United States
Securities and Exchange Commission
Washington, D.C. 20549
Form N-CSR
Certified Shareholder Report of Registered Management Investment Companies
811-4577
(Investment Company Act File Number)
Federated Income Securities Trust
_______________________________________________________________
(Exact Name of Registrant as Specified in Charter)
Federated Investors Funds
4000 Ericsson Drive
Warrendale, Pennsylvania 15086-7561
(Address of Principal Executive Offices)
(412) 288-1900
(Registrant's Telephone Number)
Peter J. Germain, Esquire
Federated Investors Tower
1001 Liberty Avenue
Pittsburgh, Pennsylvania 15222-3779
(Name and Address of Agent for Service)
(Notices should be sent to the Agent for Service)
Date of Fiscal Year End:03/31/19
Date of Reporting Period:03/31/19
| Item 1. | Reports to Stockholders |

Annual Shareholder Report
March 31, 2019
| Share Class | Ticker | A | FRSAX | C | FRICX | Institutional | FFRSX | R6 | FFRLX |
Federated Floating Rate Strategic Income Fund
Fund Established 2010
A Portfolio of Federated Income Securities Trust
IMPORTANT NOTICE REGARDING REPORT DELIVERY
Beginning on January 1, 2021, as permitted by regulations adopted by the Securities and Exchange Commission, paper copies of the Fund's shareholder reports like this one will no longer be sent by mail, unless you specifically request paper copies of the reports from the Fund or from your financial intermediary, such as a broker-dealer or bank. Instead, the reports will be made available on a website, and you will be notified by mail each time a report is posted and provided with a website link to access the report.
If you already elected to receive shareholder reports electronically, you will not be affected by this change and you need not take any action. You may elect to receive shareholder reports and other communications from the Fund or your financial intermediary electronically by contacting your financial intermediary (such as a broker-dealer or bank); other shareholders may call the Fund at 1-800-341-7400, Option 4.
You may elect to receive all future reports in paper free of charge. You can inform the Fund or your financial intermediary that you wish to continue receiving paper copies of your shareholder reports by contacting your financial intermediary (such as a broker-dealer or bank); other shareholders may call the Fund at 1-800-341-7400, Option 4. Your election to receive reports in paper will apply to all funds held with the Fund complex or your financial intermediary.
Not FDIC Insured ■ May Lose Value ■ No Bank Guarantee
J. Christopher
Donahue
President
Federated Floating Rate Strategic Income Fund
Letter from the President
Dear Valued Shareholder,
I am pleased to present the Annual Shareholder Report for your fund covering the period from April 1, 2018 through March 31, 2019. This report includes Management's Discussion of Fund Performance, a complete listing of your fund's holdings, performance information and financial statements along with other important fund information.
In addition, our website, FederatedInvestors.com, offers easy access to Federated resources that include timely fund updates, economic and market insights from our investment strategists, and financial planning tools.
Thank you for investing with Federated. I hope you find this information useful and look forward to keeping you informed.
Sincerely,
J. Christopher Donahue, President
CONTENTS
| 1 |
| 8 |
| 9 |
| 18 |
| 22 |
| 24 |
| 25 |
| 26 |
| 37 |
| 39 |
| 41 |
| 47 |
| 54 |
| 54 |
Management's Discussion of Fund Performance (unaudited)
The total return of Federated Floating Rate Strategic Income Fund (the “Fund”), based on net asset value for the 12-month reporting period ended March 31, 2019, was 2.58% for the Class A Shares, 1.92% for the Class C Shares, 2.94% for the Institutional Shares and 2.85% for the Class R6 Shares. The 2.94% total return for the Institutional Shares during the reporting period consisted of 4.55% of dividends and reinvestments and -1.61% of depreciation in the net asset value of the shares. The ICE BofAML US 3-Month Treasury Bill Index (BAML3MT),1 the Fund's broad-based securities market index, had a total return of 2.12%, and the Fund's custom blended index (“Blended Benchmark”)2 (55% Credit Suisse Leveraged Loan Index (CSLLI)/30% ICE BofAML 1-Year US Treasury Note Index (BAML1YT)/15% ICE BofAML 1-Month London InterBank Offered Rate(LIBOR)) had a total return of 2.91% for the same reporting period. The Fund's total return during the reporting period reflected actual cash flows, transaction costs and other expenses which were not reflected in the total return of the BAML3MT or the Blended Benchmark.
During the reporting period, the primary components of the Fund's investment strategy which affected performance relative to the Blended Benchmark3 were: (a) allocation of Fund assets among the following three broad sectors: domestic noninvestment-grade,4domestic investment-grade and foreign;5 (b) the selection of securities within each of the Fund's sectors; and (c) duration6 management utilizing derivatives in conjunction with anticipated interest rate changes.
The following discussion will focus on the performance of the Fund's Institutional Shares.
MARKET OVERVIEW
During the reporting period, domestic leveraged finance asset classes generated positive absolute total returns despite experiencing volatile conditions. This included the U.S. leveraged loan market. Credit spreads moved wider and asset prices declined modestly in the U.S. leveraged loan market as macroeconomic and geopolitical concerns outweighed healthy credit conditions in leveraged finance markets. In fact, the spread between the CSLLI and 3-month LIBOR (a common benchmark rate for floating rate assets), as measured by a 3-year discount margin, increased from 3.96% at the beginning of the period to 4.67% by the end of the reporting period.7 The average price of assets in the CSLLI (excluding defaulted constituents) decreased from $98.50 to $96.53 during the same timeframe. Rising current income stream generated by leveraged loans mitigated average price declines, which resulted in a positive total return.
Annual Shareholder Report
While fundamental credit conditions were healthy, volatility in the U.S. leveraged loan market was driven by a variety of macroeconomic and geopolitical factors. The Federal Reserve (the “Fed”) hiked the federal funds target interest rate on three separate occasions. Risk market angst significantly expanded over perceptions that later tightening actions were moving forward in the face of global economic and corporate earnings headwinds. Holders of risk assets were also bothered by tariff jousting and uncertain trade negotiations between the U.S. and China. Political dysfunction in Washington, capped by a partial government shutdown, also created uncertainty for investors in the U.S.
The U.S. leveraged loan market experienced an abrupt change in technical factors. Following years of positive investor demand in a rising rate environment, loan funds experienced record outflows during the final quarter of calendar year 2018. With the flattening of the U.S. Treasury curve and growing concerns over the length of the credit cycle, heavy selling pressure exacerbated the downward shift in market asset prices.
During the final months of the reporting period, leveraged finance asset prices rebounded sharply. Risk markets were bolstered by a more “dovish” tone from the Fed, as well as more sanguine views on the health of the economy. With the continuation of healthy credit fundamentals and attractive valuations, the U.S. leveraged loan market participated in the upswing, recovering losses from the prior quarter.
With the favorable economic picture in the U.S., short-term rates moved higher in conjunction with the Fed actions. For example, the 3-month LIBOR advanced higher from 2.31% at the beginning of the period to 2.60% as of March 31, 2019. In conjunction with the rate move, the overall interest coupon level for floating rate assets shifted higher during the reporting period.
SECTOR ALLOCATION
The Fund's sector weightings were a positive contributor to performance relative to the Blended Benchmark. In general, the Fund's assets were positioned with an overweight weighting to the riskier domestic noninvestment-grade sector and an underweight weighting to higher quality domestic investment-grade sector during the reporting period. Despite the market volatility, leveraged loan assets with a higher degree of credit risk outperformed higher quality floating rate assets due to higher income levels offsetting widening risk spreads.
SECURITY SELECTION
Overall positive security selection contributed to the Fund's outperformance relative to the Blended Benchmark during the reporting period. Within the domestic noninvestment-grade sector, the Fund's portfolio outperformance was aided by positive selection in short duration high yield bonds. Fund holdings in various higher quality floating rate asset classes8 including bank loans,9 floating rate corporate bonds and agency-backed mortgages produced blended returns which exceeded that portion of the Blended Benchmark. Within the foreign
Annual Shareholder Report
sector, leveraged bank loans, trade finance instruments and corporate bonds from foreign-domiciled issuers contributed positively to returns which comfortably exceeded that portion of the Blended Benchmark.
DURATION MANAGEMENT
The Fund's position in U.S. Treasury futures contracts10 was a modestly positive contributor to performance relative to the Blended Benchmark. Value was created as U.S. Treasury yields trended higher during the first seven months of the reporting period.
| 1 | Please see the footnotes to the line graphs below for definitions of, and further information about, the BAML3MT. |
| 2 | Please see the footnotes to the line graphs below for definitions of, and further information about, the Blended Benchmark. |
| 3 | The impact of these factors on Fund performance relative to the index is discussed below and in terms of fund gross performance (i.e., without regard to actual cash flows, transaction costs and other expenses). |
| 4 | Noninvestment-grade securities are securities that are not rated at least “BBB” or unrated securities of a comparable quality. Investment-grade securities are securities that are rated at least “BBB” or unrated securities of a comparable quality. Credit ratings are an indication of the risk that a security will default. They do not protect a security from credit risk. Lower-rated bonds typically offer higher yields to help compensate investors for the increased risk associated with them. Among these risks are lower creditworthiness, greater price volatility, more risk to principal and income than with higher-rated securities and increased possibilities of default. |
| 5 | International investing involves special risks including currency risks, increased volatility, political risks and differences in auditing and other financial standards. |
| 6 | Duration is a measure of a security's price sensitivity to changes in interest rates. Securities with longer duration are more sensitive to changes in interest rates than securities of shorter durations. |
| 7 | Bond prices are sensitive to changes in interest rates, and a rise in interest rates can cause a decline in their prices. |
| 8 | Variable and floating rate loans and securities generally are less sensitive to interest rate changes, but may decline in value if their interest rates do not rise as much or as quickly as interest rates in general. Conversely, variable and floating-rate loans and securities generally will not increase in value as much as fixed-rate debt instruments if interest rates decline. |
| 9 | In addition to the risks generally associated with debt instruments such as credit, market, interest rate, liquidity and derivatives risk, leveraged loans are also subject to the risk that the value of the collateral securing a loan may decline, be insufficient to meet the obligations of the borrower, or be difficult to liquidate. |
| 10 | The Fund's use of derivative instruments involves risks different from, or possibly greater than, the risks associated with investing directly in securities and other traditional instruments. |
Annual Shareholder Report
FUND PERFORMANCE AND GROWTH OF A $10,000 INVESTMENT
The graphs below illustrate the hypothetical investment of $10,0001 in the Federated Floating Rate Strategic Income Fund (the “Fund”) from February 23, 2011 to March 31, 2019 for Class A Shares and December 3, 2010 to March 31, 2019 for Class C Shares and Institutional Shares compared to the ICE BofAML US 3-Month Treasury Bill Index (BAML3MT),2,3 the Fund's broad-based securities market index, a blend of indexes comprised of 55% Credit Suisse Leveraged Loan Index (CSLLI)4/30% BofAML 1-Year US Treasury Note Index (BAML1YT)5/ 15% ICE BofAML US Dollar 1-Month Deposit Offered Rate Constant Maturity Index6 (the “New Blended Benchmark”) and a blend of indexes comprised of 55% Credit Suisse Leveraged Loan Index (CSLLI)/30% BofAML 1-Year US Treasury Note Index (BAML1YT)/15% ICE BofAML 1-Month London Interbank Offered Rate (LIBOR)7 (the “Former Blended Benchmark”).The Average Annual Total Return table below shows returns for each class averaged over the stated periods.
Growth of a $10,000 Investment
Growth of $10,000 as of March 31, 2019
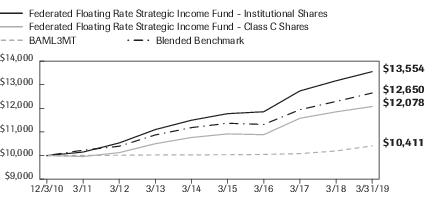
| Federated Floating Rate Strategic Income Fund - | Institutional Shares | Class C Shares | BAML3MT | Blended Benchmark |
| F | F | I | I |
| 12/3/2010 | 10,000 | 10,000 | 10,000 | 10,000 |
| 3/31/2011 | 10,147 | 9,957 | 10,006 | 10,226 |
| 3/31/2012 | 10,533 | 10,124 | 10,013 | 10,394 |
| 3/31/2013 | 11,100 | 10,501 | 10,025 | 10,873 |
| 3/31/2014 | 11,496 | 10,765 | 10,031 | 11,184 |
| 3/31/2015 | 11,774 | 10,916 | 10,034 | 11,367 |
| 3/31/2016 | 11,855 | 10,884 | 10,046 | 11,317 |
| 3/31/2017 | 12,738 | 11,579 | 10,082 | 11,942 |
| 3/31/2018 | 13,167 | 11,851 | 10,194 | 12,292 |
| 3/31/2019 | 13,554 | 12,078 | 10,411 | 12,650 |
41 graphic description end -->
| ■ | Total returns shown for Class C Shares include the maximum contingent deferred sales charge of 1.00% as applicable. |
Annual Shareholder Report
Growth of a $10,000 Investment–CLASS A SHARES
Growth of $10,000 as of March 31, 2019

| Federated Floating Rate Strategic Income Fund - | Class A Shares | NA | BAML3MT | Blended Benchmark |
| F | NA | I | I |
| 2/23/2011 | 9,800 | | 10,000 | 10,000 |
| 3/31/2011 | 9,797 | | 10,002 | 10,038 |
| 3/31/2012 | 10,134 | | 10,009 | 10,203 |
| 3/31/2013 | 10,643 | | 10,021 | 10,674 |
| 3/31/2014 | 10,984 | | 10,027 | 10,978 |
| 3/31/2015 | 11,210 | | 10,030 | 11,158 |
| 3/31/2016 | 11,248 | | 10,042 | 11,109 |
| 3/31/2017 | 12,043 | | 10,078 | 11,723 |
| 3/31/2018 | 12,406 | | 10,190 | 12,066 |
| 3/31/2019 | 12,726 | | 10,406 | 12,417 |
41 graphic description end -->
| ■ | Total returns shown for Class A Shares include the maximum sales charge of 2.00% ($10,000 investment minus $200 sales charge = $9,800). |
The Fund offers multiple share classes whose performance may be greater than or less than its other share class(es) due to differences in sales charges and expenses. See the Average Annual Return table below for the returns of additional classes not shown in the line graphs above.
Average Annual Total ReturnsTable for the Period Ended 3/31/2019
(returns reflect all applicable sales charges and contingent deferred sales charges as specified below in footnote #1)
| | 1 Year | 5 Year | Start of
Performance* |
| Class A Shares | 0.56% | 2.56% | 3.02% |
| Class C Shares8 | 0.94% | 2.33% | 2.29% |
| Institutional Shares | 2.94% | 3.35% | 3.72% |
| Class R6 Shares9 | 2.85% | 3.28% | 3.28% |
| BAML3MT | 2.12% | 0.74% | 0.48% |
| New Blended Benchmark (as of April 1, 2019) | 2.92% | 2.49% | 2.86% |
| Former Blended Benchmark (prior to April 1, 2019) | 2.91% | 2.49% | 2.86% |
| * | The Fund's Class A Shares start of performance date was February 23, 2011. The Fund's Class C Shares, Institutional Shares and Class R6 Shares start of performance date was December 3, 2010. The returns of the BAML3MT and Blended Benchmarks are from the Institutional Shares start of performance date. |
Annual Shareholder Report
Performance data quoted represents past performance which is no guarantee of future results. Investment return and principal value will fluctuate so that an investor's shares, when redeemed, may be worth more or less than their original cost. Mutual fund performance changes over time and current performance may be lower or higher than what is stated. For current to the most recent month-end performance and after-tax returns, visit FederatedInvestors.com or call 1-800-341-7400. Returns shown do not reflect the deduction of taxes that a shareholder would pay on Fund distributions or the redemption of Fund shares. Mutual funds are not obligations of or guaranteed by any bank and are not federally insured.
| 1 | Represents a hypothetical investment of $10,000 in the Fund's Class A Shares after deducting the maximum sales charge of 2.00% ($10,000 investment minus $200 sales charge = $9,800); for Class C Shares, a 1.00% contingent deferred sales charge would be applied to any redemption less than one year from purchase date. The Fund's performance assumes the reinvestment of all dividends and distributions. The BAML3MT and the Blended Benchmarks have been adjusted to reflect reinvestment of dividends on securities in the indexes. |
| 2 | The BAML3MT and the Blended Benchmarks are not adjusted to reflect sales charges, expenses or other fees that the Securities and Exchange Commission requires to be reflected in the Fund's performance. The indexes are unmanaged and, unlike the Fund, are not affected by cash flows. It is not possible to invest directly in an index. |
| 3 | The BAML3MT is comprised of a single issue purchased at the beginning of the month and held for a full month. At the end of the month that issue is sold and rolled into a newly selected issue. The issue selected at each month-end rebalancing is the outstanding Treasury Bill that matures closest to, but not beyond, three months from the rebalancing date. To qualify for selection, an issue must have settled on or before the month-end rebalancing date. |
| 4 | The CSLLI is designed to mirror the investable universe of the U.S. dollar-denominated leveraged loan market. |
| 5 | The BAML1YT is comprised of a single issue purchased at the beginning of the month and held for a full month. At the end of the month that issue is sold and rolled into a newly selected issue. The issue selected at each month-end rebalancing is the outstanding two-year Treasury note that matures closest to, but not beyond, one year from the rebalancing date. To qualify for selection, an issue must have settled on or before the month-end rebalancing date. |
| 6 | Effective April 1, 2019, the New Blended Benchmark is a blend of indexes comprised of 55% Credit Suisse Leveraged Loan Index/30% ICE BofAML 1-Year US Treasury Note Index/15% ICE BofAML US Dollar 1-Month Deposit Offered Rate Constant Maturity Index. The ICE BofAML US Dollar 1-Month Deposit Offered Rate Constant Maturity Index is a newly available, independent calculation of the ICE BofAML 1-Month London Interbank Offered Rate (LIBOR) previously used as a component of the Former Blended Benchmark. This component of the blended index has been replaced in light of the anticipated phase out of the London Interbank Offered Rate. |
Annual Shareholder Report
| 7 | Prior to April 1, 2019, the Former Blended Benchmark was a blend of indexes comprised of 55% Credit Suisse Leveraged Loan Index/30% ICE BofAML 1-Year US Treasury Note Index/15% ICE BofAML 1-Month LIBOR. ICE BofAML 1-Month LIBOR is a widely used benchmark for short term interest rates, providing an indication of the average rates at which LIBOR panel banks could obtain wholesale, unsecured funding for set periods in particular currencies. |
| 8 | The Fund's Class C Shares commenced operations on September 6, 2013. For the period prior to the commencement of operations of Class C Shares, the performance information shown is for the Fund's Institutional Shares performance adjusted to reflect the expenses of Class C Shares for each year for which the expenses of Class C Shares would have exceeded the actual expenses paid by Institutional Shares. The performance shown in the table above also has been adjusted to reflect differences between the sales loads and charges imposed on the purchase and redemption of the Institutional Shares and Class C Shares. |
| 9 | The Fund's Class R6 Shares commenced operations on December 27, 2016. For the period prior to the commencement of operations of the Class R6 Shares, the performance information shown is for Institutional Shares, which has been adjusted to reflect the expenses of Class R6 Shares for each year for which the Fund's Class R6 expenses would have exceeded the actual expenses paid by the Fund's Institutional Shares. |
Annual Shareholder Report
Portfolio of Investments Summary Table (unaudited)
At March 31, 2019, the Fund's portfolio composition1 was as follows:
| Security Type | Percentage of
Total Net Assets2 |
| Floating Rate Loans | 66.3% |
| Corporate Debt Securities | 10.5% |
| Trade Finance Agreements | 8.9% |
| Collateralized Mortgage Obligations | 4.8% |
| Asset-Backed Securities | 3.0% |
| Other Security Type3 | 2.0% |
| U.S. Government Agency Adjustable Rate Mortgage Securities | 0.1% |
| Cash Equivalents4 | 6.3% |
| Other Assets and Liabilities—Net5 | (1.9)% |
| TOTAL | 100.0% |
| 1 | See the Fund's prospectus and Statement of Additional Information for a description of the principal types of securities in which the Fund invests. |
| 2 | As of the date specified above, the Fund owned shares of one or more affiliated investment companies. For purposes of this table, the affiliated investment company (other than an affiliated money market mutual fund) is not treated as a single portfolio security, but rather the Fund is treated as owning a pro rata portion of each security and each other asset and liability owned by the affiliated investment company. Accordingly, the percentages of total net assets shown in the table will differ from those presented on the Portfolio of Investments. |
| 3 | Other Security Type consists of exchange-traded funds. |
| 4 | Cash Equivalents include any investments in money market mutual funds and/or overnight repurchase agreements. |
| 5 | Assets, other than investments in securities and derivative contracts, less liabilities. See Statement of Assets and Liabilities. |
Annual Shareholder Report
Portfolio of Investments
March 31, 2019
Principal
Amount
or Shares | | | Value |
| | 1 | ADJUSTABLE RATE MORTGAGES—0.1% | |
| | | Federal Home Loan Mortgage Corporation ARM—0.1% | |
| $70,600 | | FHLMC ARM, 4.116%, 5/1/2034 | $73,566 |
| 96,207 | | FHLMC ARM, 4.337%, 7/1/2034 | 100,441 |
| 136,610 | | FHLMC ARM, 4.627%, 8/1/2035 | 143,191 |
| 62,743 | | FHLMC ARM, 4.676%, 5/1/2036 | 66,076 |
| | | TOTAL | 383,274 |
| | | Federal National Mortgage Association ARM—0.0% | |
| 38,906 | | FNMA ARM, 4.269%, 9/1/2035 | 40,354 |
| 67,747 | | FNMA ARM, 4.710%, 2/1/2036 | 70,784 |
| 37,858 | | FNMA ARM, 4.785%, 4/1/2034 | 39,869 |
| | | TOTAL | 151,007 |
| | | TOTAL ADJUSTABLE RATE MORTGAGES
(IDENTIFIED COST $538,605) | 534,281 |
| | | CORPORATE BONDS—10.5% | |
| | | Automotive—0.4% | |
| 2,000,000 | 1 | Daimler Finance NA LLC, Sr. Unsecd. Note, 144A, 3.577% (3-month USLIBOR +0.840%), 5/4/2023 | 1,996,959 |
| 2,400,000 | 1 | Nissan Motor Acceptance Corp., Sr. Unsecd. Note, 144A, 3.287% (3-month USLIBOR +0.690%), 9/28/2022 | 2,347,425 |
| | | TOTAL | 4,344,384 |
| | | Building Materials—0.2% | |
| 2,205,000 | | CD&R Waterworks Merger Subsidiary LLC, Sr. Unsecd. Note, 144A, 6.125%, 8/15/2025 | 2,167,074 |
| | | Cable Satellite—0.2% | |
| 2,000,000 | | CSC Holdings LLC, 144A, 5.375%, 7/15/2023 | 2,042,500 |
| | | Consumer Cyclical Services—0.2% | |
| 2,550,000 | | GW Honos Security Corp., Sr. Unsecd. Note, 144A, 8.750%, 5/15/2025 | 2,441,625 |
| | | Diversified Manufacturing—0.1% | |
| 1,500,000 | | CFX Escrow Corp., Sr. Unsecd. Note, 144A, 6.000%, 2/15/2024 | 1,567,500 |
| | | Finance Companies—0.3% | |
| 2,000,000 | 1 | American Express Co., 3.288% (3-month USLIBOR +0.650%), 2/27/2023 | 1,997,447 |
| 1,000,000 | | Navient Corp., Sr. Unsecd. Note, 5.500%, 1/25/2023 | 1,005,000 |
| | | TOTAL | 3,002,447 |
Annual Shareholder Report
Principal
Amount
or Shares | | | Value |
| | | CORPORATE BONDS—continued | |
| | | Financial Institution - Insurance - Life—0.2% | |
| $2,250,000 | 1 | New York Life Global Funding, Sec. Fac. Bond, 144A, 2.751% (3-month USLIBOR +0.160%), 10/1/2020 | $2,251,130 |
| | | Financial Institutions—1.1% | |
| 2,000,000 | 1 | Bank of America Corp., Sr. Unsecd. Note, Series FRN, 3.152% (3-month USLIBOR +0.380%), 1/23/2022 | 1,994,049 |
| 3,000,000 | 1 | Goldman Sachs Group, Inc., Sr. Unsecd. Note, 3.401% (3-month USLIBOR +0.750%), 2/23/2023 | 2,975,421 |
| 3,000,000 | 1 | JPMorgan Chase & Co., Sr. Unsecd. Note, 3.662% (3-month USLIBOR +0.890%), 7/23/2024 | 2,994,335 |
| 2,900,000 | 1 | Manufacturers & Traders Trust Co., Sub. Note, Series BKNT, 3.266% (3-month USLIBOR +0.640%), 12/1/2021 | 2,887,034 |
| 1,000,000 | 1 | U.S. Bank N.A., Cincinnati, Sr. Unsecd. Note, Series BKNT, 3.084% (3-month USLIBOR +0.320%), 4/26/2021 | 1,000,844 |
| | | TOTAL | 11,851,683 |
| | | Food & Beverage—0.3% | |
| 3,000,000 | | Post Holdings, Inc., Sr. Unsecd. Note, 144A, 5.500%, 3/1/2025 | 3,045,000 |
| | | Gaming—0.3% | |
| 2,000,000 | | Mohegan Tribal Gaming Authority, Sr. Unsecd. Note, 144A, 7.875%, 10/15/2024 | 1,995,000 |
| 775,000 | | Rivers Pittsburgh LP, 144A, 6.125%, 8/15/2021 | 778,875 |
| | | TOTAL | 2,773,875 |
| | | Health Care—2.7% | |
| 2,000,000 | | Acadia Healthcare Co., Inc., Sr. Unsecd. Note, 5.125%, 7/1/2022 | 2,015,000 |
| 3,000,000 | | Air Medical Group Holdings, Inc., Sr. Unsecd. Note, 144A, 6.375%, 5/15/2023 | 2,535,000 |
| 2,000,000 | | Avantor, Inc., 144A, 6.000%, 10/1/2024 | 2,080,000 |
| 2,000,000 | | Hologic, Inc., Sr. Unsecd. Note, 144A, 4.375%, 10/15/2025 | 1,999,600 |
| 2,000,000 | | MEDNAX, Inc., Sr. Unsecd. Note, 144A, 5.250%, 12/1/2023 | 2,030,000 |
| 2,000,000 | | MPH Acquisition Holdings LLC, 144A, 7.125%, 6/1/2024 | 2,000,000 |
| 1,650,000 | | Ortho-Clinical Diagnostics, Inc., 144A, 6.625%, 5/15/2022 | 1,571,625 |
| 3,625,000 | | Polaris Intermediate Corp., Sr. Unsecd. Note, 144A, 8.500%, 12/1/2022 | 3,589,656 |
| 3,900,000 | | SteriGenics Nordion Topco, Sr. Unsecd. Note, 144A, 8.125%, 11/1/2021 | 3,861,000 |
| 2,000,000 | | Tenet Healthcare Corp., Sr. Unsecd. Note, 6.750%, 6/15/2023 | 2,067,500 |
| 2,000,000 | | Tenet Healthcare Corp., 8.125%, 4/1/2022 | 2,159,200 |
| 2,000,000 | | West Street Merger Subsidiary, Inc., Sr. Unsecd. Note, 144A, 6.375%, 9/1/2025 | 1,955,000 |
| | | TOTAL | 27,863,581 |
| | | Independent Energy—0.9% | |
| 3,000,000 | | Chesapeake Energy Corp., Sr. Unsecd. Note, 7.000%, 10/1/2024 | 3,003,750 |
Annual Shareholder Report
Principal
Amount
or Shares | | | Value |
| | | CORPORATE BONDS—continued | |
| | | Independent Energy—continued | |
| $3,000,000 | | Gulfport Energy Corp., Sr. Unsecd. Note, 6.000%, 10/15/2024 | $2,737,920 |
| 2,000,000 | | QEP Resources, Inc., Sr. Unsecd. Note, 5.250%, 5/1/2023 | 1,895,000 |
| 2,000,000 | | Range Resources Corp., Sr. Unsecd. Note, 5.000%, 8/15/2022 | 1,990,000 |
| | | TOTAL | 9,626,670 |
| | | Insurance - P&C—0.1% | |
| 1,000,000 | | Ardonagh Midco Three PLC, 144A, 8.625%, 7/15/2023 | 860,000 |
| 900,000 | | Kirs Midco 3 PLC, Sec. Fac. Bond, 144A, 8.625%, 7/15/2023 | 774,000 |
| | | TOTAL | 1,634,000 |
| | | Midstream—0.2% | |
| 2,000,000 | | Suburban Propane Partners LP, 5.500%, 6/1/2024 | 1,958,200 |
| | | Oil Field Services—0.2% | |
| 1,925,000 | | Sesi LLC, 7.125%, 12/15/2021 | 1,734,906 |
| | | Packaging—0.6% | |
| 2,000,000 | | Ardagh Packaging Finance PLC/Ardagh Holdings, Sr. Unsecd. Note, 144A, 6.000%, 2/15/2025 | 2,005,000 |
| 4,000,000 | | Bway Holding Co., Sec. Fac. Bond, 144A, 5.500%, 4/15/2024 | 3,986,200 |
| | | TOTAL | 5,991,200 |
| | | Pharmaceuticals—1.6% | |
| 2,000,000 | 1 | AstraZeneca PLC, Sr. Unsecd. Note, 3.347% (3-month USLIBOR +0.665%), 8/17/2023 | 1,990,601 |
| 1,442,000 | | Bausch Health Cos, Inc., Sr. Unsecd. Note, 144A, 5.500%, 3/1/2023 | 1,454,372 |
| 1,442,000 | | Bausch Health Cos, Inc., Sr. Unsecd. Note, 144A, 5.875%, 5/15/2023 | 1,461,827 |
| 2,075,000 | | Eagle Holding Co. II LLC, Sr. Unsecd. Note, 144A, 7.625%, 5/15/2022 | 2,098,344 |
| 4,000,000 | | Jaguar Holding Co. II/Pharmaceutical Product Development LLC, Sr. Unsecd. Note, 144A, 6.375%, 8/1/2023 | 4,085,000 |
| 4,000,000 | | Mallinckrodt International Finance SA/Mallinckrodt CB LLC, Sr. Unsecd. Note, 144A, 5.625%, 10/15/2023 | 3,340,000 |
| 2,000,000 | | Mallinckrodt International Finance SA/Mallinckrodt CB LLC, Sr. Unsecd. Note, 144A, 5.750%, 8/1/2022 | 1,890,000 |
| | | TOTAL | 16,320,144 |
| | | Restaurants—0.2% | |
| 2,000,000 | | Performance Food Group, Inc., 144A, 5.500%, 6/1/2024 | 2,025,000 |
| | | Technology—0.5% | |
| 1,300,000 | | Diamond 1 Finance Corp./Diamond 2 Finance Corp., Sr. Secd. Note, 144A, 4.420%, 6/15/2021 | 1,334,422 |
| 1,575,000 | | Financial & Risk US Holdings, Inc., 144A, 6.250%, 5/15/2026 | 1,600,594 |
| 2,000,000 | | Tempo Acquisition LLC, Sr. Unsecd. Note, 144A, 6.750%, 6/1/2025 | 2,025,000 |
| | | TOTAL | 4,960,016 |
Annual Shareholder Report
Principal
Amount
or Shares | | | Value |
| | | CORPORATE BONDS—continued | |
| | | Utility - Electric—0.2% | |
| $1,750,000 | | TerraForm Power Operating LLC, Sr. Unsecd. Note, 144A, 4.250%, 1/31/2023 | $1,737,733 |
| | | TOTAL CORPORATE BONDS
(IDENTIFIED COST $109,918,926) | 109,338,668 |
| | 1 | ASSET-BACKED SECURITIES—3.0% | |
| | | Auto Receivables—0.3% | |
| 2,300,000 | | BMW Floorplan Master Owner Trust 2018-1, Class A2, 2.803% (1-month USLIBOR +0.320%), 5/15/2023 | 2,299,668 |
| 549,009 | | Chesapeake Funding II LLC 2016-2A, Class A2, 3.483% (1-month USLIBOR +1.000%), 6/15/2028 | 550,196 |
| | | TOTAL | 2,849,864 |
| | | Credit Card—2.5% | |
| 5,000,000 | | American Express Credit Account Master Trust 2017-5, Class A, 2.863% (1-month USLIBOR +0.380%), 2/18/2025 | 5,015,847 |
| 6,000,000 | | Capital One Multi-Asset Execution Trust 2017-A2, Class A2, 2.893% (1-month USLIBOR +0.410%), 1/15/2025 | 6,017,614 |
| 5,000,000 | | Citibank Credit Card Issuance Trust 2017-A7, Class A7, 2.861% (1-month USLIBOR +0.370%), 8/8/2024 | 5,006,425 |
| 5,000,000 | | Citibank Credit Card Issuance Trust 2018-A2, Class A2, 2.817% (1-month USLIBOR +0.330%), 1/20/2025 | 4,995,353 |
| 3,000,000 | | Gracechurch Card PLC 2018-1A, Class A, 2.883% (1-month USLIBOR +0.400%), 7/15/2022 | 2,999,172 |
| 2,100,000 | | Master Credit Card Trust 2018-1A, Class A, 2.976% (1-month USLIBOR +0.490%), 7/21/2024 | 2,097,665 |
| | | TOTAL | 26,132,076 |
| | | Other—0.2% | |
| 2,200,000 | | PFS Financing Corp. 2018-A, Class A, 2.883% (1-month USLIBOR +0.400%), 2/15/2022 | 2,200,847 |
| | | Student Loans—0.0% | |
| 301,634 | | SLM Student Loan Trust 2013-C, Class A2B, 3.883% (1-month USLIBOR +1.400%), 10/15/2031 | 302,330 |
| | | TOTAL ASSET-BACKED SECURITIES
(IDENTIFIED COST $31,442,088) | 31,485,117 |
| | 1 | COLLATERALIZED MORTGAGE OBLIGATIONS—4.8% | |
| | | Commercial Mortgage—0.1% | |
| 600,000 | | Wells Fargo Commercial Mortgage Trust 2013-LC12, Class A3FL, 3.533% (1-month USLIBOR +1.050%), 7/15/2046 | 604,023 |
| | | Federal Home Loan Mortgage Corporation—0.7% | |
| 1,392,652 | | REMIC, Series 2976, Class KJ, 2.833% (1-month USLIBOR +0.350%), 5/15/2035 | 1,389,771 |
Annual Shareholder Report
Principal
Amount
or Shares | | | Value |
| | 1 | COLLATERALIZED MORTGAGE OBLIGATIONS—continued | |
| | | Federal Home Loan Mortgage Corporation—continued | |
| $203,947 | | REMIC, Series 3122, Class FE, 2.783% (1-month USLIBOR +0.300%), 3/15/2036 | $203,327 |
| 607,276 | | REMIC, Series 3241, Class FM, 2.863% (1-month USLIBOR +0.380%), 11/15/2036 | 606,306 |
| 1,151,045 | | REMIC, Series 3922, Class CF, 2.883% (1-month USLIBOR +0.400%), 4/15/2041 | 1,149,463 |
| 3,713,308 | | REMIC, Series 4097, Class KF, 2.783% (1-month USLIBOR +0.300%), 9/15/2031 | 3,700,673 |
| | | TOTAL | 7,049,540 |
| | | Federal National Mortgage Association—1.0% | |
| 488,679 | | REMIC, Series 2006-111, Class FA, 2.865% (1-month USLIBOR +0.380%), 11/25/2036 | 488,118 |
| 2,067,640 | | REMIC, Series 2006-35, Class F, 2.785% (1-month USLIBOR +0.300%), 5/25/2036 | 2,058,226 |
| 2,306,778 | | REMIC, Series 2006-85, Class PF, 2.865% (1-month USLIBOR +0.380%), 9/25/2036 | 2,300,095 |
| 789,512 | | REMIC, Series 2006-99, Class AF, 2.905% (1-month USLIBOR +0.420%), 10/25/2036 | 789,932 |
| 145,037 | | REMIC, Series 2010-134, Class BF, 2.915% (1-month USLIBOR +0.430%), 10/25/2040 | 145,053 |
| 295,195 | | REMIC, Series 2010-135, Class FP, 2.885% (1-month USLIBOR +0.400%), 12/25/2040 | 295,008 |
| 618,183 | | REMIC, Series 2012-135, Class FA, 2.785% (1-month USLIBOR +0.300%), 11/25/2039 | 616,197 |
| 838,097 | | REMIC, Series 2012-79, Class F, 2.935% (1-month USLIBOR +0.450%), 7/25/2042 | 838,390 |
| 2,819,789 | | REMIC, Series 2014-73, Class FA, 2.835% (1-month USLIBOR +0.350%), 11/25/2044 | 2,801,768 |
| | | TOTAL | 10,332,787 |
| | | Government National Mortgage Association—2.8% | |
| 5,740,907 | | REMIC, Series 2007-17, Class SF, 2.793% (1-month USLIBOR +0.312%), 4/16/2037 | 5,717,837 |
| 4,457,539 | | REMIC, Series 2011-83, Class FJ, 2.787% (1-month USLIBOR +0.300%), 5/20/2040 | 4,428,681 |
| 6,238,350 | | REMIC, Series 2012-41, Class FA, 2.887% (1-month USLIBOR +0.400%), 3/20/2042 | 6,232,444 |
| 6,346,260 | | REMIC, Series 2012-42, Class HF, 2.857% (1-month USLIBOR +0.370%), 3/20/2042 | 6,321,769 |
| 6,772,897 | | REMIC, Series 2012-77, Class FE, 2.871% (1-month USLIBOR +0.390%), 5/16/2041 | 6,796,073 |
| | | TOTAL | 29,496,804 |
Annual Shareholder Report
Principal
Amount
or Shares | | | Value |
| | 1 | COLLATERALIZED MORTGAGE OBLIGATIONS—continued | |
| | | Non-Agency Mortgage—0.2% | |
| $197,906 | | Gosforth Funding PLC 2016-1A, Class A1A, 3.383% (3-month USLIBOR +0.700%), 2/15/2058 | $197,910 |
| 2,320,000 | | Silverstone Master Issuer 2018-1A, Class 1A, 3.165% (3-month USLIBOR +0.390%), 1/21/2070 | 2,295,700 |
| | | TOTAL | 2,493,610 |
| | | TOTAL COLLATERALIZED MORTGAGE OBLIGATIONS
(IDENTIFIED COST $50,245,940) | 49,976,764 |
| | 1 | FLOATING RATE LOANS—3.0% | |
| | | Automotive—0.2% | |
| 2,000,000 | | Dana, Inc., Term Loan—1st Lien, 4.748% (1-month USLIBOR +2.250%), 2/28/2026 | 1,985,000 |
| | | Cable Satellite—0.7% | |
| 3,930,051 | | Charter Communications Operating LLC, Term Loan—1st Lien, 4.500% (1-month USLIBOR +2.000%), 4/30/2025 | 3,908,691 |
| 3,500,000 | | Virgin Media Bristol LLC, Term Loan—1st Lien, 4.983% (1-month USLIBOR +2.500%), 1/15/2026 | 3,466,872 |
| | | TOTAL | 7,375,563 |
| | | Chemicals—0.3% | |
| 1,099,737 | | WR Grace & Co-Conn, Term Loan—1st Lien, 4.351% (3-month USLIBOR +1.750%), 4/3/2025 | 1,085,759 |
| 1,885,263 | | WR Grace & Co-Conn, Term Loan—1st Lien, 4.351% (3-month USLIBOR +1.750%), 4/3/2025 | 1,861,302 |
| | | TOTAL | 2,947,061 |
| | | Food & Beverage—0.2% | |
| 1,942,355 | | Aramark Services, Inc., Term Loan—1st Lien, 4.248% (1-month USLIBOR +1.750%), 3/28/2024 | 1,930,526 |
| | | Gaming—0.4% | |
| 2,860,239 | | Las Vegas Sands Corp., Term Loan—1st Lien, 4.248% (1-month USLIBOR +1.750%), 3/27/2025 | 2,814,046 |
| 1,231,250 | | Seminole Tribe of Florida, Inc., Term Loan—1st Lien, 4.248% (1-month USLIBOR +1.750%), 7/6/2024 | 1,229,970 |
| | | TOTAL | 4,044,016 |
| | | Health Care—0.3% | |
| 203,519 | | HCA, Inc., Term Loan—1st Lien, 4.248% (1-month USLIBOR +1.750%), 3/18/2023 | 203,534 |
| 495,000 | | HCA, Inc., Term Loan—1st Lien, 4.498% (1-month USLIBOR +2.000%), 3/13/2025 | 495,042 |
| 2,481,250 | | IMS Health, Inc., Term Loan—1st Lien, 4.248% (1-month USLIBOR +1.750%), 6/11/2025 | 2,458,758 |
| | | TOTAL | 3,157,334 |
Annual Shareholder Report
Principal
Amount
or Shares | | | Value |
| | 1 | FLOATING RATE LOANS—continued | |
| | | Lodging—0.3% | |
| $2,586,557 | | Hilton Worldwide Finance LLC, Term Loan—1st Lien, 4.235% (1-month USLIBOR +1.750%), 10/25/2023 | $2,583,531 |
| 497,500 | | Wyndham Hotels & Resorts, Inc., Term Loan—1st Lien, 4.248% (1-month USLIBOR +1.750%), 5/30/2025 | 491,903 |
| | | TOTAL | 3,075,434 |
| | | Media Entertainment—0.2% | |
| 742,500 | | Lamar Media Corp., Term Loan—1st Lien, 4.250% (1-month USLIBOR +1.750%), 3/16/2025 | 741,884 |
| 977,587 | | Nielsen Finance LLC/Nielsen Finance Co., Term Loan—1st Lien, 4.492% (1-month USLIBOR +2.000%), 10/4/2023 | 961,838 |
| | | TOTAL | 1,703,722 |
| | | Restaurants—0.1% | |
| 1,457,799 | | KFC Holding Co., Term Loan—1st Lien, 4.231% (1-month USLIBOR +1.750%), 4/3/2025 | 1,451,720 |
| | | Technology—0.3% | |
| 2,992,500 | | Entergris Inc., Term Loan—1st Lien, 4.498% (1-month USLIBOR +2.000%), 11/1/2025 | 2,981,278 |
| 422,805 | | TTM Technologies, Inc., Term Loan—1st Lien, 5.001% (1-month USLIBOR +2.500%), 9/28/2024 | 420,163 |
| | | TOTAL | 3,401,441 |
| | | TOTAL FLOATING RATE LOANS
(IDENTIFIED COST $31,225,605) | 31,071,817 |
| | | INVESTMENT COMPANIES—78.3% | |
| 69,783,521 | | Federated Bank Loan Core Fund | 687,367,687 |
| 16,988,547 | | Federated Institutional Prime Value Obligations Fund, Institutional Shares, 2.55%2 | 16,991,945 |
| 12,102,275 | | Federated Project and Trade Finance Core Fund | 109,041,501 |
| | | TOTAL INVESTMENT COMPANIES
(IDENTIFIED COST $833,490,091) | 813,401,133 |
| | | TOTAL INVESTMENT IN SECURITIES—99.7%
(IDENTIFIED COST $1,056,861,255)3 | 1,035,807,780 |
| | | OTHER ASSETS AND LIABILITIES - NET—0.3%4 | 2,720,751 |
| | | TOTAL NET ASSETS—100% | $1,038,528,531 |
Annual Shareholder Report
Affiliated holdings are investment companies which are managed by Federated Investment Management Company (the “Adviser”) or an affiliate of the Adviser. Transactions with affiliated fund holdings during the period ended March 31, 2019, were as follows:
| | Federated
Bank Loan
Core Fund* | Federated
Institutional
Prime Value
Obligations Fund,
Institutional
Shares | Federated
Project
and Trade Finance
Core Fund | Total of
Affiliated
Transactions |
| Balance of Shares 3/31/2018 | 50,930,403 | 12,614,009 | 9,134,047 | 72,678,459 |
| Purchases/Additions | 19,679,856 | 379,112,753 | 5,178,173 | 403,970,782 |
| Sales/Reductions | (826,738) | (374,738,215) | (2,209,945) | (377,774,898) |
| Balance of Shares Held 3/31/2019 | 69,783,521 | 16,988,547 | 12,102,275 | 98,874,343 |
| Value | $687,367,687 | $16,991,945 | $109,041,501 | $813,401,133 |
| Change in Unrealized Appreciation/Depreciation | $(15,056,361) | $948 | $811,545 | $(14,243,868) |
| Net Realized Gain/(Loss) | $(482,328) | $(5,221) | $— | $(487,549) |
| Dividend Income | $34,548,041 | $304,378 | $5,059,684 | $39,912,103 |
| * | At March 31, 2019, the Fund owns a majority of the outstanding shares of beneficial interest of Federated Bank Loan Core Fund (BLCORE). |
Pursuant to an Exemptive Order issued by the Securities and Exchange Commission (SEC), the Fund may invest in a portfolio of Federated Core Trust (“Core Trust”), which is managed by the Adviser. Core Trust is an open-end management company, registered under the Investment Company Act of 1940, as amended (the “Act”), available only to registered investment companies and other accredited investors. The investment objective of BLCORE, a portfolio of Core Trust, is to provide current income. It pursues its objective by investing primarily in a portfolio of U.S. dollar-denominated floating-rate term loans, loan-related derivatives and loan index products. Federated Investors, Inc. receives no advisory or administrative fees from the funds within the Core Trust. Income distributions from BLCORE are declared daily and paid monthly, and are recorded by the Fund as dividend income. Capital gain distributions, if any, from BLCORE are declared and paid annually, and are recorded by the Fund as capital gains. The performance of the Fund is directly affected by the performance of BLCORE in which the Fund invested 66.2% of its net assets at March 31, 2019. A copy of BLCORE's financial statements is available on the EDGAR Database on the SEC's website or upon request from the Fund.
| 1 | Floating/adjustable note with current rate and current maturity or next reset date shown. Adjustable rate mortgage security coupons are based on the weighted average note rates of the underlying mortgages less the guarantee and servicing fees. These securities do not indicate an index and spread in their description above. |
| 2 | 7-day net yield. |
| 3 | The cost of investments for federal tax purposes amounts to $1,058,683,431. |
| 4 | Assets, other than investments in securities, less liabilities. See Statement of Assets and Liabilities. |
Note: The categories of investments are shown as a percentage of total net assets at March 31, 2019.
Various inputs are used in determining the value of the Fund's investments. These inputs are summarized in the three broad levels listed below:
Level 1—quoted prices in active markets for identical securities.
Annual Shareholder Report
Level 2—other significant observable inputs (including quoted prices for similar securities, interest rates, prepayment speeds, credit risk, etc.). Also includes securities valued at amortized cost.
Level 3—significant unobservable inputs (including the Fund's own assumptions in determining the fair value of investments).
The inputs or methodology used for valuing securities are not an indication of the risk associated with investing in those securities.
The following is a summary of the inputs used, as of March 31, 2019, in valuing the Fund's assets carried at fair value:
| Valuation Inputs | | | | |
| | Level 1—
Quoted
Prices | Level 2—
Other
Significant
Observable
Inputs | Level 3—
Significant
Unobservable
Inputs | Total |
| Debt Securities: | | | | |
| Adjustable Rate Mortgages | $— | $534,281 | $— | $534,281 |
| Corporate Bonds | — | 109,338,668 | — | 109,338,668 |
| Asset-Backed Securities | — | 31,485,117 | — | 31,485,117 |
| Collateralized Mortgage Obligations | — | 49,976,764 | — | 49,976,764 |
| Floating Rate Loans | — | 31,071,817 | — | 31,071,817 |
| Investment Companies1 | 16,991,945 | — | — | 813,401,133 |
| TOTAL SECURITIES | $16,991,945 | $222,406,647 | $— | $1,035,807,780 |
| 1 | As permitted by U.S. generally accepted accounting principles (GAAP), Investment Companies valued at $796,409,188 are measured at fair value using the net asset value (NAV) per share practical expedient and have not been categorized in the chart above but are included in the Total column. The amount included herein is intended to permit reconciliation of the fair value classifications to the amounts presented on the Statement of Assets and Liabilities. The price of shares redeemed in Federated Bank Loan Core Fund is the next determined NAV after receipt of a shareholder redemption request. The price of shares redeemed of Federated Project and Trade Finance Core Fund may be determined as of the closing NAV of the fund up to twenty-four days after receipt of a shareholder redemption request. |
The following acronyms are used throughout this portfolio:
| ARM | —Adjustable Rate Mortgage |
| BKNT | —Bank Notes |
| FHLMC | —Federal Home Loan Mortgage Corporation |
| FNMA | —Federal National Mortgage Association |
| FRN | —Floating Rate Notes |
| LIBOR | —London Interbank Offered Rate |
| REMIC | —Real Estate Mortgage Investment Conduit |
See Notes which are an integral part of the Financial Statements
Annual Shareholder Report
Financial Highlights–Class A Shares
(For a Share Outstanding Throughout Each Period)
| Year Ended March 31 | 2019 | 2018 | 2017 | 2016 | 2015 |
| Net Asset Value, Beginning of Period | $9.94 | $9.99 | $9.65 | $9.94 | $10.06 |
| Income From Investment Operations: | | | | | |
| Net investment income | 0.42 | 0.35 | 0.33 | 0.32 | 0.311 |
| Net realized and unrealized gain (loss) | (0.17) | (0.05) | 0.34 | (0.29) | (0.11) |
| TOTAL FROM INVESTMENT OPERATIONS | 0.25 | 0.30 | 0.67 | 0.03 | 0.20 |
| Less Distributions: | | | | | |
| Distributions from net investment income | (0.41) | (0.35) | (0.33) | (0.32) | (0.32) |
| Distributions from net realized gain | — | — | — | — | (0.00)2 |
| TOTAL DISTRIBUTIONS | (0.41) | (0.35) | (0.33) | (0.32) | (0.32) |
| Net Asset Value, End of Period | $9.78 | $9.94 | $9.99 | $9.65 | $9.94 |
| Total Return3 | 2.58% | 3.01% | 7.07% | 0.34% | 2.06% |
| Ratios to Average Net Assets: | | | | | |
| Net expenses | 1.04% | 1.03% | 1.04% | 1.04% | 1.04% |
| Net investment income | 4.20% | 3.46% | 3.35% | 3.26% | 3.13% |
| Expense waiver/reimbursement4 | 0.09% | 0.10% | 0.11% | 0.11% | 0.11% |
| Supplemental Data: | | | | | |
| Net assets, end of period (000 omitted) | $376,745 | $385,448 | $352,980 | $275,135 | $308,242 |
| Portfolio turnover | 39% | 15% | 16% | 25% | 26% |
| 1 | Per share number has been calculated using the average shares method. |
| 2 | Represents less than $0.01. |
| 3 | Based on net asset value, which does not reflect the sales charge, redemption fee or contingent deferred sales charge, if applicable. |
| 4 | This expense decrease is reflected in both the net expense and the net investment income ratios shown above. |
See Notes which are an integral part of the Financial Statements
Annual Shareholder Report
Financial Highlights–Class C Shares
(For a Share Outstanding Throughout Each Period)
| Year Ended March 31 | 2019 | 2018 | 2017 | 2016 | 2015 |
| Net Asset Value, Beginning of Period | $9.95 | $10.00 | $9.66 | $9.95 | $10.07 |
| Income From Investment Operations: | | | | | |
| Net investment income | 0.35 | 0.28 | 0.27 | 0.26 | 0.251 |
| Net realized and unrealized gain (loss) | (0.16) | (0.05) | 0.34 | (0.29) | (0.11) |
| TOTAL FROM INVESTMENT OPERATIONS | 0.19 | 0.23 | 0.61 | (0.03) | 0.14 |
| Less Distributions: | | | | | |
| Distributions from net investment income | (0.35) | (0.28) | (0.27) | (0.26) | (0.26) |
| Distributions from net realized gain | — | — | — | — | (0.00)2 |
| TOTAL DISTRIBUTIONS | (0.35) | (0.28) | (0.27) | (0.26) | (0.26) |
| Net Asset Value, End of Period | $9.79 | $9.95 | $10.00 | $9.66 | $9.95 |
| Total Return3 | 1.92% | 2.34% | 6.39% | (0.29)% | 1.41% |
| Ratios to Average Net Assets: | | | | | |
| Net expenses | 1.69% | 1.68% | 1.68% | 1.67% | 1.69% |
| Net investment income | 3.56% | 2.81% | 2.71% | 2.63% | 2.51% |
| Expense waiver/reimbursement4 | 0.10% | 0.13% | 0.11% | 0.11% | 0.11% |
| Supplemental Data: | | | | | |
| Net assets, end of period (000 omitted) | $45,449 | $45,759 | $42,067 | $29,378 | $24,105 |
| Portfolio turnover | 39% | 15% | 16% | 25% | 26% |
| 1 | Per share number has been calculated using the average shares method. |
| 2 | Represents less than $0.01. |
| 3 | Based on net asset value, which does not reflect the sales charge, redemption fee or contingent deferred sales charge, if applicable. |
| 4 | This expense decrease is reflected in both the net expense and the net investment income ratios shown above. |
See Notes which are an integral part of the Financial Statements
Annual Shareholder Report
Financial Highlights–Institutional Shares
(For a Share Outstanding Throughout Each Period)
| Year Ended March 31 | 2019 | 2018 | 2017 | 2016 | 2015 |
| Net Asset Value, Beginning of Period | $9.94 | $9.99 | $9.65 | $9.94 | $10.06 |
| Income From Investment Operations: | | | | | |
| Net investment income | 0.45 | 0.38 | 0.37 | 0.36 | 0.351 |
| Net realized and unrealized gain (loss) | (0.16) | (0.05) | 0.34 | (0.29) | (0.11) |
| TOTAL FROM INVESTMENT OPERATIONS | 0.29 | 0.33 | 0.71 | 0.07 | 0.24 |
| Less Distributions: | | | | | |
| Distributions from net investment income | (0.45) | (0.38) | (0.37) | (0.36) | (0.36) |
| Distributions from net realized gain | — | — | — | — | (0.00)2 |
| TOTAL DISTRIBUTIONS | (0.45) | (0.38) | (0.37) | (0.36) | (0.36) |
| Net Asset Value, End of Period | $9.78 | $9.94 | $9.99 | $9.65 | $9.94 |
| Total Return3 | 2.94% | 3.37% | 7.44% | 0.69% | 2.42% |
| Ratios to Average Net Assets: | | | | | |
| Net expenses | 0.69% | 0.68% | 0.69% | 0.69% | 0.69% |
| Net investment income | 4.55% | 3.82% | 3.69% | 3.61% | 3.48% |
| Expense waiver/reimbursement4 | 0.11% | 0.12% | 0.11% | 0.11% | 0.11% |
| Supplemental Data: | | | | | |
| Net assets, end of period (000 omitted) | $605,393 | $561,017 | $464,819 | $267,138 | $249,630 |
| Portfolio turnover | 39% | 15% | 16% | 25% | 26% |
| 1 | Per share number has been calculated using the average shares method. |
| 2 | Represents less than $0.01. |
| 3 | Based on net asset value. Total returns for periods of less than one year are not annualized. |
| 4 | This expense decrease is reflected in both the net expense and the net investment income ratios shown above. |
See Notes which are an integral part of the Financial Statements
Annual Shareholder Report
Financial Highlights–Class R6 Shares
(For a Share Outstanding Throughout Each Period)
| | Year Ended March 31, | Period
Ended
3/31/20171 |
| 2019 | 2018 |
| Net Asset Value, Beginning of Period | $9.94 | $9.99 | $9.97 |
| Income From Investment Operations: | | | |
| Net investment income | 0.45 | 0.38 | 0.09 |
| Net realized and unrealized gain (loss) | (0.17) | (0.05) | 0.02 |
| TOTAL FROM INVESTMENT OPERATIONS | 0.28 | 0.33 | 0.11 |
| Less Distributions: | | | |
| Distributions from net investment income | (0.45) | (0.38) | (0.09) |
| Net Asset Value, End of Period | $9.77 | $9.94 | $9.99 |
| Total Return2 | 2.85% | 3.38% | 1.07% |
| Ratios to Average Net Assets: | | | |
| Net expenses | 0.68% | 0.66% | 0.69%3 |
| Net investment income | 4.74% | 3.87% | 3.49%3 |
| Expense waiver/reimbursement4 | 0.05% | 0.07% | 0.12%3 |
| Supplemental Data: | | | |
| Net assets, end of period (000 omitted) | $10,941 | $1,134 | $05 |
| Portfolio turnover | 39% | 15% | 16%6 |
| 1 | Reflects operations for the period from December 27, 2016 (date of initial investment) to March 31, 2017. |
| 2 | Based on net asset value. Total returns for periods of less than one year are not annualized. |
| 3 | Computed on an annualized basis. |
| 4 | This expense decrease is reflected in both the net expense and the net investment income ratios shown above. |
| 5 | Represents less than $1,000. |
| 6 | Portfolio turnover is calculated at the Fund level. Percentage indicated was calculated for the year ended March 31, 2017. |
See Notes which are an integral part of the Financial Statements
Annual Shareholder Report
Statement of Assets and Liabilities
March 31, 2019
| Assets: | | |
| Investment in securities, at value including $813,401,133 of investment in affiliated holdings (identified cost $1,056,861,255) | | $1,035,807,780 |
| Cash | | 42,419 |
| Income receivable | | 3,550,293 |
| Income receivable from affiliated holdings | | 2,540,880 |
| Receivable for investments sold | | 31,199 |
| Receivable for shares sold | | 1,838,430 |
| TOTAL ASSETS | | 1,043,811,001 |
| Liabilities: | | |
| Payable for shares redeemed | $4,470,437 | |
| Income distribution payable | 389,482 | |
| Payable for investment adviser fee (Note 5) | 45,753 | |
| Payable for administrative fees (Note 5) | 6,781 | |
| Payable for Directors'/Trustees' fees (Note 5) | 769 | |
| Payable for distribution services fee (Note 5) | 61,832 | |
| Payable for other service fees (Notes 2 and 5) | 94,514 | |
| Accrued expenses (Note 5) | 212,902 | |
| TOTAL LIABILITIES | | 5,282,470 |
| Net assets for 106,228,046 shares outstanding | | $1,038,528,531 |
| Net Assets Consist of: | | |
| Paid-in capital | | $1,071,052,940 |
| Total distributable earnings (loss) | | (32,524,409) |
| TOTAL NET ASSETS | | $1,038,528,531 |
Annual Shareholder Report
Statement of Assets and Liabilities–continued
| Net Asset Value, Offering Price and Redemption Proceeds Per Share | | |
| Class A Shares: | | |
Net asset value per share ($376,744,881 ÷ 38,535,354 shares outstanding),
no par value, unlimited shares authorized | | $9.78 |
| Offering price per share (100/98.00 of $9.78) | | $9.98 |
| Redemption proceeds per share | | $9.78 |
| Class C Shares: | | |
Net asset value per share ($45,449,230 ÷ 4,643,668 shares outstanding),
no par value, unlimited shares authorized | | $9.79 |
| Offering price per share | | $9.79 |
| Redemption proceeds per share (99.00/100 of $9.79) | | $9.69 |
| Institutional Shares: | | |
Net asset value per share ($605,393,231 ÷ 61,929,287 shares outstanding),
no par value, unlimited shares authorized | | $9.78 |
| Offering price per share | | $9.78 |
| Redemption proceeds per share | | $9.78 |
| Class R6 Shares: | | |
Net asset value per share ($10,941,189 ÷ 1,119,737 shares outstanding),
no par value, unlimited shares authorized | | $9.77 |
| Offering price per share | | $9.77 |
| Redemption proceeds per share | | $9.77 |
See Notes which are an integral part of the Financial Statements
Annual Shareholder Report
Statement of Operations
Year Ended March 31, 2019
| Investment Income: | | | |
| Dividends received from affiliated holdings* | | | $39,912,103 |
| Interest | | | 16,892,845 |
| TOTAL INCOME | | | 56,804,948 |
| Expenses: | | | |
| Investment adviser fee (Note 5) | | $6,500,107 | |
| Administrative fee (Note 5) | | 870,164 | |
| Custodian fees | | 49,039 | |
| Transfer agent fee (Note 2) | | 758,120 | |
| Directors'/Trustees' fees (Note 5) | | 8,831 | |
| Auditing fees | | 29,300 | |
| Legal fees | | 15,667 | |
| Portfolio accounting fees | | 202,585 | |
| Distribution services fee (Note 5) | | 769,858 | |
| Other service fees (Notes 2 and 5) | | 1,135,713 | |
| Share registration costs | | 102,662 | |
| Printing and postage | | 48,265 | |
| Miscellaneous (Note 5) | | 31,229 | |
| TOTAL EXPENSES | | 10,521,540 | |
| Waiver and Reimbursements: | | | |
| Waiver/reimbursement of investment adviser fee (Note 5) | $(578,531) | | |
| Reimbursement of other operating expenses (Notes 2 and 5) | (538,881) | | |
| TOTAL WAIVER AND REIMBURSEMENTS | | (1,117,412) | |
| Net expenses | | | 9,404,128 |
| Net investment income | | | 47,400,820 |
| Realized and Unrealized Gain (Loss) on Investments, Futures Contracts and Foreign Currency Transactions: | | | |
| Net realized loss on investments (including net realized loss of $(487,549) on sales of investments in affiliated holdings*) | | | (8,018,841) |
| Net realized loss on futures contracts | | | (337,992) |
| Net change in unrealized depreciation of investments (including net change in unrealized depreciation of $(14,243,868) on investments in affiliated holdings*) | | | (13,862,144) |
| Net change in unrealized depreciation of futures contracts | | | 373,264 |
| Net realized and unrealized gain (loss) on investments, futures contracts and foreign currency transactions | | | (21,845,713) |
| Change in net assets resulting from operations | | | $25,555,107 |
| * | See information listed after the Fund's Portfolio of Investments |
See Notes which are an integral part of the Financial Statements
Annual Shareholder Report
Statement of Changes in Net Assets
| Year Ended March 31 | 2019 | 2018 |
| Increase (Decrease) in Net Assets | | |
| Operations: | | |
| Net investment income | $47,400,820 | $34,323,740 |
| Net realized gain (loss) | (8,356,833) | 2,822,865 |
| Net change in unrealized appreciation/depreciation | (13,488,880) | (7,628,739) |
| CHANGE IN NET ASSETS RESULTING FROM OPERATIONS | 25,555,107 | 29,517,866 |
| Distributions to Shareholders (Note 2): | | |
| Class A Shares | (16,991,424) | (12,762,562) |
| Class C Shares | (1,700,751) | (1,226,063) |
| Institutional Shares | (28,079,914) | (20,373,934) |
| Class R6 Shares | (264,254) | (27,344) |
| CHANGE IN NET ASSETS RESULTING FROM DISTRIBUTIONS TO SHAREHOLDERS | (47,036,343) | (34,389,903) |
| Share Transactions: | | |
| Proceeds from sale of shares | 592,291,369 | 520,766,114 |
| Net asset value of shares issued to shareholders in payment of distributions declared | 42,477,636 | 31,025,533 |
| Cost of shares redeemed | (568,117,589) | (413,427,620) |
| CHANGE IN NET ASSETS RESULTING FROM SHARE TRANSACTIONS | 66,651,416 | 138,364,027 |
| Change in net assets | 45,170,180 | 133,491,990 |
| Net Assets: | | |
| Beginning of period | 993,358,351 | 859,866,361 |
| End of period | $1,038,528,531 | $993,358,351 |
See Notes which are an integral part of the Financial Statements
Annual Shareholder Report
Notes to Financial Statements
March 31, 2019
1. ORGANIZATION
Federated Income Securities Trust (the “Trust”) is registered under the Act, as an open-end management investment company. The Trust consists of seven portfolios. The financial statements included herein are only those of Federated Floating Rate Strategic Income Fund (the “Fund”), a diversified portfolio. The financial statements of the other portfolios are presented separately. The assets of each portfolio are segregated and a shareholder's interest is limited to the portfolio in which shares are held. Each portfolio pays its own expenses. The Fund offers four classes of shares: Class A Shares, Class C Shares, Institutional Shares and Class R6 Shares. All shares of the Fund have equal rights with respect to voting, except on class-specific matters. The investment objective of the Fund is to provide total return consistent with current income and low interest rate volatility.
Effective August 1, 2018, an automatic conversion feature for Class C Shares was implemented. Pursuant to this automatic conversion feature, after Class C Shares have been held for ten years from the date of purchase, they will automatically convert to Class A Shares on the next monthly conversion processing date.
2. SIGNIFICANT ACCOUNTING POLICIES
The following is a summary of significant accounting policies consistently followed by the Fund in the preparation of its financial statements. These policies are in conformity with GAAP.
Investment Valuation
In calculating its NAV, the Fund generally values investments as follows:
| ■ | Fixed-income securities are fair valued using price evaluations provided by a pricing service approved by the Fund's Board of Trustees (the “Trustees”). |
| ■ | Shares of other mutual funds or non-exchange-traded investment companies are valued based upon their reported NAVs. |
| ■ | Derivative contracts listed on exchanges are valued at their reported settlement or closing price, except that options are valued at the mean of closing bid and asked quotations. |
| ■ | Over-the-counter (OTC) derivative contracts are fair valued using price evaluations provided by a pricing service approved by the Trustees. |
| ■ | For securities that are fair valued in accordance with procedures established by and under the general supervision of the Trustees, certain factors may be considered, such as: the last traded or purchase price of the security, information obtained by contacting the issuer or dealers, analysis of the issuer's financial statements or other available documents, fundamental analytical data, the nature and duration of restrictions on disposition, the movement of the market in which the security is normally traded, public trading in similar securities or derivative contracts of the issuer or comparable issuers, movement of a relevant index, or other factors including but not limited to industry changes and relevant government actions. |
If any price, quotation, price evaluation or other pricing source is not readily available when the NAV is calculated, if the Fund cannot obtain price evaluations from a pricing service or from more than one dealer for an investment within a reasonable period of time as set forth in the Fund's valuation policies and procedures, or if information furnished by a pricing service, in the opinion of the valuation committee (“Valuation Committee”), is deemed not
Annual Shareholder Report
representative of the fair value of such security, the Fund uses the fair value of the investment determined in accordance with the procedures described below. There can be no assurance that the Fund could obtain the fair value assigned to an investment if it sold the investment at approximately the time at which the Fund determines its NAV per share.
Fair Valuation and Significant Events Procedures
The Trustees have ultimate responsibility for determining the fair value of investments for which market quotations are not readily available. The Trustees have appointed a Valuation Committee comprised of officers of the Fund, the Adviser and certain of the Adviser's affiliated companies to assist in determining fair value and in overseeing the calculation of the NAV. The Trustees have also authorized the use of pricing services recommended by the Valuation Committee to provide fair value evaluations of the current value of certain investments for purposes of calculating the NAV. The Valuation Committee employs various methods for reviewing third-party pricing-service evaluations including periodic reviews of third-party pricing services' policies, procedures and valuation methods (including key inputs, methods, models and assumptions), transactional back-testing, comparisons of evaluations of different pricing services, and review of price challenges by the Adviser based on recent market activity. In the event that market quotations and price evaluations are not available for an investment, the Valuation Committee determines the fair value of the investment in accordance with procedures adopted by the Trustees. The Trustees periodically review and approve the fair valuations made by the Valuation Committee and any changes made to the procedures.
Factors considered by pricing services in evaluating an investment include the yields or prices of investments of comparable quality, coupon, maturity, call rights and other potential prepayments, terms and type, reported transactions, indications as to values from dealers and general market conditions. Some pricing services provide a single price evaluation reflecting the bid-side of the market for an investment (a “bid” evaluation). Other pricing services offer both bid evaluations and price evaluations indicative of a price between the prices bid and asked for the investment (a “mid” evaluation). The Fund normally uses bid evaluations for any U.S. Treasury and Agency securities, mortgage-backed securities and municipal securities. The Fund normally uses mid evaluations for any other types of fixed-income securities and any OTC derivative contracts. In the event that market quotations and price evaluations are not available for an investment, the fair value of the investment is determined in accordance with procedures adopted by the Trustees.
The Trustees also have adopted procedures requiring an investment to be priced at its fair value whenever the Adviser determines that a significant event affecting the value of the investment has occurred between the time as of which the price of the investment would otherwise be determined and the time as of which the NAV is computed. An event is considered significant if there is both an affirmative expectation that the investment's value will change in response to the event and a reasonable basis for quantifying the resulting change in value. Examples of significant events that may occur after the close of the principal market on which a security is traded, or after the time of a price evaluation provided by a pricing service or a dealer, include:
| ■ | With respect to securities traded principally in foreign markets, significant trends in U.S. equity markets or in the trading of foreign securities index futures contracts; |
| ■ | Political or other developments affecting the economy or markets in which an issuer conducts its operations or its securities are traded; |
| ■ | Announcements concerning matters such as acquisitions, recapitalizations, litigation developments, or a natural disaster affecting the issuer's operations or regulatory changes or market developments affecting the issuer's industry. |
Annual Shareholder Report
The Trustees have adopted procedures whereby the Valuation Committee uses a pricing service to provide factors to update the fair value of equity securities traded principally in foreign markets from the time of the close of their respective foreign stock exchanges to the pricing time of the Fund. For other significant events, the Fund may seek to obtain more current quotations or price evaluations from alternative pricing sources. If a reliable alternative pricing source is not available, the Fund will determine the fair value of the investment in accordance with the fair valuation procedures approved by the Trustees. The Trustees have ultimate responsibility for any fair valuations made in response to a significant event.
Repurchase Agreements
The Fund may invest in repurchase agreements for short-term liquidity purposes. It is the policy of the Fund to require the other party to a repurchase agreement to transfer to the Fund's custodian or sub-custodian eligible securities or cash with a market value (after transaction costs) at least equal to the repurchase price to be paid under the repurchase agreement. The eligible securities are transferred to accounts with the custodian or sub-custodian in which the Fund holds a “securities entitlement” and exercises “control” as those terms are defined in the Uniform Commercial Code. The Fund has established procedures for monitoring the market value of the transferred securities and requiring the transfer of additional eligible securities if necessary to equal at least the repurchase price. These procedures also allow the other party to require securities to be transferred from the account to the extent that their market value exceeds the repurchase price or in exchange for other eligible securities of equivalent market value.
The insolvency of the other party or other failure to repurchase the securities may delay the disposition of the underlying securities or cause the Fund to receive less than the full repurchase price. Under the terms of the repurchase agreement, any amounts received by the Fund in excess of the repurchase price and related transaction costs must be remitted to the other party.
The Fund may enter into repurchase agreements in which eligible securities are transferred into joint trading accounts maintained by the custodian or sub-custodian for investment companies and other clients advised by the Fund's Adviser and its affiliates. The Fund will participate on a pro rata basis with the other investment companies and clients in its share of the securities transferred under such repurchase agreements and in its share of proceeds from any repurchase or other disposition of such securities.
Investment Income, Gains and Losses, Expenses and Distributions
Investment transactions are accounted for on a trade-date basis. Realized gains and losses from investment transactions are recorded on an identified-cost basis. Interest income and expenses are accrued daily. Dividend income and distributions to shareholders are recorded on the ex-dividend date. Foreign dividends are recorded on the ex-dividend date or when the Fund is informed of the ex-dividend date. Distributions of net investment income, if any, are declared daily and paid monthly. Non-cash dividends included in dividend income, if any, are recorded at fair value. Amortization/accretion of premium and discount is included in investment income. Gains and losses realized on principal payment of mortgage-backed securities (paydown gains and losses) are classified as part of investment income. Investment income, realized and unrealized gains and losses, and certain fund-level expenses are
Annual Shareholder Report
allocated to each class based on relative average daily net assets, except that select classes will bear certain expenses unique to those classes. The detail of the total fund expense waiver and reimbursements of $1,117,412 is disclosed in various locations in this Note 2 and Note 5. For the year ended March 31, 2019, transfer agent fees for the Fund were as follows:
| | Transfer Agent
Fees Incurred | Transfer Agent
Fees Reimbursed |
| Class A Shares | $241,817 | $(161,409) |
| Class C Shares | 37,863 | (23,651) |
| Institutional Shares | 477,853 | (353,821) |
| Class R6 Shares | 587 | – |
| TOTAL | $758,120 | $(538,881) |
Dividends are declared separately for each class. No class has preferential dividend rights; differences in per share dividend rates are generally due to differences in separate class expenses. All distributions as indicated on the Statement of Changes in Net Assets for the year ended March 31, 2018, were from net investment income. Undistributed net investment income at March 31, 2018, was $23,580.
Other Service Fees
The Fund may pay other service fees up to 0.25% of the average daily net assets of the Fund's Class A Shares and Class C Shares to unaffiliated financial intermediaries or to Federated Shareholder Services Company (FSSC) for providing services to shareholders and maintaining shareholder accounts. Subject to the terms described in the Expense Limitation note, FSSC may voluntarily reimburse the Fund for other service fees. This reimbursement can be modified or terminated at any time. For the year ended March 31, 2019, other service fees for the Fund were as follows:
| | Other Service
Fees Incurred |
| Class A Shares | $1,019,713 |
| Class C Shares | 116,000 |
| TOTAL | $1,135,713 |
Federal Taxes
It is the Fund's policy to comply with the Subchapter M provision of the Internal Revenue Code (the “Code”) and to distribute to shareholders each year substantially all of its income. Accordingly, no provision for federal income tax is necessary. As of and during the year ended March 31, 2019, the Fund did not have a liability for any uncertain tax positions. The Fund recognizes interest and penalties, if any, related to tax liabilities as income tax expense in the Statement of Operations. As of March 31, 2019, tax years 2016 through 2019 remain subject to examination by the Fund's major tax jurisdictions, which include the United States of America and the Commonwealth of Massachusetts.
The Fund may be subject to taxes imposed by governments of countries in which it invests. Such taxes are generally based on either income or gains earned or repatriated. The Fund accrues and applies such taxes to net investment income, net realized gains and net unrealized gains as income and/or gains are earned.
Annual Shareholder Report
When-Issued and Delayed-Delivery Transactions
The Fund may engage in when-issued or delayed-delivery transactions. The Fund records when-issued securities on the trade date and maintains security positions such that sufficient liquid assets will be available to make payment for the securities purchased. Securities purchased on a when-issued or delayed-delivery basis are marked to market daily and begin earning interest on the settlement date. Losses may occur on these transactions due to changes in market conditions or the failure of counterparties to perform under the contract.
Futures Contracts
The Fund purchases and sells financial futures contracts to seek to increase income and to manage duration risk. Upon entering into a financial futures contract with a broker, the Fund is required to deposit in a segregated account, either U.S. government securities or a specified amount of Restricted cash, which is shown in the Statement of Assets and Liabilities. Futures contracts are valued daily and unrealized gains or losses are recorded in a “variation margin” account. Daily, the Fund receives from or pays to the broker a specified amount of cash based upon changes in the variation margin account. When a contract is closed, the Fund recognizes a realized gain or loss. Futures contracts have market risks, including the risk that the change in the value of the contract may not correlate with the changes in the value of the underlying securities. There is minimal counterparty risk to the Fund since futures contracts are exchange traded and the exchange's clearinghouse, as counterparty to all exchange traded futures contracts, guarantees the futures contracts against default.
At March 31, 2019, the Fund had no outstanding futures contracts.
The average notional value of short futures contracts held by the Fund throughout the period was $30,205,553. This is based on amounts held as of each month-end throughout the fiscal period.
Foreign Currency Translation
The accounting records of the Fund are maintained in U.S. dollars. All assets and liabilities denominated in foreign currencies are translated into U.S. dollars based on the rates of exchange of such currencies against U.S. dollars on the date of valuation. Purchases and sales of securities, income and expenses are translated at the rate of exchange quoted on the respective date that such transactions are recorded. The Fund does not isolate that portion of the results of operations resulting from changes in foreign exchange rates on investments from the fluctuations arising from changes in market prices of securities held. Such fluctuations are included with the net realized and unrealized gain or loss from investments.
Reported net realized foreign exchange gains or losses arise from sales of foreign currencies, currency gains or losses realized between the trade and settlement dates on securities transactions, the difference between the amounts of dividends, interest and foreign withholding taxes recorded on the Fund's books, and the U.S. dollar equivalent of the amounts actually received or paid. Net unrealized foreign exchange gains and losses arise from changes in the value of assets and liabilities other than investments in securities at fiscal period end, resulting from changes in the exchange rate.
Restricted Securities
The Fund may purchase securities which are considered restricted. Restricted securities are securities that either: (a) cannot be offered for public sale without first being registered, or being able to take advantage of an exemption from registration, under the Securities Act of 1933; or (b) are subject to contractual restrictions on public sales. In some cases, when a security cannot be offered for public sale without first being registered, the issuer of the
Annual Shareholder Report
restricted security has agreed to register such securities for resale, at the issuer's expense, either upon demand by the Fund or in connection with another registered offering of the securities. Many such restricted securities may be resold in the secondary market in transactions exempt from registration. Restricted securities may be determined to be liquid under criteria established by the Trustees. The Fund will not incur any registration costs upon such resales. The Fund's restricted securities, like other securities, are priced in accordance with procedures established by and under the general supervision of the Trustees.
The Effect of Derivative Instruments on the Statement of Operations for the Year Ended March 31, 2019
| Amount of Realized Gain or (Loss) on Derivatives Recognized in Income |
| | Futures
Contracts |
| Interest rate contracts | $(337,992) |
| Change in Unrealized Appreciation or (Depreciation) on Derivatives Recognized in Income |
| | Futures
Contracts |
| Interest rate contracts | $373,264 |
Other
The preparation of financial statements in conformity with GAAP requires management to make estimates and assumptions that affect the amounts of assets, liabilities, expenses and revenues reported in the financial statements. Actual results could differ from those estimated. The Fund applies investment company accounting and reporting guidance.
3. SHARES OF BENEFICIAL INTEREST
The following tables summarize share activity:
| Year Ended March 31 | 2019 | 2018 |
| Class A Shares: | Shares | Amount | Shares | Amount |
| Shares sold | 19,858,977 | $196,540,247 | 20,269,038 | $202,195,806 |
| Shares issued to shareholders in payment of distributions declared | 1,710,570 | 16,839,324 | 1,274,363 | 12,715,300 |
| Shares redeemed | (21,808,775) | (214,048,857) | (18,102,053) | (180,612,847) |
NET CHANGE RESULTING FROM
CLASS A SHARE TRANSACTIONS | (239,228) | $(669,286) | 3,441,348 | $34,298,259 |
| Year Ended March 31 | 2019 | 2018 |
| Class C Shares: | Shares | Amount | Shares | Amount |
| Shares sold | 2,192,663 | $21,690,109 | 1,413,670 | $14,118,296 |
| Shares issued to shareholders in payment of distributions declared | 163,467 | 1,610,412 | 117,223 | 1,170,923 |
| Shares redeemed | (2,310,666) | (22,674,648) | (1,139,001) | (11,376,413) |
NET CHANGE RESULTING FROM
CLASS C SHARE TRANSACTIONS | 45,464 | $625,873 | 391,892 | $3,912,806 |
Annual Shareholder Report
| Year Ended March 31 | 2019 | 2018 |
| Institutional Shares: | Shares | Amount | Shares | Amount |
| Shares sold | 36,711,024 | $362,639,122 | 30,308,812 | $302,412,811 |
| Shares issued to shareholders in payment of distributions declared | 2,414,678 | 23,763,650 | 1,715,042 | 17,111,970 |
| Shares redeemed | (33,637,668) | (329,655,655) | (22,114,466) | (220,512,001) |
| NET CHANGE RESULTING FROM INSTITUTIONAL SHARE TRANSACTIONS | 5,488,034 | $56,747,117 | 9,909,388 | $99,012,780 |
| Year Ended March 31 | 2019 | 2018 |
| Class R6 Shares: | Shares | Amount | Shares | Amount |
| Shares sold | 1,156,036 | $11,421,891 | 204,390 | $2,039,201 |
| Shares issued to shareholders in payment of distributions declared | 27,012 | 264,250 | 2,744 | 27,340 |
| Shares redeemed | (177,428) | (1,738,429) | (93,027) | (926,359) |
NET CHANGE RESULTING FROM
CLASS R6 SHARE TRANSACTIONS | 1,005,620 | $9,947,712 | 114,107 | $1,140,182 |
NET CHANGE RESULTING FROM
TOTAL FUND SHARE TRANSACTIONS | 6,299,890 | $66,651,416 | 13,856,735 | $138,364,027 |
4. FEDERAL TAX INFORMATION
The tax character of distributions as reported on the Statement of Changes in Net Assets for the years ended March 31, 2019 and 2018, was as follows:
| | 2019 | 2018 |
| Ordinary income | $47,036,343 | $34,389,903 |
As of March 31, 2019, the components of distributable earnings on a tax-basis were as follows:
| Undistributed ordinary income | $141,985 |
| Net unrealized depreciation | $(22,875,651) |
| Capital loss carryforwards | $(9,790,743) |
The difference between book-basis and tax-basis net unrealized appreciation/depreciation is attributable to differing treatments for deferral of losses on wash sales and discount accretion/premium amortization on debt securities.
At March 31, 2019, the cost of investments for federal tax purposes was $1,058,683,431. The net unrealized depreciation of investments for federal tax purposes was $22,875,651. This consists of net unrealized appreciation from investments for those securities having an excess of value over cost of $1,557,919 and net unrealized depreciation from investments for those securities having an excess of cost over value of $24,433,570.
At March 31, 2019, the Fund had a capital loss carryforward of $9,790,743 which will reduce the Fund's taxable income arising from future net realized gains on investments, if any, to the extent permitted by the Code, thereby reducing the amount of distributions to shareholders which would otherwise be necessary to relieve the Fund of any liability for federal income tax.
Annual Shareholder Report
Pursuant to the Code, a net capital loss incurred in taxable years beginning after December 22, 2010, retains its character as either short-term or long-term and does not expire. All of the Fund's capital loss carryforwards were incurred in taxable years beginning after December 22, 2010.
The following schedule summarizes the Fund's capital loss carryforwards:
| Short-Term | Long-Term | Total |
| $1,947,631 | $7,843,112 | $9,790,743 |
5. INVESTMENT ADVISER FEE AND OTHER TRANSACTIONS WITH AFFILIATES
Investment Adviser Fee
The advisory agreement between the Fund and the Adviser provides for an annual fee equal to 0.60% of the Fund's average daily net assets. Subject to the terms described in the Expense Limitation note, the Adviser may voluntarily choose to waive any portion of its fee and/or reimburse certain operating expenses. For the year ended March 31, 2019, the Adviser voluntarily waived $570,344 of its fee and voluntarily reimbursed $538,881 of transfer agent fees.
The Adviser has agreed to reimburse the Fund for certain investment adviser fees as a result of transactions in other affiliated investment companies. For the year ended March 31, 2019, the Adviser reimbursed $8,187.
Administrative Fee
Federated Administrative Services (FAS), under the Administrative Services Agreement, provides the Fund with administrative personnel and services. For purposes of determining the appropriate rate breakpoint, “Investment Complex” is defined as all of the Federated Funds subject to a fee under the Administrative Services Agreement. The fee paid to FAS is based on the average daily net assets of the Investment Complex as specified below:
| Administrative Fee | Average Daily Net Assets
of the Investment Complex |
| 0.100% | on assets up to $50 billion |
| 0.075% | on assets over $50 billion |
Subject to the terms described in the Expense Limitation note, FAS may voluntarily choose to waive any portion of its fee. For the year ended March 31, 2019, the annualized fee paid to FAS was 0.080% of average daily net assets of the Fund.
Prior to September 1, 2017, the breakpoints of the Administrative Fee paid to FAS, described above, were:
| Administrative Fee | Average Daily Net Assets
of the Investment Complex |
| 0.150% | on the first $5 billion |
| 0.125% | on the next $5 billion |
| 0.100% | on the next $10 billion |
| 0.075% | on assets in excess of $20 billion |
In addition, FAS may charge certain out-of-pocket expenses to the Fund.
Annual Shareholder Report
Distribution Services Fee
The Fund has adopted a Distribution Plan (the “Plan”) pursuant to Rule 12b-1 under the Act. Under the terms of the Plan, the Fund will compensate Federated Securities Corp. (FSC), the principal distributor, from the daily net assets of the Fund's Class A Shares and Class C Shares to finance activities intended to result in the sale of these shares. The Plan provides that the Fund may incur distribution expenses at the following percentages of average daily net assets annually, to compensate FSC:
| Share Class Name | Percentage of Average Daily
Net Assets of Class |
| Class A Shares | 0.10% |
| Class C Shares | 0.75% |
Subject to the terms described in the Expense Limitation note, FSC may voluntarily choose to waive any portion of its fee. For the year ended March 31, 2019, distribution services fees for the Fund were as follows:
| | Distribution Services
Fees Incurred |
| Class A Shares | $407,886 |
| Class C Shares | 361,972 |
| TOTAL | $769,858 |
When FSC receives fees, it may pay some or all of them to financial intermediaries whose customers purchase shares. For the year ended March 31, 2019, FSC retained $83,167 fees paid by the Fund.
Sales Charges
Front-end sales charges and contingent deferred sales charges (CDSC) do not represent expenses of the Fund. They are deducted from the proceeds of sales of Fund shares prior to investment or from redemption proceeds prior to remittance, as applicable. For the year ended March 31, 2019, FSC did not retain sales charges from the sale of the Class A Shares. For the year ended March 31, 2019, FSC retained $90 and $14,495 of CDSC relating to redemptions of Class A Shares and Class C Shares, respectively.
Other Service Fees
For the year ended March 31, 2019, FSSC received $1,787 of the other service fees disclosed in Note 2.
Expense Limitation
The Adviser and certain of its affiliates (which may include FSC, FAS and FSSC) on their own initiative have agreed to waive certain amounts of their respective fees and/or reimburse expenses. Effective June 1, 2019, total annual fund operating expenses (as shown in the financial highlights, excluding interest expense, extraordinary expenses and proxy-related expenses paid by the Fund, if any) paid by the Fund's Class A Shares, Class C Shares, Institutional Shares and Class R6 Shares (after the voluntary waivers and/or reimbursements) will not exceed 1.04%, 1.76%, 0.69% and 0.68% (the “Fee Limit”), respectively, up to but not including the later of (the “Termination Date”): (a) June 1, 2020; or (b) the date of the Fund's
Annual Shareholder Report
next effective Prospectus. While the Adviser and its applicable affiliates currently do not anticipate terminating or increasing these arrangements prior to the Termination Date, these arrangements may only be terminated or the Fee Limit increased prior to the Termination Date with the agreement of the Trustees.
Interfund Transactions
During the year ended March 31, 2019, the Fund engaged in sale transactions with funds that have a common investment adviser (or affiliated investment advisers), common Directors/Trustees and/or common Officers. These sale transactions complied with Rule 17a-7 under the Act and amounted to $6,082,375.
Directors'/Trustees' and Miscellaneous Fees
Certain Officers and Trustees of the Fund are Officers and Directors or Trustees of certain of the above companies. To efficiently facilitate payment, Directors'/Trustees' fees and certain expenses related to conducting meetings of the Directors/Trustees and other miscellaneous expenses are paid by an affiliate of the Adviser which in due course are reimbursed by the Fund. These expenses related to conducting meetings of the Directors/Trustees and other miscellaneous expenses may be included in Accrued and Miscellaneous Expenses on the Statement of Assets and Liabilities and Statement of Operations, respectively.
6. INVESTMENT TRANSACTIONS
Purchases and sales of investments, excluding long-term U.S. government securities and short-term obligations, for the year ended March 31, 2019, were as follows:
| Purchases | $474,898,949 |
| Sales | $415,049,660 |
Annual Shareholder Report
7. LINE OF CREDIT
The Fund participates with certain other Federated Funds, on a several basis, in an up to $500,000,000 unsecured, 364-day, committed, revolving line of credit (LOC) agreement. The LOC was made available to finance temporarily the repurchase or redemption of shares of the Fund, failed trades, payment of dividends, settlement of trades and for other short-term, temporary or emergency general business purposes. The Fund cannot borrow under the LOC if an inter-fund loan is outstanding. The Fund's ability to borrow under the LOC also is subject to the limitations of the Act and various conditions precedent that must be satisfied before the Fund can borrow. Loans under the LOC are charged interest at a fluctuating rate per annum equal to the highest, on any day, of (a) (i) the federal funds effective rate, (ii) the one month London Interbank Offered Rate (LIBOR), and (iii) 0.0%, plus (b) a margin. The LOC also requires the Fund to pay, quarterly in arrears and at maturity, its pro rata share of a commitment fee based on the amount of the lenders' commitment that has not been utilized. As of March 31, 2019, the Fund had no outstanding loans. During the year ended March 31, 2019, the Fund did not utilize the LOC.
8. INTERFUND LENDING
Pursuant to an Exemptive Order issued by the Securities and Exchange Commission, the Fund, along with other funds advised by subsidiaries of Federated Investors, Inc., may participate in an interfund lending program. This program provides an alternative credit facility allowing the Fund to borrow from other participating affiliated funds. As of March 31, 2019, there were no outstanding loans. During the year ended March 31, 2019, the program was not utilized.
Annual Shareholder Report
Report of Independent Registered Public Accounting Firm
TO THE board of trustees OF federated income securities trust and shareholders of Federated Floating Rate Strategic Income Fund:
Opinion on the Financial Statements
We have audited the accompanying statement of assets and liabilities of Federated Floating Rate Strategic Income Fund (the “Fund”) (one of the portfolios constituting Federated Income Securities Trust), including the portfolio of investments, as of March 31, 2019, and the related statement of operations for the year then ended, the statement of changes in net assets for each of the two years in the period then ended, the financial highlights for each of the five years in the period then ended and the related notes (collectively referred to as the “financial statements”). In our opinion, the financial statements present fairly, in all material respects, the financial position of the Fund at March 31, 2019, the results of its operations for the year then ended, the changes in its net assets for each of the two years in the period then ended and its financial highlights for each of the five years in the period then ended, in conformity with U.S. generally accepted accounting principles.
Basis for Opinion
These financial statements are the responsibility of the Fund's management. Our responsibility is to express an opinion on the Fund's financial statements based on our audits. We are a public accounting firm registered with the Public Company Accounting Oversight Board (United States) (“PCAOB”) and are required to be independent with respect to the Fund in accordance with the U.S. federal securities laws and the applicable rules and regulations of the Securities and Exchange Commission and the PCAOB.
We conducted our audits in accordance with standards of the PCAOB. Those standards require that we plan and perform the audit to obtain reasonable assurance about whether the financial statements and financial highlights are free of material misstatement, whether due to error or fraud. The Fund is not required to have, nor were we engaged to perform, an audit of the Fund's internal control over financial reporting. As part of our audits, we are required to obtain an understanding of internal control over financial reporting, but not for the purpose of expressing an opinion on the effectiveness of the Fund's internal control over financial reporting. Accordingly, we express no such opinion.
Annual Shareholder Report
Our audits included performing procedures to assess the risks of material misstatement of the financial statements, whether due to error or fraud, and performing procedures that respond to those risks. Such procedures included examining, on a test basis, evidence regarding the amounts and disclosures in the financial statements. Our procedures included confirmation of securities owned as of March 31, 2019, by correspondence with the custodian and others, or by other appropriate auditing procedures where replies from others were not received. Our audits also included evaluating the accounting principles used and significant estimates made by management, as well as evaluating the overall presentation of the financial statements. We believe that our audits provide a reasonable basis for our opinion.
We have served as the auditor of one or more Federated investment companies since 1979.
Boston, Massachusetts
May 22, 2019
Annual Shareholder Report
Shareholder Expense Example (unaudited)
As a shareholder of the Fund, you incur two types of costs: (1) transaction costs, including sales charges (loads) on purchase or redemption payments; and (2) ongoing costs, including management fees and to the extent applicable, distribution (12b-1) fees and/or other service fees and other Fund expenses. This Example is intended to help you to understand your ongoing costs (in dollars) of investing in the Fund and to compare these costs with the ongoing costs of investing in other mutual funds. It is based on an investment of $1,000 invested at the beginning of the period and held for the entire period from October 1, 2018 to March 31, 2019.
ACTUAL EXPENSES
The first section of the table below provides information about actual account values and actual expenses. You may use the information in this section, together with the amount you invested, toestimate the expenses that you incurred over the period. Simply divide your account value by $1,000 (for example, an $8,600 account value divided by $1,000 = 8.6), then multiply the result by the number in the first section under the heading entitled “Expenses Paid During Period” to estimate the expenses attributable to your investment during this period.
HYPOTHETICAL EXAMPLE FOR COMPARISON PURPOSES
The second section of the table below provides information about hypothetical account values and hypothetical expenses based on the Fund's actual expense ratio and anassumed rate of return of 5% per year before expenses, which is not the Fund's actual return. Thus, you shouldnot use the hypothetical account values and expenses to estimate the actual ending account balance or your expenses for the period. Rather, these figures are required to be provided to enable you to compare the ongoing costs of investing in the Fund with other funds. To do so, compare this 5% hypothetical example with the 5% hypothetical examples that appear in the shareholder reports of the other funds.
Annual Shareholder Report
Please note that the expenses shown in the table are meant to highlight your ongoing costs only and do not reflect any transaction costs, such as sales charges (loads) on purchase or redemption payments. Therefore, the second section of the table is useful in comparing ongoing costs only, and will not help you determine the relativetotal costs of owning different funds. In addition, if these transaction costs were included, your costs would have been higher.
| | Beginning
Account Value
10/1/2018 | Ending
Account Value
3/31/2019 | Expenses Paid
During Period1 |
| Actual: | | | |
| Class A Shares | $1,000 | $1,004.90 | $5.20 |
| Class C Shares | $1,000 | $1,001.60 | $8.43 |
| Institutional Shares | $1,000 | $1,006.60 | $3.45 |
| Class R6 Shares | $1,000 | $1,006.60 | $3.40 |
Hypothetical (assuming a 5% return
before expenses): | | | |
| Class A Shares | $1,000 | $1,019.70 | $5.24 |
| Class C Shares | $1,000 | $1,016.50 | $8.50 |
| Institutional Shares | $1,000 | $1,021.50 | $3.48 |
| Class R6 Shares | $1,000 | $1,021.50 | $3.43 |
| 1 | Expenses are equal to the Fund's annualized net expense ratios, multiplied by the average account value over the period, multiplied by 182/365 (to reflect the one-half-year period). The annualized net expense ratios are as follows:
|
| | |
| Class A Shares | 1.04% |
| Class C Shares | 1.69% |
| Institutional Shares | 0.69% |
| Class R6 Shares | 0.68% |
Annual Shareholder Report
Board of Trustees and Trust Officers
The Board of Trustees is responsible for managing the Trust's business affairs and for exercising all the Trust's powers except those reserved for the shareholders. The following tables give information about each Trustee and the senior officers of the Fund. Where required, the tables separately list Trustees who are “interested persons” of the Fund (i.e., “Interested” Trustees) and those who are not (i.e., “Independent” Trustees). Unless otherwise noted, the address of each person listed is Federated Investors Tower, 1001 Liberty Avenue, Pittsburgh, PA 15222. The address of all Independent Trustees listed is 4000 Ericsson Drive, Warrendale, PA 15086-7561; Attention: Mutual Fund Board. As of December 31, 2018, the Trust comprised seven portfolio(s), and the Federated Fund Family consisted of 40 investment companies (comprising 102 portfolios). Unless otherwise noted, each Officer is elected annually. Unless otherwise noted, each Trustee oversees all portfolios in the Federated Fund Family and serves for an indefinite term. The Fund's Statement of Additional Information includes additional information about Trust Trustees and is available, without charge and upon request, by calling 1-800-341-7400.
Interested TRUSTEES Background
Name
Birth Date
Positions Held with Trust
Date Service Began | Principal Occupation(s) for Past Five Years,
Other Directorships Held and Previous Position(s) |
J. Christopher Donahue*
Birth Date: April 11, 1949
President and Trustee
Indefinite Term
Began serving: January 2000 | Principal Occupations: Principal Executive Officer and President of certain of the Funds in the Federated Fund Family; Director or Trustee of the Funds in the Federated Fund Family; President, Chief Executive Officer and Director, Federated Investors, Inc.; Chairman and Trustee, Federated Investment Management Company; Trustee, Federated Investment Counseling; Chairman and Director, Federated Global Investment Management Corp.; Chairman and Trustee, Federated Equity Management Company of Pennsylvania; Trustee, Federated Shareholder Services Company; Director, Federated Services Company.
Previous Positions: President, Federated Investment Counseling; President and Chief Executive Officer, Federated Investment Management Company, Federated Global Investment Management Corp. and Passport Research, Ltd; Chairman, Passport Research, Ltd. |
Annual Shareholder Report
Name
Birth Date
Positions Held with Trust
Date Service Began | Principal Occupation(s) for Past Five Years,
Other Directorships Held and Previous Position(s) |
John B. Fisher*
Birth Date: May 16, 1956
Trustee
Indefinite Term
Began serving: May 2016 | Principal Occupations:Principal Executive Officer and President of certain of the Funds in the Federated Fund Family; Director or Trustee of certain of the Funds in the Federated Fund Family; Vice President, Federated Investors, Inc.; President, Director/Trustee and CEO, Federated Advisory Services Company, Federated Equity Management Company of Pennsylvania, Federated Global Investment Management Corp., Federated Investment Counseling, Federated Investment Management Company; President of some of the Funds in the Federated Fund Complex and Director, Federated Investors Trust Company.
Previous Positions: President and Director of the Institutional Sales Division of Federated Securities Corp.; President and Director of Federated Investment Counseling; President and CEO of Passport Research, Ltd.; Director, Edgewood Securities Corp.; Director, Federated Services Company; Director, Federated Investors, Inc.; Chairman and Director, Southpointe Distribution Services, Inc. and President, Technology, Federated Services Company. |
| * | Reasons for “interested” status: J. Christopher Donahue and John B. Fisher are interested due to their beneficial ownership of shares of Federated Investors, Inc. and due to positions they hold with Federated and its subsidiaries. |
INDEPENDENT TRUSTEES Background
Name
Birth Date
Positions Held with Trust
Date Service Began | Principal Occupation(s) for Past Five Years,
Other Directorships Held, Previous Position(s) and Qualifications |
John T. Collins
Birth Date: January 24, 1947
Trustee
Indefinite Term
Began serving: October 2013 | Principal Occupations: Director or Trustee of the Federated Fund Family; formerly, Chairman and CEO, The Collins Group, Inc. (a private equity firm) (Retired).
Other Directorships Held: Director, Chairman of the Compensation Committee, KLX Energy Services Holdings, Inc. (oilfield services); former Director of KLX Corp. (aerospace).
Qualifications: Mr. Collins has served in several business and financial management roles and directorship positions throughout his career. Mr. Collins previously served as Chairman and CEO of The Collins Group, Inc. (a private equity firm) and as a Director of KLX Corp. Mr. Collins serves as Chairman Emeriti, Bentley University. Mr. Collins previously served as Director and Audit Committee Member, Bank of America Corp.; Director, FleetBoston Financial Corp.; and Director, Beth Israel Deaconess Medical Center (Harvard University Affiliate Hospital). |
Annual Shareholder Report
Name
Birth Date
Positions Held with Trust
Date Service Began | Principal Occupation(s) for Past Five Years,
Other Directorships Held, Previous Position(s) and Qualifications |
G. Thomas Hough
Birth Date: February 28, 1955
Trustee
Indefinite Term
Began serving: August 2015 | Principal Occupations: Director or Trustee of the Federated Fund Family; formerly, Vice Chair, Ernst & Young LLP (public accounting firm) (Retired).
Other Directorships Held: Director, Member of Governance and Compensation Committees, Publix Super Markets, Inc.; Director, Chair of the Audit Committee, Equifax, Inc.; Director, Member of the Audit Committee, Haverty Furniture Companies, Inc.
Qualifications: Mr. Hough has served in accounting, business management and directorship positions throughout his career. Mr. Hough most recently held the position of Americas Vice Chair of Assurance with Ernst & Young LLP (public accounting firm). Mr. Hough serves on the President's Cabinet and Business School Board of Visitors for the University of Alabama and is on the Business School Board of Visitors for Wake Forest University. Mr. Hough previously served as an Executive Committee member of the United States Golf Association. |
Maureen Lally-Green
Birth Date: July 5, 1949
Trustee
Indefinite Term
Began serving: August 2009 | Principal Occupations: Director or Trustee of the Federated Fund Family; Dean of the Duquesne University School of Law; Professor and Adjunct Professor of Law, Duquesne University School of Law; formerly, Interim Dean of the Duquesne University School of Law; formerly, Associate General Secretary and Director, Office of Church Relations, Diocese of Pittsburgh.
Other Directorships Held: Director, CNX Resources Corporation (formerly known as CONSOL Energy Inc.).
Qualifications: Judge Lally-Green has served in various legal and business roles and directorship positions throughout her career and currently serves as the Dean of the School of Law of Duquesne University. Judge Lally-Green previously served as a member of the Superior Court of Pennsylvania and as a Professor of Law, Duquesne University School of Law. Judge Lally-Green also currently holds the positions on not for profit or for profit boards of directors as follows: Director and Chair, UPMC Mercy Hospital; Director and Vice Chair, Our Campaign for the Church Alive!, Inc.; Regent, Saint Vincent Seminary; Member, Pennsylvania State Board of Education (public); and Director CNX Resources Corporation (formerly known as CONSOL Energy Inc.). Judge Lally-Green has held the positions of: Director, Auberle; Director, Epilepsy Foundation of Western and Central Pennsylvania; Director, Ireland Institute of Pittsburgh; Director, Saint Thomas More Society; Director and Chair, Catholic High Schools of the Diocese of Pittsburgh, Inc.; Director, Pennsylvania Bar Institute; Director, St. Vincent College; and Director and Chair, North Catholic High School, Inc. |
Charles F. Mansfield, Jr.
Birth Date: April 10, 1945
Trustee
Indefinite Term
Began serving: November 1999 | Principal Occupations: Director or Trustee of the Federated Fund Family; Management Consultant and Author.
Other Directorships Held: None.
Qualifications: Mr. Mansfield has served as a Marine Corps officer and in several banking, business management, educational roles and directorship positions throughout his long career. He remains active as a Management Consultant and Author. |
Annual Shareholder Report
Name
Birth Date
Positions Held with Trust
Date Service Began | Principal Occupation(s) for Past Five Years,
Other Directorships Held, Previous Position(s) and Qualifications |
Thomas M. O'Neill
Birth Date: June 14, 1951
Trustee
Indefinite Term
Began serving: October 2006 | Principal Occupations: Director or Trustee, Chair of the Audit Committee of the Federated Fund Family; Sole Proprietor, Navigator Management Company (investment and strategic consulting).
Other Directorships Held: None.
Qualifications: Mr. O'Neill has served in several business, mutual fund and financial management roles and directorship positions throughout his career. Mr. O'Neill serves as Director, Medicines for Humanity and Director, The Golisano Children's Museum of Naples, Florida. Mr. O'Neill previously served as Chief Executive Officer and President, Managing Director and Chief Investment Officer, Fleet Investment Advisors; President and Chief Executive Officer, Aeltus Investment Management, Inc.; General Partner, Hellman, Jordan Management Co., Boston, MA; Chief Investment Officer, The Putnam Companies, Boston, MA; Credit Analyst and Lending Officer, Fleet Bank; Director and Consultant, EZE Castle Software (investment order management software); and Director, Midway Pacific (lumber). |
P. Jerome Richey
Birth Date: February 23, 1949
Trustee
Indefinite Term
Began serving: October 2013 | Principal Occupations: Director or Trustee of the Federated Fund Family; Management Consultant; Retired; formerly, Senior Vice Chancellor and Chief Legal Officer, University of Pittsburgh and Executive Vice President and Chief Legal Officer, CNX Resources Corporation (formerly known as CONSOL Energy Inc.).
Other Directorships Held: None.
Qualifications: Mr. Richey has served in several business and legal management roles and directorship positions throughout his career. Mr. Richey most recently held the positions of Senior Vice Chancellor and Chief Legal Officer, University of Pittsburgh. Mr. Richey previously served as Chairman of the Board, Epilepsy Foundation of Western Pennsylvania and Chairman of the Board, World Affairs Council of Pittsburgh. Mr. Richey previously served as Chief Legal Officer and Executive Vice President, CNX Resources Corporation (formerly known as CONSOL Energy Inc.); and Board Member, Ethics Counsel and Shareholder, Buchanan Ingersoll & Rooney PC (a law firm). |
John S. Walsh
Birth Date: November 28, 1957
Trustee
Indefinite Term
Began serving: November 1999 | Principal Occupations: Director or Trustee, and Chair of the Board of Directors or Trustees, of the Federated Fund Family; President and Director, Heat Wagon, Inc. (manufacturer of construction temporary heaters); President and Director, Manufacturers Products, Inc. (distributor of portable construction heaters); President, Portable Heater Parts, a division of Manufacturers Products, Inc.
Other Directorships Held: None.
Qualifications: Mr. Walsh has served in several business management roles and directorship positions throughout his career. Mr. Walsh previously served as Vice President, Walsh & Kelly, Inc. (paving contractors). |
Annual Shareholder Report
OFFICERS
Name
Birth Date
Address
Positions Held with Trust
Date Service Began | Principal Occupation(s) for Past Five Years
and Previous Position(s) |
Lori A. Hensler
Birth Date: January 6, 1967
TREASURER
Officer since: April 2013 | Principal Occupations: Principal Financial Officer and Treasurer of the Federated Fund Family; Senior Vice President, Federated Administrative Services; Financial and Operations Principal for Federated Securities Corp. and Edgewood Services, Inc.; and Assistant Treasurer, Federated Investors Trust Company. Ms. Hensler has received the Certified Public Accountant designation.
Previous Positions: Controller of Federated Investors, Inc.; Senior Vice President and Assistant Treasurer, Federated Investors Management Company; Treasurer, Federated Investors Trust Company; Assistant Treasurer, Federated Administrative Services, Federated Administrative Services, Inc., Federated Securities Corp., Edgewood Services, Inc., Federated Advisory Services Company, Federated Equity Management Company of Pennsylvania, Federated Global Investment Management Corp., Federated Investment Counseling, Federated Investment Management Company, Passport Research, Ltd., and Federated MDTA, LLC; Financial and Operations Principal for Federated Securities Corp., Edgewood Services, Inc. and Southpointe Distribution Services, Inc. |
Peter J. Germain
Birth Date: September 3, 1959
CHIEF LEGAL OFFICER, SECRETARY and EXECUTIVE VICE PRESIDENT
Officer since: January 2005 | Principal Occupations: Mr. Germain is Chief Legal Officer, Secretary and Executive Vice President of the Federated Fund Family. He is General Counsel, Chief Legal Officer, Secretary and Executive Vice President, Federated Investors, Inc.; Trustee and Senior Vice President, Federated Investors Management Company; Trustee and President, Federated Administrative Services; Director and President, Federated Administrative Services, Inc.; Director and Vice President, Federated Securities Corp.; Director and Secretary, Federated Private Asset Management, Inc.; Secretary, Federated Shareholder Services Company; and Secretary, Retirement Plan Service Company of America. Mr. Germain joined Federated in 1984 and is a member of the Pennsylvania Bar Association.
Previous Positions: Deputy General Counsel, Special Counsel, Managing Director of Mutual Fund Services, Federated Investors, Inc.; Senior Vice President, Federated Services Company; and Senior Corporate Counsel, Federated Investors, Inc. |
Stephen Van Meter
Birth Date: June 5, 1975
CHIEF COMPLIANCE OFFICER AND SENIOR VICE PRESIDENT
Officer since: July 2015 | Principal Occupations: Senior Vice President and Chief Compliance Officer of the Federated Fund Family; Vice President and Chief Compliance Officer of Federated Investors, Inc. and Chief Compliance Officer of certain of its subsidiaries. Mr. Van Meter joined Federated in October 2011. He holds FINRA licenses under Series 3, 7, 24 and 66.
Previous Positions: Mr. Van Meter previously held the position of Compliance Operating Officer, Federated Investors, Inc. Prior to joining Federated, Mr. Van Meter served at the United States Securities and Exchange Commission in the positions of Senior Counsel, Office of Chief Counsel, Division of Investment Management and Senior Counsel, Division of Enforcement. |
Annual Shareholder Report
Name
Birth Date
Address
Positions Held with Trust
Date Service Began | Principal Occupation(s) for Past Five Years
and Previous Position(s) |
Robert J. Ostrowski
Birth Date: April 26, 1963
Chief Investment Officer
Officer since: May 2004 | Principal Occupations: Robert J. Ostrowski joined Federated in 1987 as an Investment Analyst and became a Portfolio Manager in 1990. He was named Chief Investment Officer of Federated's taxable fixed-income products in 2004 and also serves as a Senior Portfolio Manager. Mr. Ostrowski became an Executive Vice President of the Fund's Adviser in 2009 and served as a Senior Vice President of the Fund's Adviser from 1997 to 2009. Mr. Ostrowski has received the Chartered Financial Analyst designation. He received his M.S. in Industrial Administration from Carnegie Mellon University. |
Annual Shareholder Report
Evaluation and Approval of Advisory Contract–May 2018
Federated Floating Rate Strategic Income Fund (the “Fund”)
At its meetings in May 2018, the Fund's Board of Trustees (the “Board”), including a majority of those Trustees who are not “interested persons” of the Fund, as defined in the Investment Company Act of 1940 (the “Independent Trustees”), reviewed and unanimously approved the continuation of the Fund's investment advisory contract for an additional one-year term. The Board's decision regarding the contract reflects the exercise of its business judgment after considering all of the information received on whether to continue the existing arrangements.
The Board had previously appointed a Senior Officer, whose duties included specified responsibilities relating to the process by which advisory fees are to be charged to a fund advised by Federated Investment Management Company (the “Adviser”) or its affiliates (collectively, “Federated”) (each, a “Federated fund”). The Senior Officer's responsibilities included preparing and furnishing to the Board an annual independent written evaluation that covered topics discussed below. In December 2017, the Senior Officer position was eliminated. Notwithstanding the elimination of the Senior Officer position, at the request of the Independent Trustees, the Fund's Chief Compliance Officer (the CCO) furnished to the Board in advance of its May 2018 meetings an independent written evaluation covering substantially the same topics that had been covered in the Senior Officer's written evaluation in prior years. The Board considered the CCO's independent written evaluation (the “CCO Fee Evaluation Report”), along with other information, in evaluating the reasonableness of the Fund's management fee and in deciding to approve the continuation of the investment advisory contract. Consistent with the former Senior Officer position, the CCO, in preparing the CCO Fee Evaluation Report, has the authority to retain consultants, experts or staff as reasonably necessary to assist in the performance of his duties, reports directly to the Board, and can be terminated only with the approval of a majority of the Independent Trustees.
The Board also considered judicial decisions concerning allegedly excessive investment advisory fees in making its decision. Using these judicial decisions as a guide, the Board observed that the following factors may be relevant to an adviser's fiduciary duty with respect to its receipt of compensation from a fund: (1) the nature and quality of the services provided by an adviser to a fund and its shareholders (including the performance of the fund, its benchmark, and comparable funds); (2) an adviser's cost of providing the services (including the profitability to an adviser of providing advisory services to a fund); (3) the extent to which an adviser may realize “economies of scale” as a fund grows larger and, if such economies of scale exist, whether they have been shared with a fund and its shareholders or the family of funds; (4) any “fall-out” financial benefits that accrue to an adviser because of its relationship with a fund (including
Annual Shareholder Report
research services received from brokers that execute fund trades and any fees paid to affiliates of an adviser for services rendered to a fund); (5) comparative fee and expense structures (including a comparison of fees paid to an adviser with those paid by similar funds both internally and externally as well as management fees charged to institutional and other advisory clients of the Adviser or its affiliates for what might be viewed as like services); and (6) the extent of care, conscientiousness and independence with which the fund's board members perform their duties and their expertise (including whether they are fully informed about all facts the board deems relevant to its consideration of an adviser's services and fees). The Board noted that the Securities and Exchange Commission (SEC) disclosure requirements regarding the basis for the Board's approval of the Fund's investment advisory contract generally align with the factors listed above. The Board was aware of these factors and was guided by them in its review of the Fund's investment advisory contract to the extent it considered them to be appropriate and relevant, as discussed further below.
The Board considered and weighed these factors in light of its substantial accumulated experience in governing the Fund and working with Federated on matters relating to the Federated funds. The Independent Trustees were assisted in their deliberations by independent legal counsel.
In addition to the extensive materials that comprise and accompany the CCO Fee Evaluation Report, the Board received detailed information about the Fund and the Federated organization throughout the year, and in connection with its May meetings at which the Board's formal approval of the advisory and subadvisory contracts occurred. In this regard, Federated provided much of this information at each regular meeting of the Board, and furnished additional information specifically in connection with the May meetings. In the months preceding the May meetings, the Board requested and reviewed written materials prepared by Federated in response to requests on behalf of the Independent Trustees encompassing a wide variety of topics. At the May meetings, in addition to meeting in separate sessions of the Independent Trustees without management present, senior management of the Adviser also met with the Independent Trustees and their counsel to discuss the materials presented and such additional matters as the Independent Trustees deemed reasonably necessary to evaluate the advisory and subadvisory contracts. Between regularly scheduled meetings, the Board also received information on particular matters as the need arose.
The Board's consideration of the investment advisory contract included review of the CCO Fee Evaluation Report, accompanying data and additional information covering the following matters, among others: the Adviser's investment philosophy, revenue, profitability, personnel and processes; investment and operating strategies; the Fund's short-term and long-term performance (in absolute terms, both on a gross basis and net of expenses, as well as in terms relative to its particular investment program and certain competitor or “peer group” funds and/or other benchmarks, as appropriate) and comments on the
Annual Shareholder Report
reasons for performance; the Fund's investment objectives; the Fund's expenses, including the advisory fee and the overall expense structure of the Fund (both in absolute terms and relative to similar and/or competing funds), with due regard for contractual or voluntary expense limitations; the use and allocation of brokerage commissions derived from trading the Fund's portfolio securities (if any); and the nature, quality and extent of the advisory and other services provided to the Fund by the Adviser and its affiliates. The Board also considered the preferences and expectations of Fund shareholders; the entrepreneurial and other risks assumed by the Adviser in sponsoring the Fund; the continuing state of competition in the mutual fund industry and market practices; the range of comparable fees for similar funds in the mutual fund industry; the Fund's relationship to the Federated funds which include a comprehensive array of funds with different investment objectives, policies and strategies which are generally available for exchange without the incurrence of additional sales charges; compliance and audit reports concerning the Federated funds and the Federated companies that service them (including communications from regulatory agencies), as well as Federated's responses to any issues raised therein; and relevant developments in the mutual fund industry and how the Federated funds and/or Federated are responding to them. The Board's evaluation process is evolutionary. The criteria considered and the emphasis placed on relevant criteria change in recognition of changing circumstances in the mutual fund marketplace.
While mindful that courts have cautioned against giving too much weight to comparative information concerning fees charged by other advisers for managing funds with comparable investment programs, the Board has found the use of such comparisons to be relevant to its deliberations. In this regard, the Board was presented with, and considered, information regarding the contractual advisory fee rates, net advisory fee rates, total expense ratios and each element of the Fund's total expense ratio (i.e., gross and net advisory fees, custody fees, portfolio accounting fees and transfer agency fees) relative to an appropriate group of peer funds compiled by Federated using data supplied by independent fund ranking organizations (the “Peer Group”). The Board received a description of the composition and methodology used to select the Peer Group. The Board focused on comparisons with other similar mutual funds more heavily than non-mutual fund products or services because it is believed that they are more relevant. For example, other mutual funds are the products most like the Fund, in that they are readily available to Fund shareholders as alternative investment vehicles. Also, they are the type of investment vehicle, in fact, chosen and maintained by the Fund's investors. The range of their fees and expenses, therefore, appears to be a relevant indicator of what consumers have found to be reasonable in the marketplace in which the Fund competes.
Annual Shareholder Report
The Board reviewed the contractual advisory fee rate, net advisory fee rate and other expenses of the Fund and noted the position of the Fund's fee rates relative to its Peer Group. In this regard, the Board noted that the contractual advisory fee rate was below the median of the relevant Peer Group and the Board was satisfied that the overall expense structure of the Fund remained competitive.
For comparison, the CCO reviewed the fees charged by Federated for providing advisory services to products other than the Federated funds (e.g., institutional and separate accounts and third-party unaffiliated mutual funds for which Federated serves as sub-adviser) (referenced to as “Comparable Funds/Accounts”). With respect to Comparable Funds/Accounts other than third-party mutual funds, the CCO concluded that they are inherently different products. Those differences include, but are not limited to, different types of targeted investors; different applicable laws and regulations; different legal structures; different average account sizes and portfolio management techniques made necessary by different cash flows and different associated costs; and the time spent by portfolio managers and their teams, as well as personnel in the Funds Financial Services, Legal, Compliance and Risk Management departments, in reviewing securities pricing, addressing different administrative responsibilities, addressing different degrees of risk associated with management and a variety of different costs. The CCO also reviewed the differences in the nature of the services required for Federated to manage its proprietary mutual fund business versus managing a discrete pool of assets as a sub-adviser to another institution's mutual fund, and that Federated generally performs significant additional services and assumes substantially greater risk in managing the Fund and other Federated funds than in its role as sub-adviser to an unaffiliated third-party mutual fund. The CCO did not consider the fees for providing advisory services to Comparable Funds/Accounts to be determinative in judging the appropriateness of the Federated funds' advisory fees.
Following such evaluation, and full deliberations, the Board concluded that the fees and expenses of the Fund are reasonable and supported renewal of the Fund's investment advisory contract.
The Board considered the nature, extent and quality of the services provided to the Fund by the Adviser and the resources of the Adviser and its affiliates dedicated to the Fund. In this regard, the Board evaluated, among other things, the Adviser's personnel, experience, track record, overall reputation and willingness to invest in personnel and infrastructure that benefit the Fund. In addition, the Board reviewed the qualifications, backgrounds and responsibilities of the portfolio management team primarily responsible for the day-to-day management of the Fund and the Adviser's ability and experience in attracting and retaining qualified personnel to service the Fund. The Board noted the compliance program of the Adviser and the compliance-related resources provided to the Fund by the Adviser, including the Adviser's commitment to respond to rulemaking initiatives of the SEC. The Fund's ability to deliver
Annual Shareholder Report
competitive performance when compared to its Peer Group was also deemed to be relevant by the Board as a useful indicator of how the Adviser is executing the Fund's investment program. The Adviser's ability to execute this program was one of the Board's considerations in reaching a conclusion that the nature, extent and quality of the Adviser's investment management services warrant the continuation of the investment advisory contract.
In evaluating the Fund's investment performance, the Board considered performance results in light of the Fund's investment objective, strategies and risks, as disclosed in the Fund's prospectus. The Board considered detailed investment reports on the Fund's performance that were provided to the Board throughout the year and in connection with the May meetings. The CCO also reviewed information regarding the performance of other mutual funds in the Peer Group, noting the CCO's view that comparisons to fund peer groups may be helpful, though not conclusive, in evaluating the performance of the Adviser in managing the Fund. The Board considered, in evaluating such comparisons, that in some cases individual funds may exhibit significant and unique differences in their objectives and management techniques when compared to other funds within a Peer Group.
The Fund's performance fell below the median of the relevant Peer Group for the one-year, three-year and five-year periods covered by the CCO Fee Evaluation Report. The Board discussed the Fund's performance with the Adviser and recognized the efforts being taken by the Adviser in the context of other factors considered relevant by the Board.
Following such evaluation, and full deliberations, the Board concluded that the performance of the Fund supported renewal of the Fund's investment advisory contract.
The Board also received financial information about Federated, including information regarding the compensation and ancillary (or “fall-out”) benefits Federated derived from its relationships with the Federated funds. This information covered not only the fees under the investment advisory contracts, but also fees received by Federated's subsidiaries for providing other services to the Federated funds under separate contracts (e.g., for serving as the Federated funds' administrator and distributor). In this regard, the Board considered that certain Federated subsidiaries provide distribution and shareholder services to the Federated funds, for which they may be compensated through distribution and servicing fees paid pursuant to Rule 12b-1 plans or otherwise. The information also detailed any indirect benefit Federated may derive from its receipt of research services from brokers who execute Federated fund trades. In addition, the Board considered the fact that, in order for a Federated fund to be competitive in the marketplace, the Adviser and its affiliates frequently waived fees and/or reimbursed expenses and have disclosed to Federated fund investors and/or indicated to the Board their intention to do so in the future. Moreover,
Annual Shareholder Report
the Board receives regular reporting as to the institution, adjustment or elimination of these voluntary waivers. The Board considered Federated's previous reductions in contractual management fees to certain Federated funds in response to the CCO's recommendations.
Federated furnished information, requested by the CCO, that reported revenues on a fund-by-fund basis and made estimates of the allocation of expenses on a fund-by-fund basis, using allocation methodologies specified by the CCO. The CCO noted that, while these cost allocation reports apply consistent allocation processes, the inherent difficulties in allocating costs continues to cause the CCO to question the precision of the process and to conclude that such reports may be unreliable, since a single change in an allocation estimate may dramatically alter the resulting estimate of cost and/or profitability of a Federated fund and may produce unintended consequences. The allocation information, including the CCO's view that fund-by-fund estimations may be unreliable, was considered in the evaluation by the Board.
The Board and the CCO also reviewed information compiled by Federated comparing its profitability information to other publicly held fund management companies, including information regarding profitability trends over time. In this regard, the CCO concluded that Federated's profit margins did not appear to be excessive. The CCO also noted that Federated appeared financially sound, with the resources necessary to fulfill its obligations under its contracts with the Fund.
The CCO Fee Evaluation Report also discussed the notion of possible realization of “economies of scale” as a fund grows larger. In this regard, the Board considered that the Adviser has made significant and long-term investments in areas that support all of the Federated funds, such as personnel and processes for the portfolio management, shareholder services, compliance, internal audit and risk management functions, as well as systems technology (including technology relating to cybersecurity) and that the benefits of these efforts (as well as any economies of scale, should they exist) were likely to be shared with the Federated fund family as a whole. The Board noted that the Adviser's investments in these areas are extensive. In addition, the Board considered that the Adviser and its affiliates have frequently waived fees and/or reimbursed expenses and that this has allowed fund shareholders to share potential economies of scale with shareholders. The Board also considered that such waivers and reimbursements can provide protection from an increase in expenses if a Federated fund's assets decline. Federated, as it does throughout the year, and specifically in connection with the Board's review of the advisory and subadvisory contracts, furnished information relative to revenue sharing or adviser-paid fees. Federated and the CCO noted that this information should be viewed to determine if there was an incentive to either not apply breakpoints, or to apply breakpoints at higher levels, and should not be viewed to determine the appropriateness of advisory fees because it would represent marketing and distribution expenses. The Board also noted the absence of any applicable
Annual Shareholder Report
regulatory or industry guidelines on this subject, which (as discussed in the CCO Fee Evaluation Report) is compounded by the lack of any common industry practice or general pattern with respect to structuring fund advisory fees with “breakpoints” that serve to reduce the fee as a fund attains a certain size.
The CCO stated that his observations and the information accompanying the CCO Fee Evaluation Report supported a finding by the Board that the management fee for the Fund was reasonable. Under these circumstances, no changes were recommended to, and no objection was raised to the continuation of, the Fund's investment advisory contract. The CCO also recognized that the Board's evaluation of the Federated funds' advisory and subadvisory arrangements is a continuing and on-going process that is informed by the information that the Board requests and receives from management throughout the course of the year and, in this regard, the CCO noted certain items for future reporting to the Board or further consideration by management as the Board continues its on-going oversight of the Federated funds.
In its decision to continue an existing investment advisory contract, the Board was mindful of the potential disruptions of the Fund's operations and various risks, uncertainties and other effects that could occur as a result of a decision to terminate or not renew an investment advisory contract. In particular, the Board recognized that many shareholders have invested in the Fund on the strength of the Adviser's industry standing and reputation and with the expectation that the Adviser will have a continuing role in providing advisory services to the Fund. Thus, the Board's approval of the investment advisory contract reflected the fact that it is the shareholders who have effectively selected the Adviser by virtue of having invested in the Fund. The Board concluded that, in light of the factors summarized above, including the nature, quality and scope of the services provided to the Fund by the Adviser and its affiliates, continuation of the investment advisory contract was appropriate.
The Board based its decision to approve the investment advisory contract on the totality of the circumstances and relevant factors and with a view to past and future long-term considerations. Not all of the factors and considerations identified above were necessarily relevant to the Fund, nor did the Board consider any one of them to be determinative. With respect to the factors that were relevant, the Board's decision to approve the continuation of the contract reflects its view that Federated's performance and actions provided a satisfactory basis to support the decision to continue the existing arrangement.
Annual Shareholder Report
Voting Proxies on Fund Portfolio Securities
A description of the policies and procedures that the Fund uses to determine how to vote proxies, if any, relating to securities held in the Fund's portfolio is available, without charge and upon request, by calling 1-800-341-7400. A report on “Form N-PX” of how the Fund voted any such proxies during the most recent 12-month period ended June 30 is available via the Proxy Voting Record (Form N-PX) link associated with the Fund and share class name at www.FederatedInvestors.com/FundInformation. Form N-PX filings are also available at the SEC's website at www.sec.gov.
Quarterly Portfolio Schedule
Each fiscal quarter, the Fund will file with the SEC a complete schedule of its monthly portfolio holdings on “Form N-PORT.” The Fund's holdings as of the end of the third month of every fiscal quarter, as reported on Form N-PORT, will be publicly available on the SEC's website at www.sec.gov within 60 days of the end of the fiscal quarter upon filing. You may also access this information via the link to the Fund and share class name at www.FederatedInvestors.com.
Annual Shareholder Report
Mutual funds are not bank deposits or obligations, are not guaranteed by any bank and are not insured or guaranteed by the U.S. government, the Federal Deposit Insurance Corporation, the Federal Reserve Board or any other government agency. Investment in mutual funds involves investment risk, including the possible loss of principal.
This Report is authorized for distribution to prospective investors only when preceded or accompanied by the Fund's Prospectus, which contains facts concerning its objective and policies, management fees, expenses and other information.
Federated Floating Rate Strategic Income Fund
Federated Investors Funds
4000 Ericsson Drive
Warrendale, PA 15086-7561
Contact us at FederatedInvestors.com
or call 1-800-341-7400.
Federated Securities Corp., Distributor
CUSIP 31420C647
CUSIP 31420C597
CUSIP 31420C670
CUSIP 31420C571
Q450751 (5/19)
Federated is a registered trademark of Federated Investors, Inc.
2019 ©Federated Investors, Inc.
Annual Shareholder Report
March 31, 2019
| Share Class | Ticker | A | FUSGX | B | FUSBX | C | FUSCX | |
Federated Fund for U.S. Government Securities
Fund Established 1969
A Portfolio of Federated Income Securities Trust
IMPORTANT NOTICE REGARDING REPORT DELIVERY
Beginning on January 1, 2021, as permitted by regulations adopted by the Securities and Exchange Commission, paper copies of the Fund's shareholder reports like this one will no longer be sent by mail, unless you specifically request paper copies of the reports from the Fund or from your financial intermediary, such as a broker-dealer or bank. Instead, the reports will be made available on a website, and you will be notified by mail each time a report is posted and provided with a website link to access the report.
If you already elected to receive shareholder reports electronically, you will not be affected by this change and you need not take any action. You may elect to receive shareholder reports and other communications from the Fund or your financial intermediary electronically by contacting your financial intermediary (such as a broker-dealer or bank); other shareholders may call the Fund at 1-800-341-7400, Option 4.
You may elect to receive all future reports in paper free of charge. You can inform the Fund or your financial intermediary that you wish to continue receiving paper copies of your shareholder reports by contacting your financial intermediary (such as a broker-dealer or bank); other shareholders may call the Fund at 1-800-341-7400, Option 4. Your election to receive reports in paper will apply to all funds held with the Fund complex or your financial intermediary.
Not FDIC Insured ■ May Lose Value ■ No Bank Guarantee
J. Christopher
Donahue
President
Federated Fund for U.S. Government Securities
Letter from the President
Dear Valued Shareholder,
I am pleased to present the Annual Shareholder Report for your fund covering the period from April 1, 2018 through March 31, 2019. This report includes Management's Discussion of Fund Performance, a complete listing of your fund's holdings, performance information and financial statements along with other important fund information.
In addition, our website, FederatedInvestors.com, offers easy access to Federated resources that include timely fund updates, economic and market insights from our investment strategists, and financial planning tools.
Thank you for investing with Federated. I hope you find this information useful and look forward to keeping you informed.
Sincerely,
J. Christopher Donahue, President
CONTENTS
| 1 |
| 5 |
| 6 |
| 14 |
| 17 |
| 19 |
| 20 |
| 21 |
| 31 |
| 33 |
| 35 |
| 41 |
| 48 |
| 48 |
Management's Discussion of Fund Performance (unaudited)
The total return of Federated Fund for U.S. Government Securities (the “Fund”), based on net asset value for the 12-month reporting period ended March 31, 2019, was 3.48% for the Class A Shares, 2.83% for the Class B Shares and 2.69% for the Class C Shares. The 3.48% total return of the Class A Shares consisted of 2.65% in taxable dividends and 0.83% of price appreciation in the net asset value of the shares. The Bloomberg Barclays U.S. Mortgage Backed Securities Index (BBMBS),1 the Fund's broad-based securities market index, returned 4.42% for the same period. The total return of the Lipper U.S. Mortgage Funds Average (LUSMFA),2 a peer group average for the Fund, was 4.03% for the same period. The Fund's and the LUSMFA's total returns for the most recently completed fiscal year reflected actual cash flows, transaction costs and other expenses, which were not reflected in the total return of the BBMBS.
The most significant factors affecting the Fund's performance relative to the BBMBS were (a) duration strategy;3 and (b) security selection.
The following discussion will focus on the performance of the Fund's Class A Shares.
MARKET OVERVIEW
Nonfarm payroll growth averaged 211,000 jobs per month, and the U.S. unemployment rate fell from 4.1% to 3.9% during the reporting period, led by gains in professional and business services, leisure/hospitality and manufacturing. With positive trends in wages, labor productivity, labor participation rate and inflation, the Federal Reserve (the “Fed”) continued on a steady path toward interest rate normalization. Short-term U.S. Treasury yields increased in concert with tighter monetary policy.
The Fed continued to reduce monetary policy accommodation with three 25 basis point hikes in the federal funds target rate during the reporting period, accompanied by additional balance sheet reduction. The combination of higher rates and a smaller balance sheet acted to tighten monetary policy from the accommodative stance at period outset. Short-maturity market yields climbed along with the federal funds target rate—which ended the reporting period in a range of 2.25% to 2.50%—while long-maturity rates declined in a “flattening” of the U.S. Treasury yield curve. The Mortgage Banker Association's (MBA) 30-year rate increased in the first half of the reporting period before reversing course to end the period at 4.06%, a decline of nearly 40 basis points measured year-over-year.
Federated Fund for U.S. Government Securities
Annual Shareholder Report
Spread sectors had mixed results during the reporting period as agency mortgage-backed securities (MBS)4 and agency debt performed in line with similar duration U.S. Treasury securities while investment-grade corporate debt5 and high-yield6 debt posted strong excess returns. Uncertainty related to trade, economic growth in Asia and Europe, and the UK's exit from the European Union weighed on investor sentiment, boosting intra-period volatility.
During the reporting period, 2- and 10-year U.S. Treasury yields declined 1 and 33 basis points to 2.26% and 2.41%, respectively.7
DURATION
The Fund's interest rate stance was tactically adjusted during the reporting period based on expectations for interest rates. Interest rate stance was generally cautious in the first half of the period when market interest rates increased and more constructive in the latter portion of the reporting period. Longer-maturity interest rates peaked in November 2018, and the interest rate strategy made a positive impact on Fund performance during the reporting period.
Security selection
Holdings of MBS with specific characteristics which limit prepayment risk lagged the mortgage market, particularly during the first portion of the reporting period when interest rates increased and prepayment risk declined. Although the value of securities with these factors did recover as interest rates declined in the latter stage of the reporting period, overall, security selection acted as a drag on Fund performance.
| 1 | Please see the footnotes to the line graph under “Fund Performance and Growth of a $10,000 Investment” below for the definition of, and more information about, the BBMBS. |
| 2 | Please see the footnotes to the line graph under “Fund Performance and Growth of a $10,000 Investment” below for the definition of, and more information about, the LUSMFA. |
| 3 | Duration is a measure of a security's price sensitivity to changes in interest rates. Securities with longer durations are more sensitive to changes in interest rates than other securities of shorter durations. |
| 4 | The value of some mortgage-backed securities may be particularly sensitive to changes in the prevailing interest rates, and although the securities are generally supported by some form of government or private insurance, there is no assurance that private guarantors or insurers will meet their obligations. |
| 5 | Investment-grade securities are securities that are rated at least “BBB- (minus)” or unrated securities of a comparable quality. Noninvestment-grade securities are securities that are not rated at least “BBB- (minus)” or unrated securities of a comparable quality. Credit ratings are an indication of the risk that a security will default. They do not protect a security from credit risk. Lower-rated bonds typically offer higher yields to help compensate investors for the increased risk associated with them. Among these risks are lower credit-worthiness, greater price volatility, more risk to principal and income than with higher-rated securities and increased possibilities of default. |
| 6 | High-yield, lower-rated securities generally entail greater market, credit and liquidity risks than investment-grade securities and may include higher volatility and a higher risk of default. |
| 7 | Bond prices are sensitive to changes in interest rates, and a rise in interest rates can cause a decline in their prices. |
Federated Fund for U.S. Government Securities
Annual Shareholder Report
FUND PERFORMANCE AND GROWTH OF A $10,000 INVESTMENT
The graph below illustrates the hypothetical investment of $10,0001 in the Federated Fund for U.S. Government Securities (the “Fund”) from March 31, 2009 to March 31, 2019, compared to the Bloomberg Barclays U.S. Mortgage Backed Securities Index (BBMBS)2and the Lipper U.S. Mortgage Funds Average (LUSMFA).3 The Average Annual Total Return table below shows returns for each class averaged over the stated periods.
Growth of a $10,000 Investment
Growth of $10,000 as of March 31, 2019
| Federated Fund for U.S. Government Securities - | Class A Shares | Class C Shares | BBMBS | LUSMFA |
| F | F | I | I |
| 3/31/2009 | 9,550 | 10,000 | 10,000 | 10,000 |
| 3/31/2010 | 10,071 | 10,451 | 10,521 | 10,991 |
| 3/31/2011 | 10,393 | 10,704 | 10,981 | 11,571 |
| 3/31/2012 | 10,918 | 11,162 | 11,663 | 12,265 |
| 3/31/2013 | 11,115 | 11,292 | 11,893 | 12,719 |
| 3/31/2014 | 11,060 | 11,136 | 11,916 | 12,739 |
| 3/31/2015 | 11,573 | 11,581 | 12,575 | 13,382 |
| 3/31/2016 | 11,724 | 11,643 | 12,881 | 13,567 |
| 3/31/2017 | 11,721 | 11,552 | 12,904 | 13,673 |
| 3/31/2018 | 11,739 | 11,482 | 13,003 | 13,774 |
| 3/31/2019 | 12,147 | 11,790 | 13,579 | 14,318 |
41 graphic description end -->
| ■ | Total returns shown for Class A Shares include the maximum sales charge of 4.50% ($10,000 investment minus $450 sales charge = $9,550). |
| ■ | Total returns shown for Class C Shares include the maximum contingent deferred sales charge of 1.00% as applicable. |
The Fund offers multiple share classes whose performance may be greater than or less than its other share class(es) due to differences in sales charges and expenses. See the Average Annual Total Return table below for the returns of the additional classes not shown in the line graph above.
Average Annual Total Returnsfor the Period Ended 3/31/2019
(returns reflect all applicable sales charges and contingent deferred sales charges as specified below in footnote #1)
| | 1 Year | 5 Years | 10 Years |
| Class A Shares | -1.18% | 0.97% | 1.96% |
| Class B Shares | -2.67% | 0.77% | 1.82% |
| Class C Shares | 1.69% | 1.15% | 1.66% |
| BBMBS | 4.42% | 2.65% | 3.11% |
| LUSMFA | 4.03% | 2.39% | 3.60% |
Federated Fund for U.S. Government Securities
Annual Shareholder Report
Performance data quoted represents past performance which is no guarantee of future results. Investment return and principal value will fluctuate so that an investor's shares, when redeemed, may be worth more or less than their original cost. Mutual fund performance changes over time and current performance may be lower or higher than what is stated. For current to the most recent month-end performance and after-tax returns, visit FederatedInvestors.com or call 1-800-341-7400. Returns shown do not reflect the deduction of taxes that a shareholder would pay on Fund distributions or the redemption of Fund shares. Mutual funds are not obligations of or guaranteed by any bank and are not federally insured.
| 1 | Represents a hypothetical investment of $10,000 in the Fund after deducting applicable sales charges: for Class A Shares, the maximum sales charge of 4.50% ($10,000 investment minus $450 sales charge = $9,550); for Class B Shares, the maximum contingent deferred sales charge is 5.50% on any redemption less than one year from the purchase date; for Class C Shares, a 1.00% contingent deferred sales charge would be applied to any redemption less than one year from purchase date. The Fund's performance assumes the reinvestment of all dividends and distributions. The BBMBS and the LUSMFA have been adjusted to reflect reinvestment of dividends on securities in the index and the average. |
| 2 | The BBMBS tracks agency mortgage backed pass-through securities (both fixed-rate and hybrid ARM) guaranteed by Ginnie Mae (GNMA), Fannie Mae (FNMA) and Freddie Mac (FHLMC). The index is not adjusted to reflect sales loads, expenses or other fees that the Securities and Exchange Commission requires to be reflected in the Fund's performance. The index is unmanaged and, unlike the Fund, is not affected by cash flows. It is not possible to invest directly in an index. |
| 3 | Lipper figures represent the average of the total returns reported by all funds designated by Lipper, Inc., as falling into the respective category and is not adjusted to reflect any sales charges. The Lipper figures in the Growth of $10,000 line graph are based on historical return information published by Lipper and reflect the return of the funds comprising the category in the year of publication. Because the funds designated by Lipper as falling into the category can change over time, the Lipper figures in the line graph may not match the Lipper figures in the Average Annual Total Returns table, which reflect the return of the funds that currently comprise the category. |
Federated Fund for U.S. Government Securities
Annual Shareholder Report
Portfolio of Investments Summary Table (unaudited)
At March 31, 2019, the Fund's portfolio composition1 was as follows:
| Sector Composition | Percentage of
Total Net Assets |
| U.S. Government Agency Mortgage-Backed Securities | 92.8% |
| Non-Agency Mortgage-Backed Securities | 2.7% |
| U.S. Government Agency Commercial Mortgage-Backed Securities | 2.0% |
| Asset-Backed Securities | 0.6% |
| Cash Equivalents2 | 1.5% |
| Other Assets and Liabilities—Net3 | 0.4% |
| TOTAL | 100.0% |
| 1 | See the Fund's prospectus and Statement of Additional Information for a description of the principal types of securities in which the Fund invests. |
| 2 | Cash Equivalents include any investments in money market mutual funds and/or overnight repurchase agreements. |
| 3 | Assets, other than investments in securities and derivative contracts, less liabilities. See Statement of Assets and Liabilities. |
Federated Fund for U.S. Government Securities
Annual Shareholder Report
Portfolio of Investments
March 31, 2019
Principal
Amount
or Shares | | | Value |
| | | MORTGAGE-BACKED SECURITIES—92.8% | |
| | | Federal Home Loan Mortgage Corporation—42.3% | |
| $ 1,293,681 | | 3.000%, 3/1/2032 | $1,308,411 |
| 1,502,175 | | 3.000%, 2/1/2033 | 1,519,279 |
| 2,084,769 | | 3.000%, 1/1/2043 | 2,088,407 |
| 749,445 | | 3.000%, 10/1/2045 | 748,411 |
| 1,388,345 | | 3.000%, 11/1/2045 | 1,386,429 |
| 5,325,660 | | 3.000%, 8/1/2046 | 5,308,324 |
| 1,411,348 | | 3.000%, 10/1/2046 | 1,406,313 |
| 2,238,546 | | 3.000%, 10/1/2046 | 2,234,057 |
| 1,575,313 | | 3.000%, 11/1/2046 | 1,569,693 |
| 3,353,268 | | 3.000%, 1/1/2047 | 3,341,305 |
| 4,299,386 | | 3.000%, 2/1/2047 | 4,284,047 |
| 9,644,763 | | 3.500%, 7/1/2042 | 9,902,330 |
| 5,478,301 | | 3.500%, 9/1/2043 | 5,600,633 |
| 2,275,186 | | 3.500%, 5/1/2046 | 2,316,038 |
| 5,583,855 | | 3.500%, 7/1/2046 | 5,684,115 |
| 2,961,862 | | 3.500%, 10/1/2046 | 3,012,266 |
| 2,561,699 | | 3.500%, 10/1/2046 | 2,617,302 |
| 1,796,996 | | 3.500%, 11/1/2047 | 1,827,015 |
| 648,129 | | 4.000%, 8/1/2025 | 668,410 |
| 5,594,503 | | 4.000%, 12/1/2041 | 5,824,657 |
| 783,057 | | 4.000%, 1/1/2042 | 815,271 |
| 2,213,415 | | 4.000%, 9/1/2047 | 2,292,715 |
| 1,834,991 | | 4.000%, 10/1/2047 | 1,917,362 |
| 1,571,560 | | 4.000%, 11/1/2047 | 1,627,373 |
| 2,290,693 | | 4.000%, 12/1/2047 | 2,373,478 |
| 1,129,520 | | 4.000%, 2/1/2048 | 1,169,987 |
| 1,415,697 | | 4.000%, 4/1/2048 | 1,460,666 |
| 966,168 | | 4.000%, 6/1/2048 | 1,011,955 |
| 110,453 | | 4.500%, 2/1/2024 | 113,700 |
| 257,946 | | 4.500%, 6/1/2024 | 265,791 |
| 194,359 | | 4.500%, 11/1/2039 | 206,436 |
| 545,132 | | 4.500%, 4/1/2040 | 579,005 |
| 762,616 | | 4.500%, 5/1/2040 | 809,764 |
| 1,333,512 | | 4.500%, 5/1/2040 | 1,415,955 |
Federated Fund for U.S. Government Securities
Annual Shareholder Report
Principal
Amount
or Shares | | | Value |
| | | MORTGAGE-BACKED SECURITIES—continued | |
| | | Federal Home Loan Mortgage Corporation—continued | |
| $402,584 | | 4.500%, 8/1/2040 | $427,473 |
| 1,754,576 | | 4.500%, 9/1/2040 | 1,863,051 |
| 1,107,910 | | 4.500%, 9/1/2040 | 1,176,405 |
| 1,762,551 | | 4.500%, 9/1/2041 | 1,881,984 |
| 448,658 | | 4.500%, 2/1/2048 | 482,565 |
| 495,339 | | 4.500%, 8/1/2048 | 527,201 |
| 17,521 | | 5.000%, 7/1/2020 | 17,622 |
| 507,528 | | 5.000%, 1/1/2034 | 545,774 |
| 1,207,271 | | 5.000%, 5/1/2034 | 1,299,071 |
| 129,026 | | 5.000%, 2/1/2039 | 139,476 |
| 412,479 | | 5.000%, 3/1/2039 | 445,500 |
| 287,565 | | 5.000%, 7/1/2039 | 310,586 |
| 671,472 | | 5.000%, 9/1/2039 | 724,808 |
| 1,136,963 | | 5.000%, 10/1/2039 | 1,227,274 |
| 6,034 | | 5.500%, 3/1/2021 | 6,157 |
| 3,107,403 | | 5.500%, 5/1/2034 | 3,392,631 |
| 436,115 | | 5.500%, 12/1/2035 | 476,662 |
| 472,829 | | 5.500%, 5/1/2036 | 516,802 |
| 620,613 | | 5.500%, 6/1/2036 | 679,335 |
| 38,562 | | 5.500%, 6/1/2036 | 42,245 |
| 65,624 | | 5.500%, 9/1/2037 | 71,515 |
| 31,539 | | 6.000%, 2/1/2032 | 34,982 |
| 253,611 | | 6.500%, 10/1/2037 | 289,377 |
| 29,352 | | 6.500%, 4/1/2038 | 33,491 |
| 45,024 | | 6.500%, 10/1/2038 | 51,481 |
| 4,800 | | 6.500%, 10/1/2038 | 5,500 |
| 283,354 | | 7.000%, 12/1/2031 | 324,411 |
| 3,533 | | 7.500%, 1/1/2021 | 3,644 |
| 81,673 | | 7.500%, 1/1/2027 | 90,823 |
| 2,910 | | 7.500%, 12/1/2029 | 3,343 |
| 73,934 | | 7.500%, 5/1/2030 | 83,188 |
| 20,610 | | 7.500%, 1/1/2031 | 23,760 |
| 72,004 | | 7.500%, 2/1/2031 | 83,016 |
| 4,859 | | 7.500%, 8/1/2031 | 5,622 |
| | | TOTAL | 95,993,675 |
| | | Federal National Mortgage Association—47.6% | |
| 2,303,814 | | 3.000%, 10/1/2046 | 2,295,036 |
Federated Fund for U.S. Government Securities
Annual Shareholder Report
Principal
Amount
or Shares | | | Value |
| | | MORTGAGE-BACKED SECURITIES—continued | |
| | | Federal National Mortgage Association—continued | |
| $3,222,881 | | 3.000%, 11/1/2046 | $3,210,601 |
| 3,365,127 | | 3.000%, 11/1/2046 | 3,352,305 |
| 2,310,634 | | 3.000%, 1/1/2047 | 2,301,830 |
| 2,060,784 | | 3.000%, 1/1/2047 | 2,052,933 |
| 972,858 | | 3.000%, 2/1/2047 | 971,584 |
| 9,797,706 | | 3.500%, 9/1/2042 | 10,062,016 |
| 5,409,842 | | 3.500%, 12/1/2042 | 5,527,887 |
| 7,670,589 | | 3.500%, 8/1/2046 | 7,803,207 |
| 1,456,825 | | 3.500%, 8/1/2046 | 1,481,558 |
| 2,200,060 | | 3.500%, 9/1/2046 | 2,251,848 |
| 3,665,398 | | 3.500%, 10/1/2047 | 3,731,060 |
| 1,291,168 | | 3.500%, 11/1/2047 | 1,311,877 |
| 2,186,683 | | 3.500%, 12/1/2047 | 2,223,123 |
| 2,416,843 | | 3.500%, 1/1/2048 | 2,455,607 |
| 4,789,885 | | 4.000%, 12/1/2031 | 4,992,171 |
| 1,316,326 | | 4.000%, 2/1/2041 | 1,373,151 |
| 3,460,492 | | 4.000%, 12/1/2041 | 3,609,879 |
| 4,862,894 | | 4.000%, 3/1/2042 | 5,078,901 |
| 2,730,800 | | 4.000%, 4/1/2042 | 2,838,873 |
| 3,557,097 | | 4.000%, 6/1/2044 | 3,686,199 |
| 409,154 | | 4.000%, 9/1/2046 | 427,584 |
| 1,679,852 | | 4.000%, 6/1/2047 | 1,760,770 |
| 1,333,100 | | 4.000%, 11/1/2047 | 1,389,816 |
| 1,732,046 | | 4.000%, 12/1/2047 | 1,814,937 |
| 4,104,308 | | 4.000%, 12/1/2047 | 4,284,053 |
| 867,448 | | 4.000%, 1/1/2048 | 901,506 |
| 1,592,834 | | 4.000%, 2/1/2048 | 1,648,654 |
| 1,141,600 | | 4.000%, 2/1/2048 | 1,182,142 |
| 682,098 | | 4.000%, 2/1/2048 | 712,183 |
| 1,391,919 | | 4.000%, 2/1/2048 | 1,438,523 |
| 1,649,204 | | 4.000%, 2/1/2048 | 1,708,803 |
| 691,454 | | 4.000%, 3/1/2048 | 714,605 |
| 1,149,295 | | 4.000%, 5/1/2048 | 1,183,825 |
| 465,298 | | 4.000%, 6/1/2048 | 478,987 |
| 1,234,441 | | 4.000%, 6/1/2048 | 1,271,529 |
| 2,700 | | 4.500%, 12/1/2019 | 2,697 |
| 1,224,487 | | 4.500%, 10/1/2040 | 1,298,287 |
Federated Fund for U.S. Government Securities
Annual Shareholder Report
Principal
Amount
or Shares | | | Value |
| | | MORTGAGE-BACKED SECURITIES—continued | |
| | | Federal National Mortgage Association—continued | |
| $2,981,691 | | 4.500%, 3/1/2041 | $3,159,532 |
| 102,291 | | 4.500%, 6/1/2041 | 108,360 |
| 460,466 | | 4.500%, 5/1/2048 | 481,599 |
| 285,222 | | 5.000%, 1/1/2024 | 295,721 |
| 1,308,689 | | 5.000%, 7/1/2034 | 1,409,970 |
| 90,585 | | 5.000%, 11/1/2035 | 98,014 |
| 338,671 | | 5.000%, 1/1/2039 | 365,549 |
| 870,706 | | 5.000%, 7/1/2039 | 938,992 |
| 223,022 | | 5.000%, 10/1/2039 | 240,373 |
| 1,297,340 | | 5.000%, 11/1/2039 | 1,398,273 |
| 432,370 | | 5.000%, 12/1/2039 | 466,009 |
| 109,671 | | 5.000%, 1/1/2040 | 118,135 |
| 540,466 | | 5.000%, 7/1/2048 | 572,549 |
| 592,913 | | 5.500%, 9/1/2034 | 650,030 |
| 9,871 | | 6.000%, 10/1/2028 | 10,812 |
| 6,812 | | 6.000%, 11/1/2028 | 7,467 |
| 535 | | 6.000%, 12/1/2028 | 583 |
| 19,423 | | 6.000%, 12/1/2028 | 21,280 |
| 10,693 | | 6.000%, 12/1/2028 | 11,404 |
| 13,400 | | 6.000%, 12/1/2028 | 14,610 |
| 10,709 | | 6.000%, 12/1/2028 | 11,663 |
| 11,069 | | 6.000%, 1/1/2029 | 12,056 |
| 2,590 | | 6.000%, 1/1/2029 | 2,811 |
| 508 | | 6.000%, 1/1/2029 | 554 |
| 17,975 | | 6.000%, 1/1/2029 | 19,599 |
| 3,259 | | 6.000%, 1/1/2029 | 3,553 |
| 886 | | 6.000%, 3/1/2029 | 970 |
| 597 | | 6.000%, 3/1/2029 | 655 |
| 53,822 | | 6.000%, 5/1/2029 | 58,649 |
| 44,786 | | 6.000%, 5/1/2029 | 48,877 |
| 714 | | 6.000%, 11/1/2029 | 780 |
| 35,524 | | 6.000%, 11/1/2029 | 38,874 |
| 6,466 | | 6.000%, 4/1/2031 | 7,039 |
| 574,981 | | 6.000%, 11/1/2034 | 642,688 |
| 41,890 | | 6.000%, 5/1/2036 | 47,118 |
| 37,521 | | 6.000%, 6/1/2036 | 42,283 |
| 71,639 | | 6.000%, 7/1/2036 | 80,854 |
Federated Fund for U.S. Government Securities
Annual Shareholder Report
Principal
Amount
or Shares | | | Value |
| | | MORTGAGE-BACKED SECURITIES—continued | |
| | | Federal National Mortgage Association—continued | |
| $200,403 | | 6.000%, 9/1/2037 | $225,419 |
| 157,353 | | 6.000%, 2/1/2038 | 177,208 |
| 97,696 | | 6.000%, 4/1/2038 | 110,106 |
| 44,552 | | 6.500%, 5/1/2031 | 49,929 |
| 30,559 | | 6.500%, 6/1/2031 | 34,236 |
| 54,707 | | 6.500%, 4/1/2032 | 61,133 |
| 215,343 | | 6.500%, 9/1/2036 | 245,799 |
| 593,748 | | 6.500%, 8/1/2037 | 679,043 |
| 81,930 | | 7.000%, 8/1/2028 | 91,292 |
| 41,920 | | 7.000%, 10/1/2028 | 46,675 |
| 22,628 | | 7.000%, 6/1/2029 | 25,496 |
| 206 | | 7.000%, 11/1/2031 | 235 |
| 6,839 | | 7.000%, 11/1/2031 | 7,822 |
| 6,178 | | 7.000%, 12/1/2031 | 7,078 |
| 2,778 | | 7.000%, 12/1/2031 | 3,187 |
| 79,987 | | 7.000%, 12/1/2031 | 91,083 |
| 1,171 | | 7.000%, 1/1/2032 | 1,336 |
| 1,065 | | 7.500%, 1/1/2030 | 1,223 |
| | | TOTAL | 108,077,132 |
| | | Government National Mortgage Association—2.9% | |
| 3,839,508 | | 3.500%, 2/20/2048 | 3,934,756 |
| 259,524 | | 5.000%, 11/20/2038 | 277,201 |
| 84,399 | | 5.000%, 12/20/2038 | 90,125 |
| 161,334 | | 5.000%, 5/20/2039 | 172,582 |
| 655,206 | | 5.000%, 8/20/2039 | 700,883 |
| 296,228 | | 5.000%, 9/20/2039 | 316,880 |
| 273,620 | | 5.500%, 12/20/2038 | 296,260 |
| 225,242 | | 6.000%, 9/20/2038 | 252,783 |
| 38,503 | | 7.500%, 12/15/2023 | 41,066 |
| 11,057 | | 7.500%, 1/15/2026 | 12,264 |
| 13,530 | | 7.500%, 2/15/2026 | 14,809 |
| 196,124 | | 7.500%, 2/15/2028 | 220,953 |
| 4,999 | | 7.500%, 6/15/2029 | 5,549 |
| 678 | | 7.500%, 7/15/2029 | 775 |
| 840 | | 7.500%, 7/15/2029 | 952 |
| 1,006 | | 7.500%, 7/15/2029 | 1,059 |
| 4,771 | | 7.500%, 9/15/2029 | 5,444 |
Federated Fund for U.S. Government Securities
Annual Shareholder Report
Principal
Amount
or Shares | | | Value |
| | | MORTGAGE-BACKED SECURITIES—continued | |
| | | Government National Mortgage Association—continued | |
| $540 | | 7.500%, 9/15/2029 | $615 |
| 2,485 | | 7.500%, 10/15/2029 | 2,771 |
| 10,983 | | 7.500%, 10/15/2029 | 12,531 |
| 9,580 | | 7.500%, 10/15/2029 | 10,903 |
| 5,857 | | 7.500%, 10/15/2029 | 6,711 |
| 56,557 | | 7.500%, 6/15/2030 | 65,086 |
| 31,286 | | 7.500%, 6/15/2030 | 36,004 |
| 81,780 | | 7.500%, 7/15/2030 | 94,114 |
| 76,629 | | 8.250%, 10/15/2030 | 89,780 |
| | | TOTAL | 6,662,856 |
| | | TOTAL MORTGAGE-BACKED SECURITIES
(IDENTIFIED COST $204,309,230) | 210,733,663 |
| | | ASSET-BACKED SECURITIES—0.6% | |
| | | Other—0.6% | |
| 470,873 | | Sofi Consumer Loan Program Trust 2016-1, Class A, 3.260%, 8/25/2025 | 472,058 |
| 487,641 | | Sofi Consumer Loan Program Trust 2016-2, Class A, 3.090%, 10/27/2025 | 487,386 |
| 362,537 | | Sofi Consumer Loan Program Trust 2016-3, Class A, 3.050%, 12/26/2025 | 362,759 |
| | | TOTAL ASSET-BACKED SECURITIES
(IDENTIFIED COST $1,320,916) | 1,322,203 |
| | | COLLATERALIZED MORTGAGE OBLIGATIONS—2.7% | |
| | | Non-Agency Mortgage-Backed Securities—2.7% | |
| 210,411 | | Credit Suisse Mortgage Trust 2007-4, Class 4A2, 5.500%, 6/25/2037 | 139,023 |
| 647,458 | | Credit Suisse Mortgage Trust 2014-WIN2, Class A2, 3.500%, 10/25/2044 | 648,805 |
| 1,561,276 | | Credit Suisse Mortgage Trust 2015-WIN1, Class A6, 3.500%, 12/25/2044 | 1,563,547 |
| 75,939 | 1 | Lehman Structured Securities Corp. Mortgage 2002-GE1, Class A, 0.000%, 7/26/2024 | 52,410 |
| 1,275,476 | | Sequoia Mortgage Trust 2012-4, Class A3, 2.069%, 9/25/2042 | 1,217,259 |
| 2,528,334 | | Sequoia Mortgage Trust 2014-4, Class A5, 3.500%, 11/25/2044 | 2,533,610 |
| | | TOTAL COLLATERALIZED MORTGAGE OBLIGATIONS
(IDENTIFIED COST $6,355,752) | 6,154,654 |
| | | COMMERCIAL MORTGAGE-BACKED SECURITY—2.0% | |
| | | Agency Commercial Mortgage-Backed Securities—2.0% | |
| 4,500,000 | | FHLMC REMIC, Series KC03, Class A2, 3.499%, 1/25/2026
(IDENTIFIED COST $4,544,847) | 4,647,347 |
Federated Fund for U.S. Government Securities
Annual Shareholder Report
Principal
Amount
or Shares | | | Value |
| | | INVESTMENT COMPANY—1.5% | |
| 3,392,454 | | Federated Government Obligations Fund, Premier Shares, 2.36%2
(IDENTIFIED COST $3,392,454) | $3,392,454 |
| | | TOTAL INVESTMENT IN SECURITIES—99.6%
(IDENTIFIED COST $219,923,199)3 | 226,250,321 |
| | | OTHER ASSETS AND LIABILITIES - NET—0.4%4 | 844,083 |
| | | TOTAL NET ASSETS—100% | $227,094,404 |
Affiliated fund holdings are investment companies which are managed by the Adviser or an affiliate of the Adviser. Transactions with affiliated fund holdings during the period ended March 31, 2019, were as follows:
| | Federated Government
Obligations Fund,
Premier Shares |
| Balance of Shares Held 3/31/2018 | 3,291,650 |
| Purchases/Additions | 57,964,025 |
| Sales/Reductions | (57,863,221) |
| Balance of Shares Held 3/31/2019 | 3,392,454 |
| Value | $3,392,454 |
| Change in Unrealized Appreciation/Depreciation | N/A |
| Net Realized Gain/(Loss) | N/A |
| Dividend Income | $58,060 |
| 1 | Non-income-producing security. |
| 2 | 7-day net yield. |
| 3 | The cost of investments for federal tax purposes amounts to $219,646,364. |
| 4 | Assets, other than investments in securities, less liabilities. See Statement of Assets and Liabilities. |
Note: The categories of investments are shown as a percentage of total net assets at March 31, 2019.
Various inputs are used in determining the value of the Fund's investments. These inputs are summarized in the three broad levels listed below:
Level 1—quoted prices in active markets for identical securities.
Level 2—other significant observable inputs (including quoted prices for similar securities, interest rates, prepayment speeds, credit risk, etc.). Also includes securities valued at amortized cost.
Level 3—significant unobservable inputs (including the Fund's own assumptions in determining the fair value of investments).
The inputs or methodology used for valuing securities are not an indication of the risk associated with investing in those securities.
Federated Fund for U.S. Government Securities
Annual Shareholder Report
The following is a summary of the inputs used, as of March 31, 2019, in valuing the Fund's assets carried at fair value:
| Valuation Inputs | | | | |
| | Level 1—
Quoted
Prices | Level 2—
Other
Significant
Observable
Inputs | Level 3—
Significant
Unobservable
Inputs | Total |
| Debt Securities: | | | | |
| Mortgage-Backed Securities | $— | $210,733,663 | $— | $210,733,663 |
| Asset-Backed Securities | — | 1,322,203 | — | 1,322,203 |
| Collateralized Mortgage Obligations | — | 6,154,654 | — | 6,154,654 |
| Commercial Mortgage-Backed Security | — | 4,647,347 | — | 4,647,347 |
| Investment Company | 3,392,454 | — | — | 3,392,454 |
| TOTAL SECURITIES | $3,392,454 | $222,857,867 | $— | $226,250,321 |
The following acronyms are used throughout this portfolio:
| FHLMC | —Federal Home Loan Mortgage Corporation |
| REMIC | —Real Estate Mortgage Investment Conduit |
See Notes which are an integral part of the Financial Statements
Federated Fund for U.S. Government Securities
Annual Shareholder Report
Financial Highlights–Class A Shares
(For a Share Outstanding Throughout Each Period)
| Year Ended March 31 | 2019 | 2018 | 2017 | 2016 | 2015 |
| Net Asset Value, Beginning of Period | $7.21 | $7.37 | $7.54 | $7.63 | $7.49 |
| Income From Investment Operations: | | | | | |
| Net investment income1 | 0.18 | 0.17 | 0.16 | 0.18 | 0.19 |
| Net realized and unrealized gain (loss) | 0.07 | (0.16) | (0.16) | (0.08) | 0.15 |
| TOTAL FROM INVESTMENT OPERATIONS | 0.25 | 0.01 | — | 0.10 | 0.34 |
| Less Distributions: | | | | | |
| Distributions from net investment income | (0.19) | (0.17) | (0.17) | (0.19) | (0.20) |
| Net Asset Value, End of Period | $7.27 | $7.21 | $7.37 | $7.54 | $7.63 |
| Total Return2 | 3.48% | 0.15% | (0.03)% | 1.30% | 4.64% |
| Ratios to Average Net Assets: | | | | | |
| Net expenses | 0.96% | 0.96% | 0.91% | 0.92% | 0.94% |
| Net investment income | 2.59% | 2.28% | 2.17% | 2.39% | 2.54% |
| Expense waiver/reimbursement3 | 0.04% | 0.00%4 | 0.01% | —% | —% |
| Supplemental Data: | | | | | |
| Net assets, end of period (000 omitted) | $216,404 | $236,461 | $295,523 | $329,055 | $367,904 |
| Portfolio turnover | 60% | 45% | 91%5 | 56% | 65% |
| Portfolio turnover (excluding purchases and sales from dollar-roll transactions) | 60% | 34% | 43% | 28% | 26% |
| 1 | Per share numbers have been calculated using the average shares method. |
| 2 | Based on net asset value, which does not reflect the sales charge, redemption fee or contingent deferred sales charge, if applicable. |
| 3 | This expense decrease is reflected in both the net expense and the net investment income ratios shown above. |
| 4 | Represents less than 0.01%. |
| 5 | The portfolio turnover rate was higher from the prior year as a result of significant dollar-roll transactions, monthly prepayment activity, reinvestment activity, asset allocation changes and asset reduction. |
See Notes which are an integral part of the Financial Statements
Annual Shareholder Report
Financial Highlights–Class B Shares
(For a Share Outstanding Throughout Each Period)
| Year Ended March 31 | 2019 | 2018 | 2017 | 2016 | 2015 |
| Net Asset Value, Beginning of Period | $7.21 | $7.38 | $7.55 | $7.63 | $7.49 |
| Income From Investment Operations: | | | | | |
| Net investment income1 | 0.13 | 0.11 | 0.11 | 0.12 | 0.14 |
| Net realized and unrealized gain (loss) | 0.07 | (0.16) | (0.17) | (0.07) | 0.15 |
| TOTAL FROM INVESTMENT OPERATIONS | 0.20 | (0.05) | (0.06) | 0.05 | 0.29 |
| Less Distributions: | | | | | |
| Distributions from net investment income | (0.13) | (0.12) | (0.11) | (0.13) | (0.15) |
| Net Asset Value, End of Period | $7.28 | $7.21 | $7.38 | $7.55 | $7.63 |
| Total Return2 | 2.83% | (0.74)% | (0.78)% | 0.66% | 3.85% |
| Ratios to Average Net Assets: | | | | | |
| Net expenses | 1.71% | 1.71% | 1.66% | 1.67% | 1.69% |
| Net investment income | 1.81% | 1.54% | 1.42% | 1.63% | 1.79% |
| Expense waiver/reimbursement3 | 0.04% | 0.00%4 | 0.01% | —% | —% |
| Supplemental Data: | | | | | |
| Net assets, end of period (000 omitted) | $1,691 | $3,024 | $5,447 | $7,608 | $10,005 |
| Portfolio turnover | 60% | 45% | 91%5 | 56% | 65% |
| Portfolio turnover (excluding purchases and sales from dollar-roll transactions) | 60% | 34% | 43% | 28% | 26% |
| 1 | Per share numbers have been calculated using the average shares method. |
| 2 | Based on net asset value, which does not reflect the sales charge, redemption fee or contingent deferred sales charge, if applicable. |
| 3 | This expense decrease is reflected in both the net expense and the net investment income ratios shown above. |
| 4 | Represents less than 0.01%. |
| 5 | The portfolio turnover rate was higher from the prior year as a result of significant dollar-roll transactions, monthly prepayment activity, reinvestment activity, asset allocation changes and asset reduction. |
See Notes which are an integral part of the Financial Statements
Annual Shareholder Report
Financial Highlights–Class C Shares
(For a Share Outstanding Throughout Each Period)
| Year Ended March 31 | 2019 | 2018 | 2017 | 2016 | 2015 |
| Net Asset Value, Beginning of Period | $7.21 | $7.37 | $7.54 | $7.63 | $7.48 |
| Income From Investment Operations: | | | | | |
| Net investment income1 | 0.13 | 0.11 | 0.11 | 0.12 | 0.14 |
| Net realized and unrealized gain (loss) | 0.06 | (0.15) | (0.17) | (0.08) | 0.16 |
| TOTAL FROM INVESTMENT OPERATIONS | 0.19 | (0.04) | (0.06) | 0.04 | 0.30 |
| Less Distributions: | | | | | |
| Distributions from net investment income | (0.13) | (0.12) | (0.11) | (0.13) | (0.15) |
| Net Asset Value, End of Period | $7.27 | $7.21 | $7.37 | $7.54 | $7.63 |
| Total Return2 | 2.69% | (0.61)% | (0.78)% | 0.53% | 4.00% |
| Ratios to Average Net Assets: | | | | | |
| Net expenses | 1.71% | 1.71% | 1.66% | 1.67% | 1.69% |
| Net investment income | 1.81% | 1.53% | 1.42% | 1.64% | 1.79% |
| Expense waiver/reimbursement3 | 0.04% | 0.00%4 | 0.01% | —% | —% |
| Supplemental Data: | | | | | |
| Net assets, end of period (000 omitted) | $8,999 | $16,447 | $25,271 | $31,803 | $32,987 |
| Portfolio turnover | 60% | 45% | 91%5 | 56% | 65% |
| Portfolio turnover (excluding purchases and sales from dollar-roll transactions) | 60% | 34% | 43% | 28% | 26% |
| 1 | Per share numbers have been calculated using the average shares method. |
| 2 | Based on net asset value, which does not reflect the sales charge, redemption fee or contingent deferred sales charge, if applicable. |
| 3 | This expense decrease is reflected in both the net expense and the net investment income ratios shown above. |
| 4 | Represents less than 0.01%. |
| 5 | The portfolio turnover rate was higher from the prior year as a result of significant dollar-roll transactions, monthly prepayment activity, reinvestment activity, asset allocation changes and asset reduction. |
See Notes which are an integral part of the Financial Statements
Annual Shareholder Report
Statement of Assets and Liabilities
March 31, 2019
| Assets: | | |
| Investment in securities, at value including $3,392,454 of investment in an affiliated holding (identified cost $219,923,199) | | $226,250,321 |
| Income receivable | | 681,783 |
| Income receivable from an affiliated holding | | 6,350 |
| Receivable for investments sold | | 471,865 |
| Receivable for shares sold | | 119,909 |
| TOTAL ASSETS | | 227,530,228 |
| Liabilities: | | |
| Payable for shares redeemed | $171,077 | |
| Income distribution payable | 77,917 | |
| Payable for investment adviser fee (Note 5) | 7,063 | |
| Payable for administrative fees (Note 5) | 1,490 | |
| Payable for transfer agent fee | 49,508 | |
| Payable for Directors'/Trustees' fees (Note 5) | 251 | |
| Payable for portfolio accounting fees | 23,957 | |
| Payable for distribution services fee (Note 5) | 6,818 | |
| Payable for other service fees (Notes 2 and 5) | 73,935 | |
| Payable for share registration costs | 11,034 | |
| Accrued expenses (Note 5) | 12,774 | |
| TOTAL LIABILITIES | | 435,824 |
| Net assets for 31,231,654 shares outstanding | | $227,094,404 |
| Net Assets Consist of: | | |
| Paid-in capital | | $232,736,446 |
| Total distributable earnings (loss) | | (5,642,042) |
| TOTAL NET ASSETS | | $227,094,404 |
Annual Shareholder Report
Statement of Assets and Liabilities–continued
| Net Asset Value, Offering Price and Redemption Proceeds Per Share | | |
| Class A Shares: | | |
Net asset value per share ($216,404,119 ÷ 29,762,055 shares outstanding),
no par value, unlimited shares authorized | | $7.27 |
| Offering price per share (100/95.50 of $7.27) | | $7.61 |
| Redemption proceeds per share | | $7.27 |
| Class B Shares: | | |
Net asset value per share ($1,691,089 ÷ 232,404 shares outstanding),
no par value, unlimited shares authorized | | $7.28 |
| Offering price per share | | $7.28 |
| Redemption proceeds per share (94.50/100 of $7.28) | | $6.88 |
| Class C Shares: | | |
Net asset value per share ($8,999,196 ÷ 1,237,195 shares outstanding),
no par value, unlimited shares authorized | | $7.27 |
| Offering price per share | | $7.27 |
| Redemption proceeds per share (99.00/100 of $7.27) | | $7.20 |
See Notes which are an integral part of the Financial Statements
Annual Shareholder Report
Statement of Operations
Year Ended March 31, 2019
| Investment Income: | | |
| Interest | | $8,394,392 |
| Dividends received from an affiliated holding* | | 58,060 |
| TOTAL INCOME | | 8,452,452 |
| Expenses: | | |
| Investment adviser fee (Note 5) | $981,061 | |
| Administrative fee (Note 5) | 190,754 | |
| Custodian fees | 26,588 | |
| Transfer agent fee | 306,033 | |
| Directors'/Trustees' fees (Note 5) | 2,921 | |
| Auditing fees | 29,602 | |
| Legal fees | 12,509 | |
| Portfolio accounting fees | 143,928 | |
| Distribution services fee (Note 5) | 103,376 | |
| Other service fees (Notes 2 and 5) | 591,796 | |
| Share registration costs | 51,429 | |
| Printing and postage | 34,299 | |
| Miscellaneous (Note 5) | 23,930 | |
| TOTAL EXPENSES | 2,498,226 | |
| Waiver and Reimbursement: | | |
| Waiver/reimbursement of investment adviser fee (Note 5) | (106,188) | |
| Net expenses | | 2,392,038 |
| Net investment income | | 6,060,414 |
| Realized and Unrealized Gain (Loss) on Investments: | | |
| Net realized loss on investments | | (3,273,367) |
| Net change in unrealized appreciation of investments | | 4,933,136 |
| Net realized and unrealized gain on investments | | 1,659,769 |
| Change in net assets resulting from operations | | $7,720,183 |
| * | See information listed after the Fund's Portfolio of Investments |
See Notes which are an integral part of the Financial Statements
Annual Shareholder Report
Statement of Changes in Net Assets
| Year Ended March 31 | 2019 | 2018 |
| Increase (Decrease) in Net Assets | | |
| Operations: | | |
| Net investment income | $6,060,414 | $6,499,867 |
| Net realized gain (loss) | (3,273,367) | 859,314 |
| Net change in unrealized appreciation/depreciation | 4,933,136 | (6,835,107) |
| CHANGE IN NET ASSETS RESULTING FROM OPERATIONS | 7,720,183 | 524,074 |
| Distributions to Shareholders (Note 2): | | |
| Class A Shares | (5,803,151) | (6,250,950) |
| Class B Shares | (37,646) | (63,624) |
| Class C Shares | (205,627) | (318,938) |
| CHANGE IN NET ASSETS RESULTING FROM DISTRIBUTIONS TO SHAREHOLDERS | (6,046,424) | (6,633,512) |
| Share Transactions: | | |
| Proceeds from sale of shares | 18,830,573 | 12,554,828 |
| Net asset value of shares issued to shareholders in payment of distributions declared | 5,055,217 | 5,502,724 |
| Cost of shares redeemed | (54,397,187) | (82,257,329) |
| CHANGE IN NET ASSETS RESULTING FROM SHARE TRANSACTIONS | (30,511,397) | (64,199,777) |
| Change in net assets | (28,837,638) | (70,309,215) |
| Net Assets: | | |
| Beginning of period | 255,932,042 | 326,241,257 |
| End of period | $227,094,404 | $255,932,042 |
See Notes which are an integral part of the Financial Statements
Annual Shareholder Report
Notes to Financial Statements
March 31, 2019
1. ORGANIZATION
Federated Income Securities Trust (the “Trust”) is registered under the Investment Company Act of 1940, as amended (the “Act”), as an open-end management investment company. The Trust consists of seven portfolios. The financial statements included herein are only those of Federated Fund for U.S. Government Securities (the “Fund”), a diversified portfolio. The financial statements of the other portfolios are presented separately. The assets of each portfolio are segregated and a shareholder's interest is limited to the portfolio in which shares are held. Each portfolio pays its own expenses. The Fund offers three classes of shares: Class A Shares, Class B Shares and Class C Shares. All shares of the Fund have equal rights with respect to voting, except on class-specific matters. Class B Shares are closed to new accounts/investors and to new purchases/exchanges by existing shareholders. Effective June 18, 2018, Class B Shares were permitted to be exchanged for Class B Shares of any other Federated fund. The investment objective of the Fund is to provide current income.
On March 30, 2017, the Fund's T Share class became effective with the Securities and Exchange Commission (SEC), but is not yet offered for sale.
Effective August 1, 2018, an automatic conversion feature for Class C Shares was implemented. Pursuant to this automatic conversion feature, after Class C Shares have been held for ten years from the date of purchase, they will automatically convert to Class A Shares on the next monthly conversion processing date.
2. SIGNIFICANT ACCOUNTING POLICIES
The following is a summary of significant accounting policies consistently followed by the Fund in the preparation of its financial statements. These policies are in conformity with U.S. generally accepted accounting principles (GAAP).
Investment Valuation
In calculating its net asset value (NAV), the Fund generally values investments as follows:
| ■ | Fixed-income securities are fair valued using price evaluations provided by a pricing service approved by the Fund's Board of Trustees (the “Trustees”). |
| ■ | Shares of other mutual funds or non-exchange-traded investment companies are valued based upon their reported NAVs. |
| ■ | Derivative contracts listed on exchanges are valued at their reported settlement or closing price, except that options are valued at the mean of closing bid and asked quotations. |
| ■ | Over-the-counter (OTC) derivative contracts are fair valued using price evaluations provided by a pricing service approved by the Trustees. |
| ■ | For securities that are fair valued in accordance with procedures established by and under the general supervision of the Trustees, certain factors may be considered, such as: the last traded or purchase price of the security, information obtained by contacting the issuer or dealers, analysis of the issuer's financial statements or other available documents, fundamental analytical data, the nature and duration of restrictions on disposition, the movement of the market in which the security is normally traded, public trading in similar securities or derivative contracts of the issuer or comparable issuers, movement of a relevant index, or other factors including but not limited to industry changes and relevant government actions. |
Annual Shareholder Report
If any price, quotation, price evaluation or other pricing source is not readily available when the NAV is calculated, if the Fund cannot obtain price evaluations from a pricing service or from more than one dealer for an investment within a reasonable period of time as set forth in the Fund's valuation policies and procedures, or if information furnished by a pricing service, in the opinion of the valuation committee (“Valuation Committee”), is deemed not representative of the fair value of such security, the Fund uses the fair value of the investment determined in accordance with the procedures described below. There can be no assurance that the Fund could obtain the fair value assigned to an investment if it sold the investment at approximately the time at which the Fund determines its NAV per share.
Fair Valuation and Significant Events Procedures
The Trustees have ultimate responsibility for determining the fair value of investments for which market quotations are not readily available. The Trustees have appointed a Valuation Committee comprised of officers of the Fund, Federated Investment Management Company (the “Adviser”) and certain of the Adviser's affiliated companies to assist in determining fair value and in overseeing the calculation of the NAV. The Trustees have also authorized the use of pricing services recommended by the Valuation Committee to provide fair value evaluations of the current value of certain investments for purposes of calculating the NAV. The Valuation Committee employs various methods for reviewing third-party pricing-service evaluations including periodic reviews of third-party pricing services' policies, procedures and valuation methods (including key inputs, methods, models and assumptions), transactional back-testing, comparisons of evaluations of different pricing services, and review of price challenges by the Adviser based on recent market activity. In the event that market quotations and price evaluations are not available for an investment, the Valuation Committee determines the fair value of the investment in accordance with procedures adopted by the Trustees. The Trustees periodically review and approve the fair valuations made by the Valuation Committee and any changes made to the procedures.
Factors considered by pricing services in evaluating an investment include the yields or prices of investments of comparable quality, coupon, maturity, call rights and other potential prepayments, terms and type, reported transactions, indications as to values from dealers and general market conditions. Some pricing services provide a single price evaluation reflecting the bid-side of the market for an investment (a “bid” evaluation). Other pricing services offer both bid evaluations and price evaluations indicative of a price between the prices bid and asked for the investment (a “mid” evaluation). The Fund normally uses bid evaluations for any U.S. Treasury and Agency securities, mortgage-backed securities and municipal securities. The Fund normally uses mid evaluations for any other types of fixed-income securities and any OTC derivative contracts. In the event that market quotations and price evaluations are not available for an investment, the fair value of the investment is determined in accordance with procedures adopted by the Trustees.
The Trustees also have adopted procedures requiring an investment to be priced at its fair value whenever the Adviser determines that a significant event affecting the value of the investment has occurred between the time as of which the price of the investment would otherwise be determined and the time as of which the NAV is computed. An event is considered significant if there is both an affirmative expectation that the investment's value will change in response to the event and a reasonable basis for quantifying the resulting change in value. Examples of significant events that may occur after the close of the principal market on which a security is traded, or after the time of a price evaluation provided by a pricing service or a dealer, include:
| ■ | With respect to securities traded principally in foreign markets, significant trends in U.S. equity markets or in the trading of foreign securities index futures contracts; |
Annual Shareholder Report
| ■ | Political or other developments affecting the economy or markets in which an issuer conducts its operations or its securities are traded; |
| ■ | Announcements concerning matters such as acquisitions, recapitalizations, litigation developments, or a natural disaster affecting the issuer's operations or regulatory changes or market developments affecting the issuer's industry. |
The Trustees have adopted procedures whereby the Valuation Committee uses a pricing service to provide factors to update the fair value of equity securities traded principally in foreign markets from the time of the close of their respective foreign stock exchanges to the pricing time of the Fund. For other significant events, the Fund may seek to obtain more current quotations or price evaluations from alternative pricing sources. If a reliable alternative pricing source is not available, the Fund will determine the fair value of the investment in accordance with the fair valuation procedures approved by the Trustees. The Trustees have ultimate responsibility for any fair valuations made in response to a significant event.
Repurchase Agreements
The Fund may invest in repurchase agreements for short-term liquidity purposes. It is the policy of the Fund to require the other party to a repurchase agreement to transfer to the Fund's custodian or sub-custodian eligible securities or cash with a market value (after transaction costs) at least equal to the repurchase price to be paid under the repurchase agreement. The eligible securities are transferred to accounts with the custodian or sub-custodian in which the Fund holds a “securities entitlement” and exercises “control” as those terms are defined in the Uniform Commercial Code. The Fund has established procedures for monitoring the market value of the transferred securities and requiring the transfer of additional eligible securities if necessary to equal at least the repurchase price. These procedures also allow the other party to require securities to be transferred from the account to the extent that their market value exceeds the repurchase price or in exchange for other eligible securities of equivalent market value.
The insolvency of the other party or other failure to repurchase the securities may delay the disposition of the underlying securities or cause the Fund to receive less than the full repurchase price. Under the terms of the repurchase agreement, any amounts received by the Fund in excess of the repurchase price and related transaction costs must be remitted to the other party.
The Fund may enter into repurchase agreements in which eligible securities are transferred into joint trading accounts maintained by the custodian or sub-custodian for investment companies and other clients advised by the Fund's Adviser and its affiliates. The Fund will participate on a pro rata basis with the other investment companies and clients in its share of the securities transferred under such repurchase agreements and in its share of proceeds from any repurchase or other disposition of such securities.
Investment Income, Gains and Losses, Expenses and Distributions
Investment transactions are accounted for on a trade-date basis. Realized gains and losses from investment transactions are recorded on an identified-cost basis. Interest income and expenses are accrued daily. Dividend income and distributions to shareholders are recorded on the ex-dividend date. Distributions of net investment income, if any, are declared and paid monthly. Amortization/accretion of premium and discount is included in investment income. Gains and losses realized on principal payment of mortgage-backed securities (paydown gains and losses) are classified as part of investment income. Investment income, realized
Annual Shareholder Report
gains and losses, and certain fund-level expenses are allocated to each class based on relative average daily net assets, except that select classes will bear certain expenses unique to those classes. The detail of the total fund expense waiver and reimbursement of $106,188 is disclosed in various locations in this Note 5.
Dividends are declared separately for each class. No class has preferential dividend rights; differences in per share dividend rates are generally due to differences in separate class expenses. All distributions as indicated on the Statement of Changes in Net Assets for the year ended March 31, 2018, were from net investment income. Distributions in excess of net investment income at March 31, 2018 was $4,960.
Other Service Fees
The Fund may pay other service fees up to 0.25% of the average daily net assets of the Fund's Class A Shares, Class B Shares and Class C Shares to unaffiliated financial intermediaries or to Federated Shareholder Services Company (FSSC) for providing services to shareholders and maintaining shareholder accounts. FSSC may voluntarily reimburse the Fund for other service fees. In addition, unaffiliated third-party financial intermediaries may waive other service fees. This waiver can be modified or terminated at any time. For the year ended March 31, 2019, other service fees for the Fund were as follows:
| | Other Service
Fees Incurred |
| Class A Shares | $557,729 |
| Class B Shares | 5,261 |
| Class C Shares | 28,806 |
| TOTAL | $591,796 |
Federal Taxes
It is the Fund's policy to comply with the Subchapter M provision of the Internal Revenue Code (the “Code”) and to distribute to shareholders each year substantially all of its income. Accordingly, no provision for federal income tax is necessary. As of and during the year ended March 31, 2019, the Fund did not have a liability for any uncertain tax positions. The Fund recognizes interest and penalties, if any, related to tax liabilities as income tax expense in the Statement of Operations. As of March 31, 2019, tax years 2016 through 2019 remain subject to examination by the Fund's major tax jurisdictions, which include the United States of America and the Commonwealth of Massachusetts.
When-Issued and Delayed-Delivery Transactions
The Fund may engage in when-issued or delayed-delivery transactions. The Fund records when-issued securities on the trade date and maintains security positions such that sufficient liquid assets will be available to make payment for the securities purchased. Securities purchased on a when-issued or delayed-delivery basis are marked to market daily and begin earning interest on the settlement date. Losses may occur on these transactions due to changes in market conditions or the failure of counterparties to perform under the contract.
The Fund may transact in To Be Announced Securities (TBAs). As with other delayed-delivery transactions, a seller agrees to issue TBAs at a future date. However, the seller does not specify the particular securities to be delivered. Instead, the Fund agrees to accept any security that meets specified terms such as issuer, interest rate and terms of underlying mortgages. The Fund records TBAs on the trade date utilizing information associated with the
Annual Shareholder Report
specified terms of the transaction as opposed to the specific mortgages. TBAs are marked to market daily and begin earning interest on the settlement date. Losses may occur due to the fact that the actual underlying mortgages received may be less favorable than those anticipated by the Fund.
Dollar-Roll Transactions
The Fund engages in dollar-roll transactions in which the Fund sells mortgage-backed securities with a commitment to buy similar (same type, coupon and maturity), but not identical mortgage-backed securities on a future date. Both securities involved are TBA mortgage-backed securities. The Fund treats dollar-roll transactions as purchases and sales. Dollar-rolls are subject to interest rate risks and credit risks.
Restricted Securities
The Fund may purchase securities which are considered restricted. Restricted securities are securities that either: (a) cannot be offered for public sale without first being registered, or being able to take advantage of an exemption from registration, under the Securities Act of 1933; or (b) are subject to contractual restrictions on public sales. In some cases, when a security cannot be offered for public sale without first being registered, the issuer of the restricted security has agreed to register such securities for resale, at the issuer's expense, either upon demand by the Fund or in connection with another registered offering of the securities. Many such restricted securities may be resold in the secondary market in transactions exempt from registration. Restricted securities may be determined to be liquid under criteria established by the Trustees. The Fund will not incur any registration costs upon such resales. The Fund's restricted securities, like other securities, are priced in accordance with procedures established by and under the general supervision of the Trustees.
Futures Contracts
The Fund purchases and sells financial futures contracts to manage duration and yield curve risks. Upon entering into a financial futures contract with a broker, the Fund is required to deposit in a segregated account either U.S. government securities or a specified amount of Restricted cash which is shown in the Statement of Assets and Liabilities. Futures contracts are valued daily and unrealized gains or losses are recorded in a “variation margin” account. Daily, the Fund receives from or pays to the broker a specified amount of cash based upon changes in the variation margin account. When a contract is closed, the Fund recognizes a realized gain or loss. Futures contracts have market risks, including the risk that the change in the value of the contract may not correlate with the changes in the value of the underlying securities. There is minimal counterparty risk to the Fund since futures contracts are exchange traded and the exchange's clearinghouse, as counterparty to all exchange traded futures contracts, guarantees the futures contracts against default.
At March 31, 2019, the Fund had no outstanding futures contracts.
Other
The preparation of financial statements in conformity with GAAP requires management to make estimates and assumptions that affect the amounts of assets, liabilities, expenses and revenues reported in the financial statements. Actual results could differ from those estimated. The Fund applies investment company accounting and reporting guidance.
Annual Shareholder Report
3. SHARES OF BENEFICIAL INTEREST
The following tables summarize share activity:
| Year Ended March 31 | 2019 | 2018 |
| Class A Shares: | Shares | Amount | Shares | Amount |
| Shares sold | 2,397,182 | $17,113,354 | 1,426,949 | $10,494,150 |
| Shares issued to shareholders in payment of distributions declared | 676,259 | 4,827,021 | 699,989 | 5,144,162 |
| Shares redeemed | (6,126,423) | (43,661,570) | (9,385,608) | (69,057,402) |
NET CHANGE RESULTING FROM
CLASS A SHARE TRANSACTIONS | (3,052,982) | $(21,721,195) | (7,258,670) | $(53,419,090) |
| Year Ended March 31 | 2019 | 2018 |
| Class B Shares: | Shares | Amount | Shares | Amount |
| Shares sold | 18,905 | $137,017 | 120 | $1,918 |
| Shares issued to shareholders in payment of distributions declared | 5,015 | 35,819 | 8,344 | 61,421 |
| Shares redeemed | (210,887) | (1,504,442) | (327,334) | (2,413,576) |
NET CHANGE RESULTING FROM
CLASS B SHARE TRANSACTIONS | (186,967) | $(1,331,606) | (318,870) | $(2,350,237) |
| Year Ended March 31 | 2019 | 2018 |
| Class C Shares: | Shares | Amount | Shares | Amount |
| Shares sold | 221,689 | $1,580,202 | 279,344 | $2,058,760 |
| Shares issued to shareholders in payment of distributions declared | 26,941 | 192,377 | 40,422 | 297,141 |
| Shares redeemed | (1,293,861) | (9,231,175) | (1,464,929) | (10,786,351) |
NET CHANGE RESULTING FROM
CLASS C SHARE TRANSACTIONS | (1,045,231) | $(7,458,596) | (1,145,163) | $(8,430,450) |
NET CHANGE RESULTING FROM
TOTAL FUND SHARE TRANSACTIONS | (4,285,180) | $(30,511,397) | (8,722,703) | $(64,199,777) |
4. FEDERAL TAX INFORMATION
The tax character of distributions as reported on the Statement of Changes in Net Assets for the years ended March 31, 2019 and 2018, was as follows:
| | 2019 | 2018 |
| Ordinary income | $6,046,424 | $6,633,512 |
As of March 31, 2019, the components of distributable earnings on a tax-basis were as follows:
| Undistributed ordinary income | $36,587 |
| Unrealized appreciation (depreciation) | $6,603,957 |
| Capital loss carryforwards | $(12,282,586) |
Annual Shareholder Report
The difference between book-basis and tax-basis net unrealized appreciation/depreciation is attributable to differing treatments for accretion/premium amortization on debt securities and REMIC adjustments.
At March 31, 2019, the cost of investments for federal tax purposes was $219,646,364. The net unrealized appreciation of investments for federal tax purposes was $6,603,957. This consists of net unrealized appreciation from investments for those securities having an excess of value over cost of $6,852,950 and net unrealized depreciation from investments for those securities having an excess of cost over value of $248,993.
At March 31, 2019, the Fund had a capital loss carryforward of $12,282,586 which will reduce the Fund's taxable income arising from future net realized gains on investments, if any, to the extent permitted by the Code, thereby reducing the amount of distributions to shareholders which would otherwise be necessary to relieve the Fund of any liability for federal income tax. Pursuant to the Code, a net capital loss incurred in taxable years beginning after December 22, 2010, retains its character as either short-term or long-term, does not expire and is required to be utilized prior to the losses which have a Carryforward Limit.
The following schedule summarizes the Fund's capital loss carryforwards:
| Short-Term | Long-Term | Total |
| $8,870,405 | $3,412,181 | $12,282,586 |
5. INVESTMENT ADVISER FEE AND OTHER TRANSACTIONS WITH AFFILIATES
The Fund's investment advisory contract provides for payment to the Adviser of an annual investment advisory fee based on the Fund's average daily net asset value as shown in the chart below plus 4.50% of the Fund's gross income. The Adviser may voluntarily choose to waive any portion of its fee. The Adviser can modify or terminate this voluntary waiver at any time at its sole discretion. For the year ended March 31, 2019, the Adviser voluntarily waived $104,269 of its fee.
The Adviser has agreed to reimburse the Fund for certain investment adviser fees as a result of transactions in other affiliated investment companies. For the year ended March 31, 2019, the Adviser reimbursed $1,919.
| Average Daily Net Assets | Percentage of Average
Daily Net Assets |
| First $500 million | 0.250% |
| Second $500 million | 0.225% |
| Over $1 billion | 0.200% |
Annual Shareholder Report
Administrative Fee
Federated Administrative Services (FAS), under the Administrative Services Agreement, provides the Fund with administrative personnel and services. For purposes of determining the appropriate rate breakpoint, “Investment Complex” is defined as all of the Federated Funds subject to a fee under the Administrative Services Agreement. The fee paid to FAS is based on the average daily net assets of the Investment Complex as specified below:
| Administrative Fee | Average Daily Net Assets
of the Investment Complex |
| 0.100% | on assets up to $50 billion |
| 0.075% | on assets over $50 billion |
FAS may voluntarily choose to waive any portion of its fee. For the year ended March 31, 2019, the annualized fee paid to FAS was 0.080% of average daily net assets of the Fund.
Prior to September 1, 2017, the breakpoints of the Administrative Fee paid to FAS, described above, were:
| Administrative Fee | Average Daily Net Assets
of the Investment Complex |
| 0.150% | on the first $5 billion |
| 0.125% | on the next $5 billion |
| 0.100% | on the next $10 billion |
| 0.075% | on assets in excess of $20 billion |
In addition, FAS may charge certain out-of-pocket expenses to the Fund.
Distribution Services Fee
The Fund has adopted a Distribution Plan (the “Plan”) pursuant to Rule 12b-1 under the Act. Under the terms of the Plan, the Fund will compensate Federated Securities Corp. (FSC), the principal distributor, from the daily net assets of the Fund's Class B Shares and Class C Shares to finance activities intended to result in the sale of these shares. The Plan provides that the Fund may incur distribution expenses at the following percentages of average daily net assets annually, to compensate FSC:
| Share Class Name | Percentage of Average Daily
Net Assets of Class |
| Class B Shares | 0.75% |
| Class C Shares | 0.75% |
FSC may voluntarily choose to waive any portion of its fee. For the year ended March 31, 2019, distribution services fees for the Fund were as follows:
| | Distribution Services
Fees Incurred |
| Class B Shares | $15,784 |
| Class C Shares | 87,592 |
| TOTAL | $103,376 |
Annual Shareholder Report
When FSC receives fees, it may pay some or all of them to financial intermediaries whose customers purchase shares. For the year ended March 31, 2019, FSC retained $21,114 fees paid by the Fund.
Sales Charges
Front-end sales charges and contingent deferred sales charges (CDSC) do not represent expenses of the Fund. They are deducted from the proceeds of sales of Fund shares prior to investment or from redemption proceeds prior to remittance, as applicable. For the year ended March 31, 2019, FSC retained $1,605 in sales charges from the sale of Class A Shares. FSC also retained $1,082 of CDSC relating to redemptions of Class B Shares and $172 relating to redemptions of Class C Shares.
Other Service Fees
For the year ended March 31, 2019, FSSC received $226,160 of the other service fees disclosed in Note 2.
Expense Limitation
The Adviser and certain of its affiliates (which may include FSC, FAS and FSSC) on their own initiative have agreed to waive certain amounts of their respective fees and/or reimburse expenses. Effective June 1, 2019, total annual fund operating expenses (as shown in the financial highlights, excluding interest expense, extraordinary expenses and proxy-related expenses paid by the Fund, if any) paid by the Fund's Class A Shares, Class B Shares and Class C Shares (after the voluntary waivers and/or reimbursements) will not exceed 0.97%, 1.72% and 1.72% (the “Fee Limit”), respectively, up to but not including the later of (the “Termination Date”): (a) June 1, 2020; or (b) the date of the Fund's next effective Prospectus. While the Adviser and its applicable affiliates currently do not anticipate terminating or increasing these arrangements prior to the Termination Date, these arrangements may only be terminated or the Fee Limit increased prior to the Termination Date with the agreement of the Trustees.
Directors'/Trustees' and Miscellaneous Fees
Certain Officers and Trustees of the Fund are Officers and Directors or Trustees of certain of the above companies. To efficiently facilitate payment, Directors'/Trustees' fees and certain expenses related to conducting meetings of the Directors/Trustees and other miscellaneous expenses are paid by an affiliate of the Adviser which in due course are reimbursed by the Fund. These expenses related to conducting meetings of the Directors/Trustees and other miscellaneous expenses may be included in Accrued and Miscellaneous Expenses on the Statement of Assets and Liabilities and Statement of Operations, respectively.
6. INVESTMENT TRANSACTIONS
Purchases and sales of investments, excluding long-term U.S. government securities and short-term obligations, for the year ended March 31, 2019, were as follows:
| Purchases | $4,544,847 |
| Sales | $13,477,966 |
Annual Shareholder Report
7. LINE OF CREDIT
The Fund participates with certain other Federated Funds, on a several basis, in an up to $500,000,000 unsecured, 364-day, committed, revolving line of credit (LOC) agreement. The LOC was made available to finance temporarily the repurchase or redemption of shares of the Fund, failed trades, payment of dividends, settlement of trades and for other short-term, temporary or emergency general business purposes. The Fund cannot borrow under the LOC if an inter-fund loan is outstanding. The Fund's ability to borrow under the LOC also is subject to the limitations of the Act and various conditions precedent that must be satisfied before the Fund can borrow. Loans under the LOC are charged interest at a fluctuating rate per annum equal to the highest, on any day, of (a) (i) the federal funds effective rate, (ii) the one month London Interbank Offered Rate (LIBOR), and (iii) 0.0%, plus (b) a margin. The LOC also requires the Fund to pay, quarterly in arrears and at maturity, its pro rata share of a commitment fee based on the amount of the lenders' commitment that has not been utilized. As of March 31, 2019, the Fund had no outstanding loans. During the year ended March 31, 2019, the Fund did not utilize the LOC.
8. INTERFUND LENDING
Pursuant to an Exemptive Order issued by the SEC, the Fund, along with other funds advised by subsidiaries of Federated Investors, Inc., may participate in an interfund lending program. This program provides an alternative credit facility allowing the Fund to borrow from other participating affiliated funds. As of March 31, 2019, there were no outstanding loans. During the year ended March 31, 2019, the program was not utilized.
Annual Shareholder Report
Report of Independent Registered Public Accounting Firm
TO THE BOARD OF TRUSTEES OF FEDERATED INCOME SECURITIES TRUST AND SHAREHOLDERS OF FEDERATED FUND FOR U.S. GOVERNMENT SECURITIES:
Opinion on the Financial Statements
We have audited the accompanying statement of assets and liabilities of Federated Fund for U.S. Government Securities (the “Fund”) (one of the portfolios constituting Federated Income Securities Trust), including the portfolio of investments, as of March 31, 2019, and the related statement of operations for the year then ended, the statement of changes in net assets for each of the two years in the period then ended, the financial highlights for each of the five years in the period then ended and the related notes (collectively referred to as the “financial statements”). In our opinion, the financial statements present fairly, in all material respects, the financial position of the Fund at March 31, 2019, the results of its operations for the year then ended, the changes in its net assets for each of the two years in the period then ended and its financial highlights for each of the five years in the period then ended, in conformity with U.S. generally accepted accounting principles.
Basis for Opinion
These financial statements are the responsibility of the Fund's management. Our responsibility is to express an opinion on the Fund's financial statements based on our audits. We are a public accounting firm registered with the Public Company Accounting Oversight Board (United States) (“PCAOB”) and are required to be independent with respect to the Fund in accordance with the U.S. federal securities laws and the applicable rules and regulations of the Securities and Exchange Commission and the PCAOB.
We conducted our audits in accordance with standards of the PCAOB. Those standards require that we plan and perform the audit to obtain reasonable assurance about whether the financial statements are free of material misstatement, whether due to error or fraud. The Fund is not required to have, nor were we engaged to perform, an audit of the Fund's internal control over financial reporting. As part of our audits, we are required to obtain an understanding of internal control over financial reporting, but not for the purpose of expressing an opinion on the effectiveness of the Fund's internal control over financial reporting. Accordingly, we express no such opinion.
Annual Shareholder Report
Our audits included performing procedures to assess the risks of material misstatement of the financial statements, whether due to error or fraud, and performing procedures that respond to those risks. Such procedures included examining, on a test basis, evidence regarding the amounts and disclosures in the financial statements. Our procedures included confirmation of securities owned as of March 31, 2019, by correspondence with the custodian and others, or by other appropriate auditing procedures where replies from others were not received. Our audits also included evaluating the accounting principles used and significant estimates made by management, as well as evaluating the overall presentation of the financial statements. We believe that our audits provide a reasonable basis for our opinion.
We have served as the auditor of one or more Federated investment companies since 1979.
Boston, Massachusetts
May 22, 2019
Annual Shareholder Report
Shareholder Expense Example
As a shareholder of the Fund, you incur ongoing costs, including management fees and to the extent applicable, distribution (12b-1) fees and/or other service fees and other Fund expenses. This Example is intended to help you to understand your ongoing costs (in dollars) of investing in the Fund and to compare these costs with the ongoing costs of investing in other mutual funds. It is based on an investment of $1,000 invested at the beginning of the period and held for the entire period from October 1, 2018 to March 31, 2019.
ACTUAL EXPENSES
The first section of the table below provides information about actual account values and actual expenses. You may use the information in this section, together with the amount you invested, toestimate the expenses that you incurred over the period. Simply divide your account value by $1,000 (for example, an $8,600 account value divided by $1,000 = 8.6), then multiply the result by the number in the first section under the heading entitled “Expenses Paid During Period” to estimate the expenses attributable to your investment during this period.
HYPOTHETICAL EXAMPLE FOR COMPARISON PURPOSES
The second section of the table below provides information about hypothetical account values and hypothetical expenses based on the Fund's actual expense ratio and anassumed rate of return of 5% per year before expenses, which is not the Fund's actual return. Thus, you shouldnot use the hypothetical account values and expenses to estimate the actual ending account balance or your expenses for the period. Rather, these figures are required to be provided to enable you to compare the ongoing costs of investing in the Fund with other funds. To do so, compare this 5% hypothetical example with the 5% hypothetical examples that appear in the shareholder reports of the other funds.
Annual Shareholder Report
Please note that the expenses shown in the table are meant to highlight your ongoing costs only. Therefore, the second section of the table is useful in comparing ongoing costs only, and will not help you determine the relativetotal costs of owning different funds.
| | Beginning
Account Value
10/1/2018 | Ending
Account Value
3/31/2019 | Expenses Paid
During Period1 |
| Actual: | | | |
| Class A Shares | $1,000 | $1,039.10 | $4.88 |
| Class B Shares | $1,000 | $1,036.60 | $8.68 |
| Class C Shares | $1,000 | $1,035.20 | $8.68 |
| Hypothetical (assuming a 5% return before expenses): | | | |
| Class A Shares | $1,000 | $1,020.10 | $4.84 |
| Class B Shares | $1,000 | $1,016.40 | $8.60 |
| Class C Shares | $1,000 | $1,016.40 | $8.60 |
| 1 | Expenses are equal to the Fund's annualized net expense ratios, multiplied by the average account value over the period, multiplied by 182/365 (to reflect the one-half-year period). The annualized net expense ratios are as follows: |
| | |
| Class A Shares | 0.96% |
| Class B Shares | 1.71% |
| Class C Shares | 1.71% |
Annual Shareholder Report
Board of Trustees and Trust Officers
The Board of Trustees is responsible for managing the Trust's business affairs and for exercising all the Trust's powers except those reserved for the shareholders. The following tables give information about each Trustee and the senior officers of the Fund. Where required, the tables separately list Trustees who are “interested persons” of the Fund (i.e., “Interested” Trustees) and those who are not (i.e., “Independent” Trustees). Unless otherwise noted, the address of each person listed is Federated Investors Tower, 1001 Liberty Avenue, Pittsburgh, PA 15222. The address of all Independent Trustees listed is 4000 Ericsson Drive, Warrendale, PA 15086-7561; Attention: Mutual Fund Board. As of December 31, 2018, the Trust comprised eight portfolio(s), and the Federated Fund Family consisted of 40 investment companies (comprising 102 portfolios). Unless otherwise noted, each Officer is elected annually. Unless otherwise noted, each Trustee oversees all portfolios in the Federated Fund Family and serves for an indefinite term. The Fund's Statement of Additional Information includes additional information about Trust Trustees and is available, without charge and upon request, by calling 1-800-341-7400.
Interested TRUSTEES Background
Name
Birth Date
Positions Held with Trust
Date Service Began | Principal Occupation(s) for Past Five Years,
Other Directorships Held and Previous Position(s) |
J. Christopher Donahue*
Birth Date: April 11, 1949
President and Trustee
Indefinite Term
Began serving: January 2000 | Principal Occupations: Principal Executive Officer and President of certain of the Funds in the Federated Fund Family; Director or Trustee of the Funds in the Federated Fund Family; President, Chief Executive Officer and Director, Federated Investors, Inc.; Chairman and Trustee, Federated Investment Management Company; Trustee, Federated Investment Counseling; Chairman and Director, Federated Global Investment Management Corp.; Chairman and Trustee, Federated Equity Management Company of Pennsylvania; Trustee, Federated Shareholder Services Company; Director, Federated Services Company.
Previous Positions: President, Federated Investment Counseling; President and Chief Executive Officer, Federated Investment Management Company, Federated Global Investment Management Corp. and Passport Research, Ltd; Chairman, Passport Research, Ltd. |
Annual Shareholder Report
Name
Birth Date
Positions Held with Trust
Date Service Began | Principal Occupation(s) for Past Five Years,
Other Directorships Held and Previous Position(s) |
John B. Fisher*
Birth Date: May 16, 1956
Trustee
Indefinite Term
Began serving: May 2016 | Principal Occupations:Principal Executive Officer and President of certain of the Funds in the Federated Fund Family; Director or Trustee of certain of the Funds in the Federated Fund Family; Vice President, Federated Investors, Inc.; President, Director/Trustee and CEO, Federated Advisory Services Company, Federated Equity Management Company of Pennsylvania, Federated Global Investment Management Corp., Federated Investment Counseling, Federated Investment Management Company; President of some of the Funds in the Federated Fund Complex and Director, Federated Investors Trust Company.
Previous Positions: President and Director of the Institutional Sales Division of Federated Securities Corp.; President and Director of Federated Investment Counseling; President and CEO of Passport Research, Ltd.; Director, Edgewood Securities Corp.; Director, Federated Services Company; Director, Federated Investors, Inc.; Chairman and Director, Southpointe Distribution Services, Inc. and President, Technology, Federated Services Company. |
| * | Reasons for “interested” status: J. Christopher Donahue and John B. Fisher are interested due to their beneficial ownership of shares of Federated Investors, Inc. and due to positions they hold with Federated and its subsidiaries. |
INDEPENDENT TRUSTEES Background
Name
Birth Date
Positions Held with Trust
Date Service Began | Principal Occupation(s) for Past Five Years,
Other Directorships Held, Previous Position(s) and Qualifications |
John T. Collins
Birth Date: January 24, 1947
Trustee
Indefinite Term
Began serving: October 2013 | Principal Occupations: Director or Trustee of the Federated Fund Family; formerly, Chairman and CEO, The Collins Group, Inc. (a private equity firm) (Retired).
Other Directorships Held: Director, Chairman of the Compensation Committee, KLX Energy Services Holdings, Inc. (oilfield services); former Director of KLX Corp. (aerospace).
Qualifications: Mr. Collins has served in several business and financial management roles and directorship positions throughout his career. Mr. Collins previously served as Chairman and CEO of The Collins Group, Inc. (a private equity firm) and as a Director of KLX Corp. Mr. Collins serves as Chairman Emeriti, Bentley University. Mr. Collins previously served as Director and Audit Committee Member, Bank of America Corp.; Director, FleetBoston Financial Corp.; and Director, Beth Israel Deaconess Medical Center (Harvard University Affiliate Hospital). |
Annual Shareholder Report
Name
Birth Date
Positions Held with Trust
Date Service Began | Principal Occupation(s) for Past Five Years,
Other Directorships Held, Previous Position(s) and Qualifications |
G. Thomas Hough
Birth Date: February 28, 1955
Trustee
Indefinite Term
Began serving: August 2015 | Principal Occupations: Director or Trustee of the Federated Fund Family; formerly, Vice Chair, Ernst & Young LLP (public accounting firm) (Retired).
Other Directorships Held: Director, Member of Governance and Compensation Committees, Publix Super Markets, Inc.; Director, Chair of the Audit Committee, Equifax, Inc.; Director, Member of the Audit Committee, Haverty Furniture Companies, Inc.
Qualifications: Mr. Hough has served in accounting, business management and directorship positions throughout his career. Mr. Hough most recently held the position of Americas Vice Chair of Assurance with Ernst & Young LLP (public accounting firm). Mr. Hough serves on the President's Cabinet and Business School Board of Visitors for the University of Alabama and is on the Business School Board of Visitors for Wake Forest University. Mr. Hough previously served as an Executive Committee member of the United States Golf Association. |
Maureen Lally-Green
Birth Date: July 5, 1949
Trustee
Indefinite Term
Began serving: August 2009 | Principal Occupations: Director or Trustee of the Federated Fund Family; Dean of the Duquesne University School of Law; Professor and Adjunct Professor of Law, Duquesne University School of Law; formerly, Interim Dean of the Duquesne University School of Law; formerly, Associate General Secretary and Director, Office of Church Relations, Diocese of Pittsburgh.
Other Directorships Held: Director, CNX Resources Corporation (formerly known as CONSOL Energy Inc.).
Qualifications: Judge Lally-Green has served in various legal and business roles and directorship positions throughout her career and currently serves as the Dean of the School of Law of Duquesne University. Judge Lally-Green previously served as a member of the Superior Court of Pennsylvania and as a Professor of Law, Duquesne University School of Law. Judge Lally-Green also currently holds the positions on not for profit or for profit boards of directors as follows: Director and Chair, UPMC Mercy Hospital; Director and Vice Chair, Our Campaign for the Church Alive!, Inc.; Regent, Saint Vincent Seminary; Member, Pennsylvania State Board of Education (public); and Director CNX Resources Corporation (formerly known as CONSOL Energy Inc.). Judge Lally-Green has held the positions of: Director, Auberle; Director, Epilepsy Foundation of Western and Central Pennsylvania; Director, Ireland Institute of Pittsburgh; Director, Saint Thomas More Society; Director and Chair, Catholic High Schools of the Diocese of Pittsburgh, Inc.; Director, Pennsylvania Bar Institute; Director, St. Vincent College; and Director and Chair, North Catholic High School, Inc. |
Charles F. Mansfield, Jr.
Birth Date: April 10, 1945
Trustee
Indefinite Term
Began serving: January 2000 | Principal Occupations: Director or Trustee of the Federated Fund Family; Management Consultant and Author.
Other Directorships Held: None.
Qualifications: Mr. Mansfield has served as a Marine Corps officer and in several banking, business management, educational roles and directorship positions throughout his long career. He remains active as a Management Consultant and Author. |
Annual Shareholder Report
Name
Birth Date
Positions Held with Trust
Date Service Began | Principal Occupation(s) for Past Five Years,
Other Directorships Held, Previous Position(s) and Qualifications |
Thomas M. O'Neill
Birth Date: June 14, 1951
Trustee
Indefinite Term
Began serving: August 2006 | Principal Occupations: Director or Trustee, Chair of the Audit Committee of the Federated Fund Family; Sole Proprietor, Navigator Management Company (investment and strategic consulting).
Other Directorships Held: None.
Qualifications: Mr. O'Neill has served in several business, mutual fund and financial management roles and directorship positions throughout his career. Mr. O'Neill serves as Director, Medicines for Humanity and Director, The Golisano Children's Museum of Naples, Florida. Mr. O'Neill previously served as Chief Executive Officer and President, Managing Director and Chief Investment Officer, Fleet Investment Advisors; President and Chief Executive Officer, Aeltus Investment Management, Inc.; General Partner, Hellman, Jordan Management Co., Boston, MA; Chief Investment Officer, The Putnam Companies, Boston, MA; Credit Analyst and Lending Officer, Fleet Bank; Director and Consultant, EZE Castle Software (investment order management software); and Director, Midway Pacific (lumber). |
P. Jerome Richey
Birth Date: February 23, 1949
Trustee
Indefinite Term
Began serving: October 2013 | Principal Occupations: Director or Trustee of the Federated Fund Family; Management Consultant; Retired; formerly, Senior Vice Chancellor and Chief Legal Officer, University of Pittsburgh and Executive Vice President and Chief Legal Officer, CNX Resources Corporation (formerly known as CONSOL Energy Inc.).
Other Directorships Held: None.
Qualifications: Mr. Richey has served in several business and legal management roles and directorship positions throughout his career. Mr. Richey most recently held the positions of Senior Vice Chancellor and Chief Legal Officer, University of Pittsburgh. Mr. Richey previously served as Chairman of the Board, Epilepsy Foundation of Western Pennsylvania and Chairman of the Board, World Affairs Council of Pittsburgh. Mr. Richey previously served as Chief Legal Officer and Executive Vice President, CNX Resources Corporation (formerly known as CONSOL Energy Inc.); and Board Member, Ethics Counsel and Shareholder, Buchanan Ingersoll & Rooney PC (a law firm). |
John S. Walsh
Birth Date: November 28, 1957
Trustee
Indefinite Term
Began serving: January 2000 | Principal Occupations: Director or Trustee, and Chair of the Board of Directors or Trustees, of the Federated Fund Family; President and Director, Heat Wagon, Inc. (manufacturer of construction temporary heaters); President and Director, Manufacturers Products, Inc. (distributor of portable construction heaters); President, Portable Heater Parts, a division of Manufacturers Products, Inc.
Other Directorships Held: None.
Qualifications: Mr. Walsh has served in several business management roles and directorship positions throughout his career. Mr. Walsh previously served as Vice President, Walsh & Kelly, Inc. (paving contractors). |
Annual Shareholder Report
OFFICERS
Name
Birth Date
Address
Positions Held with Trust
Date Service Began | Principal Occupation(s) for Past Five Years
and Previous Position(s) |
Lori A. Hensler
Birth Date: January 6, 1967
TREASURER
Officer since: April 2013 | Principal Occupations: Principal Financial Officer and Treasurer of the Federated Fund Family; Senior Vice President, Federated Administrative Services; Financial and Operations Principal for Federated Securities Corp. and Edgewood Services, Inc.; and Assistant Treasurer, Federated Investors Trust Company. Ms. Hensler has received the Certified Public Accountant designation.
Previous Positions: Controller of Federated Investors, Inc.; Senior Vice President and Assistant Treasurer, Federated Investors Management Company; Treasurer, Federated Investors Trust Company; Assistant Treasurer, Federated Administrative Services, Federated Administrative Services, Inc., Federated Securities Corp., Edgewood Services, Inc., Federated Advisory Services Company, Federated Equity Management Company of Pennsylvania, Federated Global Investment Management Corp., Federated Investment Counseling, Federated Investment Management Company, Passport Research, Ltd., and Federated MDTA, LLC; Financial and Operations Principal for Federated Securities Corp., Edgewood Services, Inc. and Southpointe Distribution Services, Inc. |
Peter J. Germain
Birth Date: September 3, 1959
CHIEF LEGAL OFFICER, SECRETARY and EXECUTIVE VICE PRESIDENT
Officer since: January 2005 | Principal Occupations: Mr. Germain is Chief Legal Officer, Secretary and Executive Vice President of the Federated Fund Family. He is General Counsel, Chief Legal Officer, Secretary and Executive Vice President, Federated Investors, Inc.; Trustee and Senior Vice President, Federated Investors Management Company; Trustee and President, Federated Administrative Services; Director and President, Federated Administrative Services, Inc.; Director and Vice President, Federated Securities Corp.; Director and Secretary, Federated Private Asset Management, Inc.; Secretary, Federated Shareholder Services Company; and Secretary, Retirement Plan Service Company of America. Mr. Germain joined Federated in 1984 and is a member of the Pennsylvania Bar Association.
Previous Positions: Deputy General Counsel, Special Counsel, Managing Director of Mutual Fund Services, Federated Investors, Inc.; Senior Vice President, Federated Services Company; and Senior Corporate Counsel, Federated Investors, Inc. |
Stephen Van Meter
Birth Date: June 5, 1975
CHIEF COMPLIANCE OFFICER AND SENIOR VICE PRESIDENT
Officer since: July 2015 | Principal Occupations: Senior Vice President and Chief Compliance Officer of the Federated Fund Family; Vice President and Chief Compliance Officer of Federated Investors, Inc. and Chief Compliance Officer of certain of its subsidiaries. Mr. Van Meter joined Federated in October 2011. He holds FINRA licenses under Series 3, 7, 24 and 66.
Previous Positions: Mr. Van Meter previously held the position of Compliance Operating Officer, Federated Investors, Inc. Prior to joining Federated, Mr. Van Meter served at the United States Securities and Exchange Commission in the positions of Senior Counsel, Office of Chief Counsel, Division of Investment Management and Senior Counsel, Division of Enforcement. |
Annual Shareholder Report
Name
Birth Date
Address
Positions Held with Trust
Date Service Began | Principal Occupation(s) for Past Five Years
and Previous Position(s) |
Robert J. Ostrowski
Birth Date: April 26, 1963
Chief Investment Officer
Officer since: May 2004 | Principal Occupations: Robert J. Ostrowski joined Federated in 1987 as an Investment Analyst and became a Portfolio Manager in 1990. He was named Chief Investment Officer of Federated's taxable fixed-income products in 2004 and also serves as a Senior Portfolio Manager. Mr. Ostrowski became an Executive Vice President of the Fund's Adviser in 2009 and served as a Senior Vice President of the Fund's Adviser from 1997 to 2009. Mr. Ostrowski has received the Chartered Financial Analyst designation. He received his M.S. in Industrial Administration from Carnegie Mellon University. |
Annual Shareholder Report
Evaluation and Approval of Advisory Contract–May 2018
Federated Fund for U.S. Government Securities (the “Fund”)
At its meetings in May 2018, the Fund's Board of Trustees (the “Board”), including a majority of those Trustees who are not “interested persons” of the Fund, as defined in the Investment Company Act of 1940 (the “Independent Trustees”), reviewed and unanimously approved the continuation of the Fund's investment advisory contract for an additional one-year term. The Board's decision regarding the contract reflects the exercise of its business judgment after considering all of the information received on whether to continue the existing arrangements.
The Board had previously appointed a Senior Officer, whose duties included specified responsibilities relating to the process by which advisory fees are to be charged to a fund advised by Federated Investment Management Company (the “Adviser”) or its affiliates (collectively, “Federated”) (each, a “Federated fund”). The Senior Officer's responsibilities included preparing and furnishing to the Board an annual independent written evaluation that covered topics discussed below. In December 2017, the Senior Officer position was eliminated. Notwithstanding the elimination of the Senior Officer position, at the request of the Independent Trustees, the Fund's Chief Compliance Officer (the CCO) furnished to the Board in advance of its May 2018 meetings an independent written evaluation covering substantially the same topics that had been covered in the Senior Officer's written evaluation in prior years. The Board considered the CCO's independent written evaluation (the “CCO Fee Evaluation Report”), along with other information, in evaluating the reasonableness of the Fund's management fee and in deciding to approve the continuation of the investment advisory contract. Consistent with the former Senior Officer position, the CCO, in preparing the CCO Fee Evaluation Report, has the authority to retain consultants, experts or staff as reasonably necessary to assist in the performance of his duties, reports directly to the Board, and can be terminated only with the approval of a majority of the Independent Trustees.
The Board also considered judicial decisions concerning allegedly excessive investment advisory fees in making its decision. Using these judicial decisions as a guide, the Board observed that the following factors may be relevant to an adviser's fiduciary duty with respect to its receipt of compensation from a fund: (1) the nature and quality of the services provided by an adviser to a fund and its shareholders (including the performance of the fund, its benchmark, and comparable funds); (2) an adviser's cost of providing the services (including the profitability to an adviser of providing advisory services to a fund); (3) the extent to which an adviser may realize “economies of scale” as a fund grows larger and, if such economies of scale exist, whether they have been shared with a fund and its shareholders or the family of funds; (4) any “fall-out” financial benefits that accrue to an adviser because of its relationship with a fund (including
Annual Shareholder Report
research services received from brokers that execute fund trades and any fees paid to affiliates of an adviser for services rendered to a fund); (5) comparative fee and expense structures (including a comparison of fees paid to an adviser with those paid by similar funds both internally and externally as well as management fees charged to institutional and other advisory clients of the Adviser or its affiliates for what might be viewed as like services); and (6) the extent of care, conscientiousness and independence with which the fund's board members perform their duties and their expertise (including whether they are fully informed about all facts the board deems relevant to its consideration of an adviser's services and fees). The Board noted that the Securities and Exchange Commission (SEC) disclosure requirements regarding the basis for the Board's approval of the Fund's investment advisory contract generally align with the factors listed above. The Board was aware of these factors and was guided by them in its review of the Fund's investment advisory contract to the extent it considered them to be appropriate and relevant, as discussed further below.
The Board considered and weighed these factors in light of its substantial accumulated experience in governing the Fund and working with Federated on matters relating to the Federated funds. The Independent Trustees were assisted in their deliberations by independent legal counsel.
In addition to the extensive materials that comprise and accompany the CCO Fee Evaluation Report, the Board received detailed information about the Fund and the Federated organization throughout the year, and in connection with its May meetings at which the Board's formal approval of the advisory and subadvisory contracts occurred. In this regard, Federated provided much of this information at each regular meeting of the Board, and furnished additional information specifically in connection with the May meetings. In the months preceding the May meetings, the Board requested and reviewed written materials prepared by Federated in response to requests on behalf of the Independent Trustees encompassing a wide variety of topics. At the May meetings, in addition to meeting in separate sessions of the Independent Trustees without management present, senior management of the Adviser also met with the Independent Trustees and their counsel to discuss the materials presented and such additional matters as the Independent Trustees deemed reasonably necessary to evaluate the advisory and subadvisory contracts. Between regularly scheduled meetings, the Board also received information on particular matters as the need arose.
The Board's consideration of the investment advisory contract included review of the CCO Fee Evaluation Report, accompanying data and additional information covering the following matters, among others: the Adviser's investment philosophy, revenue, profitability, personnel and processes; investment and operating strategies; the Fund's short-term and long-term performance (in absolute terms, both on a gross basis and net of expenses, as well as in terms relative to its particular investment program and certain competitor or “peer group” funds and/or other benchmarks, as appropriate) and comments on the
Annual Shareholder Report
reasons for performance; the Fund's investment objectives; the Fund's expenses, including the advisory fee and the overall expense structure of the Fund (both in absolute terms and relative to similar and/or competing funds), with due regard for contractual or voluntary expense limitations; the use and allocation of brokerage commissions derived from trading the Fund's portfolio securities (if any); and the nature, quality and extent of the advisory and other services provided to the Fund by the Adviser and its affiliates. The Board also considered the preferences and expectations of Fund shareholders; the entrepreneurial and other risks assumed by the Adviser in sponsoring the Fund; the continuing state of competition in the mutual fund industry and market practices; the range of comparable fees for similar funds in the mutual fund industry; the Fund's relationship to the Federated funds which include a comprehensive array of funds with different investment objectives, policies and strategies which are generally available for exchange without the incurrence of additional sales charges; compliance and audit reports concerning the Federated funds and the Federated companies that service them (including communications from regulatory agencies), as well as Federated's responses to any issues raised therein; and relevant developments in the mutual fund industry and how the Federated funds and/or Federated are responding to them. The Board's evaluation process is evolutionary. The criteria considered and the emphasis placed on relevant criteria change in recognition of changing circumstances in the mutual fund marketplace.
While mindful that courts have cautioned against giving too much weight to comparative information concerning fees charged by other advisers for managing funds with comparable investment programs, the Board has found the use of such comparisons to be relevant to its deliberations. In this regard, the Board was presented with, and considered, information regarding the contractual advisory fee rates, net advisory fee rates, total expense ratios and each element of the Fund's total expense ratio (i.e., gross and net advisory fees, custody fees, portfolio accounting fees and transfer agency fees) relative to an appropriate group of peer funds compiled by Federated using data supplied by independent fund ranking organizations (the “Peer Group”). The Board received a description of the composition and methodology used to select the Peer Group. The Board focused on comparisons with other similar mutual funds more heavily than non-mutual fund products or services because it is believed that they are more relevant. For example, other mutual funds are the products most like the Fund, in that they are readily available to Fund shareholders as alternative investment vehicles. Also, they are the type of investment vehicle, in fact, chosen and maintained by the Fund's investors. The range of their fees and expenses, therefore, appears to be a relevant indicator of what consumers have found to be reasonable in the marketplace in which the Fund competes.
Annual Shareholder Report
The Board reviewed the contractual advisory fee rate, and other expenses of the Fund and noted the position of the Fund's fee rates relative to its Peer Group. In this regard, the Board noted that the contractual advisory fee rate was below the median of the relevant Peer Group and the Board was satisfied that the overall expense structure of the Fund remained competitive.
For comparison, the CCO reviewed the fees charged by Federated for providing advisory services to products other than the Federated funds (e.g., institutional and separate accounts and third-party unaffiliated mutual funds for which Federated serves as sub-adviser) (referenced to as “Comparable Funds/Accounts”). With respect to Comparable Funds/Accounts other than third-party mutual funds, the CCO concluded that they are inherently different products. Those differences include, but are not limited to, different types of targeted investors; different applicable laws and regulations; different legal structures; different average account sizes and portfolio management techniques made necessary by different cash flows and different associated costs; and the time spent by portfolio managers and their teams, as well as personnel in the Funds Financial Services, Legal, Compliance and Risk Management departments, in reviewing securities pricing, addressing different administrative responsibilities, addressing different degrees of risk associated with management and a variety of different costs. The CCO also reviewed the differences in the nature of the services required for Federated to manage its proprietary mutual fund business versus managing a discrete pool of assets as a sub-adviser to another institution's mutual fund, and that Federated generally performs significant additional services and assumes substantially greater risk in managing the Fund and other Federated funds than in its role as sub-adviser to an unaffiliated third-party mutual fund. The CCO did not consider the fees for providing advisory services to Comparable Funds/Accounts to be determinative in judging the appropriateness of the Federated funds' advisory fees.
Following such evaluation, and full deliberations, the Board concluded that the fees and expenses of the Fund are reasonable and supported renewal of the Fund's investment advisory contract.
The Board considered the nature, extent and quality of the services provided to the Fund by the Adviser and the resources of the Adviser and its affiliates dedicated to the Fund. In this regard, the Board evaluated, among other things, the Adviser's personnel, experience, track record, overall reputation and willingness to invest in personnel and infrastructure that benefit the Fund. In addition, the Board reviewed the qualifications, backgrounds and responsibilities of the portfolio management team primarily responsible for the day-to-day management of the Fund and the Adviser's ability and experience in attracting and retaining qualified personnel to service the Fund. The Board noted the compliance program of the Adviser and the compliance-related resources provided to the Fund by the Adviser, including the Adviser's commitment to respond to rulemaking initiatives of the SEC. The Fund's ability to deliver competitive performance when compared to its Peer Group was also deemed to
Annual Shareholder Report
be relevant by the Board as a useful indicator of how the Adviser is executing the Fund's investment program. The Adviser's ability to execute this program was one of the Board's considerations in reaching a conclusion that the nature, extent and quality of the Adviser's investment management services warrant the continuation of the investment advisory contract.
In evaluating the Fund's investment performance, the Board considered performance results in light of the Fund's investment objective, strategies and risks, as disclosed in the Fund's prospectus. The Board considered detailed investment reports on the Fund's performance that were provided to the Board throughout the year and in connection with the May meetings. The CCO also reviewed information regarding the performance of other mutual funds in the Peer Group, noting the CCO's view that comparisons to fund peer groups may be helpful, though not conclusive, in evaluating the performance of the Adviser in managing the Fund. The Board considered, in evaluating such comparisons, that in some cases individual funds may exhibit significant and unique differences in their objectives and management techniques when compared to other funds within a Peer Group.
For the one-year, three-year and five-year periods covered by the CCO Fee Evaluation Report, the Fund's performance was above the median of the relevant Peer Group.
Following such evaluation, and full deliberations, the Board concluded that the performance of the Fund supported renewal of the Fund's investment advisory contract.
The Board also received financial information about Federated, including information regarding the compensation and ancillary (or “fall-out”) benefits Federated derived from its relationships with the Federated funds. This information covered not only the fees under the investment advisory contracts, but also fees received by Federated's subsidiaries for providing other services to the Federated funds under separate contracts (e.g., for serving as the Federated funds' administrator and distributor). In this regard, the Board considered that certain Federated subsidiaries provide distribution and shareholder services to the Federated funds, for which they may be compensated through distribution and servicing fees paid pursuant to Rule 12b-1 plans or otherwise. The information also detailed any indirect benefit Federated may derive from its receipt of research services from brokers who execute Federated fund trades. In addition, the Board considered the fact that, in order for a Federated fund to be competitive in the marketplace, the Adviser and its affiliates frequently waived fees and/or reimbursed expenses and have disclosed to Federated fund investors and/or indicated to the Board their intention to do so in the future. Moreover, the Board receives regular reporting as to the institution, adjustment or elimination of these voluntary waivers. The Board considered Federated's previous reductions in contractual management fees to certain Federated funds in response to the CCO's recommendations.
Annual Shareholder Report
Federated furnished information, requested by the CCO, that reported revenues on a fund-by-fund basis and made estimates of the allocation of expenses on a fund-by-fund basis, using allocation methodologies specified by the CCO. The CCO noted that, while these cost allocation reports apply consistent allocation processes, the inherent difficulties in allocating costs continues to cause the CCO to question the precision of the process and to conclude that such reports may be unreliable, since a single change in an allocation estimate may dramatically alter the resulting estimate of cost and/or profitability of a Federated fund and may produce unintended consequences. The allocation information, including the CCO's view that fund-by-fund estimations may be unreliable, was considered in the evaluation by the Board.
The Board and the CCO also reviewed information compiled by Federated comparing its profitability information to other publicly held fund management companies, including information regarding profitability trends over time. In this regard, the CCO concluded that Federated's profit margins did not appear to be excessive. The CCO also noted that Federated appeared financially sound, with the resources necessary to fulfill its obligations under its contracts with the Fund.
The CCO Fee Evaluation Report also discussed the notion of possible realization of “economies of scale” as a fund grows larger. In this regard, the Board considered that the Adviser has made significant and long-term investments in areas that support all of the Federated funds, such as personnel and processes for the portfolio management, shareholder services, compliance, internal audit and risk management functions, as well as systems technology (including technology relating to cybersecurity) and that the benefits of these efforts (as well as any economies of scale, should they exist) were likely to be shared with the Federated fund family as a whole. The Board noted that the Adviser's investments in these areas are extensive. In addition, the Board considered that the Adviser and its affiliates have frequently waived fees and/or reimbursed expenses and that this has allowed fund shareholders to share potential economies of scale with shareholders. The Board also considered that such waivers and reimbursements can provide protection from an increase in expenses if a Federated fund's assets decline. Federated, as it does throughout the year, and specifically in connection with the Board's review of the advisory and subadvisory contracts, furnished information relative to revenue sharing or adviser-paid fees. Federated and the CCO noted that this information should be viewed to determine if there was an incentive to either not apply breakpoints, or to apply breakpoints at higher levels, and should not be viewed to determine the appropriateness of advisory fees because it would represent marketing and distribution expenses. The Board also noted the absence of any applicable
Annual Shareholder Report
regulatory or industry guidelines on this subject, which (as discussed in the CCO Fee Evaluation Report) is compounded by the lack of any common industry practice or general pattern with respect to structuring fund advisory fees with “breakpoints” that serve to reduce the fee as a fund attains a certain size.
The CCO stated that his observations and the information accompanying the CCO Fee Evaluation Report supported a finding by the Board that the management fee for the Fund was reasonable. Under these circumstances, no changes were recommended to, and no objection was raised to the continuation of, the Fund's investment advisory contract. The CCO also recognized that the Board's evaluation of the Federated funds' advisory and subadvisory arrangements is a continuing and on-going process that is informed by the information that the Board requests and receives from management throughout the course of the year and, in this regard, the CCO noted certain items for future reporting to the Board or further consideration by management as the Board continues its on-going oversight of the Federated funds.
In its decision to continue an existing investment advisory contract, the Board was mindful of the potential disruptions of the Fund's operations and various risks, uncertainties and other effects that could occur as a result of a decision to terminate or not renew an investment advisory contract. In particular, the Board recognized that many shareholders have invested in the Fund on the strength of the Adviser's industry standing and reputation and with the expectation that the Adviser will have a continuing role in providing advisory services to the Fund. Thus, the Board's approval of the investment advisory contract reflected the fact that it is the shareholders who have effectively selected the Adviser by virtue of having invested in the Fund. The Board concluded that, in light of the factors summarized above, including the nature, quality and scope of the services provided to the Fund by the Adviser and its affiliates, continuation of the investment advisory contract was appropriate.
The Board based its decision to approve the investment advisory contract on the totality of the circumstances and relevant factors and with a view to past and future long-term considerations. Not all of the factors and considerations identified above were necessarily relevant to the Fund, nor did the Board consider any one of them to be determinative. With respect to the factors that were relevant, the Board's decision to approve the continuation of the contract reflects its view that Federated's performance and actions provided a satisfactory basis to support the decision to continue the existing arrangement.
Annual Shareholder Report
Voting Proxies on Fund Portfolio Securities
A description of the policies and procedures that the Fund uses to determine how to vote proxies, if any, relating to securities held in the Fund's portfolio is available, without charge and upon request, by calling 1-800-341-7400. A report on “Form N-PX” of how the Fund voted any such proxies during the most recent 12-month period ended June 30 is available via the Proxy Voting Record (Form N-PX) link associated with the Fund and share class name at www.FederatedInvestors.com/FundInformation. Form N-PX filings are also available at the SEC's website at www.sec.gov.
Quarterly Portfolio Schedule
Each fiscal quarter, the Fund will file with the SEC a complete schedule of its monthly portfolio holdings on “Form N-PORT.” The Fund's holdings as of the end of the third month of every fiscal quarter, as reported on Form N-PORT, will be publicly available on the SEC's website at www.sec.gov within 60 days of the end of the fiscal quarter upon filing. You may also access this information via the link to the Fund and share class name at www.FederatedInvestors.com.
Annual Shareholder Report
Mutual funds are not bank deposits or obligations, are not guaranteed by any bank and are not insured or guaranteed by the U.S. government, the Federal Deposit Insurance Corporation, the Federal Reserve Board or any other government agency. Investment in mutual funds involves investment risk, including the possible loss of principal.
This Report is authorized for distribution to prospective investors only when preceded or accompanied by the Fund's Prospectus, which contains facts concerning its objective and policies, management fees, expenses and other information.
Federated Fund for U.S. Government Securities
Federated Investors Funds
4000 Ericsson Drive
Warrendale, PA 15086-7561
Contact us at FederatedInvestors.com
or call 1-800-341-7400.
Federated Securities Corp., Distributor
CUSIP 31420C704
CUSIP 31420C803
CUSIP 31420C886
28390 (5/19)
Federated is a registered trademark of Federated Investors, Inc.
2019 ©Federated Investors, Inc.
(a) As of the end of the period covered by this report, the registrant has adopted a code of ethics (the "Section 406 Standards for Investment Companies - Ethical Standards for Principal Executive and Financial Officers") that applies to the registrant's Principal Executive Officer and Principal Financial Officer; the registrant's Principal Financial Officer also serves as the Principal Accounting Officer.
(c) There was no amendment to the registrant’s code of ethics described in Item 2(a) above during the period covered by the report.
(d) There was no waiver granted, either actual or implicit, from a provision to the registrant’s code of ethics described in Item 2(a) above during the period covered by the report.
(e) Not Applicable
(f)(3) The registrant hereby undertakes to provide any person, without charge, upon request, a copy of the code of ethics. To request a copy of the code of ethics, contact the registrant at 1-800-341-7400, and ask for a copy of the Section 406 Standards for Investment Companies - Ethical Standards for Principal Executive and Financial Officers.
Item 3. Audit Committee Financial Expert
The registrant's Board has determined that each of the following members of the Board's Audit Committee is an “audit committee financial expert,” and is "independent," for purposes of this Item: John T. Collins, G. Thomas Hough and Thomas M. O'Neill.
| Item 4. | Principal Accountant Fees and Services |
(a) Audit Fees billed to the registrant for the two most recent fiscal years:
Fiscal year ended 2019 - $226,640
Fiscal year ended 2018 - $215,230
(b) Audit-Related Fees billed to the registrant for the two most recent fiscal years:
Fiscal year ended 2019 - $0
Fiscal year ended 2018 - $12,471
Fiscal year ended 2018- Audit consent fees for N-1A filings.
Amount requiring approval of the registrant’s audit committee pursuant to paragraph (c)(7)(ii) of Rule 2-01 of Regulation S-X, $0 and $3,904 respectively. Fiscal year ended 2018- Audit consent for N-14 filing.
(c) Tax Fees billed to the registrant for the two most recent fiscal years:
Fiscal year ended 2019 - $0
Fiscal year ended 2018 - $0
Amount requiring approval of the registrant’s audit committee pursuant to paragraph (c)(7)(ii) of Rule 2-01 of Regulation S-X, $0 and $0 respectively.
(d) All Other Fees billed to the registrant for the two most recent fiscal years:
Fiscal year ended 2019 - $0
Fiscal year ended 2018 - $0
Amount requiring approval of the registrant’s audit committee pursuant to paragraph (c)(7)(ii) of Rule 2-01 of Regulation S-X, $66,684 and $0 respectively. Fiscal year ended 2019- Service fee for analysis of potential Passive Foreign Investment Company holdings.
(e)(1) Audit Committee Policies regarding Pre-approval of Services.
The Audit Committee is required to pre-approve audit and non-audit services performed by the independent auditor in order to assure that the provision of such services do not impair the auditor’s independence. Unless a type of service to be provided by the independent auditor has received general pre-approval, it will require specific pre-approval by the Audit Committee. Any proposed services exceeding pre-approved cost levels will require specific pre-approval by the Audit Committee.
Certain services have the general pre-approval of the Audit Committee. The term of the general pre-approval is 12 months from the date of pre-approval, unless the Audit Committee specifically provides for a different period. The Audit Committee will annually review the services that may be provided by the independent auditor without obtaining specific pre-approval from the Audit Committee and may grant general pre-approval for such services. The Audit Committee will revise the list of general pre-approved services from time to time, based on subsequent determinations. The Audit Committee will not delegate its responsibilities to pre-approve services performed by the independent auditor to management.
The Audit Committee has delegated pre-approval authority to its Chairman. The Chairman will report any pre-approval decisions to the Audit Committee at its next scheduled meeting. The Committee will designate another member with such pre-approval authority when the Chairman is unavailable.
AUDIT SERVICES
The annual Audit services engagement terms and fees will be subject to the specific pre-approval of the Audit Committee. The Audit Committee must approve any changes in terms, conditions and fees resulting from changes in audit scope, registered investment company (RIC) structure or other matters.
In addition to the annual Audit services engagement specifically approved by the Audit Committee, the Audit Committee may grant general pre-approval for other Audit Services, which are those services that only the independent auditor reasonably can provide. The Audit Committee has pre-approved certain Audit services, all other Audit services must be specifically pre-approved by the Audit Committee.
AUDIT-RELATED SERVICES
Audit-related services are assurance and related services that are reasonably related to the performance of the audit or review of the Company’s financial statements or that are traditionally performed by the independent auditor. The Audit Committee believes that the provision of Audit-related services does not impair the independence of the auditor, and has pre-approved certain Audit-related services, all other Audit-related services must be specifically pre-approved by the Audit Committee.
TAX SERVICES
The Audit Committee believes that the independent auditor can provide Tax services to the Company such as tax compliance, tax planning and tax advice without impairing the auditor’s independence. However, the Audit Committee will not permit the retention of the independent auditor in connection with a transaction initially recommended by the independent auditor, the purpose of which may be tax avoidance and the tax treatment of which may not be supported in the Internal Revenue Code and related regulations. The Audit Committee has pre-approved certain Tax services, all Tax services involving large and complex transactions must be specifically pre-approved by the Audit Committee.
ALL OTHER SERVICES
With respect to the provision of services other than audit, review or attest services the pre-approval requirement is waived if:
| (1) | The aggregate amount of all such services provided constitutes no more than five percent of the total amount of revenues paid by the registrant, the registrant’s adviser (not including any sub-adviser whose role is primarily portfolio management and is subcontracted with or overseen by another investment adviser), and any entity controlling, controlled by, or under common control with the investment adviser that provides ongoing services to the registrant to its accountant during the fiscal year in which the services are provided; |
| (2) | Such services were not recognized by the registrant, the registrant’s adviser (not including any sub-adviser whose role is primarily portfolio management and is subcontracted with or overseen by another investment adviser), and any entity controlling, controlled by, or under common control with the investment adviser that provides ongoing services to the registrant at the time of the engagement to be non-audit services; and |
| (3) | Such services are promptly brought to the attention of the Audit Committee of the issuer and approved prior to the completion of the audit by the Audit Committee or by one or more members of the Audit Committee who are members of the board of directors to whom authority to grant such approvals has been delegated by the Audit Committee. |
The Audit Committee may grant general pre-approval to those permissible non-audit services classified as All Other services that it believes are routine and recurring services, and would not impair the independence of the auditor.
The SEC’s rules and relevant guidance should be consulted to determine the precise definitions of prohibited non-audit services and the applicability of exceptions to certain of the prohibitions.
PRE-APPROVAL FEE LEVELS
Pre-approval fee levels for all services to be provided by the independent auditor will be established annually by the Audit Committee. Any proposed services exceeding these levels will require specific pre-approval by the Audit Committee.
PROCEDURES
Requests or applications to provide services that require specific approval by the Audit Committee will be submitted to the Audit Committee by both the independent auditor and the Principal Accounting Officer and/or Internal Auditor, and must include a joint statement as to whether, in their view, the request or application is consistent with the SEC’s rules on auditor independence.
(e)(2) Percentage of services identified in items 4(b) through 4(d) that were approved by the registrants audit committee pursuant to paragraph (c)(7)(i)(C) of Rule 2-01 of Regulation S-X:
4(b)
Fiscal year ended 2019 – 0%
Fiscal year ended 2018 - 0%
Percentage of services provided to the registrants investment adviser and any entity controlling, controlled by, or under common control with the investment adviser that provides ongoing services to the registrant that were approved by the registrants audit committee pursuant to paragraph (c)(7)(i)(C) of Rule 2-01 of Regulation S-X, 0% and 0% respectively.
4(c)
Fiscal year ended 2019 – 0%
Fiscal year ended 2018 – 0%
Percentage of services provided to the registrants investment adviser and any entity controlling, controlled by, or under common control with the investment adviser that provides ongoing services to the registrant that were approved by the registrants audit committee pursuant to paragraph (c)(7)(i)(C) of Rule 2-01 of Regulation S-X, 0% and 0% respectively.
4(d)
Fiscal year ended 2019 – 0%
Fiscal year ended 2018 – 0%
Percentage of services provided to the registrants investment adviser and any entity controlling, controlled by, or under common control with the investment adviser that provides ongoing services to the registrant that were approved by the registrants audit committee pursuant to paragraph (c)(7)(i)(C) of Rule 2-01 of Regulation S-X, 0% and 0% respectively.
| (g) | Non-Audit Fees billed to the registrant, the registrant’s investment adviser, and certain entities controlling, controlled by or under common control with the investment adviser: |
Fiscal year ended 2019 - $1,153,044
Fiscal year ended 2018 - $904,296
| (h) | The registrant’s Audit Committee has considered that the provision of non-audit services that were rendered to the registrant’s adviser (not including any sub-adviser whose role is primarily portfolio management and is subcontracted with or overseen by another investment adviser), and any entity controlling, controlled by, or under common control with the investment adviser that provides ongoing services to the registrant that were not pre-approved pursuant to paragraph (c)(7)(ii) of Rule 2-01 of Regulation S-X is compatible with maintaining the principal accountant’s independence. |
The registrant’s management and Audit Committee continue to believe that the registrant’s registered public accounting firms, Ernst & Young LLP (“EY”) and KPMG LLP (“KPMG”) (as applicable, “EY/KPMG”), have the ability to exercise objective and impartial judgment on all issues encompassed within their audit services. EY/KPMG is required to make a determination that it satisfies certain independence requirements under the federal securities laws. Like other registrants, there is a risk that activities or relationships of EY/KPMG, or its partners or employees, can prevent a determination from being made that it satisfies such independence requirements with respect to the registrant, which could render it ineligible to serve as the registrant’s independent public accountant.
In their respective required communications to the Audit Committee of the registrant’s Board, EY/KPMG informed the Audit Committee that EY/KPMG and/or covered person professionals within EY/KPMG maintain lending relationships with certain owners of greater than 10% of the shares of certain investment companies within the “investment company complex” as defined under Rule 2-01(f)(14) of Regulation S-X, which are affiliates of the registrant. EY/KPMG has advised the Audit Committee that these lending relationships implicate Rule 2-01(c)(1)(ii)(A) of Regulation S-X (referred to as the “Loan Rule”). The Loan Rule prohibits an independent public accountant, or covered person professionals at such firm, from having a financial relationship (such as a loan) with a lender that is a record or beneficial owner of more than 10% of an audit client’s equity securities. For purposes of the Loan Rule, audit clients include the registrant, as well as all registered investment companies advised by advisory subsidiaries of Federated Investors, Inc., the Adviser (for which EY serves as independent public accountant), and their respective affiliates (collectively, the “Federated Fund Complex”).
EY/KPMG informed the Audit Committee that EY/KPMG believes that these lending relationships described above do not and will not impair EY/KPMG’s ability to exercise objective and impartial judgment in connection with financial statement audits of their respective funds of the registrant and a reasonable investor with knowledge of all relevant facts and circumstances would conclude that EY/KPMG has been and is capable of objective and impartial judgment on all issues encompassed within EY/KPMG’s audits.
On June 20, 2016, the Division of Investment Management of the Securities and Exchange Commission (“SEC”) issued a no-action letter to another mutual fund complex (see Fidelity Management & Research Company et al., No-Action Letter) related to similar Loan Rule matters as those described above (the “Letter”). In the Letter, the SEC Staff confirmed that it would not recommend enforcement action against an investment company that relied on the audit services performed by an independent public accountant where the Loan Rule was implicated in certain specified circumstances provided that: (1) the auditor has complied with PCAOB Rule 3526(b)(1) and 3526(b)(2); (2) the Loan Rule is implicated because of lending relationships; and (3) notwithstanding such lending relationships that implicate the Loan Rule, the auditor has concluded that it is objective and impartial with respect to the issues encompassed within its engagement as auditor of the funds. The circumstances described in the Letter are substantially similar to the circumstances that implicated the Loan Rule with respect to EY/KPMG and the registrant. On September 22, 2017, the SEC extended the expiration of the Letter until the effectiveness of any amendments to the Loan Rule designed to address the concerns in the Letter. On May 2, 2018, the SEC proposed amendments to the Loan Rule, which, if adopted as proposed, would refocus the analysis that must be conducted to determine whether an auditor is independent when the auditor has a lending relationship with certain shareholders of an audit client at any time during an audit or professional engagement period.
Additionally, on July 18, 2018, EY informed the registrant that Rule 2-01(c)(1)(i)(A) of Regulation S-X (“Investment Rule”) had also been implicated since July 2, 2018. The Investment Rule prohibits public accounting firms, or covered person professionals and their immediate family members, from having certain direct financial investments in their audit clients and affiliated entities. EY informed the registrant that a pension trust of a non-US affiliated entity of EY had previously made, and as of July 18, 2018 maintained, an investment in a fund (“Hermes Fund”) managed by Hermes Alternative Investment Management Limited (“HAIML”), which is a wholly owned subsidiary of Hermes Fund Managers Limited (“HFML”). The pension trust’s investment in the Hermes Fund involved the Investment Rule because an indirect wholly owned subsidiary of Federated Investors, Inc. (an affiliate of the registrant’s adviser), acquired a 60% majority interest in HFML on July 2, 2018, effective July 1, 2018 (“Hermes Acquisition”). The pension trust first invested in the Hermes Fund in 2007, well prior to the Hermes Acquisition. The pension trust’s investment represented less than 3.3% of the Hermes Fund’s assets as of July 18, 2018. EY subsequently informed the registrant that EY’s affiliated entity’s pension trust had submitted an irrevocable redemption notice to redeem its investment in the Hermes Fund. Pursuant to the redemption terms of the Hermes Fund, the pension trust’s redemption would not be effected until December 26, 2018 at the earliest. The redemption notice could not be revoked by the pension trust. The redemption notice would only be revoked by HAIML, as the adviser for Hermes Fund, if, and to the extent, the pension trust successfully sold its interest in the Hermes Fund in a secondary market transaction. EY also informed the registrant that the pension trust simultaneously submitted a request to HAIML to conduct a secondary market auction for the pension trust’s interests in the Hermes Fund. In addition, the only voting rights shareholders of the Hermes Fund had under the Hermes Fund’s governing documents relate to key appointments, including the election of the non-executive members of the Hermes Fund’s committee, the appointment of the Hermes Fund’s trustee and the adoption of the Hermes Fund’s financial statements. The next meeting of the Hermes Fund at which shareholders could vote on the election of members to the Hermes Fund’s committee was not until June 2019, and the size of the pension trust’s investment in the Hermes Fund would not allow it to unilaterally elect a committee member or the trustee. EY does not audit the Hermes Fund and the Hermes Fund’s assets and operations are not consolidated in the registrant’s financial statements that are subject to audit by EY. Finally, no member of EY’s audit team that provides audit services to the registrant was a beneficiary of EY’s affiliated entity’s pension trust. Management reviewed this matter with the registrant’s Audit Committee, and, based on that review, as well as a letter from EY to the registrant dated July 26, 2018, in which EY indicated that it had determined that this matter does not impair EY’s ability to exercise objective and impartial judgment in connection with the audit of the financial statements for the registrant and the belief that a reasonable investor with knowledge of all relevant facts and circumstances would conclude that EY has been and is capable of exercising objective and impartial judgment on all issues encompassed within EY’s audit, the registrant’s management and Audit Committee made a determination that such matter does not impair EY’s ability to exercise objective and impartial judgment in connection with the audit of the financial statements for the registrant. On August 29, 2018, EY informed the registrant that EY’s affiliated entity’s pension trust sold its entire interest in the Hermes Fund, effective as of August 28, 2018.
If it were to be determined that, with respect to the Loan Rule, the relief available under the Letter was improperly relied upon, or that the independence requirements under the federal securities laws were not complied with regarding the registrant, for certain periods, and/or given the implication of the Investment Rule for certain periods, any of the registrant’s filings with the SEC which contain financial statements of the registrant for such periods may be determined not to be consistent with or comply with applicable federal securities laws, the registrant’s ability to offer shares under its current registration statement may be impacted, andcertain financial reporting and/or other covenants with, and representations and warranties to, the registrant’s lender under its committed line of credit may be impacted. Such eventscould have a material adverse effect on the registrant and the Federated Fund Complex.
| Item 5. | Audit Committee of Listed Registrants |
Not Applicable
| Item 6. | Schedule of Investments |
(a) The registrant’s Schedule of Investments is included as part of the Report to Stockholders filed under Item 1 of this form.
(b) Not Applicable; Fund had no divestments during the reporting period covered since the previous Form N-CSR filing.
| Item 7. | Disclosure of Proxy Voting Policies and Procedures for Closed-End Management Investment Companies |
Not Applicable
| Item 8. | Portfolio Managers of Closed-End Management Investment Companies |
Not Applicable
| Item 9. | Purchases of Equity Securities by Closed-End Management Investment Company and Affiliated Purchasers |
Not Applicable
| Item 10. | Submission of Matters to a Vote of Security Holders |
No Changes to Report
| Item 11. | Controls and Procedures |
(a) The registrant’s President and Treasurer have concluded that the
registrant’s disclosure controls and procedures (as defined in rule 30a-3(c) under the Act) are effective in design and operation and are sufficient to form the basis of the certifications required by Rule 30a-(2) under the Act, based on their evaluation of these disclosure controls and procedures within 90 days of the filing date of this report on Form N-CSR.
(b) There were no changes in the registrant’s internal control over financial reporting (as defined in rule 30a-3(d) under the Act) during the second fiscal quarter of the period covered by this report that have materially affected, or are reasonably likely to materially affect, the registrant’s internal control over financial reporting.
| Item 12. | Disclosure of Securities Lending Activities for Closed-End Management Investment Companies |
Not Applicable
(a)(1) Code of Ethics- Not Applicable to this Report.
(a)(2) Certifications of Principal Executive Officer and Principal Financial Officer.
(a)(3) Not Applicable.
(b) Certifications pursuant to 18 U.S.C. Section 1350.
SIGNATURES
Pursuant to the requirements of the Securities Exchange Act of 1934 and the Investment Company Act of 1940, the registrant has duly caused this report to be signed on its behalf by the undersigned, thereunto duly authorized.
RegistrantFederated Income Securities Trust
By/S/ Lori A. Hensler
Lori A. Hensler, Principal Financial Officer
DateMay 22, 2019
Pursuant to the requirements of the Securities Exchange Act of 1934 and the Investment Company Act of 1940, this report has been signed below by the following persons on behalf of the registrant and in the capacities and on the dates indicated.
By/S/ J. Christopher Donahue
J. Christopher Donahue, Principal Executive Officer
DateMay 22, 2019
By/S/ Lori A. Hensler
Lori A. Hensler, Principal Financial Officer
DateMay 22, 2019