United States
Securities and Exchange Commission
Washington, D.C. 20549
Form N-CSR
Certified Shareholder Report of Registered Management Investment Companies
811-4577
(Investment Company Act File Number)
Federated Hermes Income Securities Trust
_______________________________________________________________
(Exact Name of Registrant as Specified in Charter)
Federated Hermes Funds
4000 Ericsson Drive
Warrendale, Pennsylvania 15086-7561
(Address of Principal Executive Offices)
(412) 288-1900
(Registrant's Telephone Number)
Peter J. Germain, Esquire
1001 Liberty Avenue
Pittsburgh, Pennsylvania 15222-3779
(Name and Address of Agent for Service)
(Notices should be sent to the Agent for Service)
Date of Fiscal Year End: 10/31/20
Date of Reporting Period: 10/31/20
| Item 1. | Reports to Stockholders |
Annual Shareholder Report
October 31, 2020
Federated Hermes Muni and Stock Advantage Fund(formerly, Federated Muni and Stock Advantage Fund)
Fund Established 2003
A Portfolio of Federated Hermes Income Securities Trust(formerly, Federated Income Securities Trust)
IMPORTANT NOTICE REGARDING REPORT DELIVERY
Beginning on January 1, 2021, as permitted by regulations adopted by the Securities and Exchange Commission, paper copies of the Fund’s shareholder reports like this one will no longer be sent by mail, unless you specifically request paper copies of the reports from the Fund or from your financial intermediary, such as a broker-dealer or bank. Instead, the reports will be made available on a website, and you will be notified by mail each time a report is posted and provided with a website link to access the report.
If you already elected to receive shareholder reports electronically, you will not be affected by this change and you need not take any action. You may elect to receive shareholder reports and other communications from the Fund or your financial intermediary electronically by contacting your financial intermediary (such as a broker-dealer or bank); other shareholders may call the Fund at 1-800-341-7400, Option 4.
You may elect to receive all future reports in paper free of charge. You can inform the Fund or your financial intermediary that you wish to continue receiving paper copies of your shareholder reports by contacting your financial intermediary (such as a broker-dealer or bank); other shareholders may call the Fund at 1-800-341-7400, Option 4. Your election to receive reports in paper will apply to all funds held with the Fund complex or your financial intermediary.
Not FDIC Insured ▪ May Lose Value ▪ No Bank Guarantee
J. Christopher
Donahue
President
Federated Hermes Muni and Stock Advantage Fund
Letter from the President
Dear Valued Shareholder,
I am pleased to present the Annual Shareholder Report for your fund covering the period from November 1, 2019 through October 31, 2020.
The Fund’s primary investment objective is to provide tax-advantaged income with a secondary objective of capital appreciation.
As we all confront the unprecedented effects of the coronavirus and the challenges it presents to our families, communities, businesses and the financial markets, I want you to know that everyone at Federated Hermes is dedicated to helping you successfully navigate the markets ahead. You can count on us for the insights, investment management knowledge and client service that you have come to expect. Please refer to our website, FederatedInvestors.com, for timely updates on this and other economic and market matters.
Thank you for investing with us. I hope you find this information useful and look forward to keeping you informed.
Sincerely, 
J. Christopher Donahue, President
Management’s Discussion of Fund Performance (unaudited)
The total return of Federated Hermes Muni and Stock Advantage Fund (the “Fund”), based on net asset value for the 12-month reporting period ended October 31, 2020, was 2.73% for Class A Shares, 1.95% for Class B Shares, 1.96% for Class C Shares, 2.73% for Class F Shares and 2.99% for Institutional Shares. The 2.99% total return for the Institutional Shares for the reporting period consisted of 0.31% in appreciation of net asset value of the Fund’s shares and 2.68% in reinvested dividends. The total return of the Fund’s custom blended index (60% S&P Municipal Bond Index (S&P Muni Index) and 40% Russell 1000® Value Index (R1000V))1 (“Blended Index”) was -0.38% for the same period. The total return of the Morningstar Allocation Funds Average–30% to 50% Equity (M30-50),2 a peer group average for the Fund, was 2.76% during the same period. The Fund’s and the M30-50’s total returns for the most recently completed fiscal year reflected actual cash flows, transaction costs and other expenses, which were not reflected in the total return of the R1000V or S&P Muni Index.
During the reporting period, the Fund’s investment strategy focused on income earning investments, specifically high-quality, qualified dividend income stocks3 and intermediate- and long-term, tax-exempt securities4 to achieve the Fund’s primary tax-advantaged income objective and secondary capital appreciation objective. The most significant factors that affected the Fund’s performance during the reporting period were: (a) the Fund’s allocation between stocks and tax-exempt securities; (b) the selection of equity securities of similar issuers (referred to as sectors) and the selection of individual equity securities; (c) the selection of tax-exempt municipal securities with different maturities (expressed by a yield curve showing the relative yield of similar securities with different maturities), different credit characteristics or different structural attributes; and (d) the effective duration5 of the Fund’s tax-exempt securities portfolio.
The following discussion will focus on the performance of the Fund’s Institutional Shares relative to the Blended Index.
Annual Shareholder Report
MARKET OVERVIEW
After a strong end to 2019, the outbreak and spread of the Covid-19 virus in the first quarter 2020 significantly disrupted an otherwise healthy U.S. economy, resulting in significant market volatility. Fear and uncertainty in the early days of the outbreak drove investor sentiment to the relative safety of larger, high quality companies. For the reporting period, stocks of larger companies and growth companies fared better than value stocks, with modest gains for broad U.S. equity indices like the S&P 500 Index (S&P 500)6 and declines for the R1000V. The stock market underwent a significant selloff during the first quarter of 2020 due to the coronavirus pandemic, and value stocks were hit particularly hard. The Federal Reserve (the “Fed”) lowered interest rates and provided stimulus packages that helped cushion the downturn on businesses and individuals. The R1000V produced positive performance in the second and third quarters but considerably lagged that of the broad equity market and other asset classes, including large growth, as both fiscal and monetary stimulus poured into the economy and signs of the economy reopening emerged.
The S&P 500 returned 9.71%, and the R1000V returned -7.57% for the reporting period. In general, larger market capitalization stocks outperformed smaller market capitalization stocks, and growth stocks outperformed value stocks. Strong performance in Information Technology, Consumer Discretionary and Communications Services dominated relatively weaker performance in Energy, Financials,and Real Estate across the S&P 500 sectors during the reporting period.
U.S. Treasury yields declined sharply as the Coronavirus pandemic and efforts to contain the contagious disease produced a record decline in global economic activity during the second quarter of calendar year 2020. The Fed rapidly reduced its target short-term interest rates to near zero and instituted large-scale purchases of U.S. Treasures in order to support market functioning and counter the economic shock as unemployment spiked to the highest level since the Great Depression and inflation declined. Treasury yields hit record lows, with the U.S. 10-year yield at 0.51% in August 2020, before rising somewhat as economic growth staged a strong partial recovery later in the period. Overall, yields on 2-year, 10-year and 30-year U.S. Treasury securities declined 137 basis points (bp), 82 bp and 52 bp, respectively, over the reporting period.
Annual Shareholder Report
The onset of the global pandemic prompted a wide-spread flight to cash and safety, resulting in record-sized redemptions from municipal funds and heavy selling of municipal bonds as credit fears surged. Municipal market yields spiked in late March 2020, with the 10-year “AAA” muni yield rising about 200 basis points from March 9 to March 23, and credit spreads within the municipal market surged higher. Bold monetary and market actions from the Fed and fiscal policy actions from the U.S. government helped to stabilize strained financial markets, prompting municipal yields to rapidly decline and the widening of municipal credit spreads to partially reverse. By period-end, high-quality municipal yields had more than reversed all of the surge seen in the second quarter of 2020, with 2-year, 10-year and 30-year Municipal Market Data (MMD) “AAA” tax exempt yields declining 90 bp, 56 bp and 35 bp, respectively, over the period. The S&P Muni Index returned 3.55% for the reporting period.
PORTFOLIO ALLOCATION
During the reporting period, the Fund’s portfolio was allocated between qualified dividend income stocks and tax-exempt securities to reflect the Fund’s primary investment objective of tax-advantaged income8 and its secondary objective of capital appreciation. The factors used in the allocation decision during the reporting period were: (1) maintenance of at least 50% exposure to tax-exempt municipal securities in order to comply with Internal Revenue Service rules governing the payment of tax-exempt dividends from the tax-exempt securities portion of the Fund’s portfolio; (2) the Fund’s ability to pay and maintain an attractive level of dividends; and (3) the expected relative total return of tax-exempt securities and stocks. The allocation at the end of the reporting period was 57.9% tax-exempt municipal bonds, 41% stocks and 1.1% tax-exempt cash equivalents. During the reporting period, the Fund used various types of derivative instruments9, including equity futures, to protect the Fund from volatile market conditions. Equity futures detracted -0.03% from and equity options added 0.02% to the Fund’s performance for the reporting period. The Fund’s overweight to equities relative to the R1000V benchmark weight detracted from Fund performance during the reporting period.
SECTOR AND SECURITY SELECTION–EQUITY STOCKS
The return of the equity component of the Fund’s portfolio outperformed the R1000V during the reporting period. Stock selection in Information Technology and Consumer Discretionary were the main drivers of the outperformance. Within Information Technology, the Fund’s stock selection within Hardware and Equipment was the largest contributor to performance. Within Consumer Discretionary, security selection within Retailing was the largest contributor during the reporting period.
Annual Shareholder Report
Overall, during the reporting period, both sector allocation and stock selection contributed to the Fund’s outperformance relative to the R1000V. An overweight position in the Information Technology sector and an underweight position in the Financials sector contributed to the Fund’s performance during the reporting period. In addition, a structural sector underweight in the Real Estate sector as dividends were not qualified, was a positive contributor to performance. As noted above, the Fund had positive stock selection in the Information Technology and Consumer Discretionary sectors and negative stock selection in the Materials and Industrials sectors.
SECURITY SELECTION–TAX-EXEMPT MUNICIPAL BONDS
During the reporting period, the bond portfolio manager’s strategies were to: (1) invest in tax-exempt municipal bonds whose interest is not subject to (or not a specific preference item for purposes of) the federal alternative minimum tax for individuals; (2) maintain exposure to intermediate and long-term tax-exempt municipal bonds to capture the income advantages of such securities relative to tax-exempt municipal bonds with shorter maturities; (3) maintain a significant weighting in low investment-grade and noninvestment-grade bonds10 (or equivalents), given their income advantages; and (4) adjust portfolio duration (or sensitivity to interest rates) and yield curve exposures in an effort to enhance bond portfolio total return as market interest rates fluctuate11.
The Fund’s tax-exempt municipal bond portfolio underperformed the return of the S&P Muni Index. The bond portfolio’s allocation across the credit spectrum, with an overweight to mid- and low-quality and underweight to high-quality securities, detracted from relative performance, as did the allocation of holdings across municipal sectors. Security selection hurt relative muni performance. In contrast, duration management contributed favorably to relative performance.
DURATION–TAX-EXEMPT MUNICIPAL BONDS
During the reporting period, the duration of the Fund’s tax-exempt municipal bond portfolio averaged about 5.1 years, which was longer than the duration of the S&P Muni Index, which averaged about 4.7 years. This longer duration reflected the Fund’s focus on intermediate and long-term securities and Fund management’s tactical extension of duration after the rapid increase in municipal yields during the second quarter of 2020.
1
Please see the footnotes to the line graphs below for definitions of, and further information about, the S&P Muni Index and R1000V. The total return for the 12-month reporting period for the Fund’s current broad-based securities market indices, the S&P Muni Index and the R1000V, were 3.55% and -7.57%, respectively.
2
Please see the footnotes to the line graphs below for definitions of, and further information about, the M30-50.
3
There are no guarantees that dividend paying stocks will continue to pay dividends.
Annual Shareholder Report
4
The Fund is not entirely a “tax-exempt” or “municipal” fund. Although a portion of the dividends paid by the Fund will consist of exempt-interest dividends that are exempt from regular federal income tax, some distributions will be subject to federal income tax. Additionally, most distributions will be subject to applicable state and local personal income tax.
5
Duration is a measure of a security’s price sensitivity to changes in interest rates. Securities with longer durations are more sensitive to changes in interest rates than securities with shorter durations.
6
The S&P 500 is an unmanaged, capitalization-weighted index of 500 stocks designed to measure performance of the broad domestic economy through changes in the aggregate market value of 500 stocks representing all major industries. The index is unmanaged, and it is not possible to invest directly in an index.
7
MMD is a market data provider that produces daily generic yield curve of investment-grade municipal bonds based on a survey of municipal securities dealers and observed trades. The MMD AAA yield curve is a widely used reference for top credit quality municipal bonds in the marketplace. Investment-grade municipal bonds are rated at least “BBB” by Standard & Poor’s or another nationally recognized statistical ratings organization (or are comparable unrated municipal bonds).
8
Fund income may be subject to state and local taxes. Although this Fund pursues tax-advantaged income and seeks to invest primarily in securities whose interest is not subject to the federal alternative minimum tax, there are no assurances that it will achieve these goals.
9
The Fund’s use of derivative instruments involves risks different from, or possibly greater than, the risks associated with investing directly in securities and other traditional instruments.
10
Investment-grade securities and noninvestment-grade securities may either be: (a) rated by a nationally recognized statistical ratings organization or rating agency; or (b) unrated securities that the Fund’s Adviser believes are of comparable quality. The rating agencies that provided the ratings for rated securities include Standard & Poor’s, Moody’s Investor Services, Inc. and Fitch Rating Service. When ratings vary, the highest rating is used. Credit ratings of “AA” or better are considered to be high credit quality; credit ratings of “A” are considered high or medium/good quality; and credit ratings of “BBB” are considered to be medium/good credit quality, and the lowest category of investment-grade securities; credit ratings of “BB” and below are lower-rated, noninvestment-grade securities or junk bonds; and credit ratings of “CCC” or below are noninvestment-grade securities that have high default risk. Credit ratings are an indication of the risk that a security will default. They do not protect a security from credit risk. Lower rated bonds typically offer higher yields to help compensate investors for the increased risk associated with them. Among these risks are lower creditworthiness, greater price volatility, more risk to principal and income than with higher rated securities and increased possibilities of default.
11
Bond prices are sensitive to changes in interest rates and interest rate spreads between bonds of varying credit quality. A rise in interest rates or interest rate spreads can cause a decline in their prices.
Annual Shareholder Report
FUND PERFORMANCE AND GROWTH OF A $10,000 INVESTMENT
The graph below illustrates the hypothetical investment of $10,0001 in the Federated Hermes Muni and Stock Advantage Fund2 from October 31, 2010 to October 31, 2020, compared to the S&P Municipal Bond Index (S&P Muni Index),3 the Russell 1000® Value Index (R1000V),4 the custom blend of indexes comprised of 60% S&P Muni Index/ 40% R1000V (“Blended Index”) and the Morningstar Allocation Funds Average–30% to 50% Equity (M30-50).5 The Average Annual Total Return Table below shows returns for each class averaged over the stated periods.
Growth of a $10,000 Investment
Growth of $10,000 as of October 31, 2020 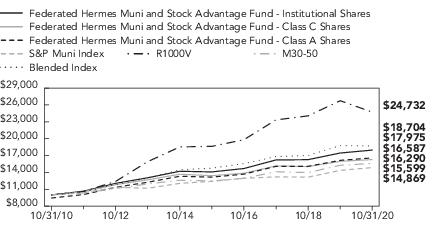
■ Total returns shown for Class A Shares include the maximum sales charge of 5.50% ($10,000 investment minus $550 sales charge = $9,450).
■ Total returns shown for the Class C Shares include the maximum contingent deferred sales charge of 1.00% as applicable.
The Fund offers multiple share classes whose performance may be greater than or less than its other share class(es) due to differences in sales charges and expenses. See the Average Annual Return table below for the returns of additional classes not shown in the line graphs above.
Annual Shareholder Report
Average Annual Total Returns for the Period Ended 10/31/2020
(returns reflect all applicable sales charges and contingent deferred sales charges as specified below in footnote #1)
Performance data quoted represents past performance which is no guarantee of future results. Investment return and principal value will fluctuate so that an investor’s shares, when redeemed, may be worth more or less than their original cost. Mutual fund performance changes over time and current performance may be lower or higher than what is stated. For current to the most recent month-end performance and after-tax returns, visit FederatedInvestors.com or call 1-800-341-7400. Returns shown do not reflect the deduction of taxes that a shareholder would pay on Fund distributions or the redemption of Fund shares. Mutual funds are not obligations of or guaranteed by any bank and are not federally insured.
1
Represents a hypothetical investment of $10,000 in the Fund after deducting applicable sales charges: for Class A Shares, the maximum sales charge of 5.50% ($10,000 investment minus $550 sales charge = $9,450); for Class B Shares, the maximum contingent deferred sales charge is 5.50% on any redemption less than one year from the purchase date; for Class C Shares, the maximum contingent deferred sales charge is 1.00% on any redemption less than one year from the purchase date; for Class F Shares, the maximum sales charge of 1.00% ($10,000 investment minus $100 sales charge = $9,900), and the contingent deferred sales charge is 1.00% on any redemption less than four years from the purchase date. The Fund’s performance assumes the reinvestment of all dividends and distributions. The S&P Muni Index, R1000V, Blended Index and the M30-50 have been adjusted to reflect reinvestment of dividends on securities in the indices and average.
2
As indicated in its name, Federated Hermes Muni and Stock Advantage Fund invests in both municipal (muni) securities and equity securities (stock) as described in the Fund’s prospectus. Thus the Fund is not entirely a “tax-exempt” or “municipal” fund, and a portion of the income derived from the Fund’s portfolio (or dividend distributions) will be subject to federal income tax and state and local personal income tax.
3
The S&P Muni Index is a broad, market value-weighted index that seeks to measure the performance of the U.S. municipal bond market. It tracks fixed-rate tax-free bonds and bonds subject to the alternative minimum tax (AMT). The index includes bonds of all quality—from “AAA” to non-rated, including defaulted bonds—from all sectors of the municipal bond market. The index is not adjusted to reflect sales charges, expenses and other fees that the Securities and Exchange Commission (SEC) requires to be reflected in the Fund’s performance. The index is unmanaged, and, unlike the Fund, is not affected by cash flows. It is not possible to invest directly in an index.
Annual Shareholder Report
4
The R1000V measures the performance of the large-cap value segment of the U.S. equity universe. It includes those Russell 1000 Index companies with lower price-to-book ratios and lower expected growth values. The R1000V is constructed to provide a comprehensive and unbiased barometer for the large-cap value segment and is completely reconstituted annually to ensure new and growing equities are included and that the represented companies continue to reflect value characteristics. The index is not adjusted to reflect sales charges, expenses and other fees that the SEC requires to be reflected in the Fund’s performance. The index is unmanaged, and, unlike the Fund, is not affected by cash flows. It is not possible to invest directly in an index.
5
Morningstar figures represent the average of the total returns reported by all the funds designated by Morningstar as falling into the respective category indicated. They do not reflect sales charges. The Morningstar figures in the Growth of $10,000 line graph are based on historical return information published by Morningstar and reflect the return of the funds comprising the category in the year of publication. Because the funds designated by Morningstar as falling into the category can change over time, the Morningstar figures in the line graph may not match the Morningstar figures in the Average Annual Total Returns table, which reflect the return of the funds that currently comprise the category.
6
The Fund’s Institutional Shares commenced operations on December 29, 2010. For the period prior to the commencement of operations of the Institutional Shares, the performance information shown for the Fund’s Institutional Shares is for the Fund’s Class A Shares. The performance of the Class A Shares has not been adjusted to reflect the expenses of the Institutional Shares, since the Institutional Shares have a lower expense ratio than the expense ratio of Class A Shares during those periods. The performance of Class A Shares has been adjusted to reflect the absence of sales charges and to remove any voluntary waiver of fund expenses related to Class A Shares during the period prior to commencement of the Institutional Shares.
Annual Shareholder Report
Portfolio of Investments Summary Tables (unaudited)
At October 31, 2020, the Fund’s portfolio composition1 was as follows:
| Percentage of
Total Net Assets |
Tax-Exempt, Fixed-Income Securities | |
| |
| |
| |
Other Assets and Liabilities—Net5 | |
| |
At October 31, 2020, the Fund’s sector composition6 for its equity securities was as follows:
| Percentage of
Equity Securities |
| |
| |
| |
| |
| |
| |
| |
| |
| |
| |
| |
Annual Shareholder Report
At October 31, 2020, the Fund’s sector composition7 for its tax-exempt securities was as follows:
| Percentage of
Tax-Exempt
Securities |
| |
| |
| |
| |
| |
| |
| |
General Obligation—State Appropriation | |
| |
| |
| |
| |
1
See the Fund’s Prospectus and Statement of Additional Information for a description of the types of securities in which the Fund invests.
2
Cash equivalents include any investments in tax-exempt, variable rate instruments.
3
Based upon net unrealized appreciation (depreciation) or value of the derivative contracts as applicable. Derivative contracts may consist of futures, forwards, options and swaps. The impact of a derivative contract on the Fund’s performance may be larger than its unrealized appreciation (depreciation) or value may indicate. In many cases, the notional value or amount of a derivative contract may provide a better indication of the contract’s significance to the portfolio. More complete information regarding the Fund’s direct investments in derivative contracts, including unrealized appreciation (depreciation), value and notional values or amounts of such contracts, can be found in the table at the end of the Portfolio of Investments included in this Report.
4
Represents less than 0.1%.
5
Assets, other than investments in securities and derivative contracts, less liabilities. See Statement of Assets and Liabilities.
6
Sector classifications are based upon, and individual portfolio securities are assigned to, the classifications of the Global Industry Classification Standard (GICS) except that the Adviser assigns a classification to securities not classified by the GICS and to securities for which the Adviser does not have access to the classification made by the GICS.
7
Sector classifications and the assignment of holdings to such sectors, are based upon the economic sector and/or revenue source of the underlying obligor, as determined by the Fund’s Adviser. For securities that have been enhanced by a third-party guarantor, such as bond insurers and banks, sector classifications are based upon the economic sector and/or revenue source of the underlying obligor, as determined by the Fund’s Adviser. Refunded securities are those whose debt service is paid from escrowed assets, usually U.S. government securities.
8
For purposes of this table, sector classifications constitute 72.9% of the Fund’s total investments in tax-exempt securities. Remaining tax-exempt security sectors have been aggregated under the designation “Other.”
Annual Shareholder Report
Portfolio of Investments
October 31, 2020
| | | |
| | | |
| | | |
| | Black Belt Energy Gas District, AL, Gas Prepay Revenue Bonds Project No. 5 (Series 2020A-1) TOBs, (Morgan Stanley GTD), 4.000%, Mandatory Tender 10/1/2026 | |
| | Selma, AL IDB (International Paper Co.), Revenue Bonds (Series 2011A), 5.375%, 12/1/2035 | |
| | | |
| | | |
| | Arizona State IDA (Equitable School Revolving Fund), Senior National Charter School Revenue Bonds (Series 2020A), 4.000%, 11/1/2050 | |
| | Arizona State Industrial Development Authority Education Revenue (Basis Schools, Inc. Obligated Group), Education Revenue Bonds (Series 2017F), (School District Credit Program GTD), 5.000%, 7/1/2052 | |
| | Maricopa County, AZ, IDA (GreatHearts Academies), Education Revenue Bonds (GreatHearts Arizona Projects) (Series 2017C), (Arizona Public School Credit Enhancement Program GTD), 5.000%, 7/1/2048 | |
| | Maricopa County, AZ, IDA (Paradise Schools), Revenue Refunding Bonds, 5.000%, 7/1/2036 | |
| | Phoenix, AZ Civic Improvement Corp.—Airport System, Junior Line Airport Revenue Bonds (Series 2019A), 4.000%, 7/1/2044 | |
| | Phoenix, AZ Civic Improvement Corp.—Airport System, Junior Line Airport Revenue Bonds (Series 2019A), 5.000%, 7/1/2044 | |
| | Phoenix, AZ IDA (GreatHearts Academies), Education Facility Revenue Bonds (Series 2014A), 5.000%, 7/1/2034 | |
| | | |
| | | |
| | California Health Facilities Financing Authority (Providence St. Joseph Health), Revenue Bonds (Series 2014B), 5.000%, 10/1/2044 | |
| | California Health Facilities Financing Authority (Stanford Health Care), Revenue Refunding Bonds (Series 2017A), 4.000%, 11/15/2040 | |
| | California School Finance Authority (KIPP LA), School Facility Revenue Bonds (Series 2014A), 5.000%, 7/1/2034 | |
| | California School Finance Authority (KIPP LA), School Facility Revenue Bonds (Series 2014A), 5.125%, 7/1/2044 | |
| | California School Finance Authority (KIPP LA), School Facility Revenue Bonds (Series 2015A), 5.000%, 7/1/2045 | |
Annual Shareholder Report
| | | |
| | MUNICIPAL BONDS—continued | |
| | | |
| | California State University (The Trustees of), Systemwide Revenue Bonds (Series 2014A), 5.000%, 11/1/2039 | |
| | California State University (The Trustees of), Systemwide Revenue Bonds (Series 2015A), 5.000%, 11/1/2030 | |
| | California State, School Facilities UT GO Bonds, 5.000%, 11/1/2031 | |
| | California State, Various Purpose Refunding GO Bonds, 5.000%, 2/1/2038 | |
| | California Statewide Communities Development Authority (899 Charleston LLC), Revenue Refunding Bonds (Series 2014A), 5.250%, 11/1/2044 | |
| | California Statewide Communities Development Authority (Sutter Health), Refunding Revenue Bonds (Series 2011D), 5.250%, 8/15/2031 | |
| | Chula Vista, CA Municipal Finance Authority, Special Tax Revenue Refunding Bonds (Series 2013), 5.500%, 9/1/2028 | |
| | Corona-Norco USD Community Facilities District No. 98-1, CA, 2013 Special Tax Refunding Bonds, 5.000%, 9/1/2032 | |
| | Foothill/Eastern Transportation Corridor Agency, CA, Toll Road Refunding Revenue Bonds (Series 2013A), (Original Issue Yield: 6.050%), 5.750%, 1/15/2046 | |
| | Golden State Tobacco Securitization Corp., CA (California State), Enhanced Tobacco Settlement Asset-Backed Bonds (Series 2015A), 5.000%, 6/1/2040 | |
| | Los Angeles Department of Water & Power (Los Angeles, CA Department of Water & Power (Electric/Power System)), Power System Revenue Bonds (Series 2019C), 5.000%, 7/1/2038 | |
| | M-S-R Energy Authority, CA, Gas Revenue Bonds (Series 2009A), (Original Issue Yield: 6.375%), (Citigroup, Inc. GTD), 6.125%, 11/1/2029 | |
| | M-S-R Energy Authority, CA, Gas Revenue Bonds (Series 2009C), (Original Issue Yield: 6.700%), (Citigroup, Inc. GTD), 6.500%, 11/1/2039 | |
| | San Jose, CA Airport, Airport Revenue Bonds (Series 2011A-2), (Original Issue Yield: 5.050%), 5.000%, 3/1/2031 | |
| | Transbay Joint Powers Authority, CA, Senior Tax Allocation Bonds Green Bonds (Series 2020A), 5.000%, 10/1/2049 | |
| | University of California (The Regents of), General Revenue Bonds (Series 2013AI), 5.000%, 5/15/2032 | |
| | University of California (The Regents of), Limited Project Revenue Bonds (Series 2012G), (United States Treasury PRF 5/15/2022@100), 5.000%, 5/15/2031 | |
| | University of California (The Regents of), Limited Project Revenue Bonds (Series 2012G), 5.000%, 5/15/2031 | |
Annual Shareholder Report
| | | |
| | MUNICIPAL BONDS—continued | |
| | | |
| | University of California (The Regents of), Limited Project Revenue Bonds (Series 2017M), 5.000%, 5/15/2036 | |
| | | |
| | | |
| | Arista, CO Metropolitan District, Special Revenue Refunding and Improvement Bonds (Series 2018A), 5.125%, 12/1/2048 | |
| | Clear Creek Station Metropolitan District No. 2, LT GO Refunding Bonds (Series 2017A), 5.000%, 12/1/2047 | |
| | Colorado Educational & Cultural Facilities Authority (University Lab School), Charter School Refunding & Improvement Revenue Bonds (Series 2015), 5.000%, 12/15/2035 | |
| | Colorado Health Facilities Authority (Christian Living Communities), Revenue Refunding Bonds (Series 2016), 5.000%, 1/1/2037 | |
| | Colorado Health Facilities Authority (Sisters of Charity of Leavenworth Health System), Revenue Bonds (Series 2013A), (Original Issue Yield: 5.120%), 5.000%, 1/1/2044 | |
| | Colorado Health Facilities Authority (Total Long-term Care National Obligated Group), Revenue Bonds (Series 2010A), (United States Treasury PRF 11/15/2020@100), 6.000%, 11/15/2030 | |
| | Colorado Springs, CO Utility System, Utilities System Revenue Bonds (Series 2014A-1), 5.000%, 11/15/2044 | |
| | Colorado State Health Facilities Authority Revenue (CommonSpirit Health), Revenue Bonds (Series 2019A-1), 4.000%, 8/1/2037 | |
| | Denver (City & County), CO (Denver, CO City & County Airport Authority), Airport System Revenue Bonds (Series 2013B), (Original Issue Yield: 5.050%), 5.000%, 11/15/2043 | |
| | STC Metropolitan District No. 2, CO, LT GO and Special Revenue Refunding and Improvement Bonds (Series2019A), 5.000%, 12/1/2049 | |
| | University of Colorado (The Regents of), University Enterprise Revenue Bonds (Series 2013A), (United States Treasury PRF 6/1/2023@100), 5.000%, 6/1/2032 | |
| | | |
| | | |
| | Connecticut State Special Transportation Fund, Special Tax Obligation Bonds Transportation Infrastructure Purpose (Series 2018B), 5.000%, 10/1/2032 | |
| | Connecticut State, UT GO Bonds (Series 2020C), 4.000%, 6/1/2036 | |
| | | |
Annual Shareholder Report
| | | |
| | MUNICIPAL BONDS—continued | |
| | | |
| | Delaware Economic Development Authority (ACTS Retirement Life Communities, Inc.), Retirement Communities Revenue Bonds (Series 2018B), 5.000%, 11/15/2048 | |
| | District of Columbia—0.9% | |
| | District of Columbia (KIPP DC), Revenue Bonds (Series 2013A), (United States Treasury PRF 7/1/2023@100), 6.000%, 7/1/2048 | |
| | District of Columbia Revenue (District of Columbia International School), Revenue Bonds (Series 2019), 5.000%, 7/1/2054 | |
| | District of Columbia Revenue (Friendship Public Charter School, Inc.), Revenue Bonds (Series 2016A), 5.000%, 6/1/2041 | |
| | District of Columbia Revenue (Ingleside at Rock Creek), Project Revenue Bonds (Series 2017A), (Original Issue Yield: 5.125%), 5.000%, 7/1/2042 | |
| | District of Columbia Revenue (Ingleside at Rock Creek), Project Revenue Bonds (Series 2017A), 5.000%, 7/1/2037 | |
| | District of Columbia, UT GO Bonds (Series 2019A), 5.000%, 10/15/2029 | |
| | Metropolitan Washington, DC Airports Authority (Dulles Metrorail and Capital Improvement Project), Dulles Toll Road Subordinate Lien Revenue Refunding Bonds (Series 2019B), (Assured Guaranty Municipal Corp. INS), 4.000%, 10/1/2053 | |
| | | |
| | | |
| | Collier County, FL IDA (Arlington of Naples), Continuing Care Community Revenue Bonds (Series 2013A), (Original Issue Yield: 8.250%), 8.125%, 5/15/2044 | |
| | Florida State Board of Education (Florida State), General Obligation Refunding Bonds (Series 2016C), 5.000%, 6/1/2025 | |
| | Miami-Dade County, FL (Miami-Dade County, FL Seaport), Seaport Revenue Bonds (Series 2013A), 5.750%, 10/1/2030 | |
| | Miami-Dade County, FL (Miami-Dade County, FL Seaport), Seaport Revenue Bonds (Series 2013A), 5.750%, 10/1/2032 | |
| | Miami-Dade County, FL Expressway Authority, Toll System Refunding Revenue Bonds (Series 2013A), 5.000%, 7/1/2027 | |
| | Miami-Dade County, FL Expressway Authority, Toll System Refunding Revenue Bonds (Series 2013A), 5.000%, 7/1/2028 | |
| | Miami-Dade County, FL Water & Sewer, Water & Sewer System Revenue Refunding Bonds (Series 2015), 5.000%, 10/1/2023 | |
| | Orlando, FL Utilities Commission, Utility System Revenue Bonds (Series 2018A), 5.000%, 10/1/2037 | |
Annual Shareholder Report
| | | |
| | MUNICIPAL BONDS—continued | |
| | | |
| | Palm Beach County, FL Health Facilities Authority (Sinai Residences of Boca Raton), Revenue Bonds (Series 2014A), 7.250%, 6/1/2034 | |
| | | |
| | | |
| | Atlanta, GA Water & Wastewater, Revenue Refunding Bonds (Series 2015), 5.000%, 11/1/2040 | |
| | Atlanta, GA Water & Wastewater, Revenue Refunding Bonds (Series 2018C), 5.000%, 11/1/2032 | |
| | Fulton County, GA Development Authority (Piedmont Healthcare, Inc.), Revenue Bonds (Series 2014A), 5.000%, 7/1/2044 | |
| | Fulton County, GA Residential Care Facilities (Lenbrook Square Foundation, Inc.), Retirement Facility Refunding Revenue Bonds (Series 2016), 5.000%, 7/1/2036 | |
| | | |
| | | |
| | Idaho Health Facilities Authority (Terraces of Boise), Revenue Bonds (Series 2013A), (Original Issue Yield: 7.875%), 7.750%, 10/1/2034 | |
| | Idaho Health Facilities Authority (Terraces of Boise), Revenue Bonds (Series 2013A), (Original Issue Yield: 8.250%), 8.125%, 10/1/2049 | |
| | | |
| | | |
| | Chicago, IL Board of Education, UT GO Dedicated Refunding Bonds (Series 2018D), (Original Issue Yield: 5.210%), 5.000%, 12/1/2046 | |
| | Chicago, IL Midway Airport, Second Lien Revenue & Refunding Bonds (Series 2014B), 5.000%, 1/1/2036 | |
| | Chicago, IL Midway Airport, Second Lien Revenue Refunding Bonds (Series 2014B), 5.000%, 1/1/2035 | |
| | Chicago, IL O’Hare International Airport, General Airport Senior Lien Revenue Refunding Bonds (Series 2016B), 5.000%, 1/1/2041 | |
| | Chicago, IL O’Hare International Airport, General Airport Senior Lien Revenue Refunding Bonds (Series 2018B), 5.000%, 1/1/2048 | |
| | Chicago, IL O’Hare International Airport, General Airport Third Lien Revenue Bonds (Series 2011A), (Original Issue Yield: 5.940%), (United States Treasury PRF 1/1/2021@100), 5.750%, 1/1/2039 | |
| | Chicago, IL O’Hare International Airport, General Airport Third Lien Revenue Bonds (Series 2011A), (Original Issue Yield: 5.940%), (United States Treasury PRF 1/1/2021@100), 5.750%, 1/1/2039 | |
Annual Shareholder Report
| | | |
| | MUNICIPAL BONDS—continued | |
| | | |
| | Chicago, IL Sales Tax, Revenue Refunding Bonds (Series 2002), (United States Treasury PRF 1/1/2025@100), 5.000%, 1/1/2027 | |
| | Chicago, IL Water Revenue, Second Lien Water Revenue Refunding Bonds (Series 2004), 5.000%, 11/1/2023 | |
| | Chicago, IL Water Revenue, Second Lien Water Revenue Refunding Bonds (Series 2004), 5.000%, 11/1/2024 | |
| | Cook County, IL Sales Tax, Revenue Refunding Bonds (Series 2017), 5.000%, 11/15/2037 | |
| | DuPage County, IL (Naperville Campus LLC), Special Tax Bonds (Series 2006), 5.625%, 3/1/2036 | |
| | Illinois Finance Authority (Admiral at the Lake), Revenue Refunding Bonds (Series 2017), (Original Issue Yield: 5.500%), 5.250%, 5/15/2054 | |
| | Illinois Finance Authority (DePaul University), Revenue Bonds (Series 2016), 5.000%, 10/1/2041 | |
| | Illinois State Toll Highway Authority, Toll Highway Senior Revenue Bonds (Series 2014B), 5.000%, 1/1/2039 | |
| | Illinois State, GO Bonds (Series 2017D), 5.000%, 11/1/2028 | |
| | Illinois State, UT GO Bonds (Series 2013A), 5.000%, 4/1/2035 | |
| | Illinois State, UT GO Bonds (Series 2017D), 5.000%, 11/1/2026 | |
| | Illinois State, UT GO Bonds (Series 2018A), 5.000%, 5/1/2042 | |
| | Illinois State, UT GO Bonds (Series June 2013), (Original Issue Yield: 5.650%), 5.500%, 7/1/2038 | |
| | Illinois State, UT GO Refunding Bonds (Series 2018A), 5.000%, 10/1/2026 | |
| | Illinois State, UT GO Refunding Bonds (Series 2018A), 5.000%, 10/1/2028 | |
| | Illinois State, UT GO Refunding Bonds (Series February 2010), 5.000%, 1/1/2024 | |
| | Illinois State, UT GO Refunding Bonds (Series May 2012), 5.000%, 8/1/2024 | |
| | Metropolitan Pier & Exposition Authority, IL, McCormick Place Expansion Project Bonds (Series 2015A), (Original Issue Yield: 5.060%), 5.000%, 6/15/2053 | |
| | Railsplitter Tobacco Settlement Authority, IL, Tobacco Settlement Revenue Bonds (Series 2010), (Original Issue Yield: 6.100%), (United States Treasury PRF 6/1/2021@100), 6.000%, 6/1/2028 | |
| | Sales Tax Securitization Corp., IL, Sales Tax Securitization Bonds (Series 2018A), 5.000%, 1/1/2048 | |
| | | |
Annual Shareholder Report
| | | |
| | MUNICIPAL BONDS—continued | |
| | | |
| | Indiana Municipal Power Agency, Power Supply System Revenue Bonds (Series 2013A), (United States Treasury PRF 7/1/2023@100), 5.250%, 1/1/2034 | |
| | Indiana Municipal Power Agency, Revenue Refunding Bonds (Series 2017A), 5.000%, 1/1/2042 | |
| | Indiana State Finance Authority Hospital Revenue (Indiana University Health Obligated Group), Hospital Revenue Refunding Bonds (Series 2014A), 5.000%, 12/1/2029 | |
| | Indiana State Finance Authority Wastewater Utilities (CWA Authority), First Lien Wastewater Utility Revenue Bonds (Series 2012A), 5.000%, 10/1/2029 | |
| | Indiana State Finance Authority Wastewater Utilities (CWA Authority), First Lien Wastewater Utility Revenue Bonds (Series 2014A), 5.000%, 10/1/2039 | |
| | Whiting, IN Environmental Facilities (BP PLC), Revenue Bonds (Series 2009), 5.250%, 1/1/2021 | |
| | | |
| | | |
| | Iowa Finance Authority (Deerfield Retirement Community, Inc.), Lifespace GTD Senior Living Facility Revenue Refunding Bonds (Series 2014A), 5.400%, 11/15/2046 | |
| | Iowa Finance Authority (Deerfield Retirement Community, Inc.), Senior Living Facility Revenue Refunding Bonds (Series 2014B), 4.253%, 5/15/2056 | |
| | Iowa Finance Authority (Iowa Fertilizer Co. LLC), Midwestern Disaster Area Revenue Bonds (Series 2013) Exchange Bonds (Series B) TOBs, 5.250%, Mandatory Tender 12/1/2037 | |
| | Iowa Finance Authority (Iowa Fertilizer Co. LLC), Midwestern Disaster Area Revenue Bonds (Series 2013), 5.875%, 12/1/2027 | |
| | Tobacco Settlement Financing Corp., IA, Tobacco Settlement Asset-Backed Bonds (Series 2005C), (Original Issue Yield: 5.700%), 5.375%, 6/1/2038 | |
| | Tobacco Settlement Financing Corp., IA, Tobacco Settlement Asset-Backed Bonds (Series 2005C), (Original Issue Yield: 5.780%), 5.500%, 6/1/2042 | |
| | | |
| | | |
| | Wyandotte County, KS Unified Government Utility System, Improvement & Refunding Revenue Bonds (Series 2014-A), 5.000%, 9/1/2044 | |
| | | |
| | Kentucky Economic Development Finance Authority (Miralea), Revenue Bonds (Series 2016A), 5.000%, 5/15/2051 | |
Annual Shareholder Report
| | | |
| | MUNICIPAL BONDS—continued | |
| | | |
| | Kentucky Public Transportation Infrastructure Authority, First Tier Toll Revenue Bonds (Series 2013), (Original Issue Yield: 6.125%), 6.000%, 7/1/2053 | |
| | Louisville & Jefferson County, KY Metropolitan Government (Catholic Health Initiatives), Revenue Bonds (Series 2012A), (United States Treasury PRF 6/1/2022@100), 5.000%, 12/1/2035 | |
| | Louisville & Jefferson County, KY Metropolitan Government (Catholic Health Initiatives), Revenue Bonds (Series 2012A), (United States Treasury PRF 6/1/2022@100), 5.000%, 12/1/2035 | |
| | | |
| | | |
| | Louisiana State Citizens Property Insurance Corp., Refunding Revenue Bonds (Series 2012), (United States Treasury PRF 6/1/2022@100), 5.000%, 6/1/2024 | |
| | St. Charles Parish, LA Gulf Opportunity Zone (Valero Energy Corp.), Revenue Bonds (Series 2010) TOBs, 4.000%, Mandatory Tender 6/1/2022 | |
| | St. James Parish, LA (NuStar Logistics LP), Revenue Bonds (Series 2011) TOBs, 5.850%, Mandatory Tender 6/1/2025 | |
| | | |
| | | |
| | Maine Health & Higher Educational Facilities Authority (MaineGeneral Medical Center), Revenue Bonds (Series 2011), (Original Issue Yield: 7.000%), 6.750%, 7/1/2041 | |
| | | |
| | Anne Arundel County, MD, LT GO Bonds (Series 2018), 5.000%, 10/1/2032 | |
| | Maryland State Economic Development Corp. (Ports America Chesapeake, Inc. ), Transportation Facilities Revenue Refunding Bonds (Series 2017A), 5.000%, 6/1/2031 | |
| | Maryland State Economic Development Corp. (Ports America Chesapeake, Inc. ), Transportation Facilities Revenue Refunding Bonds (Series 2017A), 5.000%, 6/1/2035 | |
| | Westminster, MD (Lutheran Village at Miller’s Grant, Inc.), Revenue Bonds (Series 2014A), 6.000%, 7/1/2034 | |
| | | |
| | | |
| | Massachusetts Development Finance Agency (Harvard University), Revenue Refunding Bonds (Series 2016A), 5.000%, 7/15/2040 | |
| | Massachusetts Development Finance Agency (Mass General Brigham), Revenue Bonds (Series 2016Q), 5.000%, 7/1/2041 | |
Annual Shareholder Report
| | | |
| | MUNICIPAL BONDS—continued | |
| | | |
| | Massachusetts Development Finance Agency (Wellforce Obligated Group), Revenue Bonds (Series 2020C), (Assured Guaranty Municipal Corp. INS), 4.000%, 10/1/2045 | |
| | Massachusetts School Building Authority, Senior Dedicated Sales Tax Revenue Refunding Bonds (Series 2015C), 5.000%, 8/15/2037 | |
| | Massachusetts Water Resources Authority, General Revenue Refunding Bonds (Series 2017C), 5.000%, 8/1/2030 | |
| | | |
| | | |
| | Detroit, MI, UT GO Bonds (Series 2020), 5.500%, 4/1/2050 | |
| | Michigan State Finance Authority Revenue (Great Lakes, MI Water Authority Sewage Disposal System), Local Government Loan Program Revenue Bonds (Series 2015C-1), 5.000%, 7/1/2035 | |
| | Michigan State Finance Authority Revenue (Great Lakes, MI Water Authority Water Supply System), Senior Lien Revenue Bonds (Series 2014 D-1), (Assured Guaranty Municipal Corp. INS), 5.000%, 7/1/2037 | |
| | Michigan State Finance Authority Revenue (Public Lighting Authority ), Local Government Loan Program Revenue Bonds (Series 2014B), 5.000%, 7/1/2039 | |
| | Michigan Strategic Fund (Michigan State), LT Obligation Revenue Bonds (Series 2011), 5.250%, 10/15/2026 | |
| | Wayne County, MI Airport Authority, Revenue Bonds (Series 2012A), 5.000%, 12/1/2037 | |
| | | |
| | | |
| | Forest Lake, MN (Lakes International Language Academy), Charter School Lease Revenue Bonds (Series 2018A), 5.375%, 8/1/2050 | |
| | Minnesota State, Various Purpose Refunding UT GO Bonds (Series 2016D), 5.000%, 8/1/2025 | |
| | Western Minnesota Municipal Power Agency, MN, Power Supply Revenue Bonds (Series 2014A), (United States Treasury PRF 1/1/2024@100), 5.000%, 1/1/2040 | |
| | | |
| | | |
| | Lowndes County, MS Solid Waste Disposal (International Paper Co.), PCR Refunding Bonds (Project A) Weyerhaeuser/ International Paper, 6.800%, 4/1/2022 | |
Annual Shareholder Report
| | | |
| | MUNICIPAL BONDS—continued | |
| | | |
| | Kansas City, MO Redevelopment Authority (Kansas City Convention Center Headquarters Hotel CID), Revenue Bonds (Series 2018B), (Original Issue Yield: 5.079%), 5.000%, 2/1/2050 | |
| | Missouri State HEFA (BJC Health System, MO), Health Facilities Revenue Bonds, 5.000%, 1/1/2044 | |
| | St. Louis, MO Airport Revenue (St. Louis Lambert International Airport), Airport Revenue Refunding and Airport Revenue Bonds (Series 2017C), (Assured Guaranty Municipal Corp. INS), 5.000%, 7/1/2042 | |
| | | |
| | | |
| | Central Plains Energy Project, NE, Gas Project Revenue Bonds (Project No. 3) (Series 2012), (Goldman Sachs Group, Inc. GTD), 5.000%, 9/1/2032 | |
| | Central Plains Energy Project, NE, Gas Project Revenue Bonds (Project No. 3) (Series 2012), (Original Issue Yield: 5.050%), (Goldman Sachs Group, Inc. GTD), 5.000%, 9/1/2042 | |
| | Central Plains Energy Project, NE, Gas Project Revenue Bonds (Project No. 3) (Series 2017A), (Goldman Sachs Group, Inc. GTD), 5.000%, 9/1/2042 | |
| | Nebraska Public Power District, General Revenue Bonds (Series 20014A), 5.000%, 1/1/2037 | |
| | Nebraska Public Power District, General Revenue Bonds (Series 20014A), 5.000%, 1/1/2038 | |
| | | |
| | | |
| | New Hampshire Health and Education Facilities Authority (Hillside Village), Revenue Bonds (Series 2017A), 6.125%, 7/1/2037 | |
| | | |
| | New Jersey EDA (New Jersey State), School Facilities Construction Bonds (Series 2015 WW), (United States Treasury PRF 6/15/2025@100), 5.250%, 6/15/2040 | |
| | New Jersey EDA (New Jersey State), School Facilities Construction Bonds (Series 2015 WW), 5.250%, 6/15/2040 | |
| | New Jersey EDA (New Jersey State), School Facilities Construction Refunding Bonds (Series 2017 DDD), 5.000%, 6/15/2033 | |
| | New Jersey EDA (New Jersey State), School Facilities Construction Refunding Bonds (Series 2018EEE), 5.000%, 6/15/2043 | |
| | New Jersey State Transportation Trust Fund Authority (New Jersey State), Federal Highway Reimbursement Revenue Refunding Notes (Series 2018A), 5.000%, 6/15/2031 | |
Annual Shareholder Report
| | | |
| | MUNICIPAL BONDS—continued | |
| | | |
| | New Jersey State Transportation Trust Fund Authority (New Jersey State), Transportation System Bonds (Series 2010D), 5.000%, 12/15/2023 | |
| | New Jersey State Transportation Trust Fund Authority (New Jersey State), Transportation System Bonds (Series 2011A), (United States Treasury PRF 6/15/2021@100), 6.000%, 6/15/2035 | |
| | New Jersey State Transportation Trust Fund Authority (New Jersey State), Transportation System Bonds (Series 2011B), (Original Issue Yield: 5.050%), (United States Treasury PRF 6/15/2021@100), 5.000%, 6/15/2042 | |
| | New Jersey State Transportation Trust Fund Authority (New Jersey State), Transportation System Bonds (Series 2018A), 5.000%, 12/15/2034 | |
| | New Jersey Turnpike Authority, Turnpike Revenue Bonds (Series 2015E), 5.000%, 1/1/2034 | |
| | New Jersey Turnpike Authority, Turnpike Revenue Bonds (Series 2017G), 4.000%, 1/1/2043 | |
| | South Jersey Transportation Authority, Transportation System Revenue Bonds (Series 2020A), 4.000%, 11/1/2050 | |
| | Tobacco Settlement Financing Corp., NJ, Tobacco Settlement Asset-Backed Refunding Bonds (Series 2018A), 5.000%, 6/1/2036 | |
| | Tobacco Settlement Financing Corp., NJ, Tobacco Settlement Asset-Backed Refunding Bonds (Series 2018A), 5.250%, 6/1/2046 | |
| | Tobacco Settlement Financing Corp., NJ, Tobacco Settlement Asset-Backed Subordinate Refunding Bonds (Series 2018B), 5.000%, 6/1/2046 | |
| | | |
| | | |
| | New Mexico State Hospital Equipment Loan Council (Presbyterian Healthcare Services), Hospital System Revenue Bonds (Series 2017A), 5.000%, 8/1/2046 | |
| | | |
| | Glen Cove, NY Local Economic Assistance Corp. (Garvies Point Public Improvement Project), Revenue Bonds (Series 2016A), (Original Issue Yield: 5.080%), 5.000%, 1/1/2056 | |
| | Hudson Yards Infrastructure Corp. NY, Hudson Yards Senior Revenue Bonds (Series 2012A), (United States Treasury PRF 2/15/2021@100), 5.750%, 2/15/2047 | |
| | Hudson Yards Infrastructure Corp. NY, Hudson Yards Senior Revenue Bonds (Series 2012A), 5.750%, 2/15/2047 | |
| | Metropolitan Transportation Authority, NY (MTA Transportation Revenue), Revenue Bonds (Series 2013C), 5.000%, 11/15/2042 | |
Annual Shareholder Report
| | | |
| | MUNICIPAL BONDS—continued | |
| | | |
| | Metropolitan Transportation Authority, NY (MTA Transportation Revenue), Transportation Revenue Bonds (Series 2014B), 5.250%, 11/15/2039 | |
| | Metropolitan Transportation Authority, NY (MTA Transportation Revenue), Transportation Revenue Green Bonds (Series 2020C-1), 5.000%, 11/15/2050 | |
| | Metropolitan Transportation Authority, NY (MTA Transportation Revenue), Transportation Revenue Refunding Bonds (Series 2017B), 5.000%, 11/15/2024 | |
| | New York City, NY IDA (Yankee Stadium LLC), CPI PILOT Revenue Bonds (Series 2006) FRNs, (FGIC INS), 2.140% (US CPI Urban Consumers YoY NSA +0.820%), 3/1/2021 | |
| | New York City, NY Municipal Water Finance Authority, Water & Sewer System Second General Resolution Revenue Bonds (Fiscal 2015 Series EE), 5.000%, 6/15/2036 | |
| | New York City, NY Transitional Finance Authority, Future Tax Secured Subordinate Revenue Bonds (Series 2014A-1)), 5.000%, 8/1/2036 | |
| | New York City, NY, UT GO Bonds (Series 2018B-1), 5.000%, 10/1/2039 | |
| | New York Liberty Development Corporation (3 World Trade Center), Revenue Bonds (Series 2014 Class 1), 5.000%, 11/15/2044 | |
| | New York Liberty Development Corporation (4 World Trade Center), Liberty Revenue Bonds (Series 2011), 5.750%, 11/15/2051 | |
| | New York State Dormitory Authority (Columbia University), Revenue Bonds (Series 2018A), 5.000%, 10/1/2048 | |
| | New York State Dormitory Authority State Personal Income Tax Revenue (New York State Personal Income Tax Revenue Bond Fund), General Purpose Revenue Refunding Bonds (Series 2012A), 5.000%, 12/15/2028 | |
| | New York State Power Authority, Revenue Bonds (Series 2020A), 4.000%, 11/15/2050 | |
| | New York State Power Authority, Revenue Bonds (Series 2020A), 4.000%, 11/15/2055 | |
| | New York State Thruway Authority (New York State Thruway Authority—General Revenue), General Revenue Bonds (Series 2012I), (United States Treasury PRF 1/1/2022@100), 5.000%, 1/1/2037 | |
| | New York State Thruway Authority (New York State Thruway Authority—General Revenue), General Revenue Junior Indebtedness Obligations (Series 2019B), 4.000%, 1/1/2050 | |
Annual Shareholder Report
| | | |
| | MUNICIPAL BONDS—continued | |
| | | |
| | New York State Urban Development Corp. (New York State Personal Income Tax Revenue Bond Fund), State Personal Income Tax Revenue Bonds (Series 2017A), 5.000%, 3/15/2027 | |
| | Port Authority of New York and New Jersey, Revenue Bonds (194th Series ), 5.000%, 10/15/2041 | |
| | TFA State/School Building Aid (New York City, NY Transitional Finance Authority), Building Aid Revenue Bonds (Series 2019S-3A), 5.000%, 7/15/2032 | |
| | TSASC, Inc. NY, Tobacco Settlement Asset Backed Senior Refunding Bonds (Series 2017A), 5.000%, 6/1/2024 | |
| | | |
| | | |
| | Charlotte, NC (Charlotte, NC Douglas International Airport), Airport Revenue Bonds (Series 2017A), 5.000%, 7/1/2042 | |
| | Charlotte-Mecklenburg Hospital Authority, NC (Atrium Health (previously Carolinas HealthCare) System), Health Care Revenue & Refunding Revenue Bonds (Series 2012A), 5.000%, 1/15/2043 | |
| | North Carolina Municipal Power Agency No. 1, Refunding Revenue Bonds (Series 2015A), 5.000%, 1/1/2031 | |
| | North Carolina State Turnpike Authority, Triangle Expressway System Appropriation Revenue Refunding Bonds (Series 2018A), 4.000%, 1/1/2034 | |
| | | |
| | | |
| | Allen County, OH (Bon Secours Mercy Health), Hospital Facilities Revenue Bonds (Series 2020A), 4.000%, 12/1/2040 | |
| | Buckeye Tobacco Settlement Financing Authority, OH, Tobacco Settlement Asset-Backed Refunding Bonds (Series 2020B-2 Class 2), 5.000%, 6/1/2055 | |
| | Cuyahoga County, OH Hospital Authority (MetroHealth System), Hospital Revenue Bonds (Series 2017), (Original Issue Yield: 5.030%), 5.000%, 2/15/2057 | |
| | Hamilton County, OH (Life Enriching Communities), Healthcare Improvement and Refunding Revenue Bonds (Series 2016), 5.000%, 1/1/2051 | |
| | Lucas County, OH (ProMedica Healthcare Obligated Group), Revenue Bonds (Series 2011A), (Original Issue Yield: 6.220%), (United States Treasury PRF 11/15/2021@100), 6.000%, 11/15/2041 | |
| | Muskingum County, OH (Genesis Healthcare Corp.), Hospital Facilities Revenue Bonds (Series 2013), 5.000%, 2/15/2027 | |
| | Ohio State Higher Educational Facility Commission (Cleveland Clinic), Hospital Revenue Refunding Bonds (Series 2017A), 5.000%, 1/1/2033 | |
Annual Shareholder Report
| | | |
| | MUNICIPAL BONDS—continued | |
| | | |
| | Ohio State Hospital Revenue (University Hospitals Health System, Inc.), Hospital Revenue Bonds (Series 2016A), 5.000%, 1/15/2041 | |
| | Ohio State Hospital Revenue (University Hospitals Health System, Inc.), Hospital Revenue Bonds (Series 2016A), 5.000%, 1/15/2046 | |
| | Ohio State Turnpike & Infrastructure Commission, Turnpike Junior Lien Revenue Bonds (Series 2013A-1), (Original Issue Yield: 5.050%), (United States Treasury PRF 2/15/2023@100), 5.000%, 2/15/2048 | |
| | Ohio State Turnpike & Infrastructure Commission, Turnpike Junior Lien Revenue Bonds (Series 2013A-1), 5.250%, 2/15/2030 | |
| | Ohio State, Capital Facilities Lease-Appropriation Bonds (Series 2016A), 5.000%, 2/1/2028 | |
| | Toledo-Lucas County, OH Port Authority (CSX Corp.), Revenue Bonds, 6.450%, 12/15/2021 | |
| | University of Cincinnati, OH, General Receipts Bonds (Series 2013C), (United States Treasury PRF 12/1/2023@100), 5.000%, 6/1/2039 | |
| | | |
| | | |
| | Oklahoma Development Finance Authority (OU Medicine), Hospital Revenue Bonds (Series 2018B), 5.500%, 8/15/2052 | |
| | Oklahoma Development Finance Authority (OU Medicine), Hospital Revenue Bonds (Series 2018B), 5.500%, 8/15/2057 | |
| | Tulsa, OK Industrial Authority (Montereau, Inc.), Senior Living Community Revenue Refunding Bonds (Series 2017), 5.250%, 11/15/2037 | |
| | | |
| | | |
| | Oregon State, UT GO State Project Bonds (Series 2017C), 5.000%, 6/1/2034 | |
| | | |
| | Allentown, PA Neighborhood Improvement Zone Development Authority, Tax Revenue Bonds (Series 2012A), 5.000%, 5/1/2042 | |
| | Commonwealth Financing Authority of PA (Commonwealth of Pennsylvania), Tobacco Master Settlement Payment Revenue Bonds (Series 2018), 5.000%, 6/1/2033 | |
| | Cumberland County, PA Municipal Authority (Diakon Lutheran Social Ministries), Revenue Bonds (Series 2015), 5.000%, 1/1/2038 | |
| | Cumberland County, PA Municipal Authority (Dickinson College), Revenue Bonds (Series 2016), 5.000%, 5/1/2029 | |
| | Delaware River Joint Toll Bridge Commission, Revenue Bonds (Series 2017), 5.000%, 7/1/2047 | |
Annual Shareholder Report
| | | |
| | MUNICIPAL BONDS—continued | |
| | | |
| | Geisinger Authority, PA Health System, Health System Revenue Bonds (Series 2020A), 4.000%, 4/1/2050 | |
| | Lancaster County, PA Hospital Authority (University of Pennsylvania Health System), Revenue Refunding Bonds (Series 2016), 5.000%, 8/15/2042 | |
| | Northampton County, PA General Purpose Authority (St. Luke's University Health Network), Hospital Revenue Bonds (Series 2018A), (Original Issue Yield: 4.090%), 4.000%, 8/15/2048 | |
| | Pennsylvania State Higher Education Facilities Authority (Thomas Jefferson University), Fixed Rate Revenue Bonds (Series 2015A), 5.000%, 9/1/2045 | |
| | Pennsylvania State Higher Education Facilities Authority (University of Pennsylvania Health System), Revenue Bonds (Series 2017A), 5.000%, 8/15/2047 | |
| | Pennsylvania State Turnpike Commission, Oil Franchise Tax Senior Revenue Refunding Bonds (Series 2016A), 5.000%, 12/1/2031 | |
| | Pennsylvania State Turnpike Commission, Turnpike Revenue Bonds (Series 2015B), 5.000%, 12/1/2045 | |
| | Philadelphia, PA Authority for Industrial Development (PresbyHomes Germantown/Morrisville), Senior Living Revenue Bonds (Series 2005A), 5.625%, 7/1/2035 | |
| | | |
| | | |
| | Puerto Rico Sales Tax Financing Corp., Restructured Sales Tax Bonds (Series 2019A), (Original Issue Yield: 5.154%), 5.000%, 7/1/2058 | |
| | Puerto Rico Sales Tax Financing Corp., Restructured Sales Tax Bonds (Series 2019A-1), 4.750%, 7/1/2053 | |
| | Puerto Rico Sales Tax Financing Corp., Restructured Sales Tax Bonds (Series 2019A-2), 4.784%, 7/1/2058 | |
| | | |
| | | |
| | Tobacco Settlement Financing Corp., RI, Tobacco Settlement Asset-Backed Bonds (Series 2015B), 5.000%, 6/1/2050 | |
| | | |
| | South Carolina Jobs-EDA (Prisma Health Obligated Group), Hospital Revenue Bonds (Series 2018A), 5.000%, 5/1/2048 | |
| | South Carolina Public Service Company (Santee Cooper), Revenue Refunding and Improvement Bonds (Series 2020A), 4.000%, 12/1/2040 | |
| | | |
Annual Shareholder Report
| | | |
| | MUNICIPAL BONDS—continued | |
| | | |
| | Educational Enhancement Funding Corp., SD, Tobacco Settlement Revenue Bonds (Series 2013B), 5.000%, 6/1/2023 | |
| | | |
| | Greenville, TN Health and Educational Facilities Board (Ballad Health), Hospital Revenue Bonds (Series 2018A), 4.000%, 7/1/2040 | |
| | Metropolitan Government Nashville & Davidson County, TN, GO Improvement Bonds (Series 2018), 5.000%, 7/1/2031 | |
| | Metropolitan Nashville Tennessee Airport Authority, Subordinate Airport Revenue Bonds (Series 2019A), 5.000%, 7/1/2054 | |
| | Rutherford County, TN Health and Educational Facilities Board (Ascension Health Alliance Senior Credit Group), Revenue Bonds (Series 2012C), (United States Treasury PRF 11/15/2021@100), 5.000%, 11/15/2047 | |
| | Tennessee Energy Acquisition Corp., Gas Revenue Bonds (Series 2006A), (Goldman Sachs Group, Inc. GTD), 5.250%, 9/1/2023 | |
| | Tennessee State School Board Authority, Higher Educational Facilities Second Program Bonds (Series 2013A), 5.000%, 11/1/2029 | |
| | | |
| | | |
| | Central Texas Regional Mobility Authority, Senior Lien Revenue Bonds (Series 2011), (Original Issue Yield: 6.300%), (United States Treasury PRF 1/1/2021@100), 6.250%, 1/1/2046 | |
| | Clifton Higher Education Finance Corporation, TX (Idea Public Schools ), 6.000%, 8/15/2033 | |
| | Clifton Higher Education Finance Corporation, TX (Idea Public Schools ), Education Revenue Bonds (Series 2012), 5.000%, 8/15/2042 | |
| | Clifton Higher Education Finance Corporation, TX (Uplift Education), Revenue Bonds (Series 2015A), 5.000%, 12/1/2035 | |
| | Corpus Christi, TX Utility System, Junior Lien Revenue Improvement Bonds (Series 2015A), 5.000%, 7/15/2040 | |
| | Dallas, TX Waterworks & Sewer System, Revenue Refunding Bonds (Series 2013), (United States Treasury PRF 10/1/2023@100), 5.000%, 10/1/2031 | |
| | Dallas-Fort Worth, TX International Airport, Joint Revenue Refunding Bonds (Series 2012B), 5.000%, 11/1/2035 | |
| | Decatur, TX Hospital Authority (Wise Regional Health System), Hospital Revenue Bonds (Series 2014A), (Original Issue Yield: 5.300%), 5.250%, 9/1/2044 | |
Annual Shareholder Report
| | | |
| | MUNICIPAL BONDS—continued | |
| | | |
| | Grand Parkway Transportation Corp., TX, Subordinate Tier Toll Revenue Bonds (Series 2013B TELA Supported), (United States Treasury PRF 10/1/2023@100), 5.250%, 10/1/2051 | |
| | Harris County, TX Education Facilities Finance Corp. (Brazos Presbyterian Homes, Inc.), First Mortgage Revenue Bonds (Series 2016), 5.000%, 1/1/2048 | |
| | Houston, TX Combined Utility System, First Lien Revenue & Refunding Bonds (Series 2014D), 5.000%, 11/15/2044 | |
| | Houston, TX Higher Education Finance Corp. (Cosmos Foundation, Inc. ), Education Revenue Bonds (Series 2011A), (United States Treasury PRF 5/15/2021@100), 6.875%, 5/15/2041 | |
| | Leander, TX Independent School District, UT GO Refunding Bonds (Series 2013A), (Texas Permanent School Fund Guarantee Program GTD), 5.000%, 8/15/2031 | |
| | Leander, TX Independent School District, UT GO Refunding Bonds (Series 2013A), (United States Treasury PRF 8/15/2023@100), 5.000%, 8/15/2031 | |
| | Lower Colorado River Authority, TX (LCRA Transmission Services Corp.), Transmission Contract Refunding Revenue Bonds (Series 2020A), 5.000%, 5/15/2050 | |
| | New Hope Cultural Education Facilities Finance Corporation (MRC Crestview), Retirement Facility Revenue Bonds (Series 2016), 5.000%, 11/15/2036 | |
| | New Hope Cultural Education Facilities Finance Corporation (MRC Crestview), Retirement Facility Revenue Bonds (Series 2016), 5.000%, 11/15/2046 | |
| | New Hope Cultural Education Facilities Finance Corporation (MRC Langford), Retirement Facility Revenue Bonds (Series 2016A), 5.500%, 11/15/2046 | |
| | North Texas Tollway Authority, First Tier Revenue Refunding Bonds (Series 2011B), (Original Issue Yield: 5.120%), (United States Treasury PRF 1/1/2021@100), 5.000%, 1/1/2038 | |
| | North Texas Tollway Authority, First Tier Revenue Refunding Bonds (Series 2015B), 5.000%, 1/1/2045 | |
| | North Texas Tollway Authority, Second Tier Revenue Refunding Bonds (Series 2014B), 5.000%, 1/1/2031 | |
| | Red River, TX HFDC (MRC The Crossings), Retirement Facility Revenue Bonds (Series 2014A), (Original Issue Yield: 7.550%), 7.500%, 11/15/2034 | |
| | San Antonio, TX Electric & Gas System, Revenue Bonds (New Series 2015), 5.000%, 2/1/2032 | |
| | San Antonio, TX Electric & Gas System, Revenue Refunding Bonds (New Series 2015), 5.000%, 2/1/2027 | |
Annual Shareholder Report
| | | |
| | MUNICIPAL BONDS—continued | |
| | | |
| | Spring, TX Independent School District, Unlimited Tax School Building Bonds (Series 2019), (Texas Permanent School Fund Guarantee Program GTD), 4.000%, 8/15/2043 | |
| | Tarrant County, TX Cultural Education Facilities Finance Corp. (Buckingham Senior Living Community), Retirement Facility Revenue Bonds (Series 2015A Fixed Rate Bonds), 5.500%, 11/15/2045 | |
| | Tarrant County, TX Cultural Education Facilities Finance Corp. (Buckner Senior Living-Ventana Project), Tax-Exempt Mandatory Paydown Securities 80 (Series 2017B-1), 5.625%, 11/15/2024 | |
| | Texas Municipal Gas Acquisition & Supply Corp. I, Gas Supply Senior Lien Revenue Bonds (Series 2006A), (Bank of America Corp. GTD), 5.250%, 12/15/2026 | |
| | Texas Private Activity Bonds Surface Transportation Corporation (LBJ Infrastructure Group LLC), Senior Lien Revenue Refunding Bonds I-635 Managed Lanes Project (Series 2020A), 4.000%, 12/31/2039 | |
| | Texas State Transportation Commission (Central Texas Turnpike System), First Tier Revenue Refunding Bonds (Series 2012-A), (United States Treasury PRF 8/15/2022@100), 5.000%, 8/15/2041 | |
| | Texas State Transportation Commission (State Highway 249 System), First Tier Toll Revenue Bonds (Series 2019A), 5.000%, 8/1/2057 | |
| | Texas Water Development Board (Texas State Water Implementation Revenue Fund), Revenue Bonds (Series 2017A), 4.000%, 10/15/2036 | |
| | | |
| | | |
| | Virginia College Building Authority, Revenue Bonds (Series 2018A), 5.000%, 9/1/2031 | |
| | Virginia Commonwealth Transportation Board (Virginia State), Transportation Capital Projects Revenue Refunding Bonds (Series 2017), 5.000%, 5/15/2026 | |
| | Virginia Small Business Financing Authority (Bon Secours Mercy Health), Hospital Facilities Revenue Bonds (Series 2020A), 4.000%, 12/1/2049 | |
| | | |
| | | |
| | Central Puget Sound, WA Regional Transit Authority, Sales Tax Improvement & Refunding Bonds (Series 2015S-1) (Green Bonds), 5.000%, 11/1/2029 | |
| | Energy Northwest, WA, Columbia Generating Station Electric Revenue Refunding Bonds (Series 2020A), 5.000%, 7/1/2039 | |
Annual Shareholder Report
| | | |
| | MUNICIPAL BONDS—continued | |
| | | |
| | Seattle, WA Municipal Light & Power, Improvement and Refunding Revenue Bonds (Series 2017C), 4.000%, 9/1/2040 | |
| | Seattle, WA Municipal Light & Power, Improvement Revenue Bonds (Series 2018A), 4.000%, 1/1/2031 | |
| | Tobacco Settlement Authority, WA, Tobacco Settlement Revenue Refunding Bonds (Series 2013), 5.250%, 6/1/2031 | |
| | Washington State Health Care Facilities Authority (CommonSpirit Health), Revenue Refunding Bonds (Series 2019A-1), 4.000%, 8/1/2044 | |
| | Washington State Housing Finance Commission (Presbyterian Retirement Communities Northwest), Revenue Bonds (Series 2016), 5.000%, 1/1/2031 | |
| | Washington State Housing Finance Commission (Rockwood Retirement Communities), Nonprofit Housing Revenue & Refunding Revenue Bonds (Series 2014A), (Original Issue Yield: 7.400%), 7.375%, 1/1/2044 | |
| | Washington State, UT GO Bonds (Series 2018C), 5.000%, 2/1/2036 | |
| | Washington State, UT GO Motor Vehicle Fuel Tax Bonds (Series 2019B), 5.000%, 6/1/2039 | |
| | | |
| | | |
| | Wisconsin Health & Educational Facilities Authority (Hospital Sisters Services, Inc.), Revenue Refunding Bonds (Series 2014A), 5.000%, 11/15/2029 | |
| | Wisconsin State, UT GO Bonds (Series 2018A), 4.000%, 5/1/2034 | |
| | | |
| | | |
| | Laramie County, WY (Cheyenne Regional Medical Center), Hospital Revenue Bonds (Series 2012), 5.000%, 5/1/2037 | |
| | TOTAL MUNICIPAL BONDS
(IDENTIFIED COST $765,806,206) | |
| | | |
| | Communication Services—3.5% | |
| | | |
| | | |
| | | |
| | | |
| | Verizon Communications, Inc. | |
| | | |
| | | |
Annual Shareholder Report
| | | |
| | | |
| | Consumer Discretionary—5.4% | |
| | | |
| | American Eagle Outfitters, Inc. | |
| | | |
| | | |
| | Dick’s Sporting Goods, Inc. | |
| | | |
| | | |
| | | |
| | | |
| | | |
| | Wyndham Destinations, Inc. | |
| | | |
| | | |
| | Constellation Brands, Inc., Class A | |
| | | |
| | Mondelez International, Inc. | |
| | Philip Morris International, Inc. | |
| | | |
| | | |
| | | |
| | | |
| | | |
| | | |
| | | |
| | | |
| | | |
| | | |
| | | |
| | | |
| | | |
| | Capital One Financial Corp. | |
| | Citizens Financial Group, Inc. | |
| | | |
| | Goldman Sachs Group, Inc. | |
| | | |
| | LPL Investment Holdings, Inc. | |
| | Reinsurance Group of America | |
Annual Shareholder Report
| | | |
| | | |
| | | |
| | | |
| | | |
| | | |
| | | |
| | | |
| | | |
| | | |
| | | |
| | | |
| | | |
| | | |
| | | |
| | | |
| | Thermo Fisher Scientific, Inc. | |
| | | |
| | Zimmer Biomet Holdings, Inc. | |
| | | |
| | | |
| | | |
| | | |
| | Honeywell International, Inc. | |
| | | |
| | Jacobs Engineering Group, Inc. | |
| | | |
| | Stanley Black & Decker, Inc. | |
| | | |
| | | |
| | | |
| | | |
| | | |
| | Information Technology—6.9% | |
| | Akamai Technologies, Inc. | |
| | | |
| | | |
| | | |
| | Fidelity National Information Services, Inc. | |
| | | |
Annual Shareholder Report
| | | |
| | | |
| | Information Technology—continued | |
| | | |
| | | |
| | | |
| | | |
| | | |
| | | |
| | | |
| | | |
| | | |
| | | |
| | | |
| | | |
| | | |
| | | |
| | | |
| | American Electric Power Co., Inc. | |
| | American Water Works Co., Inc. | |
| | | |
| | | |
| | | |
| | | |
| | | |
| | | |
| | | |
| | TOTAL COMMON STOCKS
(IDENTIFIED COST $492,818,826) | |
| | SHORT-TERM MUNICIPALS—0.2% | |
| | | |
| | Columbia, AL IDB PCRB (Alabama Power Co.), (Series C) Daily VRDNs, 0.160%, 11/2/2020 | |
| | Wilsonville, AL IDB (Alabama Power Co.), (Series D) (Gaston Plant) Daily VRDNs, 0.120%, 11/2/2020 | |
| | | |
| | | |
| | Allen County, OH (Bon Secours Mercy Health), (Series 2010C) Daily VRDNs, (BMO Harris Bank, N.A. LOC), 0.110%, 11/2/2020 | |
Annual Shareholder Report
| | | |
| | SHORT-TERM MUNICIPALS—continued | |
| | | |
| | Ohio State Higher Educational Facility Commission (Cleveland Clinic), (Series 2013B-2) Daily VRDNs, (Bank of New York Mellon, N.A. LIQ), 0.110%, 11/2/2020 | |
| | | |
| | | |
| | Philadelphia, PA Hospitals & Higher Education Facilities Authority (Children’s Hospital of Philadelphia), (Series 2002-B) Daily VRDNs, (Wells Fargo Bank, N.A. LIQ), 0.110%, 11/2/2020 | |
| | TOTAL SHORT-TERM MUNICIPALS
(IDENTIFIED COST $3,600,000) | |
| | TOTAL INVESTMENT IN SECURITIES—99.2%
(IDENTIFIED COST $1,262,225,032)5 | |
| | OTHER ASSETS AND LIABILITIES - NET—0.8%6 | |
| | | |
At October 31, 2020, the Fund had the following outstanding written option contract:
| | | | | |
| |
| | | | | |
(PREMIUMS RECEIVED $176,323) | |
At October 31, 2020, the Fund held no securities that are subject to the federal alternative minimum tax (AMT) (unaudited).
1
Denotes a restricted security that either: (a) cannot be offered for public sale without first being registered, or availing of an exemption from registration, under the Securities Act of 1933; or (b) is subject to a contractual restriction on public sales. At October 31, 2020, these restricted securities amounted to $19,843,736, which represented 1.4% of total net assets.
2
Non-income-producing security.
4
Current rate and current maturity or next reset date shown for floating rate notes and variable rate notes/demand instruments. Certain variable rate securities are not based on a published reference rate and spread but are determined by the issuer or agent and are based on current market conditions. These securities do not indicate a reference rate and spread in their description above.
5
The cost of investments for federal tax purposes amounts to $1,272,271,873.
6
Assets, other than investments in securities, less liabilities. See Statement of Assets and Liabilities.
Note: The categories of investments are shown as a percentage of total net assets at October 31, 2020.
Annual Shareholder Report
Various inputs are used in determining the value of the Fund’s investments. These inputs are summarized in the three broad levels listed below:
Level 1—quoted prices in active markets for identical securities.
Level 2—other significant observable inputs (including quoted prices for similar securities, interest rates, prepayment speeds, credit risk, etc.). Also includes securities valued at amortized cost.
Level 3—significant unobservable inputs (including the Fund’s own assumptions in determining the fair value of investments).
The inputs or methodology used for valuing securities are not an indication of the risk associated with investing in those securities.
The following is a summary of the inputs used, as of October 31, 2020, in valuing the Fund’s assets carried at fair value:
| | | | |
| | Level 2—
Other
Significant
Observable
Inputs | Level 3—
Significant
Unobservable
Inputs | |
| | | | |
| | | | |
| | | | |
| | | | |
| | | | |
| | | | |
| | | | |
| | | | |
Other Financial Instrument: | | | | |
| | | | |
| | | | |
| | | | |
| | | | |
TOTAL OTHER FINANCIAL INSTRUMENT | | | | |
Annual Shareholder Report
The following acronym(s) are used throughout this portfolio:
| |
| —Economic Development Authority |
| —Financial Guaranty Insurance Company |
| |
| |
| |
| —Health and Education Facilities Authority |
| —Health Facility Development Corporation |
| —Industrial Development Authority |
| —Industrial Development Bond |
| |
| |
| |
| |
| —Pollution Control Revenue |
| —Pollution Control Revenue Bonds |
| —Payment in Lieu of Taxes |
| |
| —Toll Equity Loan Agreement |
| —Transitional Finance Authority |
| |
| |
| |
| —Variable Rate Demand Notes |
See Notes which are an integral part of the Financial Statements
Annual Shareholder Report
Financial Highlights–Class A Shares
(For a Share Outstanding Throughout Each Period)
| | | | | |
Net Asset Value, Beginning of Period | | | | | |
Income From Investment Operations: | | | | | |
| | | | | |
Net realized and unrealized gain (loss) | | | | | |
TOTAL FROM INVESTMENT OPERATIONS | | | | | |
| | | | | |
Distributions from net investment income | | | | | |
Distributions from net realized gain | | | | | |
| | | | | |
Net Asset Value, End of Period | | | | | |
| | | | | |
Ratios to Average Net Assets: | | | | | |
| | | | | |
| | | | | |
Expense waiver/reimbursement5 | | | | | |
| | | | | |
Net assets, end of period (000 omitted) | | | | | |
| | | | | |
1
Per share number has been calculated using the average shares method.
2
Based on net asset value, which does not reflect the sales charge, redemption fee or contingent deferred sales charge, if applicable.
3
Amount does not reflect net expenses incurred by investment companies in which the Fund may invest.
4
The net expense ratio is calculated without reduction for expense offset arrangements. The net expense ratio is 1.00% for the years ended October 31, 2020, 2019 and 2018, respectively, after taking into account these expense reductions.
5
This expense decrease is reflected in both the net expense and net investment income ratios shown above. Amount does not reflect expense waiver/reimbursement recorded by investment companies in which the Fund may invest.
See Notes which are an integral part of the Financial Statements
Annual Shareholder Report
Financial Highlights–Class B Shares
(For a Share Outstanding Throughout Each Period)
| | | | | |
Net Asset Value, Beginning of Period | | | | | |
Income From Investment Operations: | | | | | |
| | | | | |
Net realized and unrealized gain (loss) | | | | | |
TOTAL FROM INVESTMENT OPERATIONS | | | | | |
| | | | | |
Distributions from net investment income | | | | | |
Distributions from net realized gain | | | | | |
| | | | | |
Net Asset Value, End of Period | | | | | |
| | | | | |
Ratios to Average Net Assets: | | | | | |
| | | | | |
| | | | | |
Expense waiver/reimbursement5 | | | | | |
| | | | | |
Net assets, end of period (000 omitted) | | | | | |
| | | | | |
1
Per share number has been calculated using the average shares method.
2
Based on net asset value, which does not reflect the sales charge, redemption fee or contingent deferred sales charge, if applicable.
3
Amount does not reflect net expenses incurred by investment companies in which the Fund may invest.
4
The net expense ratio is calculated without reduction for expense offset arrangements. The net expense ratio is 1.75% for the years ended October 31, 2020, 2019 and 2018, respectively, after taking into account these expense reductions.
5
This expense decrease is reflected in both the net expense and net investment income ratios shown above. Amount does not reflect expense waiver/reimbursement recorded by investment companies in which the Fund may invest.
See Notes which are an integral part of the Financial Statements
Annual Shareholder Report
Financial Highlights–Class C Shares
(For a Share Outstanding Throughout Each Period)
| | | | | |
Net Asset Value, Beginning of Period | | | | | |
Income From Investment Operations: | | | | | |
| | | | | |
Net realized and unrealized gain (loss) | | | | | |
TOTAL FROM INVESTMENT OPERATIONS | | | | | |
| | | | | |
Distributions from net investment income | | | | | |
Distributions from net realized gain | | | | | |
| | | | | |
Net Asset Value, End of Period | | | | | |
| | | | | |
Ratios to Average Net Assets: | | | | | |
| | | | | |
| | | | | |
Expense waiver/reimbursement5 | | | | | |
| | | | | |
Net assets, end of period (000 omitted) | | | | | |
| | | | | |
1
Per share number has been calculated using the average shares method.
2
Based on net asset value, which does not reflect the sales charge, redemption fee or contingent deferred sales charge, if applicable.
3
Amount does not reflect net expenses incurred by investment companies in which the Fund may invest.
4
The net expense ratio is calculated without reduction for expense offset arrangements. The net expense ratio is 1.75% for the years ended October 31, 2020, 2019 and 2018, respectively, after taking into account these expense reductions.
5
This expense decrease is reflected in both the net expense and net investment income ratios shown above. Amount does not reflect expense waiver/reimbursement recorded by investment companies in which the Fund may invest.
See Notes which are an integral part of the Financial Statements
Annual Shareholder Report
Financial Highlights–Class F Shares
(For a Share Outstanding Throughout Each Period)
| | | | | |
Net Asset Value, Beginning of Period | | | | | |
Income From Investment Operations: | | | | | |
| | | | | |
Net realized and unrealized gain (loss) | | | | | |
TOTAL FROM INVESTMENT OPERATIONS | | | | | |
| | | | | |
Distributions from net investment income | | | | | |
Distributions from net realized gain | | | | | |
| | | | | |
Net Asset Value, End of Period | | | | | |
| | | | | |
Ratios to Average Net Assets: | | | | | |
| | | | | |
| | | | | |
Expense waiver/reimbursement5 | | | | | |
| | | | | |
Net assets, end of period (000 omitted) | | | | | |
| | | | | |
1
Per share number has been calculated using the average shares method.
2
Based on net asset value, which does not reflect the sales charge, redemption fee or contingent deferred sales charge, if applicable.
3
Amount does not reflect net expenses incurred by investment companies in which the Fund may invest.
4
The net expense ratio is calculated without reduction for expense offset arrangements. The net expense ratio is 1.00% for the years ended October 31, 2020, 2019 and 2018, respectively, after taking into account these expense reductions.
5
This expense decrease is reflected in both the net expense and net investment income ratios shown above. Amount does not reflect expense waiver/reimbursement recorded by investment companies in which the Fund may invest.
See Notes which are an integral part of the Financial Statements
Annual Shareholder Report
Financial Highlights–Institutional Shares
(For a Share Outstanding Throughout Each Period)
| | | | | |
Net Asset Value, Beginning of Period | | | | | |
Income From Investment Operations: | | | | | |
| | | | | |
Net realized and unrealized gain (loss) | | | | | |
TOTAL FROM INVESTMENT OPERATIONS | | | | | |
| | | | | |
Distributions from net investment income | | | | | |
Distributions from net realized gain | | | | | |
| | | | | |
Net Asset Value, End of Period | | | | | |
| | | | | |
Ratios to Average Net Assets: | | | | | |
| | | | | |
| | | | | |
Expense waiver/reimbursement5 | | | | | |
| | | | | |
Net assets, end of period (000 omitted) | | | | | |
| | | | | |
1
Per share number has been calculated using the average shares method.
2
Based on net asset value.
3
Amount does not reflect net expenses incurred by investment companies in which the Fund may invest.
4
The net expense ratio is calculated without reduction for expense offset arrangements. The net expense ratio is 0.75% for the years ended October 31, 2020, 2019 and 2018, respectively, after taking into account these expense reductions.
5
This expense decrease is reflected in both the net expense and net investment income ratios shown above. Amount does not reflect expense waiver/reimbursement recorded by investment companies in which the Fund may invest.
See Notes which are an integral part of the Financial Statements
Annual Shareholder Report
Statement of Assets and LiabilitiesOctober 31, 2020
| | |
Investment in securities, at value (identified cost $1,262,225,032) | | |
| | |
| | |
Receivable for investments sold | | |
Receivable for shares sold | | |
| | |
| | |
Payable for investments purchased | | |
Payable for shares redeemed | | |
Written options outstanding, at value (premiums received $176,323) | | |
Payable for other service fees (Notes 2 and 5) | | |
Payable for distribution services fee (Note 5) | | |
Payable for portfolio accounting fees | | |
Payable for investment adviser fee (Note 5) | | |
Payable for administrative fee (Note 5) | | |
Accrued expenses (Note 5) | | |
| | |
Net assets for 108,045,780 shares outstanding | | |
| | |
| | |
Total distributable earnings (loss) | | |
| | |
Annual Shareholder Report
Statement of Assets and Liabilities–continued
Net Asset Value, Offering Price and Redemption
Proceeds Per Share: | | |
| | |
Net asset value per share ($577,399,598 ÷ 44,348,364 shares outstanding), no par value, unlimited shares authorized | | |
Offering price per share (100/94.50 of $13.02) | | |
Redemption proceeds per share | | |
| | |
Net asset value per share ($9,822,291 ÷ 754,698 shares outstanding), no par value, unlimited shares authorized | | |
| | |
Redemption proceeds per share (94.50/100 of $13.01) | | |
| | |
Net asset value per share ($212,844,507 ÷ 16,363,492 shares outstanding), no par value, unlimited shares authorized | | |
| | |
Redemption proceeds per share (99.00/100 of $13.01) | | |
| | |
Net asset value per share ($238,542,742 ÷ 18,322,591 shares outstanding), no par value, unlimited shares authorized | | |
Offering price per share (100/99.00 of $13.02) | | |
Redemption proceeds per share (99.00/100 of $13.02) | | |
| | |
Net asset value per share ($367,770,835 ÷ 28,256,635 shares outstanding), no par value, unlimited shares authorized | | |
| | |
Redemption proceeds per share | | |
See Notes which are an integral part of the Financial Statements
Annual Shareholder Report
Statement of OperationsYear Ended October 31, 2020
| | | |
| | | |
Dividends (net of foreign tax withheld of $194,083) | | | |
| | | |
| | | |
Investment adviser fee (Note 5) | | | |
Administrative fee (Note 5) | | | |
| | | |
| | | |
Directors’/Trustees’ fees (Note 5) | | | |
| | | |
| | | |
Distribution services fee (Note 5) | | | |
Other service fees (Notes 2 and 5) | | | |
Portfolio accounting fees | | | |
| | | |
| | | |
| | | |
| | | |
| | | |
Waiver of investment adviser fee (Note 5) | | | |
Reduction of custodian fees (Note 6) | | | |
TOTAL WAIVER AND REDUCTION | | | |
| | | |
| | | |
Annual Shareholder Report
Statement of Operations–continued
Realized and Unrealized Gain (Loss) on Investments, Futures Contracts, Written Options and Foreign Currency Transactions: | | | |
Net realized gain on investments and foreign currency transactions | | | |
Net realized loss on futures contracts | | | |
Net realized gain on written options | | | |
Net change in unrealized appreciation of investments and translation of assets and liabilities in foreign currency | | | |
Net change in unrealized depreciation of futures contracts | | | |
Net change in unrealized appreciation of written options | | | |
Net realized and unrealized gain (loss) on investments, futures contracts, written options and foreign currency transactions | | | |
Change in net assets resulting from operations | | | |
See Notes which are an integral part of the Financial Statements
Annual Shareholder Report
Statement of Changes in Net Assets
| | |
Increase (Decrease) in Net Assets | | |
| | |
| | |
| | |
Net change in unrealized appreciation/depreciation | | |
CHANGE IN NET ASSETS RESULTING FROM OPERATIONS | | |
Distributions to Shareholders: | | |
| | |
| | |
| | |
| | |
| | |
CHANGE IN NET ASSETS RESULTING FROM DISTRIBUTIONS TO SHAREHOLDERS | | |
| | |
Proceeds from sale of shares | | |
Net asset value of shares issued to shareholders in payment of distributions declared | | |
| | |
CHANGE IN NET ASSETS RESULTING FROM SHARE TRANSACTIONS | | |
| | |
| | |
| | |
| | |
See Notes which are an integral part of the Financial Statements
Annual Shareholder Report
Notes to Financial Statements
October 31, 2020
1. ORGANIZATION
Federated Hermes Income Securities Trust (the “Trust”) is registered under the Investment Company Act of 1940, as amended (the “Act”), as an open-end management investment company. The Trust consists of seven portfolios. The financial statements included herein are only those of Federated Hermes Muni and Stock Advantage Fund (the “Fund”), a diversified portfolio. The financial statements of the other portfolios are presented separately. The assets of each portfolio are segregated and a shareholder’s interest is limited to the portfolio in which shares are held. Each portfolio pays its own expenses. The Fund offers five classes of shares: Class A Shares, Class B Shares, Class C Shares, Class F Shares and Institutional Shares. All shares of the Fund have equal rights with respect to voting, except on class-specific matters. The primary investment objective of the Fund is to provide tax-advantaged income with a secondary objective of capital appreciation.
Class B Shares are closed to new accounts, new investors and new purchases by existing shareholders (excluding reinvestment of dividends and capital gains). Class B Shares of the Fund may be exchanged for Class B Shares of any other Federated Hermes fund.
Prior to June 29, 2020, the names of the Trust and Fund were Federated Income Securities Trust and Federated Muni and Stock Advantage Fund, respectively.
2. SIGNIFICANT ACCOUNTING POLICIES
The following is a summary of significant accounting policies consistently followed by the Fund in the preparation of its financial statements. These policies are in conformity with U.S. generally accepted accounting principles (GAAP).
Investment Valuation
In calculating its net asset value (NAV), the Fund generally values investments as follows:
■ Fixed-income securities are fair valued using price evaluations provided by a pricing service approved by the Fund’s Board of Trustees (the “Trustees”).
■ Equity securities listed on an exchange or traded through a regulated market system are valued at their last reported sale price or official closing price in their principal exchange or market.
■ Derivative contracts listed on exchanges are valued at their reported settlement or closing price, except that options are valued at the mean of closing bid and asked quotations.
■ Over-the-counter (OTC) derivative contracts are fair valued using price evaluations provided by a pricing service approved by the Trustees.
■ Shares of other mutual funds or non-exchange-traded investment companies are valued based upon their reported NAVs.
■ For securities that are fair valued in accordance with procedures established by and under the general supervision of the Trustees, certain factors may be considered such as: the last traded or purchase price of the security, information obtained by contacting the issuer or dealers, analysis of the issuer’s financial statements or other available documents, fundamental analytical data, the nature and duration of restrictions on disposition, the movement of the market in which the security is
Annual Shareholder Report
normally traded, public trading in similar securities or derivative contracts of the issuer or comparable issuers, movement of a relevant index, or other factors including but not limited to industry changes and relevant government actions.
If any price, quotation, price evaluation or other pricing source is not readily available when the NAV is calculated, if the Fund cannot obtain price evaluations from a pricing service or from more than one dealer for an investment within a reasonable period of time as set forth in the Fund’s valuation policies and procedures, or if information furnished by a pricing service, in the opinion of the valuation committee (“Valuation Committee”), is deemed not representative of the fair value of such security, the Fund uses the fair value of the investment determined in accordance with the procedures described below. There can be no assurance that the Fund could obtain the fair value assigned to an investment if it sold the investment at approximately the time at which the Fund determines its NAV per share, and the actual value obtained could be materially different.
Fair Valuation and Significant Events Procedures
The Trustees have ultimate responsibility for determining the fair value of investments for which market quotations are not readily available. The Trustees have appointed a Valuation Committee comprised of officers of the Fund, Federated Equity Management Company of Pennsylvania (the “Adviser”) and certain of the Adviser’s affiliated companies to assist in determining fair value and in overseeing the calculation of the NAV. The Trustees have also authorized the use of pricing services recommended by the Valuation Committee to provide fair value evaluations of the current value of certain investments for purposes of calculating the NAV. The Valuation Committee employs various methods for reviewing third-party pricing-service evaluations including periodic reviews of third-party pricing services’ policies, procedures and valuation methods (including key inputs, methods, models and assumptions), transactional back-testing, comparisons of evaluations of different pricing services and review of price challenges by the Adviser based on recent market activity. In the event that market quotations and price evaluations are not available for an investment, the Valuation Committee determines the fair value of the investment in accordance with procedures adopted by the Trustees. The Trustees periodically review and approve the fair valuations made by the Valuation Committee and any changes made to the procedures.
Factors considered by pricing services in evaluating an investment include the yields or prices of investments of comparable quality, coupon, maturity, call rights and other potential prepayments, terms and type, reported transactions, indications as to values from dealers and general market conditions. Some pricing services provide a single price evaluation reflecting the bid-side of the market for an investment (a “bid” evaluation). Other pricing services offer both bid evaluations and price evaluations indicative of a price between the prices bid and asked for the investment (a “mid” evaluation). The Fund normally uses bid evaluations for any U.S. Treasury and Agency securities, mortgage-backed securities and municipal securities. The Fund normally uses mid evaluations for any other types of fixed-income securities and any OTC derivative contracts. In the event that market quotations and price evaluations are not available for an investment, the fair value of the investment is determined in accordance with procedures adopted by the Trustees.
Annual Shareholder Report
The Trustees also have adopted procedures requiring an investment to be priced at its fair value whenever the Adviser determines that a significant event affecting the value of the investment has occurred between the time as of which the price of the investment would otherwise be determined and the time as of which the NAV is computed. An event is considered significant if there is both an affirmative expectation that the investment’s value will change in response to the event and a reasonable basis for quantifying the resulting change in value. Examples of significant events that may occur after the close of the principal market on which a security is traded, or after the time of a price evaluation provided by a pricing service or a dealer, include:
■ With respect to securities traded principally in foreign markets, significant trends in U.S. equity markets or in the trading of foreign securities index futures contracts;
■ Political or other developments affecting the economy or markets in which an issuer conducts its operations or its securities are traded;
■ Announcements concerning matters such as acquisitions, recapitalizations, litigation developments, or a natural disaster affecting the issuer’s operations or regulatory changes or market developments affecting the issuer’s industry.
The Trustees have adopted procedures whereby the Valuation Committee uses a pricing service to provide factors to update the fair value of equity securities traded principally in foreign markets from the time of the close of their respective foreign stock exchanges to the pricing time of the Fund. For other significant events, the Fund may seek to obtain more current quotations or price evaluations from alternative pricing sources. If a reliable alternative pricing source is not available, the Fund will determine the fair value of the investment in accordance with the fair valuation procedures approved by the Trustees. The Trustees have ultimate responsibility for any fair valuations made in response to a significant event.
Investment Income, Gains and Losses, Expenses and Distributions
Investment transactions are accounted for on a trade-date basis. Realized gains and losses from investment transactions are recorded on an identified-cost basis. Interest income and expenses are accrued daily. Dividend income and distributions to shareholders are recorded on the ex-dividend date. Distributions of net investment income, if any, are declared and paid monthly. Non-cash dividends included in dividend income, if any, are recorded at fair value. Amortization/accretion of premium and discount is included in investment income. Investment income, realized and unrealized gains and losses, and certain fund-level expenses are allocated to each class based on relative average daily net assets, except that select classes will bear certain expenses unique to those classes. The detail of the total fund expense waiver and reduction of $1,100,662 is disclosed in Note 5 and Note 6.
Dividends are declared separately for each class. No class has preferential dividend rights; differences in per share dividend rates are generally due to differences in separate class expenses.
Annual Shareholder Report
Other Service Fees
The Fund may pay other service fees up to 0.25% of the average daily net assets of the Fund’s Class A Shares, Class B Shares, Class C Shares and Class F Shares to unaffiliated financial intermediaries or to Federated Shareholder Services Company (FSSC) for providing services to shareholders and maintaining shareholder accounts. Subject to the terms described in the Expense Limitation note, FSSC may voluntarily reimburse the Fund for other service fees. For the year ended October 31, 2020, other service fees for the Fund were as follows:
| Other
Service Fees
Incurred |
| |
| |
| |
| |
| |
Federal Taxes
It is the Fund’s policy to comply with the Subchapter M provision of the Internal Revenue Code (the “Code”) and to distribute to shareholders each year substantially all of its income. Accordingly, no provision for federal income tax is necessary. As of and during the year ended October 31, 2020, the Fund did not have a liability for any uncertain tax positions. The Fund recognizes interest and penalties, if any, related to tax liabilities as income tax expense in the Statement of Operations. As of October 31, 2020, tax years 2017 through 2020 remain subject to examination by the Fund’s major tax jurisdictions, which include the United States of America and the Commonwealth of Massachusetts.
The Fund may be subject to taxes imposed by governments of countries in which it invests. Such taxes are generally based on either income or gains earned or repatriated. The Fund accrues and applies such taxes to net investment income, net realized gains and net unrealized gains as income and/or gains are earned.
When-Issued and Delayed-Delivery Transactions
The Fund may engage in when-issued or delayed-delivery transactions. The Fund records when-issued securities on the trade date and maintains security positions such that sufficient liquid assets will be available to make payment for the securities purchased. Securities purchased on a when-issued or delayed-delivery basis are marked to market daily and begin earning interest on the settlement date. Losses may occur on these transactions due to changes in market conditions or the failure of counterparties to perform under the contract.
Futures Contracts
The Fund purchases and sells financial futures contracts to manage currency, duration market, sector/asset class and yield curve risks. Upon entering into a financial futures contract with a broker, the Fund is required to deposit with a broker, either U.S. government securities or a specified amount of cash, which is shown as due from broker in the Statement of Assets and Liabilities. Futures contracts are valued daily and
Annual Shareholder Report
unrealized gains or losses are recorded in a “variation margin” account. The Fund receives from or pays to the broker a specified amount of cash based upon changes in the variation margin account. When a contract is closed, the Fund recognizes a realized gain or loss. Futures contracts have market risks, including the risk that the change in the value of the contract may not correlate with the changes in the value of the underlying securities. There is minimal counterparty risk to the Fund since futures contracts are exchange traded and the exchange’s clearing house, as counterparty to all exchange traded futures contracts, guarantees the futures contracts against default.
At October 31, 2020, the Fund had no outstanding futures contracts.
The average notional value of short futures contracts held by the Fund throughout the period was $2,335,231. This is based on amounts held as of each month end throughout the fiscal year.
Foreign Currency Translation
The accounting records of the Fund are maintained in U.S. dollars. All assets and liabilities denominated in foreign currencies are translated into U.S. dollars based on the rates of exchange of such currencies against U.S. dollars on the date of valuation. Purchases and sales of securities, income and expenses are translated at the rate of exchange quoted on the respective date that such transactions are recorded. The Fund does not isolate that portion of the results of operations resulting from changes in foreign exchange rates on investments from the fluctuations arising from changes in market prices of securities held. Such fluctuations are included with the net realized and unrealized gain or loss from investments.
Reported net realized foreign exchange gains or losses arise from sales of foreign currencies, currency gains or losses realized between the trade and settlement dates on securities transactions, the difference between the amounts of dividends, interest and foreign withholding taxes recorded on the Fund’s books and the U.S. dollar equivalent of the amounts actually received or paid. Net unrealized foreign exchange gains and losses arise from changes in the value of assets and liabilities other than investments in securities at period end, resulting from changes in the exchange rate.
Restricted Securities
The Fund may purchase securities which are considered restricted. Restricted securities are securities that either: (a) cannot be offered for public sale without first being registered or being able to take advantage of an exemption from registration, under the Securities Act of 1933; or (b) are subject to contractual restrictions on public sales. In some cases, when a security cannot be offered for public sale without first being registered, the issuer of the restricted security has agreed to register such securities for resale, at the issuer’s expense, either upon demand by the Fund or in connection with another registered offering of the securities. Many such restricted securities may be resold in the secondary market in transactions exempt from registration. Restricted securities may be determined to be liquid under criteria established by the Trustees. The Fund will not incur any registration costs upon such resales. The Fund’s restricted securities, like other securities, are priced in accordance with procedures established by and under the general supervision of the Trustees.
Annual Shareholder Report
Additional information on restricted securities held at October 31, 2020, is as follows:
| | | |
California School Finance Authority (KIPP LA), School Facility Revenue Bonds (Series 2014A), 5.000%, 7/1/2034 | | | |
California School Finance Authority (KIPP LA), School Facility Revenue Bonds (Series 2014A), 5.125%, 7/1/2044 | | | |
California School Finance Authority (KIPP LA), School Facility Revenue Bonds (Series 2015A), 5.000%, 7/1/2045 | | | |
California Statewide Communities Development Authority (899 Charleston LLC), Revenue Refunding Bonds (Series 2014A), 5.250%, 11/1/2044 | | | |
Collier County, FL IDA (Arlington of Naples), Continuing Care Community Revenue Bonds (Series 2013A), (Original Issue Yield: 8.250%), 8.125%, 5/15/2044 | | | |
Kansas City, MO Redevelopment Authority (Kansas City Convention Center Headquarters Hotel CID), Revenue Bonds (Series 2018B), (Original Issue Yield: 5.079%), 5.000%, 2/1/2050 | | | |
Maricopa County, AZ, IDA (Paradise Schools), Revenue Refunding Bonds, 5.000%, 7/1/2036 | | | |
New Hampshire Health and Education Facilities Authority (Hillside Village), Revenue Bonds (Series 2017A), 6.125%, 7/1/2037 | | | |
New York Liberty Development Corporation (3 World Trade Center), Revenue Bonds (Series 2014 Class 1), 5.000%, 11/15/2044 | | | |
Washington State Housing Finance Commission (Presbyterian Retirement Communities Northwest), Revenue Bonds (Series 2016), 5.000%, 1/1/2031 | | | |
Washington State Housing Finance Commission (Rockwood Retirement Communities), Nonprofit Housing Revenue & Refunding Revenue Bonds (Series 2014A), (Original Issue Yield: 7.400%), 7.375%, 1/1/2044 | | | |
Option Contracts
The Fund buys or sells put and call options to manage security, market and sector/asset class risks. The seller (“writer”) of an option receives a payment or premium, from the buyer, which the writer keeps regardless of whether the buyer exercises the option. When the Fund writes a put or call option, an amount equal to the premium received is recorded as a liability and subsequently marked to market to reflect the current value of the option written. Premiums received from writing options which expire are treated as
Annual Shareholder Report
realized gains. The Fund, as a writer of an option, bears the market risk of an unfavorable change in the price of the underlying reference instrument. When the Fund purchases a put or call option, an amount equal to the premium paid is recorded as an increase to the cost of the investment and subsequently marked to market to reflect the current value of the option purchased. Premiums paid for purchasing options which expire are treated as realized losses. Premiums received/paid for writing/purchasing options which are exercised or closed are added to the proceeds or offset against amounts paid on the underlying reference instrument to determine the realized gain or loss. The risk associated with purchasing put and call options is limited to the premium paid. Options can trade on securities or commodities exchanges. In this case, the exchange sets all the terms of the contract except for the price. Most exchanges require investors to maintain margin accounts through their brokers to cover their potential obligations to the exchange. This protects investors against potential defaults by the counterparty.
At October 31, 2020, the Fund had no outstanding purchased options contracts.
Written option contracts, at value at period end are listed after the Fund’s Portfolio of Investments.
The average market value of purchased and written options held by the Fund throughout the period was $20,017 and $174,031, respectively. This is based on amounts held as of each month end throughout the fiscal year.
Additional Disclosure Related to Derivative Instruments
Fair Value of Derivative Instruments | |
| Statement of
Assets and
Liabilities
Location | |
Derivatives not accounted for as hedging instruments under ASC Topic 815 | | |
| Written Options
outstanding,
at value | |
Annual Shareholder Report
The Effect of Derivative Instruments on the Statement of Operations for the Year Ended October 31, 2020
Amount of Realized Gain or (Loss) on Derivatives Recognized in Income |
| |
| |
| |
| |
| |
1
The net realized loss on Purchased Options is found within the Net realized gain on investments and foreign currency transactions on the Statement of Operations.
Change in Unrealized Appreciation or (Depreciation) on Derivatives Recognized in Income |
| |
| |
| |
| |
Other
The preparation of financial statements in conformity with GAAP requires management to make estimates and assumptions that affect the amounts of assets, liabilities, expenses and revenues reported in the financial statements. Actual results could differ materially from those estimated. The Fund applies investment company accounting and reporting guidance.
3. SHARES OF BENEFICIAL INTEREST
The following tables summarize share activity:
| | |
| | | | |
| | | | |
Shares issued to shareholders in payment of distributions declared | | | | |
| | | | |
NET CHANGE RESULTING FROM CLASS A SHARE TRANSACTIONS | | | | |
Annual Shareholder Report
| | |
| | | | |
| | | | |
Shares issued to shareholders in payment of distributions declared | | | | |
| | | | |
NET CHANGE RESULTING FROM CLASS B SHARE TRANSACTIONS | | | | |
| | |
| | | | |
| | | | |
Shares issued to shareholders in payment of distributions declared | | | | |
| | | | |
NET CHANGE RESULTING FROM CLASS C SHARE TRANSACTIONS | | | | |
| | |
| | | | |
| | | | |
Shares issued to shareholders in payment of distributions declared | | | | |
| | | | |
NET CHANGE RESULTING FROM CLASS F SHARE TRANSACTIONS | | | | |
| | |
| | | | |
| | | | |
Shares issued to shareholders in payment of distributions declared | | | | |
| | | | |
NET CHANGE RESULTING FROM INSTITUTIONAL SHARE TRANSACTIONS | | | | |
NET CHANGE RESULTING FROM TOTAL FUND SHARE TRANSACTIONS | | | | |
Annual Shareholder Report
4. FEDERAL TAX INFORMATION
The tax character of distributions as reported on the Statement of Changes in Net Assets for the years ended October 31, 2020 and 2019, was as follows:
1
For tax purposes, short-term capital gains are considered ordinary income distributions.
As of October 31, 2020, the components of distributable earnings on a tax-basis were as follows:
Undistributed tax-exempt income | |
Undistributed ordinary income | |
Net unrealized appreciation | |
Capital loss carryforwards | |
The difference between book-basis and tax-basis net unrealized appreciation is attributable to differing treatments for the deferral of losses on wash sales, defaulted bonds, straddle loss deferrals and discount accretion/premium amortization on debt securities.
At October 31, 2020, the cost of investments for federal tax purposes was $1,272,271,873. The net unrealized appreciation of investments for federal tax purposes was $121,979,080. This consists of net unrealized appreciation from investments for those securities having an excess of value over cost of $145,939,894 and net unrealized depreciation from investments for those securities having an excess of cost over value of $23,960,814.
As of October 31, 2020, the Fund had a capital loss carryforward of $27,574,474 which will reduce the Fund’s taxable income arising from future net realized gains on investments, if any, to the extent permitted by the Code, thereby reducing the amount of distributions to shareholders which would otherwise be necessary to relieve the Fund of any liability for federal income tax. Pursuant to the Code, these net capital losses retain their character as either short-term or long-term and do not expire.
The following schedule summarizes the Fund’s capital loss carryforwards:
Capital loss carryforwards of $16,345,087 were utilized during the year ended October 31, 2020.
At October 31, 2020, for federal tax purposes, the Fund had $1,228,567 in straddle loss deferrals.
Annual Shareholder Report
5. INVESTMENT ADVISER FEE AND OTHER TRANSACTIONS WITH AFFILIATES
Investment Adviser Fee
The advisory agreement between the Fund and the Adviser provides for an annual fee equal to 0.65% of the Fund’s average daily net assets. Subject to the terms described in the Expense Limitation note, the Adviser may voluntarily choose to waive any portion of its fee. For the year ended October 31, 2020, the Adviser waived $1,097,835 of its fee.
Certain of the Fund’s assets are managed by Federated Investment Management Company (the “Sub-Adviser”). Under the terms of a sub-advisory agreement between the Adviser and the Sub-Adviser, the Sub-Adviser receives an allocable portion of the Adviser’s fee. The fee is paid by the Adviser out of its resources and is not an incremental Fund expense. For the year ended October 31, 2020, the Sub-Adviser earned a fee of $2,103,970.
Administrative Fee
Federated Administrative Services (FAS), under the Administrative Services Agreement, provides the Fund with administrative personnel and services. For purposes of determining the appropriate rate breakpoint, “Investment Complex” is defined as all of the Federated Hermes Funds subject to a fee under the Administrative Services Agreement. The fee paid to FAS is based on the average daily net assets of the Investment Complex as specified below:
| Average Daily Net Assets
of the Investment Complex |
| on assets up to $50 billion |
| on assets over $50 billion |
Subject to the terms described in the Expense Limitation note, FAS may voluntarily choose to waive any portion of its fee. For the year ended October 31, 2020, the annualized fee paid to FAS was 0.078% of average daily net assets of the Fund.
In addition, FAS may charge certain out-of-pocket expenses to the Fund.
Distribution Services Fee
The Fund has adopted a Distribution Plan (the “Plan”) pursuant to Rule 12b-1 under the Act. Under the terms of the Plan, the Fund will compensate Federated Securities Corp. (FSC), the principal distributor, from the daily net assets of the Fund’s Class A Shares, Class B Shares and Class C Shares to finance activities intended to result in the sale of these shares. The Plan provides that the Fund may incur distribution expenses at the following percentages of average daily net assets annually, to compensate FSC:
| Percentage of Average Daily
Net Assets of Class |
| |
| |
| |
Annual Shareholder Report
Subject to the terms described in the Expense Limitation note, FSC may voluntarily choose to waive any portion of its fee. For the year ended October 31, 2020, distribution services fees for the Fund were as follows:
| Distribution
Services Fees
Incurred |
| |
| |
| |
When FSC receives fees, it may pay some or all of them to financial intermediaries whose customers purchase shares. For the year ended October 31, 2020, FSC retained $268,587 of fees paid by the Fund. For the year ended October 31, 2020, the Fund’s Class A Shares did not incur a distribution services fee; however, it may begin to incur this fee upon approval of the Trustees.
Sales Charges
Front-end sales charges and contingent deferred sales charges (CDSC) do not represent expenses of the Fund. They are deducted from the proceeds of sales of Fund shares prior to investment or from redemption proceeds prior to remittance, as applicable. For the year ended October 31, 2020, FSC retained $82,342 in sales charges from the sale of Class A Shares. FSC also retained $22,011, $59,898, $22,058, and $60,029 relating to redemptions of Class A Shares, Class B Shares, Class C Shares and Class F Shares, respectively.
Other Service Fees
For the year ended October 31, 2020, FSSC received $39,582 of the other service fees disclosed in Note 2.
Expense Limitation
The Adviser and certain of its affiliates (which may include FSC, FAS and FSSC) on their own initiative have agreed to waive certain amounts of their respective fees and/or reimburse expenses. Total annual fund operating expenses (as shown in the financial highlights, excluding interest expense, extraordinary expenses and proxy-related expenses, paid by the Fund, if any) paid by the Fund’s Class A Shares, Class B Shares, Class C Shares, Class F Shares and Institutional Shares (after the voluntary waivers and reimbursements) will not exceed 1.00%, 1.75%, 1.75%, 1.00% and 0.75% (the “Fee Limit”), respectively, up to but not including the later of (the “Termination Date”): (a) January 1, 2022; or (b) the date of the Fund’s next effective Prospectus. While the Adviser and its applicable affiliates currently do not anticipate terminating or increasing these arrangements prior to the Termination Date, these arrangements may only be terminated or the Fee Limit increased prior to the Termination Date with the agreement of the Trustees.
Annual Shareholder Report
Interfund Transactions
During the year ended October 31, 2020, the Fund engaged in purchase and sale transactions with funds that have a common investment adviser (or affiliated investment advisers), common Directors/Trustees and/or common Officers. These purchase and sale transactions complied with Rule 17a-7 under the Act and amounted to $293,868,720 and $275,131,811, respectively. Net realized gain recognized on these transactions was $3,360.
Directors’/Trustees’ and Miscellaneous Fees
Certain Officers and Trustees of the Fund are Officers and Directors or Trustees of certain of the above companies. To efficiently facilitate payment, Independent Directors’/Trustees’ fees and certain expenses related to conducting meetings of the Directors/Trustees and other miscellaneous expenses are paid by an affiliate of the Adviser which in due course are reimbursed by the Fund. These expenses related to conducting meetings of the Directors/Trustees and other miscellaneous expenses may be included in Accrued and Miscellaneous Expenses on the Statement of Assets and Liabilities and Statement of Operations, respectively.
6. EXPENSE REDUCTION
Through arrangements with the Fund’s custodian, net credits realized as a result of uninvested cash balances were used to reduce custody expenses. For the year ended October 31, 2020, the Fund’s expenses were reduced by $2,827 under these arrangements.
7. Investment TRANSACTIONS
Purchases and sales of investments, excluding long-term U.S. government securities and short-term obligations, for the year ended October 31, 2020, were as follows:
8. LINE OF CREDIT
The Fund participates with certain other Federated Hermes Funds, on a several basis, in an up to $500,000,000 unsecured, 364-day, committed, revolving line of credit (LOC) agreement dated June 24, 2020. The LOC was made available to temporarily finance the repurchase or redemption of shares of the Fund, failed trades, payment of dividends, settlement of trades and for other short-term, temporary or emergency general business purposes. The Fund cannot borrow under the LOC if an inter-fund loan is outstanding. The Fund’s ability to borrow under the LOC also is subject to the limitations of the Act and various conditions precedent that must be satisfied before the Fund can borrow. Loans under the LOC are charged interest at a fluctuating rate per annum equal to the highest, on any day, of (a) (i) the federal funds effective rate, (ii) the one month London Interbank Offered Rate (LIBOR), or a replacement rate as appropriate, and (iii) 0.0%, plus (b) a margin. Any fund eligible to borrow under the LOC pays its pro rata share of an upfront fee, and its pro rata share of a commitment fee based on the amount of the lenders’ commitment that has not been utilized, quarterly in arrears and at maturity. As of October 31, 2020, the Fund had no outstanding loans. During the year ended October 31, 2020, the Fund did not utilize the LOC.
Annual Shareholder Report
9. INTERFUND LENDING
Pursuant to an Exemptive Order issued by the Securities and Exchange Commission (SEC), the Fund, along with other funds advised by subsidiaries of Federated Hermes, Inc., may participate in an interfund lending program. This program provides an alternative credit facility allowing the Fund to borrow from other participating affiliated funds. As of October 31, 2020, there were no outstanding loans. During the year ended October 31, 2020, the program was not utilized.
10. OTHER MATTERS
An outbreak of respiratory disease caused by a novel coronavirus was first detected in China in late 2019 and subsequently spread globally. As of the date of the issuance of these financial statements, this coronavirus has resulted in closing borders, enhanced health screenings, healthcare service preparation and delivery, quarantines, cancellations, and disruptions to supply chains, workflow operations and consumer activity, as well as general concern and uncertainty. The impact of this coronavirus may be short term or may last for an extended period of time and has resulted in a substantial economic downturn. Health crises caused by outbreaks, such as the coronavirus outbreak, may exacerbate other pre-existing political, social and economic risks. The impact of this outbreak, and other epidemics and pandemics that may arise in the future, could continue to negatively affect the worldwide economy, as well as the economies of individual countries, individual companies (including certain Fund service providers and issuers of the Fund’s investments) and the markets in general in significant and unforeseen ways. Any such impact could adversely affect the Fund’s performance.
11. FEDERAL TAX INFORMATION (UNAUDITED)
For the fiscal year ended October 31, 2020, 58.92% of distributions from net investment income is exempt from federal income tax, other than the federal AMT.
For the fiscal year ended October 31, 2020, 100% of total ordinary income distributions made by the Fund are qualifying dividends which may be subject to a maximum tax rate of 15%, as provided for by the Jobs and Growth Tax Relief Act of 2003. Complete information is reported in conjunction with the reporting of your distributions on Form 1099-DIV.
Of the ordinary income distributions made by the Fund during the year ended October 31, 2020, 100% qualify for the dividend received deduction available to corporate shareholders.
Annual Shareholder Report
Report of Independent Registered Public Accounting Firm
TO THE BOARD OF Trustees OF Federated hermes Income Securities Trust AND SHAREHOLDERS OF Federated HERMES Muni and Stock Advantage Fund:
Opinion on the Financial Statements
We have audited the accompanying statement of assets and liabilities of Federated Hermes Muni and Stock Advantage Fund (formerly, Federated Muni and Stock Advantage Fund) (the “Fund”) (one of the portfolios constituting Federated Hermes Income Securities Trust (formerly, Federated Income Securities Trust) (the “Trust”)), including the portfolio of investments, as of October 31, 2020, and the related statement of operations for the year then ended, the statement of changes in net assets for each of the two years in the period then ended, the financial highlights for each of the five years in the period then ended and the related notes (collectively referred to as the “financial statements”). In our opinion, the financial statements present fairly, in all material respects, the financial position of the Fund (one of the portfolios constituting Federated Hermes Income Securities Trust) at October 31, 2020, the results of its operations for the year then ended, the changes in its net assets for each of the two years in the period then ended and its financial highlights for each of the five years in the period then ended, in conformity with U.S. generally accepted accounting principles.
Basis for Opinion
These financial statements are the responsibility of the Trust’s management. Our responsibility is to express an opinion on the Fund’s financial statements based on our audits We are a public accounting firm registered with the Public Company Accounting Oversight Board (United States) (“PCAOB”) and are required to be independent with respect to the Trust in accordance with the U.S. federal securities laws and the applicable rules and regulations of the Securities and Exchange Commission and the PCAOB.
We conducted our audits in accordance with standards of the PCAOB. Those standards require that we plan and perform the audit to obtain reasonable assurance about whether the financial statements are free of material misstatement, whether due to error or fraud. The Trust is not required to have, nor were we engaged to perform, an audit of the Trust’s internal control over financial reporting. As part of our audits, we are required to obtain an understanding of internal control over financial reporting, but not for the purpose of expressing an opinion on the effectiveness of the Trust’s internal control over financial reporting. Accordingly, we express no such opinion.
Annual Shareholder Report
Our audits included performing procedures to assess the risks of material misstatement of the financial statements, whether due to error or fraud, and performing procedures that respond to those risks. Such procedures included examining, on a test basis, evidence regarding the amounts and disclosures in the financial statements. Our procedures included confirmation of securities owned as of October 31, 2020, by correspondence with the custodian and others or by other appropriate auditing procedures where replies from others were not received. Our audits also included evaluating the accounting principles used and significant estimates made by management, as well as evaluating the overall presentation of the financial statements. We believe that our audits provide a reasonable basis for our opinion. 
We have served as the auditor of one or more Federated Hermes investment companies since 1979.
Boston, Massachusetts
December 23, 2020
Annual Shareholder Report
Shareholder Expense Example
As a shareholder of the Fund, you incur two types of costs: (1) transaction costs, including sales charges (loads) on purchase or redemption payments; and (2) ongoing costs, including management fees and to the extent applicable, distribution (12b-1) fees and/or other service fees and other Fund expenses. This Example is intended to help you to understand your ongoing costs (in dollars) of investing in the Fund and to compare these costs with the ongoing costs of investing in other mutual funds. It is based on an investment of $1,000 invested at the beginning of the period and held for the entire period from May 1, 2020 to October 31, 2020.
ACTUAL EXPENSES
The first section of the table below provides information about actual account values and actual expenses. You may use the information in this section, together with the amount you invested, to estimate the expenses that you incurred over the period. Simply divide your account value by $1,000 (for example, an $8,600 account value divided by $1,000 = 8.6), then multiply the result by the number in the first section under the heading entitled “Expenses Paid During Period” to estimate the expenses attributable to your investment during this period.
HYPOTHETICAL EXAMPLE FOR COMPARISON PURPOSES
The second section of the table below provides information about hypothetical account values and hypothetical expenses based on the Fund’s actual expense ratio and an assumed rate of return of 5% per year before expenses, which is not the Fund’s actual return. Thus, you should not use the hypothetical account values and expenses to estimate the actual ending account balance or your expenses for the period. Rather, these figures are required to be provided to enable you to compare the ongoing costs of investing in the Fund with other funds. To do so, compare this 5% hypothetical example with the 5% hypothetical examples that appear in the shareholder reports of the other funds.
Annual Shareholder Report
Please note that the expenses shown in the table are meant to highlight your ongoing costs only and do not reflect any transaction costs, such as sales charges (loads) on purchase or redemption payments. Therefore, the second section of the table is useful in comparing ongoing costs only, and will not help you determine the relative total costs of owning different funds. In addition, if these transaction costs were included, your costs would have been higher.
| Beginning
Account Value
5/1/2020 | Ending
Account Value
10/31/2020 | Expenses Paid
During Period1 |
| | | |
| | | |
| | | |
| | | |
| | | |
| | | |
Hypothetical (assuming a 5% return
before expenses): | | | |
| | | |
| | | |
| | | |
| | | |
| | | |
1
Expenses are equal to the Fund’s annualized net expense ratios, multiplied by the average account value over the period, multiplied by 184/366 (to reflect the one-half-year period). The annualized net expense ratios are as follows:
Annual Shareholder Report
Board of Trustees and Trust Officers
The Board of Trustees is responsible for managing the Trust’s business affairs and for exercising all the Trust’s powers except those reserved for the shareholders. The following tables give information about each Trustee and the senior officers of the Fund. Where required, the tables separately list Trustees who are “interested persons” of the Fund (i.e., “Interested” Trustees) and those who are not (i.e., “Independent” Trustees). Unless otherwise noted, the address of each person listed is 1001 Liberty Avenue, Pittsburgh, PA 15222. The address of all Independent Trustees listed is 4000 Ericsson Drive, Warrendale, PA 15086-7561; Attention: Mutual Fund Board. As of December 31, 2019, the Trust comprised seven portfolio(s), and the Federated Hermes Fund Family consisted of 41 investment companies (comprising 135 portfolios). Unless otherwise noted, each Officer is elected annually. Unless otherwise noted, each Trustee oversees all portfolios in the Federated Hermes Fund Family and serves for an indefinite term. The Fund’s Statement of Additional Information includes additional information about Trust Trustees and is available, without charge and upon request, by calling 1-800-341-7400.
Interested Trustees Background
Name
Birth Date
Positions Held with Trust
Date Service Began | Principal Occupation(s) for Past Five Years,
Other Directorships Held and Previous Position(s) |
J. Christopher Donahue*
Birth Date: April 11, 1949
President and Trustee
Indefinite Term
Began serving:
January 2000 | Principal Occupations: Principal Executive Officer and President of certain of the Funds in the Federated Hermes Fund Family; Director or Trustee of the Funds in the Federated Hermes Fund Family; President, Chief Executive Officer and Director, Federated Hermes, Inc.; Chairman and Trustee, Federated Investment Management Company; Trustee, Federated Investment Counseling; Chairman and Director, Federated Global Investment Management Corp.; Chairman and Trustee, Federated Equity Management Company of Pennsylvania; Trustee, Federated Shareholder Services Company; Director, Federated Services Company.
Previous Positions: President, Federated Investment Counseling; President and Chief Executive Officer, Federated Investment Management Company, Federated Global Investment Management Corp. and Passport Research, Ltd; Chairman, Passport Research, Ltd. |
Annual Shareholder Report
Name Birth Date Positions Held with Trust Date Service Began | Principal Occupation(s) for Past Five Years, Other Directorships Held and Previous Position(s) |
John B. Fisher*
Birth Date: May 16, 1956
Trustee
Indefinite Term
Began serving: May 2016 | Principal Occupations: Principal Executive Officer and President of certain of the Funds in the Federated Hermes Fund Family; Director or Trustee of certain of the Funds in the Federated Hermes Fund Family; Vice President, Federated Hermes, Inc.; President, Director/Trustee and CEO, Federated Advisory Services Company, Federated Equity Management Company of Pennsylvania, Federated Global Investment Management Corp., Federated Investment Counseling, Federated Investment Management Company; President of some of the Funds in the Federated Hermes Fund Family and Director, Federated Investors Trust Company.
Previous Positions: President and Director of the Institutional Sales Division of Federated Securities Corp.; President and Director of Federated Investment Counseling; President and CEO of Passport Research, Ltd.; Director, Edgewood Securities Corp.; Director, Federated Services Company; Director, Federated Hermes, Inc.; Chairman and Director, Southpointe Distribution Services, Inc. and President, Technology, Federated Services Company. |
*
Reasons for “interested” status: J. Christopher Donahue and John B. Fisher are interested due to their beneficial ownership of shares of Federated Hermes, Inc. and due to positions they hold with Federated Hermes, Inc. and its subsidiaries.
INDEPENDENT Trustees Background
Name
Birth Date
Positions Held with Trust
Date Service Began | Principal Occupation(s) for Past Five Years,
Other Directorships Held, Previous Position(s) and Qualifications |
John T. Collins
Birth Date: January 24, 1947
Trustee
Indefinite Term
Began serving:
October 2013 | Principal Occupations: Director or Trustee of the Federated Hermes Fund Family; formerly, Chairman and CEO, The Collins Group, Inc. (a private equity firm) (Retired).
Other Directorships Held: Chairman of the Board of Directors, Director, and Chairman of the Compensation Committee, KLX Energy Services Holdings, Inc. (oilfield services); former Director of KLX Corp. (aerospace).
Qualifications: Mr. Collins has served in several business and financial management roles and directorship positions throughout his career. Mr. Collins previously served as Chairman and CEO of The Collins Group, Inc. (a private equity firm) and as a Director of KLX Corp. Mr. Collins serves as Chairman Emeriti, Bentley University. Mr. Collins previously served as Director and Audit Committee Member, Bank of America Corp.; Director, FleetBoston Financial Corp.; and Director, Beth Israel Deaconess Medical Center (Harvard University Affiliate Hospital). |
Annual Shareholder Report
Name Birth Date Positions Held with Trust Date Service Began | Principal Occupation(s) for Past Five Years, Other Directorships Held, Previous Position(s) and Qualifications |
G. Thomas Hough
Birth Date: February 28, 1955
Trustee
Indefinite Term
Began serving: August 2015 | Principal Occupations: Director or Trustee, Chair of the Audit Committee of the Federated Hermes Fund Family; formerly, Vice Chair, Ernst & Young LLP (public accounting firm) (Retired).
Other Directorships Held: Director, Chair of the Audit Committee, Equifax, Inc.; Director, Member of the Audit Committee, Haverty Furniture Companies, Inc.; formerly, Director, Member of Governance and Compensation Committees, Publix Super Markets, Inc.
Qualifications: Mr. Hough has served in accounting, business management and directorship positions throughout his career. Mr. Hough most recently held the position of Americas Vice Chair of Assurance with Ernst & Young LLP (public accounting firm). Mr. Hough serves on the President’s Cabinet and Business School Board of Visitors for the University of Alabama. Mr. Hough previously served on the Business School Board of Visitors for Wake Forest University, and he previously served as an Executive Committee member of the United States Golf Association. |
Maureen Lally-Green
Birth Date: July 5, 1949
Trustee
Indefinite Term
Began serving: August 2009 | Principal Occupations: Director or Trustee of the Federated Hermes Fund Family; Adjunct Professor of Law, Duquesne University School of Law; formerly, Dean of the Duquesne University School of Law and Professor of Law and Interim Dean of the Duquesne University School of Law; formerly, Associate General Secretary and Director, Office of Church Relations, Diocese of Pittsburgh.
Other Directorships Held: Director, CNX Resources Corporation (formerly known as CONSOL Energy Inc.).
Qualifications: Judge Lally-Green has served in various legal and business roles and directorship positions throughout her career. Judge Lally-Green previously held the position of Dean of the School of Law of Duquesne University (as well as Interim Dean). Judge Lally-Green previously served as a member of the Superior Court of Pennsylvania and as a Professor of Law, Duquesne University School of Law. Judge Lally-Green was appointed by the Supreme Court of Pennsylvania to serve on the Supreme Court’s Board of Continuing Judicial Education and the Supreme Court’s Appellate Court Procedural Rules Committee. Judge Lally-Green also currently holds the positions on not for profit or for profit boards of directors as follows: Director and Chair, UPMC Mercy Hospital; Director and Vice Chair, Our Campaign for the Church Alive!, Inc.; Regent, Saint Vincent Seminary; Member, Pennsylvania State Board of Education (public); Director, Catholic Charities, Pittsburgh; and Director CNX Resources Corporation (formerly known as CONSOL Energy Inc.). Judge Lally-Green has held the positions of: Director, Auberle; Director, Epilepsy Foundation of Western and Central Pennsylvania; Director, Ireland Institute of Pittsburgh; Director, Saint Thomas More Society; Director and Chair, Catholic High Schools of the Diocese of Pittsburgh, Inc.; Director, Pennsylvania Bar Institute; Director, St. Vincent College; and Director and Chair, North Catholic High School, Inc. |
Annual Shareholder Report
Name Birth Date Positions Held with Trust Date Service Began | Principal Occupation(s) for Past Five Years, Other Directorships Held, Previous Position(s) and Qualifications |
Charles F. Mansfield, Jr.
Birth Date: April 10, 1945
Trustee
Indefinite Term
Began serving: November 1999 | Principal Occupations: Director or Trustee of the Federated Hermes Fund Family; Management Consultant and Author.
Other Directorships Held: None.
Qualifications: Mr. Mansfield has served as a Marine Corps officer and in several banking, business management, educational roles and directorship positions throughout his long career. He remains active as a Management Consultant and Author. |
Thomas M. O’Neill
Birth Date: June 14, 1951
Trustee
Indefinite Term
Began serving: August 2006 | Principal Occupations: Director or Trustee of the Federated Hermes Fund Family; Sole Proprietor, Navigator Management Company (investment and strategic consulting).
Other Directorships Held: None.
Qualifications: Mr. O’Neill has served in several business, mutual fund and financial management roles and directorship positions throughout his career. Mr. O’Neill serves as Director, Medicines for Humanity and Director, The Golisano Children’s Museum of Naples, Florida. Mr. O’Neill previously served as Chief Executive Officer and President, Managing Director and Chief Investment Officer, Fleet Investment Advisors; President and Chief Executive Officer, Aeltus Investment Management, Inc.; General Partner, Hellman, Jordan Management Co., Boston, MA; Chief Investment Officer, The Putnam Companies, Boston, MA; Credit Analyst and Lending Officer, Fleet Bank; Director and Consultant, EZE Castle Software (investment order management software); and Director, Midway Pacific (lumber). |
Madelyn A. Reilly
Birth Date: February 2, 1956
Trustee
Indefinite Term
Began serving:
November 2020 | Principal Occupations: Director or Trustee of the Federated Hermes Fund Family; Senior Vice President for Legal Affairs, General Counsel and Secretary of the Board of Trustees, Duquesne University.
Other Directorships Held: None.
Qualifications: Ms. Reilly has served in various business and legal management roles throughout her career. Ms. Reilly previously served as Director of Risk Management and Associate General Counsel, Duquesne University. Prior to her work at Duquesne University, Ms. Reilly served as Assistant General Counsel of Compliance and Enterprise Risk as well as Senior Counsel of Environment, Health and Safety, PPG Industries. Ms. Reilly also previously served as Chair of the Risk Management Committee for Holy Ghost Preparatory School, Philadelphia and Secretary and Chair of the Governance Committee, Oakland Catholic High School Board of Trustees, Pittsburgh. |
Annual Shareholder Report
Name Birth Date Positions Held with Trust Date Service Began | Principal Occupation(s) for Past Five Years, Other Directorships Held, Previous Position(s) and Qualifications |
P. Jerome Richey
Birth Date: February 23, 1949
Trustee
Indefinite Term
Began serving:
October 2013 | Principal Occupations: Director or Trustee of the Federated Hermes Fund Family; Management Consultant; Retired; formerly, Senior Vice Chancellor and Chief Legal Officer, University of Pittsburgh and Executive Vice President and Chief Legal Officer, CNX Resources Corporation (formerly known as CONSOL Energy Inc.).
Other Directorships Held: None.
Qualifications: Mr. Richey has served in several business and legal management roles and directorship positions throughout his career. Mr. Richey most recently held the positions of Senior Vice Chancellor and Chief Legal Officer, University of Pittsburgh. Mr. Richey previously served as Chairman of the Board, Epilepsy Foundation of Western Pennsylvania and Chairman of the Board, World Affairs Council of Pittsburgh. Mr. Richey previously served as Chief Legal Officer and Executive Vice President, CNX Resources Corporation (formerly known as CONSOL Energy Inc.); and Board Member, Ethics Counsel and Shareholder, Buchanan Ingersoll & Rooney PC (a law firm). |
John S. Walsh
Birth Date:
November 28, 1957
Trustee
Indefinite Term
Began serving: November 1999 | Principal Occupations: Director or Trustee, and Chair of the Board of Directors or Trustees, of the Federated Hermes Fund Family; President and Director, Heat Wagon, Inc. (manufacturer of construction temporary heaters); President and Director, Manufacturers Products, Inc. (distributor of portable construction heaters); President, Portable Heater Parts, a division of Manufacturers Products, Inc.
Other Directorships Held: None.
Qualifications: Mr. Walsh has served in several business management roles and directorship positions throughout his career. Mr. Walsh previously served as Vice President, Walsh & Kelly, Inc. (paving contractors). |
Annual Shareholder Report
OFFICERS
Name
Birth Date
Address
Positions Held with Trust
Date Service Began | Principal Occupation(s) for Past Five Years
and Previous Position(s) |
Lori A. Hensler
Birth Date: January 6, 1967
TREASURER
Officer since: April 2013 | Principal Occupations: Principal Financial Officer and Treasurer of the Federated Hermes Fund Family; Senior Vice President, Federated Administrative Services; Financial and Operations Principal for Federated Securities Corp.; and Assistant Treasurer, Federated Investors Trust Company. Ms. Hensler has received the Certified Public Accountant designation.
Previous Positions: Controller of Federated Hermes, Inc.; Senior Vice President and Assistant Treasurer, Federated Investors Management Company; Treasurer, Federated Investors Trust Company; Assistant Treasurer, Federated Administrative Services, Federated Administrative Services, Inc., Federated Securities Corp., Edgewood Services, Inc., Federated Advisory Services Company, Federated Equity Management Company of Pennsylvania, Federated Global Investment Management Corp., Federated Investment Counseling, Federated Investment Management Company, Passport Research, Ltd., and Federated MDTA, LLC; Financial and Operations Principal for Federated Securities Corp., Edgewood Services, Inc. and Southpointe Distribution Services, Inc. |
Peter J. Germain
Birth Date:
September 3, 1959
CHIEF LEGAL OFFICER, SECRETARY and EXECUTIVE VICE PRESIDENT
Officer since: January 2005 | Principal Occupations: Mr. Germain is Chief Legal Officer, Secretary and Executive Vice President of the Federated Hermes Fund Family. He is General Counsel, Chief Legal Officer, Secretary and Executive Vice President, Federated Hermes, Inc.; Trustee and Senior Vice President, Federated Investors Management Company; Trustee and President, Federated Administrative Services; Director and President, Federated Administrative Services, Inc.; Director and Vice President, Federated Securities Corp.; Director and Secretary, Federated Private Asset Management, Inc.; Secretary, Federated Shareholder Services Company; and Secretary, Retirement Plan Service Company of America. Mr. Germain joined Federated Hermes, Inc. in 1984 and is a member of the Pennsylvania Bar Association.
Previous Positions: Deputy General Counsel, Special Counsel, Managing Director of Mutual Fund Services, Federated Hermes, Inc.; Senior Vice President, Federated Services Company; and Senior Corporate Counsel, Federated Hermes, Inc. |
Stephen Van Meter
Birth Date: June 5, 1975
CHIEF COMPLIANCE OFFICER AND SENIOR VICE PRESIDENT
Officer since: July 2015 | Principal Occupations: Senior Vice President and Chief Compliance Officer of the Federated Hermes Fund Family; Vice President and Chief Compliance Officer of Federated Hermes, Inc. and Chief Compliance Officer of certain of its subsidiaries. Mr. Van Meter joined Federated Hermes, Inc. in October 2011. He holds FINRA licenses under Series 3, 7, 24 and 66.
Previous Positions: Mr. Van Meter previously held the position of Compliance Operating Officer, Federated Hermes, Inc. Prior to joining Federated Hermes, Inc., Mr. Van Meter served at the United States Securities and Exchange Commission in the positions of Senior Counsel, Office of Chief Counsel, Division of Investment Management and Senior Counsel, Division of Enforcement. |
Annual Shareholder Report
Name Birth Date Address Positions Held with Trust Date Service Began | Principal Occupation(s) for Past Five Years and Previous Position(s) |
Stephen F. Auth
Birth Date: September 13, 1956
101 Park Avenue
41st Floor
New York, NY 10178
CHIEF INVESTMENT OFFICER
Officer since: May 2004 | Principal Occupations: Stephen F. Auth is Chief Investment Officer of various Funds in the Federated Hermes Fund Family; Executive Vice President, Federated Investment Counseling, Federated Global Investment Management Corp. and Federated Equity Management Company of Pennsylvania.
Previous Positions: Executive Vice President, Federated Investment Management Company and Passport Research, Ltd. (investment advisory subsidiary of Federated); Senior Vice President, Global Portfolio Management Services Division; Senior Vice President, Federated Investment Management Company and Passport Research, Ltd.; Senior Managing Director and Portfolio Manager, Prudential Investments. |
Robert J. Ostrowski
Birth Date: April 26, 1963
Chief Investment Officer
Officer since: May 2004 | Principal Occupations: Robert J. Ostrowski joined Federated Hermes, Inc. in 1987 as an Investment Analyst and became a Portfolio Manager in 1990. He was named Chief Investment Officer of Federated Hermes’ taxable fixed-income products in 2004 and also serves as a Senior Portfolio Manager. Mr. Ostrowski became an Executive Vice President of the Fund’s Sub-Adviser in 2009 and served as a Senior Vice President of the Fund’s Sub-Adviser from 1997 to 2009. Mr. Ostrowski has received the Chartered Financial Analyst designation. He received his M.S. in Industrial Administration from Carnegie Mellon University. |
Annual Shareholder Report
Evaluation and Approval of Advisory Contract–May 2020
Federated Muni and Stock Advantage Fund (the “Fund”)
(EFFECTIVE CLOSE OF BUSINESS ON JUNE 26, 2020, THE FUND’S NAME CHANGED TO FEDERATED HERMES MUNI AND STOCK ADVANTAGE FUND)
At its meetings in May 2020 (the “May Meetings”), the Fund’s Board of Trustees (the “Board”), including a majority of those Trustees who are not “interested persons” of the Fund, as defined in the Investment Company Act of 1940 (the “Independent Trustees”), reviewed and unanimously approved the continuation of the investment advisory contract between the Fund and Federated Equity Management Company of Pennsylvania (the “Adviser”) and the investment subadvisory contract between the Adviser and Federated Investment Management Company with respect to the Fund (together, the “Contracts”) for an additional one-year term. The Board’s determination to approve the continuation of the Contracts reflects the exercise of its business judgment after considering all of the information and factors believed to be relevant and appropriate on whether to continue the existing arrangements. The information, factors and conclusions that formed the basis for the Board’s approval are summarized below.
Information Received and Review Process
At the request of the Independent Trustees, the Fund’s Chief Compliance Officer (the “CCO”) furnished to the Board in advance of its May Meetings an independent written evaluation presenting on the topics discussed below. The Board considered the CCO’s independent written evaluation (the “CCO Fee Evaluation Report”), along with other information, in evaluating the reasonableness of the Fund’s management fee and in determining to approve the continuation of the Contracts. The CCO, in preparing the CCO Fee Evaluation Report, has the authority to retain consultants, experts or staff as reasonably necessary to assist in the performance of his duties, reports directly to the Board, and can be terminated only with the approval of a majority of the Independent Trustees. At the request of the Independent Trustees, the CCO Fee Evaluation Report followed the same general approach and covered the same topics as that of the report that had previously been delivered by the CCO in his capacity as “Senior Officer” prior to the elimination of the Senior Officer position in December 2017.
In addition to the extensive materials that comprise and accompany the CCO Fee Evaluation Report, in the months preceding the May Meetings, the Board requested and reviewed written responses and supporting materials prepared by the Adviser and its affiliates (collectively, “Federated Hermes”) in response to requests posed to Federated Hermes on behalf of the Independent Trustees encompassing a wide variety of topics. The Board also considered such additional matters as the Independent Trustees deemed reasonably necessary to
Annual Shareholder Report
evaluate the Contracts, which included detailed information about the Fund and Federated Hermes furnished to the Board at its meetings throughout the year and in between regularly scheduled meetings on particular matters as the need arose, as well as information specifically prepared in connection with the approval of the continuation of the Contracts that was presented at the May Meetings.
The Board’s consideration of the Contracts included review of materials and information covering the following matters, among others: the Adviser’s and sub-adviser’s investment philosophy, revenue, profitability, personnel and processes; investment and operating strategies; the Fund’s short-term and long-term performance (in absolute terms, both on a gross basis and net of expenses, and relative to the Fund’s particular investment program and a group of its peer funds and/or its benchmark, as appropriate) and comments on the reasons for the Fund’s performance; the Fund’s investment objectives; the Fund’s expenses, including the advisory fee and the overall expense structure of the Fund (both in absolute terms and relative to a group of its peer funds), with due regard for contractual or voluntary expense limitations (if any); the use and allocation of brokerage commissions derived from trading the Fund’s portfolio securities (if any); and the nature, quality and extent of the advisory and other services provided to the Fund by the Adviser and its affiliates. The Board also considered the preferences and expectations of Fund shareholders; the entrepreneurial and other risks assumed by the Adviser in sponsoring and managing the Fund; the continuing state of competition in the mutual fund industry and market practices; the range of comparable fees for similar funds in the mutual fund industry; the Fund’s relationship to the other funds advised by Federated Hermes (each, a “Federated Hermes Fund”), which include a comprehensive array of funds with different investment objectives, policies and strategies which are generally available for exchange without the incurrence of additional sales charges; compliance and audit reports concerning the Federated Hermes Funds and the Federated Hermes’ affiliates that service them (including communications from regulatory agencies), as well as Federated Hermes’ responses to any issues raised therein; and relevant developments in the mutual fund industry and how the Federated Hermes Funds and/or Federated Hermes may be responding to them. In addition, the Board received and considered information furnished by Federated Hermes on the impacts of the coronavirus (COVID-19) outbreak on Federated Hermes generally and the Fund in particular, including, among other information, the current and anticipated impacts on the management, operations and performance of the Fund. The Board noted that its evaluation process is evolutionary and that the criteria considered and the emphasis placed on relevant criteria may change in recognition of changing circumstances in the mutual fund marketplace.
Annual Shareholder Report
The Board also considered judicial decisions concerning allegedly excessive investment advisory fees in determining to approve the Contracts. Using these judicial decisions as a guide, the Board observed that the following factors may be relevant to an adviser’s fiduciary duty with respect to its receipt of compensation from a fund: (1) the nature and quality of the services provided by an adviser to a fund and its shareholders (including the performance of the fund, its benchmark, and comparable funds); (2) an adviser’s cost of providing the services (including the profitability to an adviser of providing advisory services to a fund); (3) the extent to which an adviser may realize “economies of scale” as a fund grows larger and, if such economies of scale exist, whether they have been shared with a fund and its shareholders or the family of funds; (4) any “fall-out” financial benefits that accrue to an adviser because of its relationship with a fund (including research services received from brokers that execute fund trades and any fees paid to affiliates of an adviser for services rendered to a fund); (5) comparative fee and expense structures (including a comparison of fees paid to an adviser with those paid by similar funds both internally and externally as well as management fees charged to institutional and other advisory clients of the adviser for what might be viewed as like services); and (6) the extent of care, conscientiousness and independence with which the fund’s board members perform their duties and their expertise (including whether they are fully informed about all facts the board deems relevant to its consideration of an adviser’s services and fees). The Board noted that the Securities and Exchange Commission (“SEC”) disclosure requirements regarding the basis for a fund board’s approval of the fund’s investment advisory contracts generally align with the factors listed above. The Board was aware of these factors and was guided by them in its review of the Contracts to the extent it considered them to be appropriate and relevant, as discussed further below.
The Board considered and weighed these factors in light of its substantial accumulated experience in governing the Fund and working with Federated Hermes on matters relating to the Federated Hermes Funds. While individual members of the Board may have weighed certain factors differently, the Board’s determination to continue the Contracts was based on a comprehensive consideration of all information provided to the Board throughout the year and specifically with respect to the continuation of the Contracts. The Independent Trustees were assisted throughout the evaluation process by independent legal counsel. In connection with their deliberations at the May Meetings, the Independent Trustees met separately in executive session with their independent legal counsel and without management present to review the relevant materials and consider their responsibilities under applicable laws. In addition, senior management representatives of Federated Hermes also met with the Independent Trustees and their independent legal counsel to discuss
Annual Shareholder Report
the materials and presentations furnished to the Board at the May Meetings. The Board considered the approval of the Contracts for the Fund as part of its consideration of agreements for funds across the Federated Hermes Funds family, but its approvals were made on a fund-by-fund basis.
Nature, Extent and Quality of Services
The Board considered the nature, extent and quality of the services provided to the Fund by the Adviser and the resources of the Adviser and its affiliates dedicated to the Fund. In this regard, the Board evaluated, among other things, the Adviser’s personnel, experience and track record, as well as the financial resources and overall reputation of Federated Hermes and its willingness to invest in personnel and infrastructure that benefit the Federated Hermes Funds. The Board noted the significant acquisition of Hermes Fund Managers Limited by Federated Hermes in 2018, which has deepened the organization’s investment management expertise and capabilities and expanded the investment process for all of the Federated Hermes Funds to incorporate environmental, social and governance (“ESG”) factors and issuer engagement on ESG matters.
In addition, the Board reviewed the qualifications, backgrounds and responsibilities of the portfolio management team primarily responsible for the day-to-day management of the Fund and the Adviser’s ability and experience in attracting and retaining qualified personnel to service the Fund. The Board noted the compliance program of the Adviser and the compliance-related resources devoted by the Adviser and its affiliates in support of the Fund’s obligations pursuant to Rule 38a-1 under the Investment Company Act of 1940, including the Adviser’s commitment to respond to rulemaking and other regulatory initiatives of the SEC such as the liquidity risk management program rules. In addition, the Board considered the response by the Adviser to recent market conditions and considered the overall performance of the Adviser in this context. The Fund’s ability to deliver competitive performance when compared to its Performance Peer Group (as defined below) was also deemed to be relevant by the Board as a useful indicator of how the Adviser is executing the Fund’s investment program. The Adviser’s ability to execute this program was one of the Board’s considerations in reaching a conclusion that the nature, extent and quality of the Adviser’s investment management and related services warrant the continuation of the Contracts.
Fund Investment Performance
In evaluating the Fund’s investment performance, the Board considered performance results in light of the Fund’s investment objective, strategies and risks, as disclosed in the Fund’s prospectus. The Board also considered the Fund’s performance in light of the overall recent market conditions. The Board considered detailed investment reports on the Fund’s performance over different time periods that were provided to the Board throughout the year and in connection with the May Meetings and evaluated the Adviser’s analysis of
Annual Shareholder Report
the Fund’s performance for these time periods. The Board also reviewed comparative information regarding the performance of other mutual funds in the category of peer funds selected by Morningstar, Inc. (the “Morningstar”), an independent fund ranking organization (the “Performance Peer Group”), noting the CCO’s view that comparisons to fund peer groups may be helpful, though not conclusive, in evaluating the performance of the Adviser in managing the Fund. The Board considered, in evaluating such comparisons, that in some cases there may be differences in the funds’ objectives or investment management techniques, or the costs to implement the funds, even within the same Performance Peer Group.
For the periods covered by the CCO Fee Evaluation Report, the Fund’s performance for the five-year period was above the median of the relevant Peer Group, and the Fund’s performance fell below the median of the relevant Peer Group for the one-year and three-year periods. The Board discussed the Fund’s performance with the Adviser and recognized the efforts being taken by the Adviser in the context of other factors considered relevant by the Board.
Following such evaluation, and full deliberations, the Board concluded that the performance of the Fund supported renewal of the Contracts.
Fund Expenses
While mindful that courts have cautioned against giving too much weight to comparative information concerning fees charged by other advisers for managing funds with comparable investment programs, the Board has found the use of such comparisons to be relevant to its deliberations. In this regard, the Board was presented with, and considered, information regarding the contractual advisory fee rates, net advisory fee rates, total expense ratios and each element of the Fund’s total expense ratio (i.e., gross and net advisory fees, administrative fees, custody fees, portfolio accounting fees and transfer agency fees) relative to an appropriate group of peer funds compiled by Federated Hermes from the category of peer funds selected by Morningstar (the “Expense Peer Group”). The Board received a description of the methodology used to select the Expense Peer Group from the overall Morningstar category. The Board also reviewed comparative information regarding the fees and expenses of the broader group of funds in the overall Morningstar category. The Board focused on comparisons with other similar mutual funds more heavily than non-mutual fund products or services because such comparisons are believed to be more relevant. The Board considered that other mutual funds are the products most like the Fund, in that they are readily available to Fund shareholders as alternative investment vehicles, and they are the type of investment vehicle, in fact, chosen and maintained by the Fund’s investors. The Board noted that the range of their fees and expenses, therefore, appears to be a relevant indicator of what consumers have found to be reasonable in the marketplace in which the Fund competes.
Annual Shareholder Report
The Board reviewed the contractual advisory fee rate, net advisory fee rate and other expenses of the Fund and noted the position of the Fund’s fee rates relative to its Expense Peer Group. In this regard, the Board noted that the contractual advisory fee rate was above the median of the relevant Expense Peer Group, but the Board noted the applicable waivers and reimbursements, and that the overall expense structure of the Fund remained competitive in the context of other factors considered by the Board.
For comparison, the Board received and considered information about the fees charged by Federated Hermes for providing advisory services to other types of clients with investment strategies similar to those of the Federated Hermes Funds, including non-mutual fund clients such as institutional separate accounts and third-party unaffiliated mutual funds for which the Adviser or its affiliates serve as sub-adviser. The Board noted the CCO’s conclusion that non-mutual fund clients are inherently different products due to the following differences, among others: (i) different types of targeted investors; (ii) different applicable laws and regulations; (iii) different legal structures; (iv) different average account sizes and portfolio management techniques made necessary by different cash flows and different associated costs; (v) and the time spent by portfolio managers and their teams (among other personnel across various departments, including legal, compliance and risk management) in reviewing securities pricing, addressing different administrative responsibilities, and addressing different degrees of risk associated with management; and (vi) a variety of different costs. The Board also considered information regarding the differences in the nature of the services required for Federated Hermes to manage its proprietary mutual fund business versus managing a discrete pool of assets as a sub-adviser to another institution’s mutual fund, noting that Federated Hermes generally performs significant additional services and assumes substantially greater risks in managing the Fund and other Federated Hermes Funds than in its role as sub-adviser to an unaffiliated third-party mutual fund. The Board noted that the CCO did not consider the fees for providing advisory services to other types of clients to be determinative in judging the appropriateness of the Federated Hermes Funds’ advisory fees.
Following such evaluation, and full deliberations, the Board concluded that the fees and expenses of the Fund are reasonable and supported renewal of the Contracts.
Profitability and Other Benefits
The Board also received financial information about Federated Hermes, including information regarding the compensation and ancillary (or “fall-out”) benefits Federated Hermes derived from its relationships with the Federated Hermes Funds. This information covered not only the fees under the Federated Hermes Funds’ investment advisory contracts, but also fees received by Federated Hermes’ affiliates for providing other services to the Federated Hermes Funds under separate contracts (e.g., for serving as the Federated
Annual Shareholder Report
Hermes Funds’ administrator and distributor). In this regard, the Board considered that certain of Federated Hermes’ affiliates provide distribution and shareholder services to the Federated Hermes Funds, for which they may be compensated through distribution and servicing fees paid pursuant to Rule 12b-1 plans or otherwise. The Board also received and considered information detailing any indirect benefit Federated Hermes may derive from its receipt of research services from brokers who execute portfolio trades for the Federated Hermes Funds. In addition, the Board considered the fact that, in order for the Federated Hermes Funds to be competitive in the marketplace, the Adviser and its affiliates frequently waived fees and/or reimbursed expenses and have disclosed to Federated Hermes Fund shareholders and/or reported to the Board their intention to do so in the future. Moreover, the Board received and considered regular reports from Federated Hermes throughout the year as to the institution, adjustment or elimination of these voluntary waivers and/or reimbursements. The Board considered Federated Hermes’ previous reductions in contractual management fees to certain Federated Hermes Funds during the prior year, including in response to the CCO’s recommendations in the prior year’s CCO Fee Evaluation Report.
The Board received and considered information furnished by Federated Hermes, as requested by the CCO, that reported revenues on a fund-by-fund basis and made estimates of the allocation of expenses on a fund-by-fund basis, using allocation methodologies specified by the CCO and described to the Board. The Board considered the CCO’s view that, while these cost allocation reports apply consistent allocation processes, the inherent difficulties in allocating costs continues to cause the CCO to question the precision of the process and to conclude that such reports may be unreliable, because a single change in an allocation estimate may dramatically alter the resulting estimate of cost and/or profitability of a Federated Hermes Fund and may produce unintended consequences. The allocation information, including the CCO’s view that fund-by-fund estimations may be unreliable, was considered in the evaluation by the Board. In addition, the Board considered that, during the prior year, an independent consultant conducted a review of the allocation methodologies used by Federated Hermes in estimating profitability for purposes of reporting to the Board in connection with the continuation of the Contracts. The Board noted the consultant’s view that, although there is no single best method to allocate expenses, the methodologies used by Federated Hermes are reasonable.
The Board also reviewed information compiled by Federated Hermes comparing its profitability information to other publicly held fund management companies, including information regarding profitability trends over time. The Board considered the CCO’s conclusion that, based on such profitability
Annual Shareholder Report
information, Federated Hermes’ profit margins did not appear to be excessive. The Board also considered the CCO’s view that Federated Hermes appeared financially sound, with the resources necessary to fulfill its obligations under its contracts with the Federated Hermes Funds.
Economies of Scale
The Board received and considered information about the notion of possible realization of “economies of scale” as a fund grows larger, the difficulties of calculating economies of scale at an individual fund level, and the extent to which potential scale benefits are shared with shareholders. In this regard, the Board considered that the Adviser has made significant and long-term investments in areas that support all of the Federated Hermes Funds, such as personnel and processes for the portfolio management, trading operations, issuer engagement (including with respect to ESG matters), shareholder services, compliance, business continuity, internal audit and risk management functions, as well as systems technology (including technology relating to cybersecurity) and use of data. The Board noted that Federated Hermes’ investments in these areas are extensive and are designed to provide enhanced services to the Federated Hermes Funds and their shareholders. The Board considered that the benefits of these investments (as well as the benefits of any economies of scale, should they exist) are likely to be shared with the Federated Hermes Fund family as a whole. In addition, the Board considered that the Adviser and its affiliates have frequently waived fees and/or reimbursed expenses for the Federated Hermes Funds and that such waivers and reimbursements are another means for potential economies of scale to be shared with shareholders and can provide protection from an increase in expenses if a Federated Hermes Fund’s assets decline. Federated Hermes, as it does throughout the year, and specifically in connection with the Board’s review of the Contracts, furnished information relative to adviser-paid fees (commonly referred to as revenue sharing). The Board considered the beliefs of Federated Hermes and the CCO that this information should be viewed to determine if there was an incentive to either not apply breakpoints, or to apply breakpoints at higher levels, and should not be viewed to determine the appropriateness of advisory fees. The Board also noted the absence of any applicable regulatory or industry guidelines on this subject, which is compounded by the lack of any common industry practice or general pattern with respect to structuring fund advisory fees with “breakpoints” that serve to reduce the fee as a fund attains a certain size.
Conclusions
The Board considered the CCO’s conclusion that his observations and the information accompanying the CCO Fee Evaluation Report show that the management fee for the Fund was reasonable and the CCO’s recommendation that the Board approve the management fee. The Board noted that, under these circumstances, no changes were recommended to, and no objection was raised
Annual Shareholder Report
to the continuation of, the Contracts by the CCO. The CCO also recognized that the Board’s evaluation of the Federated Hermes Funds’ advisory and subadvisory arrangements is a continuing and on-going process that is informed by the information that the Board requests and receives from management throughout the course of the year and, in this regard, the CCO noted certain items for future reporting to the Board or further consideration by management as the Board continues its on-going oversight of the Federated Hermes Funds.
In its determination to continue an existing investment advisory contract, the Board was mindful of the potential disruptions of the Fund’s operations and various risks, uncertainties and other effects that could occur as a result of a decision to terminate or not renew an investment advisory contract. In particular, the Board recognized that many shareholders have invested in the Fund on the strength of the Adviser’s industry standing and reputation and with the expectation that the Adviser will have a continuing role in providing advisory services to the Fund. Thus, the Board’s approval of the Contracts reflected the fact that it is the shareholders who have effectively selected the Adviser by virtue of having invested in the Fund. The Board concluded that, in light of the factors summarized above, including the nature, quality and scope of the services provided to the Fund by the Adviser and its affiliates, continuation of the Contracts was appropriate.
The Board based its determination to approve the Contracts on the totality of the circumstances and relevant factors and with a view to past and future long-term considerations. Not all of the factors and considerations identified above were necessarily deemed to be relevant to the Fund, nor did the Board consider any one of them to be determinative. With respect to the factors that were deemed to be relevant, the Board’s determination to approve the continuation of the Contracts reflects its view that Federated Hermes’ performance and actions provided a satisfactory basis to support the determination to continue the existing arrangements.
Annual Shareholder Report
Liquidity Risk Management Program– Annual Evaluation of Adequacy and Effectiveness
In accordance with Rule 22e-4 under the Investment Company Act of 1940, as amended (the “Liquidity Rule”), Federated Hermes Income Securities Trust (the “Trust”) has adopted and implemented a liquidity risk management program (the “Program”) for Federated Hermes Muni and Stock Advantage Fund (the “Fund” and, collectively with the Federated Hermes funds, the “Federated Hermes Funds”). The Program seeks to assess and manage the Fund’s liquidity risk. “Liquidity risk” is defined under the Liquidity Rule as the risk that the Fund is unable to meet redemption requests without significantly diluting remaining investors’ interests in the Fund. The Board of Trustees of the Trust (the “Board”) has approved the designation of the Fund’s investment adviser as the administrator for the Program for the Fund. Each affiliated Federated Hermes advisory subsidiary (including the Fund’s investment adviser) that serves as investment adviser to a Federated Hermes Fund (including the Fund) has been approved as the administrator of the Program for each Federated Hermes Fund they manage (each an “Administrator”). The Administrator in turn has delegated daily responsibility for the administration of the Program to multiple Liquidity Risk Management Committees (the “Committees”). The Committees, which are comprised of representatives of Enterprise Risk Management, Compliance, Investment Management and Trading, must review and assess certain information related to the liquidity of the Federated Hermes Funds, including the Fund.
The Program is comprised of various components designed to support the assessment and/or management of liquidity risk, including: (1) the periodic assessment (no less frequently than annually) of certain factors that influence the Fund’s liquidity risk; (2) the periodic classification (no less frequently than monthly) of the Fund’s investments into one of four liquidity categories that reflect an estimate of their liquidity under current market conditions; (3) a 15% limit on the acquisition of “illiquid investments” (as defined under the Liquidity Rule); (4) to the extent a Fund does not invest primarily in “highly liquid investments” (as defined under the Liquidity Rule), the determination of a minimum percentage of the Fund’s assets that generally will be invested in highly liquid investments (an “HLIM”); (5) if a Fund has established an HLIM, the periodic review (no less frequently than annually) of the HLIM and the adoption of policies and procedures for responding to a shortfall of the Fund’s highly liquid investments below its HLIM; and (6) periodic reporting to the Board.
At its meetings in May 2020, the Board received and reviewed a written report (the “Report”) from the Federated Hermes Funds’ Chief Compliance Officer and Chief Risk Officer, on behalf of the Administrator, concerning the operation of the Program for the period from the Program’s inception on December 1, 2018 through March 31, 2020 (the “Period”). The Report
Annual Shareholder Report
addressed the operation of the Program and assessed its adequacy and effectiveness, including, where applicable, the operation of any HLIM established for a Federated Hermes Fund and each Federated Hermes Fund’s access to other available funding sources such as the Federated Hermes Funds’ interfund lending facility, redemptions in-kind and committed lines of credit. There were no material changes to the Program during the Period. The Report summarized the operation of the Program and the information and factors considered by the Administrator in assessing whether the Program has been adequately and effectively implemented with respect to the Federated Hermes Funds. Such information and factors included, among other things:
■ confirmation that the Fund did not utilize alternative funding sources during the Period;
■ the periodic classifications of the Fund’s investments into one of four liquidity categories and the methodologies and inputs used to classify the investments, including the Fund’s reasonably anticipated trade size;
■ the analysis received from a third-party liquidity assessment vendor that is taken into account in the process of determining the liquidity classifications of the Fund’s investments and the results of an evaluation of the services performed by the vendor in support of this process;
■ the fact that the Fund invested primarily in highly liquid investments during the Period and, therefore, was not required to establish, and has not established, an HLIM and the procedures for monitoring the status of the Fund as investing primarily in highly liquid investments;
■ the fact that the Fund invested no more than 15% of its assets in illiquid investments during the Period and the procedures for monitoring this limit; and
■ liquidity events during the Period, including the impact on liquidity caused by extended non-U.S. market closures and the market disruptions resulting from the novel coronavirus outbreak, and the fact that there were no specific liquidity events during the Period that materially affected the Fund’s liquidity risk.
Based on this review, the Fund’s investment adviser, in its role as Administrator, collectively with the other investment advisers to the Federated Hermes Funds, concluded that the Program is operating effectively to assess and manage the Fund’s liquidity risk, and that the Program has been and continues to be adequately and effectively implemented to monitor and, as applicable, respond to the Fund’s liquidity developments.
Annual Shareholder Report
Voting Proxies on Fund Portfolio Securities
A description of the policies and procedures that the Fund uses to determine how to vote proxies, if any, relating to securities held in the Fund’s portfolio is available, without charge and upon request, by calling 1-800-341-7400. A report on “Form N-PX” of how the Fund voted any such proxies during the most recent 12-month period ended June 30 is available via the Proxy Voting Record (Form N-PX) link associated with the Fund and share class name at FederatedInvestors.com/FundInformation. Form N-PX filings are also available at the SEC’s website at sec.gov.
Quarterly Portfolio Schedule
Each fiscal quarter, the Fund will file with the SEC a complete schedule of its monthly portfolio holdings on “Form N-PORT.” The Fund’s holdings as of the end of the third month of every fiscal quarter, as reported on Form N-PORT, will be publicly available on the SEC’s website at sec.gov within 60 days of the end of the fiscal quarter upon filing. You may also access this information via the link to the Fund and share class name at FederatedInvestors.com.
Annual Shareholder Report
Mutual funds are not bank deposits or obligations, are not guaranteed by any bank and are not insured or guaranteed by the U.S. government, the Federal Deposit Insurance Corporation, the Federal Reserve Board or any other government agency. Investment in mutual funds involves investment risk, including the possible loss of principal.
This Report is authorized for distribution to prospective investors only when preceded or accompanied by the Fund’s Prospectus, which contains facts concerning its objective and policies, management fees, expenses and other information. 
Federated Hermes Muni and Stock Advantage Fund
Federated Hermes Funds
4000 Ericsson Drive
Warrendale, PA 15086-7561
Contact us at FederatedInvestors.com
or call 1-800-341-7400.
Federated Securities Corp., Distributor
CUSIP 31420C837
CUSIP 31420C829
CUSIP 31420C811
CUSIP 31420C720
CUSIP 31420C654
31285 (12/20)
© 2020 Federated Hermes, Inc.
(a) As of the end of the period covered by this report, the registrant has adopted a code of ethics (the "Section 406 Standards for Investment Companies - Ethical Standards for Principal Executive and Financial Officers") that applies to the registrant's Principal Executive Officer and Principal Financial Officer; the registrant's Principal Financial Officer also serves as the Principal Accounting Officer.
(c) There was no amendment to the registrant’s code of ethics described in Item 2(a) above during the period covered by the report.
(d) There was no waiver granted, either actual or implicit, from a provision to the registrant’s code of ethics described in Item 2(a) above during the period covered by the report.
(e) Not Applicable
(f)(3) The registrant hereby undertakes to provide any person, without charge, upon request, a copy of the code of ethics. To request a copy of the code of ethics, contact the registrant at 1-800-341-7400, and ask for a copy of the Section 406 Standards for Investment Companies - Ethical Standards for Principal Executive and Financial Officers.
Item 3. Audit Committee Financial Expert
The registrant's Board has determined that each of the following members of the Board's Audit Committee is an “audit committee financial expert,” and is "independent," for purposes of this Item: John T. Collins, G. Thomas Hough and Thomas M. O'Neill.
| Item 4. | Principal Accountant Fees and Services |
(a) Audit Fees billed to the registrant for the two most recent fiscal years:
Fiscal year ended 2020 - $246,978
Fiscal year ended 2019 - $227,447
(b) Audit-Related Fees billed to the registrant for the two most recent fiscal years:
Fiscal year ended 2020 - $4,000
Fiscal year ended 2019 - $0
Audit Consent for additional class N-1A.
Amount requiring approval of the registrant’s audit committee pursuant to paragraph (c)(7)(ii) of Rule 2-01 of Regulation S-X, $0 and $0 respectively.
(c) Tax Fees billed to the registrant for the two most recent fiscal years:
Fiscal year ended 2020 - $0
Fiscal year ended 2019 - $0
Amount requiring approval of the registrant’s audit committee pursuant to paragraph (c)(7)(ii) of Rule 2-01 of Regulation S-X, $0 and $0 respectively.
(d) All Other Fees billed to the registrant for the two most recent fiscal years:
Fiscal year ended 2020 - $0
Fiscal year ended 2019 - $0
Amount requiring approval of the registrant’s audit committee pursuant to paragraph (c)(7)(ii) of Rule 2-01 of Regulation S-X, $46,864 and $30,141 respectively. Fiscal year ended 2020- Service fee for analysis of potential Passive Foreign Investment Company holdings. Fiscal year ended 2019- Service fee for analysis of potential Passive Foreign Investment Company holdings.
(e)(1) Audit Committee Policies regarding Pre-approval of Services.
The Audit Committee is required to pre-approve audit and non-audit services performed by the independent auditor in order to assure that the provision of such services do not impair the auditor’s independence. Unless a type of service to be provided by the independent auditor has received general pre-approval, it will require specific pre-approval by the Audit Committee. Any proposed services exceeding pre-approved cost levels will require specific pre-approval by the Audit Committee.
Certain services have the general pre-approval of the Audit Committee. The term of the general pre-approval is 12 months from the date of pre-approval, unless the Audit Committee specifically provides for a different period. The Audit Committee will annually review the services that may be provided by the independent auditor without obtaining specific pre-approval from the Audit Committee and may grant general pre-approval for such services. The Audit Committee will revise the list of general pre-approved services from time to time, based on subsequent determinations. The Audit Committee will not delegate to management its responsibilities to pre-approve services performed by the independent auditor.
The Audit Committee has delegated pre-approval authority to its Chairman for services that do not exceed a specified dollar threshold. The Chairman or Chief Audit Executive will report any such pre-approval decisions to the Audit Committee at its next scheduled meeting. The Committee will designate another member with such pre-approval authority when the Chairman is unavailable.
AUDIT SERVICES
The annual Audit services engagement terms and fees will be subject to the specific pre-approval of the Audit Committee. The Audit Committee will approve, if necessary, any changes in terms, conditions and fees resulting from changes in audit scope, registered investment company (RIC) structure or other matters.
In addition to the annual Audit services engagement specifically approved by the Audit Committee, the Audit Committee may grant general pre-approval for other Audit services, which are those services that only the independent auditor reasonably can provide. The Audit Committee has pre-approved certain Audit services; with limited exception, all other audit services must be specifically pre-approved by the Audit Committee.
AUDIT-RELATED SERVICES
Audit-related services are assurance and related services that are reasonably related to the performance of the audit or review of the RIC’s financial statements or that are traditionally performed by the independent auditor. The Audit Committee believes that the provision of Audit-related services does not impair the independence of the auditor, and has pre-approved certain audit-related services; all other audit-related services must be specifically pre-approved by the Audit Committee.
TAX SERVICES
The Audit Committee believes that the independent auditor can provide Tax services to the RIC such as tax compliance, tax planning and tax advice without impairing the auditor’s independence. However, the Audit Committee will not permit the retention of the independent auditor in connection with a transaction initially recommended by the independent auditor, the purpose of which may be tax avoidance and the tax treatment of which may not be supported in the Internal Revenue Code and related regulations. The Audit Committee has pre-approved certain Tax services; with limited exception, all tax services involving large and complex transactions must be specifically pre-approved by the Audit Committee.
ALL OTHER SERVICES
With respect to the provision of permissible services other than audit, review or attest services the pre-approval requirement is waived if:
| (1) | With respect to such services rendered to the Funds, the aggregate amount of all such services provided constitutes no more than five percent of the total amount of revenues paid by the audit client to its accountant during the fiscal year in which the services are provided; and, |
| (2) | With respect to such services rendered to the Fund’s investment adviser and any entity controlling, controlled by to under common control with the investment adviser such as affiliated non-U.S. and U.S. funds not under the Audit Committee’s purview and which do not fall within a category of service which has been determined by the Audit Committee not to have a direct impact on the operations or financial reporting of the RIC, the aggregate amount of all services provided constitutes no more than five percent of the total amount of revenues paid to the RIC’s auditor by the RIC, its investment adviser and any entity controlling, controlled by, or under common control with the investment adviser during the fiscal year in which the services are provided; and |
| (3) | Such services were not recognized by the issuer or RIC at the time of the engagement to be non-audit services; and |
| (4) | Such services are promptly brought to the attention of the Audit Committee and approved prior to the completion of the audit by the Audit Committee or by one or more members of the Audit Committee who are members of the Board of Directors to whom authority to grant such approvals has been delegated by the Audit Committee. |
The Audit Committee may grant general pre-approval to those permissible non-audit services which qualify for pre-approval and which it believes are routine and recurring services, and would not impair the independence of the auditor.
The SEC’s rules and relevant guidance should be consulted to determine the precise definitions of these services and applicability of exceptions to certain of the prohibitions.
PRE-APPROVAL FEE LEVELS
Pre-approval fee levels for all services to be provided by the independent auditor will be established annually by the Audit Committee. Any proposed services exceeding these levels will require specific pre-approval by the Audit Committee.
PROCEDURES
Requests or applications to provide services that require specific approval by the Audit Committee will be submitted to the Audit Committee by the Fund’s Principal Accounting Officer and/or the Chief Audit Executive of Federated Hermes, Inc., only after those individuals have determined that the request or application is consistent with the SEC’s rules on auditor independence.
(e)(2) Percentage of services identified in items 4(b) through 4(d) that were approved by the registrants audit committee pursuant to paragraph (c)(7)(i)(C) of Rule 2-01 of Regulation S-X:
4(b)
Fiscal year ended 2020 – 0%
Fiscal year ended 2019 - 0%
Percentage of services provided to the registrants investment adviser and any entity controlling, controlled by, or under common control with the investment adviser that provides ongoing services to the registrant that were approved by the registrants audit committee pursuant to paragraph (c)(7)(i)(C) of Rule 2-01 of Regulation S-X, 0% and 0% respectively.
4(c)
Fiscal year ended 2020 – 0%
Fiscal year ended 2019 – 0%
Percentage of services provided to the registrants investment adviser and any entity controlling, controlled by, or under common control with the investment adviser that provides ongoing services to the registrant that were approved by the registrants audit committee pursuant to paragraph (c)(7)(i)(C) of Rule 2-01 of Regulation S-X, 0% and 0% respectively.
4(d)
Fiscal year ended 2020 – 0%
Fiscal year ended 2019 – 0%
Percentage of services provided to the registrants investment adviser and any entity controlling, controlled by, or under common control with the investment adviser that provides ongoing services to the registrant that were approved by the registrants audit committee pursuant to paragraph (c)(7)(i)(C) of Rule 2-01 of Regulation S-X, 0% and 0% respectively.
| (g) | Non-Audit Fees billed to the registrant, the registrant’s investment adviser, and certain entities controlling, controlled by or under common control with the investment adviser: |
Fiscal year ended 2020 - $143,651
Fiscal year ended 2019 - $695,017
| (h) | The registrant’s Audit Committee has considered that the provision of non-audit services that were rendered to the registrant’s adviser (not including any sub-adviser whose role is primarily portfolio management and is subcontracted with or overseen by another investment adviser), and any entity controlling, controlled by, or under common control with the investment adviser that provides ongoing services to the registrant that were not pre-approved pursuant to paragraph (c)(7)(ii) of Rule 2-01 of Regulation S-X is compatible with maintaining the principal accountant’s independence. |
| Item 5. | Audit Committee of Listed Registrants |
Not Applicable
| Item 6. | Schedule of Investments |
(a) The registrant’s Schedule of Investments is included as part of the Report to Stockholders filed under Item 1 of this form.
(b) Not Applicable; Fund had no divestments during the reporting period covered since the previous Form N-CSR filing.
| Item 7. | Disclosure of Proxy Voting Policies and Procedures for Closed-End Management Investment Companies |
Not Applicable
| Item 8. | Portfolio Managers of Closed-End Management Investment Companies |
Not Applicable
| Item 9. | Purchases of Equity Securities by Closed-End Management Investment Company and Affiliated Purchasers |
Not Applicable
| Item 10. | Submission of Matters to a Vote of Security Holders |
No Changes to Report
| Item 11. | Controls and Procedures |
(a) The registrant’s President and Treasurer have concluded that the
registrant’s disclosure controls and procedures (as defined in rule 30a-3(c) under the Act) are effective in design and operation and are sufficient to form the basis of the certifications required by Rule 30a-(2) under the Act, based on their evaluation of these disclosure controls and procedures within 90 days of the filing date of this report on Form N-CSR.
(b) There were no changes in the registrant’s internal control over financial reporting (as defined in rule 30a-3(d) under the Act) during the registrant’s most recent fiscal half-year (the registrant’s second fiscal half-year in the case of an annual report) that have materially affected, or are reasonably likely to materially affect, the registrant’s internal control over financial reporting.
| Item 12. | Disclosure of Securities Lending Activities for Closed-End Management Investment Companies |
Not Applicable
(a)(1) Code of Ethics- Not Applicable to this Report.
(a)(2) Certifications of Principal Executive Officer and Principal Financial Officer.
(a)(3) Not Applicable.
(b) Certifications pursuant to 18 U.S.C. Section 1350.
SIGNATURES
Pursuant to the requirements of the Securities Exchange Act of 1934 and the Investment Company Act of 1940, the registrant has duly caused this report to be signed on its behalf by the undersigned, thereunto duly authorized.
Registrant Federated Hermes Income Securities Trust
By /S/ Lori A. Hensler
Lori A. Hensler, Principal Financial Officer
Date December 23, 2020
Pursuant to the requirements of the Securities Exchange Act of 1934 and the Investment Company Act of 1940, this report has been signed below by the following persons on behalf of the registrant and in the capacities and on the dates indicated.
By /S/ J. Christopher Donahue
J. Christopher Donahue, Principal Executive Officer
Date December 23, 2020
By /S/ Lori A. Hensler
Lori A. Hensler, Principal Financial Officer
Date December 23, 2020