2021 Investor Presentation
Safe Harbor Statement and Disclosure This presentation includes forward-looking comments subject to important risks and uncertainties. It may also contain financial measures that are not in conformance with accounting principles generally accepted in the United States of America (GAAP) Refer to NACCO’s reports filed on Forms 8-K (current), 10-Q (quarterly), and 10-K (annual) for information on factors that could cause actual results to differ materially from information in this presentation. Past performance may not be representative of future results Information noted in the following slides was effective as of the date that this presentation was posted to the NACCO Industries website, March 31, 2021. Nothing in this presentation should be construed as reaffirming or disaffirming the outlook provided as of the Company’s most recent earnings release and conference call (March 3, 2022) This presentation is not an offer to sell or a solicitation of offers to buy any of NACCO Industries, Inc.’s securities 2

Company Overview NACCO Industries® brings natural resources to life by delivering aggregates, minerals, reliable fuels and environmental solutions through its robust portfolio of NACCO Natural Resources businesses
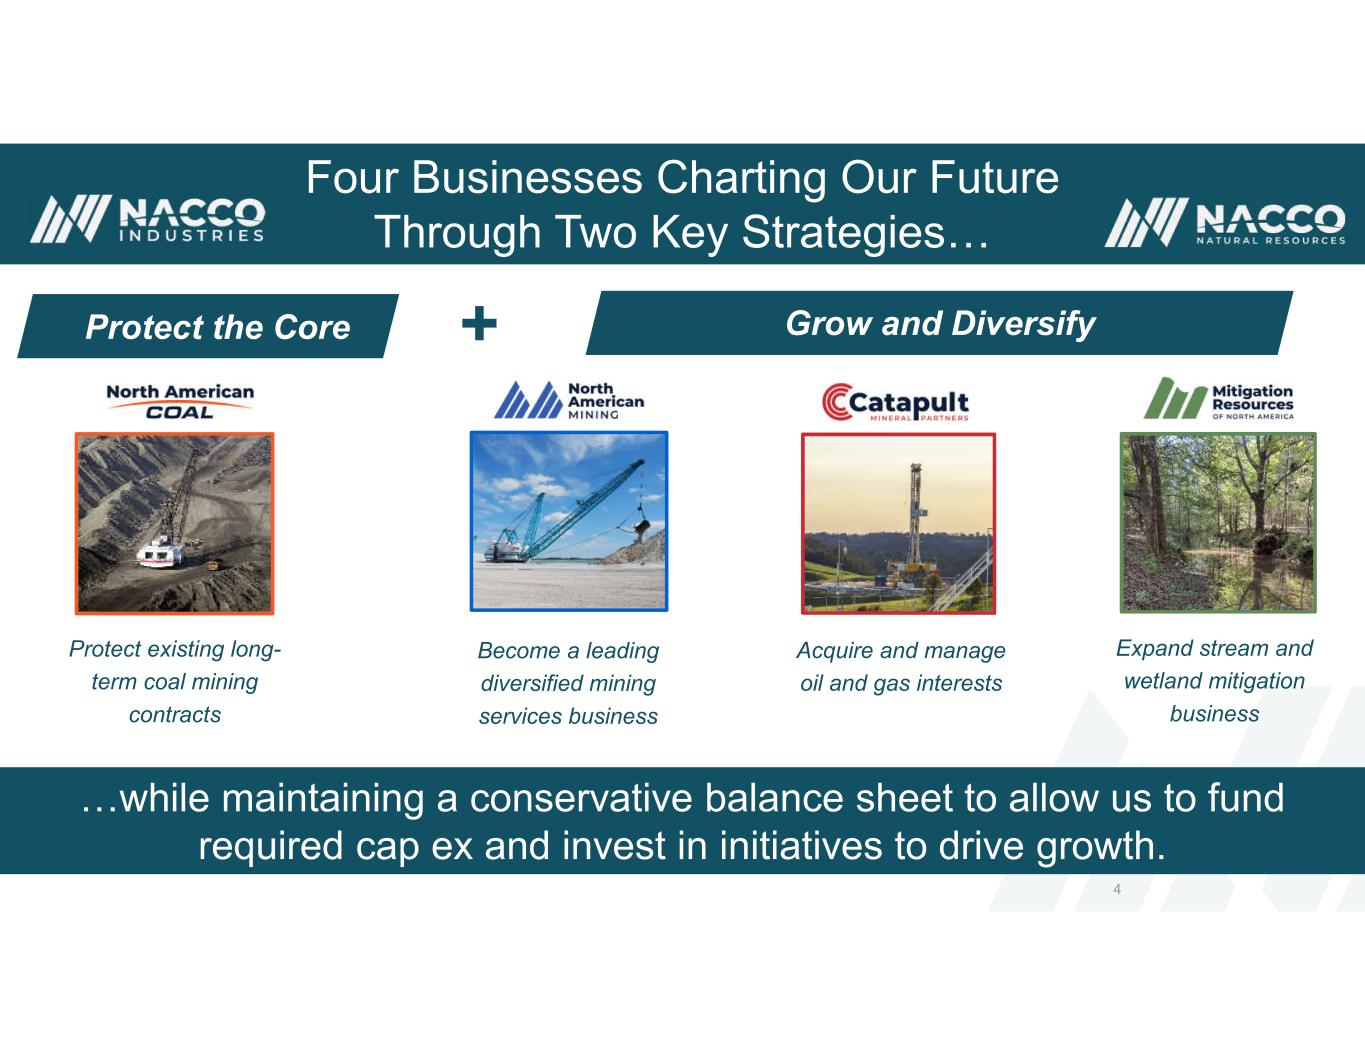
Four Businesses Charting Our Future Through Two Key Strategies… …while maintaining a conservative balance sheet to allow us to fund required cap ex and invest in initiatives to drive growth. 4 Protect the Core Protect existing long- term coal mining contracts Become a leading diversified mining services business Acquire and manage oil and gas interests Expand stream and wetland mitigation business Grow and Diversify+

(1) Includes a contract termination settlement of $10.3 million pre-tax, or $7.9 million after taxes of $2.4 million. (2) Consolidated Adjusted EBITDA and Net Cash (Debt) are non-GAAP measures and should not be considered in isolation or as substitutes for GAAP measures. See non-GAAP explanations and reconciliations to GAAP measures beginning on page 35. (3) Net Cash (Debt) at December 31, 2021 is calculated as cash of $86.0 million less total debt of $20.7 million. NACCO Industries (NYSE: NC) – At a Glance 5 Key Metrics In thousands Year Ended December 31, 2021 Operating Profit (1) $55,410 Income before Income taxes (1) $56,850 Net Income(1) $48,125 Consolidated Adjusted EBITDA(2) $70,872 Net Cash (Debt) at 12/31/2021(2)(3) $65,295 Positioned for Growth Priorities for Cash Invest in growth and diversification strategies Fund required cap ex Return cash to stockholders through dividends and as appropriate, share repurchases Maintain a conservative leverage ratio Availability under Revolver: $116 million at 12/31/21

Coal Mining Segment
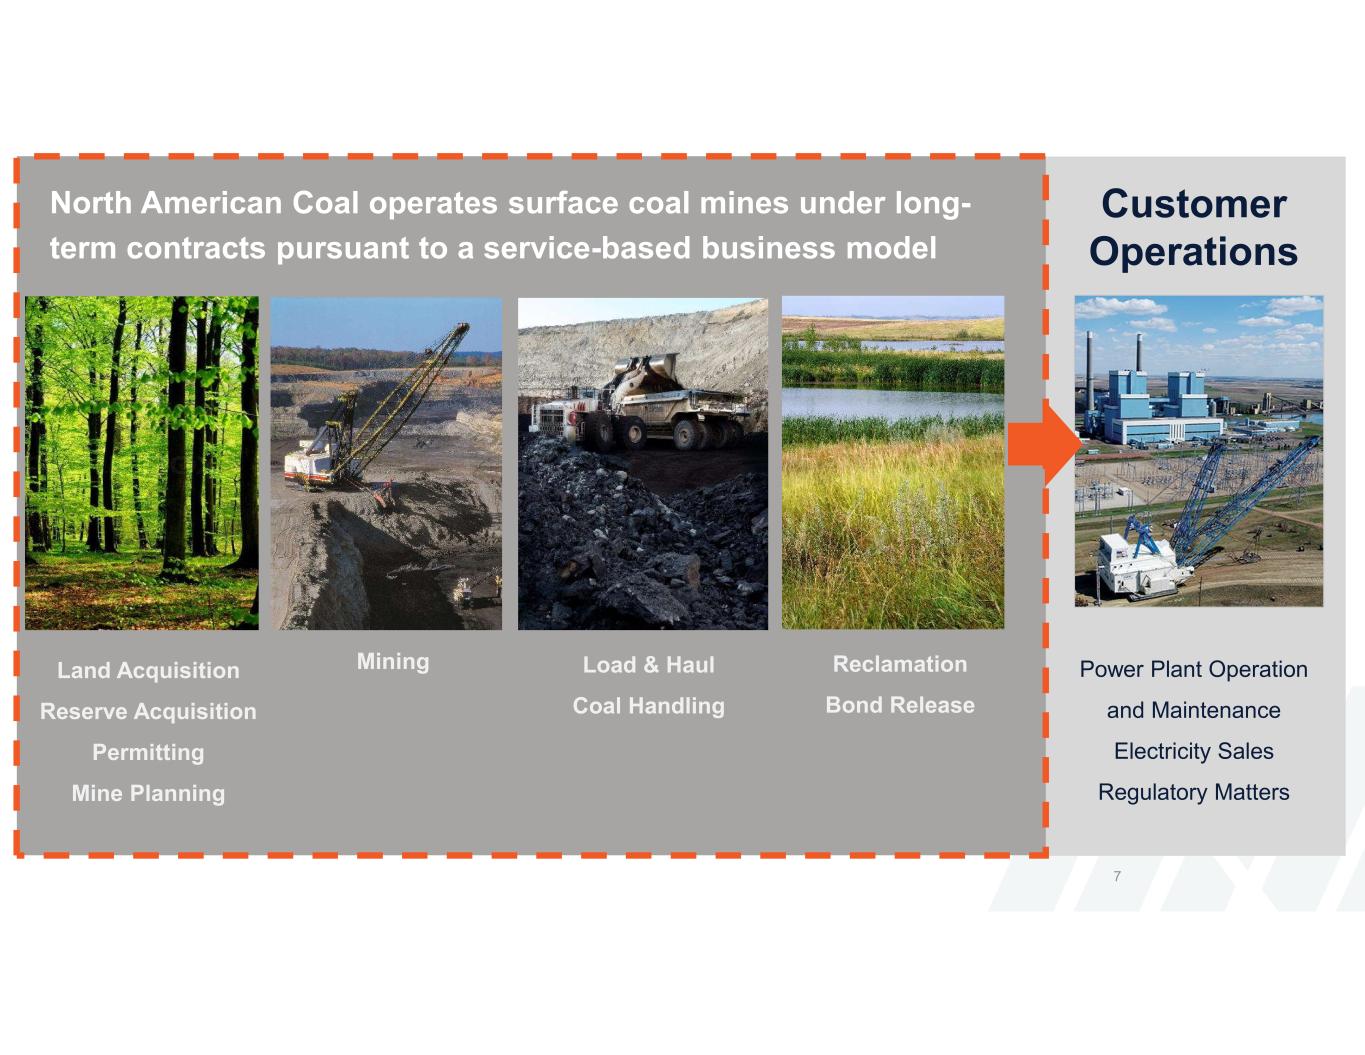
Coal Mining Segment – Operations 7 Power Plant Operation and Maintenance Electricity Sales Regulatory Matters MiningLand Acquisition Reserve Acquisition Permitting Mine Planning Load & Haul Coal Handling Reclamation Bond Release North American Coal operates surface coal mines under long- term contracts pursuant to a service-based business model Customer Operations

Coal Mine Locations • More than 100 years of experience • Our mines deliver coal to adjacent power plants • Each mine is the exclusive supplier to its customer’s facility 8
Focused on managing coal production costs and maximizing efficiencies Benefits customers and NACCO as coal cost is a significant driver in power plant dispatch Increased power plant dispatch results in increased demand for coal Fluctuating natural gas prices and availability of renewable energy sources affect the amount of electricity dispatched Significant increase in natural gas prices during 2021 contributed to an increase in customer power plant dispatch and resulted in strong 2021 operating results 9 We work diligently to support our customers so they can produce reliable and affordable energy Strong Customer Relationships
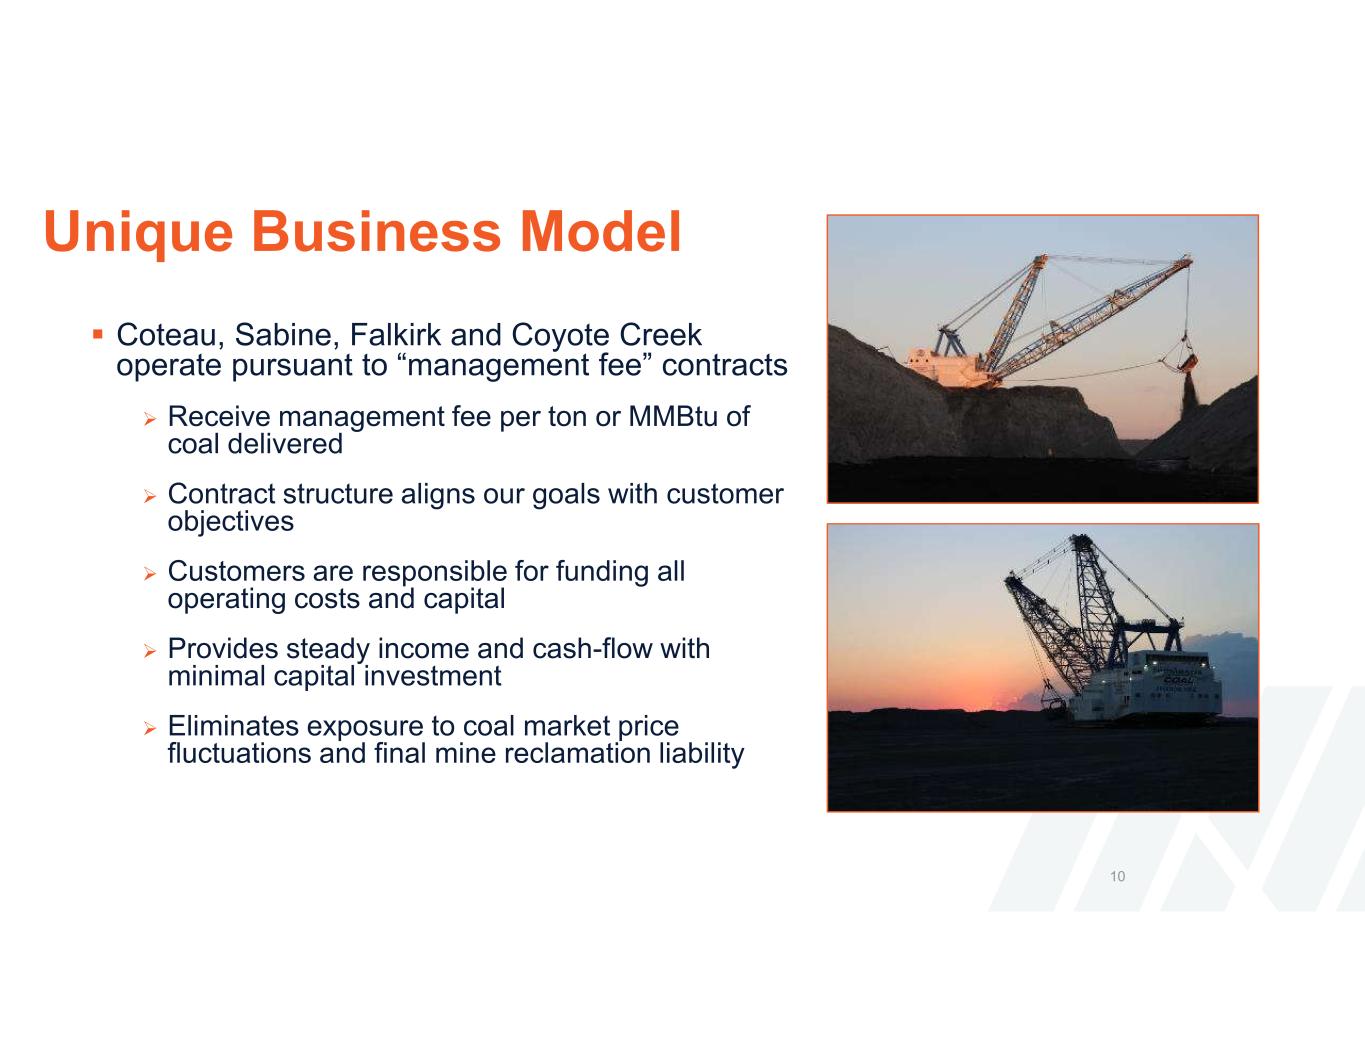
Unique Business Model Coteau, Sabine, Falkirk and Coyote Creek operate pursuant to “management fee” contracts Receive management fee per ton or MMBtu of coal delivered Contract structure aligns our goals with customer objectives Customers are responsible for funding all operating costs and capital Provides steady income and cash-flow with minimal capital investment Eliminates exposure to coal market price fluctuations and final mine reclamation liability 10
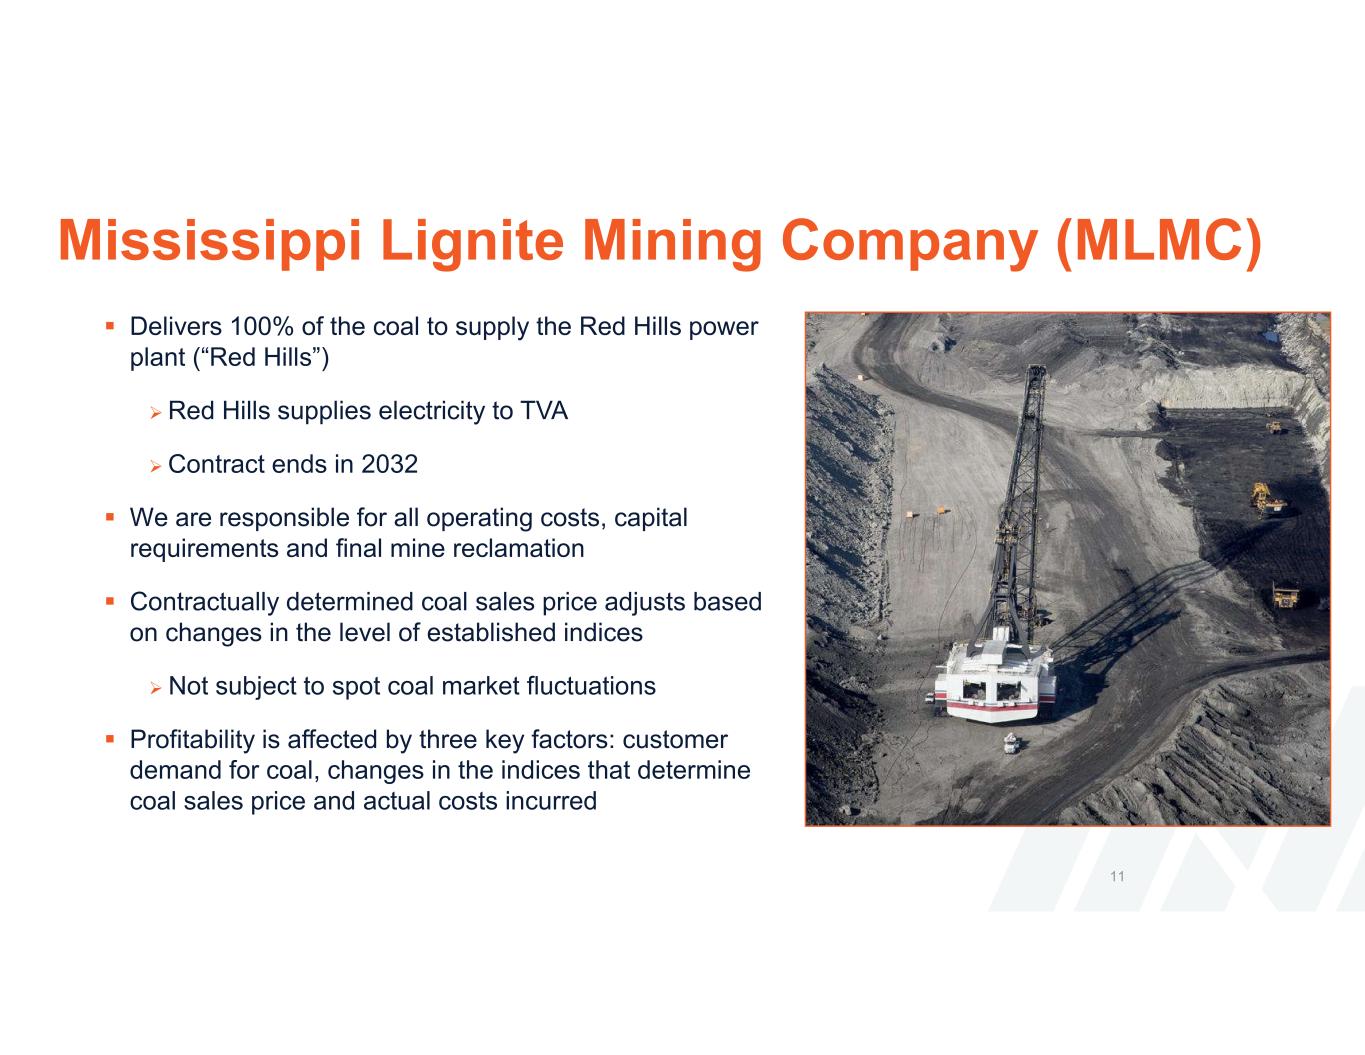
Mississippi Lignite Mining Company (MLMC) Delivers 100% of the coal to supply the Red Hills power plant (“Red Hills”) Red Hills supplies electricity to TVA Contract ends in 2032 We are responsible for all operating costs, capital requirements and final mine reclamation Contractually determined coal sales price adjusts based on changes in the level of established indices Not subject to spot coal market fluctuations Profitability is affected by three key factors: customer demand for coal, changes in the indices that determine coal sales price and actual costs incurred 11
North American Mining Segment
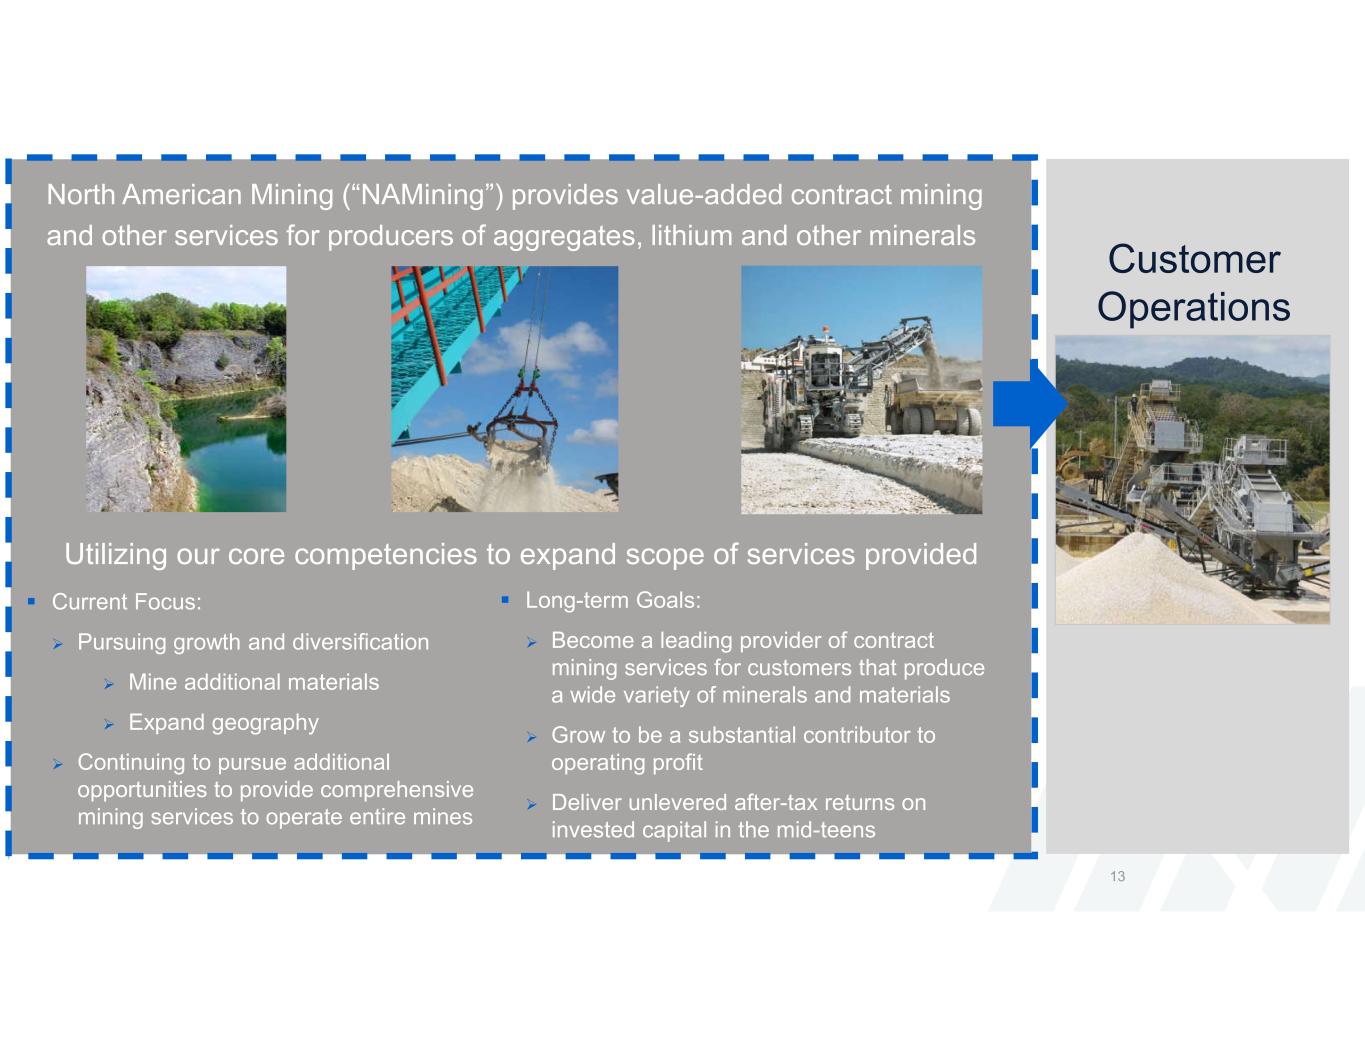
13 North American Mining (“NAMining”) provides value-added contract mining and other services for producers of aggregates, lithium and other minerals Customer Operations Utilizing our core competencies to expand scope of services provided Current Focus: Pursuing growth and diversification Mine additional materials Expand geography Continuing to pursue additional opportunities to provide comprehensive mining services to operate entire mines Long-term Goals: Become a leading provider of contract mining services for customers that produce a wide variety of minerals and materials Grow to be a substantial contributor to operating profit Deliver unlevered after-tax returns on invested capital in the mid-teens
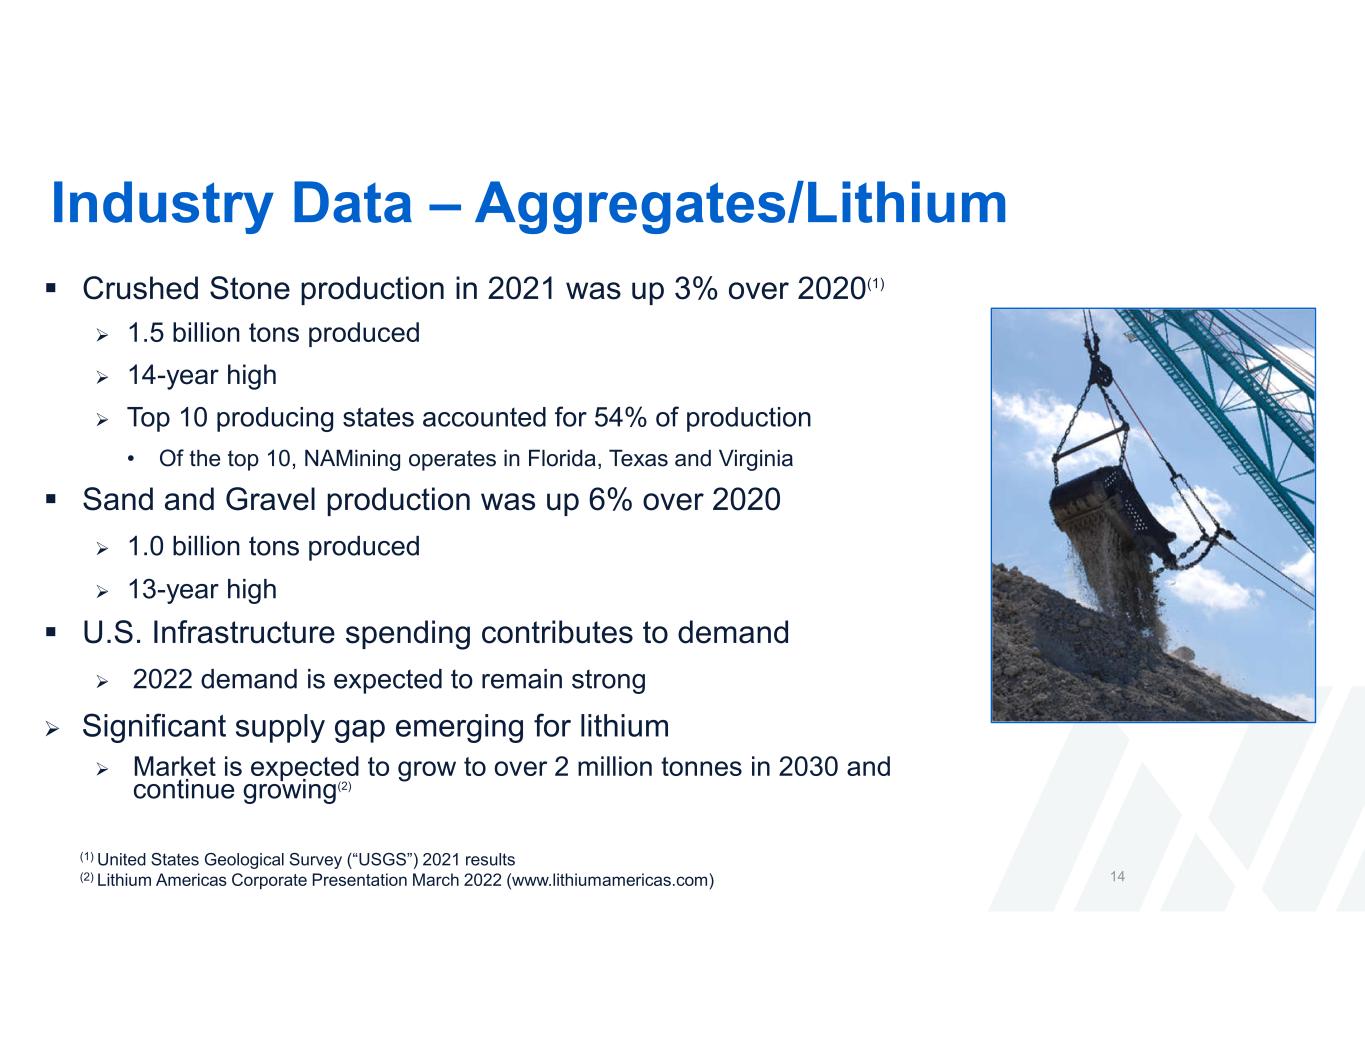
Industry Data – Aggregates/Lithium 14 Crushed Stone production in 2021 was up 3% over 2020(1) 1.5 billion tons produced 14-year high Top 10 producing states accounted for 54% of production • Of the top 10, NAMining operates in Florida, Texas and Virginia Sand and Gravel production was up 6% over 2020 1.0 billion tons produced 13-year high U.S. Infrastructure spending contributes to demand 2022 demand is expected to remain strong Significant supply gap emerging for lithium Market is expected to grow to over 2 million tonnes in 2030 and continue growing(2) (1) United States Geological Survey (“USGS”) 2021 results (2) Lithium Americas Corporate Presentation March 2022 (www.lithiumamericas.com)
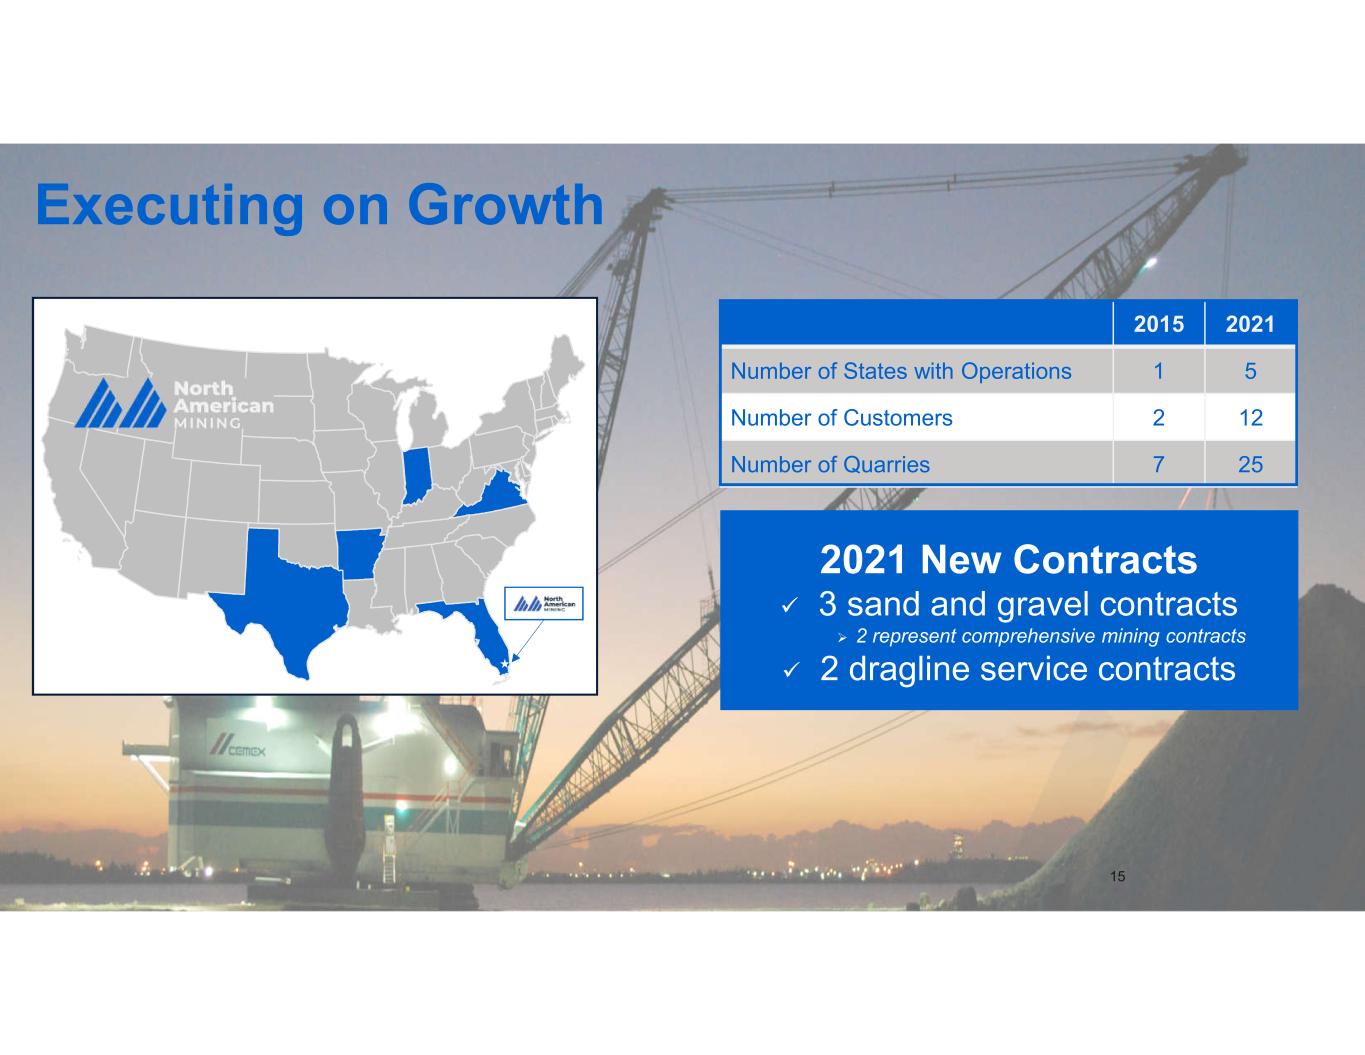
15 Executing on Growth 2015 2021 Number of States with Operations 1 5 Number of Customers 2 12 Number of Quarries 7 25 2021 New Contracts 3 sand and gravel contracts 2 represent comprehensive mining contracts 2 dragline service contracts

NAMining – Sawtooth/Thacker Pass Project (in development) NAMining’s subsidiary, Sawtooth Mining, will serve as exclusive contract miner for the Thacker Pass lithium project The Thacker Pass Project is 100% owned by Lithium Nevada Corp. • Developing a lithium production facility near what is believed to be the largest known lithium deposit in the United States • Lithium Nevada Corp. owned by Lithium Americas (NYSE: LAC) Sawtooth Mining will provide comprehensive mining services Reimbursed for operating and mine reclamation costs Management fee per metric ton of lithium delivered 20 year contract term 16
Minerals Management Segment

Catapult Mineral Partners is the business unit focused on managing and expanding our portfolio of oil and gas mineral and royalty interests Acquired mineral and royalty interests totaling approximately $5 million in 2021 Building on acquisitions of approximately $14 million in 2020 With a total domestic minerals market estimated at 100- 400x Catapult’s forecasted investment in 2022, growth opportunities remain significant(1) Disciplined approach to target potential acquisitions in the United States: Align with our strategy and objectives Balance of well development levels Extend geographic footprint to diversify across multiple basins 18 Minerals Management was a strong contributor to operating profit in 2021 Executing Growth (1) Source: Enverus. Inflation adjusted 5 year average of total publicly announced transactions with disclosed transaction values.
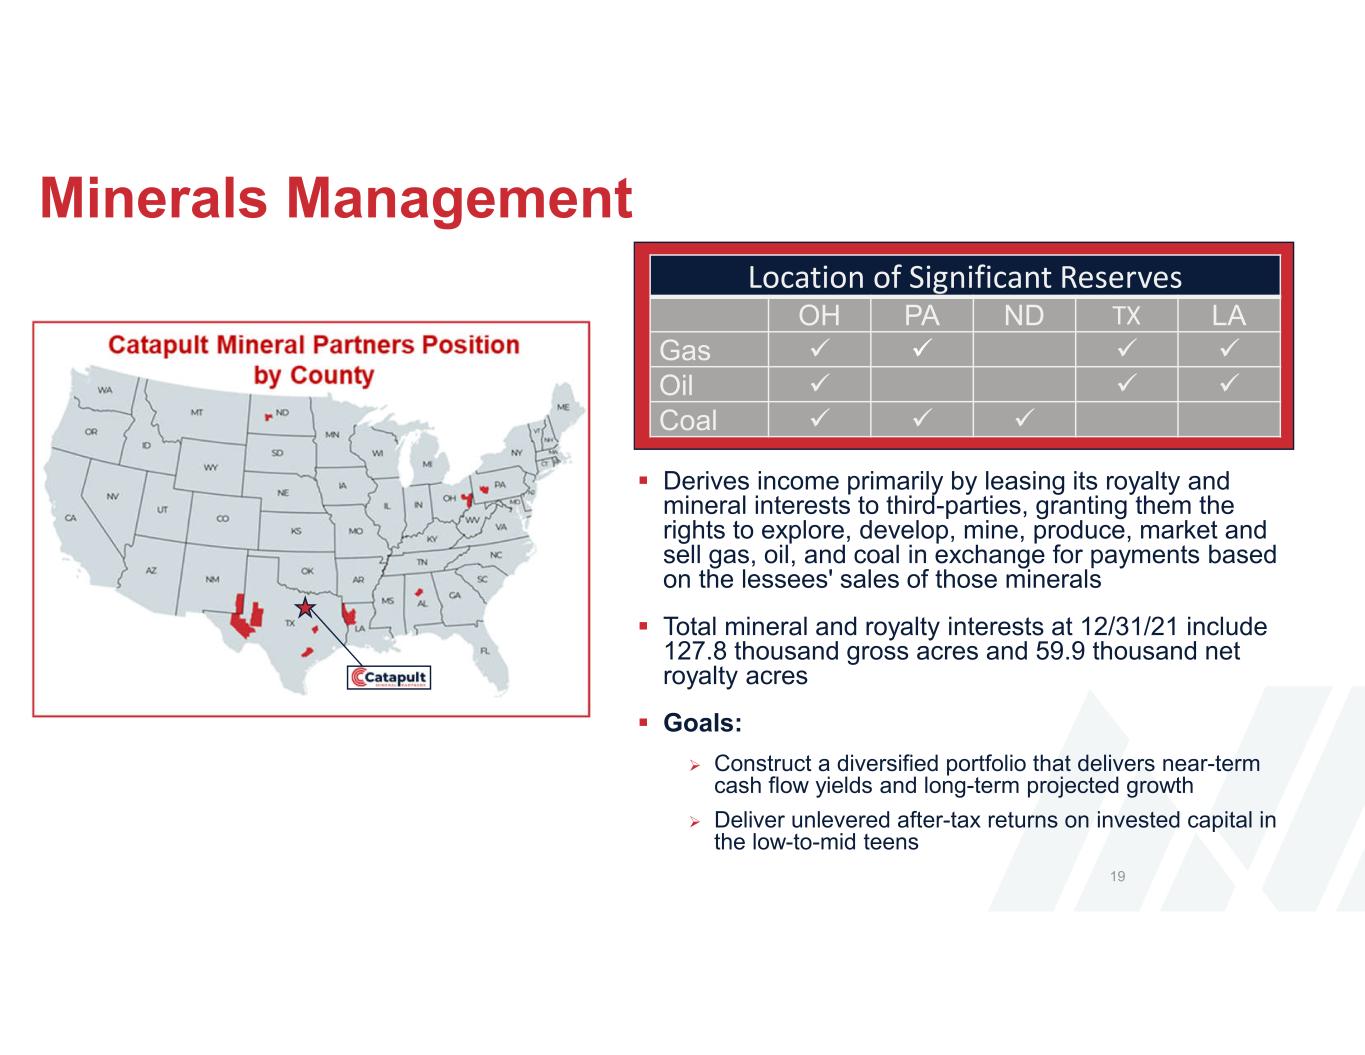
Minerals Management Derives income primarily by leasing its royalty and mineral interests to third-parties, granting them the rights to explore, develop, mine, produce, market and sell gas, oil, and coal in exchange for payments based on the lessees' sales of those minerals Total mineral and royalty interests at 12/31/21 include 127.8 thousand gross acres and 59.9 thousand net royalty acres Goals: Construct a diversified portfolio that delivers near-term cash flow yields and long-term projected growth Deliver unlevered after-tax returns on invested capital in the low-to-mid teens 19 Location of Significant Reserves OH PA ND TX LA Gas Oil Coal

Business Model Minerals Management owns royalty interests, mineral interests, nonparticipating royalty interests, and overriding royalty interests Benefit from the continued development of properties without the need for additional investment once interests have been acquired We believe this business model can deliver higher average operating margins over the life of a reserve than traditional oil and gas companies that bear the cost of exploration, production and/or development 20

Portfolio Overview Appalachia E. TX/ Haynesville Permian Eagle Ford Other Totals 2021 Gross Acres 34,661.0 6,477.2 63,997.9 15,510.3 7,138.9 127,785.3 2021 Net Royalty Acres 36,199.3 7,455.4 1,243.1 1,712.3 13,327.2 59,937.3 2021 Production (BOE) 881,231 183,041 47,480 19,836 2,168 1,133,756 Production Mix By Revenue(1) Gross/Net Well Count 156 / 8.415 38 / 1.107 596 / 0.779 68 / 0.968 7 / 1.065 865 / 12.334 Q4 2021 Production Rate (BOE/d)(1) 2,118 500 157 45 6 2,826 Production Mix By Product(1) Rig Count(2) 18 36 166 23 6 249 Top Operators Ascent Resources Aethon Energy Endeavor Energy Resources SilverBow Resources Summit Natural Resources Ascent Resources EAP Holdings Tellurian Inc Pioneer Natural Resources ConocoPhillips EAP Holdings Gulfport Energy Corp BPX Energy Laredo Petroleum Ranger Oil Corp Aethon Energy Gas 92% NGL 8% Gas 100% Gas 10% Oil 77% NGL 13% Gas 15% Oil 68% NGL 17% Gas 93% NGL 7% Gas 25% Oil 56% NGL 19% Gas 26% Oil 46% NGL 28% Gas 100% Company Data as of 12/31/2021, unless otherwise noted (1) Based on average production rates and realized prices for Q4 2021 (2) Rigs operating for company lessees within the basin, as of 3/24/2022 Gas 100% Gas 100% Oil 11% NGL 8% Gas 89% Oil 4% NGL 7% Gas 81% 21
Mitigation Resources
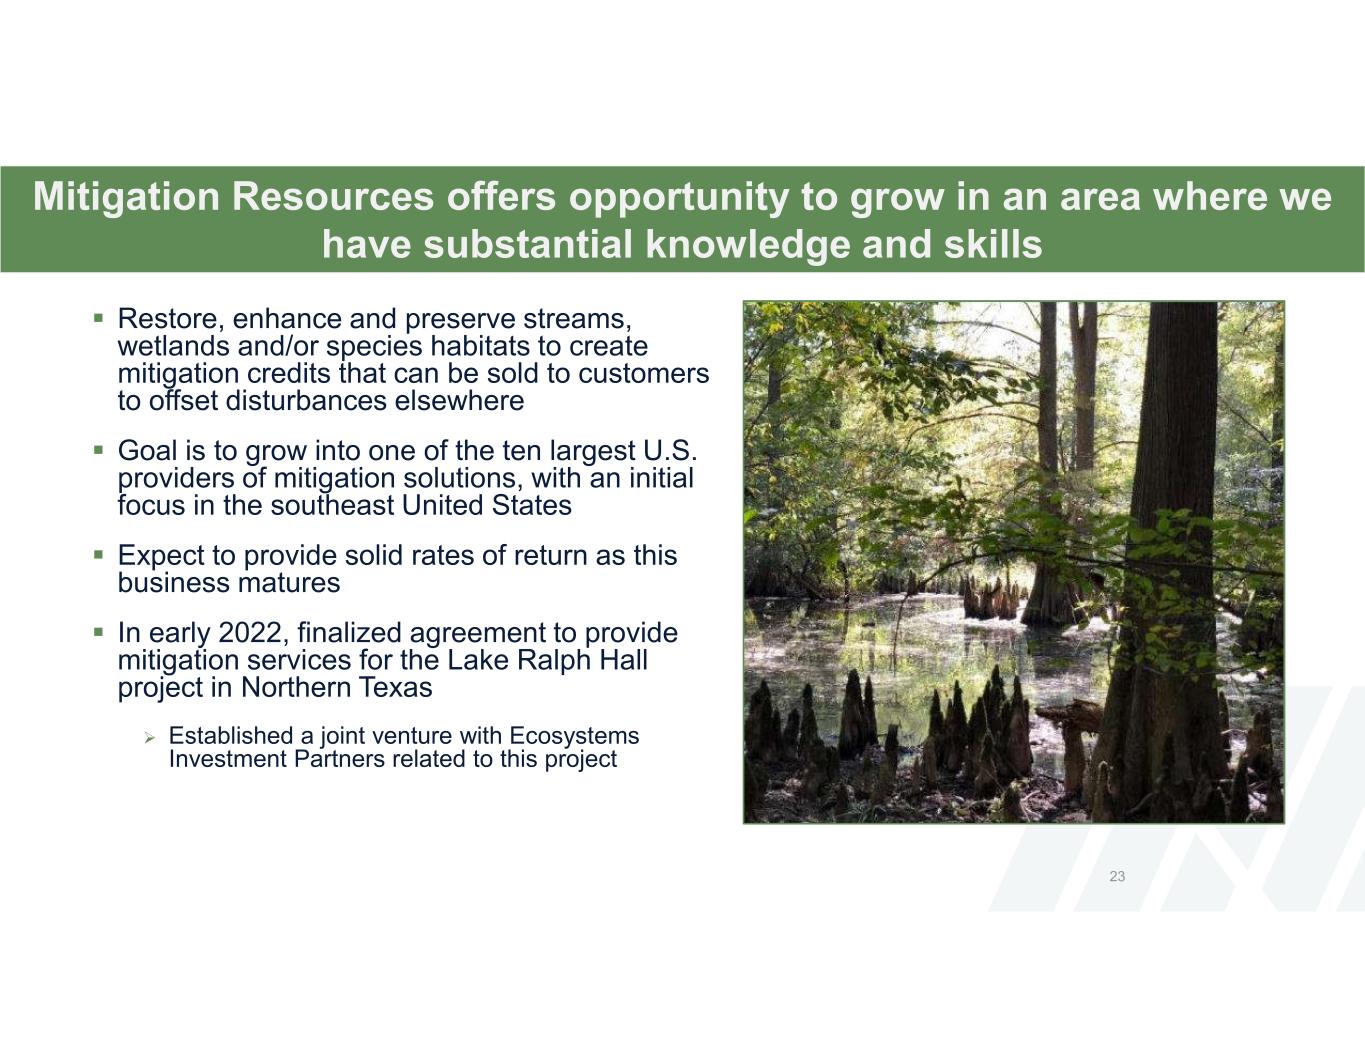
Restore, enhance and preserve streams, wetlands and/or species habitats to create mitigation credits that can be sold to customers to offset disturbances elsewhere Goal is to grow into one of the ten largest U.S. providers of mitigation solutions, with an initial focus in the southeast United States Expect to provide solid rates of return as this business matures In early 2022, finalized agreement to provide mitigation services for the Lake Ralph Hall project in Northern Texas Established a joint venture with Ecosystems Investment Partners related to this project 23 Mitigation Resources offers opportunity to grow in an area where we have substantial knowledge and skills
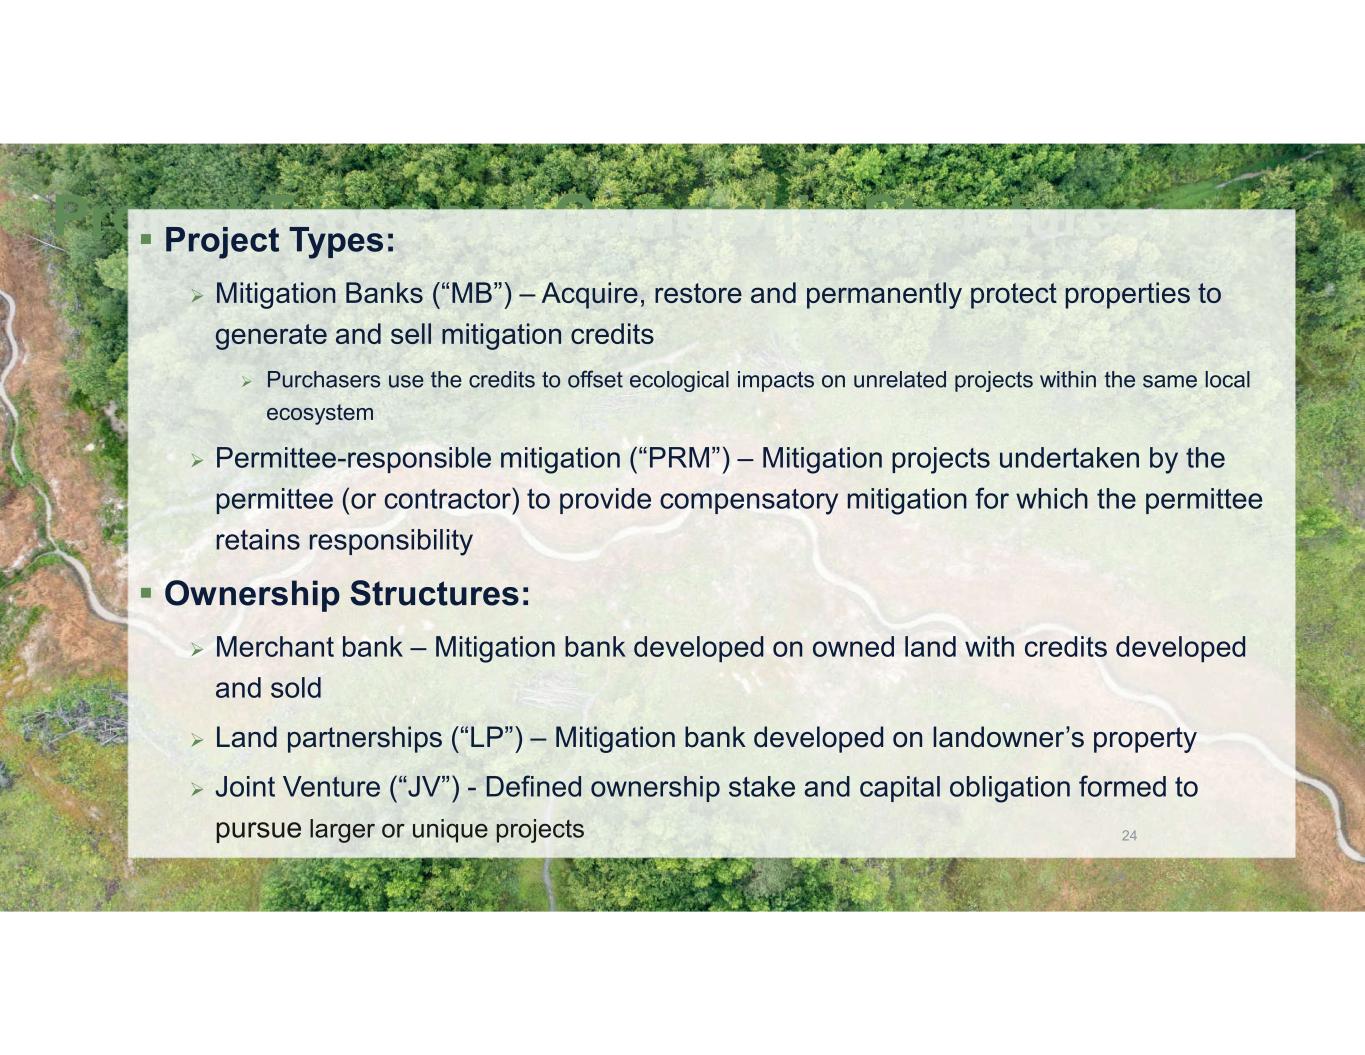
Project Types and Ownership Structures Project Types: Mitigation Banks (“MB”) – Acquire, restore and permanently protect properties to generate and sell mitigation credits Purchasers use the credits to offset ecological impacts on unrelated projects within the same local ecosystem Permittee-responsible mitigation (“PRM”) – Mitigation projects undertaken by the permittee (or contractor) to provide compensatory mitigation for which the permittee retains responsibility Ownership Structures: Merchant bank – Mitigation bank developed on owned land with credits developed and sold Land partnerships (“LP”) – Mitigation bank developed on landowner’s property Joint Venture (“JV”) - Defined ownership stake and capital obligation formed to pursue larger or unique projects 24 24
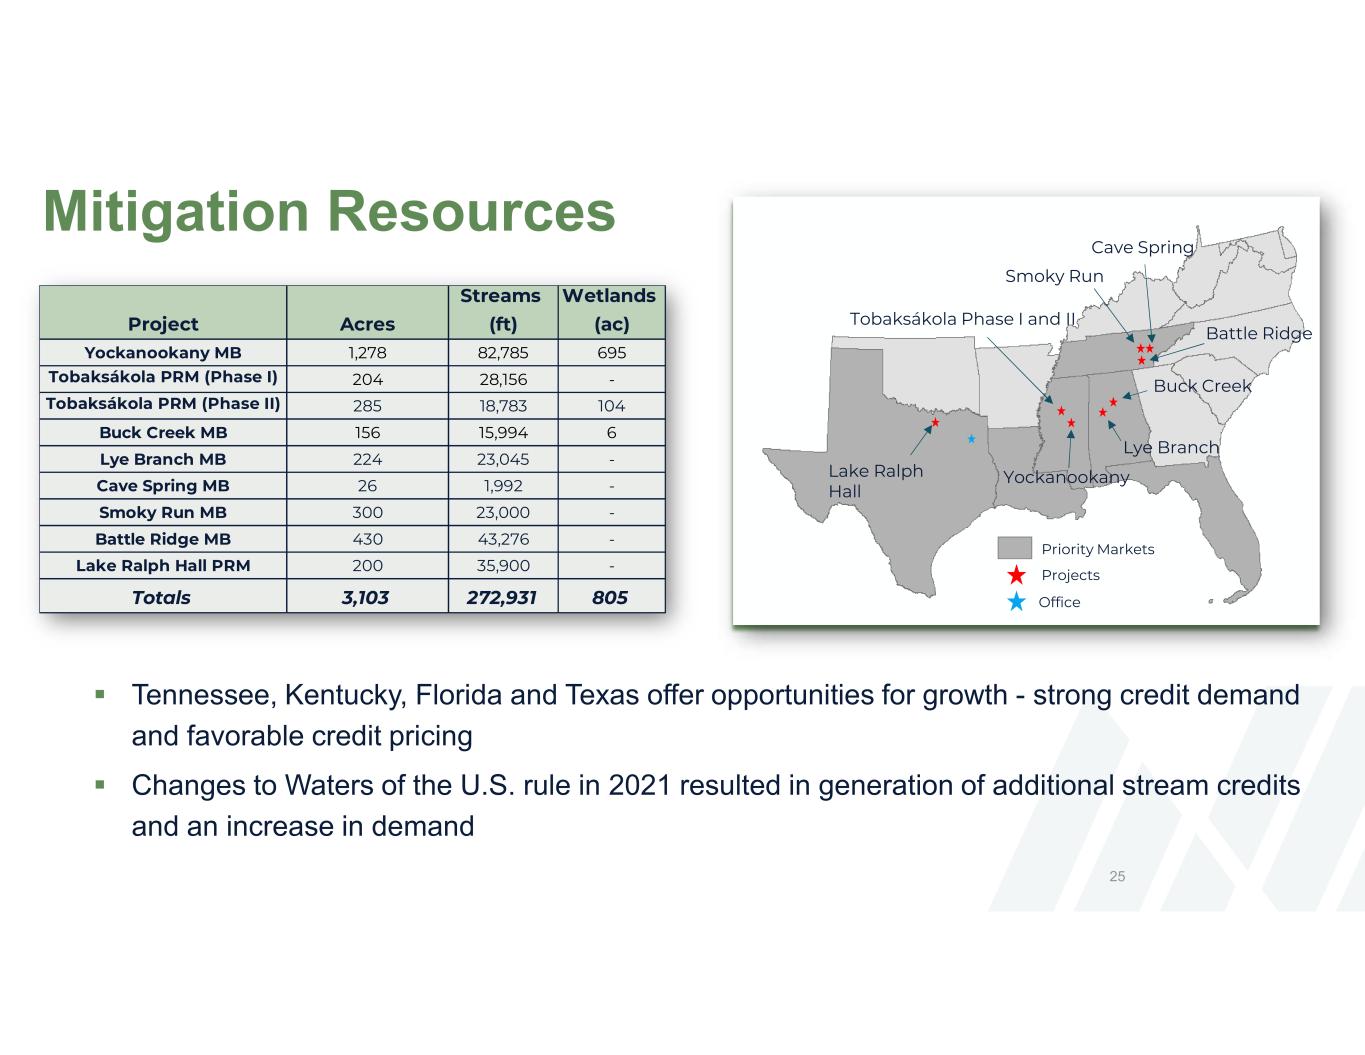
Tennessee, Kentucky, Florida and Texas offer opportunities for growth - strong credit demand and favorable credit pricing Changes to Waters of the U.S. rule in 2021 resulted in generation of additional stream credits and an increase in demand Mitigation Resources 25 Priority Markets Projects Office Yockanookany Lye Branch Tobaksákola Phase I and II Buck Creek Cave Spring Smoky Run Battle Ridge Lake Ralph Hall Project Acres Streams (ft) Wetlands (ac) Yockanookany MB 1,278 82,785 695 Tobaksákola PRM (Phase I) 204 28,156 - Tobaksákola PRM (Phase II) 285 18,783 104 Buck Creek MB 156 15,994 6 Lye Branch MB 224 23,045 - Cave Spring MB 26 1,992 - Smoky Run MB 300 23,000 - Battle Ridge MB 430 43,276 - Lake Ralph Hall PRM 200 35,900 - Totals 3,103 272,931 805
Corporate Responsibility
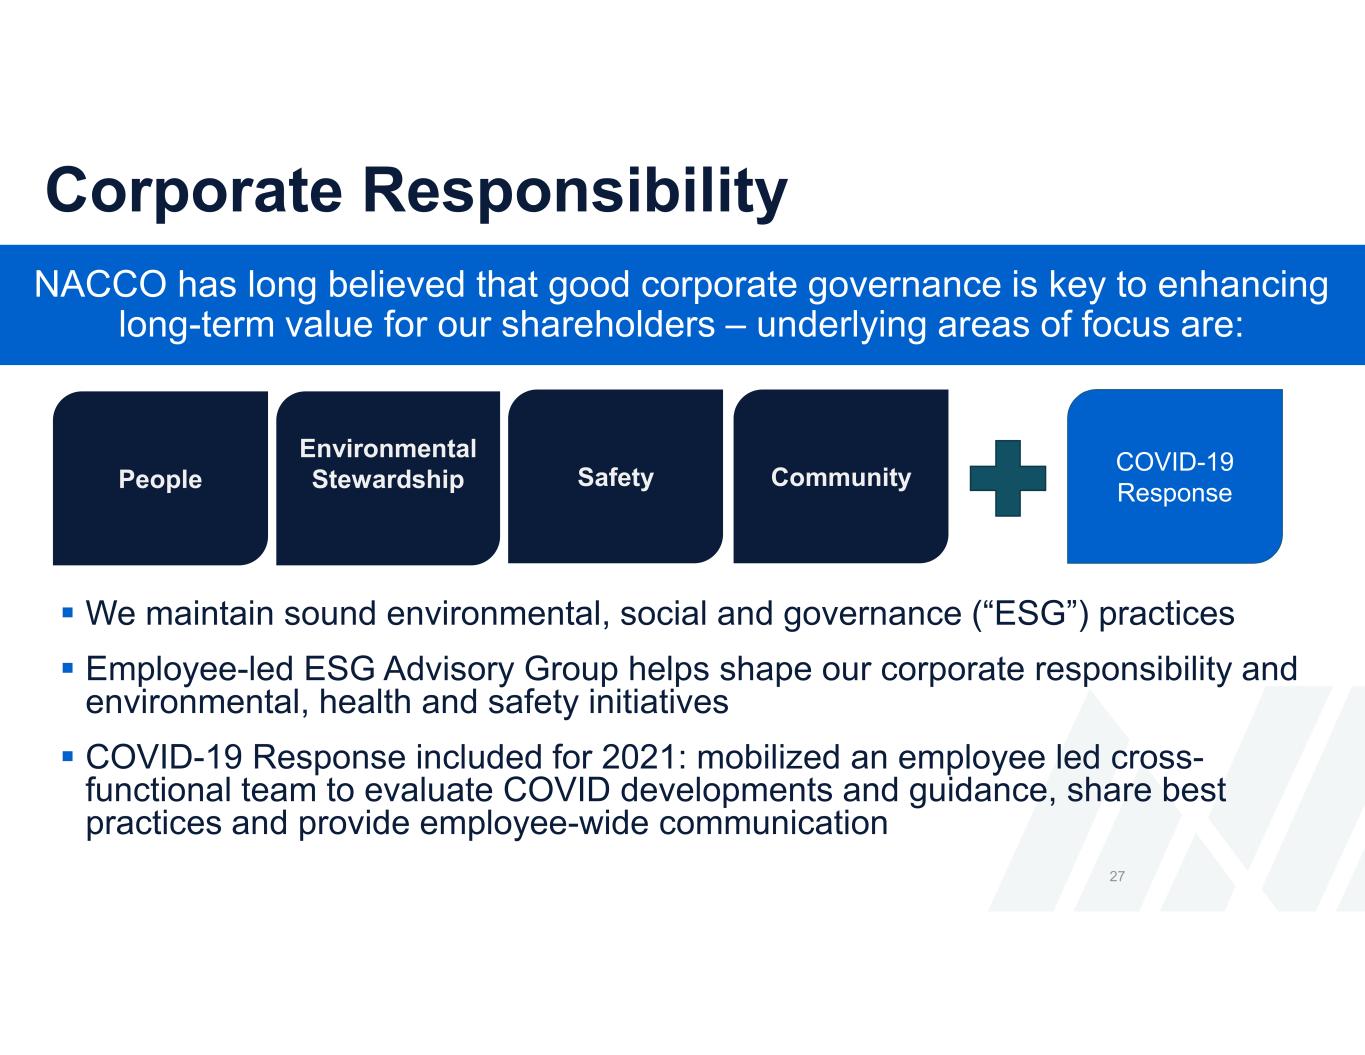
Corporate Responsibility We maintain sound environmental, social and governance (“ESG”) practices Employee-led ESG Advisory Group helps shape our corporate responsibility and environmental, health and safety initiatives COVID-19 Response included for 2021: mobilized an employee led cross- functional team to evaluate COVID developments and guidance, share best practices and provide employee-wide communication 27 NACCO has long believed that good corporate governance is key to enhancing long-term value for our shareholders – underlying areas of focus are: Environmental StewardshipPeople CommunitySafety COVID-19 Response

We enjoy high retention rates and long tenures with our employees Our most tenured employee celebrated 45 years with the company in 2021 Average tenure is 11 years of service 14% of employees have at least 20 years of service People Employees fuel our success Employees are encouraged to pursue continued professional development, skills training and other educational opportunities 28
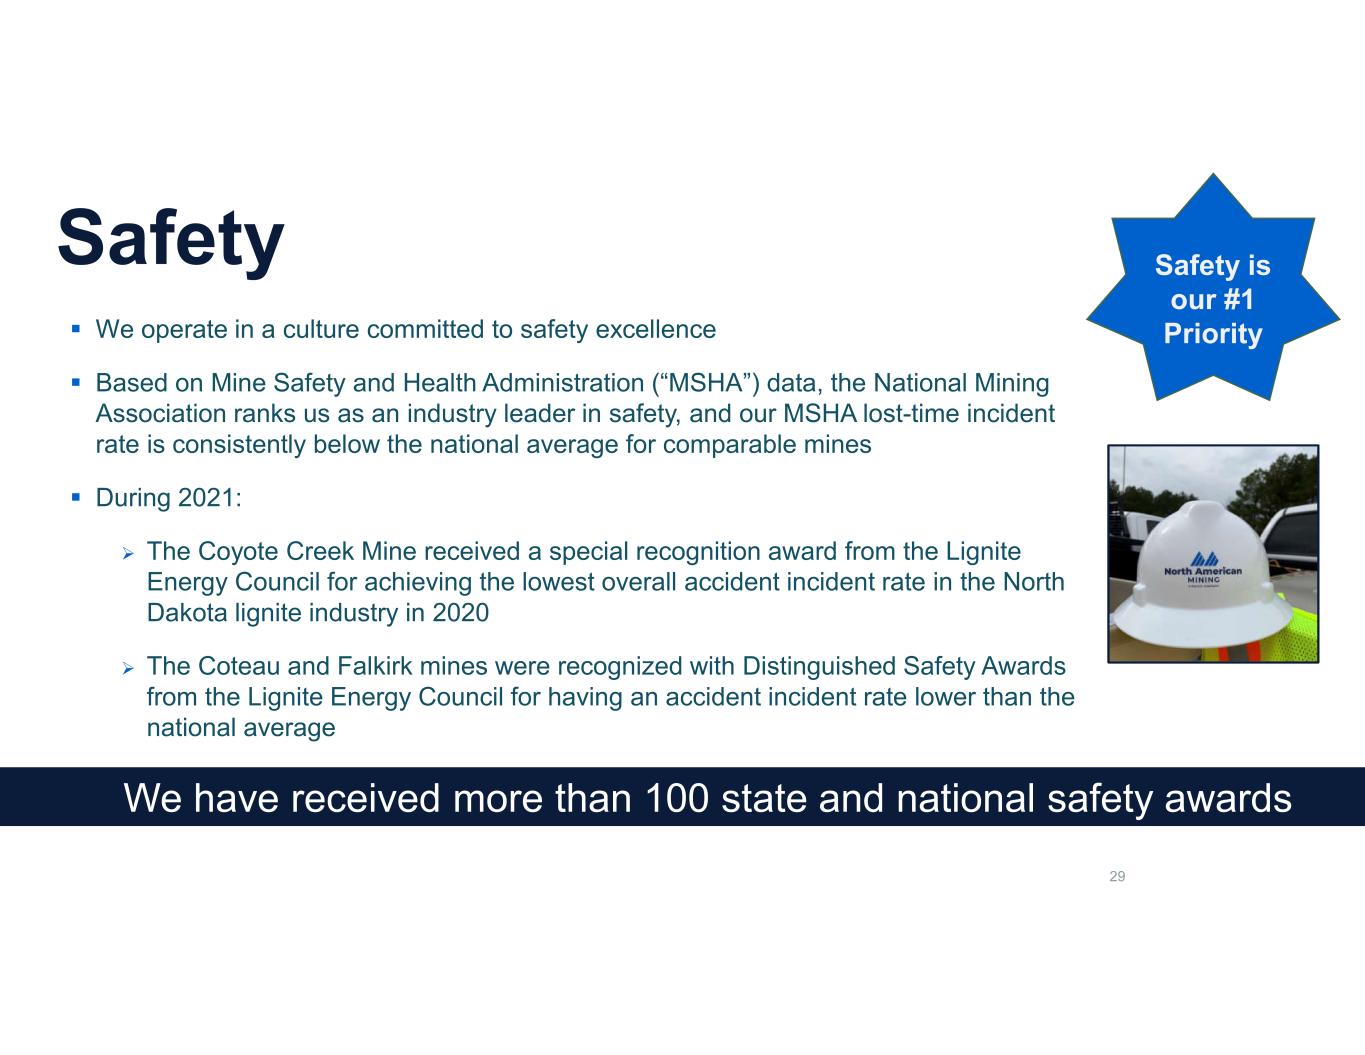
Safety We operate in a culture committed to safety excellence Based on Mine Safety and Health Administration (“MSHA”) data, the National Mining Association ranks us as an industry leader in safety, and our MSHA lost-time incident rate is consistently below the national average for comparable mines During 2021: The Coyote Creek Mine received a special recognition award from the Lignite Energy Council for achieving the lowest overall accident incident rate in the North Dakota lignite industry in 2020 The Coteau and Falkirk mines were recognized with Distinguished Safety Awards from the Lignite Energy Council for having an accident incident rate lower than the national average 29 Safety is our #1 Priority We have received more than 100 state and national safety awards
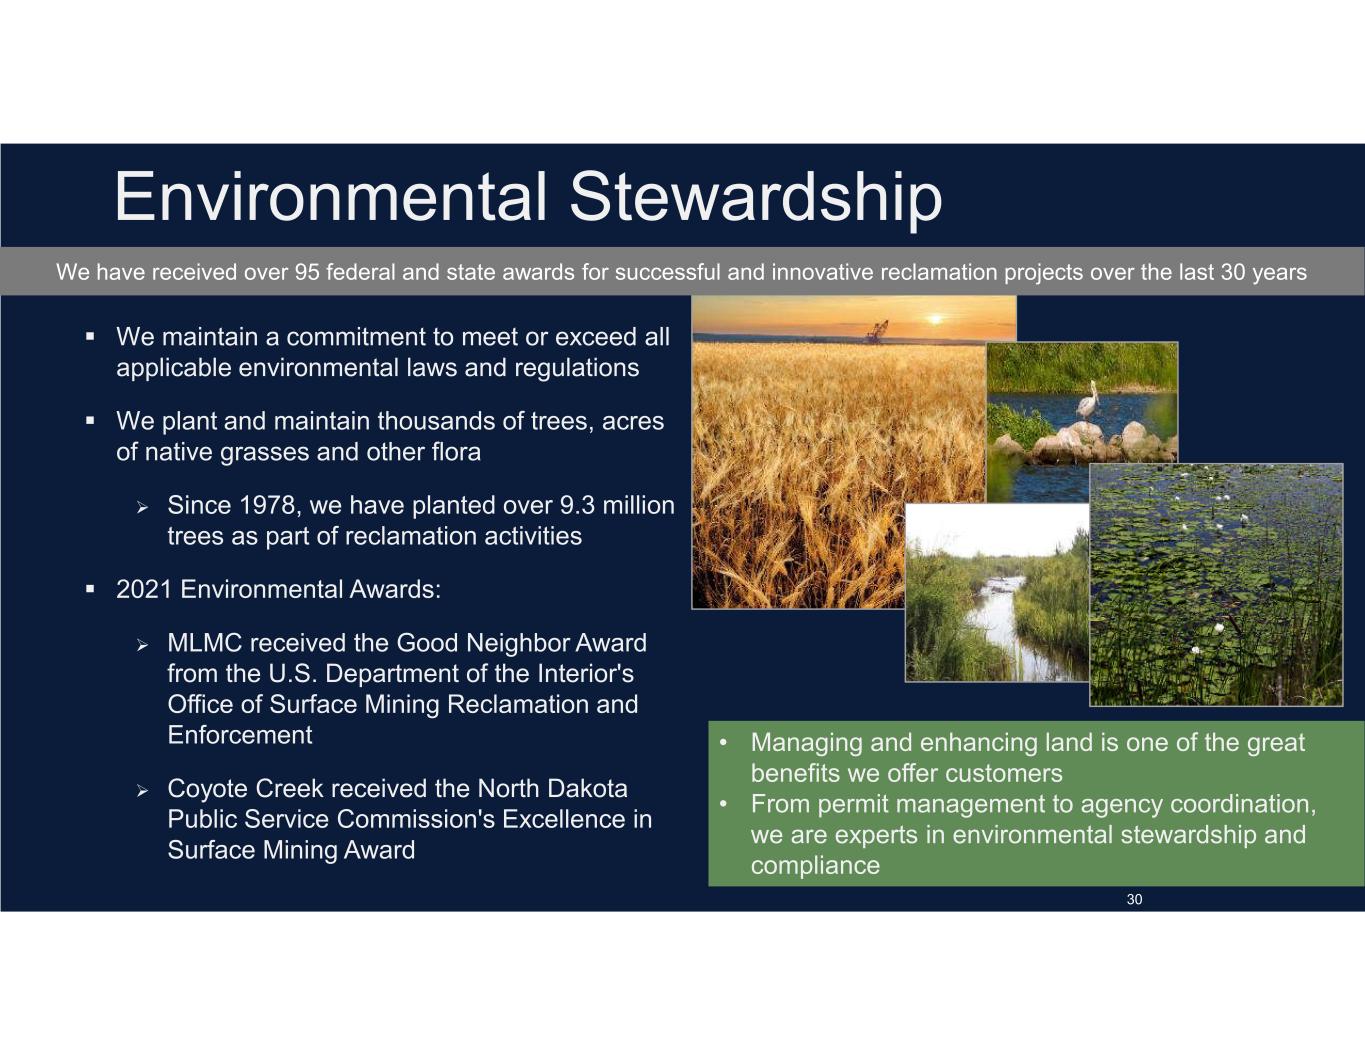
30 Environmental Stewardship We maintain a commitment to meet or exceed all applicable environmental laws and regulations We plant and maintain thousands of trees, acres of native grasses and other flora Since 1978, we have planted over 9.3 million trees as part of reclamation activities 2021 Environmental Awards: MLMC received the Good Neighbor Award from the U.S. Department of the Interior's Office of Surface Mining Reclamation and Enforcement Coyote Creek received the North Dakota Public Service Commission's Excellence in Surface Mining Award • Managing and enhancing land is one of the great benefits we offer customers • From permit management to agency coordination, we are experts in environmental stewardship and compliance We have received over 95 federal and state awards for successful and innovative reclamation projects over the last 30 years 30

Community We believe in making long-term investments in the areas where we operate Support numerous charitable efforts • Literacy • Educational • Arts During 2021, we contributed over $425,000 to organizations that serve the communities where we operate Also support employee cash donations to qualified organizations through our matching gift program • Match up to $5,000 per employee 31
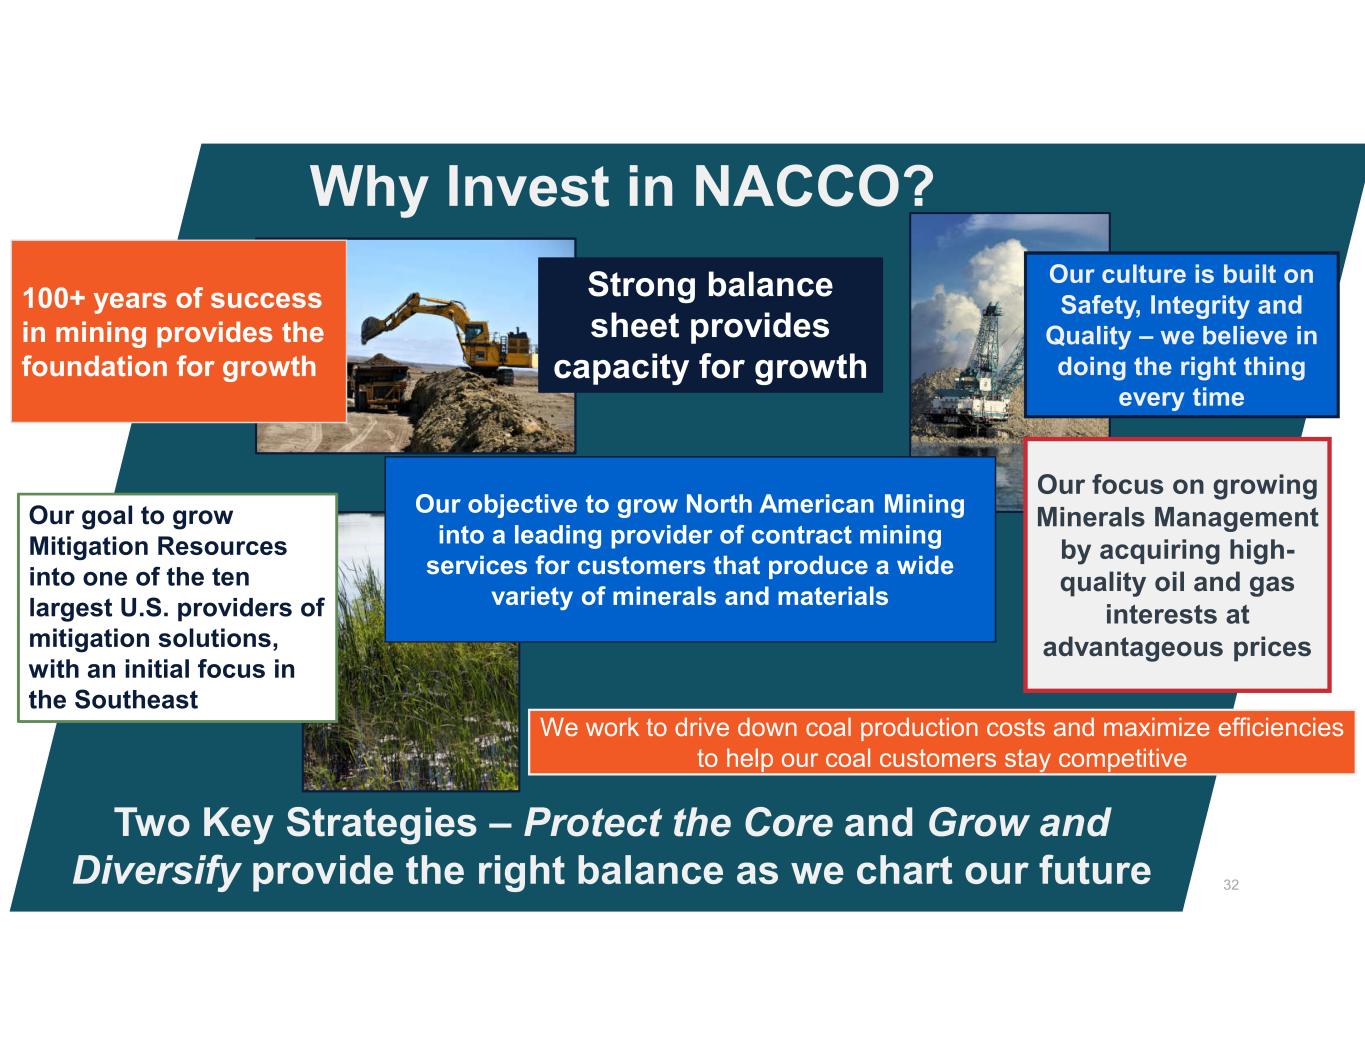
Why Invest in NACCO? 32 Strong balance sheet provides capacity for growth We work to drive down coal production costs and maximize efficiencies to help our coal customers stay competitive Our focus on growing Minerals Management by acquiring high- quality oil and gas interests at advantageous prices Our objective to grow North American Mining into a leading provider of contract mining services for customers that produce a wide variety of minerals and materials 100+ years of success in mining provides the foundation for growth Our culture is built on Safety, Integrity and Quality – we believe in doing the right thing every time Our goal to grow Mitigation Resources into one of the ten largest U.S. providers of mitigation solutions, with an initial focus in the Southeast Two Key Strategies – Protect the Core and Grow and Diversify provide the right balance as we chart our future
Financial Results and Non-GAAP Reconciliation
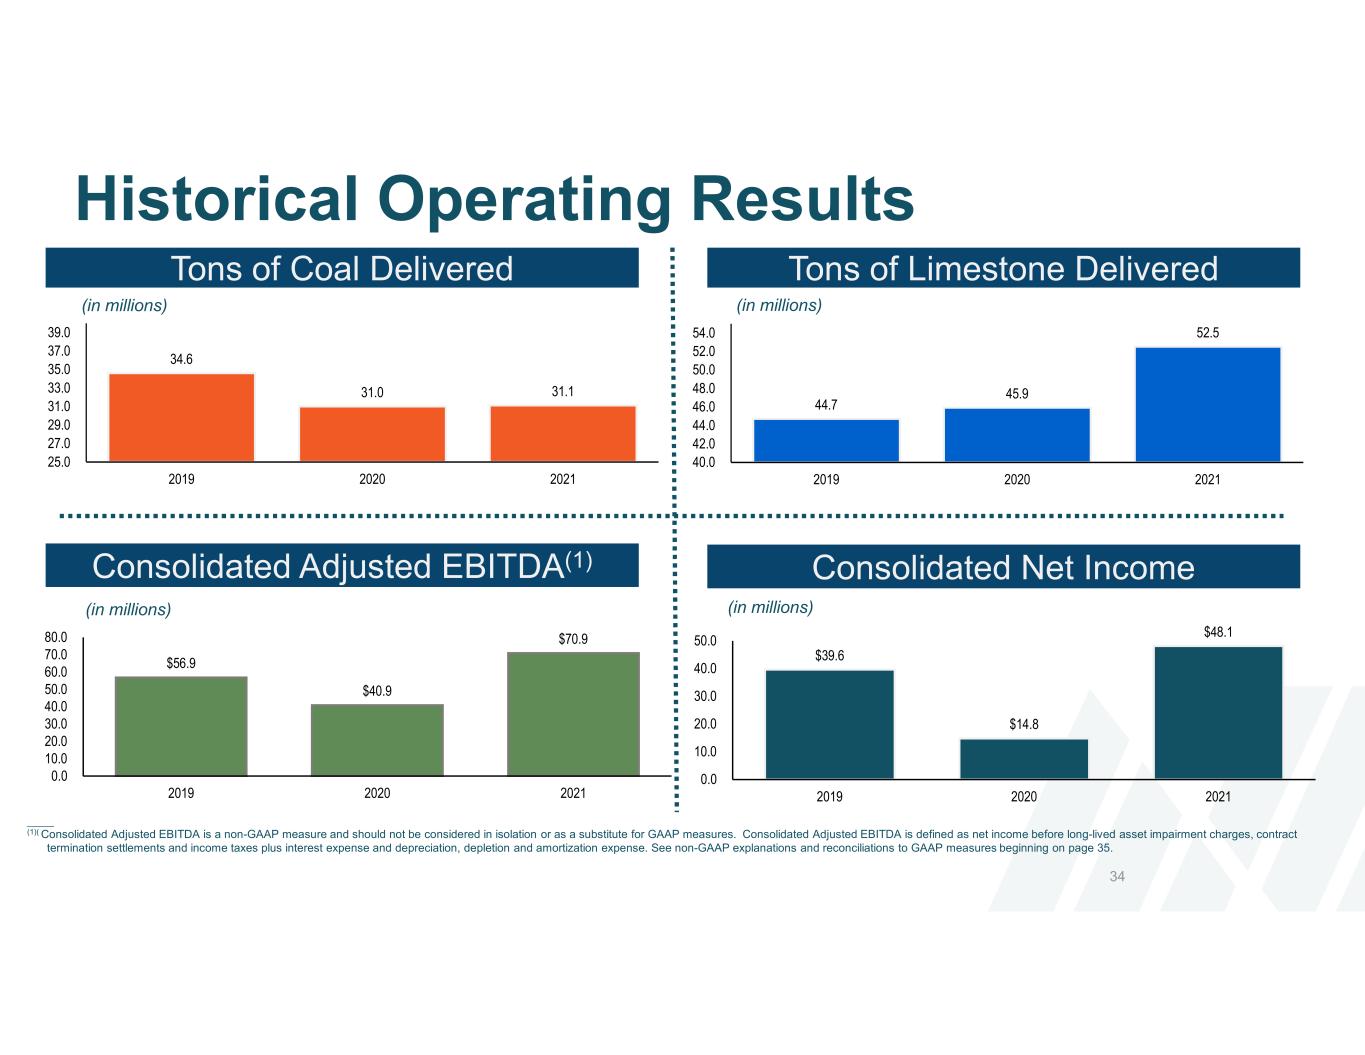
Historical Operating Results 34 34.6 31.0 31.1 25.0 27.0 29.0 31.0 33.0 35.0 37.0 39.0 2019 2020 2021 Tons of Coal Delivered Tons of Limestone Delivered Consolidated Adjusted EBITDA(1) $39.6 $14.8 $48.1 0.0 10.0 20.0 30.0 40.0 50.0 2019 2020 2021 $56.9 $40.9 $70.9 0.0 10.0 20.0 30.0 40.0 50.0 60.0 70.0 80.0 2019 2020 2021 Consolidated Net Income _____ (1)( Consolidated Adjusted EBITDA is a non-GAAP measure and should not be considered in isolation or as a substitute for GAAP measures. Consolidated Adjusted EBITDA is defined as net income before long-lived asset impairment charges, contract termination settlements and income taxes plus interest expense and depreciation, depletion and amortization expense. See non-GAAP explanations and reconciliations to GAAP measures beginning on page 35. 44.7 45.9 52.5 40.0 42.0 44.0 46.0 48.0 50.0 52.0 54.0 2019 2020 2021 (in millions) (in millions) (in millions) (in millions)
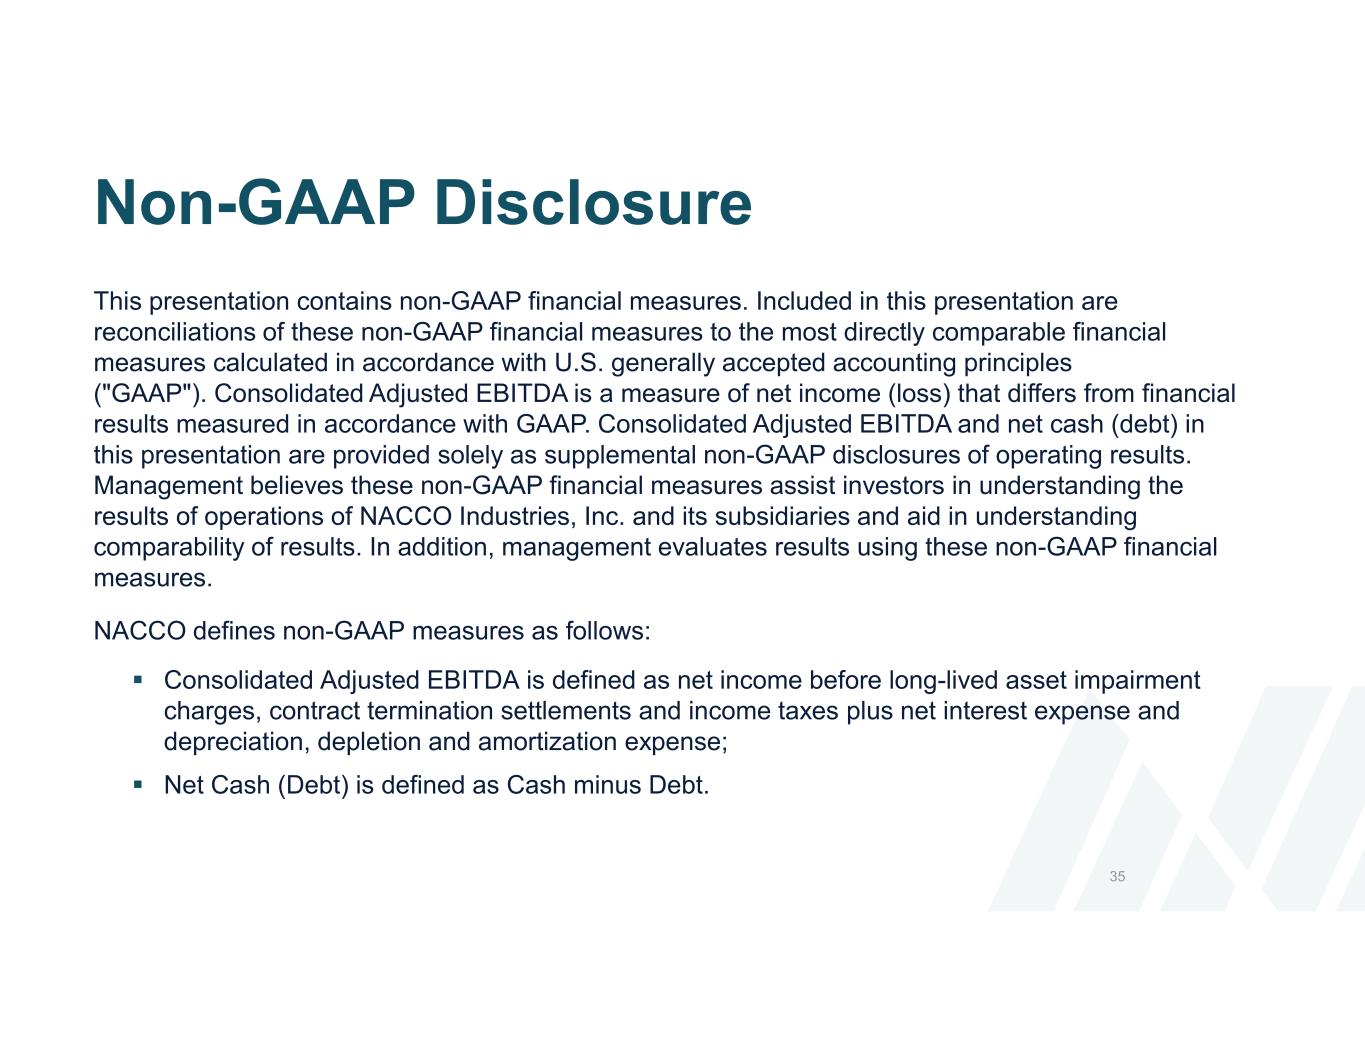
Non-GAAP Disclosure This presentation contains non-GAAP financial measures. Included in this presentation are reconciliations of these non-GAAP financial measures to the most directly comparable financial measures calculated in accordance with U.S. generally accepted accounting principles ("GAAP"). Consolidated Adjusted EBITDA is a measure of net income (loss) that differs from financial results measured in accordance with GAAP. Consolidated Adjusted EBITDA and net cash (debt) in this presentation are provided solely as supplemental non-GAAP disclosures of operating results. Management believes these non-GAAP financial measures assist investors in understanding the results of operations of NACCO Industries, Inc. and its subsidiaries and aid in understanding comparability of results. In addition, management evaluates results using these non-GAAP financial measures. NACCO defines non-GAAP measures as follows: Consolidated Adjusted EBITDA is defined as net income before long-lived asset impairment charges, contract termination settlements and income taxes plus net interest expense and depreciation, depletion and amortization expense; Net Cash (Debt) is defined as Cash minus Debt. 35
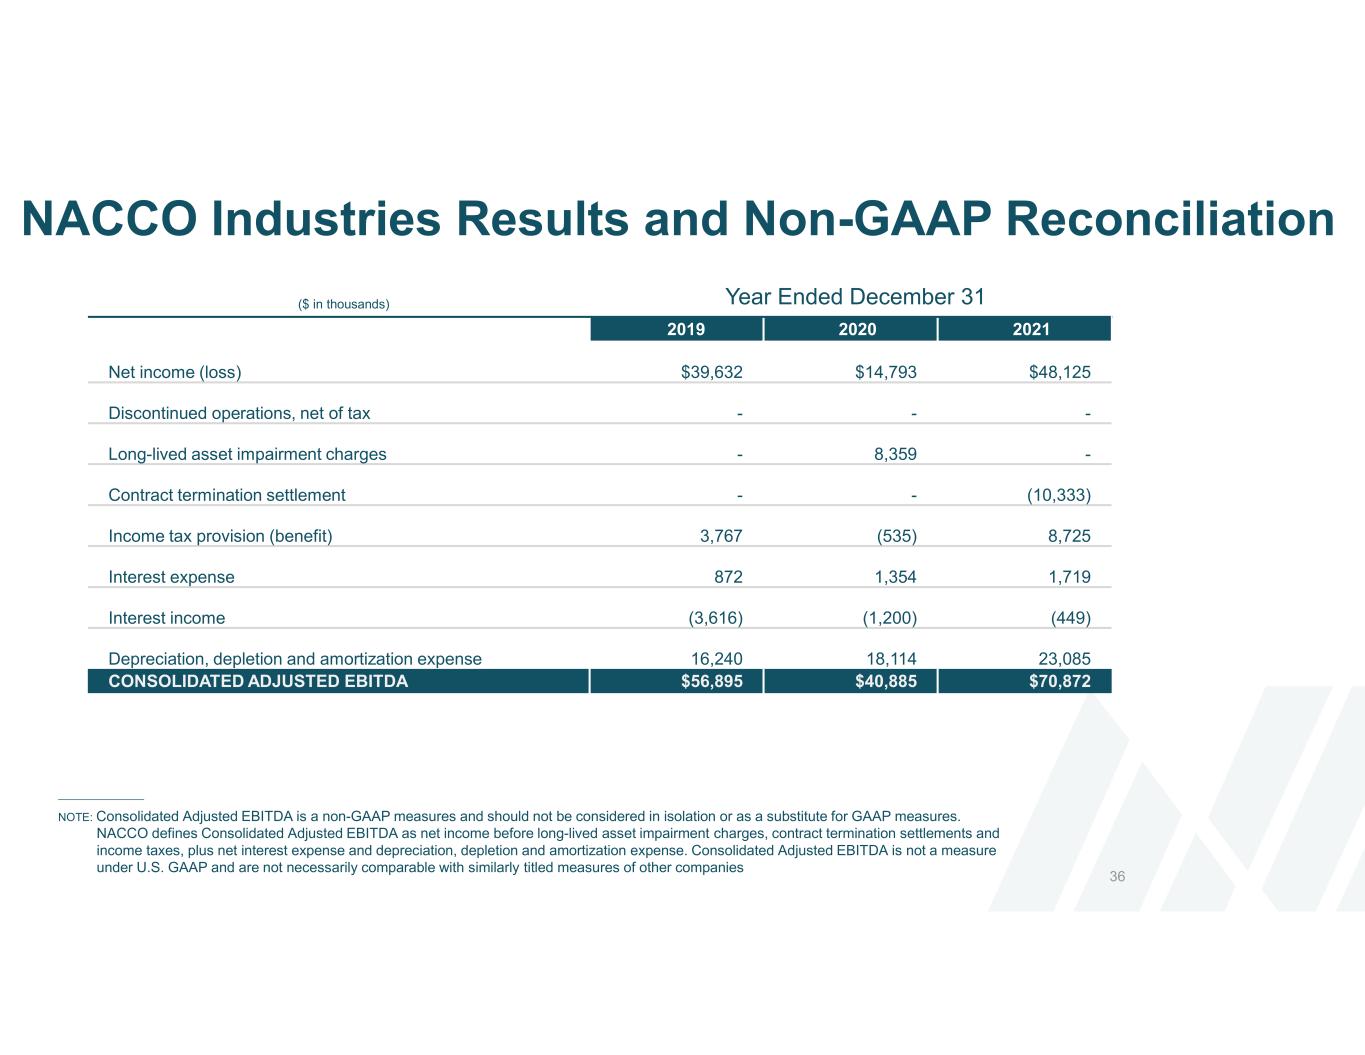
NACCO Industries Results and Non-GAAP Reconciliation 36 NOTE: Consolidated Adjusted EBITDA is a non-GAAP measures and should not be considered in isolation or as a substitute for GAAP measures. NACCO defines Consolidated Adjusted EBITDA as net income before long-lived asset impairment charges, contract termination settlements and income taxes, plus net interest expense and depreciation, depletion and amortization expense. Consolidated Adjusted EBITDA is not a measure under U.S. GAAP and are not necessarily comparable with similarly titled measures of other companies ($ in thousands) Year Ended December 31 2019 2020 2021 Net income (loss) $39,632 $14,793 $48,125 Discontinued operations, net of tax - - - Long-lived asset impairment charges - 8,359 - Contract termination settlement - - (10,333) Income tax provision (benefit) 3,767 (535) 8,725 Interest expense 872 1,354 1,719 Interest income (3,616) (1,200) (449) Depreciation, depletion and amortization expense 16,240 18,114 23,085 CONSOLIDATED ADJUSTED EBITDA $56,895 $40,885 $70,872
