Exhibit 99
NACCO Industries, Inc. at a Glance
| 2012 | ||||||
| Principal Businesses | Financial Results | Market Positions | ||||
| North American Coal (“NACoal”) Headquarters: Dallas, Texas
North American Coal, NACCO’s predecessor company, mines and markets steam and metallurgical coal for use in power generation and steel production and provides selected value-added mining services for other natural resources companies. North American Coal operates eight surface coal mining operations and has four additional coal mines under development.
The company also provides dragline mining services operating under the name “North American Mining Company” for independently owned limerock quarries in Florida.
| NACoal: Revenues: $132.4 million Operating profit: $43.2 million Net income: $32.8 million | NACoal: North American Coal is among the ten largest coal producers in the United States.
Coal is delivered from developed mines in North Dakota, Texas, Mississippi, Louisiana and Alabama, primarily to adjacent or nearby power plants. | |||
| Hamilton Beach Brands (“HBB”) Headquarters: Richmond, Virginia
HBB is a leading designer, marketer and distributor of small electric household appliances, as well as commercial products for restaurants, bars and hotels.
HBB has a broad portfolio of some of the most recognized and respected brands in the small electric appliance industry, including Hamilton Beach®, Proctor Silex®, TrueAir® and Hamilton Beach® Commercial.
| HBB: Revenues: $521.6 million Operating profit: $35.8 million Net income: $21.2 million | HBB: HBB is a leading company in retail and commercial small appliances, with strong share positions in many of the categories in which it competes.
HBB products are primarily distributed through mass merchants, national department stores, wholesale distributors and other retail sales outlets. | |||
| Kitchen Collection Headquarters: Chillicothe, Ohio
Kitchen Collection is a national specialty retailer of kitchenware and gourmet foods operating under the Kitchen Collection® and Le Gourmet Chef® store names in outlet and traditional malls throughout the United States. | Kitchen Collection: Revenues: $224.7 million Operating loss: $4.6 million Net loss: $3.1 million | Kitchen Collection: Kitchen Collection is the nation’s leading specialty retailer of kitchen and related products in factory outlet malls with 312 stores throughout the United States in 2012. | |||


4
NACCO Industries, Inc. is an operating holding company with subsidiaries in the following principal industries: mining, small appliances and specialty retail. In 2012, total revenues were $873.4 million and net income was $108.7 million.
| Competitive Advantages | Financial Objectives | Key Initiatives | ||
| NACoal: | NACoal: | NACoal: | ||
• Coal mines provide steady income and cash flow before financing activities and high returns on equity • Steam coal contracts are structured to minimize exposure to market fluctuations of coal prices • 2.2 billion tons of lignite coal reserves, of which approximately 1.1 billion tons are committed to current customers • Outstanding operational and technological mining skills • Highly efficient heavy equipment utilization • Excellent record of environmental respon-sibility and employee safety | Earn a minimum return on capital employed of 13 percent, attain positive Economic Value Income from all existing consolidated mining operations and any new projects, maintain or increase the profitability of all existing unconsolidated mining operations and achieve substantial income growth by developing new mining ventures | • Actively pursue domestic opportunities for new coal mining projects • Develop a metallurgical coal business platform • Actively pursue international opportunities for new value-added mining services and exports • Expand capabilities in the aggregates market • Pursue a technologically enhanced fuel strategic platform | ||
| HBB: | HBB: | HBB: | ||
• Strong heritage brands with leading market shares • Strong relationships with leading retailers • Highly professional and experienced management team • Successful track record of product line expansion and new product innovation • Industry-leading working capital management | Achieve a minimum operating profit margin target of 10 percent | • Enhance placements in the North American consumer business • Enhance internet sales by providing best-in-class retailer support and increased consumer content and engagement • Achieve further penetration of the global Commercial market through an enhanced global product line • Expand internationally in the emerging Asian and Latin American markets • Enter the “only-the-best” market with a strong brand and broad product line | ||
| Kitchen Collection: | Kitchen Collection: | Kitchen Collection: | ||
• Highly analytical merchandising skills and disciplined operating controls • Two well-established, complementary retail store formats – Kitchen Collection® and Le Gourmet Chef® | Achieve a minimum operating profit margin target of 5 percent | • Grow comparable store sales and create a solid store portfolio • Enhance sales volume and profitability through refinement of store formats and specific product offerings • Improve inventory efficiency and store inventory controls • Grow the number of Kitchen Collection® stores through identification of the best positions in the best outlet malls • Explore growth opportunities in textiles and gourmet foods, as well as in e-commerce | ||
5
Selected Financial and Operating Data
NACCO Industries, Inc. and Subsidiaries
| Year Ended December 31 | ||||||||||||||||||||
| 2012(1) | 2011(1)(2) | 2010(1)(2) | 2009(1)(2)(3) | 2008(1)(2)(3)(4) | ||||||||||||||||
| (In millions, except per share data) | ||||||||||||||||||||
Operating Statement Data: | ||||||||||||||||||||
Revenues | $ | 873.4 | $ | 790.4 | $ | 885.6 | $ | 835.4 | $ | 840.8 | ||||||||||
Operating profit (loss) | $ | 67.5 | $ | 64.1 | $ | 94.2 | $ | 90.3 | $ | (45.5 | ) | |||||||||
Income (loss) from continuing operations | $ | 42.2 | $ | 79.5 | $ | 47.1 | $ | 51.6 | $ | (63.9 | ) | |||||||||
Discontinued operations, net-of-tax(1)(3) | 66.5 | 82.6 | 32.4 | (20.5 | ) | (373.7 | ) | |||||||||||||
|
|
|
|
|
|
|
|
|
| |||||||||||
Net income (loss) | $ | 108.7 | $ | 162.1 | $ | 79.5 | $ | 31.1 | $ | (437.6 | ) | |||||||||
|
|
|
|
|
|
|
|
|
| |||||||||||
Basic Earnings (Loss) per Share: | ||||||||||||||||||||
Income (loss) from continuing operations | $ | 5.04 | $ | 9.49 | $ | 5.66 | $ | 6.22 | $ | (7.71 | ) | |||||||||
Discontinued operations, net-of-tax(1)(3) | 7.93 | 9.85 | 3.89 | (2.47 | ) | (45.13 | ) | |||||||||||||
|
|
|
|
|
|
|
|
|
| |||||||||||
Basic earnings (loss) per share | $ | 12.97 | $ | 19.34 | $ | 9.55 | $ | 3.75 | $ | (52.84 | ) | |||||||||
|
|
|
|
|
|
|
|
|
| |||||||||||
Diluted Earnings (Loss) per Share: | ||||||||||||||||||||
Income (loss) from continuing operations | $ | 5.02 | $ | 9.46 | $ | 5.65 | $ | 6.22 | $ | (7.71 | ) | |||||||||
Discontinued operations, net-of-tax(1)(3) | 7.90 | 9.82 | 3.88 | (2.47 | ) | (45.13 | ) | |||||||||||||
|
|
|
|
|
|
|
|
|
| |||||||||||
Diluted earnings (loss) per share | $ | 12.92 | $ | 19.28 | $ | 9.53 | $ | 3.75 | $ | (52.84 | ) | |||||||||
|
|
|
|
|
|
|
|
|
| |||||||||||
Per Share and Share Data: | ||||||||||||||||||||
Cash dividends(5) | $ | 5.378 | $ | 2.120 | $ | 2.085 | $ | 2.068 | $ | 2.045 | ||||||||||
Market value at December 31 | $ | 60.69 | $ | 89.22 | $ | 108.37 | $ | 49.80 | $ | 37.41 | ||||||||||
Stockholders’ equity at December 31 | $ | 33.69 | $ | 68.81 | $ | 53.69 | $ | 47.82 | $ | 43.05 | ||||||||||
Actual shares outstanding at December 31 | 8.353 | 8.374 | 8.333 | 8.294 | 8.286 | |||||||||||||||
Basic weighted average shares outstanding | 8.384 | 8.383 | 8.328 | 8.290 | 8.281 | |||||||||||||||
Diluted weighted average shares outstanding | 8.414 | 8.408 | 8.344 | 8.296 | 8.281 | |||||||||||||||
Balance Sheet Data at December 31: | ||||||||||||||||||||
Cash(1) | $ | 139.9 | $ | 153.7 | $ | 92.4 | $ | 93.0 | $ | 80.2 | ||||||||||
Total assets | $ | 776.3 | $ | 1,808.7 | $ | 1,670.9 | $ | 1,497.4 | $ | 1,702.3 | ||||||||||
Long-term debt(1) | $ | 135.4 | $ | 74.5 | $ | 139.8 | $ | 148.4 | $ | 170.6 | ||||||||||
Stockholders’ equity | $ | 281.4 | $ | 576.2 | $ | 447.4 | $ | 396.6 | $ | 356.7 | ||||||||||
| (1) | During 2012, NACCO spun off Hyster-Yale, a former subsidiary. The results of operations of Hyster-Yale for all periods shown have been reclassified to reflect Hyster-Yale’s operating results as discontinued operations. |
| (2) | In 2006, NACCO initiated litigation in the Delaware Chancery Court against Applica Incorporated (“Applica”) and individuals and entities affiliated with Applica’s shareholder, Harbinger Capital Partners Master Fund, Ltd. The litigation alleged a number of contract and tort claims against the defendants related to the failed transaction with Applica, which had been previously announced. On February 14, 2011, the parties to this litigation entered into a settlement agreement. The settlement agreement provided for, among other things, the payment of $60 million to NACCO and dismissal of the lawsuit with prejudice. The payment was received in February 2011. Litigation costs related to this matter were $2.8 million, $18.8 million, $1.1 million and $0.8 million in 2011, 2010, 2009 and 2008, respectively. |
| (3) | During 2009, the Company’s North American Coal subsidiary completed the sale of certain assets of the Red River Mining Company. The results of operations of Red River for 2009 and all prior periods have been reclassified to reflect Red River’s operating results as discontinued operations. |
| (4) | During 2008, NACCO’s stock price significantly declined compared with previous periods and the Company’s market value of equity was below its book value of tangible assets and book value of equity. The Company performed an impairment test, which indicated that goodwill and certain other intangibles were impaired at December 31, 2008. |
Therefore, the Company recorded a non-cash impairment charge of $435.7 million in 2008, of which $84.6 million is included in continuing operations and $351.1 million is included in discontinued operations.
| (5) | Cash dividends in 2012 include a one-time special cash dividend of $3.50 per share. The $0.25 dividend paid in the fourth quarter of 2012 was the first regular quarterly dividend following the spin off of Hyster-Yale. |
This Annual Report contains references to non-GAAP financial measures. Presentations of, and quantitative reconciliations to, the most directly comparable financial measures calculated and presented in accordance with U.S. generally accepted accounting principles (“GAAP”) appear on page 7 and page 24. For certain pre-tax disclosures included in the “To Our Stockholders” letter beginning on page 8, the resulting after-tax amount and the related income tax amount have been included. Certain after-tax amounts are considered non-GAAP measures in accordance with Regulation G. Management believes that after-tax information is useful in analyzing the Company’s net income.
6
| Year Ended December 31 | ||||||||||||||||||||
| 2012(1) | 2011(1)(2) | 2010(1)(2) | 2009(1)(2)(3) | 2008(1)(2)(3)(4) | ||||||||||||||||
| (In millions, except employee data) | ||||||||||||||||||||
Cash Flow Data: | ||||||||||||||||||||
Operating Activities | ||||||||||||||||||||
North American Coal Corporation | $ | 50.2 | $ | 31.7 | $ | 25.9 | $ | 50.4 | $ | 20.9 | ||||||||||
Hamilton Beach Brands | 27.4 | 24.2 | 15.0 | 35.5 | 18.0 | |||||||||||||||
Kitchen Collection | 3.8 | 4.9 | 6.3 | 5.4 | (6.4 | ) | ||||||||||||||
NACCO and Other | (7.0 | ) | 39.8 | (31.6 | ) | (41.8 | ) | (2.6 | ) | |||||||||||
|
|
|
|
|
|
|
|
|
| |||||||||||
Provided by operating activities from continuing operations | $ | 74.4 | $ | 100.6 | $ | 15.6 | $ | 49.5 | $ | 29.9 | ||||||||||
|
|
|
|
|
|
|
|
|
| |||||||||||
Investing Activities | ||||||||||||||||||||
North American Coal Corporation | $ | (56.3 | ) | $ | (10.7 | ) | $ | 6.9 | $ | (6.5 | ) | $ | (15.6 | ) | ||||||
Hamilton Beach Brands | (3.2 | ) | (3.7 | ) | (2.2 | ) | (2.1 | ) | (5.7 | ) | ||||||||||
Kitchen Collection | (3.9 | ) | (2.3 | ) | (2.7 | ) | (1.1 | ) | (6.0 | ) | ||||||||||
NACCO and Other | (0.3 | ) | (0.1 | ) | 0.7 | (14.0 | ) | (6.3 | ) | |||||||||||
|
|
|
|
|
|
|
|
|
| |||||||||||
Provided by (used for) investing activities from continuing operations | $ | (63.7 | ) | $ | (16.8 | ) | $ | (2.7 | ) | $ | (23.7 | ) | $ | (33.6 | ) | |||||
|
|
|
|
|
|
|
|
|
| |||||||||||
Cash Flow before Financing Activities(6) | ||||||||||||||||||||
North American Coal Corporation | $ | (6.1 | ) | $ | 21.0 | $ | 32.8 | $ | 43.9 | $ | 5.3 | |||||||||
Hamilton Beach Brands | 24.2 | 20.5 | 12.8 | 33.4 | 12.3 | |||||||||||||||
Kitchen Collection | (0.1 | ) | 2.6 | 3.6 | 4.3 | (12.4 | ) | |||||||||||||
NACCO and Other | (7.3 | ) | 39.7 | (30.9 | ) | (55.8 | ) | (8.9 | ) | |||||||||||
|
|
|
|
|
|
|
|
|
| |||||||||||
Consolidated Cash Flow before Financing Activities from continuing operations(6) | $ | 10.7 | $ | 83.8 | $ | 18.3 | $ | 25.8 | $ | (3.7 | ) | |||||||||
|
|
|
|
|
|
|
|
|
| |||||||||||
Used for financing activities from continuing operations | $ | (24.5 | ) | $ | (22.5 | ) | $ | (18.9 | ) | $ | (45.8 | ) | $ | (70.1 | ) | |||||
Other Data: | ||||||||||||||||||||
Adjusted EBITDA(7) | $ | 81.9 | $ | 79.9 | $ | 110.3 | $ | 107.0 | $ | 53.1 | ||||||||||
Total employees at December 31(3)(8) | 4,300 | 4,000 | 3,900 | 4,100 | 3,800 | |||||||||||||||
| (6) | Cash Flow before Financing Activities is equal to net cash provided by operating activities less net cash used for investing activities. |
| (7) | Adjusted EBITDA is provided solely as a supplemental disclosure with respect to liquidity because management believes it provides useful information regarding a company’s ability to service its indebtedness. Adjusted EBITDA does not represent cash flow from operations, as defined by U.S. GAAP. You should not consider Adjusted EBITDA as a substitute for net income or net loss, or as an indicator of our operating performance or whether cash flows will be sufficient to fund our cash needs. NACCO defines Adjusted EBITDA as income before discontinued operations, Applica settlement and litigation charges, goodwill and other intangible assets impairment charges and income taxes plus net interest expense and depreciation, depletion and amortization expense. Adjusted EBITDA is not a measurement under U.S. GAAP and is not necessarily comparable with similarly titled measures of other companies. Net cash flows from operating, investing and financing activities as determined using U.S. GAAP are presented above. A reconciliation of cash flow provided by operating activities to Adjusted EBITDA is presented below. |
| (8) | Includes employees of Reed Minerals in 2012 and the unconsolidated mining subsidiaries for all years presented and excludes employees of Hyster-Yale and Red River for all years presented. |
| Year Ended December 31 | ||||||||||||||||||||
| 2012(1) | 2011(1)(2) | 2010(1)(2) | 2009(1)(2)(3) | 2008(1)(2)(3)(4) | ||||||||||||||||
| (In millions) | ||||||||||||||||||||
Reconciliation of net cash provided by operating activities from continuing operations to EBITDA(7) | ||||||||||||||||||||
Net cash provided by operating activities from continuing operations | $ | 74.4 | $ | 100.6 | $ | 15.6 | $ | 49.5 | $ | 29.9 | ||||||||||
Change in working capital items | 7.8 | 1.6 | 29.3 | 21.4 | 14.2 | |||||||||||||||
Applica settlement and litigation costs | — | (57.2 | ) | 18.8 | 1.1 | 0.8 | ||||||||||||||
Gain on sale of assets and businesses | 6.8 | 1.0 | 0.2 | 8.6 | — | |||||||||||||||
Difference between deferred income taxes and total tax provision (benefit) | 1.2 | 32.9 | 6.0 | 27.9 | 1.6 | |||||||||||||||
Other non-cash items | (14.2 | ) | (7.4 | ) | 29.9 | (14.3 | ) | (4.9 | ) | |||||||||||
Interest expense, net | 5.9 | 8.4 | 10.5 | 12.8 | 11.5 | |||||||||||||||
|
|
|
|
|
|
|
|
|
| |||||||||||
Adjusted EBITDA(7) | $ | 81.9 | $ | 79.9 | $ | 110.3 | $ | 107.0 | $ | 53.1 | ||||||||||
|
|
|
|
|
|
|
|
|
| |||||||||||
Calculation of Adjusted EBITDA(7) | ||||||||||||||||||||
Net income (loss) | $ | 108.7 | $ | 162.1 | $ | 79.5 | $ | 31.1 | $ | (437.6 | ) | |||||||||
Discontinued operations, net of tax | (66.5 | ) | (82.6 | ) | (32.4 | ) | 20.5 | 373.7 | ||||||||||||
Applica settlement and litigation costs | — | (57.2 | ) | 18.8 | 1.1 | 0.8 | ||||||||||||||
Goodwill and other intangible assets impairment charges | — | — | — | — | 84.6 | |||||||||||||||
Income tax provision | 15.8 | 32.8 | 15.6 | 24.1 | 3.2 | |||||||||||||||
Interest expense | 6.1 | 8.7 | 10.8 | 13.2 | 14.7 | |||||||||||||||
Interest income | (0.2 | ) | (0.3 | ) | (0.3 | ) | (0.4 | ) | (3.2 | ) | ||||||||||
Depreciation, depletion and amortization expense | 18.0 | 16.4 | 18.3 | 17.4 | 16.9 | |||||||||||||||
|
|
|
|
|
|
|
|
|
| |||||||||||
Adjusted EBITDA(7) | $ | 81.9 | $ | 79.9 | $ | 110.3 | $ | 107.0 | $ | 53.1 | ||||||||||
|
|
|
|
|
|
|
|
|
| |||||||||||
7

Subsidiary Financial Objectives
| • | NACoal:Earn a minimum return on capital employed of 13 percent, attain positive Economic Value Income from all existing consolidated mining operations and any new projects, maintain or increase the profitability of all existing unconsolidated mining operations and achieve substantial income growth by developing new mining ventures. |
| • | HBB:Achieve a minimum operating profit margin of 10 percent. |
| • | Kitchen Collection:Achieve a minimum operating profit margin of 5 percent. |
| • | All businesses:Generate substantial cash flow before financing activities. |

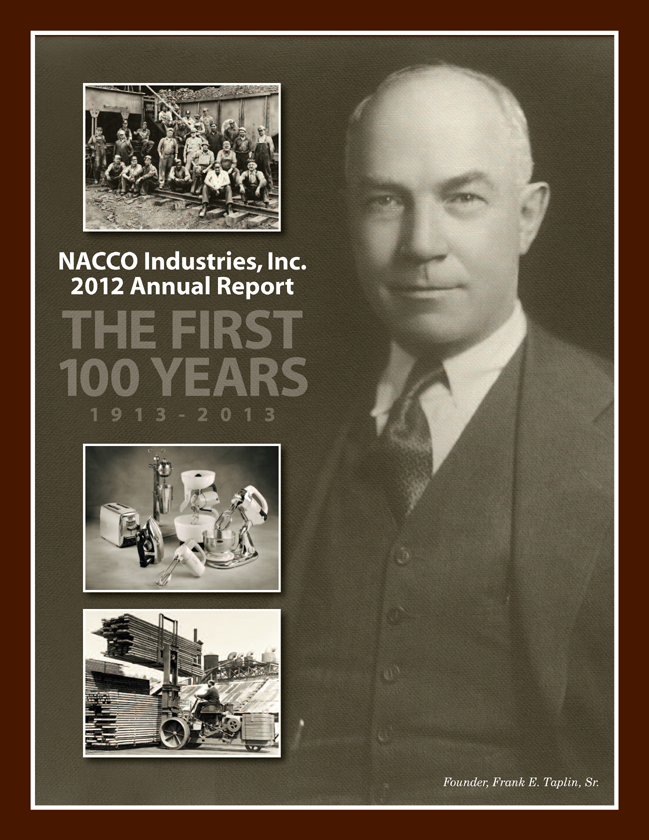
To Our
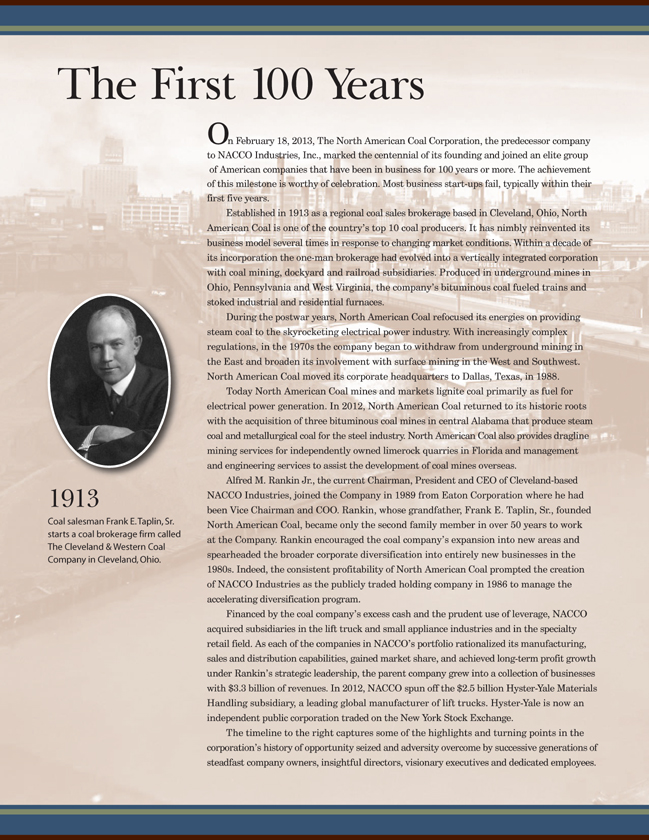
In 1913, Frank E. Taplin, Sr., pictured on the front of this annual report, started The Cleveland & Western Coal Company, the predecessor of The North American Coal Corporation, as a one-man brokerage firm, selling other companies’ coal. That original business has been transformed many times over the past 100 years to become the NACCO Industries, Inc. of today.
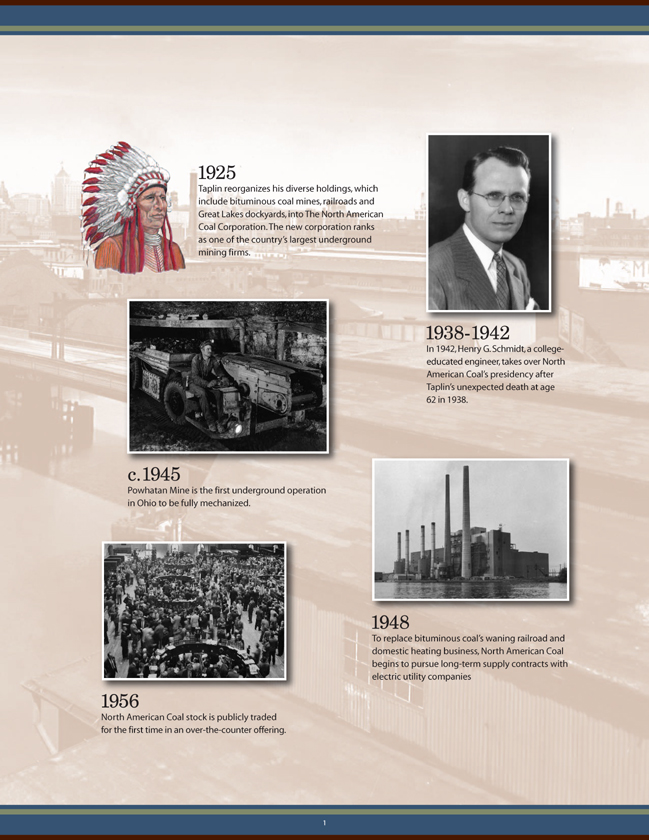
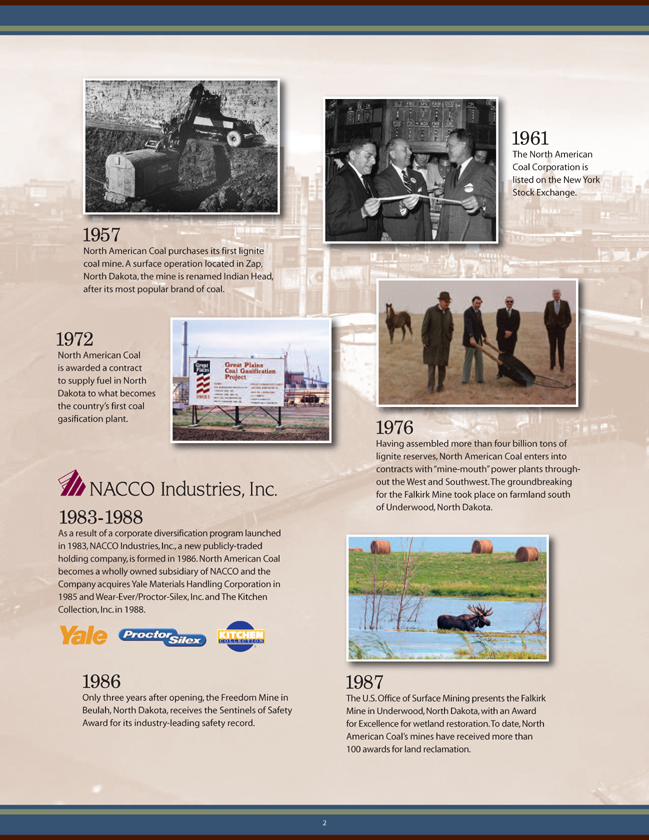
By 1916, Mr. Taplin’s small brokerage had evolved into an underground mining company in Southern Ohio that would, in 1926, become The North American Coal Corporation. A dual focus on safety and innovation would see the company transformed from an Eastern underground miner of bituminous coal to, as the 20th century closed, the largest lignite surface miner in the United States. A corporate diversification program launched in the early 1980s led to the creation of NACCO Industries, Inc. in 1986 and the Company’s entry into other businesses – a controlling investment in the lift truck industry beginning in 1985 and an acquisition in the housewares industry beginning in 1988.

As a diversified holding company, NACCO grew to become aFortune1000 business with revenues of $3.3 billion in 2011.
Fittingly, during its 100th year, the Company transformed itself yet again. NACCO’s commitment to creating shareholder value was demonstrated in September 2012 when the Company spun off its materials handling business as an independent public company, Hyster-Yale Materials Handling, Inc., to NACCO stockholders. As a result, the financial information in this Annual Report on Form 10-K has been reclassified to reflect Hyster-Yale’s pre-spin operating results as discontinued operations and all further discussions in this letter relate to income from continuing operations. Today, NACCO remains a strong, multi-industry company with leading businesses in the mining, small appliances and specialty retail industries, and is well positioned to support its individual businesses in the years ahead.
The spin-off was not the only substantial change to the Company’s business model during 2012. Late in
8

Stockholders
the third quarter, The North American Coal Corporation (“NACoal”) underwent a transformation of its own by re-entering the bituminous coal business through the acquisition of companies which comprise the operations of Reed Minerals, an Alabama producer of steam and metallurgical coal. With this acquisition, NACoal is positioned to expand in the domestic and international metallurgical coal business, in addition to the growth expected in its domestic lignite mining operations.
Coal deliveries at NACoal’s lignite mines increased in 2012 as more electrical demand at customers’ power plants translated into higher customer requirements during the first half of the year. However, an extended power plant outage in the latter half of the year tempered those improvements. Limerock customers increased requirements as a result of significant demand related primarily to one large project in the Florida construction market. The
consumer market continued to be soft as the mass-market consumer, which is Hamilton Beach Brands’ (“HBB”) and Kitchen Collection’s primary customer, remained under pressure in 2012. Additionally, customer visits to stores in both indoor and outlet malls dropped in 2012, especially during the fourth-quarter holiday-selling season. In this highly challenging environment, revenues and profits improved at HBB as a result of increased placements and promotions at its largest customers. Kitchen Collection continues to make adjustments to attract customers but was not able to overcome the unfavorable effect of the decline in customer visits to its stores.
Given 2012 market conditions, the acquisition of Reed Minerals and gains on sales of assets at NACoal, revenues increased and strong operating results were achieved at HBB and NACoal but operating results were disappointing at Kitchen Collection. Consolidated
revenues for NACCO grew to $873.4 million in 2012 from $790.4 million in 2011, with the increase primarily driven by increased deliveries at NACoal and higher sales volumes of higher-priced products at HBB. Income from continuing operations decreased to $42.2 million, or $5.02 per diluted share, in 2012 from $79.5 million, or $9.46 per diluted share, in 2011. However, income from continuing operations for 2011 included the receipt of $60.0 million, or $39.0 million after taxes of $21.0 million, related to the Applica litigation settlement in 2011. This settlement was partially offset by litigation costs of $2.8 million, or $1.8 million after taxes of $1.0 million, also incurred in 2011. Excluding the settlement and the corresponding litigation costs, adjusted income from continuing operations(1) was $42.3 million, or $5.03 per diluted share for the year ended December 31, 2011.
In 2012, strong returns on capital employed(2) (“ROTCE”) on a net debt
| (1) | “Consolidated adjusted income from continuing operations” in this letter refers to income from continuing operations that exclude the Applica settlement and related litigation costs. (For reconciliations from GAAP results to the adjusted non-GAAP results, see page 24.) Management believes a discussion of adjusted income from continuing operations is more reflective of NACCO’s underlying business operations and assists investors in better understanding the results of operations of NACCO and its subsidiaries. |
| (2) | See page 24 for the calculation of return on capital employed. |
9
basis were realized at NACoal (17.3 percent) and HBB (29.4 percent) but Kitchen Collection had a negative return of 6.1 percent. The Company generated cash flow before financing activities from continuing operations of $10.7 million in 2012 as strong positive cash flow before financing activities at HBB was offset by negative cash flow before financing activities at NACoal, primarily due to the cash paid of $69.3 million for the acquisition of Reed Minerals. Cash flow before financing activities from continuing operations of $83.8 million generated in 2011 included the receipt of $60 million for the Applica litigation settlement. The Company’s cash position at December 31, 2012 was strong at $139.9 million despite paying both a special dividend of $3.50 per share and a regular quarterly dividend of $0.25 per share to stockholders on December 14, 2012, which used $31.4 million of cash. Consolidated debt as of December 31, 2012 increased to $177.7 million from $148.2 million as of December 31, 2011, largely as a result of the Reed Minerals acquisition. NACCO expects strong cash flow before financing activities from NACoal and HBB in 2013 and modest cash flow before financing activities at Kitchen Collection.
On the first trading day of 2012, NACCO’s stock price closed at $91.43. The stock reached a high of $129.20 in July 2012 following the announcement of the spin-off of the materials handling business, and closed on September 28, 2012 at $125.41. The spin-off was completed after the market closed on September 28th when the Company distributed one share of Hyster-Yale Class A common stock and one share of Hyster-Yale Class B common stock to NACCO stockholders for each share
of NACCO Class A common stock or Class B common stock owned. Post-spin, NACCO’s stock opened at $41.50 and achieved an average price of $53.31 for the fourth quarter of 2012. Hyster-Yale’s stock (NYSE: HY) opened at $40.00 per share on its first day of trading and achieved an average price of $42.74 for the fourth quarter of 2012. Combining the value of one NACCO share with the value of two Hyster-Yale shares, in line with the distribution in the spin-off, equals a combined opening value of $121.50 per share on the first day after the spin-off and $138.79 per share on average for the fourth quarter. Share prices for NACCO and Hyster-Yale on March 4, 2013 were $57.91 and $51.93, respectively, equaling $161.77 per share on a similarly calculated “one NACCO share plus two Hyster-Yale shares” basis.
NACCO’s objective is to realize improved valuation over time as the Company executes its strategies for growth and to reach its subsidiaries’ financial targets. In addition, in Novem-ber 2012, NACCO’s Board of Directors approved an extension of the Company’s stock repurchase program through December 31, 2013. The stock repurchase program permits the repurchase of up to $50 million of the Company’s outstanding Class A common stock. The share repurchase program does not require the Company to acquire any specific number of shares. As of December 31, 2012, NACCO had purchased a total of 75,074 shares since the buyback’s inception, including 30,851 shares purchased before the spin-off at an average price of $85.59 per share and 44,223 shares purchased after the spin-off at an average price of $58.76 per share.
Subsidiary Financial Objectives
Each of NACCO’s subsidiary companies has specific long-term financial objectives (described on page 8). In 2012, NACoal met its ROTCE objective but fell short of its other objectives. Continued improvements in performance at NACoal’s Mississippi Lignite Mining Company (“MLMC”) and the integration and expected growth of Reed Minerals are anticipated to help NACoal achieve all of its objectives. HBB had sound operating profit but fell below its long-term operating profit margin target. Kitchen Collection fell well below its operating profit margin target and declined substantially compared with 2011. Looking forward, HBB is expected to continue to improve results but will need additional sales volumes through execution of its strategic initiatives, or possibly through a synergistic partnership or acquisition to reach its target. Kitchen Collection’s goal will be difficult to achieve if the Le Gourmet Chef® stores continue to struggle and customer visits to outlet malls fail to recover. The Kitchen Collection® store format is expected to continue to produce sound results over time but the Le Gourmet Chef® stores are not expected to achieve their target objective until sales volumes increase and additional underperforming stores have been closed. As each of NACCO’s subsidiaries executes its strategic initiatives, the Company expects that its subsidiaries will be positioned to achieve or exceed their long-term financial goals.
10

Mining
North American Coal
2012 Results.NACoal has delivered strong, stable performance over the years. 2012 was no exception. In addition, a few significant transactions contributed to the improved results in 2012. During the year, NACoal sold certain assets which resulted in pre-tax gains of approximately $7.0 million. Also, on August 31, 2012, NACoal acquired Reed Minerals, which resulted in an increase in deliveries and contributed
$1.5 million of operating profit during the balance of the year. Additional increases in net income were provided by MLMC as deliveries increased to the customer’s power plant which ran more consistently in 2012 than in 2011, by increased deliveries at the limerock dragline mining operations due to customer demand for supply to a large construction project in southern Florida, and by higher royalty income. Higher employee-related expenses,
largely related to long-term incentive compensation associated with achieving significant new business opportunities for North American Coal, and acquisition-related costs, as well as higher income tax expense, mostly offset these improvements. As a result, NACoal reported net income in 2012 of $32.8 million compared with $29.4 million in 2011.
While NACoal generated cash flow from operations of $50.2 million in 2012,
11

cash flow before financing activities was actually negative at $6.1 million predominantly due to several unique transactions in 2012. These included cash paid of $69.3 million to acquire Reed Minerals, the purchase of two draglines for $26.8 million, the sale of two draglines for $31.2 million and the receipt of $14.4 million in payment for a long-term note related to a dragline sold in 2009. Cash flow before financing activities was $21.0 million in 2011.
Outlook for 2013.While NACoal will work to integrate Reed Minerals in 2013, the company will remain focused on safety, environmental compliance and continuous improvement programs. These well-established
programs provide a solid foundation for all of the company’s coal and limerock mining operations. NACoal expects steady operating performance at its coal mining operations in 2013. Steam coal tons delivered in 2013 are expected to increase over 2012 at both the consolidated and unconsolidated mining operations provided end-use customers achieve currently planned power plant operating levels. NACoal is optimistic that the power plant served by MLMC will build on its operating improvements in 2012 and run more consistently in 2013. However, metallurgical coal sales for Reed Minerals are expected to be below the company’s initial expectations as demand for steel is down and customers are reducing inventories.
Limerock deliveries are expected to decrease in 2013 compared with 2012 as customer requirements are expected to decline moderately because the large construction project that increased 2012 requirements will be completed in early 2013 and the overall Florida construction market remains weak. Demery Resources Company’s Five Forks Mine commenced delivering coal to its customer in 2012 and is expected to increase production in 2013, with full production levels expected to be reached in late 2015 or 2016. Royalty income is expected to be lower in 2013 compared with 2012.
NACoal expects to continue to generate modest income in 2013 from the four unconsolidated mines which
12

are in development. Liberty Fuels is eventually expected to produce approximately 4.5 million tons of lignite coal annually for Mississippi Power Company’s new Kemper County Energy Facility currently being built in Mississippi. The project is on track for initial coal deliveries in mid-2014. In February 2013, the mining permit needed to commence mining operations at the Caddo Creek Resources Company’s project in Texas was issued. Caddo Creek expects to mine approximately 650,000 tons of coal annually with initial deliveries expected in early 2014. In January 2013, the mining permit needed to commence mining operations at the Camino Real Fuels project in Texas was issued. Camino
Real Fuels expects initial deliveries in the third quarter of 2014, and expects to mine approximately 2.7 million tons of coal annually when full production is achieved. In addition, in October 2012, North American Coal’s subsidiary, Coyote Creek Mining Company, entered into a new agreement with the co-owners of the Coyote Station generation plant to develop a lignite mine in Mercer County, North Dakota. Coyote Creek Mining Company expects to deliver approximately 2.5 million tons of coal annually beginning in May 2016.
North American Coal also expects to continue to incur additional expenses in 2013 to pursue new project opportunities. In particular, the company continues to move forward to obtain
a permit for its Otter Creek reserve in North Dakota in preparation for the anticipated construction of a new mine.
Overall, North American Coal expects net income in 2013 to decrease slightly from 2012 primarily due to the absence of pre-tax gains of approximately $7.0 million from asset sales during 2012. Excluding the effect of the asset sales, operating results are expected to increase compared with 2012 mainly as a result of increased deliveries and lower operating expenses. Cash flow before financing activities for 2013 is expected to be higher than 2012, but not at the levels of 2011 due to an anticipated increase in capital expenditures to support operating improvements at the Reed Minerals operations.
13


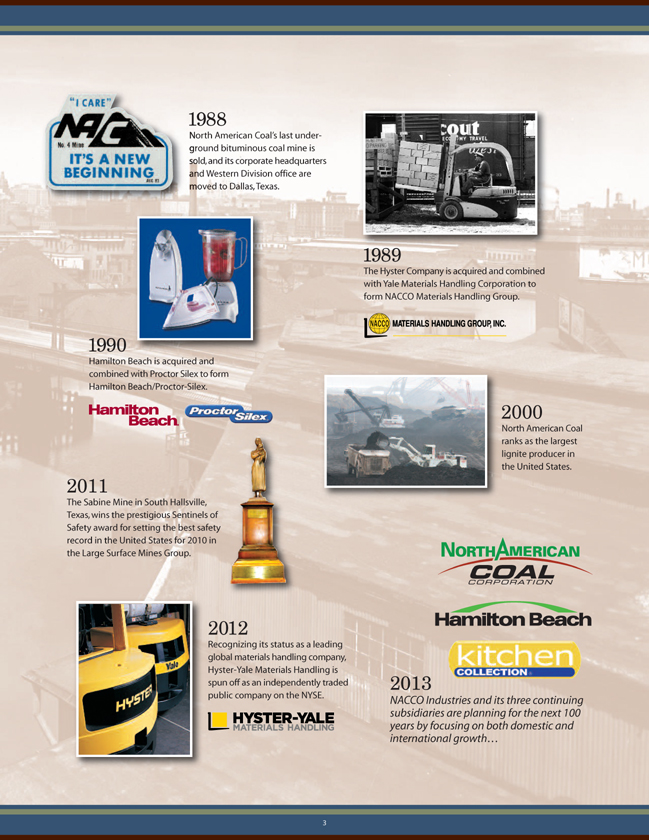
Longer-Term Perspective. In 2012, NACoal’s Sabine Mine, which opened in 1984, delivered its 100,000,000th ton of coal, a tribute to the company’s objective of being a long-term partner with its customers. NACoal expects to continue its record of operational excellence in safety, environmental stewardship and production at each of its mining operations and, over time, to deliver profitability that exceeds its financial objectives.
NACoal’s vision is to continue to be a leading low-cost miner of coal for its customers and to provide selected value-added mining services for companies in the aggregates business. NACoal expects to continue to pursue opportunities for new domestic coal mining projects. However the prospects for the development of new coal fired power generation in the United States are uncertain at best. As a result, the company has put in place four additional strategic growth initiatives to help achieve this objective.
The company considers its acquisition of Reed Minerals as the first step in a metallurgical coal strategic initiative which includes coal exports. NACoal’s full integration of Reed Minerals will increase capacity and lower costs, providing enhanced opportunities to increase both domestic and export sales.
The company is also pursuing opportunities to expand through mining activities that serve the international mining arena, such as new opportunities to provide value-added mining services outside the United States, similar to its current relationship in India.
In addition, the company is investigating a number of non-coal mining opportunities, both domestically and internationally.
Finally, strategic growth may come from projects developed out of new technologies that utilize coal, such as coal-to-liquids, integrated gasification combined cycle power generation, and production of alternative fuels made from coal, as well as other clean coal technologies and non-traditional products derived from coal. NACoal is working with a range of technical experts and potential partners who might help develop projects based on these advanced technologies. However, any significant growth in domestic opportunities is largely dependent on the United States adopting a balanced energy policy in which coal continues to play a key role, including through these new coal technologies.
NACoal believes that a large majority of consumers in the United States want a domestic energy policy
which balances affordability, energy needs and environmental responsibility. The company believes that coal must remain an integral part of the nation’s total energy mix for the United States to continue to be competitive in a global economy. NACoal will continue to monitor pending regulations and legislation and will work to take a leadership role to help ensure that reasonable actions are undertaken by the government. Importantly, NACoal expects that currently anticipated changes to domestic environmental regulatory requirements will be effectively addressed by working with its customers.
Overall, NACoal anticipates reasonable prospects for growth over the next few years as the company’s new mines currently in development reach full production. This enhanced financial performance is expected to provide a solid base for NACoal to attain its strategic objectives and achieve its long-term financial targets.
At left and top left to right:Shovels load overburden into one of a fleet of dump trucks, which carry the overburden to areas of the mine that are being reclaimed. A look beyond reclaimed land used for growing pine trees to the mining pit at the Red Hills Mine in Mississippi. One of North American Coal’s environmental specialists tests water samples in a reclaimed wetland.
Bottom: The Kress haul truck that delivered the 100,000,000th ton of coal at North American Coal’s Sabine Mine.
15


Housewares
Hamilton Beach Brands
2012 Results.HBB came back strong in 2012 following a challenging 2011. While weak consumer demand in 2011 continued to reduce sales volumes in the first half of 2012, primarily at the U.S. mass-market consumer retailers, HBB’s success at selling products with higher price points offset these volume declines in the latter part of the year. The company gained further ground during the fourth-quarter holiday-selling season with strong placements and promotions at key retailers that increased volumes substantially, ending 2012 with substantially higher
sales volumes in the U.S. consumer business than in 2011. Sales of higher-margin products throughout the year and moderating commodity costs in the back half of the year allowed the company to offset some of the margin pressure created by higher product costs in the first half of 2012 and increased employee-related costs, resulting in HBB maintaining its operating profit margin compared with 2011. Overall, revenues increased to $521.6 million in 2012 from $493.0 million in 2011 and net income improved to $21.2 million in 2012 from $18.4 million in 2011. In addition, HBB ended the year with
improved cash flow before financing activities of $24.2 million compared with $20.5 million in 2011.
Outlook for 2013.The overall retail market for higher-end small kitchen appliances has recently shown some signs of softening while the middle-market portion in which HBB participates is relatively flat. HBB’s target consumer, the middle-market mass consumer, continues to struggle with financial and economic concerns, and consumer confidence does not appear to be as high as it was in 2012. As a result, sales volumes in the middle-
Left:Hamilton Beach Brands’ newest products include, clockwise from top: Hamilton Beach® BrewStation® 12-cup coffeemaker with removable reservoir, Hamilton Beach® Big Mouth® Pro juice extractor, Hamilton Beach® Stay or Go® 4-quart slow cooker, Hamilton Beach® Smoothie Smart™ Blender and Hamilton Beach® Digital Simplicity™ Rice Cooker and Steamer.
Above:New display layouts and signage at Kitchen Collection’s Le Gourmet Chef® store in Aurora, Ohio. Le Gourmet Chef® stores feature brand-name kitchenware and gourmet foods.
17
market portion of the U.S. small kitchen appliance market are projected to grow only moderately in 2013 compared with 2012. International and commercial product markets are expected to continue to grow reasonably in 2013 compared with 2012.
HBB continues to focus on strength- ening its North American consumer market position through product innovation, promotions, increased placements and branding programs, together with appropriate levels of advertising for the company’s highly successful and inno- vative product lines. Particular focus is being placed on single-serve coffee prod- ucts such as The Scoop® and FlexBrewTM. HBB expects The Scoop®, the Two-Way Brewer and the DurathonTM iron product line, all introduced in late 2011, as well as the FlexBrewTM, launched in late 2012, to continue to gain market position as broader distribution is attained over time. The company is continuing to introduce innovative products in several small appliance categories. In the first quarter of 2013, HBB expects to launch the Hamilton Beach® Breakfast Sandwich Maker, which provides an innovative and convenient way for con-
| sumers to cook breakfast sandwiches quickly at home. These products, as well as other new product introductions in the pipeline for 2013, are expected to increase both revenues and operating profit. As a result of these new products, the company’s improving position in commercial and international markets, and execution of the company’s strategic initiatives, HBB expects to increase volumes and revenues in 2013 compared with 2012 at more than the 2013 market forecast rate of increase.
Overall, HBB expects full-year 2013 net income to be comparable to 2012 as anticipated increases in profit from increased revenues are forecasted to be largely offset by expected increases in operating expenses to support HBB’s strategic initiatives. Product and transportation costs are currently expected to remain comparable to 2012. HBB continues to monitor commodity costs closely and will adjust product prices and product placements, as appropriate, if these costs increase more than anticipated. HBB expects 2013 cash flow before financing activities to be moderately lower than in 2012 due to increased working capital needs.
| Longer-Term Perspective.HBB’s vision is to be the leading designer, marketer and distributor of small electric household and commercial appliances sold worldwide under strong brand names and to achieve profitable growth from innovative solutions that improve everyday living. To achieve this vision, HBB will focus on five strategic growth initiatives, each of which is described separately below:
1.Enhancing placements in theNorth American consumer business through consumer-driven innovative products and strong sales and market- ing support. The company’s product and placement track record is strong due to innovation processes centered on understanding and meeting end-user needs. In the North American consumer market, HBB believes it has a stronger and deeper portfolio of new products than its competitors. HBB expects its product pipeline in 2013 and beyond to be at or above already increased 2012 levels, with strong brands and best-in- class products.
2. Enhancing Internet sales by providing best-in-class retailer support and increased consumer content and engagement. In the past few years, Internet sales have grown significantly in all product areas. Small kitchen appliances are no exception. During 2012, 18 percent of small kitchen appli- ances were purchased online. Retailers are looking for partners that can pro- vide not only products, but also new capabilities and support for promotion, marketing and distribution programs. As consumers’ shopping habits evolve to rely more on the Internet, HBB is focused on being the leading partner to its retailers and by increasing engage-ment with end users by enhancing its programs designed to make HBB the preferred source for small appliances. | ||
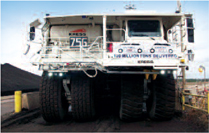
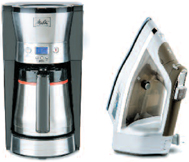
| Left to Right:Melitta 10-cup thermal coffeemaker, the newest version of the Durathon™ Digital Iron with Durathon™ Nonstick Soleplate, Hamilton Beach® Tournant™ high-performance commercial food blender and The Scoop® single-cup coffeemaker. | ||||
18
3.Achieving further penetration of the global Commercial market through a commitment to an enhanced global product line for chains and distributors serving the global food service and hospitality markets.HBB expects to enhance its global commercial product line, particularly with new innovative blending and mixing platforms, and strengthen food service and hospitality options in order to achieve further market penetration in this segment. Over the near term, the company anticipates continuing to incur costs to build distribution capabilities and increase the number of sales representatives in the international food service market.
4.Expanding internationally in the emerging Asian and Latin American markets by offering products designed specifically for those market needs and by expanding distribution channels and sales and marketing capabilities. HBB’s historical strength has been in the domestic consumer goods market, with only 24 percent of total sales in 2012 occurring outside the United States. The company’s objective is to increase international sales to 35 to 45 percent of total sales. HBB’s efforts will focus on continuing to expand in Mexico, Canada and Central America, as well as entering the emerging markets of China, India, Brazil and other South American countries. To achieve this growth, the company is working to understand local consumers’ needs and developing products to meet those needs, especially in the mid- to high-end segments of these markets. In addition, HBB expects to work with local partners in certain targeted countries. |  | |||
| Hamilton Beach Brands’ newest Proctor Silex® products include, clockwise from top: Proctor Silex® programmable 12-cup coffeemaker, Proctor Silex® 10-speed blender and Proctor Silex® 4-quart slow cooker. | ||||
5.Entering the “only-the-best” market with a strong brand and broadproduct line.HBB is planning to enter the “only-the-best” high-end small kitchen appliance market in selected segments. The company is currently working with Jamba Juice® to create a product line focused on blending and juicing. HBB also is seeking other partners to create additional lines that |
can be distributed in high-end specialty stores and on the Internet.
HBB believes these five strategic initiatives provide a solid set of strategies for profitable growth. The company is optimistic that it will be able to build on momentum achieved in distribution in 2012, and make continued progress in expanding in selected international consumer and global commercial | |||
19
markets. The company believes it is well-positioned to continue its leadership position in the small kitchen appliances industry and to move toward achieving its near-term financial objective of 8 percent operating profit margin and its long-term financial objective of a minimum 10 percent operating profit margin in the years ahead.
Kitchen Collection
2012 Results.Over the course of 2012, Kitchen Collection made significant operational strides by improving its Kitchen Collection® and Le Gourmet Chef® store formats. Unfortunately, these operational improvements did not translate into financial improvements in 2012. Improved comparable store results and new store sales in the first half of the year were offset by a very difficult second half. Inclement weather and continued financial pressures weighing on middle-market consumers reduced customer visits to outlet malls in general and to the company’s stores, especially in the fourth quarter. Further, the costs to remodel and reformat stores and a $0.7 million impairment charge for leasehold improvements at under-performing stores offset the favorable results of opening new stores.
The Kitchen Collection® stores, which sell a wide variety of basic kitchen items, generated an increased average sales transaction value. However, the number of customer visits declined. Additionally, lower gross margins and higher employee-related costs reduced Kitchen Collection® store income compared with the prior year. The Le Gourmet Chef® stores, which sell
higher-end goods focusing on cooking and entertaining themes, continued to struggle in 2012. A higher average sales transaction value did not make up for fewer transactions due to reduced customer visits.
Revenues increased to $224.7 million in 2012 from $221.2 million in 2011 as sales from new stores and 34 seasonal stores that were open only in the fourth quarter offset lost revenues from closed stores. However, operating results were very disappointing as a

result of the factors previously described and lower margins due to the liquidation of a significant amount of inventory as stores were closed. As a result, Kitchen Collection reported a net loss of $3.1 million in 2012 compared with net income of $1.1 million in 2011 and had negative cash flow before financing activities of $0.1 million compared with positive cash flow before financing activities of $2.6 million in 2011.
Outlook for 2013.Prospects for 2013 remain uncertain, but are expected to improve over 2012 levels. However, the middle-market consumer remains under pressure due to financial and economic concerns, and those concerns are expected to continue to dampen consumer sentiment and limit consumer spending levels for Kitchen Collection’s target customer in 2013. As a result, Kitchen Collection expects 2013 revenues to be comparable to 2012, although the company expects to maintain a lower number of stores through much of 2013 than in 2012, since a number of stores will be closed early in the year and the majority of new ones won’t be opened until the latter half of the year.
Overall, Kitchen Collection expects modest net income for the 2013 full year and positive cash flow before financing activities compared with a net loss and essentially break even cash flow before financing in 2012. Enhanced sales per store and product margins are expected as a result of the improvements in store formats and layouts and refinements of promotional offers and merchandise mix at both the Kitchen Collection® and Le Gourmet Chef® stores. During 2012, Kitchen Collection reformatted many of its stores to promote a value and trend message at the front of its stores, which is expected, with some further adjustments, to drive an increased number of customers into its locations. The company invested significant resources implementing format changes at all of its Le Gourmet Chef® stores in the first half of 2012 and completing the remodeling of a
Above:A free-standing display of products at the Le Gourmet Chef® store in Aurora, Ohio, makes it easier for customers to shop and select products.
Right:The newly formatted Kitchen Collection® store in Jeffersonville, Ohio, features bump outs to improve the display of products.
20

| total of 82 Kitchen Collection® stores over the course of 2012. Feedback to date on these changes is favorable, but reduced traffic in 2012 made it difficult to determine their longer-term impact. In addition, these changes resulted in higher up-front costs during 2012 and the liquidation of a substantial amount of inventory, both of which are not | expected to recur in 2013. As these new formats gain traction, they are expected to improve margins and income in 2013.
Longer-Term Perspective. Kitchen Collection’s vision is to be the leading specialty retailer of kitchen, home entertaining and gourmet food products mainly in outlet malls and
| certain traditional mall types for consumers seeking a large selection of unique, high quality products at an exceptional value. The company’s core strength is its Kitchen Collection® store format in outlet malls, but it has two solid store formats and plans to leverage this strength with strong, separate brand identities for each. However, with an operating margin significantly lower than its target, the company is focused on ways to move the business back to a significantly more profitable position and has identified initiatives that are expected to move the company closer to, and ultimately achieve, its long-term financial target of 5 percent operating profit margin.
Kitchen Collection plans to focus on comparable store sales growth by enhancing sales volume and profitability through refinement of its formats and value and trend messaging, and presentation and ongoing review of the specific product offerings, merchandise mix, store displays and appearance, while improving inventory efficiency and store inventory controls. The company will also continue to evaluate and, as lease contracts permit, close underperforming and loss-generating stores, principally Le Gourmet Chef® stores. In the near term, Kitchen Collection expects to concentrate its growth on increasing the number of Kitchen Collection® stores, with the store expansion program tied to identi- fying the best positions in the best outlet malls for Kitchen Collection® stores. At such time as adequate profit prospects are demonstrated by the Le Gourmet Chef® format, the com- pany’s expansion focus will shift to increasing the number of these stores as well. | ||
 | ||||
| Kitchen Collection® provides a wide variety of specialty kitchen-related products, as shown in this new bakeware display at the Kitchen Collection® store in Jeffersonville, Ohio. | ||||
22
Kitchen Collection also expects to explore other growth opportunities. The company expects to increase the role of regional assortments by tailoring store merchandise to local tastes and to test distribution of new product categories such as textiles and gourmet foods. In addition, the company is pursuing strategies to enhance its e-commerce and mobile technology capabilities to ensure it is meeting the needs of its consumers regardless of whether shopping occurs in the company’s stores or on its websites.
Through the execution of its initiatives, the Kitchen Collection® stores are expected to achieve higher margins in 2013, but are still not expected to achieve the long-term operating margin target of 5 percent in the immediate future. Le Gourmet Chef® stores are not expected to achieve target margins unless sales volumes per store increase and until additional underperforming stores are closed.
Conclusion and NACCO Outlook.The most significant event in NACCO’s 100th year was the spinoff of Hyster-Yale Materials Handling. The new NACCO Industries that remains has substantial opportunities for growth and profitability as it moves on to its second 100 years. NACCO is confident that each subsidiary has the right initiatives in place both to grow and to achieve its long-term financial objectives. Growth opportunities are particularly significant at the NACoal and HBB businesses, although both will be prudent in their implementation. Kitchen Collection is concentrating on ways it can improve by thoughtfully identifying what is and what is not working at each format and making
appropriate changes. Each subsidiary has benefited from previous programs put in place which, when combined with the new strategic growth initiatives being implemented, should move each business forward on a growth path.
In 2013, overall consolidated income from continuing operations is expected to increase moderately compared with 2012, primarily because Kitchen Collection is expected to improve to modest net income in 2013. The housewares market is expected to remain challenging for both HBB and Kitchen Collection, but the Company is hopeful consumer confidence and financial position will improve and that customer visits, number of transactions and sales per transaction will consequently improve at mass-market retailers and outlet malls. Comparable results are expected at HBB as higher expenses associated with implementing its strategic initiatives are expected to offset the gross margin effect of anticipated top-line growth. Finally, while an expected increase in tons delivered and lower operating expenses in 2013 are expected to lead to improved operating results at NACoal, the absence of gains from asset sales in 2012 is expected to result in slightly decreased net income in 2013 than in 2012. NACCO expects an overall increase in cash flow before financing activities in 2013 compared with 2012.
We would like to welcome James Ratner and David Williams, both of whom joined our Board after the spinoff of the materials handling business. We are privileged to have them on our Board.
In closing, we would like to thank all of our subsidiaries’ customers, retailers and suppliers, and all of NACCO’s stockholders, for their continued support. Most importantly, we would also like to thank all employees of NACCO and its subsidiary companies for their continued hard work and commitment to achieving the successes and meeting the challenges of 2012. We continue to have great confidence in the management teams leading each of our subsidiaries and the parent company. Our many experienced and highly motivated professionals worked successfully to transform NACCO through the spin-off of Hyster-Yale, secure two new mining projects for North American Coal, overcome challenges in the Housewares market and deliver the Company’s solid financial results in 2012. We are confident they can successfully implement their respective strategic initiatives to propel the Company into our next 100 years.

Alfred M. Rankin, Jr.
Chairman, President and Chief Executive Officer,
NACCO Industries, Inc.

Robert L. Benson
President and Chief Executive Officer, The North American Coal Corporation

Gregory H. Trepp
President and Chief Executive Officer, Hamilton Beach Brands, Inc.
Chief Executive Officer, The Kitchen Collection, LLC

Richard R. Chene, Jr.
President, The Kitchen Collection, LLC
23
Supplemental Data
Reconciliation of 2011 Consolidated Income from continuing operations
“As reported” to Adjusted Income from continuing operations:
| (In millions, except per share data) | ||||||||
| Diluted earnings | ||||||||
| 2011 | per share | |||||||
2011 Income from continuing operations, as reported | $ | 79.5 | $ | 9.46 | ||||
Impact of Applica settlement, after taxes of $21.0 | (39.0 | ) | (4.64 | ) | ||||
Impact of Applica litigation costs, after taxes of $1.0 | 1.8 | 0.21 | ||||||
|
|
|
| |||||
2011 Adjusted Income from continuing operations | $ | 42.3 | $ | 5.03 | ||||
|
|
|
| |||||
Adjusted Income from continuing operations is a measure of income that differs from Income from continuing operations measured in accordance with U.S. GAAP. The Company has reported adjusted income from continuing operations and earnings per diluted share for the year ended December 31, 2011 excluding the net effect of the Applica settlement and related litigation costs. Management believes a discussion excluding the settlement and litigation costs is more reflective of NACCO’s underlying business operations and enables investors to better understand the results of operations of the Company.
Calculation of Return on Capital Employed:
| (In millions, except percentage data) | ||||||||||||
| 2012 | NACoal | HBB | Kitchen Collection | |||||||||
2012 Average Equity (12/31/2011 and each of 2012’s quarter ends) | $ | 96.4 | $ | 36.0 | $ | 42.9 | ||||||
2012 Average Debt (12/31/2011 and at each of 2012’s quarter ends) | 109.0 | 45.5 | 7.9 | |||||||||
2012 Average Cash (12/31/2011 and at each of 2012’s quarter ends) | (5.7 | ) | (3.7 | ) | (5.3 | ) | ||||||
|
|
|
|
|
| |||||||
Total 2012 average capital employed | $ | 199.7 | $ | 77.8 | $ | 45.5 | ||||||
2012 Net income (loss), as reported | $ | 32.8 | $ | 21.2 | $ | (3.1 | ) | |||||
Plus: 2012 Interest expense, net | 2.7 | 2.7 | 0.5 | |||||||||
Less: Income taxes on 2012 interest expense at 38%* | (1.0 | ) | (1.0 | ) | (0.2 | ) | ||||||
|
|
|
|
|
| |||||||
Actual return on capital employed = actual net income (loss) before interest expense, net, after tax | $ | 34.5 | $ | 22.9 | $ | (2.8 | ) | |||||
|
|
|
|
|
| |||||||
Actual return on capital employed percentage | 17.3 | % | 29.4 | % | (6.1 | %) | ||||||
|
|
|
|
|
| |||||||
Calculation of Return on Capital Employed:
| 2011 | NACoal | HBB | Kitchen Collection | |||||||||
2011 Average Equity (12/31/2010 and each of 2011’s quarter ends) | $ | 133.8 | $ | 22.3 | $ | 43.2 | ||||||
2011 Average Debt (12/31/2010 and at each of 2011’s quarter ends) | 51.9 | 90.6 | 7.6 | |||||||||
2011 Average Cash (12/31/2010 and at each of 2011’s quarter ends) | (2.7 | ) | (34.8 | ) | (5.1 | ) | ||||||
|
|
|
|
|
| |||||||
Total 2011 average capital employed | $ | 183.0 | $ | 78.1 | $ | 45.7 | ||||||
2011 Net income, as reported | $ | 29.4 | $ | 18.4 | $ | 1.1 | ||||||
Plus: 2011 Interest expense, as reported | 2.7 | 5.2 | 0.5 | |||||||||
Less: Income taxes on 2011 interest expense at 38%** | (1.0 | ) | (2.0 | ) | (0.2 | ) | ||||||
|
|
|
|
|
| |||||||
Actual return on capital employed = actual net income before interest expense, after tax | $ | 31.1 | $ | 21.6 | $ | 1.4 | ||||||
|
|
|
|
|
| |||||||
Actual return on capital employed percentage | 17.0 | % | 27.7 | % | 3.1 | % | ||||||
|
|
|
|
|
| |||||||
Return on capital employed is provided solely as a supplemental disclosure with respect to income generation because management believes it provides useful information with respect to earnings in a form that is comparable to the Company’s cost of capital employed, which includes both equity and debt securities, net of cash.
Return on equity is defined as net income divided by average equity.
| * | Tax rate of 38% represents the Company’s target marginal tax rate compared with 2012’s effective income tax rate of 27.2%. |
| ** | Tax rate of 38% represents the Company’s target marginal tax rate compared with 2011’s effective income tax rate of 29.2%. |
24
Officers and Directors
Officers and Directors of NACCO Industries, Inc.
Officers:
Alfred M. Rankin, Jr.
Chairman, President and Chief Executive Officer
J.C. Butler, Jr.
Senior Vice President – Finance, Treasurer and Chief Administrative Officer
Mark E. Barrus
Vice President and Controller
John D. Neumann
Vice President, General Counsel and Secretary
Robert L. Benson
President and Chief Executive Officer – The North American Coal Corporation
Gregory H. Trepp
President and Chief Executive Officer – Hamilton Beach Brands, Inc.
Directors:
John P. Jumper
Chief Executive Officer, SAIC Retired Chief of Staff, United States Air Force
Dennis W. LaBarre
Partner,
Jones Day
Richard de J. Osborne
Retired Chairman and Chief Executive Officer, ASARCO Incorporated
Alfred M. Rankin, Jr.
Chairman, President and Chief Executive Officer, NACCO Industries, Inc.
James A. Ratner
Executive Vice President of Forest City Enterprises, Inc. and Chairman and Chief Executive Officer of Forest City Commercial Group
Britton T. Taplin
Self employed (personal investments)
David F. Taplin
Self employed (tree farming)
John F. Turben
Founding Partner,
Kirtland Capital Partners
David B. H. Williams
Partner,
Williams, Bax & Saltzman, P.C.
Officers of Subsidiaries
Officers of The North American Coal Corporation
Alfred M. Rankin, Jr.
Chairman
Robert L. Benson
President and Chief Executive Officer
J.C. Butler, Jr.
Senior Vice President-Project Development and Administration
Michael J. Gregory
Vice President-International Operations and Special Projects
Miles B. Haberer
Associate General Counsel and Assistant Secretary
Thomas A. Koza
Vice President, Senior Counsel and Assistant Secretary
John D. Neumann
Vice President, General Counsel
and Secretary
Harry B. Tipton III
Vice President-Engineering, and Louisiana and Mississippi Operations
K. Donald Grischow
Treasurer
John R. Pokorny
Controller
Officers of Hamilton Beach Brands, Inc.
Alfred M. Rankin, Jr.
Chairman
Gregory H. Trepp
President and Chief Executive Officer
Gregory E. Salyers
Senior Vice President, Global Operations
R. Scott Tidey
Senior Vice President, North America Sales and Marketing
Keith B. Burns
Vice President, Engineering and Information Technology
Kathleen L. Diller
Vice President, General Counsel and Secretary
James H. Taylor
Vice President and Chief Financial Officer
Richard E. Moss
Senior Director, Finance & Treasurer
Officers of The Kitchen Collection, LLC
Alfred M. Rankin, Jr.
Chairman
Gregory H. Trepp
Chief Executive Officer
Richard R. Chene, Jr.
President
Randy L. Sklenar
Vice President-Field Operations and Human Resources
Karen E. Cavender
Controller
L.J. Kennedy
Secretary and Treasurer
Corporate Information
Annual Meeting
The Annual Meeting of Stockholders of NACCO Industries, Inc. will be held on May 7, 2013, at 9:00 a.m. at the corporate office located at: 5875 Landerbrook Drive, Cleveland, Ohio 44124
Form 10-K
Additional copies of the Company’s Form 10-K filed with the Securities and Exchange Commission are available free of charge through NACCO Industries’ website(www.nacco.com) or by request to:
Investor Relations
NACCO Industries, Inc.
5875 Landerbrook Drive, Suite 220
Cleveland, Ohio 44124
(440) 229-5130
Stock Transfer Agent and Registrar
Computershare
250 Royall Street
Canton, Massachusetts 02021
(800) 622-6757
Legal Counsel
McDermott Will & Emery LLP
227 West Monroe Street
Chicago, Illinois 60606
Independent Registered Public Accounting Firm
Ernst & Young LLP
1300 Huntington Building
925 Euclid Avenue
Cleveland, Ohio 44115
Stock Exchange Listing
The New York Stock Exchange
Symbol: NC
Investor Relations Contact
Investor questions may be addressed to:
Investor Relations
NACCO Industries, Inc.
5875 Landerbrook Drive, Suite 220
Cleveland, Ohio 44124
(440) 229-5130
E-mail:ir@naccoind.com
NACCO Industries Website
Additional information on NACCO Industries may be found at the corporate website,www.nacco.com. The Company considers this website to be one of the primary sources of information for investors and other interested parties.
Subsidiary Company Websites
The websites for NACCO’s subsidiaries are as follows:
Hamilton Beach Brands–U.S.:
www.hamiltonbeach.com
www.proctorsilex.com
www.commercial.hamiltonbeach.com
Hamilton Beach Brands–Mexico:
www.hamiltonbeach.com.mx
Kitchen Collection:
www.kitchencollection.com
www.legourmetchef.com
North American Coal:
www.nacoal.com

Front cover:
Top:Mine workers at North American Coal’s Powhatan Mine (circa 1940).
Middle:Heritage Hamilton Beach® products, clockwise from the top: Hamilton Beach® Drink mixer (circa 1910), Hamilton Beach® Standmixer Juice Extractor (circa 1930), Hamilton Beach® Standmixer (circa 1950), Hamilton Beach® Hand Mixer (circa 1950), Hamilton Beach® Iron (circa 1950), Hamilton Beach® Toaster (circa 1940)
Bottom:An early model Hyster® lift truck (circa 1940) loads lumber onto a pallet.

5875 Landerbrook Drive, Suite 220 • Cleveland, Ohio 44124
An Equal Opportunity Employer