Exhibit 99
Exhibit 99
Investor Presentation
Safe Harbor Statement & Disclosure
This presentation includes forward-looking comments subject to important risks and uncertainties. It may also contain financial measures that are not in conformance with accounting principles generally accepted in the United States of America (GAAP).
Refer to NACCO’s reports filed on Forms 8-K (current),10-Q (quarterly), and 10-K (annual) for information on factors that could cause actual results to differ materially from information in this presentation and for information reconciling financial measures to GAAP. Past performance may not be representative of future results.
Guidance noted in the following slides was effective as of the company’s most recent earningsrelease and conference call (March 3, 2016). Nothing in thispresentation should be construed as reaffirming or disaffirming such guidance.
This presentation is not an offer to sell or a solicitation of offers to buy any of NACCO’s securities.
2
NACCO Industries Overview
3
NACCO Industries at a Glance
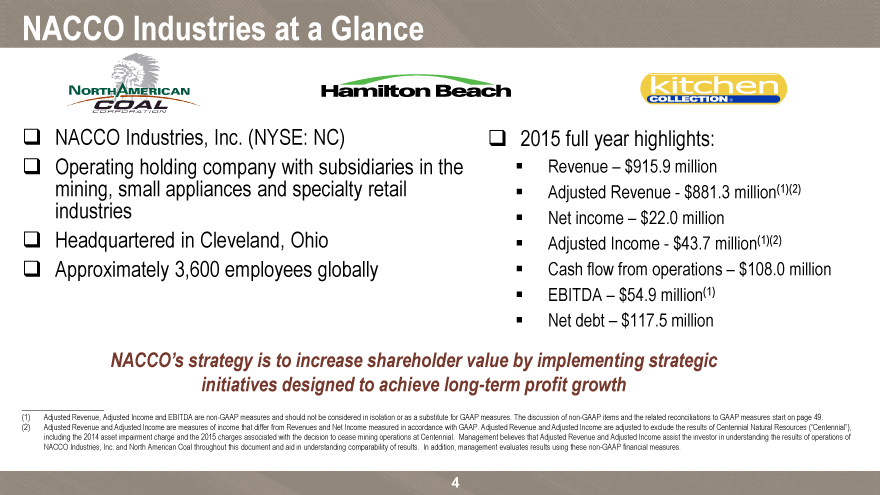
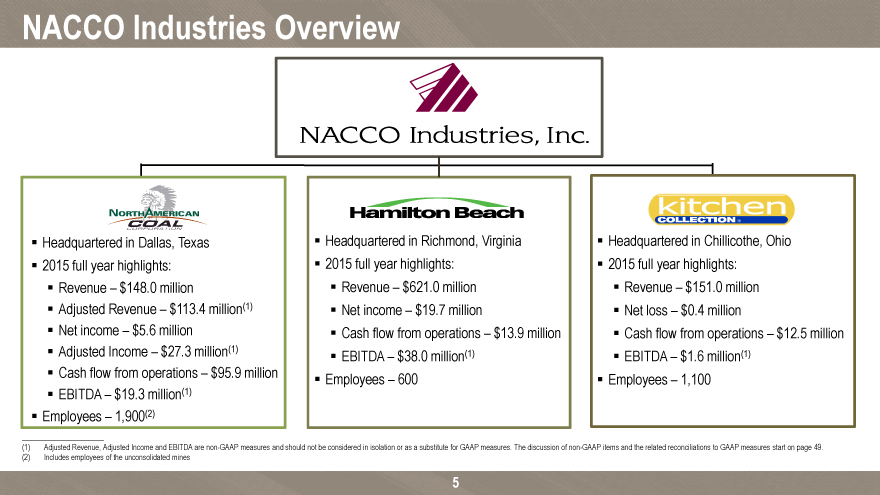
NACCO Industries, Inc. (NYSE: NC) 2015 full year highlights: Operating holding company with subsidiaries in the ? Revenue $915.9 million mining, small appliances and specialty retail ? Adjusted Revenue—$881.3 million(1)(2)
industries? Net income – $22.0 million
Headquartered in Cleveland, Ohio? Adjusted Income—$43.7 million(1)(2)
Approximately 3,600 employees globally? Cash flow from operations – $108.0 million? EBITDA – $54.9 million(1)? Net debt – $117.5 million
NACCO’s strategy is to increase shareholder value by implementing strategic initiatives designed to achieve long-term profit growth
(1) Adjusted Revenue, Adjusted Income and EBITDA are non-GAAP measures and should not be considered in isolation or as a substitute for GAAP measures. The discussion of non-GAAP items and the related reconciliations to GAAP measures start on page 49.
(2) Adjusted Revenue and Adjusted Income are measures of income that differ from Revenues and Net Income measured in accordance with GAAP. Adjusted Revenue and Adjusted Income are adjusted to exclude the results of Centennial Natural Resources (“Centennial”), including the 2014 asset impairment charge and the 2015 charges associated with the decision to cease mining operations at Centennial. Management believes that Adjusted Revenue and Adjusted Income assist the investor in understanding the results of operations of NACCO Industries, Inc. and North American Coal throughout this document and aid in understanding comparability of results. In addition, management evaluates results using these non-GAAP financial measures.
4
NACCO Industries Overview
? Headquartered in Dallas, Texas? Headquartered in Richmond, Virginia? Headquartered in Chillicothe, Ohio? 2015 full year highlights:? 2015 full year highlights:? 2015 full year highlights:? Revenue – $148.0 million? Revenue – $621.0 million? Revenue – $151.0 million? Adjusted Revenue – $113.4 million(1)? Net income – $19.7 million? Net loss – $0.4 million
? Net income $5.6 million? Cash flow from operations – $13.9 million? Cash flow from operations – $12.5 million? Adjusted Income – $27.3 million(1)? EBITDA – $38.0 million(1)? EBITDA – $1.6 million(1)? Cash flow from operations – $95.9 million? Employees – 600 Employees –? 1,100? EBITDA – $19.3 million(1)? Employees – 1,900(2)
(1) Adjusted Revenue, Adjusted Income and EBITDA are non-GAAP measures and should not be considered in isolation or as a substitute for GAAP measures. The discussion of non-GAAP items and the related reconciliations to GAAP measures start on page 49. (2) Includes employees of the unconsolidated mines
5
NACCO Industries Overview (continued)
? NACCO has significant strengths in its principal businesses:
Strong collective earnings and cash flow generation capability
– Cash flow sustainability and low earnings volatility
– Significant management expertise in operating each business across a range of economic conditions
– Substantial overall cash generation to support growth strategies and objectives and cash returns to shareholders
6
NACCO’s Priorities for Use of Cash
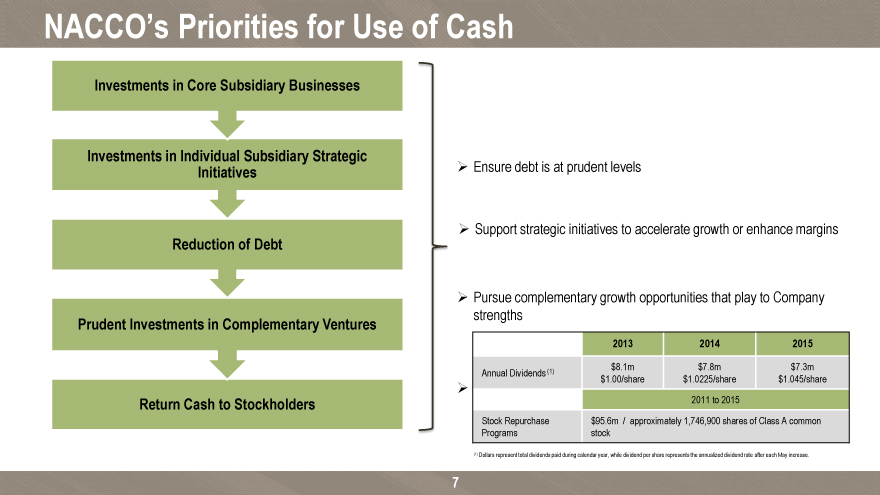
Investments in Core Subsidiary Businesses
Investments in Individual Subsidiary Strategic
Initiatives? Ensure debt is at prudent levels
? Support strategic initiatives to accelerate growth or enhance margins
Reduction of Debt
? Pursue complementary growth opportunities that play to Company strengths
Prudent Investments in Complementary Ventures
2013 2014 2015
(1) $8.1m $7.8m $7.3m Annual Dividends $1.00/share $1.0225/share $1.045/share
?
Return Cash to Stockholders 2011 to 2015
Stock Repurchase $95.6m / approximately 1,746,900 shares of Class A common Programs stock
(1) Dollars represent total dividends paid during calendar year, while dividend per share represents the annualized dividend rate after each May increase.
7
Experienced Management Team
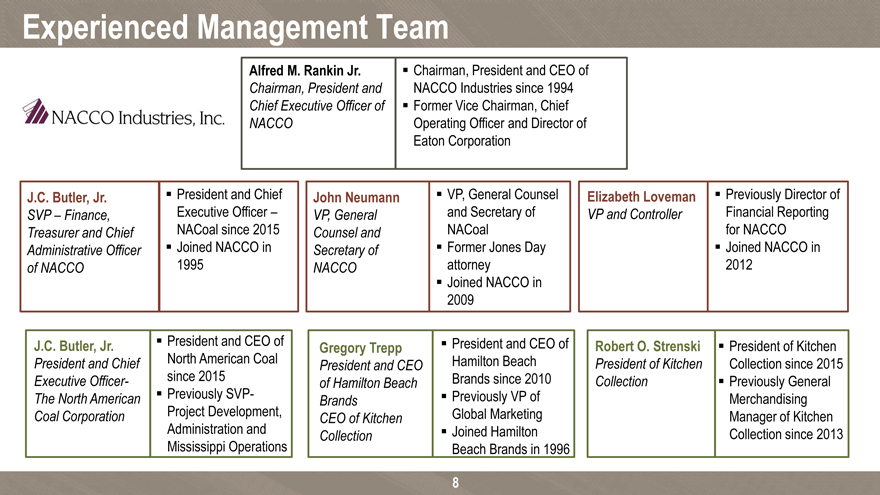
Alfred M. Rankin Jr.? Chairman, President and CEO of Chairman, President and NACCO Industries since 1994 Chief Executive Officer of ? Former Vice Chairman, Chief NACCO Operating Officer and Director of Eaton Corporation
J.C. Butler, Jr.? President and Chief John Neumann? VP, General Counsel Elizabeth Loveman? Previously Director of SVP – Finance, Executive Officer – VP, General and Secretary of VP and Controller Financial Reporting
Treasurer and Chief NACoal since 2015 Counsel and NACoal for NACCO
Administrative Officer ? Joined NACCO in Secretary of ? Former Jones Day ? Joined NACCO in of NACCO 1995 NACCO attorney 2012? Joined NACCO in 2009
J.C. Butler, Jr.? President and CEO of Gregory Trepp? President and CEO of Robert O. Strenski? President of Kitchen President and Chief North American Coal Hamilton Beach President of Kitchen Collection since 2015
President and CEO
Executive Officer- since 2015 Brands since 2010 Collection? Previously General of Hamilton Beach The North American ? Previously SVP-? Previously VP of Merchandising
Brands
Coal Corporation Project Development, Global Marketing Manager of Kitchen
CEO of Kitchen
Administration and ? Joined Hamilton Collection since 2013
Collection
Mississippi Operations Beach Brands in 1996
8
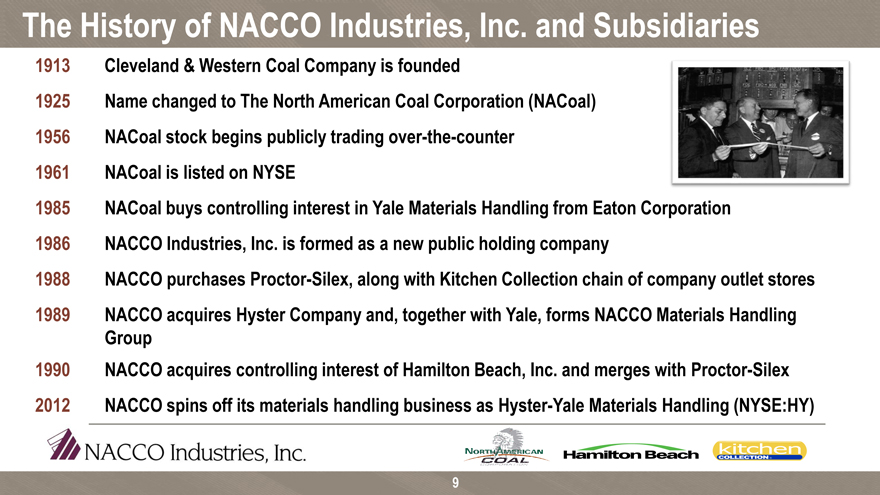
The History of NACCO Industries, Inc. and Subsidiaries
1913 Cleveland & Western Coal Company is founded
1925 Name changed to The North American Coal Corporation (NACoal) 1956 NACoal stock begins publicly trading over-the-counter 1961 NACoal is listed on NYSE
1985 NACoal buys controlling interest in Yale Materials Handling from Eaton Corporation 1986 NACCO Industries, Inc. is formed as a new public holding company
1988 NACCO purchases Proctor-Silex, along with Kitchen Collection chain of company outlet stores 1989 NACCO acquires Hyster Company and, together with Yale, forms NACCO Materials Handling Group 1990 NACCO acquires controlling interest of Hamilton Beach, Inc. and merges with Proctor-Silex 2012 NACCO spins off its materials handling business as Hyster-Yale Materials Handling (NYSE:HY)
9
North American Coal Overview
10
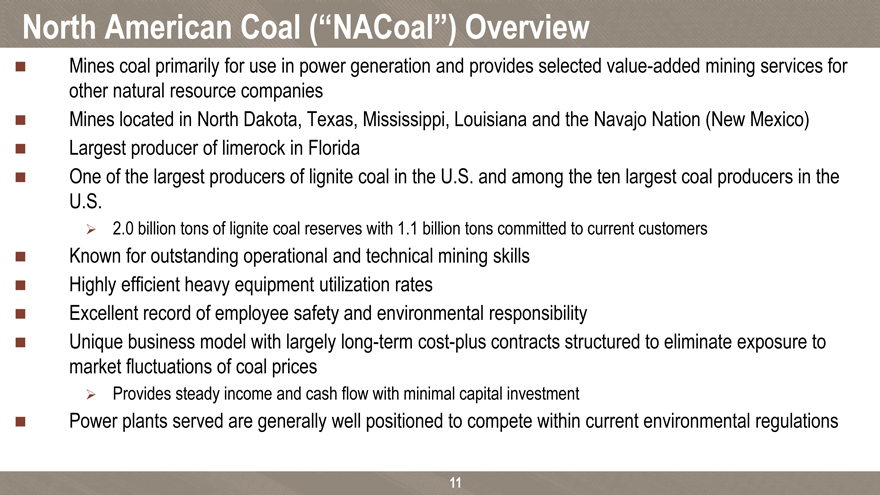
North American Coal (“NACoal”) Overview
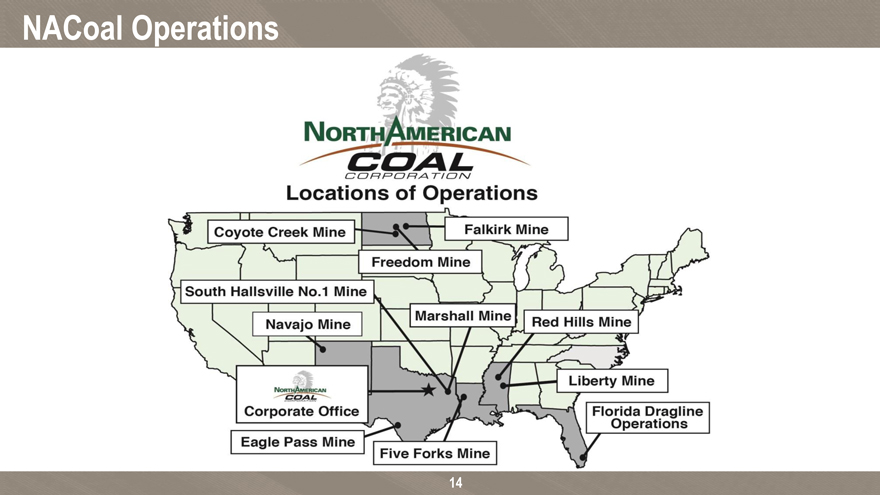
? Mines coal primarily for use in power generation and provides selected value-added mining services for other natural resource companies? Mines located in North Dakota, Texas, Mississippi, Louisiana and the Navajo Nation (New Mexico)? Largest producer of limerock in Florida? One of the largest producers of lignite coal in the U.S. and among the ten largest coal producers in the U.S.
? 2.0 billion tons of lignite coal reserves with 1.1 billion tons committed to current customers
? Known for outstanding operational and technical mining skills? Highly efficient heavy equipment utilization rates? Excellent record of employee safety and environmental responsibility
? Unique business model with largely long-term cost-plus contracts structured to eliminate exposure to market fluctuations of coal prices
? Provides steady income and cash flow with minimal capital investment
? Power plants served are generally well positioned to compete within current environmental regulations
11
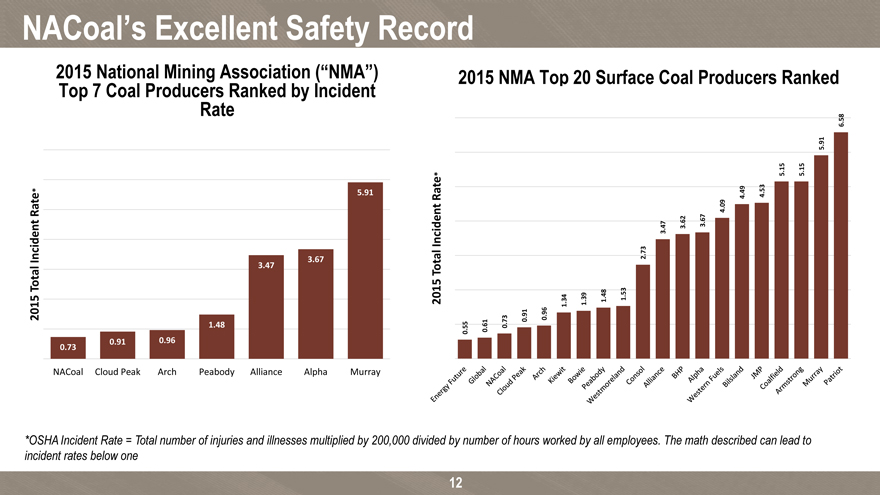
NACoal’s Excellent Safety Record
2015 Top 7 National Coal Producers Mining Association Ranked by Incident (“NMA”) 2015 NMA Top 20 Surface Coal Producers Ranked Rate
. 58 6
. 91 5
1 5 1 5
* 5 . 5 .
* 49 . 53
5.91 Rate 4 . 4
09
Rate 4 .
62 67
47 . 3 . 3
ident Incident 3 .
73
Inc 3.67 2 .
3.47 Total Total
48 . 53
34 39 . 1
2015 . 1 . 1
96 1 2015 . 91 0 .
61 . 73 0
1.48 55 . 0 0 . 0
0.73 0.91 0.96
NACoal Cloud Peak Arch Peabody Alliance Alpha Murray
*OSHA Incident Rate = Total number of injuries and illnesses multiplied by 200,000 divided by number of hours worked by all employees. The math described can lead to incident rates below one
12
Environmental Responsibility
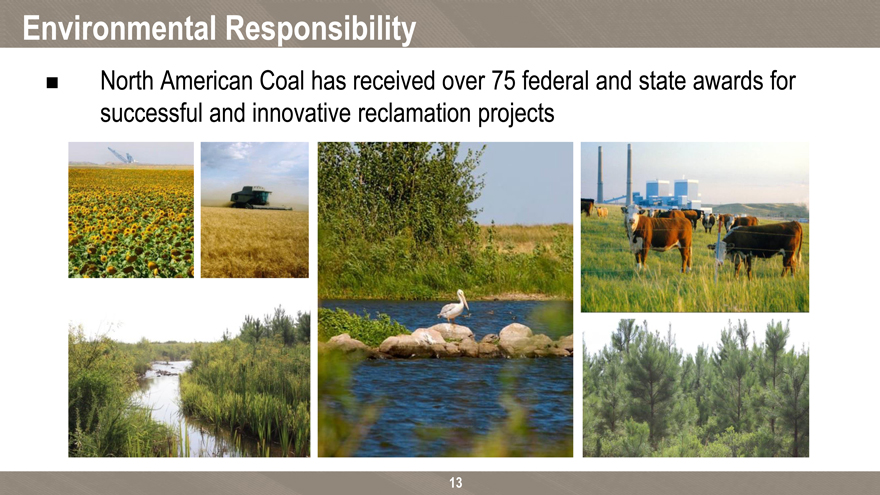
? North American Coal has received over 75 federal and state awards for successful and innovative reclamation projects
13
NACoal Operations
14
Bisti Fuels Company
15
In December 2015, Bisti Fuels Company, LLC, a subsidiary of NACoal, entered into a 15-year, cost-plus Contract Mining Agreement with the Navajo Transitional Energy Company, LLC (“NTEC”)
Bisti will act as NTEC’s contract miner at NTEC’s Navajo Mine, a surface coal mine located within the Navajo Nation near Fruitland, New Mexico
Bisti anticipates it will replace an existing contract miner during the second half of 2016
Annual coal deliveries are expected to be between 5.0 to 6.0 million tons
NTEC provides coal to the third-party owners of the nearby Four Corners Generating Station
Unconsolidated Mines
16
NACoal’s unconsolidated mines operate under long-term cost-plus contracts with their customers
Customer pays 100% of cost of operating the mine
Customer provides, or provides support for, all of the capital required, so little or no NACoal investment
NACoal is paid a modest agreed profit per ton of coal or heating units (btus) delivered
Fees adjust over time with indices which are generally reflective of overall inflation rates
Contracts eliminate exposure to spot coal market price fluctuations
Long-term contracts expiring 2018 – 2055
These mines produce strong cash flow with minimal capital requirements
Unconsolidated Mines (continued)
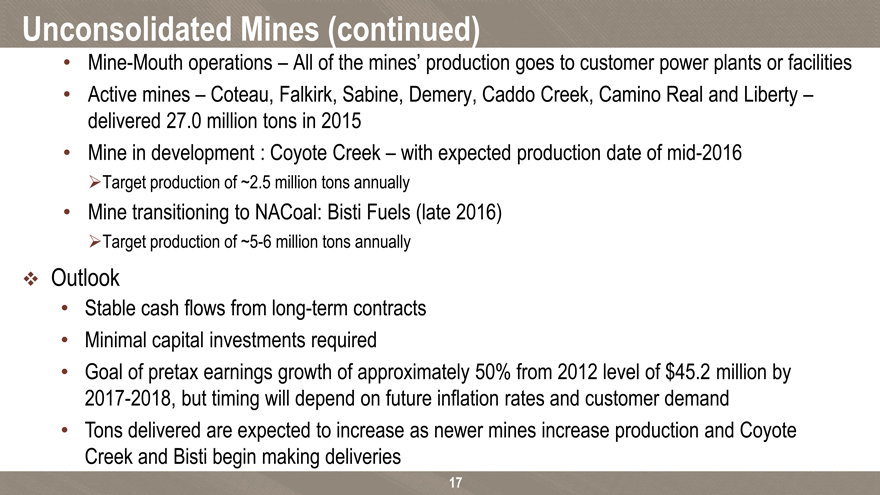
Mine-Mouth operations – All of the mines’ production goes to customer power plants or facilities
Active mines – Coteau, Falkirk, Sabine, Demery, Caddo Creek, Camino Real and Liberty – delivered 27.0 million tons in 2015
Mine in development : Coyote Creek – with expected production date of mid-2016
Target production of ~2.5 million tons annually
Mine transitioning to NACoal: Bisti Fuels (late 2016)
Target production of ~5-6 million tons annually
Outlook
Stable cash flows from long-term contracts
Minimal capital investments required
Goal of pretax earnings growth of approximately 50% from 2012 level of $45.2 million by 2017-2018, but timing will depend on future inflation rates and customer demand
Tons delivered are expected to increase as newer mines increase production and Coyote Creek and Bisti begin making deliveries
17
Consolidated Mine – Mississippi Lignite Mining Company
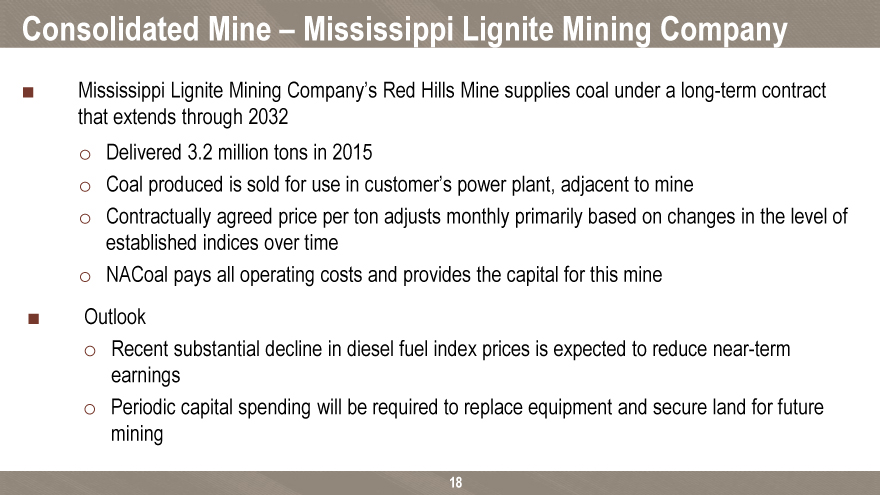
? Mississippi Lignite Mining Company’s Red Hills Mine supplies coal under a long-term contract that extends through 2032 o Delivered 3.2 million tons in 2015 o Coal produced is sold for use in customer’s power plant, adjacent to mine o Contractually agreed price per ton adjusts monthly primarily based on changes in the level of established indices over time o NACoal pays all operating costs and provides the capital for this mine
? Outlook o Recent substantial decline in diesel fuel index prices is expected to reduce near-term earnings o Periodic capital spending will be required to replace equipment and secure land for future mining
18
Value-Added Mining Services and Other Income Sources
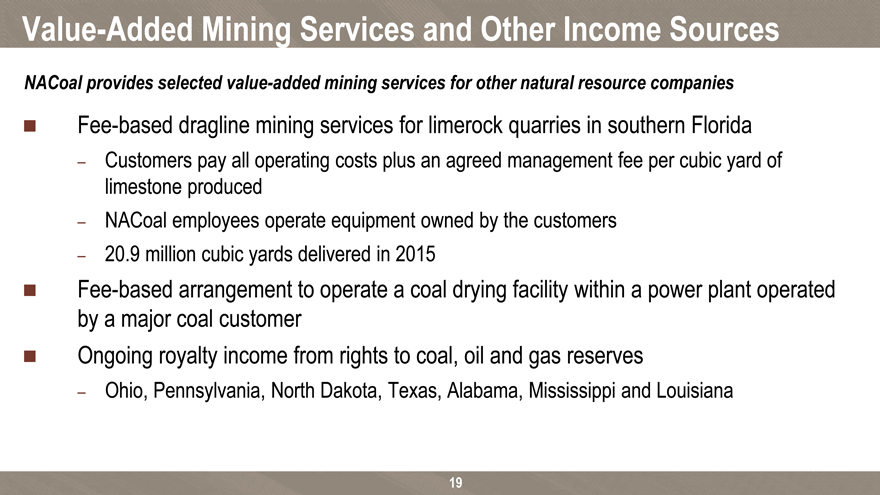
NACoal provides selected value added mining services for other natural resource companies
? Fee-based dragline mining services for limerock quarries in southern Florida
– Customers pay all operating costs plus an agreed management fee per cubic yard of limestone produced
– NACoal employees operate equipment owned by the customers
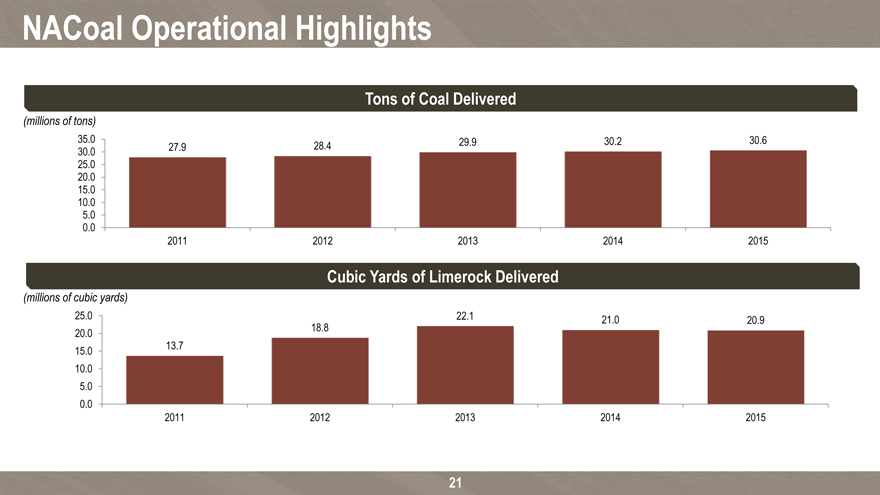
– 20.9 million cubic yards delivered in 2015
? Fee-based arrangement to operate a coal drying facility within a power plant operated by a major coal customer? Ongoing royalty income from rights to coal, oil and gas reserves
– Ohio, Pennsylvania, North Dakota, Texas, Alabama, Mississippi and Louisiana
19
NACoal Key Strategy Overview
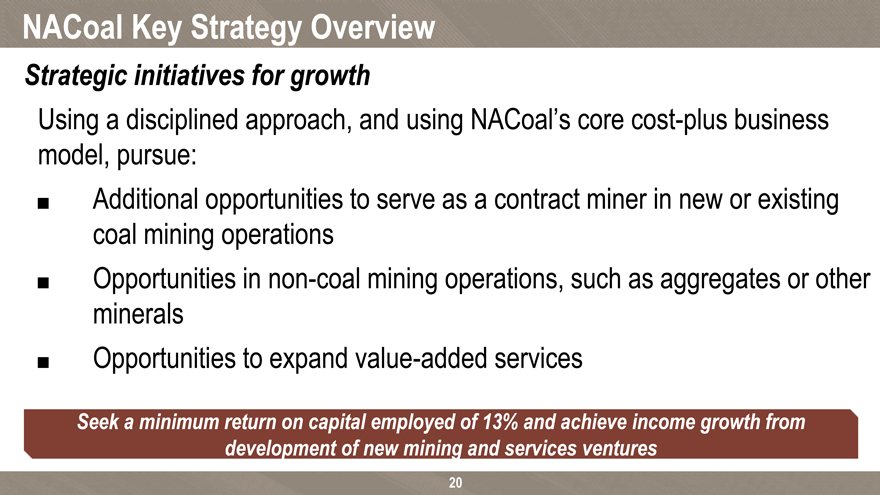
Strategic initiatives for growth
Using a disciplined approach, and using NACoal’s core cost-plus business model, pursue:
? Additional opportunities to serve as a contract miner in new or existing coal mining operations
? Opportunities in non-coal mining operations, such as aggregates or other minerals
? Opportunities to expand value-added services
Seek a minimum return on capital employed of 13% and achieve income growth from development of new mining and services ventures
20
NACoal Operational Highlights
Tons of Coal Delivered
(millions of tons)
35.0 29.9 30.2 30.6
27.9 28.4
30.0
25.0
20.0
15.0
10.0
5.0
0.0
2011 2012 2013 2014 2015
Cubic Yards of Limerock Delivered
(millions of cubic yards)
25.0 22.1 21.0 20.9
18.8
20.0
13.7
15.0
10.0
5.0
0.0
2011 2012 2013 2014 2015
21
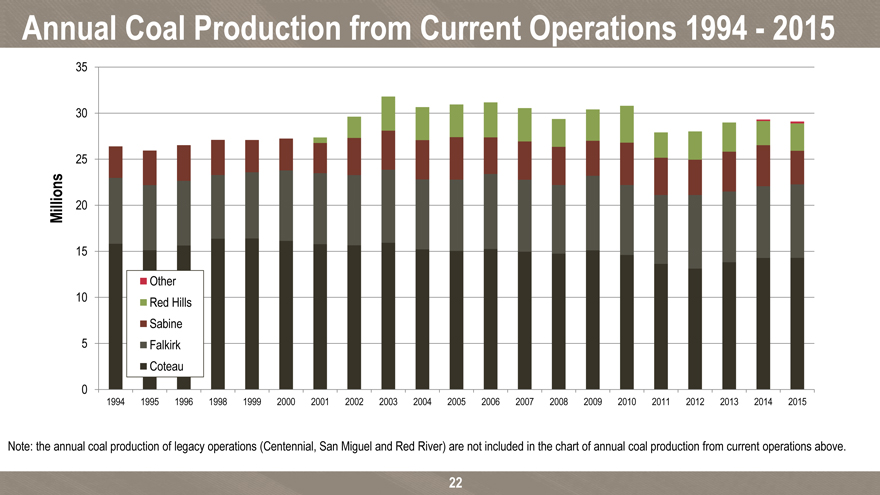
Annual Coal Production from Current Operations 1994—2015
35
30
25
Millions 20
15
Other
10 Red Hills Sabine
5 Falkirk Coteau 0
1994 1995 1996 1998 1999 2000 2001 2002 2003 2004 2005 2006 2007 2008 2009 2010 2011 2012 2013 2014 2015
Note: the annual coal production of legacy operations (Centennial, San Miguel and Red River) are not included in the chart of annual coal production from current operations above.
22
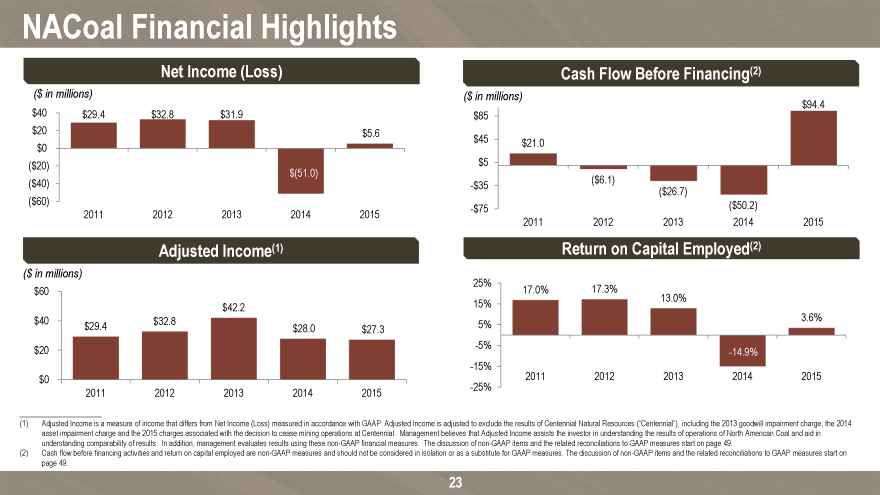
NACoal Financial Highlights
Net Income (Loss) Cash Flow Before Financing(2)
($ in millions) ($ in millions) $94.4
$40 $29.4 $32.8 $31.9 $85
$20 $5.6
$45 $21.0 $0
($20) $(51.0) $5
($40) ($6.1)
-$35
($60) ($26.7)
-$75 ($50.2) 2011 2012 2013 2014 2015
2011 2012 2013 2014 2015
Adjusted Income(1) Return on Capital Employed(2)
($ in millions)
25%
$60 17.0% 17.3%
13.0% $42.2 15%
$40 $32.8 3.6% $29.4 $28.0 $27.3 5%
$20 -5%
-14.9%
-15% 2011 2012 2013 2014 2015 $0 -25% 2011 2012 2013 2014 2015
(1) Adjusted Income is a measure of income (Loss) that differs from Net Income measured in accordance with GAAP. Adjusted Income is adjusted to exclude the results of Centennial Natural Resources (“Centennial”), including the 2013 goodwill impairment charge, the 2014 asset impairment charge and the 2015 charges associated with the decision to cease mining operations at Centennial. Management believes that Adjusted Income assists the investor in understanding the results of operations of North American Coal and aid in understanding comparability of results. In addition, management evaluates results using these non-GAAP financial measures. The discussion of non-GAAP items and the related reconciliations to GAAP measures start on page 49.
(2) Cash flow before financing activities and return on capital employed are non-GAAP measures and should not be considered in isolation or as a substitute for GAAP measures. The discussion of non-GAAP items and the related reconciliations to GAAP measures start on page 49.
23
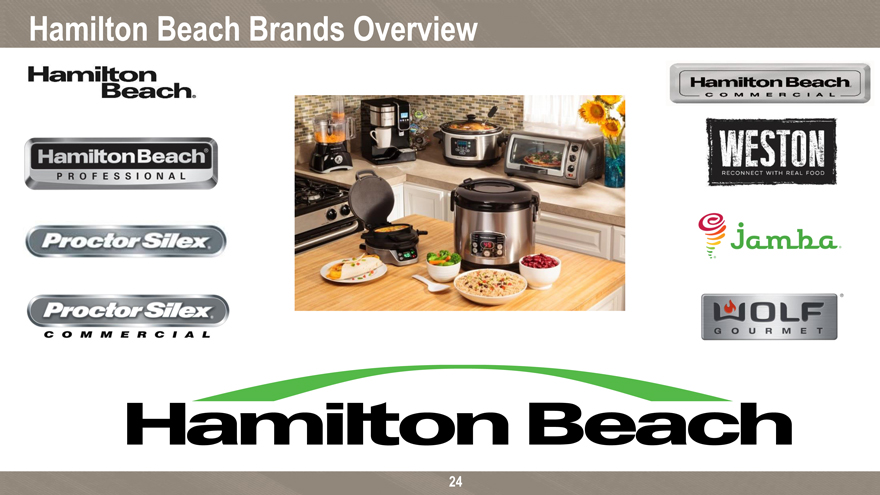
Hamilton Beach Brands Overview
24
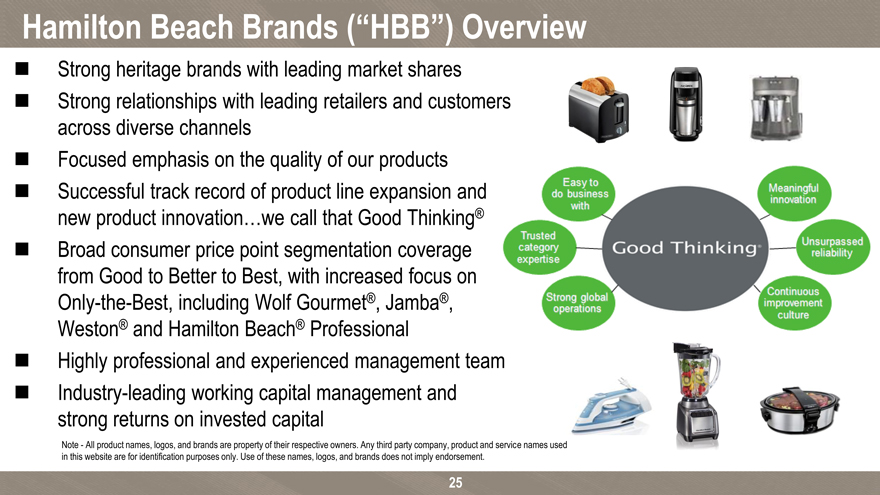
Hamilton Beach Brands (“HBB”) Overview
? Strong heritage brands with leading market shares? Strong relationships with leading retailers and customers across diverse channels? Focused emphasis on the quality of our products ? Successful track record of product line expansion and new product innovation…we call that Good Thinking® ? Broad consumer price point segmentation coverage from Good to Better to Best, with increased focus on Only-the-Best, including Wolf Gourmet®, Jamba®, Weston® and Hamilton Beach® Professional? Highly professional and experienced management team? Industry-leading working capital management and strong returns on invested capital
Note—All product names, logos, and brands are property of their respective owners. Any third party company, product and service names used in this website are for identification purposes only. Use of these names, logos, and brands does not imply endorsement.
25
HBB Business Highlights
? Leading designer, marketer and distributor of: Well-recognized Brands
– Small electric household and specialty housewares appliances
– Commercial products for restaurants, bars and hotels? HBB has a leading retail market share position in North America
– In U.S. & Canada, ranked in top 3 share position in over 25 product categories
– Strong share in Canada, Mexico & Central America
? Powerful heritage brands including Hamilton Beach and Proctor Silex
- HBB has been a critical part of life in America for over 100 years
- New brands, Weston® and Jamba® (licensed) focused on fast-growing food trends
- Hamilton Beach Commercial and Proctor Silex Commercial are expanding globally and have a reputation for durable, quality performance in the demanding commercial products industry
- Wolf Gourmet® (licensed), a premier brand in large appliances is now available in small appliances, cookware and cutlery
* Jamba® is a registered trademark of the Jamba Juice Company
** Wolf Gourmet® is a registered trademark of the Sub-Zero Group, Inc.
26
HBB Business Highlights (continued)
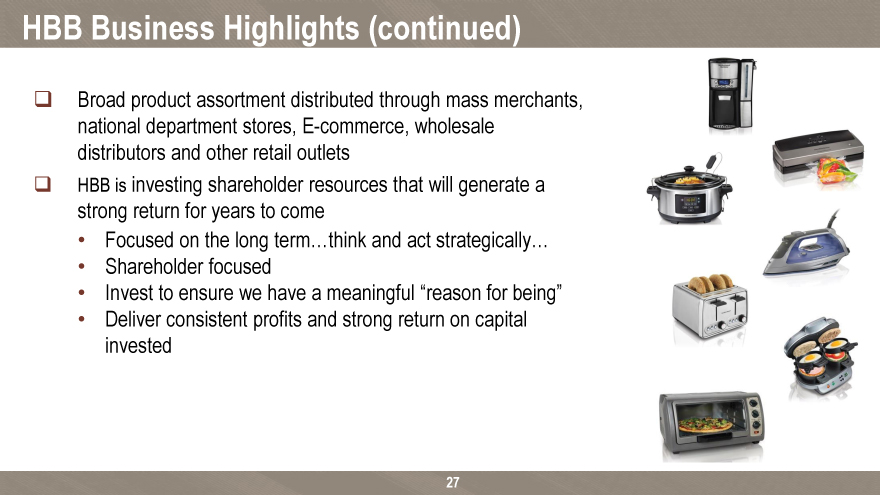
Broad product assortment distributed through mass merchants, national department stores, E-commerce, wholesale distributors and other retail outlets HBB is investing shareholder resources that will generate a strong return for years to come
Focused on the long term…think and act strategically…
Shareholder focused
Invest to ensure we have a meaningful “reason for being”
Deliver consistent profits and strong return on capital invested
27
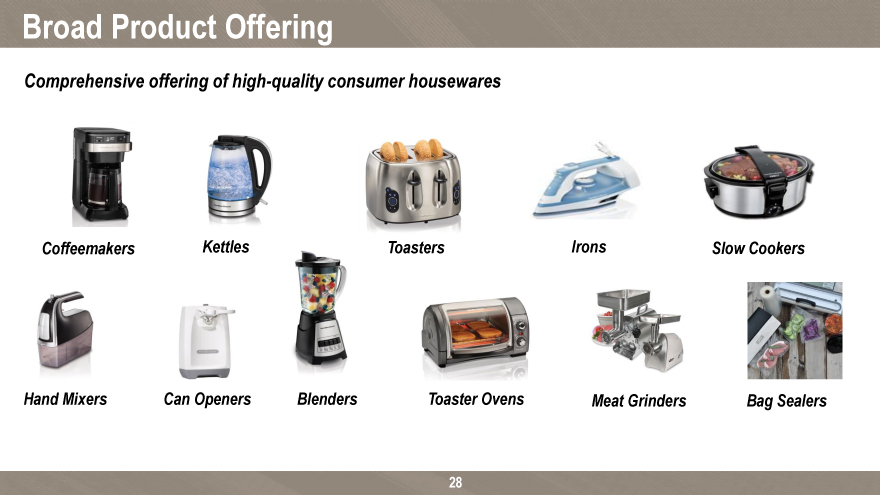
Broad Product Offering
Comprehensive offering of high-quality consumer housewares
Coffeemakers Kettles Toasters Irons Slow Cookers
Hand Mixers Can Openers Blenders Toaster Ovens Meat Grinders Bag Sealers
28
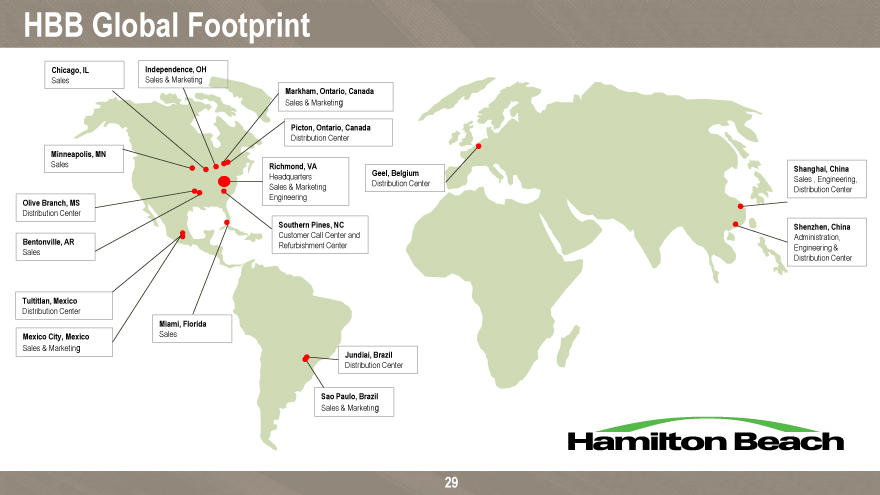
HBB Global Footprint
Chicago, IL Independence, OH
Sales Sales & Marketing
Markham, Ontario, Canada
Sales & Marketing
Picton, Ontario, Canada
Distribution Center
Minneapolis, MN
Sales Richmond, VA
Shanghai, China Headquarters Geel, Belgium
Sales , Engineering, Sales & Marketing Distribution Center Engineering Distribution Center
Olive Branch, MS
Distribution Center
Southern Pines, NC Shenzhen, China
Customer Call Center and Administration, Bentonville, AR Refurbishment Center Engineering & Sales Distribution Center
Tultitlan, Mexico
Distribution Center
Miami, Florida Mexico City, Mexico Sales Sales & Marketing
Jundiai, Brazil
Distribution Center
Sao Paulo, Brazil
Sales & Marketing
29
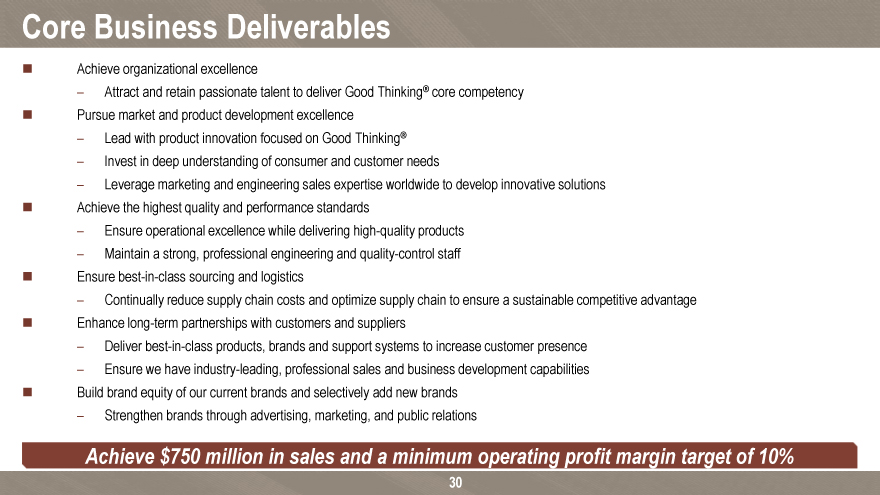
Core Business Deliverables
? Achieve organizational excellence
– Attract and retain passionate talent to deliver Good Thinking® core competency ? Pursue market and product development excellence
– Lead with product innovation focused on Good Thinking®
– Invest in deep understanding of consumer and customer needs
– Leverage marketing and engineering sales expertise worldwide to develop innovative solutions? Achieve the highest quality and performance standards
– Ensure operational excellence while delivering high-quality products
– Maintain a strong, professional engineering and quality-control staff? Ensure best-in-class sourcing and logistics
– Continually reduce supply chain costs and optimize supply chain to ensure a sustainable competitive advantage? Enhance long-term partnerships with customers and suppliers
– Deliver best-in-class products, brands and support systems to increase customer presence
– Ensure we have industry-leading, professional sales and business development capabilities? Build brand equity of our current brands and selectively add new brands
– Strengthen brands through advertising, marketing, and public relations
Achieve $750 million in sales and a minimum operating profit margin target of 10%
30
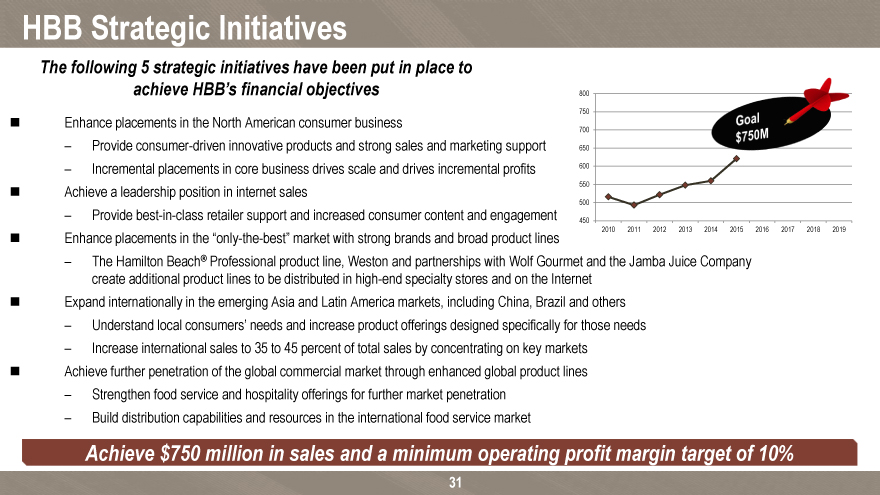
HBB Strategic Initiatives
The following 5 strategic initiatives have been put in place to achieve HBB’s financial objectives 800
? Enhance placements in the North American consumer business 750
700
– Provide consumer-driven innovative products and strong sales and marketing support 650
– Incremental placements in core business drives scale and drives incremental profits 600 Achieve a leadership position in internet 550? sales
500
– Provide best-in-class retailer support and increased consumer content and engagement 450
2010 2011 2012 2013 2014 2015 2016 2017 2018 2019
? Enhance placements in the “only-the-best” market with strong brands and broad product lines
– The Hamilton Beach® Professional product line, Weston and partnerships with Wolf Gourmet and the Jamba Juice Company create additional product lines to be distributed in high-end specialty stores and on the Internet? Expand internationally in the emerging Asia and Latin America markets, including China, Brazil and others
– Understand local consumers’ needs and increase product offerings designed specifically for those needs
– Increase international sales to 35 to 45 percent of total sales by concentrating on key markets? Achieve further penetration of the global commercial market through an enhanced global product lines
– Strengthen food service and hospitality offerings for further market penetration
– Build distribution capabilities and resources in the international food service market
Achieve $750 million in sales and a minimum operating profit margin target of 10%
31
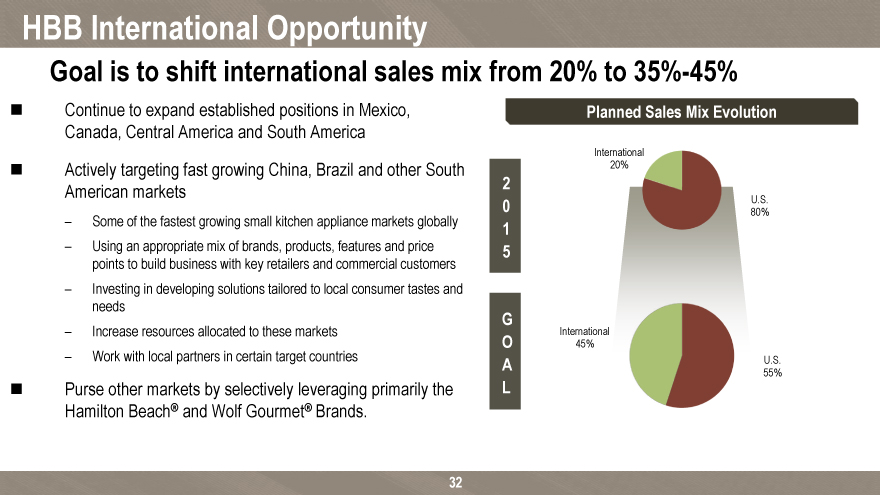
HBB International Opportunity
Goal is to shift international sales mix from 20% to 35%-45%
? Continue to expand established positions in Mexico, Planned Sales Mix Evolution Canada, Central America and South America
International
? Actively targeting fast growing China, Brazil and other South 20% American markets 2
0 U.S. 80%
– Some of the fastest growing small kitchen appliance markets globally 1
– Using an appropriate mix of brands, products, features and price 5 points to build business with key retailers and commercial customers
– Investing in developing solutions tailored to local consumer tastes and needs
G International
Increase resources allocated to these markets
– Work with local partners in certain target countries O 45%
A U.S. 55%
? Purse other markets by selectively leveraging primarily the L Hamilton Beach® and Wolf Gourmet® Brands.
32
Recent Product Launches Support Market Share Gains
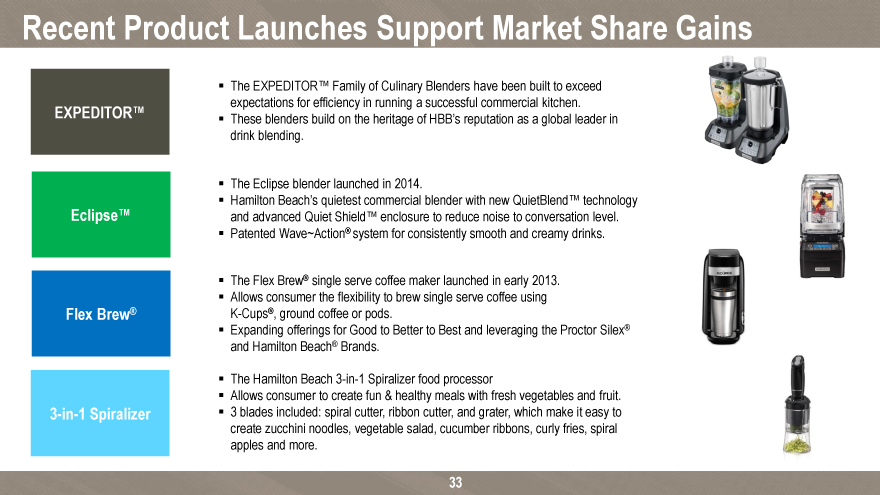
? The EXPEDITOR™ Family of Culinary Blenders have been built to exceed expectations for efficiency in running a successful commercial kitchen
EXPEDITOR™
? These blenders build on the heritage of HBB’s reputation as a global leader in drink XXX blending
? The Eclipse blender launched in 2014
? Hamilton Beach’s quietest commercial blender with new QuietBlend™ technology and
Eclipse™ advanced Quiet Shield™ enclosure to reduce noise to conversation level ? Patented xxx Wave~Action® system for consistently smooth and creamy drinks
? The Flex Brew® single serve coffee maker launched in early 2013 ? Allows consumer the flexibility to brew single serve coffee using Flex Brew® K-Cups®, ground coffee or pods ? Expanding offerings for Good to Better to Best and leveraging the Proctor Silex® and Flex Brew® Hamilton Beach® Brands ? The Hamilton Beach 3-in-1 Spiralizer food processor ? Allows consumer xxx to create fun & healthy meals with fresh vegetables and fruit 3-in-1 Spiralizer ? 3 blades included: spiral cutter, ribbon cutter, and grater, which make it easy to create zucchini noodles, vegetable salad, cucumber ribbons, curly fries, spiral apples and more
xxx
33
Recent Product Launches Support Market Share Gains (continued)
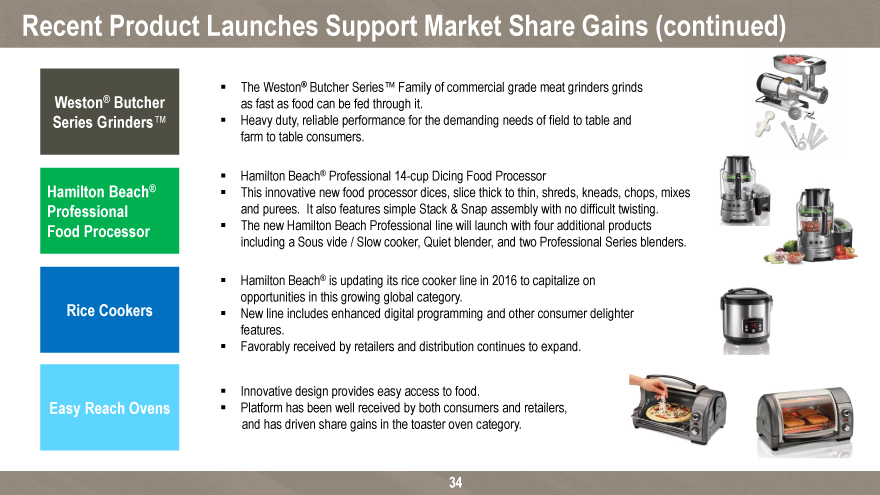
Weston® ? The Weston® Butcher Series™ Family of commercial grade meat grinders grinds as fast as food can be fed through it
Butcher Series
Grinders™ ? Heavy duty, reliable performance for the demanding needs of XXXfield to table and farm to table consumers.
? Hamilton Beach® Professional 14 Cup Dicing Food Processor ? This innovative new food processor dices, slice thick to thin, shreds, kneads, chops, mixes and
Hamilton Beach®
purees. It also features simple Stack & Snap assembly with no difficult twisting. Professional ? Hamilton Beach® Professional is a new sub-brand launching in 2016. Inspired by HBB’s commercial heritage, Hamilton Beach® Professional brings Good Thinking to the kitchens of Food Processor accomplished home cooks. xxx? The new Hamilton Beach Professional line will launch with four additional products including a Sous vide // Slow cooker, Quiet blender, and two Professional Series blenders.
? HBB is updating its rice cooker line in 2016 to capitalize on opportunities in this growing global category Rice Cookers ? New line includes enhanced digital programming and other consumer delighter features.
Brew®? Favorably received by retailers and distribution continues to expand.
? Innovative design provides easy access to food. Easy Reach ? Platform has been well received by both consumers and Ovens retailers, and xxx has driven share gains in the toaster oven category.
xxx
34
HBB Financial Highlights
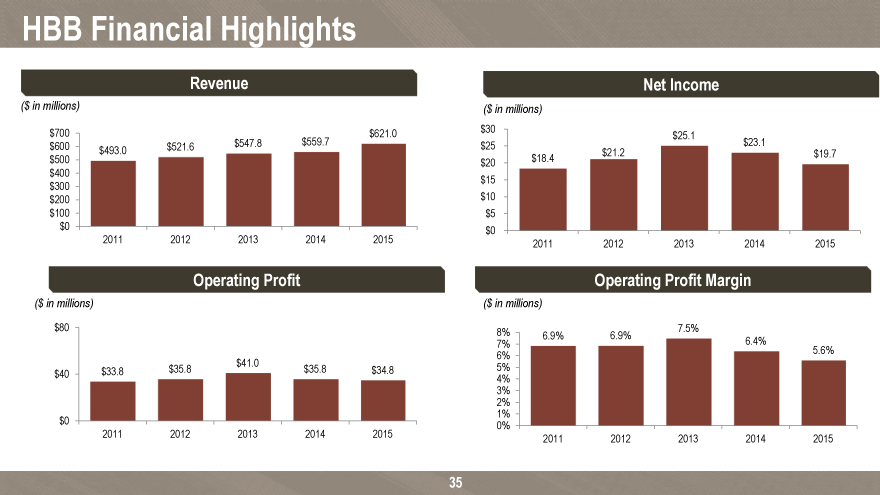
Revenue Net Income
($ in millions) ($ in millions) $700 $621.0 $30
$25.1 $600 $521.6 $547.8 $559.7 $25 $23.1 $493.0 $21.2 $19.7 $500 $20 $18.4 $400 $15 $300 $10 $200 $100 $5
$0 $0
2011 2012 2013 2014 2015 2011 2012 2013 2014 2015
Operating Profit Operating Profit Margin
($ in millions) ($ in millions)
$80 8% 7.5%
6.9% 6.9%
7% 6.4%
5.6% 6%
$41.0 5%
$33.8 $35.8 $35.8 $34.8
$40 4% 3% 2% 1%
$0 0%
2011 2012 2013 2014 2015 2011 2012 2013 2014 2015
35
HBB Financial Highlights (continued)
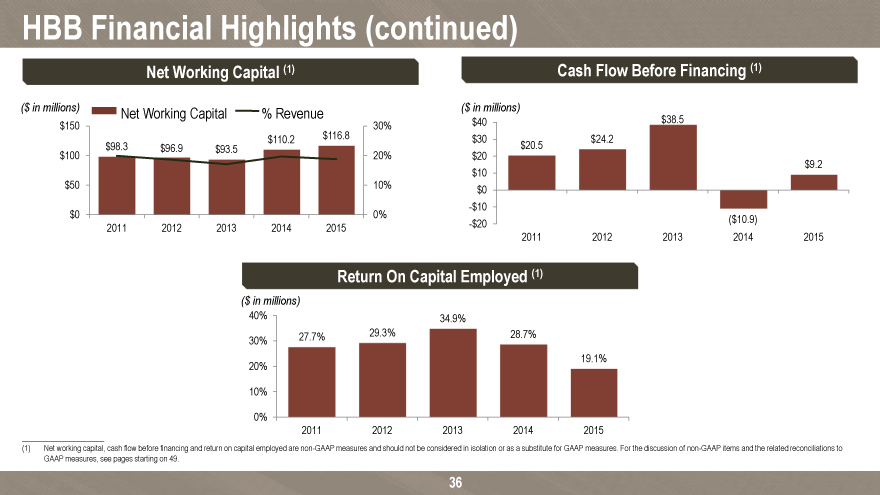
Net Working Capital (1) Cash Flow Before Financing (1)
($ in millions) Net Working Capital % Revenue ($ in millions)
$40 $38.5 $150 30% $110.2 $116.8 $30 $24.2 $100 $98.3 $96.9 $93.5 20% $20.5 $20
$9.2 $10
$50 10% $0
-$10
$0 0% ($10.9) 2011 2012 2013 2014 2015 -$20
2011 2012 2013 2014 2015
Return On Capital Employed (1)
($ in millions)
40% 34.9%
27.7% 29.3% 28.7% 30%
19.1% 20%
10%
0%
2011 2012 2013 2014 2015
(1) Net working capital, cash flow before financing and return on capital employed are non-GAAP measures and should not be considered in isolation or as a substitute for GAAP measures. For the discussion of non-GAAP items and the related reconciliations to GAAP measures, see pages starting on 49.
36
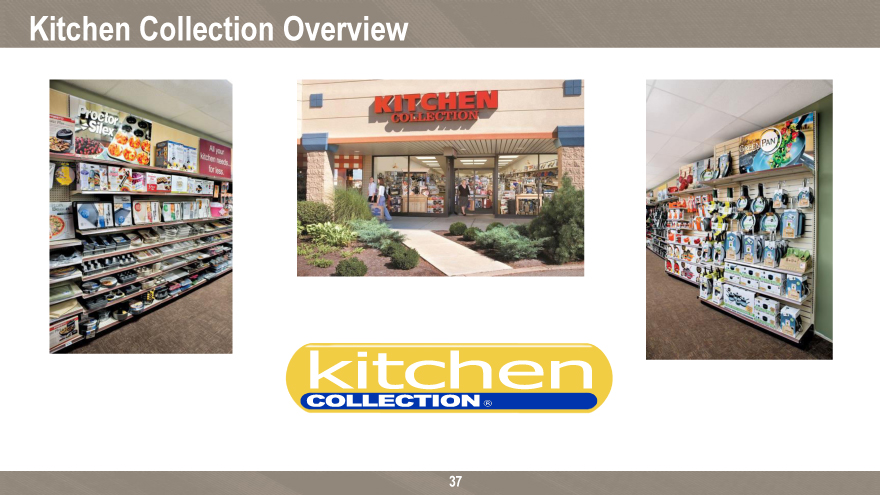
Kitchen Collection Overview
37
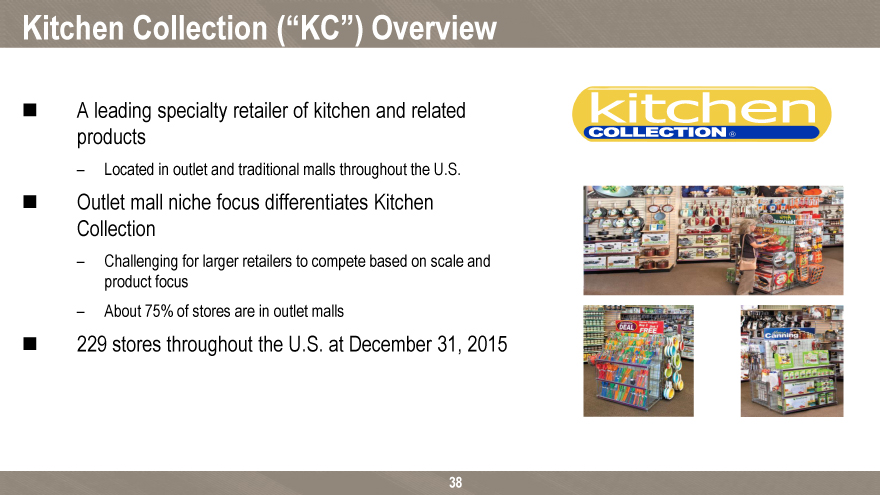
Kitchen Collection (“KC”) Overview
? A leading specialty retailer of kitchen and related products
– Located in outlet and traditional malls throughout the U.S.
? Outlet mall niche focus differentiates Kitchen Collection
– Challenging for larger retailers to compete based on scale and product focus
– About 75% of stores are in outlet malls
? 229 stores throughout the U.S. at December 31, 2015
38
Kitchen Collection Locations
39
KC Business Highlights
Strong core store format
– Focus on outlet segment
– Continue to optimize store portfolio with stores in high-traffic locations in strong outlet malls? Significant progress made implementing strategic plan over the past few years Store rationalization plan that included closing underperforming stores
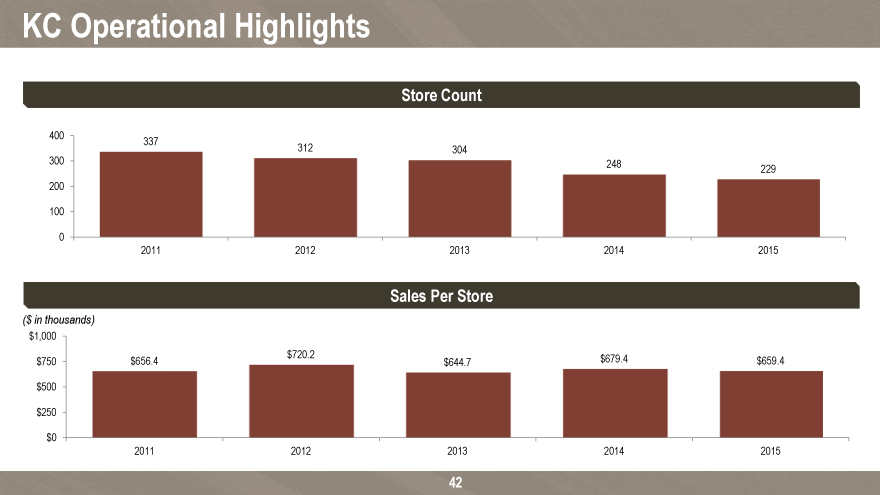
Number of stores reduced from 337 at 12/31/11 to 229 at 12/31/15
Total “go forward” count projected to be approximately 220 stores
Reduced home office and distribution center costs
– Implemented the “KC Bright” store refresh initiative
– Improved inventory control and gross margin performance
– Ongoing merchandising improvement focus
40
KC Key Strategy Overview
KC is dealing with a difficult environment and evolving aggressively in a constructive manner KC is focused on comparable store sales growth o Enhancing customers’ store experience through improved customer interactions to generate greater average sale transaction size o Working to enhance sales volume and profitability by improving closure rates through continued refinement of product offerings, merchandise mix and store displays and appearances Selectively open new Kitchen Collection® stores in strong outlet malls in well-positioned locations Continue focus on profit and cash flow improvement areas o Emphasis on increasing sales of higher-margin products o Maintain inventory efficiency and store inventory controls o Use of highly analytical merchandising skills and disciplined operating controls to improve gross margin performance
Achieve a minimum operating profit margin target of 5%
41
KC Operational Highlights
Store Count
400
337
312 304
300 248
229 200
100
0
2011 2012 2013 2014 2015
Sales Per Store
($ in thousands) $1,000 $720.2 $679.4 $750 $656.4 $644.7 $659.4 $500
$250
$0
2011 2012 2013 2014 2015
42
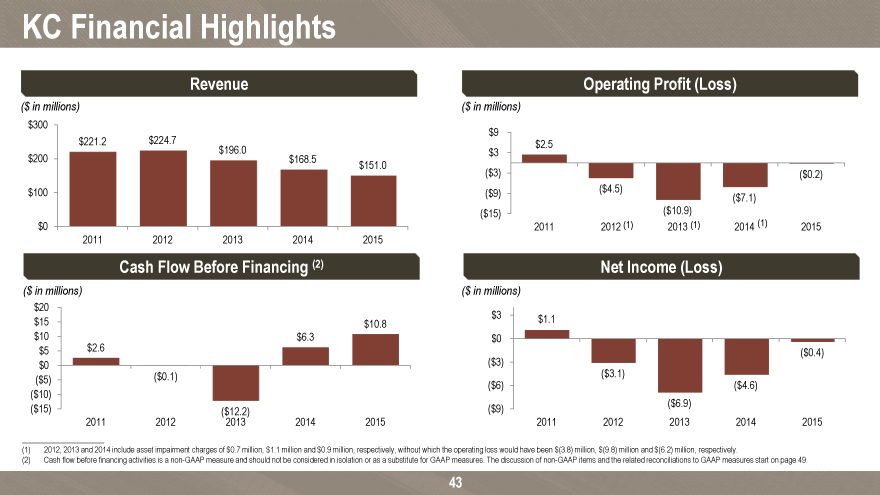
KC Financial Highlights
($ in millions) ($ in millions) $300 $9 $221.2 $224.7 $2.5 $196.0 $3 $200 $168.5 $151.0
($3) ($0.2) $100 ($9) ($4.5)
($7.1)
($15) ($10.9)
$0 2011 2012 (1) 2013 (1) 2014 (1) 2015 2011 2012 2013 2014 2015
Cash Flow Before Financing (2) Net Income (Loss)
($ in millions) ($ in millions) $20
$3 $1.1
$15 $10.8
$10 $6.3 $0
$5 $2.6 ($0.4)
$0 ($3)
($0.1) ($3.1)
($5)
($6) ($4.6)
($10)
($6.9)
($15) ($12.2) ($9)
2011 2012 2013 2014 2015 2011 2012 2013 2014 2015
(1) 2012, 2013 and 2014 include asset impairment charges of $0.7 million, $1.1 million and $0.9 million, respectively, without which the operating loss would have been $(3.8) million, $(9.8) million and $(6.2) million, respectively.
(2) Cash flow before financing activities is a non-GAAP measure and should not be considered in isolation or as a substitute for GAAP measures. The discussion of non-GAAP items and the related reconciliations to GAAP measures start on page 49.
43
NACCO Industries Financial Update
44
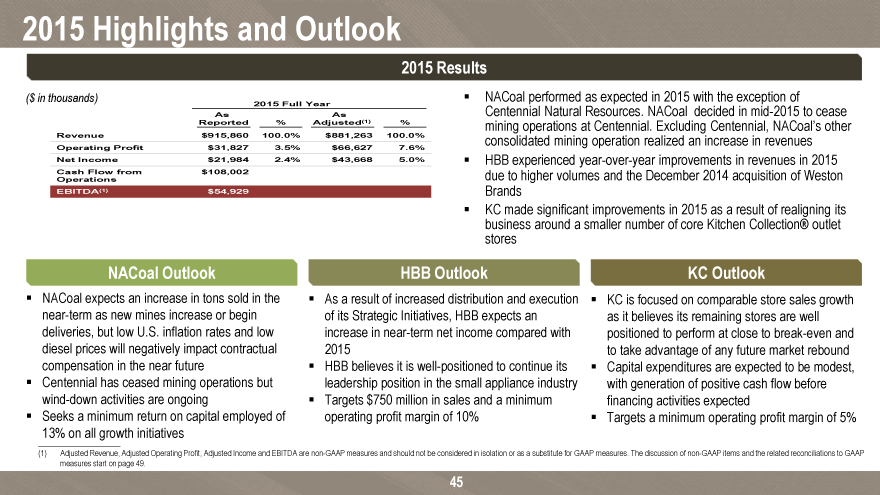
2015 Highlights and Outlook
2015 Results
($ in thousands)? NACoal performed as expected in 2015 with the exception of
2015 Full Year Centennial Natural Resources. NACoal decided in mid-2015 to cease
As As
Reported % Adjusted(1) % mining operations at Centennial. Excluding Centennial, NACoal’s other Revenue $915,860 100.0% $881,263 100.0% consolidated mining operation realized an increase in revenues
Operating Profit $31,827 3.5% $66,627 7.6%
Net Income $21,984 2.4% $43,668 5.0% ? HBB experienced year-over-year improvements in revenues in 2015 Cash Flow from $108,002 due to higher volumes and the December 2014 acquisition of Weston
Operations
EBITDA(1) $54,929 Brands
? KC made significant improvements in 2015 as a result of realigning its business around a smaller number of core Kitchen Collection® outlet stores
NACoal Outlook HBB Outlook KC Outlook
? NACoal expects an increase in tons sold in the ? As a result of increased distribution and execution ? KC is focused on comparable store sales growth near-term as new mines increase or begin of its Strategic Initiatives, HBB expects an as it believes its remaining stores are well deliveries, but low U.S. inflation rates and low increase in near-term net income compared with positioned to perform at close to break-even and diesel prices will negatively impact contractual 2015 to take advantage of any future market rebound compensation in the near future? HBB believes it is well-positioned to continue its ? Capital expenditures are expected to be modest, ? Centennial has ceased mining operations but leadership position in the small appliance industry with generation of positive cash flow before wind-down activities are ongoing? Targets $750 million in sales and a minimum financing activities expected? Seeks a minimum return on capital employed of operating profit margin of 10%? Targets a minimum operating profit margin of 5% 13% on all growth initiatives
(1) Adjusted Revenue, Adjusted Operating Profit, Adjusted Income and EBITDA are non-GAAP measures and should not be considered in isolation or as a substitute for GAAP measures. The discussion of non-GAAP items and the related reconciliations to GAAP measures start on page 49.
45
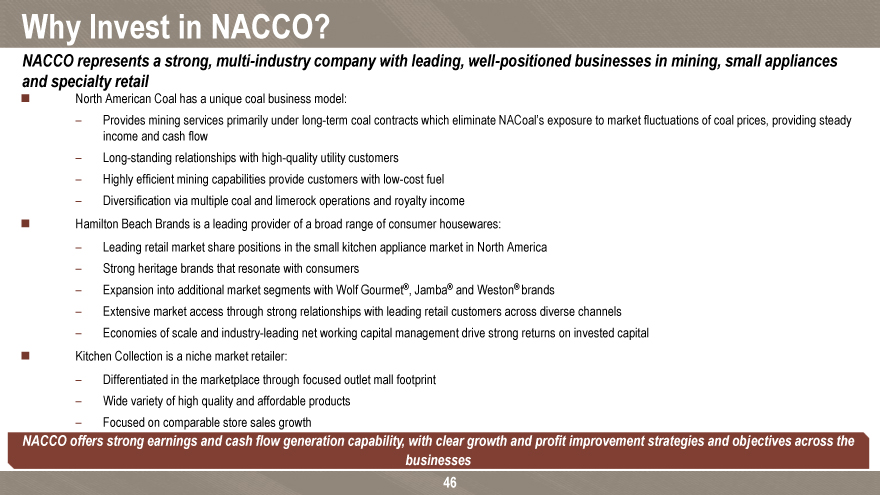
Why Invest in NACCO?
NACCO represents a strong, multi-industry company with leading, well-positioned businesses in mining, small appliances and specialty retail
? North American Coal has a unique coal business model:
– Provides mining services primarily under long-term coal contracts which eliminate NACoal’s exposure to market fluctuations of coal prices, providing steady income and cash flow
– Long-standing relationships with high-quality utility customers
– Highly efficient mining capabilities provide customers with low-cost fuel
– Diversification via multiple coal and limerock operations and royalty income? Hamilton Beach Brands is a leading provider of a broad range of consumer housewares:
Leading retail market share positions in the small kitchen appliance market in North America
– Strong heritage brands that resonate with consumers
– Expansion into additional market segments with Wolf Gourmet®, Jamba® and Weston® brands
– Extensive market access through strong relationships with leading retail customers across diverse channels
– Economies of scale and industry-leading net working capital management drive strong returns on invested capital? Kitchen Collection is a niche market retailer:
– Differentiated in the marketplace through focused outlet mall footprint
– Wide variety of high quality and affordable products
– Focused on comparable store sales growth
NACCO offers strong earnings and cash flow generation capability, with clear growth and profit improvement strategies and objectives across the businesses
46
Appendix
47
Risk Factors
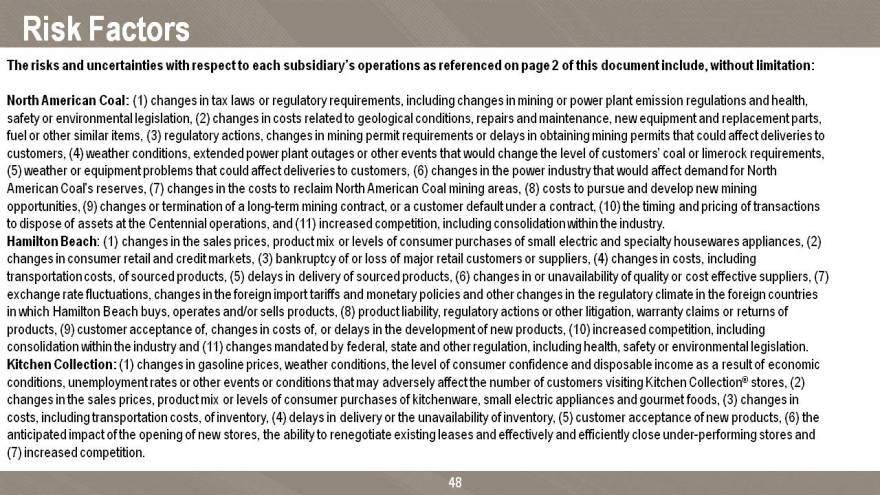
The risks and uncertainties with respect to each subsidiary’s operations as referenced on page 2 of this document include, without limitation:
North American Coal: (1) changes in tax laws or regulatory requirements, including changes in mining or power plant emission regulations and health, safety or environmental legislation, (2) changes in costs related to geological conditions, repairs and maintenance, new equipment and replacement parts, fuel or other similar items, (3) regulatory actions, changes in mining permit requirements or delays in obtaining mining permits that could affect deliveries to customers, (4) weather conditions, extended power plant outages or other events that would change the level of customers’ coal or limerock requirements, (5) weather or equipment problems that could affect deliveries to customers, (6) changes in the power industry that would affect demand for North American Coal’s reserves, (7) changes in the costs to reclaim North American Coal mining areas, (8) costs to pursue and develop new mining opportunities, (9) changes or termination of a long-term mining contract, or a customer default under a contract, (10) the timing and pricing of transactions to dispose of assets at the Centennial operations, and (11) increased competition, including consolidation within the industry.
Hamilton Beach: (1) changes in the sales prices, product mix or levels of consumer purchases of small electric and specialty housewares appliances, (2) changes in consumer retail and credit markets, (3) bankruptcy of or loss of major retail customers or suppliers, (4) changes in costs, including transportation costs, of sourced products, (5) delays in delivery of sourced products, (6) changes in or unavailability of quality or cost effective suppliers, (7) exchange rate fluctuations, changes in the foreign import tariffs and monetary policies and other changes in the regulatory climate in the foreign countries in which Hamilton Beach buys, operates and/or sells products, (8) product liability, regulatory actions or other litigation, warranty claims or returns of products, (9) customer acceptance of, changes in costs of, or delays in the development of new products, (10) increased competition, including consolidation within the industry and (11) changes mandated by federal, state and other regulation, including health, safety or environmental legislation. Kitchen Collection: (1) changes in gasoline prices, weather conditions, the level of consumer confidence and disposable income as a result of economic conditions, unemployment rates or other events or conditions that may adversely affect the number of customers visiting Kitchen Collection® stores, (2) changes in the sales prices, product mix or levels of consumer purchases of kitchenware, small electric appliances and gourmet foods, (3) changes in costs, including transportation costs, of inventory, (4) delays in delivery or the unavailability of inventory, (5) customer acceptance of new products, (6) the anticipated impact of the opening of new stores, the ability to renegotiate existing leases and effectively and efficiently close under-performing stores and (7) increased competition.
48
Non-GAAP Disclosure
49
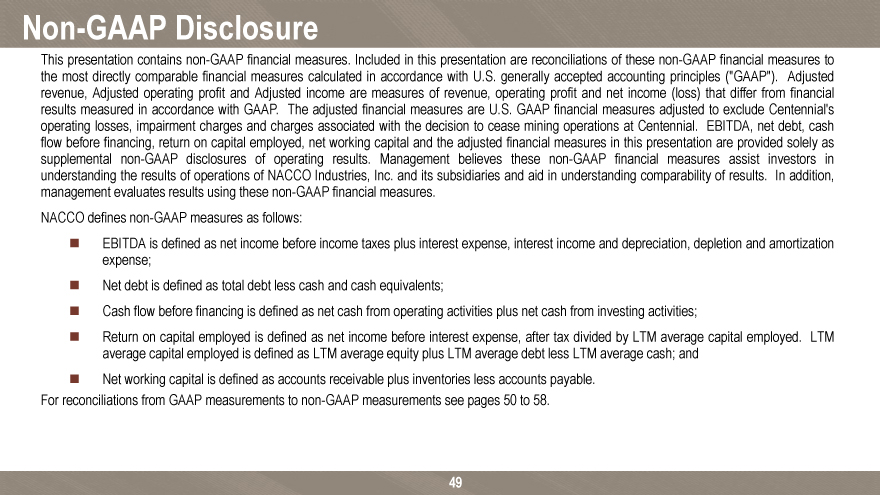
This presentation contains non-GAAP financial measures. Included in this presentation are reconciliations of these non-GAAP financial measures to the most directly comparable financial measures calculated in accordance with U.S. generally accepted accounting principles (“GAAP”). Adjusted revenue, Adjusted operating profit and Adjusted income are measures of revenue, operating profit and net income (loss) that differ from financial results measured in accordance with GAAP. The adjusted financial measures are U.S. GAAP financial measures adjusted to exclude Centennial’s operating losses, impairment charges and charges associated with the decision to cease mining operations at Centennial. EBITDA, net debt, cash flow before financing, return on capital employed, net working capital and the adjusted financial measures in this presentation are provided solely as supplemental non-GAAP disclosures of operating results. Management believes these non-GAAP financial measures assist investors in understanding the results of operations of NACCO Industries, Inc. and its subsidiaries and aid in understanding comparability of results. In addition, management evaluates results using these non-GAAP financial measures. NACCO defines non-GAAP measures as follows:
EBITDA is defined as net income before income taxes plus interest expense, interest income and depreciation, depletion and amortization expense;
Net debt is defined as total debt less cash and cash equivalents;
Cash flow before financing is defined as net cash from operating activities plus net cash from investing activities;
Return on capital employed is defined as net income before interest expense, after tax divided by LTM average capital employed. LTM average capital employed is defined as LTM average equity plus LTM average debt less LTM average cash; and
Net working capital is defined as accounts receivable plus inventories less accounts payable. For reconciliations from GAAP measurements to non-GAAP measurements see pages 50 to 58.
Non-GAAP Reconciliations
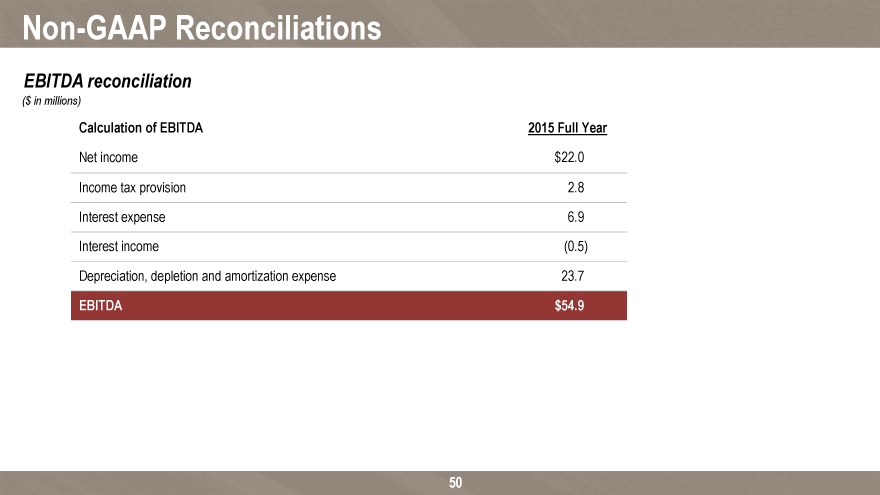
EBITDA reconciliation
($ in millions)
Calculation of EBITDA 2015 Full Year
Net income $22.0
Income tax provision 2.8 Interest expense 6.9 Interest income (0.5) Depreciation, depletion and amortization expense 23.7
EBITDA $54.9
50
Non-GAAP Reconciliations (continued)
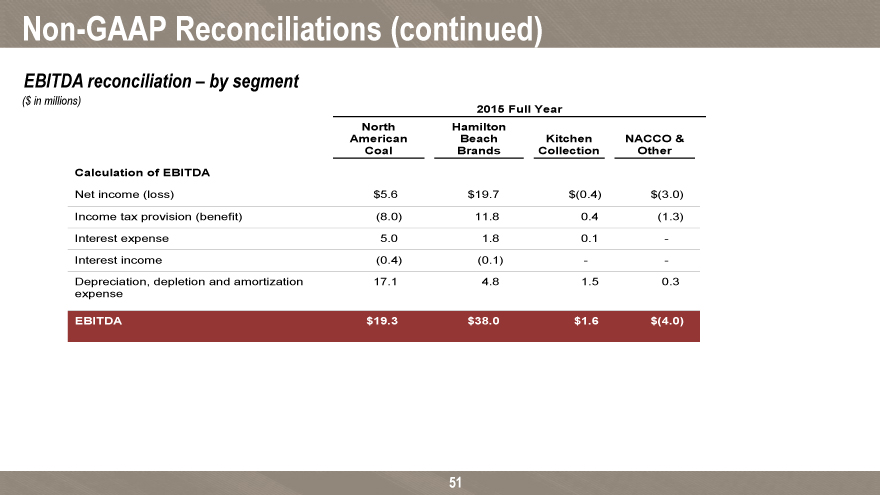
EBITDA reconciliation – by segment
($ in millions)
2015 Full Year North Hamilton
American Beach Kitchen NACCO & Coal Brands Collection Other Calculation of EBITDA
Net income (loss) $5.6 $19.7 $(0.4) $(3.0) Income tax provision (benefit) (8.0) 11.8 0.4 (1.3) Interest expense 5.0 1.8 0.1—Interest income (0.4) (0.1) —
Depreciation, depletion and amortization 17.1 4.8 1.5 0.3 expense
EBITDA $19.3 $38.0 $1.6 $(4.0)
51
Non-GAAP Reconciliations (continued)
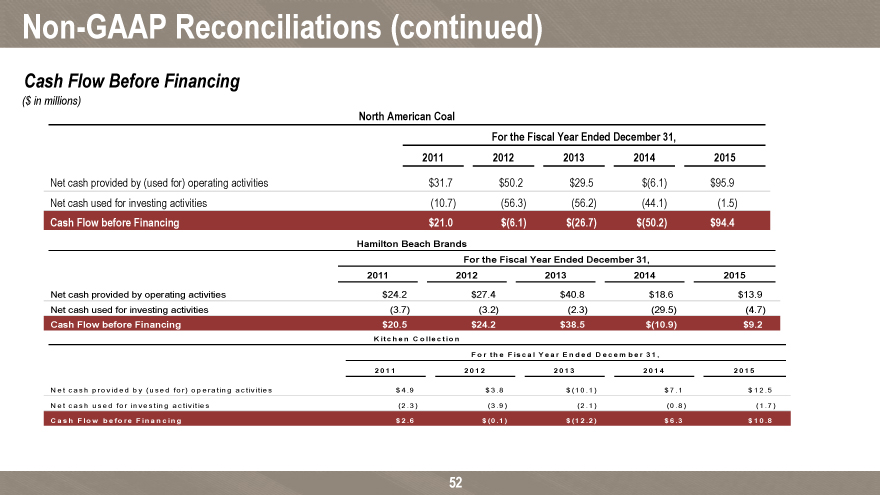
Cash Flow Before Financing
($ in millions)
North American Coal
For the Fiscal Year Ended December 31,
2011 2012 2013 2014 2015
Net cash provided by (used for) operating activities $31.7 $50.2 $29.5 $(6.1) $95.9 Net cash used for investing activities (10.7) (56.3) (56.2) (44.1) (1.5)
Cash Flow before Financing $21.0 $(6.1) $(26.7) $(50.2) $94.4
Hamilton Beach Brands
For the Fiscal Year Ended December 31,
2011 2012 2013 2014 2015
Net cash provided by operating activities $24.2 $27.4 $40.8 $18.6 $13.9 Net cash used for investing activities (3.7) (3.2) (2.3) (29.5) (4.7)
Cash Flow before Financing $20.5 $24.2 $38.5 $(10.9) $9.2
K itc he n C o lle c tio n
F o r th e F is c a l Y e a r E n d e d D e c e m b e r 3 1 ,
2 0 1 1 2 0 1 2 2 0 1 3 2 0 1 4 2 0 1 5
N e t c a s h p ro v id e d b y (u s e d fo r) o p e ra tin g a c tiv itie s $ 4 .9 $ 3 .8 $ (1 0 .1 ) $ 7 .1 $ 1 2 .5 N e t c a s h u s e d fo r in v e s tin g a c tiv itie s (2 .3 ) (3 ..9 ) (2 .1 ) (0 .8 ) (1 .7 )
C a s h F lo w b e fo re F in a n c in g $ 2 .6 $ (0 .1 ) $ (1 2 .2 ) $ 6 .3 $ 1 0 .8
52
Non-GAAP Reconciliations (continued)
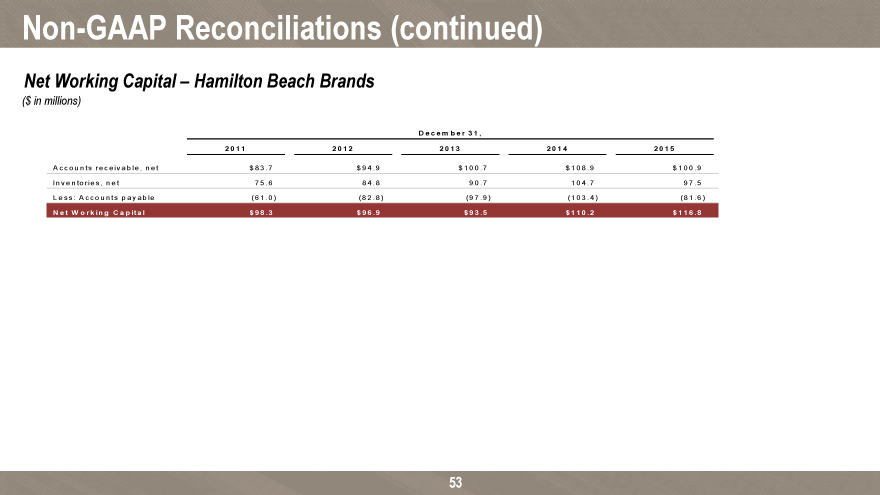
Net Working Capital – Hamilton Beach Brands
($ in millions)
D e c e m b e r 3 1 ,
2 0 1 1 2 0 1 2 2 0 1 3 2 0 1 4 2 0 1 5
A c c o u n ts re c e iv a b le , n e t $ 8 3 .7 $ 9 4 .9 $ 1 0 0 .7 $ 1 0 8 .9 $ 1 0 0 .9 In v e n to rie s , n e t 7 5 .6 8 4 .8 9 0 .7 1 0 4 .7 9 7 .5 L e s s : A c c o u n ts p a y a b le (6 1 .0 ) (8 2 .8 ) (9 7 .9 ) (1 0 3 .4 ) (8 1 .6 )
N e t W o rk in g C a p ita l $ 9 8 .3 $ 9 6 .9 $ 9 3 .5 $ 1 1 0 .2 $ 1 1 6 .8
53
Non-GAAP Reconciliations (continued)
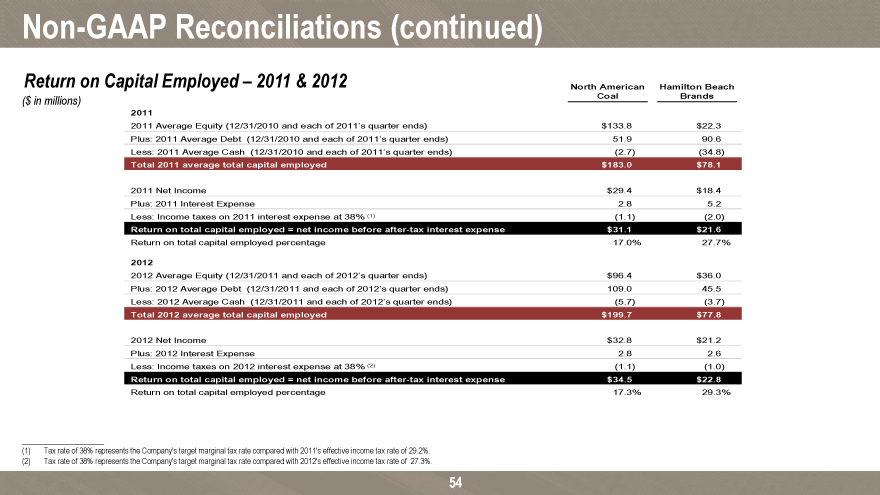
Return on Capital Employed – 2011 & 2012 North American Hamilton Beach
($ in millions) Coal Brands
2011
2011 Average Equity (12/31/2010 and each of 2011’s quarter ends) $133.8 $22.3 Plus: 2011 Average Debt (12/31/2010 and each of 2011’s quarter ends) 51.9 90.6 Less: 2011 Average Cash (12/31/2010 and each of 2011’s quarter ends) (2.7) (34.8)
Total 2011 average total capital employed $183.0 $78.1
2011 Net Income $29.4 $18.4 Plus: 2011 Interest Expense 2.8 5.2 Less: Income taxes on 2011 interest expense at 38% (1) (1.1) (2.0)
Return on total capital employed = net income before after-tax interest expense $31.1 $21.6
Return on total capital employed percentage 17.0% 27.7%
2012
2012 Average Equity (12/31/2011 and each of 2012’s quarter ends) $96.4 $36.0 Plus: 2012 Average Debt (12/31/2011 and each of 2012’s quarter ends) 109.0 45.5 Less: 2012 Average Cash (12/31/2011 and each of 2012’s quarter ends) (5.7) (3.7)
Total 2012 average total capital employed $199.7 $77.8
2012 Net Income $32.8 $21.2 Plus: 2012 Interest Expense 2.8 2.6 Less: Income taxes on 2012 interest expense at 38% (2) (1.1) (1.0)
Return on total capital employed = net income before after-tax interest expense $34.5 $22.8
Return on total capital employed percentage 17.3% 29.3%
(1) Tax rate of 38% represents the Company’s target marginal tax rate compared with 2011’s effective income tax rate of 29.2%. (2) Tax rate of 38% represents the Company’s target marginal tax rate compared with 2012’s effective income tax rate of 27.3%.
54
Non-GAAP Reconciliations (continued)
North Hamilton American Beach
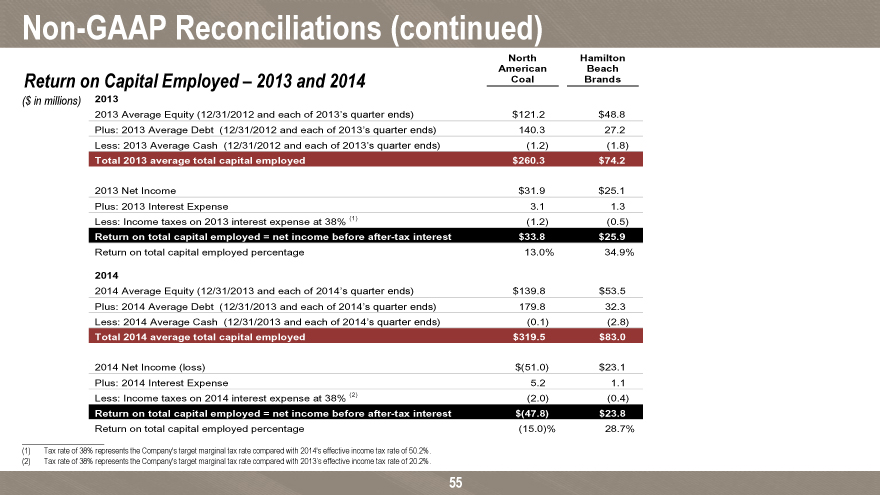
Return on Capital Employed – 2013 and 2014 Coal Brands
($ in millions) 2013
2013 Average Equity (12/31/2012 and each of 2013’s quarter ends) $121.2 $48.8 Plus: 2013 Average Debt (12/31/2012 and each of 2013’s quarter ends) 140.3 27.2 Less: 2013 Average Cash (12/31/2012 and each of 2013’s quarter ends) (1.2) (1.8)
Total 2013 average total capital employed $260.3 $74.2
2013 Net Income $31.9 $25.1 Plus: 2013 Interest Expense 3.1 1.3 Less: Income taxes on 2013 interest expense at 38% (1) (1.2) (0.5)
Return on total capital employed = net income before after-tax interest $33.8 $25.9
Return on total capital employed percentage 13.0% 34.9%
2014
2014 Average Equity (12/31/2013 and each of 2014’s quarter ends) $139.8 $53.5 Plus: 2014 Average Debt (12/31/2013 and each of 2014’s quarter ends) 179.8 32.3 Less: 2014 Average Cash (12/31/2013 and each of 2014’s quarter ends) (0.1) (2.8)
Total 2014 average total capital employed $319.5 $83.0
2014 Net Income (loss) $(51.0) $23.1 Plus: 2014 Interest Expense 5.2 1.1 Less: Income taxes on 2014 interest expense at 38% (2) (2.0) (0.4)
Return on total capital employed = net income before after-tax interest $(47.8) $23.8
Return on total capital employed percentage (15.0)% 28.7%
(1) Tax rate of 38% represents the Company’s target marginal tax rate compared with 2014’s effective income tax rate of 50.2%. (2) Tax rate of 38% represents the Company’s target marginal tax rate compared with 2013’s effective income tax rate of 20.2%.
55
Non-GAAP Reconciliations (continued)
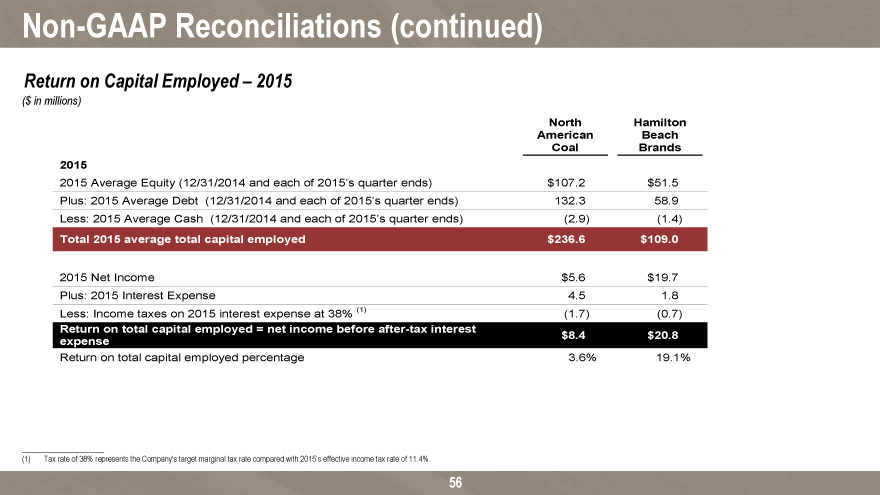
Return on Capital Employed – 2015
($ in millions)
North Hamilton American Beach Coal Brands 2015
2015 Average Equity (12/31/2014 and each of 2015’s quarter ends) $107.2 $51.5 Plus: 2015 Average Debt (12/31/2014 and each of 2015’s quarter ends) 132.3 58.9 Less: 2015 Average Cash (12/31/2014 and each of 2015’s quarter ends) (2.9) (1.4)
Total 2015 average total capital employed $236.6 $109.0
2015 Net Income $5.6 $19.7 Plus: 2015 Interest Expense 4.5 1.8 Less: Income taxes on 2015 interest expense at 38% (1) (1.7) (0.7)
Return on total capital employed = net income before after-tax interest $8.4 $20.8 expense
Return on total capital employed percentage 3.6% 19.1%
(1) Tax rate of 38% represents the Company’s target marginal tax rate compared with 2015’s effective income tax rate of 11.4%.
56
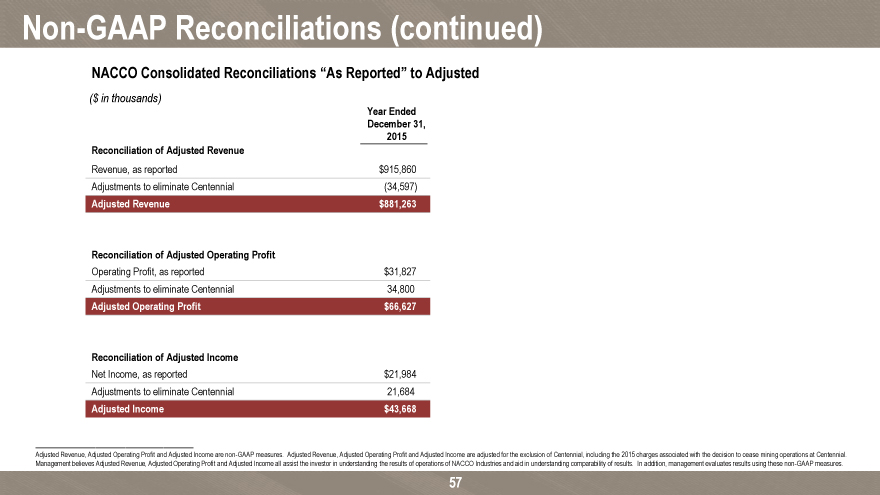
Non-GAAP Reconciliations (continued)
NACCO Consolidated Reconciliations “As Reported” to Adjusted
( $ in thousands)
Year Ended
December 31, 2015
Reconciliation of Adjusted Revenue
Revenue, as reported $915,860 Adjustments to eliminate Centennial (34,597)
Adjusted Revenue $881,263
Reconciliation of Adjusted Operating Profit
Operating Profit, as reported $31,827 Adjustments to eliminate Centennial 34,800
Adjusted Operating Profit $66,627
Reconciliation of Adjusted Income
Net Income, as reported $21,984 Adjustments to eliminate Centennial 21,684
Adjusted Income $43,668
Adjusted Revenue, Adjusted Operating Profit and Adjusted Income are non-GAAP measures. Adjusted Revenue, Adjusted Operating Profit and Adjusted Income are adjusted for the exclusion of Centennial, including the 2015 charges associated with the decision to cease mining operations at Centennial. Management believes Adjusted Revenue, Adjusted Operating Profit and Adjusted Income all assist the investor in understanding the results of operations of NACCO Industries. In addition, management evaluates results using these non-GAAP measures.
57
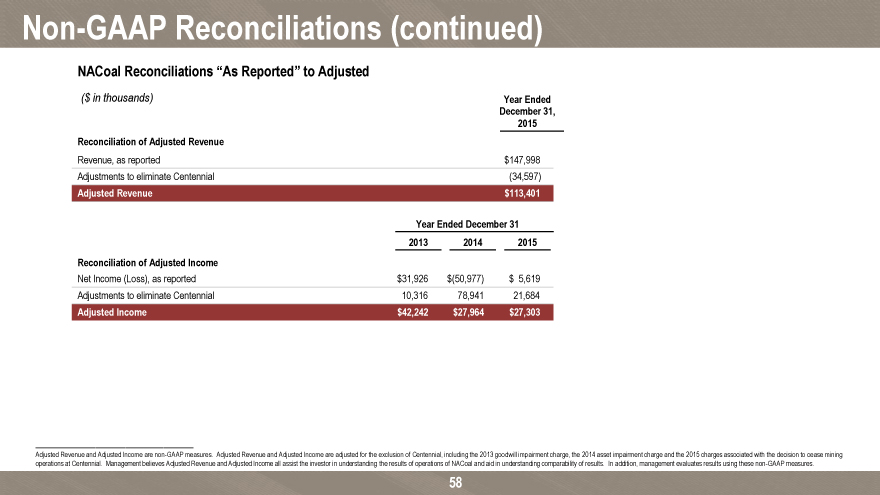
Non-GAAP Reconciliations (continued)
NACoal Reconciliations “As Reported” to Adjusted
($ in thousands) Year Ended December 31, 2015
Reconciliation of Adjusted Revenue
Revenue, as reported $147,998 Adjustments to eliminate Centennial (34,597)
Adjusted Revenue $113,401
Year Ended December 31 2013 2014 2015
Reconciliation of Adjusted Income
Net Income (Loss), as reported $31,926 $(50,977) $ 5,619 Adjustments to eliminate Centennial 10,316 78,941 21,684
Adjusted Income $42,242 $27,964 $27,303
Adjusted Revenue and Adjusted Income are non-GAAP measures. Adjusted Revenue and Adjusted Income are adjusted for the exclusion of Centennial, including the 2013 goodwill impairment charge, the 2014 asset impairment charge and the 2015 charges associated with the decision to cease mining operations at Centennial. Management believes Adjusted Revenue and Adjusted Income all assist the investor in understanding the results of operations of NACCO Industries and aid in understanding comparability of results. In addition, management evaluates results using these non-GAAP measures.
58