UNITED STATES
SECURITIES AND EXCHANGE COMMISSION
WASHINGTON, D.C. 20549
FORM 10-K
ANNUAL REPORT PURSUANT TO SECTION 13 OR 15(d)
OF THE SECURITIES EXCHANGE ACT OF 1934
| | |
| For the Fiscal Year Ended: December 31, 2006 | | Commission File Number 1-9853 |
EMC CORPORATION
(Exact name of registrant as specified in its charter)
| | |
Massachusetts
| | 04-2680009
|
| (State or other jurisdiction of incorporation or organization) | | (I.R.S. Employer Identification Number) |
176 South Street
Hopkinton, Massachusetts 01748
(Address of principal executive offices, including zip code)
(508) 435-1000
(Registrant’s telephone number, including area code)
Securities registered pursuant to Section 12(b) of the Act:
| | |
Title of Each Class:
| | Name of Each Exchange on Which Registered:
|
| Common Stock, par value $.01 per share | | New York Stock Exchange |
Securities registered pursuant to Section 12(g) of the Act:
None
Indicate by check mark if the registrant is a well-known seasoned issuer, as defined in Rule 405 of the Securities Act. Yes x No¨
Indicate by check mark if the registrant is not required to file reports pursuant to Section 13 or Section 15(d) of the Act. Yes ¨ Nox
Indicate by check mark whether the registrant: (1) has filed all reports required to be filed by Section 13 or 15(d) of the Securities Exchange Act of 1934 during the preceding 12 months (or for such shorter period that the registrant was required to file such reports), and (2) has been subject to such filing requirements for the past 90 days. Yesx No¨
Indicate by check mark if disclosure of delinquent filers pursuant to Item 405 of Regulation S-K is not contained herein, and will not be contained, to the best of registrant’s knowledge, in definitive proxy or information statements incorporated by reference in Part III of this Form 10-K or any amendment to this Form 10-K.¨
Indicate by check mark whether the registrant is a large accelerated filer, an accelerated filer, or a non-accelerated filer. See definition of “accelerated filer and large accelerated filer” in Rule 12b-2 of the Exchange Act. (Check one):
| | | | |
| Large accelerated filerx | | Accelerated filer¨ | | Non-accelerated filer¨ |
Indicate by check mark whether the registrant is a shell company (as defined in Rule 12b-2 of the Act). Yes¨ Nox
The aggregate market value of voting stock held by non-affiliates of the registrant was $25,134,370,656 based upon the closing price on the New York Stock Exchange on the last business day of the registrant’s most recently completed second fiscal quarter (June 30, 2006).
The number of shares of the registrant’s Common Stock, par value $.01 per share, outstanding as of January 31, 2007 was 2,108,120,587.
DOCUMENTS INCORPORATED BY REFERENCE
Information required in response to Part III of Form 10-K (Items 10, 11, 12, 13 and 14) is hereby incorporated by reference to the specified portions of the registrant’s Proxy Statement for the Annual Meeting of Shareholders to be held on May 3, 2007.
EMC CORPORATION
FACTORS THAT MAY AFFECT FUTURE RESULTS
This Annual Report on Form 10-K contains forward-looking statements, within the meaning of the Federal securities laws, about our business and prospects. The forward-looking statements do not include the potential impact of any mergers, acquisitions, divestitures, securities offerings or business combinations that may be announced or consummated after the date hereof. Any statements contained herein that are not statements of historical fact may be deemed to be forward-looking statements. Without limiting the foregoing, the words “believes,” “plans,” “intends,” “expects,” “goals” and similar expressions are intended to identify forward-looking statements, although not all forward-looking statements contain these words. Our future results may differ materially from our past results and from those projected in the forward-looking statements due to various uncertainties and risks, including those described in Item 1A of Part I (Risk Factors). We disclaim any obligation to update any forward-looking statements contained herein after the date of this Annual Report.
PART I
General
EMC Corporation (“EMC”) and its subsidiaries develop, deliver and support the Information Technology (“IT”) industry’s broadest range of information infrastructure technologies and solutions that are designed to help individuals and organizations handle their digital information needs.
EMC’s systems, software, and services support our customers’ critical business processes by helping them build information infrastructures from the most comprehensive systems available to store, manage and protect information at the right service levels and the right costs. We refer to this as aninformation lifecycle management (“ILM”) strategy. Our information management software and solutions empower our customers to capture, manage and leverage structured and unstructured information – documents, images or emails – to support their business processes. Our virtual infrastructure software helps organizations respond to changing IT requirements by dynamically altering their computing and storage environments with flexible virtualization technologies. Our resource management software allows organizations to better understand, manage and automate the operation of their information infrastructure.
Additionally, we also recently created an information security division to help customers systematically and comprehensively secure their information. Through the company’s recent acquisitions of RSA Security Inc. (“RSA”) and Network Intelligence Corporation (“Network Intelligence”) and our organic development initiatives, this new division offers customers security solutions to assess the risk to their information; secure the people accessing information and the infrastructure; protect the confidentiality and integrity of the information itself; and manage security information and events to assure effectiveness and ease the burdens of compliance.
We were incorporated in Massachusetts in 1979. Our corporate headquarters are located at 176 South Street, Hopkinton, Massachusetts.
Products and Offerings
Our principal segments consist of Information storage, Content management and archiving, RSA information security and VMware virtual infrastructure.
Information Storage Segment
The Information storage segment is composed of storage systems, platform-based and multi-platform software and services. We offer a wide range of networked information storage systems to support our customers’ ILM strategies to meet their performance, functionality, scalability, data availability and financial requirements. Our storage systems are the foundation of an information infrastructure and can be deployed in a storage area network (“SAN”), networked attached storage (“NAS”), content addressed storage (“CAS”) or direct attached storage environment.
EMC Symmetrix Systems
The EMC Symmetrix family of high-end networked storage systems delivers the highest levels of functionality, performance, data availability and information protection by enabling customers to incrementally scale the performance and capacity of a single array from seven terabytes to more than a petabyte, the largest and most scalable system of its kind. EMC Symmetrix DMX-3, the industry’s fastest, most scalable and flexible storage system, supports customers’ ILM strategies to address the storage
1
management challenges of high-end computing systems, mid-sized organizations requiring high-performance storage and stringent data protection, and data centers with constrained space, power and cooling resources. Introduced in 2006, the newest Symmetrix DMX-3 model 950 delivers capacity, performance and functionality in a compact package and is ideal for increasingly space- and power-constrained data centers and as a key element of a business continuity strategy.
EMC CLARiiON Systems
Our EMC CLARiiON family of mid-tier networked storage systems is based on a modular design and provides flexible levels of functionality, performance, scalability and availability for small- and medium-sized businesses (“SMBs”), mid-size enterprises and branch offices. In 2006, we introduced EMC CLARiiON CX3 UltraScale systems, based on the new EMC-developed CLARiiON UltraScale architecture, which doubled the performance and capacity of its predecessor. These are the first storage systems in the industry to feature full end-to-end 4 gigabit-per-second (“Gb/s”) Fibre Channel technology for improved performance, scalability and economics. Additionally, we introduced the EMC CLARiiON AX150 and AX150i networked storage systems for SMBs and distributed enterprises. These new architectures provide new advances in performance, ease-of-use, and data protection and are available in a compact and cost-effective system. We also introduced enhancements to our industry-leading EMC Disk Library family of easy-to-use disk-based backup and recovery solutions. The new EMC Disk Library models are based on the CLARiiON UltraScale architecture and feature new capabilities, improved performance and scalability.
EMC Celerra IP Storage Systems
Our EMC Celerra family of IP (internet protocol) storage systems range from the midrange to the high-end of the network attached storage (“NAS”) market and deliver advanced scalability and functionality, unmatched availability and simplified management for customers that would like to access storage via ubiquitous IP networks as part of an overall ILM strategy. In 2006, we introduced new EMC Celerra NS series systems, which utilize the new UltraScale architecture, and a series of software products to monitor the performance of and improve application performance over IP networks.
EMC Centera Content Addressed Storage (“CAS”) Systems
Our EMC Centera CAS systems provide fast, secure online access to archived fixed content – data that cannot be modified or will not change over time, such as digital x-ray images, movies, check images, medical records, e-mail correspondence and other similar types of digital “objects.” Centera systems help customers worldwide comply with complex governance and regulatory requirements for digital record retention, archiving and access. In 2006, we enhanced the storage capabilities of the Centera systems, including new retention management features to give customers more security, flexibility and control over their archived information for regulatory and legal purposes.
EMC Connectrix directors and switches
Our EMC Connectrix family includes high-end directors and departmental switches to help customers of all sizes increase the connectivity between servers and storage systems in a SAN, consolidate their networked storage systems, improve total cost of ownership and tier their storage environments to support an ILM strategy. In 2006, EMC introduced the EMC Connectrix ED-10000M backbone director and EMC Connectrix MDS 9513 Director, which deliver high levels of flexibility and scalability to enable massive SAN consolidation and tiering.
We intend to continue to enhance our storage systems with additional features and capabilities.
Storage Software
Our storage software offering includes both platform and multi-platform software.
Our platform-based software generally controls and enables functions that take place within the EMC networked storage system, such as replication, optimization and data movement. We are the leading supplier of platform-based software for local and remote replication with products such as EMC SRDF (Symmetrix Remote Data Facility), EMC MirrorView, EMC TimeFinder and EMC SnapView, which customers use to copy, protect and share data across varied distances.
EMC’s multi-platform software includes products to help customers better store, protect, optimize and leverage their rapidly increasing volumes of information in complex IT environments. Among others, this line-up of products includes our EMC ControlCenter and EMC Visual families of storage resource management software; PowerPath automated, non-disruptive path management software, the EMC Smarts family of intelligent, automated IT management solutions; EMC’s recovery management solutions including EMC NetWorker, EMC Retrospect and EMC RecoverPoint; EMC Invista network storage virtualization for mixed Fibre Channel SANs; and Rainfinity Global File Virtualization for seamless management of multi-vendor, IP-based NAS, CAS and file servers.
2
In 2006, EMC introduced a series of software products to help customers reduce complexity, lower operating costs, improve mean-time-to-repair, and enhance reliability of core business services. EMC Smarts Storage Insight for Availability leverages ControlCenter storage management software and fully automates root-cause and impact analysis of availability problems across the SAN, resulting in significant reduction in downtime and maintenance time. EMC Smarts Application Discovery Manager provides extensive application and infrastructure monitoring, analysis and automation across the enterprise. Rainfinity Global File Virtualization solution now offers customers a single platform to manage both active and inactive files throughout a file’s lifecycle across heterogeneous environments.
In 2006, EMC also introduced the new EMC Infoscape software to help companies discover, classify and manage unstructured enterprise information. This software enables customers to efficiently, accurately and easily search all corporate information in file systems; automatically classify information based on business value; manage the retention of unstructured information for compliance; and facilitate policy-based and automated data migration across a tiered storage infrastructure.
Additionally, EMC introduced in 2006 a number of new and updated software products that enable customers to improve the recovery of critical applications and data. EMC’s recovery management solutions target three pillars in data protection – application-aware protection, disk-based recoverability and enhanced manageability – enabling customers to recover the right data, at the right time, easily and reliably.
We intend to continue to enhance our storage software with additional features and capabilities.
Storage Services
Our services include EMC Consulting Services, Implementation and Integration, EMC Managed Services, EMC Customer Service and EMC Education Services, to help our customers plan, build and manage integrated IT infrastructures to more cost-effectively manage and protect their information throughout its lifecycle. We provide consulting, assessment, implementation, integration and operations management services, day-to-day support, maintenance, education and training to our customers. In 2006, EMC also introduced a managed services portfolio that enables customers to more cost-effectively manage their information infrastructure with help from dedicated, onsite EMC personnel. The EMC Managed Services portfolio helps customers improve storage operations and more efficiently meet demanding service levels associated with administering, protecting and storing information. In conjunction with our new EMC Infoscape software in 2006, EMC also introduced the EMC Information Management Strategy Service to help companies discover, classify and manage unstructured enterprise information.
Content Management and Archiving Segment
Our content management software, which includes the EMC Documentum family, helps customers optimize business processes and create, manage, deliver and archive information, ranging from documents and discussions to e-mail, Web pages, images, XML, reports, records, rich media and application data. Additionally, the EMC Captiva family of input management software provides for conversion, indexing and processing of paper-based information to digital formats.
In 2006, EMC modified its family of enterprise archiving software products to a single, unified archiving platform for collecting, retaining and securing all types of document images for compliance and legal discovery, content re-use, improved decision-making and operational efficiency. These include EMC Documentum Archive Services for Email, EMC Documentum Archive Services for Reports, EMC Documentum Archive Services for Imaging, EMC Documentum OEM Edition, EMC Documentum Information Rights Management (“IRM”) Services, EMC Documentum Records Manager 5.3, EMC Documentum Page Builder web content management (“WCM”) and new versions of the EMC Captiva document capture software.
Additionally, in 2006 EMC introduced the EMC e-Discovery Solution. This services-led, integrated offering consists of EMC information and content management software, networked storage and professional services designed to help customers of all sizes better manage the legal discovery process.
We intend to continue to enhance our products and services in this segment with additional features and capabilities and to introduce new software products and services.
RSA Information Security Segment
In September 2006, EMC acquired RSA and Network Intelligence. These two organizations, combined with our organic development initiatives, form the foundation of EMC’s new RSA information security segment.
RSA adds industry-leading enterprise identity and access management products, consumer identity and fraud protection solutions, encryption and key management software and security knowledge and expertise to EMC’s expanding, information-centric security product and service portfolio. Network Intelligence advances EMC’s information-centric security strategy by
3
providing tools that enable companies to collect, monitor, analyze and report on security event-related activity throughout the IT infrastructure – in the network, in enterprise applications, on mainframes, on desktops, in storage devices or elsewhere. Solutions from Network Intelligence ease the burden of proving compliance with security policies and regulations.
In 2006, RSA introduced its RSA Key Manager software, which enables businesses to effectively manage the lifecycle of encryption keys. The solution also helps companies comply with the key lifecycle management guidelines of the Payment Card Industry (“PCI”) Data Security Standard, a global initiative of leading payment card companies which strives to protect consumers’ transaction data.
We intend to continue to enhance RSA’s products and services with additional features and capabilities and to introduce new products and services.
VMware Virtual Infrastructure Segment
VMware, Inc. (“VMware”) is a subsidiary of EMC. Its virtual infrastructure solutions and services are used by more than 20,000 enterprises for server consolidation and containment, disaster recovery and business continuity, capacity planning and development, enterprise desktop hosting, test optimization and software distribution. By helping customers virtualize their enterprises, VMware enables them to build a more flexible and highly available IT infrastructure.
VMware virtual infrastructure simplifies IT so companies better leverage their storage, network and computing resources to control costs and increase response time. The VMware virtual infrastructure approach to IT management creates virtual resources from the physical IT infrastructure, enabling administrators to allocate these virtual resources quickly to the business units that need them most.
In 2006, VMware introduced Infrastructure 3, the third generation of its virtualization software. VMware Infrastructure 3 delivers an unprecedented ability to automate maximum power savings, guaranteed response times and newly added capacity and consolidated backup.
In 2006, VMware also launched Virtual Desktop Infrastructure, a solution that moves desktop management to a centralized server and secures its data there; shipped VMware Lab Manager, which enables enterprise software development organizations to more efficiently utilize software development and test lab assets, accelerate software development cycles and increase the quality of delivered software products; introduced VMware Converter 3, the next generation of its conversion tool that enables fast and reliable Physical-to-Virtual and Virtual-to-Virtual conversions through a simple and centralized management product; expanded its customer base with the release of VMware Server, the free, feature-packed hosted virtualization product that provides companies a first step to enterprise-wide infrastructure virtualization and offers the option to purchase enterprise-class VMware support; and launched the Virtual Appliance Marketplace.
VMware intends to continue to enhance its products and services with additional features and capabilities and to introduce new software products and services.
In 2007, we announced our intention to sell approximately 10% of VMware via an initial public offering of newly-issued VMware stock. We will retain ownership in the remaining shares of VMware.
Markets and Distribution Channels
Markets
We focus on providing information storage, content management and archiving, security and virtualization to support customers’ information infrastructures and their ILM strategies. We target organizations of all sizes.
Distribution Channels
We market our products through direct sales and through multiple distribution channels. We have a direct sales presence throughout North America, Latin America, Europe, the Middle East, South Africa and the Asia Pacific region. We also have agreements in place with many distributors, systems integrators, resellers and OEMs. These agreements, subject to certain terms and conditions, enable these companies to market and resell certain EMC systems and software. In 2006, we expanded our distribution capabilities through both new and enhanced partner and channel relationships. VMware generally distributes its products and services through its own distribution channels that include distributors, systems integrators, resellers and OEM hardware vendors. In 2006, EMC and Dell, Inc. (“Dell”) announced an extension of a strategic alliance enabling Dell to offer EMC technology through 2011. Also, EMC formed an OEM and technology relationship with Intel Corporation (“Intel”), enabling Intel to offer certain EMC storage systems under the Intel brand name. In addition, EMC and NEC Corporation announced an expansion of their strategic business and technology alliance in 2006.
4
Technology Alliances
We have technology alliances with leading software, networking and services companies. We intend to continue to form additional alliances. Our strategy is to work closely with these and other companies to provide added value to our customers by integrating our solutions with software and networking applications that customers rely on to manage their day-to-day business operations. In 2006, EMC expanded its major alliances with Microsoft Corporation and Oracle Corporation.
Manufacturing and Quality
Our products are assembled and tested primarily at our facilities in the United States and Ireland or at global manufacturing service suppliers. See Item 2 “Properties.” We work closely with our suppliers to design, assemble and test product components in accordance with production standards and quality controls established by us. Our software products are designed, developed and tested primarily at our facilities in the United States and abroad. The products are tested to meet quality standards established by us.
We have implemented a formal, documented quality management system to ensure that our products and services satisfy customer needs and expectations and to provide the framework for continual improvement of our processes and products. This system is certified to the ISO 9001 International Standard. Several additional ISO 9001 certifications are maintained for sales and service operations worldwide. We have also implemented Six Sigma, Lean Manufacturing and other quality methodologies to ensure that the quality of our designs, manufacturing, test processes and supplier relationships are continually improved. Our storage systems manufacturing and test facilities in Massachusetts, North Carolina and Ireland are certified to the ISO 14001 International Standard for environmental management systems. We also maintain Support Center Practices (“SCP”) certification for our primary customer support centers. These internationally recognized endorsements of ongoing quality and environmental management are among the highest levels of certifications available.
Raw Materials
We purchase many sophisticated components and products from one or a limited number of qualified suppliers, including some of our competitors. Our products utilize industry-standard and semi-custom components and subsystems. Among the most important components that we use are disk drives, high density memory components, microcontrollers and power supplies. While such components are generally available, we have experienced delivery delays from time to time because of high industry demand or the inability of some vendors to consistently meet our quality or delivery requirements.
Research and Development
We continually enhance our existing products and develop new products to meet changing customer requirements. In 2006, 2005 and 2004, our research and development (“R&D”) expenses totaled $1,254.2 million, $1,004.8 million, and $847.9 million, respectively. We support our R&D efforts through state-of-the-art development labs worldwide.
Backlog
We produce our products on the basis of our forecast of near-term demand and maintain inventory in advance of receipt of firm orders from customers. We configure to customer specifications and generally deliver products shortly after receipt of the order. Service engagements are also included in certain orders. Customers may reschedule or cancel orders with little or no penalty. We believe that our backlog at any particular time is not meaningful because it is not necessarily indicative of future sales levels.
Competition
We compete with many companies in the markets we serve, including companies that offer a broad spectrum of IT products and services and others that offer specific information storage, content management, security or server virtualization products or services. We believe that most of these companies compete based on their market presence, products, service or price. Some of these companies also compete by offering information storage, content management or virtualization-related products or services, together with other IT products or services, at minimal or no additional cost in order to preserve or gain market share.
We believe that we have a number of competitive advantages over these companies, including product, distribution and service. We believe the advantages in our products include quality, breadth of offerings, performance, functionality, scalability, availability, interoperability, connectivity, time-to-market enhancements and total value of ownership. We believe our advantages in distribution include the world’s largest information infrastructure-focused direct sales force and a broad network of channel partners. We believe our advantages in service include our ability to provide our customers with a full range of expertise before, during and after their purchase of solutions from us or other vendors.
5
Seasonality
We generally experience the lowest demand for our products and services in the first quarter of the year and the greatest demand for our products and services in the last quarter of the year.
Intellectual Property
We generally rely on patent, copyright, trademark and trade secret laws and contract rights to establish and maintain our proprietary rights in our technology and products. While our intellectual property rights are important to our success, we believe that our business as a whole is not materially dependent on any particular patent, trademark, license or other intellectual property right.
We have been granted or own by assignment approximately 1,390 patents issued by, and have more than approximately 1,500 patent applications pending with, the U.S. Patent and Trademark Office, as well as a corresponding number of international patents and patent applications. While the duration of our patents varies, we believe that the duration of our patents is adequate relative to the expected lives of our products.
We have used, registered or applied to register certain trademarks and copyrights in the United States and in other countries. We also license certain technology from third parties for use in our products and processes and license some of our technologies to third parties.
Employees
As of December 31, 2006, we had approximately 31,100 employees worldwide. None of our domestic employees is represented by a labor union, and we have never suffered an interruption of business as a result of a labor dispute. We consider our relations with our employees to be good.
Financial Information About Segments, Foreign and Domestic Operations and Export Sales
We operate in four business segments: Information storage, Content management and archiving, RSA information security and VMware virtual infrastructure. Sales and marketing operations outside the United States are conducted through sales subsidiaries and branches located principally in Europe, Latin America and the Asia Pacific region. We have five manufacturing facilities: two in Massachusetts, which manufacture storage products and security products for the North American markets; two in Ireland, which manufacture storage products and security products for markets outside of North America; and one in North Carolina, which manufactures storage products for worldwide markets. See Note Q to the Consolidated Financial Statements for information about revenues by segment and geographic area.
Available Information
Our Annual Report on Form 10-K, Quarterly Reports on Form 10-Q, Current Reports on Form 8-K and amendments to reports filed pursuant to Sections 13(a) and 15(d) of the Securities Exchange Act of 1934, as amended (the “Exchange Act”), are made available free of charge on or through our website atwww.emc.com as soon as reasonably practicable after such reports are filed with, or furnished to, the Securities and Exchange Commission (the “SEC”). Copies of our (i) Corporate Governance Guidelines, (ii) charters for the Audit Committee, Compensation Committee, Corporate Governance and Nominating Committee, Mergers and Acquisitions Committee and Finance Committee and (iii) Business Conduct Guidelines (code of business conduct and ethics) are available atwww.emc.com/about/governance. Copies will be provided to any shareholder upon request. Please go towww.emc.com/ir to submit an electronic request, or send a written request to EMC Investor Relations, 176 South Street, Hopkinton, MA 01748. None of the information posted on our website is incorporated by reference into this Annual Report.
CEO Certification
An annual CEO Certification was submitted by our CEO to the New York Stock Exchange (the “NYSE”) on May 26, 2006 in accordance with the NYSE’s listing standards.
6
ITEM 1A. RISK FACTORS
This Annual Report on Form 10-K contains forward-looking statements, within the meaning of the Federal securities laws, about our business and prospects. The forward-looking statements do not include the potential impact of any mergers, acquisitions, divestitures or business combinations that may be announced after the date hereof. Our future results may differ materially from our past results and from those projected in the forward-looking statements due to various uncertainties and risks, including but not limited to those set forth below, one-time events and other important factors disclosed previously and from time to time in our other filings with the SEC. We disclaim any obligation to update any forward-looking statements contained herein after the date of this Annual Report.
The risk factors that appear below could materially affect our business, financial condition and results of operations. The risks and uncertainties described below are not the only risks and uncertainties facing us. Our business is also subject to general risks and uncertainties that affect many other companies.
Our business could be materially adversely affected as a result of general economic and market conditions.
We are subject to the effects of general global economic and market conditions. If these conditions deteriorate, our business, results of operations or financial condition could be materially adversely affected.
Our business could be materially adversely affected as a result of a lessening demand in the information technology market.
Our revenue and profitability depend on the overall demand for our products and services. Delays or reductions in IT spending, domestically or internationally, could materially adversely affect demand for our products and services which could result in decreased revenues or earnings.
Competitive pricing, sales volume, mix and component costs could materially adversely affect our revenues, gross margins and earnings.
Our gross margins are impacted by a variety of factors, including competitive pricing, component and product design costs as well as the volume and relative mixture of product and services revenues. Increased component costs, increased pricing pressures, the relative and varying rates of increases or decreases in component costs and product price, changes in product and services revenue mixture or decreased volume could have a material adverse effect on our revenues, gross margins or earnings.
The costs of third-party components comprise a significant portion of our product costs. While we generally have been able to manage our component and product design costs, we may have difficulty managing such costs if supplies of certain components become limited or component prices increase. Any such limitation could result in an increase in our component costs. An increase in component or design costs relative to our product prices could have a material adverse effect on our gross margins and earnings. Moreover, certain competitors may have advantages due to vertical integration of their supply chain, which may include disk drives, microprocessors, memory components and servers.
The markets in which we do business are highly competitive and we encounter aggressive price competition for all of our products and services from numerous companies globally. There also has been and may continue to be a willingness on the part of certain competitors to reduce prices or provide information infrastructure products or services, together with other IT products or services, at minimal or no additional cost in order to preserve or gain market share. Such price competition may result in pressure on our product and service prices, and reductions in product and service prices may have a material adverse effect on our revenues, gross margins and earnings. We currently believe that pricing pressures are likely to continue.
If our suppliers are not able to meet our requirements, we could have decreased revenues and earnings.
We purchase or license many sophisticated components and products from one or a limited number of qualified suppliers, including some of our competitors. These components and products include disk drives, high density memory components, power supplies and software developed and maintained by third parties. We have experienced delivery delays from time to time because of high industry demand or the inability of some vendors to consistently meet our quality or delivery requirements. If any of our suppliers were to cancel or materially change contracts or commitments with us or fail to meet the quality or delivery requirements needed to satisfy customer orders for our products, we could lose time-sensitive customer orders, be unable to develop or sell certain products cost-effectively or on a timely basis, if at all, and have significantly decreased quarterly revenues and earnings, which would have a material adverse effect on our business, results of operations and financial condition. Additionally, we periodically transition our product line to incorporate new technologies. The importance of transitioning our customers smoothly to new technologies, along with our historically uneven pattern of quarterly sales, intensifies the risk that the failure of a supplier to meet our quality or delivery requirements will have a material adverse impact on our revenues and earnings.
7
Our business could be materially adversely affected as a result of the risks associated with acquisitions and investments.
As part of our business strategy, we seek to acquire businesses that offer complementary products, services or technologies. These acquisitions are accompanied by the risks commonly encountered in an acquisition of a business, which may include, among other things:
| | • | | the effect of the acquisition on our financial and strategic position and reputation |
| | • | | the failure of an acquired business to further our strategies |
| | • | | the failure of the acquisition to result in expected benefits, which may include benefits relating to enhanced revenues, technology, human resources, cost savings, operating efficiencies and other synergies |
| | • | | the difficulty and cost of integrating the acquired business, including costs and delays in implementing common systems and procedures and costs and delays caused by communication difficulties or geographic distances between the two companies’ sites |
| | • | | the assumption of liabilities of the acquired business, including litigation-related liability |
| | • | | the potential impairment of acquired assets |
| | • | | the lack of experience in new markets, products or technologies or the initial dependence on unfamiliar supply or distribution partners |
| | • | | the diversion of our management’s attention from other business concerns |
| | • | | the impairment of relationships with customers or suppliers of the acquired business or our customers or suppliers |
| | • | | the potential loss of key employees of the acquired company |
| | • | | the potential incompatibility of business cultures |
These factors could have a material adverse effect on our business, results of operations or financial condition. To the extent that we issue shares of our common stock or other rights to purchase our common stock in connection with any future acquisition, existing shareholders may experience dilution and our earnings per share may decrease.
In addition to the risks commonly encountered in the acquisition of a business as described above, we may also experience risks relating to the challenges and costs of closing a transaction. Further, the risks described above may be exacerbated as a result of managing multiple acquisitions at the same time.
We also seek to invest in businesses that offer complementary products, services or technologies. These investments are accompanied by risks similar to those encountered in an acquisition of a business.
We may be unable to keep pace with rapid industry, technological and market changes.
The markets in which we compete are characterized by rapid technological change, frequent new product introductions, evolving industry standards and changing needs of customers. There can be no assurance that our existing products will be properly positioned in the market or that we will be able to introduce new or enhanced products into the market on a timely basis, or at all. We spend a considerable amount of money on research and development and introduce new products from time to time. There can be no assurance that enhancements to existing products and solutions or new products and solutions will receive customer acceptance. As competition in the IT industry increases, it may become increasingly difficult for us to maintain a technological advantage and to leverage that advantage toward increased revenues and profits.
Risks associated with the development and introduction of new products include delays in development and changes in data storage, networking virtualization, infrastructure management, information security and operating system technologies which could require us to modify existing products. Risks inherent in the transition to new products include:
| | • | | the difficulty in forecasting customer preferences or demand accurately |
| | • | | the inability to expand production capacity to meet demand for new products |
| | • | | the impact of customers’ demand for new products on the products being replaced, thereby causing a decline in sales of existing products and an excessive, obsolete supply of inventory |
| | • | | delays in initial shipments of new products |
Further risks inherent in new product introductions include the uncertainty of price-performance relative to products of competitors, competitors’ responses to the introductions and the desire by customers to evaluate new products for extended periods of time. Our failure to introduce new or enhanced products on a timely basis, keep pace with rapid industry, technological or market changes or effectively manage the transitions to new products or new technologies could have a material adverse effect on our business, results of operations or financial condition.
8
The markets we serve are highly competitive and we may be unable to compete effectively.
We compete with many companies in the markets we serve, certain of which offer a broad spectrum of IT products and services and others which offer specific information storage, management or virtualization products or services. Some of these companies (whether independently or by establishing alliances) may have substantially greater financial, marketing and technological resources, larger distribution capabilities, earlier access to customers and greater opportunity to address customers’ various IT requirements than us. In addition, as the IT industry consolidates, companies may improve their competitive position and ability to compete against us. We compete on the basis of our products’ features, performance and price as well as our services. Our failure to compete on any of these bases could affect demand for our products or services, which could have a material adverse effect on our business, results of operations or financial condition.
Companies may develop new technologies or products in advance of us or establish business models or technologies disruptive to us. Our business may be materially adversely affected by the announcement or introduction of new products, including hardware and software products and services by our competitors, and the implementation of effective marketing or sales strategies by our competitors. The material adverse effect to our business could include a decrease in demand for our products and services and an increase in the length of our sales cycle due to customers taking longer to compare products and services and to complete their purchases.
We may have difficulty managing operations.
Our future operating results will depend on our overall ability to manage operations, which includes, among other things:
| | • | | retaining and hiring, as required, the appropriate number of qualified employees |
| | • | | managing, protecting and enhancing, as appropriate, our infrastructure, including but not limited to, our information systems and internal controls |
| | • | | accurately forecasting revenues |
| | • | | training our sales force to sell more software and services |
| | • | | successfully integrating new acquisitions |
| | • | | managing inventory levels, including minimizing excess and obsolete inventory, while maintaining sufficient inventory to meet customer demands |
| | • | | managing our manufacturing capacity, real estate facilities and other assets |
An unexpected decline in revenues without a corresponding and timely reduction in expenses or a failure to manage other aspects of our operations could have a material adverse effect on our business, results of operations or financial condition.
Our business could be materially adversely affected as a result of war or acts of terrorism.
Terrorist acts or acts of war may cause damage or disruption to our employees, facilities, customers, partners, suppliers, distributors and resellers, which could have a material adverse effect on our business, results of operations or financial condition. Such conflicts may also cause damage or disruption to transportation and communication systems and to our ability to manage logistics in such an environment, including receipt of components and distribution of products.
Our business may suffer if we are unable to retain or attract key personnel.
Our business depends to a significant extent on the continued service of senior management and other key employees, the development of additional management personnel and the hiring of new qualified employees. There can be no assurance that we will be successful in retaining existing personnel or recruiting new personnel. The loss of one or more key or other employees, our inability to attract additional qualified employees or the delay in hiring key personnel could have a material adverse effect on our business, results of operations or financial condition.
In addition, we have historically used stock options and other equity awards as key elements of our compensation packages for many of our employees. Under recent accounting rules, we are required to treat stock-based compensation as an expense. In addition, changes to regulatory or stock exchange rules and regulations and in institutional shareholder voting guidelines on equity plans may result in additional requirements or limitations on our equity plans. As a result, we may change our compensation practices with respect to the number of shares and type of equity awards used. The value of our equity awards may also be adversely affected by the volatility of our stock price. These factors may impair our ability to attract, retain and motivate employees.
9
Changes in generally accepted accounting principles may adversely affect us.
From time to time, the Financial Accounting Standards Board (“FASB”) promulgates new accounting principles that are applicable to us. In the first quarter of 2006, we adopted Financial Accounting Standard (“FAS”) FAS No. 123R “Share-based Payment” (“FAS No. 123R”). This standard requires us to expense the fair value of stock options issued to employees in our basic financial statements. This has adversely affected our results of operations. The FASB has proposed or promulgated other standards, including modifying the accounting for income taxes, accounting for business combinations and fair value measurements. These proposed and new standards or other proposals could have a material adverse impact on our results of operations or financial condition.
The Financial Accounting Standards Board’s Emerging Issues Task Force (the “Task Force”) has on its agenda a plan to review the accounting for convertible debt instruments that require or permit partial cash settlement upon conversion. The Task Force has proposed to discuss whether the current accounting treatment should be retained or if it should be modified to require the debt portion to be recorded at the fair market value of a similar liability. If the Task Force concludes that the accounting should be modified, this would result in incremental interest expense being recognized on our convertible debt instrument over the life of the debt, negatively impacting our diluted earnings per share.
Our quarterly revenues and earnings could be materially adversely affected by uneven sales patterns and changing purchasing behaviors.
Our quarterly sales have historically reflected an uneven pattern in which a disproportionate percentage of a quarter’s total sales occur in the last month and weeks and days of each quarter. This pattern makes prediction of revenues, earnings and working capital for each financial period especially difficult and uncertain and increases the risk of unanticipated variations in quarterly results and financial condition. We believe this uneven sales pattern is a result of many factors including:
| | • | | the relative dollar amount of our product and services offerings in relation to many of our customers’ budgets, resulting in long lead times for customers’ budgetary approval, which tends to be given late in a quarter |
| | • | | the tendency of customers to wait until late in a quarter to commit to purchase in the hope of obtaining more favorable pricing from one or more competitors seeking their business |
| | • | | the fourth quarter influence of customers’ spending their remaining capital budget authorization prior to new budget constraints in the first six months of the following year |
Our uneven sales pattern also makes it extremely difficult to predict near-term demand and adjust manufacturing capacity accordingly. If predicted demand is substantially greater than orders, there will be excess inventory. Alternatively, if orders substantially exceed predicted demand, the ability to assemble, test and ship orders received in the last weeks and days of each quarter may be limited, which could materially adversely affect quarterly revenues and earnings.
In addition, our revenues in any quarter are substantially dependent on orders booked and shipped in that quarter and our backlog at any particular time is not necessarily indicative of future sales levels. This is because:
| | • | | we assemble our products on the basis of our forecast of near-term demand and maintain inventory in advance of receipt of firm orders from customers |
| | • | | we generally ship products shortly after receipt of the order |
| | • | | customers may reschedule or cancel orders with little or no penalty |
Loss of infrastructure, due to factors such as an information systems failure, loss of public utilities or extreme weather conditions, could impact our ability to ship products in a timely manner. Delays in product shipping or an unexpected decline in revenues without a corresponding and timely slowdown in expenses, could intensify the impact of these factors on our business, results of operations and financial condition.
In addition, unanticipated changes in our customers’ purchasing behaviors such as customers taking longer to negotiate and complete their purchases or making smaller, incremental purchases based on their current needs, also make the prediction of revenues, earnings and working capital for each financial period difficult and uncertain and increase the risk of unanticipated variations in our quarterly results and financial condition.
Risks associated with our distribution channels may materially adversely affect our financial results.
In addition to our direct sales force, we have agreements in place with many distributors, systems integrators, resellers and original equipment manufacturers to market and sell our products and services. We may, from time to time, derive a significant percentage of our revenues from such distribution channels. For 2006, Dell Inc., one of our channel partners, accounted for 14.5%
10
of our revenues. Our financial results could be materially adversely affected if our contracts with channel partners were terminated, if our relationship with channel partners were to deteriorate, if the financial condition of our channel partners were to weaken, if our channel partners are not able to timely and effectively implement their planned actions or if the level of demand for our channel partners’ products and services decreases. In addition, as our market opportunities change, we may have an increased reliance on channel partners, which may negatively impact our gross margins. There can be no assurance that we will be successful in maintaining or expanding these channels. If we are not successful, we may lose sales opportunities, customers and market share. Furthermore, the partial reliance on channel partners may materially reduce the visibility to our management of potential customers and demand for products and services, thereby making it more difficult to accurately forecast such demand. In addition, there can be no assurance that our channel partners will not develop, market or sell products or services in competition with us in the future.
In addition, as we focus on new market opportunities and additional customers through our various distribution channels, including small-to-medium sized businesses, we may be required to provide different levels of service and support than we typically provided in the past. We may have difficulty managing directly or indirectly through our channels these different service and support requirements and may be required to incur substantial costs to provide such services which may adversely affect our business, results of operations or financial condition.
Changes in foreign conditions could impair our international operations.
A substantial portion of our revenues is derived from sales outside the United States. In addition, a substantial portion of our products is manufactured outside of the United States. Accordingly, our future results could be materially adversely affected by a variety of factors, including changes in foreign currency exchange rates, changes in a specific country’s or region’s political or economic conditions, trade restrictions, import or export licensing requirements, the overlap of different tax structures or changes in international tax laws, changes in regulatory requirements, compliance with a variety of foreign laws and regulations and longer payment cycles in certain countries.
Undetected problems in our products could directly impair our financial results.
If flaws in design, production, assembly or testing of our products (by us or our suppliers) were to occur, we could experience a rate of failure in our products that would result in substantial repair, replacement or service costs and potential damage to our reputation. Continued improvement in manufacturing capabilities, control of material and manufacturing quality and costs and product testing are critical factors in our future growth. There can be no assurance that our efforts to monitor, develop, modify and implement appropriate test and manufacturing processes for our products will be sufficient to permit us to avoid a rate of failure in our products that results in substantial delays in shipment, significant repair or replacement costs or potential damage to our reputation, any of which could have a material adverse effect on our business, results of operations or financial condition.
Our business could be materially adversely affected as a result of the risks associated with alliances.
We have alliances with leading information technology companies and we plan to continue our strategy of developing key alliances in order to expand our reach into markets. There can be no assurance that we will be successful in our ongoing strategic alliances or that we will be able to find further suitable business relationships as we develop new products and strategies. Any failure to continue or expand such relationships could have a material adverse effect on our business, results of operations or financial condition.
There can be no assurance that companies with which we have strategic alliances, certain of which have substantially greater financial, marketing or technological resources than us, will not develop or market products in competition with us in the future, discontinue their alliances with us or form alliances with our competitors.
Our business may suffer if we cannot protect our intellectual property.
We generally rely upon patent, copyright, trademark and trade secret laws and contract rights in the United States and in other countries to establish and maintain our proprietary rights in our technology and products. However, there can be no assurance that any of our proprietary rights will not be challenged, invalidated or circumvented. In addition, the laws of certain countries do not protect our proprietary rights to the same extent as do the laws of the United States. Therefore, there can be no assurance that we will be able to adequately protect our proprietary technology against unauthorized third-party copying or use, which could adversely affect our competitive position. Further, there can be no assurance that we will be able to obtain licenses to any technology that we may require to conduct our business or that, if obtainable, such technology can be licensed at a reasonable cost.
From time to time, we receive notices from third parties claiming infringement by our products of third-party patent or other intellectual property rights. Responding to any such claim, regardless of its merit, could be time-consuming, result in costly litigation, divert management’s attention and resources and cause us to incur significant expenses. In the event there is a temporary
11
or permanent injunction entered prohibiting us from marketing or selling certain of our products or a successful claim of infringement against us requiring us to pay royalties to a third party, and we fail to develop or license a substitute technology, our business, results of operations or financial condition could be materially adversely affected.
We may become involved in litigation that may materially adversely affect us.
From time to time in the ordinary course of our business, we may become involved in various legal proceedings, including patent, commercial, product liability, employment, class action, whistleblower and other litigation and claims, and governmental and other regulatory investigations and proceedings. Such matters can be time-consuming, divert management’s attention and resources and cause us to incur significant expenses. Furthermore, because litigation is inherently unpredictable, there can be no assurance that the results of any of these actions will not have a material adverse effect on our business, results of operations or financial condition.
We may have exposure to additional income tax liabilities.
As a multinational corporation, we are subject to income taxes in both the United States and various foreign jurisdictions. Our domestic and international tax liabilities are subject to the allocation of revenues and expenses in different jurisdictions and the timing of recognizing revenues and expenses. Additionally, the amount of income taxes paid is subject to our interpretation of applicable tax laws in the jurisdictions in which we file. From time to time, we are subject to income tax audits. While we believe we have complied with all applicable income tax laws, there can be no assurance that a governing tax authority will not have a different interpretation of the law and assess us with additional taxes. Should we be assessed with additional taxes, there could be a material adverse effect on our results of operations or financial condition.
There are risks associated with our previously-announced proposed initial public offering of VMware.
We announced that we intend to sell approximately 10% of our wholly-owned subsidiary, VMware, via an initial public offering (an “IPO”). We may not complete the IPO, in which event we will have incurred significant expenses which we will be unable to recover, and for which we will not receive any benefit. Additionally, our strategic objectives for the IPO, including improving visibility into VMware’s performance and growth relative to the market and strengthening VMware employee retention and recruitment, are based on the completion of the IPO. If we do not complete the IPO, we will need to pursue alternative means of accomplishing these strategic objectives.
If the IPO is completed, VMware would be a new public company. We are unable to predict what the market price of our common stock would be after the IPO. We cannot assure you that the IPO, if completed, will produce any increase for our shareholders in the market value of their holdings in our company. In addition, the market price of our common stock could be volatile for several months after the IPO and may continue to be more volatile than our common stock would have been if a transaction had not occurred.
Changes in regulations could materially adversely affect us.
Our business, results of operations or financial conditions could be materially adversely affected if laws, regulations or standards relating to us or our products are newly implemented or changed. In addition, our compliance with existing regulations may have a material adverse impact on us. Under applicable federal securities laws, including the Sarbanes-Oxley Act of 2002, we are required to evaluate and determine the effectiveness of our internal control structure and procedures for financial reporting. Should we or our independent auditors determine that we have material weaknesses in our internal controls, our results of operations or financial condition may be materially adversely affected or our stock price may decline.
Our stock price is volatile.
Our stock price, like that of other technology companies, is subject to significant volatility because of factors such as:
| | • | | the announcement of acquisitions, new products, services or technological innovations by us or our competitors |
| | • | | quarterly variations in our operating results |
| | • | | changes in revenue or earnings estimates by the investment community |
| | • | | speculation in the press or investment community |
In addition, our stock price is affected by general economic and market conditions and has been negatively affected by unfavorable global economic and market conditions. If such conditions deteriorate, our stock price could decline.
ITEM 1B. UNRESOLVED STAFF COMMENTS
None.
12
As of December 31, 2006, we owned or leased the facilities described below:
| | | | | | | | |
| Location | | Approximate Sq. Ft.* | | Principal Use(s) | | Principal Segment(s) |
| | | | |
Hopkinton, MA | | owned:
leased: | | 1,832,500
20,500 | | executive and administrative offices, R&D, customer service and sales | | Information Storage, Content Mgmt. & Archiving |
| |
| |
| |
| |
|
| | | | |
Franklin, MA | | owned:
leased: | | 938,600
97,000 | | manufacturing | | Information Storage |
| |
| |
| |
| |
|
| | | | |
Bedford, MA | | leased: | | 328,000 | | R&D, customer service, sales and administrative offices | | RSA Information Security |
| |
| |
| |
| |
|
| | | | |
Apex, NC | | owned: | | 387,900 | | manufacturing | | Information Storage |
| |
| |
| |
| |
|
| | | | |
Palo Alto, CA | | leased: | | 227,000 | | executive and administrative offices, R&D, customer service and sales | | VMware Virtual Infrastructure |
| |
| |
| |
| |
|
| | | | |
Other North American locations | | owned:
leased: | | 1,061,600
3,891,788 | | executive and administrative offices, sales, customer service and R&D | | ** |
| |
| |
| |
| |
|
| | | | |
Asia Pacific region | | leased: | | 738,057 | | sales, customer service and R&D | | *** |
| |
| |
| |
| |
|
| | | | |
Cork, Ireland | | owned:
leased: | | 578,300
27,500 | | manufacturing, customer service, R&D and administrative offices | | ** |
| |
| |
| |
| |
|
| | | | |
Europe, Middle East and Africa (excluding Cork, Ireland) | | owned:
leased: | | 32,466
1,142,294 | | sales, customer service and R&D | | *** |
| |
| |
| |
| |
|
| | | | |
Latin American region | | leased: | | 77,552 | | sales and customer service | | *** |
| |
| |
| |
| |
|
* Of the total square feet owned and leased, approximately 600,000 square feet was vacant and 930,000 square feet was leased or subleased to non-EMC businesses.
** All segments of our business, with the exception of VMware Virtual Infrastructure, generally utilize these facilities.
***All segments of our business generally utilize these facilities.
We also own land in Massachusetts and Ireland for possible future expansion purposes. We believe our existing facilities are suitable and adequate for our present purposes. For further information regarding our lease obligations, see Note M to our Consolidated Financial Statements.
We are a party to litigation which we consider routine and incidental to our business. Management does not expect the results of any of these actions to have a material adverse effect on our business, results of operations or financial condition.
| ITEM 4. | SUBMISSION OF MATTERS TO A VOTE OF SECURITY HOLDERS |
No matter was submitted to a vote of our shareholders during the fourth quarter of 2006.
13
EXECUTIVE OFFICERS OF THE REGISTRANT
Our executive officers are as follows:
| | | | |
Name
| | Age
| | Position
|
Joseph M. Tucci | | 59 | | Chairman, President and Chief Executive Officer |
William J. Teuber, Jr. | | 55 | | Vice Chairman |
Arthur W. Coviello, Jr. | | 53 | | Executive Vice President and President of RSA |
Paul T. Dacier | | 49 | | Executive Vice President and General Counsel |
David G. DeWalt | | 42 | | Executive Vice President and President, Customer Operations and Content Management Software |
David A. Donatelli | | 41 | | Executive Vice President, Storage Product Operations |
Howard D. Elias | | 49 | | Executive Vice President, Global Services and Resource Management Software Group |
David I. Goulden | | 47 | | Executive Vice President and Chief Financial Officer |
Diane Greene | | 51 | | Executive Vice President and President of VMware |
Frank M. Hauck | | 47 | | Executive Vice President, Global Marketing and Customer Quality |
Mark S. Lewis | | 44 | | Executive Vice President, Chief Development Officer |
John T. Mollen | | 56 | | Executive Vice President, Human Resources |
Joseph M. Tucci has been the Chairman of the Board of Directors, since January 2006 and has been Chief Executive Officer and a Director since January 2001. He has served as President since January 2000. He also served as Chief Operating Officer from January 2000 to January 2001. Prior to joining EMC, Mr. Tucci served as Deputy Chief Executive Officer of Getronics N.V. (“Getronics”), an information technology services company, from June 1999 through December 1999 and as Chairman of the Board and Chief Executive Officer of Wang Global, an information technology services company, from December 1993 to June 1999. Getronics acquired Wang Global in June 1999. Mr. Tucci joined Wang Global in 1990 as its Executive Vice President, Operations. Mr. Tucci is also a director of Paychex, Inc., a provider of payroll, human resources and benefits outsourcing solutions.
William J. Teuber, Jr. has been our Vice Chairman since May 2006. Mr. Teuber served as our Vice Chairman and Chief Financial Officer from May 2006 to August 2006 and as Executive Vice President and Chief Financial Officer from November 2001 to May 2006. He served as Senior Vice President and Chief Financial Officer from February 2000 to November 2001, as Vice President and Chief Financial Officer from February 1997 to February 2000, and as Vice President and Controller from August 1995 to February 1997. Mr. Teuber is a director of Popular, Inc., a financial holding company.
Arthur W. Coviello, Jr. has been our Executive Vice President and President of RSA, the Security Division of EMC, since September 2006. Prior to joining EMC, Mr. Coviello served as Chief Executive Officer of RSA Security Inc. from January 2000 to September 2006 and as acting Chief Financial Officer of RSA Security from December 2005 to May 2006. He served as President of RSA Security from March 1999 to September 2006, Executive Vice President of RSA Security from September 1995 to March 1999, Chief Operating Officer of RSA Security from January 1997 to March 1999; and Chief Financial Officer and Treasurer of RSA Security from October 1995 to August 1997. Mr. Coviello served as Chief Operating Officer and Chief Financial Officer, among other capacities, for CrossComm Corporation, a developer of internet working products, from March 1992 through August 1995.
Paul T. Dacier has been our Executive Vice President and General Counsel, since May 2006. Mr. Dacier served as Senior Vice President and General Counsel from February 2000 to May 2006. He served as Vice President and General Counsel from February 1993 to February 2000 and as General Counsel of EMC from March 1990 to February 1993.
David G. DeWalt has been our Executive Vice President and President, Customer Operations and Content Management Software, since August 2006. Mr. DeWalt served as Executive Vice President and President, EMC Software Group from July 2004 to August 2006. He served as Executive Vice President and President of our Documentum division from December 2003 to July 2004. Prior to joining EMC, Mr. DeWalt served as President and Chief Executive Officer of Documentum, Inc. (“Documentum”) from July 2001 to December 2003, Executive Vice President and Chief Operating Officer of Documentum, from October 2000 to July 2001 and Executive Vice President and General Manager, eBusiness Unit of Documentum, from August 1999 to October 2000. Prior to joining Documentum in 1999, Mr. DeWalt was the Founding Principal and Vice President of Eventus Software, a Web content software company, from August 1997 to December 1998. Following Eventus’ 1998 acquisition by Segue Software, an e-business software company, Mr. DeWalt served as Vice President, North American Sales for Segue. Mr. DeWalt is a director of Polycom, Inc., a provider of video, voice, data and Web conferencing collaboration solutions.
David A. Donatelli has been our Executive Vice President, Storage Product Platforms, since August 2006. Mr. Donatelli served as Executive Vice President, Storage Platforms Operations, from November 2001 to August 2006. He served as Senior Vice
14
President, Corporate Marketing and New Business Development, from April 2001 to November 2001, Senior Vice President, New Business Development, from February 2000 to April 2001 and as Vice President, New Business Development, from April 1999 to February 2000. He has also held a number of other executive positions since he joined EMC in 1987, including serving as Vice President, General Manager of our EDM business from September 1996 to April 1999 and as Vice President of Global Alliances from February 1996 to November 1998.
Howard D. Elias has been our Executive Vice President, Global Services and Resource Management Software Group, since May 2006. Mr. Elias served as our Executive Vice President, Global Marketing and Corporate Development from January 2006 to May 2006. He served as Executive Vice President, Corporate Marketing, Office of Technology and New Business Development, from January 2004 to January 2006. He served as Executive Vice President, New Ventures and Office of Technology, from September 2003 to January 2004. Prior to joining EMC, Mr. Elias served as Senior Vice President of Business Management and Operations in the Enterprise Systems Group at Hewlett-Packard Company (“Hewlett-Packard”), a provider of information technology products, services and solutions for enterprise customers, from May 2003 to August 2003 and Senior Vice President and General Manager of Network Storage Solutions from May 2002 to April 2003. Prior to Hewlett-Packard’s acquisition of Compaq Computer Corporation (“Compaq”), Mr. Elias served as Senior Vice President and General Manager of Compaq’s Business Critical Server Group from January 2001 to April 2002. He served as Vice President and General Manager in the Storage Products Division of Compaq from 1998 to 2000.
David I. Goulden has been our Executive Vice President and Chief Financial Officer since August 2006. Mr. Goulden served as our Executive Vice President, Customer Operations from April 2004 to August 2006. He served as Executive Vice President, Customer Solutions and Marketing and New Business Development from November 2003 to April 2004 and as Executive Vice President, Global Marketing and New Business Development from July 2002 to November 2003. Prior to joining EMC, Mr. Goulden served as a member of the Board of Management, President and Chief Operating Officer for the Americas and Asia Pacific of Getronics, an information technology services company, from April 2000 to July 2002, as President and Chief Operating Officer for the Americas of Getronics from June 1999 to April 2000, and in a number of executive positions at Wang Global, an information technology services company, from September 1990 to June 1999. Getronics acquired Wang Global in June 1999.
Diane Greene has served as Executive Vice President of EMC since January 2005 and as President of our VMware subsidiary since January 2004. Ms. Greene was a founder of VMware and served as its President and CEO from its inception in 1998 to January 2004. Ms. Greene is a director of Intuit Inc., a provider of business, financial management and tax solutions for small businesses, consumers and accountants.
Frank M. Hauck has been our Executive Vice President, Global Marketing and Customer Quality, since May 2006. Mr. Hauck served as Executive Vice President, Customer Quality and Services from April 2005 to May 2006. He served as Executive Vice President, Customer Operations, from November 2001 to April 2005. Mr. Hauck served as Executive Vice President, Global Sales and Services, from April 2001 to November 2001 and as Executive Vice President, Products and Offerings, from June 2000 to April 2001. He served as Senior Vice President and Chief Information Officer from January 2000 to June 2000, as Senior Vice President, Business Integration, from July 1999 to January 2000, and as Senior Vice President, Customer Service, from November 1997 to July 1999. Mr. Hauck has also held a number of other executive positions since he joined EMC in 1990.
Mark S. Lewis has been our Executive Vice President, Chief Development Officer since May 2005. Mr. Lewis served as Executive Vice President, EMC Software Group from July 2004 to May 2005. Mr. Lewis served as Executive Vice President, Open Software Operations, from July 2003 to July 2004 and as Executive Vice President, New Ventures and Chief Technology Officer from July 2002 to July 2003. Prior to joining EMC, Mr. Lewis served as Vice President of Worldwide Marketing and Solutions in the Network Storage Solutions Group at Hewlett-Packard. Prior to Hewlett-Packard’s acquisition of Compaq, Mr. Lewis served as Vice President and General Manager of Compaq’s Enterprise Storage Group from January 2001 to April 2002. Prior to joining Compaq, Mr. Lewis spent fourteen years at Digital Equipment Corporation, where he helped develop the StorageWorks product line.
John T. Mollen has been our Executive Vice President, Human Resources since May 2006. Mr. Mollen joined EMC as Senior Vice President, Human Resources in September 1999. Prior to joining EMC, he was Vice President of Human Resources with Citigroup Inc., a financial services company.
AutoSwap, EMC, CLARiiON, Captiva, Celerra, Centera, Connectrix, DatabaseXtender, Direct Matrix Architecture, DMX, Documentum, EMC ControlCenter, EMC Proven, EDM, EmailXtender, Insignia, LEGATO, NetWin, Open Replicator, RSA, Rainfinity, SRDF, Symmetrix and VMware are either registered trademarks or trademarks of EMC Corporation. Other trademarks are either registered trademarks or trademarks of their respective owners.
15
PART II
| ITEM 5. | MARKET FOR THE REGISTRANT’S COMMON EQUITY, RELATED STOCKHOLDER MATTERS AND ISSUER PURCHASES OF EQUITY SECURITIES |
Our common stock, par value $.01 per share, trades on the New York Stock Exchange under the symbol EMC.
The following table sets forth the range of high and low sales prices of our common stock on the New York Stock Exchange for the past two years during the fiscal periods shown.
| | | | | | |
Fiscal 2006
| | High
| | Low
|
First Quarter | | $ | 14.75 | | $ | 13.05 |
Second Quarter | | | 13.99 | | | 10.11 |
Third Quarter | | | 12.09 | | | 9.44 |
Fourth Quarter | | | 13.79 | | | 11.69 |
| | |
Fiscal 2005
| | High
| | Low
|
First Quarter | | $ | 15.09 | | $ | 11.79 |
Second Quarter | | | 14.88 | | | 11.10 |
Third Quarter | | | 14.78 | | | 12.05 |
Fourth Quarter | | | 14.55 | | | 12.70 |
We had 14,919 holders of record of our common stock as of February 26, 2007.
We have never paid cash dividends on our common stock. While subject to periodic review, the current policy of our Board of Directors is to retain cash and investments primarily to provide funds for our future growth. Additionally, we use cash to repurchase our common stock.
EQUITY COMPENSATION PLAN INFORMATION
The following table sets forth certain information regarding EMC’s equity compensation plans as of December 31, 2006.
| | | | | | | | |
Plan Category
| | Number of securities to be issued upon exercise of outstanding options, warrants and rights(1)
| | Weighted-average exercise price per share of outstanding options, warrants and rights(1)
| | Number of securities remaining available for future issuance under equity compensation plans (excluding securities reflected in column (a))
| |
Equity compensation plans approved
by security holders | | (a) 262,292,697 | |
$ | (b) 18.56 | | (c) 72,971,457 |
(2) |
Equity compensation plans not
approved by security holders(3) | | 50,000 | | $ | 21.83 | | 0 | |
| | |
| | | | |
|
|
Total: | | 262,342,697 | | $ | 18.56 | | 72,971,457 | |
| | |
| | | | |
|
|
| | (1) | Does not include an aggregate of 40,841,483 shares of common stock to be issued (subject to vesting) upon the exercise of outstanding option grants, with a weighted-average exercise price of $8.42 per share, assumed by EMC in connection with various acquisitions. The option plans relating to such outstanding options were approved by the respective security holders of the acquired companies. |
| | (2) | Includes 4,992,302 shares of common stock available for future issuance under our employee stock purchase plan. Also includes up to 28,206,776 shares available for future issuance under the 2003 Stock Plan in the form of awards of restricted stock or restricted stock units. |
| | (3) | In January 1999 and January 2002, EMC entered into Stock Option Agreements with its Secretary, pursuant to which EMC granted to such person non-qualified options to purchase 40,000 and 10,000 shares, respectively, of common stock. Such option grants did not receive shareholder approval. The options are exercisable in annual increments of 20% over a five-year period and will expire on the tenth anniversary of the respective dates of grant; provided, however, that if the option holder ceases to serve as an officer of EMC for any reason, the options will terminate on the date such service terminates with respect to any shares subject to the options, whether such shares are vested or unvested on such date. The exercise price for the options are $23.39 and $15.60 per share, respectively. As of December 31, 2006, an aggregate of 50,000 shares of common stock were issuable (subject to vesting) upon the exercise of the options. |
16
ISSUER PURCHASES OF EQUITY SECURITIES IN THE FOURTH QUARTER OF 2006
| | | | | | | | | | |
Period
| | Total Number
of Shares
Purchased(1)
| | | Average Price Paid per Share
| | Total Number of
Shares Purchased as
Part of Publicly
Announced Plans or
Programs
| | Maximum Number (or
Approximate Dollar
Value) of Shares that
May Yet Be Purchased
Under the Plans or Programs
|
October 1, 2006 – October 31, 2006 | | 19,679,292 | | | $ | 12.44 | | 19,675,000 | | 140,189,363 |
November 1, 2006 – November 30, 2006 | | 75,000,000 | (2) | | | 12.61 | | — | | 140,189,363 |
December 1, 2006 – December 31, 2006 | | — | | | | — | | — | | — |
| | |
|
| | | | |
| | |
Total | | 94,679,292 | (3) | | $ | 12.57 | | 19,675,000 | | 140,189,363 |
| | |
|
| | | | |
| | |
| | (1) | Except as noted in notes (2) and (3), all shares were purchased in open-market transactions pursuant to previously announced authorizations by our Board of Directors in October 2002 and April 2006 to repurchase 500.0 million shares of our common stock. These repurchase authorizations do not have a fixed termination date. |
| | (2) | In November 2006, our Board of Directors approved a one-time authorization to repurchase up to 100.0 million shares of our common stock in conjunction with the issuance of our $1.725 billion 1.75% convertible senior notes due 2011 and our $1.725 billion 1.75% convertible senior notes due 2013. |
| | (3) | Includes an aggregate of 4,292 shares withheld from employees for the payment of taxes. |
17
| ITEM 6. | SELECTED CONSOLIDATED FINANCIAL DATA |
FIVE YEAR SELECTED CONSOLIDATED FINANCIAL DATA
(in thousands, except per share amounts)
| | | | | | | | | | | | | | | | |
| | | Year Ended December 31,
| |
| | | 2006(1)(2)
| | 2005(3)
| | 2004(4)
| | 2003(5)
| | 2002
| |
Summary of Operations: | | | | | | | | | | | | | | | | |
Revenues | | $ | 11,155,090 | | $ | 9,663,955 | | $ | 8,229,488 | | $ | 6,236,808 | | $ | 5,438,352 | |
Operating income (loss) | | | 1,207,758 | | | 1,480,422 | | | 1,043,993 | | | 401,157 | | | (493,831 | ) |
Net income (loss) | | | 1,223,982 | | | 1,133,165 | | | 871,189 | | | 496,108 | | | (118,706 | ) |
Net income (loss) per weighted
average share, basic | | $ | 0.54 | | $ | 0.48 | | $ | 0.36 | | $ | 0.22 | | $ | (0.05 | ) |
Net income (loss) per weighted
average share, diluted | | $ | 0.54 | | $ | 0.47 | | $ | 0.36 | | $ | 0.22 | | $ | (0.05 | ) |
Weighted average shares,
basic | | | 2,248,431 | | | 2,382,977 | | | 2,402,198 | | | 2,211,544 | | | 2,206,294 | |
Weighted average shares,
diluted | | | 2,286,304 | | | 2,432,582 | | | 2,450,570 | | | 2,237,656 | | | 2,206,294 | |
Balance Sheet Data: | | | | | | | | | | | | | | | | |
Working capital | | $ | 2,639,483 | | $ | 2,900,118 | | $ | 1,882,226 | | $ | 2,140,775 | | $ | 2,175,598 | |
Total assets | | | 18,566,247 | | | 16,790,383 | | | 15,422,906 | | | 14,092,860 | | | 9,590,447 | |
Long-term obligations(6) | | | 3,454,665 | | | 129,994 | | | 130,844 | | | 132,634 | | | 6,963 | |
Stockholders’ equity | | | 10,325,707 | | | 12,065,430 | | | 11,523,287 | | | 10,884,721 | | | 7,226,002 | |
| | (1) | In 2006, EMC adopted FAS No. 123R “Share-based Payment” which requires the expensing of stock options. As a result of adopting the new standard, Operating income decreased by $241.6 million, Net income decreased by $204.5 million, Net income per weighted average share, basic decreased by $0.10 and Net income per weighted average share, diluted decreased by $0.09. |
| | (2) | In 2006, EMC acquired all of the outstanding shares of RSA Security Inc. (“RSA”), Network Intelligence Corporation (“Network Intelligence”), Kashya, Inc. (“Kashya”), Interlink Group, Inc. (“Interlink”), nLayers Ltd. (“nLayers”), Akimbi Systems, Inc. (“Akimbi”) and Avamar Technologies, Inc. (“Avamar”) and acquired the assets of ProActivity Software Solutions Ltd., (“ProActivity”) (see Note B to the Consolidated Financial Statements). |
| | (3) | In 2005, EMC acquired all of the outstanding shares of System Management Arts Incorporated (“Smarts”) and Captiva Software Corporation (“Captiva”) (see Note B to the Consolidated Financial Statements). |
| | (4) | In 2004, EMC acquired all of the outstanding shares of VMware, Inc. (“VMware”) (see Note B to the Consolidated Financial Statements). |
| | (5) | In 2003, EMC acquired all of the outstanding shares of LEGATO Systems, Inc. (“LEGATO”) and Documentum, Inc. (“Documentum”). |
| | (6) | Includes long-term convertible debt and capital leases, excluding current portion. |
18
| ITEM 7. | MANAGEMENT’S DISCUSSION AND ANALYSIS OF FINANCIAL CONDITION AND RESULTS OF OPERATIONS |
This Management’s Discussion and Analysis (“MD&A”) of Financial Condition and Results of Operations should be read in conjunction with our consolidated financial statements and notes thereto which appear elsewhere in this Annual Report on Form 10-K. The following discussion contains forward-looking statements and should also be read in conjunction with the risk factors set forth in Item 1A. The forward-looking statements do not include the potential impact of any mergers, acquisitions, divestitures, securities offerings or business combinations that may be announced or consummated after the date hereof.
All dollar amounts in this MD&A are in millions, except per share amounts.
Certain tables may not add due to rounding.
INTRODUCTION
Our financial objective is to achieve profitable growth. Management believes that by providing a combination of systems, software, services and solutions to meet customers’ needs, we will be able to further profitably increase revenues. Our efforts over the past few years have been primarily focused on growing revenues by enhancing and expanding our portfolio of offerings to satisfy our customers’ information infrastructure requirements. We have increased our overall investment in research and development (“R&D”) from $847.9 in 2004 to $1,254.2 in 2006. These R&D expenditures have enabled us to introduce new and enhanced offerings. We have also made acquisitions over the past three years to expand our offerings.
Additionally, as further discussed below, in 2006 we implemented an integration plan for EMC and most of the acquisitions we have made over the past three years. The objectives of the plan are to improve efficiencies across our business and reduce costs, while helping us to present a more unified “One EMC” appearance to our customers.
Through a combination of increasing our revenues and controlling the level of cost increases, our objective is to increase our overall level of profitability.
RESULTS OF OPERATIONS
Revenues
In the fourth quarter of 2006, we realigned our business into four segments: Information storage, Content management and archiving, VMware virtual infrastructure and RSA information security. We have conformed our prior period presentations to be consistent with our current segments. The following table presents revenue by our segments:
| | | | | | | | | | | | | | | |
| | | | | | | | | Percentage Change
| |
| | | 2006
| | 2005
| | 2004
| | 2006 vs 2005
| | | 2005 vs 2004
| |
Information storage | | $ | 9,608.6 | | $ | 8,792.2 | | $ | 7,615.0 | | 9.3 | % | | 15.5 | % |
Content management and archiving | | | 685.8 | | | 484.3 | | | 396.3 | | 41.6 | | | 22.2 | |
VMware virtual infrastructure | | | 709.0 | | | 387.5 | | | 218.2 | | 83.0 | | | 77.6 | |
RSA information security | | | 151.7 | | | — | | | — | | NM | | | NM | |
| | |
|
| |
|
| |
|
| |
|
| |
|
|
Total revenues | | $ | 11,155.1 | | $ | 9,664.0 | | $ | 8,229.5 | | 15.4 | % | | 17.4 | % |
| | |
|
| |
|
| |
|
| |
|
| |
|
|
NM – not measurable
The Information storage segment revenues include systems, software license and services revenues. Systems revenues were $5,124.8, $4,486.9 and $3,871.0 in 2006, 2005 and 2004, respectively, representing increases of 14.2% in 2006 and 15.9% in 2005. The increases in 2006 and 2005 were due to greater demand for these products attributable to wider acceptance of information lifecycle management-based solutions, a broadened product portfolio, increased demand for IT infrastructure and new and enhanced distribution channels. Software license revenues were $2,015.3, $2,005.9 and $1,813.1 in 2006, 2005 and 2004, respectively, representing increases of 0.5% in 2006 and 10.6% in 2005. Software license revenues increased in 2006 compared to 2005 primarily due to higher demand for our resource management software and backup and recovery software. This increase was partially offset by a decrease in platform-based software revenues due to a change in the mix of mid-range information storage systems sold resulting in more lower-end units with a decreased software content. Additionally, within our high-end storage system product line, we sold a greater proportion of larger systems in 2006 compared to 2005 which resulted in less platform-based software revenues. The increase in 2005 software license revenues compared to 2004 was attributable to higher platform-based
19
software revenues due to an expanded product offering, a greater demand for software to manage increasingly complex high-end and midrange networked storage environments and new and enhanced distribution channels. Services revenues were $2,468.5, $2,299.4 and $1,930.9 in 2006, 2005 and 2004, respectively, representing increases of 7.4% in 2006 and 19.1% in 2005. Services revenues consist of software and hardware maintenance and professional services revenues. Services revenues increased in both 2006 and 2005 due to greater demand for our software support. Additionally, increased demand for professional services, largely to support and implement information lifecycle management-based solutions, contributed to the increase. The increase in 2005 services revenues was also impacted by greater demand for hardware maintenance contracts associated with increased sales of information storage systems. Partially offsetting the increases in services revenues in 2006 and 2005 was a decrease in AViiON maintenance services revenues. These revenues are expected to continue to decline in future years, as we have discontinued selling AViiON servers.
The Content management and archiving segment revenues include software license and services revenues. Software license revenues were $323.6, $228.7 and $192.7 in 2006, 2005 and 2004, respectively, representing increases of 41.5% in 2006 and 18.7% in 2005. Software license revenue increased in 2006 and 2005 primarily due to greater demand for content management software. Software license revenues for 2006 were favorably impacted by $63.7 from the Captiva acquisition which was completed in December 2005. Services revenues were $353.6, $255.5 and $203.6 in 2006, 2005 and 2004, respectively, representing increases of 38.4% in 2006 and 25.5% in 2005. The increase in services revenues in 2006 and 2005 was primarily attributable to higher software maintenance revenues and higher professional services revenues. Services revenues for 2006 were favorably impacted by $38.1 from the Captiva acquisition.
The VMware virtual infrastructure segment revenues include software license and services revenues. Software license revenues were $494.6, $287.5 and $178.3 in 2006, 2005 and 2004, respectively, representing increases of 72.0% in 2006 and 61.2% in 2005. The software license revenue increases in 2006 and 2005 were attributable to increased demand for virtual infrastructure software and the introduction of new product offerings. Services revenues were $214.4, $99.9 and $39.9 in 2006, 2005 and 2004, respectively, representing increases of 114.6% in 2006 and 150.4% in 2005. The increases in 2006 and 2005 were primarily due to higher software maintenance revenues associated with the growth in sales of virtualization software product offerings.
The RSA information security segment was created during the third quarter of 2006 as a result of our acquisitions of RSA and Network Intelligence. The RSA information security segment provides technologies to secure information no matter where it resides or travels inside or outside of an organization and throughout its lifecycle and includes systems, software license, software maintenance and other services revenues. Total revenues for the period from the dates of acquisition through December 31, 2006 were $151.7.
Revenues by geography were as follows:
| | | | | | | | | | | | | | | |
| | | | | | | | | Percentage Change
| |
| | | 2006
| | 2005
| | 2004
| | 2006 vs 2005
| | | 2005 vs 2004
| |
United States | | $ | 6,319.7 | | $ | 5,468.6 | | $ | 4,631.3 | | 15.6 | % | | 18.1 | % |
Europe, Middle East and Africa | | | 3,232.6 | | | 2,743.8 | | | 2,355.9 | | 17.8 | | | 16.5 | |
Asia Pacific | | | 1,126.2 | | | 1,061.2 | | | 926.0 | | 6.1 | | | 14.6 | |
Latin America, Mexico and Canada | | | 476.6 | | | 390.3 | | | 316.3 | | 22.1 | | | 23.4 | |
Revenue increased in 2006 and 2005 in all of our markets due to greater demand for our products and services. The lower growth rate in the Asia Pacific markets in 2006 was primarily attributable to lower levels of demand in Japan. Changes in exchange rates adversely impacted revenue growth by 0.2% in 2006 and positively impacted revenue growth by 0.8% in 2005 and 3.7% in 2004. The impact of the change in rates in 2006 was most significant in the Asia Pacific market, primarily Japan. In 2005 and 2004, the impact of the change in rates was most significant in the European market, primarily Germany, France, Italy and the United Kingdom.
Costs and expenses
Our results of operations were impacted by a significant increase in stock-based compensation expense as a result of our adoption of Financial Accounting Standards Board (“FASB”) Statement No. 123R, “Share-Based Payment” (“FAS No. 123R”) for 2006, as described further below. We selected the modified prospective transition method of adoption, which does not result in the restatement of results from prior periods, and accordingly, our gross and operating margins as a percentage of total revenue declined during 2006 compared to 2005. We do not expect a similar type of decline to occur in 2007 because both the 2006 and 2007 results will include the effect of accounting for stock-based compensation under FAS No. 123R.
20
FAS No. 123R requires recognizing compensation costs for all share-based payment awards made to employees and directors based upon the award’s estimated grant date fair value. The standard covers employee stock options, restricted stock, restricted stock units and employee stock purchases related to our employee stock purchase plan (“ESPP”). Additionally, we applied the provisions of the SEC’s Staff Accounting Bulletin (“SAB”) No. 107 on Share-Based Payment to our adoption of FAS No. 123R. Previously, we elected to account for these share-based payment awards under Accounting Principles Board Opinion No. 25, “Accounting for Stock Issued to Employees” (“APB No. 25”), and elected to only disclose the pro forma impact of expensing the fair value of stock options in the notes to the financial statements.
Total after-tax stock-based compensation expense, which consists of expense from employee stock options, ESPP and restricted stock awards, was $317.3 in 2006. For periods prior to our adoption of FAS No. 123R on January 1, 2006, stock-based compensation expense consisted of expense from restricted stock awards and the amortization of deferred compensation costs associated with stock options issued as consideration in various acquisitions. Accordingly, our financial results in 2006 were not prepared on a comparative basis to our financial results in 2005 and 2004. Total after-tax stock-based compensation expense in 2005 and 2004 was $52.1 and $40.3, respectively.
We elected to estimate the fair value of employee stock option awards and ESPP purchases using the Black-Scholes model. The determination of the fair value of share-based payment awards on the date of grant using the Black-Scholes model is affected by our stock price as well as assumptions regarding a number of subjective variables. These variables include the expected term of the awards, the expected stock price volatility over the term of the awards, the risk-free interest rate associated with the expected term of the awards and the expected dividends.
In 2006, our Black-Scholes option model included the following weighted average assumptions for our employee stock options and ESPP:
| | | | | | |
| | | Stock Options
| | ESPP
|
Dividend yield | | | None | | | None |
Expected volatility | | | 35.2% | | | 27.6% |
Risk-free interest rate | | | 4.80% | | | 4.82% |
Expected life (in years) | | | 4.0 | | | 0.5 |
Weighted-average fair value at grant date | | $ | 3.80 | | $ | 2.89 |
To determine an expected volatility assumption required in the Black-Scholes option pricing model, we used a combination of implied volatility for six-month and two-year traded options on our stock as well as our historical stock price volatility. The expected term assumption is based upon actual historical exercises and cancellations of EMC stock options. We are using the same methodology to calculate expected volatility and expected term that was used prior to our adoption of FAS No. 123R. The risk-free interest rate assumption is based upon observed interest rates appropriate for the expected term of our employee stock options and ESPP. The dividend yield assumption is based on the history and expectation of dividend payouts. Stock-based compensation expense recognized within a given reporting period is based on awards that are expected to vest in current or future periods. Accordingly, recognized stock-based compensation expense from stock options and ESPP is reduced for expected forfeitures. FAS No. 123R requires forfeitures to be estimated at the time of grant and revised, if necessary, in subsequent periods if actual forfeitures differ from those estimates. Forfeitures were estimated based on historical experience. See Note N to the Consolidated Financial Statements for more information regarding our implementation of FAS No. 123R.
21
The following table presents our costs and expenses, other income and net income.
| | | | | | | | | | | | | | | | | | |
| | | | | | | | | | | | Percentage Change
| |
| | | 2006
| | | 2005
| | | 2004
| | | 2006 vs 2005
| | | 2005 vs 2004
| |
Cost of revenue: | | | | | | | | | | | | | | | | | | |
Information storage | | $ | 4,710.8 | | | $ | 4,198.6 | | | $ | 3,807.1 | | | 12.2 | % | | 10.3 | % |
Content management and archiving | | | 225.8 | | | | 149.5 | | | | 109.0 | | | 51.0 | | | 37.2 | |
VMware virtual infrastructure | | | 107.0 | | | | 45.3 | | | | 18.1 | | | 136.2 | | | 150.3 | |
RSA information security | | | 37.7 | | | | — | | | | — | | | NM | | | NM | |
Corporate reconciling items | | | 160.6 | | | | 77.7 | | | | 80.6 | | | 106.7 | | | (3.6 | ) |
| | |
|
|
| |
|
|
| |
|
|
| |
|
| |
|
|
Total cost of revenue | | | 5,241.9 | | | | 4,471.1 | | | | 4,014.9 | | | 17.2 | | | 11.4 | |
Gross margins: | | | | | | | | | | | | | | | | | | |
Information storage | | | 4,897.8 | | | | 4,593.6 | | | | 3,807.9 | | | 6.6 | | | 20.6 | |
Content management and archiving | | | 460.0 | | | | 334.8 | | | | 287.3 | | | 37.4 | | | 16.5 | |
VMware virtual infrastructure | | | 602.0 | | | | 342.2 | | | | 200.0 | | | 75.9 | | | 71.1 | |
RSA information security | | | 114.0 | | | | — | | | | — | | | NM | | | NM | |
Corporate reconciling items | | | (160.6 | ) | | | (77.7 | ) | | | (80.6 | ) | | (106.7 | ) | | 3.6 | |
| | |
|
|
| |
|
|
| |
|
|
| |
|
| |
|
|
Total gross margin | | | 5,913.2 | | | | 5,192.8 | | | | 4,214.6 | | | 13.9 | | | 23.2 | |
| | | | | |
Operating expenses: | | | | | | | | | | | | | | | | | | |
Research and development | | | 1,254.2 | | | | 1,004.8 | | | | 847.9 | | | 24.8 | | | 18.5 | |
Selling, general and administrative | | | 3,253.3 | | | | 2,606.0 | | | | 2,266.7 | | | 24.8 | | | 15.0 | |
In-process research and development | | | 35.4 | | | | 17.4 | | | | 17.4 | | | 103.4 | | | — | |
Restructuring charges | | | 162.6 | | | | 84.2 | | | | 38.6 | | | 93.1 | | | 118.1 | |
| | |
|
|
| |
|
|
| |
|
|
| |
|
| |
|
|
Total operating expenses | | | 4,705.4 | | | | 3,712.4 | | | | 3,170.6 | | | 26.7 | | | 17.1 | |
| | |
|
|
| |
|
|
| |
|
|
| |
|
| |
|
|
Operating income | | | 1,207.8 | | | | 1,480.4 | | | | 1,044.0 | | | (18.4 | ) | | 41.8 | |
Investment income, interest expense and other expenses | | | 182.3 | | | | 171.8 | | | | 141.0 | | | 6.1 | | | 21.8 | |
| | |
|
|
| |
|
|
| |
|
|
| |
|
| |
|
|
Income before taxes and cumulative effect of a change in accounting principle | | | 1,390.0 | | | | 1,652.2 | | | | 1,185.0 | | | (15.9 | ) | | 39.4 | |
Provision for income taxes | | | 162.7 | | | | 519.1 | | | | 313.8 | | | (68.7 | ) | | 65.4 | |
| | |
|
|
| |
|
|
| |
|
|
| |
|
| |
|
|
Income before cumulative effect of a change in accounting principle | | | 1,227.4 | | | | 1,133.2 | | | | 871.2 | | | 8.3 | | | 30.1 | |
Cumulative effect of a change in accounting principle | | | (3.4 | ) | | | — | | | | — | | | NM | | | NM | |
| | |
|
|
| |
|
|
| |
|
|
| |
|
| |
|
|
Net income | | $ | 1,224.0 | | | $ | 1,133.2 | | | $ | 871.2 | | | 8.0 | % | | 30.1 | % |
| | |
|
|
| |
|
|
| |
|
|
| |
|
| |
|
|
NM – not measurable
Gross Margins
Our overall gross margin percentages were 53.0% in 2006, 53.7% in 2005 and 51.2% in 2004. Incremental stock-based compensation expense recognized within cost of product sales and cost of services as a result of adopting FAS No. 123R was $53.9 in 2006, negatively impacting our overall gross margin by 0.5%. Additionally, our overall gross margin in 2006 was negatively impacted 1.3% by the Information storage segment and 0.2% by increases in intangible amortization expense associated with acquisitions. Our overall gross margin in 2006 was favorably impacted 0.8% by the VMware virtual infrastructure segment, 0.2% by the Content management and archiving segment and 0.3% by the incremental margin generated from the RSA information security segment as a result of the acquisitions of RSA and Network Intelligence during the third quarter of 2006. Our overall gross margin in 2005 was favorably impacted 1.9% by the Information storage segment and 0.6% by the VMware virtual infrastructure segment. The Content management and archiving segment had a neutral impact on our overall gross margin in 2005 compared to 2004.
For segment reporting purposes, stock-based compensation and acquisition-related intangible asset amortization are recognized as corporate expenses and are not allocated among our various operating segments. Stock-based compensation expense and acquisition-related intangible asset amortization expense was $160.6, $77.7 and $80.6 in 2006, 2005 and 2004, respectively. Acquisition-related intangible asset amortization expense was $94.3, $72.5 and $75.7 in 2006, 2005 and 2004, respectively. The increase in 2006 compared to 2005 was primarily due to the impact of the acquisitions of Captiva in December 2005 and RSA in September 2006. Stock-based compensation expense was $66.3, $5.2 and $4.9 in 2006, 2005 and 2004, respectively. The stock-based compensation expense increase in 2006 was primarily due to the adoption of FAS No. 123R.
22
Gross margin percentages for the Information storage segment were 51.0%, 52.2% and 50.0% in 2006, 2005 and 2004, respectively. The decrease in the gross margin percentage in 2006 was attributable to a reduction in the mix of software license revenues as a percentage of total segment revenues, to 21.0% in 2006 from 22.8% in 2005. Software license revenues generally provide a higher gross margin percentage than systems revenues and services revenues. Additionally, margins generated on both our maintenance and professional services businesses decreased due to increased labor and third party maintenance costs. The increase in the gross margin percentage in 2005 was attributable to achieving higher sales volumes while at the same time improving our manufacturing cost structure. Provisions for product warranties, which reduce storage gross margins, were $127.4 in 2005 and $146.5 in 2004. In 2005, as a result of cost control efforts, we were able to reduce the cost of fulfilling our service obligations. These efforts reduced the provision as a percentage of systems revenues to 2.8% in 2005 compared to 3.8% in 2004. The gross margin percentage in 2005 was also favorably impacted by improvements in the gross margin percentages earned from professional services which resulted primarily from reducing our services cost structure and an increase in the mix of software maintenance revenues as a percentage of total services revenue. Software maintenance revenues generally provide a higher gross margin percentage than other services revenues.
The gross margin percentages for the Content management and archiving segment were 67.1%, 69.1% and 72.5% in 2006, 2005 and 2004, respectively. The decrease in gross margin percentage in 2006 was primarily attributable to lower margins generated on our professional services businesses due to increased labor costs as well as higher amortization expense from increased capitalized software development costs. Partially offsetting the decrease in gross margin percentage was a 1.7% favorable impact due to the Captiva acquisition which was completed in December 2005. The decrease in gross margin percentage in 2005 was primarily due to a reduction in the mix of software license revenues as a percentage of total segment revenues. Software license revenues as a percentage of total segment revenues declined to 47.2% in 2005 from 48.6% in 2004. Software license revenues generally provide a higher gross margin percentage than services revenues. Additionally, higher amortization expense associated with increased capitalized software development costs contributed to the decrease in gross margin percentage.
The gross margin percentage for the VMware virtual infrastructure segment was 84.9% in 2006, 88.3% in 2005 and 91.7% for 2004. The decrease in the gross margin percentages in both 2006 and 2005 was attributable to a reduction in the mix of software license revenues as a percentage of total segment revenues. Software license revenues as a percentage of total segment revenues declined to 69.8% in 2006 from 74.2% in 2005 and 81.7% in 2004. Software license revenues generally provide a higher gross margin percentage than services revenues.
The gross margin percentage for the RSA information security segment was 75.2% in 2006. The RSA information security segment was created during the third quarter of 2006 as a result of our acquisitions of RSA and Network Intelligence.
Research and Development
As a percentage of revenues, R&D expenses were 11.2%, 10.4% and 10.3% in 2006, 2005 and 2004, respectively. In addition, we incurred $215.6, $167.1 and $166.3 in 2006, 2005 and 2004, respectively, on software development costs which were capitalized. Software development costs increased from 2005 to 2006 due to increased development efforts across all of our segments. Incremental stock-based compensation expense recognized as a result of adopting FAS No. 123R was $52.5 in 2006, increasing R&D as a percentage of revenue by 0.5% compared to 2005. R&D spending includes research and development on new product offerings and enhancements to our software and information storage systems. In addition to incremental stock-based compensation expense, R&D expenses increased in 2006 compared to 2005 and 2005 compared to 2004 due to increased investments to support new product development and incremental R&D efforts resulting from the acquisitions of RSA in 2006 and Smarts and Captiva in 2005.
Selling, General and Administrative
As a percentage of revenues, selling, general and administrative (“SG&A”) expenses were 29.2%, 27.0% and 27.5% in 2006, 2005 and 2004, respectively. Incremental stock-based compensation expense recognized as a result of adopting FAS No. 123R was $131.9 in 2006, negatively impacting SG&A as a percentage of revenues by 1.2% compared to 2005. In addition to incremental stock-based compensation expense, the majority of the increase in SG&A expenses in 2006 compared to 2005 consisted of increases to support our newly acquired higher growth businesses. The expense increases were primarily incremental selling costs and salaries and benefits associated with personnel for these businesses. SG&A expenses increased in absolute dollars in 2005 compared to 2004 but decreased as a percentage of revenue as we achieved higher sales volumes while controlling our cost structure.
23
In-process Research and Development
In-process research and development (“IPR&D”) was $35.4, $17.4 and $17.4 in 2006, 2005 and 2004, respectively. The increase in IPR&D in 2006 compared to 2005 was primarily attributable to an increase in both the number of acquisitions and the R&D levels of businesses acquired.
Restructuring Charges
In 2006, 2005 and 2004, we incurred restructuring charges of $162.6, $84.2 and $38.6, respectively.
The 2006 charge consisted of $129.4 for employee termination benefits associated with a reduction in workforce plans, a $29.7 charge associated with abandoned assets for which we will no longer derive a benefit, a $5.7 charge associated with vacating excess facilities and a $10.9 charge for other contract terminations. Partially offsetting these amounts were net adjustments of $13.1 associated with prior years’ restructuring programs.
The 2005 charge consisted of $84.1 for employee termination benefits associated with workforce rebalancing and reductions in force efforts and $0.4 of costs associated with vacating excess facilities. Partially offsetting these amounts were net adjustments of $0.3 associated with prior years’ restructuring programs.
The 2004 charge consisted of $24.5 of employee termination benefits associated with reductions in force and $2.1 associated with vacating excess facilities. The remaining $12.0 of charges was associated with prior restructuring programs, primarily relating to additional rent expense for vacated facilities. The additional rent expense was attributable to a revised estimate of the time needed to sublet facilities.
The activity for each charge is explained in the following sections.
2006 Restructuring Programs
The activity for the 2006 restructuring programs for the year ended December 31, 2006 is presented below:
| | | | | | | | | | | | | |
Category
| | Initial
Provision
| | Utilization
During 2006
| | | Ending
Balance
| | Non-Cash
Portion of the
Provision
|
Workforce reductions | | $ | 129.4 | | $ | (1.5 | ) | | $ | 127.8 | | $ | 10.7 |
Asset impairment | | | 29.7 | | | (29.7 | ) | | | — | | | 29.7 |
Consolidation of excess facilities | | | 5.7 | | | (0.2 | ) | | | 5.5 | | | — |
Contractual and other obligations | | | 10.9 | | | (6.1 | ) | | | 4.8 | | | — |
| | |
|
| |
|
|
| |
|
| |
|
|
Total | | $ | 175.7 | | $ | (37.5 | ) | | $ | 138.2 | | $ | 40.4 |
| | |
|
| |
|
|
| |
|
| |
|
|
The 2006 restructuring programs included a workforce reduction that was finalized on December 29, 2006 and covers approximately 1,350 employees worldwide. The workforce reduction’s objective is to further integrate EMC and the majority of the businesses we have acquired over the past three years. These actions impacted our major business functions and major geographic regions. Approximately 70% of the affected employees are or were based in North America, excluding Mexico, and 30% are or were based in Europe, Latin America, Mexico and the Asia Pacific region. As of December 31, 2006, approximately 100 employees have been terminated.
The asset impairment charge of $29.7 consists primarily of internal infrastructure projects that management decided to no longer pursue. The impairment charge was equal to the amount by which the assets’ carrying amount exceeded its fair value, measured as the present value of their estimated discounted cash flows.
The restructuring programs impacted the Information storage and Content management and archiving segments. The workforce reductions include $10.7 of non-cash stock-based compensation expense.
The 2006 restructuring programs are expected to be completed by the end of 2007 with the remaining cash expenditures relating to workforce reduction expected to be substantially paid by the end of 2008. The expected cash impact of the 2006 restructuring charges is $135.3, of which $7.8 was paid in 2006.
24
2005 Restructuring Programs
The activity for the 2005 restructuring programs for the years ended December 31, 2006 and 2005 is presented below:
| | | | | | | | | | | | | | |
2006 Category
| | Beginning
Balance
| | Adjustments
to the
Provision
During 2006
| | | Utilization
During 2006
| | | Ending Balance
|
Workforce reductions | | $ | 79.8 | | $ | (2.3 | ) | | $ | (59.4 | ) | | $ | 18.0 |
Consolidation of excess facilities | | | — | | | 0.1 | | | | — | | | | 0.1 |
| | |
|
| |
|
|
| |
|
|
| |
|
|
Total | | $ | 79.8 | | $ | (2.2 | ) | | $ | (59.4 | ) | | $ | 18.2 |
| | |
|
| |
|
|
| |
|
|
| |
|
|
| | | | |
2005 Category
| | Initial
Provision
| | Adjustments
to the
Provision
During 2005
| | | Utilization
During 2005
| | | Ending Balance
|
Workforce reductions | | $ | 84.1 | | $ | — | | | $ | (4.4 | ) | | $ | 79.8 |
Consolidation of excess facilities | | | 0.4 | | | — | | | | (0.4 | ) | | | — |
| | |
|
| |
|
|
| |
|
|
| |
|
|
Total | | $ | 84.6 | | $ | — | | | $ | (4.8 | ) | | $ | 79.8 |
| | |
|
| |
|
|
| |
|
|
| |
|
|
The 2005 restructuring programs included two separate reductions in force, one that commenced in the first quarter of 2005 and a second that commenced in the fourth quarter of 2005, aggregating approximately 1,060 employees. These actions impacted our major business functions and major geographic regions. Approximately 67% of the affected employees were based in North America, excluding Mexico, and 33% were based in Europe, Latin America, Mexico and the Asia Pacific region. As of December 31, 2006, the restructuring programs had been substantially completed. The restructuring programs impacted the Information storage and Content management and archiving segments.
The adjustment to the provision in 2006 is primarily attributable to a decrease in the original number of individuals identified for termination and lower than expected severance benefits. The remaining cash expenditures relating to workforce reduction are expected to be substantially paid by the end of 2007. The expected cash impact of the 2005 restructuring charges is $78.3, of which $4.8 was paid in 2005 and $55.3 was paid in 2006.
2004 Restructuring Programs
The activity for the 2004 restructuring programs for the years ended December 31, 2006, 2005 and 2004 is presented below:
| | | | | | | | | | | | | | |
2006 Category
| | Beginning
Balance
| | Adjustments
to the
Provision
During 2006
| | | Utilization
During 2006
| | | Ending Balance
|
Workforce reductions | | $ | 5.7 | | $ | (2.2 | ) | | $ | (3.1 | ) | | $ | 0.5 |
Consolidation of excess facilities | | | 0.1 | | | (0.1 | ) | | | — | | | | — |
| | |
|
| |
|
|
| |
|
|
| |
|
|
Total | | $ | 5.8 | | $ | (2.3 | ) | | $ | (3.1 | ) | | $ | 0.5 |
| | |
|
| |
|
|
| |
|
|
| |
|
|
| | | | |
2005 Category
| | Beginning
Balance
| | Adjustments
to the
Provision
During 2005
| | | Utilization
During 2005
| | | Ending Balance
|
Workforce reductions | | $ | 16.4 | | $ | (1.1 | ) | | $ | (9.6 | ) | | $ | 5.7 |
Consolidation of excess facilities | | | 1.7 | | | (0.5 | ) | | | (1.1 | ) | | | 0.1 |
| | |
|
| |
|
|
| |
|
|
| |
|
|
Total | | $ | 18.0 | | $ | (1.5 | ) | | $ | (10.7 | ) | | $ | 5.8 |
| | |
|
| |
|
|
| |
|
|
| |
|
|
| | | | |
2004 Category
| | Initial
Provision
| | Adjustments
to the
Provision
During 2004
| | | Utilization
During 2004
| | | Ending Balance
|
Workforce reductions | | $ | 26.8 | | $ | (2.4 | ) | | $ | (8.1 | ) | | $ | 16.4 |
Consolidation of excess facilities | | | 2.2 | | | (0.1 | ) | | | (0.5 | ) | | | 1.7 |
| | |
|
| |
|
|
| |
|
|
| |
|
|
Total | | $ | 29.0 | | $ | (2.4 | ) | | $ | (8.6 | ) | | $ | 18.0 |
| | |
|
| |
|
|
| |
|
|
| |
|
|
25
The 2004 restructuring programs included two separate reductions in force, one that commenced in the first quarter of 2004 and a second that commenced in the fourth quarter of 2004, aggregating approximately 400 employees across our major business functions and all major geographic regions. As of December 31, 2006, substantially all of the employees have been terminated. The remaining cash expenditures relating to workforce reduction are expected to be paid by the end of 2007. The expected cash impact of the 2004 restructuring charge is $22.9, of which $8.6 was paid in 2004, $10.7 was paid in 2005 and $3.1 was paid in 2006.
The reversal to the provision for workforce reduction in 2006, 2005 and 2004 was primarily attributable to a decrease in the original number of individuals identified for termination and lower than expected severance benefits.
The 2004 restructuring programs impacted the Information storage and Content management and archiving segments.
Prior Year Restructuring Programs
Prior to 2004, we had instituted several restructuring programs. The activity for these programs for the years ended December 31, 2006, 2005 and 2004 is presented below:
| | | | | | | | | | | | | | |
2006 Category
| | Beginning
Balance
| | Adjustments to
the Provision
During 2006
| | | Utilization
During 2006
| | | Ending Balance
|
Workforce reduction | | $ | 1.3 | | $ | (0.5 | ) | | $ | (0.1 | ) | | $ | 0.7 |
Consolidation of excess facilities | | | 65.3 | | | (8.4 | ) | | | (16.8 | ) | | | 40.1 |
Other contractual obligations | | | 2.4 | | | 0.3 | | | | (0.7 | ) | | | 1.9 |
| | |
|
| |
|
|
| |
|
|
| |
|
|
Total | | $ | 69.0 | | $ | (8.6 | ) | | $ | (17.7 | ) | | $ | 42.7 |
| | |
|
| |
|
|
| |
|
|
| |
|
|
| | | | |
2005 Category
| | Beginning
Balance
| | Adjustments to
the Provision
During 2005
| | | Utilization
During 2005
| | | Ending Balance
|
Workforce reduction | | $ | 3.3 | | $ | (0.7 | ) | | $ | (1.3 | ) | | $ | 1.3 |
Consolidation of excess facilities | | | 91.3 | | | 2.1 | | | | (28.1 | ) | | | 65.3 |
Other contractual obligations | | | 2.6 | | | (0.2 | ) | | | — | | | | 2.4 |
| | |
|
| |
|
|
| |
|
|
| |
|
|
Total | | $ | 97.2 | | $ | 1.2 | | | $ | (29.4 | ) | | $ | 69.0 |
| | |
|
| |
|
|
| |
|
|
| |
|
|
| | | | |
2004 Category
| | Beginning
Balance
| | Adjustments to
the Provision
During 2004
| | | Utilization
During 2004
| | | Ending Balance
|
Workforce reduction | | $ | 27.1 | | $ | (11.7 | ) | | $ | (12.1 | ) | | $ | 3.3 |
Consolidation of excess facilities | | | 106.3 | | | 23.7 | | | | (38.7 | ) | | | 91.3 |
Other contractual obligations | | | 5.7 | | | — | | | | (3.1 | ) | | | 2.6 |
| | |
|
| |
|
|
| |
|
|
| |
|
|
Total | | $ | 139.1 | | $ | 12.0 | | | $ | (53.9 | ) | | $ | 97.2 |
| | |
|
| |
|
|
| |
|
|
| |
|
|
The reductions to the provisions in 2006 for excess facilities were a result of higher than anticipated sublease income from facilities associated with our 2001 restructuring program. The net additions to the provisions in 2005 and 2004 were the result of higher than anticipated costs associated with vacating facilities associated with our 2001 restructuring program. These additions were partially offset by a reduction in the number of individuals originally identified for termination.
The prior year restructuring programs impacted the Information storage and Content management and archiving segments.
All restructuring programs, with the exception of the 2006 programs are substantially complete, although our ability to sublet facilities is subject to appropriate market conditions. The remaining liability for the consolidation of excess facilities is expected to be paid through 2015.
As we continue to refine our business model, we will reassess our cost structure and asset deployment to assess whether additional changes are necessary. Should we determine that additional restructuring programs will benefit our business, we may incur additional charges. If customer demand for products changes, we may be required to write down the value of assets. Additionally, changes in our business model or market conditions could cause goodwill or other assets to be impaired.
26
Investment Income
Investment income was $224.9, $190.4 and $156.7 in 2006, 2005 and 2004, respectively. Investment income increased in 2006 compared to 2005 due to greater yields on investments and decreased realized losses on investments, partially offset by lower average outstanding cash and investment balances due to a significant increase in repurchases of our common stock in the open market. Investment income increased in 2005 compared to 2004 due to higher outstanding cash and investment balances and greater yields on investments and was partially offset by increased realized losses on investments. The weighted average return on investments, excluding realized losses, was 4.2%, 3.4% and 2.6% in 2006, 2005 and 2004, respectively. Net realized losses were $27.8, $58.9 and $11.7 in 2006, 2005 and 2004, respectively.
Interest Expense
Interest expense was $34.1, $8.0 and $7.5 in 2006, 2005 and 2004, respectively. Interest expense increased in 2006 compared to 2005 primarily due to higher debt balances. In September 2006, we borrowed $2,200.0 under a six-month unsecured credit facility to finance the acquisition of RSA. In November 2006, we completed the issuance of our $1,725.0 1.75% convertible senior notes due 2011 (the “2011 Notes”) and our $1,725.0 1.75% convertible senior notes due 2013 (the “2013 Notes” and, together with the 2011 Notes, the “Notes”). A portion of the proceeds from the Notes was used to repay in full the $2,200.0 of outstanding indebtedness under the aforementioned unsecured credit facility. Interest expense in 2005 and 2004 was primarily attributable to interest associated with our $125.0 4.5% Senior Convertible Notes due April 1, 2007, which were assumed in connection with the Documentum (the “Documentum Notes”) acquisition. The Documentum Notes were redeemed in April 2006.
Other Expense, Net
Other expense, net was $8.6, $10.6 and $8.2 in 2006, 2005 and 2004, respectively. The decrease in other expense in 2006 compared to 2005 was primarily attributable to a decrease in foreign currency transaction losses. Other expense increased in 2005 compared to 2004 due to higher foreign currency transaction losses.
Provision for Income Taxes
Our effective income tax rate was 11.7%, 31.4% and 26.5% in 2006, 2005 and 2004, respectively. The effective income tax rate is based upon the income for the year, the composition of the income in different countries, and adjustments, if any, for the potential tax consequences, benefits, resolutions of tax audits or other tax contingencies. For 2006, 2005 and 2004 the effective tax rate varied from the statutory rate as a result of the mix of income attributable to foreign versus domestic jurisdictions. Our aggregate income tax rate in foreign jurisdictions is lower than our income tax rate in the United States. Additionally, in 2006, we recognized an income tax benefit of $171.8 from the favorable resolution of income tax audits and expiration of statutes of limitations. Partially offsetting these benefits were non-deductible IPR&D charges of $35.4 from acquisitions and $73.3 in non-deductible stock-based compensation expense for options issued as incentive stock options and shares issued under EMC’s ESPP. In 2005, we repatriated approximately $3,000.0 under the American Jobs Creation Act of 2004 (the “AJCA”). The repatriation resulted in an incremental income tax expense of $180.2. Also in 2005, we incurred $17.4 of non-deductible IPR&D charges from acquisitions. These unfavorable increases to our effective tax rate were partially offset by an income tax benefit of $163.9 from the favorable resolution of certain income tax audits and expiration of statutes of limitations. For 2004, as a result of tax audits, we recognized a $20.0 reduction in our estimated income tax exposure pertaining to our international tax liabilities. Partially offsetting these benefits were non-deductible IPR&D charges of $17.4 from acquisitions.
Financial Condition
Cash provided by operating activities was $2,140.4 in 2006, $2,216.3 in 2005 and $2,102.3 in 2004. Cash received from customers was $11,167.2, $9,732.8 and $8,329.4 in 2006, 2005 and 2004, respectively. The annual increases were attributable to higher sales volume and greater cash proceeds from the sale of maintenance contracts. Cash paid to suppliers and employees was $8,666.6, $7,539.9 and $6,299.1 in 2006, 2005 and 2004, respectively. The annual increases were partially attributable to higher headcount. Total headcount was approximately 31,100, 26,500 and 22,700 at December 31, 2006, 2005 and 2004, respectively. The majority of the headcount increases was due to the general growth of the business, as well as increased acquisition activity including the acquisitions of Smarts and Captiva in 2005 and RSA in 2006. Greater levels of inventory purchases to support the transition to our next generation storage systems also contributed to the increased amounts of payments to suppliers. Inventory increased from $724.8 at December 31, 2005 to $834.8 at December 31, 2006. The increase was primarily attributable to higher inventory levels for new products to support the overall growth of the business. Cash received from dividends and interest was $258.6, $249.2 and $162.4 in 2006, 2005 and 2004, respectively. The annual increases were due to higher rates of return received on our cash, cash equivalents and short and long-term investments. In 2006, 2005 and 2004, we paid $592.1, $216.7 and $84.0,
27
respectively, in income taxes. The cash paid for income taxes in 2006 includes $125.9 associated with the repatriation of funds under the AJCA. The annual increases were due to a combination of higher pre-tax income and a reduction in the amount of net operating losses available to reduce our taxable income.
Cash used for investing activities was $2,296.7, $611.7 and $2,064.7 in 2006, 2005 and 2004, respectively. Cash paid for business acquisitions, net of cash acquired was $2,618.4, $683.7 and $590.4, in 2006, 2005 and 2004, respectively. Capital additions were $718.1, $601.1 and $371.4 in 2006, 2005 and 2004, respectively. The increases in capital spending in 2006 compared to 2005 and 2005 compared to 2004 was attributable to various IT initiatives to further integrate our acquisitions, to enable us to more effectively service our growing customer base and to support the overall growth of the business. Capitalized software development costs were $192.9, $167.1 and $166.3 in 2006, 2005 and 2004, respectively. Software development costs increased from 2005 to 2006 due to increased development efforts across all of our segments. Net sales (purchases) and maturities of investments were $1,253.6, $868.4 and $(858.1) in 2006, 2005 and 2004, respectively. This activity varies from year to year based upon our cash collections, cash requirements and maturity dates of our investments.
Cash used for financing activities was $392.0, $743.6 and $323.8 in 2006, 2005 and 2004, respectively. Our Board of Directors has authorized the repurchase of 500.0 million shares of our common stock. In 2006, we repurchased 227.3 million shares of our common stock. Of the 500.0 million shares authorized for repurchase, we have cumulatively repurchased 359.8 million shares at a total cost of $4,389.0, leaving a remaining balance of 140.2 million shares authorized for future repurchases. In 2006, the Board also authorized a one-time repurchase of up to 100.0 million shares in conjunction with our issuance of the Notes. Of this amount, 75.0 million shares were repurchased using $945.8 of the net proceeds from the Notes. We spent $3,655.4, $1,003.4 and $545.7 on such repurchases in 2006, 2005 and 2004, respectively. We plan to spend at least $1,000.0 on common stock repurchases during 2007; however, the number of shares purchased and timing of our purchases will be dependent upon a number of factors, including the price of our stock, market conditions, our cash position and alternative demands for our cash resources. We generated $257.8, $263.3 and $230.0 in 2006, 2005 and 2004, respectively, from the exercise of stock options. Proceeds from short- and long-term obligations were $5,654.0, $0.2 and $0.1 in 2006, 2005 and 2004, respectively. In September 2006, we borrowed $2,200.0 under a six-month unsecured credit facility to finance the acquisition of RSA. In November 2006, we also closed the sale of the 2011 Notes and the 2013 Notes for an aggregate amount of $3,450.0. Total payments of short- and long-term obligations were $2,331.6, $3.7 and $8.2 in 2006, 2005 and 2004, respectively. The increase in total payments in 2006 compared to 2005 and 2004 was primarily attributable to $2,200.0 to repay in full the outstanding indebtedness under our six-month unsecured credit facility which was used to finance the acquisition of RSA and $126.1 paid to redeem the outstanding principal balance of the Documentum Notes.
In November 2006, we issued our 2011 Notes and 2013 Notes for total gross proceeds of $3,450.0. The Notes are senior unsecured obligations and rank equally with all other existing and future senior unsecured debt. The Notes are structurally subordinated to all liabilities of our subsidiaries and are effectively subordinated to our secured indebtedness. As of December 31, 2006, the aggregate amount of liabilities of our subsidiaries was approximately $2,200.0, excluding intercompany liabilities. Holders may convert their Notes at their option on any day prior to the close of business on the scheduled trading day immediately preceding (i) September 1, 2011, with respect to the 2011 Notes, and (ii) September 1, 2013, with respect to the 2013 Notes, in each case only under the following circumstances: (1) during the five business-day period after any five consecutive trading-day period (the “measurement period”) in which the price per Note of the applicable series for each day of that measurement period was less than 98% of the product of the last reported sale price of our common stock and the conversion rate on each such day; (2) during any calendar quarter, if the last reported sale price of our common stock for 20 or more trading days in a period of 30 consecutive trading days ending on the last trading day of the immediately preceding calendar quarter exceeds 130% of the applicable conversion price in effect on the last trading day of the immediately preceding calendar quarter; or (3) upon the occurrence of certain events specified in the Notes. Additionally, the Notes will become convertible during the last three months prior to the respective maturities of the 2011 Notes and the 2013 Notes.
Upon conversion, we will pay cash up to the principal amount of the Notes converted. With respect to any conversion value in excess of the principal amount of the Notes converted, we have the option to settle the excess with cash, shares of our common stock, or a combination of cash and shares of our common stock based on a daily conversion value, determined in accordance with the indenture, calculated on a proportionate basis for each day of the relevant 20-day observation period. The initial conversion rate for the Notes will be 62.1978 shares of our common stock per one thousand dollars of principal amount of Notes, which represents a 27.5 percent conversion premium from the date the Notes were issued and is equivalent to a conversion price of approximately $16.08 per share of our common stock. The conversion price is subject to adjustment in some events as set forth in the indenture. In addition, if a “fundamental change” (as defined in the indenture) occurs prior to the maturity date, we will in some cases increase the conversion rate for a holder of Notes that elects to convert its Notes in connection with such fundamental change.
28
Subject to certain exceptions, if we undergo a “designated event” (as defined in the indenture) including a “fundamental change,” holders of the Notes will have the option to require us to repurchase all or any portion of their Notes. The designated event repurchase price will be 100% of the principal amount of the Notes to be purchased plus any accrued interest up to but excluding the relevant repurchase date. We will pay cash for all Notes so repurchased. We may not redeem the Notes prior to maturity.
In connection with the sale of the Notes, we entered into a registration rights agreement (the “Registration Rights Agreement”). Pursuant to the Registration Rights Agreement, on February 2, 2007 we filed a shelf registration statement with the SEC covering the resale of the Notes and our common stock issuable upon conversion of the Notes. We also have agreed to use our commercially reasonable efforts to keep the shelf registration statement effective until the earliest of (i) the date when all securities covered by the registration statement have been sold; (ii) the expiration of the applicable holding period with respect to the Notes and our common stock issuable upon conversion of the Notes under Rule 144(k) under the Securities Act of 1933, or any successor provision; and (iii) the date that is two years after the effective date of the registration statement. We may suspend the use of the registration statement to resell Notes or shares of our common stock issued upon conversion of Notes for reasons relating to pending corporate developments, public filings or other events.
Subject to certain limitations, we will be required to pay the holders of the Notes special interest on the Notes if we fail to keep such registration statement effective during specified time periods. The Notes pay interest in cash at a rate of 1.75% semi-annually in arrears on December 1 and June 1 of each year, beginning on June 1, 2007. Aggregate debt issuance costs of approximately $58.9 are being amortized to interest expense over the respective terms of the Notes.
A total of $2,200.0 of the net proceeds from the issuance of the Notes was used to repay the outstanding indebtedness under our six-month unsecured credit facility which was used to finance the acquisition of RSA.
In connection with the sale of the Notes, we entered into separate convertible note hedge transactions with respect to our common stock (the “Purchased Options”). The Purchased Options allow us to receive shares of our common stock and/or cash related to the excess conversion value that we would pay to holders of the Notes upon conversion. The Purchased Options will cover, subject to customary anti-dilution adjustments, approximately 215 million shares of our common stock. Half of the Purchased Options expire on December 1, 2011 and the remaining half of the Purchased Options expire on December 1, 2013. We paid an aggregate amount of $669.1 of the proceeds from the sale of the Notes for the Purchased Options.
We also entered into separate transactions in which we sold warrants to acquire, subject to customary anti-dilution adjustments, approximately 215 million shares of our common stock (the “Sold Warrants”) at an exercise price of approximately $19.55 per share of our common stock. Half of the Sold Warrants have expiration dates between February 15, 2012 and March 15, 2012 and the remaining half of the Sold Warrants have expiration dates between February 18, 2014 and March 18, 2014. We received aggregate proceeds of $391.1 from the sale of the Sold Warrants.
The Purchased Options and Sold Warrants will generally have the effect of increasing the conversion price of the Notes to approximately $19.55 per share of our common stock, representing an approximate 55 percent conversion premium based on the closing price of $12.61 per share of our common stock on November 13, 2006.
Depreciation and amortization expense was $764.2, $640.0 and $616.4 in 2006, 2005 and 2004, respectively. The increase in depreciation and amortization expense in each year was primarily attributable to intangible amortization expense associated with increased acquisition activity including the acquisitions of Smarts and Captiva in 2005 and RSA in 2006. Higher amortization expense associated with an increase in capitalized software development costs also contributed to the increase. A general growth in our property, plant and equipment balances in each year also resulted in greater depreciation expense.
We have available for use a credit line of $50.0 in the United States. As of December 31, 2006, we had no borrowings outstanding on the line of credit. The credit line bears interest at the bank’s base rate and requires us, upon utilization of the credit line, to meet certain financial covenants with respect to limitations on losses. In the event the covenants are not met, the lender may require us to provide collateral to secure the outstanding balance. At December 31, 2006, we were in compliance with the covenants.
We derive revenues from both selling and leasing activity. We customarily sell the notes receivable resulting from our leasing activity. Generally, we do not retain any recourse on the sale of these notes. If recourse is retained, we assess and provide for any estimated exposure.
Based on our current operating and capital expenditure forecasts, we believe that the combination of funds currently available, funds to be generated from operations and our available lines of credit will be adequate to finance our ongoing operations for at least the next twelve months.
To date, inflation has not had a material impact on our financial results.
29
Off-Balance Sheet Arrangements, Contractual Obligations, Contingent Liabilities and Commitments
Contractual Obligations
We have various contractual obligations impacting our liquidity. The following represents our contractual obligations as of December 31, 2006:
| | | | | | | | | | | | | | | |
| | | Payments Due by Period
|
| | | Total
| | Less than 1 year
| | 1-3 years*
| | 3-5 years**
| | More than 5 years
|
Operating leases | | $ | 752.1 | | $ | 193.4 | | $ | 270.4 | | $ | 127.7 | | $ | 160.6 |
Long-term convertible debt | | | 3,450.0 | | | — | | | — | | | 1,725.0 | | | 1,725.0 |
Other long-term obligations, including notes payable and current portion of long-term obligations | | | 129.3 | | | 77.7 | | | 6.0 | | | 2.3 | | | 43.3 |
Purchase orders | | | 1,478.2 | | | 882.7 | | | 595.5 | | | — | | | — |
| | |
|
| |
|
| |
|
| |
|
| |
|
|
Total | | $ | 5,809.6 | | $ | 1,153.8 | | $ | 871.9 | | $ | 1,855.0 | | $ | 1,928.9 |
| | |
|
| |
|
| |
|
| |
|
| |
|
|
*Includes payments from January 1, 2008 through December 31, 2009.
**Includes payments from January 1, 2010 through December 31, 2011.
Our operating leases are primarily for office space around the world. We believe leasing such space in most cases is more cost-effective than purchasing real estate. The long-term convertible debt pertains to the 2011 Notes and the 2013 Notes. The purchase orders are for manufacturing and non-manufacturing related goods and services. While the purchase orders are generally cancelable without penalty, certain vendor agreements provide for percentage-based cancellation fees or minimum restocking charges based on the nature of the product or service.
Guarantees and Indemnification Obligations
EMC’s subsidiaries have entered into arrangements with financial institutions for such institutions to provide guarantees for rent, taxes, insurance, leases, performance bonds, bid bonds and customs duties aggregating $57.7 as of December 31, 2006. The guarantees vary in length of time. In connection with these arrangements, we have agreed to guarantee substantially all of the guarantees provided by these financial institutions.
We enter into agreements in the ordinary course of business with, among others, customers, resellers, OEMs, systems integrators and distributors. Most of these agreements require us to indemnify the other party against third-party claims alleging that an EMC product infringes a patent and/or copyright. Most of these agreements in which we license our trademarks to another party require us to indemnify the other party against third-party claims alleging that an EMC product infringes a trademark. Certain of these agreements require us to indemnify the other party against certain claims relating to property damage, personal injury or the acts or omissions of EMC, its employees, agents or representatives. In addition, from time to time, we have made certain guarantees regarding the performance of our systems to our customers.
We have agreements with certain vendors, financial institutions, lessors and service providers pursuant to which we have agreed to indemnify the other party for specified matters, such as acts and omissions of EMC, its employees, agents or representatives.
We have procurement or license agreements with respect to technology that is used in our products and agreements in which we obtain rights to a product from an OEM. Under some of these agreements, we have agreed to indemnify the supplier for certain claims that may be brought against such party with respect to our acts or omissions relating to the supplied products or technologies.
We have agreed to indemnify the directors and executive officers of EMC and our subsidiaries to the extent legally permissible, against all liabilities reasonably incurred in connection with any action in which such individual may be involved by reason of such individual being or having been a director or executive officer.
In connection with certain acquisitions, we have agreed to indemnify the current and former directors, officers and employees of the acquired company in accordance with the acquired company’s by-laws and charter in effect immediately prior to the acquisition or in accordance with indemnification or similar agreements entered into by the acquired company and such persons. In a substantial majority of instances, we have maintained the acquired company’s directors’ and officers’ insurance, which should enable us to recover a portion of any future amounts paid. These indemnities vary in length of time.
30
Based upon our historical experience and information known as of December 31, 2006, we believe our liability on the above guarantees and indemnities at December 31, 2006 is not material.
Notes and Accounts Receivable
We derive revenues from both selling and leasing information storage systems. We customarily sell the notes receivable resulting from our leasing activity to provide for current liquidity. Generally, we do not retain any recourse on the sale of these notes.
Litigation
We are a party to litigation which we consider routine and incidental to our business. Management does not expect the results of any of these actions to have a material adverse effect on our business, results of operations or financial condition.
Pension and Post-Retirement Medical and Life Insurance Plans
We have noncontributory defined benefit pension plans which were assumed as part of the Data General acquisition, which cover substantially all former Data General employees located in the U.S. and Canada (the “Pension Plans”). The Pension Plans were frozen in 1999, resulting in employees no longer accruing pension benefits for future services. The assets for the Pension Plans are invested in common stocks, bonds and cash. The market related value of the plans’ assets is based upon the assets’ fair value. The expected long-term rate of return on assets for the year ended December 31, 2006 was 8.25%. This rate represents the average of the long-term rates of return for the Pension Plans weighted by the plans’ assets as of December 31, 2006. The actual long-term rate of return for the ten years ended December 31, 2006 was 7.05%. Based upon current market conditions, the expected long-term rate of return for 2007 will remain at 8.25%. A 25 basis point change in the expected long-term rate of return on the plans’ assets would have approximately a $1.0 impact on the 2007 pension expense. As of December 31, 2006, the Pension Plans had a $100.5 accumulated actuarial loss that will be expensed over the average future working lifetime of active participants. For the year ended December 31, 2006, the discount rate to determine the benefit obligation was 5.9%. The discount rate selected was based on highly rated long-term bond indices and yield curves that match the duration of the plans’ benefit obligations. The bond indices and yield curve analyses include only bonds rated Aa or higher from a reputable rating agency. This rate represents the average of the discount rates for the Pension Plans weighted by plan liabilities as of December 31, 2006. The discount rate reflects the rate at which the pension benefits could be effectively settled. A 25 basis point change in the discount rate would have approximately a $0.7 impact on the 2007 pension expense for the Pension Plans. Additionally, certain of the former Data General foreign subsidiaries and one of our foreign subsidiaries in Japan have defined benefit pension plans. These foreign pension plans are excluded from this discussion because they do not have a material impact on our consolidated financial position or results of operations.
We also assumed a post-retirement benefit plan as part of the Data General acquisition that provides certain medical and life insurance benefits for retired former Data General employees. The plan’s assets are invested in common stocks, bonds and cash. The market related value of the plan’s assets is equal to the assets’ fair value. The expected long-term rate of return on the plan’s assets for the year ended December 31, 2006 was 8.25%. The actual long-term rate of return for the ten years ended December 31, 2006 was 7.05%. Based on current capital market conditions, the expected long-term rate of return for 2007 will remain at 8.25%. A 25 basis point change in the expected long-term rate of return on the plan’s assets has minimal impact on our benefit expense. As of December 31, 2006, the plan had $0.4 accumulated actuarial loss that will be recognized over the anticipated remaining years of service for participants. For the year ended December 31, 2006, the discount rate to determine the benefit obligation was 5.9%. The discount rate selected was based on highly rated long-term bond indices and yield curves that match the duration of the plan’s benefit obligations. The bond indices and yield curve analyses include only bonds rated Aa or higher from a reputable rating agency. A 25 basis point change in the discount rate has a minimal impact on the expense.
Critical Accounting Policies
Our consolidated financial statements are based on the selection and application of generally accepted accounting principles which require us to make estimates and assumptions about future events that affect the amounts reported in our financial statements and the accompanying notes. Future events and their effects cannot be determined with certainty. Therefore, the determination of estimates requires the exercise of judgment. Actual results could differ from those estimates, and any such differences may be material to our financial statements. We believe that the policies set forth below may involve a higher degree of judgment and complexity in their application than our other accounting policies and represent the critical accounting policies used in the preparation of our financial statements. If different assumptions or conditions were to prevail, the results could be materially different from our reported results. Our significant accounting policies are presented within Note A to our Consolidated Financial Statements.
31
Revenue Recognition
Revenue recognition is governed by various accounting principles, including SAB No. 104, “Revenue Recognition”; Emerging Issues Task Force No. 00-21, “Revenue Arrangements with Multiple Deliverables”; Statement of Position (“SOP”) No. 97-2, “Software Revenue Recognition”; FAS No. 48, “Revenue Recognition When Right of Return Exists”; FAS No. 13, “Accounting for Leases”; and SOP No. 81-1, “Accounting for Performance of Construction-Type and Certain Production-Type Contracts,” among others. The application of the appropriate accounting principle to our revenue is dependent upon the specific transaction and whether the sale or lease includes systems, software and services or a combination of these items. As our business evolves, the mix of products and services sold will impact the timing of when revenue and related costs are recognized. Additionally, revenue recognition involves judgments, including assessments of expected returns and the likelihood of nonpayment. We analyze various factors, including a review of specific transactions, the credit-worthiness of our customers, our historical experience and market and economic conditions. Changes in judgments on these factors could materially impact the timing and amount of revenue and costs recognized. Should market or economic conditions deteriorate, our actual return experience could exceed our estimate.
Warranty Costs
We accrue for systems warranty costs at the time of shipment. We estimate systems warranty costs based upon historical experience and specific identification of system requirements. While we engage in extensive product quality programs and processes, our warranty obligation is affected by product failure rates, material usage and service delivery costs. To the extent that our actual systems warranty costs differed from our estimates by 5 percent, consolidated pre-tax income would have increased/decreased by approximately $10.0 in 2006.
Asset Valuation
Asset valuation includes assessing the recorded value of certain assets, including accounts and notes receivable, investments, inventories, goodwill and other intangible assets. We use a variety of factors to assess valuation, depending upon the asset. Accounts and notes receivable are evaluated based upon the credit-worthiness of our customers, our historical experience, the age of the receivable and current market and economic conditions. Should current market and economic conditions deteriorate, our actual bad debt experience could exceed our estimate. The determination of whether unrealized losses on investments are other than temporary is based upon the type of investments held, market conditions, length of the impairment, magnitude of the impairment and ability to hold the investment to maturity. Should current market and economic conditions deteriorate, our ability to recover the cost of our investments may be impaired. The recoverability of inventories is based upon the types and levels of inventory held, forecasted demand, pricing, competition and changes in technology. Should current market and economic conditions deteriorate, our actual recovery could be less than our estimate. Other intangible assets are evaluated based upon the expected period the asset will be utilized, forecasted cash flows, changes in technology and customer demand. Changes in judgments on any of these factors could materially impact the value of the asset. Our goodwill valuation is based upon a discounted cash flow analysis performed at the reporting unit level. The analysis factors in estimated revenue and expense growth rates. The estimates are based upon our historical experience and projections of future activity, factoring in customer demand, changes in technology and a cost structure necessary to achieve the related revenues. Changes in judgments on any of these factors could materially impact the value of the asset.
Restructuring Charges
We recognized restructuring charges in 2006, 2005, 2004 and prior years. The restructuring charges include, among other items, estimated losses on the sale of real estate, employee termination benefit costs, subletting of facilities and termination of various contracts. The amount of the actual obligations may be different than our estimates due to various factors, including market conditions and negotiations with third parties. Should the actual amounts differ from our estimates, the amount of the restructuring charges could be materially impacted.
Accounting for Income Taxes
As part of the process of preparing our financial statements, we are required to estimate our provision for income taxes in each of the jurisdictions in which we operate. This process involves estimating our actual current tax exposure, including assessing the risks associated with tax audits, together with assessing temporary differences resulting from the different treatment of items for tax and accounting purposes. These differences result in deferred tax assets and liabilities, which are included within our balance sheet. We assess the likelihood that our deferred tax assets will be recovered from future taxable income and to the extent we believe that recovery is more likely than not, do not establish a valuation allowance. In the event that actual results differ from these estimates, our provision for income taxes could be materially impacted.
32
Accounting for Stock-based Compensation
On January 1, 2006, we adopted FAS No. 123R, which requires the recognition of compensation expense for all share-based payment awards made to employees and directors based upon the awards’ estimated grant date fair value. Previously, we elected to account for these share-based payment awards under APB No. 25 and elected to only disclose the impact of expensing the fair value of stock options in the notes to the Consolidated Financial Statements. FAS No. 123R requires management to make estimates and assumptions to determine the underlying value of stock options and restricted stock awards, including the vesting or accelerated vesting for restricted stock awards containing performance-based vesting features, the expected life of stock options and an estimate of future forfeitures. Changes to these estimates and assumptions may have a significant impact on the value of stock-based compensation expense recognized, which could have a material impact on our financial statements. Total pre-tax stock-based compensation expense recognized in 2006 was $409.4.
New Accounting Pronouncements
In June 2006, the FASB issued FASB Interpretation No. 48, “Accounting for Uncertainty in Income Taxes, an Interpretation of FASB Statement No. 109” (“FIN No. 48”). FIN No. 48 clarifies the accounting for uncertainty in income taxes recognized in an enterprise’s financial statements in accordance with FAS No. 109, “Accounting for Income Taxes.” FIN No. 48 prescribes a two-step process to determine the amount of tax benefit to be recognized. First, the tax position must be evaluated to determine the likelihood that it will be sustained upon external examination. If the tax position is deemed “more-likely-than-not” to be sustained, the tax position is then assessed to determine the amount of benefit to recognize in the financial statements. The amount of the benefit that may be recognized is the largest amount that has a greater than 50 percent likelihood of being realized upon ultimate settlement. We are required to adopt FIN No. 48 effective as of January 1, 2007. We are currently evaluating the effect FIN No. 48 will have on our financial statements. We do not expect the impact will be material.
In September 2006, the FASB issued FAS No. 157, “Fair Value Measurements” (“FAS No. 157”), which addresses how companies should measure fair value when they are required to use a fair value measure for recognition or disclosure purposes under generally accepted accounting principles. FAS No. 157 defines fair value, establishes a framework for measuring fair value in generally accepted accounting principles and expands disclosures about fair value measurements. FAS No. 157 is effective for financial statements issued for fiscal years beginning after November 15, 2007 and should be applied prospectively, except in the case of a limited number of financial instruments that require retrospective application. We are currently evaluating the potential impact of FAS No. 157 on our financial position and results of operations.
In February 2007, the FASB issued FAS No. 159, “The Fair Value Option for Financial Assets and Financial Liabilities-including an amendment of FAS 115” (“FAS No. 159”). The new statement allows entities to choose, at specified election dates, to measure eligible financial assets and liabilities at fair value that are not otherwise required to be measured at fair value. If a company elects the fair value option for an eligible item, changes in that item’s fair value in subsequent reporting periods must be recognized in current earnings. FAS No. 159 is effective for fiscal years beginning after November 15, 2007. We are currently evaluating the potential impact of FAS No. 159 on our financial position and results of operations.
33
ITEM 7A: QUANTITATIVE AND QUALITATIVE DISCLOSURES ABOUT MARKET RISK
Market Risk
We are exposed to market risk, primarily from changes in foreign exchange rates, interest rates and credit risk. To manage the volatility relating to these exposures, we enter into various derivative transactions pursuant to our policies to hedge against known or forecasted market exposures.
Foreign Exchange Risk Management
As a multinational corporation, we are exposed to changes in foreign exchange rates. Any foreign currency transaction, defined as a transaction denominated in a currency other than the U.S. dollar, will be reported in U.S. dollars at the applicable exchange rate. Assets and liabilities are translated into U.S. dollars at exchange rates in effect at the balance sheet date and income and expense items are translated at average rates for the period. The primary foreign currency denominated transactions include revenue and expenses and the resultant accounts receivable and accounts payable balances reflected on our balance sheet. Therefore, the change in the value of the U.S. dollar as compared to foreign currencies will have either a positive or negative effect on our financial position and results of operations. We enter into derivative contracts with the sole objective of decreasing the volatility of the impact of currency fluctuations. These exposures may change over time and could have a material adverse impact on our financial results. Historically, our primary exposure has related to sales denominated in the Euro, the Japanese yen and the British pound. Additionally, we have exposure to emerging market economies, particularly in Latin America and Southeast Asia.
We use foreign currency forward and option contracts to manage the risk of exchange rate fluctuations. In all cases, we use these derivative instruments to reduce our foreign exchange risk by essentially creating offsetting market exposures. The success of the hedging program depends on our forecasts of transaction activity in the various currencies. To the extent that these forecasts are overstated or understated during periods of currency volatility, we could experience unanticipated currency gains or losses. The instruments we hold are not leveraged and are not held for trading or speculative purposes.
We employ a Monte Carlo simulation model to calculate value-at-risk for our combined foreign exchange position. This model assumes that the relationships among market rates and prices that have been observed daily over the last two years are valid for estimating risk over the next trading day. Estimates of volatility and correlations of market factors are calculated by BearMeasurisk as of December 31, 2006. This model measures the potential loss in fair value that could arise from changes in market conditions, using a 95% confidence level and assuming a one-day holding period. The value-at-risk on the combined foreign exchange position was $0.5 million as of December 31, 2006 and $0.7 million as of December 31, 2005. The average, high and low value-at-risk amounts for 2006 and 2005 were as follows (in millions):
| | | | | | | | | |
| | | Average
| | High
| | Low
|
2006 | | $ | 0.7 | | $ | 1.0 | | $ | 0.5 |
2005 | | $ | 0.7 | | $ | 1.1 | | $ | 0.2 |
The average value represents an average of the quarter-end values. The high and low valuations represent the highest and lowest values of the quarterly amounts.
Interest Rate Risk
We maintain an investment portfolio consisting of debt securities of various types and maturities. The investments are classified as available for sale and are all denominated in U.S. dollars. These securities are recorded on the balance sheet at market value, with any unrealized gain or loss recorded in other comprehensive income. These instruments are not leveraged and are not held for trading purposes. A portion of our investment portfolio is comprised of mortgage-backed securities that are subject to prepayment risk.
We employ a Monte Carlo simulation model to calculate value-at-risk for changes in interest rates for our combined investment portfolios. This model assumes that the relationships among market rates and prices that have been observed daily over the last two years are valid for estimating risk over the next trading day. Estimates of volatility and correlations of market factors are drawn from the BearMeasurisk dataset as of December 31, 2006. This model measures the potential loss in fair value that could arise from changes in interest rates, using a 95% confidence level and assuming a one-day holding period. The value-at-risk on the investment portfolios was $1.9 million as of December 31, 2006 and $2.1 million as of December 31, 2005. The average, high and low value-at-risk amounts for 2006 and 2005 were as follows (in millions):
| | | | | | | | | |
| | | Average
| | High
| �� | Low
|
2006 | | $ | 1.9 | | $ | 2.3 | | $ | 1.5 |
2005 | | $ | 3.9 | | $ | 6.3 | | $ | 2.1 |
34
The average value represents an average of the quarter-end values. The high and low valuations represent the highest and lowest values of the quarterly amounts.
Credit Risk
Financial instruments which potentially subject us to concentrations of credit risk consist principally of cash and cash equivalents, short and long-term investments, accounts and notes receivable and foreign currency exchange contracts. Deposits held with banks may exceed the amount of insurance provided on such deposits. Generally, these deposits may be redeemed upon demand and are maintained with financial institutions of reputable credit and therefore bear minimal credit risk. We place our cash and cash equivalents and short- and long-term investments primarily in investment grade instruments and limit the amount of investment with any one issuer. We have entered into various agreements to loan fixed income securities generally on an overnight basis. Under these securities lending agreements, the value of the collateral is equal to 102% of the fair market value of the loaned securities. The collateral is generally cash, U.S. government-backed securities or letters of credit. At December 31, 2006, there were no outstanding securities lending transactions. The counterparties to our foreign currency exchange contracts consist of a number of major financial institutions. In addition to limiting the amount of the contracts we enter into with any one party, we monitor the credit quality of the counterparties.
The credit risk associated with accounts and notes receivables is low due to the large number of customers and their broad dispersion over many different industries and geographic areas. We establish an allowance for the estimated uncollectible portion of our accounts and notes receivable. The allowance was $41.5 million and $39.9 million at December 31, 2006 and 2005, respectively. We customarily sell the notes receivable we derive from our leasing activity. Generally, we do not retain any recourse on the sale of these notes.
35
ITEM 8: FINANCIAL STATEMENTS AND SUPPLEMENTARY DATA
EMC CORPORATION AND SUBSIDIARIES
INDEX TO CONSOLIDATED FINANCIAL STATEMENTS AND SCHEDULE
| Note: | All other financial statement schedules are omitted because they are not applicable or the required information is included in the consolidated financial statements or notes thereto. |
36
MANAGEMENT’S REPORT ON INTERNAL CONTROL OVER FINANCIAL REPORTING
The management of EMC is responsible for establishing and maintaining adequate internal control over financial reporting. Internal control over financial reporting is defined in Rule 13a-15(f) or 15d-15(f) promulgated under the Exchange Act as a process designed by, or under the supervision of, the company’s principal executive and principal financial officers and effected by the company’s board of directors, management and other personnel, to provide reasonable assurance regarding the reliability of financial reporting and the preparation of financial statements for external purposes in accordance with generally accepted accounting principles and includes those policies and procedures that:
| | • | Pertain to the maintenance of records that in reasonable detail accurately and fairly reflect the transactions and dispositions of the assets of the company; |
| | • | Provide reasonable assurance that transactions are recorded as necessary to permit preparation of financial statements in accordance with generally accepted accounting principles, and that receipts and expenditures of the company are being made only in accordance with authorizations of management and directors of the company; and |
| | • | Provide reasonable assurance regarding prevention or timely detection of unauthorized acquisition, use or disposition of the company’s assets that could have a material effect on the financial statements. |
Because of its inherent limitations, internal control over financial reporting may not prevent or detect misstatements. Also, projections of any evaluation of effectiveness to future periods are subject to the risk that controls may become inadequate because of changes in conditions, or that the degree of compliance with the policies or procedures may deteriorate.
EMC’s management assessed the effectiveness of the company’s internal control over financial reporting as of December 31, 2006. In making this assessment, EMC’s management used the criteria set forth by the Committee of Sponsoring Organizations of the Treadway Commission (COSO) inInternal Control - Integrated Framework.
Management has excluded RSA Security Inc. from its assessment of internal control over financial reporting as of December 31, 2006 because this entity was acquired by the Company in 2006. RSA Security Inc. is a wholly-owned subsidiary of the Company that represents 14.4% of consolidated total assets and 1.2% of consolidated revenue as of and for the year ended December 31, 2006.
Based on our assessment, EMC’s management determined that, as of December 31, 2006, EMC’s internal control over financial reporting is effective based on those criteria.
EMC’s management’s assessment of the effectiveness of EMC’s internal control over financial reporting as of December 31, 2006 has been audited by PricewaterhouseCoopers LLP, an independent registered public accounting firm, as stated in their report which appears on page 38.
37
REPORT OF INDEPENDENT REGISTERED PUBLIC ACCOUNTING FIRM
To the Stockholders and the
Board of Directors of EMC Corporation:
We have completed integrated audits of EMC Corporation’s consolidated financial statements and of its internal control over financial reporting as of December 31, 2006 in accordance with the standards of the Public Company Accounting Oversight Board (United States). Our opinions, based on our audits, are presented below.
Consolidated financial statements and financial statement schedule
In our opinion, the consolidated financial statements listed in the accompanying index, present fairly, in all material respects, the financial position of EMC Corporation and its subsidiaries at December 31, 2006 and December 31, 2005, and the results of their operations and their cash flows for each of the three years in the period ended December 31, 2006 in conformity with accounting principles generally accepted in the United States of America. In addition, in our opinion, the financial statement schedule listed in the accompanying index presents fairly, in all material respects, the information set forth therein when read in conjunction with the related consolidated financial statements. These financial statements and financial statement schedule are the responsibility of the Company’s management. Our responsibility is to express an opinion on these financial statements and financial statement schedule based on our audits. We conducted our audits of these statements in accordance with the standards of the Public Company Accounting Oversight Board (United States). Those standards require that we plan and perform the audit to obtain reasonable assurance about whether the financial statements are free of material misstatement. An audit of financial statements includes examining, on a test basis, evidence supporting the amounts and disclosures in the financial statements, assessing the accounting principles used and significant estimates made by management, and evaluating the overall financial statement presentation. We believe that our audits provide a reasonable basis for our opinion.
As discussed in Note A to the consolidated financial statements, the Company changed the manner in which it accounts for share-based compensation in 2006 and the manner in which it accounts for defined benefit pension and other postretirement plans effective December 31, 2006.
Internal control over financial reporting
Also, in our opinion, management’s assessment, included in Management’s Report on Internal Control Over Financial Reporting appearing on page 37 of this Form 10-K, that the Company maintained effective internal control over financial reporting as of December 31, 2006 based on criteria established inInternal Control – Integrated Framework issued by the Committee of Sponsoring Organizations of the Treadway Commission (COSO), is fairly stated, in all material respects, based on those criteria. Furthermore, in our opinion, the Company maintained, in all material respects, effective internal control over financial reporting as of December 31, 2006, based on criteria established inInternal Control – Integrated Framework issued by the COSO. The Company’s management is responsible for maintaining effective internal control over financial reporting and for its assessment of the effectiveness of internal control over financial reporting. Our responsibility is to express opinions on management’s assessment and on the effectiveness of the Company’s internal control over financial reporting based on our audit. We conducted our audit of internal control over financial reporting in accordance with the standards of the Public Company Accounting Oversight Board (United States). Those standards require that we plan and perform the audit to obtain reasonable assurance about whether effective internal control over financial reporting was maintained in all material respects. An audit of internal control over financial reporting includes obtaining an understanding of internal control over financial reporting, evaluating management’s assessment, testing and evaluating the design and operating effectiveness of internal control, and performing such other procedures as we consider necessary in the circumstances. We believe that our audit provides a reasonable basis for our opinions.
A company’s internal control over financial reporting is a process designed to provide reasonable assurance regarding the reliability of financial reporting and the preparation of financial statements for external purposes in accordance with generally accepted accounting principles. A company’s internal control over financial reporting includes those policies and procedures that (i) pertain to the maintenance of records that, in reasonable detail, accurately and fairly reflect the transactions and dispositions of the assets of the company; (ii) provide reasonable assurance that transactions are recorded as necessary to permit preparation of financial statements in accordance with generally accepted accounting principles, and that receipts and expenditures of the company are being made only in accordance with authorizations of management and directors of the company; and (iii) provide reasonable assurance regarding prevention or timely detection of unauthorized acquisition, use, or disposition of the company’s assets that could have a material effect on the financial statements.
38
Because of its inherent limitations, internal control over financial reporting may not prevent or detect misstatements. Also, projections of any evaluation of effectiveness to future periods are subject to the risk that controls may become inadequate because of changes in conditions, or that the degree of compliance with the policies or procedures may deteriorate.
As described in Management’s Report on Internal Control over Financial Reporting, management has excluded RSA Security Inc. from its assessment of internal control over financial reporting as of December 31, 2006 because this entity was acquired by the Company in 2006. We have also excluded RSA Security, Inc. from our audit of internal control over financial reporting. RSA Security Inc. is a wholly-owned subsidiary of the Company that represents 14.4% of consolidated total assets and 1.2% of consolidated revenue as of and for the year ended December 31, 2006.
PricewaterhouseCoopers LLP
Boston, Massachusetts
February 27, 2007
39
EMC CORPORATION
CONSOLIDATED BALANCE SHEETS
(in thousands, except per share amounts)
| | | | | | | | |
| | | December 31,
| |
| ASSETS | | 2006
| | | 2005
| |
Current assets: | | | | | | | | |
Cash and cash equivalents | | $ | 1,828,106 | | | $ | 2,322,370 | |
Short-term investments | | | 1,521,925 | | | | 1,615,495 | |
Accounts and notes receivable, less allowance for doubtful accounts of $39,509
and $38,126 | | | 1,692,214 | | | | 1,405,564 | |
Inventories | | | 834,800 | | | | 724,751 | |
Deferred income taxes | | | 418,146 | | | | 326,318 | |
Other current assets | | | 225,396 | | | | 179,478 | |
| | |
|
|
| |
|
|
|
Total current assets | | | 6,520,587 | | | | 6,573,976 | |
Long-term investments | | | 2,246,290 | | | | 3,417,589 | |
Property, plant and equipment, net | | | 2,035,559 | | | | 1,754,035 | |
Deferred income taxes | | | 104,446 | | | | — | |
Intangible assets, net | | | 1,003,549 | | | | 563,024 | |
Other assets, net | | | 638,655 | | | | 598,252 | |
Goodwill, net | | | 6,017,161 | | | | 3,883,507 | |
| | |
|
|
| |
|
|
|
Total assets | | $ | 18,566,247 | | | $ | 16,790,383 | |
| | |
|
|
| |
|
|
|
| | |
| LIABILITIES AND STOCKHOLDERS’ EQUITY | | | | | | | | |
Current liabilities: | | | | | | | | |
Accounts payable | | $ | 680,263 | | | $ | 583,756 | |
Accrued expenses | | | 1,592,022 | | | | 1,279,857 | |
Income taxes payable | | | 283,148 | | | | 645,694 | |
Deferred revenue | | | 1,325,671 | | | | 1,164,551 | |
| | |
|
|
| |
|
|
|
Total current liabilities | | | 3,881,104 | | | | 3,673,858 | |
Deferred revenue | | | 780,124 | | | | 640,598 | |
Deferred income taxes | | | — | | | | 175,192 | |
Long-term convertible debt | | | 3,450,000 | | | | 126,963 | |
Other liabilities | | | 129,312 | | | | 108,342 | |
Commitments and contingencies | | | | | | | | |
Stockholders’ equity: | | | | | | | | |
Series preferred stock, par value $0.01; authorized 25,000 shares; none outstanding | | | — | | | | — | |
Common stock, par value $0.01; authorized 6,000,000 shares; issued
2,122,339 and 2,384,147 shares | | | 21,223 | | | | 23,841 | |
Additional paid-in capital | | | 2,564,554 | | | | 5,867,076 | |
Deferred compensation | | | — | | | | (332,311 | ) |
Retained earnings | | | 7,794,493 | | | | 6,570,511 | |
Accumulated other comprehensive loss, net | | | (54,563 | ) | | | (63,687 | ) |
| | |
|
|
| |
|
|
|
Total stockholders’ equity | | | 10,325,707 | | | | 12,065,430 | |
| | |
|
|
| |
|
|
|
Total liabilities and stockholders’ equity | | $ | 18,566,247 | | | $ | 16,790,383 | |
| | |
|
|
| |
|
|
|
The accompanying notes are an integral part of the consolidated financial statements.
40
EMC CORPORATION
CONSOLIDATED INCOME STATEMENTS
(in thousands, except per share amounts)
| | | | | | | | | | | | |
| | | For the Year Ended December 31,
| |
| | | 2006
| | | 2005
| | | 2004
| |
Revenues: | | | | | | | | | | | | |
Product sales | | $ | 8,078,042 | | | $ | 7,009,026 | | | $ | 6,055,121 | |
Services | | | 3,077,048 | | | | 2,654,929 | | | | 2,174,367 | |
| | |
|
|
| |
|
|
| |
|
|
|
| | | | 11,155,090 | | | | 9,663,955 | | | | 8,229,488 | |
Costs and expenses: | | | | | | | | | | | | |
Cost of product sales | | | 3,906,771 | | | | 3,363,017 | | | | 3,040,560 | |
Cost of services | | | 1,335,120 | | | | 1,108,119 | | | | 974,321 | |
Research and development | | | 1,254,193 | | | | 1,004,829 | | | | 847,899 | |
Selling, general and administrative | | | 3,253,274 | | | | 2,605,977 | | | | 2,266,665 | |
In-process research and development | | | 35,410 | | | | 17,370 | | | | 17,440 | |
Restructuring charges | | | 162,564 | | | | 84,221 | | | | 38,610 | |
| | |
|
|
| |
|
|
| |
|
|
|
Operating income | | | 1,207,758 | | | | 1,480,422 | | | | 1,043,993 | |
Investment income | | | 224,949 | | | | 190,434 | | | | 156,726 | |
Interest expense | | | (34,123 | ) | | | (7,988 | ) | | | (7,516 | ) |
Other expense, net | | | (8,566 | ) | | | (10,625 | ) | | | (8,173 | ) |
| | |
|
|
| |
|
|
| |
|
|
|
Income before taxes and cumulative effect of a change in accounting principle | | | 1,390,018 | | | | 1,652,243 | | | | 1,185,030 | |
Income tax provision | | | 162,664 | | | | 519,078 | | | | 313,841 | |
| | |
|
|
| |
|
|
| |
|
|
|
Income before cumulative effect of a change in accounting principle | | | 1,227,354 | | | | 1,133,165 | | | | 871,189 | |
Cumulative effect of a change in accounting principle, net of tax benefit of $808, $0 and $0 | | | (3,372 | ) | | | — | | | | — | |
| | |
|
|
| |
|
|
| |
|
|
|
Net income | | $ | 1,223,982 | | | $ | 1,133,165 | | | $ | 871,189 | |
| | |
|
|
| |
|
|
| |
|
|
|
Net income per weighted average share, basic: | | | | | | | | | | | | |
Income before cumulative effect of a change in accounting principle | | $ | 0.55 | | | $ | 0.48 | | | $ | 0.36 | |
Cumulative effect of a change in accounting principle | | | — | | | | — | | | | — | |
| | |
|
|
| |
|
|
| |
|
|
|
Net income | | $ | 0.54 | | | $ | 0.48 | | | $ | 0.36 | |
| | |
|
|
| |
|
|
| |
|
|
|
Net income per weighted average share, diluted: | | | | | | | | | | | | |
Income before cumulative effect of a change in accounting principle | | $ | 0.54 | | | $ | 0.47 | | | $ | 0.36 | |
Cumulative effect of a change in accounting principle | | | — | | | | — | | | | — | |
| | |
|
|
| |
|
|
| |
|
|
|
Net income | | $ | 0.54 | | | $ | 0.47 | | | $ | 0.36 | |
| | |
|
|
| |
|
|
| |
|
|
|
Weighted average shares, basic | | | 2,248,431 | | | | 2,382,977 | | | | 2,402,198 | |
| | |
|
|
| |
|
|
| |
|
|
|
Weighted average shares, diluted | | | 2,286,304 | | | | 2,432,582 | | | | 2,450,570 | |
| | |
|
|
| |
|
|
| |
|
|
|
The accompanying notes are an integral part of the consolidated financial statements.
41
EMC CORPORATION
CONSOLIDATED STATEMENTS OF CASH FLOWS
(in thousands)
| | | | | | | | | | | | |
| | | For the Year Ended December 31,
| |
| | | 2006
| | | 2005
| | | 2004
| |
Cash flows from operating activities: | | | | | | | | | | | | |
Cash received from customers | | $ | 11,167,249 | | | $ | 9,732,761 | | | $ | 8,329,367 | |
Cash paid to suppliers and employees | | | (8,666,586 | ) | | | (7,539,855 | ) | | | (6,299,057 | ) |
Dividends and interest received | | | 258,631 | | | | 249,208 | | | | 162,427 | |
Interest paid | | | (26,804 | ) | | | (9,132 | ) | | | (6,423 | ) |
Income taxes paid | | | (592,066 | ) | | | (216,686 | ) | | | (84,019 | ) |
| | |
|
|
| |
|
|
| |
|
|
|
Net cash provided by operating activities | | | 2,140,424 | | | | 2,216,296 | | | | 2,102,295 | |
| | |
|
|
| |
|
|
| |
|
|
|
Cash flows from investing activities: | | | | | | | | | | | | |
Additions to property, plant and equipment | | | (718,095 | ) | | | (601,145 | ) | | | (371,449 | ) |
Capitalized software development costs | | | (192,895 | ) | | | (167,109 | ) | | | (166,347 | ) |
Purchases of short and long-term available for sale securities | | | (6,611,698 | ) | | | (12,115,524 | ) | | | (8,391,782 | ) |
Sales of short and long-term available for sale securities | | | 7,758,144 | | | | 12,726,160 | | | | 7,450,027 | |
Maturities of short and long-term available for sale securities | | | 107,120 | | | | 257,751 | | | | 83,659 | |
Business acquisitions, net of cash acquired | | | (2,618,376 | ) | | | (683,663 | ) | | | (590,410 | ) |
Other | | | (20,860 | ) | | | (28,155 | ) | | | (78,398 | ) |
| | |
|
|
| |
|
|
| |
|
|
|
Net cash used in investing activities | | | (2,296,660 | ) | | | (611,685 | ) | | | (2,064,700 | ) |
| | |
|
|
| |
|
|
| |
|
|
|
Cash flows from financing activities: | | | | | | | | | | | | |
Issuance of common stock | | | 257,789 | | | | 263,296 | | | | 229,951 | |
Repurchase of common stock | | | (3,655,404 | ) | | | (1,003,419 | ) | | | (545,718 | ) |
Excess tax benefits from stock-based compensation | | | 20,025 | | | | — | | | | — | |
Payment of short and long-term obligations | | | (2,331,587 | ) | | | (3,721 | ) | | | (8,196 | ) |
Proceeds from short and long-term obligations | | | 5,654,004 | | | | 220 | | | | 140 | |
Purchase of call options | | | (669,076 | ) | | | — | | | | — | |
Sale of warrants | | | 391,144 | | | | — | | | | — | |
Debt issuance costs | | | (58,863 | ) | | | — | | | | — | |
| | |
|
|
| |
|
|
| |
|
|
|
Net cash used in financing activities | | | (391,968 | ) | | | (743,624 | ) | | | (323,823 | ) |
Effect of exchange rate changes on cash | | | 53,940 | | | | (15,420 | ) | | | 10,055 | |
| | |
|
|
| |
|
|
| |
|
|
|
Net (decrease) increase in cash and cash equivalents | | | (494,264 | ) | | | 845,567 | | | | (276,173 | ) |
Cash and cash equivalents at beginning of year | | | 2,322,370 | | | | 1,476,803 | | | | 1,752,976 | |
| | |
|
|
| |
|
|
| |
|
|
|
Cash and cash equivalents at end of year | | $ | 1,828,106 | | | $ | 2,322,370 | | | $ | 1,476,803 | |
| | |
|
|
| |
|
|
| |
|
|
|
Reconciliation of net income to net cash provided by operating activities: | | | | | | | | | | | | |
Net income | | $ | 1,223,982 | | | $ | 1,133,165 | | | $ | 871,189 | |
Adjustments to reconcile net income to net cash provided by operating activities: | | | | | | | | | | | | |
Cumulative effect of a change in accounting principle | | | 3,372 | | | | — | | | | — | |
Depreciation and amortization | | | 764,162 | | | | 639,974 | | | | 616,357 | |
Non-cash restructuring and other special charges | | | 75,889 | | | | 17,370 | | | | 19,291 | |
Stock-based compensation expense | | | 398,687 | | | | 81,578 | | | | 59,715 | |
Provision for doubtful accounts | | | 10,290 | | | | 9,750 | | | | 10,067 | |
Deferred income taxes, net | | | (131,966 | ) | | | (3,173 | ) | | | 241,591 | |
Tax benefit from stock options exercised | | | — | | | | 42,593 | | | | 46,302 | |
Excess tax benefits from stock-based compensation | | | (20,025 | ) | | | — | | | | — | |
Other | | | 27,271 | | | | 56,594 | | | | (2,143 | ) |
Changes in assets and liabilities, net of acquisitions: | | | | | | | | | | | | |
Accounts and notes receivable | | | (232,295 | ) | | | (221,507 | ) | | | (208,595 | ) |
Inventories | | | (69,567 | ) | | | (180,442 | ) | | | 21,084 | |
Other assets | | | (31,822 | ) | | | (65,150 | ) | | | (20,554 | ) |
Accounts payable | | | 59,631 | | | | 12,186 | | | | 108,827 | |
Accrued expenses | | | 133,856 | | | | 153,622 | | | | 75,346 | |
Income taxes payable | | | (297,936 | ) | | | 263,255 | | | | (58,612 | ) |
Deferred revenue | | | 234,164 | | | | 280,563 | | | | 298,407 | |
Other liabilities | | | (7,269 | ) | | | (4,082 | ) | | | 24,023 | |
| | |
|
|
| |
|
|
| |
|
|
|
Net cash provided by operating activities | | $ | 2,140,424 | | | $ | 2,216,296 | | | $ | 2,102,295 | |
| | |
|
|
| |
|
|
| |
|
|
|
Non-cash activity: | | | | | | | | | | | | |
Issuance of common stock and stock options exchanged in business combinations | | $ | 41,151 | | | $ | 77,645 | | | $ | 73,351 | |
The accompanying notes are an integral part of the consolidated financial statements.
42
EMC CORPORATION
CONSOLIDATED STATEMENTS OF STOCKHOLDERS’ EQUITY
(in thousands)
| | | | | | | | | | | | | | | | | | | | | | | | | | | | | | | | | |
| | | Common Stock
| | | Additional
Paid-in Capital
| | | Deferred Compensation
| | | Retained Earnings
| | Accumulated
Other
Comprehensive Income (Loss)
| | | Treasury Stock
| | | Stockholders’ Equity
| |
| | | Shares
| | | Par Value
| | | | | | | Shares
| | | Cost
| | |
Balance, January 1, 2004 | | 2,476,821 | | | $ | 24,768 | | | $ | 6,894,823 | | | $ | (94,068 | ) | | $ | 4,566,157 | | $ | 2,197 | | | (62,082 | ) | | $ | (509,156 | ) | | $ | 10,884,721 | |
Stock issued through stock option and stock purchase plans | | 32,149 | | | | 321 | | | | 229,630 | | | | — | | | | — | | | — | | | — | | | | — | | | | 229,951 | |
Tax benefit from stock options exercised | | — | | | | — | | | | 24,907 | | | | — | | | | — | | | — | | | — | | | | — | | | | 24,907 | |
Compensation charge for variable stock options | | — | | | | — | | | | 20 | | | | — | | | | — | | | — | | | — | | | | — | | | | 20 | |
Grants of restricted stock, net of cancellations and withholdings | | 4,656 | | | | 47 | | | | 58,928 | | | | (58,975 | ) | | | — | | | — | | | — | | | | — | | | | — | |
Repurchase of common stock | | (19,940 | ) | | | (199 | ) | | | (235,876 | ) | | | — | | | | — | | | — | | | (26,617 | ) | | | (309,643 | ) | | | (545,718 | ) |
Reclassification of treasury stock to common stock | | (88,699 | ) | | | (887 | ) | | | (817,912 | ) | | | — | | | | — | | | — | | | 88,699 | | | | 818,799 | | | | — | |
Stock options issued in purchase acquisitions | | — | | | | — | | | | 73,351 | | | | (37,730 | ) | | | — | | | — | | | — | | | | — | | | | 35,621 | |
Amortization of deferred compensation | | — | | | | — | | | | — | | | | 59,715 | | | | — | | | — | | | — | | | | — | | | | 59,715 | |
Reversal of deferred compensation due to employee terminations | | (18 | ) | | | — | | | | (6,772 | ) | | | 6,772 | | | | — | | | — | | | — | | | | — | | | | — | |
Change in market value of investments | | — | | | | — | | | | — | | | | — | | | | — | | | (36,545 | ) | | — | | | | — | | | | (36,545 | ) |
Change in market value of derivatives | | — | | | | — | | | | — | | | | — | | | | — | | | (31 | ) | | — | | | | — | | | | (31 | ) |
Translation adjustment | | — | | | | — | | | | — | | | | — | | | | — | | | (543 | ) | | — | | | | — | | | | (543 | ) |
Net income | | — | | | | — | | | | — | | | | — | | | | 871,189 | | | — | | | — | | | | — | | | | 871,189 | |
| | |
|
| |
|
|
| |
|
|
| |
|
|
| |
|
| |
|
|
| |
|
| |
|
|
| |
|
|
|
Balance, December 31, 2004 | | 2,404,969 | | | | 24,050 | | | | 6,221,099 | | | | (124,286 | ) | | | 5,437,346 | | | (34,922 | ) | | — | | | | — | | | | 11,523,287 | |
| | |
|
| |
|
|
| |
|
|
| |
|
|
| |
|
| |
|
|
| |
|
| |
|
|
| |
|
|
|
Stock issued through stock option and stock purchase plans | | 33,789 | | | | 337 | | | | 262,959 | | | | — | | | | — | | | — | | | — | | | | — | | | | 263,296 | |
Tax benefit from stock options exercised | | — | | | | — | | | | 32,127 | | | | — | | | | — | | | — | | | — | | | | — | | | | 32,127 | |
Compensation charge for variable stock options | | — | | | | — | | | | 37 | | | | — | | | | — | | | — | | | — | | | | — | | | | 37 | |
Grants of restricted stock, net of cancellations and withholdings | | 19,484 | | | | 195 | | | | 283,747 | | | | (283,942 | ) | | | — | | | — | | | — | | | | — | | | | — | |
Repurchase of common stock | | (73,838 | ) | | | (738 | ) | | | (1,002,681 | ) | | | — | | | | — | | | — | | | — | | | | — | | | | (1,003,419 | ) |
Stock options issued in purchase acquisitions | | — | | | | — | | | | 77,645 | | | | (13,521 | ) | | | — | | | — | | | — | | | | — | | | | 64,124 | |
Amortization of deferred compensation | | — | | | | — | | | | — | | | | 81,578 | | | | — | | | — | | | — | | | | — | | | | 81,578 | |
Reversal of deferred compensation due to employee terminations | | (257 | ) | | | (3 | ) | | | (7,857 | ) | | | 7,860 | | | | — | | | — | | | — | | | | — | | | | — | |
Change in market value of investments | | — | | | | — | | | | — | | | | — | | | | — | | | (9,309 | ) | | — | | | | — | | | | (9,309 | ) |
Change in market value of derivatives | | — | | | | — | | | | — | | | | — | | | | — | | | 898 | | | — | | | | — | | | | 898 | |
Translation adjustment | | — | | | | — | | | | — | | | | — | | | | — | | | (20,354 | ) | | — | | | | — | | | | (20,354 | ) |
Net income | | — | | | | — | | | | — | | | | — | | | | 1,133,165 | | | — | | | — | | | | — | | | | 1,133,165 | |
| | |
|
| |
|
|
| |
|
|
| |
|
|
| |
|
| |
|
|
| |
|
| |
|
|
| |
|
|
|
Balance, December 31, 2005 | | 2,384,147 | | | | 23,841 | | | | 5,867,076 | | | | (332,311 | ) | | | 6,570,511 | | | (63,687 | ) | | — | | | | — | | | | 12,065,430 | |
| | |
|
| |
|
|
| |
|
|
| |
|
|
| |
|
| |
|
|
| |
|
| |
|
|
| |
|
|
|
Stock issued through stock option and stock purchase plans | | 34,787 | | | | 349 | | | | 257,440 | | | | — | | | | — | | | — | | | — | | | | — | | | | 257,789 | |
Tax benefit from stock options exercised | | — | | | | — | | | | 30,728 | | | | — | | | | — | | | — | | | — | | | | — | | | | 30,728 | |
Grants of restricted stock, net of cancellations and withholdings | | 5,739 | | | | 56 | | | | (20,069 | ) | | | — | | | | — | | | — | | | — | | | | — | | | | (20,013 | ) |
Repurchase of common stock | | (302,334 | ) | | | (3,023 | ) | | | (3,652,381 | ) | | | — | | | | — | | | — | | | — | | | | — | | | | (3,655,404 | ) |
Reclassification of deferred compensation to additional paid-in capital | | — | | | | — | | | | (332,311 | ) | | | 332,311 | | | | — | | | — | | | — | | | | — | | | | — | |
Stock options issued in purchase acquisitions | | — | | | | — | | | | 41,151 | | | | — | | | | — | | | — | | | — | | | | — | | | | 41,151 | |
Stock-based compensation | | — | | | | — | | | | 399,949 | | | | — | | | | — | | | — | | | — | | | | — | | | | 399,949 | |
Purchase of call options | | — | | | | — | | | | (669,076 | ) | | | — | | | | — | | | — | | | — | | | | — | | | | (669,076 | ) |
Tax benefit from purchase of call options | | — | | | | — | | | | 250,903 | | | | — | | | | — | | | — | | | — | | | | — | | | | 250,903 | |
Sale of warrants | | — | | | | — | | | | 391,144 | | | | — | | | | — | | | — | | | — | | | | — | | | | 391,144 | |
Impact of adoption of new accounting standard for pension and other post-retirement plans (see Note A) | | — | | | | — | | | | — | | | | — | | | | — | | | (58,275 | ) | | — | | | | — | | | | (58,275 | ) |
Change in market value of investments | | — | | | | — | | | | — | | | | — | | | | — | | | 22,762 | | | — | | | | — | | | | 22,762 | |
Change in market value of derivatives | | — | | | | — | | | | — | | | | — | | | | — | | | (805 | ) | | — | | | | — | | | | (805 | ) |
Translation adjustment | | — | | | | — | | | | — | | | | — | | | | — | | | 45,442 | | | — | | | | — | | | | 45,442 | |
Net income | | — | | | | — | | | | — | | | | — | | | | 1,223,982 | | | — | | | — | | | | — | | | | 1,223,982 | |
| | |
|
| |
|
|
| |
|
|
| |
|
|
| |
|
| |
|
|
| |
|
| |
|
|
| |
|
|
|
Balance, December 31, 2006 | | 2,122,339 | | | $ | 21,223 | | | $ | 2,564,554 | | | $ | — | | | $ | 7,794,493 | | $ | (54,563 | ) | | — | | | $ | — | | | $ | 10,325,707 | |
| | |
|
| |
|
|
| |
|
|
| |
|
|
| |
|
| |
|
|
| |
|
| |
|
|
| |
|
|
|
The accompanying notes are an integral part of the consolidated financial statements.
43
EMC CORPORATION
CONSOLIDATED STATEMENTS OF COMPREHENSIVE INCOME
(in thousands)
| | | | | | | | | | | | |
| | | For the Year Ended December 31,
| |
| | | 2006
| | | 2005
| | | 2004
| |
Net income | | $ | 1,223,982 | | | $ | 1,133,165 | | | $ | 871,189 | |
Other comprehensive income (loss), net of taxes (benefit): | | | | | | | | | | | | |
Foreign currency translation adjustments, net of taxes (benefit) of
$0, $(10,716) and $4,979 | | | 45,442 | | | | (20,354 | ) | | | (543 | ) |
Changes in market value of investments, including unrealized gains
and losses and reclassification adjustments to net income, net of taxes (benefit) of $3,011, $3,543 and $(11,900) | | | 22,762 | | | | (9,309 | ) | | | (36,545 | ) |
Changes in market value of derivatives, net of taxes (benefit) of
$(90), $96 and $0 | | | (805 | ) | | | 898 | | | | (31 | ) |
| | |
|
|
| |
|
|
| |
|
|
|
Other comprehensive income (loss) | | | 67,399 | | | | (28,765 | ) | | | (37,119 | ) |
| | |
|
|
| |
|
|
| |
|
|
|
Comprehensive income | | $ | 1,291,381 | | | $ | 1,104,400 | | | $ | 834,070 | |
| | |
|
|
| |
|
|
| |
|
|
|
The accompanying notes are an integral part of the consolidated financial statements.
44
EMC CORPORATION
NOTES TO CONSOLIDATED FINANCIAL STATEMENTS
A. Summary of Significant Accounting Policies
Company
EMC Corporation (“EMC”) and its subsidiaries develop, deliver and support the Information Technology (“IT”) industry’s broadest range of information infrastructure technologies and solutions that are designed to help individuals and organizations handle their digital information needs.
EMC’s systems, software, and services support our customers’ critical business processes by helping them build information infrastructures from the most comprehensive systems available to store, manage and protect information at the right service levels and the right costs. We refer to this as an information lifecycle management (“ILM”) strategy. Our information management software and solutions empower our customers to capture, manage and leverage structured and unstructured information – documents, images or emails – to support their business processes. Our virtual infrastructure software helps organizations respond to changing IT requirements by dynamically altering their computing and storage environments with flexible virtualization technologies. Our resource management software allows organizations to better understand, manage and automate the operation of their information infrastructure.
Additionally, we also recently created an information security division to help customers systematically and comprehensively secure their information. Through the company’s recent acquisitions of RSA Security Inc. (“RSA”) and Network Intelligence Corporation (“Network Intelligence”) and our organic development initiatives, this new division offers customers security solutions to assess the risk to their information; secure the people accessing information and the infrastructure; protect the confidentiality and integrity of the information itself; and manage security information and events to assure effectiveness and ease the burdens of compliance.
Accounting Principles
The financial statements and accompanying notes are prepared in accordance with accounting principles generally accepted in the United States of America.
Principles of Consolidation
The consolidated financial statements include the accounts of EMC and its subsidiaries. All intercompany transactions and balances have been eliminated.
Basis of Presentation
Certain reclassifications have been made to the prior years’ financial statements to conform to the current year’s presentation.
Use of Accounting Estimates
The preparation of financial statements in conformity with generally accepted accounting principles requires management to make estimates and assumptions that affect the reported amounts of assets and liabilities, the reported amounts of revenues and expenses during the reporting period and the disclosure of contingent assets and liabilities at the date of the financial statements. Actual results could differ from those estimates.
Revenue Recognition
We derive revenue from sales of information systems, software and services. We recognize revenue when persuasive evidence of an arrangement exists, delivery has occurred, the sales price is fixed or determinable and collectibility is reasonably assured. This policy is applicable to all sales, including sales to resellers and end users. The following summarizes the major terms of our contractual relationships with our customers and the manner in which we account for sales transactions.
Systems sales consist of the sale of hardware, including Symmetrix systems, CLARiiON systems and Celerra systems, Centera systems and Connectrix systems. Revenue for hardware is generally recognized upon shipment.
Software sales consist of the sale of software application programs. Our software products provide customers with resource management, backup and archiving, content management, information security and server virtualization capabilities. Revenue for software is generally recognized upon shipment or electronic delivery. License revenue from royalty payments is recognized upon either receipt of royalty reports or payments from third parties.
45
EMC CORPORATION
NOTES TO CONSOLIDATED FINANCIAL STATEMENTS - (Continued)
Services revenue consists of installation services, professional services, software maintenance, hardware maintenance and training.
Installation and professional services are not considered essential to the functionality of our products as these services do not alter the product capabilities, do not require specialized skills and may be performed by our customers or other vendors. Installation services revenues are recognized upon completion of installation. Professional services revenues include information infrastructure assessments and design, integration and implementation, business continuity, data migration, residencies, networking storage and project management. Revenues on engagements for which reasonably dependable estimates of progress toward completion are capable of being made are recognized as earned based upon the hours incurred. Revenue on all other engagements is recognized upon completion.
Software and hardware maintenance revenues are recognized ratably over the contract period.
Training revenues are recognized upon completion of the training.
| | • | Multiple element arrangements |
When more than one element such as hardware, software and services are contained in a single arrangement, we allocate revenue between the elements based on each element’s relative fair value, provided that each element meets the criteria for treatment as a separate unit of accounting. An item is considered a separate unit of accounting if it has value to the customer on a standalone basis and there is objective and reliable evidence of the fair value of the undelivered items. Fair value is generally determined based upon the price charged when the element is sold separately. Fair value of software support services may also be measured by the renewal rate offered to the customer. In the absence of fair value for a delivered element, we allocate revenue first to the fair value of the undelivered elements and allocate the residual revenue to the delivered elements. In the absence of fair value for an undelivered element, the arrangement is accounted for as a single unit of accounting, resulting in a deferral of revenue recognition for the delivered elements until all undelivered elements have been fulfilled.
Our sales contracts generally provide for the customer to accept title and risk of loss when the product leaves our facilities. When shipping terms or local laws do not allow for passage of title and risk of loss at shipping point, we defer recognizing revenue until title and risk of loss transfer to the customer.
Revenue from sales-type leases is recognized at the net present value of future lease payments. Revenue from operating leases is recognized over the lease period.
We accrue for the estimated costs of systems’ warranty at the time of sale. We reduce revenue for estimated sales returns at the time of sale. Systems’ warranty costs are estimated based upon our historical experience and specific identification of systems’ requirements. Sales returns are estimated based upon our historical experience and specific identification of probable returns.
Shipping and Handling Costs
Shipping and handling costs are classified in cost of product sales.
Foreign Currency Translation
The local currency is the functional currency of the majority of our subsidiaries. Assets and liabilities are translated into U.S. dollars at exchange rates in effect at the balance sheet date. Income and expense items are translated at average rates for the period.
Gains and losses from foreign currency transactions are included in other expense, net, and consist of losses of $5.7 million in 2006, $17.9 million in 2005 and $13.4 million in 2004.
Derivatives
We use derivatives to hedge foreign currency exposures related to foreign currency denominated assets and liabilities and forecasted revenue and expense transactions.
46
EMC CORPORATION
NOTES TO CONSOLIDATED FINANCIAL STATEMENTS - (Continued)
We hedge our exposure in foreign currency denominated monetary assets and liabilities with foreign currency forward and option contracts. Since these derivatives hedge existing exposures that are denominated in foreign currencies, the contracts do not qualify for hedge accounting. Accordingly, all outstanding derivatives are recognized on the balance sheet at fair value and the changes in fair value from these contracts are recorded in other expense, net, in the income statement. These derivative contracts mature in less than one year.
We use foreign currency forward and option contracts to hedge our exposure on a portion of our forecasted revenue and expense transactions. These derivatives are designated as cash flow hedges. All outstanding derivatives are recognized on the balance sheet at fair value and changes in their fair value are recorded in accumulated other comprehensive loss until the underlying forecasted transactions occur. To achieve hedge accounting, the criteria specified in Financial Accounting Standard (“FAS”) No. 133, “Accounting for Derivative Instrument and Hedging Activities” (“FAS No. 133”) must be met. These criteria include (i) ensuring at the inception of the hedge that formal documentation exists for both the hedging relationship and the entity’s risk management objective and strategy for undertaking the hedge and (ii) at the inception of the hedge and on an ongoing basis, the hedging relationship is expected to be highly effective in achieving offsetting changes in fair value attributed to the hedged risk during the period that the hedge is designated. Further, an assessment of effectiveness is required at a minimum on a quarterly basis. Absent meeting these criteria, changes in fair value are recognized currently in other expense, net, in the income statement. Once the underlying forecasted transaction is realized, the gain or loss from the derivative designated as a hedge of the transaction is reclassified from accumulated other comprehensive loss to the income statement, in the related revenue or expense caption, as appropriate. In the event the underlying forecasted transaction does not occur, the amount recorded in accumulated other comprehensive loss will be reclassified to other expense, net, in the income statement in the then-current period. Any ineffective portion of the derivatives designated as cash flow hedges is recognized in current earnings, which did not represent a material amount for the fiscal years presented. The ineffective portion of the derivatives consists of gains or losses associated with differences between actual and forecasted amounts. Our cash flow hedges generally mature within six months or less. Total cash flow hedges outstanding as of December 31, 2006, 2005 and 2004 were $93 million, $107 million and $60 million, respectively.
We do not engage in currency speculation. For purposes of presentation within the statement of cash flows, derivative gains and losses are presented within net cash provided by operating activities.
Cash and Cash Equivalents
Cash and cash equivalents include highly liquid investments with a maturity of ninety days or less at the time of purchase. Cash equivalents consist primarily of money market securities, U.S. treasury bills, U.S. agency discount notes and commercial paper. Cash equivalents are stated at amortized cost plus accrued interest, which approximates market. Total cash equivalents were $775.9 million and $1,659.4 million at December 31, 2006 and 2005, respectively.
Allowance for Doubtful Accounts
We maintain an allowance for doubtful accounts for the estimated probable losses on uncollectible accounts and notes receivable. The allowance is based upon the creditworthiness of our customers, our historical experience, the age of the receivable and current market and economic conditions. Uncollectible amounts are charged against the allowance account. The allowance for doubtful accounts is maintained against both our current and non-current accounts and notes receivable balances. The balances in the allowance accounts at December 31, 2006 and 2005 were as follows (table in thousands):
| | | | | | |
| | | December 31,
|
| | | 2006
| | 2005
|
Current | | $ | 39,509 | | $ | 38,126 |
Non-current (included in other assets, net) | | | 2,000 | | | 1,800 |
| | |
|
| |
|
|
| | | $ | 41,509 | | $ | 39,926 |
| | |
|
| |
|
|
Investments
Our investments are comprised primarily of debt securities that are classified as available for sale and recorded at their fair market values. Investments with remaining maturities of twelve months or less from the balance sheet date are classified as short-term investments. Investments with remaining maturities of more than twelve months from the balance sheet date are classified as long-term investments.
47
EMC CORPORATION
NOTES TO CONSOLIDATED FINANCIAL STATEMENTS - (Continued)
We also hold strategic equity investments. Strategic equity investments in publicly traded companies are classified as available for sale when there are no restrictions on our ability to liquidate such securities. These investments are also carried at their market values. Strategic equity investments in privately-held companies are carried at the lower of cost or net realizable value due to their illiquid nature. We review these investments to ascertain whether unrealized losses are other than temporary.
Unrealized gains and temporary losses on investments classified as available for sale are included within accumulated other comprehensive loss, net of any related tax effect. Realized gains and losses and other than temporary impairments on non-strategic investments are reflected in the income statement in investment income. Realized gains and losses and other than temporary impairments on strategic investments are reflected in the income statement in other expense, net. Gains or losses are calculated primarily using the first-in, first-out method.
Inventories
Inventories are stated at the lower of cost (first-in, first-out) or market, not in excess of net realizable value.
Property, Plant and Equipment
Property, plant and equipment are recorded at cost. Buildings under development are included in building construction in progress. Depreciation commences upon placing the asset in service and is recognized on a straight-line basis over the estimated useful lives of the assets, as follows:
| | |
Furniture and fixtures | | 5-7 years |
Equipment | | 1-10 years |
Improvements | | 5-25 years |
Buildings | | 25-31 1/2 years |
Upon retirement or disposition, the asset cost and related accumulated depreciation are removed with any gain or loss recognized in the income statement. Repair and maintenance costs, including planned maintenance, are expensed as incurred.
Research and Development and Capitalized Software Development Costs
Research and development (“R&D”) costs are expensed as incurred. R&D costs include salaries and benefits, consultants, facilities related costs, material costs, depreciation and travel. Software development costs incurred subsequent to establishing technological feasibility through the general release of the software products are capitalized. Technological feasibility is demonstrated by the completion of a detailed program design or working model. Capitalized costs are amortized over periods ranging from eighteen months to two years which represent the products’ estimated useful lives. Unamortized software development costs were $310.3 million and $261.6 million at December 31, 2006 and 2005, respectively, and are included in other assets, net. Amortization expense was $166.9 million, $124.5 million and $113.5 million in 2006, 2005 and 2004, respectively. Amounts capitalized were $215.6 million, $167.1 million and $166.3 million in 2006, 2005 and 2004, respectively.
Long-lived Assets
Purchased intangible assets, other than goodwill, are amortized over their estimated useful lives which range from one to twelve years. Intangible assets include goodwill, developed technology, trademarks and tradenames, customer relationships and customer lists, software licenses, patents and other intangible assets, which include backlog, non-competition agreements and non-solicitation agreements. Goodwill is not amortized and is carried at its historical cost.
We periodically review our long-lived assets for impairment. We initiate reviews for impairment whenever events or changes in business circumstances indicate that the carrying amount of the assets may not be fully recoverable or that the useful lives of these assets are no longer appropriate. Each impairment test is based on a comparison of the undiscounted cash flows to the recorded value of the asset. If an impairment is indicated, the asset is written down to its estimated fair value.
We test goodwill for impairment in the fourth quarter of each year or more frequently if events or changes in circumstances indicate that the asset might be impaired.
48
EMC CORPORATION
NOTES TO CONSOLIDATED FINANCIAL STATEMENTS - (Continued)
Advertising
Advertising costs are expensed as incurred. Advertising expense was $16.1 million, $14.7 million and $11.7 million in 2006, 2005 and 2004, respectively.
Legal Costs
Legal costs incurred in connection with loss contingencies are recognized when the costs are probable of occurrence and estimable.
Income Taxes
Deferred tax liabilities and assets are recognized for the expected future tax consequences of events that have been included in the financial statements or tax returns. Deferred tax liabilities and assets are determined based on the difference between the tax basis of assets and liabilities and their reported amounts using enacted tax rates in effect for the year in which the differences are expected to reverse. Tax credits are generally recognized as reductions of income tax provisions in the year in which the credits arise. The measurement of deferred tax assets is reduced by a valuation allowance if, based upon available evidence, it is more likely than not that some or all of the deferred tax assets will not be realized.
We do not provide for a U.S. income tax liability on undistributed earnings of our foreign subsidiaries. The earnings of non-U.S. subsidiaries, which reflect full provision for non-U.S. income taxes, are currently indefinitely reinvested in non-U.S. operations or will be remitted substantially free of additional tax.
Sales Taxes
Sales and other taxes collected from customers and subsequently remitted to government authorities are recorded as accounts receivable with a corresponding offset recorded to sales taxes payable. These balances are removed from the consolidated balance sheet as cash is collected from the customers and remitted to the tax authority.
Earnings Per Share
Basic net income per share is computed using the weighted average number of shares of our common stock outstanding during the period. Diluted net income per share is computed using the weighted average number of common and dilutive common equivalent shares outstanding during the period. Common equivalent shares consist of stock options, unvested restricted stock, the $125.0 million 4.5% Senior Convertible notes due April 1, 2007 that we assumed in connection with the acquisition of Documentum (the “Documentum notes”), our $1.725 billion 1.75% convertible senior notes due 2011 (the “2011 Notes”), our $1.725 billion 1.75% convertible senior notes due 2013 (the “2013 Notes” and, together with the 2011 Notes, the “Notes”), and the associated warrants (the “Sold Warrants”). See Note D for further information regarding the Notes and the Sold Warrants and Note N for further information regarding the calculation of diluted net income per weighted average share.
Retirement/Post Employment Benefits
Pension cost for our domestic defined benefit pension plan is funded to the extent that current pension cost is deductible for U.S. Federal tax purposes and to comply with the Employee Retirement Income Security Act and the General Agreement on Tariff and Trade Bureau additional minimum funding requirements. Net pension cost for our international defined benefit pension plans are generally funded as accrued.
Post-retirement benefit cost for the domestic post-retirement benefits plan assumed as part of our acquisition of Data General Corporation is generally funded on a pay-as-you-go basis to the extent that current cost is deductible for U.S. Federal tax purposes.
On December 31, 2006 we adopted FAS No. 158, “Employers’ Accounting for Defined Benefit Pension and Other Postretirement Plans, an amendment of FASB Statements No. 87, 88, 106 and 132(R)” (“FAS No. 158”), which requires an employer to recognize in its statement of financial position the net funded status of each of its defined benefit postretirement plans.
Prior to the issuance of FAS No. 158, the net amount recognized as an asset or liability on our consolidated balance sheet with respect to our defined benefit pension and other post-retirement plans (the “Plans”) consisted of each plan’s net funded status,
49
EMC CORPORATION
NOTES TO CONSOLIDATED FINANCIAL STATEMENTS - (Continued)
adjusted to exclude the effects of accumulated actuarial gains/losses and prior service credits that would be recognized in future periods. Upon adoption of FAS No. 158, we adjusted the respective asset and liability balances of the Plans to reflect only their net funded status as of December 31, 2006. Accordingly, all accumulated actuarial gains/losses and prior service credits, net of tax, were reclassified to accumulated other comprehensive loss. The following represents the incremental effect of applying FAS No. 158 on individual line items in our consolidated balance sheet as of December 31, 2006 (table in thousands):
| | | | | | | | | | | |
Balance Sheet Line Item
| | Balance of the
Plans Prior to
Application of
FAS No. 158
| | Decrease from
Application of
FAS No. 158
| | | Balance of the
Plans After
Application of
FAS No. 158
| |
Other assets | | $ | 148,347 | | $ | (100,971 | ) | | $ | 47,376 | |
Accrued expenses | | | 27,087 | | | (5,787 | ) | | | 21,300 | |
Deferred income tax liability | | | 51,976 | | | (36,909 | ) | | | 15,067 | |
Accumulated other comprehensive loss | | | — | | | (58,275 | ) | | | (58,275 | ) |
Concentrations of Risks
Financial instruments which potentially subject us to concentrations of credit risk consist principally of cash and cash equivalents, short- and long-term investments, accounts and notes receivable and foreign currency exchange contracts. Deposits held with banks may exceed the amount of insurance provided on such deposits. Generally, these deposits may be redeemed upon demand and are maintained with financial institutions of reputable credit and therefore bear minimal credit risk. We place our cash and cash equivalents and short- and long-term investments primarily in investment grade instruments and limit the amount of investment with any one issuer. We have entered into various agreements to loan fixed income securities generally on an overnight basis. Under these securities lending agreements, the value of the collateral is equal to 102% of the fair market value of the loaned securities. The collateral is generally cash, U.S. government-backed securities or letters of credit and is held in our possession. At December 31, 2006, there were no outstanding securities lending transactions. We provide credit to customers in the normal course of business. Credit is extended to new customers based upon industry reputation or a check of credit references. Credit is extended to existing customers based on prior payment history and demonstrated financial stability. The credit risk associated with accounts and notes receivables is generally limited due to the large number of customers and their broad dispersion over many different industries and geographic areas. Our sales are generally dispersed to a large number of customers, minimizing the reliance on any particular customer or group of customers. Dell, Inc., one of our channel partners, accounted for 14.5% and 11.6% of our revenues in 2006 and 2005, respectively, and accounted for 10.2% of our accounts receivable at December 31, 2006. The counterparties to our foreign currency exchange contracts consist of a number of major financial institutions. In addition to limiting the amount of the contracts we enter into with any one party, we monitor the credit quality of the counterparties.
We purchase or license many sophisticated components and products from one or a limited number of qualified suppliers. If any of our suppliers were to cancel or materially change contracts or commitments with us or fail to meet the quality or delivery requirements needed to satisfy customer orders for our products, we could lose customer orders. We attempt to minimize this risk by finding alternative suppliers or maintaining adequate inventory levels to meet our forecasted needs.
Accounting for Stock-Based Compensation
On January 1, 2006, we adopted FAS No. 123R, “Share-Based Payment” (“FAS No. 123R”). The standard requires recognizing compensation costs for all share-based payment awards made to employees and directors based upon the awards’ estimated grant date fair value. The standard covers employee stock options, restricted stock, restricted stock units and employee stock purchases related to our employee stock purchase plan. Additionally, we applied the provisions of the SEC’s Staff Accounting Bulletin No. 107 on Share-Based Payment to our adoption of FAS No. 123R. Previously, we elected to account for these share-based payment awards under Accounting Principles Board Opinion No. 25, “Accounting for Stock Issued to Employees” (“APB No. 25”) and elected to only disclose the impact of expensing the fair value of stock options in the notes to the financial statements.
We adopted FAS No. 123R using the modified prospective transition method which requires applying the standard as of January 1, 2006 (“the adoption date”). The modified prospective transition method does not result in the restatement of results from prior periods and accordingly, the results of operations for 2006 and future periods will not be comparable to our historical results of operations.
Under the modified prospective transition method, FAS No. 123R applies to new equity awards and to equity awards modified, repurchased or canceled after the adoption date. Additionally, compensation cost for the portion of awards granted prior
50
EMC CORPORATION
NOTES TO CONSOLIDATED FINANCIAL STATEMENTS - (Continued)
to the adoption date for which the requisite service has not been rendered as of the adoption date shall be recognized as the requisite service is rendered. The compensation cost for that portion of awards shall be based on the grant-date fair value of those awards as calculated in the prior period pro forma disclosures under FAS No. 123, “Accounting for Stock-Based Compensation” (“FAS No. 123”). Changes to the grant-date fair value of equity awards granted before the effective date are precluded. The compensation cost for those earlier awards shall be attributed to periods beginning on or after the adoption date using the attribution method that was used under FAS No. 123, which was the straight-line method. Instead of recognizing forfeitures only as they occur, we now estimate an expected forfeiture rate which is factored in to determine our quarterly expense. Deferred compensation which related to those earlier awards has been eliminated against additional paid-in capital. FAS No. 123R also changes the reporting of tax-related amounts within the statement of cash flows. The gross amount of windfall tax benefits resulting from stock-based compensation will be reported as financing inflows.
For stock options, we have selected the Black-Scholes option-pricing model to determine the fair value of our stock option awards. For stock options, restricted stock and restricted stock units, we recognize compensation cost on a straight-line basis over the awards’ vesting periods for those awards which contain only a service vesting feature. For awards with a performance condition vesting feature, we recognize compensation cost on a graded-vesting basis over the awards’ expected vesting periods.
New Accounting Pronouncements
In June 2006, the Financial Accounting Standards Board (“FASB”) issued FASB Interpretation No. 48, “Accounting for Uncertainty in Income Taxes, an Interpretation of FASB Statement No. 109” (“FIN No. 48”). FIN No. 48 clarifies the accounting for uncertainty in income taxes recognized in an enterprise’s financial statements in accordance with FAS No. 109, “Accounting for Income Taxes.” FIN No. 48 prescribes a two-step process to determine the amount of tax benefit to be recognized. First, the tax position must be evaluated to determine the likelihood that it will be sustained upon external examination. If the tax position is deemed “more-likely-than-not” to be sustained, the tax position is then assessed to determine the amount of benefit to recognize in the financial statements. The amount of the benefit that may be recognized is the largest amount that has a greater than 50 percent likelihood of being realized upon ultimate settlement. We are required to adopt FIN No. 48 effective as of January 1, 2007. We are currently evaluating the effect FIN No. 48 will have on our financial statements. We do not expect the impact will be material.
In September 2006, the FASB issued FAS No. 157, “Fair Value Measurements” (“FAS No. 157”), which addresses how companies should measure fair value when they are required to use a fair value measure for recognition or disclosure purposes under generally accepted accounting principles. FAS No. 157 defines fair value, establishes a framework for measuring fair value in generally accepted accounting principles and expands disclosures about fair value measurements. FAS No. 157 is effective for financial statements issued for fiscal years beginning after November 15, 2007 and should be applied prospectively, except in the case of a limited number of financial instruments that require retrospective application. We are currently evaluating the potential impact of FAS No. 157 on our financial position and results of operations.
In February 2007, the FASB issued FAS No. 159, “The Fair Value Option for Financial Assets and Financial Liabilities-including an amendment of FAS 115” (“FAS No. 159”). The new statement allows entities to choose, at specified election dates, to measure eligible financial assets and liabilities at fair value that are not otherwise required to be measured at fair value. If a company elects the fair value option for an eligible item, changes in that item’s fair value in subsequent reporting periods must be recognized in current earnings. FAS No. 159 is effective for fiscal years beginning after November 15, 2007. We are currently evaluating the potential impact of FAS No. 159 on our financial position and results of operations.
B. Business Acquisitions, Goodwill and Intangible Assets
2006 Acquisitions
Acquisition of RSA Security Inc.
In September 2006, we acquired all of the outstanding capital stock of RSA. RSA provides technologies to secure information no matter where it resides or travels inside or outside of an organization and throughout its lifecycle. The acquisition adds industry-leading identity and access management solutions and encryption and key management software to our product offerings.
The purchase price, net of cash received, was approximately $2.0 billion, which consisted of $2.0 billion of cash, $27.9 million in fair value of our stock options and $11.6 million of transaction costs, which primarily consisted of fees incurred by us
51
EMC CORPORATION
NOTES TO CONSOLIDATED FINANCIAL STATEMENTS - (Continued)
for financial advisory, legal and accounting services. The fair value of our stock options issued to employees of RSA was estimated using a Black-Scholes option-pricing model. The fair value of the stock options was estimated assuming no expected dividends and the following weighted-average assumptions:
| | | |
Expected life (in years) | | 1.6 | |
Expected volatility | | 31.0 | % |
Risk-free interest rate | | 5.0 | % |
The consolidated financial statements include the results of RSA from the date of acquisition. The purchase price has been allocated to the assets acquired and the liabilities assumed based on estimated fair values as of the acquisition date. The purchase price allocation is preliminary and a final determination of required purchase accounting adjustments will be made upon the finalization of our integration activities.
The following represents the preliminary allocation of the purchase price (table in thousands):
| | | | |
Current assets | | $ | 60,860 | |
Property, plant and equipment | | | 66,991 | |
Other long-term assets | | | 20,517 | |
Goodwill | | | 1,693,149 | |
Intangible assets: | | | | |
Developed technology (weighted-average useful life of 5.1 years) | | | 231,600 | |
Customer relationships (weighted-average useful life of 8.6 years) | | | 162,900 | |
Tradename and trademark (weighted-average useful life of 10.0 years) | | | 77,500 | |
Non-competition agreement (weighted-average useful life of 3.0 years) | | | 1,400 | |
Acquired in-process research and development (“IPR&D”) | | | 10,500 | |
| | |
|
|
|
Total intangible assets | | | 483,900 | |
Current liabilities | | | (174,763 | ) |
Deferred income taxes | | | (80,274 | ) |
Long-term liabilities | | | (21,893 | ) |
| | |
|
|
|
Total purchase price | | $ | 2,048,487 | |
| | |
|
|
|
In determining the purchase price allocation, we considered, among other factors, our intention to use the acquired assets and historical and estimated future demand of RSA products and services. The fair value of intangible assets was primarily based upon the income approach. The rate used to discount the net cash flows to their present values was based upon a weighted average cost of capital of 13.0%. The discount rate was determined after consideration of market rates of return on debt and equity capital, the weighted average return on invested capital and the risk associated with achieving forecasted sales related to the technology and assets acquired from RSA.
The total weighted average amortization period for the intangible assets is 7.1 years. The intangible assets are being amortized based upon the pattern in which the economic benefits of the intangible assets are being utilized, which in general reflects the cash flows generated from such assets. None of the goodwill is deductible for income tax purposes. Of the total goodwill acquired from the acquisition of RSA, $1,273.4 million was allocated to our RSA information security segment and $419.7 million was allocated to our information storage segment.
Of the $483.9 million of acquired intangible assets, $10.5 million was allocated to IPR&D which was written off at the respective date of acquisition because the IPR&D had no alternative uses and had not reached technological feasibility. The value assigned to IPR&D was determined utilizing the income approach by determining cash flow projections relating to the identified IPR&D projects. The stage of completion of each in-process project was estimated to determine the discount rates to be applied to the valuation of the in-process technology. Based upon the level of completion and the risk associated with in-process technology, we applied a discount rate of 18.0% to value the IPR&D projects.
In connection with the acquisition of RSA, we commenced integration activities which have resulted in recognizing $2.9 million in liabilities for employee termination benefits and $0.3 million for lease and contract terminations, of which $0.2 million was paid through December 31, 2006. We expect to pay the liabilities associated with the employee termination benefits through
52
EMC CORPORATION
NOTES TO CONSOLIDATED FINANCIAL STATEMENTS - (Continued)
2007 and the liabilities associated with the lease and contract terminations through 2008. Management is in the process of determining whether additional liabilities relating to employee termination benefits or other contractual obligations are required to be recorded.
Other 2006 Acquisitions
In May 2006, we acquired all of the outstanding capital stock of Kashya, Inc. (“Kashya”), a provider of enterprise-class data replication and data protection software. The acquisition of Kashya allows us to expand our software portfolio for replication across heterogeneous environments.
In May 2006, we acquired all of the outstanding capital stock of Interlink Group, Inc. (“Interlink”), an IT professional services firm that specializes in application development, IT infrastructure, enterprise integration, enterprise content management and customer relationship management for Microsoft environments. The acquisition of Interlink strengthens and expands our growing Microsoft solutions practice.
In June 2006, we acquired all of the outstanding capital stock of nLayers Ltd. (“nLayers”), a leader in application discovery and mapping software. The acquisition further expands our resource management portfolio, enabling automated comprehensive root-cause and impact analysis across all technology domains, including networks, applications and storage.
In June 2006, we acquired the assets of ProActivity Software Solutions Ltd. (“ProActivity”), a provider of content management software for business process management. ProActivity provides tools to monitor, analyze and optimize business processes. The acquisition further expands the EMC Documentum product suite’s process modeling, process execution and process integration capabilities.
In June 2006, our VMware subsidiary acquired all of the outstanding capital stock of Akimbi Systems, Inc. (“Akimbi”), a developer of software that builds upon and leverages virtualization technology to improve the efficiency and effectiveness of enterprise application development operations and the IT organizations that support them. Through the acquisition of Akimbi, we intend to enhance our capabilities for virtualizing information by providing virtualization solutions to the development and test environments.
In September 2006, we acquired all of the outstanding capital stock of Network Intelligence. Network Intelligence specializes in transforming enterprise-wide data into automated compliance and security information and, together with the acquisition of RSA, enables us to assist customers in securing their information throughout its lifecycle and reduce the associated cost of regulatory compliance.
In November 2006, we acquired all of the outstanding capital stock of Avamar Technologies, Inc. (“Avamar”), a leading provider of enterprise data protection software that allows corporations to efficiently move, store, and leverage information for business value. Avamar advances EMC’s core strengths in information protection and recovery management, changing the way customers protect their data and accelerating the transition from tape to disk-based recovery solutions.
The aggregate purchase price, net of cash received, for all acquisitions other than RSA was $624.7 million, which consisted of $598.8 million of cash, $13.3 million in fair value of our stock options issued in exchange for the acquirees’ stock options and $12.6 million of transaction costs, which primarily consisted of fees incurred by us for financial advisory, legal and accounting services.
The consolidated financial statements include the results of each of the aforementioned companies from their respective dates of acquisition. The purchase price for each company has been allocated to the assets acquired and the liabilities assumed based on estimated fair values as of the respective acquisition dates. The purchase price allocations are preliminary and a final determination of required purchase accounting adjustments will be made upon finalization of our integration activities. The total goodwill recognized from the aforementioned acquisitions was $478.3 million, of which $6.3 million is deductible for income tax purposes. Of this amount, we allocated $223.1 million to our information storage segment, $55.5 million to our content management and archiving segment, $77.3 million to our VMware virtual infrastructure segment and $122.4 million to our RSA information security segment.
53
EMC CORPORATION
NOTES TO CONSOLIDATED FINANCIAL STATEMENTS - (Continued)
The following represents the aggregate allocation of the purchase price for the aforementioned companies to intangible assets (table in thousands):
| | | |
Developed technology (weighted-average useful life of 5.6 years) | | $ | 89,147 |
Customer relationships (weighted-average useful life of 7.0 years) | | | 16,600 |
Tradenames and trademarks (weighted-average useful life of 0.5 years) | | | 26 |
Non-competition agreement (weighted-average useful life of 3.0 years) | | | 200 |
Backlog (weighted-average useful life of 2.0 years) | | | 900 |
Acquired IPR&D | | | 24,910 |
| | |
|
|
Total intangible assets | | $ | 131,783 |
| | |
|
|
The fair value of intangible assets was primarily based upon the income approach. The rates used to discount the net cash flows to their present values for each acquisition were based upon weighted average costs of capital that ranged from 5.3% - 25.0%. The discount rates were determined after consideration of market rates of return on debt and equity capital, the weighted average returns on invested capital and the risk associated with achieving forecasted sales related to the technology and assets acquired. The total weighted average amortization period for the intangible assets is 5.8 years. The intangible assets are being amortized based upon the pattern in which the economic benefits of the intangible assets are being utilized.
Of the $131.8 million of acquired intangible assets, $24.9 million was allocated to IPR&D which was written off at the respective dates of acquisition because the IPR&D had no alternative uses and had not reached technological feasibility. The value assigned to IPR&D was determined utilizing the income approach by determining cash flow projections relating to identified IPR&D projects. The stage of completion of each in-process project was estimated to determine the discount rates to be applied to the valuation of the in-process technology. Based upon the level of completion and the risk associated with in-process technology, we applied discount rates that ranged from 22.0% - 35.0% to value the IPR&D projects acquired.
Total IPR&D for all of these acquisitions and RSA was $35.4 million in 2006.
2005 Acquisitions
Acquisition of Captiva Software Corporation
In December 2005, we acquired all of the outstanding capital stock of Captiva Software Corporation (“Captiva”). Captiva is a provider of software solutions that capture and manage business-critical information from paper, faxed and scanned forms and documents, Internet forms and XML data streams, converting them into information that is usable in database, document, content and other information management systems. The acquisition enables us to deliver an expanded solution to our customers, enabling them to gain a richer understanding of their information and become better equipped to classify it, create policy based workflow and automate information lifecycle management.
The purchase price, net of cash received, was $322.6 million, which consisted of $280.8 million of cash, $36.3 million in fair value of our stock options and $5.5 million of transaction costs, which primarily consisted of financial advisory, legal and accounting services. The fair value of our stock options issued to employees was estimated using a Black-Scholes option-pricing model. The fair value of the stock options was estimated assuming no expected dividends and the following weighted-average assumptions:
| | |
Expected life (in years) | | 4.0 |
Expected volatility | | 40.0% |
Risk-free interest rate | | 4.32% |
The intrinsic value allocated to the unvested options issued in the acquisition that had yet to be earned as of the acquisition date was $8.0 million and was initially recorded as deferred compensation in the purchase price allocation. As a result of our adoption of FAS No. 123R in 2006, we reclassified all deferred compensation balances to additional paid-in capital.
54
EMC CORPORATION
NOTES TO CONSOLIDATED FINANCIAL STATEMENTS - (Continued)
The purchase price has been allocated based on estimated fair values as of the acquisition date. The following represents the final allocation of the purchase price (table in thousands):
| | | | |
Current assets | | $ | 12,395 | |
Property, plant and equipment | | | 1,635 | |
Other long-term assets | | | 374 | |
Goodwill | | | 264,245 | |
Intangible assets: | | | | |
Developed technology (weighted-average useful life of 4.4 years) | | | 42,530 | |
Customer relationships (weighted-average useful life of 7.1 years) | | | 22,800 | |
Tradenames and trademarks (weighted-average useful life of 5.0 years) | | | 2,000 | |
Non-competition agreements (weighted-average useful life of 3.0 years) | | | 750 | |
Acquired IPR&D | | | 14,270 | |
| | |
|
|
|
Total intangible assets | | | 82,350 | |
Deferred compensation | | | 8,000 | |
Current liabilities | | | (30,695 | ) |
Deferred income taxes | | | (14,949 | ) |
Long-term liabilities | | | (766 | ) |
| | |
|
|
|
Total purchase price | | $ | 322,589 | |
| | |
|
|
|
In determining the purchase price allocation, we considered, among other factors, our intention to use the acquired assets and historical demand and estimates of future demand of Captiva’s products and services. The fair value of intangible assets was primarily based upon the income approach. The rate used to discount the net cash flows to their present values was based upon a weighted average cost of capital of 15%. The discount rate was determined after consideration of market rates of return on debt and equity capital, the weighted average return on invested capital and the risk associated with achieving forecasted sales related to the technology and assets acquired from Captiva.
The total weighted average amortization period for the intangible assets is 5.3 years. The intangible assets are being amortized based upon the pattern in which the economic benefits of the intangible assets are being utilized. None of the goodwill is deductible for income tax purposes. The goodwill is classified within our content management and archiving segment.
Of the $82.4 million of acquired intangible assets, $14.3 million was allocated to IPR&D and was written off at the date of acquisition because the IPR&D had no alternative uses and had not reached technological feasibility. The value assigned to IPR&D was determined utilizing the income approach by determining cash flow projections relating to the IPR&D projects. The stage of completion of each in-process project was estimated to determine the discount rate to be applied to the valuation of the in-process technology. Based upon the level of completion and the risk associated with in-process technology, we deemed a discount rate of 30% as appropriate for valuing IPR&D.
In connection with the Captiva acquisition, we commenced integration activities which have resulted in recognizing $4.0 million in liabilities for employee termination benefits and $1.2 million for lease and contract terminations, of which $1.3 million was paid through December 31, 2006. We expect to pay the liabilities associated with the employee termination benefits through 2007 and the liabilities associated with the lease and contract terminations through 2009.
Acquisition of System Management Arts, Inc.
In February 2005, we acquired all of the outstanding capital stock of System Management Arts, Inc. (“Smarts”). Smarts’ software products automatically locate root-cause problems, calculate their impact across technology domains and present the logical action plan required to keep business services up and running. The acquisition enables us to offer event automation and real-time network systems management software. Additionally, the acquisition enables us to apply the modeling, correlation and root-cause analysis technology to expand our information and storage management offerings.
The purchase price, net of cash received, was $293.5 million, which consisted of $252.6 million of cash, $37.4 million in fair value of our stock options and $3.5 million of transaction costs, which primarily consisted of fees paid for financial advisory, legal
55
EMC CORPORATION
NOTES TO CONSOLIDATED FINANCIAL STATEMENTS - (Continued)
and accounting services. The fair value of our stock options issued to employees was estimated using a Black-Scholes option-pricing model. The fair value of the stock options was estimated assuming no expected dividends and the following weighted-average assumptions:
| | | |
Expected life (in years) | | 4.0 | |
Expected volatility | | 45.0 | % |
Risk-free interest rate | | 2.7 | % |
The intrinsic value allocated to the unvested options issued in the acquisition that had yet to be earned as of the acquisition date was $3.5 million and was initially recorded as deferred compensation in the purchase price allocation. As a result of our adoption of FAS No. 123R in 2006, we reclassified all deferred compensation balances to additional paid-in capital.
The consolidated financial statements include the results of Smarts from the date of acquisition. The purchase price has been allocated based on estimated fair values as of the acquisition date. The following represents the final allocation of the purchase price (table in thousands):
| | | | |
Current assets | | $ | 21,077 | |
Property, plant and equipment | | | 7,596 | |
Other long-term assets | | | 533 | |
Goodwill | | | 266,000 | |
Intangible assets: | | | | |
Developed technology (weighted-average useful life of 6.4 years) | | | 24,870 | |
Customer relationships (weighted-average useful life of 5.7 years) | | | 16,170 | |
Tradenames and trademarks (weighted-average useful life of 6.6 years) | | | 1,660 | |
Non-solicitation agreements (weighted-average useful life of 3.0 years) | | | 1,570 | |
Acquired IPR&D | | | 3,100 | |
| | |
|
|
|
Total intangible assets | | | 47,370 | |
Deferred compensation | | | 3,536 | |
Current liabilities | | | (33,059 | ) |
Deferred income taxes | | | (12,215 | ) |
Long-term liabilities | | | (7,354 | ) |
| | |
|
|
|
Total purchase price | | $ | 293,484 | |
| | |
|
|
|
In determining the purchase price allocation, we considered, among other factors, our intention to use the acquired assets and historical demand and estimates of future demand of Smarts’ products and services. The fair value of intangible assets was primarily based upon the income approach. The rate used to discount the net cash flows to their present values was based upon a weighted average cost of capital of 16%. The discount rate was determined after consideration of market rates of return on debt and equity capital, the weighted average return on invested capital and the risk associated with achieving forecasted sales related to the technology and assets acquired from Smarts.
The total weighted average amortization period for the intangible assets is 6.0 years. The intangible assets are being amortized based upon the pattern in which the economic benefits of the intangible assets are being utilized. None of the goodwill is deductible for income tax purposes. The goodwill is classified within our information storage segment.
Of the $47.4 million of acquired intangible assets, $3.1 million was allocated to IPR&D and was written off at the date of acquisition because the IPR&D had no alternative uses and had not reached technological feasibility. The value assigned to IPR&D was determined utilizing the income approach by determining cash flow projections relating to the IPR&D projects. The stage of completion of each in-process project was estimated to determine the discount rate to be applied to the valuation of the in-process technology. Based upon the level of completion and the risk associated with in-process technology, we deemed a discount rate of 40% as appropriate for valuing IPR&D.
In connection with the Smarts acquisition, we commenced integration activities which resulted in recognizing $1.9 million in liabilities for employee termination benefits and $1.0 million for lease and contract terminations, of which $2.4 million was paid through December 31, 2006. All liabilities associated with the employee termination benefits have been paid. We expect to pay the liabilities associated with the lease and contract terminations through 2008.
56
EMC CORPORATION
NOTES TO CONSOLIDATED FINANCIAL STATEMENTS - (Continued)
Acquisition of VMware, Inc.
In January 2004, we acquired all of the shares of outstanding stock of VMware, Inc. (“VMware”), a software company specializing in virtualization technology. VMware’s technology enables multiple operating systems to run simultaneously and independently on the same Intel-based server or workstation and move live applications across systems without business disruption. We determined that the acquisition advances our goal of simplifying the information technology operations of our customers. The purchase price, net of cash received, was approximately $613.1 million, which consisted of $539.4 million of cash, $72.0 million in fair value of our stock options and $1.7 million of transaction costs, which primarily consisted of fees paid for financial advisory, legal and accounting services. The fair value of our stock options issued to employees was estimated using a Black-Scholes option-pricing model. The fair value of the stock options was estimated assuming no expected dividends and the following weighted-average assumptions:
| | | |
Expected life (in years) | | 4.0 | |
Expected volatility | | 60.0 | % |
Risk-free interest rate | | 2.0 | % |
The intrinsic value allocated to the unvested options issued in the acquisition that had yet to be earned as of the acquisition date was $47.3 million and was initially recorded as deferred compensation in the purchase price allocation. As a result of our adoption of FAS No. 123R in 2006, we reclassified all deferred compensation balances to additional paid-in capital.
The consolidated financial statements include the results of VMware from the date of acquisition. The following represents the final allocation of the purchase price (table in thousands):
| | | | |
Current assets | | $ | 18,644 | |
Property, plant and equipment | | | 2,472 | |
Other long-term assets | | | 1,520 | |
Goodwill | | | 518,581 | |
Intangible assets: | | | | |
Developed technology (weighted-average useful life of 4.6 years) | | | 93,610 | |
Support and subscription contracts (weighted-average useful life of 9.0 years) | | | 3,950 | |
OEM contracts (weighted-average useful life of 5.0 years) | | | 5,570 | |
Tradenames and trademarks (weighted-average useful life of 5.0 years) | | | 7,580 | |
Non-solicitation agreements (weighted-average useful life of 3.0 years) | | | 40 | |
Acquired IPR&D | | | 15,200 | |
| | |
|
|
|
Total intangible assets | | | 125,950 | |
Deferred compensation | | | 47,300 | |
Current liabilities | | | (81,241 | ) |
Deferred income taxes | | | (16,444 | ) |
Long-term liabilities | | | (3,670 | ) |
| | |
|
|
|
Total purchase price | | $ | 613,112 | |
| | |
|
|
|
In determining the purchase price allocation, we considered, among other factors, our intention to use the acquired assets, historical demand and estimates of future demand of VMware’s products and services. The fair value of intangible assets was primarily based upon the income approach. The rate used to discount the net cash flows to their present values was based upon a weighted average cost of capital of 14%. The discount rate was determined after consideration of market rates of return on debt and equity capital, the weighted average return on invested capital and the risk associated with achieving forecast sales related to the technology and assets acquired from VMware.
The total weighted-average amortization period for the intangible assets is 4.8 years. The intangible assets are being amortized based upon the pattern in which the economic benefits of the intangible assets are being utilized. None of the goodwill is deductible for income tax purposes. The goodwill is classified within our VMware virtual infrastructure segment.
Of the $126.0 million of acquired intangible assets, $15.2 million was allocated to IPR&D and was written off at the date of acquisition because the IPR&D had no alternative uses and had not reached technological feasibility. The value assigned to IPR&D was determined utilizing the income approach by determining cash flow projections relating to the IPR&D projects. The stage of
57
EMC CORPORATION
NOTES TO CONSOLIDATED FINANCIAL STATEMENTS - (Continued)
completion of each in-process project was estimated to determine the discount rate to be applied to the valuation of the in-process technology. Based upon the level of completion and the risk associated with in-process technology, we deemed a discount rate of 50% as appropriate for valuing IPR&D.
Pro forma Effect of the Acquisitions
The following pro forma information gives effect to all the acquisitions set forth in the sections entitledRSA Security Inc.,Other 2006 Acquisitions, Captiva and System Management Arts, Inc. above as if the acquisitions occurred on January 1, 2005. The pro forma results are not necessarily indicative of what actually would have occurred had the acquisitions been in effect for the periods presented (table in thousands, except per share data):
| | | | | | |
| | | (unaudited) Year Ended December 31,
|
| | | 2006
| | 2005
|
Revenue | | $ | 11,452,189 | | $ | 10,112,926 |
Net income | | | 1,087,513 | | | 1,010,428 |
Net income per weighted average share, basic | | $ | 0.48 | | $ | 0.43 |
Net income per weighted average share, diluted | | $ | 0.48 | | $ | 0.42 |
The pro forma impact on reported net income per weighted average share was primarily attributable to amortization of acquired intangible assets and interest expense associated with the acquisition of RSA.
Intangible Assets
Intangible assets, excluding goodwill, as of December 31, 2006 and 2005, consist of (tables in thousands):
| | | | | | | | | | |
2006 Category
| | Gross Carrying
Amount
| | Accumulated
Amortization
| | | Net Book Value
|
Purchased technology | | $ | 817,066 | | $ | (338,493 | ) | | $ | 478,573 |
Patents | | | 61,857 | | | (61,130 | ) | | | 727 |
Software licenses | | | 56,698 | | | (19,999 | ) | | | 36,699 |
Trademarks and tradenames | | | 108,409 | | | (20,465 | ) | | | 87,944 |
Customer relationships and customer lists | | | 481,985 | | | (89,168 | ) | | | 392,817 |
Other | | | 13,130 | | | (6,341 | ) | | | 6,789 |
| | |
|
| |
|
|
| |
|
|
Total intangible assets, excluding goodwill | | $ | 1,539,145 | | $ | (535,596 | ) | | $ | 1,003,549 |
| | |
|
| |
|
|
| |
|
|
| | | |
2005 Category
| | Gross Carrying
Amount
| | Accumulated
Amortization
| | | Net Book Value
|
Purchased technology | | $ | 489,953 | | $ | (241,011 | ) | | $ | 248,942 |
Patents | | | 61,857 | | | (60,191 | ) | | | 1,666 |
Software licenses | | | 49,788 | | | (12,141 | ) | | | 37,647 |
Trademarks and tradenames | | | 30,883 | | | (15,304 | ) | | | 15,579 |
Customer relationships and customer lists | | | 301,586 | | | (50,373 | ) | | | 251,213 |
Other | | | 11,530 | | | (3,553 | ) | | | 7,977 |
| | |
|
| |
|
|
| |
|
|
Total intangible assets, excluding goodwill | | $ | 945,597 | | $ | (382,573 | ) | | $ | 563,024 |
| | |
|
| |
|
|
| |
|
|
Amortization expense on intangibles was $153.0 million, $112.8 million and $109.3 million in 2006, 2005 and 2004, respectively. As of December 31, 2006, amortization expense on intangible assets for the next five years is expected to be as follows (table in thousands):
| | | |
2007 | | $ | 191,015 |
2008 | | | 226,915 |
2009 | | | 175,829 |
2010 | | | 135,339 |
2011 | | | 93,111 |
| | |
|
|
Total | | $ | 822,209 |
| | |
|
|
58
EMC CORPORATION
NOTES TO CONSOLIDATED FINANCIAL STATEMENTS - (Continued)
Changes in the carrying amount of goodwill, net, on a consolidated basis and by segment for the years ended December 31, 2006 and 2005 consist of the following (tables in thousands):
| | | | | | | | | | | | | | | | | | | | |
| | | Year Ended December 31, 2006
| |
| | | Information
Storage
| | | Content
Management
and Archiving
| | | VMware
Virtual
Infrastructure
| | | RSA
Information
Security
| | | Total
| |
Balance, beginning of the year | | $ | 2,043,193 | | | $ | 1,317,797 | | | $ | 522,517 | | | $ | — | | | $ | 3,883,507 | |
Goodwill acquired | | | 647,499 | | | | 64,484 | | | | 76,504 | | | | 1,423,438 | | | | 2,211,925 | |
Tax deduction from exercise of stock options | | | (2,358 | ) | | | (7,905 | ) | | | (489 | ) | | | (1,018 | ) | | | (11,770 | ) |
Finalization of purchase price allocations | | | (31,014 | ) | | | (8,188 | ) | | | 525 | | | | (26,652 | ) | | | (65,329 | ) |
Reduction in income tax valuation allowance | | | — | | | | (1,172 | ) | | | — | | | | — | | | | (1,172 | ) |
| | |
|
|
| |
|
|
| |
|
|
| |
|
|
| |
|
|
|
Balance, end of the year | | $ | 2,657,320 | | | $ | 1,365,016 | | | $ | 599,057 | | | $ | 1,395,768 | | | $ | 6,017,161 | |
| | |
|
|
| |
|
|
| |
|
|
| |
|
|
| |
|
|
|
| |
| | | Year Ended December 31, 2005
| |
| | | Information
Storage
| | | Content
Management
and Archiving
| | | VMware
Virtual
Infrastructure
| | | RSA
Information
Security
| | | Total
| |
Balance, beginning of the year | | $ | 1,693,895 | | | $ | 1,063,838 | | | $ | 526,681 | | | $ | — | | | $ | 3,284,414 | |
Goodwill acquired | | | 362,739 | | | | 265,146 | | | | 4,427 | | | | — | | | | 632,312 | |
Tax deduction from exercise of stock options | | | (4,822 | ) | | | (5,644 | ) | | | — | | | | — | | | | (10,466 | ) |
Finalization of purchase price allocations | | | (8,619 | ) | | | (4,936 | ) | | | (8,591 | ) | | | — | | | | (22,146 | ) |
Reduction in income tax valuation allowance | | | — | | | | (607 | ) | | | — | | | | — | | | | (607 | ) |
| | |
|
|
| |
|
|
| |
|
|
| |
|
|
| |
|
|
|
Balance, end of the year | | $ | 2,043,193 | | | $ | 1,317,797 | | | $ | 522,517 | | | $ | — | | | $ | 3,883,507 | |
| | |
|
|
| |
|
|
| |
|
|
| |
|
|
| |
|
|
|
We test the goodwill balances for impairment at least annually. There was no impairment in 2006, 2005 or 2004.
C. Restructuring Charges
In 2006, 2005 and 2004, we incurred restructuring charges of $162.6 million, $84.2 million and $38.6 million, respectively.
The 2006 charge consisted of $129.4 million for employee termination benefits associated with reduction in workforce efforts, a $29.7 million charge associated with abandoned assets for which we will no longer derive a benefit, a $5.7 million charge associated with vacating excess facilities and a $10.9 million charge for other contract terminations. Partially offsetting these amounts were net adjustments of $13.1 million associated with prior years’ restructuring programs.
The 2005 charge consisted of $84.1 million for employee termination benefits associated with workforce rebalancing and reductions in force efforts and $0.4 million of costs associated with vacating excess facilities. Partially offsetting these amounts were net adjustments of $0.3 million associated with prior years’ restructuring programs.
The 2004 charge consisted of $24.5 million of employee termination benefits associated with reductions in force and $2.1 million associated with vacating excess facilities. The remaining $12.0 million of charges was associated with prior restructuring programs, primarily relating to additional rent expense for vacated facilities. The additional rent expense was attributable to a revised estimate of the time needed to sublet facilities.
The activity for each charge is explained in the following sections.
2006 Restructuring Programs
The activity for the 2006 restructuring programs for the year ended December 31, 2006 is presented below (tables in thousands):
| | | | | | | | | | | | | |
Category
| | Initial
Provision
| | Utilization
During 2006
| | | Ending Balance
| | Non-Cash
Portion of the
Provision
|
Workforce reductions | | $ | 129,369 | | $ | (1,549 | ) | | $ | 127,820 | | $ | 10,720 |
Asset impairment | | | 29,659 | | | (29,659 | ) | | | — | | | 29,659 |
Consolidation of excess facilities | | | 5,698 | | | (162 | ) | | | 5,536 | | | — |
Contractual and other obligations | | | 10,925 | | | (6,111 | ) | | | 4,814 | | | — |
| | |
|
| |
|
|
| |
|
| |
|
|
Total | | $ | 175,651 | | $ | (37,481 | ) | | $ | 138,170 | | $ | 40,379 |
| | |
|
| |
|
|
| |
|
| |
|
|
59
EMC CORPORATION
NOTES TO CONSOLIDATED FINANCIAL STATEMENTS - (Continued)
The 2006 restructuring programs included a workforce reduction that was finalized on December 29, 2006 and covers approximately 1,350 employees worldwide. The workforce reduction’s objective is to further integrate EMC and the majority of the businesses we have acquired over the past three years. These actions impacted our major business functions and major geographic regions. Approximately 70% of the affected employees are or were based in North America, excluding Mexico, and 30% are or were based in Europe, Latin America, Mexico and the Asia Pacific region. As of December 31, 2006, approximately 100 employees have been terminated.
The asset impairment charge of $29.7 million consists primarily of internal infrastructure projects that management decided to no longer pursue. The impairment charge was equal to the amount by which the assets’ carrying amount exceeded its fair value, measured as the present value of their estimated discounted cash flows.
The restructuring programs impacted the Information storage and Content management and archiving segments. The workforce reductions include $10.7 million of non-cash stock-based compensation expense.
The 2006 restructuring programs are expected to be completed by the end of 2007 with the remaining cash expenditures relating to workforce reduction expected to be substantially paid by the end of 2008. The expected cash impact of the 2006 restructuring charges is $135.3 million, of which $7.8 million was paid in 2006.
2005 Restructuring Programs
The activity for the 2005 restructuring programs for the years ended December 31, 2006 and 2005 is presented below (table in thousands):
| | | | | | | | | | | | | | |
2006 Category
| | Beginning
Balance
| | Adjustments
to the Provision
During 2006
| | | Utilization
During 2006
| | | Ending
Balance
|
Workforce reductions | | $ | 79,783 | | $ | (2,338 | ) | | $ | (59,402 | ) | | $ | 18,043 |
Consolidation of excess facilities | | | — | | | 148 | | | | — | | | | 148 |
| | |
|
| |
|
|
| |
|
|
| |
|
|
Total | | $ | 79,783 | | $ | (2,190 | ) | | $ | (59,402 | ) | | $ | 18,191 |
| | |
|
| |
|
|
| |
|
|
| |
|
|
| | | | |
2005 Category
| | Initial
Provision
| | Adjustments
to the Provision
During 2005
| | | Utilization
During 2005
| | | Ending
Balance
|
Workforce reductions | | $ | 84,144 | | $ | — | | | $ | (4,361 | ) | | $ | 79,783 |
Consolidation of excess facilities | | | 423 | | | — | | | | (423 | ) | | | — |
| | |
|
| |
|
|
| |
|
|
| |
|
|
Total | | $ | 84,567 | | $ | — | | | $ | (4,784 | ) | | $ | 79,783 |
| | |
|
| |
|
|
| |
|
|
| |
|
|
The 2005 restructuring programs included two separate reductions in force, one that commenced in the first quarter of 2005 and a second that commenced in the fourth quarter of 2005, aggregating approximately 1,060 employees. These actions impacted our major business functions and major geographic regions. Approximately 67% of the affected employees were based in North America, excluding Mexico, and 33% were based in Europe, Latin America, Mexico and the Asia Pacific region. As of December 31, 2006, the restructuring programs had been substantially completed. The restructuring programs impacted the Information storage and Content management and archiving segments.
The adjustment to the provision in 2006 is primarily attributable to a decrease in the original number of individuals identified for termination and lower than expected severance benefits. The remaining cash expenditures relating to workforce reduction are expected to be substantially paid by the end of 2007. The expected cash impact of the 2005 restructuring charges is $78.3 million, of which $4.8 million was paid in 2005 and $55.3 million was paid in 2006.
60
EMC CORPORATION
NOTES TO CONSOLIDATED FINANCIAL STATEMENTS - (Continued)
2004 Restructuring Programs
The activity for the 2004 restructuring programs for the years ended December 31, 2006, 2005 and 2004 is presented below (tables in thousands):
| | | | | | | | | | | | | | |
2006 Category
| | Beginning
Balance
| | Adjustments to
the Provision
During 2006
| | | Utilization
During 2006
| | | Ending
Balance
|
Workforce reductions | | $ | 5,689 | | $ | (2,171 | ) | | $ | (3,053 | ) | | $ | 465 |
Consolidation of excess facilities | | | 123 | | | (117 | ) | | | (6 | ) | | | — |
| | |
|
| |
|
|
| |
|
|
| |
|
|
Total | | $ | 5,812 | | $ | (2,288 | ) | | $ | (3,059 | ) | | $ | 465 |
| | |
|
| |
|
|
| |
|
|
| |
|
|
| | | | |
2005 Category
| | Beginning
Balance
| | Adjustments to
the Provision
During 2005
| | | Utilization
During 2005
| | | Ending
Balance
|
Workforce reductions | | $ | 16,380 | | $ | (1,074 | ) | | $ | (9,617 | ) | | $ | 5,689 |
Consolidation of excess facilities | | | 1,662 | | | (459 | ) | | | (1,080 | ) | | | 123 |
| | |
|
| |
|
|
| |
|
|
| |
|
|
Total | | $ | 18,042 | | $ | (1,533 | ) | | $ | (10,697 | ) | | $ | 5,812 |
| | |
|
| |
|
|
| |
|
|
| |
|
|
| | | | |
2004 Category
| | Initial
Provision
| | Adjustments to the Provision During 2004
| | | Utilization
During 2004
| | | Ending
Balance
|
Workforce reductions | | $ | 26,849 | | $ | (2,378 | ) | | $ | (8,091 | ) | | $ | 16,380 |
Consolidation of excess facilities | | | 2,200 | | | (66 | ) | | | (472 | ) | | | 1,662 |
| | |
|
| |
|
|
| |
|
|
| |
|
|
Total | | $ | 29,049 | | $ | (2,444 | ) | | $ | (8,563 | ) | | $ | 18,042 |
| | |
|
| |
|
|
| |
|
|
| |
|
|
The 2004 restructuring programs included two separate reductions in force, one that commenced in the first quarter of 2004 and a second that commenced in the fourth quarter of 2004, aggregating approximately 400 employees across our major business functions and all major geographic regions. As of December 31, 2006, substantially all of the employees have been terminated. The remaining cash expenditures relating to workforce reduction are expected to be paid by the end of 2007. The expected cash impact of the 2004 restructuring charge is $22.9 million, of which $8.6 million was paid in 2004, $10.7 million was paid in 2005 and $3.1 million was paid in 2006.
The reversal to the provision for workforce reduction in 2006, 2005 and 2004 was primarily attributable to a decrease in the original number of individuals identified for termination and lower than expected severance benefits.
The 2004 restructuring programs impacted the Information storage and Content management and archiving segments.
61
EMC CORPORATION
NOTES TO CONSOLIDATED FINANCIAL STATEMENTS - (Continued)
Prior Year Restructuring Programs
Prior to 2004, we had instituted several restructuring programs. The activity for these programs for the years ended December 31, 2006, 2005 and 2004 is presented below (tables in thousands):
| | | | | | | | | | | | | | |
2006 Category
| | Beginning
Balance
| | Adjustments
to the
Provision
During 2006
| | | Utilization
During 2006
| | | Ending
Balance
|
Workforce reduction | | $ | 1,349 | | $ | (506 | ) | | $ | (132 | ) | | $ | 711 |
Consolidation of excess facilities | | | 65,291 | | | (8,381 | ) | | | (16,825 | ) | | | 40,085 |
Other contractual obligations | | | 2,378 | | | 278 | | | | (740 | ) | | | 1,916 |
| | |
|
| |
|
|
| |
|
|
| |
|
|
Total | | $ | 69,018 | | $ | (8,609 | ) | | $ | (17,697 | ) | | $ | 42,712 |
| | |
|
| |
|
|
| |
|
|
| |
|
|
| | | | |
2005 Category
| | Beginning
Balance
| | Adjustments
to the
Provision
During 2005
| | | Utilization
During 2005
| | | Ending
Balance
|
Workforce reduction | | $ | 3,300 | | $ | (651 | ) | | $ | (1,300 | ) | | $ | 1,349 |
Consolidation of excess facilities | | | 91,281 | | | 2,082 | | | | (28,072 | ) | | | 65,291 |
Other contractual obligations | | | 2,639 | | | (244 | ) | | | (17 | ) | | | 2,378 |
| | |
|
| |
|
|
| |
|
|
| |
|
|
Total | | $ | 97,220 | | $ | 1,187 | | | $ | (29,389 | ) | | $ | 69,018 |
| | |
|
| |
|
|
| |
|
|
| |
|
|
| | | | |
2004 Category
| | Beginning
Balance
| | Adjustments
to the
Provision
During 2004
| | | Utilization
During 2004
| | | Ending
Balance
|
Workforce reduction | | $ | 27,138 | | $ | (11,728 | ) | | $ | (12,110 | ) | | $ | 3,300 |
Consolidation of excess facilities | | | 106,296 | | | 23,687 | | | | (38,702 | ) | | | 91,281 |
Other contractual obligations | | | 5,701 | | | 46 | | | | (3,108 | ) | | | 2,639 |
| | |
|
| |
|
|
| |
|
|
| |
|
|
Total | | $ | 139,135 | | $ | 12,005 | | | $ | (53,920 | ) | | $ | 97,220 |
| | |
|
| |
|
|
| |
|
|
| |
|
|
The reductions to the provisions in 2006 for excess facilities were a result of higher than anticipated sublease income from facilities associated with our 2001 restructuring program. The net additions to the provisions in 2005 and 2004 were the result of higher than anticipated costs associated with vacating facilities associated with our 2001 restructuring program. These additions were partially offset by a reduction in the number of individuals originally identified for termination.
The prior year restructuring programs impacted the Information storage and Content management and archiving segments.
All restructuring programs, with the exception of the 2006 program are substantially complete, although our ability to sublet facilities is subject to appropriate market conditions. The remaining liability for the consolidation of excess facilities is expected to be paid out through 2015.
D. Convertible Debt
In November 2006, we issued our 2011 Notes and 2013 Notes for total gross proceeds of $3.45 billion. The Notes are senior unsecured obligations and rank equally with all other existing and future senior unsecured debt. Holders may convert their Notes at their option on any day prior to the close of business on the scheduled trading day immediately preceding (i) September 1, 2011, with respect to the 2011 Notes, and (ii) September 1, 2013, with respect to the 2013 Notes, in each case only under the following circumstances: (1) during the five business-day period after any five consecutive trading-day period (the “measurement period”) in which the price per Note of the applicable series for each day of that measurement period was less than 98% of the product of the last reported sale price of our common stock and the conversion rate on each such day; (2) during any calendar quarter, if the last reported sale price of our common stock for 20 or more trading days in a period of 30 consecutive trading days ending on the last trading day of the immediately preceding calendar quarter exceeds 130% of the applicable conversion price in effect on the last trading day of the immediately preceding calendar quarter; or (3) upon the occurrence of certain events specified in the Notes. Additionally, the Notes will become convertible during the last three months prior to the respective maturities of the 2011 Notes and the 2013 Notes.
62
EMC CORPORATION
NOTES TO CONSOLIDATED FINANCIAL STATEMENTS - (Continued)
Upon conversion, we will pay cash up to the principal amount of the Notes converted. With respect to any conversion value in excess of the principal amount of the Notes converted, we have the option to settle the excess with cash, shares of our common stock, or a combination of cash and shares of our common stock based on a daily conversion value, determined in accordance with the indenture, calculated on a proportionate basis for each day of the relevant 20-day observation period. The initial conversion rate for the Notes will be 62.1978 shares of our common stock per one thousand principal amount of Notes, which represents a 27.5 percent conversion premium and is equivalent to a conversion price of approximately $16.08 per share of our common stock. The conversion price is subject to adjustment in some events as set forth in the indenture. In addition, if a “fundamental change” (as defined in the indenture) occurs prior to the maturity date, we will in some cases increase the conversion rate for a holder of Notes that elects to convert its Notes in connection with such fundamental change.
Subject to certain exceptions, if we undergo a “designated event” (as defined in the indenture) including a “fundamental change,” holders of the Notes will have the option to require us to repurchase all or any portion of their Notes. The designated event repurchase price will be 100% of the principal amount of the Notes to be purchased plus any accrued interest up to but excluding the relevant repurchase date. We will pay cash for all Notes so repurchased. We may not redeem the Notes prior to maturity.
In connection with the sale of the Notes, we entered into a registration rights agreement (the “Registration Rights Agreement”). Pursuant to the Registration Rights Agreement, on February 2, 2007, we filed a shelf registration statement with the SEC covering the resale of the Notes and our common stock issuable upon conversion of the Notes. We also have agreed to use our commercially reasonable efforts to keep the shelf registration statement effective until the earliest of (i) the date when all securities covered by the registration statement have been sold; (ii) the expiration of the applicable holding period with respect to the Notes and our common stock issuable upon conversion of the Notes under Rule 144(k) under the Securities Act of 1933, or any successor provision; and (iii) the date that is two years after the effective date of the registration statement. We may suspend the use of the registration statement to resell Notes or shares of our common stock issued upon conversion of Notes for reasons relating to pending corporate developments, public filings or other events.
Subject to certain limitations, we will be required to pay the holders of the Notes special interest on the Notes if we fail to keep such registration statement effective during specified time periods. The Notes pay interest in cash at a rate of 1.75% semi-annually in arrears on December 1 and June 1 of each year, beginning on June 1, 2007. Aggregate debt issuance costs of approximately $58.9 million are being amortized to interest expense over the respective terms of the Notes.
A total of $2.2 billion of the net proceeds from the issuance of the Notes was used to repay the outstanding indebtedness under our six-month unsecured credit facility which was used to finance the acquisition of RSA. Additionally, $945.8 million of the net proceeds were used to repurchase 75.0 million shares of our common stock.
In connection with the sale of the Notes, we entered into separate Purchased Options (the “Purchased Options”) with respect to our common stock. The Purchased Options allow us to receive shares of our common stock and/or cash related to the excess conversion value that we would pay to the holders of the Notes upon conversion. The Purchased Options will cover, subject to customary anti-dilution adjustments, approximately 215 million shares of our common stock. Half of the Purchased Options expire on December 1, 2011 and the remaining half of the Purchased Options expire on December 1, 2013. We paid an aggregate amount of $669.1 million of the proceeds from the sale of the Notes for the Purchased Options.
We also entered into separate transactions in which we sold warrants to acquire, subject to customary anti-dilution adjustments, approximately 215 million shares of our common stock at an exercise price of approximately $19.55 per share of our common stock. Half of the Sold Warrants have expiration dates between February 15, 2012 and March 15, 2012 and the remaining half of the Sold Warrants have expiration dates between February 18, 2014 and March 18, 2014. We received aggregate proceeds of $391.1 million from the sale of the Sold Warrants.
The Purchased Options and Sold Warrants will generally have the effect of increasing the conversion price of the Notes to approximately $19.55 per share of our common stock, representing an approximate 55 percent conversion premium based on the closing price of $12.61 per share of our common stock on November 13, 2006.
The cost of the Purchased Options and net proceeds from the sale of the Sold Warrants are classified in stockholders’ equity.
In April 2006, we redeemed the Documentum Notes for $126.1 million, based on a contractual redemption price of 100.9%.
63
EMC CORPORATION
NOTES TO CONSOLIDATED FINANCIAL STATEMENTS - (Continued)
E. Derivatives
At December 31, 2006, the fair value of our foreign currency derivative contracts resulted in both an unrealized gain of $16.7 million classified in other current assets and an unrealized loss of $18.2 million classified in accrued expenses. At December 31, 2005, the fair value of our foreign currency hedges resulted in both an unrealized gain of $13.1 million classified in other current assets and an unrealized loss of $12.1 million classified in accrued expenses.
The following table summarizes activity in other comprehensive income related to derivatives held by us for 2006, 2005 and 2004 (table in thousands):
| | | | | | | | | | | | |
| | | 2006
| | | 2005
| | | 2004
| |
Unrealized gains (losses) on derivative instruments, beginning of year | | $ | 963 | | | $ | (31 | ) | | $ | — | |
Add: (decrease) increase in fair value of derivatives | | | (7,002 | ) | | | 28,873 | | | | (9,500 | ) |
Less: (losses) gains reclassified into revenue or expenses | | | (6,107 | ) | | | 27,879 | | | | (9,469 | ) |
| | |
|
|
| |
|
|
| |
|
|
|
Unrealized gains (losses) on derivative instruments, end of year | | $ | 68 | | | $ | 963 | | | $ | (31 | ) |
| | |
|
|
| |
|
|
| |
|
|
|
As of December 31, 2006 the unrealized gains on derivative instruments consisted of gross unrealized gains of $0.5 million and gross unrealized losses of $0.4 million. The net unrealized gain is expected to be reclassified into the income statement in 2007.
F. Fair Value of Financial Instruments
Fair Value
The carrying amounts reflected in our consolidated balance sheets for cash and cash equivalents, accounts and notes receivable, current portion of long-term debt and accounts and notes payable approximate fair value due to the short maturities of these instruments.
The fair value of our long-term convertible debt at December 31, 2006 was $3,580.4 million, compared to a carrying amount of $3,450.0 million. The fair value is based upon the trading price of the debt.
Investments
The following tables summarize the composition of our available for sale, short and long-term investments, at December 31, 2006 and 2005 (tables in thousands). Fair value was determined based upon quoted market prices for the security.
| | | | | | |
| | | December 31, 2006
|
| | | Amortized
Cost Basis
| | Aggregate Fair Value
|
U.S. government and agency obligations | | $ | 1,077,756 | | $ | 1,072,352 |
U.S. corporate debt securities | | | 572,157 | | | 568,569 |
Asset and mortgage-backed securities | | | 787,841 | | | 782,805 |
Municipal obligations | | | 489,405 | | | 486,898 |
Auction rate securities | | | 812,778 | | | 812,780 |
Foreign debt securities | | | 44,996 | | | 44,811 |
| | |
|
| |
|
|
Total | | $ | 3,784,933 | | $ | 3,768,215 |
| | |
|
| |
|
|
| |
| | | December 31, 2005
|
| | | Amortized
Cost Basis
| | Aggregate Fair Value
|
U.S. government and agency obligations | | $ | 1,593,877 | | $ | 1,577,472 |
U.S. corporate debt securities | | | 824,540 | | | 816,433 |
Asset and mortgage-backed securities | | | 972,258 | | | 960,046 |
Bank loans | | | 536,378 | | | 540,379 |
Municipal obligations | | | 399,538 | | | 399,895 |
Auction rate securities | | | 666,765 | | | 666,765 |
Foreign debt securities | | | 73,075 | | | 72,094 |
| | |
|
| |
|
|
Total | | $ | 5,066,431 | | $ | 5,033,084 |
| | |
|
| |
|
|
64
EMC CORPORATION
NOTES TO CONSOLIDATED FINANCIAL STATEMENTS - (Continued)
Gross unrealized gains on these investments were $2.9 million and $6.7 million at December 31, 2006 and 2005, respectively. Gross unrealized losses on these investments were $19.6 million and $40.0 million at December 31, 2006 and 2005, respectively. Gross realized gains on these investments were $17.9 million, $4.9 million and $18.4 million in 2006, 2005 and 2004, respectively. Gross realized losses on these investments were $45.7 million, $63.8 million and $30.1 million in 2006, 2005 and 2004, respectively.
The effective maturities of investments held at December 31, 2006 and 2005 are as follows (tables in thousands):
| | | | | | |
| | | December 31, 2006
|
| | | Amortized
Cost Basis
| | Aggregate Fair Value
|
Due within one year | | $ | 1,525,653 | | $ | 1,521,925 |
Due after one year through 8 years | | | 2,259,280 | | | 2,246,290 |
| | |
|
| |
|
|
Total | | $ | 3,784,933 | | $ | 3,768,215 |
| | |
|
| |
|
|
| |
| | | December 31, 2005
|
| | | Amortized
Cost Basis
| | Aggregate Fair Value
|
Due within one year | | $ | 1,623,799 | | $ | 1,615,495 |
Due after one year through 8 years | | | 3,442,632 | | | 3,417,589 |
| | |
|
| |
|
|
Total | | $ | 5,066,431 | | $ | 5,033,084 |
| | |
|
| |
|
|
Unrealized losses on investments at December 31, 2006 by investment category and length of time the investment has been in a continuous unrealized loss position are as follows (table in thousands):
| | | | | | | | | | | | | | | | | | |
| | | Less Than 12 Months
| | 12 Months or Greater
| | Total
|
| | | Fair Value
| | Gross
Unrealized
Losses
| | Fair Value
| | Gross
Unrealized
Losses
| | Fair Value
| | Gross
Unrealized
Losses
|
U.S. government and agency obligations | | $ | 470,747 | | $ | 1,835 | | $ | 339,920 | | $ | 4,447 | | $ | 810,667 | | $ | 6,282 |
U.S. corporate debt securities | | | 144,765 | | | 479 | | | 310,529 | | | 3,467 | | | 455,294 | | | 3,946 |
Asset and mortgage-backed securities | | | 180,035 | | | 615 | | | 345,634 | | | 5,677 | | | 525,669 | | | 6,292 |
Municipal obligations | | | 213,574 | | | 735 | | | 185,677 | | | 2,122 | | | 399,251 | | | 2,857 |
Foreign debt securities | | | 15,318 | | | 51 | | | 26,283 | | | 143 | | | 41,601 | | | 194 |
| | |
|
| |
|
| |
|
| |
|
| |
|
| |
|
|
Total | | $ | 1,024,439 | | $ | 3,715 | | $ | 1,208,043 | | $ | 15,856 | | $ | 2,232,482 | | $ | 19,571 |
| | |
|
| |
|
| |
|
| |
|
| |
|
| |
|
|
We evaluate investments with unrealized losses to determine if the losses are other than temporary. The gross unrealized losses were due to changes in interest rates. We have determined that the gross unrealized losses at December 31, 2006 are temporary. In making this determination, we considered the financial condition and near-term prospects of the issuers, the magnitude of the losses compared to the investments’ cost, the length of time the investments have been in an unrealized loss position and our ability to hold the investment to maturity.
The following table summarizes our strategic investments at December 31, 2006 and 2005 (table in thousands). The investments are classified within other assets, net, in the balance sheet. Fair value for publicly-traded investments is determined based upon quoted prices. Fair value is not available for privately-held investments.
| | | | | | | | | | | | |
| | | December 31, 2006
| | December 31, 2005
|
| | | Cost
| | Fair Value
| | Cost
| | Fair Value
|
Strategic investments in publicly-held companies | | $ | 7,206 | | $ | 16,247 | | $ | 7,700 | | $ | 7,599 |
Strategic investments in privately-held companies | | | 20,112 | | | N/A | | | 24,524 | | | N/A |
Gross unrealized gains on these investments were $10.1 million and $0.6 million at December 31, 2006 and 2005, respectively. Gross unrealized losses on these investments were $1.1 million and $0.7 million at December 31, 2006 and 2005, respectively. Gross realized gains on strategic investments were $7.9 million, $7.0 million and $5.2 million in 2006, 2005 and 2004, respectively. Gross realized losses on strategic investments were $9.3 million, $1.4 million and $0.5 million in 2006, 2005 and 2004, respectively.
65
EMC CORPORATION
NOTES TO CONSOLIDATED FINANCIAL STATEMENTS - (Continued)
G. Inventories
Inventories consist of (table in thousands):
| | | | | | |
| | | December 31,
2006
| | December 31, 2005
|
Purchased parts | | $ | 75,206 | | $ | 56,803 |
Work-in-process | | | 451,045 | | | 491,474 |
Finished goods | | | 308,549 | | | 176,474 |
| | |
|
| |
|
|
| | | $ | 834,800 | | $ | 724,751 |
| | |
|
| |
|
|
H. Notes Receivable
Notes receivable are primarily from sales-type leases of our products. The payment schedule for such notes at December 31, 2006 is as follows (table in thousands):
| | | | |
2007 | | $ | 59,063 | |
2008 | | | 46,414 | |
2009 | | | 56,295 | |
| | |
|
|
|
Face value | | | 161,772 | |
Less amounts representing interest | | | (13,295 | ) |
| | |
|
|
|
Present value | | | 148,477 | |
Current portion (included in accounts and notes receivable) | | | 54,532 | |
| | |
|
|
|
Long-term portion (included in other assets, net) | | $ | 93,945 | |
| | |
|
|
|
Actual cash collections may differ from amounts shown on the table due to early customer buyouts, trade-ins or refinancings. We typically sell without recourse our notes receivable and underlying equipment associated with our sales-type leases to third parties.
We maintain an allowance for doubtful accounts for the estimated probable losses on uncollected notes receivable. This allowance is part of our allowance for bad debts (See Note A).
I. Property, Plant and Equipment
Property, plant and equipment consists of (table in thousands):
| | | | | | | | |
| | | December 31,
2006
| | | December 31, 2005
| |
Furniture and fixtures | | $ | 190,925 | | | $ | 168,495 | |
Equipment | | | 2,799,367 | | | | 2,249,054 | |
Buildings and improvements | | | 1,039,409 | | | | 908,559 | |
Land | | | 116,222 | | | | 105,906 | |
Building construction in progress | | | 141,196 | | | | 108,524 | |
| | |
|
|
| |
|
|
|
| | | | 4,287,119 | | | | 3,540,538 | |
Accumulated depreciation | | | (2,251,560 | ) | | | (1,786,503 | ) |
| | |
|
|
| |
|
|
|
| | | $ | 2,035,559 | | | $ | 1,754,035 | |
| | |
|
|
| |
|
|
|
Building construction in progress and land owned at December 31, 2006 include $62.4 million and $6.0 million, respectively, of facilities not yet placed in service that we are holding for future use. Depreciation expense was $455.4 million, $402.7 million and $393.6 million in 2006, 2005 and 2004, respectively.
66
EMC CORPORATION
NOTES TO CONSOLIDATED FINANCIAL STATEMENTS - (Continued)
J. Accrued Expenses
Accrued expenses consist of (table in thousands):
| | | | | | |
| | | December 31,
2006
| | December 31, 2005
|
Salaries and benefits | | $ | 595,691 | | $ | 477,361 |
Product warranties | | | 242,744 | | | 206,608 |
Restructuring (See Note C) | | | 199,538 | | | 154,613 |
Other | | | 554,049 | | | 441,275 |
| | |
|
| |
|
|
| | | $ | 1,592,022 | | $ | 1,279,857 |
| | |
|
| |
|
|
Product Warranties
Systems sales include a standard product warranty. At the time of the sale, we accrue for systems’ warranty costs. The initial systems’ warranty accrual is based upon our historical experience, expected future costs and specific identification of systems’ requirements. Upon expiration of the initial warranty, we may sell additional maintenance contracts to our customers. Revenue from these additional maintenance contracts is deferred and recognized ratably over the service period. The following represents the activity in our warranty accrual for our standard product warranty (table in thousands):
| | | | | | | | | | | | |
| | | Year Ended December 31,
| |
| | | 2006
| | | 2005
| | | 2004
| |
Balance, beginning of the year | | $ | 206,608 | | | $ | 180,758 | | | $ | 118,816 | |
Provision | | | 158,799 | | | | 127,388 | | | | 146,526 | |
Amounts charged to the accrual | | | (122,663 | ) | | | (101,538 | ) | | | (84,584 | ) |
| | |
|
|
| |
|
|
| |
|
|
|
Balance, end of the year | | $ | 242,744 | | | $ | 206,608 | | | $ | 180,758 | |
| | |
|
|
| |
|
|
| |
|
|
|
The provision includes amounts accrued for systems at the time of shipment, adjustments for changes in estimated costs for warranties on systems shipped in the year and changes in estimated costs for warranties on systems shipped in prior years. It is not practicable to determine the amounts applicable to each of the components. The provision in 2006 includes $34.4 million, and the amounts charged to the accrual in 2006 include $10.4 million, associated with stock-based compensation expense as a result of the adoption of FAS No. 123R.
K. Income Taxes
Our provision for income taxes consists of (table in thousands):
| | | | | | | | | | | | |
| | | 2006
| | | 2005
| | | 2004
| |
Federal: | | | | | | | | | | | | |
Current | | $ | 335,193 | | | $ | 511,173 | | | $ | 234 | |
Deferred | | | (115,835 | ) | | | (10,947 | ) | | | 236,167 | |
| | |
|
|
| |
|
|
| |
|
|
|
| | | | 219,358 | | | | 500,226 | | | | 236,401 | |
| | |
|
|
| |
|
|
| |
|
|
|
State: | | | | | | | | | | | | |
Current | | | 3,982 | | | | 31,670 | | | | 1,703 | |
Deferred | | | (2,176 | ) | | | 3,549 | | | | 9,208 | |
| | |
|
|
| |
|
|
| |
|
|
|
| | | | 1,806 | | | | 35,219 | | | | 10,911 | |
| | |
|
|
| |
|
|
| |
|
|
|
Foreign: | | | | | | | | | | | | |
Current | | | (44,545 | ) | | | (20,592 | ) | | | 70,313 | |
Deferred | | | (13,955 | ) | | | 4,225 | | | | (3,784 | ) |
| | |
|
|
| |
|
|
| |
|
|
|
| | | | (58,500 | ) | | | (16,367 | ) | | | 66,529 | |
| | |
|
|
| |
|
|
| |
|
|
|
Total provision for income taxes | | $ | 162,664 | | | $ | 519,078 | | | $ | 313,841 | |
| | |
|
|
| |
|
|
| |
|
|
|
In 2006, we recognized an income tax benefit of $171.8 million from the favorable resolution of income tax audits and expiration of statutes of limitations. Partially offsetting these benefits were non-deductible IPR&D charges of $35.4 million from
67
EMC CORPORATION
NOTES TO CONSOLIDATED FINANCIAL STATEMENTS - (Continued)
acquisitions and $73.3 million in non-deductible stock-based compensation expense for options issued as incentive stock options and shares issued under EMC’s Employee Stock Purchase Plan.
The American Jobs Creation Act of 2004 (the “AJCA”) created a temporary incentive for U.S. corporations to repatriate accumulated income earned abroad by providing an 85% dividends received deduction for certain dividends from controlled foreign corporations. In October 2005, our Chief Executive Officer and Board of Directors approved a domestic reinvestment plan to repatriate approximately $3.0 billion in foreign earnings; such repatriation resulted in a current tax provision of $180.2 million. Additionally, we recognized a $163.9 million benefit in 2005 resulting from the favorable resolution of certain income tax audits and expiration of statutes of limitations, the majority of which is attributable to foreign operations.
In 2006, 2005 and 2004, we were able to utilize $31.1 million, $125.9 million and $252.7 million of net operating loss carryforwards and tax credits to reduce the current portion of our tax provision.
The effective income tax rate is based upon the income for the year, the composition of the income in different countries, and adjustments, if any, for the potential tax consequences, benefits or resolutions of tax audits. A reconciliation of our income tax provision to the statutory federal tax rate is as follows:
| | | | | | | | | |
| | | 2006
| | | 2005
| | | 2004
| |
Statutory federal tax rate | | 35.0 | % | | 35.0 | % | | 35.0 | % |
State taxes, net of federal taxes | | 0.4 | | | 1.8 | | | 1.0 | |
Resolution of income tax audits and expiration of statutes of limitation | | (12.4 | ) | | (9.9 | ) | | (4.9 | ) |
Tax rate differential for international jurisdictions and other international related tax items | | (13.9 | ) | | (8.3 | ) | | (9.4 | ) |
U.S. tax credits | | (1.3 | ) | | (1.5 | ) | | (0.8 | ) |
Changes in valuation allowance | | 0.5 | | | 0.4 | | | 1.2 | |
Permanent items | | 3.5 | | | 2.8 | | | 3.6 | |
Tax cost of repatriation under the AJCA | | — | | | 10.9 | | | — | |
Other | | (0.1 | ) | | 0.2 | | | 0.8 | |
| | |
|
| |
|
| |
|
|
| | | 11.7 | % | | 31.4 | % | | 26.5 | % |
| | |
|
| |
|
| |
|
|
The components of the current and noncurrent deferred tax assets are as follows (table in thousands):
| | | | | | | | | | | | | | | | |
| | | December 31, 2006
| | | December 31, 2005
| |
| | | Deferred
Tax Asset
| | | Deferred
Tax Liability
| | | Deferred
Tax Asset
| | | Deferred
Tax Liability
| |
Current: | | | | | | | | | | | | | | | | |
Accounts and notes receivable | | $ | 69,313 | | | $ | — | | | $ | 56,060 | | | $ | — | |
Inventory | | | 54,948 | | | | — | | | | 47,999 | | | | — | |
Accrued expenses | | | 177,246 | | | | — | | | | 129,409 | | | | — | |
Deferred revenue | | | 116,639 | | | | — | | | | 92,850 | | | | — | |
| | |
|
|
| |
|
|
| |
|
|
| |
|
|
|
Total current | | | 418,146 | | | | — | | | | 326,318 | | | | — | |
| | | | |
Noncurrent: | | | | | | | | | | | | | | | | |
Property, plant and equipment, net | | | — | | | | (22,477 | ) | | | — | | | | (37,951 | ) |
Intangible and other assets, net | | | — | | | | (381,008 | ) | | | — | | | | (212,995 | ) |
Equity | | | 368,645 | | | | — | | | | 39,241 | | | | — | |
Deferred revenue | | | 21,362 | | | | — | | | | 45,733 | | | | — | |
Other noncurrent liabilities | | | — | | | | (54,595 | ) | | | — | | | | (54,765 | ) |
Credit carryforwards | | | 20,086 | | | | — | | | | 18,507 | | | | — | |
Net operating loss carryforwards | | | 173,422 | | | | — | | | | 90,300 | | | | — | |
Other comprehensive loss | | | 34,542 | | | | — | | | | 555 | | | | — | |
| | |
|
|
| |
|
|
| |
|
|
| |
|
|
|
Total noncurrent | | | 618,057 | | | | (458,080 | ) | | | 194,336 | | | | (305,711 | ) |
| | |
|
|
| |
|
|
| |
|
|
| |
|
|
|
Gross deferred tax assets and liabilities | | | 1,036,203 | | | | (458,080 | ) | | | 520,654 | | | | (305,711 | ) |
Valuation allowance | | | (55,531 | ) | | | — | | | | (63,817 | ) | | | — | |
| | |
|
|
| |
|
|
| |
|
|
| |
|
|
|
Total deferred tax assets and liabilities | | $ | 980,672 | | | $ | (458,080 | ) | | $ | 456,837 | | | $ | (305,711 | ) |
| | |
|
|
| |
|
|
| |
|
|
| |
|
|
|
68
EMC CORPORATION
NOTES TO CONSOLIDATED FINANCIAL STATEMENTS - (Continued)
We have federal and foreign net operating loss carryforwards of $357.1 million and $95.3 million, respectively. Portions of these carryforwards are subject to annual limitations, including Section 382 of the Internal Revenue Code of 1986, as amended (the “Code”), for U.S. tax purposes and similar provisions under other countries’ tax laws. Certain net operating losses will begin to expire in 2008, while others have an unlimited carryforward period. The increase in net operating loss carryforwards from 2005 to 2006 is attributable to acquired net operating loss carryforwards for acquisitions consummated in 2006.
The valuation allowance decreased from $63.8 million at December 31, 2005 to $55.5 million at December 31, 2006. The decrease was primarily attributable to utilization of net operating loss carryforwards and changes in our assessment of the realizability of certain net operating loss carryforwards to be more likely than not. The valuation allowance at December 31, 2006 relates to foreign subsidiaries’ deferred tax assets, capital loss carryforwards and domestic tax credit carryforwards.
Deferred income taxes have not been provided on basis differences related to investments in foreign subsidiaries. These basis differences were approximately $1.9 billion and $1.1 billion at December 31, 2006 and 2005, respectively, and consisted of undistributed earnings permanently invested in these entities. The change in the basis difference between 2005 and 2006 was mainly attributable to income earned in the current year. The unrecognized deferred tax liability associated with these unremitted earnings is approximately $552.0 million and $280.0 million as of December 31, 2006 and 2005, respectively. Income before income taxes from foreign operations for 2006, 2005 and 2004 was $835.9 million, $781.4 million and $632.0 million, respectively.
L. Retirement Plans and Retiree Medical Benefits
401(k) Plan
We have established a deferred compensation program for certain employees that is qualified under Section 401(k) of the Code. EMC will match pre-tax employee contributions up to 6% of eligible compensation during each pay period (subject to the $750 maximum match each quarter). Matching contributions are immediately 100% vested. Our contributions amounted to $48.6 million in 2006, $36.8 million in 2005 and $30.5 million in 2004.
Employees may elect to invest their contributions in a variety of funds, including an EMC stock fund. The deferred compensation program limits an employee’s maximum investment allocation in the EMC stock fund to 30% of their total contribution. Our matching contribution mirrors the investment allocation of the employee’s contribution.
Defined Benefit Pension Plan
We have noncontributory defined benefit pension plans which were assumed as part of the Data General acquisition, which cover substantially all former Data General employees located in the U.S. and Canada. In addition, certain of the former Data General foreign subsidiaries also have retirement plans covering substantially all of their employees. All of these plans were frozen in 1999, resulting in employees no longer accruing pension benefits for future services. One of our foreign subsidiaries in Japan also has a defined benefit pension plan.
Benefits under these plans are generally based on either career average or final average salaries and creditable years of service as defined in the plans. The annual cost for these plans is determined using the projected unit credit actuarial cost method that includes actuarial assumptions and estimates which are subject to change. The measurement date for the plans is December 31.
Our investment policy provides that no security, except issues of the U.S. Government, shall comprise more than 5% of total plan assets, measured at market. At December 31, 2006, the Data General U.S. pension plan held $0.4 million of our common stock.
The Data General U.S. pension plan and Canada pension plan (the “Pension Plans”) are summarized in the following tables. The pension plans associated with the Data General and Japan foreign subsidiaries are not presented below because they do not have a material impact on our consolidated financial position or results of operations.
69
EMC CORPORATION
NOTES TO CONSOLIDATED FINANCIAL STATEMENTS - (Continued)
The components of the change in benefit obligation of the Pension Plans are as follows (table in thousands):
| | | | | | | | |
| | | December 31,
2006
| | | December 31, 2005
| |
Benefit obligation, at beginning of year | | $ | 362,427 | | | $ | 337,004 | |
Interest cost | | | 20,143 | | | | 19,033 | |
Foreign exchange loss | | | 33 | | | | 50 | |
Benefits paid | | | (10,644 | ) | | | (9,779 | ) |
Settlement payments | | | (25 | ) | | | (13 | ) |
Actuarial (gain) loss | | | (12,896 | ) | | | 16,132 | |
| | |
|
|
| |
|
|
|
Benefit obligation, at end of year | | $ | 359,038 | | | $ | 362,427 | |
| | |
|
|
| |
|
|
|
The reconciliation of the beginning and ending balances of the fair value of the assets of the Pension Plans is as follows (table in thousands):
| | | | | | | | |
| | | December 31,
2006
| | | December 31, 2005
| |
Fair value of plan assets, at beginning of year | | $ | 366,383 | | | $ | 347,447 | |
Actual return on plan assets | | | 49,954 | | | | 13,692 | |
Employer contributions | | | — | | | | 15,000 | |
Foreign exchange gain | | | 22 | | | | 36 | |
Benefits paid | | | (10,644 | ) | | | (9,779 | ) |
Settlement payments | | | (25 | ) | | | (13 | ) |
| | |
|
|
| |
|
|
|
Fair value of plan assets, at end of year | | $ | 405,690 | | | $ | 366,383 | |
| | |
|
|
| |
|
|
|
In 2005, we contributed $15.0 million to the U.S. pension plan. We did not make any contributions to the Pension Plans in 2006, and we do not expect to make any contributions to the Pension Plans in 2007. The net funded status of the Pension Plans at December 31, 2006 and 2005 was $46.7 million and $4.0 million, respectively.
Amounts recognized in the balance sheet as assets and liabilities consist of the following (table in thousands):
| | | | | | | | |
| | | December 31, 2006
| | | December 31,
2005
| |
Prepaid benefit cost | | $ | 47,375 | | | $ | 146,282 | |
Accrued benefit liability | | | (723 | ) | | | (474 | ) |
| | |
|
|
| |
|
|
|
Net amount recognized at year end | | $ | 46,652 | | | $ | 145,808 | |
| | |
|
|
| |
|
|
|
Prior to our adoption of FAS No. 158, the prepaid benefit cost and accrued benefit liability consisted of both the net funded status and the accumulated actuarial loss of the Pension Plans. The value of these components as of December 31, 2005 was as follows (table in thousands):
| | | |
| | | December 31, 2005
|
Funded status | | $ | 3,956 |
Accumulated actuarial loss | | | 141,852 |
| | |
|
|
Net amount recognized at year end | | $ | 145,808 |
| | |
|
|
Upon adoption of FAS No. 158, we reclassified the accumulated actuarial loss associated with the Pension Plans to accumulated other comprehensive loss. The reclassification consisted of the following items (table in thousands):
| | | | |
| | | December 31, 2006
| |
Accumulated actuarial loss | | $ | 100,535 | |
Tax benefit | | | (37,701 | ) |
| | |
|
|
|
Net amount reclassified | | $ | 62,834 | |
| | |
|
|
|
70
EMC CORPORATION
NOTES TO CONSOLIDATED FINANCIAL STATEMENTS - (Continued)
There was no other activity within accumulated other comprehensive loss during 2006 associated with the Pension Plans. We expect that $4.7 million of the total balance reclassified to accumulated other comprehensive loss will be recognized as a component of net periodic benefit cost in 2007. We do not expect to receive any refunds from the Pension Plans in 2007.
The components of net periodic benefit credit of the Pension Plans are as follows (table in thousands):
| | | | | | | | | | | | |
| | | 2006
| | | 2005
| | | 2004
| |
Interest cost | | $ | 20,143 | | | $ | 19,033 | | | $ | 18,542 | |
Expected return on plan assets | | | (29,738 | ) | | | (28,240 | ) | | | (26,540 | ) |
Amortization of transition asset | | | — | | | | (611 | ) | | | (853 | ) |
Recognized actuarial loss | | | 8,207 | | | | 6,412 | | | | 5,615 | |
| | |
|
|
| |
|
|
| |
|
|
|
Net periodic benefit credit | | $ | (1,388 | ) | | $ | (3,406 | ) | | $ | (3,236 | ) |
| | |
|
|
| |
|
|
| |
|
|
|
The weighted-average assumptions used in the Pension Plans to determine benefit obligations at December 31 are as follows:
| | | | | | | | | |
| | | December 31, 2006
| | | December 31,
2005
| | | December 31,
2004
| |
Discount rate | | 5.9 | % | | 5.7 | % | | 5.7 | % |
Rate of compensation increase | | N/A | | | N/A | | | N/A | |
The weighted-average assumptions used in the Pension Plans to determine periodic benefit cost for the years ended December 31 are as follows:
| | | | | | | | | |
| | | December 31, 2006
| | | December 31,
2005
| | | December 31, 2004
| |
Discount rate | | 5.7 | % | | 5.7 | % | | 6.1 | % |
Expected long-term rate of return on plan assets | | 8.25 | % | | 8.25 | % | | 8.25 | % |
Rate of compensation increase | | N/A | | | N/A | | | N/A | |
The expected long-term rate of return on plan assets considers the current level of expected returns on risk free investments (primarily government bonds), the historical level of the risk premium associated with the other asset classes in which the portfolio is invested and the expectations for future returns of each asset class. The expected return for each asset class was weighted based on the target asset allocation to develop the expected long-term rate of return on assets. The weighted average asset allocations are as follows:
| | | | | | |
| | | December 31, 2006
| | | December 31,
2005
| |
Equity securities | | 71 | % | | 68 | % |
Debt securities | | 26 | | | 27 | |
Cash | | 3 | | | 5 | |
| | |
|
| |
|
|
Total | | 100 | % | | 100 | % |
| | |
|
| |
|
|
The target allocation of the assets in the Pension Plans at December 31, 2006 consisted of equity securities of 70% and debt securities of 30%.
Our Pension Plan assets are managed by outside investment managers. Our investment strategy with respect to pension assets is to maximize returns while preserving principal.
The benefit payments are expected to be paid in the following years (table in thousands):
| | | |
2007 | | $ | 12,026 |
2008 | | | 14,332 |
2009 | | | 13,534 |
2010 | | | 14,562 |
2011 | | | 15,972 |
Years 2012 – 2016 | | | 104,700 |
71
EMC CORPORATION
NOTES TO CONSOLIDATED FINANCIAL STATEMENTS - (Continued)
Post Retirement Medical and Life Insurance Plan
Our post retirement benefit plan, which was assumed in connection with the acquisition of Data General, provides certain medical and life insurance benefits for retired former Data General employees. With the exception of certain participants who retired prior to 1986, the medical benefit plan requires monthly contributions by retired participants in an amount equal to insured equivalent costs less a fixed EMC contribution which is dependent on the participant’s length of service and Medicare eligibility. Benefits are continued to dependents of eligible retiree participants for 39 weeks after the death of the retiree. The life insurance benefit plan is noncontributory. The measurement date for the plan is December 31.
The components of the change in benefit obligation are as follows (table in thousands):
| | | | | | | | |
| | | December 31, 2006
| | | December 31,
2005
| |
Benefit obligation, at beginning of year | | $ | 7,437 | | | $ | 4,496 | |
Interest cost | | | 339 | | | | 390 | |
Benefits paid | | | (694 | ) | | | (504 | ) |
Recognized actuarial (gain) loss | | | (1,349 | ) | | | 3,055 | |
| | |
|
|
| |
|
|
|
Benefit obligation, at end of year | | $ | 5,733 | | | $ | 7,437 | |
| | |
|
|
| |
|
|
|
The reconciliation of the beginning and ending balances of the fair value of plan assets is as follows (table in thousands):
| | | | | | | | |
| | | December 31, 2006
| | | December 31,
2005
| |
Fair value of plan assets, at beginning of year | | $ | 408 | | | $ | 391 | |
Actual return on plan assets | | | 58 | | | | 17 | |
Employer contributions | | | 694 | | | | 504 | |
Benefits paid | | | (694 | ) | | | (504 | ) |
| | |
|
|
| |
|
|
|
Fair value of plan assets, at end of year | | $ | 466 | | | $ | 408 | |
| | |
|
|
| |
|
|
|
We expect to contribute $1.0 million to the plan in 2007.
The net funded status of the plan at December 31, 2006 and 2005 were net liabilities of $5.3 million and $7.0 million, respectively. At December 31, 2006 and 2005, we recognized $5.3 million and $6.2 million, respectively in the balance sheet as an accrued benefit liability in connection with the plan.
Prior to our adoption of FAS No. 158, the accrued benefit liability consisted of both the net funded status and the accumulated actuarial loss and prior service credit of the plan. The value of these components as of December 31, 2005 was as follows (table in thousands):
| | | | |
| | | December 31, 2005
| |
Funded status | | $ | (7,029 | ) |
Accumulated actuarial loss | | | 1,830 | |
Prior service credit | | | (1,048 | ) |
| | |
|
|
|
Accrued benefit liability | | $ | (6,247 | ) |
| | |
|
|
|
Upon adoption of FAS No. 158, we reclassified the accumulated actuarial loss and prior service credit associated with the plan to accumulated other comprehensive loss. The reclassification consisted of the following items (table in thousands):
| | | | |
| | | December 31, 2006
| |
Accumulated actuarial loss | | $ | (438 | ) |
Prior service credit | | | 947 | |
Taxes | | | 191 | |
| | |
|
|
|
Net amount reclassified | | $ | 318 | |
| | |
|
|
|
72
EMC CORPORATION
NOTES TO CONSOLIDATED FINANCIAL STATEMENTS - (Continued)
There was no other activity within accumulated other comprehensive loss during 2006 associated with the plan. We expect that $0.1 million of the total balance reclassified to accumulated other comprehensive loss will be recognized as a component of net periodic benefit cost in 2007. We do not expect to receive any refunds from the plan in 2007.
The components of net periodic benefit cost are as follows (table in thousands):
| | | | | | | | | | | | |
| | | December 31, 2006
| | | December 31,
2005
| | | December 31, 2004
| |
Interest cost | | $ | 339 | | | $ | 390 | | | $ | 272 | |
Expected return on plan assets | | | (34 | ) | | | (32 | ) | | | (30 | ) |
Amortization of prior service credit | | | (101 | ) | | | (101 | ) | | | (100 | ) |
Recognized actuarial loss (gain) | | | 19 | | | | 177 | | | | (51 | ) |
| | |
|
|
| |
|
|
| |
|
|
|
Net periodic benefit cost | | $ | 223 | | | $ | 434 | | | $ | 91 | |
| | |
|
|
| |
|
|
| |
|
|
|
The weighted-average assumptions used in the plan to determine benefit obligations at December 31 are as follows:
| | | | | | | | | |
| | | December 31, 2006
| | | December 31,
2005
| | | December 31, 2004
| |
Discount rate | | 5.9 | % | | 5.7 | % | | 5.7 | % |
Rate of compensation increase | | N/A | | | N/A | | | N/A | |
The weighted-average assumptions used in the plan to determine net benefit cost for the years ended December 31 are as follows:
| | | | | | | | | |
| | | December 31, 2006
| | | December 31,
2005
| | | December 31, 2004
| |
Discount rate | | 5.7 | % | | 5.7 | % | | 6.1 | % |
Expected long-term rate of return on plan assets | | 8.25 | % | | 8.25 | % | | 8.25 | % |
Rate of compensation increase | | N/A | | | N/A | | | N/A | |
The assumed health care cost trend rate for the plan is as follows:
| | | | | | |
| | | December 31, 2006
| | | December 31,
2005
| |
Health care cost trend rate assumed for next year | | 9.0 | % | | 10.0 | % |
Rate to which the cost trend rate is assumed to decline (the ultimate trend rate) | | 5.0 | % | | 5.0 | % |
Year that the rate reaches the ultimate trend rate | | 2013 | | | 2013 | |
The effects of a one percent change in the assumed health care cost trend rates are as follows (table in thousands):
| | | | | | | |
| | | 1% increase
| | 1% decrease
| |
Effect on total service and interest cost components for 2006 | | $ | 6 | | $ | (5 | ) |
Effect on year-end post retirement obligation | | | 106 | | | (99 | ) |
The expected long-term rate of return on plan assets considers the current level of expected returns on risk free investments (primarily government bonds), the historical level of the risk premium associated with the other asset classes in which the portfolio is invested and the expectations for future returns of each asset class. The expected return for each asset class was weighted based on the target asset allocation to develop the expected long-term rate of return on assets.
The actual asset allocations are as follows:
| | | | | | |
| | | December 31,
2006
| | | December 31,
2005
| |
Equity securities | | 71 | % | | 68 | % |
Debt securities | | 26 | | | 27 | |
Cash | | 3 | | | 5 | |
| | |
|
| |
|
|
Total | | 100 | % | | 100 | % |
| | |
|
| |
|
|
73
EMC CORPORATION
NOTES TO CONSOLIDATED FINANCIAL STATEMENTS - (Continued)
The target allocation of the assets in the plan as of December 31, 2006 was 70% equity securities and 30% debt securities.
The plan assets are managed by outside investment managers. Our investment strategy with respect to the plan is to maximize returns while preserving principal.
The benefit payments are expected to be paid in the following years (table in thousands):
| | | |
2007 | | $ | 1,039 |
2008 | | | 910 |
2009 | | | 812 |
2010 | | | 636 |
2011 | | | 557 |
2012 - 2016 | | | 1,723 |
M. Commitments and Contingencies
Operating Lease Commitments
We lease office and warehouse facilities and equipment under various operating leases. Facility leases generally include renewal options. Rent expense for 2006, 2005 and 2004 was as follows (table in thousands):
| | | | | | | | | | | | |
| | | 2006
| | | 2005
| | | 2004
| |
Rent expense | | $ | 234,341 | | | $ | 214,303 | | | $ | 207,111 | |
Sublease proceeds | | | (9,430 | ) | | | (7,940 | ) | | | (7,195 | ) |
| | |
|
|
| |
|
|
| |
|
|
|
Net rent expense | | $ | 224,911 | | | $ | 206,363 | | | $ | 199,916 | |
| | |
|
|
| |
|
|
| |
|
|
|
Our future lease commitments are as follows (table in thousands):
| | | |
2007 | | $ | 193,365 |
2008 | | | 152,895 |
2009 | | | 117,478 |
2010 | | | 74,943 |
2011 | | | 52,771 |
Thereafter | | | 160,648 |
| | |
|
|
Total minimum lease payments | | $ | 752,100 |
| | |
|
|
We have sublet certain of our office facilities. Non-cancelable sublease proceeds are as follows (table in thousands):
| | | |
2007 | | $ | 12,398 |
2008 | | | 10,026 |
2009 | | | 8,218 |
2010 | | | 5,201 |
2011 | | | 3,411 |
Thereafter | | | 1,098 |
| | |
|
|
Total sublease proceeds | | $ | 40,352 |
| | |
|
|
Outstanding Purchase Orders
At December 31, 2006 we had outstanding purchase orders aggregating approximately $1.5 billion. The purchase orders are for manufacturing and non-manufacturing related goods and services. While the purchase orders are generally cancelable without penalty, certain vendor agreements provide for percentage-based cancellation fees or minimum restocking charges based on the nature of the product or service.
74
EMC CORPORATION
NOTES TO CONSOLIDATED FINANCIAL STATEMENTS - (Continued)
Line of Credit
We have available for use a credit line of $50.0 million in the United States. As of December 31, 2006, we had no borrowings outstanding on the line of credit. The credit line bears interest at the bank’s base rate and requires us, upon utilization of the credit line, to meet certain financial covenants with respect to limitations on losses. In the event the covenants are not met, the lender may require us to provide collateral to secure the outstanding balance. At December 31, 2006, we were in compliance with the covenants.
Guarantees and Indemnification Obligations
EMC’s subsidiaries have entered into arrangements with financial institutions for such institutions to provide guarantees for rent, taxes, insurance, leases, performance bonds, bid bonds and customs duties aggregating $57.7 million as of December 31, 2006. The guarantees vary in length of time. In connection with these arrangements, we have agreed to guarantee substantially all of the guarantees provided by these financial institutions.
We enter into agreements in the ordinary course of business with, among others, customers, resellers, OEMs, systems integrators and distributors. Most of these agreements require us to indemnify the other party against third-party claims alleging that an EMC product infringes a patent and/or copyright. Most of these agreements in which we license our trademarks to another party require us to indemnify the other party against third-party claims alleging that an EMC product infringes a trademark. Certain of these agreements require us to indemnify the other party against certain claims relating to property damage, personal injury or the acts or omissions of EMC, its employees, agents or representatives. In addition, from time to time we have made certain guarantees regarding the performance of our systems to our customers.
We have agreements with certain vendors, financial institutions, lessors and service providers pursuant to which we have agreed to indemnify the other party for specified matters, such as acts and omissions of EMC, its employees, agents or representatives.
We have procurement or license agreements with respect to technology that is used in our products and agreements in which we obtain rights to a product from an OEM. Under some of these agreements, we have agreed to indemnify the supplier for certain claims that may be brought against such party with respect to our acts or omissions relating to the supplied products or technologies.
We have agreed to indemnify the directors and executive officers of EMC and our subsidiaries, to the extent legally permissible, against all liabilities reasonably incurred in connection with any action in which such individual may be involved by reason of such individual being or having been a director or executive officer.
In connection with certain acquisitions, we have agreed to indemnify the current and former directors, officers and employees of the acquired company in accordance with the acquired company’s by-laws and charter in effect immediately prior to the acquisition or in accordance with indemnification or similar agreements entered into by the acquired company and such persons. In a substantial majority of instances, we have maintained the acquired company’s directors’ and officers’ insurance, which should enable us to recover a portion of any future amounts paid. These indemnities vary in length of time.
Based upon our historical experience and information known as of December 31, 2006, we believe our liability on the above guarantees and indemnities at December 31, 2006 is immaterial.
Litigation
We are a party to various litigation matters which we consider routine and incidental to our business. Management does not expect the results of any of these actions to have a material adverse effect on our business, results of operations or financial condition.
75
EMC CORPORATION
NOTES TO CONSOLIDATED FINANCIAL STATEMENTS - (Continued)
N. Stockholders’ Equity
Net Income Per Share
The reconciliation from basic to diluted earnings per share for both the numerators and denominators is as follows (table in thousands):
| | | | | | | | | |
| | | 2006
| | 2005
| | 2004
|
Numerator: | | | | | | | | | |
Net income, as reported - basic | | $ | 1,223,982 | | $ | 1,133,165 | | $ | 871,189 |
Adjustment for interest expense on Documentum Notes, net of taxes . | | | 643 | | | 2,572 | | | 2,572 |
| | |
|
| |
|
| |
|
|
Net income - diluted | | $ | 1,224,625 | | $ | 1,135,737 | | $ | 873,761 |
| | |
|
| |
|
| |
|
|
Denominator: | | | | | | | | | |
Basic weighted average common shares outstanding | | | 2,248,431 | | | 2,382,977 | | | 2,402,198 |
Weighted common stock equivalents | | | 35,609 | | | 40,549 | | | 39,316 |
Assumed conversion of Documentum Notes | | | 2,264 | | | 9,056 | | | 9,056 |
| | |
|
| |
|
| |
|
|
Diluted weighted average shares outstanding | | | 2,286,304 | | | 2,432,582 | | | 2,450,570 |
| | |
|
| |
|
| |
|
|
Options to acquire 213.1 million, 91.7 million and 101.7 million shares of common stock as of December 31, 2006, 2005 and 2004, respectively, were excluded from the calculation of diluted earnings per share because of their antidilutive effect. There were no shares potentially issuable under the Notes or the Sold Warrants because these instruments were not “in-the-money.” As a result, the Notes and the Sold Warrants were excluded from the calculation of diluted net income per weighted average share for the year ended December 31, 2006. The effect of the Documentum Notes on the calculation of diluted net income per weighted average share for the years ended December 31, 2006, 2005 and 2004 was calculated using the “if converted” method. See Note D for further information regarding the Notes, the Sold Warrants and the Documentum Notes.
In connection with our adoption of FAS No. 123R, the calculation of assumed proceeds used to determine our diluted weighted average shares outstanding under the treasury stock method in 2006 was adjusted by tax windfalls and shortfalls associated with all of our outstanding stock awards. Windfalls and shortfalls are computed by comparing the tax deductible amount of outstanding stock awards to their grant date fair values and multiplying the result by the applicable statutory tax rate. A positive result creates a windfall, which increases the assumed proceeds and a negative result creates a shortfall, which reduces the assumed proceeds.
Accumulated Other Comprehensive Loss
Accumulated other comprehensive loss, which is presented net of tax, consists of the following (table in thousands):
| | | | | | | | |
| | | December 31, 2006
| | | December 31,
2005
| |
Foreign currency translation adjustments, net of tax benefits of $0 and $0 | | $ | 13,672 | | | $ | (31,770 | ) |
Unrealized losses on investments, net of tax benefits of $1,736 and $2,538 | | | (18,928 | ) | | | (38,187 | ) |
Unrealized gains on investments, net of taxes of $4,096 and $1,887 | | | 8,906 | | | | 5,403 | |
Unrealized gain on derivatives, net of taxes of $6 and $96 | | | 62 | | | | 867 | |
Impact of adoption of FAS No. 158, net of tax benefits of $36,909 and $0 | | | (58,275 | ) | | | — | |
| | |
|
|
| |
|
|
|
| | | $ | (54,563 | ) | | $ | (63,687 | ) |
| | |
|
|
| |
|
|
|
Reclassification adjustments between other comprehensive income and the income statement consist of the following (table in thousands):
| | | | | | | | | | | | |
| | | Year Ended December 31,
| |
| | | 2006
| | | 2005
| | | 2004
| |
Realized losses on investments, net of tax benefit of
$(10,338), $(21,671) and $(4,279) | | $ | (17,469 | ) | | $ | (37,260 | ) | | $ | (7,397 | ) |
Realized gains (losses) on derivatives, net of taxes (benefit) of
$(611), $2,788 and $(947) | | | (5,496 | ) | | | 25,091 | | | | (8,522 | ) |
76
EMC CORPORATION
NOTES TO CONSOLIDATED FINANCIAL STATEMENTS - (Continued)
Preferred Stock
Our series preferred stock may be issued from time to time in one or more series, with such terms as our Board of Directors may determine, without further action by our shareholders.
Equity Plans
The EMC Corporation 2003 Stock Plan (the “2003 Plan”) provides for the grant of stock options, stock appreciation rights, restricted stock and restricted stock units. The exercise price for a stock option shall not be less than 100% of the fair market value of our common stock on the date of grant. Options generally become exercisable in annual installments over a period of three to five years after the date of grant and expire ten years after the date of grant. Incentive stock options will expire no later than ten years after the date of grant. Restricted stock is common stock that is subject to a risk of forfeiture or other restrictions that will lapse upon satisfaction of specified conditions. Restricted stock units represent the right to receive shares of common stock in the future, with the right to future delivery of the shares subject to a risk of forfeiture or other restrictions that will lapse upon satisfaction of specified conditions. Awards of restricted stock or restricted stock units that vest only by the passage of time will not vest fully in less than three years after the date of grant. The 2003 Plan allows us to grant up to 200.0 million shares of common stock, no more than 60.0 million shares of which may be issued pursuant to awards of restricted stock or restricted stock units.
In addition to the 2003 Plan, we have three employee stock option plans (the “1985 Plan,” the “1993 Plan,” and the “2001 Plan”). Under the terms of each of the three plans, the exercise price of incentive stock options issued must be equal to at least the fair market value of our common stock on the date of grant. In the event that non-qualified stock options are granted under the 1985 Plan, the exercise price may be less than the fair market value at the time of grant, but in the case of employees not subject to Section 16 of the Securities Exchange Act of 1934, not less than par value (which is $0.01 per share), and in the case of employees subject to Section 16, not less than 50% of the fair market value on the date of grant. In the event that non-qualified stock options are granted under the 1993 Plan or the 2001 Plan, the exercise price may be less than the fair market value at the time of grant but not less than par value.
A total of 748.0 million shares of common stock have been reserved for issuance under the above four plans.
We have a stock option plan that provides for the grant of stock options to members of our Board of Directors (the “Directors Plan”). A total of 14.4 million shares of common stock have been reserved for issuance under the Directors Plan. The exercise price for each option granted under the Directors Plan will be at a price per share determined at the time the option is granted, but not less than 50% of the fair market value of common stock on the date of grant.
At December 31, 2006, there was an aggregate of approximately 68.0 million shares of common stock available for issuance pursuant to future grants under the 1985 Plan, the 1993 Plan, the 2001 Plan, the 2003 Plan and the Directors Plan, which includes up to 28.2 million shares available for future issuance under the 2003 Stock Plan in the form of awards of restricted stock or restricted stock units.
We have, in connection with the acquisition of various companies, assumed the stock option plans of these companies. We do not intend to make future grants under any of such plans.
On July 1, 2004, the Massachusetts Business Corporation Act (the “MBCA”) became effective and eliminated treasury shares. Under the MBCA, shares repurchased by Massachusetts corporations constitute authorized but unissued shares. As a result, all of our former treasury shares were automatically converted to unissued shares on July 1, 2004 and have been accounted for as a reduction of common stock (at par value) and additional paid-in capital.
We utilize both authorized and unissued shares (including repurchased shares) to satisfy all shares issued under our equity plans. Our Board of Directors has authorized the repurchase of 500.0 million shares of our common stock. In 2006, we repurchased 227.3 million shares of our common stock. Of the 500.0 million shares authorized for repurchase, we have cumulatively repurchased 359.8 million shares at a total cost of $4.4 billion, leaving a remaining balance of 140.2 million shares authorized for future repurchases. In 2006, the Board also authorized a one-time repurchase of up to 100.0 million shares in conjunction with our issuance of the Notes. Of this amount, 75.0 million shares were repurchased using $945.8 million of the net proceeds from the Notes.
In 2006, we repurchased approximately $3.7 billion of our common stock and redeemed the Documentum Notes for $126.1 million.
77
EMC CORPORATION
NOTES TO CONSOLIDATED FINANCIAL STATEMENTS - (Continued)
Employee Stock Purchase Plan
Under our 1989 Employee Stock Purchase Plan (the “1989 Plan”), eligible employees may purchase shares of common stock through payroll deductions at the lower of 85% of the fair market value of the stock at the time of grant or 85% of the fair market value at the time of exercise. Options to purchase shares are granted twice yearly, on January 1 and July 1, and are exercisable on the succeeding June 30 or December 31. There are 98.0 million shares available for grant. In 2006, 2005 and 2004, 11.5 million shares, 8.7 million shares and 9.8 million shares, respectively, were purchased under the 1989 Plan at a weighted average purchase price per share of $9.32, $11.61 and $9.58, respectively. Total cash proceeds from the purchase of shares under the 1989 Plan in 2006, 2005 and 2004 were $107.6 million, $100.9 million and $93.5 million, respectively.
Stock Options
The following tables summarize our option activity under all equity plans in 2006, 2005 and 2004 (shares in thousands):
| | | | | | |
| | | Number of Shares
| | | Wtd. Avg.
Exercise
Price
|
Outstanding, January 1, 2004 | | 254,574 | | | $ | 18.56 |
Options granted relating to business acquisitions | | 6,559 | | | | 1.82 |
Granted | | 46,402 | | | | 12.69 |
Forfeited | | (7,090 | ) | | | 15.61 |
Expired | | (2,798 | ) | | | 40.06 |
Exercised | | (22,306 | ) | | | 6.14 |
| | |
|
| | | |
Outstanding, December 31, 2004 | | 275,341 | | | | 18.02 |
Options granted relating to business acquisitions | | 7,985 | | | | 5.15 |
Granted | | 51,442 | | | | 14.34 |
Forfeited | | (8,443 | ) | | | 14.18 |
Expired | | (4,997 | ) | | | 38.28 |
Exercised | | (25,078 | ) | | | 6.74 |
| | |
|
| | | |
Outstanding, December 31, 2005 | | 296,250 | | | | 17.78 |
Options granted relating to business acquisitions | | 16,393 | | | | 5.70 |
Granted | | 32,423 | | | | 10.98 |
Forfeited | | (11,162 | ) | | | 12.57 |
Expired | | (7,480 | ) | | | 29.06 |
Exercised | | (23,240 | ) | | | 6.48 |
| | |
|
| | | |
Outstanding, December 31, 2006 | | 303,184 | | | $ | 17.19 |
| | |
|
| | | |
The total pre-tax intrinsic values of options exercised in 2006, 2005 and 2004 were $151.6 million, $174.0 million and $163.4 million, respectively. Cash proceeds from the exercise of stock options were $150.2 million, $162.4 million and $136.5 million in 2006, 2005 and 2004, respectively. Income tax benefits realized from the exercise of stock options in 2006, 2005 and 2004 were $47.5 million, $52.3 million and $46.2 million, respectively.
78
EMC CORPORATION
NOTES TO CONSOLIDATED FINANCIAL STATEMENTS - (Continued)
Summarized information about stock options outstanding that are expected to vest and stock options exercisable at December 31, 2006 is as follows (options and intrinsic values in thousands):
| | | | | | | | | | | | | | | | | | | | |
Options Outstanding and Expected to Vest
| | Options Exercisable
|
Range of Exercise Price
| | Number of Options
| | Weighted Avg. Remaining
Contractual Life
| | Weighted Avg. Exercise Price
| | Aggregate
Intrinsic Value
| | Number of Options
| | Weighted Avg. Remaining
Contractual Life
| | Weighted Avg. Exercise Price
| | Aggregate
Intrinsic Value
|
$0.01-$5.00 | | 11,353 | | 5.20 | | $ | 2.61 | | $ | 120,228 | | 7,441 | | 4.34 | | $ | 2.56 | | $ | 79,172 |
$5.01-$10.00 | | 62,975 | | 6.15 | | | 7.26 | | | 374,072 | | 35,521 | | 4.57 | | | 6.37 | | | 242,608 |
$10.01-$15.00 | | 157,995 | | 6.85 | | | 12.95 | | | 91,183 | | 84,320 | | 5.67 | | | 12.46 | | | 74,325 |
$15.01-$20.00 | | 10,379 | | 4.23 | | | 17.09 | | | — | | 9,907 | | 4.19 | | | 17.16 | | | — |
$20.01-$30.00 | | 1,623 | | 2.51 | | | 26.23 | | | — | | 1,623 | | 2.51 | | | 26.23 | | | — |
$30.01-$50.00 | | 23,894 | | 3.71 | | | 35.08 | | | — | | 23,894 | | 3.71 | | | 35.08 | | | — |
$50.01-$70.00 | | 5,303 | | 3.22 | | | 60.12 | | | — | | 5,303 | | 3.22 | | | 60.12 | | | — |
$70.01-$90.00 | | 13,316 | | 3.70 | | | 83.32 | | | — | | 13,316 | | 3.70 | | | 83.32 | | | — |
| | |
| | | | | | |
|
| |
| | | | | | |
|
|
| | | 286,838 | | 6.03 | | | 17.50 | | $ | 585,483 | | 181,325 | | 4.81 | | | 20.82 | | $ | 396,105 |
| | | | | | | | | |
|
| |
| | | | | | |
|
|
Expected forfeitures | | 16,346 | | | | | | | | | | | | | | | | | | |
| | |
| | | | | | | | | | | | | | | | | | |
Total options outstanding | | 303,184 | | | | | | | | | | | | | | | | | | |
| | |
| | | | | | | | | | | | | | | | | | |
The aggregate intrinsic values in the preceding table represent the total pre-tax intrinsic values based on our closing stock price of $13.20 as of December 31, 2006 which would have been received by the option holders had all in-the-money options been exercised as of that date.
Restricted Stock and Restricted Stock Units
The following tables summarize our restricted stock and restricted stock unit activity in 2006, 2005 and 2004 (shares in thousands):
| | | | | | |
| | | Number of
Shares
| | | Weighted Average
Grant Date
Fair Value
|
Restricted stock and restricted stock units at January 1, 2004 | | 2,283 | | | $ | 12.88 |
Granted | | 4,660 | | | | 12.66 |
Vested | | (40 | ) | | | 7.99 |
| | |
|
| | | |
Outstanding, December 31, 2004 | | 6,903 | | | | 12.76 |
Granted | | 20,191 | | | | 14.06 |
Vested | | (1,492 | ) | | | 12.78 |
Forfeited | | (311 | ) | | | 13.21 |
| | |
|
| | | |
Outstanding, December 31, 2005 | | 25,291 | | | | 13.79 |
Granted | | 8,392 | | | | 10.39 |
Vested | | (4,538 | ) | | | 13.24 |
Forfeited | | (1,244 | ) | | | 9.36 |
| | |
|
| | | |
Restricted stock and restricted stock units at December 31, 2006 | | 27,901 | | | $ | 13.05 |
| | |
|
| | | |
The total fair values of restricted stock and restricted stock units that vested in 2006, 2005 and 2004 were $60.1 million, $19.1 million and $0.3 million, respectively.
Our restricted stock awards are valued based on our stock price on the award date. Our restricted stock awards have various vesting terms from the date of grant, including pro rata vesting over three years, cliff vesting at the end of three or five years with acceleration for achieving specified performance criteria and cliff vesting on various dates contingent on achieving specified performance criteria. For awards with performance conditions, management evaluates the criteria in each grant to determine the probability that the performance condition will be achieved.
79
EMC CORPORATION
NOTES TO CONSOLIDATED FINANCIAL STATEMENTS - (Continued)
As of December 31, 2006, 27.9 million shares of restricted stock and restricted stock units were outstanding and unvested, with an aggregate intrinsic value of $364.1 million and a weighted average remaining contractual life of approximately 3.1 years. These shares and units are scheduled to vest through 2011. Of the total shares of restricted stock and restricted stock units outstanding, 21.5 million shares and units will vest upon fulfilling service conditions, of which vesting for 19.5 million shares and units will accelerate upon achieving performance conditions. The remaining 6.4 million shares and units will vest only if certain performance conditions are achieved.
Impact of Adopting FAS No. 123R
The following table summarizes the components of total stock-based compensation expense included in our consolidated income statement in 2006 (in thousands):
| | | | | | | | | |
| | | Year Ended December 31, 2006
|
| | | Stock Options
| | Restricted
Stock
| | Total Stock-Based
Compensation
|
Cost of product sales | | $ | 35,005 | | $ | 6,517 | | $ | 41,522 |
Cost of services | | | 21,598 | | | 3,168 | | | 24,766 |
Research and development | | | 61,582 | | | 45,899 | | | 107,481 |
Selling, general and administrative | | | 146,950 | | | 77,968 | | | 224,918 |
Restructuring charges | | | 3,801 | | | 6,919 | | | 10,720 |
| | |
|
| |
|
| |
|
|
Stock-based compensation expense before income taxes | | | 268,936 | | | 140,471 | | | 409,407 |
Income tax benefit | | | 50,559 | | | 41,565 | | | 92,124 |
| | |
|
| |
|
| |
|
|
Total stock-based compensation, net of tax | | $ | 218,377 | | $ | 98,906 | | $ | 317,283 |
| | |
|
| |
|
| |
|
|
Stock option expense includes $30.4 million of expense associated with our employee stock purchase plan. The restructuring charges represent FAS No. 123R expense associated with our 2006 restructuring program. See Note C for more information.
In connection with the adoption of FAS No. 123R, we recorded a cumulative effect adjustment to recognize compensation costs recorded in our pro forma equity compensation disclosures that would have been capitalized in our consolidated balance sheet as of January 1, 2006. Additionally, included in the cumulative effect adjustment was the application of an estimated forfeiture rate on our previously recognized expense on unvested restricted stock and restricted stock units. The components of the adjustment were as follows (in thousands):
| | | | |
| | | Year Ended December 31, 2006
| |
Inventory | | $ | 2,505 | |
Capitalized software development costs (included in Other assets) | | | 13,139 | |
Accrued warranty expenses (included in Accrued expenses) | | | (19,896 | ) |
Estimated forfeitures on previously recognized restricted stock expense | | | 72 | |
| | |
|
|
|
Cumulative effect of a change in accounting principle before taxes | | | (4,180 | ) |
Income taxes | | | 808 | |
| | |
|
|
|
Cumulative effect of a change in accounting principle, net of tax | | $ | (3,372 | ) |
| | |
|
|
|
The table below presents the net change in amounts capitalized or accrued in 2006 for the following items (in thousands):
| | | | |
| | | Increased (decreased)
during the year ended
December 31, 2006
| |
Inventory | | $ | 2,630 | |
Other assets (capitalized software development costs) | | | 14,320 | |
Accrued expenses (accrued warranty expenses) | | | (23,935 | ) |
As of December 31, 2006, the total unrecognized after-tax compensation cost for stock options, restricted stock, restricted stock units and options under our employee stock purchase plan was $563.7 million. Approximately 85% of our employees have received grants through these equity compensation programs. This non-cash expense will be recognized through 2011 with a weighted average remaining period of 1.5 years.
80
EMC CORPORATION
NOTES TO CONSOLIDATED FINANCIAL STATEMENTS - (Continued)
As a result of adopting FAS No. 123R, our income before taxes and net income in 2006 were $241.6 million and $204.5 million lower, respectively, than if we had continued to account for share-based compensation under APB No. 25. Basic and diluted earnings per share in 2006 would have been $0.64 and $0.63, respectively, if we had not adopted FAS No. 123R, compared to reported basic and diluted earnings per share which were each $0.54.
Prior to the adoption of FAS No. 123R, we presented all tax benefits of deductions resulting from the exercise of stock options as operating cash flows in the consolidated statement of cash flows. FAS No. 123R requires the cash flows resulting from excess tax benefits to be classified as financing cash flows, rather than as operating cash flows. The $20.0 million excess tax benefit classified as a financing cash inflow in 2006 would have been classified as an operating cash inflow had we not adopted FAS No. 123R.
For the periods prior to 2006, we elected to apply APB No. 25 and related interpretations in accounting for our stock-based compensation plans. The following is a reconciliation of net income per weighted average share had we adopted the fair value recognition provisions of FAS No. 123 in 2005 and 2004 (table in thousands, except per share amounts):
| | | | | | | | |
| | | 2005
| | | 2004
| |
Net income | | $ | 1,133,165 | | | $ | 871,189 | |
Add back: Stock compensation costs, net of tax, on stock-based awards | | | 52,131 | | | | 40,345 | |
Less: Stock compensation costs, net of taxes, had stock compensation expense been measured at fair value | | | (371,681 | ) | | | (411,929 | ) |
| | |
|
|
| |
|
|
|
Incremental stock compensation expense per FAS No. 123, net of taxes | | | (319,550 | ) | | | (371,584 | ) |
| | |
|
|
| |
|
|
|
Adjusted net income | | $ | 813,615 | | | $ | 499,605 | |
| | |
|
|
| |
|
|
|
Net income per weighted average share, basic – as reported | | $ | 0.48 | | | $ | 0.36 | |
| | |
|
|
| |
|
|
|
Net income per weighted average share, diluted – as reported | | $ | 0.47 | | | $ | 0.36 | |
| | |
|
|
| |
|
|
|
Adjusted net income per weighted average share, basic | | $ | 0.34 | | | $ | 0.21 | |
| | |
|
|
| |
|
|
|
Adjusted net income per weighted average share, diluted | | $ | 0.34 | | | $ | 0.20 | |
| | |
|
|
| |
|
|
|
Under the 2003 Plan, certain awards granted to an employee who meets the age and/or length of service requirements for “retirement” set forth in the plan generally will continue to vest after such employee’s retirement without additional service, subject to the terms and conditions of the grant document. In connection with the above reconciliation of net income assuming adoption of FAS No. 123, our policy with respect to these awards has been to recognize compensation cost over the stipulated vesting period, which is typically five years. If the employee retires before the end of the vesting period, any remaining unrecognized compensation cost would be recognized at the date of retirement. The SEC has determined that companies that follow this approach should continue to do so for all applicable equity-based awards issued prior to the effective date of FAS No. 123R. These awards should also continue to be accounted for in this manner subsequent to the effective date of FAS No. 123R. The cost of applicable equity-based awards issued subsequent to the effective date of FAS No. 123R, however, should be recognized through the retirement eligibility date. Had we recognized compensation expense over this shorter service period, the increase in stock compensation costs, net of taxes, in addition to the amounts in the aforementioned table, would have been $57.0 million in 2005 and $29.1 million in 2004.
81
EMC CORPORATION
NOTES TO CONSOLIDATED FINANCIAL STATEMENTS - (Continued)
The fair value of each option granted during 2006, 2005 and 2004 is estimated on the date of grant using the Black-Scholes option-pricing model with the following weighted average assumptions:
| | | | | | | | | | | | |
| | | For the Year Ended
December 31,
| |
Stock Options
| | 2006
| | | 2005
| | | 2004
| |
Dividend yield | | | None | | | | None | | | | None | |
Expected volatility | | | 35.2 | % | | | 40.3 | % | | | 46.4 | % |
Risk-free interest rate | | | 4.80 | % | | | 4.02 | % | | | 3.18 | % |
Expected life (in years) | | | 4.0 | | | | 4.0 | | | | 4.2 | |
Weighted-average fair value at grant date | | $ | 3.80 | | | $ | 5.29 | | | $ | 5.15 | |
| |
| | | For the Year Ended
December 31,
| |
Employee Stock Purchase Plan
| | 2006
| | | 2005
| | | 2004
| |
Dividend yield | | | None | | | | None | | | | None | |
Expected volatility | | | 27.6 | % | | | 42.4 | % | | | 49.9 | % |
Risk-free interest rate | | | 4.82 | % | | | 2.91 | % | | | 1.33 | % |
Expected life (in years) | | | 0.5 | | | | 0.5 | | | | 0.5 | |
Weighted-average fair value at grant date | | $ | 2.89 | | | $ | 3.97 | | | $ | 3.51 | |
Expected volatilities are based on our historical and implied volatilities from traded options in our stock. We use EMC historical data to estimate the expected term of options granted within the valuation model. The risk-free rate for periods within the contractual life of the option is based on the U.S. Treasury yield curve in effect at the time of grant.
O. Related Party Transactions
In 2006, 2005 and 2004, we leased certain real estate from a company owned by a member of our Board of Directors and such Director’s siblings, for which payments aggregated approximately $3.8 million, $3.8 million and $2.9 million, respectively. Such leases were initially assumed by us as a result of our acquisition of Data General in 1999, and one lease was renewed for a ten-year term in 2003.
We purchased upgrades and licenses to software products from two companies, for which payments aggregated approximately $3.5 million and $0.3 million in 2005 and 2004, respectively. We sublet facilities to one of these companies, for which we were paid $30,000 in 2004. A member of our Board of Directors is Chairman of the Board of Directors of one of these companies and is managing partner and general partner in a limited partnership which is currently a stockholder of both such companies.
In 2006, we purchased approximately $152,000 of hardware, software and services from a company. A member of our Board of Directors is a managing partner and general partner in a limited partnership which is currently a stockholder of such company.
In February 2006, we acquired all of the outstanding shares of Authentica, Inc. A member of our Board of Directors is a general partner in a limited partnership that was a stockholder of Authentica. Of the total cash paid to Authentica’s stockholders of approximately $16 million, proceeds to the limited partnership as a result of this acquisition were approximately $2.7 million. Such director did not participate in any Board or committee approval of this acquisition, and EMC believes that the terms of the transaction were negotiated at arms’ length.
In September 2006, we acquired all of the outstanding shares of Network Intelligence. A member of our Board of Directors is a managing partner and general partner in a limited partnership that was a stockholder in Network Intelligence. Of the total cash paid to Network Intelligence’s stockholders of approximately $170 million, proceeds to the limited partnership as a result of the acquisition were approximately $24.4 million. Such director did not participate in any Board or committee approval of this acquisition, and EMC believes that the terms of the transaction were negotiated at arms’ length.
In accordance with its written policy and procedures relating to related person transactions, EMC’s Audit Committee has approved each of the above transactions pertaining to 2006.
EMC is a large global organization which engages in thousands of purchase, sales and other transactions annually. We enter into purchase and sales transactions with other publicly- and privately-held companies, universities, hospitals and not-for-profit organizations in which members of our Board of Directors or executive officers are executive officers or members of boards of these entities. We enter into these arrangements in the ordinary course of our business.
From time to time, we make strategic investments in privately-held companies that develop software, hardware and other technologies or provide services supporting our technologies. We may purchase from or make sales to these organizations.
82
EMC CORPORATION
NOTES TO CONSOLIDATED FINANCIAL STATEMENTS - (Continued)
We believe that the terms of each of these arrangements described above were fair and not less favorable to us than could have been obtained from unaffiliated parties.
P. Risks and Uncertainties
Our future results of operations involve a number of risks and uncertainties. Factors that could affect our future operating results and cause actual results to vary materially from expectations include, but are not limited to: adverse changes in general economic or market conditions; delays or reductions in information technology spending; risks associated with acquisitions and investments, including the challenges and costs of integration, restructuring and achieving anticipated synergies; competitive factors, including but not limited to pricing pressures and new product introductions; the relative and varying rates of product price and component cost declines and the volume and mixture of product and services revenues; component and product quality and availability; the transition to new products, the uncertainty of customer acceptance of new product offerings and rapid technological and market change; insufficient, excess or obsolete inventory; war or acts of terrorism; the ability to attract and retain highly qualified employees; fluctuating currency exchange rates; risks associated with litigation; and other one-time events and other important factors disclosed previously and from time to time in our filings with the SEC.
Q. Segment Information
Management has organized the business around our offerings. In the fourth quarter of 2006, we realigned our business into four segments: Information storage, Content management and archiving, VMware virtual infrastructure and RSA information security. We have conformed our prior period presentations to be consistent with our current segments. Our management measures are designed to assess segment operating performance. As a result, the corporate reconciling items are used to capture stock-based compensation expense and acquisition related intangible asset amortization expense. Management does not include these costs in evaluating the performance of its operating segments. Our management makes financial decisions and allocates resources based on revenues and gross profit achieved at the segment level. We do not allocate selling, general and administrative expenses, research and development expenses or assets to each segment, as management does not use this information to measure the performance of the operating segments.
The revenue components and gross profit attributable to these segments are set forth in the following tables (tables in thousands, except percentages):
| | | | | | | | | | | | | | | | | | | | | | | | |
| | | Information
Storage
| | | Content
Management
and Archiving
| | | VMware
Virtual
Infrastructure
| | | RSA
Information
Security
| | | Corporate Reconciling Items
| | | Consolidated
| |
2006 | | | | | | | | | | | | | | | | | | | | | | | | |
Systems revenues | | $ | 5,124,780 | | | $ | 8,621 | | | $ | — | | | $ | 7,225 | | | $ | — | | | $ | 5,140,626 | |
Software revenues | | | 2,015,257 | | | | 323,593 | | | | 494,647 | | | | 103,919 | | | | — | | | | 2,937,416 | |
Services revenues | | | 2,468,541 | | | | 353,576 | | | | 214,389 | | | | 40,542 | | | | — | | | | 3,077,048 | |
| | |
|
|
| |
|
|
| |
|
|
| |
|
|
| |
|
|
| |
|
|
|
Total revenues | | | 9,608,578 | | | | 685,790 | | | | 709,036 | | | | 151,686 | | | | — | | | | 11,155,090 | |
Cost of sales | | | 4,710,755 | | | | 225,819 | | | | 107,025 | | | | 37,671 | | | | 160,621 | | | | 5,241,891 | |
| | |
|
|
| |
|
|
| |
|
|
| |
|
|
| |
|
|
| |
|
|
|
Gross profit | | $ | 4,897,823 | | | $ | 459,971 | | | $ | 602,011 | | | $ | 114,015 | | | $ | (160,621 | ) | | $ | 5,913,199 | |
| | |
|
|
| |
|
|
| |
|
|
| |
|
|
| |
|
|
| |
|
|
|
Gross profit percentage | | | 51.0 | % | | | 67.1 | % | | | 84.9 | % | | | 75.2 | % | | | — | | | | 53.0 | % |
| | | | | | |
2005 | | | | | | | | | | | | | | | | | | | | | | | | |
Systems revenues | | $ | 4,486,867 | | | $ | — | | | $ | — | | | $ | — | | | $ | — | | | $ | 4,486,867 | |
Software revenues | | | 2,005,885 | | | | 228,728 | | | | 287,546 | | | | — | | | | — | | | | 2,522,159 | |
Services revenues | | | 2,299,441 | | | | 255,548 | | | | 99,940 | | | | — | | | | — | | | | 2,654,929 | |
| | |
|
|
| |
|
|
| |
|
|
| |
|
|
| |
|
|
| |
|
|
|
Total revenues | | | 8,792,193 | | | | 484,276 | | | | 387,486 | | | | — | | | | — | | | | 9,663,955 | |
Cost of sales | | | 4,198,642 | | | | 149,488 | | | | 45,335 | | | | — | | | | 77,671 | | | | 4,471,136 | |
| | |
|
|
| |
|
|
| |
|
|
| |
|
|
| |
|
|
| |
|
|
|
Gross profit | | $ | 4,593,551 | | | $ | 334,788 | | | $ | 342,151 | | | $ | — | | | $ | (77,671 | ) | | $ | 5,192,819 | |
| | |
|
|
| |
|
|
| |
|
|
| |
|
|
| |
|
|
| |
|
|
|
Gross profit percentage | | | 52.2 | % | | | 69.1 | % | | | 88.3 | % | | | — | | | | — | | | | 53.7 | % |
| | | | | | |
2004 | | | | | | | | | | | | | | | | | | | | | | | | |
Systems revenues | | $ | 3,871,006 | | | $ | — | | | $ | — | | | $ | — | | | $ | — | | | $ | 3,871,006 | |
Software revenues | | | 1,813,117 | | | | 192,689 | | | | 178,309 | | | | — | | | | — | | | | 2,184,115 | |
Services revenues | | | 1,930,921 | | | | 203,578 | | | | 39,868 | | | | — | | | | — | | | | 2,174,367 | |
| | |
|
|
| |
|
|
| |
|
|
| |
|
|
| |
|
|
| |
|
|
|
Total revenues | | | 7,615,044 | | | | 396,267 | | | | 218,177 | | | | — | | | | — | | | | 8,229,488 | |
Cost of sales | | | 3,807,145 | | | | 108,986 | | | | 18,144 | | | | — | | | | 80,606 | | | | 4,014,881 | |
| | |
|
|
| |
|
|
| |
|
|
| |
|
|
| |
|
|
| |
|
|
|
Gross profit | | $ | 3,807,899 | | | $ | 287,281 | | | $ | 200,033 | | | $ | — | | | $ | (80,606 | ) | | $ | 4,214,607 | |
| | |
|
|
| |
|
|
| |
|
|
| |
|
|
| |
|
|
| |
|
|
|
Gross profit percentage | | | 50.0 | % | | | 72.5 | % | | | 91.7 | % | | | — | | | | — | | | | 51.2 | % |
83
EMC CORPORATION
NOTES TO CONSOLIDATED FINANCIAL STATEMENTS - (Continued)
Our revenues are attributed to the geographic areas according to the location of the customers. Revenues by geographic area are included in the following table (table in thousands):
| | | | | | | | | |
| | | 2006
| | 2005
| | 2004
|
United States | | $ | 6,319,689 | | $ | 5,468,644 | | $ | 4,631,340 |
Europe, Middle East and Africa | | | 3,232,610 | | | 2,743,810 | | | 2,355,874 |
Asia Pacific | | | 1,126,214 | | | 1,061,198 | | | 925,990 |
Latin America, Mexico and Canada | | | 476,577 | | | 390,303 | | | 316,284 |
| | |
|
| |
|
| |
|
|
Total | | $ | 11,155,090 | | $ | 9,663,955 | | $ | 8,229,488 |
| | |
|
| |
|
| |
|
|
No country other than the United States accounted for 10% or more of revenues in 2006, 2005 or 2004.
Long-lived assets, excluding financial instruments and deferred tax assets in the United States, were $9,352.9 million at December 31, 2006 and $6,527.8 million at December 31, 2005. No country other than the United States accounted for 10% or more of these assets at December 31, 2006 or 2005. Long-lived assets, excluding financial instruments and deferred tax assets, internationally were $342.0 million at December 31, 2006 and $271.0 million at December 31, 2005.
For 2006 and 2005, Dell, Inc. accounted for 14.5% and 11.6%, respectively, of our total revenues. Dell, Inc. also accounted for 10.2% of our accounts receivable at December 31, 2006. Revenues from Dell, Inc. are classified within all segments, except for RSA information security.
R. Subsequent Event
On February 7, 2007, we announced our intention to sell approximately 10% of VMware via an initial public offering of newly-issued VMware stock. We will retain ownership of the remaining shares of VMware.
S. Selected Quarterly Financial Data (unaudited)
Quarterly financial data for 2006 and 2005 is as follows (tables in thousands, except per share amounts):
| | | | | | | | | | | | |
2006
| | Q1 2006
| | Q2 2006
| | Q3 2006
| | Q4 2006
|
Revenues | | $ | 2,550,687 | | $ | 2,574,523 | | $ | 2,815,306 | | $ | 3,214,574 |
Gross profit | | | 1,333,343 | | | 1,357,992 | | | 1,483,739 | | | 1,738,125 |
Net income | | | 272,456 | | | 279,093 | | | 283,664 | | | 388,769 |
Net income per share, diluted | | $ | 0.11 | | $ | 0.12 | | $ | 0.13 | | $ | 0.18 |
| | | | |
2005
| | Q1 2005
| | Q2 2005
| | Q3 2005
| | Q4 2005
|
Revenues | | $ | 2,243,131 | | $ | 2,344,815 | | $ | 2,365,742 | | $ | 2,710,267 |
Gross profit | | | 1,174,221 | | | 1,256,642 | | | 1,277,617 | | | 1,484,339 |
Net income | | | 269,834 | | | 293,364 | | | 421,672 | | | 148,295 |
Net income per share, diluted | | $ | 0.11 | | $ | 0.12 | | $ | 0.17 | | $ | 0.06 |
Quarterly financial data for the fourth quarter of 2006 includes an after-tax restructuring charge which reduced net income by $129.0 million or $0.06 per diluted share and income tax benefits consisting primarily of favorable audit resolutions which increased net income by $111.6 million or $0.05 per diluted share.
Quarterly financial data for the fourth quarter of 2005 includes an after-tax restructuring charge which reduced net income by $65.8 million or $0.03 per diluted share and an income tax charge to repatriate income abroad which reduced net income by $180.2 million or $0.08 per diluted share.
Quarterly financial data for the third quarter of 2005 includes an income tax adjustment decreasing income tax expense resulting from the favorable resolution of certain income tax audits and expiration of statutes of limitations which increased net income by $105.7 million or $0.04 per diluted share.
84
| ITEM 9. CHANGES | IN AND DISAGREEMENTS WITH ACCOUNTANTS ON ACCOUNTING AND FINANCIAL DISCLOSURE |
None.
| ITEM 9A. CONTROLS | AND PROCEDURES |
Evaluation of Disclosure Controls and Procedures. Our management, with the participation of our principal executive officer and principal financial officer, has evaluated the effectiveness of our disclosure controls and procedures (as defined in Rules 13a-15(e) and 15d-15(e) under the Exchange Act), as of the end of the period covered by this Annual Report on Form 10-K. Based on such evaluation, our principal executive officer and principal financial officer have concluded that as of such date, our disclosure controls and procedures were effective.
Management’s Annual Report on Internal Control Over Financial Reporting. Management’s Report on Internal Control Over Financial Reporting on page 37 is incorporated herein by reference.
Attestation Report of the Registered Public Accounting Firm. The Report of Independent Registered Public Accounting Firm on page 38 is incorporated herein by reference.
Changes in Internal Control Over Financial Reporting. There was no change in our internal control over financial reporting (as defined in Rules 13a-15(f) and 15d-15(f) under the Exchange Act) that occurred during the quarter ended December 31, 2006 that has materially affected, or is reasonably likely to materially affect, our internal control over financial reporting.
In making its assessment of the changes in internal control over financial reporting as of December 31, 2006, our management excluded the evaluation of the disclosure controls and procedures of RSA, which was acquired by EMC on September 15, 2006. See Note B to the Consolidated Financial Statements (Business Acquisitions, Goodwill and Intangible Assets) under Item 8 for a discussion of the acquisition.
| ITEM 9B. OTHER | INFORMATION |
None.
85
PART III
STOCK PRICE PERFORMANCE GRAPH
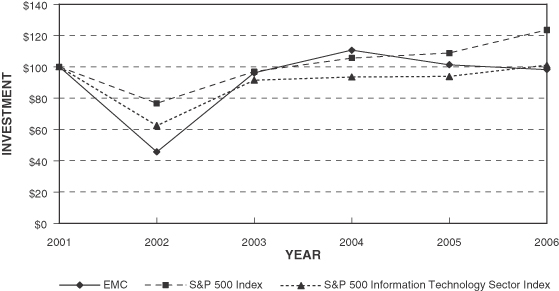
| | | | | | | | | | | | | | | | | | |
| | | 2001
| | 2002
| | 2003
| | 2004
| | 2005
| | 2006
|
EMC | | $ | 100.00 | | $ | 45.68 | | $ | 96.13 | | $ | 110.64 | | $ | 101.34 | | $ | 98.21 |
S&P 500 Index | | $ | 100.00 | | $ | 76.63 | | $ | 96.85 | | $ | 105.56 | | $ | 108.73 | | $ | 123.54 |
S&P 500 Information Technology Sector Index | | $ | 100.00 | | $ | 62.42 | | $ | 91.48 | | $ | 93.44 | | $ | 93.79 | | $ | 101.02 |
Source: Returns were derived from Thomson Financial
* $100 invested on December 31, 2001 in EMC Common Stock, S&P 500 Index and S&P 500 Information Technology Sector Index, including reinvestment of dividends, if any.
Note: The stock price performance shown on the graph above is not necessarily indicative of future price performance. This graph shall not be deemed “filed” for purposes of Section 18 of the Securities and Exchange Act of 1934 (the “Exchange Act”) or otherwise subject to the liabilities of that section nor shall it be deemed incorporated by reference in any filing under the Securities Act of 1933 or the Exchange Act, regardless of any general incorporation language in such filing.
86
| ITEM 10. | DIRECTORS, EXECUTIVE OFFICERS AND CORPORATE GOVERNANCE |
We will furnish to the SEC a definitive Proxy Statement not later than 120 days after the close of the fiscal year ended December 31, 2006. Certain information required by this item is incorporated herein by reference to the Proxy Statement. Also see “Executive Officers of the Registrant” in Part I of this Annual Report on Form 10-K.
We have a code of ethics that applies to all of our employees and non-employee directors. This code (available on our website) satisfies the requirements set forth in Item 406 of Regulation S-K and applies to all relevant persons set forth therein. We intend to disclose on our website atwww.emc.com amendments to, and, if applicable, waivers of, our code of ethics.
| ITEM 11. | EXECUTIVE COMPENSATION |
Certain information required by this item is incorporated herein by reference to the Proxy Statement.
| ITEM 12. | SECURITY OWNERSHIP OF CERTAIN BENEFICIAL OWNERS AND MANAGEMENT AND RELATED STOCKHOLDER MATTERS |
The information required by this item is incorporated herein by reference to the Proxy Statement.
| ITEM 13. | CERTAIN RELATIONSHIPS AND RELATED TRANSACTIONS, AND DIRECTOR INDEPENDENCE |
The information required by this item is incorporated herein by reference to the Proxy Statement and included in Note O to the Consolidated Financial Statements.
| ITEM 14. | PRINCIPAL ACCOUNTANT FEES AND SERVICES |
The information required by this item is incorporated herein by reference to the Proxy Statement.
PART IV
| ITEM 15. | EXHIBITS AND FINANCIAL STATEMENT SCHEDULES |
(a)
The financial statements listed in the Index to Consolidated Financial Statements are filed as part of this report.
The Schedule on page S-1 is filed as part of this report.
See Index to Exhibits on page 89 of this report.
The exhibits are filed with or incorporated by reference in this report.
87
SIGNATURES
Pursuant to the requirements of Section 13 or 15(d) of the Securities Exchange Act of 1934, EMC Corporation has duly caused this report to be signed on its behalf by the undersigned, thereunto duly authorized on February 27, 2007.
| | |
EMC CORPORATION |
| |
By: | | /S/ JOSEPH M. TUCCI
Joseph M. Tucci Chairman, President and Chief Executive Officer |
Pursuant to the requirements of the Securities Exchange Act of 1934, this report has been signed below by the following persons on behalf of EMC Corporation and in the capacities indicated as of February 27, 2007.
| | |
Signature
| | Title
|
| |
/S/ JOSEPH M. TUCCI
Joseph M. Tucci | | Chairman, President and Chief Executive Officer (Principal Executive Officer) |
| |
/S/ DAVID I. GOULDEN
David I. Goulden | | Executive Vice President and Chief Financial Officer (Principal Financial Officer) |
| |
/S/ MARK A. LINK
Mark A. Link | | Senior Vice President and Chief Accounting Officer (Principal Accounting Officer) |
| |
/S/ MICHAEL W. BROWN
Michael W. Brown | | Director |
| |
/S/ MICHAEL J. CRONIN
Michael J. Cronin | | Director |
| |
/S/ GAIL DEEGAN
Gail Deegan | | Director |
| |
/S/ JOHN R. EGAN
John R. Egan | | Director |
| |
/S/ W. PAUL FITZGERALD
W. Paul Fitzgerald | | Director |
| |
/S/ OLLI-PEKKA KALLASVUO
Olli-Pekka Kallasvuo | | Director |
| |
/S/ WINDLE B. PRIEM
Windle B. Priem | | Director |
| |
/S/ DAVID N. STROHM
David N. Strohm | | Director |
| |
/S/ ALFRED M. ZEIEN
Alfred M. Zeien | | Director |
88
Exhibit Index
The exhibits listed below are filed with or incorporated by reference in this Annual Report on Form 10-K.
| | |
| 3.1 | | Restated Articles of Organization of EMC Corporation, as amended. (1) |
| 3.2 | | Amended and Restated By-laws of EMC Corporation. (2) |
| 4.1 | | Form of Stock Certificate. (1) |
| 10.1* | | EMC Corporation 1985 Stock Option Plan, as amended. (3) |
| 10.2* | | EMC Corporation 1992 Stock Option Plan for Directors, as amended. (4) |
| 10.3* | | EMC Corporation 1993 Stock Option Plan, as amended. (3) |
| 10.4* | | EMC Corporation 2001 Stock Option Plan, as amended. (3) |
| 10.5* | | EMC Corporation 2003 Stock Plan, as amended. (5) |
| 10.6* | | EMC Corporation Executive Deferred Compensation Retirement Plan, as amended. (filed herewith) |
| 10.7* | | EMC Corporation Executive Incentive Bonus Plan. (6) |
| 10.8* | | Form of Severance Agreement for the Named Executive Officers. (7) |
| 10.9* | | Form of Stock Option Agreement under the EMC Corporation 2003 Stock Plan. (8) |
| 10.10* | | Form of Restricted Stock Agreement under the EMC Corporation 2003 Stock Plan. (8) |
| 10.11 | | Form of Indemnification Agreement for directors and executive officers. (8) |
| 12.1 | | Statement regarding Computation of Ratio of Earnings to Fixed Charges. (filed herewith) |
| 21.1 | | Subsidiaries of Registrant. (filed herewith) |
| 23.1 | | Consent of Independent Registered Public Accounting Firm. (filed herewith) |
| 31.1 | | Certification of Principal Executive Officer required by Rule 13a-14(a) or Rule 15d-14(a) of the Securities Exchange Act of 1934, as adopted pursuant to Section 302 of the Sarbanes-Oxley Act of 2002. (filed herewith) |
| 31.2 | | Certification of Principal Financial Officer required by Rule 13a-14(a) or Rule 15d-14(a) of the Securities Exchange Act of 1934, as adopted pursuant to Section 302 of the Sarbanes-Oxley Act of 2002. (filed herewith) |
| 32.1 | | Certification of Chief Executive Officer pursuant to 18 U.S.C. Section 1350, as adopted pursuant to Section 906 of the Sarbanes-Oxley Act of 2002. (filed herewith) |
| 32.2 | | Certification of Chief Financial Officer pursuant to 18 U.S.C. Section 1350, as adopted pursuant to Section 906 of the Sarbanes-Oxley Act of 2002. (filed herewith) |
| * | This exhibit is a management contract or compensatory plan or arrangement required to be filed as an exhibit pursuant to Item 15(a) of Form 10-K. |
| (1) | Incorporated by reference to EMC Corporation’s Annual Report on Form 10-K filed March 6, 2006 (No. 33-03656). |
| (2) | Incorporated by reference to EMC Corporation’s Current Report on Form 8-K filed February 16, 2006 (No. 33-03656). |
| (3) | Incorporated by reference to EMC Corporation’s Quarterly Report on Form 10-Q filed July 30, 2002 (No. 1-9853). |
| (4) | Incorporated by reference to EMC Corporation’s Quarterly Report on Form 10-Q filed April 27, 2005 (No. 1-9853). |
| (5) | Incorporated by reference to EMC Corporation’s Definitive Proxy Statement on Schedule 14A filed March 11, 2005 (No. 33-03656). |
| (6) | Incorporated by reference to EMC Corporation’s Current Report on Form 8-K filed February 2, 2005 (No. 1-9853). |
| (7) | Incorporated by reference to EMC Corporation’s Annual Report on Form 10-K filed March 22, 2002 (No. 1-9853). |
| (8) | Incorporated by reference to EMC Corporation’s Quarterly Report on Form 10-Q filed November 3, 2004 (No. 1-9853). |
89
EMC CORPORATION AND SUBSIDIARIES
SCHEDULE II–VALUATION AND QUALIFYING ACCOUNTS
(in thousands)
| | | | | | | | | | | | | | | | | | |
Allowance for Bad Debts Description
| | Balance at
Beginning of
Period
| | Allowance for
Bad Debts
Charged to
Selling, General
and
Administrative
Expenses
| | | Charged to
Other
Accounts
| | | Bad Debts
Write-Offs
| | | Balance at
End of
Period
|
Year ended December 31, 2006 allowance for doubtful accounts | | $ | 39,926 | | $ | 10,290 | | | $ | — | | | $ | (8,707 | ) | | $ | 41,509 |
Year ended December 31, 2005 allowance for doubtful accounts | | | 41,701 | | | 9,750 | | | | — | | | | (11,525 | ) | | | 39,926 |
Year ended December 31, 2004 allowance for doubtful accounts | | | 41,982 | | | 10,067 | | | | — | | | | (10,348 | ) | | | 41,701 |
Note: The allowance for doubtful accounts includes both current and non-current portions. |
Allowance for Sales Returns Description
| | Balance at Beginning of Period
| | Allowance for
Sales Returns
Accounted for as
a Reduction
(Increase) in Revenue
| | | Charged to Other Accounts
| | | Sales Returns
| | | Balance at End of Period
|
Year ended December 31, 2006 allowance for sales returns | | $ | 24,826 | | $ | 35,767 | | | $ | — | | | $ | (21,215 | ) | | $ | 39,378 |
Year ended December 31, 2005 allowance for sales returns | | | 38,471 | | | 9,225 | | | | — | | | | (22,870 | ) | | | 24,826 |
Year ended December 31, 2004 allowance for sales returns | | | 60,813 | | | (5,688 | ) | | | — | | | | (16,654 | ) | | | 38,471 |
| | | | | |
Tax Valuation Allowance Description
| | Balance at Beginning of Period
| | Tax Valuation
Allowance
Charged to
Income Tax
Provision
| | | Charged to Other Accounts*
| | | Tax Valuation
Allowance
Credited to
Income Tax
Provision
| | | Balance at End of Period
|
Year ended December 31, 2006 income tax valuation allowance | | $ | 63,817 | | $ | 6,289 | | | $ | (1,172 | ) | | $ | (13,403 | ) | | $ | 55,531 |
Year ended December 31, 2005 income tax valuation allowance | | | 61,976 | | | 7,443 | | | | (607 | ) | | | (4,995 | ) | | | 63,817 |
Year ended December 31, 2004 income tax valuation allowance | | | 60,085 | | | 12,127 | | | | (3,816 | ) | | | (6,420 | ) | | | 61,976 |
*Amount represents valuation allowances recognized in connection with business combinations.
S-1