UNITED STATES
SECURITIES AND EXCHANGE COMMISSION
Washington, D.C. 20549
FORM N-CSR
CERTIFIED SHAREHOLDER REPORT OF REGISTERED MANAGEMENT INVESTMENT COMPANIES
| Investment Company Act file number: | | 811-04611 |
| | | |
| Exact name of registrant as specified in charter: | | abrdn Asia-Pacific Income Fund, Inc. |
| | | |
| Address of principal executive offices: | | 1900 Market Street, Suite 200 |
| | | Philadelphia, PA 19103 |
| | | |
| Name and address of agent for service: | | Andrea Melia |
| | | abrdn Inc. |
| | | 1900 Market Street Suite 200 |
| | | Philadelphia, PA 19103 |
| | | |
| Registrant’s telephone number, including area code: | | 1-800-522-5465 |
| | | |
| Date of fiscal year end: | | October 31 |
| | | |
| Date of reporting period: | | October 31, 2022 |
Item 1. Reports to Stockholders.
abrdn Asia-Pacific Income Fund, Inc. (FAX)
Annual Report
October 31, 2022
Managed Distribution Policy (unaudited)
The Board of Directors of the abrdn Asia-Pacific Income Fund, Inc. (the "Fund") has authorized a managed distribution policy ("MDP") of paying monthly distributions at an annual rate set once a year. The Fund's current monthly distribution is set at a rate of $0.0275 per share. With each distribution, the Fund will issue a notice to shareholders and an accompanying press release which will provide detailed information regarding the amount and estimated composition of the distribution and other information required by
the Fund's MDP exemptive order. The Fund's Board of Directors may amend or terminate the MDP at any time without prior notice to shareholders; however, at this time, there are no reasonably foreseeable circumstances that might cause the termination of the MDP. You should not draw any conclusions about the Fund's investment performance from the amount of distributions or from the terms of the Fund's MDP.
Distribution Disclosure Classification (unaudited)
The Fund’s policy is to provide investors with a stable distribution rate. Each quarterly distribution will be paid out of current income, supplemented by realized capital gains and, to the extent necessary, paid-in capital.
The Fund is subject to U.S. corporate, tax and securities laws. Under U.S. tax rules, the amount applicable to the Fund and character of distributable income for each fiscal period depends on the actual exchange rates during the entire year between the U.S. Dollar and the currencies in which Fund assets are denominated and on the aggregate gains and losses realized by the Fund during the entire year.
Therefore, the exact amount of distributable income for each fiscal year can only be determined as of the end of the Fund’s fiscal year, October 31. Under Section 19 of the Investment Company Act of
1940, as amended (the “1940 Act”), the Fund is required to indicate the sources of certain distributions to shareholders. The estimated distribution composition may vary from month-to-month because it may be materially impacted by future income, expenses and realized gains and losses on securities and fluctuations in the value of the currencies in which Fund assets are denominated.
The distributions for the fiscal year ended October 31, 2022 consisted of 27% net investment income, 0% net realized gains and 73% tax return of capital.
In January 2023, a Form 1099-DIV will be sent to shareholders, which will state the final amount and composition of distributions and provide information with respect to their appropriate tax treatment for the 2022 calendar year.
abrdn Asia-Pacific Income Fund, Inc.
Letter to Shareholders (unaudited)
Dear Shareholder,
We present the Annual Report, which covers the activities of abrdn Asia-Pacific Income Fund, Inc. (the “Fund”), for the fiscal year ended October 31, 2022. The Fund’s principal investment objective is to seek current income. The Fund may also achieve incidental capital appreciation.
Total Investment Return1
For the fiscal year ended October 31, 2022, the total return to shareholders of the Fund based on the net asset value (“NAV”) and market price of the Fund, respectively, compared to the Fund’s benchmark is as follows:
| NAV2,3 | -27.70% |
| Market Price2 | -37.59% |
| Blended Benchmark4 | -16.68% |
For more information about Fund performance, please visit the Fund on the web at www.abrdnfax.com. Here, you can view quarterly commentary on the Fund's performance, monthly fact sheets, distribution and performance information, and other Fund literature.
NAV, Market Price and Premium(+)/Discount(-)
The below table represents comparison from current fiscal year end to prior fiscal year end of market price to NAV and associated Premium(+) and Discount(-).
| | |
| | NAV | Closing
Market
Price | Premium(+)/
Discount(-) |
| 10/31/2022 | $2.85 | $2.37 | -16.84% |
| 10/31/2021 | $4.38 | $4.22 | -3.70% |
During the fiscal year ended October 31, 2022, the Fund’s NAV traded within a range of $2.82 to $4.39 and the Fund’s market price traded within a range of $2.31 to $4.22. During the fiscal year ended October 31, 2022, the Fund’s shares traded within a range of a premium(+)/discount(-) of -3.20% to -18.60%.
Managed Distribution Policy
Distributions to common shareholders for the twelve-month periods ended October 31, 2022, October 31, 2021 and October 31, 2020 totaled $0.33 per share. Based on the market price of $2.37, $4.22 and $3.80 on October 31, 2022, October 31, 2021 and October 31, 2020, the distribution rate over the twelve-month period on each date was 13.9%, 7.8% and 8.7%, respectively. Based on the NAV of $2.85, $4.38 and $4.65 on October 31, 2022, October 31, 2021 and October 31, 2020, the annualized distribution rate was 11.6%, 7.5% and 7.1%, respectively. Since all distributions are paid after deducting applicable withholding taxes, the effective distribution rate may be higher for those U.S. investors who are able to claim a tax credit.
On November 9, 2022 and December 9, 2022, the Fund announced that it will pay on November 30, 2022 and January 11, 2023, respectively, a distribution of U.S. $0.0275 per share to all shareholders of record as of November 22, 2022 and December 30, 2022, respectively.
The Fund’s policy is to provide investors with a stable monthly distribution out of current income, supplemented by realized capital gains and, to the extent necessary, paid-in capital, which is a non-taxable return of capital. This policy is subject to an annual review as well as regular review at the Board’s quarterly meetings, unless market conditions require an earlier evaluation.
The Fund is covered under exemptive relief received by the Fund's investment manager from the U.S. Securities and Exchange Commission ("SEC") that allows the Fund to distribute long-term capital gains as frequently as monthly in any one taxable year.
Portfolio Allocation
As of October 31, 2022, the Fund held 76.2% of its total investments in Asian debt securities, 7.3% in Australian debt securities, 6.4% in Latin America debt securities, 5.2% in European debt securities, 2.7% in U.S. debt securities and 2.2% in African debt securities.
Of the Fund’s total investments, excluding hedges, 51.8% were held in U.S. Dollar denominated bonds issued by foreign issuers as of October 31, 2022. The rest of the Fund’s currency exposure as of October 31, 2022 was 5.3% in the Australian Dollar, 36.2% in various Asian currencies, 6.4% in various Latin American currencies and 0.3% in various European currencies.
{foots1}
| 1 | Past performance is no guarantee of future results. Investment returns and principal value will fluctuate and shares, when sold, may be worth more or less than original cost. Current performance may be lower or higher than the performance quoted. Net asset value return data include investment management fees, custodial charges and administrative fees (such as Director and legal fees) and assumes the reinvestment of all distributions. |
{foots1}
| 2 | Assuming the reinvestment of dividends and distributions. |
{foots1}
| 3 | The Fund’s total return is based on the reported NAV for each financial reporting period end and may differ from what is reported on the Financial Highlights due to financial statement rounding or adjustments. |
{foots1}
| 4 | Blended Benchmark as defined in Total Investment Return section on Page 6. |
| abrdn Asia-Pacific Income Fund, Inc. | 1 |
Letter to Shareholders (unaudited) (continued)
Of the Fund’s total investments, including hedges, 57.2% were held in U.S. Dollar denominated bonds issued by foreign issuers as of October 31, 2022. The rest of the Fund’s currency exposure as of October 31, 2022 was 0.9% in the Australian Dollar, 35.2% in various Asian currencies, 6.4% in various Latin American currencies and 0.3% in various European currencies.
Credit Quality
As of October 31, 2022, 13.6% of the Fund’s total investments were invested in securities where either the issue or the issuer was rated A or better by S&P Global Ratings (“S&P”)*, Moody’s Investors Services, Inc. (“Moody’s”)** or Fitch Ratings, Inc. (“Fitch”)***
Fund’s Leverage
The table below summarizes certain key terms of the Fund’s current leverage:
| Amount ($ in millions) | Maturity |
| Revolving Credit Facility | $65 | August 2, 2023 |
| 10-Year Series A Mandatory Redeemable Preferred Shares | $50 | June 27, 2023 |
| 15-Year Series C Senior Secured Notes | $50 | February 8, 2032 |
| 15-Year Series D Senior Secured Notes | $100 | August 10, 2032 |
| 15-Year Series E Senior Secured Notes | $100 | June 19, 2034 |
As at October 31, 2022, the Series A Mandatory Redeemable Preferred Shares (“MRPS”), with a liquidation value of $50 million, are rated A by Fitch and the combined $250 million 10-year and 15-Year Series C, D and E Senior Secured Notes are rated A by Fitch.
We believe the Fund has been able to lock in an attractive rate cost of borrowing and extend the maturity of the leverage facility while diversifying its borrowing structure during what we believe to be a favorable current interest rate environment. A more detailed description of the Fund’s leverage can be found in the Report of the Investment Manager and the Notes to Financial Statements.
Unclaimed Share Accounts
Please be advised that abandoned or unclaimed property laws for certain states require financial organizations to transfer (escheat) unclaimed property (including Fund shares) to the state. Each state has its own definition of unclaimed property, and Fund shares could
be considered “unclaimed property” due to account inactivity (e.g., no owner-generated activity for a certain period), returned mail (e.g., when mail sent to a shareholder is returned to the Fund’s transfer agent as undeliverable), or a combination of both. If your Fund shares are categorized as unclaimed, your financial advisor or the Fund’s transfer agent will follow the applicable state’s statutory requirements to contact you, but if unsuccessful, laws may require that the shares be escheated to the appropriate state. If this happens, you will have to contact the state to recover your property, which may involve time and expense. For more information on unclaimed property and how to maintain an active account, please contact your financial adviser or the Fund’s transfer agent.
Open Market Repurchase Program
The Fund’s Board approved an open market repurchase and discount management policy, which allows the Fund to purchase, in the open market, its outstanding common shares, with the amount and timing of any repurchase determined at the discretion of the Fund’s investment adviser. The Fund reports the number of shares repurchased on its website monthly. During the fiscal year ended October 31, 2022, the Fund did not repurchase any shares through this program.
On a quarterly basis, the Fund’s Board will receive information on any transactions made pursuant to this policy during the prior quarter and management will post the number of shares repurchased on the Fund’s website on a monthly basis. Under the terms of the Program, the Fund is permitted to repurchase up to 10% of its outstanding shares of common stock in the open market during any 12 month period.
Portfolio Holdings Disclosure
The Fund’s complete schedule of portfolio holdings for the second and fourth quarters of each fiscal year are included in the Fund’s semi-annual and annual reports to shareholders. The Fund files its complete schedule of portfolio holdings with the Securities and Exchange Commission (the “SEC”) for the first and third quarters of each fiscal year as an exhibit to its reports on Form N-PORT. These reports are available on the SEC’s website at http://www.sec.gov. The Fund makes the information available to shareholders upon request and without charge by calling Investor Relations toll-free at 1-800-522-5465.
{foots1}
| * | S&P’s ratings are expressed as letter grades that range from ‘AAA’ to ‘D’ to communicate the agency’s opinion of relative level of credit risk. Ratings from ‘AA’ to ‘CCC’ may be modified by the addition of a plus (+) or minus (-) sign to show relative standing within the major rating categories. The investment grade category is a rating from ‘AAA’ to ‘BBB-’. |
{foots1}
| ** | Moody’s is an independent, unaffiliated research company that rates fixed income securities. Moody’s assigns ratings on the basis of risk and the borrower’s ability to make interest payments. Typically, securities are assigned a rating from ‘Aaa’ to ‘C’, with ‘Aaa’ being the highest quality and ‘C’ the lowest quality. |
{foots1}
| *** | Fitch is an international credit rating agency. Fitch ratings range from AAA (reliable and stable) to D (high risk). |
| 2 | abrdn Asia-Pacific Income Fund, Inc. |
Letter to Shareholders (unaudited) (concluded)
Proxy Voting
A description of the policies and procedures that the Fund uses to determine how to vote proxies relating to portfolio securities and information regarding how the Fund voted proxies relating to portfolio securities during the most recent 12 month period ended June 30 is available by August 31 of the relevant year: (1) upon request without charge by calling Investor Relations toll-free at 1-800-522-5465; and (2) on the SEC’s website at http://www.sec.gov.
Investor Relations Information
As part of abrdn’s commitment to shareholders, we invite you to visit the Fund on the web at www.abrdnfax.com. Here, you can view monthly fact sheets, quarterly commentary, distribution and performance information, and other Fund literature.
Enroll in abrdn’s email services and be among the first to receive the latest closed-end fund news, announcements, videos, and other information. In addition, you can receive electronic versions of important Fund documents, including annual reports, semi-annual reports, prospectuses and proxy statements. Sign up today at https://www.abrdn.com/enus/cefinvestorcenter/contact-us/preferences
Contact Us:
| • | Visit: https://www.abrdn.com/en-us/cefinvestorcenter |
| • | Email: Investor.Relations@abrdn.com; or |
| • | Call: 1-800-522-5465 (toll free in the U.S.). |
Yours sincerely,
/s/ Christian Pittard
Christian Pittard
President
{foots1}
All amounts are U.S. Dollars unless otherwise stated.
| abrdn Asia-Pacific Income Fund, Inc. | 3 |
Report of the Investment Manager (unaudited)
Market/Economic Review
Government bonds delivered negative returns as U.S. Treasury yields surged to levels not seen since the 2007/08 global financial crisis, with the U.S. curve remaining firmly inverted as the Federal Reserve (Fed) conceded that controlling inflation was likely to require a sustained period of below-trend growth. Central banks around the world raised interest rates increasingly aggressively to try to tame inflation that soared to 40-year highs in the U.S. (9.1%) and U.K. (10.1%) and an all-time high in the eurozone (10.6%). Benchmark yields rose by around 2.5 percentage points in all three core markets as policymakers quickened their pace of tightening to 75bps moves by the end of the period. Markets were further disrupted by Russia’s invasion of Ukraine in February and the UK briefly proposing massive unfunded spending and tax cuts in September.
Risk aversion in a deteriorating economic environment and the steep rise in government yields weighed on returns from emerging market (EM) debt and Asian credit. The rapid hikes in U.S. interest rates drove a sharp rally in the dollar that considerably weakened the euro, sterling and yen, with the dollar rally showing some signs of easing only at the end of the period. Shortly after period-end, a combination of U.S. inflation printing below expectations and China announcing an easing of its strict COVID-19 restrictions triggered a sharp rebound in core rates markets.
China led the performance of Asian local currency bonds as its 10-year yield fell by 32bps, significantly outperforming U.S. Treasuries. Benchmark yields elsewhere in Asia rose steeply, although, except for Hong Kong (where the 10-year yield rose by 250bps), Asian bonds outperformed U.S. Treasuries. Ten-year yields rose by 106bps in India, 150bps in Indonesia, 78bps in Malaysia, 233bps in Philippines, 159bps in Singapore, 166bps in South Korea and 122bps in Thailand. Many Asian yield curves flattened, most noticeably in Hong Kong, India, Malaysia, Singapore and South Korea, as growth headwinds in the U.S. came into play for Asian rates markets.
The relative performance between core markets and Asian markets is consistent with how much central banks are expected still to have to tighten policy to reach their price stability goals. The Fed, European Central Bank and Bank of England are all expected to have to continue raising rates aggressively into the end of the year. In contrast, central banks in Asia are mostly on much shallower tightening paths, with India, Indonesia and South Korea expected to tighten by less than half as much as their developed-market peers.
The environment in Asia has some other distinct characteristics compared with the U.S. There is far less demand-pull inflation, tightness in labor markets or need to urgently withdraw liquidity1.
This is a result of not over-easing and, in the case of South Korea, proactively beginning policy normalisation sooner. Hence, policymakers should reach terminal rates sooner. Inflation in Asia has recently been mixed, continuing to rise in South Korea, Singapore, Philippines and Thailand and easing in India, Indonesia and Malaysia.
Contributing to market unease, China’s policymakers signalled some concern with the downside risks to their economy, shocking markets in mid-August by cutting their key interest rate after holding policy for most of the year. China’s economy continues to struggle against COVID-19 infections, a worsening housing slump and cooling global outlook, which is weighing on global trade and activity.
After holding its policy rate at a record low for more than a year, the Reserve Bank of India began a hiking cycle in May to tackle rising inflation that printed above the central bank’s target from January onwards. Indonesia hiked rates at successive meetings towards the end of the period, with Bank Indonesia describing the policy as “front-loaded, pre-emptive and forward-looking” to guide inflation back to the target range next year while also safeguarding the stability of the rupiah. Inflation in Singapore remains broad-based and notably sticky in food and services. The Monetary Authority of Singapore tightened policy in October for a fifth time since the pandemic by re-centring upwards the Singapore dollar nominal effective exchange rate (NEER) by approximately 200bps. The Bank of Korea (BoK) started hiking its policy rate in mid-2021 and continued tightening throughout the period, albeit the 50bps move in October was somewhat dovish as two board members preferred 25bps. BoK raised its inflation forecasts and signalled that it might have to keep raising rates for longer to curb rising prices. South Korea’s export momentum continued to fade and its current account slipped into deficit. The Bank of Thailand raised rates by 25bps in both August and September, with the moves considered dovish as policymakers emphasised that policy normalisation would be gradual and measured.
The International Monetary Fund (IMF) expects emerging and developing Asia to grow next year by 4.9%, outpacing other regions within global emerging markets and well ahead of developed markets. It forecasts that India will grow next year at 6.1% (the fastest rate among major economies) while China will grow at 4.4%. The Brent crude oil price rose by 12.4% to $94.80 a barrel, stoked by reopening economies, restrictions on Russian crude following the invasion of Ukraine and OPEC+ agreeing to cut output.
The Fed’s aggressive hiking cycle drove a relentless rally in the U.S. dollar, against which many currencies in Asia and around the world struggled. The Singapore dollar was relatively the most resilient regional currency as it fell by 5%. Most other Asian currencies saw double-digit declines. China’s offshore yuan (-14.5%), the ringgit
{foots1}
| 1 | The degree to which an asset or investment can be easily converted to cash, by sale at a fair price. Liquidity also describes the amount of cash held in a portfolio. |
| 4 | abrdn Asia-Pacific Income Fund, Inc. |
Report of the Investment Manager (unaudited) (continued)
(-14.2%), Philippine peso (-15%) and Thai baht (-14.7%) suffered heavy losses, while the South Korean won was the worst performer, falling by 21.9%. It wasn’t until October that the U.S. dollar finally showed signs of faltering under the weight of crowded long positioning and hopes of a policy pivot by the Fed, although by then the dollar had strengthened by more than 18% over the 12 months.
Market volatility2 forced central banks across Asia to intervene to support their currencies. South Korea pledged to buy sovereign debt while selling U.S. dollars. China tried to slow the yuan’s decline through tighter daily fixing. Indonesia’s central bank hopes to support the rupiah with its version of Operation Twist, buying longer-dated bonds and selling shorter-term ones to attract foreign inflows. However, despite the weakness over the 12 months, Asia remains in a better position than global and EM ex-Asia regions as it is supported by stronger fundamentals and more robust buffers. Asian countries also have less vulnerability to domestic political risks.
Asian credit markets were very weak over the year, with the J.P. Morgan Asian Credit Index (JACI) Diversified returning -17.1%. This was primarily due to the steep rise in U.S. Treasury yields, although spreads also contributed negatively as the index spread widened by 168bps to 370bps. The key themes that weighed on returns were the barrage of Fed rate hikes, rising stress and contagion in the Chinese property sector and a sharp rise in geopolitical tensions following Russia’s invasion of Ukraine. The combined effect was broad-based risk aversion that generally pressured markets. All countries and sectors in the index delivered negative returns, with Pakistan, Sri Lanka and Macau the worst performers by country. Real estate and consumer were the laggards by sector. The high-yield segment (-26.4%) was affected by Chinese developers and the underperformance of sovereign names, namely Sri Lanka, Pakistan and to some extent Mongolia, and lagged investment-grade3 (-14.6%) credits.
Emerging market debt faced a testing 12 months given the sharp rise in U.S. Treasury yields and investor risk aversion in the face of heightened geopolitical and economic risks. Local-currency bonds outperformed hard-currency bonds (those denominated in U.S. dollars) although both were pushed deeply into negative returns territory. Returns were similar across the investment-grade and high-yield segments of the market. All index countries delivered
negative returns although there was considerable divergence by country, with Lebanon, Pakistan and Sri Lanka performing very weakly and Ukraine the standout laggard. Countries with large funding gaps found it difficult to access markets due to the uncertain macroeconomic environment, and increasingly looked to multilateral sources of financing. This saw several governments, such as those in Egypt, Ukraine and Tunisia, needing to seek IMF support as they confront the headwinds of currency volatility and higher inflation. The downbeat tone of the annual IMF meetings in Washington highlights investor concerns over the risks facing highly debt-burdened EM sovereign issuers as global growth forecasts were downgraded and expectations of a recession increased. Another frequent discussion at the meetings surrounded concerns over the potential harsher treatment of private sector creditors in ongoing restructurings.
Performance Review
The abrdn Asia-Pacific Income Fund returned -27.70% on a net asset value4 basis for the 12-month reporting period ended October 31, 2022, compared with the Bloomberg Asian-Pacific Aggregate Index return of -19.42% and the -16.68% return of its blended benchmark5 during the same period. While the performance of the net asset value includes the impact of leverage6, the benchmark indices does not.
Rising interest rates, wider credit spreads and significant U.S. dollar strength all contributed to the negative total return for the reporting period. The Fund’s use of leverage magnified the negative impact of the investment returns on the net asset value.
Leverage is used strategically by the Fund to support its income-generating capacity. The Fund continues to benefit from a positive interest rate differential between the interest income on the investment portfolio and the cost of the leverage. The Fund's leverage usage for the fiscal year ranged from 31.5% to 36.4% of average managed assets.
Relative to the Fund’s blended benchmark, the investment portfolio underperformed. The principal driver of negative relative performance was the overweight7 allocation to U.S. dollar-denominated Asian credit markets. Overweight exposures to relatively resilient local-currency markets in Asia, such as India and China, had a positive
{foots1}
| 2 | If the price of a fund moves significantly over a short period of time it is said to be 'volatile' or has 'high volatility'. If the price remains relatively stable it is said to have 'low volatility'. Volatility can be used as a measure of risk. |
{foots1}
| 3 | Companies whose bonds are rated as 'investment grade' have a lower chance of defaulting on their debt than those rated as 'non-investment grade'. Generally, these bonds are issued by long-established companies with strong balance sheets. Bonds rated BBB or above are known as Investment Grade Bonds. |
{foots1}
| 4 | A key measure of the value of a company, fund or trust – the total value of assets less liabilities, divided by the number of shares. |
{foots1}
| 5 | The Fund’s blended benchmark is composed of 40% Markit iBoxx Asian Local Bond Index; 35% J.P. Morgan Asian Credit Index Diversified; 15% J.P. Morgan GBI Emerging Market Global Diversified Index; and 10% Bloomberg AusBond Composite Index |
{foots1}
| 6 | Usually refers to a fund being exposed by more than 100% of its net asset value to assets or markets; typically resulting from the use of debt or derivatives. |
{foots1}
| 7 | A portfolio holding an excess amount of a particular security (or sector or region) compared to the security’s weight in the benchmark portfolio. |
| abrdn Asia-Pacific Income Fund, Inc. | 5 |
Report of the Investment Manager (unaudited) (continued)
contribution. The underweight8 to broader emerging market debt also had a positive contribution and partly offset some of the negative impacts on relative performance.
During the reporting period, the Fund's performance was negatively impacted by 1.00% due to the use of the various forms of derivatives. The use of derivatives to hedge the interest rate risk in the portfolio contributed positively, while the use of currency forwards detracted value.
The monthly distribution reflects the Fund’s current policy to provide shareholders with a relatively stable cash flow per share. This policy did not have a significant impact on the Fund’s investment strategy over the reporting period. During the 12-month period ended October 31, 2022, the distributions comprised of net ordinary income and return of capital.
Outlook
Since October, with U.S. inflation printing below expectations and China announcing a long-awaited easing of its strict zero-COVID restrictions, markets have anticipated an improvement in the global macro environment as we head into 2023. We expect that the Fed will pause its policy rate-hiking cycle in the first half of next year, as the real policy rate turns positive versus the central bank’s preferred measure of inflation, core personal consumption expenditures (PCE). While the U.S. labor market remains tight, other macro indicators are causing more worry, such as the housing market and the manufacturing sector. As monetary policy9 works with long and variable lags, we suspect the Fed will choose to pause and take stock of the economic impact of its rapid tightening cycle.
We believe this is likely to remove pressure on the U.S. dollar to continue to strengthen and provide policy space for other global central banks to slow their tightening cycles. We suspect some EM central banks, particularly those in Latin America which started their cycles earlier and have reached very elevated levels of nominal rates, could be the first to start cutting later in the year. In Asia, hiking cycles are likely to continue in the near term, but most central banks are already close to reaching their terminal rates, as markets have largely priced in.
We expect growth in China to pick up during the year although the economy must first navigate the escalation in COVID-19 infections and the inevitable impact on the healthcare system and, ultimately, mobility. While the recovery will be bumpy, we expect activity to pick up through the year as the population acquires immunity through infections and an acceleration in the vaccination program. Both monetary and fiscal policy are likely to remain supportive through
this process although we believe eventually there will be a need to moderate and remove accommodation as the recovery takes hold.
As China emerges from the pandemic, we expect the Asian region to benefit through the sentiment channel, improved trade flows and, eventually, the restoration of tourism flows, which are particularly important for the ASEAN (Association of Southeast Asian Nations) region. We believe an improvement in the domestic environment and better coordinated economic policymaking will provide support for the embattled China credit market, with positive spillovers to Asian credit more broadly. We will continue to seek to take advantage of dislocations in pricing where our fundamental company views differ from those of the market.
We suspect 2023 can also be a better year for EM credit as the U.S. rates environment turns more constructive for the asset class, EM growth holds up relatively well and market access is improved or restored for better-quality issuers. While a small handful of sovereign issuers will continue to face external financing challenges, we expect multilateral partners to remain engaged and provide liquidity where macro policies are judged to be sound and public debt to be sustainable.
While the outlook is still characterised by risks, such as economic slowdown in the U.S. and developed markets, hiccups along China’s reopening path and geopolitics, we judge that many of these challenges are already known to markets and have been adequately priced in. We believe three factors will underpin support for Asian and EM fixed income markets in 2023: a more stable global macro environment; inexpensive valuations in currencies, domestic rates and credit; and light positioning as global investors moved underweight the asset class this year.
Loan Facilities and the Use of Leverage
The amounts borrowed under the Revolving Credit Facility, the Notes and the Series A MRPS (each as defined below) may be invested to seek to return higher rates than the rates pursuant to which interests or dividends are paid under such forms of leverage. However, the cost of leverage could exceed the income earned by the Fund on the proceeds of such leverage. To the extent that the Fund is unable to invest the proceeds from the use of leverage in assets which pay interest at a rate which exceeds the rate paid on the leverage, the yield on the Fund’s common stock will decrease. In addition, in the event of a general market decline in the value of assets in which the Fund invests, the effect of that decline will be magnified in the Fund because of the additional assets purchased with the proceeds of the leverage.
{foots1}
| 8 | A portfolio holding less of a particular security (or sector or region) than the security’s weight in the benchmark portfolio. |
{foots1}
| 9 | Decisions made by a government, usually through its central bank, regarding the amount of money in circulation in the economy. This includes setting official interest rates. |
| 6 | abrdn Asia-Pacific Income Fund, Inc. |
Report of the Investment Manager (unaudited) (continued)
The Fund employed leverage obtained via bank borrowing and other forms of leverage during the fiscal year ended October 31, 2022. On August 3, 2022, the Fund executed an amendment and assignment of the $100,000,000 senior secured revolving credit loan facility (the “Revolving Credit Facility”) with a syndicate of banks with The Bank of Nova Scotia, acting as administrative agent. Between November 2021 and September 2022, the Fund paid down its entire $100,000,000 balance outstanding on its revolving credit facility. On October 26, 2022, the Fund drew down $65 million on its revolving credit facility and used the proceeds to pay down the Fund's $100,000,000 in 3.69% Series B Senior Secured Notes. As of October 31, 2022, the Fund’s outstanding balance on the revolving credit facility was $65,000,000.
At October 31, 2022, the Fund had $250,000,000 in aggregate principal amount of senior secured notes rated `A’ by Fitch Ratings outstanding ($50,000,000 in 3.87% Series C Senior Secured Notes due February 8, 2032, $100,000,000 in 3.70% Series D Senior Secured Notes due August 10, 2032 and $100,000,000 in 3.73% Series D Senior Secured Notes due June 19, 2034) (collectively, the “Notes”).
At October 31, 2022, the Fund had 2,000,000 shares of Series A MRPS, rated `A’ by Fitch ratings, outstanding with an aggregate liquidation preference of $50,000,000 ($25 per share).
The Fund’s leveraged capital structure creates special risks not associated with unleveraged funds having similar investment objectives and policies. The funds borrowed pursuant to the Revolving Credit Facility and the Notes may constitute a substantial lien and burden by reason of their prior claim against the income of the Fund and against the net assets of the Fund in liquidation. The Fund is limited in its ability to declare dividends or other distributions under the terms of the various forms of leverage. In the event of an event of default under the Revolving Credit Facility, the lenders have the right to cause a liquidation of the collateral (i.e., sell portfolio securities and other assets of the Fund) and, if any such default is not cured, the lenders may be able to control the liquidation as well. In the event of an event of default under the Note Purchase Agreement, the holders of the Notes have the right to cause a liquidation of the collateral (i.e., cause the sale of portfolio securities and other assets of the Fund). A liquidation of the Fund’s collateral assets in an event of default, or a voluntary paydown of the Revolving Credit Facility, Series A MRPS or the Notes in order to avoid an event of default, would typically involve administrative expenses and sometimes penalties. Additionally, such liquidations often involve selling off of portions of the Fund’s assets at inopportune times which can result in losses when markets are unfavorable.
Each of the Revolving Credit Facility Agreement, the Note Purchase Agreement, and the Securities Purchase Agreement relating to the Series A MRPS includes usual and customary covenants for the
applicable type of transaction. These covenants impose on the Fund asset coverage requirements, Fund composition requirements and limits on certain investments, such as illiquid investments, which are more stringent than those imposed on the Fund by the 1940 Act. The covenants or guidelines could impede the Fund’s investment manager, investment adviser, or sub-adviser from fully managing the Fund’s portfolio in accordance with the Fund’s investment objective and policies. Furthermore, non-compliance with such covenants or the occurrence of other events could lead to the cancellation of any and/or all of the forms of leverage. As of October 31, 2022, the Fund was in compliance with all covenants under the agreements relating to the various forms of leverage. Under the Fund's loan facilities, the Fund is charged interest on amounts borrowed at a variable rate, which may be based on a reference rate such as the London Interbank Offered Rate (“LIBOR”), European Interbank Offer Rate (“EURIBOR”), Sterling Overnight Interbank Average Rate (“SONIA”) or Secured Overnight Financing Rate (“SOFR”) plus a spread. Additionally, the Fund may invest in certain debt securities, derivatives or other financial instruments that utilize one of these rates as a “benchmark” or “reference rate” for various interest rate calculations. In July 2017, the United Kingdom Financial Conduct Authority (“FCA”), which regulates the LIBOR administrator, announced that the FCA will no longer persuade or compel banks to submit rates for the calculation of LIBOR after 2021. However, for US dollar LIBOR, it now appears that the relevant date may be deferred to June 30, 2023 for the most common tenors (overnight and one, three, six and 12 months). See LIBOR Risk for additional details.
Risk Considerations
Past performance is not an indication of future results.
Foreign securities in which the Fund may invest may be more volatile, harder to price and less liquid than U.S. securities. They are subject to risks associated with less stringent accounting and regulatory standards, the impact of currency exchange rate fluctuation, political and economic instability, reduced information about issuers, higher transaction costs and delayed settlement. The Fund focuses its investments in the Asia-Pacific region, which may subject the Fund to more volatility and greater risk of loss than geographically diverse funds.
Fixed income securities are subject to certain risks including, but not limited to: interest rate (changes in interest rates may cause a decline in the market value of an investment), credit (changes in the financial condition of the issuer, borrower, counterparty, or underlying collateral), prepayment (debt issuers may repay or refinance their loans or obligations earlier than anticipated), extension (principal repayments may not occur as quickly as anticipated, causing the expected maturity of a security to increase) and issuer risk (the value of a security may decline for reasons related to the issuer, such
| abrdn Asia-Pacific Income Fund, Inc. | 7 |
Report of the Investment Manager (unaudited) (concluded)
as management performance, financial leverage and reduced demand for the issuer’s goods or services).
abrdn Asia Limited (formerly known as Aberdeen Standard Investments (Asia) Limited)
| 8 | abrdn Asia-Pacific Income Fund, Inc. |
Total Investment Return (unaudited)
The following table summarizes the average annual Fund performance compared to the Fund’s primary benchmark and a blended benchmark for the 1-year, 3-year, 5-year and 10-year periods ended October 31, 2022.
| | 1 Year | 3 Years | 5 Years | 10 Years |
| Net Asset Value (NAV) | -27.70% | -8.72% | -3.91% | -1.75% |
| Market Price | -37.59% | -10.11% | -5.96% | -3.71% |
| Blended Benchmark* | -16.68% | -4.26% | -0.86% | 0.15% |
| Bloomberg Asian-Pacific Aggregate Index1 | -19.42% | -6.69% | -2.48% | -3.34% |
| * | The blended benchmark is summarized in the table below: |
| | Weight |
| Bloomberg AusBond Composite Index2 | 10.0% |
| Markit iBoxx Asian Local Bond Index3 | 40.0% |
| J.P. Morgan Asian Credit Diversified Index4 | 35.0% |
| J.P. Morgan EMBI Global Diversified Index5 | 15.0% |
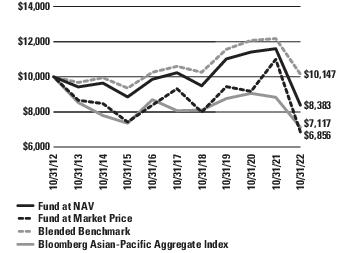
Performance of a $10,000 Investment (as of October 31, 2022)
This graph shows the change in value of a hypothetical investment of $10,000 in the Fund for the period indicated. For comparison, the same investment is shown in the indicated index.
The Fund changed its investment strategies effective June 24, 2020, following shareholder approval of the changes. Performance information for periods prior to June 24, 2020 does not reflect the current investment strategy. Please see Note 1 in the Notes to Financial Statements for details.
{foots1}
| 1 | The Bloomberg Asian-Pacific Aggregate Index contains fixed-rate, investment-grade securities denominated in Australian dollar, Chinese yuan, Hong Kong dollar, Indonesian rupiah, Japanese yen, Malaysian ringgit, New Zealand dollar, Singapore dollar, South Korean won and Thai baht. The index is composed primarily of local currency sovereign debt, but also includes government-related, corporate and securitized bonds. |
{foots1}
| 2 | The Bloomberg AusBond Composite Bond Index includes investment grade fixed interest bonds of all maturities issued in the Australian debt market under Australian law. |
{foots1}
| 3 | The Markit iBoxx Asia Local Bond Index (“iBoxx ALBI”) is designed to reflect the performance of local currency bonds from 11 Asian local currency bond markets. |
{foots1}
| 4 | The J.P. Morgan Asian Credit Diversified Index is a variant of the JP Morgan Asia Credit Index (JACI) focuses on reducing concentration risk of the JACI index to any particular market. The JACI is a broad-based securities market index which consists of liquid US dollar-denominated debt securities issued out of Asia ex-Japan region. |
{foots1}
| 5 | The J.P. Morgan EMBI Global Diversified Index is a comprehensive global local emerging markets index comprising liquid, fixed rate, domestic currency government bonds. |
| abrdn Asia-Pacific Income Fund, Inc. | 9 |
Total Investment Return (unaudited) (concluded)
abrdn Inc. (formerly known as "Aberdeen Standard Investments, Inc.") has entered into an agreement with the Fund to limit investor relations services fees, without which performance would be lower. This agreement aligns with the term of the advisory agreement and may not be terminated prior to the end of the current term of the advisory agreement. See Note 3 in the Notes to Financial Statements.
Returns represent past performance. Total investment return at NAV is based on changes in the NAV of Fund shares and assumes reinvestment of dividends and distributions, if any, at market prices pursuant to the dividend reinvestment program sponsored by the Fund’s transfer agent. All return data at NAV includes fees charged to the Fund, which are listed in the Fund’s Statement of Operations under “Expenses.” Total investment return at market value is based on changes in the market price at which the Fund’s shares traded on the NYSE American during the period and assumes reinvestment of dividends and distributions, if any, at market prices pursuant to the dividend reinvestment program sponsored by the Fund’s transfer agent. The Fund’s total investment return is based on the reported NAV on the financial reporting period ended October 31, 2022. Because the Fund’s shares trade in the stock market based on investor demand, the Fund may trade at a price higher or lower than its NAV. Therefore, returns are calculated based on both market price and NAV. Past performance is no guarantee of future results. The performance information provided does not reflect the deduction of taxes that a shareholder would pay on distributions received from the Fund. The current performance of the Fund may be lower or higher than the figures shown. The Fund’s yield, return, market price and NAV will fluctuate. Performance information current to the most recent month-end is available at www.abrdnfax.com or by calling 800-522-5465.
The net operating expense ratio based on the fiscal year ended October 31, 2022 was 3.15%. The net operating expenses excluding interest expense and distributions to Series A Mandatory Redeemable Preferred Shares based on the fiscal year ended October 31, 2022 was 1.36%.
| 10 | abrdn Asia-Pacific Income Fund, Inc. |
Portfolio Composition (as a percentage of net assets) (unaudited)
As of October 31, 2022
Quality of Investments(1)
As at October 31, 2022, 13.6% of the Fund’s investments were invested in securities where either the issue or the issuer was rated “A” or better by S&P Global Ratings (“S&P”), Moody’s Investors Service, Inc. ("Moody's") or Fitch Ratings, Inc. (“Fitch”) or, if unrated, was judged to be of equivalent quality by abrdn Asia Limited (formerly, Aberdeen Standard Investments (Asia) Limited) (the “Investment Manager”). The following table shows the ratings of securities held by the Fund as at October 31, 2022, compared with April 30, 2022 and October 31, 2021:
| Date | AAA/Aaa
% | AA/Aa
% | A
% | BBB/Baa
% | BB/Ba*
% | B*
% | CCC/CC/C*
% | NR**
% |
| October 31, 2022 | 2.4 | 3.9 | 7.3 | 32.1 | 12.3 | 6.2 | 1.5 | 34.3 |
| April 30, 2022 | 4.4 | 4.6 | 5.8 | 28.0 | 11.6 | 8.1 | 1.2 | 36.3 |
| October 31, 2021 | 7.7 | 2.8 | 5.7 | 26.7 | 11.3 | 9.6 | 0.8 | 35.4 |
| * | Below investment grade |
| ** | Not Rated |
| (1) | For financial reporting purposes, credit quality ratings shown above reflect the lowest rating assigned by either S&P, Moody’s or Fitch if ratings differ. These rating agencies are independent, nationally recognized statistical rating organizations and are widely used. Investment grade ratings are credit ratings of BBB/Baa or higher. Below investment grade ratings are credit ratings of BB/Ba or lower. Investments designated NR are not rated by these rating agencies. Unrated investments do not necessarily indicate low credit quality. Credit quality ratings are subject to change. The Investment Manager evaluates the credit quality of unrated investments based upon, but not limited to, credit ratings for similar investments. |
Geographic Composition
The table below shows the geographical composition of the Fund’s total investments as at October 31, 2022, compared with April 30, 2022 and October 31, 2021:
| Date | Asia
(including NZ)
% | Australia
% | Latin
America
% | Europe
% | Other, < 5
% |
| October 31, 2022 | 76.2 | 7.3 | 6.4 | 5.2 | 4.9 |
| April 30, 2022 | 74.8 | 11.0 | 5.2 | 4.5 | 4.5 |
| October 31, 2021 | 75.0 | 11.6 | 4.5 | 5.0 | 3.9 |
Currency Composition
The table below shows the currency composition of the Fund’s total investments as of October 31, 2022, compared with April 30, 2022 and October 31, 2021:
| Date | U.S. Dollar*
% | Asian Currencies
(including NZ Dollar)
% | Latin American
Currencies
% | Australian
Dollar
% | Other, < 5
% |
| October 31, 2022 | 57.2 | 35.2 | 6.4 | 0.9 | 0.3 |
| April 30, 2022 | 37.8 | 47.7 | 5.2 | 9.0 | 0.3 |
| October 31, 2021 | 38.8 | 46.1 | 4.4 | 10.1 | 0.6 |
| * | Includes U.S. Dollar-denominated bonds issued by foreign issuers: 51.8% of the Fund’s total investments on October 31, 2022, 50.7% of the Fund’s total investments on April 30, 2022, and 51.1% of the Fund’s total investments on October 31, 2021. |
| abrdn Asia-Pacific Income Fund, Inc. | 11 |
Portfolio Composition (as a percentage of net assets) (unaudited) (concluded)
As of October 31, 2022
Maturity Composition
The average maturity of the Fund’s total investments was 12.1 years at October 31, 2022, compared with 11.9 years at April 30, 2022, and 11.5 years at October 31, 2021. The following table shows the maturity composition of the Fund’s investments as at October 31, 2022, compared with April 30, 2022 and October 31, 2021:
| Date | Under 3 Years
% | Under 3 Years
% | 5 to 10 Years
% | 10 Years & Over
% |
| October 31, 2022 | 24.4 | 16.0 | 39.9 | 19.7 |
| April 30, 2022 | 28.0 | 15.9 | 36.3 | 19.8 |
| October 31, 2021 | 27.6 | 18.7 | 34.3 | 19.4 |
Modified Duration
As of October 31, 2022, the modified duration* of the Fund was 7.3 years.
| * | Modified duration is a measure of the sensitivity of the price of a bond to the fluctuations in interest rates. |
| 12 | abrdn Asia-Pacific Income Fund, Inc. |
Summary of Key Rates (unaudited)
The following table summarizes the movements of key interest rates and currencies from October 31, 2022 compared to April 30, 2022 and October 31, 2021.
| | | Oct–22 | Apr–22 | Oct-21 |
| Australia | 90 day Bank Bills | 3.09% | 0.70% | 0.08% |
| | 10 yr bond | 3.14% | 1.83% | 0.58% |
| | currency local per 1USD | $1.56 | $1.41 | $1.33 |
| South Korea | 90 day commercial paper | 3.96% | 1.72% | 1.12% |
| | 10 yr bond | 4.23% | 3.24% | 2.56% |
| | currency local per 1USD | ₩1,424.45 | ₩1,256.00 | ₩1,168.55 |
| Thailand | 3 months deposit rate | 0.55% | 0.38% | 0.38% |
| | 10 yr bond | 3.19% | 2.71% | 1.97% |
| | currency local per 1USD | ฿38.06 | ฿34.25 | ฿33.18 |
| Philippines | 90 day T-Bills | 3.75% | 1.25% | 1.21% |
| | 10 yr bond | 7.46% | 6.00% | 4.90% |
| | currency local per 1USD | ₱57.95 | ₱52.21 | ₱50.41 |
| Malaysia | 3-month T-Bills | 2.71% | 1.80% | 1.78% |
| | 10 yr bond | 4.37% | 4.38% | 3.58% |
| | currency local per 1USD | RM4.73 | RM4.35 | RM4.14 |
| Singapore | 3-month T-Bills | 4.05% | 1.29% | 0.40% |
| | 10 yr bond | 3.43% | 2.53% | 1.84% |
| | currency local per 1USD | S$1.42 | S$1.38 | S$1.35 |
| India | 3-month T-Bills | 6.42% | 4.04% | 3.52% |
| | 10 yr bond | 7.45% | 7.14% | 6.39% |
| | currency local per 1USD | ₹82.78 | ₹76.44 | ₹74.88 |
| Indonesia | 3 months deposit rate | 3.55% | 3.26% | 3.50% |
| | 10 yr bond | 7.51% | 6.97% | 6.03% |
| | currency local per 1USD | Rp15,597.50 | Rp14,497.00 | Rp14,167.50 |
| China Onshore | 3-month Bill Yield | 1.60% | 1.84% | 2.24% |
| | 10 yr bond | 2.64% | 2.84% | 2.97% |
| | currency local per 1USD | ¥7.30 | ¥6.59 | ¥6.40 |
| Sri Lanka | 3-month Generic Govt Yield | 31.84% | 20.33% | 7.82% |
| | 10 yr bond | 27.68% | 17.26% | 11.29% |
| | currency local per 1USD | Rs365.50 | Rs351.32 | Rs202.00 |
| USD Denominated Bonds | Indonesia (3 months) | 5.88% | 4.01% | 2.20% |
| | Sri Lanka (3 months) | 43.37% | 24.45% | 16.15% |
| abrdn Asia-Pacific Income Fund, Inc. | 13 |
Portfolio of Investments
As of October 31, 2022
| | Principal
Amount | Value |
| CORPORATE BONDS—78.8% | |
| AUSTRALIA—6.5% | | |
| Australia & New Zealand Banking Group Ltd. | | | |
| (fixed rate to 06/15/2026, variable rate thereafter), 6.75%, 06/15/2026(a)(b) | $ | 6,000,000 | $ 5,746,245 |
| 5.91%, 08/12/2032(c) | AUD | 900,000 | 559,083 |
| Emeco Pty. Ltd., 6.25%, 07/10/2026(c) | | 1,000,000 | 596,793 |
| Macquarie Bank Ltd., 3.62%, 06/03/2030(a)(c) | $ | 6,845,000 | 5,406,685 |
| Mineral Resources Ltd., 8.00%, 11/01/2027(a)(c) | | 6,850,000 | 6,738,414 |
| National Australia Bank Ltd., 3.50%, 06/09/2025(c) | | 2,000,000 | 1,921,760 |
| Qantas Airways Ltd., 5.25%, 09/09/2030(a)(c) | AUD | 2,270,000 | 1,289,774 |
| QBE Insurance Group Ltd., (fixed rate to 05/12/2025, variable rate thereafter), 5.88%, 05/12/2025(a)(b) | $ | 4,000,000 | 3,641,412 |
| Santos Finance Ltd., 4.13%, 09/14/2027(a)(c) | | 9,100,000 | 8,039,771 |
| Transurban Queensland Finance Pty Ltd., 3.25%, 08/05/2031(c) | AUD | 410,000 | 205,228 |
| Wesfarmers Ltd., 2.55%, 06/23/2031(a)(c) | | 23,600,000 | 11,577,196 |
| Westpac Banking Corp., 4.11%, 04/15/2025(c) | SGD | 250,000 | 176,207 |
| Total Australia | | 45,898,568 |
| BAHRAIN—0.4% | | |
| Oil & Gas Holding Co. BSCC, 7.50%, 10/25/2027(a)(c) | $ | 2,500,000 | 2,413,775 |
| CHINA—11.0% | | |
| Central China Real Estate Ltd. | | | |
| 7.25%, 04/24/2023(a)(c) | | 200,000 | 59,326 |
| 7.65%, 08/27/2023(a)(c) | | 1,110,000 | 168,298 |
| 7.90%, 11/07/2023(a)(c) | | 800,000 | 100,196 |
| 7.75%, 05/24/2024(a)(c) | | 3,500,000 | 479,127 |
| Central Huijin Investment Ltd., 3.02%, 03/13/2025(c) | CNY | 30,000,000 | 4,167,388 |
| China Construction Bank Corp., 3.45%, 08/10/2031(c) | | 50,000,000 | 7,009,838 |
| China Evergrande Group, 8.75%, 06/28/2025(a)(c)(d)(e) | $ | 12,500,000 | 453,125 |
| China Oil & Gas Group Ltd., 5.50%, 01/25/2023(a)(c) | | 1,000,000 | 976,300 |
| CIFI Holdings Group Co. Ltd., 5.95%, 10/20/2025(a)(c)(d) | | 1,300,000 | 86,976 |
| CMHI Finance BVI Co. Ltd., (fixed rate to 10/09/2025, variable rate thereafter), 3.88%, 10/09/2025(a)(b)(c) | | 3,405,000 | 3,185,378 |
| CNAC HK Finbridge Co. Ltd. | | | |
| 5.13%, 03/14/2028(a)(c) | | 3,320,000 | 2,942,725 |
| 3.88%, 06/19/2029(a)(c) | | 3,600,000 | 2,894,621 |
| Country Garden Holdings Co. Ltd. | | | |
| 7.25%, 04/08/2026(a)(c)(e) | | 4,161,000 | 377,755 |
| 3.30%, 01/12/2031(a)(c)(e) | | 2,522,000 | 179,385 |
| | Principal
Amount | Value |
| |
| | |
| ENN Clean Energy International Investment Ltd., 3.38%, 05/12/2026(a)(c) | $ | 4,526,000 | $ 3,683,053 |
| Gansu Provincial Highway Aviation Tourism Investment Group Co. Ltd., 3.25%, 11/03/2023(a)(c) | | 3,600,000 | 3,349,800 |
| Geely Automobile Holdings Ltd., (fixed rate to 12/09/2024, variable rate thereafter), 4.00%, 12/09/2024(a)(b)(c) | | 3,000,000 | 2,551,515 |
| GLP China Holdings Ltd., 2.95%, 03/29/2026(a)(c) | | 3,962,000 | 2,216,840 |
| Huarong Finance II Co. Ltd. | | | |
| 5.50%, 01/16/2025(a)(c) | | 6,700,000 | 5,661,500 |
| 5.00%, 11/19/2025(a)(c) | | 2,400,000 | 1,907,641 |
| Industrial & Commercial Bank of China Ltd. | | | |
| Series A, 4.15%, 11/16/2030(c) | CNY | 50,000,000 | 7,161,236 |
| Series A, 3.28%, 01/20/2032(c) | | 30,000,000 | 4,172,855 |
| Kaisa Group Holdings Ltd. | | | |
| 10.88%, 07/23/2023(a)(c)(d)(e) | $ | 4,603,000 | 287,688 |
| 9.75%, 09/28/2023(a)(c)(d)(e) | | 700,000 | 43,627 |
| 11.95%, 11/12/2023(a)(c)(d)(e) | | 3,941,000 | 246,313 |
| Lenovo Group Ltd., 6.54%, 07/27/2032(a)(c) | | 5,600,000 | 4,663,128 |
| Logan Group Co. Ltd. | | | |
| 6.50%, 07/16/2023(a)(c)(d)(e) | | 7,800,000 | 569,859 |
| 5.25%, 10/19/2025(a)(c)(d)(e) | | 7,800,000 | 597,140 |
| New Metro Global Ltd., 4.80%, 12/15/2024(a)(c) | | 2,300,000 | 559,590 |
| Shandong Iron And Steel Xinheng International Co. Ltd., 4.80%, 07/28/2024(a)(c) | | 2,040,000 | 1,892,100 |
| Shandong Iron And Steel Xinheng International Co., Ltd., 6.50%, 11/05/2023(a)(c) | | 3,754,000 | 3,678,920 |
| Shimao Group Holdings Ltd. | | | |
| 6.13%, 02/21/2024(a)(c)(d)(e) | | 4,400,000 | 264,000 |
| 5.60%, 07/15/2026(a)(c)(d)(e) | | 2,800,000 | 126,716 |
| SPIC Luxembourg Latin America Renewable Energy Investment Co. Sarl, 4.65%, 10/30/2023(a)(c) | | 2,807,000 | 2,784,853 |
| Sunac China Holdings Ltd. | | | |
| 5.95%, 04/26/2024(a)(c)(d)(e) | | 690,000 | 39,769 |
| 6.80%, 10/20/2024(a)(c)(d)(e) | | 5,714,000 | 329,337 |
| 7.00%, 07/09/2025(a)(c)(d)(e) | | 1,786,000 | 98,274 |
| Times China Holdings Ltd., 6.20%, 03/22/2026(a)(c)(d)(e) | | 7,100,000 | 398,328 |
| Wanda Properties International Co. Ltd., 7.25%, 01/29/2024(a)(c) | | 2,000,000 | 830,000 |
| Xiaomi Best Time International Ltd., 2.88%, 07/14/2031(a)(c) | | 3,180,000 | 1,998,207 |
| Yuzhou Group Holdings Co. Ltd., 8.30%, 05/27/2025(a)(c)(e) | | 7,000,000 | 201,269 |
| 14 | abrdn Asia-Pacific Income Fund, Inc. |
Portfolio of Investments (continued)
As of October 31, 2022
| | Principal
Amount | Value |
| CORPORATE BONDS (continued) | |
| CHINA (continued) | | |
| Zhenro Properties Group Ltd. | | | |
| 7.88%, 04/14/2024(a)(c)(d)(e) | $ | 4,000,000 | $ 77,237 |
| 7.10%, 09/10/2024(a)(c)(d)(e) | | 1,000,000 | 20,041 |
| 6.63%, 01/07/2026(a)(c)(d)(e) | | 10,457,000 | 313,710 |
| Zhongsheng Group Holdings Ltd., 3.00%, 01/13/2026(a)(c) | | 4,156,000 | 3,633,493 |
| Total China | | 77,438,477 |
| GERMANY—0.9% | | |
| Landwirtschaftliche Rentenbank, 4.75%, 04/08/2024(f) | AUD | 10,000,000 | 6,464,435 |
| HONG KONG—4.3% | | |
| AIA Group Ltd., 5.63%, 10/25/2027(c) | $ | 5,000,000 | 4,926,106 |
| CAS Capital No. 1 Ltd., (fixed rate to 07/12/2026, variable rate thereafter), 4.00%, 07/12/2026(a)(b)(c) | | 7,000,000 | 4,412,800 |
| Far East Horizon Ltd., 4.25%, 10/26/2026(a)(c) | | 3,670,000 | 2,723,263 |
| Hutchison Whampoa Finance CI Ltd., 7.50%, 08/01/2027(c) | | 15,500,000 | 16,877,950 |
| Hutchison Whampoa International Ltd., 7.45%, 11/24/2033(a)(c) | | 980,000 | 1,123,418 |
| Total Hong Kong | | 30,063,537 |
| INDIA—19.6% | | |
| Adani Electricity Mumbai Ltd., 3.95%, 02/12/2030(a)(c) | | 7,302,000 | 4,835,086 |
| Adani Green Energy UP Ltd. / Prayatna Developers Pvt Ltd. / Parampujya Solar Energy Pvt Ltd., 6.25%, 12/10/2024(a)(c) | | 5,230,000 | 4,727,920 |
| Adani Transmission Step-One Ltd. | | | |
| 4.00%, 08/03/2026(a)(c) | | 3,050,000 | 2,607,110 |
| 4.25%, 05/21/2036(a)(c)(g) | | 3,508,750 | 2,560,216 |
| Axis Bank Ltd. | | | |
| Series 3, 7.60%, 10/20/2023(c) | INR | 200,000,000 | 2,407,504 |
| Series 1, 8.85%, 12/05/2024(c) | | 500,000,000 | 6,147,087 |
| Axis Bank Ltd./Gift City, (fixed rate to 09/08/2026, variable rate thereafter), 4.10%, 09/08/2026(a)(b) | $ | 10,900,000 | 8,615,270 |
| Bharti Airtel International Netherlands BV, 5.35%, 05/20/2024(a)(c) | | 378,000 | 374,352 |
| CA Magnum Holdings, 5.38%, 10/31/2026(a)(c) | | 800,000 | 670,062 |
| GMR Hyderabad International Airport Ltd. | | | |
| 5.38%, 04/10/2024(a)(c) | | 4,173,000 | 3,990,640 |
| 4.75%, 02/02/2026(a)(c) | | 1,200,000 | 1,047,600 |
| Greenko Wind Projects Mauritius Ltd., 5.50%, 04/06/2025(a)(c) | | 8,206,000 | 6,986,150 |
| HDFC Bank Ltd. | | | |
| (fixed rate to 08/25/2026, variable rate thereafter), 3.70%, 08/25/2026(a)(b) | | 7,304,000 | 5,828,592 |
| Series 1, 7.95%, 09/21/2026(c) | INR | 750,000,000 | 9,106,433 |
| | Principal
Amount | Value |
| |
| | |
| Housing Development Finance Corp. Ltd. Series Q003, 7.90%, 08/24/2026(c) | INR | 100,000,000 | $ 1,204,871 |
| ICICI Bank Ltd. | | | |
| 7.60%, 10/07/2023(c) | | 100,000,000 | 1,204,459 |
| 9.15%, 08/06/2024(c) | | 250,000,000 | 3,094,138 |
| IIFL Finance Ltd. EMTN, 5.88%, 04/20/2023(a)(c) | $ | 5,732,000 | 5,581,822 |
| India Green Power Holdings, 4.00%, 02/22/2027(a)(c)(g) | | 7,072,000 | 5,304,332 |
| Indiabulls Housing Finance Ltd., 9.00%, 04/29/2026(c) | INR | 100,000,000 | 1,056,231 |
| Indian Railway Finance Corp. Ltd. Series 129, 8.45%, 12/04/2028(c) | | 50,000,000 | 635,704 |
| JSW Infrastructure Ltd., 4.95%, 01/21/2029(a)(c) | $ | 3,420,000 | 2,543,842 |
| National Highways Authority of India, 7.70%, 09/13/2029(c) | INR | 150,000,000 | 1,827,335 |
| NTPC Ltd. | | | |
| Series 60, 8.05%, 05/05/2026(c) | | 50,000,000 | 611,271 |
| Series 61-B, 8.10%, 05/27/2026(c) | | 250,000,000 | 3,061,647 |
| Periama Holdings LLC, 5.95%, 04/19/2026(a)(c) | $ | 3,280,000 | 2,661,064 |
| Power Finance Corp. Ltd. | | | |
| Series 125, 8.65%, 12/28/2024(c) | INR | 400,000,000 | 4,921,864 |
| Series 130C, 8.39%, 04/19/2025(c) | | 250,000,000 | 3,061,717 |
| 6.15%, 12/06/2028(a)(c) | $ | 7,112,000 | 6,834,513 |
| Power Grid Corp. of India Ltd. | | | |
| 8.13%, 04/25/2027(c) | INR | 150,000,000 | 1,816,437 |
| Series LIII, 8.13%, 04/25/2028(c) | | 500,000,000 | 6,178,189 |
| REC Ltd. | | | |
| 4.75%, 05/19/2023(a)(c) | $ | 3,689,000 | 3,664,837 |
| Series 180A, 8.10%, 06/25/2024(c) | INR | 150,000,000 | 1,825,496 |
| Series 123, 9.34%, 08/25/2024(c) | | 150,000,000 | 1,860,303 |
| Reliance Industries Ltd., 4.13%, 01/28/2025(a)(c) | $ | 6,200,000 | 5,961,315 |
| Shriram Transport Finance Co. Ltd., 4.40%, 03/13/2024(a)(c) | | 8,000,000 | 7,447,760 |
| State of Maharashtra India, 7.20%, 08/09/2027(c) | INR | 300,000,000 | 3,591,977 |
| UPL Corp. Ltd., 4.63%, 06/16/2030(a)(c) | $ | 3,327,000 | 2,542,150 |
| Total India | | 138,397,296 |
| INDONESIA—5.0% | | |
| Bank Mandiri Persero Tbk PT, 4.75%, 05/13/2025(a)(c) | | 2,198,000 | 2,125,443 |
| Bank Rakyat Indonesia Persero Tbk PT Series OB, 8.25%, 08/24/2024(c) | IDR | 10,000,000,000 | 654,528 |
| Bank Tabungan Negara Persero Tbk PT, 4.20%, 01/23/2025(a)(c) | $ | 7,300,000 | 6,245,150 |
| FPC Treasury Ltd., 4.50%, 04/16/2023(a)(c) | | 5,326,000 | 5,247,708 |
| Hutama Karya Persero PT, 3.75%, 05/11/2030(a)(c)(f) | | 3,766,000 | 3,247,734 |
| abrdn Asia-Pacific Income Fund, Inc. | 15 |
Portfolio of Investments (continued)
As of October 31, 2022
| | Principal
Amount | Value |
| CORPORATE BONDS (continued) | |
| INDONESIA (continued) | | |
| LLPL Capital Pte Ltd., 6.88%, 02/04/2039(a)(c)(g) | $ | 5,225,850 | $ 4,018,830 |
| Medco Oak Tree Pte Ltd., 7.38%, 05/14/2026(a)(c) | | 4,565,000 | 4,054,123 |
| Perusahaan Perseroan Persero PT Perusahaan Listrik Negara | | | |
| Series OB, 8.25%, 07/05/2023(c) | IDR | 12,000,000,000 | 783,042 |
| 6.15%, 05/21/2048(a)(c) | $ | 3,129,000 | 2,464,088 |
| Tower Bersama Infrastructure Tbk PT, 2.75%, 01/20/2026(a)(c) | | 7,181,000 | 6,049,992 |
| Total Indonesia | | 34,890,638 |
| KAZAKHSTAN—0.8% | | |
| Development Bank of Kazakhstan JSC, 10.95%, 05/06/2026(a)(c) | KZT | 3,265,000,000 | 5,446,620 |
| KUWAIT—0.9% | | |
| MEGlobal Canada ULC, 5.00%, 05/18/2025(a)(c) | $ | 6,759,000 | 6,530,884 |
| MACAO—1.5% | | |
| MGM China Holdings Ltd., 5.88%, 05/15/2026(a)(c) | | 3,500,000 | 2,684,920 |
| Sands China Ltd., 5.63%, 08/08/2025(c) | | 4,900,000 | 4,326,504 |
| Wynn Macau Ltd., 5.50%, 10/01/2027(a)(c) | | 6,000,000 | 3,868,620 |
| Total Macao | | 10,880,044 |
| MALAYSIA—2.4% | | |
| CIMB Group Holdings Bhd, 4.95%, 03/29/2028(c) | MYR | 5,000,000 | 1,065,582 |
| DRB-Hicom Bhd IMTN, 5.10%, 12/12/2029(c) | | 5,000,000 | 1,028,736 |
| Malayan Banking Bhd, (fixed rate to 09/25/2024, variable rate thereafter) IMTN, 4.08%, 09/25/2024(b)(c)(e) | | 5,000,000 | 1,055,351 |
| Pengerang LNG Two Sdn Bhd | | | |
| IMTN, 2.86%, 10/20/2028(c) | | 5,000,000 | 960,078 |
| IMTN, 2.92%, 10/19/2029(c) | | 5,000,000 | 943,401 |
| Petroleum Sarawak Exploration & Production Sdn Bhd IMTN, 4.10%, 03/19/2031(c) | | 10,000,000 | 2,029,586 |
| Petronas Capital Ltd., 3.50%, 04/21/2030(a)(c) | $ | 2,600,000 | 2,309,698 |
| Press Metal Aluminium Holdings Bhd IMTN, 4.00%, 08/15/2025(c) | MYR | 5,000,000 | 1,043,708 |
| TNB Global Ventures Capital Bhd, 3.24%, 10/19/2026(a)(c) | $ | 7,000,000 | 6,391,980 |
| Total Malaysia | | 16,828,120 |
| MEXICO—0.9% | | |
| Petroleos Mexicanos, 7.19%, 09/12/2024(a)(c) | MXN | 145,000,000 | 6,628,792 |
| NORWAY—0.6% | | |
| Kommunalbanken AS, 4.50%, 04/17/2023(a)(c) | AUD | 7,000,000 | 4,496,183 |
| | Principal
Amount | Value |
| |
| PHILIPPINES—6.3% | | |
| AC Energy Finance International Ltd., 5.10%, 11/25/2025(a)(b)(c) | $ | 6,800,000 | $ 5,257,080 |
| Globe Telecom, Inc., (fixed rate to 08/02/2026, variable rate thereafter), 4.20%, 08/02/2026(a)(b)(c) | | 4,097,000 | 3,464,103 |
| ICTSI Treasury BV, 5.88%, 09/17/2025(a)(c) | | 7,000,000 | 6,870,080 |
| Manila Water Co., Inc., 4.38%, 07/30/2030(a)(c) | | 11,000,000 | 9,300,500 |
| Megaworld Corp., 4.25%, 04/17/2023(a)(c) | | 13,086,000 | 12,885,784 |
| Royal Capital BV, (fixed rate to 05/05/2024, variable rate thereafter), 4.88%, 05/05/2024(a)(b)(c) | | 7,000,000 | 6,562,500 |
| Total Philippines | | 44,340,047 |
| REPUBLIC OF KOREA—3.8% | | |
| Busan Bank Co. Ltd., 3.63%, 07/25/2026(a)(c) | | 11,400,000 | 10,320,064 |
| Hanwha Total Petrochemical Co. Ltd., 3.88%, 01/23/2024(a)(c) | | 3,300,000 | 3,228,423 |
| Kookmin Bank, 2.50%, 11/04/2030(a)(c) | | 2,000,000 | 1,512,600 |
| Kyobo Life Insurance Co. Ltd., (fixed rate to 06/15/2027, variable rate thereafter), 5.90%, 06/15/2052(a)(c) | | 2,155,000 | 1,961,050 |
| Shinhan Bank Co. Ltd., 4.50%, 03/26/2028(a)(c) | | 5,900,000 | 5,358,369 |
| SK Hynix, Inc., 2.38%, 01/19/2031(a)(c) | | 2,071,000 | 1,492,342 |
| Tongyang Life Insurance Co. Ltd., (fixed rate to 09/22/2025, variable rate thereafter), 5.25%, 09/22/2025(a)(b)(c) | | 3,650,000 | 2,947,375 |
| Total Republic of Korea | | 26,820,223 |
| SAUDI ARABIA—0.4% | | |
| Saudi Electricity Global Sukuk Co. 3, 5.50%, 04/08/2044(a)(c) | | 2,976,000 | 2,752,800 |
| SINGAPORE—2.1% | | |
| DBS Group Holdings Ltd. | | | |
| (fixed rate to 02/27/2025, variable rate thereafter), 3.30%, 02/27/2025(a)(b)(c) | | 4,300,000 | 3,771,100 |
| (fixed rate to 12/11/2023, variable rate thereafter), 4.52%, 12/11/2028(a)(c) | | 2,400,000 | 2,364,289 |
| GLP Pte Ltd., (fixed rate to 05/17/2026, variable rate thereafter), 4.50%, 05/17/2026(a)(b)(c) | | 4,538,000 | 2,042,100 |
| Vena Energy Capital Pte Ltd., 3.13%, 02/26/2025(a)(c) | | 7,000,000 | 6,404,998 |
| Total Singapore | | 14,582,487 |
| SOUTH KOREA—0.7% | | |
| SK Hynix, Inc. REGS, 2.38%, 01/19/2031(a)(c) | | 7,000,000 | 5,044,132 |
| 16 | abrdn Asia-Pacific Income Fund, Inc. |
Portfolio of Investments (continued)
As of October 31, 2022
| | Principal
Amount | Value |
| CORPORATE BONDS (continued) | |
| TAIWAN—0.2% | | |
| TSMC Arizona Corp., 2.50%, 10/25/2031(c) | $ | 2,191,000 | $ 1,701,733 |
| THAILAND—3.7% | | |
| Bangkok Bank PCL | | | |
| 9.03%, 03/15/2029(a)(c) | | 1,200,000 | 1,311,757 |
| (fixed rate to 09/25/2029, variable rate thereafter), 3.73%, 09/25/2034(a)(c) | | 6,900,000 | 5,122,433 |
| GC Treasury Center Co. Ltd., 4.40%, 03/30/2032(a)(c) | | 4,209,000 | 3,380,248 |
| Krung Thai Bank PCL, (fixed rate to 03/25/2026, variable rate thereafter), 4.40%, 03/25/2026(a)(b)(c) | | 7,000,000 | 5,559,400 |
| Minor International PCL, (fixed rate to 06/29/2023, variable rate thereafter), 3.10%, 06/29/2023(a)(b)(c) | | 5,800,000 | 5,626,000 |
| PTTEP Treasury Center Co. Ltd., 3.90%, 12/06/2059(a)(c) | | 3,342,000 | 2,028,691 |
| TMBThanachart Bank PCL, (fixed rate to 12/02/2024, variable rate thereafter), 4.90%, 12/02/2024(a)(b)(c) | | 3,800,000 | 3,314,279 |
| Total Thailand | | 26,342,808 |
| UNITED ARAB EMIRATES—2.7% | | |
| DP World Ltd., 6.85%, 07/02/2037(a)(c) | | 2,700,000 | 2,588,749 |
| Esic Sukuk Ltd. EMTN, 3.94%, 07/30/2024(a)(c) | | 5,332,000 | 5,022,744 |
| Galaxy Pipeline Assets Bidco Ltd., 2.63%, 03/31/2036(a)(c)(g) | | 7,237,000 | 5,496,333 |
| MAF Global Securities Ltd., (fixed rate to 03/20/2026, variable rate thereafter), 6.38%, 03/20/2026(a)(b)(c) | | 6,500,000 | 5,959,200 |
| Total United Arab Emirates | | 19,067,026 |
| UNITED KINGDOM—2.9% | | |
| HSBC Holdings PLC, (fixed rate to 03/23/2023, variable rate thereafter), 6.25%, 03/23/2023(b) | | 6,760,000 | 6,363,188 |
| Standard Chartered PLC | | | |
| 3.95%, 01/11/2023(a)(c) | | 6,999,000 | 6,946,150 |
| (fixed rate to 04/02/2023, variable rate thereafter), 7.75%, 04/02/2023(a)(b) | | 2,759,000 | 2,726,369 |
| 4.05%, 04/12/2026(a)(c) | | 5,000,000 | 4,655,000 |
| Total United Kingdom | | 20,690,707 |
| UNITED STATES—0.8% | | |
| Hyundai Capital America, 6.38%, 04/08/2030(a)(c) | | 5,600,000 | 5,457,046 |
| VIETNAM—0.4% | | |
| Mong Duong Finance Holdings BV, 5.13%, 05/07/2029(a)(c)(g) | | 4,310,000 | 2,986,183 |
| Total Corporate Bonds | | 556,162,561 |
| | Principal
Amount | Value |
| GOVERNMENT BONDS—66.1% | |
| ANGOLA—1.5% | | |
| Angolan Government International Bond, 9.50%, 11/12/2025(a)(c) | $ | 11,000,000 | $ 10,715,980 |
| AUSTRALIA—4.3% | | |
| Australia Government Bond Series 154, 2.75%, 11/21/2029(a)(c) | AUD | 2,300,000 | 1,392,330 |
| New South Wales Treasury Corp. | | | |
| 4.00%, 05/20/2026(a)(c) | | 7,500,000 | 4,819,371 |
| 3.00%, 02/20/2030(a)(c) | | 13,500,000 | 7,949,302 |
| Queensland Treasury Corp. | | | |
| 4.25%, 07/21/2023(a)(c) | | 22,000,000 | 14,154,593 |
| 3.50%, 08/21/2030(a)(c) | | 300,000 | 182,019 |
| Treasury Corp. of Victoria, 2.25%, 11/20/2040(c) | | 5,000,000 | 2,147,722 |
| Total Australia | | 30,645,337 |
| BRAZIL—2.6% | | |
| Brazil Notas do Tesouro Nacional, 10.00%, 01/01/2029(c) | BRL | 103,000,000 | 18,498,988 |
| CHINA—5.9% | | |
| China Government Bond | | | |
| 2.68%, 05/21/2030(h) | CNY | 130,000,000 | 17,812,935 |
| 3.27%, 11/19/2030(h) | | 110,000,000 | 15,686,838 |
| 3.02%, 05/27/2031(h) | | 60,000,000 | 8,428,658 |
| Total China | | 41,928,431 |
| COLOMBIA—0.8% | | |
| Colombian TES Series B, 10.00%, 07/24/2024(c) | COP | 28,000,000,000 | 5,448,315 |
| HONG KONG—1.7% | | |
| Jordan Government International Bond, 7.75%, 01/15/2028(a)(c) | $ | 12,102,000 | 11,686,901 |
| INDIA—7.3% | | |
| India Government Bond | | | |
| 7.72%, 05/25/2025(c) | INR | 880,000,000 | 10,751,930 |
| 8.15%, 11/24/2026(c) | | 300,000,000 | 3,711,878 |
| 6.79%, 05/15/2027(c) | | 735,000,000 | 8,662,571 |
| 7.17%, 01/08/2028(c) | | 550,000,000 | 6,561,430 |
| 7.26%, 01/14/2029(c) | | 1,340,000,000 | 16,001,812 |
| 9.20%, 09/30/2030(c) | | 9,590,000 | 126,680 |
| 6.19%, 09/16/2034(c) | | 500,000,000 | 5,401,839 |
| Total India | | 51,218,140 |
| INDONESIA—16.6% | | |
| Indonesia Government International Bond | | | |
| 8.50%, 10/12/2035(a)(c) | $ | 9,880,000 | 11,561,421 |
| 7.75%, 01/17/2038(a)(c) | | 6,000,000 | 6,630,000 |
| 5.35%, 02/11/2049(c) | | 2,670,000 | 2,346,813 |
| abrdn Asia-Pacific Income Fund, Inc. | 17 |
Portfolio of Investments (continued)
As of October 31, 2022
| | Principal
Amount | Value |
| GOVERNMENT BONDS (continued) | |
| INDONESIA (continued) | | |
| Indonesia Treasury Bond | | | |
| Series FR64, 6.13%, 05/15/2028(c) | IDR | 271,570,000,000 | $ 16,400,756 |
| Series FR71, 9.00%, 03/15/2029(c) | | 200,000,000,000 | 13,816,573 |
| Series FR78, 8.25%, 05/15/2029(c) | | 240,000,000,000 | 16,007,642 |
| Series FR82, 7.00%, 09/15/2030(c) | | 65,000,000,000 | 4,035,688 |
| Series FR87, 6.50%, 02/15/2031(c) | | 21,000,000,000 | 1,257,146 |
| Series FR73, 8.75%, 05/15/2031(c) | | 300,000,000,000 | 20,666,774 |
| Series FR54, 9.50%, 07/15/2031(c) | | 16,000,000,000 | 1,153,057 |
| Series FR72, 8.25%, 05/15/2036(c) | | 150,000,000,000 | 10,001,218 |
| Series FR79, 8.38%, 04/15/2039(c) | | 98,500,000,000 | 6,670,024 |
| Series FR83, 7.50%, 04/15/2040(c) | | 44,000,000,000 | 2,776,676 |
| Perusahaan Penerbit SBSN Indonesia III, 4.15%, 03/29/2027(a)(c) | $ | 3,770,000 | 3,581,085 |
| Total Indonesia | | 116,904,873 |
| IRAQ—0.4% | | |
| Iraq International Bond, 5.80%, 01/15/2028(a)(c)(g) | | 3,437,500 | 2,920,266 |
| MALAYSIA—6.5% | | |
| Malaysia Government Bond | | | |
| 3.48%, 06/14/2024(c) | MYR | 17,450,000 | 3,692,866 |
| Series 0114, 4.18%, 07/15/2024(c) | | 20,500,000 | 4,400,526 |
| 3.90%, 11/16/2027(c) | | 48,300,000 | 10,072,614 |
| Series 0513, 3.73%, 06/15/2028(c) | | 17,500,000 | 3,584,894 |
| 2.63%, 04/15/2031(c) | | 46,000,000 | 8,419,592 |
| 3.76%, 05/22/2040(c) | | 9,793,000 | 1,788,012 |
| 4.70%, 10/15/2042(c) | | 16,500,000 | 3,434,708 |
| 4.92%, 07/06/2048(c) | | 30,500,000 | 6,392,944 |
| 4.07%, 06/15/2050(c) | | 14,800,000 | 2,707,041 |
| Malaysia Government Investment Issue, 3.45%, 07/15/2036(c) | | 8,200,000 | 1,503,803 |
| Total Malaysia | | 45,997,000 |
| MALDIVES—0.2% | | |
| Maldives Sukuk Issuance Ltd., 9.88%, 04/08/2026(c) | $ | 2,200,000 | 1,711,222 |
| MEXICO—3.1% | | |
| Mexican Bonos Series M20, 8.50%, 05/31/2029(c) | MXN | 469,000,000 | 22,153,797 |
| MONGOLIA—0.8% | | |
| Development Bank of Mongolia LLC, 7.25%, 10/23/2023(c) | $ | 6,200,000 | 5,449,800 |
| NIGERIA—1.4% | | |
| Nigeria Government International Bond, 8.75%, 01/21/2031(a)(c) | | 14,100,000 | 9,926,823 |
| | Principal
Amount | Value |
| |
| PAKISTAN—2.1% | | |
| Pakistan Global Sukuk Programme Co. Ltd., 7.95%, 01/31/2029(a)(c) | $ | 6,245,000 | $ 3,200,563 |
| Pakistan Government International Bond | | | |
| 8.25%, 04/15/2024(a)(c) | | 7,495,000 | 3,204,112 |
| 8.25%, 09/30/2025(a)(c) | | 5,209,000 | 1,849,195 |
| 6.88%, 12/05/2027(a)(c) | | 18,129,000 | 5,630,867 |
| 7.38%, 04/08/2031(a)(c) | | 2,355,000 | 730,050 |
| Total Pakistan | | 14,614,787 |
| PHILIPPINES—2.1% | | |
| Philippine Government Bond, 6.75%, 09/15/2032(c) | PHP | 481,500,000 | 7,939,662 |
| Philippine Government International Bond, 4.20%, 03/29/2047(c) | $ | 2,570,000 | 1,996,190 |
| Philippines Government Bonds, 8.00%, 09/30/2035(c) | PHP | 260,310,000 | 4,648,917 |
| Total Philippines | | 14,584,769 |
| REPUBLIC OF KOREA—2.3% | | |
| Korea Treasury Bond, 2.50%, 03/10/2052(c) | KRW | 31,500,000,000 | 16,132,312 |
| SINGAPORE—1.8% | | |
| Singapore Government Bond, 1.63%, 07/01/2031(c) | SGD | 21,000,000 | 12,839,432 |
| SOUTH KOREA—1.7% | | |
| Industrial Bank of Korea, 5.13%, 10/25/2024(c) | $ | 2,500,000 | 2,486,676 |
| Korea Treasury Bond, 3.13%, 09/10/2027(c) | KRW | 14,500,000,000 | 9,661,390 |
| Total South Korea | | 12,148,066 |
| UKRAINE—0.6% | | |
| Ukraine Government Bond, 15.84%, 02/26/2025(c)(e) | UAH | 210,000,000 | 2,503,876 |
| Ukraine Government International Bond, 7.38%, 09/25/2034(a)(c)(d)(e)(g) | $ | 10,600,000 | 1,643,000 |
| Total Ukraine | | 4,146,876 |
| URUGUAY—1.9% | | |
| Uruguay Government International Bond, 8.25%, 05/21/2031(c) | UYU | 674,024,434 | 13,735,762 |
| UZBEKISTAN—0.5% | | |
| Republic of Uzbekistan International Bond MTN, 5.38%, 02/20/2029(a)(c) | $ | 4,250,000 | 3,565,580 |
| Total Government Bonds | | 466,973,457 |
| 18 | abrdn Asia-Pacific Income Fund, Inc. |
Portfolio of Investments (continued)
As of October 31, 2022
| | Principal
Amount | Value |
| SHORT-TERM INVESTMENT—3.3% | |
| State Street Institutional U.S. Government Money Market Fund, Premier Class, 3.01%(i) | | 22,927,480 | $ 22,927,480 |
| Total Short-Term Investment | | 22,927,480 |
Total Investments
(Cost $1,328,212,057)(j)—148.2% | | 1,046,063,498 |
| Long Term Debt Securities | (315,000,000) |
| Mandatory Redeemable Preferred Stock at Liquidation Value | (50,000,000) |
| Other Assets in Excess of Liabilities—3.5% | | 24,868,929 |
| Net Assets—100.0% | | $705,932,427 |
| (a) | Denotes a security issued under Regulation S or Rule 144A. |
| (b) | Perpetual bond. This is a bond that has no maturity date, is redeemable and pays a steady stream of interest indefinitely. The maturity date presented for these instruments represents the next call/put date. |
| (c) | The maturity date presented for these instruments represents the next call/put date. |
| (d) | Security is in default. |
| (e) | Illiquid security. |
| (f) | This security is government guaranteed. |
| (g) | Sinkable security. |
| (h) | China A Shares. These shares are issued in local currency, traded in the local stock markets and are held through either a Qualified Foreign Institutional Investor (QFII) license or the Shanghai or Shenzhen Hong-Kong Stock Connect program. |
| (i) | Registered investment company advised by State Street Global Advisors. The rate shown is the 7 day yield as of October 31, 2022. |
| (j) | See accompanying Notes to Financial Statements for tax unrealized appreciation/(depreciation) of securities. |
| AUD | Australian Dollar |
| BRL | Brazilian Real |
| CNH | Chinese Yuan Renminbi Offshore |
| CNY | Chinese Yuan Renminbi |
| COP | Colombian Peso |
| EMTN | Euro Medium Term Note |
| IDR | Indonesian Rupiah |
| INR | Indian Rupee |
| KRW | South Korean Won |
| KZT | Kazakhstan Tenge |
| MTN | Medium Term Note |
| MXN | Mexican Peso |
| MYR | Malaysian Ringgit |
| PHP | Philippine Peso |
| PLC | Public Limited Company |
| SGD | Singapore Dollar |
| THB | Thai Baht |
| UAH | Ukraine Hryvna |
| USD | U.S. Dollar |
| UYU | Uruguayan Peso |
| At October 31, 2022, the Fund held the following futures contracts: |
| Futures Contracts | Number of
Contracts
Long/(Short) | Expiration
Date | Notional
Amount | Market
Value | Unrealized
Appreciation/
(Depreciation) |
| Long Contract Positions | | | | | |
| Korea Treasury Bond - 10 year | 404 | 12/20/2022 | $31,362,505 | $30,117,421 | $(1,245,084) |
| United States Treasury Note 6%—10 year | 75 | 12/20/2022 | 8,312,227 | 8,294,531 | (17,696) |
| United States Treasury Note 6%—5 year | 99 | 12/30/2022 | 11,045,980 | 10,552,781 | (493,199) |
| United States Treasury Note 6%-Ultra Bond | 271 | 12/20/2022 | 40,557,941 | 34,594,844 | (5,963,097) |
| | | | | | $(7,719,076) |
| Short Contract Positions | | | | | |
| United States Treasury Note 6%—10 year | (792) | 12/20/2022 | $(93,238,193) | $(87,590,250) | $5,647,943 |
| United States Treasury Note 6%—5 year | (114) | 12/30/2022 | (12,716,176) | (12,151,687) | 564,489 |
| | | | | | $6,212,432 |
| | | | | | $(1,506,644) |
| At October 31, 2022, the Fund held the following forward foreign currency contracts: |
Purchase Contracts
Settlement Date* | Counterparty | Amount
Purchased | Amount
Sold | Fair Value | Unrealized
Appreciation/
(Depreciation) |
| Australian Dollar/United States Dollar | | | | | |
| 12/14/2022 | Citibank N.A. | AUD | 15,925,552 | USD | 10,000,000 | $10,200,034 | $200,034 |
| Indonesian Rupiah/United States Dollar | | | | | |
| 01/19/2023 | UBS AG | IDR | 39,418,166,458 | USD | 2,508,869 | 2,515,368 | 6,499 |
| abrdn Asia-Pacific Income Fund, Inc. | 19 |
Portfolio of Investments (concluded)
As of October 31, 2022
Purchase Contracts
Settlement Date* | Counterparty | Amount
Purchased | Amount
Sold | Fair Value | Unrealized
Appreciation/
(Depreciation) |
| Malaysian Ringgit/United States Dollar | | | | | |
| 01/11/2023 | Standard Chartered Bank | MYR | 11,225,912 | USD | 2,384,433 | $2,387,070 | $2,637 |
| 01/11/2023 | Standard Chartered Bank | MYR | 25,304,335 | USD | 5,388,487 | 5,380,696 | (7,791) |
| Philippine Peso/United States Dollar | | | | | |
| 11/18/2022 | Citibank N.A. | PHP | 806,619,903 | USD | 13,765,080 | 13,868,523 | 103,443 |
| Singapore Dollar/United States Dollar | | | | | |
| 12/01/2022 | Standard Chartered Bank | SGD | 43,269,007 | USD | 30,926,669 | 30,571,757 | (354,912) |
| South Korean Won/United States Dollar | | | | | |
| 11/02/2022 | Citibank N.A. | KRW | 2,540,398,520 | USD | 1,781,810 | 1,783,424 | 1,614 |
| 11/02/2022 | Citibank N.A. | KRW | 85,745,557,535 | USD | 61,859,097 | 60,195,555 | (1,663,542) |
| 11/02/2022 | UBS AG | KRW | 3,882,788,895 | USD | 2,837,204 | 2,725,816 | (111,388) |
| 01/12/2023 | Citibank N.A. | KRW | 15,724,566,282 | USD | 11,086,129 | 11,044,386 | (41,743) |
| Thai Baht/United States Dollar | | | | | |
| 11/08/2022 | State Street Bank & Trust Co. | THB | 1,252,814,782 | USD | 35,039,065 | 32,931,669 | (2,107,396) |
| | $173,604,298 | $(3,972,545) |
Sale Contracts
Settlement Date* | Counterparty | Amount
Purchased | Amount
Sold | Fair Value | Unrealized
Appreciation/
(Depreciation) |
| United States Dollar/Australian Dollar | | | | | |
| 12/14/2022 | UBS AG | USD | 58,007,018 | AUD | 89,504,295 | $57,325,913 | $681,105 |
| United States Dollar/Chinese Yuan Renminbi Offshore | | | | | |
| 01/19/2023 | Standard Chartered Bank | USD | 2,044,265 | CNH | 14,950,813 | 2,047,960 | (3,695) |
| United States Dollar/Indian Rupee | | | | | |
| 12/16/2022 | Citibank N.A. | USD | 2,126,773 | INR | 174,541,461 | 2,098,014 | 28,759 |
| 12/16/2022 | HSBC Bank USA | USD | 3,930,283 | INR | 315,259,809 | 3,789,469 | 140,814 |
| United States Dollar/Indonesian Rupiah | | | | | |
| 01/19/2023 | UBS AG | USD | 33,242,912 | IDR | 522,297,000,000 | 33,329,030 | (86,118) |
| United States Dollar/Malaysian Ringgit | | | | | |
| 01/11/2023 | BNP Paribas S.A. | USD | 38,646,232 | MYR | 180,327,182 | 38,344,642 | 301,590 |
| United States Dollar/Philippine Peso | | | | | |
| 11/18/2022 | Citibank N.A. | USD | 18,229,348 | PHP | 1,069,270,631 | 18,384,377 | (155,029) |
| United States Dollar/Singapore Dollar | | | | | |
| 12/01/2022 | Citibank N.A. | USD | 6,327,087 | SGD | 8,889,051 | 6,280,567 | 46,520 |
| 12/01/2022 | Royal Bank of Canada (UK) | USD | 1,270,565 | SGD | 1,816,410 | 1,283,386 | (12,821) |
| United States Dollar/South Korean Won | | | | | |
| 11/02/2022 | Citibank N.A. | USD | 52,949,597 | KRW | 74,936,630,455 | 52,607,414 | 342,183 |
| 11/02/2022 | Citibank N.A. | USD | 9,331,212 | KRW | 13,349,325,600 | 9,371,565 | (40,353) |
| 11/02/2022 | UBS AG | USD | 2,730,128 | KRW | 3,882,788,895 | 2,725,816 | 4,312 |
| United States Dollar/Thai Baht | | | | | |
| 11/08/2022 | UBS AG | USD | 3,813,524 | THB | 141,324,348 | 3,714,872 | 98,652 |
| | $231,303,025 | $1,345,919 |
| Unrealized appreciation on forward foreign currency exchange contracts | $1,958,162 |
| Unrealized depreciation on forward foreign currency exchange contracts | $(4,584,788) |
| * | Certain contracts with different trade dates and like characteristics have been shown net. |
See Notes to Financial Statements.
| 20 | abrdn Asia-Pacific Income Fund, Inc. |
Statement of Assets and Liabilities
As of October 31, 2022
| Assets | |
| Investments, at value (cost $1,305,284,577) | $1,023,136,018 |
| Short-term investments, at value (cost $22,927,480) | 22,927,480 |
| Foreign currency, at value (cost $2,486,769) | 2,381,409 |
| Cash at broker for futures contracts | 5,149,531 |
| Cash at broker for forward foreign currency contracts | 1,660,000 |
| Due from broker | 81,191 |
| Interest receivable | 19,006,262 |
| Unrealized appreciation on forward foreign currency exchange contracts | 1,958,162 |
| Variation margin receivable for futures contracts | 2,551,690 |
| Prepaid expenses in connection with revolving credit facility, senior secured notes, term loans and Series A Mandatory Redeemable Preferred Shares (Note 9) | 1,631,814 |
| Prepaid expenses and other assets | 63,348 |
| Total assets | 1,080,546,905 |
| Liabilities | |
| Senior secured notes payable (Note 8) | 250,000,000 |
| Revolving credit facility payable (Note 9) | 65,000,000 |
| Unrealized depreciation on forward foreign currency exchange contracts | 4,584,788 |
| Interest payable on revolving credit facility and senior secured notes | 3,231,930 |
| Series A Mandatory Redeemable Preferred Shares ($25.00 liquidation value per share, 2,000,000 shares outstanding) (Note 7) | 50,000,000 |
| Investment management fees payable (Note 3) | 545,183 |
| Due to custodian | 327,329 |
| Dividend payable on Series A Mandatory Redeemable Preferred Shares | 246,355 |
| Administration fees payable (Note 3) | 116,680 |
| Deferred foreign capital gains tax | 26,022 |
| Investor relations fees payable (Note 3) | 20,880 |
| Other accrued expenses | 515,311 |
| Total liabilities | 374,614,478 |
| |
| Net Assets Applicable to Common Shareholders | $705,932,427 |
| Composition of Net Assets | |
| Common stock (par value $0.01 per share) (Note 5) | $2,476,958 |
| Paid-in capital in excess of par | 1,088,987,942 |
| Distributable accumulated loss | (385,532,473) |
| Net Assets Applicable to Common Shareholders | $705,932,427 |
| Net asset value per share based on 247,695,769 shares issued and outstanding | $2.85 |
See Notes to Financial Statements.
| abrdn Asia-Pacific Income Fund, Inc. | 21 |
Statement of Operations
For the Year Ended October 31, 2022
| Net Investment Income | |
| Investment Income: | |
| Interest and amortization of discount and premium and other income (net of foreign withholding taxes of $1,451,964) | $72,296,280 |
| Total investment income | 72,296,280 |
| Expenses: | |
| Investment management fee (Note 3) | 7,743,384 |
| Administration fee (Note 3) | 1,638,677 |
| Bank loan fees and expenses | 967,697 |
| Custodian’s fees and expenses | 768,246 |
| Investor relations fees and expenses (Note 3) | 255,785 |
| Legal fees and expenses | 238,561 |
| Directors' fees and expenses | 225,272 |
| Reports to shareholders and proxy solicitation | 191,705 |
| Insurance expense | 119,964 |
| Transfer agent’s fees and expenses | 110,910 |
| Independent auditors’ fees and expenses | 101,171 |
| Miscellaneous | 111,515 |
| Total operating expenses, excluding interest expense | 12,472,887 |
| Interest expense (Notes 8 & 9) | 14,408,636 |
| Distributions to Series A Mandatory Redeemable Preferred Shares (Note 7) | 2,091,146 |
| Net operating expenses | 28,972,669 |
| |
| Net investment income applicable to common shareholders | 43,323,611 |
| Net Realized/Unrealized Gain/(Loss) from Investments and Foreign Currency Related Transactions: | |
| Net realized gain/(loss) from: | |
| Investment transactions (including $84,726 capital gains tax) | (45,792,263) |
| Futures contracts | 2,390,340 |
| Interest rate swaps | 12,366,408 |
| Forward foreign currency exchange contracts | (13,475,534) |
| Foreign currency transactions | (35,780,761) |
| | (80,291,810) |
| Net change in unrealized appreciation/(depreciation) on: | |
| Investments (including change in deferred capital gains tax of $571,014) | (211,187,368) |
| Interest rate swaps | (4,274,345) |
| Futures contracts | (3,925,886) |
| Forward foreign currency exchange contracts | (2,252,680) |
| Foreign currency translation | (39,103,440) |
| | (260,743,719) |
| Net realized and unrealized loss from investments, interest rate swaps, futures contracts, forward foreign currency exchange contracts and foreign currencies | (341,035,529) |
| Net Decrease in Net Assets Applicable to Common Shareholders Resulting from Operations | $(297,711,918) |
See Notes to Financial Statements.
| 22 | abrdn Asia-Pacific Income Fund, Inc. |
Statements of Changes in Net Assets
| | For the
Year Ended
October 31, 2022 | For the
Year Ended
October 31, 2021 |
| Increase/(Decrease) in Net Assets Applicable to Common Shareholders: | | |
| Operations: | | |
| Net investment income | $43,323,611 | $43,706,112 |
| Net realized loss from investments, interest rate swaps, futures contracts, forward foreign currency exchange contracts and foreign currency transactions | (80,291,810) | (17,599,227) |
| Net change in unrealized depreciation on investments, interest rate swaps, futures contracts, forward foreign currency exchange contracts and foreign currency translation | (260,743,719) | (10,830,326) |
| Net increase/(decrease) in net assets applicable to common shareholders resulting from operations | (297,711,918) | 15,276,559 |
| Distributions to Common Shareholders From: | | |
| Distributable earnings | (22,362,158) | (43,575,028) |
| Tax return of capital | (59,377,467) | (38,164,598) |
| Net decrease in net assets applicable to common shareholders from distributions | (81,739,625) | (81,739,626) |
| Change in net assets applicable to common shareholders | (379,451,543) | (66,463,067) |
| Net Assets Applicable to Common Shareholders: | | |
| Beginning of year | 1,085,383,970 | 1,151,847,037 |
| End of year | $705,932,427 | $1,085,383,970 |
See Notes to Financial Statements.
| abrdn Asia-Pacific Income Fund, Inc. | 23 |
Statement of Cash Flows
For the Year Ended October 31, 2022
| Cash flows from operating activities: | |
| Net increase (decrease) in net assets resulting from operations | $(297,711,918) |
Adjustments to reconcile net increase (decrease) in net assets resulting
from operations to net cash provided by operating activities: | |
| Investments purchased | (347,717,769) |
| Investments sold and principal repayments | 546,212,614 |
| Decrease in short-term investments, excluding foreign government | 95,573 |
| Net amortization/accretion of premium (discount) | (111,393) |
| Decrease in cash due to broker for forward foreign currency exchange contracts | (230,000) |
| Decrease in interest and dividends receivable | 4,912,953 |
| Net change unrealized (appreciation) depreciation on forward foreign currency exchange contracts | 2,252,680 |
| Decrease in prepaid expenses | 467,891 |
| Decrease in interest payable on bank loan | (1,360,058) |
| Decrease in accrued investment management fees payable | (346,682) |
| Decrease in other accrued expenses | (226,916) |
| Decrease in variation margin payable for futures contracts | (132,448) |
| Net change in unrealized depreciation of investments | 211,187,368 |
| Net change unrealized depreciation on forward foreign currency translations | 39,103,440 |
| Net realized loss on investments transactions | 45,792,263 |
| Net cash provided by operating activities | 202,187,598 |
| Cash flows from financing activities: | |
| Increase in due to custodian | 327,329 |
| Borrowings on line of credit | 75,000,000 |
| Repayment of Series B Senior Note | (100,000,000) |
| Repayment of revolving credit facility | (110,000,000) |
| Distributions paid to shareholders | (81,739,625) |
| Net cash paid (received) for swap contracts | (98,918) |
| Net cash used in financing activities | (216,511,214) |
| Effect of exchange rate on cash | (147,295) |
| Net change in cash | (14,470,911) |
| Unrestricted and restricted cash and foreign currency, beginning of year | 23,743,042 |
| Unrestricted and restricted cash and foreign currency, end of year | $9,272,131 |
| Supplemental disclosure of cash flow information: | |
| Cash paid for interest and fees on borrowing | $15,768,694 |
See Notes to Financial Statements.
| 24 | abrdn Asia-Pacific Income Fund, Inc. |
Statement of Cash Flows (concluded)
For the Year Ended October 31, 2022
| Reconciliation of unrestricted and restricted cash to the statements of assets and liabilities | | |
| | Year Ended
October 31, 2022 | Year Ended
October 31, 2021 |
| Cash | $– | $5,570,685 |
| Foreign currency, at value | 2,381,409 | 11,255,759 |
| Cash at broker for interest rate swaps | – | 4,104,161 |
| Cash at broker for futures contracts | 5,149,531 | 2,342,437 |
| Cash at broker for forward foreign currency contracts | 1,660,000 | 470,000 |
| Due from broker | 81,191 | – |
| | $9,272,131 | $23,743,042 |
Amounts listed as “–” are $0 or round to $0.
See Notes to Financial Statements.
| abrdn Asia-Pacific Income Fund, Inc. | 25 |
| | For the Fiscal Years Ended October 31, |
| | 2022 | 2021 | 2020 | 2019 | 2018 |
| PER SHARE OPERATING PERFORMANCE(a): | | | | | |
| Net asset value per common share, beginning of year | $4.38 | $4.65 | $4.88 | $4.59 | $5.43 |
| Net investment income | 0.17 | 0.18 | 0.15 | 0.18 | 0.21 |
| Net realized and unrealized gains/(losses) on investments, interest rate swaps, futures contracts and foreign currency transactions | (1.37) | (0.12) | (0.05) | 0.48 | (0.64) |
| Total from investment operations applicable to common shareholders | (1.20) | 0.06 | 0.10 | 0.66 | (0.43) |
| Distributions to common shareholders from: | | | | | |
| Net investment income | (0.09) | (0.18) | (0.07) | (0.12) | (0.25) |
| Net realized gains | – | – | (0.01) | – | – |
| Tax return of capital | (0.24) | (0.15) | (0.25) | (0.25) | (0.17) |
| Total distributions | (0.33) | (0.33) | (0.33) | (0.37) | (0.42) |
| Capital Share Transactions: | | | | | |
| Impact due to open market repurchase policy (Note 7) | – | – | – | – | 0.01 |
| Net asset value per common share, end of year | $2.85 | $4.38 | $4.65 | $4.88 | $4.59 |
| Market price, end of year | $2.37 | $4.22 | $3.80 | $4.25 | $3.93 |
| Total Investment Return Based on(b): | | | | | |
| Market price | (37.59%) | 19.87% | (2.82%) | 18.12% | (14.29%) |
| Net asset value | (27.70%) | 1.67% | 3.56% | 16.13% | (7.27%) |
| Ratio to Average Net Assets Applicable to Common Shareholders/Supplementary Data(c): | | | | | |
| Net assets applicable to common shareholders, end of year (000 omitted) | $705,932 | $1,085,384 | $1,151,847 | $1,208,154 | $1,142,604 |
| Average net assets applicable to common shareholders (000 omitted) | $919,052 | $1,165,019 | $1,145,806 | $1,194,235 | $1,290,606 |
| Net operating expenses | 3.15% | 2.57% | 2.87% | 2.84% | 2.67% |
Net operating expenses, excluding interest expense
and distributions to Series A Mandatory Redeemable Preferred
Shares | 1.36% | 1.16% | 1.32% | 1.22% | 1.17% |
| Net Investment income | 4.71% | 3.75% | 3.29% | 3.68% | 4.14% |
| Portfolio turnover | 26% | 44% | 88% | 46% | 44% |
| Leverage (senior securities) outstanding (000 omitted) | $315,000 | $450,000 | $415,000 | $531,000 | $505,000 |
| Leverage (preferred stock) outstanding (000 omitted) | $50,000 | $50,000 | $50,000 | $50,000 | $50,000 |
| Asset coverage ratio on long-term debt obligations at year end(d) | 340% | 352% | 390% | 337% | 336% |
| Asset coverage per $1,000 on long-term debt obligations at year end | $3,400 | $3,523 | $3,896 | $3,369 | $3,362
See Notes to Financial Statements. |
| 26 | abrdn Asia-Pacific Income Fund, Inc. |
Financial Highlights (concluded)
| | For the Fiscal Years Ended October 31, |
| | 2022 | 2021 | 2020 | 2019 | 2018 |
| Asset coverage ratio on total leverage at year end(e) | 293% | 317% | 348% | 308% | 306% |
| Asset coverage per $1,000 on total leverage at year end | $2,934 | $3,171 | $3,477 | $3,079 | $3,059 |
| (a) | Based on average shares outstanding. |
| (b) | Total investment return based on market value is calculated assuming that shares of the Fund’s common stock were purchased at the closing market price as of the beginning of the period, dividends, capital gains and other distributions were reinvested as provided for in the Fund’s dividend reinvestment plan and then sold at the closing market price per share on the last day of the period. The computation does not reflect any sales commission investors may incur in purchasing or selling shares of the Fund. The total investment return based on the net asset value is similarly computed except that the Fund’s net asset value is substituted for the closing market value. |
| (c) | Ratios calculated on the basis of income, expenses and preferred share dividends applicable to both the common and preferred shares relative to the average net assets of common shareholders. For the fiscal years ended October 31, 2022, 2021, 2020, 2019, 2018, the ratios of net investment income before preferred stock dividends to average net assets of common shareholders were 4.91, 3.93%, 3.47%, 3.85% and 4.30% respectively. |
| (d) | Asset coverage ratio is calculated by dividing net assets plus the amount of any borrowings, including Series A Mandatory Redeemable Preferred Shares, for investment purposes by the amount of any long-term debt obligations, which includes the senior secured notes and revolving credit facility. |
| (e) | Asset coverage ratio is calculated by dividing net assets plus the amount of any borrowings for investment purposes by the amount of any borrowings. |
Amounts listed as “–” are $0 or round to $0.
See Notes to Financial Statements.
| abrdn Asia-Pacific Income Fund, Inc. | 27 |
Notes to Financial Statements
October 31, 2022
1. Organization
abrdn Asia-Pacific Income Fund, Inc. (formerly, Aberdeen Asia-Pacific Income Fund, Inc.) (the “Fund”) was incorporated in Maryland on March 14, 1986 as a closed-end, non-diversified management investment company. The Fund’s principal investment objective is to seek current income. The Fund may also achieve incidental capital appreciation. To achieve its investment objectives, the Fund normally invests at least 80% of its total assets, plus the amount of any borrowings for investment purposes, in "Asia-Pacific debt securities,” which include: (1) debt securities of Asia-Pacific Country issuers, including securities issued by Asia-Pacific Country governmental entities, as well as by banks, companies and other entities which are located in Asia-Pacific Countries, whether or not denominated in an Asia-Pacific Country currency; (2) debt securities of other issuers, denominated in, or linked to, the currency of an Asia-Pacific Country, including securities issued by supranational issuers, such as The World Bank and derivative debt securities that replicate, or substitute for, the currency of an Asia-Pacific Country; (3) debt securities issued by entities which, although not located in an Asia-Pacific Country, derive at least 50% of their revenues from Asia-Pacific Countries or have at least 50% of their assets located in Asia-Pacific Countries; and (4) debt securities issued by a wholly-owned subsidiary of an entity located in an Asia-Pacific Country, provided that the debt securities are guaranteed by the parent entity located in the Asia-Pacific Country (the “80% Policy”). With reference to items (3) and (4) above, Asia-Pacific debt securities may be denominated in an Asia-Pacific Country currency or U.S. dollars. “Asia-Pacific Countries” (each, an “Asia-Pacific Country”) means countries included in “Asia” and “Oceania” in the United Nations (“UN”) geographic regions used by the UN Statistics Division. The 80% Policy, which went into effect on June 24, 2020, is fundamental and may not be changed without a vote of shareholders. There can be no assurance that the Fund will achieve its investment objectives. The ability of issuers of debt securities held by the Fund to meet their obligations may be affected by economic developments in a specific industry, country or region.
Prior to June 24, 2020, the Fund normally invested up to 80% of its total assets, plus the amount of any borrowings for investment purposes, in Asian debt securities, Australian debt securities and New Zealand debt securities (the “prior 80% policy”). Under the prior 80% policy “Asian debt securities” included: (1) debt securities of Asian Country (as defined below) issuers, including securities issued by Asian Country governmental entities, as well as by banks, companies and other entities which are located in Asian Countries, whether or not denominated in an Asian Country currency; (2) debt securities of other issuers denominated in, or linked to, the currency of an Asian Country, including securities issued by supranational issuers, such as The World Bank and derivative debt securities that replicate, or substitute for, the currency of an Asian Country; (3) debt securities issued by entities
which, although not located in an Asian Country, derive at least 50% of their revenues from Asian Countries or have at least 50% of their assets located in Asian Countries; and (4) debt securities issued by a wholly-owned subsidiary of an entity located in an Asian Country, provided that the debt securities are guaranteed by the parent entity located in the Asian Country. With reference to items (3) and (4) above, Asian debt securities may be denominated in an Asian Country currency or in Australian, New Zealand or U.S. Dollars.
Additionally, prior to June 24, 2020, the maximum country exposure to any one Asian Country (other than Korea) was limited to 20% of the Fund’s total assets and the maximum currency exposure to any one Asian Country currency (other than Korea) was limited to 10% of the Fund’s total assets. Also, prior to June 24, 2020, the maximum country exposure for Korea was limited to 40% of the Fund’s total assets, and the maximum currency exposure for Korea was limited to 25% of the Fund’s total assets. Although the Fund eliminated these fundamental country limits, it replaced them with non-fundamental country limits. Effective June 24, 2020, the maximum exposure to any one “Investment Grade Country” (other than the U.S.) is limited to 25% of the Fund's total assets and the maximum exposure to any one “Non-Investment Grade Country” is limited to 15% of the Fund's total assets. Investment Grade Countries are those countries whose sovereign debt is rated not less than Baa3 by Moody’s Investors Service, Inc. (“Moody’s”), BBB- by S& P Global Ratings (“S&P”) or BBB- by Fitch Ratings, Inc. ("Fitch") or comparably rated by another appropriate nationally or internationally recognized ratings agency. Non-Investment Grade Countries are those that are not Investment Grade Countries.
2. Summary of Significant Accounting Policies
The Fund is an investment company and accordingly follows the investment company accounting and reporting guidance of the Financial Accounting Standards Board (“FASB”) Accounting Standard Codification Topic 946 Financial Services-Investment Companies.
The following is a summary of significant accounting policies followed by the Fund in the preparation of its financial statements. The policies conform to generally accepted accounting principles (“GAAP”) in the United States of America. The preparation of financial statements requires management to make estimates and assumptions that affect the reported amounts of assets and liabilities, disclosure of contingent assets and liabilities at the date of the financial statements, and the reported amounts of income and expenses for the period. Actual results could differ from those estimates. The accounting records of the Fund are maintained in U.S. Dollars and the U.S. Dollar is used as both the functional and reporting currency. However, the Australian Dollar is the functional currency for U.S. federal tax purposes.
| 28 | abrdn Asia-Pacific Income Fund, Inc. |
Notes to Financial Statements (continued)
October 31, 2022
a. Security Valuation:
The Fund values its securities at current market value or fair value, consistent with regulatory requirements. "Fair value" is defined in the Fund's Valuation and Liquidity Procedures as the price that could be received to sell an asset or paid to transfer a liability in an orderly transaction between willing market participants without a compulsion to transact at the measurement date. Pursuant to Rule 2a-5 under the Investment Company Act of 1940, as amended (the "1940 Act"), the Board of Directors (the "Board") designated abrdn Asia Limited (formerly, Aberdeen Standard Investments (Asia) Limited) (“abrdn Asia” or the “Investment Manager”) as the valuation designee ("Valuation Designee") for the Fund to perform the fair value determinations relating to Fund investments for which market quotations are not readily available.
In accordance with the authoritative guidance on fair value measurements and disclosures under GAAP, the Fund discloses the fair value of its investments using a three-level hierarchy that classifies the inputs to valuation techniques used to measure the fair value. The hierarchy assigns Level 1, the highest level, measurements to valuations based upon unadjusted quoted prices in active markets for identical assets, Level 2 measurements to valuations based upon other significant observable inputs, including adjusted quoted prices in active markets for similar assets, and Level 3, the lowest level, measurements to valuations based upon unobservable inputs that are significant to the valuation. Inputs refer broadly to the assumptions that market participants would use in pricing the asset or liability, including assumptions about risk, for example, the risk inherent in a particular valuation technique used to measure fair value including a pricing model and/or the risk inherent in the inputs to the valuation technique. Inputs may be observable or unobservable. Observable inputs are inputs that reflect the assumptions market participants would use in pricing the asset or liability, which are based on market data obtained from sources independent of the reporting entity. Unobservable inputs are inputs that reflect the reporting entity’s own assumptions about the assumptions market participants would use in pricing the asset or liability developed based on the best information available in the circumstances. A financial instrument’s level within the fair value hierarchy is based upon the lowest level of any input that is significant to the fair value measurement.
Long-term debt and other fixed-income securities are valued at the last quoted or evaluated bid price on the valuation date provided by an independent pricing service provider. If there are no current day bids, the security is valued at the previously applied bid. Pricing services generally price debt securities assuming orderly transactions of an institutional "round lot" size and the strategies employed by the Fund's Investment Manager as Valuation Designee generally trade in round lot sizes. In certain circumstances, some trades may occur in
smaller "odd lot" sizes which may be effected at lower or higher prices than institutional round lot trades. Short-term debt securities (such as commercial paper and U.S. treasury bills) having a remaining maturity of 60 days or less are valued at amortized cost, if it represents the best approximation of fair value. Debt and other fixed-income securities are generally determined to be Level 2 investments.
Short-term investments are comprised of cash and cash equivalents invested in short-term investment funds which are redeemable daily. The Fund sweeps available cash into the State Street Institutional U.S. Government Money Market Fund, which has elected to qualify as a “government money market fund” pursuant to Rule 2a-7 under the 1940 Act and has an objective, which is not guaranteed, to maintain a $1.00 per share NAV. Generally, these investment types are categorized as Level 1 investments.
Derivatives are valued at fair value. Exchange traded derivatives are generally Level 1 investments and over-the-counter and centrally cleared derivatives are generally Level 2 investments. Forward foreign currency contracts are generally valued based on the bid price of the forward rates and the current spot rate. Forward exchange rate quotations are available for scheduled settlement dates, such as 1-, 3-, 6-, 9- and 12-month periods. An interpolated valuation is derived based on the actual settlement dates of the forward contracts held. Futures contracts are valued at the settlement price or at the last bid price if no settlement price is available. Interest rate swaps agreements are generally valued by an approved pricing agent based on the terms of the swap agreement (including future cash flows).
In the event that a security’s market quotations are not readily available or are deemed unreliable (for reasons other than because the foreign exchange on which it trades closed before the Valuation Time), the security is valued at fair value as determined by the Valuation Designee, taking into account the relevant factors and surrounding circumstances using valuation policies and procedures approved by the Board. Under normal circumstances the Valuation Time is as of the close of regular trading on the New York Stock Exchange (usually 4:00 p.m. Eastern Time). A security that has been fair valued by the Manager may be classified as Level 2 or Level 3 depending on the nature of the inputs.
The three-level hierarchy of inputs is summarized below:
Level 1 - quoted prices in active markets for identical investments;
Level 2 - other significant observable inputs (including quoted prices for similar securities, interest rates, prepayment speeds, and credit risk); or
Level 3 - significant unobservable inputs (including the Fund’s own assumptions in determining the fair value of investments).
| abrdn Asia-Pacific Income Fund, Inc. | 29 |
Notes to Financial Statements (continued)
October 31, 2022
A summary of standard inputs is listed below:
| Security Type | Standard Inputs |
| Debt and other fixed-income securities | Reported trade data, broker-dealer price quotations, benchmark yields, issuer spreads on comparable securities, credit quality, yield, and maturity. |
| Forward foreign currency contracts | Forward exchange rate quotations. |
The following is a summary of the inputs used as of October 31, 2022 in valuing the Fund's investments at fair value. The inputs or methodologies used for valuing securities are not necessarily an indication of the risk associated with investing in those securities. Please refer to the Portfolio of Investments for a detailed breakout of the security types:
| Investments, at Value | Level 1 – Quoted
Prices | Level 2 – Other Significant
Observable Inputs | Level 3 – Significant
Unobservable Inputs | Total |
| Assets | | |
| Investments in Securities | | | |
| Corporate Bonds | $– | $556,162,561 | $– | $556,162,561 |
| Government Bonds | – | 466,973,457 | – | 466,973,457 |
| Short-Term Investment | 22,927,480 | – | – | 22,927,480 |
| Total Investments | $22,927,480 | $1,023,136,018 | $– | $1,046,063,498 |
| Other Financial Instruments | | | |
| Foreign Currency Exchange Contracts | $– | $1,958,162 | $– | $1,958,162 |
| Futures Contracts | 6,212,432 | – | – | 6,212,432 |
| Total Other Financial Instruments | $6,212,432 | $1,958,162 | $– | $8,170,594 |
| Total Assets | $29,139,912 | $1,025,094,180 | $– | $1,054,234,092 |
| Liabilities | | |
| Other Financial Instruments | | | |
| Foreign Currency Exchange Contracts | $– | $(4,584,788) | $– | $(4,584,788) |
| Futures Contracts | (7,719,076) | – | – | (7,719,076) |
| Total Liabilities | $(7,719,076) | $(4,584,788) | $– | $(12,303,864) |
Amounts listed as “–” are $0 or round to $0.
For the fiscal year ended October 31, 2022, there were no significant changes to the fair valuation methodologies.
b. Restricted Securities:
Restricted securities are privately-placed securities whose resale is restricted under U.S. securities laws. The Fund may invest in restricted securities, including unregistered securities eligible for resale without registration pursuant to Rule 144A and privately-placed securities of U.S. and non-U.S. issuers offered outside the U.S. without registration pursuant to Regulation S under the Securities Act of 1933, as amended. Rule 144A securities may be freely traded among certain qualified institutional investors, such as the Fund, but resale of such securities in the U.S. is permitted only in limited circumstances.
c. Foreign Currency Translation:
Foreign securities, currencies, and other assets and liabilities denominated in foreign currencies are translated into U.S. Dollars at the exchange rate of said currencies against the U.S. Dollar, as of the Valuation Time, as provided by an independent pricing service approved by the Board.
Foreign currency amounts are translated into U.S. Dollars on the following basis:
| i) | market value of investment securities, other assets and liabilities – at the current daily rates of exchange at the Valuation Time; and |
| ii) | purchases and sales of investment securities, income and expenses – at the relevant rates of exchange prevailing on the respective dates of such transactions. |
The Fund does not isolate that portion of gains and losses on investments in equity securities due to changes in the foreign exchange rates from the portion due to changes in market prices of equity securities. Accordingly, realized and unrealized foreign currency gains and losses with respect to such securities are included in the reported net realized and unrealized gains and losses on investment transactions balances.
| 30 | abrdn Asia-Pacific Income Fund, Inc. |
Notes to Financial Statements (continued)
October 31, 2022
Net exchange gain/(loss) is realized from sales and maturities of portfolio securities, sales of foreign currencies, settlement of securities transactions, dividends, interest and foreign withholding taxes recorded on the Fund's books. Net unrealized foreign exchange appreciation/(depreciation) includes changes in the value of portfolio securities and other assets and liabilities arising as a result of changes in the exchange rate. The net realized and unrealized foreign exchange gain/(loss) shown in the composition of net assets represents foreign exchange gain/(loss) for book purposes that may not have been recognized for tax purposes.
Foreign security and currency transactions may involve certain considerations and risks not typically associated with those of domestic origin, including unanticipated movements in the value of the foreign currency relative to the U.S. Dollar. Generally, when the U.S. Dollar rises in value against foreign currency, the Fund’s investments denominated in that foreign currency will lose value because the foreign currency is worth fewer U.S. Dollars; the opposite effect occurs if the U.S. Dollar falls in relative value.
d. Derivative Financial Instruments:
The Fund is authorized to use derivatives to manage currency risk, interest rate risk and credit risk and to replicate, or use as a substitute for, physical securities. Losses may arise due to changes in the value of the contract or if the counterparty does not perform under the contract. The use of derivative instruments involves, to varying degrees, elements of market risk in excess of the amount recognized in the Statement of Assets and Liabilities.
Forward Foreign Currency Exchange Contracts
A forward foreign currency exchange contract (“forward contract”) involves an obligation to purchase and sell a specific currency at a future date, which may be any fixed number of days from the date of the contract agreed upon by the parties, at a price set at the time of the contract. Forward contracts are used to manage the Fund's currency exposure in an efficient manner. They are used to sell unwanted currency exposure that comes with holding securities in a market, or to buy currency exposure where the exposure from holding securities is insufficient to give the desired currency exposure either in absolute terms or relative to the benchmark. The use of forward contracts allows the separation of decision-making between markets and their currencies.
The forward contract is marked-to-market daily and the change in market value is recorded by the Fund as unrealized appreciation or depreciation. Forward contracts' prices are received daily from an independent pricing provider. When the forward contract is closed, the Fund records a realized gain or loss equal to the difference between the value at the time it was opened and the value at the time it was closed. These realized and unrealized gains and losses are reported on the Statement of Operations. The Fund could be exposed to risks if the
counterparties to the contracts are unable to meet the terms of their contracts or from unanticipated movements in exchange rates. These realized and unrealized gains and losses are reported on the Statements of Operations. During the fiscal year ended October 31, 2022, the Fund used forward contracts to hedge its currency exposure.
While the Fund may enter into forward contracts to seek to reduce currency exchange rate risks, transactions in such contracts involve certain risks. The Fund could be exposed to risks if the counterparties to the contracts are unable to meet the terms of their contracts and from unanticipated movements in exchange rates. Thus, while the Fund may benefit from such transactions, unanticipated changes in currency prices may result in a poorer overall performance for the Fund than if it had not engaged in any such transactions. Moreover, there may be imperfect correlation between the Fund’s portfolio holdings or securities quoted or denominated in a particular currency and forward contracts entered into by the Fund. Such imperfect correlation may prevent the Fund from achieving a complete hedge, which will expose the Fund to the risk of foreign exchange loss.
Forward contracts are subject to the risk that a counterparty to such contracts may default on their obligations. Since a forward contract is not guaranteed by an exchange or clearing house, a default on the contract would deprive the Fund of unrealized profits, transaction costs or the benefits of a currency hedge or force the Fund to cover its purchase or sale commitments, if any, at the market price at the time of the default.
Futures Contracts
The Fund may invest in financial futures contracts (“futures contracts”) for the purpose of hedging its existing portfolio securities, or securities that the Fund intends to purchase, against fluctuations in value caused by changes in prevailing market interest rates or prices.
Futures contracts may also be entered into for non-hedging purposes, however, in those instances, (a) either the aggregate initial margin and premiums required to establish the Fund's position may not exceed 5% of the Fund's NAV after taking into account unrealized profits and unrealized losses on any such contract into which it has entered into, or (b) the aggregate net notional value of the Fund’s position may not exceed 100% of the Fund's NAV after taking into account unrealized profits and unrealized losses on any such contract which it has entered into.
Upon entering into a futures contract, the Fund is required to pledge to the broker an amount of cash and/or other assets equal to a certain percentage of the contract amount. This payment is known as initial margin. Subsequent payments, known as “variation margin,” are calculated each day, depending on the daily fluctuations in the fair value/market value of the underlying assets. An unrealized gain/(loss) equal to the variation margin is recognized on a daily basis. When the
| abrdn Asia-Pacific Income Fund, Inc. | 31 |
Notes to Financial Statements (continued)
October 31, 2022
contract expires or is closed, the gain/(loss) is realized and is presented in the Statement of Operations as a net realized gain/(loss) on futures contracts. Futures contracts are valued daily at their last quoted sale price on the exchange on which they are traded.
A “sale” of a futures contract means a contractual obligation to deliver the securities or foreign currency called for by the contract at a fixed price at a specified time in the future. A “purchase” of a futures contract means a contractual obligation to acquire the securities or foreign currency at a fixed price at a specified time in the future. During the year ended October 31, 2022, the Fund used U.S. Treasury futures to efficiently manage U.S. interest rate exposure and hedge the U.S. interest rate risk.
There are significant risks associated with the Fund's use of futures contracts, including the following: (1) the success of a hedging strategy may depend on the ability of the Fund's investment manager and/or sub-adviser to predict movements in the prices of individual securities, fluctuations in markets and movements in interest rates; (2) there may be an imperfect or no correlation between the movement in the price of futures contracts, interest rates and the value/market value of the securities held by the Fund; (3) there may not be a liquid secondary market for a futures contract; (4) trading restrictions or limitations may be imposed by an exchange; and (5) government regulations may restrict trading in futures contracts. In addition, should market conditions change unexpectedly, the Fund may not achieve the anticipated benefits of the futures contracts and may realize a loss.
Swaps
A swap is an agreement that obligates two parties to exchange a series of cash flows and/or meet certain obligations at specified intervals based upon or calculated by reference to changes in specified prices or rates (interest rates in the case of interest rate swaps, currency exchange rates in the case of currency swaps) or the occurrence of a credit event with respect to an underlying reference obligation (in the case of a credit default swap) for a specified amount of an underlying asset or notional principal amount. The Fund will enter into swaps only on a net basis, which means that the two payment streams are netted out, with the Fund receiving or paying, as the case may be, only the amount of the difference between the two payments. Except for currency swaps and credit default swaps, the notional principal amount is used solely to calculate the payment streams but is not exchanged. With respect to currency swaps, actual principal amounts of currencies may be exchanged by the counterparties at the initiation, and again upon the termination of the transaction.
Traditionally, swaps were customized, privately negotiated agreements executed between two parties (“OTC Swaps”) but since 2013, certain swaps are required to be cleared pursuant to rules and regulations related to the Dodd–Frank Wall Street Reform and Consumer Protection Act (“Dodd Frank”) and/or Regulation (EU) No
648/2012 on OTC Derivatives, Central Counterparties and Trade Repositories (“EMIR”) (“Cleared Swaps”). Like OTC Swaps, Cleared Swaps are negotiated bilaterally. Unlike OTC Swaps, the act of clearing results in two swaps executed between each of the parties and a central counterparty (“CCP”), and thus the counterparty credit exposure of the parties is to the CCP rather than to one another. Upon entering into a Cleared Swap, the Fund is required to pledge an amount of cash and/or other assets equal to a certain percentage of the contract amount. This payment is known as “initial margin”. Subsequent payments, known as “variation margin,” are calculated each day, depending on the daily fluctuations in the fair value/ market value of the underlying assets. An unrealized gain or loss equal to the variation margin is recognized on a daily basis. When the contract matures or is terminated, the gain or loss is realized and is presented in the Statements of Operations as a net realized gain or loss on swap contracts. As of March 2017, the Fund may be required to provide variation and/or initial margin for OTC Swaps pursuant to further rules and regulations related to Dodd Frank and EMIR. The margin requirements associated with OTC Swaps and Cleared Swaps may not be the same.
The rights and obligations of the parties to a swap are memorialized in either an International Swap Dealers Association, Inc. Master Agreement (“ISDA”) for OTC Swaps or a futures agreement with an OTC addendum for Cleared Swaps (“Clearing Agreement”). These agreements are with certain counterparties whose creditworthiness is monitored on an ongoing basis by risk professionals. Both the ISDA and Clearing Agreement maintain provisions for general obligations, representations, agreements, collateral, and events of default or termination. The occurrence of a specified event of default or termination by one party may give the other party the right to terminate and settle all of its contracts.
Entering into swap agreements involves, to varying degrees, elements of credit, market and interest risk in excess of the amounts reported on the Statement of Assets and Liabilities. Such risks involve the possibility that there will be no liquid market for these agreements, that the counterparty to the agreements may default on its obligation to perform and that there may be unfavorable changes in the value of the index or securities underlying the agreement. The Fund's maximum risk of loss from counterparty risk related to swaps is the fair value of the contract. This risk is mitigated by the posting of collateral by the counterparties to the Fund to cover the Fund's exposure to the counterparty.
Interest Rate Swaps
The Fund may use interest rate swap contracts to manage its exposure to interest rates. Interest rate swap contracts typically represent the exchange between the Fund and a counterparty of respective commitments to make variable rate and fixed rate payments with
| 32 | abrdn Asia-Pacific Income Fund, Inc. |
Notes to Financial Statements (continued)
October 31, 2022
respect to a notional amount of principal. Interest rate swap contracts may have a term that is greater than one year, but typically require periodic interim settlement in cash, at which time the specified value of the variable interest rate is reset for the next settlement period. Net
payments of interest are recorded as realized gains or losses. During the period that the swap contract is open, the contract is marked-to-market as the net amount due to or from the Fund and changes in the value of swap contracts are recorded as unrealized gains or losses.
Summary of Derivative Instruments:
The Fund may use derivatives for various purposes as noted above. The following is a summary of the fair value of derivative instruments, not accounted for as hedging instruments, as of October 31, 2022.
| | Risk Exposure Category |
| | Interest
Rate
Contracts | Foreign
Currency
Contracts | Credit
Contracts | Equity
Contracts | Commodity
Contracts | Total |
| |
| Assets: |
| Unrealized appreciation on: |
| Forward Foreign Currency Exchange Contracts | $– | $1,958,162 | $– | $– | $– | $1,958,162 |
| Futures Contracts | 6,212,432 | – | – | – | – | 6,212,432 |
| Total | $6,212,432 | $1,958,162 | $– | $– | $– | $8,170,594 |
| Liabilities: |
| Unrealized depreciation on: |
| Forward Foreign Currency Exchange Contracts | $– | $4,584,788 | $– | $– | $– | $4,584,788 |
| Futures Contracts | 7,719,076 | – | – | – | – | 7,719,076 |
| Total | $7,719,076 | $4,584,788 | $– | $– | $– | $12,303,864 |
Amounts listed as “–” are $0 or round to $0.
The Fund has transactions that may be subject to enforceable master netting agreements. A reconciliation of the gross amounts on the Statement of Assets and Liabilities as of October 31, 2022 to the net amounts by broker and derivative type, including any collateral received or pledged, is included in the following tables:
| | |
| | | Gross Amounts Not Offset
in the Statement of
Assets and Liabilities | | Gross Amounts Not Offset
in the Statement of
Assets and Liabilities |
| | Gross Amounts
of Assets
Presented in
Statement of
Assets and
Liabilities | Financial
Instruments | Collateral
Received | Net
Amount | Gross Amounts
of Liabilities
Presented in
Statement of
Assets and
Liabilities | Financial
Instruments | Collateral
Pledged | Net
Amount |
| Description | Assets | Liabilities |
| Foreign Currency Exchange Contracts |
| BNP Paribas S.A. | $301,590 | $– | $– | $301,590 | $– | $– | $– | $– |
| Citibank N.A. | 722,553 | (722,553) | – | – | 1,900,667 | (722,553) | (1,178,114) | – |
| HSBC Bank USA | 140,814 | – | – | 140,814 | – | – | – | – |
| Royal Bank of Canada (UK) | – | – | – | – | 12,821 | – | – | 12,821 |
| Standard Chartered Bank | 2,637 | (2,637) | – | – | 366,398 | (2,637) | – | 363,761 |
| State Street Bank & Trust Co. | – | – | – | – | 2,107,396 | – | – | 2,107,396 |
| UBS AG | 790,568 | (197,506) | – | 593,062 | 197,506 | (197,506) | – | – |
Amounts listed as “–” are $0 or round to $0.
| abrdn Asia-Pacific Income Fund, Inc. | 33 |
Notes to Financial Statements (continued)
October 31, 2022
The effect of derivative instruments on the Statement of Operations for the fiscal year ended October 31, 2022:
| | Risk Exposure Category |
| | Interest
Rate
Contracts | Foreign
Currency
Contracts | Credit
Contracts | Equity
Contracts | Commodity
Contracts | Total |
| |
Realized Gain (Loss) on Derivatives Recognized
as a Result of Operations: |
| Net realized gain (loss) on: |
| Futures Contracts | $2,390,340 | $– | $– | $– | $– | $2,390,340 |
| Forward Currency Contracts | – | (13,475,534) | – | – | – | (13,475,534) |
| Swap Contracts | 12,366,408 | – | – | – | – | 12,366,408 |
| Total | $14,756,748 | $(13,475,534) | $– | $– | $– | $1,281,214 |
Net Change in Unrealized Appreciation (Depreciation) on
Derivatives Recognized as a Result of Operations: |
| Net change in unrealized appreciation (depreciation) of: |
| Futures Contracts | $(3,925,886) | $– | $– | $– | $– | $(3,925,886) |
| Forward Currency Contracts | – | (2,252,680) | – | – | – | (2,252,680) |
| Swap Contracts | (4,274,345) | – | – | – | – | (4,274,345) |
| Total | $(8,200,231) | $(2,252,680) | $– | $– | $– | $(10,452,911) |
Amounts listed as “–” are $0 or round to $0.
Information about derivatives reflected as of the date of this report is generally indicative of the type of activity during the year ended October 31, 2022. The table below summarizes the weighted average values of derivatives holdings for the Fund during the year ended October 31, 2022.
| Derivative | Average
Notional Value |
| Long Futures Contracts | $75,477,074 |
| Short Futures Contracts | $120,452,739 |
| Swap Contracts at Notional Amount | $108,333,333 |
| Foreign Currency Contracts Purchased | $330,101,794 |
| Foreign Currency Contracts Sold | $199,730,749 |
e. Bank Loans:
The Fund may invest in bank loans. Bank loans include floating and fixed-rate debt obligations. Floating rate loans are debt obligations issued by companies or other entities with floating interest rates that reset periodically. Bank loans may include, but are not limited to, term loans, delayed funding loans, bridge loans and revolving credit facilities. Loan interest will primarily take the form of assignments purchased in the primary or secondary market but may include participations. Floating rate loans are secured by specific collateral of the borrower and are senior to most other securities of the borrower (e.g., common stock or debt instruments) in the event of bankruptcy. Floating rate loans are often issued in connection with recapitalizations, acquisitions, leveraged buyouts, and refinancings. Floating
rate loans are typically structured and administered by a financial institution that acts as the agent of the lenders participating in the floating rate loan. Floating rate loans may be acquired directly through the agent, as an assignment from another lender who holds a direct interest in the floating rate loan, or as a participation interest in another lender’s portion of the floating rate loan.
The Fund may also enter into, or acquire participation in, delayed funding loans and revolving credit facilities. Delayed funding loans and revolving credit facilities are borrowings in which the Fund agrees to make loans up to a maximum amount upon demand by the borrowing issuer for a specified term. A revolving credit facility differs from a delayed funding loan in that as the borrowing issuer repays the loan, an amount equal to the repayment is again made available to the borrowing issuer under the facility. The borrowing issuer may at any time borrow and repay amounts so long as, in the aggregate, at any given time the amount borrowed does not exceed the maximum amount established by the loan agreement. Delayed funding loans and revolving credit facilities usually provide for floating or variable rates of interest.
See “Bank Loan Risk” under “Portfolio Investment Risks” for information regarding the risks associated with an investment in bank loans.
| 34 | abrdn Asia-Pacific Income Fund, Inc. |
Notes to Financial Statements (continued)
October 31, 2022
f. Security Transactions, Investment Income and Expenses:
Security transactions are recorded on the trade date. Realized and unrealized gains/(losses) from security and foreign currency transactions are calculated on the identified cost basis. Interest income and expenses are recorded on an accrual basis. Discounts and premiums on securities purchased are accreted or amortized on an effective yield basis over the estimated lives of the respective securities.
g. Distributions:
The Fund has a managed distribution policy to pay distributions from net investment income supplemented by net realized foreign exchange gains, net realized short-term capital gains, net realized long-term capital gains and return of capital distributions, if necessary, on a monthly basis. The managed distribution policy is subject to regular review by the Board. The Fund will also declare and pay distributions at least annually from net realized gains on investment transactions and net realized foreign exchange gains, if any. Dividends and distributions to shareholders are recorded on the ex-dividend date. Dividends and distributions to shareholders are determined in accordance with federal income tax regulations, which may differ from GAAP.
Distributions to Series A Mandatory Redeemable Preferred Shares (the “Series A MRPS”) shareholders are accrued daily and paid quarterly based on an annual rate of 4.125%. The Fund may not pay distributions to its preferred shareholders unless (i) the pro forma asset coverage ratios for the Series A MRPS, as calculated in accordance with the Fitch total and net overcollateralization tests per the 'A' rating guidelines outlined in Fitch's closed-end fund criteria, is in excess of 100%, and (ii) the Fund's asset coverage ratios for the Series A MRPS, as calculated in accordance with the 1940 Act, is in excess of 225%. The character of distributions to Series A MRPS shareholders made during the fiscal year may differ from their ultimate characterization for federal income tax purposes. For tax purposes, the Fund's distributions to Series A MRPS shareholders for the year ended October 31, 2022 were 100% net investment income.
h. Federal Income Taxes:
For U.S. federal income purposes, the Fund includes a separately identifiable unit called a Qualified Business Unit (“QBU”) (see Internal Revenue Code of 1986, as amended (“IRC”) section 987). The Fund has operated with a QBU for U.S. federal income purposes since 1990. The home office of the Fund is designated as the United States and of the QBU is Australia with a functional currency of Australian dollar. The securities held within the Fund reside within either the QBU or the home office. Australian dollar denominated securities within the Australian QBU generate capital gain/loss (which are translated for U.S. federal income tax purposes into U.S. Dollars based on the weighted average exchange rate for the period) but not currency
gain/loss. If a non AUD denominated security were to sit in the AUD QBU and was sold, the sale would generate capital gain/loss as well as currency gain/loss based on the currency exchange between the currency the security is denominated in and the Australian dollar.
Currency gain/loss related to currency exchange between the U.S. Dollar and the QBU functional currency is generated when money is transferred from a QBU to the home office. The currency gain/loss would result from the difference between the current exchange rate and the fiscal year to date average exchange rate until which profits are repatriated to U.S. Dollar basis in the QBU (which is generally computed based on the currency exchange rates from when money was transferred into such QBU and from gain/losses generated within such QBU based on the weighted average exchange rates for the periods such gain/loss was recognized). Based on the QBU structure, there may be sizable differences in the currency gain/loss recognized for U.S. federal income tax purposes and what is reported within the financial statements under GAAP. As of the Fund’s fiscal year-end, the calculation of the composition of distributions to shareholders is finalized and reported in the Fund’s annual report to shareholders.
The Fund intends to continue to qualify as a “regulated investment company” by complying with the provisions available to certain investment companies, as defined in Subchapter M of the IRC, and to make distributions of net investment income and net realized capital gains sufficient to relieve the Fund from all federal income taxes. Therefore, no federal income tax provision is required. The Fund recognizes the tax benefits of uncertain tax positions only where the position is "more likely than not" to be sustained assuming examination by tax authorities. Management of the Fund has concluded that there are no significant uncertain tax positions that would require recognition in the financial statements. Since tax authorities can examine previously filed tax returns, the Fund's U.S. federal and state tax returns for each of the most recent four fiscal years up to the most recent fiscal year ended October 31, 2022 are subject to such review.
i. Foreign Withholding Tax:
Dividend and interest income from non-U.S. sources received by the Fund are generally subject to non-U.S. withholding taxes. In addition, the Fund may be subject to capital gains tax in certain countries in which it invests. The above taxes may be reduced or eliminated under the terms of applicable U.S. income tax treaties with some of these countries. The Fund accrues such taxes when the related income is earned.
In addition, when the Fund sells securities within certain countries in which it invests, the capital gains realized may be subject to tax. Based on these market requirements and as required under GAAP, the Fund accrues deferred capital gains tax on securities currently held that have unrealized appreciation within these countries. The amount of
| abrdn Asia-Pacific Income Fund, Inc. | 35 |
Notes to Financial Statements (continued)
October 31, 2022
deferred capital gains tax accrued, if any, is reported on the Statement of Assets and Liabilities.
j. Cash Flow Information:
The Fund invests in securities and distributes dividends from net investment income and net realized gains on investment and currency transactions which are paid in cash or are reinvested at the discretion of shareholders. These activities are reported in the Statements of Changes in Net Assets and additional information on cash receipts and cash payments is presented in the Statement of Cash Flows. Cash includes domestic and foreign currency as well as cash in segregated accounts for financial futures, swaps, and forward contracts which has been designated as collateral.
3. Agreements and Transactions with Affiliates
a. Investment Manager, Investment Sub-Adviser, and Fund Administration:
abrdn Asia serves as Investment Manager to the Fund, pursuant to a management agreement. abrdn Investments Limited (formerly, Aberdeen Asset Managers Limited) (the "Sub-Adviser") serves as the sub-adviser pursuant to a sub-advisory agreement with the Investment Manager. The Investment Manager and the Sub-Adviser (collectively, the “Advisers”) are wholly-owned indirect subsidiaries of abrdn plc, formerly known as Standard Life Aberdeen plc. In rendering advisory services, the Advisers may use the resources of investment advisor subsidiaries of abrdn plc. These affiliates have entered into procedures pursuant to which investment professionals from affiliates may render portfolio management and research services as associated persons of the Advisers.
The Investment Manager manages the Fund’s investments and makes investment decisions on behalf of the Fund including the selection of and the placement of orders with brokers and dealers to execute portfolio transactions on behalf of the Fund. The Sub-Adviser manages the portion of the Fund’s assets that the Investment Manager allocates to it. The Sub-Adviser is paid by the Investment Manager, not the Fund.
The management agreement provides the Investment Manager with a fee, payable monthly by the Fund, at the following annual rates: 0.65% of the Fund’s average weekly Managed Assets up to $200 million, 0.60% of Managed Assets between $200 million and $500 million, 0.55% of Managed Assets between $500 million and $900 million, 0.50% of Managed Assets between $900 million and $1.75 billion and 0.45% of Managed Assets in excess of $1.75 billion. Managed Assets is defined in the management agreement to mean total assets of the Fund, including any form of investment leverage, minus all accrued expenses incurred in the normal course of operations, but not excluding any liabilities or obligations attributable to investment leverage obtained through (i) indebtedness of any type (including, without limitation, borrowing through a credit facility or
the issuance of debt securities), (ii) the issuance of preferred stock or other similar preference securities, (iii) the reinvestment of collateral received for securities loaned in accordance with the Fund’s investment objectives and policies, and/or (iv) any other means.
For the year ended October 31, 2022, the Fund paid the Investment Manager $7,743,384.
abrdn Inc. (formerly, known as Aberdeen Standard Investments, Inc.), an affiliate of the Investment Manager and Sub-Adviser, is the Fund’s Administrator pursuant to an agreement under which abrdn Inc. receives a fee payable monthly by the Fund, at an annual fee rate of 0.125% of the Fund’s average weekly Managed Assets up to $1 billion, 0.10% of the Fund’s average weekly Managed Assets between $1 billion and $2 billion, and 0.075% of the Fund’s average weekly Managed Assets in excess of $2 billion. For the fiscal year ended October 31, 2022, abrdn Inc. earned $1,638,677 from the Fund for administration fees.
b. Investor Relations:
Under the terms of the Investor Relations Services Agreement, abrdn Inc. provides and/or engages third parties to provide investor relations services to the Fund and certain other funds advised by abrdn Asia or its affiliates as part of an Investor Relations Program. Under the Investor Relations Services Agreement, the Fund owes a portion of the fees related to the Investor Relations Program (the "Fund's Portion"). However, investor relations services fees are limited by abrdn Inc. so that the Fund will only pay up to an annual rate of 0.05% of the Fund's average weekly net assets. Any difference between the capped rate of 0.05% of the Fund's average weekly net assets and the Fund's Portion is paid for by abrdn Inc.
Pursuant to the terms of the Investor Relations Services Agreement, abrdn Inc. (or third parties hired by abrdn Inc.), among other things, provides objective and timely information to stockholders based on publicly available information; provides information efficiently through the use of technology while offering stockholders immediate access to knowledgeable investor relations representatives; develops and maintains effective communications with investment professionals from a wide variety of firms; creates and maintains investor relations communication materials such as fund manager interviews, films and webcasts, publishes white papers, magazine articles and other relevant materials discussing the Fund’s investment results, portfolio positioning and outlook; develops and maintains effective communications with large institutional shareholders; responds to specific shareholder questions; and reports activities and results to the Board and management detailing insight into general shareholder sentiment.
During the fiscal year ended October 31, 2022, the Fund incurred investor relations fees of approximately $255,785. For the fiscal year
| 36 | abrdn Asia-Pacific Income Fund, Inc. |
Notes to Financial Statements (continued)
October 31, 2022
ended October 31, 2022, abrdn Inc. did not bear any portion of to the investor relations fees for the Fund because the Fund’s contribution was below 0.05% of the Fund’s average weekly net assets on an annual basis.
4. Investment Transactions
Purchases and sales of investment securities (excluding short-term securities) for the fiscal year ended October 31, 2022, were $337,781,609 and $503,402,502, respectively.
5. Capital
The authorized capital of the Fund is 400 million shares of $0.01 par value per share of common stock. During the fiscal year ended October 31, 2022, the Fund repurchased no shares pursuant to its Open Market Repurchase Program, see Note 6 for further information. As of October 31, 2022, there were 247,695,769 shares of common stock issued and outstanding.
6. Open Market Repurchase Program
The Fund’s Board approved an open market repurchase and discount management policy (the “Program”). The Program allows the Fund to purchase, in the open market, its outstanding common shares, with the amount and timing of any repurchase determined at the discretion of the Fund’s investment adviser. Such purchases may be made opportunistically at certain discounts to net asset value per share in the reasonable judgment of management based on historical discount levels and current market conditions.
On a quarterly basis, the Fund’s Board will receive information on any transactions made pursuant to this policy during the prior quarter and management will post the number of shares repurchased on the Fund’s website on a monthly basis. Under the terms of the Program, the Fund is permitted to repurchase up to 10% of its outstanding shares of common stock in the open market during any 12 month period.
For the fiscal year ended October 31, 2022, the Fund did not repurchase any shares through this program.
7. Preferred Shares
At October 31, 2022, the Fund had 2,000,000 shares of Series A MRPS, rated ‘A’ by Fitch, outstanding with an aggregate liquidation preference of $50,000,000 ($25 per share). The following table shows the mandatory redemption date, annual fixed rate, aggregate liquidation preference and estimated fair value of the Series A MRPS at October 31, 2022.
Mandatory
Redemption
Date | Annual
Fixed
Rate | Aggregate
Liquidation
Preference | Estimated
Fair
Value |
| June 27, 2023 | 4 | $50,000,000 | $49,092,762 |
Holders of the Series A MRPS are entitled to receive quarterly cumulative cash dividend payments on the first business day following each calendar quarter at an annual fixed rate of 4.125% until maturity. The Series A MRPS were issued in private placement offerings to institutional investors and are not listed on any exchange or automated quotation system. Distributions are accrued daily and paid quarterly and are presented in the Statement of Assets and Liabilities as a dividend payable to preferred shareholders. For the fiscal year ended October 31, 2022, the Fund paid $2,091,146 in distributions to preferred shareholders.
The Series A MRPS rank senior to all of the Fund’s outstanding shares of common stock and on a parity with shares of any other series of preferred stock as to the payment of dividends to which the shares are entitled and the distribution of assets upon dissolution, liquidation or winding up of the affairs of the Fund.
The estimated fair value of Series A MRPS was calculated, for disclosure purposes, by discounting future cash flows by a rate equal to the current U.S. Treasury rate with an equivalent maturity date, plus the spread between the U.S. insurance and financial debt rate and the U.S. Treasury rate plus a market spread for the issuance of preferred shares.
The Series A MRPS are redeemable in certain circumstances at the option of the Fund. The Series A MRPS are also subject to mandatory redemption, unless otherwise prohibited by the 1940 Act, if the Fund fails to maintain (1) asset coverage, as determined in accordance with Section 18(h) of the 1940 Act, of at least 225%, with respect to all outstanding preferred stock, as of the last day of any month or (2) eligible assets with an aggregate agency discounted value at least equal to the basic maintenance amount as provided in the Fund’s rating agency guidelines. As of October 31, 2022, the Fund was in compliance with the asset coverage and basic maintenance requirements of the Series A MRPS.
Except for matters which do not require the vote of the holders of the Series A MRPS under the 1940 Act and except as otherwise provided in the Fund’s Charter or Bylaws, or as otherwise required by applicable law, holders of the Series A MRPS have one vote per share and generally vote together with holders of common stock as a single class on all matters submitted to the Fund’s stockholders. The holders of the Series A MRPS, voting separately as a single class, have the right to elect at least two directors of the Fund.
8. Senior Secured Notes
At October 31, 2022, the Fund had $250,000,000 in aggregate principal amount of senior secured notes rated ‘A’ by Fitch outstanding ($50,000,000 in 3.87% Series C Senior Secured Notes due February 8, 2032, $100,000,000 in 3.70% Series D Senior Secured Notes due August 10, 2032 and $100,000,000 in 3.73% Series D Senior Secured
| abrdn Asia-Pacific Income Fund, Inc. | 37 |
Notes to Financial Statements (continued)
October 31, 2022
Notes due June 19, 2034) (collectively, the “Notes”). The Notes are secured obligations of the Fund and, upon liquidation, dissolution or winding up of the Fund, will rank senior to all unsecured and unsubordinated indebtedness and senior to any common or preferred stock pari passu in priority and security with all other secured indebtedness. Holders of the Notes are entitled to receive cash interest payments semi-annually until maturity. The Series B Notes, the Series C Notes, the Series D Notes and the Series E Notes accrue interest at annual fixed rates of 3.69%, 3.87%, 3.70% and 3.73%, respectively.
The Notes were issued in private placement offerings to institutional investors and are not listed on any exchange or automated quotation system.
The estimated fair value of each series of fixed-rate Notes was calculated, for disclosure purposes, by discounting future cash flows by a rate equal to the current U.S. Treasury rate with an equivalent maturity date, plus either 1) the spread between the interest rate on recently issued debt and the U.S. Treasury rate with a similar maturity date or 2) if there has not been a recent debt issuance, the spread between the AAA corporate finance debt rate and the U.S. Treasury rate with an equivalent maturity date. The following table shows the maturity date, interest rate, notional/carrying amount and estimated fair value for each series of Notes outstanding at October 31, 2022.
| Series | Maturity Date | Interest Rate | Notional/
Carrying Amount | Estimated Fair Value |
| Series C | February 8, 2032 | 3.87% | $50,000,000 | $42,951,111 |
| Series D | August 10, 2032 | 3.70% | $100,000,000 | $84,038,377 |
| Series E | June 19, 2034 | 3.73% | $100,000,000 | $82,207,923 |
9. Credit Facility
On August 3, 2022, the Fund executed an amendment and assignment of the $100,000,000 senior secured revolving credit loan facility (the “Revolving Credit Facility”) with a syndicate of banks with The Bank of Nova Scotia, acting as administrative agent. Between November 2021 and September 2022, the Fund paid down its entire $100,000,000 balance outstanding on its revolving credit facility. On October 26, 2022, the Fund drew down $65 million on its revolving credit facility and used the proceeds to paydown the Fund's $100,000,000 Series B Senior Secured Note. At October 31, 2022, the Fund had $65,000,000 outstanding under the Revolving Credit Facility. Under the terms of the Revolving Credit Facility and the Agreement and applicable regulations, the Fund is required to maintain certain asset coverage ratios for the amount of its outstanding borrowings.
For the fiscal year ended October 31, 2022, the average interest rate on the Revolving Credit Facility was 2.17% and the average balance of the Revolving Credit Facility was $75,533,923.
The Revolving Credit Facility has a term of one year and is not a perpetual form of leverage; there can be no assurance that the Revolving Credit Facility will be available for renewal on acceptable terms, if at all. Bank loan fees and expenses included in the Statement of Operations include fees for the renewal of the Revolving Credit Facility as well as commitment fees for any portion of the loan facility not drawn upon at any time during the period.
10. Risks of Leveraged Capital Structure
The Fund may use leverage to the maximum extent permitted by the 1940 Act, which permits leverage to exceed 33 1/3% of the Fund’s total assets (including the amount obtained through leverage) in certain market conditions.
The amounts borrowed under the Revolving Credit Facility and the Notes and other funds obtained through various forms of leverage, including the Series A MRPS, may be invested to return higher rates than the rates pursuant to which interests or dividends are paid under such forms of leverage. However, the cost of leverage could exceed the income earned by the Fund on the proceeds of such leverage. To the extent that the Fund is unable to invest the proceeds from the use of leverage in assets which pay interest at a rate which exceeds the rate paid on the leverage, the yield on the Fund’s common stock will decrease. In addition, in the event of a general market decline in the value of assets in which the Fund invests, the effect of that decline will be magnified in the Fund because of the additional assets purchased with the proceeds of the leverage.
The Fund’s leveraged capital structure creates special risks not associated with unleveraged funds having similar investment objectives and policies. The funds borrowed pursuant to the Revolving Credit Facility and the Notes may constitute a substantial lien and burden by reason of their prior claim against the income of the Fund and against the net assets of the Fund in liquidation. The Fund is limited in its ability to declare dividends or other distributions under
| 38 | abrdn Asia-Pacific Income Fund, Inc. |
Notes to Financial Statements (continued)
October 31, 2022
the terms of the various forms of leverage. In the event of an event of default under the Revolving Credit Facility, the lenders have the right to cause a liquidation of the collateral (i.e., sell portfolio securities and other assets of the Fund) and, if any such default is not cured, the lenders may be able to control the liquidation as well. In the event of an event of default under the Note Purchase Agreement, the holders of the Notes have the right to cause a liquidation of the collateral (i.e., sell portfolio securities and other assets of the Fund). If there exists an event of default under the Securities Purchase Agreement that has not been cured, the holders of the Series A MRPS have the right to cause the Fund’s outstanding borrowings to be immediately due and payable and proceed to protect and enforce their rights by an action at law, suit in equity or other appropriate proceeding. A liquidation of the Fund’s collateral assets in an event of default, or a voluntary paydown of the Revolving Credit Facility, Series A MRPS or the Notes in order to avoid an event of default, would typically involve administrative expenses and sometimes penalties. Additionally, such liquidations often involve selling off of portions of the Fund’s assets at inopportune times which can result in losses when markets are unfavorable.
Each of the Revolving Credit Facility Agreement, the Note Purchase Agreement or the Securities Purchase Agreement relating to the Series A MRPS includes usual and customary covenants for the applicable type of transaction. These covenants impose on the Fund asset coverage requirements, Fund composition requirements and limits on certain investments, such as illiquid investments, which are more stringent than those imposed on the Fund by the 1940 Act. The covenants or guidelines could impede the Investment Manager or Sub-Adviser from fully managing the Fund’s portfolio in accordance with the Fund’s investment objective and policies. Furthermore, non-compliance with such covenants or the occurrence of other events could lead to the cancellation of any and/or all of the forms of leverage. As of October 31, 2022, the Fund was in compliance with all covenants under the agreements relating to the various forms of leverage.
During the fiscal year ended October 31, 2022, the Fund incurred fees of approximately $868,122 for the Revolving Credit Facility and Notes.
11. Portfolio Investment Risks
a. Bank Loan Risk:
There are a number of risks associated with an investment in bank loans including credit risk, interest rate risk, illiquid securities risk, and prepayment risk. There is also the possibility that the collateral securing a loan, if any, may be difficult to liquidate or be insufficient to cover the amount owed under the loan. These risks could cause the Fund to lose income or principal on a particular investment, which in turn could affect the Fund’s returns. In addition, bank loans may settle on a delayed basis, resulting in the proceeds from the sale of such loans
not being readily available to make additional investments or distributions. To the extent the extended settlement process gives rise to short-term liquidity needs, the Fund may hold additional cash, sell investments or temporarily borrow from banks or other lenders.
b. Credit and Market Risk:
A debt instrument’s price depends, in part, on the credit quality of the issuer, borrower, counterparty, or underlying collateral and can decline in response to changes in the financial condition of the issuer, borrower, counterparty, or underlying collateral, or changes in specific or general market, economic, industry, political, regulatory, geopolitical, or other conditions. Funds that invest in high yield and emerging market instruments are subject to certain additional credit and market risks. The yields of high yield and emerging market debt obligations reflect, among other things, perceived credit risk. The Fund's investments in securities rated below investment grade typically involve risks not associated with higher rated securities including, among others, greater risk of not receiving timely and/or ultimate payment of interest and principal, greater market price volatility, and less liquid secondary market trading.
c. Focus Risk:
The Fund may have elements of risk not typically associated with investments in the United States due to focused investments in a limited number of countries or regions subject to foreign securities or currency risks. Such focused investments may subject the Fund to additional risks resulting from political or economic conditions in such countries or regions and the possible imposition of adverse governmental laws or currency exchange restrictions could cause the securities and their markets to be less liquid and their prices to be more volatile than those of comparable U.S. securities.
d. High-Yield Bonds and Other Lower-Rated Securities Risk:
The Fund’s investments in high-yield bonds (commonly referred to as “junk bonds”) and other lower-rated securities will subject the Fund to substantial risk of loss. Investments in high-yield bonds are speculative and issuers of these securities are generally considered to be less financially secure and less able to repay interest and principal than issuers of investment-grade securities. Prices of high-yield bonds tend to be very volatile. These securities are less liquid than investment-grade debt securities and may be difficult to price or sell, particularly in times of negative sentiment toward high-yield securities.
e. Interest Rate Risk:
The prices of fixed income securities respond to economic developments, particularly interest rate changes, as well as to perceptions about the creditworthiness of individual issuers, including governments. Generally, the Fund's fixed income securities will decrease in value if interest rates rise and vice versa, and the volatility
| abrdn Asia-Pacific Income Fund, Inc. | 39 |
Notes to Financial Statements (continued)
October 31, 2022
of lower-rated securities is even greater than that of higher-rated securities. Also, longer-term securities are generally more volatile, so the average maturity or duration of these securities affects risk.
The Fund may be subject to a greater risk of rising interest rates due to current interest rate environment and the effect of potential government fiscal policy initiatives and resulting market reaction to those initiatives.
f. LIBOR Risk:
The Fund may invest in certain debt securities, derivatives or other financial instruments that utilize LIBOR as a “benchmark” or “reference rate” for various interest rate calculations. In July 2017, the United Kingdom Financial Conduct Authority (“FCA”), which regulates LIBOR, announced a desire to phase out the use of LIBOR by the end of 2021. However, subsequent announcements by the FCA, the LIBOR administrator and other regulators indicate that it is possible that the most widely used LIBOR rates may continue until mid-2023. It is anticipated that LIBOR ultimately will be discontinued or the regulator will announce that it is no longer sufficiently robust to be representative of its underlying market around that time. Although financial regulators and industry working groups have suggested alternative reference rates, such as European Interbank Offered Rate (“EURIBOR”), Sterling Overnight Interbank Average Rate (“SONIA”) and SOFR, global consensus on alternative rates is lacking and the process for amending existing contracts or instruments to transition away from LIBOR remains unclear. The elimination of LIBOR or changes to other reference rates or any other changes or reforms to the determination or supervision of reference rates could have an adverse impact on the market for, or value of, any securities or payments linked to those reference rates, which may adversely affect the Fund’s performance and/or net asset value. Uncertainty and risk also remain regarding the willingness and ability of issuers and lenders to include revised provisions in new and existing contracts or instruments. Consequently, the transition away from LIBOR to other reference rates may lead to increased volatility and illiquidity in markets that are tied to LIBOR, fluctuations in values of LIBOR-related investments or investments in issuers that utilize LIBOR, increased difficulty in borrowing or refinancing and diminished effectiveness of hedging strategies, adversely affecting the Fund’s performance. Furthermore, the risks associated with the expected discontinuation of LIBOR and transition may be exacerbated if the work necessary to effect an orderly transition to an alternative reference rate is not completed in a timely manner.
g. Risk Associated with Foreign Securities and Currencies:
Investments in securities of foreign issuers carry certain risks not ordinarily associated with investments in securities of U.S. issuers.
These risks include future political and economic developments, and the possible imposition of exchange controls or other foreign governmental laws and restrictions. In addition, with respect to certain countries, there is the possibility of expropriation of assets, confiscatory taxation, and political or social instability or diplomatic developments, which could adversely affect investments in those countries. Foreign securities may also be harder to price than U.S. securities.
Certain countries also may impose substantial restrictions on investments in their capital markets by foreign entities, including restrictions on investments in issuers of industries deemed sensitive to relevant national interests. These factors may limit the investment opportunities available and result in a lack of liquidity and high price volatility with respect to securities of issuers from developing countries.
The value of foreign currencies relative to the U.S. Dollar fluctuates in response to market, economic, political, regulatory, geopolitical or other conditions. A decline in the value of a foreign currency versus the U.S. Dollar reduces the value in U.S. Dollars of investments denominated in that foreign currency. This risk may impact the Fund more greatly to the extent the Fund does not hedge its currency risk, or hedging techniques used by the Advisers are unsuccessful.
h. Russia/Ukraine Risk
In February 2022, Russia commenced a military attack on Ukraine. The outbreak of hostilities between the two countries and the threat of wider spread hostilities could have a severe adverse effect on the region and global economies, including significant negative impacts on the markets for certain securities and commodities, such as oil and natural gas. In addition, sanctions imposed on Russia by the United States and other countries, and any sanctions imposed in the future, could have a significant adverse impact on the Russian economy and related markets. The price and liquidity of investments may fluctuate widely as a result of the conflict and related events. How long the armed conflict and related events will last cannot be predicted. These tensions and any related events could have a significant impact on Fund performance and the value of the Fund's investments.
12. Contingencies
In the normal course of business, the Fund may provide general indemnifications pursuant to certain contracts and organizational documents. The Fund's maximum exposure under these arrangements is dependent on future claims that may be made against the Fund, and therefore, cannot be estimated; however, the Fund expects the risk of loss from such claims to be remote.
| 40 | abrdn Asia-Pacific Income Fund, Inc. |
Notes to Financial Statements (concluded)
October 31, 2022
13. Tax Information
The U.S. federal income tax basis of the Fund’s investments (including derivatives, if applicable) and the net unrealized depreciation as of October 31, 2022, were as follows:
Tax Cost of
Securities | Unrealized
Appreciation | Unrealized
Depreciation | Net
Unrealized
Appreciation/
(Depreciation) |
| $1,370,204,703 | $15,718,886 | $(341,105,176) | $(325,386,290) |
The tax character of distributions paid during the fiscal years ended October 31, 2022 and October 31, 2021 was as follows:
| | October 31, 2022 | October 31, 2021 |
| Distributions paid from: | | |
| Ordinary Income | $22,362,158 | $43,575,028 |
| Return of Capital | 59,377,467 | 38,164,598 |
| Total tax character of distributions | $81,739,625 | $81,739,626 |
As of October 31, 2022, the components of accumulated earnings on a tax basis were as follows:
| Undistributed Ordinary Income | $- |
| Undistributed Long-Term Capital Gains | - |
| Total undistributed earnings | $- |
| Capital loss carryforward | $(74,801,582)* |
| Other currency gains | — |
| Other Temporary Differences | (9,151,201) |
| Unrealized Appreciation/(Depreciation) | (301,579,690)** |
| Total accumulated earnings/(losses) – net | $(385,532,473) |
Amounts listed as “–” are $0 or round to $0.
| * | On October 31, 2022, the Fund had a net capital loss carryforward of $(74,801,582) which will be available to offset like amounts of any future taxable gains. The Fund is permitted to carry forward capital losses for an unlimited period and capital losses that are carried forward will retain their character as either short-term or long-term capital losses. The breakdown of capital loss carryforwards are as follows: |
| Amounts | Expires |
| $9,760,222 | Unlimited (Short-Term) |
| 65,041,360 | Unlimited (Long-Term) |
** The difference between book-basis and tax-basis unrealized appreciation/(depreciation) is attributable to the difference between book and tax amortization methods for premiums and discounts on fixed income securities, differing treatments for foreign currencies, the tax deferral of wash sales, the realization of unrealized gains on certain futures and forward contracts, and other timing differences.
14. Subsequent Events
Management has evaluated the need for disclosures and/or adjustments resulting from subsequent events through the date the financial statements were issued. Based on this evaluation, no disclosures and/or adjustments were required to the financial statements as of October 31, 2022, other than as noted below.
On November 9, 2022 and December 9, 2022, the Fund announced that it will pay on November 30, 2022 and January 11, 2023, a distribution of US $0.0275 per share to all shareholders of record as of November 22, 2022 and December 30, 2022, respectively.
| abrdn Asia-Pacific Income Fund, Inc. | 41 |
Report of Independent Registered Public Accounting Firm
To the Shareholders and Board of Directors
abrdn Asia-Pacific Income Fund, Inc.:
Opinion on the Financial Statements
We have audited the accompanying statement of assets and liabilities of abrdn Asia-Pacific Income Fund, Inc. (formerly, Aberdeen Asia-Pacific Income Fund, Inc.) (the Fund), including the portfolio of investments, as of October 31, 2022, the related statements of operations and cash flows for the year then ended, the statements of changes in net assets for each of the years in the two-year period then ended, and the related notes (collectively, the financial statements) and the financial highlights for each of the years in the five-year period then ended. In our opinion, the financial statements and financial highlights present fairly, in all material respects, the financial position of the Fund as of October 31, 2022, the results of its operations and its cash flows for the year then ended, the changes in its net assets for each of the years in the two-year period then ended, and the financial highlights for each of the years in the five-year period then ended, in conformity with U.S. generally accepted accounting principles.
Basis for Opinion
These financial statements and financial highlights are the responsibility of the Fund's management. Our responsibility is to express an opinion on these financial statements and financial highlights based on our audits. We are a public accounting firm registered with the Public Company Accounting Oversight Board (United States) (PCAOB) and are required to be independent with respect to the Fund in accordance with the U.S. federal securities laws and the applicable rules and regulations of the Securities and Exchange Commission and the PCAOB.
We conducted our audits in accordance with the standards of the PCAOB. Those standards require that we plan and perform the audit to obtain reasonable assurance about whether the financial statements and financial highlights are free of material misstatement, whether due to error or fraud. Our audits included performing procedures to assess the risks of material misstatement of the financial statements and financial highlights, whether due to error or fraud, and performing procedures that respond to those risks. Such procedures included examining, on a test basis, evidence regarding the amounts and disclosures in the financial statements and financial highlights. Such procedures also included confirmation of securities owned as of October 31, 2022, by correspondence with custodians and brokers; when replies were not received from brokers, we performed other auditing procedures. Our audits also included evaluating the accounting principles used and significant estimates made by management, as well as evaluating the overall presentation of the financial statements and financial highlights. We believe that our audits provide a reasonable basis for our opinion.

We have served as the auditor of one or more abrdn investment companies since 2009.
Philadelphia, Pennsylvania
December 29, 2022
| 42 | abrdn Asia-Pacific Income Fund, Inc. |
Federal Tax Information: Dividends and Distributions (Unaudited)
In early 2023, the Fund will notify applicable shareholders of final amounts for use in preparing 2022 U.S. federal income tax forms.
| abrdn Asia-Pacific Income Fund, Inc. | 43 |
Supplemental Information (Unaudited)
Board of Directors’ Consideration of Management and Sub-Advisory Agreements
At a regularly scheduled quarterly meeting (the “Quarterly Meeting”) of the Board of Directors (the “Board”) of abrdn Asia-Pacific Income Fund, Inc. (“FAX” or the “Fund”) held on June 15, 2022, the Board, including a majority of the Directors who are not considered to be “interested persons” of the Fund (the “Independent Directors”) under the Investment Company Act of 1940, as amended (the “1940 Act”), approved for an annual period the continuation of the Fund’s management agreement with abrdn Asia Limited (the “Investment Manager”) and the investment sub-advisory agreement among the Fund, the Investment Manager and abrdn Investments Limited (formerly, "Aberdeen Asset Managers Limited") (the “Sub-Adviser”). In addition, the Independent Directors of the Fund held a separate telephonic meeting on June 8, 2022 (together with the in-person Quarterly Meeting held on June 15, 2022, the “Meetings”) to review the materials provided and the relevant legal considerations. The Investment Manager and the Sub-Adviser are referred to collectively herein as the “Advisers” and the aforementioned agreements with the Advisers are referred to as the “Advisory Agreements.” The Sub-Adviser is an affiliate of the Investment Manager.
In connection with their consideration of whether to approve the continuation of the Fund’s Advisory Agreements, the Board members received and reviewed a variety of information provided by the Advisers relating to the Fund, the Advisory Agreements and the Advisers, including comparative performance, fee and expense information, and other information regarding the nature, extent and quality of services provided by the Advisers under their respective Advisory Agreements. The materials provided to the Board generally included, among other items: (i) information on the investment performance of the Fund and the performance of peer groups of funds and the Fund’s performance benchmark; (ii) information on the Fund’s advisory fees and other expenses, including information comparing the Fund’s expenses to those of a peer group of funds and information about any applicable expense limitations and fee “breakpoints”; (iii) information about the profitability of the Advisory Agreements to the Advisers; (iv) a report prepared by the Advisers in response to a request submitted by the Independent Directors’ independent legal counsel on behalf of such Directors; and (v) a memorandum from the Independent Directors’ independent legal counsel on the responsibilities of the Board in considering for approval the investment advisory and investment sub-advisory arrangements under the 1940 Act and Maryland law.
The Independent Directors were advised by separate independent legal counsel throughout the process and consulted in executive sessions with their independent legal counsel regarding their consideration of the renewal of the Advisory Agreements. The Directors also considered the recommendation of the Board’s Contract Review Committee, which consists solely of the Board’s Independent Directors, that the Advisory Agreements be renewed. In considering whether to approve the continuation of the Advisory Agreements, the Board, including the Independent Directors, did not identify any single factor as determinative. Individual Directors may have evaluated the information presented differently from one another, giving different weights to various factors. Matters considered by the Board, including the Independent Directors, in connection with its approval of the continuation of the Advisory Agreements included the factors listed below.
In addition to the materials requested by the Directors in connection with their annual consideration of the continuation of the Advisory Agreements, the Directors received and reviewed materials in advance of each regular quarterly meeting of the Board that contained information about the Fund’s investment performance and information relating to the services provided by the Advisers.
The Board, including the Fund’s Independent Directors, also considered other matters such as: (i) the Fund’s investment objective and strategies; (ii) the resources devoted to, and the record of compliance with, the Fund’s investment policies and restrictions, policies on personal securities transactions and other compliance policies; (iii) the Advisers’ investment personnel and operations; (iv) the Advisers’ financial results and financial condition; (v) the procedures employed to value the Fund’s assets; (vi) the allocation of the Fund’s brokerage, if any, including, if applicable, allocations to brokers affiliated with the Advisers and the use, if any, of “soft” commission dollars to pay Fund expenses and to pay for research and other similar services; and (vii) possible conflicts of interest. Throughout the process, the Board had the opportunity to ask questions of and request additional information from the Advisers.
Investment performance of the Fund and the Advisers. The Board received and reviewed with management, among other performance data, information that compared the Fund’s return to comparable investment companies focused on non-U.S. regions. The Board also received and considered performance information compiled by Institutional Shareholder Services Inc. (“ISS”), an independent third-party provider of investment company data as to the Fund’s total return, as compared with the funds in the Fund’s Morningstar category (the “Morningstar Group”).
In addition, the Board received and reviewed information for each of the last five fiscal years regarding the Fund’s total return on a gross and net basis and relative to the Fund’s benchmark, the impact of foreign currency movements on the Fund’s performance and the Fund’s share performance and premium/discount information. The Board also received and reviewed information on the Fund’s total return for each of the last five fiscal years as compared with the total returns of its Morningstar Group average, and other comparable abrdn-managed funds and one separate account. The Board took into account information about the Fund’s discount/premium ranking relative to its Morningstar Group and considered management’s discussion of the Fund’s performance. Additionally, the Directors considered management’s discussion of the factors contributing to differences in performance, including differences in the investment strategies of each of these other funds and accounts.
| 44 | abrdn Asia-Pacific Income Fund, Inc. |
Supplemental Information (Unaudited) (concluded)
The Board also considered the Advisers’ performance generally, the historical responsiveness of the Investment Manager to Director concerns about performance, and the willingness of the Advisers to take steps intended to improve performance.
The nature, extent and quality of the services provided to the Fund under the Advisory Agreements. The Board considered, among other things, the nature, extent and quality of the services provided by the Advisers to the Fund and the resources dedicated to the Fund by the Advisers. The Directors took into account the Advisers’ investment experience and considered the allocation of responsibilities between the Advisers. The Board also considered the Advisers’ risk management processes. The Board considered the background and experience of the Advisers’ senior management personnel and the qualifications, background and responsibilities of the portfolio managers primarily responsible for the day-to-day portfolio management services for the Fund. The Board also considered information regarding the Advisers’ compliance with applicable laws and Securities and Exchange Commission and other regulatory inquiries or audits of the Fund and the Advisers. The Board considered that they received information on a regular basis from the Fund’s Chief Compliance Officer regarding the Advisers’ compliance policies and procedures and considered the Advisers’ brokerage policies and practices. Management reported to the Board on, among other things, its business plans and organizational changes. The Directors took into account their knowledge of management and the quality of the performance of management’s duties through Board meetings, discussion and reports during the preceding year.
After reviewing these and related factors, the Board concluded that the nature, extent and quality of the services provided supported the renewal of the Advisory Agreements.
Fees and expenses. The Board reviewed with management the effective annual fee rate paid by the Fund to the Investment Manager for investment management services. The Board also received and considered information compiled at the request of the Fund by ISS that compared the Fund’s effective annual management fee rate with the fees paid by a peer group consisting of other comparable closed-end funds (each such group, a “Peer Group”). The Directors took into account the management fee structure, including that management fees for the Fund were based on the Fund’s total managed assets, whether attributable to common stock or borrowings, if any. The Directors also considered information from management about the fees charged by the Advisers to other U.S. clients investing primarily in an asset class similar to that of the Fund. The Board reviewed and considered additional information about the Sub-Adviser’s fees, including the amount of the management fees retained by the Investment Manager after payment of the advisory fees. The Board considered that the compensation paid to the Sub-Adviser was paid by the Investment Manager, and, accordingly that the retention of the Sub-Adviser did not increase the fees or expenses otherwise incurred by the Fund’s shareholders. The Board considered the fee comparisons in light of the differences in resources and costs required to manage the different types of accounts.
The Board also took into account management’s discussion of the Fund’s expenses, including the factors that impacted the Fund’s expenses.
Economies of Scale. The Board considered management’s discussion of the Fund’s management fee structure and determined that the management fee structure was reasonable. The Board based this determination on various factors, including how the Fund’s management fee compared to its Peer Group at higher asset levels and that the Fund’s management fee schedule provides breakpoints at higher asset levels.
The Directors also considered other factors, which included but were not limited to the following:
| • | the nature, quality, cost and extent of administrative services provided by abrdn Inc., an affiliate of the Investment Manager, under a separate agreement covering administrative services. |
whether the Fund has operated in accordance with its investment objective and the Fund’s record of compliance with its investment restrictions, and the compliance programs of the Advisers. The Directors also considered the compliance-related resources the Advisers and their affiliates were providing to the Fund.
so-called “fallout benefits” to the Advisers and their affiliates, including indirect benefits. The Directors considered any possible conflicts of interest associated with these fallout and other benefits, and the reporting, disclosure and other processes in place to disclose and monitor such possible conflicts of interest.
the effect of any market and economic volatility on the performance, asset levels and expense ratios of the Fund.
* * *
Based on their evaluation of all factors that they deemed to be material, including those factors described above, and assisted by the advice of independent counsel, the Directors, including the Independent Directors, concluded that renewal of the Advisory Agreements would be in the best interest of the Fund and its shareholders.
| abrdn Asia-Pacific Income Fund, Inc. | 45 |
Additional Information Regarding the Fund (Unaudited)
RECENT CHANGES
The following information is a summary of certain changes during the fiscal year ended October 31, 2022. This information may not reflect all of the changes that have occurred since you purchased the Fund.
During the applicable period, there have been: (i) no material changes to the Fund’s investment objectives and policies that constitute its principal portfolio emphasis that have not been approved by shareholders, (ii) no material changes to the Fund’s principal risks, (iii) no changes to the persons primarily responsible for day-to-day management of the Fund; and (iv) no changes to the Fund’s charter or by-laws that would delay or prevent a change of control that have not been approved by shareholders; except as follows:
Changes to Persons Primarily Responsible for Day-to-Day Management of the Fund
The Fund is managed by abrdn’s Asia-Pacific fixed income team, which also draws on the expertise of abrdn's fixed income team globally. The Asia-Pacific fixed income team works in a collaborative fashion; all team members have both portfolio management and research responsibilities. The team is responsible for the day-to-day management of the Fund.
Effective August 4, 2022, Paul Lukaszewski ceased serving as one of the portfolio managers having primary responsibility for the day-to-day management of the Fund's portfolio. As of October 31, 2022, the members of the team that are primarily responsible for the day-to-day management of the Fund's portfolio are Kenneth Akintewe, Mark Baker, Adam McCabe and Tai Li Yian.
INVESTMENT OBJECTIVES, STRATEGIES AND POLICIES
The Fund’s principal investment objective is to seek current income. The Fund may also achieve incidental capital appreciation. The Fund’s investment objective is fundamental and may not be changed without the approval of the holders of a majority of the outstanding shares of the Common Stock and the Preferred Stock, voting together as a single class, as well as by the holders of a majority of the outstanding shares of the Fund’s Preferred Stock voting as a separate class without regard to series. A majority vote, as defined by the 1940 Act, means the affirmative vote of the lesser of (i) 67% of the relevant shares represented at a meeting at which more than 50% of such shares are represented, or (ii) more than 50% of the relevant shares.
Fundamental Investment Policies
To achieve its investment objective, the Fund normally invests at least 80% of its total assets, plus the amount of any borrowings for investment purposes in “Asia-Pacific debt securities,” which include: (1) debt securities of Asia-Pacific Country issuers, including securities issued by Asia-Pacific Country governmental entities, as well as by banks, companies and other entities which are located in
Asia-Pacific Countries, whether or not denominated in an Asia-Pacific Country currency; (2) debt securities of other issuers, denominated in, or linked to, the currency of an Asia-Pacific Country, including securities issued by supranational issuers, such as The World Bank and derivative debt securities that replicate, or substitute for, the currency of an Asia-Pacific Country; (3) debt securities issued by entities which, although not located in an Asia-Pacific Country, derive at least 50% of their revenues from Asia-Pacific Countries or have at least 50% of their assets located in Asia-Pacific Countries; and (4) debt securities issued by a wholly-owned subsidiary of an entity located in an Asia-Pacific Country, provided that the debt securities are guaranteed by the parent entity located in the Asia-Pacific Country. With reference to items (3) and (4) above, Asia-Pacific debt securities may be denominated in an Asia- Pacific Country currency or U.S. dollars.
“Asia-Pacific Countries” (each, an “Asia-Pacific Country”) means countries included in “Asia” and “Oceania” in the United Nations (“UN”) geographic regions used by the UN Statistics Division.
Non-Fundamental Investment Policies
The Fund may invest up to 10% of its total assets in the debt securities of any one country other than the U.S. or an Asia-Pacific Country (“Other Country” debt securities). The maximum exposure to any one Other Country currency (excluding U.S. dollars) is limited to 10% of the Fund’s total assets.
The maximum exposure to any one Investment Grade Country (other than the U.S.) is limited to 25% of the Fund’s total assets and the maximum exposure to any one Non-Investment Grade Country is limited to 15% of total assets. Investment Grade Countries are those countries whose sovereign debt is rated not less than Baa3 by Moody’s Investors Service, Inc. (“Moody’s”), BBB- by S&P Global Ratings (“S&P”) or BBB- by Fitch or comparably rated by another appropriate nationally or internationally recognized ratings agency. Non-Investment Grade Countries are those that are not Investment Grade Countries.
The maximum currency exposure to any one Investment Grade Country currency (other than U.S. currency) is limited to 25% of the Fund’s total assets, the maximum currency exposure to any one Non- Investment Grade Country currency is limited to 15% of total assets.
During periods when, in the Investment Manager’s judgment, economic conditions warrant a temporary defensive investment policy, the Fund may temporarily invest up to 100% of its assets in U.S. cash and debt securities.
In order to accommodate investment in Asia-Pacific markets, the Fund may invest up to 35% of its total assets in Asia-Pacific debt securities rated below BBB- by S&P, Baa3 by Moody’s or BBB- by Fitch (also known as “junk bonds”), or judged by the Investment Manager to be below investment grade at the time of investment, provided
| 46 | abrdn Asia-Pacific Income Fund, Inc. |
Additional Information Regarding the Fund (Unaudited) (continued)
that, with the approval of the Fund’s Board of Directors, the ratings of other recognized rating services may be used. The Fund may invest up to 35% of its total assets in Asia-Pacific debt securities which may be deemed to be illiquid.
The Fund may invest up to 10% of its total assets in securities rated by S&P, Moody’s, Fitch, or judged by the Investment Manager to be, below B- at the time of investment, provided that, with the approval of the Fund’s Board of Directors, the ratings of other recognized ratings services may be used.
The Fund may enter into repurchase agreements with banks and broker-dealers pursuant to which the Fund may acquire a security for a relatively short period (usually no more than a week) subject to the obligations of the seller to repurchase and the Fund to resell such security at a fixed time and price. The Fund will enter into repurchase agreements only with parties who meet creditworthiness standards approved by the Fund’s Board of Directors, i.e., banks or broker-dealers which have been determined by the Fund’s Investment Manager to present no serious risk of becoming involved in bankruptcy proceedings within the period contemplated by the repurchase transaction.
A maximum of 20% of the Fund’s total assets in Asia-Pacific debt securities can be denominated in any combination of Yen, Euro and British pound.
The Fund may invest up to 10% of its total assets in secondary market bank loans, and up to an additional 10% of its total assets in convertible securities and other hybrid securities, and up to an additional 10% of its total assets in asset-backed securities.
The Fund currently utilizes and in the future expects to continue to utilize leverage through borrowings or through other transactions, such as reverse repurchase agreements, which have the effect of leverage. The Fund may also utilize leverage through the issuance of debt securities or preferred stock. The Fund generally will not utilize leverage if it anticipates that the Fund’s leveraged capital structure would result in a lower return to shareholders than that obtainable over time with an unleveraged capital structure. Use of leverage creates an opportunity for increased income and capital appreciation for shareholders but, at the same time, creates special risks, and there can be no assurance that a leveraging strategy will be successful during any period in which it is employed.
Consistent with its investment objective, the Fund may invest in a broad array of financial instruments and securities in which the value of the instrument or security is “derived” from the performance of an underlying asset or a “benchmark” such as a security index, an interest rate or a foreign currency (“derivatives”). The Fund may use derivatives to manage currency risk, credit risk and interest rate risk and to replicate or as a substitute for physical securities. The Fund
may use interest rate swaps to hedge the Fund’s liability with respect to its leverage. There is no limit on the amount of interest rate swap transactions that may be entered into by the Fund. Derivative debt securities that replicate, or substitute for, the currency of a particular country will be counted toward the limitations applicable with respect to issuers in that country. The Fund may invest in over-the-counter or exchange traded derivatives. The Fund may invest in derivatives up to the limits allowed under the 1940 Act. The following guidelines apply with respect to the Fund’s derivative investments:
| 1. | The Fund will only use counterparty institutions rated A- or better by recognized international rating agencies for all over the counter (“OTC”) derivatives transactions. |
| 2. | A maximum of 20% of the Fund’s total assets may have exposure to currency-linked notes. |
| 3. | A maximum of 10% of the Fund’s total assets may be at risk to any single counterparty (aggregate interest rate, currency and credit derivatives). |
| 4. | Exchange-traded derivatives may only be traded on regulated derivative exchanges and a maximum of 35% of the Fund’s total assets may have exposure to exchange-traded derivatives. |
| 5. | A maximum of 20% of the Fund’s total assets may have exposure to derivatives traded on the Chicago Board of Trade. |
The Fund may invest in securities issued by investment companies registered as such under the 1940 Act and unregistered, private funds (each, an “acquired company”), subject to the limitations below (which are to be applied immediately after the acquisition of such securities).
The Fund may not acquire securities issued by an acquired company:
| • | if the value of such securities exceeds 3% of the total outstanding voting stock of the acquired company; |
| • | if the aggregate value of such securities would exceed 5% of the value of the total assets of the Fund; or |
| • | if the aggregate value of such securities, together with all other acquired company securities in the Fund’s portfolio, would exceed 10% of the value of the total assets of the Fund. |
As a non-diversified company, there is no investment restriction on the percentage of the Fund’s assets that may be invested at any time in the securities of any issuer. However, the Fund intends to limit its investments in the securities of any issuer, except for securities issued or guaranteed as to payment of principal and interest by Asia-Pacific Country or Other Country governmental entities, to 5% of its total assets at the time of purchase. The Fund intends to invest in a variety of debt securities, with differing issuers, maturities and interest rates, and to comply with the diversification and other requirements of the Code applicable to regulated investment companies so that the Fund will not be subject to U.S. federal income taxes on its net investment
| abrdn Asia-Pacific Income Fund, Inc. | 47 |
Additional Information Regarding the Fund (Unaudited) (continued)
income. The average U.S. dollar weighted maturity of the Fund’s portfolio is not expected to exceed 10 years.
FUNDAMENTAL INVESTMENT RESTRICTIONS
The Fund has elected to be classified as a non-diversified closed-end management investment company and will invest its assets only in a manner consistent with this classification under applicable law.
The Fund will not:
| 1. | issue senior securities, except (a) insofar as the Fund may be deemed to have issued a senior security in connection with any repurchase or securities lending agreement or any borrowing agreement permitted by these investment restrictions and (b) that the Fund may issue one or more series of its preferred stock, if permitted by its Articles of Incorporation, including Articles of Amendment and Articles Supplementary thereto; |
| 2. | borrow money, except as permitted under, or to the extent not prohibited by, the Investment Company Act of 1940, as amended, and as interpreted or modified by regulatory authority having jurisdiction, from time to time; |
| 3. | engage in the business of underwriting securities issued by others, except to the extent that the Fund may be deemed to be an underwriter in connection with the disposition of portfolio securities; |
| 4. | purchase or sell real estate, which term does not include securities of companies that deal in real estate or mortgages or investments secured by real estate or interests therein, except that the Fund reserves freedom of action to hold and to sell real estate acquired as a result of the Fund’s ownership of securities; |
| 5. | purchase physical commodities or contracts relating to physical commodities; |
| 6. | make loans to other persons, except as permitted under, or to the extent not prohibited by, the Investment Company Act of 1940, as amended, and as interpreted or modified by regulatory authority having jurisdiction, from time to time; |
| 7. | concentrate its investments in a particular industry or group of industries, as those terms are used in the Investment Company Act of 1940, as amended or modified by regulatory authority having jurisdiction from time to time, except that at any time the Fund has invested more than 25% of its total assets in securities of issuers of a particular country, the Fund may invest more than 25% of its assets, and up to the amount of its total assets invested in securities of issuers of that country, in securities issued or guaranteed, as to payment of principal and interest, by the government (including governmental subdivisions) or governmental entities or instrumentalities of that country. |
For purposes of Restriction 7, above, “securities of issuers of a particular country” shall include: (a) securities of issuers located in that country; (b) securities that are denominated in, or linked to, the currency of that country, including securities of supranational issuers and derivative securities that replicate, or substitute for, the currency of that country; (c) securities of issuers that derive at least 50% of their revenues from that country or have at least 50% of their assets located in that country; (d) securities issued by a parent or subsidiary of, and guaranteed by, an entity located in that country; (e) securities issued by the government (including governmental subdivisions) or governmental entities or instrumentalities of that country; and (f) repurchase agreements with respect to any of the foregoing securities.
INVESTMENT SECURITIES
The principal types of debt securities in which the Fund is permitted to invest include those described below. The list is not exclusive, but is indicative of the kinds of securities which the Fund’s investment objective, policies and restrictions permit it to buy.
Debt Securities
Local Currency Sovereign and Quasi-Sovereign Bonds. The Fund is permitted to invest in securities issued or guaranteed by governmental entities, including sovereign and quasi-sovereign entities, whether or not denominated in the currency of the country where such entity is located. The available maturities for these types of securities vary from country to country.
Commercial Banks. The Fund may also invest in securities issued by banks, whether or not denominated in the currency of the country where such bank is located.
U.S. Dollar-Denominated Debt Securities. The Fund is also permitted to invest in U.S. dollar-denominated debt securities in order to gain exposure to certain foreign debt markets without exposing the Fund to local currency risk. Such debt securities may be issued by issuers in developed markets, investment grade developing or emerging markets, or sub-investment grade developing or emerging markets and may be issued and/or registered in the United States. U.S. dollar-denominated debt securities are subject to credit risk relating primarily to the issuer of the bond and liquidity risk relating to the maintenance of a sufficiently liquid market for the specific security. Such securities are also affected by movements in U.S. interest rates.
External Debt. The Fund may invest in external debt obligations, which are often longer maturity (up to 30 years) securities, registered in London or globally, that are generally issued in U.S. dollars, but are increasingly issued in euros and occasionally in yen. External debt is typically issued in bearer form, carry a fixed or floating rate of interest, and amortize principal through a bullet payment with semi-annual interest payments in the currency in which the bond is issued.
| 48 | abrdn Asia-Pacific Income Fund, Inc. |
Additional Information Regarding the Fund (Unaudited) (continued)
Supranational Debt Obligations. The Fund may invest in debt issued by supranational entities. Supranational entities are entities constituted by the national governments of several countries to promote economic development, such as the World Bank, the International Monetary Fund, the European Investment Bank and the Asian Development Bank. Obligations of these entities are supported by appropriated but unpaid commitments of their member countries, and there can be no assurances that these commitments will be undertaken or met in the future.
Companies. The Fund is permitted to invest in publicly-traded notes and debentures or bills of exchange issued or guaranteed as to the payment of principal and interest by companies domiciled in a developed market, an investment grade developing or emerging market or a sub-investment grade developing or emerging market.
U.S. Securities
Government. The Fund is permitted to invest in U.S. government securities, including obligations issued or guaranteed by U.S. government agencies or instrumentalities, some of which are backed by the full faith and credit of the U.S. Treasury (such as direct passthrough certificates of the Government National Mortgage Association), some of which are supported by the right of the issuer to borrow from the U.S. government (such as obligations of Federal Home Loan Banks), and some of which are backed only by the credit of the issuer itself. Government obligations do not generally involve the credit risks associated with other types of interest bearing securities, although, as a result, the yields available from U.S. government obligations are generally lower than the yields available from corporate interest bearing securities. Like other interest bearing securities, however, the value of Government obligations changes as interest rates fluctuate.
Corporations and Banks. The Fund is permitted to invest for defensive and other temporary purposes in U.S. corporate debt instruments rated at the time of investment Aa or better by Moody’s or AA or better by S&P, finance company and corporate commercial paper, and other short-term obligations, in each case rated at the time of investment Prime-2 or better by Moody’s or A-2 or better by S&P. The Fund is also permitted to invest in obligations of U.S. Federal or state chartered banks and bank holding companies rated at the time of investment Aa or better by Moody’s or AA or better by S&P (including certificates of deposit, bankers’ acceptances and other short-term obligations).
Bank Loans
The Fund may acquire privately held loans from banks, insurance companies, financial institutions, or other lenders, as well as claims held by trade or other creditors, and may originate these types of loans. The bank loans in which the Fund invests may be structured and
administered by a third party that acts as agent for a group of lenders that make or hold interests in the loan. The Fund may acquire interests in such loans by taking an assignment of all or a portion of a direct interest in a loan previously held by another institution or by acquiring a participation in an interest in a loan that continues to be held by another institution.
Convertible Securities
Convertible securities include bonds, debentures, notes, preferred stocks and other securities that entitle the holder to acquire common stock or other equity securities of the same or a different issuer. Convertible securities have general characteristics similar to both debt and equity securities. A convertible security generally entitles the holder to receive interest or preferred dividends paid or accrued until the convertible security matures or is redeemed, converted or exchanged. Before conversion, convertible securities have characteristics similar to non-convertible debt obligations. Convertible securities rank senior to common stock in a corporation’s capital structure and, therefore, generally entail less risk than the corporation’s common stock, although the extent to which such risk is reduced depends in large measure upon the degree to which the convertible security sells above its value as a debt obligation. A convertible security may be subject to redemption at the option of the issuer at a predetermined price. If a convertible security held by the Fund is called for redemption, the Fund would be required to permit the issuer to redeem the security and convert it to underlying common stock, or would sell the convertible security to a third party, which may have an adverse effect on the Fund’s ability to achieve its investment objective. The price of a convertible security often reflects variations in the price of the underlying common stock in a way that non-convertible debt may not. The value of a convertible security is a function of (i) its yield in comparison to the yields of other securities of comparable maturity and quality that do not have a conversion privilege and (ii) its worth if converted into the underlying common stock.
Asset-Backed Securities
Asset-backed securities are a form of structured debt obligation. Asset-backed securities are payment claims that are securitized in the form of negotiable paper that is issued by a financing company (generally called a special purpose vehicle). Collateral assets brought into a pool according to specific diversification rules. A special purpose vehicle is founded for the purpose of securitizing these payment claims and the assets of the special purpose vehicle are the diversified pool of collateral assets. The special purpose vehicle issues marketable securities which are intended to represent a lower level or risk than an underlying collateral asset individually, due to the diversification in the pool. The redemption of the securities issued by the special purpose vehicle takes place out of the cash flow generated by
| abrdn Asia-Pacific Income Fund, Inc. | 49 |
Additional Information Regarding the Fund (Unaudited) (continued)
the collected assets. A special purpose vehicle may issue multiple securities with different priorities to the cash flows generated and the collateral assets. The collateral for asset-backed securities may include home equity loans, automobile and credit card receivables, boat loans, computer leases, airplane leases, mobile home loans, recreational vehicle loans and hospital account receivables. The Fund may invest in these and other types of asset-backed securities that may be developed in the future. There is the possibility that recoveries on the underlying collateral may not, in some cases, be available to support payments on these securities.
Derivatives
With respect to all of its portfolio, the Fund will invest in derivatives for two main purposes: (1) to modify interest rate risk, modify credit risk and adjust currency risk within the portfolio, and (2) to enable the Fund to replicate or substitute for a particular security in order to gain access to a particular foreign market or security, where either the physical security is judged by the Advisers to be too expensive, or the Advisers believe there is an insufficient supply of the particular security or no security fitting the precise needs of the Fund exists. The types of derivatives which may be used include, but are not limited to, futures, options, forwards, forwards that can only be settled in U.S. dollars, swaps, and securities with structured cash flows, whether traded on an exchange or over-the-counter, that have as their underlying security reference to a fixed income security or currency. In general, derivatives will not be utilized to leverage the Fund; however, the Board has authorized the use of reverse repurchase agreements as a form of leverage.
Investment in fixed income securities may at certain times be more efficiently achieved using derivative securities to replicate physical securities. These types of derivatives carry identical market price risks to the equivalent physical securities but provide a number of transactional benefits. For example, by using derivatives, the Fund may be able to implement investment decisions at lower costs, increase the after-tax yield, obtain prices that are not available in the underlying cash market, or settle in U.S. dollars. In less developed markets, liquidity and credit quality can be enhanced and transaction costs reduced by using derivatives rather than the underlying securities. In certain circumstances, due to lack of available direct investment opportunity or government regulations, the only means of gaining exposure to particular countries is through derivatives.
The derivatives used for adjusting currency exposures or replicating underlying securities are usually over-the-counter (“OTC”) securities. OTC securities carry credit risk associated with the counterparty institution. See "Risk Factors - Derivatives Risk." To manage this risk, the Fund will only use counterparty institutions rated A- or better by a recognized international rating agency. Up to 10% of total assets may be put at risk in derivatives transactions with any single counterparty
(aggregate interest rate, credit and currency derivatives exposure). A maximum of 20% of total assets may be at risk in currency-linked notes.
The types of derivatives used by the Fund and the techniques employed may change over time as new derivatives and strategies are developed or regulatory changes occur. The Fund will not use derivatives where it would contravene the guidelines set by the lending banks for the Fund’s bank loan.
Derivatives may be used to hedge the interest rate risk associated with the Fund's outstanding leverage. The Fund may use interest rate swaps to hedge the Fund's liability with respect to its bank loan. At present, the Fund has been authorized by its Board of Directors to hedge up to 100% of the Fund's liability with respect to its bank loan. See "Investment Securities – Derivatives – Swaps" and "Risk Factors Derivatives Risk." The following guidelines apply with respect to the Fund's derivative instruments:
| • | The Fund will only use counterparty institutions rated A- or better by recognized international rating agencies, except with respect to Korean futures. In Korea, brokerage houses with Korean futures exchanges require deposits into margin accounts, and in many cases, these accounts are with unrated entities. |
| • | A maximum of 20% of the Fund’s total assets may have exposure to currency-linked notes. |
| • | A maximum of 10% of the Fund’s total assets may be at risk to any single counterparty (aggregate interest rate, currency and credit derivatives). |
| • | Exchange-traded derivatives may only be traded on regulated derivative exchanges and a maximum of 35% of the Fund’s total assets may have exposure to exchange-traded derivatives. |
| • | The Fund’s maximum gross exposure (long plus short positions) to derivatives traded on the Sydney Futures Exchange is 20% of its total assets and the maximum net exposure (long positions minus short positions) to derivatives traded on the Sydney Futures Exchange is 15% of the Fund’s total assets. |
| • | A maximum of 20% of the Fund’s total assets may have exposure to derivatives traded on the Chicago Board of Trade. |
Forward Currency Contracts. The Fund may enter into forward currency contracts. A forward currency contract involves an obligation to purchase or sell a specific currency at a future date, which may be any fixed number of days from the date of the contract agreed upon by the parties, at a price set at the time of the contract.
The cost to the Fund of engaging in forward currency contracts will vary with factors such as the length of the contract period and the market conditions then prevailing. Because forward currency contracts are usually conducted on a principal basis, no fees or commissions are involved, although the price charged in the transaction includes a dealer’s markup. The use of forward currency contracts in this manner is intended to fix a rate of exchange that can be achieved at a certain time in the future.
| 50 | abrdn Asia-Pacific Income Fund, Inc. |
Additional Information Regarding the Fund (Unaudited) (continued)
Futures Contracts. The Fund may enter into futures contracts in U.S. domestic markets or on exchanges located outside the United States for both hedging and non-hedging purposes. Foreign markets may offer advantages such as trading opportunities or arbitrage possibilities not available in the United States. Foreign markets, however, may have greater risk potential than domestic markets. For example, some foreign exchanges are principal markets so that no common clearing facility exists and an investor may look only to the broker for performance of the contract. In addition, any profits the Fund might realize in trading could be eliminated by adverse changes in the exchange rate, or the Fund could incur losses as a result of those changes. Transactions on foreign exchanges may include both underlying assets which are traded on U.S. commodities exchanges and those which are not. Unlike trading on U.S. exchanges, trading on foreign commodities exchanges is not regulated by the Commodity Futures Trading Commission (“CFTC”).
Engaging in these transactions involves risk of loss to the Fund which could adversely affect the value of the Fund’s net assets. No assurance can be given that a liquid market will exist for any particular futures contract at any particular time. Many futures exchanges and boards of trade limit the amount of fluctuation permitted in futures contract prices during a single trading day. Once the daily limit has been reached in a particular contract, no trades may be made that day at a price beyond that limit or trading may be suspended for specified periods during the trading day. Futures contract prices could move to the limit for several consecutive trading days with little or no trading, thereby preventing prompt liquidation of futures positions and potentially subjecting the Fund to substantial losses.
Successful use of futures by the Fund also is subject to the Advisers’ ability to predict correctly movements in the direction of the relevant market, and, to the extent the transaction is entered into for hedging purposes, to ascertain the appropriate correlation between the transaction being hedged and the price movements of the futures contract.
The Fund also may purchase and write options to buy or sell those futures contracts in which it may invest. Such investment strategies will be used for hedging purposes and for non-hedging purposes, subject to applicable law. An option on a futures contract provides the holder with the right to enter into a “long” position in the underlying futures contract, in the case of a call option, or a “short” position in the underlying futures contract, in the case of a put option, at a fixed exercise price up to a stated expiration date or, in the case of certain options, on such date. Upon exercise of the option by the holder, the contract market clearinghouse establishes a corresponding short position for the writer of the option, in the case of a call option, or a corresponding long position in the case of a put option. In the event that an option is exercised, the parties will be subject to all the risks associated with the trading of futures contracts, such as payment of
initial and variation margin deposits. In addition, the writer of an option on a futures contract, unlike the holder, is subject to initial and variation margin requirements on the option position.
A position in an option on a futures contract may be terminated by the purchaser or seller prior to expiration by effecting an offsetting purchase or sale transaction, subject to the continued availability of a liquid secondary market, which is the purchase or sale of an option of the same type (i.e., the same exercise price and expiration date) as the option previously purchased or sold. The difference between the premiums paid and received represents the Fund’s profit or loss on the transaction. Options on futures contracts that are written or purchased by the Fund on U.S. exchanges are traded on the same contract market as the underlying futures contract, and, like futures contracts, are subject to regulation by the CFTC and the performance guarantee of the exchange clearinghouse.
The Investment Manager has claimed an exclusion from the definition of the term “commodity pool operator” under the Commodity Exchange Act (“CEA”) pursuant to Rule 4.5 under the CEA with respect to the Fund. The Investment Manager is not, therefore, subject to registration or regulation as a “commodity pool operator” under the CEA in respect of the Fund.
Swaps. The Fund may enter into interest rate swaps, currency swaps, credit default swaps and other types of available swap agreements, including swaps on securities, financial assets and indices, and related types of derivatives, such as caps, collars and floors. A swap is an agreement between two parties pursuant to which each party agrees to make one or more payments to the other on regularly scheduled dates over a stated term, based on different interest rates, currency exchange rates, security or financial asset prices, the prices or rates of other types of financial instruments or assets or the levels of specified indices. Under a typical swap, one party may agree to pay a fixed rate or a floating rate determined by reference to a specified instrument, rate or index, multiplied in each case by a specified amount (the “notional amount”), while the other party agrees to pay an amount equal to a different floating rate multiplied by the same notional amount. On each payment date, the obligations of parties are netted, with only the net amount paid by one party to the other. All swap agreements entered into by the Fund with the same counterparty are generally governed by a single master agreement, which provides for the netting of all amounts owed by the parties under the agreement upon the occurrence of an event of default, thereby reducing the credit risk to which such party is exposed.
Swap agreements are typically individually negotiated and structured to provide exposure to a variety of different types of investments or market factors. Swap agreements may be entered into for hedging or non-hedging purposes and, therefore, may increase or decrease the Fund’s exposure to the underlying instrument, rate, asset or index.
| abrdn Asia-Pacific Income Fund, Inc. | 51 |
Additional Information Regarding the Fund (Unaudited) (continued)
Swap agreements can take many different forms and are known by a variety of names. The Fund is not limited to any particular form or variety of swap agreement if the Advisers determine that it is consistent with the Fund’s investment objective and policies.
Private Placements
Certain debt securities purchased by the Fund may have been placed privately. These securities are somewhat less liquid than securities which are widely traded by the public and there may be contractual restrictions on their resale to the public. Therefore, although these securities may be resold in privately negotiated transactions, the prices realized from such sales may be less than what might have been realized on a more active public trading market.
Other Investment Companies
Subject to the limitations set forth in Section 12(d) of the 1940 Act, the Fund may invest in securities issued by other investment companies that invest primarily in fixed-income securities. As a shareholder of another investment company, the Fund will bear its pro rata portion of the other investment company’s expenses, including advisory fees. These expenses would be in addition to the expenses, including advisory fees, that the Fund bears in connection with its own operations.
Repurchase and Securities Lending Agreements
The Fund is permitted to invest in repurchase agreements with banks and broker-dealers. A repurchase agreement is a contract under which the Fund acquires a security for a relatively short period (usually no more than one week) subject to the obligations of the seller to repurchase and the Fund to resell such security at a fixed time and price (representing the Fund’s cost plus interest). The Investment Manager monitors the value of such securities daily to determine that the value equals or exceeds the repurchase price. Under the 1940 Act, repurchase agreements are considered to be loans made by the Fund which are collateralized by the securities subject to repurchase. Repurchase agreements may involve risks in the event of default or insolvency of the seller, including possible delays or restrictions upon the Fund’s ability to dispose of the underlying securities. The Fund will enter into repurchase agreements only with parties who meet creditworthiness standards approved by the Fund's Board of Directors, i.e., banks or broker-dealers which have been determined by the Investment Manager to present no serious risk of becoming involved in bankruptcy proceedings within the time frame contemplated by the repurchase transaction.
The Fund may also lend to banks and broker-dealers portfolio securities with an aggregate market value of up to one-third of its total assets when it deems advisable. Any such loans must be secured by collateral (consisting of any combination of cash, U.S. Government securities, irrevocable letters of credit or other high-quality debt
securities) in an amount at least equal (on a daily marked-to-market basis) to the current market value of the securities loaned. The Fund may terminate the loans at any time and obtain the return of the securities. The Fund will continue to receive any interest or dividends paid on the loaned securities and will continue to have voting rights with respect to the securities. In connection with the lending of its portfolio securities, the Fund is exposed to the risk of delay in recovery of the securities loaned or possible loss of right in the collateral should the borrower become insolvent.
Issuers of irrevocable letters of credit used as collateral for securities lending agreements must meet the same or similar standards.
Firm Commitment Agreements and When-Issued Securities
The Fund may purchase debt securities on a firm commitment or when-issued basis. New issues of certain debt securities are often offered on a when-issued basis; that is, the payment obligation and the interest rate are fixed at the time the buyer enters into the commitment, but delivery and payment for the securities normally take place after the date of the commitment to purchase. Firm commitment agreements call for the purchase of securities at an agreed-upon price on a specified future date. The transactions are entered into in order to secure what is considered to be an advantageous price and yield to the Fund and not for purposes of leveraging the Fund’s assets. The Fund will not earn any income on these securities prior to delivery. The value of when-issued securities and firm commitment agreements may vary prior to and after delivery depending on market conditions and changes in interest rate levels. There is a risk that a party with whom the Fund has entered into such transactions will not perform its commitment, which could result in a gain or loss to the Fund.
RISK FACTORS
The Fund is a non-diversified, closed-end investment company designed primarily as a long-term investment vehicle and not as a trading tool. The Fund invests primarily in a portfolio of fixed income securities. An investment in the Fund's Common Shares may be speculative and involves a high degree of risk. The Fund should not be considered a complete investment program. Due to the uncertainty in all investments, there can be no assurance that the Fund will achieve its investment objective. The value of an investment in the Fund's Common Shares could decline substantially and cause you to lose some or all of your investment. Before investing in the Fund's Common Shares you should consider carefully the following principal risks of investing in the Fund.
Management Risk
The Fund's ability to achieve its investment objective is directly related to the Advisers' investment strategies for the Fund. The value of your investment in the Fund's Common Shares may vary with the
| 52 | abrdn Asia-Pacific Income Fund, Inc. |
Additional Information Regarding the Fund (Unaudited) (continued)
effectiveness of the research and analysis conducted by the Advisers and their ability to identify and take advantage of attractive investment opportunities. If the investment strategies of the Advisers do not produce the expected results, the value of your investment could be diminished or even lost entirely, and the Fund could underperform the market or other funds with similar investment objectives. Additionally, there can be no assurance that all of the personnel of the Advisers will continue to be associated with the Advisers for any length of time. The loss of the services of one or more key employees of the Advisers could have an adverse impact on the Fund's ability to realize its investment objective.
Investment and Market Risk
An investment in the Fund's Shares is subject to investment risk, including the possible loss of the entire principal amount that you invest. Your investment in Shares represents an indirect investment in the securities owned by the Fund. The value of these securities, like other market investments, may move up or down, sometimes rapidly and unpredictably, and these fluctuations are likely to have a greater impact on the value of the Shares during periods in which the Fund utilizes a leveraged capital structure. If the current global economic downturn continues into a prolonged recession or deteriorates further, the ability of issuers of the corporate fixed-income securities and other securities in which the Fund invests to service their obligations could be materially and adversely affected. The value of the securities in which the Fund invests will affect the value of the Shares. Your Shares at any point in time may be worth less than your original investment, even after taking into account the reinvestment of Fund dividends and distributions.
Country/Regional Focus Risk and Asian-Pacific Region Risk
Parts of the Asian-Pacific region may be subject to a greater degree of economic, political and social instability than is the case in the United States and Europe. Some Asian-Pacific countries can be characterized as emerging markets or newly industrialized and may experience more volatile economic cycles than developed countries. The developing nature of securities markets in many countries in the Asian-Pacific region may lead to a lack of liquidity while some countries have restricted the flow of money in and out of the country. Some countries in Asia-Pacific have historically experienced political uncertainty, corruption, military intervention and social unrest.
Additionally, the Fund may be more volatile than a fund which is broadly diversified geographically. Focusing on a single geographical region involves increased currency, political, regulatory and other risks. Market swings in the targeted country or geographical region, such as the Asia-Pacific region, likely will have a greater effect on portfolio performance than they would in a more geographically diversified fixed income fund.
China Risk. In addition to the risks discussed under “Developing and Emerging Markets Risk,” as well as the risks described under “Foreign Securities Risk,” investing in China presents additional risks. Concentrating investments in China and Hong Kong may make the Fund significantly more volatile than geographically diverse mutual funds. Additional risks associated with investments in China and Hong Kong include exposure to currency fluctuations, less liquidity, expropriation, confiscatory taxation, nationalization, exchange control regulations (including currency blockage) and differing legal standards. Any spread of an infectious illness, public health threat or similar issue could reduce consumer demand or economic output, result in market closures, travel restrictions or quarantines, and generally have a significant impact on the Chinese economy, which in turn could adversely affect the Fund’s investments.
Inflation and rapid fluctuations in inflation and interest rates have had, and may continue to have, negative effects on the economies and securities markets of China or Hong Kong. The Chinese government could, at any time, alter or discontinue economic reform programs implemented since 1978. Military conflicts, either in response to internal social unrest or conflicts with other countries, are an ever present consideration.
The adoption or continuation of protectionist trade policies by one or more countries (including the U.S.) could lead to decreased demand for Chinese products and have an adverse effect on the Chinese securities markets. In particular, the current political climate has intensified concerns about a potential trade war between China and the United States, as each country has imposed, and may in the future impose additional, tariffs on the other country’s products. These actions may trigger a significant reduction in international trade, the oversupply of certain manufactured goods, substantial price reductions of goods and possible failure of individual companies and/or large segments of China’s export industry, which could have a negative impact on the Fund’s performance. Certain securities are, or may in the future become, restricted, and the Fund may be forced to sell such restricted securities and incur a loss as a result. U.S. companies that source material and goods from China and those that make large amounts of sales in China would be particularly vulnerable to an escalation of trade tensions. Uncertainty regarding the outcome of the trade tensions and the potential for a trade war could cause the U.S. dollar to decline against safe haven currencies, such as the Japanese yen and the euro. Events such as these and their consequences are difficult to predict and it is unclear whether further tariffs may be imposed or other escalating actions may be taken in the future.
Chinese authorities may intervene in the China securities market and halt or suspend trading of securities for short or even longer periods of time. The China securities market has, at times, experienced considerable volatility and has historically been subject to relatively
| abrdn Asia-Pacific Income Fund, Inc. | 53 |
Additional Information Regarding the Fund (Unaudited) (continued)
frequent and extensive trading halts and suspensions. These trading halts and suspensions have, among other things, contributed to uncertainty in the markets and reduced the liquidity of the securities subject to such trading halts and suspensions, which could include securities held by the Fund.
The Fund may gain exposure to companies based or operated in China by investing through legal structures known as variable interest entities (VIEs). Instead of directly owning the equity securities of a Chinese company, a VIE enters into service and other contracts with the Chinese company. Although the VIE has no equity ownership of the Chinese company, the contractual arrangements permit the VIE to consolidate the Chinese company into its financial statements. The Chinese government could intervene with respect to VIEs, which could significantly affect the Chinese company’s performance and the enforceability of the VIE’s contractual arrangement with the Chinese company.
Exposure to China may be gained through investments in securities that are economically tied to China or, in some cases, through direct investment in China securities.
China Interbank Bond Market. To the extent permitted by its principal investment strategies, the Fund may transact in the China Interbank Bond Market (“CIBM”) when buying or selling portfolio securities for the Fund. The China bond market is made up of the CIBM and the exchange listed bond market. The CIBM was established in 1997 and was limited to domestic participants, but access to the market has since been expanded to foreign institutional investors. To the extent permissible by the relevant regulations or authorities, the Fund may invest in the CIBM through CIBM Direct or Bond Connect. Under the CIBM Direct regime, foreign institutional investors have direct access to bonds traded on the CIBM, subject to the relevant rules established by the People's Bank of China (“PBOC”) (“CIBM Direct Rules”). An onshore trading and settlement agent shall be engaged to make the filing on behalf of the relevant Fund and conduct trading and settlement agency services for the Fund. PBOC will exercise on-going supervision on the onshore settlement agent and the Fund's trading under the CIBM Direct Rules and may take relevant administrative actions such as suspension of trading and mandatory exit against the Fund and/or abrdn Asia Limited in the event of any incompliance with the CIBM Direct Rules. The CIBM Direct Rules are relatively new and are still subject to continuous evolvement, which may adversely affect the Fund's capability to invest in the CIBM.
Bond Connect is a trading and settlement link program developed by the PBOC and the Hong Kong Monetary Authority (“HKMA”) with a view to establish mutual bond market access between the PRC and Hong Kong. Trading through Bond Connect
is subject to a number of restrictions that may affect a Fund's investments and returns. Investments made through Bond Connect are subject to order, clearance and settlement procedures that are relatively untested in the PRC, which could pose risks to a Fund. A Fund's investments in securities via Bond Connect are generally subject to Chinese securities regulations and listing rules, among other restrictions. Such securities may lose their eligibility at any time, in which case they could be sold but could no longer be purchased through Bond Connect. The Bond Connect program is a relatively new program and may be subject to further interpretation and guidance.
Market volatility and potential lack of liquidity due to low trading volume of certain debt securities may result in prices of debt securities traded on such market fluctuating significantly. The bid and offer spreads of the prices of the PRC bonds may be large, and if a Fund transacts in the CIBM, it may therefore incur significant trading and realization costs and may even suffer losses when selling such investments. To the extent that a Fund transacts in the CIBM, it may also be exposed to risks associated with settlement procedures and default of counterparties. The CIBM is also subject to regulatory risks. Due to irregularities in the CIBM trading activities, the China Government Securities Depository Trust & Clearing Co. (the central clearing entity) suspended new account opening on the CIBM for specific types of products. Although funds classified as mutual funds offered to the public were not affected, there is no assurance that future regulatory actions will not affect such funds. If accounts are suspended, or cannot be opened, the Fund's ability to invest in the CIBM will be limited and the Funds may suffer losses as a result.
Investment in Hong Kong issuers may subject the Fund to legal, regulatory, and political risks, specific to Hong Kong. Hong Kong is closely tied to China, economically and politically, following the UK's 1997 handover of the former colony to China to be governed as a Special Administrative Region. Changes to Hong Kong's legal, financial, and monetary system could negatively impact its economic prospects. Hong Kong's evolving relationship with the central government in Beijing has been a source of political unrest and may result in economic disruption. By treaty, China has committed to preserve Hong Kong's high degree of autonomy in certain matters until 2047. However, as demonstrated by Hong Kong protests in recent years over political, economic, and legal freedoms, and the Chinese government's response to them, there continues to exist political uncertainty within Hong Kong. For example, in June 2020 China adopted a new security law that severely limits freedom of speech in Hong Kong and expands police powers to seize electronic devices and intercept communications of suspects.
| 54 | abrdn Asia-Pacific Income Fund, Inc. |
Additional Information Regarding the Fund (Unaudited) (continued)
Widespread protests were held in Hong Kong in response to the new law, and the United States imposed sanctions on certain Hong Kong officials for cracking down on pro-democracy protests. There is no guarantee that additional protests will not arise in the future or whether the United States will respond to such protests with additional sanctions. Further, any changes in the Chinese economy, trade regulations, or control over Hong Kong may have an adverse impact on Hong Kong's economy and thereby impact the Fund.
India Risk. The value of the Fund’s assets may be adversely affected by political, economic, social and religious factors, changes in Indian law or regulations and the status of India’s relations with other countries. In addition, the economy of India may differ favorably or unfavorably from the U.S. economy in such respects as the rate of growth of gross domestic product, the rate of inflation, capital reinvestment, resource self-sufficiency and balance of payments position. The Indian government has exercised and continues to exercise significant influence over many aspects of the economy, and the number of public sector enterprises in India is substantial. Accordingly, Indian government actions in the future could have a significant effect on the Indian economy, which could affect private sector companies and the Fund, market conditions, and prices and yields of securities in the Fund’s portfolio. Economic growth in India is constrained by inadequate infrastructure, a cumbersome bureaucracy, corruption, labor market rigidities, regulatory and foreign investment controls, the “reservation” of key products for small-scale industries and high fiscal deficits. Changes in economic policies, or lack of movement toward economic liberalization, could negatively affect the general business and economic conditions in India, which could in turn affect the Fund’s investments. The securities market in India is substantially smaller, less liquid and significantly more volatile than the securities market in the United States. The relatively small market capitalizations of, and trading values on, Indian stock exchanges may cause the Fund’s investments in securities listed on these exchanges to be comparatively less liquid and subject to greater price volatility than comparable U.S. investments.
Indonesia Risk. The limited liquidity of the Indonesian and other foreign securities markets may also affect the Fund’s ability to acquire or dispose of securities at a price and time that it wishes to do so. Accordingly, in periods of rising market prices, the Fund may be unable to participate in such price increases fully to the extent that it is unable to acquire desired portfolio positions quickly; conversely the Fund’s inability to dispose fully and promptly of positions in declining markets will cause its net asset value to decline as the value of unsold positions is marked to lower prices.
The Indonesian securities market is an emerging market characterized by a small number of company listings, high price volatility and a relatively illiquid secondary trading environment. These factors,
coupled with restrictions on investment by foreigners and other factors, limit the supply of securities available for investment by the Fund. This will affect the rate at which the Fund is able to invest in Indonesian and other foreign securities, the purchase and sale prices for such securities and the timing of purchases and sales.
Leverage Risk
The Fund generally seeks to enhance its total returns through the use of leverage. The Fund currently utilizes and in the future expects to continue to utilize leverage through borrowings (including through the issuance of debt securities) and through the issuance of preferred stock. The Fund may seek to enhance returns through other transactions, such as reverse repurchase agreements, which have the effect of leverage. The Fund is currently leveraged through a revolving loan facility, senior secured notes and preferred stock.
With respect to asset coverage for preferred shares, under the 1940 Act, the Fund is not permitted to issue preferred shares unless immediately after such issuance the value of the Fund's total net assets (as defined below) is at least 200% of the liquidation value of the outstanding preferred shares and the newly issued preferred shares plus the aggregate amount of any senior securities of the Fund representing indebtedness (i.e., such liquidation value plus the aggregate amount of senior securities representing indebtedness may not exceed 50% of the Fund's total net assets). In addition, the Fund is not permitted to declare any cash dividend or other distribution on its Common Shares unless, at the time of such declaration, the value of the Fund's total net assets (determined after deducting the amount of such dividend or other distribution) satisfies the above-referenced 200% coverage requirement.
The 1940 Act generally prohibits the Fund from engaging in most forms of leverage representing indebtedness other than preferred shares unless immediately after such incurrence the Fund's total assets less all liabilities and indebtedness not represented by senior securities (for these purposes, "total net assets") is at least 300% of the aggregate senior securities representing indebtedness (i.e., the use of leverage through senior securities representing indebtedness may not exceed 33 1/3% of the Fund's total net assets (including the proceeds from leverage)). Additionally, under the 1940 Act, the Fund generally may not declare any dividend or other distribution upon any class of its capital shares, or purchase any such capital shares, unless at the time of such declaration or purchase, this asset coverage test is satisfied.
The Fund may also enter into certain transactions that create leverage, such as reverse repurchase agreements, which are not subject to the asset coverage requirements set out above.
The Fund seeks a leverage ratio, based on a variety of factors including market conditions and the Advisers' market outlook, where the rate of
| abrdn Asia-Pacific Income Fund, Inc. | 55 |
Additional Information Regarding the Fund (Unaudited) (continued)
return, net of applicable Fund expenses, on the Fund's investment portfolio investments purchased with leverage exceeds the costs associated with such leverage.
The Fund may engage in additional borrowings in order to maintain the Fund's desired leverage ratio. Leverage creates a greater risk of loss, as well as a potential for more gain, for the common stock than if leverage were not used. Interest on borrowings may be at a fixed or floating rate, and the interest at a floating rate generally will be based on short-term rates. The costs associated with the Fund's use of leverage, including the issuance of such leverage and the payment of dividends or interest on such leverage, will be borne entirely by the holders of common stock. As long as the rate of return, net of applicable Fund expenses, on the Fund's investment portfolio investments purchased with leverage exceeds the costs associated with such leverage, the Fund will generate more return or income than will be needed to pay such costs. In this event, the excess will be available to pay higher dividends to holders of common stock. Conversely, if the Fund's return on such assets is less than the cost of leverage and other Fund expenses, the return to the holders of the common stock will diminish. To the extent that the Fund uses leverage, the net asset value and market price of the common stock and the yield to holders of common stock will be more volatile. The Fund's leveraging strategy may not be successful.
Credit Risk
Investments in debt securities expose the Fund to credit risk. Credit risk is the risk that one or more of the Fund's investments in debt securities or other instruments will decline in price, or fail to pay interest, liquidation value or principal when due, because the issuer of the obligation or the issuer of a reference security experiences an actual or perceived decline in its financial status. Credit risk is influenced by changes in general economic and political conditions and changes in the financial condition of the issuers. During periods of economic downturn or rising interest rates, issuers of securities with a low credit rating may experience financial weakness that could affect their ability to make payments of interest and principal.
Adverse publicity and investor perceptions, whether or not based on fundamental analysis, may also decrease the value and liquidity of securities with low credit ratings, especially in markets characterized by a low volume of trading.
Interest Rate and Pre-Payment Risk
Generally, when market interest rates rise, the prices of debt obligations fall, and vice versa. Interest rate risk is the risk that debt obligations and other instruments in the Fund's portfolio will decline in value because of increases in market interest rates. This risk may be particularly acute when market interest rates are at low levels. The prices of long-term debt obligations generally fluctuate more than
prices of short-term debt obligations as interest rates change. During periods of rising interest rates, the average life of certain types of securities may be extended due to slower than expected payments. This may lock in a below market yield, increase the security's duration and reduce the security's value.
Investments in floating rate debt instruments, although generally less sensitive to interest rate changes than longer duration fixed rate instruments, may nevertheless decline in value in response to rising interest rates if, for example, the rates at which they pay interest do not rise as much, or as quickly, as market interest rates in general. Conversely, floating rate instruments will not generally increase in value if interest rates decline. Inverse floating rate debt securities may also exhibit greater price volatility than a fixed rate debt obligation with similar credit quality. To the extent the Fund holds floating rate instruments, a decrease (or, in the case of inverse floating rate securities, an increase) in market interest rates will adversely affect the income received from such securities and the net asset value of the Fund's Common Shares.
Pre-payment risk refers to the risk that a debt obligations are prepaid ahead of schedule. In this event, the proceeds from the prepaid securities would likely be reinvested by the Fund in securities bearing a lower interest rate. Pre-payment rates usually increase when interest rates are falling.
Private Placements and Other Restricted Securities Risk
Private placement and other restricted securities include securities that have been privately placed and are not registered under the Securities Act, such as unregistered securities eligible for resale without registration pursuant to Rule 144A ("Rule 144A Securities") and privately placed securities of U.S. and non-U.S. issuers offered outside of the United States without registration with the SEC pursuant to Regulation S ("Regulation S Securities"). Private placements may offer attractive opportunities for investment not otherwise available on the open market.
Private placements securities typically may be sold only to qualified institutional buyers (or, in the case of the initial sale of certain securities, such as those issued in collateralized debt obligations or collateralized loan obligations, to accredited investors (as defined in Rule 501(a) under the Securities Act)), or in a privately negotiated transaction or to a limited number of purchasers, or in limited quantities after they have been held for a specified period of time and other conditions are met pursuant to an exemption from registration. Rule 144A Securities and Regulation S Securities may be freely traded among certain qualified institutional investors, such as the Fund, but their resale in the U.S. is permitted only in limited circumstances. Issuers of restricted securities may not be subject to the disclosure and other investor protection requirements that would be applicable if their securities were publicly traded. Where a registration
| 56 | abrdn Asia-Pacific Income Fund, Inc. |
Additional Information Regarding the Fund (Unaudited) (continued)
statement is required for the resale of restricted securities, the Fund may be required to bear all or part of the registration expenses. The Fund may be deemed to be an "underwriter" for purposes of the Securities Act when selling restricted securities to the public and, in such event, the Fund may be liable to purchasers of such securities if the registration statement prepared by the issuer is materially inaccurate or misleading. Private placements typically are subject to restrictions on resale as a matter of contract or under federal securities laws. Because there may be relatively few potential purchasers for such securities, especially under adverse market or economic conditions or in the event of adverse changes in the financial condition of the issuer, the Fund could find it more difficult to sell such securities when it may be advisable to do so or it may be able to sell such securities only at prices lower than if such securities were more widely held. At times, it also may be more difficult to determine the fair value of such securities for purposes of computing the Fund's net asset value NAV due to the absence of a trading market.
Private placements and restricted securities may be considered illiquid securities, which could have the effect of increasing the level of the Fund's illiquidity. Additionally, a restricted security that was liquid at the time of purchase may subsequently become illiquid. Disposing of illiquid investments may involve time-consuming negotiation and legal expenses, and it may be difficult or impossible for the Fund to sell them promptly at an acceptable price. The Fund may have to bear the extra expense of registering the securities for resale and the risk of substantial delay in effecting the registration. In addition, market quotations typically are less readily available for these securities.
Foreign Securities Risk
Investing in foreign securities involves certain special considerations that are not typically associated with investments in the securities of U.S. issuers. Foreign issuers are not generally subject to uniform accounting, auditing and financial reporting standards and may have policies that are not comparable to those of domestic issuers. As a result, there may be less information available about foreign issuers than about domestic issuers. Securities of some foreign issuers may be less liquid and more volatile than securities of comparable domestic issuers. There is generally less government supervision and regulation of securities markets, brokers and issuers than in the United States. In addition, with respect to certain foreign countries, there is a possibility of expropriation or confiscatory taxation, political and social instability, or diplomatic developments, which could affect the value of investments in those countries. The costs of investing in foreign countries frequently are higher than the costs of investing in the United States. Although the Advisers endeavor to achieve the most favorable execution costs in portfolio transactions,
trading costs in non-U.S. securities markets are generally higher than trading costs in the United States.
Investments in securities of foreign issuers often will be denominated in foreign currencies. Accordingly, the value of the Fund's assets, as measured in U.S. dollars, may be affected favorably or unfavorably by changes in currency exchange rates and in exchange control regulations. The Fund may incur costs in connection with conversions between various currencies.
The Fund generally holds its foreign securities and cash in foreign banks and securities depositories approved by State Street Bank and Trust Company, the Fund's Foreign Custody Manager (as that term is defined in Rule 17f-5 under the 1940 Act). Some foreign banks and securities depositories may be recently organized or new to the foreign custody business. There may be limited or no regulatory oversight over their operations. Also, the laws of certain countries may put limits on the Fund's ability to recover its assets if a foreign bank, depository or issuer of a security, or any of their agents, goes bankrupt. In addition, it is often more expensive for the Fund to buy, sell and hold securities in certain foreign markets than in the United States. The increased expense of investing in foreign markets reduces the amount the Fund can earn on its investments and typically results in a higher operating expense ratio for the Fund than for investment companies invested only in the United States.
Certain foreign governments levy withholding or other taxes on dividend and interest income. Although in some countries a portion of these taxes are recoverable, the non-recovered portion of foreign withholding taxes will reduce the income received from investments in such countries.
From time to time, the Fund may have invested in certain sovereign debt obligations that are issued by, or certain companies that operate in or have dealings with, countries that become subject to sanctions or embargoes imposed by the U.S. government and the United Nations and/or countries identified by the U.S. government as state sponsors of terrorism. Investments in such countries may be adversely affected because, for example, the credit rating of the sovereign debt security may be lowered due to the country's instability or unreliability or the company may suffer damage to its reputation if it is identified as a company which operates in, or has dealings with, such countries. As an investor in such companies, the Fund will be indirectly subject to those risks.
Developing and Emerging Markets Risk
Investing in the securities of issuers located in developing and emerging market countries (and to a certain extent non-U.S. developed market countries) involves a high degree of risk and special considerations not typically associated with investing in the securities of U.S. issuers and other developed market issuers. Compared to the
| abrdn Asia-Pacific Income Fund, Inc. | 57 |
Additional Information Regarding the Fund (Unaudited) (continued)
United States and other developed countries, emerging market countries may have relatively unstable governments, economies which may be more likely to take extra-legal action with respect to companies, industries, assets, or foreign ownership than those in more developed markets and therefore issuers of such emerging markets may be more affected by the performance of such industries or sectors. Emerging market economies may be based on only a few industries and securities markets that trade a small number of securities. Securities issued by companies or governments located in emerging market countries tend to be especially volatile (particularly during market closures due to local market holidays or other reasons) and may be less liquid than securities traded in developed countries. Securities in these countries have been characterized by greater potential loss than securities of companies and governments located in developed countries. Investments in the securities of issuers located in emerging markets could be affected by risks associated with expropriation and/or nationalization, political or social instability, pervasiveness of corruption and crime, armed conflict, the impact on the economy of civil war, religious or ethnic unrest and the withdrawal or non-renewal of any license enabling the Fund to trade in securities of a particular country, confiscatory taxation, restrictions on transfers of assets, lack of uniform accounting and auditing standards, less publicly available financial and other information, diplomatic development which could affect U.S. investments in those countries, and potential difficulties in enforcing contractual obligations. Emerging market countries generally have less developed legal, accounting and financial reporting systems than those in more developed markets, which may reduce the scope or quality of financial information available to investors. Moreover, it can be more difficult for investors to bring litigation or enforce judgments against issuers in emerging markets or for U.S. regulators to bring enforcement actions against such issuers.
Countries in emerging markets are also more likely to experience high levels of inflation, deflation or currency devaluation, which could also hurt their economies and securities markets. For these and other reasons, investments in emerging markets are often considered speculative.
The economies of individual developing and emerging market countries may differ favourably or unfavorably from the United States economy in such respects as growth of gross domestic product, rate of inflation, currency depreciation, capital reinvestment, resource self-sufficiency and balance of payments position. Governments of many developing and emerging market countries have exercised and continue to exercise substantial influence over many aspects of the private sector. In some cases, the government owns or controls many companies, including some of the largest in the country.
Accordingly, government actions could have a significant effect on economic conditions in a developing or emerging market country and
on market conditions, prices and yields of securities in the Fund's portfolio. Moreover, the economies of developing and emerging market countries generally are heavily dependent upon international trade and, accordingly, have been and may continue to be adversely affected by trade barriers, exchange controls, managed adjustments in relative currency values and other protectionist measures imposed or negotiated by the countries with which they trade. These economies also have been and may continue to be adversely affected by economic conditions in the countries with which they trade. Many developing and emerging market economies are considered to be more politically volatile than the developed markets. Investments in securities of issuers in countries other than the U.S. may involve greater political risk, including in some countries, the possibility of nationalization of assets, expropriation or confiscatory taxation, restrictions on repatriation, and the establishment of foreign exchange controls, political changes, government regulation, overburdened and obsolete or unseasoned financial systems, environmental problems, less developed legal systems, economic or social instability or diplomatic developments (including war) which could affect adversely the economies of such countries or the value of the Fund's investments in those countries. Central authorities also tend to exercise a high degree of control over the economies and in many cases have ownership over core productive assets.
The legal systems in many developing and emerging market countries are less developed than those in more developed countries, with the administration of laws and regulations often subject to considerable discretion. Non-U.S. markets may offer less protection to investors than U.S. or other developed markets. It also may be difficult to obtain and enforce a judgment in a court outside of the United States.
Adequate public information on non-U.S. issuers may not be available, and it may be difficult to secure information regarding corporate actions on a timely basis. In general, there is less overall governmental supervision and regulation of securities exchanges, brokers, and listed companies than in the United States or other developed market countries.
Due to their strong reliance on international trade, most developing and emerging market economies tend to be sensitive both to economic changes in their own region and to changes affecting their major trading partners. These include changes in growth, inflation, foreign exchange rates, current account positions, government policies, taxation and tariffs.
Investments in developing and emerging market countries may entail purchasing securities issued by or on behalf of entities that are insolvent, bankrupt, in default or otherwise engaged in an attempt to reorganize or reschedule their obligations or in entities that have little or no proven credit rating or credit history. In any such case, the issuer's poor or deteriorating financial condition may increase the
| 58 | abrdn Asia-Pacific Income Fund, Inc. |
Additional Information Regarding the Fund (Unaudited) (continued)
likelihood that the Fund will experience losses or diminution in available gains due to bankruptcy, insolvency or fraud.
Foreign Currency Risk
The Fund may invest all of its assets in debt securities which are denominated in currencies other than the U.S. dollar. Currency exchange rates can fluctuate significantly over short periods and can be subject to unpredictable changes based on a variety of factors including political developments and currency controls by governments. A change in the value of a currency in which a security is denominated against the U.S. dollar will generally result in a change in the U.S. dollar value of the Fund's assets.
The currencies of developing and emerging markets, in particular, have experienced periods of steady declines or even sudden devaluations relative to the U.S. dollar. Some developing and emerging market currencies may not be internationally traded or may be subject to strict controls by local governments, resulting in undervalued or overvalued currencies. Some developing and emerging markets have experienced balance of payment deficits and shortages in foreign exchange reserves. Governments have responded by restricting currency conversions. Future restrictive exchange controls could prevent or restrict a company's ability to make dividend or interest payments in the original currency of an obligation (often U.S. dollars). In addition, even though the currencies of some developing and emerging markets may be convertible into U.S. dollars, the conversion rates may be artificial to their actual market values. If the exchange rate for a non-U.S. currency declines compared to the U.S. dollar, the Fund's NAV would decline. In addition, although much of the Fund's income will be received or realized in non-U.S. currencies, the Fund is required to compute and distribute its income in U.S. dollars. Therefore, for example, if the exchange rate for a non-U.S. currency declines after the Fund's income has been accrued and translated into U.S. dollars, but before the income has been received or converted into U.S. dollars, the Fund could be required to liquidate securities to make distributions. Similarly, if the exchange rate declines between the time the Fund incurs expenses in U.S. dollars and the time expenses are paid, the amount of non-U.S. currency required to be converted into U.S. dollars in order to pay such U.S. dollar expenses will be greater than the non-U.S. currency equivalent of the expenses at the time they were incurred.
Sovereign Debt Obligation Risk
Investments in developing and emerging market countries' government debt obligations involve special risks. Certain developing and emerging market countries have historically experienced, and may continue to experience, high rates of inflation, high interest rates, exchange rate fluctuations, large amounts of external debt, balance of payments and trade difficulties and extreme poverty and
unemployment. The issuer or governmental authority that controls the repayment of a developing and emerging market country's debt may not be able or willing to repay the principal and/or interest when due in accordance with the terms of such debt. A debtor's willingness or ability to repay principal and interest due in a timely manner may be affected by, among other factors, its cash flow situation and, in the case of a government debtor, the extent of its foreign reserves, the availability of sufficient foreign exchange on the date a payment is due, the relative size of the debt service burden to the economy as a whole, the government debtor's policy towards the International Monetary Fund and the political constraints to which a government debtor may be subject. Government debtors may default on their debt and may also be dependent on expected disbursements from foreign governments, multilateral agencies and others abroad to reduce principal and interest arrearages on their debt. The commitment on the part of these governments, agencies and others to make such disbursements may be conditioned on a debtor's implementation of economic reforms and/or economic performance and the timely service of such debtor's obligations. Failure to implement such reforms, achieve such levels of economic performance or repay principal or interest when due may result in the cancellation of such third parties' commitments to lend funds to the government debtor, which may further impair such debtor's ability or willingness to service its debts on a timely basis. Holders of government debt, including the Fund, may be requested to participate in the rescheduling of such debt and to extend further loans to government debtors.
As a result of the foregoing, a government obligor may default on its obligations. If such an event occurs, the Fund may have limited legal recourse against the issuer and/or guarantor. Remedies must, in some cases, be pursued in the courts of the defaulting party itself, and the ability of the holder of foreign government debt securities to obtain recourse may be subject to the political climate in the relevant country. In addition, no assurance can be given that the holders of more senior fixed income securities, such as commercial bank debt, will not contest payments to the holders of other foreign government debt securities in the event of default under their commercial bank loan agreements.
Government obligors in developing and emerging market countries are among the world's largest debtors to commercial banks, other governments, international financial organizations and other financial institutions. The issuers of the government debt securities in which the Fund may invest have in the past experienced substantial difficulties in servicing their external debt obligations, which led to defaults on certain obligations and the restructuring of certain indebtedness. Restructuring arrangements have included, among other things, reducing and rescheduling interest and principal payments by negotiating new or amended credit agreements, and
| abrdn Asia-Pacific Income Fund, Inc. | 59 |
Additional Information Regarding the Fund (Unaudited) (continued)
obtaining new credit to finance interest payments. Holders of certain foreign government debt securities may be requested to participate in the restructuring of such obligations and to extend further loans to their issuers. There can be no assurance that the foreign government debt securities in which the Fund may invest will not be subject to similar restructuring arrangements or to requests for new credit, which may adversely affect the Fund's holdings. Furthermore, certain participants in the secondary market for such debt may be directly involved in negotiating the terms of these arrangements and may therefore have access to information not available to other market participants. Investments in developing and emerging market countries' government debt securities involve currency risk. See "Foreign Currency Risk" above.
Corporate Debt Risk
The Fund may invest in debt securities of non-governmental issuers. Like all debt securities, corporate debt securities generally represent an issuer's obligation to repay to the investor (or lender) the amount borrowed plus interest over a specified time period. A typical corporate bond specifies a fixed date when the amount borrowed (principal) is due in full, known as the maturity date, and specifies dates when periodic interest (coupon) payments will be made over the life of the security.
Corporate debt securities come in many varieties and may differ in the way that interest is calculated, the amount and frequency of payments, the type of collateral, if any, and the presence of special features (e.g., conversion rights). The Fund's investments in corporate debt securities may include, but are not limited to, senior, junior, secured and unsecured bonds, notes and other debt securities, and may be fixed rate, floating rate, zero coupon and inflation linked, among other things.
Prices of corporate debt securities fluctuate and, in particular, are subject to several key risks including, but not limited to, interest rate risk, credit risk, prepayment risk and spread risk. The market value of a corporate bond may be affected by the credit rating of the corporation, the corporation's performance and perceptions of the corporation in the market place. There is a risk that the issuers of the corporate debt securities in which the Fund may invest may not be able to meet their obligations on interest or principal payments at the time called for by an instrument.
High-Yield Bonds and Other Lower-Rated Securities Risk
The Fund's investments in high-yield bonds (commonly referred to as "junk bonds") and other lower-rated securities will subject the Fund to substantial risk of loss. Investments in high-yield bonds are speculative and issuers of these securities are generally considered to be less financially secure and less able to repay interest and principal than issuers of investment-grade securities. Prices of high-yield bonds
tend to be very volatile. These securities are less liquid than investment-grade debt securities and may be difficult to price or sell, particularly in times of negative sentiment toward high-yield securities. The Fund's investments in lower rated securities may involve the following specific risks: greater risk of loss due to default because of the increased likelihood that adverse economic or company specific events will make the issuer unable to pay interest and/or principal when due; wider price fluctuations due to changing interest rates and/or adverse economic and business developments; and greater risk of loss due to declining credit quality.
Liquidity Risk
While the Fund ordinarily invests in debt securities for which there is an active secondary market, the Fund may invest in debt securities for which there is no established secondary market. The securities markets that exist in developing and emerging market countries are substantially smaller, less developed, less liquid and more volatile than the securities markets of the United States and other more developed countries. In addition, the markets for below investment grade securities may be substantially smaller, less developed, less liquid and more volatile than the markets for prime rated securities, which may make obtaining accurate market quotations for financial reporting purposes and for calculating net asset values more difficult. Market quotations on many non-U.S. debt and sub-investment grade securities may only be available from a limited number of dealers and may not necessarily represent firm bids from those dealers or prices for actual sales. The Fund may not be able readily to dispose of illiquid securities at prices that approximate those at which the Fund could sell such securities if they were more widely traded and, as result of such illiquidity, the Fund may have to sell other investments or engage in borrowing transactions if necessary to raise cash to meet its obligations. Illiquid securities generally trade at a discount. Settlement and custodial practices (including those involving securities settlement where fund assets may be released prior to receipt of payment) are also often less developed than those in U.S. or other developed markets, and may result in increased risk or substantial delays in the event of a failed trade or the insolvency of, or breach of duty by, a non-U.S. broker-dealer, securities depository or non-U.S. subcustodian.
Liquidity in developing markets may be low and transaction costs high. Reduced liquidity often creates higher volatility, as well as difficulties in obtaining accurate market quotations for financial reporting purposes and for calculating net asset values, and sometimes also an inability to buy and sell securities. Market quotations on many non-U.S. debt securities may only be available from a limited number of dealers and may not necessarily represent firm bids from those dealers or prices for actual sales.
| 60 | abrdn Asia-Pacific Income Fund, Inc. |
Additional Information Regarding the Fund (Unaudited) (continued)
Bank Loan Risk
Bank loans include floating and fixed-rate debt obligations. Floating rate loans are debt obligations issued by companies or other entities with floating interest rates that reset periodically. Bank loans may include, but are not limited to, term loans, delayed funding loans, bridge loans and revolving credit facilities. Loan interest will primarily take the form of assignments purchased in the primary or secondary market but may include participants. Floating rate loans are secured by specific collateral of the borrower and are senior to most other securities of the borrower (e.g., common stock or debt instruments) in the event of bankruptcy. Floating rate loans are often issued in connection with recapitalizations, acquisitions, leveraged buyouts, and refinancings. Floating rate loans are typically structured and administered by a financial institution that acts as the agent of the lenders participating in the floating rate loan. Floating rate loans may be acquired directly through the agent, as an assignment from another lender who holds a direct interest in the floating rate loan, or as a participation interest in another lender's portion of the floating rate loan.
There are a number of risks associated with an investment in bank loans including credit risk, interest rate risk, illiquid securities risk, and prepayment risk. There is also the possibility that the collateral securing a loan, if any, may be difficult to liquidate or be insufficient to cover the amount owed under the loan. These risks could cause the Fund to lose income or principal on a particular investment, which in turn could affect the Fund's returns. In addition, bank loans may settle on a delayed basis, resulting in the proceeds from the sale of such loans not being readily available to make additional investments. To the extent the extended settlement process gives rise to short-term liquidity needs, the Fund may hold additional cash or sell investments.
Convertible Securities Risk
The Fund may invest in convertible securities, which include bonds, debentures, notes, preferred stocks and other securities that entitle the holder to acquire common stock or other equity securities of the same or a different issuer. Convertible securities generally offer lower interest or dividend yields than non-convertible securities of similar quality. As with all debt securities, the market values of convertible securities tend to decline as interest rates increase and, conversely, to increase as interest rates decline. Convertible securities also tend to reflect the market price of the underlying stock in varying degrees, depending on the relationship of such market price to the conversion price in the terms of the convertible security. Convertible securities rank senior to common stock in an issuer's capital structure and consequently entail less risk than the issuer's common stock.
Asset-Backed Securities Risk
Payment of interest and repayment of principal on asset-backed securities is largely dependent upon the cash flows generated by the assets backing the securities and, in certain cases, supported by letters of credit, surety bonds or other credit enhancements. Asset-backed security values may also be affected by the creditworthiness of the servicing agent for the pool, the originator of the loans or receivables and any entities providing the credit enhancement. In addition, the underlying assets are subject to prepayments that shorten the securities' weighted average maturity and may lower their return.
Derivatives Risk
Consistent with its investment objective, the Fund may invest in a broad array of financial instruments and securities in which the value of the instrument or security is "derived" from the performance of an underlying asset or a "benchmark" such as a security index, an interest rate or a foreign currency ("derivatives"). Derivatives are most often used to manage interest rate, currency and credit risk, to increase or decrease exposure to an asset class or benchmark (as a hedge or to enhance return), or to create an investment position directly (often because it is more efficient or less costly than direct investment). There is no guarantee that these results can be achieved through the use of derivatives and any success in their use depends on a variety of factors including the ability of the Advisers to predict correctly the direction of interest rates, securities prices, currency exchange rates and other factors. The primary risk of derivatives is the same as the risk of the underlying asset, namely that the value of the underlying asset may increase or decrease. Adverse movements in the value of the underlying asset can expose the Fund to losses, which can be increased if derivatives are used to obtain leverage. In addition, risks in the use of derivatives include:
| • | an imperfect correlation between the price of derivatives and the movement of the securities prices, interest rates or currency exchange rates being hedged or replicated; |
| • | the possible absence of a liquid secondary market for any particular derivatives contract at any time and the need to continue making margin and settlement payments thereunder; |
| • | the potential loss if the counterparty to the transaction does not perform as promised; |
| • | the possible need to defer closing out certain positions to avoid adverse tax consequences, as well as the possibility that derivative transactions may result in acceleration of gain, deferral of losses or a change in the character of gain realized; |
| • | the risk that the financial intermediary "manufacturing" the over-the-counter derivative, being the most active market maker and offering the best price for repurchase, will not continue to create a credible market in the derivative; |
| • | because certain derivatives are "manufactured" by financial institutions, the risk that the Fund may develop a substantial exposure to financial institution counterparties; and |
| abrdn Asia-Pacific Income Fund, Inc. | 61 |
Additional Information Regarding the Fund (Unaudited) (continued)
| • | the risk that a full and complete appreciation of the complexity of derivatives and how future value is affected by various factors including changing interest rates, exchange rates and credit quality is not attained. |
Derivatives also may create operational and legal risks for the Fund. There is no guarantee that derivatives will provide successful results and any success in their use depends on a variety of factors including the ability of the Advisers to predict correctly the direction of interest rates, securities prices, currency exchange rates and other factors. Recent legislation calls for new regulation of the derivatives markets. The extent and impact of the regulation are not yet completely known and may not be known for some time. New regulation of derivatives may make them more costly, may limit their availability, or may otherwise adversely affect their value or performance.
The Fund may use interest rate swaps to hedge the Fund’s liability with respect to its leverage. A significant type of risk associated with interest rate swaps is the risk that the counterparty may default or file for bankruptcy, in which case the Fund would bear the risk of loss of the amount expected to be received under the swap agreement. There can be no assurance that the Fund will have an interest rate swap in place at any given time, nor can there be any assurance that, if an interest rate swap is in place, it will be successful in hedging the Fund's interest rate risk with respect to its leverage.
In October 2020, the SEC adopted Rule 18f-4 under the 1940 Act governing a registered investment company's use of derivatives, short sales, reverse repurchase agreements, and certain other instruments. Under Rule 18f-4, a fund's derivatives exposure is limited through a value-at-risk test and requires the adoption and implementation of a derivatives risk management program for certain derivatives users. However, subject to certain conditions, funds that do not invest heavily in derivatives may be deemed limited derivatives users and would not be subject to the full requirements of Rule 18f-4. Under the rule, when the Fund trades reverse repurchase agreements or similar financing transactions, including certain tender option bonds, it needs to aggregate the amount of indebtedness associated with the reverse repurchase agreements or similar financing transactions with the aggregate amount of any other senior securities representing indebtedness when calculating the Fund’s asset coverage ratio or treat all such transactions as derivatives transactions. In addition, under the rule, the Fund is permitted to invest in a security on a when-issued or forward-settling basis, or with a non-standard settlement cycle, and the transaction will be deemed not to involve a senior security (as defined under Section 18(g) of the 1940 Act), provided that, (i) the Fund intends to physically settle the transaction and (ii) the transaction will settle within 35 days of its trade date (the “Delayed-Settlement Securities Provision”). The Fund may otherwise engage in when-issued, forward-settling and non-standard settlement cycle securities transactions that do not meet the
conditions of the Delayed-Settlement Securities Provision so long as the Fund treats any such transaction as a “derivatives transaction” for purposes of compliance with the rule. Furthermore, under the rule, the Fund is permitted to enter into an unfunded commitment agreement, and such unfunded commitment agreement will not be subject to the asset coverage requirements under the 1940 Act, if the Fund reasonably believes, at the time it enters into such agreement, that it will have sufficient cash and cash equivalents to meet its obligations with respect to all such agreements as they come due. These requirements may limit the ability of the Fund to use derivatives, and reverse repurchase agreements and similar financing transactions as part of its investment strategies. These requirements may increase the cost of the Fund’s investments and cost of doing business, which could adversely affect investors.
Hedging Strategy Risk
Certain of the investment techniques that the Fund may employ for hedging will expose the Fund to additional or increased risks.
There may be an imperfect correlation between changes in the value of the Fund's portfolio holdings and hedging positions entered into by the Fund, which may prevent the Fund from achieving the intended hedge or expose the Fund to risk of loss. In addition, the Fund's success in using hedge instruments is subject to the Advisers' ability to predict correctly changes in the relationships of such hedge instruments to the Fund's portfolio holdings, and there can be no assurance that the Advisers' judgment in this respect will be accurate. Consequently, the use of hedging transactions might result in a poorer overall performance for the Fund, whether or not adjusted for risk, than if the Fund had not hedged its portfolio holdings.
The Advisers are under no obligation to engage in any hedging strategies, and may, in their discretion, choose not to engage in hedging strategies. Even if the Advisers desire to hedge some of the Fund's risks, suitable hedging transactions may not be available or, if available, attractive. A failure to hedge may result in losses to the value of the Fund's investments.
Counterparty Risk
The Fund will be subject to credit risk with respect to the counterparties to the derivative contracts purchased or sold by the Fund. Recently, several broker-dealers and other financial institutions have experienced extreme financial difficulty, sometimes resulting in bankruptcy of the institution. Although the Advisers monitor the creditworthiness of the Fund's counterparties, there can be no assurance that the Fund's counterparties will not experience similar difficulties, possibly resulting in losses to the Fund.
If a counterparty becomes bankrupt, or otherwise fails to perform its obligations under a derivative contract due to financial difficulties, the Fund may experience significant delays in obtaining any recovery
| 62 | abrdn Asia-Pacific Income Fund, Inc. |
Additional Information Regarding the Fund (Unaudited) (continued)
under the derivative contract in a bankruptcy or other reorganization proceeding. The Fund may obtain only a limited recovery or may obtain no recovery in such circumstances.
Inflation Risk
Inflation risk is the risk that the value of assets or income from investments will be worth less in the future as inflation decreases the value of money. To the extent that inflation occurs, it will reduce the real value of dividends paid by the Fund and the Fund’s Common Shares. Most emerging market countries, in particular, have experienced substantial, and in some periods extremely high and volatile, rates of inflation. Inflation and rapid fluctuations in inflation rates have had and may continue to have very negative effects on the economies and securities markets globally. In an attempt to control inflation, wage and price controls have been imposed at times in certain countries.
LIBOR Risk
Under the Fund’s loan facilities, the Fund is charged interest on amounts borrowed at a variable rate, which may be based on the London Interbank Offered Rate (“LIBOR”) plus a spread. Additionally, the Fund may invest in certain debt securities, derivatives or other financial instruments that utilize LIBOR as a “benchmark” or “reference rate” for various interest rate calculations. In July 2017, the United Kingdom Financial Conduct Authority (“FCA”), which regulates the LIBOR administrator, announced that the FCA will no longer persuade or compel banks to submit rates for the calculation of LIBOR after 2021. However, for US dollar LIBOR, it now appears that the relevant date may be deferred to June 30, 2023 for the most common tenors (overnight and one, three, six and 12 months). As to those tenors, the LIBOR administrator has published a consultation regarding its intention to cease publication of US dollar LIBOR as of June 30, 2023 (instead of December 31, 2021, as previously expected), apparently based on continued rate submissions from banks. The FCA and other regulators have stated that they welcome the LIBOR Administrator’s action. An extension to 2023 would mean that many legacy US dollar LIBOR contracts would terminate before related LIBOR rates cease to be published. However, the same regulators emphasized that, despite any continued publication of US dollar LIBOR through June 30, 2023, no new contracts using US dollar LIBOR should be entered into after December 31, 2021. There is no assurance that LIBOR, of any particular currency and tenor, will continue to be published until any particular date.
Although the financial regulators and industry working groups have suggested alternative reference rates, such as the European Interbank Offer Rate (“EURIBOR”), Sterling Overnight Interbank Average Rate (“SONIA”) and Secured Overnight Financing Rate (“SOFR”), global consensus on alternative rates is incomplete, and the process for
amending existing contracts or instruments to transition from LIBOR remains unclear.
It is not possible to predict the effect that these announcements or any such discontinuance will have on LIBOR or on floating rate securities linked to LIBOR (“LIBOR-linked securities”). Many, but not all, LIBOR-linked securities have provisions that will change their interest rate basis upon the occurrence of certain benchmark transitions events. If the calculation agent (or other party in certain cases) for such a security determines that a benchmark transition event and its related benchmark replacement date have occurred with respect to LIBOR for particular LIBOR-linked securities, then a benchmark replacement may be selected by the calculation agent (or other party) in accordance with the benchmark transition provisions of the relevant securities.
The selection of a benchmark replacement, and any decisions, determinations or elections made by the calculation agent (or other party) in connection with implementing a benchmark replacement with respect to LIBOR-linked securities in accordance with the relevant benchmark transition provisions could result in adverse consequences to the interest rate, which could adversely affect the return on, value of and market for LIBOR-linked securities held by the Fund. Further, there is no assurance that the characteristics of any benchmark replacement will be similar to LIBOR, or that any benchmark replacement will produce the economic equivalent of LIBOR. In addition, these announcements and any additional regulatory or market changes, or any substitute reference rate and any pricing adjustments imposed by a regulator or by counterparties or otherwise may adversely affect the Fund’s performance and/or NAV. Until then, the Fund may continue to invest in instruments that reference such rates or otherwise use such reference rates due to favorable liquidity or pricing.
Market Events Risk
The market values of securities or other assets will fluctuate, sometimes sharply and unpredictably, due to changes in general market conditions, overall economic trends or events, governmental actions or intervention, actions taken by the U.S. Federal Reserve or foreign central banks, market disruptions caused by trade disputes or other factors, political developments, investor sentiment and other factors that may or may not be related to the issuer of the security or other asset. Economies and financial markets throughout the world are increasingly interconnected. Economic, financial or political events, trading and tariff arrangements, war, terrorism, natural disasters and other circumstances in one country or region could have profound impacts on global economies or markets. As a result, whether or not the Fund invests in securities of issuers located in or with significant exposure to the countries directly affected, the value and liquidity of the Fund's investments may be negatively affected. In
| abrdn Asia-Pacific Income Fund, Inc. | 63 |
Additional Information Regarding the Fund (Unaudited) (continued)
addition, any spread of an infectious illness, public health threat or similar issue could reduce consumer demand or economic output, result in market closures, travel restrictions or quarantines, and generally have a significant impact on the world economy, which in turn could adversely affect the Fund's investments.
Russia/Ukraine Risk. In February 2022, Russia commenced a military attack on Ukraine. The outbreak of hostilities between the two countries and the threat of wider spread hostilities could have a severe adverse effect on the region and global economies, including significant negative impacts on the markets for certain securities and commodities, such as oil and natural gas. In addition, sanctions imposed on Russia by the United States and other countries, and any sanctions imposed in the future, could have a significant adverse impact on the Russian economy and related markets. The price and liquidity of investments may fluctuate widely as a result of the conflict and related events. How long the armed conflict and related events will last cannot be predicted. These tensions and any related events could have a significant impact on Fund performance and the value of the Fund’s investments.
COVID-19 Risk. Economies and financial markets around the world, including the United States, have experienced increased volatility, losses, uncertainty and disruption to consumer demand, economic output and supply chains as a result of conditions associated with COVID-19. To the extent the impacts of COVID-19 continue, the Fund may experience negative impacts to its business that could exacerbate other risks of the Fund and may adversely affect the value and liquidity of the Fund’s investments.
The ultimate adverse impact of COVID-19 on economic and market conditions and on the Fund is difficult to accurately predict. The full extent of the impact and effects of COVID-19 will depend on future developments, including, among other factors, the duration and spread of the outbreak, along with related travel advisories, quarantines and restrictions, the recovery time of the disrupted supply chains and industries, the impact of labor market interruptions, the impact of government interventions, and uncertainty with respect to the duration of the global economic slowdown.
Europe Related Risk. A number of countries in Europe have experienced severe economic and financial difficulties. Many non-governmental issuers, and even certain governments, have defaulted on, or been forced to restructure, their debts; many other issuers have faced difficulties obtaining credit or refinancing existing obligations; financial institutions have in many cases required government or central bank support, have needed to raise capital, and/or have been impaired in their ability to extend credit; and financial markets in Europe and elsewhere have experienced extreme volatility and declines in asset values and liquidity. These difficulties
may continue, worsen or spread within and outside Europe. Responses to the financial problems by European governments, central banks and others, including austerity measures and reforms, may not work, may result in social unrest and may limit future growth and economic recovery or have other unintended consequences. Further defaults or restructurings by governments and others of their debt could have additional adverse effects on economies, financial markets and asset valuations around the world.
In addition, the United Kingdom left the European Union on January 31, 2020 ("Brexit"). The European Union and the United Kingdom reached an agreement in principle on the terms of certain agreements and declarations governing the ongoing relationship between the European Union and the United Kingdom, including the European Union-United Kingdom Trade and Cooperation Agreement (the "TCA"), which came into full force on May 1, 2021. Due to political uncertainty, it is not possible to anticipate the form or nature of the future trading relationship between the United Kingdom and the EU. The Fund may face risks associated with the potential uncertainty and consequences that may follow Brexit, including with respect to potential volatility in exchange rates and interest rates. Whether or not the Fund invests in securities of issuers located in Europe (whether the EU, Eurozone or UK) or with significant exposure to European, EU, Eurozone or UK issuers or countries, the unavoidable uncertainties and events related to Brexit could negatively affect the value and liquidity of the Fund's investments, increase taxes and costs of business and cause volatility in currency exchange rates and interest rates. Brexit could adversely affect the performance of contracts and European, UK or worldwide political, regulatory, economic or market conditions and could contribute to instability in political institutions, regulatory agencies and financial markets. Brexit could also lead to legal uncertainty and politically divergent national laws and regulations. Any of these effects of Brexit, and others that cannot be anticipated, could adversely affect the Fund's business, results of operations and financial condition. In addition, the risk that abrdn plc, the parent of the companies that provide investment advisory, sub-advisory and administration services to the Fund and which is headquartered in the UK, fails to adequately respond to Brexit could have significant customer, reputation and capital impacts for abrdn plc and its subsidiaries, including those providing services to the Fund; however, abrdn plc has detailed contingency planning in place to seek to manage the consequences of Brexit on the Fund and to manage any disruption to the Fund and to the services its subsidiaries provide. Given the fluidity and complexity of the situation, however, it cannot assure that the Fund will not be adversely impacted despite preparations.
Government Intervention in Financial Markets Risk
Instability in the financial markets has led the U.S. federal and state governments and foreign governments to take a number of
| 64 | abrdn Asia-Pacific Income Fund, Inc. |
Additional Information Regarding the Fund (Unaudited) (continued)
unprecedented actions designed to support certain financial institutions and segments of the financial markets that have experienced extreme volatility, and in some cases a lack of liquidity. U.S. federal and state governments and foreign governments, their regulatory agencies or self-regulatory organizations may take additional actions that affect the regulation of the securities in which the Fund invests, or the issuers of such securities, in ways that are unforeseeable. The withdrawal of U.S. government and foreign government support could negatively affect financial markets generally as well as reduce the value and liquidity of certain securities. The current market environment could make identifying investment risks and opportunities especially difficult for the Investment Manager.
Additionally, issuers of corporate fixed income securities might seek protection under the bankruptcy laws. Legislation or regulation may also change the way in which the Fund itself is regulated. Such legislation or regulation could limit or preclude the Fund's ability to achieve its investment objective. The Investment Manager will monitor developments and seek to manage the Fund's portfolio in a manner consistent with achieving the Fund's investment objective, but there can be no assurance that it will be successful in doing so.
In addition, policy and legislative changes in the United States and in other countries are affecting many aspects of financial regulation. New or revised laws or regulations may be imposed by the Security and Exchange Commission (“SEC”), the CFTC, the Internal Revenue Services (“IRS”), the U.S. Federal Reserve or other governmental regulatory authorities or self-regulatory organizations that could adversely affect the Fund’s performance. The Fund may also be adversely impacted by changes in the enforcement or interpretation of existing statutes and rules by governmental regulatory authorities or self-regulatory organizations. The impact of these changes on the markets, and the practical implications for market participants, may not be fully known for some time. Furthermore, volatile financial markets can expose the Fund to greater market and liquidity risk and potential difficulty in valuing portfolio instruments held by the Fund. The value of the Fund's holdings is also generally subject to the risk of future local, national, or global economic disturbances based on unknown weaknesses in the markets in which the Fund invests. In addition, it is not certain that the U.S. Government will intervene in response to a future market disturbance and the effect of any such future intervention cannot be predicted.
Cybersecurity Risk
The Fund is subject to direct cybersecurity risk. Cybersecurity incidents may allow an unauthorized party to gain access to Fund assets, customer data (including private shareholder information), or proprietary information, or cause the Fund, the Advisers and/or the Fund's service providers (including, but not limited to, Fund
accountants, custodians, sub-custodians and transfer agents) to suffer data breaches, data corruption or lose operational functionality.
Net Asset Value Discount
Shares of closed-end investment companies frequently trade at a discount from net asset value. This characteristic is a risk separate and distinct from the risk that net asset value will decrease. The Fund cannot predict whether its Shares in the future will trade at, below or above net asset value. This risk that shares of a closed-end fund might trade at a discount is more significant for investors who wish to sell their shares in a relatively short period of time. For those investors, realization of gain or loss on their investment is likely to be more dependent upon the existence of a premium or discount than upon portfolio performance.
Distribution Rate
It is the Fund's current policy to pay distributions on a monthly basis. If the Fund's investments do not generate sufficient income, the Fund may be required to liquidate a portion of its portfolio to fund these distributions, and therefore a portion or all of such distributions may represent a reduction of the shareholders' principal investment. Such liquidation might be at a time when independent investment judgment would not dictate such action, increasing the Fund's overall portfolio turnover (and related transaction costs) and making it more difficult for the Fund to achieve its investment objective.
Non-Diversification Risk
The Fund is classified as a "non-diversified" management investment company under the 1940 Act. This means that the Fund is not subject to limits under the 1940 Act as to the proportion of its assets that may be invested in the securities of a single issuer. As a non-diversified investment company, the Fund may therefore invest its assets in securities of a smaller number of issuers or may invest a larger portion of its assets in a single issuer than a diversified fund, and, as a result, would be more susceptible than a diversified fund to any single corporate, political, geographic or regulatory occurrence. Although the Fund must comply with certain diversification requirements in order to qualify as a regulated investment company under the Internal Revenue Code of 1986, as amended ("Code"), the Fund may be more susceptible to any single economic, political or regulatory occurrence than would be the case if it had elected to diversify its holding sufficiently to be classified as a "diversified" management investment company under the 1940 Act. The Fund, however, intends to comply with the diversification requirements imposed by the Code, for qualification as a regulated investment company.
| abrdn Asia-Pacific Income Fund, Inc. | 65 |
Additional Information Regarding the Fund (Unaudited) (continued)
Conflicts of Interest Risk
The Advisers’ advisory fees are based on net assets plus the amount of any borrowings for investment purposes. Consequently, the Advisers will benefit from an increase in the Fund's net assets resulting from an offering.
Additionally, the portfolio managers' management of "other accounts" may give rise to potential conflicts of interest in connection with their management of the Fund's investments, on the one hand, and the investments of the other accounts, on the other. The other accounts may have the same investment objective as the Fund. Therefore, a potential conflict of interest may arise as a result of the identical investment objectives, whereby the portfolio manager could favor one account over another. However, the Advisers believe that these risks are mitigated by the fact that: (i) accounts with like investment strategies managed by a particular portfolio manager are generally managed in a similar fashion, subject to exceptions to account for particular investment restrictions or policies applicable only to certain accounts, differences in cash flows and account sizes, and similar factors; and (ii) portfolio manager personal trading is monitored to avoid potential conflicts. In addition, the Advisers have adopted trade allocation procedures that require equitable allocation of trade orders for a particular security among participating accounts.
In some cases, another account managed by the same portfolio manager may compensate the Advisers based on the performance of the portfolio held by that account. The existence of such a performance-based fee may create additional conflicts of interest for the portfolio manager in the allocation of management time, resources and investment opportunities.
Another potential conflict could include instances in which securities considered as investments for the Fund also may be appropriate for other investment accounts managed by the Advisers or their affiliates. Whenever decisions are made to buy or sell securities by the Fund and one or more of the other accounts simultaneously, the Advisers may aggregate the purchases and sales of the securities and will allocate the securities transactions in a manner that it believes to be equitable under the circumstances. As a result of the allocations, there may be instances where the Fund will not participate in a transaction that is allocated among other accounts. While these aggregation and allocation policies could have a detrimental effect on the price or amount of the securities available to the Fund from time to time, it is the opinion of the Advisers that the benefits from the policies outweigh any disadvantage that may arise from exposure to simultaneous transactions. The Advisers have adopted policies that are designed to eliminate or minimize conflicts of interest, although there is no guarantee that procedures adopted under such policies will detect each and every situation in which a conflict arises.
From time to time, the Advisers may seed proprietary accounts for the purpose of evaluating a new investment strategy that eventually may be available to clients through one or more product structures. Such accounts also may serve the purpose of establishing a performance record for the strategy. The management by the Advisers of accounts with proprietary interests and nonproprietary client accounts may create an incentive to favor the proprietary accounts in the allocation of investment opportunities, and the timing and aggregation of investments. The Advisers' proprietary seed accounts may include long-short strategies, and certain client strategies may permit short sales. A conflict of interest arises if a security is sold short at the same time as a long position, and continuous short selling in a security may adversely affect the stock price of the same security held long in client accounts. The Advisers have adopted various policies to mitigate these conflicts.
Situations may occur when the Fund could be disadvantaged because of the investment activities conducted by the Advisers and their affiliates for other accounts. Such situations may be based on, among other things, the following: (1) legal or internal restrictions on the combined size of positions that may be taken for the Fund or the other accounts, thereby limiting the size of the Fund's position; (2) the difficulty of liquidating an investment for the Fund or the other accounts where the market cannot absorb the sale of the combined position; or (3) regulatory restrictions on transaction with affiliates.
The Advisers and their respective principals, officers, employees and affiliates may buy and sell securities or other investments for their own accounts and may have actual or potential conflicts of interest with respect to investments made on the Fund's behalf. As a result of differing trading and investment strategies or constraints, positions may be taken by principals, officers, employees and affiliates of the Advisers that are the same as, different from or made at a different time from positions taken for the Fund. Further, the Advisers may at some time in the future manage additional investment funds with the same investment objective as the Fund.
Anti-Takeover Charter Provisions
The Fund’s charter and by-laws contain several provisions that may be regarded as “anti-takeover” because they have the effect of maintaining continuity of management. Also, charter provisions subject the Fund to certain provisions of the Maryland General Corporation Law with respect to unsolicited takeovers.
Repurchase Agreement Risk
Repurchase agreements may involve risks in the event of default or insolvency of the seller, including possible delays or restrictions with respect to the Fund's ability to dispose of the underlying securities, and the possibility that the collateral might not be sufficient to cover any losses incurred by the Fund.
| 66 | abrdn Asia-Pacific Income Fund, Inc. |
Additional Information Regarding the Fund (Unaudited) (concluded)
Securities Lending Risk
In connection with its loans of portfolio securities, the Fund may be exposed to the risk of delay in recovery of the loaned securities or possible loss of rights in the collateral should the borrower become insolvent. The Fund also bears the risk of loss on the investment of cash collateral. There is also the risk that, in the event of default by the borrower, the collateral might not be sufficient to cover any losses incurred by the Fund. There can be no assurance that the return to the Fund from a particular loan, or from its loans overall, will exceed the related costs and any related losses.
Tax Risk
The Fund may invest in securities of which the federal income tax treatment may not be clear or may be subject to recharacterization by the IRS. It could be more difficult for the Fund to comply with the United States tax requirements applicable to regulated investment companies, or with other tax requirements applicable to foreign investors, if the tax characterization of the Fund's investments or the tax treatment of the income from such investments were successfully challenged by the IRS.
EFFECTS OF LEVERAGE
The following table is furnished in response to requirements of the SEC. It is designed to, among other things, illustrate the effects of leverage through the use of senior securities, as that term is defined under Section 18 of the 1940 Act, on Common Share total return, assuming investment portfolio total returns (consisting of income and changes in the value of investments held in a Fund’s portfolio) of -10%, -5%, 0%, 5% and 10%. The table below reflects the Fund’s continued use of senior securities, Preferred Shares, the revolving credit facility and reverse repurchase agreements, as applicable, as of October 31, 2022 as a percentage of total managed assets (including assets attributable to such leverage), the estimated annual effective Preferred Share dividend rate and interest expense rate payable by the Fund on such instruments (based on market conditions as of October 31, 2022), and the annual return that the Fund’s portfolio must experience (net of expenses) in order to cover such costs. The information below does not reflect the Fund’s use of certain other forms of economic leverage achieved through the use of other instruments or transactions not considered to be senior securities under the 1940 Act, such as covered reverse repurchase agreements, covered credit default swaps or other derivative instruments, if any.
The assumed investment portfolio returns in the table below are hypothetical figures and are not necessarily indicative of the investment portfolio returns experienced or expected to be experienced by the Fund. Your actual returns may be greater or less
than those appearing below. In addition, actual borrowing expenses associated with borrowings used by the Fund may vary frequently and may be significantly higher or lower than the rate used for the example below.
Assumed
annual
returns on
the Fund's
portfolio
(net of
expenses) | (10)% | (5)% | 0% | 5% | 10% |
Corresponding
return of
shareholder | (17.2%) | (9.7%) | (2.1%) | 5.5% | 13.1% |
Based on estimated indebtedness of $365,000,000 (representing approximately 34.1% of the Fund’s Managed Assets as of October 31, 2022), at a weighted annual interest rate of 4.02% (effective interest rate as of October 31, 2022 on the senior securities, revolving credit facility and preferred shares), the Fund’s investment portfolio at fair value would have to produce an annual return of approximately 1.37% to cover annual interest payments on the estimated debt.
Common Share total return is composed of two elements – the distributions paid by the Fund to holders of Common Shares (the amount of which is largely determined by the net investment income of the Fund after paying dividend payments on any preferred shares issued by the Fund and expenses on any forms of leverage outstanding) and gains or losses on the value of the securities and other instruments the Fund owns. As required by SEC rules, the table assumes that the Fund is more likely to suffer capital losses than to enjoy capital appreciation. For example, to assume a total return of 0%, the Fund must assume that the income it receives on its investments is entirely offset by losses in the value of those investments. This table reflects hypothetical performance of the Fund’s portfolio and not the actual performance of the Fund’s Common Shares, the value of which is determined by market forces
and other factors.
Should the Fund elect to add additional leverage to its portfolio, any benefits of such additional leverage cannot be fully achieved until the proceeds resulting from the use of such leverage have been received by the Fund and invested in accordance with the Fund’s investment objective and policies. As noted above, the Fund’s willingness to use additional leverage, and the extent to which leverage is used at any time, will depend on many factors, including, among other things, the Advisers' assessment of the yield curve environment, interest rate trends, market conditions and other factors.
| abrdn Asia-Pacific Income Fund, Inc. | 67 |
Dividend Reinvestment and Optional Cash Purchase Plan (Unaudited)
The Fund intends to distribute to stockholders substantially all of its net investment income and to distribute any net realized capital gains at least annually. Net investment income for this purpose is income other than net realized long-term and short-term capital gains net of expenses. Pursuant to the Dividend Reinvestment and Optional Cash Purchase Plan (the “Plan”), stockholders whose shares of common stock are registered in their own names will be deemed to have elected to have all distributions automatically reinvested by Computershare Trust Company N.A. (the “Plan Agent”) in the Fund shares pursuant to the Plan, unless such stockholders elect to receive distributions in cash. Stockholders who elect to receive distributions in cash will receive such distributions paid by check in U.S. Dollars mailed directly to the stockholder by the Plan Agent, as dividend paying agent. In the case of stockholders such as banks, brokers or nominees that hold shares for others who are beneficial owners, the Plan Agent will administer the Plan on the basis of the number of shares certified from time to time by the stockholders as representing the total amount registered in such stockholders’ names and held for the account of beneficial owners that have not elected to receive distributions in cash. Investors that own shares registered in the name of a bank, broker or other nominee should consult with such nominee as to participation in the Plan through such nominee and may be required to have their shares registered in their own names in order to participate in the Plan. Please note that the Fund does not issue certificates so all shares will be registered in book entry form. The Plan Agent serves as agent for the stockholders in administering the Plan. If the Directors of the Fund declare an income dividend or a capital gains distribution payable either in the Fund’s common stock or in cash, nonparticipants in the Plan will receive cash and participants in the Plan will receive common stock, to be issued by the Fund or purchased by the Plan Agent in the open market, as provided below. If the market price per share (plus expected per share fees) on the valuation date equals or exceeds NAV per share on that date, the Fund will issue new shares to participants at NAV; provided, however, that if the NAV is less than 95% of the market price on the valuation date, then such shares will be issued at 95% of the market price. The valuation date will be the payable date for such distribution or dividend or, if that date is not a trading day on the New York Stock Exchange, the immediately preceding trading date. If NAV exceeds the market price of Fund shares at such time, or if the Fund should declare an income dividend or capital gains distribution payable only in cash, the Plan Agent will, as agent for the participants, buy Fund shares in the open market, on the New York Stock Exchange or elsewhere, for the participants’ accounts on, or shortly after, the payment date. If, before the Plan Agent has completed its purchases, the market price exceeds the NAV of a Fund share, the average per share purchase price paid by the Plan Agent may exceed the NAV of the Fund’s shares, resulting in the acquisition of fewer shares than if the distribution had been paid in shares issued by the Fund on the
dividend payment date. Because of the foregoing difficulty with respect to open-market purchases, the Plan provides that if the Plan Agent is unable to invest the full dividend amount in open-market purchases during the purchase period or if the market discount shifts to a market premium during the purchase period, the Plan Agent will cease making open-market purchases and will receive the uninvested portion of the dividend amount in newly issued shares at the close of business on the last purchase date.
Participants have the option of making additional cash payments of a minimum of $50 per investment (by check, one-time online bank debit or recurring automatic monthly ACH debit) to the Plan Agent for investment in the Fund’s common stock, with an annual maximum contribution of $250,000. The Plan Agent will wait up to three business days after receipt of a check or electronic funds transfer to ensure it receives good funds. Following confirmation of receipt of good funds, the Plan Agent will use all such funds received from participants to purchase Fund shares in the open market on the 25th day of each month or the next trading day if the 25th is not a trading day.
If the participant sets up recurring automatic monthly ACH debits, funds will be withdrawn from his or her U.S. bank account on the 20th of each month or the next business day if the 20th is not a banking business day and invested on the next investment date. The Plan Agent maintains all stockholder accounts in the Plan and furnishes written confirmations of all transactions in an account, including information needed by stockholders for personal and tax records. Shares in the account of each Plan participant will be held by the Plan Agent in the name of the participant, and each stockholder’s proxy will include those shares purchased pursuant to the Plan. There will be no brokerage charges with respect to common shares issued directly by the Fund. However, each participant will pay a per share fee of $0.02 incurred with respect to the Plan Agent’s open market purchases in connection with the reinvestment of dividends, capital gains distributions and voluntary cash payments made by the participant. Per share fees include any applicable brokerage commissions the Plan Agent is required to pay.
Participants also have the option of selling their shares through the Plan. The Plan supports two types of sales orders. Batch order sales are submitted on each market day and will be grouped with other sale requests to be sold. The price will be the average sale price obtained by Computershare’s broker, net of fees, for each batch order and will be sold generally within 2 business days of the request during regular open market hours. Please note that all written sales requests are always processed by Batch Order. ($10 and $0.12 per share). Market Order sales will sell at the next available trade. The shares are sold real time when they hit the market, however an available trade must be presented to complete this transaction. Market Order sales may only
| 68 | abrdn Asia-Pacific Income Fund, Inc. |
Dividend Reinvestment and Optional Cash Purchase Plan (Unaudited) (concluded)
be requested by phone at 1-800-647-0584 or using Investor Center through www.computershare.com/buyaberdeen. ($25 and $0.12 per share).
The receipt of dividends and distributions under the Plan will not relieve participants of any income tax that may be payable on such dividends or distributions. The Fund or the Plan Agent may terminate the Plan as applied to any voluntary cash payments made and any dividend or distribution paid subsequent to notice of the termination sent to members of the Plan at least 30 days prior to the record date for such dividend or distribution. The Plan also may be amended by
the Fund or the Plan Agent, but (except when necessary or appropriate to comply with applicable law or the rules or policies of the Securities and Exchange Commission or any other regulatory authority) only by mailing a written notice at least 30 days prior to the effective date to the participants in the Plan. All correspondence concerning the Plan should be directed to the Plan Agent by phone at 1-800-647-0584, using Investor Center through www.computershare.com/buyaberdeen or in writing to Computershare Trust Company N.A., P.O. Box 43006, Providence, RI 02940-3078.
| abrdn Asia-Pacific Income Fund, Inc. | 69 |
Management of the Fund (Unaudited)
As of October 31, 2022
The names, years of birth and business addresses of the Directors and officers of the Fund as of October 31, 2022, their principal occupations during the past five years, the number of portfolios each Director oversees and other directorships they hold are provided in the tables below. Directors that are deemed “interested persons” (as that term is defined in Section 2(a)(19) of the Investment Company Act of 1940, as amended) of the Fund or the Fund's Advisers are included in the table below under the heading “Interested Directors.” Directors who are not interested persons, as described above, are referred to in the table below under the heading “Independent Directors.” abrdn Inc., its parent company abrdn plc, and its advisory affiliates are collectively referred to as “abrdn” in the tables below.
Name, Address and
Year of Birth | Position(s) Held
with the Fund | Term of Office
and Length of
Time Served | Principal Occupation(s)
During Past Five Years | Number of
Funds in
Fund Complex*
Overseen by
Director | Other
Directorships
Held by
Director** |
| Interested Directors | | | | | |
Stephen Bird†
c\o abrdn Inc.
1900 Market Street
Suite 200
Philadelphia, PA 19103
Year of Birth: 1967 | Class I Director; Vice President | Term expires 2025; Director since 2021 | Mr. Bird joined the Board of abrdn plc in July 2020 as Chief Executive-Designate, and was formally appointed Chief Executive Officer in September 2020. Previously, Mr. Bird served as chief executive officer of global consumer banking at Citigroup from 2015, retiring from the role in November 2019. His responsibilities encompassed all consumer and commercial banking businesses in 19 countries, including retail banking and wealth management, credit cards, mortgages, and operations and technology supporting these businesses. Prior to this, Mr. Bird was chief executive for all of Citigroup’s Asia Pacific business lines across 17 markets in the region, including India and China. Mr. Bird joined Citigroup in 1998, and during his 21 years with the company he held a number of leadership roles in banking, operations and technology across its Asian and Latin American businesses. Before this, he held management positions in the UK at GE Capital – where he was director of UK operations from 1996 to 1998 – and at British Steel. | 28 | None. |
| Independent Directors | | | | | |
Radhika Ajmera
c\o abrdn Inc.
1900 Market Street
Suite 200
Philadelphia, PA 19103
Year of Birth: 1964 | Class III Director | Term expires 2024; Director since 2021 | Ms. Ajmera was appointed Chair of abrdn Japan Equity Fund Inc in 2017, having served as a director since 2014. She has been an independent nonexecutive director of abrdn Asia-Pacific Income Fund VCC since 2015. She is also an independent non-executive director of abrdn Funds since 2020 and abrdn Global Income Fund Inc, abrdn Asia-Pacific Income Fund Inc and abrdn Australia Equity Fund Inc since 2021. She has over 20 years’ experience in fund management, predominantly in emerging markets. She has also held a number of UK closed end fund non-executive directorships. Ms. Ajmera is a graduate of the London School of Economics. | 23 | None. |
| 70 | abrdn Asia-Pacific Income Fund, Inc. |
Management of the Fund (Unaudited) (continued)
As of October 31, 2022
Name, Address and
Year of Birth | Position(s) Held
with the Fund | Term of Office
and Length of
Time Served | Principal Occupation(s)
During Past Five Years | Number of
Funds in
Fund Complex*
Overseen by
Director | Other
Directorships
Held by
Director** |
P. Gerald Malone
c\o abrdn Inc.
1900 Market Street
Suite 200
Philadelphia, PA 19103
Year of Birth: 1950 | Chairman of the Board; Class II Director | Term expires 2023; Director since 2001 | Mr. Malone is, by profession, a lawyer of over 40 years. Currently, he is a non-executive director of a number of U.S. companies, including Medality Medical (medical technology company) since 2018. He is also Chairman of many of the open and closed end funds in the Fund Complex. He previously served as a non-executive director of U.S. healthcare company Bionik Laboratories Corp. (2018 - July 2022), as Independent Chairman of UK companies Crescent OTC Ltd (pharmaceutical services) until February 2018; and fluidOil Ltd. (oil services) until June 2018; U.S. company Rejuvenan llc (wellbeing services) until September 2017 and as chairman of UK company Ultrasis plc (healthcare software services company) until October 2014. Mr. Malone was previously a Member of Parliament in the U.K. from 1983 to 1997 and served as Minister of State for Health in the U.K. government from 1994 to 1997. | 28 | None. |
William J. Potter
c\o abrdn Inc.
1900 Market Street
Suite 200
Philadelphia, PA 19103
Year of Birth: 1948 | Preferred Share Director | Term expires 2024; Director since 1992 | Mr. Potter has been the Chairman of Arsenal Square Holdings (consulting and advisory) since 2018, a Director of Alexandria Bancorp (international banking and trustee services) since 1989, a Director of the National Foreign Trade Council (international trade) 1983-2017, director of Howell Biopharma Ltd (healthcare) since 2018, director and chairman of Arrow Robotics Ltd (technology) since 2018, and advisory board member of Nuvve Holding Corporation (technology) since 2020. He also serves on the boards or advisory boards of a number of private companies and charities including the Queen Elizabeth September 11th Garden and the National Foundation for Cancer Research. | 3 | None. |
Moritz Sell
c\o abrdn Inc.
1900 Market Street
Suite 200
Philadelphia, PA 19103
Year of Birth: 1967 | Class I Director | Term expires 2025; Director since 2018 | Mr. Sell currently serves as a Principal at Edison Holdings GmbH (commercial real estate and venture capital) (since October 2015). In addition, Mr. Sell served as Senior Advisor to Markston International LLC, an Independent Investment manager (from 2014 through 2019). | 3 | Swiss Helvetia Fund (since June 2017) and High Income Securities Fund (since June 2018). |
| * | As of October 31, 2022, the Fund Complex consists of: abrdn Income Credit Strategies Fund, abrdn Asia-Pacific Income Fund, Inc., abrdn Global Income Fund, Inc., abrdn Australia Equity Fund, Inc., abrdn Emerging Markets Equity Income Fund, Inc., abrdn Japan Equity Fund, Inc., The India Fund, Inc., abrdn Global Dynamic Dividend Fund, abrdn Total Dynamic Dividend Fund, abrdn Global Premier Properties Fund, abrdn Global Infrastructure Income Fund, abrdn Funds (which consists of 19 portfolios) and abrdn ETFs (which consists of 3 portfolios). For the purposes of listing the number of funds in the Fund Complex overseen by each Board member, each portfolio of abrdn Funds and abrdn ETFs is counted individually. |
| ** | Current directorships (excluding Fund Complex) as of October 31, 2022 held in (1) any other investment companies registered under the 1940 Act, (2) any company with a class of securities registered pursuant to Section 12 of the Securities Exchange Act of 1934, as amended (the “1934 Act”) or (3) any company subject to the requirements of Section 15(d) of the Exchange Act. |
| † | Mr. Bird is considered to be an “interested person” of the Fund as defined in the 1940 Act because of his affiliation with the Investment Manager. |
| abrdn Asia-Pacific Income Fund, Inc. | 71 |
Management of the Fund (Unaudited) (continued)
As of October 31, 2022
Officers of the Fund
Name, Address and
Year of Birth | Position(s) Held
with the Fund | Term of Office*
and Length of
Time Served | Principal Occupation(s) During Past Five Years |
Kenneth Akintewe**
c\o abrdn Asia Limited
21 Church Street
#01-01 Capital Square Two
Singapore 049480
Year of Birth: 1980 | Vice President | Since 2014 | Currently, Head of Asian Sovereign Debt on the Asian Fixed Income Team at abrdn. Mr. Akintewe joined abrdn in 2002. |
Joseph Andolina**
c\o abrdn Inc.
1900 Market Street
Suite 200
Philadelphia, PA 19103
Year of Birth: 1978 | Chief Compliance Officer; Vice President – Compliance | Since 2017 | Currently, Chief Risk Officer – Americas for abrdn Inc. and serves as the Chief Compliance Officer for abrdn Inc. Prior to joining the Risk and Compliance Department, he was a member of abrdn Inc.'s Legal Department, where he served as US Counsel since 2012. |
Mark Baker**
c\o abrdn Asia Limited
21 Church Street
#01-01 Capital Square Two
Singapore 049480
Year of Birth: 1981 | Vice President | Since 2019 | Currently, Head of Fixed Income – Hong Kong on the Asian Fixed Income Team at abrdn. Mr. Baker joined abrdn in 2012. |
Chris Demetriou**
c\o abrdn Inc.
1900 Market Street
Suite 200
Philadelphia, PA 19103
Year of Birth: 1983 | Vice President | Since 2020 | Currently, Chief Executive Officer – UK, EMEA and Americas. Mr. Demetriou joined abrdn Inc. in 2013, as a result of the acquisition of SVG, a FTSE 250 private equity investor based in London. |
Sharon Ferrari**
c\o abrdn Inc.
1900 Market Street
Suite 200
Philadelphia, PA 19103
Year of Birth: 1977 | Vice President | Since 2009 | Currently, Senior Product Manager for abrdn Inc. Prior to that she was a Senior Fund Administration Manager for abrdn Inc. Ms. Ferrari joined the company in June 2008. |
Alan Goodson**
c\o abrdn Inc.
1900 Market Street
Suite 200
Philadelphia, PA 19103
Year of Birth: 1974 | Vice President | Since 2009 | Currently, Executive Director, Product & Client Solutions – Americas for abrdn Inc., overseeing Product Management & Governance , Product Development and Client Solutions for registered and unregistered investment companies in the U.S., Brazil and Canada. Mr. Goodson is Director and Vice President of abrdn Inc. and joined abrdn Inc. in 2000. |
Heather Hasson**
c\o abrdn Inc.
1900 Market Street
Suite 200
Philadelphia, PA 19103
Year of Birth: 1982 | Vice President | Since 2021 | Currently, Senior Product Solutions and Implementation Manager for abrdn Inc. Ms. Hasson joined the company in November 2006. |
Robert Hepp**
c\o abrdn Inc.
1900 Market Street
Suite 200
Philadelphia, PA 19103
Year of Birth: 1986 | Vice President | Since 2021 | Currently, Senior Product Governance Manager – US for abrdn Inc. Mr. Hepp joined abrdn Inc. as a Senior Paralegal in 2016. |
Megan Kennedy**
c\o abrdn Inc.
1900 Market Street
Suite 200
Philadelphia, PA 19103
Year of Birth: 1974 | Vice President and Secretary | Since 2008 | Currently, Director, Senior Product Governance for abrdn Inc. Ms. Kennedy joined abrdn Inc. in 2005. |
| 72 | abrdn Asia-Pacific Income Fund, Inc. |
Management of the Fund (Unaudited) (concluded)
As of October 31, 2022
Name, Address and
Year of Birth | Position(s) Held
with the Fund | Term of Office*
and Length of
Time Served | Principal Occupation(s) During Past Five Years |
Andrew Kim**
c\o abrdn Inc.
1900 Market Street
Suite 200
Philadelphia, PA 19103
Year of Birth: 1983 | Vice President | Since 2021 | Currently, Senior Product Governance Manager – US for abrdn Inc. Mr. Kim joined abrdn Inc. as a Product Manager in 2013. |
Brian Kordeck**
c\o abrdn Inc.
1900 Market Street
Suite 200
Philadelphia, PA 19103
Year of Birth: 1978 | Vice President | Since 2021 | Currently, Senior Product Manager – US for abrdn Inc. Mr. Kordeck joined abrdn Inc. as a Senior Fund Administrator in 2013. |
Michael Marsico**
c\o abrdn Inc.
1900 Market Street
Suite 200
Philadelphia, PA 19103
Year of Birth: 1980 | Vice President | Since 2021 | Currently, Senior Product Manager – US for abrdn Inc. Mr. Marsico joined abrdn Inc. as a Fund Administrator in 2014. |
Adam McCabe**
c\o abrdn Asia Limited
21 Church Street
#01-01 Capital Square Two
Singapore 049480
Year of Birth: 1979 | Vice President | Since 2011 | Currently, Head of Fixed Income – Asia Pacific at abrdn. Mr. McCabe joined abrdn in 2009 following the acquisition of certain asset management businesses from Credit Suisse. |
Andrea Melia**
c\o abrdn Inc.
1900 Market Street
Suite 200
Philadelphia, PA 19103
Year of Birth: 1969 | Treasurer and Principal Accounting Officer | Since 2009 | Currently, Vice President and Senior Director, Product Management for abrdn Inc. Ms. Melia joined abrdn Inc. in September 2009. |
Christian Pittard**
c/o abrdn Investments Limited
280 Bishopsgate
London, EC2M 4AG
Year of Birth: 1973 | President | Since 2009 | Currently, Group Head of Product Opportunities at abrdn and a Director of Aberdeen Asset Management PLC since 2010. Mr. Pittard joined abrdn from KPMG in 1999. |
Lucia Sitar**
c\o abrdn Inc.
1900 Market Street
Suite 200
Philadelphia, PA 19103
Year of Birth: 1971 | Vice President | Since 2008 | Currently, Vice President and Head of Product Management and Governance for abrdn Inc. since 2020. Previously, Ms. Sitar was Managing U.S. Counsel for abrdn Inc. She joined abrdn Inc. as U.S. Counsel in July 2007. |
| * | Officers hold their positions with the Fund until a successor has been duly elected and qualifies. Officers are elected annually at a meeting of the Board of Directors. |
| ** | Each officer may hold officer position(s) in one or more other funds which are part of the Fund Complex. |
Further information about the Fund's Directors and Officers is available in the Fund's Statement of Additional Information, which can be obtained without charge by calling (800) 522-5465.
| abrdn Asia-Pacific Income Fund, Inc. | 73 |
[THIS PAGE INTENTIONALLY LEFT BLANK]
[THIS PAGE INTENTIONALLY LEFT BLANK]
[THIS PAGE INTENTIONALLY LEFT BLANK]
Directors
P. Gerald Malone, Chairman
Radhika Ajmera
Stephen Bird
William J. Potter
Moritz Sell
Investment Manager
abrdn Asia Limited
21 Church Street
#01-01 Capital Square Two
Singapore 049480
Investment Sub-Adviser
abrdn Investments Limited
10 Queen's Terrace
Aberdeen, AB10 1XL
Scotland, United Kingdom
Administrator
abrdn Inc.
1900 Market Street, Suite 200
Philadelphia, PA 19103
Custodian
State Street Bank and Trust Co.
1 Heritage Drive, 3rd Floor
North Quincy, MA 02171
Transfer Agent
Computershare Trust Company, N.A.
P.O. Box 43006
Providence, RI 02940-3078
Independent Registered Public Accounting Firm
KPMG LLP
1601 Market Street
Philadelphia, PA 19103
Legal Counsel
Dechert LLP
1900 K Street N.W.
Washington D.C. 20006
Investor Relations
abrdn Inc.
1900 Market Street, Suite 200
Philadelphia, PA 19103
1-800-522-5465
Investor.Relations@abrdn.com
Notice is hereby given in accordance with Section 23(c) of the Investment Company Act of 1940, as amended, that the Fund may purchase, from time to time, shares of its common stock in the open market.
Shares of abrdn Asia-Pacific Income Fund, Inc. are traded on the NYSE American under the symbol “FAX”. Information about the Fund’s net asset value and market price is available at www.abrdnfax.com.
This report, including the financial information herein, is transmitted to the shareholders of abrdn Asia-Pacific Income Fund, Inc. for their general information only. It does not have regard to the specific investment objectives, financial situation and the particular needs of any specific person. Past performance is no guarantee of future results.
Item 2. Code of Ethics.
| (a) | As of October 31, 2022, abrdn Asia-Pacific Income Fund, Inc. (the “Fund” or the “Registrant”) had adopted a Code of Ethics that applies to the Registrant’s principal executive officer, principal financial officer, principal accounting officer or controller, or persons performing similar functions, regardless of whether these individuals are employed by the Registrant or a third party (the “Code of Ethics”). |
| (c) | There have been no amendments, during the period covered by this report, to a provision of the Code of Ethics. |
| (d) | During the period covered by this report, there were no waivers to the provisions of the Code of Ethics. |
| (f) | A copy of the Code of Ethics has been filed as an exhibit to this Form N-CSR. |
Item 3. Audit Committee Financial Expert.
The Registrant's Board of Directors has determined that Moritz Sell, a member of the Board of Directors’ Audit Committee, possesses the attributes, and has acquired such attributes through means, identified in instruction 2 of Item 3 to Form N-CSR to qualify as an “audit committee financial expert,” and has designated Mr. Sell as the Audit Committee’s financial expert. Mr. Sell is considered to be an “independent” director, as such term is defined in paragraph (a)(2) of Item 3 to Form N-CSR.
Item 4. Principal Accountant Fees and Services.
(a) – (d) Below is a table reflecting the fee information requested in Items 4(a) through (d):
Fiscal Year
Ended | | (a)
Audit Fees1 | | | (b)
Audit-Related Fees2 | | | (c)
Tax Fees3 | | | (d)
All Other Fees4 | |
| October 31, 2022 | | $ | 90,660 | | | $ | 0 | | | $ | 7,720 | | | $ | 0 | |
| Percentage approved pursuant to pre-approval exception5 | | | 0 | % | | | 0 | % | | | 0 | % | | | 0 | % |
| October 31, 2021 | | $ | 85,587 | | | $ | 0 | | | $ | 7,980 | | | $ | 0 | |
| Percentage approved pursuant to pre-approval exception5 | | | 0 | % | | | 0 | % | | | 0 | % | | | 0 | % |
1 “Audit Fees” are the aggregate fees billed for professional services for the audit of the Fund’s annual financial statements and services provided in connection with statutory and regulatory filings or engagements.
2 “Audit Related Fees” are the aggregate fees billed for assurance and related services reasonably related to the performance of the audit or review of financial statements that are not reported under “Audit Fees”. These fees include offerings related to the Fund’s common shares.
3 “Tax Fees” are the aggregate fees billed for professional services for tax advice, tax compliance, and tax planning. These fees include: federal and state income tax returns, review of excise tax distribution calculations and federal excise tax return.
4 “All Other Fees” are the aggregate fees billed for products and services other than “Audit Fees”, “Audit-Related Fees” and “Tax Fees”.
5 Pre-approval exception under Rule 2-01 of Regulation S-X. The pre-approval exception for services provided directly to the Fund waives the pre-approval requirement for services other than audit, review or attest services if: (A) the aggregate amount of all such services provided constitutes no more than 5% of the total amount of revenues paid by the Fund to its accountant during the fiscal year in which the services are provided; (B) the Fund did not recognize the services as non-audit services at the time of the engagement; and (C) the services are promptly brought to the Audit Committee’s attention, and the Committee (or its delegate) approves the services before the audit is completed.
| (e)(1) | The Registrant’s Audit Committee (the “Committee”) has adopted a Charter that provides that the Committee shall annually select, retain or terminate, and recommend to the Independent Trustees for their ratification, the selection, retention or termination, the Registrant’s independent auditor and, in connection therewith, to evaluate the terms of the engagement (including compensation of the independent auditor) and the qualifications and independence of the independent auditor, including whether the independent auditor provides any consulting, auditing or tax services to the Registrant’s investment adviser (the “Adviser”) or any sub-adviser, and to receive the independent auditor’s specific representations as to their independence, delineating all relationships that may affect the independent auditor’s independence, including the disclosures required by PCAOB Rule 3526 or any other applicable auditing standard. PCAOB Rule 3526 requires that, at least annually, the auditor: (1) disclose to the Committee in writing all relationships between the auditor and its related entities and the Registrant and its related entities that in the auditor’s professional judgment may reasonably be thought to bear on independence; (2) confirm in the letter that, in its professional judgment, it is independent of the Registrant within the meaning of the Securities Acts administered by the SEC; and (3) discuss the auditor���s independence with the audit committee. The Committee is responsible for actively engaging in a dialogue with the independent auditor with respect to any disclosed relationships or services that may impact the objectivity and independence of the independent auditor and for taking, or recommending that the full Board take, appropriate action to oversee the independence of the independent auditor. The Committee Charter also provides that the Committee shall review in advance, and consider approval of, any and all proposals by Management or the Adviser that the Registrant, the Adviser or their affiliated persons, employ the independent auditor to render “permissible non-audit services” to the Registrant and to consider whether such services are consistent with the independent auditor’s independence. “Permissible non-audit services” include any professional services, including tax services, provided to the Registrant by the independent auditor, other than those provided to the Registrant in connection with an audit or a review of the financial statements of the Registrant. Permissible non-audit services may not include: (i) bookkeeping or other services related to the accounting records or financial statements of the Registrant; (ii) financial information systems design and implementation; (iii) appraisal or valuation services, fairness opinions or contribution-in-kind reports; (iv) actuarial services; (v) internal audit outsourcing services; (vi) management functions or human resources; (vii) broker or dealer, investment adviser or investment banking services; (viii) legal services and expert services unrelated to the audit; and (ix) any other service the PCAOB determines, by regulation, is impermissible. Pre-approval by the Committee of any permissible non-audit services is not required so long as: (i) the aggregate amount of all such permissible non-audit services provided to the Registrant constitutes not more than 5% of the total amount of revenues paid by the Registrant to its auditor during the fiscal year in which the permissible non-audit services are provided; (ii) the permissible non-audit services were not recognized by the Registrant at the time of the engagement to be non-audit services; and (iii) such services are promptly brought to the attention of the Committee and approved by the Committee or its Delegate(s) prior to the completion of the audit. The Committee may delegate to one or more of its members (“Delegates”) authority to pre-approve permissible non-audit services to be provided to the Registrant. Any pre-approval determination of a Delegate shall be presented to the full Committee at its next meeting. Any pre-approval determination of a Delegate shall be presented to the full Committee at its next meeting. Pursuant to this authority, the Registrant’s Committee delegates to the Committee Chair, subject to subsequent ratification by the full Committee, up to a maximum amount of $25,000, which includes any professional services, including tax services, provided to the Registrant by its independent registered public accounting firm other than those provided to the Registrant in connection with an audit or a review of the financial statements of the Registrant. The Committee shall communicate any pre-approval made by it or a Delegate to the Adviser, who will ensure that the appropriate disclosure is made in the Registrant’s periodic reports required by Section 30 of the Investment Company Act of 1940, as amended, and other documents as required under the federal securities laws. |
| (e)(2) | None of the services described in each of paragraphs (b) through (d) of this Item involved a waiver of the pre-approval requirement by the Audit Committee pursuant to Rule 2-01 (c)(7)(i)(C) of Regulation S-X. |
The following table shows the amount of fees that KPMG LLP billed during the Fund’s last two fiscal years for non-audit services to the Registrant, and to the Adviser, and any entity controlling, controlled by or under common control with the Adviser that provides ongoing services to the Fund (“Affiliated Fund Service Provider”):
| Fiscal Year Ended | | Total Non-Audit Fees
Billed to Fund | | | Total Non-Audit Fees
billed to Adviser and
Affiliated Fund Service
Providers (engagements
related directly to the
operations and financial
reporting of the Fund) | | | Total Non-Audit Fees
billed to Adviser and
Affiliated Fund Service
Providers (all other
engagements) | | | Total | |
| October 31, 2022 | | $ | 0 | | | $ | 0 | | | $ | 1,108,929 | | | $ | 1,108,929 | |
| October 31, 2021 | | $ | 7,980 | | | $ | 0 | | | $ | 1,547,556 | | | $ | 1,555,536 | |
“Non-Audit Fees billed to Fund” for both fiscal years represent “Tax Fees” and “All Other Fees” billed to Fund in their respective amounts from the previous table.
Item 5. Audit Committee of Listed Registrants.
| (a) | The Registrant has a separately-designated standing Audit Committee established in accordance with Section 3(a)(58)(A) of the Exchange Act (15 U.S.C. 78c(a)(58)(A)). |
As of the fiscal year ended October 31, 2022, the Audit Committee members were:
Radhika Ajmera
P. Gerald Malone
William J. Potter
Moritz Sell
Item 6. Schedule of Investments.
(a) Included as part of the Report to Shareholders filed under Item 1 of this Form N-CSR.
(b) Not applicable.
Item 7. Disclosure of Proxy Voting Policies and Procedures for Closed-End Management Investment Companies.
Pursuant to the Registrant's Proxy Voting Policy and Procedures, the Registrant has delegated responsibility for its proxy voting to its Adviser, provided that the Registrant's Board of Directors has the opportunity to periodically review the Adviser's proxy voting policies and material amendments thereto.
The proxy voting policies of the Registrant are included herewith as Exhibit (c) and policies of the Adviser are included as Exhibit (d).
Item 8. Portfolio Managers of Closed-End Management Investment Companies.
(a)(1) PORTFOLIO MANAGER BIOGRAPHIES
The Fund is managed by abrdn’s Asia-Pacific fixed income team which also draws on the expertise of abrdn’s fixed income team globally. The Asia-Pacific fixed income team works in a collaborative fashion; all team members have both portfolio management and research responsibilities. The team is responsible for the day-to-day management of the Fund. As of the date of filing this report, the following individuals have primary responsibility for the day-to-day management of the Fund’s portfolio:
| Individual & Position | Past Business Experience |
Kenneth Akintewe
Head of Asian Sovereign Debt | Kenneth Akintewe is the Head of Asian Sovereign Debt on the Asia-Pacific fixed income team. Kenneth is responsible for coordinating Asian interest rate and foreign exchange strategy. He is also a Vice President and Officer for the abrdn Asia-Pacific Income Fund, abrdn Global Income Fund and abrdn Asia-Pacific Income Investment Company Limited. Following a graduate traineeship in 2002 with the Global Equities team in Glasgow, Kenneth joined the Global Fixed Income team in London in 2003. In his role as assistant fund manager he transferred to abrdn's Singapore office in 2004, in order to facilitate the incorporation of Asian fixed income into global bond portfolios, before joining the Asia-Pacific fixed income team in 2005 to focus on Asian local currency interest rate and foreign exchange strategy. Kenneth graduated with an MA in Economics and an MSc in International Banking and Financial Studies from Heriot-Watt University, Edinburgh, UK. |
Mark Baker Head of Fixed Income – Hong Kong | Mark Baker is the Head of Fixed Income - Hong Kong, within the Emerging Market Debt team and is responsible for covering Sovereign Debt. Mark began his investment career in 2001 at Henderson Global Investors before moving to Citigroup Asset Management. Prior to joining Standard Life (which merged with abrdn in August 2017) in 2012, Mark spent seven years at Threadneedle Investments as an Investment Specialist for Emerging Market Fixed Income. He graduated with a BA (Hons) in Business Studies from London Southbank University. Mark also holds the IMC and is a CFA® Charterholder. |
Tai Li-Yan Investment Manager | Tai Li Yian is an Investment Manager on the Asia Pacific fixed income team. Li Yian is responsible for undertaking fundamental research and making investment recommendations on Asian corporate credits. Li Yian joined the firm in 2014 as a Graduate Trainee. Li Yian graduated with a Bachelor of Commerce from the University of Melbourne and an MSc in Financial Economics from the University of Oxford. Li-Yian is a CFA® Charterholder. |
Adam McCabe
Head of Fixed Income Asia Pacific | Adam McCabe is the Head of Fixed Income - Asia Pacific at abrdn. Adam joined abrdn via the acquisition of certain asset management businesses from Credit Suisse in 2009. Adam worked for Credit Suisse since 2001, where he was a director/investment manager responsible for the development and implementation of its Asian currency and interest rate strategies. Before that, he was a member of Credit Suisse's Australian fixed income team, where he was responsible for interest rate and currency strategies. Adam was also Head of Fixed Income for Woori Credit Suisse Asset Management, Korea, where he was responsible for the fixed income and money market portfolio management, investment strategy and processes. Adam graduated with a BComm (First Class Honours and University Medal) from the University of Sydney, Australia and a Diploma in Global Finance from the Chinese University of Hong Kong. |
(a)(2) OTHER ACCOUNTS MANAGED BY PORTFOLIO MANAGERS.
The following chart summarizes information regarding other accounts for which each portfolio manager has day-to-day management responsibilities. Accounts are grouped into the following three categories: (1) registered investment companies; (2) other pooled investment vehicles; and (3) other accounts. To the extent that any of these accounts pay advisory fees that are based on account performance (“performance-based fees”), information on those accounts is provided separately. The figures in the chart below for the category of “registered investment companies” include the Fund. The “Other Accounts Managed” represents the accounts managed by the teams of which the portfolio manager is a member. The information in the table below is as of October 31, 2022.
Name of
Portfolio Manager | | Type of Accounts | | Other Accounts
Managed | | Total Assets ($M) | | Number of
Accounts
Managed for
Which
Advisory
Fee is Based
on
Performance | | Total Assets for
Which
Advisory Fee is
Based on
Performance ($M) | |
| Kenneth Akintewe | | Registered Investment Companies | | 6 | | $ | 1,431.72 | | 0 | | $ | 0 | |
| | | Pooled Investment Vehicles | | 41 | | $ | 4,733.25 | | 0 | | $ | 0 | |
| | | Other Accounts | | 34 | | $ | 9,631.29 | | 0 | | $ | 0 | |
| Mark Baker | | Registered Investment Companies | | 6 | | $ | 1,431.72 | | 0 | | $ | 0 | |
| | | Pooled Investment Vehicles | | 41 | | $ | 4,733.25 | | 0 | | $ | 0 | |
| | | Other Accounts | | 34 | | $ | 9,631.29 | | 0 | | $ | 0 | |
| Tai Li-Yan | | Registered Investment Companies | | 6 | | $ | 1,431.72 | | 0 | | $ | 0 | |
| | | Pooled Investment Vehicles | | 41 | | $ | 4,733.25 | | 0 | | $ | 0 | |
| | | Other Accounts | | 34 | | $ | 9,631.29 | | 0 | | $ | 0 | |
| Adam McCabe | | Registered Investment Companies | | 6 | | $ | 1,431.72 | | 0 | | $ | 0 | |
| | | Pooled Investment Vehicles | | 41 | | $ | 4,733.25 | | 0 | | $ | 0 | |
| | | Other Accounts | | 34 | | $ | 9,631.29 | | 0 | | $ | 0 | |
1 Includes accounts managed by the Global Emerging Markets Debt, Asian Fixed Income and Australian Fixed Income teams, of which the portfolio manager is a member.
POTENTIAL CONFLICTS OF INTEREST
The Adviser and its affiliates (collectively referred to herein as “abrdn”) serve as investment advisers for multiple clients, including the Registrant and other investment companies registered under the 1940 Act and private funds (such clients are also referred to below as “accounts”). The portfolio managers’ management of “other accounts” may give rise to potential conflicts of interest in connection with their management of the Registrant’s investments, on the one hand, and the investments of the other accounts, on the other. The other accounts may have the same investment objective as the Registrant. Therefore, a potential conflict of interest may arise as a result of the identical investment objectives, whereby the portfolio manager could favor one account over another. However, the Adviser believes that these risks are mitigated by the fact that: (i) accounts with like investment strategies managed by a particular portfolio manager are generally managed in a similar fashion, subject to exceptions to account for particular investment restrictions or policies applicable only to certain accounts, differences in cash flows and account sizes, and similar factors; and (ii) portfolio manager personal trading is monitored to avoid potential conflicts. In addition, the Adviser has adopted trade allocation procedures that require equitable allocation of trade orders for a particular security among participating accounts.
In some cases, another account managed by the same portfolio manager may compensate Aberdeen based on the performance-based fees with qualified clients. The existence of such a performance-based fee may create additional conflicts of interest for the portfolio manager in the allocation of management time, resources and investment opportunities.
Another potential conflict could include instances in which securities considered as investments for the Registrant also may be appropriate for other investment accounts managed by the Adviser or its affiliates. Whenever decisions are made to buy or sell securities for the Registrant and one or more of the other accounts simultaneously, the Adviser may aggregate the purchases and sales of the securities and will allocate the securities transactions in a manner that it believes to be equitable under the circumstances. As a result of the allocations, there may be instances where the Registrant will not participate in a transaction that is allocated among other accounts. While these aggregation and allocation policies could have a detrimental effect on the price or amount of the securities available to the Registrant from time to time, it is the opinion of the Adviser that the benefits from the policies outweigh any disadvantage that may arise from exposure to simultaneous transactions. The Registrant has adopted policies that are designed to eliminate or minimize conflicts of interest, although there is no guarantee that procedures adopted under such policies will detect each and every situation in which a conflict arises.
With respect to non-discretionary model delivery accounts (including UMA accounts) and discretionary SMA accounts, abrdn Inc. will utilize a third party service provider to deliver model portfolio recommendations and model changes to the Sponsors. abrdn Inc. seeks to treat clients fairly and equitably over time, by delivering model changes to our service provider and investment instructions for our other discretionary accounts to our trading desk, simultaneously or approximately at the same time. The service provider will then deliver the model changes to each Sponsor on a when-traded, randomized full rotation schedule. All Sponsors will be included in the rotation schedule, including SMA and UMA.
UMA Sponsors will be responsible for determining how and whether to implement the model portfolio or model changes and implementation of any client specific investment restrictions. The Sponsors are solely responsible for determining the suitability of the model portfolio for each model delivery client, executing trades and seeking best execution for such clients.
As it relates to SMA accounts, abrdn Inc. will be responsible for managing the account on the basis of each client’s financial situation and objectives, the day to day investment decisions, best execution, accepting or rejecting client specific investment restrictions and performance. The SMA Sponsors will collect suitability information and will provide a summary questionnaire for our review and approval or rejection. For dual contract SMAs, abrdn Inc. will collect a suitability assessment from the client, along with the Sponsor suitability assessment. Our third party service provider will monitor client specific investment restrictions on a day to day basis. For SMA accounts, model trades will be traded by the Sponsor or may be executed through a “step-out transaction,”- or traded away- from the client’s Sponsor if doing so is consistent with abrdn’s obligation to obtain best execution. When placing trades through Sponsor Firms (instead of stepping them out), we will generally aggregate orders where it is possible and in the client’s best interests. In the event we are not comfortable that a Sponsor can obtain best execution for a specific security and trading away is infeasible, we may exclude the security from the model.
Trading costs are not covered by the Wrap Program fee and may result in additional costs to the client. In some instances, step-out trades are executed without any additional commission, mark-up, or mark-down, but in many instances, the executing broker-dealer may impose a commission or a mark-up or mark-down on the trade. Typically, the executing broker will embed the added costs into the price of the trade execution, making it difficult to determine and disclose the exact added cost to clients. In this instance, these additional trading costs will be reflected in the price received for the security, not as a separate commission, on trade confirmations or on account statements. In determining best execution for SMA accounts, abrdn Inc. takes into consideration that the client will not pay additional trading costs or commission if executing with the Sponsor.
While UMA accounts are invested in the same strategies as and may perform similarly to SMA accounts, there are expected to be performance differences between them. There will be performance dispersions between UMAs and other types of accounts because abrdn does not have discretion over trading and there may be client specific restrictions for SMA accounts.
abrdn may have already commenced trading for its discretionary client accounts before the model delivery accounts have executed abrdn's recommendations. In this event, trades placed by the model delivery clients may be subject to price movements, particularly with large orders or where securities are thinly traded, that may result in model delivery clients receiving less favorable prices than our discretionary clients. abrdn has no discretion over transactions executed by model delivery clients and is unable to control the market impact of those transactions.
Timing delays or other operational factors associated with the implementation of trades may result in non-discretionary and model delivery clients receiving materially different prices relative to other client accounts. In addition, the constitution and weights of stocks within model portfolios may not always be exactly aligned with similar discretionary accounts. This may create performance dispersions within accounts with the same or similar investment mandate.
(a)(3)
DESCRIPTION OF COMPENSATION STRUCTURE
abrdn’s remuneration policies are designed to support its business strategy as a leading international asset manager. The objective is to attract, retain and reward talented individuals for the delivery of sustained, superior returns for abrdn’s clients and shareholders. abrdn operates in a highly competitive international employment market, and aims to maintain its strong track record of success in developing and retaining talent.
abrdn’s policy is to recognize corporate and individual achievements each year through an appropriate annual bonus scheme. The bonus is a single, fully discretionary variable pay award. The aggregate value of awards in any year is dependent on the group’s overall performance and profitability. Consideration is also given to the levels of bonuses paid in the market. Individual awards, which are payable to all members of staff, are determined by a rigorous assessment of achievement against defined objectives.
The variable pay award is composed of a mixture of cash and a deferred award, the portion of which varies based on the size of the award. Deferred awards are by default abrdn plc shares, with an option to put up to 50% of the deferred award into funds managed by abrdn. Overall compensation packages are designed to be competitive relative to the investment management industry.
Base Salary
abrdn’s policy is to pay a fair salary commensurate with the individual’s role, responsibilities and experience, and having regard to the market rates being offered for similar roles in the asset management sector and other comparable companies. Any increase is generally to reflect inflation and is applied in a manner consistent with other abrdn employees; any other increases must be justified by reference to promotion or changes in responsibilities.
Annual Bonus
The Remuneration Committee determines the key performance indicators that will be applied in considering the overall size of the bonus pool. In line with practices amongst other asset management companies, individual bonuses are not subject to an absolute cap. However, the aggregate size of the bonus pool is dependent on the group’s overall performance and profitability. Consideration is also given to the levels of bonuses paid in the market. Individual awards are determined by a rigorous assessment of achievement against defined objectives, and are reviewed and approved by the Remuneration Committee.
abrdn has a deferral policy which is intended to assist in the retention of talent and to create additional alignment of executives’ interests with abrdn’s sustained performance and, in respect of the deferral into funds managed by abrdn, to align the interest of portfolio managers with our clients.
Staff performance is reviewed formally at least once a year. The review process evaluates the various aspects that the individual has contributed to abrdn, and specifically, in the case of portfolio managers, to the relevant investment team. Discretionary bonuses are based on client service, asset growth and the performance of the respective portfolio manager. Overall participation in team meetings, generation of original research ideas and contribution to presenting the team externally are also evaluated.
In the calculation of a portfolio management team’s bonus, abrdn takes into consideration investment matters (which include the performance of funds, adherence to the company investment process, and quality of company meetings) as well as more subjective issues such as team participation and effectiveness at client presentations through key performance indicator scorecards. To the extent performance is factored in, such performance is not judged against any specific benchmark and is evaluated over the period of a year - January to December. The pre- or after-tax performance of an individual account is not considered in the determination of a portfolio manager’s discretionary bonus; rather the review process evaluates the overall performance of the team for all of the accounts the team manages.
Portfolio manager performance on investment matters is judged over all of the accounts the portfolio manager contributes to and is documented in the appraisal process. A combination of the team’s and individual’s performance is considered and evaluated.
Although performance is not a substantial portion of a portfolio manager’s compensation, abrdn also recognizes that fund performance can often be driven by factors outside one’s control, such as (irrational) markets, and as such pays attention to the effort by portfolio managers to ensure integrity of our core process by sticking to disciplines and processes set, regardless of momentum and ‘hot’ themes. Short-terming is thus discouraged and trading-oriented managers will thus find it difficult to thrive in the abrdn environment. Additionally, if any of the aforementioned undue risks were to be taken by a portfolio manager, such trend would be identified via abrdn’s dynamic compliance monitoring system.
In rendering investment management services, the Adviser may use the resources of additional investment adviser subsidiaries of abrdn plc. These affiliates have entered into a memorandum of understanding (“MOU”) pursuant to which investment professionals from each affiliate may render portfolio management, research or trading services to abrdn clients. Each investment professional who renders portfolio management, research or trading services under a MOU or personnel sharing arrangement (“Participating Affiliate”) must comply with the provisions of the Advisers Act, the 1940 Act, the Securities Act of 1933, the Exchange Act, and the Employee Retirement Income Security Act of 1974, and the laws of states or countries in which the Adviser does business or has clients. No remuneration is paid by the Fund with respect to the MOU/personnel sharing arrangements.
(a)(4)
Dollar Range of Equity Securities in the
Registrant Beneficially Owned by the Portfolio
Manager as of October 31, 2021 | | | | |
| Kenneth Akintewe | | | $1-$10,000 | |
| Mark Baker | | | None | |
| Tai Li-Yan | | | None | |
| Adam McCabe | | | $10,001-$50,000 | |
(b) Not applicable.
Item 9. Purchases of Equity Securities by Closed-End Management Investment Company and Affiliated Purchasers.
No such purchases were made by or on behalf of the Registrant during the period covered by the report.
Item 10. Submission of Matters to a Vote of Security Holders.
During the period ended October 31, 2022, there were no material changes to the procedures by which shareholders may recommend nominees to the Registrant’s Board of Directors.
Item 11. Controls and Procedures.
| | (a) | The Registrant’s principal executive and principal financial officers, or persons performing similar functions, have concluded that the Registrant’s disclosure controls and procedures (as defined in Rule 30a-3(c) under the Investment Company Act of 1940 (the “Act”) (17 CFR 270.30a-3(c)) are effective, as of a date within 90 days of the filing date of the report that includes the disclosure required by this paragraph, based on the evaluation of these controls and procedures required by Rule 30a-3(b) under the Act (17 CFR 270.30a3(b)) and Rule 13a-15(b) or 15d-15(b) under the Securities Exchange Act of 1934, as amended (17 CFR 240.13a-15(b) or 240.15d15(b)). |
| | (b) | There were no changes in the Registrant’s internal control over financial reporting (as defined in Rule 30a-3(d) under the Act (17 CFR 270.30a-3(d))) that occurred during the second fiscal quarter of the period covered by this report that has materially affected, or is reasonably likely to materially affect, the Registrant’s internal control over financial reporting. |
Item 12. Disclosure of Securities Lending Activities for Closed-End Management Investment Companies
Not applicable
Item 13. Exhibits.
| (e) | A copy of the Registrant’s notices to stockholders, which accompanied distributions paid, pursuant to the Registrant’s Managed Distribution Policy since the Registrant’s last filed N-CSR, are filed herewith as Exhibits (e)(1), (e)(2), (e)(3), (e)(4) and (e)(5) as required by the terms of the Registrant’s SEC exemptive order. |
SIGNATURES
Pursuant to the requirements of the Securities Exchange Act of 1934 and the Investment Company Act of 1940, the Registrant has duly caused this report to be signed on its behalf by the undersigned, thereunto duly authorized.
abrdn Asia-Pacific Income Fund, Inc.
| By: | /s/ Christian Pittard | |
| | Christian Pittard, | |
| | Principal Executive Officer of abrdn Asia-Pacific Income Fund, Inc. | |
| | |
| Date: January 9, 2023 | |
Pursuant to the requirements of the Securities Exchange Act of 1934 and the Investment Company Act of 1940, this report has been signed below by the following persons on behalf of the Registrant and in the capacities and on the dates indicated.
| By: | /s/ Christian Pittard | |
| | Christian Pittard, | |
| | Principal Executive Officer of abrdn Asia-Pacific Income Fund, Inc. | |
| | |
| Date: January 9, 2023 | |
| By: | /s/ Andrea Melia | |
| | Andrea Melia, | |
| | Principal Financial Officer of abrdn Asia-Pacific Income Fund, Inc. | |
| | |
| Date: January 9, 2023 | |