UNITED STATES
SECURITIES AND EXCHANGE COMMISSION
WASHINGTON, D.C. 20549
FORM N-CSR
CERTIFIED SHAREHOLDER REPORT OF REGISTERED MANAGEMENT
INVESTMENT COMPANIES
Investment Company Act file number 811-4626
THE CASCADES TRUST
(Exact name of Registrant as specified in charter)
120 West 45th Street, Suite 3600
New York, New York 10036
(Address of principal executive offices) (Zip code)
Joseph P. DiMaggio
120 West 45th Street, Suite 3600
New York, New York 10036
(Name and address of agent for service)
Registrant's telephone number, including area code: (212) 697-6666
Date of fiscal year end: 3/31/18
Date of reporting period: 3/31/18
FORM N-CSR
ITEM 1. REPORTS TO STOCKHOLDERS
| | | | | | | | | | | | | | | | | | | | | | | | | | |
| | | | | | | | | | | | | | | | | | | | | | | | | | |
| | | | | | | | | | | | | | | | | | | | | | | | | |  |
| | | | | | | | | | | | | | | | | | | | | | | | | | |
| | | | | | | | | | | | | | | | | | | | | | | | | | |
| | | | | | | | | | | | | | | | | | | | | | | | | | |
| | | | | | | | | | | | | | | | | | | | | | | | | | Annual Report March 31, 2018 |
| | | | | | | | | | | | | | | | | | | | | | | | | | |
| | | | | | | | | | | | | | | | | | | | | | | | | | |
| | | | | | | | | | | | | | | | | | | | | | | | | | |
| | | | | | | | | | | | | | | | | | | | | | | | | | |
| | | | | | | | | | | | | | | | | | | | | | | | | | |
| | | | | | | | | | | | | | | | | | | | | | | | | | |
| | | | | | | | | | | | | | | | | | | | | | | | | | |
| | | | | | | | | | | | | | | | | | | | | | | | | | |
| | | | | | | | | | | | | | | | | | | | | | | | | | |
| | | | | | | | | | | | | | | | | | | | | | | | | | |
| | | | | | | | | | | | | | | | | | | | | | | | | | |
| | | | | | | | | | | | | | | | | | | | | | | | | | |
| | | | | | | | | | | | | | | | | | | | | | | | | | |
| | | | | | | | | | | | | | | | | | | | | | | | | | |
| | | | | | | | | | | | | | | | | | | | | | | | | |  |
 | Aquila Tax-Free
Trust of Oregon
“Consistency and Continuity”
Serving Oregon investors since 1986
|  |
May, 2018
Dear Fellow Shareholder:
For over three decades, we have sought to give you as comprehensive a picture of Aquila Tax-Free Trust of Oregon as possible by highlighting, in each Annual Report letter, topics we believe you will find of interest.
Yes – “over three decades!” That’s a considerable amount of time. Yet, in some ways, it seems like just yesterday.
We believe part of the reason why it doesn’t feel nearly that long to us is because of our commitment to consistency and continuity.
If we look back over the Aquila Group of Funds’ and the Trust’s existence, many things “feel” the same. In fact, while we have made certain changes, out of necessity or desire, over the years, we take great pride in the unbroken and consistent existence of our core values and beliefs implemented by dedicated and talented individuals.
First and foremost, we never forget that it is your money and your Trust, investing in your state. We view every interaction with you, our shareholders, and your financial professionals as an opportunity to strengthen that relationship.
We also value the fact that you and your fellow shareholders have invested in Aquila Trust of Oregon not only for tax-free income, but also for preservation of capital.
These two key values are the basis of our four guiding principles:
| • | focus on what we know best |
| • | put customers first; and |
As investment managers for nearly 35 years, we have always believed that investing successfully depends on knowing what you own and why you own it. We believe this is particularly important in today’s markets.
Moreover, we have never lost sight of the strategy that we formulated with our first municipal bond fund back in 1985. That strategy, which was specifically designed with a goal to meet your Trust’s investment objective of double tax-free income and stability of capital on as consistent a basis as possible, includes sticking with high quality investments, keeping an intermediate maturity for the Trust’s portfolio of investments, diversifying our investments, and utilizing the expertise of local talent.
In line with our guiding principles, we have always believed that local makes a real difference - local trustees, local portfolio management, local representatives and local shareholder meetings. We don’t have to read about issues affecting the state, because we have our local eyes and ears.
NOT A PART OF THE ANNUAL REPORT
Our portfolio management teams are attuned to the nuances of the local municipal markets, the economy and policy decisions. They are well-positioned to “kick the tires” - periodically visiting individual projects as deemed desirable, monitoring economic developments, staying familiar with, and reaching out to, local officials responsible for managing budgets, and observing the mood of the electorate as various projects are put to a vote.
We have also continually placed an emphasis on the quality of investments and the quality of the individuals who oversee those investments. When selecting securities we have always focused on the source and reliability of revenue and income streams, the management teams and the financial decisions they make, and the discipline those teams apply to executing their strategic and budget plans.
Our investment strategy of consistently focusing upon municipal bond funds with intermediate maturities has always been with a goal to limit volatility with any change in interest rates.
Our philosophy concerning diversification has been consistent as well. It’s quite simple – “don’t put all of your eggs in one basket.” To the maximum extent possible, Aquila Tax-Free Trust of Oregon continually strives to invest in as many types of projects as possible throughout the state. This is done not only to limit exposure in any particular situation, but also to enhance the quality of life throughout Oregon by financing worthy municipal projects. We are very proud that your Trust has consistently served thousands of residents and local projects very well over the years through its support of Oregon’s vital infrastructure.
In addition to our timeless and consistent focus, our continuity continues through the high caliber and longevity of our team. For example, I’ve been with the Aquila Group of Funds for over 30 years now. Your Trust has been fortunate to draw upon the experience of many other long-tenured team members as well over the years.
So, while the pieces of the puzzle may have changed shape over the years, when put together, the picture it forms is still the same - year in and year out.
Thank you for your continued confidence and loyalty in Aquila Tax-Free Trust of Oregon.
Sincerely,


Diana P. Herrmann, Vice Chair and President
Any information in this Shareholder Letter regarding market or economic trends or the factors influencing the Trust’s historical or future performance are statements of opinion as of the date of this report. These statements should not be relied upon for any other purposes. Past performance is no guarantee of future results, and there is no guarantee that any market forecasts discussed will be realized.
NOT A PART OF THE ANNUAL REPORT
| | Aquila Tax-Free
Trust of Oregon
ANNUAL REPORT
Management Discussion
Serving Oregon investors since 1986 | |
Trust Performance
The total return for the Class A shares of Aquila Tax-Free Trust of Oregon (the “Trust”) based on Net Asset Value (“NAV”) was 0.68% for the year ended March 31, 2018. The Bloomberg Barclays Quality Intermediate Municipal Bond Index (the “Index”) returned 1.11% for the same period. The portfolio performed very close to the Index returns for most sectors and maturity ranges. The underperformance was due primarily to our overweighting in pre-refunded bonds. These securities lagged market returns in the first part of the year as rates were declining and credit quality spreads were compressing. As part of our overall portfolio strategy we have purposely maintained a heightened exposure to pre-refunded bonds as a source for liquidity and current yield. Characteristics that provided favorable comparisons to the Index included a higher concentration in 7 to 10 year maturities, and a larger exposure to school district bonds.
Municipal Market
After an end of year rush to market resulting in a strong year for municipal issuance in 2017, we expect issuance is set for 2018 due, in large part, to the passage of the TCJA which eliminated advance refundings. Just over the first quarter of 2018, issuance dropped 31% compared to the first quarter of 2017. As a result, demand for new municipal bond issues has continued to be strong, further exaggerating supply limitations. Although the decrease in the corporate tax rate could make municipal bonds less attractive among banks and insurance companies, we believe individual demand will likely to remain high due to the limited State and Local Taxes (“SALT”) deduction.
However, strong demand and lack of supply could not overcome the impact of a rise in yields led by the Fed raising interest rates. In contrast to last year overall, first quarter 2018 experienced a steepening as yields on both Treasury and municipal bonds increased around 40 basis points in the 10-year part of the curve. Overall, the muni curve has become flatter, with a slight positive slope. Although we expect to see continued flattening, we do not anticipate inversion of the municipal curve, due to a variety of factors including the impact of the new issue market. In addition, credit spreads remain historically tight, with little additional yield being offered for added risk.
U.S. Economy
U.S. economic data remains solid with continued signs of growth and improvement following the passage of the Tax Cuts and Jobs Act (“TCJA”). The labor market remains strong and the 4.1% unemployment rate has remained near the lowest level seen in the past 40 years. Furthermore, we expect that economic activity will expand at a moderate pace and that labor market conditions will remain strong as unemployment rates are projected to decline and inflation to move up and stabilize around 2%. Consumer confidence remains high as spending continues to grow due to an overall increase in household wealth and income. However, as a result of elevated spending levels, the household savings rate has declined to its lowest level since 2005.
1 | Aquila Tax-Free Trust of Oregon
MANAGEMENT DISCUSSION (continued)
It came as no surprise that the Federal Reserve (the “Fed”) raised interest rates by 25 basis points in March, the fifth rate increase since December 2015, as the Fed continues to tighten monetary policy. The move came amid a strengthening labor market and economic activity rising at a moderate rate. Although the Fed has maintained its forecast for three rate hikes in 2018 amid modest inflation, both short-term and long-term government yields rose while major averages in the stock market moved higher due to the Fed’s outlook.
However, rates are not just rising in the U.S., but internationally as well. In overseas markets, the German 10-year bond yield was positive all year, after being negative for a quarter of 2016. Rate movements observed in the international markets have generally depicted the rise in oil prices and inflation expectations. We believe this trend is likely to continue as economic prospects and shifts in monetary policy continue to become more optimistic in Europe and Japan. As a result, U.S. Treasuries are becoming less attractive to foreign owners, which account for approximately 38.4% of the $16 trillion Treasury market.
Oregon Economy
Much like the national economy, we believe activity continues to show strength across the State of Oregon. For 14 consecutive months, Oregon’s unemployment rate has been around 4.1%, and has experienced the lowest levels since comparable records began in 1976. Payroll employment grew by 43,700 jobs, or 2.3%, in the most recent 12 months. The major industries adding jobs are: retail trade, construction, and health care and social assistance. The share of prime working-age Oregonians with a job is now back to where it was prior to the Great Recession. However, we expect that employment growth will likely slow down as the State economy approaches full employment.
As hinted by the strong growth in construction jobs, housing prices continue to make strong gains with the Portland market growing 7.1% annually, according to March 2018 data provided by S&P CoreLogic Case-Shiller Indices. Factors driving growth in the housing market include the strong labor growth and limited inventory. In our credit research we have also noted that the assessed values of local governments have now largely increased above pre-recession highs, which has resulted in stronger tax revenues. The Portland market's home prices continue to set new records with prices now 21% higher than the previous high-water mark, set in August 2007. However, affordability remains a concern for us.
Through our credit research we have noted distinct differences in pension funding levels and pension contribution levels at the issuer level. The Oregon Public Employees’ Retirement System continues to be a focus of our credit research due to the $25.3 billion unfunded liability at the end of 2016 and the resulting increases to contribution rates of the State and local governments. The State’s recently concluded legislative session included Senate Bill 1566, which was passed by lawmakers to establish a special incentive fund for qualifying public employers. We remain concerned about the contribution levels many issuers face and as a result, our credit research includes a review of each holding’s pension exposure. We have also given more significant weight to issuers with pension reserve funds engineered to mitigate, or at least partially off-set, the impact of future rate increases.
2 | Aquila Tax-Free Trust of Oregon
MANAGEMENT DISCUSSION (continued)
Oregon saw a slow start to 2018, with tax-exempt non-AMT (Alternative Minimum Tax) issuance of $723 million for the first quarter of the year; less than half of 2017 first quarter issuance. First quarter new issuance in 2017 was primarily driven by the November 2016 general election, which approved $1.76 billion in general obligation bonds across the State. By comparison, the November 2017 election only approved $852 million. Furthermore, as a result of the elimination of advance refundings by the TCJA, Oregon issuers rushed to complete their refunding bonds prior to the end of the year. As a result, December 2017 experienced almost three times the level of issuance versus the prior December. This rush to issuance also included many issues that would have otherwise waited until the first quarter of this year, further skewing the results. However, there are several local governments that have either authorized bond measures or have announced their intention to issue new bonds in 2018. For example, Salem-Keizer School District has a $620 million issue on the May ballot for creating new science labs and upgrading schools, and the City of Eugene has a $39 million issue on the May ballot for the park and recreation facilities.
Outlook and Strategy
The Trust’s portfolio characteristics have become more defensive over the past year with the weighted average maturity declining to 6.98 years. Credit quality has remained very high with approximately 94% of the portfolio rated AA or higher. We believe that our defensive strategy will weather the rapidly changing interest rate environment well. While it is possible the Federal Reserve will raise short-term interest rates 2 or 3 more times this year, we don’t anticipate a major disruption as evidenced by the market’s reaction to the March increase. We expect a slight upward bias in interest rates driven by Federal Reserve activities for the remainder of 2018. This may allow us to take advantage of higher yields by replacing some securities that we purchased during the very low interest rate environment in recent years.
The Trust currently benefits from legacy holdings purchased in higher interest rate environments that have been pre-refunded. These high-quality liquid securities provide what we believe to be an attractive current yield and help to reduce price volatility for our shareholders and provide the flexibility to reinvest in higher yielding bonds, should interest rates rise. We intend to continue our defensive investment strategy by striving to maintain an intermediate average portfolio maturity, emphasizing investment-grade credit quality, and a balanced exposure to callable bonds. Furthermore, we will seek to continue to perform in-depth credit research on all portfolio holdings, as we believe it is critical during the current rapidly changing economic environment.
3 | Aquila Tax-Free Trust of Oregon
Mutual fund investing involves risk and loss of principal is possible.
The market prices of the Trust’s securities may rise or decline in value due to general market conditions, such as real or perceived adverse economic or political conditions, inflation, changes in interest rates, lack of liquidity in the bond markets or adverse investor sentiment. When market prices fall, the value of your investment may go down. In the past several years, financial markets have experienced increased volatility, depressed valuations, decreased liquidity and heightened uncertainty. These conditions may continue, recur, worsen or spread.
The value of your investment may go down when interest rates rise. A rise in interest rates tends to have a greater impact on the prices of longer term securities. Interest rates in the U.S. have begun to rise after having been at historical lows for some time, so the Trust faces a heightened risk that interest rates may continue to rise. A general rise in interest rates may cause investors to move out of fixed income securities and could also result in increased redemptions from the Trust.
Investments in the Trust are subject to possible loss due to the financial failure of the issuers of underlying securities and their inability to meet their debt obligations.
The value of municipal securities can be adversely affected by changes in the financial condition of one or more individual municipal issuers or insurers of municipal issuers, regulatory developments, legislative actions, and by uncertainties and public perceptions concerning these and other factors. The Trust may be affected significantly by adverse economic, political or other events affecting state and other municipal issuers in which it invests, and may be more volatile than a more geographically diverse fund.
A portion of income may be subject to local, state, Federal and/or alternative minimum tax. Capital gains, if any, are subject to capital gains tax.
These risks may result in share price volatility.
Past performance is no guarantee of future results, and there is no guarantee that any market forecasts discussed will be realized.
Any information in this Annual Report regarding market or economic trends or the factors influencing the Trust’s historical or future performance are statements of opinion as of the date of this report. These statements should not be relied upon for any other purposes.
4 | Aquila Tax-Free Trust of Oregon
PERFORMANCE REPORT
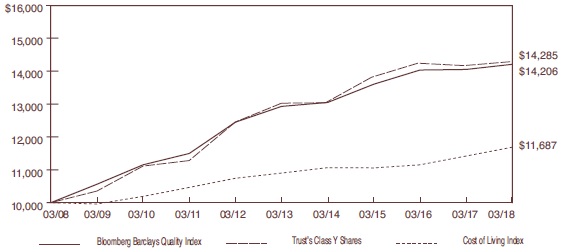
The following graph illustrates the value of $10,000 invested in the Class Y shares of Aquila Tax-Free Trust of Oregon (“the Trust”) for the 10-year period ended March 31, 2018 as compared with the Bloomberg Barclays Quality Intermediate Municipal Bond Index (the “Bloomberg Barclays Quality Index”) and the Consumer Price Index (a cost of living index). The performance of each of the other classes is not shown in the graph but is included in the table below. It should be noted that the Bloomberg Barclays Quality Index does not include any operating expenses nor sales charges, and being nationally oriented, does not reflect state-specific bond market performance.
| | | Average Annual Total Return |
| | | for periods ended March 31, 2018 |
| | | |
| Class and Inception Date | | 1 Year | | 5 Years | | 10 Years | | Since Inception | | |
| Class A since 6/16/86 | | | | | | | | | | | | | | | | | | |
| With Maximum Sales Charge | | | (3.36 | )% | | | 0.89 | % | | | 3.05 | % | | | 4.96 | % | | |
| Without Sales Charge | | | 0.68 | | | | 1.71 | | | | 3.47 | | | | 5.10 | | | |
| Class C since 4/5/96 | | | | | | | | | | | | | | | | | | |
| With CDSC** | | | (1.16 | ) | | | 0.85 | | | | 2.60 | | | | 3.30 | | | |
| Without CDSC | | | (0.18 | ) | | | 0.85 | | | | 2.60 | | | | 3.30 | | | |
| Class Y since 4/5/96 | | | | | | | | | | | | | | | | | | |
| No Sales Charge | | | 0.83 | | | | 1.87 | | | | 3.63 | | | | 4.34 | | | |
| | | | | | | | | | | | | | | | | | | |
| Bloomberg Barclays Quality Index | | | 1.11 | | | | 1.91 | | | | 3.57 | | | | 5.15 | * | | (Class A) |
| | | | | | | | | | | | | | | | 4.38 | | | (Class C & Y) |
Total return figures shown for the Trust reflect any change in price and assume all distributions, including capital gains, within the period were invested in additional shares. The returns shown do not reflect the deduction of taxes that a shareholder would pay on Trust distributions or the redemption of Trust Shares. The rates of return will vary and the principal value of an investment will fluctuate with market conditions. Shares, if redeemed, may be worth more or less than their original cost. A portion of each class’s income may be subject to Federal and state income taxes. Past performance is not predictive of future investment results.
* From commencement of the Bloomberg Barclays Quality Index on 1/1/87.
** CDSC = 1% contingent deferred sales charge imposed on redemptions made within the first 12 months after purchase.
5 | Aquila Tax-Free Trust of Oregon
REPORT OF INDEPENDENT REGISTERED PUBLIC ACCOUNTING FIRM
To the Board of Trustees and the
Shareholders of Aquila Tax-Free Trust of Oregon:
Opinion on the Financial Statements
We have audited the accompanying statement of assets and liabilities of Aquila Tax-Free Trust of Oregon (the “Trust”), including the schedule of investments, as of March 31, 2018, the related statement of operations for the year then ended, the statements of changes in net assets for each of the two years in the period then ended, and financial highlights for each of the five years in the period then ended, and the related notes (collectively referred to as the “financial statements”). In our opinion, the financial statements present fairly, in all material respects, the financial position of the Trust as of March 31, 2018, the results of its operations for the year then ended, the changes in its net assets for each of the two years in the period then ended, and its financial highlights for each of the five years in the period then ended, in conformity with accounting principles generally accepted in the United States of America.
Basis for Opinion
These financial statements are the responsibility of the Trust’s management. Our responsibility is to express an opinion on the Trust’s’ financial statements based on our audits. We are a public accounting firm registered with the Public Company Accounting Oversight Board (United States) (“PCAOB”) and are required to be independent with respect to the Trust in accordance with the U.S. federal securities laws and the applicable rules and regulations of the Securities and Exchange Commission and the PCAOB. We have served as the auditor for the Trust since 2005.
We conducted our audits in accordance with the standards of the PCAOB. Those standards require that we plan and perform the audits to obtain reasonable assurance about whether the financial statements are free of material misstatement, whether due to error or fraud. The Trust is not required to have, nor were we engaged to perform, an audit of the Trust’s internal control over financial reporting. As part of our audits we are required to obtain an understanding of internal control over financial reporting, but not for the purpose of expressing an opinion on the effectiveness of the Trust’s internal control over financial reporting. Accordingly, we express no such opinion.
Our audits included performing procedures to assess the risks of material misstatement of the financial statements, whether due to error or fraud, and performing procedures that respond to those risks. Such procedures included examining, on a test basis, evidence regarding the amounts and disclosures in the financial statements. Our audits also included evaluating the accounting principles used and significant estimates made by management, as well as evaluating the overall presentation of the financial statements. Our procedures included confirmation of securities owned as of March 31, 2018 by correspondence with the custodian. We believe that our audits provide a reasonable basis for our opinion.
TAIT, WELLER & BAKER LLP
Philadelphia, Pennsylvania
May 29, 2018
6 | Aquila Tax-Free Trust of Oregon
AQUILA TAX-FREE TRUST OF OREGON
SCHEDULE OF INVESTMENTS
MARCH 31, 2018
| | | | | Rating | | |
| | | | | Moody’s, S&P | | |
| Principal | | | | and Fitch | | |
| Amount | | General Obligation Bonds (47.9%) | | (unaudited) | | Value |
| | | | | | | |
| | | City & County (6.4%) | | | | |
| | | | | Bend, Oregon | | | | | | |
| $ | 2,435,000 | | | 4.000%, 06/01/24 | | Aa2/NR/NR | | $ | 2,617,357 | |
| | | | | Canby, Oregon | | | | | | |
| | 1,060,000 | | | 5.000%, 06/01/27 | | A1/NR/NR | | | 1,148,436 | |
| | 1,405,000 | | | 4.000%, 12/01/24 AGMC Insured | | A1/NR/NR | | | 1,488,907 | |
| | | | | Clackamas County, Oregon Refunding | | | | | | |
| | 1,135,000 | | | 4.000%, 06/01/24 | | Aaa/NR/NR | | | 1,221,408 | |
| | | | | Gresham, Oregon Full Faith and Credit | | | | | | |
| | | | | Refunding and Project Obligations | | | | | | |
| | 1,545,000 | | | 5.000%, 05/01/23 | | Aa2/NR/NR | | | 1,751,736 | |
| | | | | Lake Oswego, Oregon Refunding | | | | | | |
| | 3,140,000 | | | 4.000%, 12/01/30 | | Aaa/AAA/NR | | | 3,484,992 | |
| | | | | Lebanon, Oregon Refunding | | | | | | |
| | 1,050,000 | | | 5.000%, 06/01/24 | | A1/NR/NR | | | 1,178,488 | |
| | 1,165,000 | | | 5.000%, 06/01/25 | | A1/NR/NR | | | 1,345,750 | |
| | | | | McMinnville, Oregon Refunding | | | | | | |
| | 2,075,000 | | | 5.000%, 02/01/27 | | Aa3/NR/NR | | | 2,380,440 | |
| | | | | Multnomah County, Oregon | | | | | | |
| | 3,000,000 | | | 5.000%, 06/01/30 | | Aaa/AAA/NR | | | 3,588,870 | |
| | | | | Portland, Oregon Limited Tax, Sellwood | | | | | | |
| | | | | Bridge & Archive Space Projects | | | | | | |
| | 1,640,000 | | | 4.000%, 04/01/29 2017 Series A | | Aaa/NR/NR | | | 1,820,302 | |
| | 1,710,000 | | | 4.000%, 04/01/30 2017 Series A | | Aaa/NR/NR | | | 1,883,599 | |
| | 1,775,000 | | | 4.000%, 04/01/31 2017 Series A | | Aaa/NR/NR | | | 1,947,761 | |
| | | | | Portland, Oregon Public Safety | | | | | | |
| | 1,345,000 | | | 5.000%, 06/15/25 Series A | | Aaa/NR/NR | | | 1,592,493 | |
| | 2,130,000 | | | 4.125%, 06/01/26 Series A | | Aaa/NR/NR | | | 2,188,106 | |
| | | | | Redmond, Oregon Refunding | | | | | | |
| | 735,000 | | | 5.000%, 06/01/23 Series A | | Aa3/NR/NR | | | 815,453 | |
| | | | | Springfield, Oregon | | | | | | |
| | 1,765,000 | | | 4.000%, 06/01/24 | | Aa3/NR/NR | | | 1,948,154 | |
| | 1,830,000 | | | 4.000%, 06/01/25 | | Aa3/NR/NR | | | 2,030,458 | |
| | | | | Washington County, Oregon | | | | | | |
| | 5,055,000 | | | 4.000%, 06/01/29 Series B | | Aaa/NR/NR | | | 5,580,063 | |
| | | | | Total City & County | | | | | 40,012,773 | |
7 | Aquila Tax-Free Trust of Oregon
AQUILA TAX-FREE TRUST OF OREGON
SCHEDULE OF INVESTMENTS (continued)
MARCH 31, 2018
| | | | | Rating | | |
| | | | | Moody’s, S&P | | |
| Principal | | | | and Fitch | | |
| Amount | | General Obligation Bonds (continued) | | (unaudited) | | Value |
| | | | | | | |
| | | Community Colleges (4.0%) | | | | |
| | | | | Blue Mountain Community College | | | | | | |
| | | | | District Umatilla, Oregon Morrow and | | | | | | |
| | | | | Baker Counties Oregon (Umatilla and | | | | | | |
| | | | | Morrow Counties Service Area) | | | | | | |
| $ | 970,000 | | | 4.000%, 06/15/27 Series 2015 | | NR/AA+/NR | | $ | 1,060,617 | |
| | | | | Central Oregon Community | | | | | | |
| | | | | College District | | | | | | |
| | 1,850,000 | | | 4.750%, 06/15/22 | | NR/AA+/NR | | | 1,969,214 | |
| | 2,195,000 | | | 4.750%, 06/15/23 | | NR/AA+/NR | | | 2,334,492 | |
| | 2,175,000 | | | 4.750%, 06/15/26 | | NR/AA+/NR | | | 2,307,892 | |
| | | | | Chemeketa, Oregon Community | | | | | | |
| | | | | College District | | | | | | |
| | 2,000,000 | | | 5.000%, 06/15/25 | | NR/AA+/NR | | | 2,309,040 | |
| | | | | Clackamas, Oregon Community | | | | | | |
| | | | | College District | | | | | | |
| | 1,405,000 | | | 5.000%, 06/15/27 Series A | | Aa1/AA+/NR | | | 1,631,064 | |
| | | | | Columbia Gorge, Oregon Community | | | | | | |
| | | | | College District, Refunding | | | | | | |
| | 1,000,000 | | | 4.000%, 06/15/24 | | Aa1/NR/NR | | | 1,072,640 | |
| | | | | Lane, Oregon Community College | | | | | | |
| | 1,840,000 | | | 5.000%, 06/15/24 | | NR/AA+/NR | | | 2,061,260 | |
| | 1,750,000 | | | 4.000%, 06/15/24 | | Aa1/NR/NR | | | 1,920,940 | |
| | | | | Linn Benton, Oregon | | | | | | |
| | | | | Community College | | | | | | |
| | 1,520,000 | | | 5.000%, 06/01/27 | | NR/AA+/NR | | | 1,763,367 | |
| | | | | Mount Hood, Oregon Community | | | | | | |
| | | | | College District Refunding | | | | | | |
| | 1,865,000 | | | 5.000%, 06/01/27 | | Aa2/NR/NR | | | 2,204,206 | |
| | 1,000,000 | | | 5.000%, 06/01/29 | | Aa2/NR/NR | | | 1,173,020 | |
| | | | | Oregon Coast Community College | | | | | | |
| | | | | District State | | | | | | |
| | 1,770,000 | | | 5.000%, 06/15/25 | | Aa1/NR/NR | | | 1,983,604 | |
| | | | | Rogue, Oregon Community | | | | | | |
| | | | | College District | | | | | | |
| | 1,375,000 | | | 4.000%, 06/15/29 Series B | | Aa1/NR/NR | | | 1,497,196 | |
| | | | | Total Community Colleges | | | | | 25,288,552 | |
8 | Aquila Tax-Free Trust of Oregon
AQUILA TAX-FREE TRUST OF OREGON
SCHEDULE OF INVESTMENTS (continued)
MARCH 31, 2018
| | | | | Rating | | |
| | | | | Moody’s, S&P | | |
| Principal | | | | and Fitch | | |
| Amount | | General Obligation Bonds (continued) | | (unaudited) | | Value |
| | | | | | | |
| | | Higher Education (0.9%) | | | | |
| | | | | Oregon State Higher Education | | | | | | |
| $ | 1,000,000 | | | 5.000%, 08/01/25 Series C | | Aa1/AA+/AA+ | | $ | 1,160,040 | |
| | 1,795,000 | | | 5.000%, 08/01/27 Series C | | Aa1/AA+/AA+ | | | 2,077,695 | |
| | | | | Oregon State, Oregon University System | | | | | | |
| | 1,170,000 | | | 4.000%, 08/01/25 Series B | | Aa1/AA+/AA+ | | | 1,256,463 | |
| | 1,090,000 | | | 5.000%, 08/01/25 Series N | | Aa1/AA+/AA+ | | | 1,242,611 | |
| | | | | Total Higher Education | | | | | 5,736,809 | |
| | | | | | | | | | | |
| | | | | Hospital (0.8%) | | | | | | |
| | | | | Pacific Communities Health District, | | | | | | |
| | | | | Oregon | | | | | | |
| | 1,220,000 | | | 5.000%, 06/01/29 | | A1/NR/NR | | | 1,417,457 | |
| | 1,060,000 | | | 5.000%, 06/01/30 | | A1/NR/NR | | | 1,223,198 | |
| | 1,000,000 | | | 5.000%, 06/01/31 | | A1/NR/NR | | | 1,149,250 | |
| | 1,200,000 | | | 5.000%, 06/01/32 | | A1/NR/NR | | | 1,375,344 | |
| | | | | Total Hospital | | | | | 5,165,249 | |
| | | | | | | | | | | |
| | | | | School Districts (23.8%) | | | | | | |
| | | | | Clackamas County, Oregon School | | | | | | |
| | | | | District #12 (North Clackamas) | | | | | | |
| | 2,450,000 | | | 5.000%, 06/15/25 | | Aa1/AA+/NR | | | 2,843,935 | |
| | 1,165,000 | | | 5.000%, 06/15/25 | | Aa1/AA+/NR | | | 1,370,890 | |
| | 1,500,000 | | | 5.000%, 06/15/26 | | Aa1/AA+/NR | | | 1,736,475 | |
| | 3,725,000 | | | 5.000%, 06/15/31 | | Aa1/AA+/NR | | | 4,408,687 | |
| | 2,160,000 | | | 5.000%, 06/15/29 Series B | | Aa1/AA+/NR | | | 2,575,822 | |
| | | | | Clackamas County, Oregon School | | | | | | |
| | | | | District #62 (Oregon City) | | | | | | |
| | 1,000,000 | | | 5.000%, 06/01/29 MAC Insured | | Aa3/AA/NR | | | 1,129,710 | |
| | | | | Clackamas County, Oregon School | | | | | | |
| | | | | District #86 (Canby) | | | | | | |
| | 1,800,000 | | | 5.000%, 06/15/24 | | Aa1/AA+/NR | | | 2,019,528 | |
| | 1,110,000 | | | 5.000%, 06/15/25 Series A | | Aa1/AA+/NR | | | 1,243,478 | |
| | | | | Clackamas & Washington Counties, | | | | | | |
| | | | | Oregon School District No. 3JT | | | | | | |
| | | | | (West Linn-Wilsonville) | | | | | | |
| | 3,500,000 | | | 5.000%, 06/15/26 | | Aa1/AA+/NR | | | 4,098,290 | |
| | 5,500,000 | | | 5.000%, 06/15/27 | | Aa1/AA+/NR | | | 6,424,330 | |
| | 1,115,000 | | | 5.000%, 06/15/28 | | Aa1/AA+/NR | | | 1,296,790 | |
9 | Aquila Tax-Free Trust of Oregon
AQUILA TAX-FREE TRUST OF OREGON
SCHEDULE OF INVESTMENTS (continued)
MARCH 31, 2018
| | | | | Rating | | |
| | | | | Moody’s, S&P | | |
| Principal | | | | and Fitch | | |
| Amount | | General Obligation Bonds (continued) | | (unaudited) | | Value |
| | | | | | | |
| | | School Districts (continued) | | | | |
| | | | | Clatsop County, Oregon School | | | | | | |
| | | | | District #10 (Seaside) | | | | | | |
| $ | 1,000,000 | | | 5.000%, 06/15/29 Series B | | Aa1/AA+/NR | | $ | 1,192,510 | |
| | | | | Deschutes County, Oregon | | | | | | |
| | | | | Administrative School District #1 | | | | | | |
| | | | | (Bend - La Pine) | | | | | | |
| | 3,000,000 | | | 4.000%, 06/15/30 | | Aa1/AA+/NR | | | 3,269,760 | |
| | | | | Deschutes County, Oregon School | | | | | | |
| | | | | District #6 (Sisters) | | | | | | |
| | 1,735,000 | | | 5.250%, 06/15/19 AGMC Insured | | A2/AA+/NR | | | 1,810,351 | |
| | 1,030,000 | | | 5.250%, 06/15/21 AGMC Insured | | A2/AA+/NR | | | 1,137,614 | |
| | | | | Deschutes and Jefferson Counties, | | | | | | |
| | | | | Oregon School District #02J | | | | | | |
| | | | | (Redmond) | | | | | | |
| | 80,000 | | | 5.000%, 06/15/21 NPFG/ FGIC | | | | | | |
| | | | | Insured | | Aa1/NR/NR | | | 80,204 | |
| | 1,025,000 | | | zero coupon, 06/15/23 | | Aa1/NR/NR | | | 907,740 | |
| | | | | Greater Albany School District #8J | | | | | | |
| | | | | (Linn & Benton Counties) | | | | | | |
| | 1,000,000 | | | 5.000%, 06/15/30 | | Aa1/AA+/NR | | | 1,188,010 | |
| | | | | Hood River County, Oregon | | | | | | |
| | | | | School District | | | | | | |
| | 2,825,000 | | | 4.000%, 06/15/29 | | NR/AA+/NR | | | 3,091,256 | |
| | 2,260,000 | | | 4.000%, 06/15/30 | | NR/AA+/NR | | | 2,452,213 | |
| | 2,400,000 | | | 4.000%, 06/15/31 | | NR/AA+/NR | | | 2,585,904 | |
| | | | | Jefferson County, Oregon School | | | | | | |
| | | | | District #509J | | | | | | |
| | 1,400,000 | | | 5.000%, 06/15/25 | | Aa1/NR/NR | | | 1,591,576 | |
| | | | | Klamath County, Oregon School District | | | | | | |
| | 1,250,000 | | | 5.000%, 06/15/24 | | NR/AA+/NR | | | 1,425,662 | |
| | | | | Lane County, Oregon School District #4J | | | | | | |
| | | | | (Eugene) Refunding | | | | | | |
| | 1,130,000 | | | 4.000%, 06/15/23 | | Aa1/NR/NR | | | 1,202,591 | |
| | 2,850,000 | | | 4.000%, 06/15/24 | | Aa1/NR/NR | | | 3,074,865 | |
| | 2,765,000 | | | 3.000%, 06/15/24 | | Aa1/NR/NR | | | 2,879,443 | |
| | 4,575,000 | | | 5.000%, 06/15/26 | | Aa1/NR/NR | | | 5,267,701 | |
10 | Aquila Tax-Free Trust of Oregon
AQUILA TAX-FREE TRUST OF OREGON
SCHEDULE OF INVESTMENTS (continued)
MARCH 31, 2018
| | | | | Rating | | |
| | | | | Moody’s, S&P | | |
| Principal | | | | and Fitch | | |
| Amount | | General Obligation Bonds (continued) | | (unaudited) | | Value |
| | | | | | | |
| | | School Districts (continued) | | | | |
| | | | | Lane County, Oregon School | | | | | | |
| | | | | District #19 (Springfield) | | | | | | |
| $ | 1,000,000 | | | 5.000%, 06/15/25 | | Aa1/AA+/NR | | $ | 1,163,040 | |
| | 1,735,000 | | | 5.000%, 06/15/27 | | Aa1/AA+/NR | | | 2,029,082 | |
| | | | | Lane County, Oregon School | | | | | | |
| | | | | District #69 (Junction City) | | | | | | |
| | 630,000 | | | 5.000%, 06/15/25 | | Aa1/NR/NR | | | 739,059 | |
| | | | | Lane & Douglas Counties, Oregon | | | | | | |
| | | | | School District #45J3 | | | | | | |
| | 2,665,000 | | | 4.000%, 06/15/27 Series B | | Aa1/NR/NR | | | 2,947,144 | |
| | | | | Lincoln County, Oregon School District | | | | | | |
| | 2,370,000 | | | 4.000%, 06/15/24 Series A | | Aa1/NR/NR | | | 2,518,433 | |
| | | | | Marion County, Oregon School | | | | | | |
| | | | | District #103 (Woodburn) | | | | | | |
| | 2,140,000 | | | 5.000%, 06/15/27 | | Aa1/NR/NR | | | 2,499,648 | |
| | 2,260,000 | | | 5.000%, 06/15/28 | | Aa1/NR/NR | | | 2,628,470 | |
| | | | | Marion & Clackamas Counties, Oregon | | | | | | |
| | | | | School District #4J (Silver Falls) | | | | | | |
| | 1,260,000 | | | 5.000%, 06/15/24 | | Aa1/NR/NR | | | 1,439,071 | |
| | | | | Morrow County, Oregon School | | | | | | |
| | | | | District #1 | | | | | | |
| | 1,710,000 | | | 5.250%, 06/15/19 AGMC Insured | | A2/AA+/NR | | | 1,784,265 | |
| | | | | Multnomah County, Oregon School | | | | | | |
| | | | | District #1J (Portland) | | | | | | |
| | 2,970,000 | | | 5.000%, 06/15/26 Series B | | Aa1/AA+/NR | | | 3,471,277 | |
| | | | | Multnomah County, Oregon School | | | | | | |
| | | | | District #7 (Reynolds) | | | | | | |
| | 5,680,000 | | | 5.000%, 06/15/26 Series A | | Aa1/NR/NR | | | 6,659,175 | |
| | 1,500,000 | | | 5.000%, 06/15/27 Series A | | Aa1/NR/NR | | | 1,754,250 | |
| | 1,825,000 | | | 5.000%, 06/15/28 Series A | | Aa1/NR/NR | | | 2,123,862 | |
| | | | | Multnomah County, Oregon School | | | | | | |
| | | | | District #7 (Reynolds) Refunding | | | | | | |
| | 1,165,000 | | | 5.000%, 06/01/29 | | Aa3/NR/NR | | | 1,242,368 | |
| | | | | Multnomah County, Oregon School | | | | | | |
| | | | | District #40 (David Douglas) | | | | | | |
| | 1,500,000 | | | 5.000%, 06/15/23 Series A | | NR/AA+/NR | | | 1,677,795 | |
11 | Aquila Tax-Free Trust of Oregon
AQUILA TAX-FREE TRUST OF OREGON
SCHEDULE OF INVESTMENTS (continued)
MARCH 31, 2018
| | | | | Rating | | |
| | | | | Moody’s, S&P | | |
| Principal | | | | and Fitch | | |
| Amount | | General Obligation Bonds (continued) | | (unaudited) | | Value |
| | | | | | | |
| | | School Districts (continued) | | | | |
| | | | | Multnomah and Clackamas Counties, | | | | | | |
| | | | | Oregon School District #10 | | | | | | |
| | | | | (Gresham-Barlow) | | | | | | |
| $ | 4,275,000 | | | 5.250%, 06/15/19 AGMC Insured | | Aa1/AA+/NR | | $ | 4,458,568 | |
| | 2,500,000 | | | 5.000%, 06/15/29 Series B | | Aa1/AA+/NR | | | 2,981,275 | |
| | | | | Multnomah and Clackamas Counties, | | | | | | |
| | | | | Oregon School District #28JT | | | | | | |
| | | | | (Centennial) | | | | | | |
| | 2,680,000 | | | 5.250%, 12/15/18 AGMC Insured | | Aa1/NR/NR | | | 2,747,750 | |
| | | | | Polk, Marion & Benton Counties, | | | | | | |
| | | | | Oregon School District #13J (Central) | | | | | | |
| | 1,515,000 | | | 4.000%, 02/01/28 | | NR/AA+/NR | | | 1,637,988 | |
| | | | | Union County, Oregon School District | | | | | | |
| | | | | #1 (La Grande) | | | | | | |
| | 1,000,000 | | | 5.000%, 06/15/27 | | Aa1/NR/NR | | | 1,160,900 | |
| | | | | Wasco County, Oregon School District | | | | | | |
| | | | | #12 (The Dalles) | | | | | | |
| | 1,790,000 | | | 5.500%, 06/15/20 AGMC Insured | | A2/AA/NR | | | 1,934,596 | |
| | | | | Washington County, Oregon School | | | | | | |
| | | | | District #48J (Beaverton) | | | | | | |
| | 2,750,000 | | | 4.000%, 06/15/25 | | Aa1/AA+/NR | | | 2,945,195 | |
| | 2,275,000 | | | 4.000%, 06/15/23 Series B | | Aa1/AA+/NR | | | 2,457,364 | |
| | 5,290,000 | | | 4.000%, 06/15/24 Series B | | Aa1/AA+/NR | | | 5,707,381 | |
| | 3,000,000 | | | 5.000%, 06/15/25 Series 2014B | | Aa1/AA+/NR | | | 3,463,560 | |
| | 3,000,000 | | | 5.000%, 06/15/28 Series 2014B | | Aa1/AA+/NR | | | 3,439,320 | |
| | 1,845,000 | | | 5.000%, 06/15/29 Series 2014B | | Aa1/AA+/NR | | | 2,108,318 | |
| | 1,500,000 | | | 5.000%, 06/15/27 Series C | | Aa1/AA+/NR | | | 1,803,705 | |
| | 1,015,000 | | | 4.000%, 06/01/29 Series 2016 | | Aa2/NR/NR | | | 1,100,971 | |
| | | | | Washington, Clackamas & Yamhill | | | | | | |
| | | | | Counties, Oregon School District #88J | | | | | | |
| | 2,785,000 | | | 5.000%, 06/15/29 Series B | | Aa1/AA+/NR | | | 3,321,140 | |
| | 2,000,000 | | | 5.000%, 06/15/29 Series B | | Aa1/AA+/NR | | | 2,421,580 | |
| | | | | Washington, Multnomah & Yamhill | | | | | | |
| | | | | Counties, Oregon School District #1J | | | | | | |
| | | | | (Hillsboro) | | | | | | |
| | 1,535,000 | | | 4.000%, 06/15/25 | | Aa1/NR/NR | | | 1,642,680 | |
| | 2,105,000 | | | 5.000%, 06/15/30 | | Aa1/NR/NR | | | 2,510,234 | |
12 | Aquila Tax-Free Trust of Oregon
AQUILA TAX-FREE TRUST OF OREGON
SCHEDULE OF INVESTMENTS (continued)
MARCH 31, 2018
| | | | | Rating | | |
| | | | | Moody’s, S&P | | |
| Principal | | | | and Fitch | | |
| Amount | | General Obligation Bonds (continued) | | (unaudited) | | Value |
| | | | | | | |
| | | School Districts (continued) | | | | |
| | | | | Yamhill County, Oregon School District | | | | | | |
| | | | | #40 (McMinnville) | | | | | | |
| $ | 2,255,000 | | | 4.000%, 06/15/26 | | Aa1/NR/NR | | $ | 2,436,054 | |
| | 1,000,000 | | | 4.000%, 06/15/29 | | Aa1/AA+/NR | | | 1,096,560 | |
| | 1,000,000 | | | 4.000%, 06/15/30 | | Aa1/AA+/NR | | | 1,088,870 | |
| | | | | Total School Districts | | | | | 149,446,283 | |
| | | | | | | | | | | |
| | | | | Special Districts (4.0%) | | | | | | |
| | | | | Bend, Oregon Metropolitan Park & | | | | | | |
| | | | | Recreational District | | | | | | |
| | 1,430,000 | | | 4.000%, 06/01/27 | | Aa3/NR/NR | | | 1,517,545 | |
| | | | | Clackamas County, Oregon Fire | | | | | | |
| | | | | District No. 1 | | | | | | |
| | 1,020,000 | | | 4.000%, 06/01/30 | | NR/AA/NR | | | 1,120,001 | |
| | 2,705,000 | | | 4.000%, 06/01/31 | | NR/AA/NR | | | 2,947,341 | |
| | | | | Metro, Oregon | | | | | | |
| | 4,000,000 | | | 4.000%, 06/01/26 Series A | | Aaa/AAA/NR | | | 4,278,120 | |
| | | | | Tualatin Hills, Oregon Park & | | | | | | |
| | | | | Recreational District | | | | | | |
| | 3,480,000 | | | 5.000%, 06/01/23 | | Aa1/NR/NR | | | 3,976,596 | |
| | 4,725,000 | | | 5.000%, 06/01/24 | | Aa1/NR/NR | | | 5,495,081 | |
| | 2,775,000 | | | 5.000%, 06/01/26 | | Aa1/NR/NR | | | 3,231,155 | |
| | | | | Tualatin Valley, Oregon Fire & Rescue | | | | | | |
| | | | | Rural Fire Protection District | | | | | | |
| | 1,235,000 | | | 4.000%, 06/01/26 | | Aaa/NR/NR | | | 1,303,271 | |
| | 1,170,000 | | | 4.000%, 06/01/27 | | Aaa/NR/NR | | | 1,231,378 | |
| | | | | Total Special Districts | | | | | 25,100,488 | |
| | | | | | | | | | | |
| | | | | State (6.4%) | | | | | | |
| | | | | State of Oregon | | | | | | |
| | 750,000 | | | 5.000%, 05/01/25 Series A | | Aa1/AA+/AA+ | | | 865,613 | |
| | 3,000,000 | | | 5.000%, 05/01/23 Series L | | Aa1/AA+/AA+ | | | 3,288,030 | |
| | 1,125,000 | | | 5.000%, 05/01/24 Series L | | Aa1/AA+/AA+ | | | 1,233,011 | |
| | 1,470,000 | | | 4.000%, 11/01/26 Series M | | Aa1/AA+/AA+ | | | 1,563,668 | |
| | 2,125,000 | | | 4.000%, 05/01/25 Series O | | Aa1/AA+/AA+ | | | 2,249,270 | |
| | | | | State of Oregon Article XI-G | | | | | | |
| | | | | Community College Projects | | | | | | |
| | 1,160,000 | | | 5.000%, 08/01/27 Series J | | Aa1/AA+/AA+ | | | 1,359,822 | |
13 | Aquila Tax-Free Trust of Oregon
AQUILA TAX-FREE TRUST OF OREGON
SCHEDULE OF INVESTMENTS (continued)
MARCH 31, 2018
| | | | | Rating | | |
| | | | | Moody’s, S&P | | |
| Principal | | | | and Fitch | | |
| Amount | | General Obligation Bonds (continued) | | (unaudited) | | Value |
| | | | | | | |
| | | State (continued) | | | | |
| | | | | State of Oregon Article XI-G | | | | | | |
| | | | | Higher Education | | | | | | |
| $ | 500,000 | | | 5.000%, 08/01/25 Series O | | Aa1/AA+/AA+ | | $ | 590,915 | |
| | 1,000,000 | | | 5.000%, 08/01/26 Series O | | Aa1/AA+/AA+ | | | 1,178,140 | |
| | 1,000,000 | | | 5.000%, 08/01/27 Series O | | Aa1/AA+/AA+ | | | 1,172,260 | |
| | | | | State of Oregon Article XI-M | | | | | | |
| | | | | Seismic Projects | | | | | | |
| | 1,000,000 | | | 5.000%, 06/01/30 | | Aa1/AA+/AA+ | | | 1,177,030 | |
| | | | | State of Oregon Article XI-Q State Projects | | | | | | |
| | 2,140,000 | | | 5.000%, 11/01/28 | | Aa1/AA+/AA+ | | | 2,529,095 | |
| | 1,000,000 | | | 5.000%, 11/01/30 | | Aa1/AA+/AA+ | | | 1,173,830 | |
| | 2,000,000 | | | 5.000%, 11/01/31 | | Aa1/AA+/AA+ | | | 2,341,300 | |
| | 1,195,000 | | | 5.000%, 05/01/28 Series D | | Aa1/AA+/AA+ | | | 1,414,187 | |
| | 1,255,000 | | | 5.000%, 05/01/29 Series D | | Aa1/AA+/AA+ | | | 1,480,160 | |
| | 1,000,000 | | | 5.000%, 05/01/30 Series D | | Aa1/AA+/AA+ | | | 1,175,420 | |
| | 2,300,000 | | | 5.000%, 05/01/28 Series F | | Aa1/AA+/AA+ | | | 2,674,072 | |
| | | | | State of Oregon Department of | | | | | | |
| | | | | Administrative Services COP | | | | | | |
| | 1,815,000 | | | 5.000%, 11/01/27 Series C | | Aa2/AA/AA | | | 1,903,173 | |
| | 1,195,000 | | | 5.000%, 11/01/28 Series C | | Aa2/AA/AA | | | 1,253,053 | |
| | | | | State of Oregon Department of | | | | | | |
| | | | | Administrative Services, Oregon | | | | | | |
| | | | | Opportunity Refunding | | | | | | |
| | 6,210,000 | | | 5.000%, 12/01/19 | | Aa1/AA+/AA+ | | | 6,553,537 | |
| | | | | State of Oregon Higher Education | | | | | | |
| | 1,000,000 | | | 5.000%, 08/01/28 Series A | | Aa1/AA+/AA+ | | | 1,167,140 | |
| | 1,250,000 | | | 5.000%, 08/01/30 Series L | | Aa1/AA+/AA+ | | | 1,498,175 | |
| | | | | Total State | | | | | 39,840,901 | |
| | | | | | | | | | | |
| | | | | Transportation (1.2%) | | | | | | |
| | | | | Oregon State Department Transportation | | | | | | |
| | | | | Highway Usertax (Senior Lien) | | | | | | |
| | 5,000,000 | | | 5.000%, 11/15/29 Series B | | Aa1/AAA/AA+ | | | 5,968,300 | |
| | | | | State of Oregon ODOT Projects | | | | | | |
| | 1,020,000 | | | 5.000%, 11/15/30 Series M | | Aa1/AA+/AA+ | | | 1,217,533 | |
| | | | | Total Transportation | | | | | 7,185,833 | |
14 | Aquila Tax-Free Trust of Oregon
AQUILA TAX-FREE TRUST OF OREGON
SCHEDULE OF INVESTMENTS (continued)
MARCH 31, 2018
| | | | | Rating | | |
| | | | | Moody’s, S&P | | |
| Principal | | | | and Fitch | | |
| Amount | | General Obligation Bonds (continued) | | (unaudited) | | Value |
| | | | | | | |
| | | Water & Sewer (0.4%) | | | | |
| | | | | Gearheart, Oregon | | | | | | |
| $ | 1,060,000 | | | 4.500%, 03/01/26 AGMC Insured | | A2/NR/NR | | $ | 1,122,211 | |
| | | | | Rockwood, Oregon Water Peoples | | | | | | |
| | | | | Utility District Water | | | | | | |
| | | | | Revenue Refunding | | | | | | |
| | 1,270,000 | | | 4.250%, 08/15/26 | | A1/NR/NR | | | 1,347,216 | |
| | | | | Total Water & Sewer | | | | | 2,469,427 | |
| | | | | Total General Obligation Bonds | | | | | 300,246,315 | |
| | | | | | | | | | | |
| | | | | Revenue Bonds (28.8%) | | | | | | |
| | | | | City & County (2.3%) | | | | | | |
| | | | | Newport, Oregon Urban Renewal | | | | | | |
| | | | | Obligations, Refunding | | | | | | |
| | 565,000 | | | 4.500%, 06/15/22 Series B | | NR/AA-/NR | | | 598,505 | |
| | | | | Portland, Oregon Revenue Refunding | | | | | | |
| | | | | Limited Tax, Oregon | | | | | | |
| | | | | Convention Center | | | | | | |
| | 2,825,000 | | | 5.000%, 06/01/24 | | Aaa/NR/NR | | | 3,096,935 | |
| | 4,265,000 | | | 5.000%, 06/01/27 | | Aaa/NR/NR | | | 4,671,412 | |
| | | | | Portland, Oregon Revenue Refunding | | | | | | |
| | | | | Limited Tax | | | | | | |
| | 1,000,000 | | | 4.000%, 04/01/22 Series A | | Aaa/NR/NR | | | 1,023,580 | |
| | | | | Portland, Oregon River District Urban | | | | | | |
| | | | | Renewal and Redevelopment | | | | | | |
| | 1,600,000 | | | 5.000%, 06/15/22 Series B | | A1/NR/NR | | | 1,784,192 | |
| | 1,830,000 | | | 5.000%, 06/15/23 Series B | | A1/NR/NR | | | 2,036,772 | |
| | | | | Portland, Oregon Urban Renewal and | | | | | | |
| | | | | Redevelopment, Refunding, | | | | | | |
| | | | | North Macadam | | | | | | |
| | 1,000,000 | | | 4.000%, 06/15/25 Series B | | A1/NR/NR | | | 1,037,110 | |
| | | | | Total City & County | | | | | 14,248,506 | |
| | | | | | | | | | | |
| | | | | Electric (1.6%) | | | | | | |
| | | | | Eugene, Oregon Electric Utility | | | | | | |
| | | | | Refunding System | | | | | | |
| | 2,875,000 | | | 5.000%, 08/01/29 Series A | | Aa2/AA-/AA- | | | 3,379,160 | |
| | 4,030,000 | | | 5.000%, 08/01/30 Series A | | Aa2/AA-/AA- | | | 4,720,258 | |
15 | Aquila Tax-Free Trust of Oregon
AQUILA TAX-FREE TRUST OF OREGON
SCHEDULE OF INVESTMENTS (continued)
MARCH 31, 2018
| | | | | Rating | | |
| | | | | Moody’s, S&P | | |
| Principal | | | | and Fitch | | |
| Amount | | Revenue Bonds (continued) | | (unaudited) | | Value |
| | | | | | | |
| | | Electric (continued) | | | | |
| | | | | Northern Wasco County, Oregon | | | | | | |
| | | | | Peoples Utility District (McNary Dam | | | | | | |
| | | | | Fishway Hydroelectric Project), | | | | | | |
| | | | | Refunding | | | | | | |
| $ | 1,585,000 | | | 5.000%, 12/01/21 Series A | | NR/AA-/NR | | $ | 1,746,115 | |
| | | | | Total Electric | | | | | 9,845,533 | |
| | | | | | | | | | | |
| | | | | Higher Education (1.7%) | | | | | | |
| | | | | Oregon State Facilities Authority | | | | | | |
| | | | | (Lewis & Clark College Project) | | | | | | |
| | 1,000,000 | | | 5.250%, 10/01/24 Series A | | A3/A-/NR | | | 1,097,800 | |
| | 3,000,000 | | | 5.000%, 10/01/27 Series A | | A3/A-/NR | | | 3,269,430 | |
| | | | | Oregon State Facilities Authority | | | | | | |
| | | | | (Linfield College Project) | | | | | | |
| | 1,180,000 | | | 5.000%, 10/01/22 Series A | | Baa1/NR/NR | | | 1,313,706 | |
| | 1,000,000 | | | 5.000%, 10/01/23 Series A | | Baa1/NR/NR | | | 1,130,890 | |
| | 1,220,000 | | | 5.000%, 10/01/31 Series A 2010 | | Baa1/NR/NR | | | 1,281,817 | |
| | | | | Oregon State Facilities Authority | | | | | | |
| | | | | (Reed College Project) | | | | | | |
| | 500,000 | | | 5.000%, 07/01/30 Series A | | Aa2/AA-/NR | | | 592,160 | |
| | 1,135,000 | | | 4.000%, 07/01/31 Series A | | Aa2/AA-/NR | | | 1,235,561 | |
| | | | | Oregon State Facilities Authority | | | | | | |
| | | | | (Willamette University) | | | | | | |
| | 1,000,000 | | | 4.000%, 10/01/24 | | NR/A/NR | | | 1,026,650 | |
| | | | | Total Higher Education | | | | | 10,948,014 | |
| | | | | | | | | | | |
| | | | | Hospitals (4.8%) | | | | | | |
| | | | | Medford, Oregon Hospital Facilities | | | | | | |
| | | | | Authority Revenue Refunding, | | | | | | |
| | | | | Asante Health Systems | | | | | | |
| | 9,000,000 | | | 5.500%, 08/15/28 AGMC Insured | | NR/AA/NR | | | 9,668,070 | |
| | | | | Oregon Health Sciences University | | | | | | |
| | 9,025,000 | | | zero coupon, 07/01/21 NPFG Insured | | Aa3/AA-/AA- | | | 7,984,147 | |
| | 2,000,000 | | | 5.000%, 07/01/23 Series A | | Aa3/AA-/AA- | | | 2,224,820 | |
| | 1,250,000 | | | 5.000%, 07/01/28 Series B | | Aa3/AA-/AA- | | | 1,473,313 | |
| | 1,000,000 | | | 5.000%, 07/01/33 Series B | | Aa3/AA-/AA- | | | 1,156,940 | |
16 | Aquila Tax-Free Trust of Oregon
AQUILA TAX-FREE TRUST OF OREGON
SCHEDULE OF INVESTMENTS (continued)
MARCH 31, 2018
| | | | | Rating | | |
| | | | | Moody’s, S&P | | |
| Principal | | | | and Fitch | | |
| Amount | | Revenue Bonds (continued) | | (unaudited) | | Value |
| | | | | | | |
| | | Hospitals (continued) | | | | |
| | | | | Oregon State Facilities Authority | | | | | | |
| | | | | Revenue Refunding, Legacy | | | | | | |
| | | | | Health Systems | | | | | | |
| $ | 1,000,000 | | | 4.750%, 03/15/24 | | A1/AA-/NR | | $ | 1,046,640 | |
| | 1,000,000 | | | 5.000%, 03/15/30 | | A1/AA-/NR | | | 1,047,080 | |
| | | | | Oregon State Facilities Authority | | | | | | |
| | | | | Revenue Refunding, Samaritan | | | | | | |
| | | | | Health Services | | | | | | |
| | 1,500,000 | | | 4.375%, 10/01/20 | | NR/BBB+/NR | | | 1,581,015 | |
| | 2,000,000 | | | 4.500%, 10/01/21 | | NR/BBB+/NR | | | 2,113,060 | |
| | 1,520,000 | | | 5.000%, 10/01/23 | | NR/BBB+/NR | | | 1,626,202 | |
| | | | | Total Hospitals | | | | | 29,921,287 | |
| | | | | | | | | | | |
| | | | | Housing (0.6%) | | | | | | |
| | | | | Clackamas County, Oregon Housing | | | | | | |
| | | | | Authority Multifamily Housing | | | | | | |
| | | | | Revenue (Easton Ridge | | | | | | |
| | | | | Apartments Project) | | | | | | |
| | 1,310,000 | | | 4.000%, 09/01/27 Series A | | Aa2/NR/NR | | | 1,368,164 | |
| | | | | Portland, Oregon Urban Renewal and | | | | | | |
| | | | | Redevelopment, Interstate Corridor | | | | | | |
| | 1,390,000 | | | 5.000%, 06/15/27 Series B | | A1/NR/NR | | | 1,514,989 | |
| | | | | State of Oregon Housing and | | | | | | |
| | | | | Community Services | | | | | | |
| | 950,000 | | | 1.800%, 01/01/23 | | Aa2/NR/NR | | | 923,324 | |
| | | | | Total Housing | | | | | 3,806,477 | |
| | | | | | | | | | | |
| | | | | Lottery (4.1%) | | | | | | |
| | | | | Oregon State Department of | | | | | | |
| | | | | Administration Services (Lottery | | | | | | |
| | | | | Revenue) | | | | | | |
| | 1,015,000 | | | 5.250%, 04/01/26 Series A | | Aa2/AAA/NR | | | 1,111,658 | |
| | 1,715,000 | | | 5.000%, 04/01/24 Series B | | Aa2/AAA/NR | | | 1,903,907 | |
| | 1,500,000 | | | 5.000%, 04/01/25 Series B | | Aa2/AAA/NR | | | 1,660,980 | |
| | 1,000,000 | | | 5.000%, 04/01/25 Series B | | Aa2/AAA/NR | | | 1,154,010 | |
| | 3,000,000 | | | 5.000%, 04/01/26 Series C | | Aa2/AAA/NR | | | 3,507,900 | |
| | 4,000,000 | | | 5.000%, 04/01/30 Series C | | Aa2/AAA/NR | | | 4,758,440 | |
| | 5,000,000 | | | 5.000%, 04/01/26 Series D | | Aa2/AAA/NR | | | 5,846,500 | |
17 | Aquila Tax-Free Trust of Oregon
AQUILA TAX-FREE TRUST OF OREGON
SCHEDULE OF INVESTMENTS (continued)
MARCH 31, 2018
| | | | | Rating | | |
| | | | | Moody’s, S&P | | |
| Principal | | | | and Fitch | | |
| Amount | | Revenue Bonds (continued) | | (unaudited) | | Value |
| | | | | | | |
| | | Lottery (continued) | | | | |
| | | | | Oregon State Department of | | | | | | |
| | | | | Administration Services (Lottery | | | | | | |
| | | | | Revenue) (continued) | | | | | | |
| $ | 4,000,000 | | | 5.000%, 04/01/28 Series D | | Aa2/AAA/NR | | $ | 4,646,400 | |
| | 1,000,000 | | | 5.000%, 04/01/29 Series D | | Aa2/AAA/NR | | | 1,158,120 | |
| | | | | Total Lottery | | | | | 25,747,915 | |
| | | | | | | | | | | |
| | | | | Sales Tax (0.1%) | | | | | | |
| | | | | Metro, Oregon Dedicated Tax Revenue | | | | | | |
| | | | | (Oregon Convention Center Hotel) | | | | | | |
| | 750,000 | | | 5.000%, 06/15/31 | | Aa3/NR/NR | | | 877,672 | |
| | | | | | | | | | | |
| | | | | Transportation (6.2%) | | | | | | |
| | | | | Oregon State Department Transportation | | | | | | |
| | | | | Highway Usertax, Senior Lien | | | | | | |
| | 3,605,000 | | | 5.000%, 11/15/24 Series A | | Aa1/AAA/AA+ | | | 4,067,702 | |
| | 2,425,000 | | | 5.000%, 11/15/25 Series A | | Aa1/AAA/AA+ | | | 2,733,969 | |
| | 1,040,000 | | | 5.000%, 11/15/26 Series A | | Aa1/AAA/AA+ | | | 1,210,030 | |
| | 8,000,000 | | | 5.000%, 11/15/28 Series A | | Aa1/AAA/AA+ | | | 9,244,160 | |
| | | | | Port Portland, Oregon Airport Revenue | | | | | | |
| | | | | Refunding, Portland International | | | | | | |
| | | | | Airport Series Twenty Three | | | | | | |
| | 2,525,000 | | | 5.000%, 07/01/26 | | NR/AA-/NR | | | 2,938,999 | |
| | 1,000,000 | | | 5.000%, 07/01/28 | | NR/AA-/NR | | | 1,151,090 | |
| | 2,390,000 | | | 5.000%, 07/01/29 | | NR/AA-/NR | | | 2,739,251 | |
| | | | | Tri-County Metropolitan Transportation | | | | | | |
| | | | | District, Oregon Capital Grant Receipt | | | | | | |
| | 1,100,000 | | | 5.000%, 10/01/27 Series A | | A3/A/NR | | | 1,296,515 | |
| | 1,000,000 | | | 5.000%, 10/01/30 Series A | | A3/A/NR | | | 1,167,840 | |
| | | | | Tri-County Metropolitan Transportation | | | | | | |
| | | | | District, Oregon Senior Lien | | | | | | |
| | | | | Payroll Tax | | | | | | |
| | 1,000,000 | | | 5.000%, 09/01/25 Series A | | Aaa/AAA/NR | | | 1,183,740 | |
| | 1,890,000 | | | 5.000%, 09/01/28 Series A | | Aaa/AAA/NR | | | 2,255,866 | |
| | 1,650,000 | | | 5.000%, 09/01/29 Series A | | Aaa/AAA/NR | | | 1,962,510 | |
| | 3,975,000 | | | 5.000%, 09/01/30 Series A | | Aaa/AAA/NR | | | 4,711,289 | |
| | 2,010,000 | | | 5.000%, 09/01/29 Series B | | Aaa/AAA/NR | | | 2,350,936 | |
| | | | | Total Transportation | | | | | 39,013,897 | |
18 | Aquila Tax-Free Trust of Oregon
AQUILA TAX-FREE TRUST OF OREGON
SCHEDULE OF INVESTMENTS (continued)
MARCH 31, 2018
| | | | | Rating | | |
| | | | | Moody’s, S&P | | |
| Principal | | | | and Fitch | | |
| Amount | | Revenue Bonds (continued) | | (unaudited) | | Value |
| | | | | | | |
| | | Water & Sewer (7.4%) | | | | |
| | | | | Clackamas County, Oregon Service | | | | | | |
| | | | | District No. 1 | | | | | | |
| $ | 2,240,000 | | | 5.000%, 12/01/26 | | NR/AA+/NR | | $ | 2,685,178 | |
| | | | | Clean Water Services, Oregon Refunding | | | | | | |
| | | | | (Senior Lien) | | | | | | |
| | 1,510,000 | | | 5.000%, 10/01/27 | | Aa1/AAA/NR | | | 1,835,843 | |
| | | | | Eugene, Oregon Water Utility System | | | | | | |
| | 115,000 | | | 5.000%, 08/01/28 | | Aa2/AA/AA+ | | | 136,111 | |
| | 450,000 | | | 5.000%, 08/01/29 | | Aa2/AA/AA+ | | | 528,912 | |
| | | | | Grants Pass, Oregon | | | | | | |
| | 1,000,000 | | | 4.000%, 12/01/23 | | NR/AA-/NR | | | 1,083,920 | |
| | | | | Madras, Oregon | | | | | | |
| | 725,000 | | | 4.500%, 02/15/27 | | A3/NR/NR | | | 775,917 | |
| | | | | Portland, Oregon Water System | | | | | | |
| | | | | (First Lien) | | | | | | |
| | 3,230,000 | | | 5.000%, 05/01/27 Series A | | Aaa/NR/NR | | | 3,729,907 | |
| | 3,500,000 | | | 5.000%, 06/01/28 Series A | | Aa1/AA/NR | | | 4,065,355 | |
| | | | | Portland, Oregon Sewer System | | | | | | |
| | | | | (Second Lien) | | | | | | |
| | 3,005,000 | | | 5.000%, 03/01/28 Series A | | Aa2/AA-/NR | | | 3,183,647 | |
| | 2,000,000 | | | 5.000%, 10/01/25 Series B | | Aa2/AA-/NR | | | 2,316,200 | |
| | 2,000,000 | | | 5.000%, 06/01/26 Series B | | Aa2/AA-/NR | | | 2,334,480 | |
| | 2,000,000 | | | 5.000%, 06/01/27 Series B | | Aa2/AA-/NR | | | 2,321,640 | |
| | | | | Portland, Oregon Water System | | | | | | |
| | | | | Revenue Refunding (Sr. Lien) | | | | | | |
| | 1,275,000 | | | 4.000%, 05/01/25 Series A | | Aaa/NR/NR | | | 1,328,219 | |
| | | | | Portland, Oregon Water System Revenue | | | | | | |
| | | | | Refunding (Jr. Lien) | | | | | | |
| | 2,000,000 | | | 5.000%, 10/01/23 | | Aa1/NR/NR | | | 2,275,680 | |
| | | | | Salem, Oregon Water & Sewer Revenue | | | | | | |
| | | | | Refunding | | | | | | |
| | 3,500,000 | | | 5.000%, 06/01/25 | | Aa2/NR/NR | | | 4,115,510 | |
| | | | | Seaside, Oregon Wastewater System | | | | | | |
| | 1,000,000 | | | 4.250%, 07/01/26 | | A3/NR/NR | | | 1,051,300 | |
| | | | | Tigard, Oregon Water System | | | | | | |
| | | | | Revenue Refunding | | | | | | |
| | 2,565,000 | | | 5.000%, 08/01/24 | | Aa3/AA-/NR | | | 2,855,384 | |
19 | Aquila Tax-Free Trust of Oregon
AQUILA TAX-FREE TRUST OF OREGON
SCHEDULE OF INVESTMENTS (continued)
MARCH 31, 2018
| | | | | Rating | | |
| | | | | Moody’s, S&P | | |
| Principal | | | | and Fitch | | |
| Amount | | Revenue Bonds (continued) | | (unaudited) | | Value |
| | | | | | | |
| | | Water & Sewer (continued) | | | | |
| | | | | Washington County, Oregon Clean Water | | | | | | |
| | | | | Services Sewer (Senior Lien) | | | | | | |
| $ | 1,010,000 | | | 4.000%, 10/01/22 Series B | | Aa1/AAA/NR | | $ | 1,080,670 | |
| | 1,500,000 | | | 4.000%, 10/01/23 Series B | | Aa1/AAA/NR | | | 1,603,380 | |
| | 2,850,000 | | | 4.000%, 10/01/26 Series B | | Aa1/AAA/NR | | | 2,996,091 | |
| | 2,745,000 | | | 4.000%, 10/01/28 Series B | | Aa1/AAA/NR | | | 2,863,227 | |
| | | | | Woodburn, Oregon Wastewater | | | | | | |
| | | | | Revenue Refunding | | | | | | |
| | 1,090,000 | | | 5.000%, 03/01/21 Series A | | A2/NR/NR | | | 1,180,721 | |
| | | | | Total Water and Sewer | | | | | 46,347,292 | |
| | | | | Total Revenue Bonds | | | | | 180,756,593 | |
| | | | | | | | | | | |
| | | | | Pre-Refunded Bonds (21.2%)†† | | | | | | |
| | | | | Pre-Refunded General Obligation | | | | | | |
| | | | | Bonds (10.4%) | | | | | | |
| | | | | City & County (0.3%) | | | | | | |
| | | | | City of Salem, Oregon | | | | | | |
| | 1,750,000 | | | 5.000%, 06/01/29 | | NR/AA/NR | | | 1,817,323 | |
| | | | | | | | | | | |
| | | | | Community Colleges (1.9%) | | | | | | |
| | | | | Chemeketa, Oregon Community | | | | | | |
| | | | | College District | | | | | | |
| | 1,010,000 | | | 5.500%, 06/15/24 | | NR/AA+/NR | | | 1,018,110 | |
| | 1,235,000 | | | 5.000%, 06/15/25 | | NR/AA+/NR | | | 1,243,694 | |
| | 1,540,000 | | | 5.000%, 06/15/26 | | NR/AA+/NR | | | 1,550,842 | |
| | | | | Portland, Oregon Community | | | | | | |
| | | | | College District | | | | | | |
| | 7,915,000 | | | 5.000%, 06/15/28 | | Aa1/AA+/NR | | | 8,234,370 | |
| | | | | Total Community Colleges | | | | | 12,047,016 | |
| | | | | | | | | | | |
| | | | | Higher Education (0.8%) | | | | | | |
| | | | | Oregon State, Oregon University | | | | | | |
| | | | | System Projects | | | | | | |
| | 2,365,000 | | | 4.000%, 08/01/26 Series H | | Aa1/AA+/AA+ | | | 2,532,418 | |
| | | | | State of Oregon Board of Higher | | | | | | |
| | | | | Education | | | | | | |
| | 1,000,000 | | | 5.000%, 08/01/34 | | Aa1/AA+/NR | | | 1,011,470 | |
| | 1,000,000 | | | 5.000%, 08/01/38 | | Aa1/AA+/NR | | | 1,011,470 | |
| | 500,000 | | | 5.750%, 08/01/29 Series A | | Aa1/AA+/NR | | | 506,955 | |
| | | | | Total Higher Education | | | | | 5,062,313 | |
20 | Aquila Tax-Free Trust of Oregon
AQUILA TAX-FREE TRUST OF OREGON
SCHEDULE OF INVESTMENTS (continued)
MARCH 31, 2018
| | | | | Rating | | |
| | | | | Moody’s, S&P | | |
| Principal | | | | and Fitch | | |
| Amount | | Pre-Refunded Bonds (continued) | | (unaudited) | | Value |
| | | | | |
| | | | | School Districts (5.7%) | | | | | | |
| | | | | Clackamas County, Oregon School | | | | | | |
| | | | | District #46 (Oregon Trail) | | | | | | |
| $ | 1,000,000 | | | 5.000%, 06/15/22 | | NR/AA+/NR | | $ | 1,040,350 | |
| | 1,865,000 | | | 5.000%, 06/15/28 Series A | | NR/AA+/NR | | | 1,940,253 | |
| | 1,800,000 | | | 5.000%, 06/15/29 Series A | | NR/AA+/NR | | | 1,872,630 | |
| | 2,000,000 | | | 5.000%, 06/15/32 Series A | | NR/AA+/NR | | | 2,080,700 | |
| | 3,780,000 | | | 4.750%, 06/15/32 Series A | | NR/AA+/NR | | | 3,921,334 | |
| | | | | Clackamas & Washington Counties, | | | | | | |
| | | | | Oregon School District No. 3JT | | | | | | |
| | | | | (West Linn-Wilsonville) | | | | | | |
| | 1,110,000 | | | 5.000%, 06/15/26 | | Aa1/AA+/NR | | | 1,154,111 | |
| | 2,850,000 | | | 5.000%, 06/15/27 | | Aa1/AA+/NR | | | 2,963,259 | |
| | 2,000,000 | | | 4.500%, 06/15/29 | | Aa1/AA+/NR | | | 2,067,660 | |
| | 1,965,000 | | | 5.000%, 06/15/30 | | Aa1/AA+/NR | | | 2,043,089 | |
| | 3,000,000 | | | 5.000%, 06/15/33 | | Aa1/AA+/NR | | | 3,119,220 | |
| | 500,000 | | | 5.000%, 06/15/34 | | Aa1/AA+/NR | | | 519,870 | |
| | | | | Columbia & Washington Counties, | | | | | | |
| | | | | Oregon School District #47J | | | | | | |
| | | | | (Vernonia) | | | | | | |
| | 3,430,000 | | | 5.00%, 06/15/27 | | NR/AA+/NR | | | 3,671,781 | |
| | | | | Deschutes and Jefferson Counties, | | | | | | |
| | | | | Oregon School District #02J | | | | | | |
| | | | | (Redmond) | | | | | | |
| | 5,000,000 | | | 6.000%, 06/15/31 | | Aa1/NR/NR | | | 5,044,600 | |
| | | | | Jackson County, Oregon School District | | | | | | |
| | | | | #549C (Medford) | | | | | | |
| | 1,000,000 | | | 4.625%, 06/15/27 | | Aa1/AA+/NR | | | 1,005,990 | |
| | 1,000,000 | | | 5.000%, 06/15/33 | | Aa1/AA+/NR | | | 1,006,730 | |
| | | | | Washington County, Oregon School | | | | | | |
| | | | | District #48J (Beaverton) | | | | | | |
| | 1,280,000 | | | 5.000%, 06/01/31 AGC Insured | | Aa2/AA/NR | | | 1,329,997 | |
| | 1,000,000 | | | 5.125%, 06/01/36 AGC Insured | | Aa2/AA/NR | | | 1,040,490 | |
| | | | | Total School Districts | | | | | 35,822,064 | |
| | | | | | | | | | | |
| | | | | Special Districts (0.2%) | | | | | | |
| | | | | Tualatin Hills, Oregon Park & | | | | | | |
| | | | | Recreational District | | | | | | |
| | 1,000,000 | | | 4.250%, 06/01/24 | | Aa1/AA/NR | | | 1,030,460 | |
21 | Aquila Tax-Free Trust of Oregon
AQUILA TAX-FREE TRUST OF OREGON
SCHEDULE OF INVESTMENTS (continued)
MARCH 31, 2018
| | | | | Rating | | |
| | | | | Moody’s, S&P | | |
| Principal | | | | and Fitch | | |
| Amount | | Pre-Refunded Bonds (continued) | | (unaudited) | | Value |
| | | | | | | |
| | | State (1.5%) | | | | |
| | | | | State of Oregon Alternative | | | | | | |
| | | | | Energy Project | | | | | | |
| $ | 1,255,000 | | | 4.750%, 04/01/29 Series B | | Aa1/AA+/AA+ | | $ | 1,294,357 | |
| | 500,000 | | | 6.000%, 10/01/29 Series B | | Aa1/AA+/AA+ | | | 510,940 | |
| | | | | State of Oregon Department of | | | | | | |
| | | | | Administrative Services | | | | | | |
| | 5,000,000 | | | 5.125%, 05/01/33 | | Aa2/AA/AA | | | 5,188,600 | |
| | | | | State of Oregon Department of | | | | | | |
| | | | | Administrative Services COP | | | | | | |
| | 1,455,000 | | | 5.000%, 11/01/27 Series C | | NR/NR/NR | | | 1,528,492 | |
| | 960,000 | | | 5.000%, 11/01/28 Series C | | NR/NR/NR | | | 1,008,490 | |
| | | | | Total State | | | | | 9,530,879 | |
| | | | | Total Pre-Refunded General | | | | | | |
| | | | | Obligation Bonds | | | | | 65,310,055 | |
| | | | | | | | | | | |
| | | | | Pre-Refunded Revenue Bonds (10.8%) | | | | | | |
| | | | | City & County (0.4%) | | | | | | |
| | | | | Local Oregon Capital Assets Program | | | | | | |
| | | | | COP Cottage Grove | | | | | | |
| | 2,375,000 | | | 5.000%, 09/15/25 Series 2013A | | Baa1/NR/NR | | | 2,618,865 | |
| | | | | | | | | | | |
| | | | | Electric (1.3%) | | | | | | |
| | | | | Eugene, Oregon Electric Utility | | | | | | |
| | 5,635,000 | | | 5.000%, 08/01/30 | | Aa2/AA-/AA- | | | 5,699,633 | |
| | | | | Eugene, Oregon Electric Utility | | | | | | |
| | | | | Refunding System | | | | | | |
| | 2,000,000 | | | 5.000%, 08/01/27 Series A | | Aa2/AA-/AA- | | | 2,205,780 | |
| | | | | Total Electric | | | | | 7,905,413 | |
| | | | | | | | | | | |
| | | | | Higher Education (1.5%) | | | | | | |
| | | | | Oregon State Facilities Authority Revenue | | | | | | |
| | | | | Refunding (Reed College Project) | | | | | | |
| | 1,500,000 | | | 5.000%, 07/01/29 Series A | | Aa2/AA-/NR | | | 1,609,200 | |
| | | | | Oregon State Facilities Authority | | | | | | |
| | | | | (University of Portland) | | | | | | |
| | 3,000,000 | | | 5.000%, 04/01/32 | | NR/A-/NR | | | 3,000,000 | |
| | | | | Portland, Oregon Economic | | | | | | |
| | | | | Development (Broadway Project) | | | | | | |
| | 5,000,000 | | | 6.500%, 04/01/35 | | A1/NR/NR | | | 5,120,400 | |
| | | | | Total Higher Education | | | | | 9,729,600 | |
22 | Aquila Tax-Free Trust of Oregon
AQUILA TAX-FREE TRUST OF OREGON
SCHEDULE OF INVESTMENTS (continued)
MARCH 31, 2018
| | | | | Rating | | |
| | | | | Moody’s, S&P | | |
| Principal | | | | and Fitch | | |
| Amount | | Pre-Refunded Bonds (continued) | | (unaudited) | | Value |
| | | | | | | |
| | | Hospitals (1.7%) | | | | |
| | | | | Deschutes County, Oregon Hospital | | | | | | |
| | | | | Facilities Authority (Cascade Health) | | | | | | |
| $ | 3,500,000 | | | 8.000%, 01/01/28 | | A2/NR/NR | | $ | 3,660,685 | |
| | | | | Oregon Health Sciences University | | | | | | |
| | 4,500,000 | | | 5.750%, 07/01/39 Series A | | Aa3/AA-/NR | | | 4,726,215 | |
| | | | | Salem, Oregon Hospital Facility | | | | | | |
| | | | | Authority (Salem Hospital) | | | | | | |
| | 2,000,000 | | | 5.750%, 08/15/23 | | NR/A+/AA- | | | 2,030,020 | |
| | | | | Total Hospitals | | | | | 10,416,920 | |
| | | | | | | | | | | |
| | | | | Lottery (1.5%) | | | | | | |
| | | | | Oregon State Department of | | | | | | |
| | | | | Administration Services | | | | | | |
| | | | | (Lottery Revenue) | | | | | | |
| | 6,285,000 | | | 5.250%, 04/01/26 | | NR/NR/NR* | | | 6,906,649 | |
| | 2,500,000 | | | 5.000%, 04/01/29 | | Aa2/AAA/NR | | | 2,584,525 | |
| | | | | Total Lottery | | | | | 9,491,174 | |
| | | | | | | | | | | |
| | | | | Transportation (2.3%) | | | | | | |
| | | | | Oregon State Department Transportation | | | | | | |
| | | | | Highway Usertax (Senior Lien) | | | | | | |
| | 1,865,000 | | | 5.000%, 11/15/23 Series A | | Aa1/AAA/NR | | | 1,935,292 | |
| | 2,000,000 | | | 4.625%, 11/15/25 Series A | | Aa1/AAA/NR | | | 2,067,120 | |
| | 1,000,000 | | | 5.000%, 11/15/26 Series A | | Aa1/AAA/AA+ | | | 1,152,870 | |
| | | | | Tri-County Metropolitan Transportation | | | | | | |
| | | | | District, Oregon Capital Grant Receipt | | | | | | |
| | 1,685,000 | | | 5.000%, 10/01/24 Series A | | A3/A/NR | | | 1,862,599 | |
| | 3,480,000 | | | 5.000%, 10/01/26 Series A | | A3/A/NR | | | 3,846,792 | |
| | 3,000,000 | | | 5.000%, 10/01/27 Series A | | A3/A/NR | | | 3,316,200 | |
| | | | | Total Transportation | | | | | 14,180,873 | |
| | | | | | | | | | | |
| | | | | Water & Sewer (2.1%) | | | | | | |
| | | | | Lane County, Oregon Metropolitan | | | | | | |
| | | | | Wastewater | | | | | | |
| | 2,500,000 | | | 5.250%, 11/01/28 | | Aa2/AA/NR | | | 2,553,700 | |
| | | | | Portland Oregon Sewer System | | | | | | |
| | | | | Refunding (Second Lien) | | | | | | |
| | 5,000,000 | | | 5.000%, 06/15/33 Series B | | Aa2/AA-/NR | | | 5,035,200 | |
23 | Aquila Tax-Free Trust of Oregon
AQUILA TAX-FREE TRUST OF OREGON
SCHEDULE OF INVESTMENTS (continued)
MARCH 31, 2018
| | | | | Rating | | |
| | | | | Moody’s, S&P | | |
| Principal | | | | and Fitch | | |
| Amount | | Pre-Refunded Bonds (continued) | | (unaudited) | | Value |
| | | | | | | |
| | | Water & Sewer (continued) | | | | |
| | | | | Prineville, Oregon Refunding | | | | | | | | |
| $ | 1,255,000 | | | 4.400%, 06/01/29 AGMC Insured | | | NR/AA/NR | | | $ | 1,353,191 | |
| | | | | Washington County, Oregon Clean | | | | | | | | |
| | | | | Water Services Sewer | | | | | | | | |
| | 4,000,000 | | | 5.000%, 10/01/28 | | | Aa1/AAA/NR | | | | 4,198,200 | |
| | | | | Total Water and Sewer | | | | | | | 13,140,291 | |
| | | | | Total Pre-Refunded Revenue Bonds | | | | | | | 67,483,136 | |
| | | | | Total Pre-Refunded Bonds | | | | | | | 132,793,191 | |
| | | | | Total Investments | | | | | | | | |
| | | | | (cost $606,958,348-note 4) | | | 97.9% | | | | 613,796,099 | |
| | | | | Other assets less liabilities | | | 2.1 | | | | 13,257,310 | |
| | | | | Net Assets | | | 100.0% | | | $ | 627,053,409 | |
| | | Percent of |
| Portfolio Distribution By Quality Rating (unaudited) | | Investments † |
| Aaa of Moody’s or AAA of S&P | | | 18.9 | % |
| Pre-refunded bonds†† | | | 21.6 | |
| Aa of Moody’s or AA of S&P or Fitch | | | 53.1 | |
| A of Moody’s or S&P or Fitch | | | 4.9 | |
| Baa of Moody’s or BBB of S&P | | | 1.5 | |
| | | | 100.0 | % |
| | PORTFOLIO ABBREVIATION: | |
| | AGC - Assured Guaranty Corp. | |
| | AGMC - Assured Guaranty Municipal Corp. | |
| | COP- Certificates of Participation | |
| | FGIC - Financial Guaranty Insurance Co. | |
| | MAC - Municipal Assurance Corp. | |
| | NPFG - National Public Finance Guarantee | |
| | NR - Not Rated | |
| | ODOT - Oregon Department of Transportation | |
24 | Aquila Tax-Free Trust of Oregon
AQUILA TAX-FREE TRUST OF OREGON
SCHEDULE OF INVESTMENTS (continued)
MARCH 31, 2018
| | * | Any security not rated (“NR”) by any of the Nationally Recognized Statistical Rating Organizations (“NRSRO”) has been determined by the Investment Sub-Adviser to have sufficient quality to be ranked in the top four credit ratings if a credit rating were to be assigned by a NRSRO. | |
| | | | |
| | † | Where applicable, calculated using the highest rating of the three NRSROs. | |
| | | | |
| | †† | Pre-refunded bonds are bonds for which U.S. Government Obligations usually have been placed in escrow to retire the bonds at their earliest call date. | |
| | | | |
| | | Note: 144A – Security exempt from registration pursuant to Rule 144A under the Securities Act of 1933. These securities may be resold in transactions exempt from registration, normally to qualified institutional buyers. | |
See accompanying notes to financial statements.
25 | Aquila Tax-Free Trust of Oregon
AQUILA TAX-FREE TRUST OF OREGON
STATEMENT OF ASSETS AND LIABILITIES
YEAR MARCH 31, 2018 31, 2017
| ASSETS | | |
| Investments at value (cost $606,958,348) | | $ | 613,796,099 | |
| Cash | | | 5,904,662 | |
| Interest receivable | | | 8,527,529 | |
| Receivable for Trust shares sold | | | 121,596 | |
| Other assets | | | 58,572 | |
| Total assets | | | 628,408,458 | |
| | | | | |
| LIABILITIES | | | | |
| Payable for Trust shares redeemed | | | 676,795 | |
| Dividends payable | | | 236,782 | |
| Management fees payable | | | 209,610 | |
| Distribution and service fees payable | | | 1,274 | |
| Accrued expenses payable | | | 230,588 | |
| Total liabilities | | | 1,355,049 | |
| | | | | |
| NET ASSETS | | $ | 627,053,409 | |
| Net Assets consist of: | | | | |
| Capital Stock - Authorized an unlimited number of shares, par | | | | |
| value $0.01 per share | | $ | 580,261 | |
| Additional paid-in capital | | | 620,521,998 | |
| Net unrealized appreciation on investments (note 4) | | | 6,837,751 | |
| Undistributed net investment income | | | 310,752 | |
| Accumulated net realized loss on investments | | | (1,197,353 | ) |
| | | $ | 627,053,409 | |
| CLASS A | | | | |
| Net Assets | | $ | 389,669,448 | |
| Capital shares outstanding | | | 36,047,639 | |
| Net asset value and redemption price per share | | $ | 10.81 | |
| Maximum offering price per share (100/96 of $10.81) | | $ | 11.26 | |
| | | | | |
| CLASS C | | | | |
| Net Assets | | $ | 28,359,280 | |
| Capital shares outstanding | | | 2,626,009 | |
| Net asset value and offering price per share | | $ | 10.80 | |
| Redemption price per share (* a charge of 1% is imposed on the | | | | |
| redemption proceeds, or on the original price, whichever is | | | | |
| lower, if redeemed during the first 12 months after purchase) | | $ | 10.80 | * |
| | | | | |
| CLASS Y | | | | |
| Assets | | $ | 209,024,681 | |
| Capital shares outstanding | | | 19,352,442 | |
| Net asset value, offering and redemption price per share | | $ | 10.80 | |
See accompanying notes to financial statements.
26 | Aquila Tax-Free Trust of Oregon
AQUILA TAX-FREE TRUST OF OREGON
STATEMENT OF OPERATIONS
YEAR ENDED MARCH 31, 2018
| Investment Income: | | | | | | | | |
| | | | | | | | | |
| Interest income | | | | | | $ | 19,569,424 | |
| | | | | | | | | |
| Expenses: | | | | | | | | |
| | | | | | | | | |
| Management fee (note 3) | | $ | 2,562,558 | | | | | |
| Distribution and service fees (note 3) | | | 948,167 | | | | | |
| Transfer and shareholder servicing agent fees | | | 298,147 | | | | | |
| Trustees’ fees and expenses (note 6) | | | 292,906 | | | | | |
| Legal fees | | | 222,862 | | | | | |
| Registration fees and dues | | | 56,050 | | | | | |
| Shareholders’ reports and proxy statements | | | 51,586 | | | | | |
| Auditing and tax fees | | | 28,100 | | | | | |
| Insurance | | | 27,017 | | | | | |
| Custodian fees | | | 20,224 | | | | | |
| Chief compliance officer services (note 3) | | | 11,114 | | | | | |
| Miscellaneous | | | 55,252 | | | | | |
| Total expenses | | | 4,573,983 | | | | | |
| | | | | | | | | |
| Management fees waived (note 3) | | | (48,128 | ) | | | | |
| Net expenses | | | | | | | 4,525,855 | |
| Net investment income | | | | | | | 15,043,569 | |
| | | | | | | | | |
| Realized and Unrealized Gain (Loss) on Investments: | | | | | | | | |
| | | | | | | | | |
| Net realized gain (loss) from securities | | | | | | | | |
| transactions | | | 167,934 | | | | | |
| Change in unrealized appreciation on | | | | | | | | |
| investments | | | (10,825,870 | ) | | | | |
| | | | | | | | | |
| Net realized and unrealized gain (loss) on | | | | | | | | |
| investments | | | | | | | (10,657,936 | ) |
| Net change in net assets resulting from | | | | | | | | |
| operations | | | | | | $ | 4,385,633 | |
See accompanying notes to financial statements.
27 | Aquila Tax-Free Trust of Oregon
AQUILA TAX-FREE TRUST OF OREGON
STATEMENTS OF CHANGES IN NET ASSETS
| | | Year Ended | | Year Ended |
| | | March 31, 2018 | | March 31, 2017 |
| OPERATIONS: | | | | | | | | |
| Net investment income | | $ | 15,043,569 | | | $ | 16,352,018 | |
| Net realized gain (loss) from | | | | | | | | |
| securities transactions | | | 167,934 | | | | (542,744 | ) |
| Change in unrealized appreciation | | | | | | | | |
| on investments | | | (10,825,870 | ) | | | (21,619,220 | ) |
| Change in net assets resulting | | | | | | | | |
| from operations | | | 4,385,633 | | | | (5,809,946 | ) |
| | | | | | | | | |
| DISTRIBUTIONS TO SHAREHOLDERS (note 9): | | | | | | | | |
| Class A Shares: | | | | | | | | |
| Net investment income | | | (9,508,309 | ) | | | (10,085,312 | ) |
| | | | | | | | | |
| Class C Shares: | | | | | | | | |
| Net investment income | | | (501,190 | ) | | | (594,605 | ) |
| | | | | | | | | |
| Class Y Shares: | | | | | | | | |
| Net investment income | | | (4,927,256 | ) | | | (5,031,747 | ) |
| Change in net assets from | | | | | | | | |
| distributions | | | (14,936,755 | ) | | | (15,711,664 | ) |
| | | | | | | | | |
| CAPITAL SHARE TRANSACTIONS (note 7): | | | | | | | | |
| Proceeds from shares sold | | | 113,571,724 | | | | 146,036,358 | |
| Reinvested dividends and | | | | | | | | |
| distributions | | | 12,271,877 | | | | 12,930,374 | |
| Cost of shares redeemed | | | (125,934,967 | ) | | | (135,047,621 | ) |
| Change in net assets from | | | | | | | | |
| capital share transactions | | | (91,366 | ) | | | 23,919,111 | |
| | | | | | | | | |
| Change in net assets | | | (10,642,488 | ) | | | 2,397,501 | |
| | | | | | | | | |
| NET ASSETS: | | | | | | | | |
| Beginning of period | | | 637,695,897 | | | | 635,298,396 | |
| End of period* | | $ | 627,053,409 | | | $ | 637,695,897 | |
| | | | | | | | | |
| * Includes undistributed net investment income of: | | $ | 310,752 | | | $ | 197,217 | |
See accompanying notes to financial statements.
28 | Aquila Tax-Free Trust of Oregon
AQUILA TAX-FREE TRUST OF OREGON
NOTES TO FINANCIAL STATEMENTS
MARCH 31, 2018
1. Organization
Aquila Tax-Free Trust of Oregon (the “Trust”) (from inception until the close of business on October 11, 2013, the Trust operated under the name Tax-Free Trust of Oregon) is the sole portfolio of The Cascades Trust. The Cascades Trust (the “Business Trust”) is an open-end investment company, which was organized on October 17, 1985, as a Massachusetts business trust and commenced operations on June 16, 1986. The Trust is authorized to issue an unlimited number of shares. Class A Shares are sold at net asset value plus a sales charge of varying size (depending upon a variety of factors) paid at the time of purchase and bear a distribution fee. Class C Shares are sold at net asset value with no sales charge payable at the time of purchase but with a level charge for service and distribution fees for six years thereafter. Class C Shares automatically convert to Class A Shares after six years. Class Y Shares are sold only through authorized financial institutions acting for investors in a fiduciary, advisory, agency, custodial or similar capacity, and are not offered directly to retail customers. Class Y Shares are sold at net asset value with no sales charge, no redemption fee, no contingent deferred sales charge (“CDSC”) and no distribution fee. As of the date of this report, there were no Class F Shares or Class T Shares outstanding. All classes of shares represent interests in the same portfolio of investments and are identical as to rights and privileges but differ with respect to the effect of sales charges, the distribution and/or service fees borne by each class, expenses specific to each class, voting rights on matters affecting a single class and the exchange privileges of each class.
2. Significant Accounting Policies
The following is a summary of significant accounting policies followed by the Trust in the preparation of its financial statements. The policies are in conformity with accounting principles generally accepted in the United States of America for investment companies.
| a) | Portfolio valuation: Municipal securities are valued each business day based upon information provided by a nationally prominent independent pricing service and periodically verified through other pricing services. In the case of securities for which market quotations are readily available, securities are valued by the pricing service at the mean of bid and ask quotations. If a market quotation or a valuation from the pricing service is not readily available, the security is valued at fair value determined in good faith under procedures established by and under the general supervision of the Board of Trustees. |
| b) | Fair value measurements: The Trust follows a fair value hierarchy that distinguishes between market data obtained from independent sources (observable inputs) and the Trust’s own market assumptions (unobservable inputs). These inputs are used in determining the value of the Trust’s investments and are summarized in the following fair value hierarchy: |
| | Level 1 – Unadjusted quoted prices in active markets for identical assets or liabilities that the Trust has the ability to access. |
| | Level 2 – Observable inputs other than quoted prices included in Level 1 that are observable for the asset or liability, either directly or indirectly. These inputs may include quoted prices for the identical instrument on an inactive market, prices for similar instruments, interest rates, prepayment speeds, credit risk, yield curves, default rates and similar data. |
29 | Aquila Tax-Free Trust of Oregon
AQUILA TAX-FREE TRUST OF OREGON
NOTES TO FINANCIAL STATEMENTS (continued)
MARCH 31, 2018
| | Level 3 – Unobservable inputs for the asset or liability, to the extent relevant observable inputs are not available, representing the Trust’s own assumptions about the assumptions a market participant would use in valuing the asset or liability, based on the best information available. |
| | The inputs or methodology used for valuing securities are not an indication of the risk associated with investing in those securities. |
| | The following is a summary of the valuation inputs, representing 100% of the Trust’s investments, used to value the Trust’s net assets as of March 31, 2018: |
| Valuation Inputs | | Investments in Securities |
| Level 1 – Quoted Prices | | $ | — | |
| Level 2 – Other Significant Observable | | | | |
| Inputs – Municipal Bonds* | | | 613,796,099 | |
| Level 3 – Significant Unobservable Inputs | | | — | |
| Total | | $ | 613,796,099 | |
*See schedule of investments for a detailed listing of securities.
| c) | Subsequent events: In preparing these financial statements, the Trust has evaluated events and transactions for potential recognition or disclosure through the date these financial statements were issued. |
| d) | Securities transactions and related investment income: Securities transactions are recorded on the trade date. Realized gains and losses from securities transactions are reported on the identified cost basis. Interest income is recorded daily on the accrual basis and is adjusted for amortization of premium and accretion of original issue and market discount. |
| e) | Federal income taxes: It is the policy of the Trust to continue to qualify as a regulated investment company by complying with the provisions of the Internal Revenue Code applicable to certain investment companies. The Trust intends to make distributions of income and securities profits sufficient to relieve it from all, or substantially all, Federal income and excise taxes. |
| | Management has reviewed the tax positions for each of the open tax years (2015 –2017) or expected to be taken in the Fund’s 2018 tax returns and has concluded that there are no significant uncertain tax positions that would require recognition in the financial statements. |
| f) | Multiple class allocations: All income, expenses (other than class-specific expenses), and realized and unrealized gains or losses are allocated daily to each class of shares based on the relative net assets of each class. Class-specific expenses, which include distribution and service fees and any other items that are specifically attributed to a particular class, are also charged directly to such class on a daily basis. |
| g) | Use of estimates: The preparation of financial statements in conformity with accounting principles generally accepted in the United States of America requires management to make estimates and assumptions that affect the reported amounts of assets and liabilities and disclosure of contingent assets and liabilities at the date of the financial statements and the reported amounts of increases and decreases in net assets from operations during the reporting period. Actual results could differ from those estimates. |
30 | Aquila Tax-Free Trust of Oregon
AQUILA TAX-FREE TRUST OF OREGON
NOTES TO FINANCIAL STATEMENTS (continued)
MARCH 31, 2018
| h) | Reclassification of capital accounts: Accounting principles generally accepted in the United States of America require that certain components of net assets relating to permanent differences be reclassified between financial and tax reporting. On March 31, 2018, the Trust increased additional paid-in capital by $6,365, increased undistributed net investment income by $6,721 and increased accumulated net realized loss on investments by $13,086 These reclassificatiions had no effect on net assets or net asset value per share. |
| i) | The Trust is an investment company and accordingly follows the investment company accounting and reporting of the Financial Accounting Standards Board (“FASB”) Accounting Standard Codification Topic 946 “Financial Services-Investment Companies”. |
3. Fees and Related Party Transactions
a) Management Arrangements:
Aquila Investment Management LLC (the “Manager”), a wholly-owned subsidiary of Aquila Management Corporation, the Trust’s founder and sponsor, serves as the Manager for the Trust under an Advisory and Administration Agreement with the Trust. The portfolio management of the Trust has been delegated to a Sub-Adviser as described below. Under the Advisory and Administrative Agreement, the Manager provides all administrative services to the Trust, other than those relating to the day-today portfolio management. The Manager’s services include providing the office of the Trust and all related services as well as overseeing the activities of the Sub-Adviser and managing relationships with all the various support organizations to the Trust such as the shareholder servicing agent, custodian, legal counsel, auditors and distributor and additionally maintaining the Trust’s accounting books and records. For its services, the Manager is entitled to receive a fee which is payable monthly and computed as of the close of business each day at the annual rate of 0.40% of net assets of the Trust. The Manager has contractually agreed to waive its fees through September 30, 2018 to the extent necessary in order to pass savings through to the shareholders recognized under the Sub-Advisory Agreement (as described below) such that its fees are as follows: the annual rate shall be equivalent to 0.40% of net assets of the Trust up to $400 million; 0.38% of the Trust’s net assets above that amount to $1 billion and 0.36% of the Trust’s net assets above $1 billion. For the year ended March 31, 2018, the Trust incurred management fees of $2,562,558, of which $48,128 was waived.
Kirkpatrick Pettis Capital Management (the “Sub-Adviser”) serves as the Investment Sub-Adviser for the Trust under a Sub-Advisory Agreement between the Manager and the Sub-Adviser. Under this agreement, the Sub-Adviser continuously provides, subject to oversight of the Manager and the Board of Trustees of the Trust, the investment program of the Trust and the composition of its portfolio, arranges for the purchases and sales of portfolio securities, and provides for daily pricing of the Trust’s portfolio. For its services, the Sub-Adviser is entitled to receive a fee from the Manager which is payable monthly and computed as of the close of business each day at the annual rate of 0.18% of net assets of the Trust up to $400 million; 0.16% of net assets above $400 million up to $1 billion; and 0.14% of net assets above $1 billlion.
31 | Aquila Tax-Free Trust of Oregon
AQUILA TAX-FREE TRUST OF OREGON
NOTES TO FINANCIAL STATEMENTS (continued)
MARCH 31, 2018
Under a Compliance Agreement with the Manager, the Manager is compensated by the Trust for Chief Compliance Officer related services provided to enable the Trust to comply with Rule 38a-1 of the Investment Company Act of 1940, as amended (the “1940 Act”).
Specific details as to the nature and extent of the services provided by the Manager and the Sub-Adviser are more fully defined in the Trust’s Prospectus and Statement of Additional Information.
b) Distribution and Service Fees:
The Trust has adopted a Distribution Plan (the “Plan”) pursuant to Rule 12b-1 (the “Rule”) under the 1940 Act. Under one part of the Plan, with respect to Class A Shares, the Trust is authorized to make distribution fee payments to broker-dealers or others (“Qualified Recipients”) selected by Aquila Distributors LLC (the “Distributor”), including, but not limited to, any principal underwriter of the Trust, with which the Distributor has entered into written agreements contemplated by the Rule and which have rendered assistance in the distribution and/or retention of the Trust’s shares or servicing of shareholder accounts. The Trust makes payment of this distribution fee at the annual rate of 0.15% of the Trust’s average net assets represented by Class A Shares. For the year ended March 31, 2018, distribution fees on Class A Shares amounted to $608,690 of which the Distributor retained $27,072
Under another part of the Plan, the Trust is authorized to make payments with respect to Class C Shares to Qualified Recipients which have rendered assistance in the distribution and/or retention of the Trust’s Class C shares or servicing of shareholder accounts. These payments are made at the annual rate of 0.75% of the Trust’s average net assets represented by Class C Shares and for the year ended March 31, 2018, amounted to $254,608. In addition, under a Shareholder Services Plan, the Trust is authorized to make service fee payments with respect to Class C Shares to Qualified Recipients for providing personal services and/or maintenance of shareholder accounts. These payments are made at the annual rate of 0.25% of the Trust’s average net assets represented by Class C Shares and for the year ended March 31, 2018, amounted to $84,869. The total of these payments made with respect to Class C Shares amounted to $339,477 of which the Distributor retained $78,427.
Specific details about the Plans are more fully defined in the Trust’s Prospectus and Statement of Additional Information.
Under a Distribution Agreement, the Distributor serves as the exclusive distributor of the Trust’s shares. Through agreements between the Distributor and various brokerage and advisory firms (“financial intermediaries”), the Trust’s shares are sold primarily through the facilities of these financial intermediaries having offices within Oregon, with the bulk of any sales commissions inuring to such financial intermediaries. For the year ended March 31, 2018, total commissions on sales of Class A Shares amounted to $410,939 of which the Distributor received $76,347.
32 | Aquila Tax-Free Trust of Oregon
AQUILA TAX-FREE TRUST OF OREGON
NOTES TO FINANCIAL STATEMENTS (continued)
MARCH 31, 2018
c) Transfer and shareholder servicing fees:
The Trust occasionally compensates financial intermediaries in connection with the sub-transfer agency related services provided by such entities in connection with their respective Trust shareholders so long as the fees are deemed by the Board of Trustees to be reasonable in relation to (i) the value of the services and the benefits received by the Trust and certain shareholders; and (ii) the payments that the Trust would make to another entity to perform similar ongoing services to existing shareholders.
4. Purchases and Sales of Securities
During the year ended March 31, 2018, purchases of securities and proceeds from the sales of securities aggregated $62,193,218 and $52,316,948, respectively.
At March 31, 2018, the aggregate tax cost for all securities was $606,958,348. At March 31, 2018, the aggregate gross unrealized appreciation for all securities in which there is an excess of value over tax cost amounted to $11,726,793 and aggregate gross unrealized depreciation for all securities in which there is an excess of tax cost over value amounted to $4,889,042 for a net unrealized appreciation of $6,837,751.
5. Portfolio Orientation
Since the Trust invests principally and may invest entirely in double tax-free municipal obligations of issuers within Oregon, it is subject to possible risks associated with economic, political, or legal developments or industrial or regional matters specifically affecting Oregon and whatever effects these may have upon Oregon issuers’ ability to meet their obligations. For example, Measure 5, a 1990 amendment to the Oregon Constitution, as well as Measures 47 and 50, limit the taxing and spending authority of certain Oregon governmental entities. These amendments could have an adverse effect on the general financial condition of certain municipal entities that would impair the ability of certain Oregon issuers to pay interest and principal on their obligations. At March 31, 2018, the Trust had 100% of its net assets invested in municipal obligations of issuers within Oregon.
6. Trustees’ Fees and Expenses
At March 31, 2018, there were 8 Trustees, one of whom is affiliated with the Manager and is not paid any fees. The total amount of Trustees’ service fees (for carrying out their responsibilities) and attendance fees paid during the year ended March 31, 2018 was $239,851. Attendance fees are paid to those in attendance at regularly scheduled quarterly Board Meetings and meetings of the Independent Trustees held prior to each quarterly Board Meeting, as well as additional meetings (such as Audit, Nominating, Shareholder and special meetings). Trustees are reimbursed for their expenses such as travel, accommodations, and meals incurred in connection with attendance at Board Meetings and at the Annual Meeting of Shareholders. For the year ended March 31, 2018, such meeting-related expenses amounted to $53,055.
33 | Aquila Tax-Free Trust of Oregon
AQUILA TAX-FREE TRUST OF OREGON
NOTES TO FINANCIAL STATEMENTS (continued)
MARCH 31, 2018
7. Capital Share Transactions
Transactions in Capital Shares of the Trust were as follows:
| | | Year Ended | | Year Ended |
| | | March 31, 2018 | | March 31, 2017 |
| | | Shares | | Amount | | Shares | | Amount |
| Class A Shares: | | | | | | | | |
| Proceeds from shares sold | | | 3,092,150 | | | $ | 34,080,156 | | | | 4,781,450 | | | $ | 53,679,014 | |
| Reinvested dividends and | | | | | | | | | | | | | | | | |
| distributions | | | 713,675 | | | | 7,861,742 | | | | 744,512 | | | | 8,328,138 | |
| Cost of shares redeemed | | | (5,408,758 | ) | | | (59,588,486 | ) | | | (4,847,261 | ) | | | (53,927,875 | ) |
| Net change | | | (1,602,933 | ) | | | (17,646,588 | ) | | | 678,701 | | | | 8,079,277 | |
| | | | | | | | | | | | | | | | | |
| Class C Shares: | | | | | | | | | | | | | | | | |
| Proceeds from shares sold | | | 322,543 | | | | 3,558,945 | | | | 1,007,183 | | | | 11,352,526 | |
| Reinvested dividends and | | | | | | | | | | | | | | | | |
| distributions | | | 42,236 | | | | 465,018 | | | | 48,531 | | | | 541,957 | |
| Cost of shares redeemed | | | (1,204,350 | ) | | | (13,258,515 | ) | | | (762,522 | ) | | | (8,480,153 | ) |
| Net change | | | (839,571 | ) | | | (9,234,552 | ) | | | 293,192 | | | | 3,414,330 | |
| | | | | | | | | | | | | | | | | |
| Class Y Shares: | | | | | | | | | | | | | | | | |
| Proceeds from shares sold | | | 6,893,018 | | | | 75,932,623 | | | | 7,227,623 | | | | 81,004,818 | |
| Reinvested dividends and | | | | | | | | | | | | | | | | |
| distributions | | | 358,934 | | | | 3,945,117 | | | | 363,045 | | | | 4,060,279 | |
| Cost of shares redeemed | | | (4,832,365 | ) | | | (53,087,966 | ) | | | (6,598,236 | ) | | | (72,639,593 | ) |
| Net change | | | 2,419,587 | | | | 26,789,774 | | | | 992,432 | | | | 12,425,504 | |
| Total transactions in Trust | | | | | | | | | | | | | | | | |
| shares | | | (22,917 | ) | | $ | (91,366 | ) | | | 1,964,325 | | | $ | 23,919,111 | |
8. Securities Traded on a When-Issued Basis
The Trust may purchase or sell securities on a when-issued basis. When-issued transactions arise when securities are purchased or sold by the Trust with payment and delivery taking place in the future in order to secure what is considered to be an advantageous price and yield to the Trust at the time of entering into the transaction. Beginning on the date the Trust enters into a when-issued transaction, cash or other liquid securities are segregated in an amount equal to or greater than the value of the when-issued transaction. These transactions are subject to market fluctuations and their current value is determined in the same manner as for other securities.
9. Income Tax Information and Distributions
The Trust declares dividends daily from net investment income and makes payments monthly. Net realized capital gains, if any, are distributed annually and are taxable. These distributions are paid in additional shares at the net asset value per share or in cash, at the shareholder’s option.
The Trust intends to maintain, to the maximum extent possible, the tax-exempt status of interest payments received from portfolio municipal securities in order to allow dividends paid to shareholders from net investment income to be exempt from regular Federal and State of Oregon income taxes. Due to differences between financial statement reporting and Federal income tax reporting requirements, distributions made by the Trust may not be the same as the Trust’s net investment income, and/ or net realized securities gains. Further, a portion of the dividends may, under some circumstances, be subject to taxes at ordinary income and/or capital gain rates. As a result of the passage of the Regulated Investment Company Act of 2010 (the “Act”), losses incurred in this fiscal year and beyond retain their character as short-term or long-term, have no expiration date and are utilized before capital losses incurred prior to the enactment of the Act. At March 31, 2018, the Trust had capital loss carryover of $923,852 which is short-term and has no expiration date. During the fiscal year ended March 31, 2018, the Trust utilized $428,349 of capital loss carryforward.
34 | Aquila Tax-Free Trust of Oregon
AQUILA TAX-FREE TRUST OF OREGON
NOTES TO FINANCIAL STATEMENTS (continued)
MARCH 31, 2018
The tax character of distributions was as follows:
| | | Year | | Year |
| | | Ended | | Ended |
| | | March 31, 2018 | | March 31, 2017 |
| Net tax-exempt income | | $ | 14,836,316 | | | $ | 15,681,897 | |
| Ordinary income | | | 100,439 | | | | 29,767 | |
| | | $ | 14,936,755 | | | $ | 15,711,664 | |
As of March 31, 2018 the components of distributable earnings on a tax basis were as follows:
| Unrealized appreciation | | $ | 6,837,751 | | | | | |
| Undistributed tax-exempt income | | | 547,534 | | | | | |
| Accumulated net loss on investments | | | (923,852 | ) | | | | |
| Post October losses | | | (273,501 | ) | | | | |
| Other temporary differences | | | (236,783 | ) | | | | |
| | | $ | 5,951,149 | | | | | |
The difference between book basis and tax basis undistributed income is due to the timing difference, and other temporary differences, in recognizing dividends paid, Post October losses, the tax treatment of market discount amortization, and the deduction of distributions payable.
10. Credit Facility
Effective August 30, 2017, the Bank of New York Mellon and the Aquila Group of Funds became parties to a $40 million credit agreement, which currently terminates on August 29, 2018. In accordance with the Aquila Group of Funds Guidelines for Allocation of Committed Line of Credit (the Aquila Group of Funds is comprised of nine funds), each fund is responsible for payment of its proportionate share of
| a) | a 0.15% per annum commitment fee; and, |
| b) | interest on amounts borrowed for temporary or emergency purposes by the Trust (at the applicable rate selected by the Aquila Group of Funds at the time of the borrowing of either (i) the one-month Eurodollar Rate or (ii) a rate equal to the greater of (a) the Prime Rate in effect on such day, (b) the Federal Funds Effective Rate in effect on such day, or (c) the Overnight Eurodollar Rate in effect on such day). |
There were no borrowings under the credit agreement for the period ended March 31, 2018.
35 | Aquila Tax-Free Trust of Oregon
AQUILA TAX-FREE TRUST OF OREGON
FINANCIAL HIGHLIGHTS
For a share outstanding throughout each period
| | | Class A |
| |
| | | Year Ended March 31, |
| | | 2018 | | 2017 | | 2016 | | 2015 | | 2014 |
| Net asset value, beginning of period | | $ | 10.99 | | | $ | 11.33 | | | $ | 11.31 | | | $ | 11.01 | | | $ | 11.37 | |
| Income (loss) from investment operations: | | | | | | | | | | | | | | | | | | | | |
| Net investment income(1) | | | 0.26 | | | | 0.28 | | | | 0.31 | | | | 0.33 | | | | 0.35 | |
| Net gain (loss) on securities (both | | | | | | | | | | | | | | | | | | | | |
| realized and unrealized) | | | (0.18 | ) | | | (0.35 | ) | | | 0.01 | | | | 0.30 | | | | (0.36 | ) |
| Total from investment operations | | | 0.08 | | | | (0.07 | ) | | | 0.32 | | | | 0.63 | | | | (0.01 | ) |
| Less distributions (note 9): | | | | | | | | | | | | | | | | | | | | |
| Dividends from net investment income | | | (0.26 | ) | | | (0.27 | ) | | | (0.30 | ) | | | (0.33 | ) | | | (0.35 | ) |
| Distributions from capital gains | | | — | | | | — | | | | — | | | | — | | | | — | (2) |
| Total distributions | | | (0.26 | ) | | | (0.27 | ) | | | (0.30 | ) | | | (0.33 | ) | | | (0.35 | ) |
| Net asset value, end of period | | $ | 10.81 | | | $ | 10.99 | | | $ | 11.33 | | | $ | 11.31 | | | $ | 11.01 | |
| Total return (not reflecting sales charge) | | | 0.68 | % | | | (0.66 | )% | | | 2.91 | % | | | 5.80 | % | | | (0.04 | )% |
| Ratios/supplemental data | | | | | | | | | | | | | | | | | | | | |
| Net assets, end of period (in millions) | | $ | 390 | | | $ | 414 | | | $ | 419 | | | $ | 398 | | | $ | 385 | |
| Ratio of expenses to average net assets | | | 0.71 | % | | | 0.73 | % | | | 0.74 | % | | | 0.74 | % | | | 0.73 | % |
| Ratio of net investment income to | | | | | | | | | | | | | | | | | | | | |
| average net assets | | | 2.35 | % | | | 2.48 | % | | | 2.72 | % | | | 2.96 | % | | | 3.16 | % |
| Portfolio turnover rate | | | 8 | % | | | 13 | % | | | 7 | % | | | 5 | % | | | 5 | % |
| | | | | | | | | | | | | | | | | | | | | |
| Expense and net investment income ratios without the effect of the contractual waiver of management fees were (note 3): |
| | | | | | | | | | | | | | | | | | | | | |
| Ratio of expenses to average net assets | | | 0.72 | % | | | 0.74 | % | | | 0.74 | % | | | 0.74 | % | | | 0.74 | % |
| Ratio of net investment income to | | | | | | | | | | | | | | | | | | | | |
| average net assets | | | 2.34 | % | | | 2.47 | % | | | 2.72 | % | | | 2.96 | % | | | 3.16 | % |
_________________________
| (1) | Per share amounts have been calculated using the daily average shares method. |
| (2) | Amount represents less than $0.01. |
See accompanying notes to financial statements.
36 | Aquila Tax-Free Trust of Oregon
AQUILA TAX-FREE TRUST OF OREGON
FINANCIAL HIGHLIGHTS (continued)
For a share outstanding throughout each period
| | | Class C |
| |
| | | Year Ended March 31, |
| | | 2018 | | 2017 | | 2016 | | 2015 | | 2014 |
| Net asset value, beginning of period | | $ | 10.98 | | | $ | 11.32 | | | $ | 11.30 | | | $ | 11.00 | | | $ | 11.36 | |
| Income (loss) from investment operations: | | | | | | | | | | | | | | | | | | | | |
| Net investment income(1) | | | 0.16 | | | | 0.18 | | | | 0.21 | | | | 0.24 | | | | 0.25 | |
| Net gain (loss) on securities (both | | | | | | | | | | | | | | | | | | | | |
| realized and unrealized) | | | (0.18 | ) | | | (0.35 | ) | | | 0.02 | | | | 0.30 | | | | (0.36 | ) |
| Total from investment operations | | | (0.02 | ) | | | (0.17 | ) | | | 0.23 | | | | 0.54 | | | | (0.11 | ) |
| Less distributions (note 9): | | | | | | | | | | | | | | | | | | | | |
| Dividends from net investment income | | | (0.16 | ) | | | (0.17 | ) | | | (0.21 | ) | | | (0.24 | ) | | | (0.25 | ) |
| Distributions from capital gains | | | — | | | | — | | | | — | | | | — | | | | — | (2) |
| Total distributions | | | (0.16 | ) | | | (0.17 | ) | | | (0.21 | ) | | | (0.24 | ) | | | (0.25 | ) |
| Net asset value, end of period | | $ | 10.80 | | | $ | 10.98 | | | $ | 11.32 | | | $ | 11.30 | | | $ | 11.00 | |
| Total return (not reflecting CDSC) | | | (0.18 | )% | | | (1.50 | )% | | | 2.05 | % | | | 4.91 | % | | | (0.89 | )% |
| Ratios/supplemental data | | | | | | | | | | | | | | | | | | | | |
| Net assets, end of period (in millions) | | $ | 28 | | | $ | 38 | | | $ | 36 | | | $ | 32 | | | $ | 29 | |
| Ratio of expenses to average net assets | | | 1.56 | % | | | 1.59 | % | | | 1.59 | % | | | 1.58 | % | | | 1.58 | % |
| Ratio of net investment income to | | | | | | | | | | | | | | | | | | | | |
| average net assets | | | 1.49 | % | | | 1.63 | % | | | 1.86 | % | | | 2.11 | % | | | 2.31 | % |
| Portfolio turnover rate | | | 8 | % | | | 13 | % | | | 7 | % | | | 5 | % | | | 5 | % |
| | | | | | | | | | | | | | | | | | | | | |
| Expense and net investment income ratios without the effect of the contractual waiver of management fees were (note 3): |
| | | | | | | | | | | | | | | | | | | | | |
| Ratio of expenses to average net assets | | | 1.57 | % | | | 1.59 | % | | | 1.59 | % | | | 1.59 | % | | | 1.59 | % |
| Ratio of net investment income to | | | | | | | | | | | | | | | | | | | | |
| average net assets | | | 1.49 | % | | | 1.62 | % | | | 1.86 | % | | | 2.10 | % | | | 2.31 | % |
_________________________
| (1) | Per share amounts have been calculated using the daily average shares method. |
| (2) | Amount represents less than $0.01. |
See accompanying notes to financial statements.
37 | Aquila Tax-Free Trust of Oregon
AQUILA TAX-FREE TRUST OF OREGON
FINANCIAL HIGHLIGHTS (continued)
For a share outstanding throughout each period
| | | Class Y |
| |
| | | Year Ended March 31, |
| | | 2018 | | 2017 | | 2016 | | 2015 | | 2014 |
| Net asset value, beginning of period | | $ | 10.98 | | | $ | 11.32 | | | $ | 11.30 | | | $ | 11.00 | | | $ | 11.36 | |
| Income (loss) from investment operations: | | | | | | | | | | | | | | | | | | | | |
| Net investment income(1) | | | 0.27 | | | | 0.29 | | | | 0.32 | | | | 0.35 | | | | 0.36 | |
| Net gain (loss) on securities (both | | | | | | | | | | | | | | | | | | | | |
| realized and unrealized) | | | (0.18 | ) | | | (0.35 | ) | | | 0.02 | | | | 0.30 | | | | (0.36 | ) |
| Total from investment operations | | | 0.09 | | | | (0.06 | ) | | | 0.34 | | | | 0.65 | | | | — | |
| Less distributions (note 9): | | | | | | | | | | | | | | | | | | | | |
| Dividends from net investment income | | | (0.27 | ) | | | (0.28 | ) | | | (0.32 | ) | | | (0.35 | ) | | | (0.36 | ) |
| Distributions from capital gains | | | — | | | | — | | | | — | | | | — | | | | — | (2) |
| Total distributions | | | (0.27 | ) | | | (0.28 | ) | | | (0.32 | ) | | | (0.35 | ) | | | (0.36 | ) |
| Net asset value, end of period | | $ | 10.80 | | | $ | 10.98 | | | $ | 11.32 | | | $ | 11.30 | | | $ | 11.00 | |
| Total return | | | 0.83 | % | | | (0.51 | )% | | | 3.08 | % | | | 5.97 | % | | | 0.11 | % |
| Ratios/supplemental data | | | | | | | | | | | | | | | | | | | | |
| Net assets, end of period (in millions) | | $ | 209 | | | $ | 186 | | | $ | 180 | | | $ | 126 | | | $ | 87 | |
| Ratio of expenses to average net assets | | | 0.56 | % | | | 0.58 | % | | | 0.59 | % | | | 0.58 | % | | | 0.58 | % |
| Ratio of net investment income to | | | | | | | | | | | | | | | | | | | | |
| average net assets | | | 2.50 | % | | | 2.63 | % | | | 2.86 | % | | | 3.10 | % | | | 3.31 | % |
| Portfolio turnover rate | | | 8 | % | | | 13 | % | | | 7 | % | | | 5 | % | | | 5 | % |
| | | | | | | | | | | | | | | | | | | | | |
| Expense and net investment income ratios without the effect of the contractual waiver of management fees were (note 3): |
| | | | | | | | | | | | | | | | | | | | | |
| Ratio of expenses to average net assets | | | 0.57 | % | | | 0.59 | % | | | 0.59 | % | | | 0.59 | % | | | 0.59 | % |
| Ratio of net investment income to | | | | | | | | | | | | | | | | | | | | |
| average net assets | | | 2.49 | % | | | 2.62 | % | | | 2.86 | % | | | 3.10 | % | | | 3.31 | % |
_________________________
| (1) | Per share amounts have been calculated using the daily average shares method. |
| (2) | Amount represents less than $0.01. |
See accompanying notes to financial statements.
38 | Aquila Tax-Free Trust of Oregon
| | | | | | | | |
| Additional Information (unaudited) | | | | | | |
| | | | | | | |
| Trustees(1) | | | | | | | | |
| and Officers | | Number of | | |
| | | Positions | | Portfolios | | |
| | | Held with | | in Fund | | |
| | | Fund and | | Principal | | Complex(4) | | Other Directorships |
| Name | | Length of | | Occupation(s) | | Overseen | | Held by Trustee |
| and Year of Birth(2) | | Service(3) | | During Past 5 Years | | by Trustee | | During Past 5 Years |
| | | | | | | | | |
| Interested Trustee(5) | | | | | | | | |
| | | | | | | | | |
Diana P. Herrmann New York, NY (1958) | | Vice Chair of the Board of Trustees since 2003, President since 1998 and Trustee since 1994 | | Chair (since 2016 and previously Vice Chair since 2004) and Chief Executive Officer (since 2004) of Aquila Management Corporation, Founder and Sponsor of the Aquila Group of Funds(6) and parent of Aquila Investment Management LLC, Manager, President since 1997, Chief Operating Officer, 1997-2008, a Director since 1984, Secretary since 1986 and previously its Executive Vice President, Senior Vice President or Vice President, 1986-1997; Chief Executive Officer (since 2004) and Chair (since 2016 and previously Vice Chair since 2004), President and Manager since 2003, and Chief Operating Officer (2003-2008), of the Manager; Chair, Vice Chair, President, Executive Vice President and/or Senior Vice President of funds in the Aquila Group of Funds since 1986; Manager of the Distributor since 1997; Governor, Investment Company Institute (the U.S. mutual fund industry trade organization dedicated to protecting shareholder interests and educating the public about investing) for various periods since 2004, and Chair of its Small Funds Committee, 2004-2009; active in charitable and volunteer organizations. | | 11 | | Director of ICI Mutual Insurance Company, a Risk Retention Group, for various periods since 2006; formerly Vice Chair and Trustee of Pacific Capital Funds of Cash Assets Trust (three money-market funds in the Aquila Group of Funds) 2004-2012 |
| | | | | | | | | |
| Non-Interested Trustees | | | | | | | | |
| | | | | | | | | |
James A. Gardner Terrebonne, OR (1943) | | Chair of the Board of Trustees since 2005 and Trustee since 1986 | | President, Gardner Associates, an investment and real estate firm, since 1989; Owner and Developer of Vandevert Ranch, Sunriver, Oregon since 1989; Founding Partner, Chairman Emeritus and previously Chairman (1991-2010), Ranch at the Canyons, Terrebonne, Oregon; President Emeritus and previously President (1981-1989), Lewis and Clark College and Law School; director, Oregon High Desert Museum, 1989-2003; active in civic, business and educational organizations in Oregon; writer on Native American and settlement history of Oregon. | | 1 | | None |
39 | Aquila Tax-Free Trust of Oregon
| | | | | | | | |
| Additional Information (unaudited) | | | | | | |
| | | | | | | |
| Trustees(1) | | | | | | | | |
| and Officers | | Number of | | |
| | | Positions | | Portfolios | | |
| | | Held with | | in Fund | | |
| | | Fund and | | Principal | | Complex(4) | | Other Directorships |
| Name | | Length of | | Occupation(s) | | Overseen | | Held by Trustee |
| and Year of Birth(2) | | Service(3) | | During Past 5 Years | | by Trustee | | During Past 5 Years |
| | | | | | | | | |
| Non-Interested Trustees (cont’d) | | | | | | |
| | | | | | | | | |
Gary C. Cornia St. George, UT (1948) | | Trustee since 2002 | | Emeritus Dean and Professor, Marriott School of Management, Brigham Young University 2014-present; Professor, Marriott School of Management, Brigham Young University, 1980-2014; Commissioner, Utah State Securities Commission, 2013–present; Dean, Marriott School of Management, 2008-2013; Director, Romney Institute of Public Management, Marriott School of Management, 2004-2008; Past President, National Tax Association; Fellow, Lincoln Institute of Land Policy, 2002-present; Associate Dean, Marriott School of Management, Brigham Young University, 1991-2000; member, Utah Governor’s Tax Review Committee, 1993-2009. | | 8 | | International Center for Land Policies and Training, Taipei, Taiwan, Director and Chair of Executive Committee |
| | | | | | | | | |
Henry H. Hewitt Bend, OR (1941) | | Trustee since 2015 | | Senior Counsel, Stoel Rives LLP, a Portland law firm, since 2011; (Retired 2015) Partner 1975-2011. | | 1 | | Columbia Forest Products; Hampton Affiliates (timber products) ; Life Trustee, Willamette University; Friends of the Children (child mentoring); former director: Cascade Bancorp and Bank of the Cascades |
| | | | | | | | | |
Edmund P. Jensen Portland, OR (1937) | | Trustee since 2003 | | President and CEO, VISA International, 1994-1999; Vice Chairman and Chief Operating Officer, US Bancorp, 1974-1994. | | 1 | | Lewis and Clark College, Portland, OR; former director: FiveCubits, Inc. (formerly BMG Seltec), a software company |
40 | Aquila Tax-Free Trust of Oregon
| | | | | | | | |
| Additional Information (unaudited) | | | | | | |
| | | | | | | |
| Trustees(1) | | | | | | | | |
| and Officers | | Number of | | |
| | | Positions | | Portfolios | | |
| | | Held with | | in Fund | | |
| | | Fund and | | Principal | | Complex(4) | | Other Directorships |
| Name | | Length of | | Occupation(s) | | Overseen | | Held by Trustee |
| and Year of Birth(2) | | Service(3) | | During Past 5 Years | | by Trustee | | During Past 5 Years |
| | | | | | | | | |
| Non-Interested Trustees (cont’d) | | | | | | |
| | | | | | | | | |
John W. Mitchell Lake Oswego, OR (1944) | | Trustee since 1999 | | Principal of M & H Economic Consultants; Economist, Western Region, for U.S. Bancorp 1998-2007; Chief Economist, U.S. Bancorp, Portland, Oregon, 1983-1998; member, Oregon Governor’s Council of Economic Advisors, 1984-1998; Chairman, Oregon Governor’s Technical Advisory Committee for Tax Review in 1998. | | 1 | | Oregon Mutual Insurance; Western Capital Corporation; Northwest Bank. |
| | | | | | | | | |
Patricia L. Moss Bend, OR (1953) | | Trustee since 2015, 2002-2005; Trustee Emerita 2005-2015 | | Director, First Interstate BancSystem, Inc. since May 2017; Vice Chairman, Cascade Bancorp and Bank of the Cascades 2012-2017, President and Chief Executive Officer 1997-2012; active in community and educational organizations. | | 1 | | MDU Resources Group; Co-Chair, Oregon Growth Board; formerly board member, North Pacific Group (building materials), and Central Oregon Independent Health Services |
| | | | | | | | | |
Ralph R. Shaw Portland, OR (1938) | | Trustee since 2000 | | President, Shaw Management Company, an investment counseling firm, 1980-present; General Partner, Shaw Venture Partners, 1983-2005; Shaw Venture Partners II, 1987-2005; Shaw Venture Partners III, 1994-2005. | | 1 | | Former director: FiveCubits, Inc. (formerly BMG Seltec); Rentrak Corporation |
(1) The Trust’s Statement of Additional Information includes additional information about the Trustees and is available, without charge, upon request by calling 800-437-1020 (toll-free) or by visiting www.aquilafunds.com or the EDGAR Database at the SEC’s internet site at www.sec.gov.
(2) The mailing address of each Trustee is c/o Aquila Tax-Free Trust of Oregon, 120 West 45th Street, Suite 3600, New York, NY 10036.
(3) Each Trustee holds office until his or her successor is elected or his or her earlier retirement or removal. (4) Includes certain Aquila-sponsored funds that are dormant and have no public shareholders.
(5) Ms. Herrmann is an “interested person” of the Trust, as that term is defined in the Investment Company Act of 1940, as amended (the “1940 Act”), as an officer of the Trust, as a director, officer and shareholder of the Manager’s corporate parent, as an officer and Manager of the Manager, and as a Manager of the Distributor.
(6) The “Aquila Group of Funds” includes: Aquila Tax-Free Trust of Arizona, Aquila Tax-Free Fund of Colorado, Hawaiian Tax-Free Trust, Aquila Churchill Tax-Free Fund of Kentucky, Aquila Tax-Free Trust of Oregon, Aquila Narragansett Tax-Free Income Fund (Rhode Island) and Aquila Tax-Free Fund For Utah, each of which is a tax-free municipal bond fund and are called the “Aquila Municipal Bond Funds”; Aquila Three Peaks Opportunity Growth Fund, which is an equity fund; and Aquila Three Peaks High Income Fund, which is a high-income corporate bond fund.
41 | Aquila Tax-Free Trust of Oregon
| | | | |
| | | Positions | | |
| | | Held with | | |
| | | Trust and | | |
| Name | | Length of | | |
| and Year of Birth(1) | | Service(2) | | Principal Occupation(s) During Past 5 Years(3) |
| | | | | |
| Trustee | | | | |
| Emeritus(4) | | | | |
| | | | | |
Vernon R. Alden Boston, MA (1923) | | Trustee Emeritus since 2006 | | Retired; former director or trustee of various Fortune 500 companies, including Colgate-Palmolive and McGraw Hill; formerly President of Ohio University and Associate Dean of the Harvard University Graduate School of Business Administration; Trustee, Aquila Narragansett Tax-Free Income Fund, 1992-2006, Aquila Tax-Free Trust of Oregon, 1988-2001, Hawaiian Tax-Free Trust, 1989-2001, and Pacific Capital Funds of Cash Assets Trust (three money-market funds in the Aquila Group of Funds, consisting of Pacific Capital Cash Assets Trust, Pacific Capital Tax-Free Cash Assets Trust and Pacific Capital U.S. Government Securities Cash Assets Trust), 1989-2001; Trustee Emeritus, Aquila Narragansett Tax-Free Income Fund and Aquila Tax-Free Trust of Oregon since 2006; member of several Japan-related advisory councils, including Chairman of the Japan Society of Boston; trustee of various cultural, educational and civic organizations. |
| | | | | |
| Officers | | | | |
| | | | | |
Charles E. Childs, III New York, NY (1957) | | Executive Vice President since 2003 and Secretary since 2011 | | Executive Vice President of all funds in the Aquila Group of Funds and the Manager and the Manager’s parent since 2003; Chief Operating Officer of the Manager and the Manager’s parent since 2008; Secretary of all funds in the Aquila Group of Funds since 2011; formerly Senior Vice President, corporate development, Vice President, Assistant Vice President and Associate of the Manager’s parent since 1987; Executive Vice President, Senior Vice President, Vice President or Assistant Vice President of the Aquila money-market funds, 1988-2012; Manager of the Distributor since 2012. |
| | | | | |
Marie E. Aro New York, NY (1955) | | Senior Vice President since 2010 | | Co-President, Aquila Distributors LLC since 2010, Vice President, 1993-1997; Senior Vice President, Aquila Municipal Trust (since 2013), Aquila Funds Trust (since 2013), Aquila Tax-Free Trust of Arizona (since 2010 and Vice President, 2004-2010), Aquila Three Peaks High Income Fund (since 2006), Hawaiian Tax-Free Trust and Aquila Tax-Free Trust of Oregon (since 2010), Aquila Three Peaks Opportunity Growth Fund (2004-2013) and Aquila Churchill Tax-Free Fund of Kentucky, Aquila Narragansett Tax-Free Income Fund, Aquila Tax-Free Fund For Utah, and Aquila Tax-Free Fund of Colorado (2010-2013); Vice President, INVESCO Funds Group, 1998-2003. |
| | | | | |
Paul G. O’Brien New York, NY (1959) | | Senior Vice President since 2010 | | Co-President, Aquila Distributors LLC since 2010, Managing Director, 2009-2010; Senior Vice President of various funds in the Aquila Group of Funds since 2010 and all funds since 2013; held various positions to Senior Vice President and Chief Administrative Officer of Evergreen Investments Services, Inc., 1997-2008; Mergers and Acquisitions Coordinator for Wachovia Corporation, 1994-1997. |
| | | | | |
Christine L. Neimeth Portland, OR (1964) | | Vice President since 1998 | | Vice President of Aquila Three Peaks Opportunity Growth Fund since 1999 and Aquila Tax-Free Trust of Oregon since 1998. |
42 | Aquila Tax-Free Trust of Oregon
| | | | |
| | | Positions | | |
| | | Held with | | |
| | | Trust and | | |
| Name | | Length of | | |
| and Year of Birth(1) | | Service(2) | | Principal Occupation(s) During Past 5 Years(3) |
| | | | | |
| Officers (cont’d) | | | | |
| | | | | |
Randall S. Fillmore New York, NY (1960) | | Chief Compliance Officer since 2012 | | Chief Compliance Officer of all funds in the Aquila Group of Funds, the Manager and the Distributor since 2012; Managing Director, Fillmore & Associates, 2009-2012; Fund and Adviser Chief Compliance Officer (2002-2009), Senior Vice President - Broker Dealer Compliance (2004-2009), Schwab Funds Anti Money Laundering Officer and Identity Theft Prevention Officer (2004-2009), Vice President - Internal Audit (2000-2002), Charles Schwab Corporation; National Director, Information Systems Risk Management - Consulting Services (1999-2000), National Director, Investment Management Audit and Business Advisory Services (1992-1999), Senior Manager, Manager, Senior and Staff Roles (1983-1992), PricewaterhouseCoopers LLP. |
| | | | | |
Joseph P. DiMaggio New York, NY (1956) | | Chief Financial Officer since 2003 and Treasurer since 2000 | | Chief Financial Officer of all funds in the Aquila Group of Funds since 2003 and Treasurer since 2000. |
| | | | | |
Yolonda S. Reynolds New York, NY (1960) | | Assistant Treasurer since 2010 | | Assistant Treasurer of all funds in the Aquila Group of Funds since 2010; Director of Fund Accounting for the Aquila Group of Funds since 2007. |
| | | | | |
Lori A. Vindigni New York, NY (1966) | | Assistant Treasurer since 2000 | | Assistant Treasurer of all funds in the Aquila Group of Funds since 2000; Assistant Vice President of the Manager or its predecessor and current parent since 1998; Fund Accountant for the Aquila Group of Funds, 1995-1998. |
_________________
(1) The mailing address of each officer is c/o Aquila Tax-Free Trust of Oregon, 120 West 45th Street, Suite 3600, New York, NY 10036.
(2) The term of office of each officer is one year.
(3) The Trust’s Statement of Additional Information includes additional information about the officers and is available, without charge, upon request by calling 800-437-1020 (toll-free) or by visiting www.aquilafunds.com or the EDGAR Database at the SEC’s internet site at www.sec.gov.
(4) A Trustee Emeritus may attend Board meetings but has no voting power.
43 | Aquila Tax-Free Trust of Oregon
Your Trust’s Expenses (unaudited)
As a Trust shareholder, you may incur two types of costs: (1) transaction costs, including front-end sales charges with respect to Class A shares or contingent deferred sales charges (“CDSC”) with respect to Class C shares; and (2) ongoing costs including management fees; distribution “12b-1” and/or service fees; and other Fund expenses. The table below is intended to help you understand your ongoing costs (in dollars) of investing in the Trust and to compare these costs with the ongoing costs of investing in other mutual funds. The table below assumes a $1,000 investment held for the six months indicated.
Actual Expenses
The table provides information about actual account values and actual expenses. You may use the information provided in this table, together with the amount you invested, to estimate the expenses that you paid over the period. To estimate the expenses that you paid on your account, divide your ending account value by $1,000 (for example, an $8,600 ending account value divided by $1,000 = 8.6), then multiply the result by the number under the heading “Expenses Paid During the Period”.
Hypothetical Example for Comparison with Other Funds
Under the heading, “Hypothetical” in the table, information is provided about hypothetical account values and hypothetical expenses based on the Trust’s actual expense ratio and an assumed rate of return of 5% per year before expenses, which is not the Trust’s actual return. This information may not be used to estimate the actual ending account balance or expenses you paid for the period, but it can help you compare ongoing costs of investing in the Fund with those of other funds. To do so, compare this 5% hypothetical example for the class of shares you hold with the 5% hypothetical examples that appear in the shareholder reports of other funds.
Please note that expenses shown in the table are meant to highlight ongoing costs and do not reflect any transactional costs. Therefore, information under the heading “Hypothetical” is useful comparing ongoing costs only, and will not help you compare total costs of owning different funds. In addition, if transactional costs were included, your total costs would have been higher.
| | Actual | Hypothetical |
| | (actual return after expenses) | (5% annual return before expenses) |
| | | | Expenses(2) | | Expenses(2) | |
| | Beginning | Ending(1) | Paid During | Ending | Paid During | Net |
| | Account | Account | Period | Account | Period | Annualized |
| Share | Value | Value | 10/1/17 – | Value | 10/1/17 – | Expense |
| Class | 10/1/17 | 3/31/18 | 3/31/18 | 3/31/18 | 3/31/18 | Ratio |
| A | $1,000 | $987.90 | $3.42 | $1,021.49 | $3.48 | 0.69% |
| C | $1,000 | $983.70 | $7.67 | $1,017.20 | $7.80 | 1.55% |
| Y | $1,000 | $988.70 | $2.73 | $1,022.19 | $2.77 | 0.55% |
| (1) | Assumes reinvestment of all dividends and capital gain distributions, if any, at net asset value and does not reflect the deduction of the applicable sales charges with respect to Class A or the applicable CDSC with respect to Class C shares. Total return is not annualized and as such, it may not be representative of the total return for the year. |
| (2) | Expenses are equal to the annualized expense ratio for the six-month period as indicated above - in the far right column - multiplied by the simple average account value over the period indicated, and then multiplied by 182/365 to reflect the one-half year period. |
44 | Aquila Tax-Free Trust of Oregon
Information Available (unaudited)
Much of the information that the funds in the Aquila Group of Funds produce is automatically sent to you and all other shareholders. Specifically, you are routinely sent your Trust’s entire list of portfolio securities twice a year in the semi-annual and annual reports you receive. Additionally, under Trust policies, the Manager publicly discloses the complete schedule of the Trust’s portfolio holdings, as of each calendar quarter, generally by the 15th day after the end of each calendar quarter. Such information remains accessible until the next schedule is made publicly available. You may obtain a copy of the Trust’s portfolio holdings schedule for the most recently completed period by visiting the Trust’s website at www.aquilafunds.com. Whenever you wish to see a listing of your Trust’s portfolio other than in your shareholder reports, please check our website at www.aquilafunds.com or call us at 1-800-437-1000.
The Trust additionally files a complete list of its portfolio holdings with the SEC for the first and third quarter ends of each fiscal year on Form N-Q. Forms N-Q are available free of charge on the SEC website at www.sec.gov. You may also review or, for a fee, copy the forms at the SEC’s Public Reference Room in Washington, D.C. or by calling 1-800-SEC-0330.
Proxy Voting Record (unaudited)
During the 12 month period ended June 30, 2017, there were no proxies related to any portfolio instruments held by the Trust. As such, the Trust did not vote any proxies. Applicable regulations require us to inform you that the Fund’s proxy voting information is available on the SEC website at www.sec.gov.
Federal Tax Status of Distributions (unaudited)
This information is presented in order to comply with a requirement of the Internal Revenue Code. No action on the part of shareholders is required.
For the fiscal year ended March 31, 2018, $14,836,316 of dividends paid by Aquila Tax-Free Trust of Oregon, constituting 99.3% of total dividends paid during the fiscal year ended March 31, 2018, were exempt-interest dividends; and the balance was ordinary income.
Prior to February 15, 2019, shareholders will be mailed the appropriate tax form(s) which will contain information on the status of distributions paid for the 2018 calendar year.
45 | Aquila Tax-Free Trust of Oregon
(THIS PAGE INTENTIONALLY LEFT BLANK)
(THIS PAGE INTENTIONALLY LEFT BLANK)
(THIS PAGE INTENTIONALLY LEFT BLANK)
Founders
Lacy B. Herrmann (1929-2012)
Aquila Management Corporation, Sponsor
Manager
AQUILA INVESTMENT MANAGEMENT LLC
120 West 45th Street, Suite 3600
New York, New York 10036
Investment Sub-Adviser
KIRKPATRICK PETTIS CAPITAL MANAGEMENT
222 SW Columbia Street, Suite 1400
Portland, Oregon 97201
Board of Trustees
James A. Gardner, Chair
Diana P. Herrmann, Vice Chair
Gary C. Cornia
Henry H. Hewitt
Edmund P. Jensen
John W. Mitchell
Patricia L. Moss
Ralph R. Shaw
Officers
Diana P. Herrmann, President
Charles E. Childs, III, Executive Vice President and Secretary
Marie E. Aro, Senior Vice President
Paul G. O’Brien, Senior Vice President
Christine L. Neimeth, Vice President
Randall S. Fillmore, Chief Compliance Officer
Joseph P. DiMaggio, Chief Financial Officer and Treasurer
Distributor
AQUILA DISTRIBUTORS LLC 120
West 45th Street, Suite 3600
New York, New York 10036
Transfer and Shareholder Servicing Agent
BNY MELLON INVESTMENT SERVICING (US) INC.
4400 Computer Drive
Westborough, Massachusetts 01581
Custodian
THE BANK OF NEW YORK MELLON
225 Liberty Street
New York, New York 10286
Independent Registered Public Accounting Firm
TAIT, WELLER & BAKER LLP
1818 Market Street, Suite 2400
Philadelphia, Pennsylvania 19103
Further information is contained in the Prospectus,
which must precede or accompany this report.
ITEM 2. CODE OF ETHICS.
(a) As of March 31, 2018 (the end of the reporting period) the Trust has adopted a code of ethics that applies to the Trust's principal executive officer(s)and principal financial officer(s) and persons performing similar functions ("Covered Officers") as defined in the Aquila Group of Funds Code of Ethics for Principal Executive and Senior Financial Officers under Section 406 of the Sarbanes-Oxley Act of 2002, as amended;
(f)(1) Pursuant to Item 10(a)(1), a copy of the Trust's Code of Ethics that applies to the Trust's principal executive officer(s) and principal financial officer(s) and persons performing similar functions is included as an exhibit to its annual report on this Form N-CSR;
(f)(2) The text of the Trust's Code of Ethics that applies to the Trust's principal executive officer(s) and principal financial officer(s) and persons performing similar functions has been posted on its Internet website which can be found at the Trust's Internet address at aquilafunds.com.
ITEM 3. AUDIT COMMITTEE FINANCIAL EXPERT.
(a)(1)(i) The Registrant's board of trustees has determined that Ms. Patricia L. Moss, a member of its audit committee, is an audit committee financial expert. Ms. Moss is 'independent' as such term is defined in Form N-CSR.
ITEM 4. PRINCIPAL ACCOUNTANT FEES AND SERVICES.
a) Audit Fees - The aggregate fees billed for professional services rendered by the principal accountant for the audit of the Registrant's annual financial statements were $23,400 in 2017 $24,600 in 2018.
b) Audit Related Fees - There were no amounts billed for audit-related fees over the past two years.
c) Tax Fees - The Registrant was billed by the principal accountant $3,500 and $3,500 in 2017 and 2018, respectively, for return preparation and tax compliance.
d) All Other Fees - There were no additional fees paid for audit and non-audit services other than those disclosed in a) thorough c) above.
e)(1) Currently, the audit committee of the Registrant pre-approves audit services and fees on an engagement-by-engagement basis
e)(2) None of the services described in b) through d) above were approved by the audit committee pursuant to paragraph (c)(7)(i)(C) of Rule 2-01 of Regulation S-X, all were pre-approved on an engagement-by-engagement basis.
f) No applicable.
g) There were no non-audit services fees billed by the Registrant's accountant to the Registrant's investment adviser or distributor over the past two years
h) Not applicable.
ITEM 5. AUDIT COMMITTEE OF LISTED REGISTRANTS.
Not applicable.
ITEM 6. SCHEDULE OF INVESTMENTS.
Included in Item 1 above
ITEM 7. DISCLOSURE OF PROXY VOTING POLICIES AND PROCEDURES FOR CLOSED-END MANAGEMENT INVESTMENT COMPANIES.
Not applicable.
ITEM 8. PORTFOLIO MANAGERS OF CLOSED-END MANAGEMENT INVESTMENT COMPANIES.
Not applicable.
ITEM 9. PURCHASES OF EQUITY SECURITIES BY CLOSED-END MANAGEMENT INVESTMENT COMPANY AND AFFILIATED PURCHASERS.
Not applicable.
ITEM 10. SUBMISSION OF MATTERS TO A VOTE OF SECURITY HOLDERS.
The Board of Directors of the Registrant has adopted a Nominating Committee Charter which provides that the Nominating Committee (the 'Committee') may consider and evaluate nominee candidates properly submitted by shareholders if a vacancy among the Independent Trustees of the Registrant occurs and if, based on the Board's then current size, composition and structure, the Committee determines that the vacancy should be filled. The Committee will consider candidates submitted by shareholders on the same basis as it considers and evaluates candidates recommended by other sources. A copy of the qualifications and procedures that must be met or followed by shareholders to properly submit a nominee candidate to the Committee may be obtained by submitting a request in writing to the Secretary of the Registrant.
ITEM 11. CONTROLS AND PROCEDURES.
(a) Based on their evaluation of the registrant's disclosure controls and procedures (as defined in Rule 30a-2(c) under the Investment Company Act of 1940) as of a date within 90 days of the filing of this report, the registrant's chief financial and executive officers have concluded that the disclosure controls and procedures of the registrant are appropriately designed to ensure that information required to be disclosed in the registrant's reports that are filed under the Securities Exchange Act of 1934 are accumulated and communicated to registrant's management, including its principal executive officer(s) and principal financial officer(s), to allow timely decisions regarding required disclosure and is recorded, processed, summarized and reported, within the time periods specified in the rules and forms adopted by the Securities and Exchange Commission.
(b) There have been no significant changes in registrant's internal controls or in other factors that could significantly affect registrant's internal controls subsequent to the date of the most recent evaluation, including no significant deficiencies or material weaknesses that required corrective action.
ITEM 12. EXHIBITS.
(a)(1) Aquila Group of Funds Code of Ethics for Principal Executive and Senior Financial Officers under Section 406 of the Sarbanes-Oxley Act of 2002, as amended.
(a)(2) Certifications of principal executive officer and principal financial officer as required by Rule 30a-2(a) under the Investment Company Act of 1940.
(b) Certifications of principal executive officer and principal financial officer as required by Rule 30a-2(b) under the Investment Company Act of 1940.
SIGNATURES
Pursuant to the requirements of the Securities Exchange Act of 1934 and the Investment Company Act of 1940, the registrant has duly caused this report to be signed on its behalf by the undersigned thereunto duly authorized.
| THE CASCADES TRUST | |
| | | |
| By: | /s/ Diana P. Herrmann | |
| | Vice Chair, Trustee and President | |
| | June 7, 2018 | |
| | | |
| By: | /s/ Joseph P. DiMaggio | |
| | Chief Financial Officer | |
| | June 7, 2018 | |
Pursuant to the requirements of the Securities Exchange Act of 1934 and the Investment Company Act of 1940, this report has been signed below by the following persons on behalf of the registrant and in the capacities and on the dates indicated.
| |
| | | |
| By: | /s/ Diana P. Herrmann | |
| | Diana P. Herrmann | |
| | Vice Chair, Trustee and President | |
| | June 7, 2018 | |
| | | |
| By: | /s/ Joseph P. DiMaggio | |
| | Joseph P. DiMaggio | |
| | Chief Financial Officer and Treasurer | |
| | June 7, 2018 | |
THE CASCADES TRUST
EXHIBIT INDEX
(a)(1) Aquila Group of Funds Code of Ethics for Principal Executive and Senior Financial Officers under Section 406 of the Sarbanes-Oxley Act of 2002, as amended.
(a) (2) Certifications of principal executive officer and principal financial officer as required by Rule 30a-2(a) under the Investment Company Act of 1940.
(b) Certification of chief executive officer and chief financial officer as required by Rule 30a-2(b) of the Investment Company Act of 1940.