UNITED STATES
SECURITIES AND EXCHANGE COMMISSION
Washington, D.C. 20549
FORM N-CSR
CERTIFIED SHAREHOLDER REPORT OF REGISTERED
MANAGEMENT INVESTMENT COMPANIES
Investment Company Act file number 811- 4630
John Hancock Investment Trust III
(Exact name of registrant as specified in charter)
601 Congress Street, Boston, Massachusetts 02210
(Address of principal executive offices) (Zip code)
Salvatore Schiavone
Treasurer
601 Congress Street
Boston, Massachusetts 02210
(Name and address of agent for service)
Registrant's telephone number, including area code: 617-663-4497
Date of fiscal year end: | October 31 |
|
|
Date of reporting period: | April 30, 2015 |
ITEM 1. REPORT TO SHAREHOLDERS.
John Hancock
Greater China Opportunities Fund
Semiannual report 4/30/15
A message to shareholders
Dear fellow shareholder,
U.S. economic growth continued, despite recent weakness caused largely by the harsh winter weather. The market expansion that began in 2009 so far remains intact. Positive economic and business news has translated into good news for U.S. investors, with continued solid results for a range of U.S. equity indexes in recent months. Many fixed-income indexes have also seen positive returns in this environment.
Outside of the United States, economies are struggling to replicate the kind of success we have enjoyed at home. Central banks across Europe and Asia have announced dramatic monetary policy measures to promote economic activity—similar to the monetary policy activity of the U.S. Federal Reserve in recent years. As was the case in the United States beginning in 2009, many international markets have rallied in advance of sustained economic progress. China's stock market in particular has delivered extraordinary gains. In fact, our network of asset managers and research firms believes that government and central bank stimulus may prove to be the biggest driver of international market returns in 2015.
While maintaining adequate portfolio diversification is vital in any market environment, we believe it is especially important today given the unprecedented central bank interventions of the past few years and the very real geopolitical risk around the world. The uncertainty of today's global financial markets is one of the reasons we at John Hancock Investments believe it is important for long-term portfolios to have exposure to a diverse range of investments. Now may be a good time to discuss the resilience of your portfolio with your financial advisor.
On behalf of everyone at John Hancock Investments, I'd like to take this opportunity to welcome new shareholders and to thank existing shareholders for the continued trust you've placed in us.
Sincerely,
Andrew G. Arnott
President and Chief Executive Officer
John Hancock Investments
This commentary reflects the CEO's views as of April 30, 2015. They are subject to change at any time. For more up-to-date information, you can visit our website at jhinvestments.com.
John Hancock
Greater China Opportunities Fund
1
INVESTMENT OBJECTIVE
The fund seeks long-term capital appreciation.
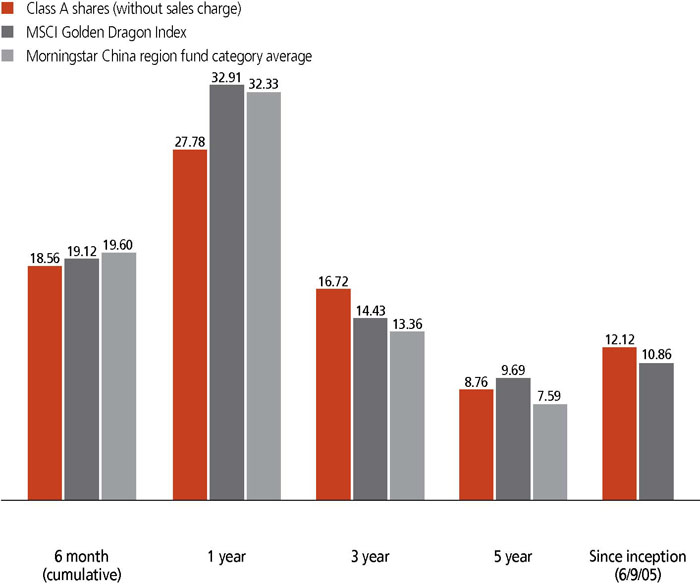
AVERAGE ANNUAL TOTAL RETURNS AS OF 4/30/15 (%)
The MSCI Golden Dragon Index (gross of foreign withholding taxes on dividends) is an unmanaged free float-adjusted market capitalization-weighted index that is designed to measure equity market performance in the China region. The MSCI Golden Dragon Index consists of the following indexes: China, Hong Kong, and Taiwan.
It is not possible to invest directly in an index. Index figures do not reflect expenses or sales charges, which would result in lower values.
Figures from Morningstar, Inc. include reinvested distributions and do not take into account sales charges. Actual load-adjusted performance is lower.
The past performance shown here reflects reinvested distributions and the beneficial effect of any expense reductions, and does not guarantee future results. Returns for periods shorter than one year are cumulative, and results for other share classes will vary. Shares will fluctuate in value and, when redeemed, may be worth more or less than their original cost. Current performance may be lower or higher than the performance cited, and can be found at jhinvestments.com or by calling 800-225-5291. For further information on the fund's objectives, risks, and strategy, see the fund's prospectuses.
2
PERFORMANCE HIGHLIGHTS OVER THE LAST SIX MONTHS
Stocks surged despite China's economic challenges
China region stocks were supported by economic stimulus measures enacted by China's government and by the accommodative monetary policies of the nation's central bank.
Fund trailed its benchmark and peer group
The fund posted a strong absolute return, but underperformed relative to its benchmark and the average of its peer group.
Positions in select stocks aided performance
Overall, the fund's positions in the healthcare and utilities sectors detracted from performance, while most positions in industrials and consumer staples aided relative results.
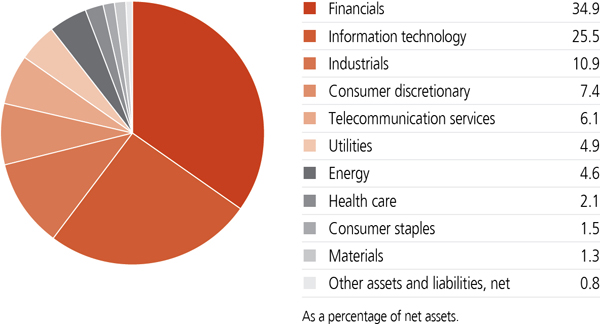
SECTOR COMPOSITION AS OF 4/30/15 (%)
A note about risks
Foreign investing has additional risks, such as currency and market volatility and political and social instability. Investments in the Greater China region are subject to special risks, such as less developed or less efficient trading markets, restrictions on monetary repatriation and possible seizure, nationalization, or expropriation of assets. The fund may invest in IPOs, which are frequently volatile in price and may lead to increased portfolio turnover. The stock prices of midsize and small companies can change more frequently and dramatically than those of large companies. The fund is non-diversified and may invest its assets in a small number of issuers. Performance could suffer significantly from adverse events affecting these issuers. Hedging, derivatives, and other strategic transactions may increase volatility and result in losses if not successful. Sector investing is subject to greater risks than the market as a whole. Because the fund may focus on particular sectors of the economy, its performance may depend on the performance of those sectors, and investments focused in one sector may fluctuate more widely than investments diversified across sectors. Please see the fund's prospectuses for additional risks.
3
An interview with Portfolio Manager Kai-Kong Chay, CFA, John Hancock Asset Management a division of Manulife Asset Management (North America) Limited
Kai-Kong Chay, CFA
Portfolio Manager
John Hancock Asset Management
While the fund underperformed its benchmark during the six-month period, it posted a strong absolute return. How would you describe the market environment that led to this result?
Investors in Greater China region stocks continued to confront the reality of a slowdown in economic growth in China, the world's second-largest economy. However, expanded stimulus measures and accommodative monetary policies served to lift investor sentiment, providing support for equity prices. China's government reported that GDP expanded by 7.4% in 2014, the slowest pace in more than two decades, and the 7.0% annualized growth rate during the first three months of 2015 was the slowest quarterly result in six years. Economic data released during the period was mostly disappointing, fueling concerns about deflationary pressures, and China's real estate market remained sluggish.
In response to these trends, China's government implemented further stimulus measures to encourage infrastructure development, and its central bank took additional steps to ease monetary policies. The People's Bank of China cut interest rates twice during the six-month period, lowered the minimum downpayment requirement for second home buyers, and reduced the amount of cash that lenders must set aside as reserves. These actions, as well as statements by Chinese government officials about the possible need for additional stimulus measures, helped to lift investor sentiment during the period.
Equity price appreciation was also fueled by the growing participation of retail investors in China's domestic stock market. Many of these investors began buying equities, helping to drive stock prices higher, as an alternative to investing in property development and real estate. Many investors were shut out of property and real estate as a result of a recent government crackdown on China's shadow banking system, in which lending transactions are made outside traditional bank channels, often with little or no regulatory oversight.
Investor sentiment was lifted further by the expanded access that foreign investors gained to China's stock market during the period, resulting in greater flow of capital to sustain economic growth. In November 2014, securities regulators in Hong Kong and mainland China began to implement the Shanghai-Hong Kong Stock Connect, a pilot program allowing investors outside
4
What about Taiwan and Hong Kong, where the fund is also invested?
Most equities in Taiwan and Hong Kong underperformed Chinese stocks, despite posting strong returns overall in absolute terms. Strength in Taiwan's information technology sector helped lift that country's market, while equities in Hong Kong were supported by the launch of the Shanghai-Hong Kong Stock Connect program and by China's monetary easing and economic stimulus initiatives.
How did the fund perform at the sector level?
Any significant over- or underweights in certain sectors are typically coincidental effects of our stock selection at the individual security level. However, there were some sectors in which our stock picking significantly detracted from or contributed to performance relative to the fund's benchmark. Overall, the fund's positions in the healthcare and utilities sectors weighed on relative results, while positions in industrials and consumer staples contributed.
Which individual holdings had the biggest negative impact on relative results?
The biggest detractor was a position in China Animal Healthcare, Ltd., a maker of vaccines for poultry and livestock. Trading of the company's stock was suspended throughout the final month of the period, at the company's request, after it failed to meet a compliance deadline to publish annual
TOP 10 HOLDINGS AS OF 4/30/15 (%)
Taiwan Semiconductor Manufacturing Company, Ltd. | 5.9 |
Tencent Holdings, Ltd. | 5.5 |
China Mobile, Ltd. | 4.4 |
AIA Group, Ltd. | 3.6 |
China Construction Bank Corp., H Shares | 3.3 |
Bank of China, Ltd., H Shares | 3.2 |
Industrial & Commercial Bank of China, Ltd., H Shares | 3.0 |
China Resources Land, Ltd. | 2.7 |
Ping An Insurance Group Company of China, Ltd., H Shares | 2.2 |
Hong Kong Exchanges & Clearing, Ltd. | 2.1 |
TOTAL | 35.9 |
As a percentage of net assets. | |
Cash and cash equivalents are not included. |
5
A position in Galaxy Entertainment Group, Ltd., a Hong Kong-based operator and owner of casino resorts in Macau, also weighed on overall results. Galaxy's shares fell sharply after revenue from gambling operations fell short of expectations, in part as a result of an anti-graft crackdown by Chinese authorities that has weighed on gambling activity in Macau. The slowdown in the Chinese economy has further slowed the industry.
Other positions that significantly weighed on the fund's relative performance were Hanergy Thin Film Power Group, Ltd., China Life Insurance Company, Ltd., and Sound Global, Ltd. We sold the fund's position in Hanergy Thin Film Power Group prior to the end of the period.
Which holdings stood out as strong performers?
The biggest relative contribution came from a position in China Communications Construction Company, Ltd., a China-based infrastructure construction firm. The company's shares surged as prospects for development of roads, bridges, railways, and other infrastructure improved as the Chinese government encouraged development intended to expand trade with nations in central Asia and other regions.
Another strong contributor was a position in China Taiping Insurance Holdings Company, Ltd., a China-based underwriter of life insurance and property and casualty insurance. China Taiping's shares rose sharply as its insurance sales increased faster than the industry average by a wide
COUNTRY COMPOSITION AS OF 4/30/15 (%)
China | 43.7 |
Hong Kong | 31.4 |
Taiwan | 23.5 |
Macau | 0.6 |
As a percentage of net assets. | |
Cash and cash equivalents are not included. |
6
margin. We sold the fund's position in the company during the period after the stock's price rose to a level that we believe reflected its fair value.
Other notable contributors included positions in China Resources Land, Ltd. (Hong Kong), Sinosoft Technology Group, Ltd. (China), and China Eastern Airlines Corp., Ltd.
How was the fund positioned at the end of the period?
The fund was slightly overweight in China relative to the benchmark, in part as a result of our expectation that the country's equity market will continue to be supported by the Chinese government's accommodative monetary policies and economic stimulus. However, we are mindful that the strong gains in China's equity market during the period increased valuations of many stocks to levels approaching what we consider to represent fair values, leaving less room for potential further appreciation in prices of these stocks.
We continue to look for equity opportunities in industries within China that we believe have strong economic prospects as a result of structural shifts in China's economy and government initiatives to encourage development. These industries include e-commerce, environmental protection, pharmaceuticals, and property development.
MANAGED BY
Kai-Kong Chay, CFA On the fund since 2011 Investing since 1997 | |
Ronald Chan, CFA On the fund since 2011 Investing since 1995 |
7
TOTAL RETURNS FOR THE PERIOD ENDED APRIL 30, 2015
Average annual total returns (%) with maximum sales charge | Cumulative total returns (%) with maximum sales charge | ||||||||||||||||||||||
1-year | 5-year | Since inception | 6-month | 5-year | Since inception | ||||||||||||||||||
Class A | 21.39 | 7.65 | 11.54 | 1 | 12.63 | 44.58 | 194.70 | 1 | |||||||||||||||
Class B | 21.69 | 7.56 | 11.26 | 1 | 13.08 | 43.95 | 187.35 | 1 | |||||||||||||||
Class C | 25.68 | 7.87 | 11.26 | 1 | 17.13 | 46.04 | 187.39 | 1 | |||||||||||||||
Class I2 | 28.18 | 9.11 | 12.40 | 1 | 18.76 | 54.66 | 217.81 | 1 | |||||||||||||||
Class NAV2,3 | 28.34 | 9.31 | 6.86 | 3 | 18.84 | 56.05 | 73.89 | 3 | |||||||||||||||
Index† | 32.91 | 9.69 | 10.86 | 1 | 19.12 | 58.82 | 177.27 | 1 |
Performance figures assume all distributions have been reinvested. Figures reflect maximum sales charge on Class A shares of 5%, and the applicable contingent deferred sales charge (CDSC) on Class B and Class C shares. The Class B shares' CDSC declines annually between years 1 to 6 according to the following schedule: 5%, 4%, 3%, 3%, 2%, 1%. No sales charge will be assessed after the sixth year. Class C shares held for less than one year are subject to a 1% CDSC. Sales charges are not applicable to Class I and Class NAV shares.
The expense ratios of the fund, both net (including any fee waivers and/or expense limitations) and gross (excluding any fee waivers and/or expense limitations), are set forth according to the most recent publicly available prospectuses for the fund and may differ from those disclosed in the Financial highlights tables in this report. Had the fee waivers and expense limitations not been in place, gross expenses would apply. The expense ratios are as follows:
Class A | Class B | Class C | Class I | Class NAV | |
Gross (%) | 1.80 | 2.50 | 2.50 | 1.49 | 1.36 |
Net (%) | 1.74 | 2.44 | 2.44 | 1.34 | 1.30 |
Please refer to the most recent prospectus and annual or semiannual report for more information on expenses and any expense limitation arrangements for each class.
The returns reflect past results and should not be considered indicative of future performance. The return and principal value of an investment will fluctuate so that shares, when redeemed, may be worth more or less than their original cost. Due to market volatility and other factors, the fund's current performance may be higher or lower than the performance shown. For current to the most recent month-end performance data, please call 800-225-5291 or visit the fund's website at jhinvestments.com.
The performance table above and the chart on the next page do not reflect the deduction of taxes that a shareholder would pay on fund distributions or the redemption of fund shares. The fund's performance results reflect any applicable fee waivers or expense reductions, without which the expenses would increase and results would have been less favorable.
† | Index is the MSCI Golden Dragon Index. |
See the following page for footnotes.
8
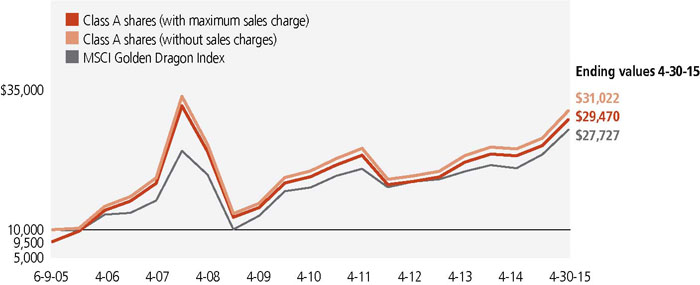
This chart and table show what happened to a hypothetical $10,000 investment in John Hancock Greater China Opportunities Fund for the share classes and periods indicated, assuming all distributions were reinvested. For comparison, we've shown the same investment in the MSCI Golden Dragon Index.
Start date | With maximum sales charge ($) | Without sales charge ($) | Index ($) | |
Class B4 | 6-9-05 | 28,735 | 28,735 | 27,727 |
Class C4 | 6-9-05 | 28,739 | 28,739 | 27,727 |
Class I2 | 6-9-05 | 31,781 | 31,781 | 27,727 |
Class NAV2 | 12-28-06 | 17,389 | 17,389 | 18,574 |
Performance of the classes will vary based on the difference in sales charges paid by shareholders investing in the different classes and the fee structure of those classes.
The MSCI Golden Dragon Index (gross of foreign withholding taxes on dividends) is an unmanaged free float-adjusted market capitalization index that is designed to measure equity market performance in the China region. The MSCI Golden Dragon Index consists of the following Indexes: China, Hong Kong, and Taiwan.
It is not possible to invest directly in an index. Index figures do not reflect expenses or sales charges, which would result in lower values.
Footnotes related to performance pages
1 | From 6-9-05. |
2 | For certain types of investors, as described in the fund's prospectuses. |
3 | From 12-28-06. |
4 | The contingent deferred sales charge is not applicable. |
9
These examples are intended to help you understand your ongoing operating expenses of investing in the fund so you can compare these costs with the ongoing costs of investing in other mutual funds.
Understanding fund expenses
As a shareholder of the fund, you incur two types of costs:
• | Transaction costs, which include sales charges (loads) on purchases or redemptions (varies by share class), minimum account fee charge, etc. |
• | Ongoing operating expenses, including management fees, distribution and service fees (if applicable), and other fund expenses. |
We are presenting only your ongoing operating expenses here.
Actual expenses/actual returns
This example is intended to provide information about the fund's actual ongoing operating expenses, and is based on the fund's actual return. It assumes an account value of $1,000.00 on November 1, 2014, with the same investment held until April 30, 2015.
Account value on 11-1-2014 | Ending value on 4-30-2015 | Expenses paid during period ended 4-30-20151 | Annualized expense ratio | |
Class A | $1,000.00 | $1,185.60 | $9.27 | 1.71% |
Class B | 1,000.00 | 1,180.80 | 13.57 | 2.51% |
Class C | 1,000.00 | 1,181.30 | 13.58 | 2.51% |
Class I | 1,000.00 | 1,187.60 | 7.27 | 1.34% |
Class NAV | 1,000.00 | 1,188.40 | 6.78 | 1.25% |
Together with the value of your account, you may use this information to estimate the operating expenses that you paid over the period. Simply divide your account value at April 30, 2015, by $1,000.00, then multiply it by the "expenses paid" for your share class from the table above. For example, for an account value of $8,600.00, the operating expenses should be calculated as follows:
10
Hypothetical example for comparison purposes
This table allows you to compare the fund's ongoing operating expenses with those of any other fund. It provides an example of the fund's hypothetical account values and hypothetical expenses based on each class's actual expense ratio and an assumed 5% annualized return before expenses (which is not the fund's actual return). It assumes an account value of $1,000.00 on November 1, 2014, with the same investment held until April 30, 2015. Look in any other fund shareholder report to find its hypothetical example and you will be able to compare these expenses. Please remember that these hypothetical account values and expenses may not be used to estimate the actual ending account balance or expenses you paid for the period.
Account value on 11-1-2014 | Ending value on 4-30-2015 | Expenses paid during period ended 4-30-20151 | Annualized expense ratio | |
Class A | $1,000.00 | $1,016.30 | $8.55 | 1.71% |
Class B | 1,000.00 | 1,012.30 | 12.52 | 2.51% |
Class C | 1,000.00 | 1,012.30 | 12.52 | 2.51% |
Class I | 1,000.00 | 1,018.10 | 6.71 | 1.34% |
Class NAV | 1,000.00 | 1,018.60 | 6.26 | 1.25% |
Remember, these examples do not include any transaction costs, therefore, these examples will not help you to determine the relative total costs of owning different funds. If transaction costs were included, your expenses would have been higher. See the prospectuses for details regarding transaction costs.
1 | Expenses are equal to the fund's annualized expense ratio, multiplied by the average account value over the period, multiplied by 181/365 (to reflect the one-half year period). |
11
Fund's investments
As of 4-30-15 (unaudited) | |||||||||||
Shares | Value | ||||||||||
Common stocks 99.2% | $87,621,084 | ||||||||||
(Cost $64,135,632) | |||||||||||
China 43.7% | 38,639,526 | ||||||||||
Baidu, Inc., ADR (I) | 3,435 | 687,958 | |||||||||
Bank of China, Ltd., H Shares | 4,096,000 | 2,806,591 | |||||||||
Byd Company, Ltd., H Shares | 155,500 | 939,432 | |||||||||
CAR, Inc. (I) | 343,000 | 810,704 | |||||||||
CGN Power Company, Ltd., H Shares (I)(S) | 1,411,000 | 789,551 | |||||||||
China Animal Healthcare, Ltd. | 1,590,000 | 1,066,763 | |||||||||
China Communications Construction Company, Ltd., H Shares | 1,001,000 | 1,820,673 | |||||||||
China Construction Bank Corp., H Shares | 3,035,000 | 2,946,179 | |||||||||
China Eastern Airlines Corp., Ltd., H Shares (I) | 956,000 | 738,204 | |||||||||
China Life Insurance Company, Ltd., H Shares | 307,000 | 1,489,958 | |||||||||
China Merchants Bank Company, Ltd., H Shares | 292,500 | 877,980 | |||||||||
China Oilfield Services, Ltd., H Shares | 484,000 | 993,749 | |||||||||
China Pacific Insurance Group Company, Ltd., H Shares | 116,000 | 628,750 | |||||||||
China Petroleum & Chemical Corp., H Shares | 958,000 | 904,128 | |||||||||
China Shipping Container Lines Company, Ltd., H Shares (I) | 577,000 | 325,399 | |||||||||
CNOOC, Ltd. | 496,000 | 845,785 | |||||||||
Dalian Wanda Commercial Properties Company, Ltd., H Shares (I)(S) | 85,200 | 698,618 | |||||||||
GF Securities Company, Ltd., H Shares (I) | 266,400 | 843,827 | |||||||||
GOME Electrical Appliances Holdings, Ltd. | 2,470,000 | 632,742 | |||||||||
Huadian Power International Corp., H Shares | 718,000 | 794,944 | |||||||||
Industrial & Commercial Bank of China, Ltd., H Shares | 3,095,500 | 2,685,225 | |||||||||
JD.com, Inc., ADR (I) | 17,541 | 588,676 | |||||||||
Kingsoft Corp., Ltd. | 218,000 | 852,236 | |||||||||
PetroChina Company, Ltd., H Shares | 1,002,000 | 1,292,343 | |||||||||
PICC Property & Casualty Company, Ltd., H Shares | 383,520 | 849,700 | |||||||||
Ping An Insurance Group Company of China, Ltd., H Shares | 137,500 | 1,966,420 | |||||||||
Shanghai Haohai Biological Technology Company, Ltd., H Shares (I)(S) | 10,400 | 78,363 | |||||||||
Sinosoft Technology Group, Ltd. | 1,300,000 | 968,092 | |||||||||
Sound Global, Ltd. (I) | 665,000 | 390,392 | |||||||||
Sunac China Holdings, Ltd. | 730,000 | 959,909 | |||||||||
Tencent Holdings, Ltd. | 234,800 | 4,846,007 | |||||||||
Wisdom Holdings Group | 1,743,000 | 1,520,228 |
Shares | Value | ||||||||||
Hong Kong 31.4% | $27,696,753 | ||||||||||
AIA Group, Ltd. | 474,000 | 3,152,325 | |||||||||
BOC Hong Kong Holdings, Ltd. | 334,000 | 1,295,492 | |||||||||
Cheung Kong Infrastructure Holdings, Ltd. | 135,000 | 1,143,637 | |||||||||
China Everbright International, Ltd. | 696,000 | 1,297,869 | |||||||||
China Gas Holdings, Ltd. | 370,000 | 653,733 | |||||||||
China Merchants Holdings International Company, Ltd. | 240,000 | 1,088,800 | |||||||||
China Mobile, Ltd. | 273,500 | 3,906,479 | |||||||||
China Resources Land, Ltd. | 656,666 | 2,382,521 | |||||||||
China Unicom Hong Kong, Ltd. | 458,000 | 860,183 | |||||||||
CK Hutchison Holdings, Ltd. | 65,000 | 1,409,991 | |||||||||
Cowell e Holdings, Inc. (I) | 782,000 | 545,848 | |||||||||
Galaxy Entertainment Group, Ltd. | 214,000 | 1,028,458 | |||||||||
Guangdong Investment, Ltd. | 362,000 | 539,801 | |||||||||
Hong Kong Exchanges & Clearing, Ltd. | 49,000 | 1,867,891 | |||||||||
Hutchison Whampoa, Ltd. | 120,000 | 1,764,206 | |||||||||
Ju Teng International Holdings, Ltd. | 1,002,000 | 628,413 | |||||||||
New World Development Company, Ltd. | 949,000 | 1,258,717 | |||||||||
Sino Biopharmaceutical, Ltd. | 608,000 | 694,140 | |||||||||
Sun Hung Kai Properties, Ltd. | 76,000 | 1,262,247 | |||||||||
Vinda International Holdings, Ltd. | 410,000 | 916,002 | |||||||||
Macau 0.6% | 518,517 | ||||||||||
Sands China, Ltd. | 127,200 | 518,517 | |||||||||
Taiwan 23.5% | 20,766,288 | ||||||||||
Advanced Semiconductor Engineering, Inc. | 257,000 | 364,458 | |||||||||
Advantech Company, Ltd. | 77,000 | 634,307 | |||||||||
Aerospace Industrial Development Corp. (I) | 336,000 | 486,749 | |||||||||
Casetek Holdings, Ltd. | 118,000 | 716,274 | |||||||||
Catcher Technology Company, Ltd. | 55,000 | 643,602 | |||||||||
China Life Insurance Company, Ltd. | 544,000 | 575,853 | |||||||||
CTBC Financial Holding Company, Ltd. | 1,259,109 | 980,057 | |||||||||
Delta Electronics, Inc. | 159,000 | 956,777 | |||||||||
Everlight Electronics Company, Ltd. | 342,000 | 790,645 | |||||||||
Far Eastern New Century Corp. | 577,000 | 633,783 | |||||||||
Formosa Chemicals & Fibre Corp. | 438,000 | 1,116,095 | |||||||||
Hermes Microvision, Inc. | 15,000 | 1,054,766 | |||||||||
Hon Hai Precision Industry Company, Ltd. | 297,960 | 892,821 | |||||||||
Johnson Health Tech Company, Ltd. | 236,000 | 610,836 | |||||||||
Largan Precision Company, Ltd. | 9,000 | 901,854 | |||||||||
Lotes Company, Ltd. | 155,000 | 639,659 | |||||||||
Novatek Microelectronics Corp. | 118,000 | 616,743 | |||||||||
President Chain Store Corp. | 60,000 | 444,010 | |||||||||
Quanta Computer, Inc. | 219,000 | 549,453 | |||||||||
Sunspring Metal Corp. | 350,000 | 681,431 |
Shares | Value | ||||||||||
Taiwan (continued) | |||||||||||
Taiwan Mobile Company, Ltd. | 182,000 | $641,195 | |||||||||
Taiwan Semiconductor Manufacturing Company, Ltd. | 1,076,089 | 5,180,585 | |||||||||
Tung Thih Electronic Company, Ltd. | 144,000 | 654,335 | |||||||||
Total investments (Cost $64,135,632)† 99.2% | $87,621,084 | ||||||||||
Other assets and liabilities, net 0.8% | $671,146 | ||||||||||
Total net assets 100.0% | $88,292,230 |
The percentage shown for each investment category is the total value of the category as a percentage of the net assets of the fund. | |||
Key to Security Abbreviations and Legend | |||
ADR | American Depositary Receipts | ||
(I) | Non-income producing security. | ||
(S) | These securities are exempt from registration under Rule 144A of the Securities Act of 1933. Such securities may be resold, normally to qualified institutional buyers, in transactions exempt from registration. | ||
† | At 4-30-15, the aggregate cost of investment securities for federal income tax purposes was $64,409,616. Net unrealized appreciation aggregated $23,211,468, of which $24,770,123 related to appreciated investment securities and $1,558,655 related to depreciated investment securities. |
Financial statements
STATEMENT OF ASSETS AND LIABILITIES 4-30-15 (unaudited)
Assets | ||||||||||||||||||||||||||||||||||||||||
Investments, at value (Cost $64,135,632) | $87,621,084 | |||||||||||||||||||||||||||||||||||||||
Cash | 152,253 | |||||||||||||||||||||||||||||||||||||||
Foreign currency, at value (Cost $178,873) | 178,862 | |||||||||||||||||||||||||||||||||||||||
Receivable for investments sold | 1,723,717 | |||||||||||||||||||||||||||||||||||||||
Receivable for fund shares sold | 139,387 | |||||||||||||||||||||||||||||||||||||||
Dividends receivable | 22,424 | |||||||||||||||||||||||||||||||||||||||
Other receivables and prepaid expenses | 49,532 | |||||||||||||||||||||||||||||||||||||||
Total assets | 89,887,259 | |||||||||||||||||||||||||||||||||||||||
Liabilities | ||||||||||||||||||||||||||||||||||||||||
Payable for investments purchased | 1,433,542 | |||||||||||||||||||||||||||||||||||||||
Payable for fund shares repurchased | 41,828 | |||||||||||||||||||||||||||||||||||||||
Payable to affiliates | ||||||||||||||||||||||||||||||||||||||||
Transfer agent fees | 13,699 | |||||||||||||||||||||||||||||||||||||||
Distribution and service fees | 45,812 | |||||||||||||||||||||||||||||||||||||||
Other liabilities and accrued expenses | 60,148 | |||||||||||||||||||||||||||||||||||||||
Total liabilities | 1,595,029 | |||||||||||||||||||||||||||||||||||||||
Net assets | $88,292,230 | |||||||||||||||||||||||||||||||||||||||
Net assets consist of | ||||||||||||||||||||||||||||||||||||||||
Paid-in capital | $61,080,599 | |||||||||||||||||||||||||||||||||||||||
Accumulated distributions in excess of net investment income | (721,043 | ) | ||||||||||||||||||||||||||||||||||||||
Accumulated net realized gain (loss) on investments and foreign currency transactions | 4,448,856 | |||||||||||||||||||||||||||||||||||||||
Net unrealized appreciation (depreciation) on investments and translation of assets and liabilities in foreign currencies | 23,483,818 | |||||||||||||||||||||||||||||||||||||||
Net assets | $88,292,230 | |||||||||||||||||||||||||||||||||||||||
Net asset value per share | ||||||||||||||||||||||||||||||||||||||||
Based on net asset values and shares outstanding-the fund has an unlimited number of shares authorized with no par value | ||||||||||||||||||||||||||||||||||||||||
Class A ($54,592,254 ÷ 2,252,396 shares)1 | $24.24 | |||||||||||||||||||||||||||||||||||||||
Class B ($3,264,991 ÷ 139,343 shares)1 | $23.43 | |||||||||||||||||||||||||||||||||||||||
Class C ($10,107,845 ÷ 431,304 shares)1 | $23.44 | |||||||||||||||||||||||||||||||||||||||
Class I ($5,889,919 ÷ 243,665 shares) | $24.17 | |||||||||||||||||||||||||||||||||||||||
Class NAV ($14,437,221 ÷ 589,864 shares) | $24.48 | |||||||||||||||||||||||||||||||||||||||
Maximum offering price per share | ||||||||||||||||||||||||||||||||||||||||
Class A (net asset value per share ÷ 95%)2 | $25.52 |
1 | Redemption price per share is equal to net asset value less any applicable contingent deferred sales charge. | |||||||
2 | On single retail sales of less than $50,000. On sales of $50,000 or more and on group sales the offering price is reduced. |
STATEMENT OF OPERATIONS For the six months ended 4-30-15 (unaudited)
Investment income | ||||||||||||||||||||||||||||||||||||||||
Dividends | $165,926 | |||||||||||||||||||||||||||||||||||||||
Less foreign taxes withheld | (8,521 | ) | ||||||||||||||||||||||||||||||||||||||
Total investment income | 157,405 | |||||||||||||||||||||||||||||||||||||||
Expenses | ||||||||||||||||||||||||||||||||||||||||
Investment management fees | 380,123 | |||||||||||||||||||||||||||||||||||||||
Distribution and service fees | 133,392 | |||||||||||||||||||||||||||||||||||||||
Accounting and legal services fees | 3,877 | |||||||||||||||||||||||||||||||||||||||
Transfer agent fees | 37,779 | |||||||||||||||||||||||||||||||||||||||
Trustees' fees | 955 | |||||||||||||||||||||||||||||||||||||||
State registration fees | 32,894 | |||||||||||||||||||||||||||||||||||||||
Printing and postage | 8,982 | |||||||||||||||||||||||||||||||||||||||
Professional fees | 22,042 | |||||||||||||||||||||||||||||||||||||||
Custodian fees | 38,754 | |||||||||||||||||||||||||||||||||||||||
Registration and filing fees | 17,876 | |||||||||||||||||||||||||||||||||||||||
Other | 4,207 | |||||||||||||||||||||||||||||||||||||||
Total expenses | 680,881 | |||||||||||||||||||||||||||||||||||||||
Less expense reductions | (16,099 | ) | ||||||||||||||||||||||||||||||||||||||
Net expenses | 664,782 | |||||||||||||||||||||||||||||||||||||||
Net investment loss | (507,377 | ) | ||||||||||||||||||||||||||||||||||||||
Realized and unrealized gain (loss) | ||||||||||||||||||||||||||||||||||||||||
Net realized gain (loss) on | ||||||||||||||||||||||||||||||||||||||||
Investments and foreign currency transactions | 4,513,139 | |||||||||||||||||||||||||||||||||||||||
4,513,139 | ||||||||||||||||||||||||||||||||||||||||
Change in net unrealized appreciation (depreciation) of | ||||||||||||||||||||||||||||||||||||||||
Investments and translation of assets and liabilities in foreign currencies | 9,559,058 | |||||||||||||||||||||||||||||||||||||||
9,559,058 | ||||||||||||||||||||||||||||||||||||||||
Net realized and unrealized gain | 14,072,197 | |||||||||||||||||||||||||||||||||||||||
Increase in net assets from operations | $13,564,820 |
STATEMENTS OF CHANGES IN NET ASSETS
Six months ended 4-30-15 | Year ended 10-31-14 | ||||||||||||||||||||||||||||||||||||||||||||
(unaudited) | |||||||||||||||||||||||||||||||||||||||||||||
Increase (decrease) in net assets | |||||||||||||||||||||||||||||||||||||||||||||
From operations | |||||||||||||||||||||||||||||||||||||||||||||
Net investment income (loss) | ($507,377 | ) | $791,533 | ||||||||||||||||||||||||||||||||||||||||||
Net realized gain | 4,513,139 | 6,350,775 | |||||||||||||||||||||||||||||||||||||||||||
Change in net unrealized appreciation (depreciation) | 9,559,058 | (2,906,766 | ) | ||||||||||||||||||||||||||||||||||||||||||
Increase in net assets resulting from operations | 13,564,820 | 4,235,542 | |||||||||||||||||||||||||||||||||||||||||||
Distributions to shareholders | |||||||||||||||||||||||||||||||||||||||||||||
From net investment income | |||||||||||||||||||||||||||||||||||||||||||||
Class A | (549,375 | ) | (351,058 | ) | |||||||||||||||||||||||||||||||||||||||||
Class B | (13,558 | ) | — | ||||||||||||||||||||||||||||||||||||||||||
Class C | (27,471 | ) | — | ||||||||||||||||||||||||||||||||||||||||||
Class I | (55,637 | ) | (14,936 | ) | |||||||||||||||||||||||||||||||||||||||||
Class NAV | (190,974 | ) | (12,022 | ) | |||||||||||||||||||||||||||||||||||||||||
From net realized gain | |||||||||||||||||||||||||||||||||||||||||||||
Class A | (3,934,001 | ) | (370,296 | ) | |||||||||||||||||||||||||||||||||||||||||
Class B | (339,402 | ) | (62,772 | ) | |||||||||||||||||||||||||||||||||||||||||
Class C | (777,489 | ) | (86,761 | ) | |||||||||||||||||||||||||||||||||||||||||
Class I | (306,074 | ) | (9,751 | ) | |||||||||||||||||||||||||||||||||||||||||
Class NAV | (1,012,052 | ) | (7,444 | ) | |||||||||||||||||||||||||||||||||||||||||
Total distributions | (7,206,033 | ) | (915,040 | ) | |||||||||||||||||||||||||||||||||||||||||
From fund share transactions | 5,013,879 | 6,961,268 | |||||||||||||||||||||||||||||||||||||||||||
Total increase | 11,372,666 | 10,281,770 | |||||||||||||||||||||||||||||||||||||||||||
Net assets | |||||||||||||||||||||||||||||||||||||||||||||
Beginning of period | 76,919,564 | 66,637,794 | |||||||||||||||||||||||||||||||||||||||||||
End of period | $88,292,230 | $76,919,564 | |||||||||||||||||||||||||||||||||||||||||||
Undistributed (accumulated distributions in excess of) net investment income | ($721,043 | ) | $623,349 |
Financial highlights
Class A Shares Period ended | 4-30-15 | 1 | 10-31-14 | 10-31-13 | 10-31-12 | 10-31-11 | 10-31-10 | |||||||||||||||||||||||||||||||||||||||||||||||||||||||||||||||||||||||||||||||||||||||||||||||||||||||||||||||
Per share operating performance | ||||||||||||||||||||||||||||||||||||||||||||||||||||||||||||||||||||||||||||||||||||||||||||||||||||||||||||||||||||||
Net asset value, beginning of period | $22.73 | $21.70 | �� | $17.99 | $16.90 | $20.24 | $17.33 | |||||||||||||||||||||||||||||||||||||||||||||||||||||||||||||||||||||||||||||||||||||||||||||||||||||||||||||||
Net investment income (loss)2 | (0.14 | ) | 0.24 | 0.12 | 0.06 | 0.14 | 0.08 | |||||||||||||||||||||||||||||||||||||||||||||||||||||||||||||||||||||||||||||||||||||||||||||||||||||||||||||||
Net realized and unrealized gain (loss) on investments | 3.83 | 1.13 | 3.65 | 1.18 | (3.41 | ) | 2.94 | |||||||||||||||||||||||||||||||||||||||||||||||||||||||||||||||||||||||||||||||||||||||||||||||||||||||||||||||
Total from investment operations | 3.69 | 1.37 | 3.77 | 1.24 | (3.27 | ) | 3.02 | |||||||||||||||||||||||||||||||||||||||||||||||||||||||||||||||||||||||||||||||||||||||||||||||||||||||||||||||
Less distributions | ||||||||||||||||||||||||||||||||||||||||||||||||||||||||||||||||||||||||||||||||||||||||||||||||||||||||||||||||||||||
From net investment income | (0.27 | ) | (0.16 | ) | (0.06 | ) | (0.15 | ) | (0.07 | ) | (0.11 | ) | ||||||||||||||||||||||||||||||||||||||||||||||||||||||||||||||||||||||||||||||||||||||||||||||||||||||||||
From net realized gain | (1.91 | ) | (0.18 | ) | — | — | — | — | ||||||||||||||||||||||||||||||||||||||||||||||||||||||||||||||||||||||||||||||||||||||||||||||||||||||||||||||
Total distributions | (2.18 | ) | (0.34 | ) | (0.06 | ) | (0.15 | ) | (0.07 | ) | (0.11 | ) | ||||||||||||||||||||||||||||||||||||||||||||||||||||||||||||||||||||||||||||||||||||||||||||||||||||||||||
Net asset value, end of period | $24.24 | $22.73 | $21.70 | $17.99 | $16.90 | $20.24 | ||||||||||||||||||||||||||||||||||||||||||||||||||||||||||||||||||||||||||||||||||||||||||||||||||||||||||||||||
Total return (%)3,4 | 18.56 | 5 | 6.39 | 21.01 | 7.51 | (16.24 | ) | 17.46 | ||||||||||||||||||||||||||||||||||||||||||||||||||||||||||||||||||||||||||||||||||||||||||||||||||||||||||||||
Ratios and supplemental data | ||||||||||||||||||||||||||||||||||||||||||||||||||||||||||||||||||||||||||||||||||||||||||||||||||||||||||||||||||||||
Net assets, end of period (in millions) | $55 | $47 | $46 | $44 | $53 | $80 | ||||||||||||||||||||||||||||||||||||||||||||||||||||||||||||||||||||||||||||||||||||||||||||||||||||||||||||||||
Ratios (as a percentage of average net assets): | ||||||||||||||||||||||||||||||||||||||||||||||||||||||||||||||||||||||||||||||||||||||||||||||||||||||||||||||||||||||
Expenses before reductions | 1.73 | 6 | 1.71 | 1.74 | 1.80 | 1.67 | 1.73 | |||||||||||||||||||||||||||||||||||||||||||||||||||||||||||||||||||||||||||||||||||||||||||||||||||||||||||||||
Expenses including reductions | 1.71 | 6 | 1.71 | 1.74 | 1.80 | 1.67 | 1.70 | |||||||||||||||||||||||||||||||||||||||||||||||||||||||||||||||||||||||||||||||||||||||||||||||||||||||||||||||
Net investment income (loss) | (1.30 | ) 6,7 | 1.10 | 0.60 | 0.37 | 0.67 | 0.45 | |||||||||||||||||||||||||||||||||||||||||||||||||||||||||||||||||||||||||||||||||||||||||||||||||||||||||||||||
Portfolio turnover (%) | 56 | 123 | 93 | 132 | 145 | 71 |
1 | Six months ended 4-30-15. Unaudited. | |||||||||||||||||||||||||||||||||||||
2 | Based on average daily shares outstanding. | |||||||||||||||||||||||||||||||||||||
3 | Does not reflect the effect of sales charges, if any. | |||||||||||||||||||||||||||||||||||||
4 | Total returns would have been lower had certain expenses not been reduced during the applicable periods. | |||||||||||||||||||||||||||||||||||||
5 | Not annualized. | |||||||||||||||||||||||||||||||||||||
6 | Annualized. | |||||||||||||||||||||||||||||||||||||
7 | Recognition of net investment income by the fund is affected by the timing and frequency of the declaration of dividends by the securities in which the fund invests. |
Class B Shares Period ended | 4-30-15 | 1 | 10-31-14 | 10-31-13 | 10-31-12 | 10-31-11 | 10-31-10 | |||||||||||||||||||||||||||||||||||||||||||||||||||||||||||||||||||||||||||||||||||||||||||||||||||||||||||||||
Per share operating performance | ||||||||||||||||||||||||||||||||||||||||||||||||||||||||||||||||||||||||||||||||||||||||||||||||||||||||||||||||||||||
Net asset value, beginning of period | $21.93 | $20.97 | $17.49 | $16.42 | $19.76 | $16.95 | ||||||||||||||||||||||||||||||||||||||||||||||||||||||||||||||||||||||||||||||||||||||||||||||||||||||||||||||||
Net investment income (loss)2 | (0.22 | ) | 0.01 | (0.08 | ) | (0.08 | ) | (0.02 | ) | (0.06 | ) | |||||||||||||||||||||||||||||||||||||||||||||||||||||||||||||||||||||||||||||||||||||||||||||||||||||||||||
Net realized and unrealized gain (loss) on investments | 3.71 | 1.13 | 3.56 | 1.18 | (3.32 | ) | 2.87 | |||||||||||||||||||||||||||||||||||||||||||||||||||||||||||||||||||||||||||||||||||||||||||||||||||||||||||||||
Total from investment operations | 3.49 | 1.14 | 3.48 | 1.10 | (3.34 | ) | 2.81 | |||||||||||||||||||||||||||||||||||||||||||||||||||||||||||||||||||||||||||||||||||||||||||||||||||||||||||||||
Less distributions | ||||||||||||||||||||||||||||||||||||||||||||||||||||||||||||||||||||||||||||||||||||||||||||||||||||||||||||||||||||||
From net investment income | (0.08 | ) | — | — | (0.03 | ) | — | — | 3 | |||||||||||||||||||||||||||||||||||||||||||||||||||||||||||||||||||||||||||||||||||||||||||||||||||||||||||||
From net realized gain | (1.91 | ) | (0.18 | ) | �� | — | — | — | — | |||||||||||||||||||||||||||||||||||||||||||||||||||||||||||||||||||||||||||||||||||||||||||||||||||||||||||||
Total distributions | (1.99 | ) | (0.18 | ) | — | (0.03 | ) | — | — | |||||||||||||||||||||||||||||||||||||||||||||||||||||||||||||||||||||||||||||||||||||||||||||||||||||||||||||
Net asset value, end of period | $23.43 | $21.93 | $20.97 | $17.49 | $16.42 | $19.76 | ||||||||||||||||||||||||||||||||||||||||||||||||||||||||||||||||||||||||||||||||||||||||||||||||||||||||||||||||
Total return (%)4,5 | 18.08 | 6 | 5.44 | 19.90 | 6.70 | (16.90 | ) | 16.58 | ||||||||||||||||||||||||||||||||||||||||||||||||||||||||||||||||||||||||||||||||||||||||||||||||||||||||||||||
Ratios and supplemental data | ||||||||||||||||||||||||||||||||||||||||||||||||||||||||||||||||||||||||||||||||||||||||||||||||||||||||||||||||||||||
Net assets, end of period (in millions) | $3 | $5 | $8 | $9 | $11 | $17 | ||||||||||||||||||||||||||||||||||||||||||||||||||||||||||||||||||||||||||||||||||||||||||||||||||||||||||||||||
Ratios (as a percentage of average net assets): | ||||||||||||||||||||||||||||||||||||||||||||||||||||||||||||||||||||||||||||||||||||||||||||||||||||||||||||||||||||||
Expenses before reductions | 2.72 | 7 | 2.67 | 2.67 | 2.61 | 2.46 | 2.49 | |||||||||||||||||||||||||||||||||||||||||||||||||||||||||||||||||||||||||||||||||||||||||||||||||||||||||||||||
Expenses including reductions | 2.51 | 7 | 2.59 | 2.67 | 2.61 | 2.46 | 2.45 | |||||||||||||||||||||||||||||||||||||||||||||||||||||||||||||||||||||||||||||||||||||||||||||||||||||||||||||||
Net investment income (loss) | (2.10 | ) 7,8 | 0.06 | (0.39 | ) | (0.45 | ) | (0.11 | ) | (0.31 | ) | |||||||||||||||||||||||||||||||||||||||||||||||||||||||||||||||||||||||||||||||||||||||||||||||||||||||||||
Portfolio turnover (%) | 56 | 123 | 93 | 132 | 145 | 71 |
1 | Six months ended 4-30-15. Unaudited. | |||||||||||||||||||||||||||||||||||||
2 | Based on average daily shares outstanding. | |||||||||||||||||||||||||||||||||||||
3 | Less than $0.005 per share. | |||||||||||||||||||||||||||||||||||||
4 | Does not reflect the effect of sales charges, if any. | |||||||||||||||||||||||||||||||||||||
5 | Total returns would have been lower had certain expenses not been reduced during the applicable periods. | |||||||||||||||||||||||||||||||||||||
6 | Not annualized. | |||||||||||||||||||||||||||||||||||||
7 | Annualized. | |||||||||||||||||||||||||||||||||||||
8 | Recognition of net investment income by the fund is affected by the timing and frequency of the declaration of dividends by the securities in which the fund invests. |
Class C Shares Period ended | 4-30-15 | 1 | 10-31-14 | 10-31-13 | 10-31-12 | 10-31-11 | 10-31-10 | |||||||||||||||||||||||||||||||||||||||||||||||||||||||||||||||||||||||||||||||||||||||||||||||||||||||||||||||
Per share operating performance | ||||||||||||||||||||||||||||||||||||||||||||||||||||||||||||||||||||||||||||||||||||||||||||||||||||||||||||||||||||||
Net asset value, beginning of period | $21.92 | $20.96 | $17.48 | $16.41 | $19.75 | $16.94 | ||||||||||||||||||||||||||||||||||||||||||||||||||||||||||||||||||||||||||||||||||||||||||||||||||||||||||||||||
Net investment income (loss)2 | (0.22 | ) | 0.05 | (0.05 | ) | (0.07 | ) | (0.02 | ) | (0.05 | ) | |||||||||||||||||||||||||||||||||||||||||||||||||||||||||||||||||||||||||||||||||||||||||||||||||||||||||||
Net realized and unrealized gain (loss) on investments | 3.72 | 1.09 | 3.53 | 1.17 | (3.32 | ) | 2.86 | |||||||||||||||||||||||||||||||||||||||||||||||||||||||||||||||||||||||||||||||||||||||||||||||||||||||||||||||
Total from investment operations | 3.50 | 1.14 | 3.48 | 1.10 | (3.34 | ) | 2.81 | |||||||||||||||||||||||||||||||||||||||||||||||||||||||||||||||||||||||||||||||||||||||||||||||||||||||||||||||
Less distributions | ||||||||||||||||||||||||||||||||||||||||||||||||||||||||||||||||||||||||||||||||||||||||||||||||||||||||||||||||||||||
From net investment income | (0.07 | ) | — | — | (0.03 | ) | — | — | 3 | |||||||||||||||||||||||||||||||||||||||||||||||||||||||||||||||||||||||||||||||||||||||||||||||||||||||||||||
From net realized gain | (1.91 | ) | (0.18 | ) | — | — | — | — | ||||||||||||||||||||||||||||||||||||||||||||||||||||||||||||||||||||||||||||||||||||||||||||||||||||||||||||||
Total distributions | (1.98 | ) | (0.18 | ) | — | (0.03 | ) | — | — | |||||||||||||||||||||||||||||||||||||||||||||||||||||||||||||||||||||||||||||||||||||||||||||||||||||||||||||
Net asset value, end of period | $23.44 | $21.92 | $20.96 | $17.48 | $16.41 | $19.75 | ||||||||||||||||||||||||||||||||||||||||||||||||||||||||||||||||||||||||||||||||||||||||||||||||||||||||||||||||
Total return (%)4,5 | 18.13 | 6 | 5.45 | 19.91 | 6.71 | (16.91 | ) | 16.59 | ||||||||||||||||||||||||||||||||||||||||||||||||||||||||||||||||||||||||||||||||||||||||||||||||||||||||||||||
Ratios and supplemental data | ||||||||||||||||||||||||||||||||||||||||||||||||||||||||||||||||||||||||||||||||||||||||||||||||||||||||||||||||||||||
Net assets, end of period (in millions) | $10 | $9 | $11 | $10 | $12 | $18 | ||||||||||||||||||||||||||||||||||||||||||||||||||||||||||||||||||||||||||||||||||||||||||||||||||||||||||||||||
Ratios (as a percentage of average net assets): | ||||||||||||||||||||||||||||||||||||||||||||||||||||||||||||||||||||||||||||||||||||||||||||||||||||||||||||||||||||||
Expenses before reductions | 2.53 | 7 | 2.58 | 2.62 | 2.61 | 2.45 | 2.48 | |||||||||||||||||||||||||||||||||||||||||||||||||||||||||||||||||||||||||||||||||||||||||||||||||||||||||||||||
Expenses including reductions | 2.51 | 7 | 2.57 | 2.62 | 2.61 | 2.45 | 2.44 | |||||||||||||||||||||||||||||||||||||||||||||||||||||||||||||||||||||||||||||||||||||||||||||||||||||||||||||||
Net investment income (loss) | (2.10 | ) 7,8 | 0.24 | (0.27 | ) | (0.43 | ) | (0.12 | ) | (0.26 | ) | |||||||||||||||||||||||||||||||||||||||||||||||||||||||||||||||||||||||||||||||||||||||||||||||||||||||||||
Portfolio turnover (%) | 56 | 123 | 93 | 132 | 145 | 71 |
1 | Six months ended 4-30-15. Unaudited. | |||||||||||||||||||||||||||||||||||||
2 | Based on average daily shares outstanding. | |||||||||||||||||||||||||||||||||||||
3 | Less than $0.005 per share. | |||||||||||||||||||||||||||||||||||||
4 | Does not reflect the effect of sales charges, if any. | |||||||||||||||||||||||||||||||||||||
5 | Total returns would have been lower had certain expenses not been reduced during the applicable periods. | |||||||||||||||||||||||||||||||||||||
6 | Not annualized. | |||||||||||||||||||||||||||||||||||||
7 | Annualized. | |||||||||||||||||||||||||||||||||||||
8 | Recognition of net investment income by the fund is affected by the timing and frequency of the declaration of dividends by the securities in which the fund invests. |
Class I Shares Period ended | 4-30-15 | 1 | 10-31-14 | 10-31-13 | 10-31-12 | 10-31-11 | 10-31-10 | |||||||||||||||||||||||||||||||||||||||||||||||||||||||||||||||||||||||||||||||||||||||||||||||||||||||||||||||
Per share operating performance | �� | |||||||||||||||||||||||||||||||||||||||||||||||||||||||||||||||||||||||||||||||||||||||||||||||||||||||||||||||||||||
Net asset value, beginning of period | $22.72 | $21.71 | $17.96 | $16.82 | $20.14 | $17.24 | ||||||||||||||||||||||||||||||||||||||||||||||||||||||||||||||||||||||||||||||||||||||||||||||||||||||||||||||||
Net investment income (loss)2 | (0.10 | ) | 0.45 | 0.17 | 0.12 | 0.18 | 0.01 | |||||||||||||||||||||||||||||||||||||||||||||||||||||||||||||||||||||||||||||||||||||||||||||||||||||||||||||||
Net realized and unrealized gain (loss) on investments | 3.81 | 1.01 | 3.69 | 1.20 | (3.41 | ) | 3.02 | |||||||||||||||||||||||||||||||||||||||||||||||||||||||||||||||||||||||||||||||||||||||||||||||||||||||||||||||
Total from investment operations | 3.71 | 1.46 | 3.86 | 1.32 | (3.23 | ) | 3.03 | |||||||||||||||||||||||||||||||||||||||||||||||||||||||||||||||||||||||||||||||||||||||||||||||||||||||||||||||
Less distributions | ||||||||||||||||||||||||||||||||||||||||||||||||||||||||||||||||||||||||||||||||||||||||||||||||||||||||||||||||||||||
From net investment income | (0.35 | ) | (0.27 | ) | (0.11 | ) | (0.18 | ) | (0.09 | ) | (0.13 | ) | ||||||||||||||||||||||||||||||||||||||||||||||||||||||||||||||||||||||||||||||||||||||||||||||||||||||||||
From net realized gain | (1.91 | ) | (0.18 | ) | — | — | — | — | ||||||||||||||||||||||||||||||||||||||||||||||||||||||||||||||||||||||||||||||||||||||||||||||||||||||||||||||
Total distributions | (2.26 | ) | (0.45 | ) | (0.11 | ) | (0.18 | ) | (0.09 | ) | (0.13 | ) | ||||||||||||||||||||||||||||||||||||||||||||||||||||||||||||||||||||||||||||||||||||||||||||||||||||||||||
Net asset value, end of period | $24.17 | $22.72 | $21.71 | $17.96 | $16.82 | $20.14 | ||||||||||||||||||||||||||||||||||||||||||||||||||||||||||||||||||||||||||||||||||||||||||||||||||||||||||||||||
Total return (%)3 | 18.76 | 4 | 6.79 | 21.57 | 8.01 | (16.12 | ) | 17.61 | ||||||||||||||||||||||||||||||||||||||||||||||||||||||||||||||||||||||||||||||||||||||||||||||||||||||||||||||
Ratios and supplemental data | ||||||||||||||||||||||||||||||||||||||||||||||||||||||||||||||||||||||||||||||||||||||||||||||||||||||||||||||||||||||
Net assets, end of period (in millions) | $6 | $4 | $1 | $1 | $2 | $3 | ||||||||||||||||||||||||||||||||||||||||||||||||||||||||||||||||||||||||||||||||||||||||||||||||||||||||||||||||
Ratios (as a percentage of average net assets): | ||||||||||||||||||||||||||||||||||||||||||||||||||||||||||||||||||||||||||||||||||||||||||||||||||||||||||||||||||||||
Expenses before reductions | 1.69 | 5 | 2.14 | 2.79 | 2.74 | 2.02 | 1.83 | |||||||||||||||||||||||||||||||||||||||||||||||||||||||||||||||||||||||||||||||||||||||||||||||||||||||||||||||
Expenses including reductions | 1.34 | 5 | 1.34 | 1.31 | 1.39 | 1.53 | 1.57 | |||||||||||||||||||||||||||||||||||||||||||||||||||||||||||||||||||||||||||||||||||||||||||||||||||||||||||||||
Net investment income (loss) | (0.94 | ) 5,6 | 2.02 | 0.85 | 0.73 | 0.87 | 0.08 | |||||||||||||||||||||||||||||||||||||||||||||||||||||||||||||||||||||||||||||||||||||||||||||||||||||||||||||||
Portfolio turnover (%) | 56 | 123 | 93 | 132 | 145 | 71 |
1 | Six months ended 4-30-15. Unaudited. | |||||||||||||||||||||||||||||||||||||
2 | Based on average daily shares outstanding. | |||||||||||||||||||||||||||||||||||||
3 | Total returns would have been lower had certain expenses not been reduced during the applicable periods. | |||||||||||||||||||||||||||||||||||||
4 | Not annualized. | |||||||||||||||||||||||||||||||||||||
5 | Annualized. | |||||||||||||||||||||||||||||||||||||
6 | Recognition of net investment income by the fund is affected by the timing and frequency of the declaration of dividends by the securities in which the fund invests. |
Class NAV Shares Period ended | 4-30-15 | 1 | 10-31-14 | 10-31-13 | 10-31-12 | 10-31-11 | 10-31-10 | |||||||||||||||||||||||||||||||||||||||||||||||||||||||||||||||||||||||||||||||||||||||||||||||||||||||||||||||
Per share operating performance | ||||||||||||||||||||||||||||||||||||||||||||||||||||||||||||||||||||||||||||||||||||||||||||||||||||||||||||||||||||||
Net asset value, beginning of period | $22.98 | $21.95 | $18.18 | $17.07 | $20.42 | $17.47 | ||||||||||||||||||||||||||||||||||||||||||||||||||||||||||||||||||||||||||||||||||||||||||||||||||||||||||||||||
Net investment income (loss)2 | (0.09 | ) | 0.62 | 0.23 | 0.15 | 0.26 | 0.20 | |||||||||||||||||||||||||||||||||||||||||||||||||||||||||||||||||||||||||||||||||||||||||||||||||||||||||||||||
Net realized and unrealized gain (loss) on investments | 3.86 | 0.87 | 3.67 | 1.21 | (3.47 | ) | 2.96 | |||||||||||||||||||||||||||||||||||||||||||||||||||||||||||||||||||||||||||||||||||||||||||||||||||||||||||||||
Total from investment operations | 3.77 | 1.49 | 3.90 | 1.36 | (3.21 | ) | 3.16 | |||||||||||||||||||||||||||||||||||||||||||||||||||||||||||||||||||||||||||||||||||||||||||||||||||||||||||||||
Less distributions | ||||||||||||||||||||||||||||||||||||||||||||||||||||||||||||||||||||||||||||||||||||||||||||||||||||||||||||||||||||||
From net investment income | (0.36 | ) | (0.28 | ) | (0.13 | ) | (0.25 | ) | (0.14 | ) | (0.21 | ) | ||||||||||||||||||||||||||||||||||||||||||||||||||||||||||||||||||||||||||||||||||||||||||||||||||||||||||
From net realized gain | (1.91 | ) | (0.18 | ) | — | — | — | — | ||||||||||||||||||||||||||||||||||||||||||||||||||||||||||||||||||||||||||||||||||||||||||||||||||||||||||||||
Total distributions | (2.27 | ) | (0.46 | ) | (0.13 | ) | (0.25 | ) | (0.14 | ) | (0.21 | ) | ||||||||||||||||||||||||||||||||||||||||||||||||||||||||||||||||||||||||||||||||||||||||||||||||||||||||||
Net asset value, end of period | $24.48 | $22.98 | $21.95 | $18.18 | $17.07 | $20.42 | ||||||||||||||||||||||||||||||||||||||||||||||||||||||||||||||||||||||||||||||||||||||||||||||||||||||||||||||||
Total return (%)3 | 18.84 | 4 | 6.88 | 21.53 | 8.20 | (15.82 | ) | 18.17 | ||||||||||||||||||||||||||||||||||||||||||||||||||||||||||||||||||||||||||||||||||||||||||||||||||||||||||||||
Ratios and supplemental data | ||||||||||||||||||||||||||||||||||||||||||||||||||||||||||||||||||||||||||||||||||||||||||||||||||||||||||||||||||||||
Net assets, end of period (in millions) | $14 | $12 | $1 | $1 | $1 | $1 | ||||||||||||||||||||||||||||||||||||||||||||||||||||||||||||||||||||||||||||||||||||||||||||||||||||||||||||||||
Ratios (as a percentage of average net assets): | ||||||||||||||||||||||||||||||||||||||||||||||||||||||||||||||||||||||||||||||||||||||||||||||||||||||||||||||||||||||
Expenses before reductions | 1.27 | 5 | 1.25 | 1.28 | 1.24 | 1.14 | 1.11 | |||||||||||||||||||||||||||||||||||||||||||||||||||||||||||||||||||||||||||||||||||||||||||||||||||||||||||||||
Expenses including reductions | 1.25 | 5 | 1.24 | 1.27 | 1.24 | 1.14 | 1.11 | |||||||||||||||||||||||||||||||||||||||||||||||||||||||||||||||||||||||||||||||||||||||||||||||||||||||||||||||
Net investment income (loss) | (0.84 | ) 5,6 | 2.80 | 1.12 | 0.87 | 1.30 | 1.08 | |||||||||||||||||||||||||||||||||||||||||||||||||||||||||||||||||||||||||||||||||||||||||||||||||||||||||||||||
Portfolio turnover (%) | 56 | 123 | 93 | 132 | 145 | 71 |
1 | Six months ended 4-30-15. Unaudited. | |||||||||||||||||||||||||||||||||||||
2 | Based on average daily shares outstanding. | |||||||||||||||||||||||||||||||||||||
3 | Total returns would have been lower had certain expenses not been reduced during the applicable periods. | |||||||||||||||||||||||||||||||||||||
4 | Not annualized. | |||||||||||||||||||||||||||||||||||||
5 | Annualized. | |||||||||||||||||||||||||||||||||||||
6 | Recognition of net investment income by the fund is affected by the timing and frequency of the declaration of dividends by the securities in which the fund invests. |
Note 1 — Organization
John Hancock Greater China Opportunities Fund (the fund) is a series of John Hancock Investment Trust III (the Trust), an open-end management investment company organized as a Massachusetts business trust and registered under the Investment Company Act of 1940, as amended (the 1940 Act). The investment objective of the fund is to seek long-term capital appreciation.
The fund may offer multiple classes of shares. The shares currently offered are detailed in the Statement of assets and liabilities. Class A and Class C shares are offered to all investors. Class B shares are closed to new investors. Class I shares are offered to institutions and certain investors. Class NAV shares are offered to John Hancock affiliated funds of funds and certain 529 plans. Shareholders of each class have exclusive voting rights to matters that affect that class. The distribution and service fees, if any, and transfer agent fees, state registration fees and printing and postage for each class may differ. Class B shares convert to Class A shares eight years after purchase.
Note 2 — Significant accounting policies
The financial statements have been prepared in conformity with accounting principles generally accepted in the United States of America (US GAAP), which require management to make certain estimates and assumptions as of the date of the financial statements. Actual results could differ from those estimates and those differences could be significant. The fund qualifies as an investment company under Topic 946 of Accounting Standards Codification of US GAAP.
Events or transactions occurring after the end of the fiscal period through the date that the financial statements were issued have been evaluated in the preparation of the financial statements. The following summarizes the significant accounting policies of the fund:
Security valuation. Investments are stated at value as of the close of regular trading on the New York Stock Exchange (NYSE), normally at 4:00 p.m., Eastern Time. In order to value the securities, the fund uses the following valuation techniques: Equity securities held by the fund are valued at the last sale price or official closing price on the exchange where the security was acquired or most likely will be sold. In the event there were no sales during the day or closing prices are not available, the securities are valued using the last available bid price. Foreign securities and currencies are valued in U.S. dollars, based on foreign currency exchange rates supplied by an independent pricing vendor.
Other portfolio securities and assets, for which reliable market quotations are not readily available, are valued at fair value as determined in good faith by the fund's Pricing Committee following procedures established by the Board of Trustees. The frequency with which these fair valuation procedures are used cannot be predicted and fair value of securities may differ significantly from the value that would have been used had a ready market for such securities existed. Trading in foreign securities may be completed before the daily close of trading on the NYSE. Significant events at the issuer or market level may affect the values of securities between the time when the valuation of the securities is generally determined and the close of the NYSE. If a significant event occurs, these securities may be fair valued, as determined in good faith by the fund's Pricing Committee, following procedures established by the Board of Trustees. The fund uses fair value adjustment factors provided by an independent pricing vendor to value certain foreign securities in order to adjust for events that may occur between the close of foreign exchanges or markets and the close of the NYSE.
The fund uses a three-tier hierarchy to prioritize the pricing assumptions, referred to as inputs, used in valuation techniques to measure fair value. Level 1 includes securities valued using quoted prices in active markets for identical securities. Level 2 includes securities valued using other significant observable inputs. Observable inputs may include quoted prices for similar securities, interest rates, prepayment speeds and credit risk. Prices for securities valued using these inputs are received from independent pricing vendors and brokers and are based on an evaluation of the inputs described. Level 3 includes securities valued using significant unobservable inputs when market prices are not readily available or reliable, including the fund's own assumptions in determining the fair value of investments. Factors used in determining value may include market or issuer specific events or trends, changes in interest rates and credit quality. The inputs or methodology used for valuing securities are not necessarily an indication of the risks associated with investing in those securities. Changes in valuation techniques may result in transfers into or out of an assigned level within the disclosure hierarchy.
23
The following is a summary of the values by input classification of the fund's investments as of April 30, 2015, by major security category or type:
Total market value at 4-30-15 | Level 1 quoted price | Level 2 significant observable inputs | Level 3 significant unobservable inputs | ||
Common stocks | |||||
China | $38,639,526 | $1,276,634 | $35,905,737 | $1,457,155 | |
Hong Kong | 27,696,753 | — | 27,696,753 | — | |
Macau | 518,517 | — | 518,517 | — | |
Taiwan | 20,766,288 | — | 20,766,288 | — | |
Total investments in securities | $87,621,084 | $1,276,634 | $84,887,295 | $1,457,155 |
The following is a reconciliation of Level 3 assets for which significant unobservable inputs were used to determine fair value. Transfers into or out of Level 3 represent the beginning value of any security or instrument where a change in the level has occurred from the beginning to the end of the period and in all cases were transferred into or out of Level 2. Securities were transferred into Level 3 because of a lack of observable market data which resulted from an absence of market activity for these securities. In addition, securities were transferred from Level 3 since observable market data became available due to the increased market activity of these securities.
Investments in securities | Common stocks | ||||
Balance as of 10-31-14 | — | ||||
Realized gain (loss) | — | ||||
Change in unrealized appreciation (depreciation) | ($627,266 | ) | |||
Purchases | 152,662 | ||||
Sales | — | ||||
Transfers into Level 3 | 1,931,759 | ||||
Transfers out of Level 3 | — | ||||
Balance as of 4-30-15 | $1,457,155 | ||||
Change in unrealized at period end* | ($627,266 | ) |
* Change in unrealized appreciation (depreciation) attributable to Level 3 securities held at the period end. This balance is included in the change in unrealized appreciation (depreciation) on the Statement of operations.
The valuation techniques and significant amounts of unobservable inputs used in the fair value measurement of the fund's Level 3 securities are outlined in the table below:
Fair value at 4-30-15 | Valuation technique | Unobservable Inputs | Input/Range | ||
Common Stocks | $1,066,763 | Market Approach | Prior / recent transactions | $5.20 | |
390,392 | Market Approach | Prior / recent transactions Discount for lack of marketability | $0.90 35% | ||
$1,457,155 |
A change to unobservable inputs of the fund's Level 3 securities may result in changes to the fair value measurement, as follows:
Unobservable input | Impact to valuation if input increases | Impact to valuation if input decreases |
Prior / recent transactions | Increase | Decrease |
Discount for lack of marketability | Decrease | Increase |
24
Security transactions and related investment income. Investment security transactions are accounted for on a trade date plus one basis for daily net asset value calculations. However, for financial reporting purposes, investment transactions are reported on trade date. Dividend income is recorded on the ex-date, except for dividends of foreign securities where the dividend may not be known until after the ex-date. In those cases, dividend income, net of withholding taxes, is recorded when the fund becomes aware of the dividends. Foreign taxes are provided for based on the fund's understanding of the tax rules and rates that exist in the foreign markets in which it invests. Gains and losses on securities sold are determined on the basis of identified cost and may include proceeds from litigation.
Foreign currency translation. Assets, including investments and liabilities denominated in foreign currencies, are translated into U.S. dollar values each day at the prevailing exchange rate. Purchases and sales of securities, income and expenses are translated into U.S. dollars at the prevailing exchange rate on the date of the transaction. The effect of changes in foreign currency exchange rates on the value of securities is reflected as a component of the realized and unrealized gains (losses) on investments.
Funds that invest internationally generally carry more risk than funds that invest strictly in U.S. securities. These risks are heightened for investments in emerging markets. Funds investing in a single country or in a limited geographic region tend to be riskier than funds that invest more broadly. Risks can result from differences in economic and political conditions, regulations, market practices (including higher transaction costs), accounting standards and other factors. Foreign investments are also subject to a decline in the value of a foreign currency versus the U.S. dollar, which reduces the dollar value of securities denominated in that currency.
Foreign taxes. The fund may be subject to withholding tax on income and/or capital gains or repatriation taxes imposed by certain countries in which the fund invests. Taxes are accrued based upon investment income, realized gains or unrealized appreciation.
Line of credit. The fund may borrow from banks for temporary or emergency purposes, including meeting redemption requests that otherwise might require the untimely sale of securities. Pursuant to the fund's custodian agreement, the custodian may loan money to the fund to make properly authorized payments. The fund is obligated to repay the custodian for any overdraft, including any related costs or expenses. The custodian may have a lien, security interest or security entitlement in any fund property that is not otherwise segregated or pledged, to the maximum extent permitted by law, to the extent of any overdraft.
In addition, the fund and other affiliated funds have entered into an agreement with Citibank N.A. that enables them to participate in a $300 million unsecured committed line of credit. A commitment fee, payable at the end of each calendar quarter, based on the average daily unused portion of the line of credit, is charged to each participating fund on a pro rata basis and is reflected in other expenses on the Statement of operations. Commitment fees for the six months ended April 30, 2015 were $243. For the six months ended April 30, 2015, the fund had no borrowings under the line of credit.
Expenses. Within the John Hancock group of funds complex, expenses that are directly attributable to an individual fund are allocated to such fund. Expenses that are not readily attributable to a specific fund are allocated among all funds in an equitable manner, taking into consideration, among other things, the nature and type of expense and the fund's relative net assets. Expense estimates are accrued in the period to which they relate and adjustments are made when actual amounts are known.
Class allocations. Income, common expenses and realized and unrealized gains (losses) are determined at the fund level and allocated daily to each class of shares based on the net assets of the class. Class-specific expenses, such as distribution and service fees, if any and transfer agent fees, for all classes, are calculated daily at the class level based on the net assets of each class and the specific expense rates applicable to each class. Through February 28, 2015, class-specific expenses, such as state registration fees and printing and postage, for all classes, were calculated daily at the class level based on the net assets of each class and the specific expense rates applicable to each class.
25
Federal income taxes. The fund intends to continue to qualify as a regulated investment company by complying with the applicable provisions of the Internal Revenue Code and will not be subject to federal income tax on taxable income that is distributed to shareholders. Therefore, no federal income tax provision is required.
As of October 31, 2014, the fund had no uncertain tax positions that would require financial statement recognition, derecognition or disclosure. The fund's federal tax returns are subject to examination by the Internal Revenue Service for a period of three years.
Distribution of income and gains. Distributions to shareholders from net investment income and net realized gains, if any, are recorded on the ex-date. The fund generally declares and pays dividends and capital gain distributions, if any, annually.
Distributions paid by the fund with respect to each class of shares are calculated in the same manner, at the same time and in the same amount, except for the effect of class level expenses that may be applied differently to each class.
Such distributions, on a tax basis, are determined in conformity with income tax regulations, which may differ from US GAAP.
Capital accounts within the financial statements are adjusted for permanent book-tax differences. These adjustments have no impact on net assets or the results of operations. Temporary book-tax differences, if any, will reverse in a subsequent period. Book-tax differences are primarily attributable to foreign currency transactions, investments in passive foreign investment companies and wash sale loss deferrals.
Note 3 — Guarantees and indemnifications
Under the Trust's organizational documents, its Officers and Trustees are indemnified against certain liabilities arising out of the performance of their duties to the Trust, including the fund. Additionally, in the normal course of business, the fund enters into contracts with service providers that contain general indemnification clauses. The fund's maximum exposure under these arrangements is unknown, as this would involve future claims that may be made against the fund that have not yet occurred. The risk of material loss from such claims is considered remote.
Note 4 — Fees and transactions with affiliates
John Hancock Advisers, LLC (the Advisor) serves as investment advisor for the fund. John Hancock Funds, LLC (the Distributor), an affiliate of the Advisor, serves as principal underwriter of the fund. The Advisor and the Distributor are indirect, wholly owned subsidiaries of Manulife Financial Corporation (MFC).
Management fee. The fund has an investment management agreement with the Advisor under which the fund pays a monthly management fee to the Advisor equivalent, on an annual basis, to the sum of: (a) 1.00% of the first $1 billion of the fund's average daily net assets; (b) 0.95% of the next $1 billion of the fund's average daily net assets and (c) 0.90% of the fund's average daily net assets in excess of $2 billion. The Advisor has a subadvisory agreement with John Hancock Asset Management a division of Manulife Asset Management (North America) Limited, an indirectly owned subsidiary of MFC and an affiliate of the Advisor. The fund is not responsible for payment of the subadvisory fees.
The Advisor has contractually agreed to waive a portion of its management fee and/or reimburse expenses for certain funds of the John Hancock funds complex, including the fund (the participating portfolios). This waiver is based upon aggregate net assets of all the participating portfolios. The amount of the reimbursement is calculated daily and allocated among all the participating portfolios in proportion to the daily net assets of each fund. During the six months ended April 30, 2015, this waiver amounted to 0.01% of the fund's average net assets. This arrangement may be amended or terminated at any time by the Advisor upon notice to the funds and with approval of the Board of Trustees.
The Advisor has contractually agreed to reduce its management fee or, if necessary, make payment to Class I shares to limit expenses for the class, to the extent that expense exceed 1.34% of average annual assets of the class. Expenses exclude taxes, brokerage commission, interest expense, acquired fund fees and expenses paid indirectly, litigation and indemnification expenses and other extraordinary expenses not incurred in the ordinary course of the fund's business, and
26
short dividend expense. The current limitation expires on February 29, 2016, unless renewed by mutual agreement of the fund and the Advisor based upon a determination that this is appropriate under the circumstances at that time.
Effective March 1, 2015, the Advisor has contractually agreed to reduce its management fee for the fund, or if necessary, make payment to the fund, in an amount equal to the amount by which the fund's expenses exceed 0.30% of average annual net assets, on an annualized basis. Expenses means all the expense of the fund, excluding taxes, brokerage commissions, interest expense, litigation and indemnification expenses and other extraordinary expenses not incurred in the ordinary course of the fund's business, advisory fees, Rule 12b-1 fees, transfer agent fees and services fees, borrowing costs, prime brokerage fees, acquired fund fees and expense paid indirectly, and short dividend expense. The current limitation will continue in effect until February 29, 2016, unless renewed by mutual agreement of the fund and Advisor based upon a determination of that this is appropriate under the circumstances at the time.
Prior to March 1, 2015, the Advisor had contractually agreed to waive and/or reimburse all class specific expenses for Class B shares of the fund, including Rule 12b-1 fees and transfer agency fees and service fees, as applicable, to the extent they exceeded 1.30% of average annual net assets attributable to Class B shares.
For the six months ended April 30, 2015, these expense reductions described above amounted to the following:
Class | Expense reduction | Class | Expense reduction | |
Class A | $3,590 | Class I | $7,144 | |
Class B | 3,713 | Class NAV | 962 | |
Class C | 690 | Total | $16,099 |
The investment management fees, including the impact of the waivers and reimbursements as described above, incurred for the six months ended April 30, 2015 were equivalent to a net annual effective rate of 0.96% of the fund's average daily net assets.
Accounting and legal services. Pursuant to the Accounting and Legal Services Agreement the fund reimburses the Advisor for all expenses associated with providing the administrative, financial, legal, accounting and recordkeeping services to the fund, including the preparation of all tax returns, periodic reports to shareholders and regulatory reports, among other services. These expenses are allocated to each share class based on its relative net assets at the time the expense was incurred. These accounting and legal services fees incurred for the six months ended April 30, 2015, amounted to an annual rate of 0.01% of the fund's average daily net assets.
Distribution and service plans. The fund has a distribution agreement with the Distributor. The fund has adopted distribution and service plans with respect to Class A, Class B and Class C shares pursuant to Rule 12b-1 under the 1940 Act, to pay the Distributor for services provided as the distributor of shares of the fund. The fund may pay up to the following contractual rates of distribution and service fees under these arrangements, expressed as an annual percentage of average daily net assets for each class of the fund's shares.
Class | Rule 12b-1 fee |
Class A | 0.30% |
Class B | 1.00% |
Class C | 1.00% |
Sales charges. Class A shares are assessed up-front sales charges, which resulted in payments to the Distributor amounting to $18,992 for the six months ended April 30, 2015. Of this amount, $3,110 was retained and used for printing prospectuses, advertising, sales literature and other purposes, $14,828 was paid as sales commissions to broker-dealers and $1,054 was paid as sales commissions to sales personnel of Signator Investors, Inc., a broker-dealer affiliate of the Advisor.
Class A, Class B and Class C shares may be subject to contingent deferred sales charges (CDSCs). Certain Class A shares that are acquired through purchases of $1 million or more and are redeemed within one year of purchase are subject to a 1.00% sales charge. Class B shares that are redeemed within six years of purchase are subject to CDSCs, at declining rates,
27
beginning at 5.00%. Class C shares that are redeemed within one year of purchase are subject to a 1.00% CDSC. CDSCs are applied to the lesser of the current market value at the time of redemption or the original purchase cost of the shares being redeemed. Proceeds from CDSCs are used to compensate the Distributor for providing distribution-related services in connection with the sale of these shares. During the six months ended April 30, 2015, CDSCs received by the Distributor amounted to $35, $3,431 and $212 for Class A, Class B and Class C shares, respectively.
Transfer agent fees. The fund has a transfer agent agreement with John Hancock Signature Services, Inc. (Signature Services), an affiliate of the Advisor. The transfer agent fees paid to Signature Services are determined based on the cost to Signature Services (Signature Services Cost) of providing recordkeeping services. The Signature Services Cost includes a component of allocated John Hancock corporate overhead for providing transfer agent services to the fund and to all other John Hancock affiliated funds. It also includes out-of-pocket expenses, including payments made to third-parties for recordkeeping services provided to their clients who invest in one or more John Hancock funds. In addition, Signature Services Cost may be reduced by certain fees that Signature Services receives in connection with retirement and small accounts. Signature Services Cost is calculated monthly and allocated, as applicable, to five categories of share classes: Retail Share and Institutional Share Classes of Non-Municipal Bond Funds, Class R6 Shares, Retirement Share Classes and Municipal Bond Share Classes. Within each of these categories, the applicable costs are allocated to the affected John Hancock affiliated funds and/or classes, based on the relative average daily net assets.
Class level expenses. Class level expenses for the six months ended April 30, 2015 were:
Class | Distribution and service fees | Transfer agent fees | State registration fees | Printing and postage |
Class A | $70,399 | $28,126 | $5,653 | $3,916 |
Class B | 18,175 | 2,136 | 5,525 | 659 |
Class C | 44,818 | 5,365 | 5,525 | 955 |
Class I | — | 2,152 | 6,093 | 278 |
Class NAV | — | — | — | — |
Total | $133,392 | $37,779 | $22,796 | $5,808 |
Effective March 1, 2015, state registrations fees and printing and postage are treated as fund level expenses and are not included in the table above. For the period March 1, 2015 to April 30, 2015, state registration fees and printing and postage amounted to $10,098 and $3,174, respectively.
Trustee expenses. The fund compensates each Trustee who is not an employee of the Advisor or its affiliates. The costs of paying Trustee compensation and expenses are allocated to each fund based on its net assets relative to other funds within the John Hancock group of funds complex.
Note 5 — Fund share transactions
Transactions in fund shares for the six months ended April 30, 2015 and for the year ended October 31, 2014 were as follows:
Six months ended 4-30-15 | Year ended 10-31-14 | |||||||||||||||||||||||||
Shares | Amount | Shares | Amount | |||||||||||||||||||||||
Class A shares | ||||||||||||||||||||||||||
Sold | 249,378 | $5,616,632 | 423,854 | $9,505,011 | ||||||||||||||||||||||
Distributions reinvested | 218,197 | 4,259,199 | 31,480 | 690,666 | ||||||||||||||||||||||
Repurchased | (295,464 | ) | (6,441,373 | ) | (507,463 | ) | (11,254,939 | ) | ||||||||||||||||||
Net increase (decrease) | 172,111 | $3,434,458 | (52,129 | ) | ($1,059,262 | ) |
28
Six months ended 4-30-15 | Year ended 10-31-14 | |||||||||||||||||||||||||
Shares | Amount | Shares | Amount | |||||||||||||||||||||||
Class B shares | ||||||||||||||||||||||||||
Sold | 2,144 | $46,604 | 3,418 | $73,910 | ||||||||||||||||||||||
Distributions reinvested | 17,493 | 330,973 | 2,566 | 54,723 | ||||||||||||||||||||||
Repurchased | (94,137 | ) | (1,969,459 | ) | (159,719 | ) | (3,415,247 | ) | ||||||||||||||||||
Net decrease | (74,500 | ) | ($1,591,882 | ) | (153,735 | ) | ($3,286,614 | ) | ||||||||||||||||||
Class C shares | ||||||||||||||||||||||||||
Sold | 37,093 | $783,708 | 44,713 | $960,086 | ||||||||||||||||||||||
Distributions reinvested | 35,331 | 668,812 | 3,334 | 71,082 | ||||||||||||||||||||||
Repurchased | (59,011 | ) | (1,253,006 | ) | (134,998 | ) | (2,904,809 | ) | ||||||||||||||||||
Net increase (decrease) | 13,413 | $199,514 | (86,951 | ) | ($1,873,641 | ) | ||||||||||||||||||||
Class I shares | ||||||||||||||||||||||||||
Sold | 130,504 | $2,778,729 | 134,058 | $2,976,018 | ||||||||||||||||||||||
Distributions reinvested | 11,787 | 229,129 | 847 | 18,506 | ||||||||||||||||||||||
Repurchased | (58,958 | ) | (1,239,095 | ) | (29,178 | ) | (643,007 | ) | ||||||||||||||||||
Net increase | 83,333 | $1,768,763 | 105,727 | $2,351,517 | ||||||||||||||||||||||
Class NAV shares | ||||||||||||||||||||||||||
Sold | — | — | 511,694 | $11,342,767 | ||||||||||||||||||||||
Distributions reinvested | 61,129 | $1,203,026 | 881 | 19,466 | ||||||||||||||||||||||
Repurchased | — | — | (23,883 | ) | (532,965 | ) | ||||||||||||||||||||
Net increase | 61,129 | $1,203,026 | 488,692 | $10,829,268 | ||||||||||||||||||||||
Total net increase | 255,486 | $5,013,879 | 301,604 | $6,961,268 |
Affiliates of the fund owned 100% of shares of beneficial interest of Class NAV on April 30, 2015.
Note 6 — Purchase and sale of securities
Purchases and sales of securities, other than short-term investments, amounted to $43,176,711 and $45,662,085, respectively, for the six months ended April 30, 2015.
Note 7 — Industry or sector risk
The fund may invest a large percentage of its assets in one or more particular industries or sectors of the economy. If a large percentage of the fund's assets are economically tied to a single or small number of industries or sectors of the economy, the fund will be less diversified than a more broadly diversified fund, and it may cause the fund to underperform if that industry or sector underperforms. In addition, focusing on a particular industry or sector may make the fund's net asset value more volatile. Further, a fund that invests in particular industries or sectors is particularly susceptible to the impact of market, economic, regulatory and other factors affecting those industries or sectors.
Note 8 — Investment by affiliated funds
Certain investors in the fund are affiliated funds that are managed by the Advisor and its affiliates. The affiliated funds do not invest in the fund for the purpose of exercising management or control; however, this investment may represent a significant portion of the fund's net assets. At April 30, 2015, the following fund had an affiliated ownership of 5% or more of the fund's net assets: John Hancock Funds II Lifestyle Aggressive Portfolio-16.4%.
29
Trustees James M. Oates, Chairperson Officers Andrew G. Arnott John J. Danello Francis V. Knox, Jr. Charles A. Rizzo Salvatore Schiavone | Investment advisor John Hancock Advisers, LLC Subadvisor John Hancock Asset Management a division of Manulife Asset Management (North America) Limited Principal distributor John Hancock Funds, LLC Custodian State Street Bank and Trust Company+ Transfer agent John Hancock Signature Services, Inc. Legal counsel K&L Gates LLP |
*Member of the Audit Committee
†Non-Independent Trustee
#Effective 3-10-15
+Through 5-29-15
ˆEffective 6-1-15
The fund's proxy voting policies and procedures, as well as the fund proxy voting record for the most recent twelve-month period ended June 30, are available free of charge on the Securities and Exchange Commission (SEC) website at sec.gov or on our website.
The fund's complete list of portfolio holdings, for the first and third fiscal quarters, is filed with the SEC on Form N-Q. The fund's Form N-Q is available on our website and the SEC's website, sec.gov, and can be reviewed and copied (for a fee) at the SEC's Public Reference Room in Washington, DC. Call 800-SEC-0330 to receive information on the operation of the SEC's Public Reference Room.
We make this information on your fund, as well as monthly portfolio holdings, and other fund details available on our website at jhinvestments.com or by calling 800-225-5291.
You can also contact us: | |||
800-225-5291 jhinvestments.com | Regular mail: John Hancock Signature Services, Inc. | Express mail: John Hancock Signature Services, Inc. |
30
Family of funds
DOMESTIC EQUITY FUNDS Balanced Blue Chip Growth Classic Value Disciplined Value Disciplined Value Mid Cap Equity-Income Fundamental All Cap Core Fundamental Large Cap Core Fundamental Large Cap Value Large Cap Equity New Opportunities Select Growth Small Cap Equity Small Cap Value Small Company Strategic Growth U.S. Equity U.S. Global Leaders Growth Value Equity GLOBAL AND INTERNATIONAL EQUITY FUNDS Disciplined Value International Emerging Markets Emerging Markets Equity Global Equity Global Opportunities Global Shareholder Yield Greater China Opportunities International Core International Growth International Small Company International Value Equity INCOME FUNDS Bond California Tax-Free Income Core High Yield Emerging Markets Debt Floating Rate Income Focused High Yield Global Income Government Income High Yield Municipal Bond | INCOME FUNDS (continued) Income Investment Grade Bond Money Market Short Duration Credit Opportunities Spectrum Income Strategic Income Opportunities Tax-Free Bond ALTERNATIVE AND SPECIALTY FUNDS Absolute Return Currency Alternative Asset Allocation Enduring Equity Financial Industries Global Absolute Return Strategies Global Conservative Absolute Return Natural Resources Redwood Regional Bank Seaport Technical Opportunities ASSET ALLOCATION Income Allocation Fund Lifestyle Aggressive Portfolio Lifestyle Balanced Portfolio Lifestyle Conservative Portfolio Lifestyle Growth Portfolio Lifestyle Moderate Portfolio Retirement Choices Portfolios (2010-2055) Retirement Living Portfolios (2010-2055) Retirement Living II Portfolios (2010-2055) CLOSED-END FUNDS Financial Opportunities Hedged Equity & Income Income Securities Trust Investors Trust Preferred Income Preferred Income II Preferred Income III Premium Dividend Tax-Advantaged Dividend Income Tax-Advantaged Global Shareholder Yield |
The fund's investment objectives, risks, charges, and expenses are included in the prospectus and should be considered carefully before investing. For a prospectus, contact your financial professional, call John Hancock Investments at 800-225-5291, or visit the fund's website at jhinvestments.com. Please read the prospectus carefully before investing or sending money.
John Hancock Investments
A trusted brand
John Hancock has helped individuals and institutions build and
protect wealth since 1862. Today, we are one of America's strongest
and most-recognized brands.
A better way to invest
As a manager of managers, we search the world to find proven
portfolio teams with specialized expertise for every fund we offer,
then apply vigorous investment oversight to ensure they continue
to meet our uncompromising standards.
Results for investors
Our unique approach to asset management has led to a diverse set
of investments deeply rooted in investor needs, along with strong
risk-adjusted returns across asset classes.
| John Hancock Funds, LLC n Member FINRA, SIPC 601 Congress Street n Boston, MA 02210-2805 800-225-5291 n jhinvestments.com | |
This report is for the information of the shareholders of John Hancock Greater China Opportunities Fund. It is not authorized for distribution to prospective investors unless preceded or accompanied by a prospectus. | ||
MF230735 | 08SA 4/15 6/15 |
ITEM 2. CODE OF ETHICS.
Not applicable at this time.
ITEM 3. AUDIT COMMITTEE FINANCIAL EXPERT.
Not applicable at this time.
ITEM 4. PRINCIPAL ACCOUNTANT FEES AND SERVICES.
Not applicable at this time.
ITEM 5. AUDIT COMMITTEE OF LISTED REGISTRANTS.
Not applicable at this time.
ITEM 6. SCHEDULE OF INVESTMENTS.
(a)
Not applicable.
(b) Not applicable.
ITEM 7. DISCLOSURE OF PROXY VOTING POLICIES AND PROCEDURES FOR CLOSED-END MANAGEMENT INVESTMENT COMPANIES.
Not applicable.
ITEM 8. PORTFOLIO MANAGERS OF CLOSED-END MANAGEMENT INVESTMENT COMPANIES.
Not applicable.
ITEM 9. PURCHASES OF EQUITY SECURITIES BY CLOSED-END MANAGEMENT INVESTMENT COMPANY AND AFFILIATED PURCHASERS.
Not applicable.
ITEM 10. SUBMISSION OF MATTERS TO A VOTE OF SECURITY HOLDERS.
The registrant has adopted procedures by which shareholders may recommend nominees to the registrant’s Board of Trustees. A copy of the procedures is filed as an exhibit to this Form N-CSR. See attached “John Hancock Funds – Nominating, Governance and Administration Committee Charter.”
ITEM 11. CONTROLS AND PROCEDURES.
(a) Based upon their evaluation of the registrant's disclosure controls and procedures as conducted within 90 days of the filing date of this Form N-CSR, the registrant's principal executive officer and principal financial officer have concluded that those disclosure controls and procedures provide reasonable assurance that the material information required to be disclosed by the registrant on this report is recorded, processed, summarized and reported within the time periods specified in the Securities and Exchange Commission's rules and forms.
(b) There were no changes in the registrant's internal control over financial reporting that occurred during the registrant's most recent fiscal half-year (the registrant's second fiscal half-year in the case of an annual report) that have materially affected, or are reasonably likely to materially affect, the registrant's internal control over financial reporting.
ITEM 12. EXHIBITS.
(a) Separate certifications for the registrant's principal executive officer and principal financial officer, as required by Section 302 of the Sarbanes-Oxley Act of 2002 and Rule 30a-2(a) under the Investment Company Act of 1940, are attached.
(b) Separate certifications for the registrant's principal executive officer and principal financial officer, as required by 18 U.S.C. Section 1350, as adopted pursuant to Section 906 of the Sarbanes-Oxley Act of 2002, and Rule 30a-2(b) under the Investment Company Act of 1940, are attached. The certifications furnished pursuant to this paragraph are not deemed to be "filed" for purposes of Section 18 of the Securities Exchange Act of 1934, or otherwise subject to the liability of that section. Such certifications are not deemed to be incorporated by reference into any filing under the Securities Act of 1933 or the Securities Exchange Act of 1934, except to the extent that the Registrant specifically incorporates them by reference.
(c)(1) Submission of Matters to a Vote of Security Holders is attached. See attached “John Hancock Funds – Nominating, Governance and Administration Committee Charter.”
(c)(2) Contact person at the registrant.
SIGNATURES
Pursuant to the requirements of the Securities Exchange Act of 1934 and the Investment Company Act of 1940, the registrant has duly caused this report to be signed on its behalf by the undersigned, thereunto duly authorized.
John Hancock Investment Trust III
By:
/s/ Andrew Arnott
______________________________
Andrew Arnott
President
Date: June 17, 2015
Pursuant to the requirements of the Securities Exchange Act of 1934 and the Investment Company Act of 1940, this report has been signed below by the following persons on behalf of the registrant and in the capacities and on the dates indicated.
By:
/s/ Andrew Arnott
______________________________
Andrew Arnott
President
Date: June 17, 2015
By:
/s/ Charles A. Rizzo
______________________________
Charles A. Rizzo
Chief Financial Officer
Date: June 17, 2015