UNITED STATES
SECURITIES AND EXCHANGE COMMISSION
Washington, D.C. 20549
FORM N-CSR
CERTIFIED SHAREHOLDER REPORT OF REGISTERED
MANAGEMENT INVESTMENT COMPANIES
Investment Company Act file number 811-4630
John Hancock Investment Trust III
(Exact name of registrant as specified in charter)
200 Berkeley Street, Boston, Massachusetts 02116
(Address of principal executive offices) (Zip code)
Salvatore Schiavone
Treasurer
200 Berkeley Street
Boston, Massachusetts 02116
(Name and address of agent for service)
Registrant's telephone number, including area code: 617-663-4497
| Date of fiscal year end: | October 31 |
| | |
| Date of reporting period: | October 31, 2018 |
ITEM 1. REPORTS TO STOCKHOLDERS.
John Hancock
Greater China Opportunities Fund
Annual report 10/31/18
A message to shareholders
Dear shareholder,
Financial markets around the world have experienced a meaningful rise in volatility this year, particularly when compared with the unusual calm of 2017. Announcements of new rounds of tariffs and heightened fears of a full-blown trade war with China overshadowed a period of strong economic growth in the United States.
Despite uncertainty raised by tariffs and rising inflation and interest rates, the U.S. economy has remained on track during the period. That said, in many global economies outside of the United States, growth has not been particularly strong. International investors have faced some challenging headwinds—including a populist movement in Italy and trade disputes between the United States and several other countries—that may not abate in the near future.
Your best resource in unpredictable and volatile markets is your financial advisor, who can help position your portfolio so that it's sufficiently diversified to meet your long-term objectives and to withstand the inevitable turbulence along the way.
On behalf of everyone at John Hancock Investments, I'd like to take this opportunity to welcome new shareholders and to thank existing shareholders for the continued trust you've placed in us.
Sincerely,
Andrew G. Arnott
President and CEO,
John Hancock Investments
Head of Wealth and Asset Management,
United States and Europe
This commentary reflects the CEO's views, which are subject to change at any time. Investing involves risks, including the potential loss of principal. Diversification does not guarantee a profit or eliminate the risk of a loss. It is not possible to invest directly in an index. For more up-to-date information, please visit our website at jhinvestments.com.
John Hancock
Greater China Opportunities Fund
Table of contents
| | | |
| 2 | | Your fund at a glance |
| 4 | | Discussion of fund performance |
| 8 | | A look at performance |
| 10 | | Your expenses |
| 12 | | Fund's investments |
| 14 | | Financial statements |
| 17 | | Financial highlights |
| 22 | | Notes to financial statements |
| 29 | | Report of independent registered public accounting firm |
| 30 | | Tax information |
| 31 | | Continuation of investment advisory and subadvisory agreements |
| 37 | | Trustees and Officers |
| 41 | | More information |
ANNUAL REPORT | JOHN HANCOCK GREATER CHINA OPPORTUNITIES FUND 1
INVESTMENT OBJECTIVE
The fund seeks long-term capital appreciation.
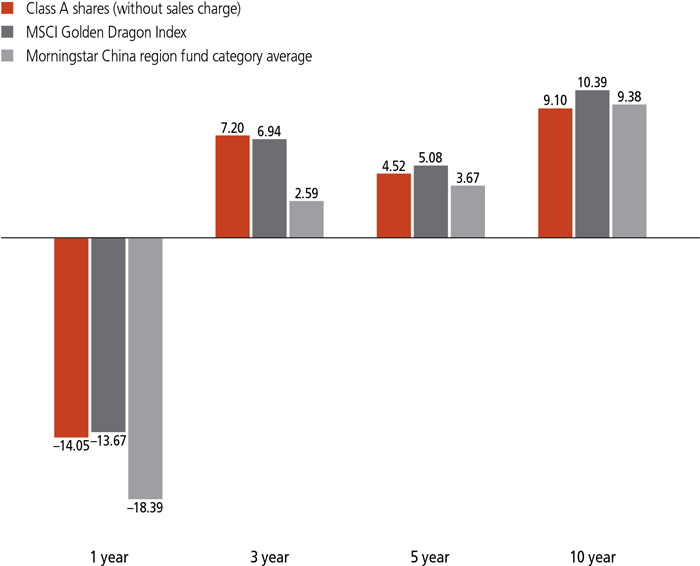
AVERAGE ANNUAL TOTAL RETURNS AS OF 10/31/18 (%)
The MSCI Golden Dragon Index is an unmanaged free float-adjusted market-capitalization-weighted index that is designed to measure equity market performance in the China region. The MSCI Golden Dragon Index captures the equity market performance of large and mid-cap China securities and non-domestic China securities listed in Hong Kong and Taiwan.
It is not possible to invest directly in an index. Index figures do not reflect expenses or sales charges, which would result in lower returns.
Figures from Morningstar, Inc. include reinvested distributions and do not take into account sales charges. Actual load-adjusted performance is lower.
The past performance shown here reflects reinvested distributions and the beneficial effect of any expense reductions, and does not guarantee future results. Performance of the other share classes will vary based on the difference in the fees and expenses of those classes. Shares will fluctuate in value and, when redeemed, may be worth more or less than their original cost. Current month-end performance may be lower or higher than the performance cited, and can be found at jhinvestments.com or by calling 800-225-5291. For further information on the fund's objectives, risks, and strategy, see the fund's prospectus.
ANNUAL REPORT | JOHN HANCOCK GREATER CHINA OPPORTUNITIES FUND 2
PERFORMANCE HIGHLIGHTS OVER THE LAST TWELVE MONTHS
A sharp decline in Chinese stocks
Increasing trade tensions, tighter lending regulations, and a slowing Chinese economy led to a decline in stock markets in the Greater China region.
The fund underperformed
The fund declined along with the region's equity markets and underperformed its benchmark, the MSCI Golden Dragon Index.
Stock selection detracted
Stock selection in the consumer discretionary and communication services sectors detracted the most from the fund's performance compared with the benchmark.
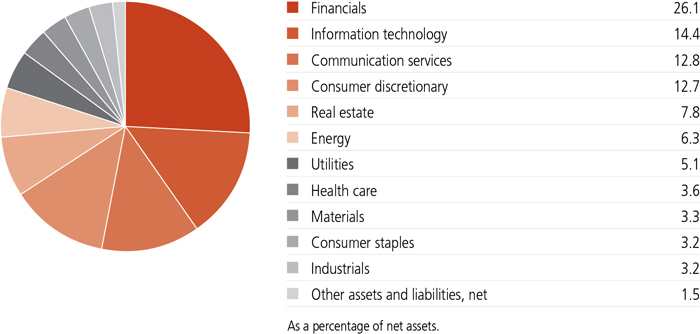
SECTOR COMPOSITION AS OF 10/31/18 (%)
A note about risks
The fund is subject to various risks as described in the fund's prospectus. For more information, please refer to the "Principal risks" section of the prospectus.
ANNUAL REPORT | JOHN HANCOCK GREATER CHINA OPPORTUNITIES FUND 3
Discussion of fund performance
An interview with Portfolio Manager Kai Kong Chay, CFA, John Hancock Asset Management a division of Manulife Asset Management (North America) Limited

Kai Kong Chay, CFA
Portfolio Manager
John Hancock Asset Management
Can you describe the economic environment in the Greater China region during the 12 months ended October 31, 2018?
The Chinese economy decelerated during the period, growing at its slowest rate in more than nine years. One contributing factor was escalating trade tensions between the United States and China, which resulted in U.S. tariffs on approximately $200 billion in Chinese imports. Although these tariffs have not yet had a meaningful direct impact on China's economic growth, the uncertainty surrounding the trade dispute had an indirect effect on the economy, as it led to a slowdown in capital spending by Chinese companies. In addition, a number of Chinese companies took steps to relocate their supply chains elsewhere in Southeast Asia, including Vietnam and Malaysia, to avoid the tariffs.
Another contributing factor to the economic slowdown in China was tighter government lending regulations, put in place to curtail off-balance-sheet lending that had become widespread in the years following the 2008 financial crisis. These regulations reduced the availability of corporate financing for private enterprise, which in turn led to weaker capital expenditures and infrastructure investment.
On the positive side, domestic consumption remained healthy during the reporting period. A reduction in personal income taxes and continued growth of a developing middle class in China contributed to a strong increase in consumer spending.
How did the stock markets in the Greater China region perform in this environment?
The region's equity markets were down sharply for the period, with the bulk of the decline occurring in the last six months as trade tensions intensified between the United States and China. Weaker-than-expected corporate earnings and a depreciating Chinese yuan also contributed to the decline in the region's stock markets.
For the period, the fund's benchmark, the MSCI Golden Dragon Index, lost 13.67%. Within the index, Taiwanese stocks declined, but held up better than those of Hong Kong and China. On a
ANNUAL REPORT | JOHN HANCOCK GREATER CHINA OPPORTUNITIES FUND 4
"The region's equity markets were down sharply for the period, with the bulk of the decline occurring in the last six months as trade tensions intensified between the United States and China."
sector basis, information technology and consumer discretionary stocks had the most significant negative impact on the index, while the energy sector contributed positively to index performance.
Turning to the fund, how would you characterize its performance?
The fund declined along with the region's equity markets and underperformed its benchmark index. Our stock selection process—which focuses on favorable growth prospects, recognized catalysts for change, and attractive valuations—produced mixed results. From a sector perspective, stock selection detracted the most in the consumer discretionary and industrials sectors.
What fund holdings detracted from performance compared with the benchmark?
One of the most significant detractors was BizLink Holding, Inc., a company largely operating in Taiwan that makes connectivity products. BizLink is the exclusive supplier of wiring harnesses to electric vehicle maker Tesla, Inc. (not held by the fund), and production delays for the Tesla 3 model weighed on BizLink's revenues and earnings during the period. Nonetheless, we continued to hold the stock, as improving production levels for Tesla should translate to better revenues and earnings for BizLink.
Another meaningful detractor was Chinese social media company Weibo Corp., which declined amid intensifying competition from other social media platforms and declining market share. Increased regulation on internet gaming also hurt advertising revenues for Weibo, as video game makers decreased their advertising on Chinese social media sites. As a result of these issues, we eliminated the stock from the portfolio during the period.
COUNTRY COMPOSITION AS OF 10/31/18 (%)
| | |
| China | 53.3 |
| Taiwan | 22.4 |
| Hong Kong | 22.4 |
| United States | 0.4 |
| Other assets and liabilities, net | 1.5 |
| TOTAL | 100.0 |
| As a percentage of net assets. | |
ANNUAL REPORT | JOHN HANCOCK GREATER CHINA OPPORTUNITIES FUND 5
"... we're emphasizing stocks that are poised to benefit from an upgrade in domestic consumption as a burgeoning middle class in China continues to expand."
One additional detractor was Taiwanese telecommunication components maker FIT Hon Teng, Ltd. Slowing sales of telecom equipment in China led to disappointing earnings for the company. However, we expect to see improving results for the company in 2019 as the rollout of 5G wireless technology picks up steam.
Shifting gears, what holdings contributed positively to performance versus the index?
Stock selection in the consumer staples sector contributed the most to relative performance, and the leading contributor in that sector was TCI Company, Ltd., a Taiwanese health food and beauty products manufacturer and distributor. A strong increase in demand for health supplements, driven primarily by e-commerce sales in China, led TCI to deliver better-than-expected earnings, which helped drive a sharp rally in its stock price.
Other strong contributors included Hong Kong biotechnology company Sino Biopharmaceutical, Ltd. and Taiwanese electronic components manufacturer Yageo Corp. Sino benefited from a strong drug development pipeline, including a new oncology drug that was introduced in mid-2018. Yageo benefited from rising prices and increased market share for many of the passive electronic components the company produces. We took profits in both stocks and eliminated them from the portfolio during the period.
One other noteworthy contributor was online video company iQIYI, Inc., which was spun off from Baidu, Inc. (also a fund holding) in early 2018.
TOP 10 HOLDINGS AS OF 10/31/18 (%)
| | |
| Taiwan Semiconductor Manufacturing Company, Ltd. | 10.0 |
| Tencent Holdings, Ltd. | 8.4 |
| Alibaba Group Holding, Ltd., ADR | 8.1 |
| China Construction Bank Corp., H Shares | 4.2 |
| Ping An Insurance Group Company of China, Ltd., H Shares | 4.2 |
| AIA Group, Ltd. | 4.0 |
| Industrial & Commercial Bank of China, Ltd., H Shares | 3.9 |
| CNOOC, Ltd. | 2.8 |
| Hong Kong Exchanges & Clearing, Ltd. | 2.4 |
| ENN Energy Holdings, Ltd. | 2.3 |
| TOTAL | 50.3 |
| As a percentage of net assets. |
| Cash and cash equivalents are not included. |
ANNUAL REPORT | JOHN HANCOCK GREATER CHINA OPPORTUNITIES FUND 6
How was the portfolio positioned as of the end of the reporting period?
The ongoing trade dispute between the United States and China is the most significant theme driving equity market performance in the Greater China region, and we don't expect this to change in the near term. On the positive side, the decline in the Chinese stock market in 2018 has pushed valuations down to levels that are attractive on a historical basis.
We continue to focus on companies that are tied primarily to the domestic Chinese economy. In particular, we're emphasizing stocks that are poised to benefit from an upgrade in domestic consumption as a burgeoning middle class in China continues to expand.
While we've increased the fund's exposure to consumer-related stocks, we've been reducing the information technology holdings, focusing primarily on upstream component manufacturers, especially in Taiwan. We believe these companies are well positioned to benefit from new innovations and a resurgence in demand.
MANAGED BY
| | |
| | Kai Kong Chay, CFA
On the fund since 2011
Investing since 1997 |
 | Ronald CC Chan, CFA
On the fund since 2011
Investing since 1995 |

The views expressed in this report are exclusively those of Kai Kong Chay, CFA, John Hancock Asset Management, and are subject to change. They are not meant as investment advice. Please note that the holdings discussed in this report may not have been held by the fund for the entire period. Portfolio composition is subject to review in accordance with the fund's investment strategy and may vary in the future. Current and future portfolio holdings are subject to risk.
ANNUAL REPORT | JOHN HANCOCK GREATER CHINA OPPORTUNITIES FUND 7
TOTAL RETURNS FOR THE PERIOD ENDED OCTOBER 31, 2018
| | | | | | | | |
Average annual total returns (%)
with maximum sales charge | | Cumulative total returns (%)
with maximum sales charge |
| | 1-year | 5-year | 10-year | | | 5-year | 10-year |
| Class A | -18.35 | 3.46 | 8.54 | | | 18.52 | 126.98 |
| Class B | -18.73 | 3.40 | 8.26 | | | 18.18 | 121.07 |
| Class C | -15.45 | 3.74 | 8.27 | | | 20.13 | 121.28 |
| Class I1 | -13.70 | 4.90 | 9.42 | | | 27.02 | 145.97 |
| Class NAV1 | -13.66 | 4.96 | 9.66 | | | 27.41 | 151.41 |
| Index† | -13.67 | 5.08 | 10.39 | | | 28.14 | 168.62 |
Performance figures assume all distributions have been reinvested. Figures reflect maximum sales charges on Class A shares of 5%, and the applicable contingent deferred sales charge (CDSC) on Class B and Class C shares. The Class B shares' CDSC declines annually between years 1 to 6 according to the following schedule: 5%, 4%, 3%, 3%, 2%, 1%. No sales charge will be assessed after the sixth year. Class C shares held for less than one year are subject to a 1% CDSC. Sales charges are not applicable to Class I and Class NAV shares.
The expense ratios of the fund, both net (including any fee waivers and/or expense limitations) and gross (excluding any fee waivers and/or expense limitations), are set forth according to the most recent publicly available prospectuses for the fund and may differ from those disclosed in the Financial highlights tables in this report. Net expenses reflect contractual expense limitations in effect until February 28, 2019 and are subject to change. Had the contractual fee waivers and expense limitations not been in place, gross expenses would apply. The expense ratios are as follows:
| | | | | | |
| | Class A | Class B | Class C | Class I | Class NAV |
| Gross (%) | 1.86 | 2.56 | 2.56 | 1.55 | 1.44 |
| Net (%) | 1.72 | 2.42 | 2.42 | 1.34 | 1.30 |
Please refer to the most recent prospectus and annual or semiannual report for more information on expenses and any expense limitation arrangements for each class.
The returns reflect past results and should not be considered indicative of future performance. The return and principal value of an investment will fluctuate so that shares, when redeemed, may be worth more or less than their original cost. Due to market volatility and other factors, the fund's current performance may be higher or lower than the performance shown. For current to the most recent month-end performance data, please call 800-225-5291 or visit the fund's website at jhinvestments.com.
The performance table above and the chart on the next page do not reflect the deduction of taxes that a shareholder would pay on fund distributions or the redemption of fund shares. The fund's performance results reflect any applicable fee waivers or expense reductions, without which the expenses would increase and results would have been less favorable.
| † | Index is the MSCI Golden Dragon Index. |
See the following page for footnotes.
ANNUAL REPORT | JOHN HANCOCK GREATER CHINA OPPORTUNITIES FUND 8
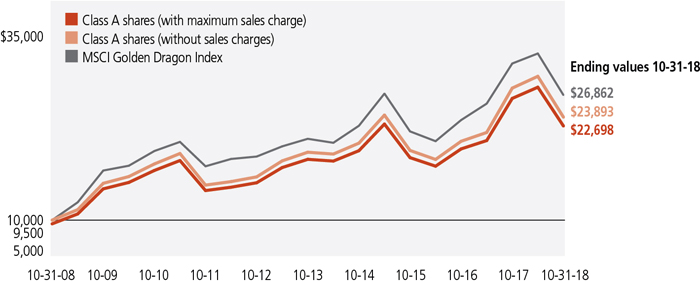
This chart and table show what happened to a hypothetical $10,000 investment in John Hancock Greater China Opportunities Fund for the share classes and periods indicated, assuming all distributions were reinvested. For comparison, we've shown the same investment in the MSCI Golden Dragon Index.
| | | | | |
| | Start date | With maximum
sales charge ($) | Without
sales charge ($) | Index ($) |
| Class B2 | 10-31-08 | 22,107 | 22,107 | 26,862 |
| Class C2 | 10-31-08 | 22,128 | 22,128 | 26,862 |
| Class I1 | 10-31-08 | 24,597 | 24,597 | 26,862 |
| Class NAV1 | 10-31-08 | 25,141 | 25,141 | 26,862 |
The MSCI Golden Dragon Index is an unmanaged free float-adjusted market capitalization index that is designed to measure equity market performance in the China region. The MSCI Golden Dragon Index captures the equity market performance of large and mid-cap China securities and non-domestic China securities listed in Hong Kong and Taiwan.
It is not possible to invest directly in an index. Index figures do not reflect expenses or sales charges, which would result in lower returns.
Footnotes related to performance pages
| 1 | For certain types of investors, as described in the fund's prospectuses. |
| 2 | The contingent deferred sales charge is not applicable. |
ANNUAL REPORT | JOHN HANCOCK GREATER CHINA OPPORTUNITIES FUND 9
These examples are intended to help you understand your ongoing operating expenses of investing in the fund so you can compare these costs with the ongoing costs of investing in other mutual funds.
Understanding fund expenses
As a shareholder of the fund, you incur two types of costs:
■Transaction costs, which include sales charges (loads) on purchases or redemptions (varies by share class), minimum account fee charge, etc.
■Ongoing operating expenses, including management fees, distribution and service fees (if applicable), and other fund expenses.
We are presenting only your ongoing operating expenses here.
Actual expenses/actual returns
The first line of each share class in the table on the following page is intended to provide information about the fund’s actual ongoing operating expenses, and is based on the fund’s actual return. It assumes an account value of $1,000.00 on May 1, 2018, with the same investment held until October 31, 2018.
Together with the value of your account, you may use this information to estimate the operating expenses that you paid over the period. Simply divide your account value at October 31, 2018, by $1,000.00, then multiply it by the “expenses paid” for your share class from the table. For example, for an account value of $8,600.00, the operating expenses should be calculated as follows:
Hypothetical example for comparison purposes
The second line of each share class in the table on the following page allows you to compare the fund’s ongoing operating expenses with those of any other fund. It provides an example of the fund’s hypothetical account values and hypothetical expenses based on each class’s actual expense ratio and an assumed 5% annualized return before expenses (which is not the class’s actual return). It assumes an account value of $1,000.00 on May 1, 2018, with the same investment held until October 31, 2018. Look in any other fund shareholder report to find its hypothetical example and you will be able to compare these expenses. Please remember that these hypothetical account values and expenses may not be used to estimate the actual ending account balance or expenses you paid for the period.
Remember, these examples do not include any transaction costs, therefore, these examples will not help you to determine the relative total costs of owning different funds. If transaction costs were included, your expenses would have been higher. See the prospectuses for details regarding transaction costs.
| 10 | JOHN HANCOCK GREATER CHINA OPPORTUNITIES FUND | ANNUAL REPORT | |
SHAREHOLDER EXPENSE EXAMPLE CHART
| | | Account
value on
5-1-2018 | Ending
value on
10-31-2018 | Expenses
paid during
period ended
10-31-20181 | Annualized
expense
ratio |
| Class A | Actual expenses/actual returns | $1,000.00 | $ 813.10 | $ 7.77 | 1.70% |
| | Hypothetical example | 1,000.00 | 1,016.60 | 8.64 | 1.70% |
| Class B | Actual expenses/actual returns | 1,000.00 | 810.20 | 10.95 | 2.40% |
| | Hypothetical example | 1,000.00 | 1,013.10 | 12.18 | 2.40% |
| Class C | Actual expenses/actual returns | 1,000.00 | 810.60 | 10.91 | 2.39% |
| | Hypothetical example | 1,000.00 | 1,013.20 | 12.13 | 2.39% |
| Class I | Actual expenses/actual returns | 1,000.00 | 814.70 | 6.13 | 1.34% |
| | Hypothetical example | 1,000.00 | 1,018.50 | 6.82 | 1.34% |
| Class NAV | Actual expenses/actual returns | 1,000.00 | 815.10 | 5.90 | 1.29% |
| | Hypothetical example | 1,000.00 | 1,018.70 | 6.56 | 1.29% |
| 1 | Expenses are equal to the annualized expense ratio, multiplied by the average account value over the period, multiplied by 184/365 (to reflect the one-half year period). |
| | ANNUAL REPORT | JOHN HANCOCK GREATER CHINA OPPORTUNITIES FUND | 11 |
AS OF 10-31-18
| | | | | Shares | Value |
| Common stocks 98.5% | | | | | $47,556,976 |
| (Cost $38,457,202) | | | | | |
| China 53.3% | | | | | 25,721,654 |
| 58.com, Inc., ADR (A) | | | | 6,110 | 400,755 |
| Alibaba Group Holding, Ltd., ADR (A) | | | | 27,441 | 3,904,302 |
| Ascletis Pharma, Inc. (A)(B) | | | | 170,000 | 124,317 |
| Baidu, Inc., ADR (A) | | | | 3,038 | 577,402 |
| BeiGene, Ltd. (A) | | | | 34,000 | 294,825 |
| China Animal Healthcare, Ltd. (A)(C) | | | | 1,590,000 | 71,776 |
| China CITIC Bank Corp., Ltd., H Shares | | | | 851,000 | 527,479 |
| China Construction Bank Corp., H Shares | | | | 2,539,000 | 2,014,816 |
| China Longyuan Power Group Corp., Ltd., H Shares | | | | 588,000 | 447,470 |
| China National Building Material Company, Ltd., H Shares | | | | 972,000 | 698,834 |
| China Petroleum & Chemical Corp., H Shares | | | | 1,126,000 | 917,213 |
| CNOOC, Ltd. | | | | 805,000 | 1,370,899 |
| ENN Energy Holdings, Ltd. | | | | 129,800 | 1,107,528 |
| Fosun International, Ltd. | | | | 340,000 | 498,828 |
| Geely Automobile Holdings, Ltd. | | | | 283,000 | 545,342 |
| Greentown Service Group Company, Ltd. | | | | 592,000 | 392,812 |
| Guangzhou Baiyunshan Pharmaceutical Holdings Company, Ltd., H Shares | | | | 130,000 | 474,563 |
| Hope Education Group Company, Ltd. (A)(B) | | | | 1,776,000 | 267,240 |
| Huifu Payment, Ltd. (A)(B) | | | | 308,800 | 151,078 |
| Industrial & Commercial Bank of China, Ltd., H Shares | | | | 2,764,500 | 1,875,639 |
| iQIYI, Inc., ADR (A) | | | | 20,890 | 410,280 |
| Microport Scientific Corp. | | | | 656,000 | 783,164 |
| Minth Group, Ltd. | | | | 148,000 | 480,871 |
| New China Life Insurance Company, Ltd., H Shares | | | | 146,400 | 686,850 |
| PICC Property & Casualty Company, Ltd., H Shares | | | | 364,000 | 353,823 |
| Ping An Insurance Group Company of China, Ltd., H Shares | | | | 212,000 | 2,004,255 |
| Sinopec Engineering Group Company, Ltd., H Shares | | | | 318,500 | 296,700 |
| Tencent Holdings, Ltd. | | | | 118,000 | 4,042,593 |
| Hong Kong 22.4% | | | | | 10,799,050 |
| AIA Group, Ltd. | | | | 251,800 | 1,915,454 |
| BOC Hong Kong Holdings, Ltd. | | | | 231,000 | 864,797 |
| China Education Group Holdings, Ltd. (A) | | | | 219,000 | 263,312 |
| China Everbright Greentech, Ltd. (B) | | | | 757,000 | 545,888 |
| China Overseas Land & Investment, Ltd. | | | | 292,000 | 918,001 |
| CK Asset Holdings, Ltd. | | | | 113,080 | 735,896 |
| Galaxy Entertainment Group, Ltd. | | | | 96,000 | 521,197 |
| HKT Trust & HKT, Ltd. | | | | 299,000 | 412,371 |
| Hong Kong Exchanges & Clearing, Ltd. | | | | 44,000 | 1,171,578 |
| New World Development Company, Ltd. | | | | 511,000 | 650,076 |
| Power Assets Holdings, Ltd. | | | | 52,500 | 350,591 |
| Sun Art Retail Group, Ltd. | | | | 912,500 | 1,000,475 |
| 12 | JOHN HANCOCK GREATER CHINA OPPORTUNITIES FUND | ANNUAL REPORT | SEE NOTES TO FINANCIAL STATEMENTS |
| | | | | Shares | Value |
| Hong Kong (continued) | | | | | |
| Swire Properties, Ltd. | | | | 213,200 | $728,574 |
| Wharf Real Estate Investment Company, Ltd. | | | | 116,000 | 720,840 |
| Taiwan 22.4% | | | | | 10,846,691 |
| Asia Cement Corp. | | | | 139,000 | 147,378 |
| China Development Financial Holding Corp. | | | | 3,182,000 | 1,024,535 |
| Chunghwa Telecom Company, Ltd. | | | | 112,000 | 395,601 |
| Delta Electronics, Inc. | | | | 97,000 | 408,294 |
| Far Eastern New Century Corp. | | | | 150,000 | 150,873 |
| FIT Hon Teng, Ltd. (B) | | | | 1,335,000 | 553,606 |
| Formosa Chemicals & Fibre Corp. | | | | 209,000 | 758,473 |
| Formosa Petrochemical Corp. | | | | 189,000 | 746,130 |
| Largan Precision Company, Ltd. | | | | 2,000 | 218,527 |
| MediaTek, Inc. | | | | 49,000 | 361,945 |
| Mega Financial Holding Company, Ltd. | | | | 174,000 | 147,342 |
| Micro-Star International Company, Ltd. | | | | 45,000 | 100,245 |
| President Chain Store Corp. | | | | 23,000 | 260,180 |
| Ruentex Industries, Ltd. | | | | 60,000 | 150,763 |
| Taiwan Semiconductor Manufacturing Company, Ltd. | | | | 640,089 | 4,805,393 |
| Taiwan Union Technology Corp. | | | | 73,000 | 200,917 |
| TCI Company, Ltd. | | | | 19,561 | 274,027 |
| Vanguard International Semiconductor Corp. | | | | 77,000 | 142,462 |
| United States 0.4% | | | | | 189,581 |
| BizLink Holding, Inc. | | | | 35,432 | 189,581 |
| Total investments (Cost $38,457,202) 98.5% | | | $47,556,976 |
| Other assets and liabilities, net 1.5% | | | 710,569 |
| Total net assets 100.0% | | | | | $48,267,545 |
| The percentage shown for each investment category is the total value of the category as a percentage of the net assets of the fund. |
| Security Abbreviations and Legend |
| ADR | American Depositary Receipt |
| (A) | Non-income producing security. |
| (B) | These securities are exempt from registration under Rule 144A of the Securities Act of 1933. Such securities may be resold, normally to qualified institutional buyers, in transactions exempt from registration. |
| (C) | Security is valued using significant unobservable inputs and is classified as Level 3 in the fair value hierarchy. |
At 10-31-18, the aggregate cost of investments for federal income tax purposes was $38,457,202. Net unrealized appreciation aggregated to $9,099,774, of which $12,771,576 related to gross unrealized appreciation and $3,671,802 related to gross unrealized depreciation.
| SEE NOTES TO FINANCIAL STATEMENTS | ANNUAL REPORT | JOHN HANCOCK GREATER CHINA OPPORTUNITIES FUND | 13 |
STATEMENT OF ASSETS AND LIABILITIES 10-31-18
| Assets | |
| Unaffiliated investments, at value (Cost $38,457,202) | $47,556,976 |
| Foreign currency, at value (Cost $781,650) | 781,946 |
| Dividends and interest receivable | 10,594 |
| Receivable for fund shares sold | 9,452 |
| Receivable for investments sold | 112,755 |
| Receivable from affiliates | 283 |
| Other assets | 34,066 |
| Total assets | 48,506,072 |
| Liabilities | |
| Due to custodian | 104,812 |
| Payable for fund shares repurchased | 76,209 |
| Payable to affiliates | |
| Accounting and legal services fees | 5,704 |
| Transfer agent fees | 3,830 |
| Distribution and service fees | 10,557 |
| Trustees' fees | 148 |
| Other liabilities and accrued expenses | 37,267 |
| Total liabilities | 238,527 |
| Net assets | $48,267,545 |
| Net assets consist of | |
| Paid-in capital | $33,248,871 |
| Accumulated distributable earnings (accumulated loss) | 15,018,674 |
| Net assets | $48,267,545 |
| |
| Net asset value per share | |
| Based on net asset value and shares outstanding - the fund has an unlimited number of shares authorized with no par value | |
| Class A ($31,356,257 ÷ 1,498,713 shares)1 | $20.92 |
| Class B ($381,872 ÷ 19,158 shares)1 | $19.93 |
| Class C ($1,991,697 ÷ 99,899 shares)1 | $19.94 |
| Class I ($5,399,284 ÷ 258,623 shares) | $20.88 |
| Class NAV ($9,138,435 ÷ 431,117 shares) | $21.20 |
| Maximum offering price per share | |
| Class A (net asset value per share ÷ 95%)2 | $22.02 |
| 1 | Redemption price per share is equal to net asset value less any applicable contingent deferred sales charge. |
| 2 | On single retail sales of less than $50,000. On sales of $50,000 or more and on group sales the offering price is reduced. |
| 14 | JOHN HANCOCK Greater China Opportunities Fund | ANNUAL REPORT | SEE NOTES TO FINANCIAL STATEMENTS |
STATEMENT OF OPERATIONS For the year ended 10-31-18
| Investment income | |
| Dividends | $1,374,329 |
| Interest | 4,733 |
| Less foreign taxes withheld | (141,999) |
| Total investment income | 1,237,063 |
| Expenses | |
| Investment management fees | 634,810 |
| Distribution and service fees | 166,835 |
| Accounting and legal services fees | 13,115 |
| Transfer agent fees | 54,804 |
| Trustees' fees | 1,187 |
| Custodian fees | 58,416 |
| State registration fees | 72,187 |
| Printing and postage | 47,160 |
| Professional fees | 47,859 |
| Other | 14,276 |
| Total expenses | 1,110,649 |
| Less expense reductions | (72,269) |
| Net expenses | 1,038,380 |
| Net investment income | 198,683 |
| Realized and unrealized gain (loss) | |
| Net realized gain (loss) on | |
| Unaffiliated investments and foreign currency transactions | 6,744,117 |
| | 6,744,117 |
| Change in net unrealized appreciation (depreciation) of | |
| Unaffiliated investments and translation of assets and liabilities in foreign currencies | (14,287,928) |
| | (14,287,928) |
| Net realized and unrealized loss | (7,543,811) |
| Decrease in net assets from operations | $(7,345,128) |
| | |
| SEE NOTES TO FINANCIAL STATEMENTS | ANNUAL REPORT | JOHN HANCOCK Greater China Opportunities Fund | 15 |
STATEMENTS OF CHANGES IN NET ASSETS
| | Year ended 10-31-18
| Year ended 10-31-17
|
| Increase (decrease) in net assets | | |
| From operations | | |
| Net investment income | $198,683 | $269,264 |
| Net realized gain | 6,744,117 | 4,741,316 |
| Change in net unrealized appreciation (depreciation) | (14,287,928) | 12,171,592 |
| Increase (decrease) in net assets resulting from operations | (7,345,128) | 17,182,172 |
| Distributions to shareholders | | |
| From net investment income and net realized gain | | |
| Class A | (1,585,593) | — |
| Class B | (27,758) | — |
| Class C | (250,189) | — |
| Class I | (239,968) | — |
| Class NAV | (775,525) | — |
| From net investment income | | |
| Class A | — | (344,884) |
| Class B | — | (4,744) |
| Class C | — | (33,201) |
| Class I | — | (50,555) |
| Class NAV | — | (192,632) |
| Total distributions | (2,879,033) | (626,016) |
| From fund share transactions | (5,374,808) | (5,516,082) |
| Total increase (decrease) | (15,598,969) | 11,040,074 |
| Net assets | | |
| Beginning of year | 63,866,514 | 52,826,440 |
| End of year1 | $48,267,545 | $63,866,514 |
| 1 | Net assets - End of year includes undistributed net investment income of $266,151 in 2017. The SEC eliminated the requirement to disclose undistributed net investment income in 2018. |
| 16 | JOHN HANCOCK Greater China Opportunities Fund | ANNUAL REPORT | SEE NOTES TO FINANCIAL STATEMENTS |
| CLASS A SHARES Period ended | 10-31-18 | 10-31-17 | 10-31-16 | 10-31-15 | 10-31-14 |
| Per share operating performance | | | | | |
| Net asset value, beginning of period | $25.42 | $19.11 | $19.46 | $22.73 | $21.70 |
| Net investment income1 | 0.11 | 0.09 | 0.06 | 0.09 | 0.24 |
| Net realized and unrealized gain (loss) on investments | (3.51) | 6.45 | 1.05 | (1.18) | 1.13 |
| Total from investment operations | (3.40) | 6.54 | 1.11 | (1.09) | 1.37 |
| Less distributions | | | | | |
| From net investment income | (0.09) | (0.23) | (0.09) | (0.27) | (0.16) |
| From net realized gain | (1.01) | — | (1.37) | (1.91) | (0.18) |
| Total distributions | (1.10) | (0.23) | (1.46) | (2.18) | (0.34) |
| Net asset value, end of period | $20.92 | $25.42 | $19.11 | $19.46 | $22.73 |
| Total return (%)2,3 | (14.05) | 34.74 | 6.38 | (4.82) | 6.39 |
| Ratios and supplemental data | | | | | |
| Net assets, end of period (in millions) | $31 | $36 | $30 | $34 | $47 |
| Ratios (as a percentage of average net assets): | | | | | |
| Expenses before reductions | 1.81 | 1.78 | 1.86 | 1.75 | 1.71 |
| Expenses including reductions | 1.70 | 1.63 | 1.72 | 1.71 | 1.71 |
| Net investment income | 0.42 | 0.44 | 0.32 | 0.44 | 1.10 |
| Portfolio turnover (%) | 52 | 63 | 55 | 82 | 123 |
| 1 | Based on average daily shares outstanding. |
| 2 | Total returns would have been lower had certain expenses not been reduced during the applicable periods. |
| 3 | Does not reflect the effect of sales charges, if any. |
| SEE NOTES TO FINANCIAL STATEMENTS | ANNUAL REPORT | JOHN HANCOCK Greater China Opportunities Fund | 17 |
| CLASS B SHARES Period ended | 10-31-18 | 10-31-17 | 10-31-16 | 10-31-15 | 10-31-14 |
| Per share operating performance | | | | | |
| Net asset value, beginning of period | $24.34 | $18.32 | $18.75 | $21.93 | $20.97 |
| Net investment income (loss)1 | (0.13) | (0.09) | (0.10) | (0.12) | 0.01 |
| Net realized and unrealized gain (loss) on investments | (3.27) | 6.21 | 1.04 | (1.07) | 1.13 |
| Total from investment operations | (3.40) | 6.12 | 0.94 | (1.19) | 1.14 |
| Less distributions | | | | | |
| From net investment income | — | (0.10) | — | (0.08) | — |
| From net realized gain | (1.01) | — | (1.37) | (1.91) | (0.18) |
| Total distributions | (1.01) | (0.10) | (1.37) | (1.99) | (0.18) |
| Net asset value, end of period | $19.93 | $24.34 | $18.32 | $18.75 | $21.93 |
| Total return (%)2,3 | (14.64) | 33.68 | 5.61 | (5.51) | 5.44 |
| Ratios and supplemental data | | | | | |
| Net assets, end of period (in millions) | $— 4 | $1 | $1 | $2 | $5 |
| Ratios (as a percentage of average net assets): | | | | | |
| Expenses before reductions | 2.51 | 2.56 | 2.56 | 2.62 | 2.67 |
| Expenses including reductions | 2.40 | 2.41 | 2.42 | 2.47 | 2.59 |
| Net investment income (loss) | (0.53) | (0.48) | (0.56) | (0.58) | 0.06 |
| Portfolio turnover (%) | 52 | 63 | 55 | 82 | 123 |
| 1 | Based on average daily shares outstanding. |
| 2 | Total returns would have been lower had certain expenses not been reduced during the applicable periods. |
| 3 | Does not reflect the effect of sales charges, if any. |
| 4 | Less than $500,000. |
| 18 | JOHN HANCOCK Greater China Opportunities Fund | ANNUAL REPORT | SEE NOTES TO FINANCIAL STATEMENTS |
| CLASS C SHARES Period ended | 10-31-18 | 10-31-17 | 10-31-16 | 10-31-15 | 10-31-14 |
| Per share operating performance | | | | | |
| Net asset value, beginning of period | $24.35 | $18.33 | $18.75 | $21.92 | $20.96 |
| Net investment income (loss)1 | (0.28) | (0.08) | (0.08) | (0.06) | 0.05 |
| Net realized and unrealized gain (loss) on investments | (3.12) | 6.20 | 1.03 | (1.13) | 1.09 |
| Total from investment operations | (3.40) | 6.12 | 0.95 | (1.19) | 1.14 |
| Less distributions | | | | | |
| From net investment income | — | (0.10) | — | (0.07) | — |
| From net realized gain | (1.01) | — | (1.37) | (1.91) | (0.18) |
| Total distributions | (1.01) | (0.10) | (1.37) | (1.98) | (0.18) |
| Net asset value, end of period | $19.94 | $24.35 | $18.33 | $18.75 | $21.92 |
| Total return (%)2,3 | (14.63) | 33.66 | 5.66 | (5.51) | 5.45 |
| Ratios and supplemental data | | | | | |
| Net assets, end of period (in millions) | $2 | $6 | $6 | $7 | $9 |
| Ratios (as a percentage of average net assets): | | | | | |
| Expenses before reductions | 2.51 | 2.56 | 2.56 | 2.51 | 2.58 |
| Expenses including reductions | 2.40 | 2.41 | 2.42 | 2.47 | 2.57 |
| Net investment income (loss) | (1.14) | (0.38) | (0.44) | (0.30) | 0.24 |
| Portfolio turnover (%) | 52 | 63 | 55 | 82 | 123 |
| 1 | Based on average daily shares outstanding. |
| 2 | Total returns would have been lower had certain expenses not been reduced during the applicable periods. |
| 3 | Does not reflect the effect of sales charges, if any. |
| SEE NOTES TO FINANCIAL STATEMENTS | ANNUAL REPORT | JOHN HANCOCK Greater China Opportunities Fund | 19 |
| CLASS I SHARES Period ended | 10-31-18 | 10-31-17 | 10-31-16 | 10-31-15 | 10-31-14 |
| Per share operating performance | | | | | |
| Net asset value, beginning of period | $25.35 | $19.08 | $19.44 | $22.72 | $21.71 |
| Net investment income1 | 0.20 | 0.21 | 0.13 | 0.23 | 0.45 |
| Net realized and unrealized gain (loss) on investments | (3.49) | 6.35 | 1.05 | (1.25) | 1.01 |
| Total from investment operations | (3.29) | 6.56 | 1.18 | (1.02) | 1.46 |
| Less distributions | | | | | |
| From net investment income | (0.17) | (0.29) | (0.17) | (0.35) | (0.27) |
| From net realized gain | (1.01) | — | (1.37) | (1.91) | (0.18) |
| Total distributions | (1.18) | (0.29) | (1.54) | (2.26) | (0.45) |
| Net asset value, end of period | $20.88 | $25.35 | $19.08 | $19.44 | $22.72 |
| Total return (%)2 | (13.70) | 35.09 | 6.74 | (4.43) | 6.79 |
| Ratios and supplemental data | | | | | |
| Net assets, end of period (in millions) | $5 | $5 | $3 | $2 | $4 |
| Ratios (as a percentage of average net assets): | | | | | |
| Expenses before reductions | 1.52 | 1.55 | 1.55 | 1.57 | 2.14 |
| Expenses including reductions | 1.34 | 1.34 | 1.34 | 1.34 | 1.34 |
| Net investment income | 0.81 | 1.02 | 0.70 | 1.06 | 2.02 |
| Portfolio turnover (%) | 52 | 63 | 55 | 82 | 123 |
| 1 | Based on average daily shares outstanding. |
| 2 | Total returns would have been lower had certain expenses not been reduced during the applicable periods. |
| 20 | JOHN HANCOCK Greater China Opportunities Fund | ANNUAL REPORT | SEE NOTES TO FINANCIAL STATEMENTS |
| CLASS NAV SHARES Period ended | 10-31-18 | 10-31-17 | 10-31-16 | 10-31-15 | 10-31-14 |
| Per share operating performance | | | | | |
| Net asset value, beginning of period | $25.72 | $19.35 | $19.70 | $22.98 | $21.95 |
| Net investment income1 | 0.08 | 0.17 | 0.15 | 0.20 | 0.62 |
| Net realized and unrealized gain (loss) on investments | (3.41) | 6.50 | 1.05 | (1.21) | 0.87 |
| Total from investment operations | (3.33) | 6.67 | 1.20 | (1.01) | 1.49 |
| Less distributions | | | | | |
| From net investment income | (0.18) | (0.30) | (0.18) | (0.36) | (0.28) |
| From net realized gain | (1.01) | — | (1.37) | (1.91) | (0.18) |
| Total distributions | (1.19) | (0.30) | (1.55) | (2.27) | (0.46) |
| Net asset value, end of period | $21.20 | $25.72 | $19.35 | $19.70 | $22.98 |
| Total return (%)2 | (13.66) | 35.17 | 6.81 | (4.36) | 6.88 |
| Ratios and supplemental data | | | | | |
| Net assets, end of period (in millions) | $9 | $17 | $12 | $12 | $12 |
| Ratios (as a percentage of average net assets): | | | | | |
| Expenses before reductions | 1.40 | 1.44 | 1.44 | 1.32 | 1.25 |
| Expenses including reductions | 1.29 | 1.29 | 1.29 | 1.27 | 1.24 |
| Net investment income | 0.31 | 0.83 | 0.81 | 0.95 | 2.80 |
| Portfolio turnover (%) | 52 | 63 | 55 | 82 | 123 |
| 1 | Based on average daily shares outstanding. |
| 2 | Total returns would have been lower had certain expenses not been reduced during the applicable periods. |
| SEE NOTES TO FINANCIAL STATEMENTS | ANNUAL REPORT | JOHN HANCOCK Greater China Opportunities Fund | 21 |
Notes to financial statements
Note 1 — Organization
John Hancock Greater China Opportunities Fund (the fund) is a series of John Hancock Investment Trust III (the Trust), an open-end management investment company organized as a Massachusetts business trust and registered under the Investment Company Act of 1940, as amended (the 1940 Act). The investment objective of the fund is to seek long-term capital appreciation.
The funds may offer multiple classes of shares. The shares currently outstanding are detailed in the Statement of assets and liabilities. Class A and Class C shares are offered to all investors. Class B shares are closed to new investors. Class I shares are offered to institutions and certain investors. Class NAV shares are offered to John Hancock affiliated funds of funds, retirement plans for employees of John Hancock and/or Manulife Financial Corporation, and certain 529 plans. Class B shares convert to Class A shares eight years after purchase. Class C shares convert to Class A shares ten years after purchase (certain exclusions may apply). Shareholders of each class have exclusive voting rights to matters that affect that class. The distribution and service fees, if any, and transfer agent fees for each class may differ.
Note 2 — Significant accounting policies
The financial statements have been prepared in conformity with accounting principles generally accepted in the United States of America (US GAAP), which require management to make certain estimates and assumptions as of the date of the financial statements. Actual results could differ from those estimates and those differences could be significant. The fund qualifies as an investment company under Topic 946 of Accounting Standards Codification of US GAAP.
Events or transactions occurring after the end of the fiscal period through the date that the financial statements were issued have been evaluated in the preparation of the financial statements. The following summarizes the significant accounting policies of the fund:
Security valuation. Investments are stated at value as of the scheduled close of regular trading on the New York Stock Exchange (NYSE), normally at 4:00 p.m., Eastern Time. In case of emergency or other disruption resulting in the NYSE not opening for trading or the NYSE closing at a time other than the regularly scheduled close, the net asset value (NAV) may be determined as of the regularly scheduled close of the NYSE pursuant to the fund's Valuation Policies and Procedures.
In order to value the securities, the fund uses the following valuation techniques: Equity securities held by the fund are typically valued at the last sale price or official closing price on the exchange or principal market where the security trades. In the event there were no sales during the day or closing prices are not available, the securities are valued using the last available bid price. Foreign securities and currencies are valued in U.S. dollars based on foreign currency exchange rates supplied by an independent pricing vendor.
In certain instances, the Pricing Committee may determine to value equity securities using prices obtained from another exchange or market if trading on the exchange or market on which prices are typically obtained did not open for trading as scheduled, or if trading closed earlier than scheduled, and trading occurred as normal on another exchange or market.
Other portfolio securities and assets, for which reliable market quotations are not readily available, are valued at fair value as determined in good faith by the fund's Pricing Committee following procedures established by the Board of Trustees. The frequency with which these fair valuation procedures are used cannot be predicted and fair value of securities may differ significantly from the value that would have been used had a ready market for such securities existed. Trading in foreign securities may be completed before the scheduled daily close of trading on the NYSE. Significant events at the issuer or market level may affect the values of securities between the time when the valuation of the securities is generally determined and the close of the NYSE. If a significant event occurs, these securities may be fair valued, as determined in good faith by the fund's Pricing Committee, following procedures established by the Board of Trustees. The fund uses fair value adjustment factors provided by an independent pricing vendor to value certain foreign securities in order to adjust for events that may occur between the close of foreign exchanges or markets and the close of the NYSE.
The fund uses a three-tier hierarchy to prioritize the pricing assumptions, referred to as inputs, used in valuation techniques to measure fair value. Level 1 includes securities valued using quoted prices in active markets for identical securities. Level 2
ANNUAL REPORT | JOHN HANCOCK GREATER CHINA OPPORTUNITIES FUND 22
includes securities valued using other significant observable inputs. Observable inputs may include quoted prices for similar securities, interest rates, prepayment speeds and credit risk. Prices for securities valued using these inputs are received from independent pricing vendors and brokers and are based on an evaluation of the inputs described. Level 3 includes securities valued using significant unobservable inputs when market prices are not readily available or reliable, including the fund's own assumptions in determining the fair value of investments. Factors used in determining value may include market or issuer specific events or trends, changes in interest rates and credit quality. The inputs or methodology used for valuing securities are not necessarily an indication of the risks associated with investing in those securities. Changes in valuation techniques and related inputs may result in transfers into or out of an assigned level within the disclosure hierarchy.
The following is a summary of the values by input classification of the fund's investments as of October 31, 2018, by major security category or type:
| | | | | | |
| | Total
value at
10-31-18 | Level 1
quoted
price | Level 2
significant
observable
inputs | Level 3
significant
unobservable
inputs |
| Investments in securities: | | | | |
| Assets | | | | |
| Common stocks | | | | |
| | China | $25,721,654 | $5,292,739 | $20,357,139 | $71,776 |
| | Hong Kong | 10,799,050 | — | 10,799,050 | — |
| | Taiwan | 10,846,691 | — | 10,846,691 | — |
| | United States | 189,581 | — | 189,581 | — |
| Total investments in securities | $47,556,976 | $5,292,739 | $42,192,461 | $71,776 |
Security transactions and related investment income. Investment security transactions are accounted for on a trade date plus one basis for daily NAV calculations. However, for financial reporting purposes, investment transactions are reported on trade date. Interest income is accrued as earned. Dividend income is recorded on the ex-date, except for dividends of foreign securities where the dividend may not be known until after the ex-date. In those cases, dividend income, net of withholding taxes, is recorded when the fund becomes aware of the dividends. Non-cash dividends, if any, are recorded at the fair market value of the securities received. Gains and losses on securities sold are determined on the basis of identified cost and may include proceeds from litigation.
Foreign investing. Assets, including investments, and liabilities denominated in foreign currencies are translated into U.S. dollar values each day at the prevailing exchange rate. Purchases and sales of securities, income and expenses are translated into U.S. dollars at the prevailing exchange rate on the date of the transaction. The effect of changes in foreign currency exchange rates on the value of securities is reflected as a component of the realized and unrealized gains (losses) on investments. Foreign investments are subject to a decline in the value of a foreign currency versus the U.S. dollar, which reduces the dollar value of securities denominated in that currency.
Funds that invest internationally generally carry more risk than funds that invest strictly in U.S. securities. These risks are heightened for investments in emerging markets. Funds investing in a single country or in a limited geographic region tend to be riskier than funds that invest more broadly. Risks can result from differences in economic and political conditions, regulations, market practices (including higher transaction costs), accounting standards and other factors.
Foreign taxes. The fund may be subject to withholding tax on income, capital gains or repatriation taxes imposed by certain countries, a portion of which may be recoverable. Foreign taxes are accrued based upon the fund's understanding of the tax rules and rates that exist in the foreign markets in which it invests. Taxes are accrued based on gains realized by the fund as a result of certain foreign security sales. In certain circumstances, estimated taxes are accrued based on unrealized appreciation of such securities. Investment income is recorded net of foreign withholding taxes.
Line of credit. The fund may have the ability to borrow from banks for temporary or emergency purposes, including meeting redemption requests that otherwise might require the untimely sale of securities. Pursuant to the fund's custodian
ANNUAL REPORT | JOHN HANCOCK GREATER CHINA OPPORTUNITIES FUND 23
agreement, the custodian may loan money to the fund to make properly authorized payments. The fund is obligated to repay the custodian for any overdraft, including any related costs or expenses. The custodian may have a lien, security interest or security entitlement in any fund property that is not otherwise segregated or pledged, to the extent of any overdraft, and to the maximum extent permitted by law. Overdrafts at period end are presented under the caption Due to custodian in the Statement of assets and liabilities.
The fund and other affiliated funds have entered into a syndicated line of credit agreement with Citibank, N.A. as the administrative agent that enables them to participate in a $750 million unsecured committed line of credit. Excluding commitments designated for a certain fund and subject to the needs of all other affiliated funds, the fund can borrow up to an aggregate commitment amount of $500 million, subject to asset coverage and other limitations as specified in the agreement. A commitment fee payable at the end of each calendar quarter, based on the average daily unused portion of the line of credit, is charged to each participating fund based on a combination of fixed and asset based allocations and is reflected in Other expenses on the Statement of operations. For the year ended October 31, 2018, the fund had no borrowings under the line of credit. Commitment fees for the year ended October 31, 2018 were $1,865.
Expenses. Within the John Hancock group of funds complex, expenses that are directly attributable to an individual fund are allocated to such fund. Expenses that are not readily attributable to a specific fund are allocated among all funds in an equitable manner, taking into consideration, among other things, the nature and type of expense and the fund's relative net assets. Expense estimates are accrued in the period to which they relate and adjustments are made when actual amounts are known.
Class allocations. Income, common expenses and realized and unrealized gains (losses) are determined at the fund level and allocated daily to each class of shares based on the net assets of the class. Class-specific expenses, such as distribution and service fees, if any, and transfer agent fees, for all classes, are charged daily at the class level based on the net assets of each class and the specific expense rates applicable to each class.
Federal income taxes. The fund intends to continue to qualify as a regulated investment company by complying with the applicable provisions of the Internal Revenue Code and will not be subject to federal income tax on taxable income that is distributed to shareholders. Therefore, no federal income tax provision is required.
As of October 31, 2018, the fund had no uncertain tax positions that would require financial statement recognition, derecognition or disclosure. The fund's federal tax returns are subject to examination by the Internal Revenue Service for a period of three years.
Distribution of income and gains. Distributions to shareholders from net investment income and net realized gains, if any, are recorded on the ex-date. The fund typically declares and pays dividends and capital gain distributions, if any, at least annually.
The tax character of distributions for the years ended October 31, 2018 and 2017 was as follows:
| | | |
| | October 31, 2018 | October 31, 2017 |
| Ordinary income | $523,017 | $626,016 |
| Long-term capital gains | 2,356,016 | — |
| Total | $2,879,033 | $626,016 |
Distributions paid by the fund with respect to each class of shares are calculated in the same manner, at the same time and in the same amount, except for the effect of class level expenses that may be applied differently to each class. As of October 31, 2018, the components of distributable earnings on a tax basis consisted of $720,713 of undistributed ordinary income and $5,197,853 of undistributed long-term capital gains.
Such distributions and distributable earnings, on a tax basis, are determined in conformity with income tax regulations, which may differ from US GAAP. Distributions in excess of tax basis earnings and profits, if any, are reported in the fund's financial statements as a return of capital.
ANNUAL REPORT | JOHN HANCOCK GREATER CHINA OPPORTUNITIES FUND 24
Capital accounts within the financial statements are adjusted for permanent book-tax differences. These adjustments have no impact on net assets or the results of operations. Temporary book-tax differences, if any, will reverse in a subsequent period. Book-tax differences are primarily attributable to treating a portion of the proceeds from redemptions as distributions for tax purposes.
Note 3 — Guarantees and indemnifications
Under the Trust's organizational documents, its Officers and Trustees are indemnified against certain liabilities arising out of the performance of their duties to the Trust, including the fund. Additionally, in the normal course of business, the fund enters into contracts with service providers that contain general indemnification clauses. The fund's maximum exposure under these arrangements is unknown, as this would involve future claims that may be made against the fund that have not yet occurred. The risk of material loss from such claims is considered remote.
Note 4 — Fees and transactions with affiliates
John Hancock Advisers, LLC (the Advisor) serves as investment advisor for the fund. John Hancock Funds, LLC (the Distributor), an affiliate of the Advisor, serves as principal underwriter of the fund. The Advisor and the Distributor are indirect, wholly owned subsidiaries of Manulife Financial Corporation (MFC).
Management fee. The fund has an investment management agreement with the Advisor under which the fund pays a daily management fee to the Advisor equivalent, on an annual basis, to the sum of: (a) 1.00% of the first $1 billion of the fund's average daily net assets; (b) 0.95% of the next $1 billion of the fund's average daily net assets and (c) 0.90% of the fund's average daily net assets in excess of $2 billion. The Advisor has a subadvisory agreement with John Hancock Asset Management a division of Manulife Asset Management (North America) Limited, an indirectly owned subsidiary of MFC and an affiliate of the Advisor. The fund is not responsible for payment of the subadvisory fees.
The Advisor has contractually agreed to waive a portion of its management fee and/or reimburse expenses for certain funds of the John Hancock funds complex, including the fund (the participating portfolios). This waiver is based upon aggregate net assets of all the participating portfolios. The amount of the reimbursement is calculated daily and allocated among all the participating portfolios in proportion to the daily net assets of each fund. During the year ended October 31, 2018, this waiver amounted to 0.01% of the fund's average net assets. This agreement expires on June 30, 2020, unless renewed by mutual agreement of the fund and the Advisor based upon a determination that this is appropriate under the circumstances at that time.
The Advisor has contractually agreed to reduce its management fee for the fund, or if necessary, make payment to the fund, in an amount equal to the amount by which the fund's expenses exceed 0.30% of average net assets, on an annualized basis. Expenses means all the expenses of the fund, excluding taxes, brokerage commissions, interest expense, litigation and indemnification expenses and other extraordinary expenses not incurred in the ordinary course of the fund's business, advisory fees, class-specific expenses, borrowing costs, prime brokerage fees, acquired fund fees and expenses paid indirectly, and short dividend expense. This current limitation expires on February 28, 2019, unless renewed by mutual agreement of the fund and Advisor based upon a determination that this is appropriate under the circumstances at that time.
The Advisor has contractually agreed to reduce its management fee or, if necessary, make payment to Class I shares to limit expenses for the class, to the extent that expense exceed 1.34% of average net assets of the class. Expenses exclude taxes, brokerage commissions, interest expense, acquired fund fees and expenses paid indirectly, litigation and indemnification expenses and other extraordinary expenses not incurred in the ordinary course of the fund's business, borrowing costs, prime brokerage fees, and short dividend expense. This current limitation expires on February 28, 2019, unless renewed by mutual
ANNUAL REPORT | JOHN HANCOCK GREATER CHINA OPPORTUNITIES FUND 25
agreement of the fund and Advisor based upon a determination that this is appropriate under the circumstances at that time. For the year ended October 31, 2018, the expense reductions described above amounted to the following:
| | | | | |
| Class | Expense reduction | | Class | Expense reduction |
| Class A | $43,255 | | Class I | $11,588 |
| Class B | 614 | | Class NAV | 12,989 |
| Class C | 3,823 | | Total | $72,269 |
Expenses waived or reimbursed in the current fiscal period are not subject to recapture in future fiscal periods.
The investment management fees, including the impact of the waivers and reimbursements as described above, incurred for the year ended October 31, 2018 were equivalent to a net annual effective rate of 0.89% of the fund's average daily net assets.
Accounting and legal services. Pursuant to a service agreement, the fund reimburses the Advisor for all expenses associated with providing the administrative, financial, legal, compliance, accounting and recordkeeping services to the fund, including the preparation of all tax returns, periodic reports to shareholders and regulatory reports, among other services. These expenses are allocated to each share class based on its relative net assets at the time the expense was incurred. These accounting and legal services fees incurred for the year ended October 31, 2018 amounted to an annual rate of 0.02% of the fund's average daily net assets.
Distribution and service plans. The fund has a distribution agreement with the Distributor. The fund has adopted distribution and service plans with respect to Class A, Class B and Class C shares pursuant to Rule 12b-1 under the 1940 Act, to pay the Distributor for services provided as the distributor of shares of the fund. The fund may pay up to the following contractual rates of distribution and service fees under these arrangements, expressed as an annual percentage of average daily net assets for each class of the fund's shares:
| | |
| Class | Rule 12b-1 fee |
| Class A | 0.30% |
| Class B | 1.00% |
| Class C | 1.00% |
Sales charges. Class A shares are assessed up-front sales charges, which resulted in payments to the Distributor amounting to $49,832 for the year ended October 31, 2018. Of this amount, $8,306 was retained and used for printing prospectuses, advertising, sales literature and other purposes, $39,978 was paid as sales commissions to broker-dealers and $1,548 was paid as sales commissions to sales personnel of Signator Investors, Inc., a broker-dealer affiliate of the Advisor.
Class A, Class B and Class C shares may be subject to contingent deferred sales charges (CDSCs). Certain Class A shares that are acquired through purchases of $1 million or more and are redeemed within one year of purchase are subject to a 1.00% sales charge. Class B shares that are redeemed within six years of purchase are subject to CDSCs, at declining rates, beginning at 5.00%. Class C shares that are redeemed within one year of purchase are subject to a 1.00% CDSC. CDSCs are applied to the lesser of the current market value at the time of redemption or the original purchase cost of the shares being redeemed. Proceeds from CDSCs are used to compensate the Distributor for providing distribution-related services in connection with the sale of these shares. During the year ended October 31, 2018, CDSCs received by the Distributor amounted to $72 and $556 for Class B and Class C shares, respectively. There were no CDSCs for Class A shares during the year ended October 31, 2018.
Transfer agent fees. The John Hancock group of funds has a complex-wide transfer agent agreement with John Hancock Signature Services, Inc. (Signature Services), an affiliate of the Advisor. The transfer agent fees paid to Signature Services are determined based on the cost to Signature Services (Signature Services Cost) of providing recordkeeping services. It also includes out-of-pocket expenses, including payments made to third-parties for recordkeeping services provided to their clients who invest in one or more John Hancock funds. In addition, Signature Services Cost may be reduced by certain fees that Signature Services receives in connection with retirement and small accounts. Signature Services Cost is calculated
ANNUAL REPORT | JOHN HANCOCK GREATER CHINA OPPORTUNITIES FUND 26
monthly and allocated, as applicable, to five categories of share classes: Retail Share and Institutional Share Classes of Non-Municipal Bond Funds, Class R6 Shares, Retirement Share Classes and Municipal Bond Share Classes. Within each of these categories, the applicable costs are allocated to the affected John Hancock affiliated funds and/or classes, based on the relative average daily net assets.
Class level expenses. Class level expenses for the year ended October 31, 2018 were:
| | | |
| Class | Distribution and service fees | Transfer agent fees |
| Class A | $115,742 | $41,968 |
| Class B | 6,058 | 652 |
| Class C | 45,035 | 4,834 |
| Class I | — | 7,350 |
| Total | $166,835 | $54,804 |
Trustee expenses. The fund compensates each Trustee who is not an employee of the Advisor or its affiliates. The costs of paying Trustee compensation and expenses are allocated to the fund based on its net assets relative to other funds within the John Hancock group of funds complex.
Interfund lending program. Pursuant to an Exemptive Order issued by the Securities Exchange Commission (SEC), the fund, along with certain other funds advised by the Advisor or its affiliates, may participate in an interfund lending program. This program provides an alternative credit facility allowing the funds to borrow from, or lend money to, other participating affiliated funds. At period end, no interfund loans were outstanding. Interest expense is included in Other expenses on the Statement of operations. The fund's activity in this program during the period for which loans were outstanding was as follows:
| | | | | |
Borrower
or lender | Weighted average
loan balance | Days
outstanding | Weighted average
interest rate | Interest expense |
| Borrower | $6,142,676 | 4 | 1.710% | $1,167 |
Note 5 — Fund share transactions
Transactions in fund shares for the years ended October 31, 2018 and 2017 were as follows:
| | | | | | | | | | | | | | | | | | | | | | | | | | | |
| | | | | | | | | |
| | | | | | | | Year ended 10-31-18 | | | | | | | | | | | | Year ended 10-31-17 | |
| | | | | Shares | | | Amount | | | | | | | | | Shares | | | Amount | |
| | Class A shares | | | | | | | | | | | | | | | | | | | |
| | Sold | | | 445,719 | | | $11,750,291 | | | | | | | | | 253,457 | | | $5,539,019 | |
| | Distributions reinvested | | | 60,500 | | | 1,502,208 | | | | | | | | | 18,679 | | | 327,821 | |
| | Repurchased | | | (411,610 | ) | | (10,443,262 | ) | | | | | | | | (454,463 | ) | | (9,267,293 | ) |
| | Net increase (decrease) | | | 94,609 | | | $2,809,237 | | | | | | | | | (182,327 | ) | | $(3,400,453 | ) |
| | Class B shares | | | | | | | | | | | | | | | | | | | |
| | Sold | | | 916 | | | $23,484 | | | | | | | | | 2,037 | | | $35,945 | |
| | Distributions reinvested | | | 1,104 | | | 26,277 | | | | | | | | | 261 | | | 4,426 | |
| | Repurchased | | | (11,908 | ) | | (289,110 | ) | | | | | | | | (25,056 | ) | | (484,551 | ) |
| | Net decrease | | | (9,888 | ) | | $(239,349 | ) | | | | | | | | (22,758 | ) | | $(444,180 | ) |
| | Class C shares | | | | | | | | | | | | | | | | | | | |
| | Sold | | | 21,978 | | | $543,413 | | | | | | | | | 17,925 | | | $372,727 | |
| | Distributions reinvested | | | 9,735 | | | 231,784 | | | | | | | | | 1,605 | | | 27,175 | |
| | Repurchased | | | (179,731 | ) | | (4,568,304 | ) | | | | | | | | (99,663 | ) | | (2,028,424 | ) |
| | Net decrease | | | (148,018 | ) | | $(3,793,107 | ) | | | | | | | | (80,133 | ) | | $(1,628,522 | ) |
ANNUAL REPORT | JOHN HANCOCK GREATER CHINA OPPORTUNITIES FUND 27
| | | | | | | | | | | | | | | | | | | | | | | | | | | |
| | | | | | | | | |
| | | | | | | | Year ended 10-31-18 | | | | | | | | | | | | Year ended 10-31-17 | |
| | | | | Shares | | | Amount | | | | | | | | | Shares | | | Amount | |
| | Class I shares | | | | | | | | | | | | | | | | | | | |
| | Sold | | | 227,839 | | | $5,702,995 | | | | | | | | | 324,724 | | | $6,403,764 | |
| | Distributions reinvested | | | 8,570 | | | 211,691 | | | | | | | | | 1,002 | | | 17,507 | |
| | Repurchased | | | (161,517 | ) | | (3,915,735 | ) | | | | | | | | (306,382 | ) | | (6,656,830 | ) |
| | Net increase (decrease) | | | 74,892 | | | $1,998,951 | | | | | | | | | 19,344 | | | $(235,559 | ) |
| | Class NAV shares | | | | | | | | | | | | | | | | | | | |
| | Sold | | | 61,594 | | | $1,485,989 | | | | | | | | | — | | | — | |
| | Distributions reinvested | | | 30,934 | | | 775,525 | | | | | | | | | 10,877 | | | $192,632 | |
| | Repurchased | | | (313,688 | ) | | (8,412,054 | ) | | | | | | | | — | | | — | |
| | Net increase (decrease) | | | (221,160 | ) | | $(6,150,540 | ) | | | | | | | | 10,877 | | | $192,632 | |
| | Total net decrease | | | (209,565 | ) | | $(5,374,808 | ) | | | | | | | | (254,997 | ) | | $(5,516,082 | ) |
Affiliates of the fund owned 100% of shares of Class NAV on October 31, 2018. Such concentration of shareholders' capital could have a material effect on the fund if such shareholders redeem from the fund.
Note 6 — Purchase and sale of securities
Purchases and sales of securities, other than short-term investments, amounted to $31,924,897 and $40,209,588, respectively, for the year ended October 31, 2018.
Note 7 — Industry or sector risk
The fund may invest a large percentage of its assets in one or more particular industries or sectors of the economy. If a large percentage of the fund's assets are economically tied to a single or small number of industries or sectors of the economy, the fund will be less diversified than a more broadly diversified fund, and it may cause the fund to underperform if that industry or sector underperforms. In addition, focusing on a particular industry or sector may make the fund's NAV more volatile. Further, a fund that invests in particular industries or sectors is particularly susceptible to the impact of market, economic, regulatory and other factors affecting those industries or sectors.
Note 8 — Greater China risk
Investments in the Greater China region may be subject to special risks, such as less developed markets, restrictions on monetary repatriation or other adverse government actions, nationalization, or expropriation of assets. Although they are larger and/or more established than many emerging markets, the markets of Greater China function in many ways as emerging markets, and carry the high levels of risks associated with emerging markets. In addition, there are risks particular to the region. For example, investments in Taiwan could be adversely affected by its political relationship with China. A small number of companies and industries represent a relatively large portion of the Greater China market as a whole. All of these factors mean that the fund is more likely to experience higher volatility and lower liquidity than a portfolio that invests mainly in U.S. stocks.
Note 9 — Investment by affiliated funds
Certain investors in the fund are affiliated funds that are managed by the Advisor and its affiliates. The affiliated funds do not invest in the fund for the purpose of exercising management or control; however, this investment may represent a significant portion of the fund's net assets. At October 31, 2018, within the John Hancock group of funds complex, John Hancock Funds II Multimanager Lifestyle Aggressive Portfolio had an affiliated ownership of 5% or more at 18.9% of the fund's net assets.
ANNUAL REPORT | JOHN HANCOCK GREATER CHINA OPPORTUNITIES FUND 28
REPORT OF INDEPENDENT REGISTERED PUBLIC ACCOUNTING FIRM
To the Board of Trustees of John Hancock Investment Trust III and Shareholders of John Hancock Greater China Opportunities Fund
Opinion on the Financial Statements
We have audited the accompanying statement of assets and liabilities, including the fund's investments, of John Hancock Greater China Opportunities Fund (the "Fund") as of October 31, 2018, the related statement of operations for the year ended October 31, 2018, the statements of changes in net assets for each of the two years in the period ended October 31, 2018, including the related notes, and the financial highlights for each of the five years in the period ended October 31, 2018 (collectively referred to as the "financial statements"). In our opinion, the financial statements present fairly, in all material respects, the financial position of the Fund as of October 31, 2018, the results of its operations for the year then ended, the changes in its net assets for each of the two years in the period ended October 31, 2018 and the financial highlights for each of the five years in the period ended October 31, 2018 in conformity with accounting principles generally accepted in the United States of America.
Basis for Opinion
These financial statements are the responsibility of the Fund's management. Our responsibility is to express an opinion on the Fund's financial statements based on our audits. We are a public accounting firm registered with the Public Company Accounting Oversight Board (United States) ("PCAOB") and are required to be independent with respect to the Fund in accordance with the U.S. federal securities laws and the applicable rules and regulations of the Securities and Exchange Commission and the PCAOB.
We conducted our audits of these financial statements in accordance with the standards of the PCAOB. Those standards require that we plan and perform the audit to obtain reasonable assurance about whether the financial statements are free of material misstatement, whether due to error or fraud.
Our audits included performing procedures to assess the risks of material misstatement of the financial statements, whether due to error or fraud, and performing procedures that respond to those risks. Such procedures included examining, on a test basis, evidence regarding the amounts and disclosures in the financial statements. Our audits also included evaluating the accounting principles used and significant estimates made by management, as well as evaluating the overall presentation of the financial statements. Our procedures included confirmation of securities owned as of October 31, 2018 by correspondence with the custodian. We believe that our audits provide a reasonable basis for our opinion.
/s/ PricewaterhouseCoopers LLP
Boston, Massachusetts
December 18, 2018
We have served as the auditor of one or more investment companies in the John Hancock group of funds since 1988.
ANNUAL REPORT | JOHN HANCOCK GREATER CHINA OPPORTUNITIES FUND 29
TAX INFORMATION
Unaudited
For federal income tax purposes, the following information is furnished with respect to the distributions of the fund, if any, paid during its taxable year ended October 31, 2018.
The fund reports the maximum amount allowable of its net taxable income as eligible for the corporate dividends-received deduction.
The fund reports the maximum amount allowable of its net taxable income as qualified dividend income as provided in the Jobs and Growth Tax Relief Reconciliation Act of 2003.
Income derived from foreign sources was $1,367,043. The fund intends to pass through foreign tax credits of $141,999.
The fund paid $3,365,039 in long term capital gain dividends.
Eligible shareholders will be mailed a 2018 Form 1099-DIV in early 2019. This will reflect the tax character of all distributions paid in calendar year 2018.
Please consult a tax advisor regarding the tax consequences of your investment in the fund.
ANNUAL REPORT | JOHN HANCOCK GREATER CHINA OPPORTUNITIES FUND 30
Continuation of Investment Advisory and Subadvisory Agreements
Evaluation of Advisory and Subadvisory Agreements by the Board of Trustees
This section describes the evaluation by the Board of Trustees (the Board) of John Hancock Investment Trust III (the Trust) of the Advisory Agreement (the Advisory Agreement) with John Hancock Advisers, LLC (the Advisor) and the Subadvisory Agreement (the Subadvisory Agreement) with John Hancock Asset Management a division of Manulife Asset Management (North America) Limited (the Subadvisor) for John Hancock Greater China Opportunities Fund (the fund). The Advisory Agreement and Subadvisory Agreement are collectively referred to as the Agreements. Prior to the June 18-21, 2018 in-person meeting at which the Agreements were approved, the Board also discussed and considered information regarding the proposed continuation of the Agreements at an in-person meeting held on May 29-31, 2018.
Approval of Advisory and Subadvisory Agreements
At in-person meetings held on June 18-21, 2018, the Board, including the Trustees who are not parties to any Agreement or considered to be interested persons of the Trust under the Investment Company Act of 1940, as amended (the 1940 Act) (the Independent Trustees), reapproved for an annual period the continuation of the Advisory Agreement between the Trust and the Advisor and the Subadvisory Agreement between the Advisor and the Subadvisor with respect to the fund.
In considering the Advisory Agreement and the Subadvisory Agreement, the Board received in advance of the meetings a variety of materials relating to the fund, the Advisor and the Subadvisor, including comparative performance, fee and expense information for a peer group of similar funds prepared by an independent third-party provider of fund data, performance information for an applicable benchmark index; and, with respect to the Subadvisor, comparative performance information for comparably managed accounts, as applicable, and other information provided by the Advisor and the Subadvisor regarding the nature, extent and quality of services provided by the Advisor and the Subadvisor under their respective Agreements, as well as information regarding the Advisor's revenues and costs of providing services to the fund and any compensation paid to affiliates of the Advisor. At the meetings at which the renewal of the Advisory Agreement and Subadvisory Agreement are considered, particular focus is given to information concerning fund performance, comparability of fees and total expenses, and profitability. However, the Board noted that the evaluation process with respect to the Advisor and the Subadvisor is an ongoing one. In this regard, the Board also took into account discussions with management and information provided to the Board (including its various committees) at prior meetings with respect to the services provided by the Advisor and the Subadvisor to the fund, including quarterly performance reports prepared by management containing reviews of investment results and prior presentations from the Subadvisor with respect to the fund. The information received and considered by the Board in connection with the May and June meetings and throughout the year was both written and oral. The Board noted the affiliation of the Subadvisor with the Advisor, noting any potential conflicts of interest. The Board also considered the nature, quality, and extent of non-advisory services, if any, to be provided to the fund by the Advisor's affiliates, including distribution services. The Board considered the Advisory Agreement and the Subadvisory Agreement separately in the course of its review. In doing so, the Board noted the respective roles of the Advisor and Subadvisor in providing services to the fund.
Throughout the process, the Board asked questions of and requested additional information from management. The Board is assisted by counsel for the Trust and the Independent Trustees are also separately assisted by independent legal counsel throughout the process. The Independent Trustees also received a memorandum from their independent legal counsel discussing the legal standards for their consideration of the proposed continuation of the Agreements and discussed the proposed continuation of the Agreements in private sessions with their independent legal counsel at which no representatives of management were present.
Approval of Advisory Agreement
In approving the Advisory Agreement with respect to the fund, the Board, including the Independent Trustees, considered a variety of factors, including those discussed below. The Board also considered other factors (including conditions and trends prevailing generally in the economy, the securities markets, and the industry) and did not treat any single factor as
ANNUAL REPORT | JOHN HANCOCK GREATER CHINA OPPORTUNITIES FUND 31
determinative, and each Trustee may have attributed different weights to different factors. The Board's conclusions may be based in part on its consideration of the advisory and subadvisory arrangements in prior years and on the Board's ongoing regular review of fund performance and operations throughout the year.
Nature, extent, and quality of services. Among the information received by the Board from the Advisor relating to the nature, extent, and quality of services provided to the fund, the Board reviewed information provided by the Advisor relating to its operations and personnel, descriptions of its organizational and management structure, and information regarding the Advisor's compliance and regulatory history, including its Form ADV. The Board also noted that on a regular basis it receives and reviews information from the Trust's Chief Compliance Officer (CCO) regarding the fund's compliance policies and procedures established pursuant to Rule 38a-1 under the 1940 Act. The Board observed that the scope of services provided by the Advisor, and of the undertakings required of the Advisor in connection with those services, including maintaining and monitoring its own and the fund's compliance programs, risk management programs, liquidity management programs and cybersecurity programs, had expanded over time as a result of regulatory, market and other developments. The Board considered that the Advisor is responsible for the management of the day-to-day operations of the fund, including, but not limited to, general supervision of and coordination of the services provided by the Subadvisor, and is also responsible for monitoring and reviewing the activities of the Subadvisor and third-party service providers. The Board also considered the significant risks assumed by the Advisor in connection with the services provided to the fund including entrepreneurial risk in sponsoring new funds and ongoing risks including investment, operational, enterprise, litigation, regulatory and compliance risks with respect to all funds.
In considering the nature, extent, and quality of the services provided by the Advisor, the Trustees also took into account their knowledge of the Advisor's management and the quality of the performance of the Advisor's duties, through Board meetings, discussions and reports during the preceding year and through each Trustee's experience as a Trustee of the Trust and of the other trusts in the John Hancock group of funds complex (the John Hancock Fund Complex).
In the course of their deliberations regarding the Advisory Agreement, the Board considered, among other things:
| | | |
| | (a) | the skills and competency with which the Advisor has in the past managed the Trust's affairs and its subadvisory relationship, the Advisor's oversight and monitoring of the Subadvisor's investment performance and compliance programs, such as the Subadvisor's compliance with fund policies and objectives, review of brokerage matters, including with respect to trade allocation and best execution and the Advisor's timeliness in responding to performance issues; |
| | (b) | the background, qualifications and skills of the Advisor's personnel; |
| | (c) | the Advisor's compliance policies and procedures and its responsiveness to regulatory changes and fund industry developments; |
| | (d) | the Advisor's administrative capabilities, including its ability to supervise the other service providers for the fund, as well as the Advisor's oversight of any securities lending activity, its monitoring of class action litigation and collection of class action settlements on behalf of the fund, and bringing loss recovery actions on behalf of the fund; |
| | (e) | the financial condition of the Advisor and whether it has the financial wherewithal to provide a high level and quality of services to the fund; |
| | (f) | the Advisor's initiatives intended to improve various aspects of the Trust's operations and investor experience with the fund; and |
| | (g) | the Advisor's reputation and experience in serving as an investment advisor to the Trust and the benefit to shareholders of investing in funds that are part of a family of funds offering a variety of investments. |
The Board concluded that the Advisor may reasonably be expected to continue to provide a high quality of services under the Advisory Agreement with respect to the fund.
ANNUAL REPORT | JOHN HANCOCK GREATER CHINA OPPORTUNITIES FUND 32
Investment performance. In considering the fund's performance, the Board noted that it reviews at its regularly scheduled meetings information about the fund's performance results. In connection with the consideration of the Advisory Agreement, the Board:
| | | |
| | (a) | reviewed information prepared by management regarding the fund's performance; |
| | (b) | considered the comparative performance of an applicable benchmark index; |
| | (c) | considered the performance of comparable funds, if any, as included in the report prepared by an independent third-party provider of fund data; and |
| | (d) | took into account the Advisor's analysis of the fund's performance and its plans and recommendations regarding the Trust's subadvisory arrangements generally. |
The Board noted that while it found the data provided by the independent third-party generally useful it recognized its limitations, including in particular that the data may vary depending on the end date selected and the results of the performance comparisons may vary depending on the selection of the peer group. The Board noted that the fund outperformed its benchmark index for the one-, three- and five-year periods and underperformed its benchmark index for the ten-year period ended December 31, 2017. The Board also noted that the fund outperformed its peer group average for the one-, three-, five- and ten-year periods ended December 31, 2017. The Board took into account management's discussion of the fund's performance, including the favorable performance relative to the benchmark for the one-, three- and five-year periods and to the peer group for the one-, three-, five and ten-year periods. The Board concluded that the fund's performance has generally been in line with or outperformed the historical performance of comparable funds and the fund's benchmark index.
Fees and expenses. The Board reviewed comparative information prepared by an independent third-party provider of fund data, including, among other data, the fund's contractual and net management fees (and subadvisory fees, to the extent available) and total expenses as compared to similarly situated investment companies deemed to be comparable to the fund in light of the nature, extent and quality of the management and advisory and subadvisory services provided by the Advisor and the Subadvisor. The Board considered the fund's ranking within a smaller group of peer funds chosen by the independent third-party provider, as well as the fund's ranking within a broader group of funds. In comparing the fund's contractual and net management fees to those of comparable funds, the Board noted that such fees include both advisory and administrative costs. The Board noted that net management fees and net total expenses for the fund are lower than the peer group median.
The Board took into account management's discussion with respect to the overall management fee and the fees of the Subadvisor, including the amount of the advisory fee retained by the Advisor after payment of the subadvisory fee, in each case in light of the services rendered for those amounts and the risks undertaken by the Advisor. The Board also noted that the Advisor pays the subadvisory fee. In addition, the Board took into account that management had agreed to implement an overall fee waiver across the complex, including the fund, which is discussed further below. The Board also noted actions taken over the past several years to reduce the fund's operating expenses. The Board also noted that, in addition, the Advisor is currently waiving fees and/or reimbursing expenses with respect to the fund and that the fund has breakpoints in its contractual management fee schedule that reduces management fees as assets increase. The Board reviewed information provided by the Advisor concerning the investment advisory fee charged by the Advisor or one of its advisory affiliates to other clients (including other funds in the John Hancock Fund Complex) having similar investment mandates, if any. The Board considered any differences between the Advisor's and Subadvisor's services to the fund and the services they provide to other comparable clients or funds. The Board concluded that the advisory fee paid with respect to the fund is reasonable in light of the nature, extent and quality of the services provided to the fund under the Advisory Agreement.
Profitability/Fall out benefits. In considering the costs of the services to be provided and the profits to be realized by the Advisor and its affiliates (including the Subadvisor) from the Advisor's relationship with the Trust, the Board:
| | | | | | | | | |
| | | | | (a) | | | reviewed financial information of the Advisor; | |
ANNUAL REPORT | JOHN HANCOCK GREATER CHINA OPPORTUNITIES FUND 33
| | | | | | | | | |
| | | | | (b) | | | reviewed and considered information presented by the Advisor regarding the net profitability to the Advisor and its affiliates with respect to the fund; | |
| | | | | (c) | | | received and reviewed profitability information with respect to the John Hancock Fund Complex as a whole and with respect to the fund; | |
| | | | | (d) | | | received information with respect to the Advisor's allocation methodologies used in preparing the profitability data and considered that the Advisor hired an independent third-party consultant to provide an analysis of the Advisor's allocation methodologies; | |
| | | | | (e) | | | considered that the John Hancock insurance companies that are affiliates of the Advisor, as shareholders of the Trust directly or through their separate accounts, receive certain tax credits or deductions relating to foreign taxes paid and dividends received by certain funds of the Trust and noted that these tax benefits, which are not available to participants in qualified retirement plans under applicable income tax law, are reflected in the profitability information reviewed by the Board; | |
| | | | | (f) | | | considered that the Advisor also provides administrative services to the fund on a cost basis pursuant to an administrative services agreement; | |
| | | | | (g) | | | noted that affiliates of the Advisor provide transfer agency services and distribution services to the fund, and that the fund's distributor also receives Rule 12b-1 payments to support distribution of the fund; | |
| | | | | (h) | | | noted that the fund's Subadvisor is an affiliate of the Advisor; | |
| | | | | (i) | | | noted that the Advisor also derives reputational and other indirect benefits from providing advisory services to the fund; | |
| | | | | (j) | | | noted that the subadvisory fee for the fund is paid by the Advisor; | |
| | | | | (k) | | | considered the Advisor's ongoing costs and expenditures necessary to improve services, meet new regulatory and compliance requirements, and adapt to other challenges impacting the fund industry; and | |
| | | | | (l) | | | considered that the Advisor should be entitled to earn a reasonable level of profits in exchange for the level of services it provides to the fund and the risks that it assumes as Advisor, including entrepreneurial, operational, reputational, litigation and regulatory risk. | |
Based upon its review, the Board concluded that the level of profitability, if any, of the Advisor and its affiliates (including the Subadvisor) from their relationship with the fund was reasonable and not excessive.
Economies of scale. In considering the extent to which economies of scale would be realized as the fund grows and whether fee levels reflect these economies of scale for the benefit of fund shareholders, the Board:
| | | |
| | (a) | considered that the Advisor has contractually agreed to waive a portion of its management fee for certain funds of the John Hancock Fund Complex, including the fund (the participating portfolios) or otherwise reimburse the expenses of the participating portfolios (the reimbursement). This waiver is based upon aggregate net assets of all the participating portfolios. The amount of the reimbursement is calculated daily and allocated among all the participating portfolios in proportion to the daily net assets of each fund; |
| | (b) | reviewed the fund's advisory fee structure and concluded that: (i) the fund's fee structure contains breakpoints at the advisory fee level; and (ii) although economies of scale cannot be measured with precision, these arrangements permit shareholders of the fund to benefit from economies of scale if the fund grows. The Board also took into account management's discussion of the fund's advisory fee structure; and |
| | (c) | the Board also considered the effect of the fund's growth in size on its performance and fees. The Board also noted that if the fund's assets increase over time, the fund may realize other economies of scale. |
ANNUAL REPORT | JOHN HANCOCK GREATER CHINA OPPORTUNITIES FUND 34
Approval of Subadvisory Agreement
In making its determination with respect to approval of the Subadvisory Agreement, the Board reviewed:
| | | |
| | (1) | information relating to the Subadvisor's business, including current subadvisory services to the Trust (and other funds in the John Hancock Fund Complex); |
| | (2) | the historical and current performance of the fund and comparative performance information relating to an applicable benchmark index and comparable funds; and |
| | (3) | the subadvisory fee for the fund and to the extent available, comparable fee information prepared by an independent third-party provider of fund data. |
Nature, extent, and quality of services. With respect to the services provided by the Subadvisor, the Board received information provided to the Board by the Subadvisor, including the Subadvisor's Form ADV, as well as took into account information presented throughout the past year. The Board considered the Subadvisor's current level of staffing and its overall resources, as well as received information relating to the Subadvisor's compensation program. The Board reviewed the Subadvisor's history and investment experience, as well as information regarding the qualifications, background, and responsibilities of the Subadvisor's investment and compliance personnel who provide services to the fund. The Board also considered, among other things, the Subadvisor's compliance program and any disciplinary history. The Board also considered the Subadvisor's risk assessment and monitoring process. The Board reviewed the Subadvisor's regulatory history, including whether it was involved in any regulatory actions or investigations as well as material litigation, and any settlements and amelioratory actions undertaken, as appropriate. The Board noted that the Advisor conducts regular, periodic reviews of the Subadvisor and its operations, including regarding investment processes and organizational and staffing matters. The Board also noted that the Trust's CCO and his staff conduct regular, periodic compliance reviews with the Subadvisor and present reports to the Independent Trustees regarding the same, which includes evaluating the regulatory compliance systems of the Subadvisor and procedures reasonably designed to assure compliance with the federal securities laws. The Board also took into account the financial condition of the Subadvisor.
The Board considered the Subadvisor's investment process and philosophy. The Board took into account that the Subadvisor's responsibilities include the development and maintenance of an investment program for the fund that is consistent with the fund's investment objective, the selection of investment securities and the placement of orders for the purchase and sale of such securities, as well as the implementation of compliance controls related to performance of these services. The Board also received information with respect to the Subadvisor's brokerage policies and practices, including with respect to best execution and soft dollars.
Subadvisor compensation. In considering the cost of services to be provided by the Subadvisor and the profitability to the Subadvisor of its relationship with the fund, the Board noted that the fees under the Subadvisory Agreement are paid by the Advisor and not the fund. The Board also received information and took into account any other potential conflicts of interest the Advisor might have in connection with the Subadvisory Agreement.
In addition, the Board considered other potential indirect benefits that the Subadvisor and its affiliates may receive from the Subadvisor's relationship with the fund, such as the opportunity to provide advisory services to additional funds in the John Hancock Fund Complex and reputational benefits.
Subadvisory fees. The Board considered that the fund pays an advisory fee to the Advisor and that, in turn, the Advisor pays a subadvisory fee to the Subadvisor. As noted above, the Board also considered the fund's subadvisory fees as compared to similarly situated investment companies deemed to be comparable to the fund as included in the report prepared by the independent third-party provider of fund data, to the extent available. The Board noted that the limited size of the Lipper peer group was not sufficient for comparative purposes. The Board also took into account the subadvisory fees paid by the Advisor to the Subadvisor with respect to the fund and compared them to fees charged by the Subadvisor to manage other subadvised portfolios and portfolios not subject to regulation under the 1940 Act, as applicable.
ANNUAL REPORT | JOHN HANCOCK GREATER CHINA OPPORTUNITIES FUND 35
Subadvisor performance. As noted above, the Board considered the fund's performance as compared to the fund's peer group and the benchmark index and noted that the Board reviews information about the fund's performance results at its regularly scheduled meetings. The Board noted the Advisor's expertise and resources in monitoring the performance, investment style and risk-adjusted performance of the Subadvisor. The Board was mindful of the Advisor's focus on the Subadvisor's performance. The Board also noted the Subadvisor's long-term performance record for similar accounts, as applicable.
The Board's decision to approve the Subadvisory Agreement was based on a number of determinations, including the following:
| | | |
| | (1) | the Subadvisor has extensive experience and demonstrated skills as a manager; |
| | (2) | the performance of the fund has generally been in line with or outperformed the historical performance of comparable funds and the fund's benchmark index; |
| | (3) | the subadvisory fee is reasonable in relation to the level and quality of services being provided under the Subadvisory Agreement; and |
| | (4) | noted that the subadvisory fees are paid by the Advisor and not the fund and the advisory fee for the fund contains breakpoints that permit shareholders to benefit from economies of scale. |
| * * * |
Based on the Board's evaluation of all factors that the Board deemed to be material, including those factors described above, the Board, including the Independent Trustees, concluded that renewal of the Advisory Agreement and the Subadvisory Agreement would be in the best interest of the fund and its shareholders. Accordingly, the Board, and the Independent Trustees voting separately, approved the Advisory Agreement and Subadvisory Agreement for an additional one-year period.
ANNUAL REPORT | JOHN HANCOCK GREATER CHINA OPPORTUNITIES FUND 36
This chart provides information about the Trustees and Officers who oversee your John Hancock fund. Officers elected by the Trustees manage the day-to-day operations of the fund and execute policies formulated by the Trustees.
Independent Trustees
| | | |
Name, year of birth
Position(s) held with Trust
Principal occupation(s) and other
directorships during past 5 years | Trustee
of the
Trust
since1 | Number of John
Hancock funds
overseen by
Trustee |
| Hassell H. McClellan, Born: 1945 | 2012 | 215 |
Trustee and Chairperson of the Board
Director/Trustee, Virtus Funds (since 2008); Director, The Barnes Group (since 2010); Associate Professor, The Wallace E. Carroll School of Management, Boston College (retired 2013). Trustee (since 2014) and Chairperson of the Board (since 2017), John Hancock Collateral Trust; Trustee (since 2015) and Chairperson of the Board (since 2017), John Hancock Exchange-Traded Fund Trust; Trustee (since 2012) and Chairperson of the Board (since 2017), John Hancock retail funds3; Trustee (2005-2006 and since 2012) and Chairperson of the Board (since 2017), John Hancock Funds III; Trustee (since 2005) and Chairperson of the Board (since 2017), John Hancock Variable Insurance Trust and John Hancock Funds II. |
| | | |
| Charles L. Bardelis,2 Born: 1941 | 2012 | 215 |
Trustee
Director, Island Commuter Corp. (marine transport). Trustee, John Hancock Collateral Trust (since 2014), Trustee, John Hancock Exchange-Traded Fund Trust (since 2015); Trustee, John Hancock retail funds3 (since 2012); Trustee, John Hancock Funds III (2005-2006 and since 2012); Trustee, John Hancock Variable Insurance Trust (since 1988); Trustee, John Hancock Funds II (since 2005). |
| | | |
| James R. Boyle, Born: 1959 | 2015 | 215 |
Trustee
Chief Executive Officer, Foresters Financial (since 2018); Chairman and Chief Executive Officer, Zillion Group, Inc. (formerly HealthFleet, Inc.) (healthcare) (2014-2018); Executive Vice President and Chief Executive Officer, U.S. Life Insurance Division of Genworth Financial, Inc. (insurance) (January 2014-July 2014); Senior Executive Vice President, Manulife Financial, President and Chief Executive Officer, John Hancock (1999-2012); Chairman and Director, John Hancock Advisers, LLC, John Hancock Funds, LLC, and John Hancock Investment Management Services, LLC (2005-2010). Trustee, John Hancock Collateral Trust and John Hancock Exchange-Traded Fund Trust (since 2015); Trustee, John Hancock retail funds3 (2005-2010; 2012-2014 and since 2015); Trustee, John Hancock Variable Insurance Trust and John Hancock Funds II (2005-2014 and since 2015). |
| | | |
| Peter S. Burgess,2 Born: 1942 | 2012 | 215 |
Trustee
Consultant (financial, accounting, and auditing matters) (since 1999); Certified Public Accountant; Partner, Arthur Andersen (independent public accounting firm) (prior to 1999); Director, Lincoln Educational Services Corporation (since 2004); Director, Symetra Financial Corporation (2010-2016); Director, PMA Capital Corporation (2004-2010). Trustee, John Hancock Collateral Trust (since 2014); Trustee, John Hancock Exchange-Traded Fund Trust (since 2015); Trustee, John Hancock retail funds3 (since 2012); Trustee, John Hancock Funds III (2005-2006 and since 2012); Trustee, John Hancock Variable Insurance Trust and John Hancock Funds II (since 2005). |
| | | |
| William H. Cunningham, Born: 1944 | 2005 | 215 |
Trustee
Professor, University of Texas, Austin, Texas (since 1971); former Chancellor, University of Texas System and former President of the University of Texas, Austin, Texas; Chairman (since 2009) and Director (since 2006), Lincoln National Corporation (insurance); Director, Southwest Airlines (since 2000); former Director, LIN Television (2009-2014). Trustee, John Hancock retail funds3 (since 1986); Trustee, John Hancock Variable Insurance Trust (since 2012); Trustee, John Hancock Funds II (2005-2006 and since 2012); Trustee, John Hancock Collateral Trust (since 2014); Trustee, John Hancock Exchange-Traded Fund Trust (since 2015). |
ANNUAL REPORT | JOHN HANCOCK GREATER CHINA OPPORTUNITIES FUND 37
Independent Trustees (continued)
| | | |
Name, year of birth
Position(s) held with Trust
Principal occupation(s) and other
directorships during past 5 years | Trustee
of the
Trust
since1 | Number of John
Hancock funds
overseen by
Trustee |
| Grace K. Fey, Born: 1946 | 2012 | 215 |
Trustee
Chief Executive Officer, Grace Fey Advisors (since 2007); Director and Executive Vice President, Frontier Capital Management Company (1988-2007); Director, Fiduciary Trust (since 2009). Trustee, John Hancock Collateral Trust (since 2014); Trustee, John Hancock Exchange-Traded Fund Trust (since 2015); Trustee, John Hancock retail funds3 (since 2012); Trustee, John Hancock Variable Insurance Trust and John Hancock Funds II (since 2008). |
| | | |
| Theron S. Hoffman,2 Born: 1947 | 2012 | 215 |
Trustee
Chief Executive Officer, T. Hoffman Associates, LLC (consulting firm) (since 2003); Director, The Todd Organization (consulting firm) (2003-2010); President, Westport Resources Management (investment management consulting firm) (2006-2008); Board Member, Senior Managing Director, Partner, and Operating Head, Putnam Investments (2000-2003); Executive Vice President, The Thomson Corp. (financial and legal information publishing) (1997-2000). Trustee, John Hancock Collateral Trust (since 2014); Trustee, John Hancock Exchange-Traded Fund Trust (since 2015); Trustee, John Hancock retail funds3 (since 2012); Trustee, John Hancock Variable Insurance Trust and John Hancock Funds II (since 2008). |
| | | |
| Deborah C. Jackson, Born: 1952 | 2008 | 215 |
Trustee
President, Cambridge College, Cambridge, Massachusetts (since 2011); Board of Directors, National Association of Corporate Directors/New England (since 2015); Board of Directors, Association of Independent Colleges and Universities of Massachusetts (since 2014); Chief Executive Officer, American Red Cross of Massachusetts Bay (2002-2011); Board of Directors of Eastern Bank Corporation (since 2001); Board of Directors of Eastern Bank Charitable Foundation (since 2001); Board of Directors of American Student Assistance Corporation (1996-2009); Board of Directors of Boston Stock Exchange (2002-2008); Board of Directors of Harvard Pilgrim Healthcare (health benefits company) (2007-2011). Trustee, John Hancock retail funds3 (since 2008); Trustee, John Hancock Variable Insurance Trust and John Hancock Funds II (since 2012); Trustee, John Hancock Collateral Trust (since 2014); and Trustee, John Hancock Exchange-Traded Fund Trust (since 2015). |
| | | |
| James M. Oates, Born: 1946 | 2012 | 215 |
Trustee
Managing Director, Wydown Group (financial consulting firm) (since 1994); Chairman and Director, Emerson Investment Management, Inc. (2000-2015); Independent Chairman, Hudson Castle Group, Inc. (formerly IBEX Capital Markets, Inc.) (financial services company) (1997-2011); Director, Stifel Financial (since 1996); Director, Investor Financial Services Corporation (1995-2007); Director, Connecticut River Bancorp (1998-2014); Director/Trustee, Virtus Funds (since 1988). Trustee (since 2014) and Chairperson of the Board (2014-2016), John Hancock Collateral Trust; Trustee (since 2015) and Chairperson of the Board (2015-2016), John Hancock Exchange-Traded Fund Trust; Trustee (since 2012) and Chairperson of the Board (2012-2016), John Hancock retail funds3; Trustee (2005-2006 and since 2012) and Chairperson of the Board (2012-2016), John Hancock Funds III; Trustee (since 2004) and Chairperson of the Board (2005-2016), John Hancock Variable Insurance Trust; Trustee (since 2005) and Chairperson of the Board, John Hancock Funds II (2005-2016).
|
| | | |
| Steven R. Pruchansky, Born: 1944 | 2005 | 215 |
Trustee and Vice Chairperson of the Board
Managing Director, Pru Realty (since 2017); Chairman and Chief Executive Officer, Greenscapes of Southwest Florida, Inc. (since 2000); Director and President, Greenscapes of Southwest Florida, Inc. (until 2000); Member, Board of Advisors, First American Bank (until 2010); Managing Director, Jon James, LLC (real estate) (since 2000); Partner, Right Funding, LLC (2014-2017); Director, First Signature Bank & Trust Company (until 1991); Director, Mast Realty Trust (until 1994); President, Maxwell Building Corp. (until 1991). Trustee (since 1992) and Chairperson of the Board (2011-2012), John Hancock retail funds3; Trustee and Vice Chairperson of the Board, John Hancock retail funds3 John Hancock Variable Insurance Trust, and John Hancock Funds II (since 2012); Trustee and Vice Chairperson of the Board, John Hancock Collateral Trust (since 2014); Trustee and Vice Chairperson of the Board, John Hancock Exchange-Traded Fund Trust (since 2015). |
ANNUAL REPORT | JOHN HANCOCK GREATER CHINA OPPORTUNITIES FUND 38
Independent Trustees (continued)
| | | |
Name, year of birth
Position(s) held with Trust
Principal occupation(s) and other
directorships during past 5 years | Trustee
of the
Trust
since1 | Number of John
Hancock funds
overseen by
Trustee |
| Gregory A. Russo, Born: 1949 | 2009 | 215 |
Trustee
Director and Audit Committee Chairman (since 2012), and Member, Audit Committee and Finance Committee (since 2011), NCH Healthcare System, Inc. (holding company for multi-entity healthcare system); Director and Member (since 2012) and Finance Committee Chairman (since 2014), The Moorings, Inc. (nonprofit continuing care community); Vice Chairman, Risk & Regulatory Matters, KPMG LLP (KPMG) (2002-2006); Vice Chairman, Industrial Markets, KPMG (1998-2002); Chairman and Treasurer, Westchester County, New York, Chamber of Commerce (1986-1992); Director, Treasurer, and Chairman of Audit and Finance Committees, Putnam Hospital Center (1989-1995); Director and Chairman of Fundraising Campaign, United Way of Westchester and Putnam Counties, New York (1990-1995). Trustee, John Hancock retail funds3 (since 2008); Trustee, John Hancock Variable Insurance Trust and John Hancock Funds II (since 2012); Trustee, John Hancock Collateral Trust (since 2014); Trustee, John Hancock Exchange-Traded Fund Trust (since 2015). |
Non-Independent Trustees4
| | | |
Name, year of birth
Position(s) held with Trust
Principal occupation(s) and other
directorships during past 5 years | Trustee
of the
Trust
since1 | Number of John
Hancock funds
overseen by
Trustee |
| Andrew G. Arnott, Born: 1971 | 2017 | 215 |
President and Non-Independent Trustee
Head of Wealth and Asset Management, United States and Europe, for John Hancock and Manulife (since 2018); Executive Vice President, John Hancock Financial Services (since 2009, including prior positions); Director and Executive Vice President, John Hancock Advisers, LLC (since 2005, including prior positions); Director and Executive Vice President, John Hancock Investment Management Services, LLC (since 2006, including prior positions); President, John Hancock Funds, LLC (since 2004, including prior positions); President, John Hancock retail funds,3 John Hancock Variable Insurance Trust, and John Hancock Funds II (since 2007, including prior positions); President, John Hancock Collateral Trust and John Hancock Exchange-Traded Fund Trust (since 2014). Trustee, John Hancock Collateral Trust, John Hancock Exchange-Traded Fund Trust, John Hancock retail funds,3 John Hancock Variable Insurance Trust, and John Hancock Funds II (since 2017). |
| | | |
| Marianne Harrison, Born: 1963 | 2018 | 215 |
Non-Independent Trustee
President and CEO, John Hancock (since 2017); President and CEO, Manulife Canadian Division (2013-2017); Member, Board of Directors, American Council of Life Insurers (ACLI) (since 2018); Member, Board of Directors, Communitech, an industry-led innovation center that fosters technology companies in Canada (since 2017); Member, Board of Directors, Manulife Assurance Canada (since 2015); Board Member, St. Mary's General Hospital Foundation (since 2014); Member, Board of Directors, Manulife Bank of Canada (since 2013); Member, Standing Committee of the Canadian Life & Health Assurance Association (since 2013); Member, Board of Directors, John Hancock USA, John Hancock Life & Health, John Hancock New York (2012-2013). Trustee, John Hancock Collateral Trust, John Hancock Exchange-Traded Fund Trust, John Hancock retail funds3, John Hancock Variable Insurance Trust, and John Hancock Funds II (since 2018). |
| | | |
| Warren A. Thomson, Born: 1955 | 2012 | 215 |
Non-Independent Trustee
Senior Executive Vice President and Chief Investment Officer, Manulife Financial and The Manufacturers Life Insurance Company (since 2009); Chairman, Manulife Asset Management (since 2001, including prior positions); Director and Chairman, Manulife Asset Management Limited (since 2006); Director and Chairman, Hancock Natural Resources Group, Inc. (since 2013). Trustee, John Hancock retail funds,3 John Hancock Variable Insurance Trust, and John Hancock Funds II (since 2012); Trustee, John Hancock Collateral Trust (since 2014); Trustee, John Hancock Exchange-Traded Fund Trust (since 2015). |
ANNUAL REPORT | JOHN HANCOCK GREATER CHINA OPPORTUNITIES FUND 39
Principal officers who are not Trustees
| | |
Name, year of birth
Position(s) held with Trust
Principal occupation(s)
during past 5 years | Officer
of the
Trust
since |
| Francis V. Knox, Jr., Born: 1947 | 2005 |
Chief Compliance Officer
Vice President, John Hancock Financial Services (since 2005); Chief Compliance Officer, John Hancock retail funds,3 John Hancock Variable Insurance Trust, John Hancock Funds II, John Hancock Advisers, LLC, and John Hancock Investment Management Services, LLC (since 2005); Chief Compliance Officer, John Hancock Collateral Trust and John Hancock Exchange-Traded Fund Trust (since 2014). |
| | |
| Charles A. Rizzo, Born: 1957 | 2007 |
Chief Financial Officer
Vice President, John Hancock Financial Services (since 2008); Senior Vice President, John Hancock Advisers, LLC and John Hancock Investment Management Services, LLC (since 2008); Chief Financial Officer, John Hancock retail funds,3 John Hancock Variable Insurance Trust and John Hancock Funds II (since 2007); Chief Financial Officer, John Hancock Collateral Trust and John Hancock Exchange-Traded Fund Trust (since 2014). |
| | |
| Salvatore Schiavone, Born: 1965 | 2010 |
Treasurer
Assistant Vice President, John Hancock Financial Services (since 2007); Vice President, John Hancock Advisers, LLC and John Hancock Investment Management Services, LLC (since 2007); Treasurer, John Hancock retail funds3 (since 2007, including prior positions); Treasurer, John Hancock Variable Insurance Trust and John Hancock Funds II (2007-2009 and since 2010, including prior positions); Treasurer, John Hancock Collateral Trust and John Hancock Exchange-Traded Fund Trust (since 2014). |
| | |
| Christopher (Kit) Sechler, Born: 1973 | 2018 |
Chief Legal Officer and Secretary
Vice President and Deputy Chief Counsel, John Hancock Investments (since 2015); Assistant Vice President and Senior Counsel (2009-2015), John Hancock Investments; Chief Legal Officer and Secretary, John Hancock retail funds(2), John Hancock Variable Insurance Trust, John Hancock Collateral Trust and John Hancock Exchange-Traded Fund Trust (since 2018); Assistant Secretary of John Hancock Advisers, LLC and John Hancock Investment Management Services, LLC (since 2009). |
The business address for all Trustees and Officers is 200 Berkeley Street, Boston, Massachusetts 02116.
The Statement of Additional Information of the fund includes additional information about members of the Board of Trustees of the Trust and is available without charge, upon request, by calling 800-225-5291.
| 1 | Each Trustee holds office until his or her successor is elected and qualified, or until the Trustee's death, retirement, resignation, or removal. Mr. Boyle has served as Trustee at various times prior to the date listed in the table. |
| 2 | Member of the Audit Committee. |
| 3 | "John Hancock retail funds" comprises John Hancock Funds III and 40 other John Hancock funds consisting of 30 series of other John Hancock trusts and 10 closed-end funds. |
| 4 | The Trustee is a Non-Independent Trustee due to current or former positions with the Advisor and certain affiliates. |
ANNUAL REPORT | JOHN HANCOCK GREATER CHINA OPPORTUNITIES FUND 40
| | |
Trustees
Hassell H. McClellan, Chairperson
Steven R. Pruchansky, Vice Chairperson
Andrew G. Arnott†
Charles L. Bardelis*
James R. Boyle
Peter S. Burgess*
William H. Cunningham
Grace K. Fey
Marianne Harrison†#
Theron S. Hoffman*
Deborah C. Jackson
James M. Oates
Gregory A. Russo
Warren A. Thomson†
Officers
Andrew G. Arnott
President
Francis V. Knox, Jr.
Chief Compliance Officer
Charles A. Rizzo
Chief Financial Officer
Salvatore Schiavone
Treasurer
Christopher (Kit) Sechler**
Secretary and Chief Legal Officer
| Investment advisor
John Hancock Advisers, LLC
Subadvisor
John Hancock Asset Management a division of Manulife Asset Management (North America) Limited
Principal distributor
John Hancock Funds, LLC
Custodian
Citibank, N.A.
Transfer agent
John Hancock Signature Services, Inc.
Legal counsel
K&L Gates LLP
Independent registered public accounting firm
PricewaterhouseCoopers LLP
|
* Member of the Audit Committee
† Non-Independent Trustee
#Effective 6-19-18
**Effective 9-13-18
The fund's proxy voting policies and procedures, as well as the fund proxy voting record for the most recent twelve-month period ended June 30, are available free of charge on the Securities and Exchange Commission (SEC) website at sec.gov or on our website.
The fund's complete list of portfolio holdings, for the first and third fiscal quarters, is filed with the SEC on Form N-Q. The fund's Form N-Q is available on our website and the SEC's website, sec.gov, and can be reviewed and copied (for a fee) at the SEC's Public Reference Room in Washington, DC. Call 800-SEC-0330 to receive information on the operation of the SEC's Public Reference Room.
We make this information on your fund, as well as monthly portfolio holdings, and other fund details available on our website at jhinvestments.com or by calling 800-225-5291.
| | | | |
| | You can also contact us: |
| | 800-225-5291
jhinvestments.com | Regular mail:
John Hancock Signature Services, Inc.
P.O. Box 55913
Boston, MA 02205-5913
| Express mail:
John Hancock Signature Services, Inc.
Suite 55913
30 Dan Road
Canton, MA 02021
|
ANNUAL REPORT | JOHN HANCOCK GREATER CHINA OPPORTUNITIES FUND 41
John Hancock family of funds
| | | |
DOMESTIC EQUITY FUNDS
Blue Chip Growth
Classic Value
Disciplined Value
Disciplined Value Mid Cap
Equity Income
Financial Industries
Fundamental All Cap Core
Fundamental Large Cap Core
Fundamental Large Cap Value
New Opportunities
Regional Bank
Small Cap Core
Small Cap Growth
Small Cap Value
U.S. Global Leaders Growth
U.S. Growth
U.S. Quality Growth
Value Equity
GLOBAL AND INTERNATIONAL EQUITY FUNDS
Disciplined Value International
Emerging Markets
Emerging Markets Equity
Fundamental Global Franchise
Global Equity
Global Shareholder Yield
Global Thematic Opportunities
Greater China Opportunities
International Growth
International Small Company
| | INCOME FUNDS
Bond
California Tax-Free Income
Emerging Markets Debt
Floating Rate Income
Government Income
High Yield
High Yield Municipal Bond
Income
Investment Grade Bond
Money Market
Short Duration Credit Opportunities
Spectrum Income
Strategic Income Opportunities
Tax-Free Bond
ALTERNATIVE AND SPECIALTY FUNDS
Absolute Return Currency
Alternative Asset Allocation
Enduring Assets
Global Absolute Return Strategies
Global Conservative Absolute Return
Global Focused Strategies
Redwood
Seaport Long/Short
Technical Opportunities
|
A fund's investment objectives, risks, charges, and expenses should be considered carefully before investing. The prospectus contains this and other important information about the fund. To obtain a prospectus, contact your financial professional, call John Hancock Investments at 800-225-5291, or visit our website at jhinvestments.com. Please read the prospectus carefully before investing or sending money.
| | | |
ASSET ALLOCATION
Balanced
Income Allocation
Multi-Index Lifetime Portfolios
Multi-Index Preservation Portfolios
Multimanager Lifestyle Portfolios
Multimanager Lifetime Portfolios
Retirement Income 2040
EXCHANGE-TRADED FUNDS
John Hancock Multifactor Consumer Discretionary ETF
John Hancock Multifactor Consumer Staples ETF
John Hancock Multifactor Developed International ETF
John Hancock Multifactor Emerging Markets ETF
John Hancock Multifactor Energy ETF
John Hancock Multifactor Financials ETF
John Hancock Multifactor Healthcare ETF
John Hancock Multifactor Industrials ETF
John Hancock Multifactor Large Cap ETF
John Hancock Multifactor Materials ETF
John Hancock Multifactor Mid Cap ETF
John Hancock Multifactor Small Cap ETF
John Hancock Multifactor Technology ETF
John Hancock Multifactor Utilities ETF
| | ENVIRONMENTAL, SOCIAL, AND GOVERNANCE FUNDS
ESG All Cap Core
ESG Core Bond
ESG International Equity
ESG Large Cap Core
CLOSED-END FUNDS
Financial Opportunities
Hedged Equity & Income
Income Securities Trust
Investors Trust
Preferred Income
Preferred Income II
Preferred Income III
Premium Dividend
Tax-Advantaged Dividend Income
Tax-Advantaged Global Shareholder Yield
|
John Hancock Multifactor ETF shares are bought and sold at market price (not NAV), and are not individually redeemed
from the fund. Brokerage commissions will reduce returns.
John Hancock ETFs are distributed by Foreside Fund Services, LLC, and are subadvised by Dimensional Fund Advisors LP.
Foreside is not affiliated with John Hancock Funds, LLC or Dimensional Fund Advisors LP.
Dimensional Fund Advisors LP receives compensation from John Hancock in connection with licensing rights to the
John Hancock Dimensional indexes. Dimensional Fund Advisors LP does not sponsor, endorse, or sell, and makes no
representation as to the advisability of investing in, John Hancock Multifactor ETFs.
John Hancock Investments
A trusted brand
John Hancock Investments is a premier asset manager representing one of
America's most trusted brands, with a heritage of financial stewardship dating
back to 1862. Helping our shareholders pursue their financial goals is at the
core of everything we do. It's why we support the role of professional financial
advice and operate with the highest standards of conduct and integrity.
A better way to invest
We serve investors globally through a unique multimanager approach:
We search the world to find proven portfolio teams with specialized
expertise for every strategy we offer, then we apply robust investment
oversight to ensure they continue to meet our uncompromising standards
and serve the best interests of our shareholders.
Results for investors
Our unique approach to asset management enables us to provide a diverse set
of investments backed by some of the world's best managers, along with strong
risk-adjusted returns across asset classes.

| | | |
| | John Hancock Funds, LLC n Member FINRA, SIPC
200 Berkeley Street n Boston, MA 02116-5010
800-225-5291 n jhinvestments.com |
| | This report is for the information of the shareholders of John Hancock Greater China Opportunities Fund. It is not authorized for distribution to prospective investors unless preceded or accompanied by a prospectus. |
| | MF647921 | 08A 10/18
12/18 |
ITEM 2. CODE OF ETHICS.
As of the end of the period, October 31, 2018, the registrant has adopted a code of ethics, as defined in Item 2 of Form N-CSR, that applies to its Chief Executive Officer, Chief Financial Officer and Treasurer (respectively, the principal executive officer, the principal financial officer and the principal accounting officer, the “Senior Financial Officers”). A copy of the code of ethics is filed as an exhibit to this Form N-CSR.
ITEM 3. AUDIT COMMITTEE FINANCIAL EXPERT.
Peter S. Burgess is the audit committee financial expert and is “independent”, pursuant to general instructions on Form N-CSR Item 3.
ITEM 4. PRINCIPAL ACCOUNTANT FEES AND SERVICES.
(a) Audit Fees
The aggregate fees billed for professional services rendered by the principal accountant(s) for John Hancock Greater China Opportunities Fund for the audit of the registrant’s annual financial statements or services that are normally provided by the accountant(s) in connection with statutory and regulatory filings or engagements amounted to $41,397 for the fiscal year ended October 31, 2018 and $35,597 for the fiscal year ended October 31, 2017. These fees were billed to the registrant and were approved by the registrant’s audit committee.
(b) Audit-Related Services
Audit-related service fees for John Hancock Greater China Opportunities Fund amounted to $540 for the fiscal year ended October 31, 2018 and $525 for the fiscal year ended October 31, 2017 billed to the registrant or to the registrant's investment adviser (not including any sub-adviser whose role is primarily portfolio management and is subcontracted with or overseen by another investment adviser), and any entity controlling, controlled by, or under common control with the adviser that provides ongoing services to the registrant ("control affiliates"). The nature of the services provided was affiliated service provider internal controls reviews. In addition, amounts billed to control affiliates for service provider internal controls reviews were $110,200 and $106,517 for the fiscal years ended October 31, 2018 and 2017, respectively.
(c) Tax Fees
The aggregate fees billed for professional services rendered by the principal accountant(s) for John Hancock Greater China Opportunities Fund for the tax compliance, tax advice and tax planning (“tax fees”) amounted to $4,275 for the fiscal year ended October 31, 2018 and $4,275 for the fiscal year ended October 31, 2017. The nature of the services comprising the tax fees was the review of the registrant’s tax returns and tax distribution requirements. These fees were billed to the registrant and were approved by the registrant’s audit committee.
(d) All Other Fees
Other fees for John Hancock Greater China Opportunities Fund amounted to $239 for the fiscal year ended October 31, 2018 and $839 for the fiscal year ended October 31, 2017 billed to the registrant or to the control affiliates.
(e)(1) Audit Committee Pre-Approval Policies and Procedures:
The trust’s Audit Committee must pre-approve all audit and non-audit services provided by the independent registered public accounting firm (the “Auditor”) relating to the operations or financial reporting of the funds. Prior to the commencement of any audit or non-audit services to a fund, the Audit Committee reviews the services to determine whether they are appropriate and permissible under applicable law.
The trust’s Audit Committee has adopted policies and procedures to, among other purposes, provide a framework for the Committee’s consideration of audit-related and non-audit services by the Auditor. The policies and procedures require that any audit-related and non-audit service provided by the Auditor and any non-audit service provided by the Auditor to a fund service provider that relates directly to the operations and financial reporting of a fund are subject to approval by the Audit Committee before such service is provided. Audit-related services provided by the Auditor that are expected to exceed $25,000 per instance/per fund are subject to specific pre-approval by the Audit Committee. Tax services provided by the Auditor that are expected to exceed $30,000 per instance/per fund are subject to specific pre-approval by the Audit Committee.
All audit services, as well as the audit-related and non-audit services that are expected to exceed the amounts stated above, must be approved in advance of provision of the service by formal resolution of the Audit Committee. At the regularly scheduled Audit Committee meetings, the Committee reviews a report summarizing the services, including fees, provided by the Auditor.
(e)(2) Services approved pursuant to paragraph (c)(7)(i)(C) of Rule 2-01 of Regulation S-X:
Audit-Related Fees, Tax Fees and All Other Fees:
There were no amounts that were approved by the Audit Committee pursuant to the de minimis exception under Rule 2-01 of Regulation S-X.
(f) According to the registrant’s principal accountant, for the fiscal year ended October 31, 2018, the percentage of hours spent on the audit of the registrant's financial statements for the most recent fiscal year that were attributed to work performed by persons who were not full-time, permanent employees of principal accountant was less than 50%.
(g) The aggregate non-audit fees billed by the registrant's accountant(s) for services rendered to the registrant and rendered to the registrant's control affiliates for each of the last two fiscal years of the registrant were $2,064,999 for the fiscal year ended October 31, 2018 and $8,884,780 for the fiscal year ended October 31, 2017.
(h) The audit committee of the registrant has considered the non-audit services provided by the registrant’s principal accountant(s) to the control affiliates and has determined that the services that were not pre-approved are compatible with maintaining the principal accountant(s)' independence.
ITEM 5. AUDIT COMMITTEE OF LISTED REGISTRANTS.
The registrant has a separately-designated standing audit committee comprised of independent trustees. The members of the audit committee are as follows:
Peter S. Burgess - Chairman
Charles L. Bardelis
Theron S. Hoffman
ITEM 6. SCHEDULE OF INVESTMENTS.
(a) Not applicable.
(b) Not applicable.
ITEM 7. DISCLOSURE OF PROXY VOTING POLICIES AND PROCEDURES FOR CLOSED-END MANAGEMENT INVESTMENT COMPANIES.
Not applicable.
ITEM 8. PORTFOLIO MANAGERS OF CLOSED-END MANAGEMENT INVESTMENT COMPANIES.
Not applicable.
ITEM 9. PURCHASES OF EQUITY SECURITIES BY CLOSED-END MANAGEMENT INVESTMENT COMPANY AND AFFILIATED PURCHASERS.
Not applicable.
ITEM 10. SUBMISSION OF MATTERS TO A VOTE OF SECURITY HOLDERS.
There were no material changes to previously disclosed John Hancock Funds – Nominating and Governance Committee Charter.
ITEM 11. CONTROLS AND PROCEDURES.
(a) Based upon their evaluation of the registrant's disclosure controls and procedures as conducted within 90 days of the filing date of this Form N-CSR, the registrant's principal executive officer and principal financial officer have concluded that those disclosure controls and procedures provide reasonable assurance that the material information required to be disclosed by the registrant on this report is recorded, processed, summarized and reported within the time periods specified in the Securities and Exchange Commission's rules and forms.
(b) There were no changes in the registrant's internal control over financial reporting that occurred during the second fiscal quarter of the period covered by this report that have materially affected, or are reasonably likely to materially affect, the registrant's internal control over financial reporting.
ITEM 12. DISCLOSURE OF SECURITIES LENDING ACTIVITIES FOR CLOSED-END MANAGEMENT INVESTMENT COMPANIES.
Not applicable.
ITEM 13. EXHIBITS.
(a)(1) Code of Ethics for Senior Financial Officers is attached.
(a)(2) Separate certifications for the registrant's principal executive officer and principal financial officer, as required by Section 302 of the Sarbanes-Oxley Act of 2002 and Rule 30a-2(a) under the Investment Company Act of 1940, are attached.
(b) Separate certifications for the registrant's principal executive officer and principal financial officer, as required by 18 U.S.C. Section 1350, as adopted pursuant to Section 906 of the Sarbanes-Oxley Act of 2002, and Rule 30a-2(b) under the Investment Company Act of 1940, are attached. The certifications furnished pursuant to this paragraph are not deemed to be "filed" for purposes of Section 18 of the Securities Exchange Act of 1934, or otherwise subject to the liability of that section. Such certifications are not deemed to be incorporated by reference into any filing under the Securities Act of 1933 or the Securities Exchange Act of 1934, except to the extent that the Registrant specifically incorporates them by reference.
(c)(1) Submission of Matters to a Vote of Security Holders is attached. See attached “John Hancock Funds – Nominating and Governance Committee Charter”.
SIGNATURES
Pursuant to the requirements of the Securities Exchange Act of 1934 and the Investment Company Act of 1940, the registrant has duly caused this report to be signed on its behalf by the undersigned, thereunto duly authorized.
John Hancock Investment Trust III
| By: | /s/ Andrew Arnott |
| Andrew Arnott |
| President |
| |
| Date: | December 18, 2018 |
Pursuant to the requirements of the Securities Exchange Act of 1934 and the Investment Company Act of 1940, this report has been signed below by the following persons on behalf of the registrant and in the capacities and on the dates indicated.
| By: | /s/ Andrew Arnott |
| Andrew Arnott |
| President |
| |
| Date: | December 18, 2018 |
| By: | /s/ Charles A. Rizzo |
| Charles A. Rizzo |
| Chief Financial Officer |
| |
| Date: | December 18, 2018 |