UNITED STATES
SECURITIES AND EXCHANGE COMMISSION
Washington, D.C. 20549
FORM N-CSR
CERTIFIED SHAREHOLDER REPORT OF REGISTERED
MANAGEMENT INVESTMENT COMPANIES
Investment Company Act file number811- 4630
John Hancock Investment Trust III
(Exact name of registrant as specified in charter)
200 Berkeley Street, Boston, Massachusetts 02116
(Address of principal executive offices) (Zip code)
Salvatore Schiavone
Treasurer
200 Berkeley Street
Boston, Massachusetts 02116
(Name and address of agent for service)
Registrant's telephone number, including area code:617-663-4497
| Date of fiscal year end: | | October 31 |
| | | |
| Date of reporting period: | | April 30, 2019 |
ITEM 1. REPORTS TO STOCKHOLDERS.
John Hancock
Greater China Opportunities Fund
Semiannual report 4/30/19
The fund liquidated on 5/17/19.
Beginning on January 1, 2021, as permitted by regulations adopted by the Securities and Exchange Commission, paper copies of the Fund's shareholder reports like this one will no longer be sent by mail, unless you specifically request paper copies of the reports from the Fund or from your financial intermediary. Instead, the reports will be made available on a website, and you will be notified by mail each time a report is posted and provided with a website link to access the report.
If you already elected to receive shareholder reports electronically, you will not be affected by this change, and you do not need to take any action. You may elect to receive shareholder reports and other communications electronically by calling John Hancock Investment Management at 800-225-5291 (Class A, Class B and Class C shares) or 888-972-8696 (Class I and Class NAV shares) or by contacting your financial intermediary.
You may elect to receive all reports in paper, free of charge, at any time. You can inform John Hancock Investment Management or your financial intermediary that you wish to continue receiving paper copies of your shareholder reports by following the instructions listed above. Your election to receive reports in paper will apply to all funds held with John Hancock Investment Management or your financial intermediary.

A message to shareholders
Dear shareholder,
The six months ended April 30, 2019, were a study in contrasts. The final months of 2018 were very volatile; developed country stock markets lost ground as fears of slowing economic growth, the potential consequences of mounting trade tensions between the United States and China, and a pullback in oil prices spooked investors. Many of those concerns were quelled as favorable earnings reports and early signs of progress with the China trade dispute sparked a market rebound during the first four months of 2019. Subsequent to period end, however, we saw reignited trade tensions with China and Mexico partially offset by more dovish comments on interest rates from the U.S. Federal Reserve.
Your best resource in unpredictable and volatile markets is your financial advisor, who can help position your portfolio so that it's sufficiently diversified to meet your long-term objectives and to withstand the inevitable turbulence along the way.
On behalf of everyone at John Hancock Investment Management, I'd like to take this opportunity to welcome new shareholders and thank existing shareholders for the continued trust you've placed in us.
Sincerely,
Andrew G. Arnott
President and CEO,
John Hancock Investment Management
Head of Wealth and Asset Management,
United States and Europe
This commentary reflects the CEO's views, which are subject to change at any time. Investing involves risks, including the potential loss of principal. Diversification does not guarantee a profit or eliminate the risk of a loss. It is not possible to invest directly in an index. For more up-to-date information, please visit our website at jhinvestments.com.
John Hancock
Greater China Opportunities Fund
Table of contents
| | | |
| 2 | | Your fund at a glance |
| 3 | | Portfolio Summary |
| 4 | | A look at performance |
| 6 | | Your expenses |
| 8 | | Fund's investments |
| 10 | | Financial statements |
| 13 | | Financial highlights |
| 18 | | Notes to financial statements |
| 26 | | More information |
SEMIANNUAL REPORT | JOHN HANCOCK GREATER CHINA OPPORTUNITIES FUND 1
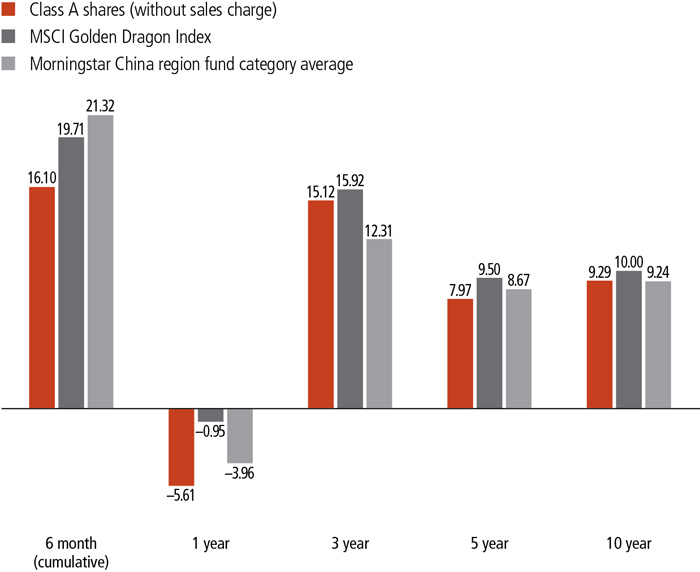
INVESTMENT OBJECTIVE
The fund seeks long-term capital appreciation.
AVERAGE ANNUAL TOTAL RETURNS AS OF 4/30/19 (%)
The MSCI Golden Dragon Index is an unmanaged free float-adjusted market-capitalization-weighted index that is designed to measure equity market performance in the China region. The MSCI Golden Dragon Index captures the equity market performance of large and mid-cap China securities and non-domestic China securities listed in Hong Kong and Taiwan.
It is not possible to invest directly in an index. Index figures do not reflect expenses or sales charges, which would result in lower returns.
Figures from Morningstar, Inc. include reinvested distributions and do not take into account sales charges. Actual load-adjusted performance is lower.
The past performance shown here reflects reinvested distributions and the beneficial effect of any expense reductions, and does not guarantee future results. Returns for periods shorter than one year are cumulative. Performance of the other share classes will vary based on the difference in the fees and expenses of those classes. Shares will fluctuate in value and, when redeemed, may be worth more or less than their original cost. Current month-end performance may be lower or higher than the performance cited, and can be found at jhinvestments.com or by calling 800-225-5291. For further information on the fund's objectives, risks, and strategy, see the fund's prospectus.
SEMIANNUAL REPORT | JOHN HANCOCK GREATER CHINA OPPORTUNITIES FUND 2
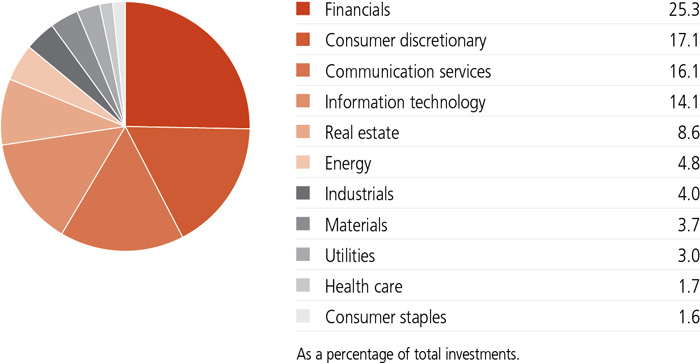
SECTOR COMPOSITION AS OF 4/30/19 (%)
COUNTRY COMPOSITION AS OF 4/30/19 (%)
| | |
| China | 53.7 |
| Hong Kong | 27.3 |
| Taiwan | 19.0 |
| TOTAL | 100.0 |
| As a percentage of total investments. | |
TOP 10 HOLDINGS AS OF 4/30/19 (%)
| | |
| Tencent Holdings, Ltd. | 11.1 |
| Taiwan Semiconductor Manufacturing Company, Ltd. | 9.1 |
| Alibaba Group Holding, Ltd., ADR | 7.8 |
| AIA Group, Ltd. | 4.9 |
| China Construction Bank Corp., H Shares | 4.6 |
| Ping An Insurance Group Company of China, Ltd., H Shares | 4.5 |
| Industrial & Commercial Bank of China, Ltd., H Shares | 3.6 |
| Hong Kong Exchanges & Clearing, Ltd. | 3.1 |
| CNOOC, Ltd. | 2.7 |
| China Overseas Land & Investment, Ltd. | 2.2 |
| TOTAL | 53.6 |
| As a percentage of total investments. |
| Cash and cash equivalents are not included. |
A note about risks
The fund is subject to various risks as described in the fund's prospectus. For more information, please refer to the "Principal risks" section of the prospectus.
SEMIANNUAL REPORT | JOHN HANCOCK GREATER CHINA OPPORTUNITIES FUND 3
TOTAL RETURNS FOR THE PERIOD ENDED APRIL 30, 2019
| | | | | | | | |
Average annual total returns (%)
with maximum sales charge | | Cumulative total returns (%)
with maximum sales charge |
| | 1-year | 5-year | 10-year | | 6-month | 5-year | 10-year |
| Class A | -10.33 | 6.87 | 8.74 | | 10.29 | 39.39 | 131.05 |
| Class B | -10.37 | 6.87 | 8.45 | | 10.70 | 39.38 | 125.01 |
| Class C | -7.05 | 7.17 | 8.45 | | 14.69 | 41.34 | 125.01 |
| Class I1 | -5.25 | 8.35 | 9.67 | | 16.30 | 49.30 | 151.64 |
| Class NAV1 | -5.21 | 8.40 | 9.81 | | 16.29 | 49.71 | 154.98 |
| Index† | -0.95 | 9.50 | 10.00 | | 19.71 | 57.43 | 159.28 |
Performance figures assume all distributions have been reinvested. Figures reflect maximum sales charges on Class A shares of 5%, and the applicable contingent deferred sales charge (CDSC) on Class B and Class C shares. The Class B shares' CDSC declines annually between years 1 to 6 according to the following schedule: 5%, 4%, 3%, 3%, 2%, 1%. No sales charge will be assessed after the sixth year. Class C shares held for less than one year are subject to a 1% CDSC. Sales charges are not applicable to Class I and Class NAV shares.
The expense ratios of the fund, both net (including any fee waivers and/or expense limitations) and gross (excluding any fee waivers and/or expense limitations), are set forth according to the most recent publicly available prospectuses for the fund and may differ from those disclosed in the Financial highlights tables in this report. Net expenses reflect contractual expense limitations in effect until February 29, 2020 and are subject to change. Had the contractual fee waivers and expense limitations not been in place, gross expenses would apply. The expense ratios are as follows:
| | | | | | |
| | Class A | Class B | Class C | Class I | Class NAV |
| Gross (%) | 1.78 | 2.48 | 2.48 | 1.49 | 1.37 |
| Net (%) | 1.70 | 2.40 | 2.40 | 1.34 | 1.29 |
Please refer to the most recent prospectus and annual or semiannual report for more information on expenses and any expense limitation arrangements for each class.
The returns reflect past results and should not be considered indicative of future performance. The return and principal value of an investment will fluctuate so that shares, when redeemed, may be worth more or less than their original cost. Due to market volatility and other factors, the fund's current performance may be higher or lower than the performance shown. For current to the most recent month-end performance data, please call 800-225-5291 or visit the fund's website at jhinvestments.com.
The performance table above and the chart on the next page do not reflect the deduction of taxes that a shareholder would pay on fund distributions or the redemption of fund shares. The fund's performance results reflect any applicable fee waivers or expense reductions, without which the expenses would increase and results would have been less favorable.
| † | Index is the MSCI Golden Dragon Index. |
See the following page for footnotes.
SEMIANNUAL REPORT | JOHN HANCOCK GREATER CHINA OPPORTUNITIES FUND 4
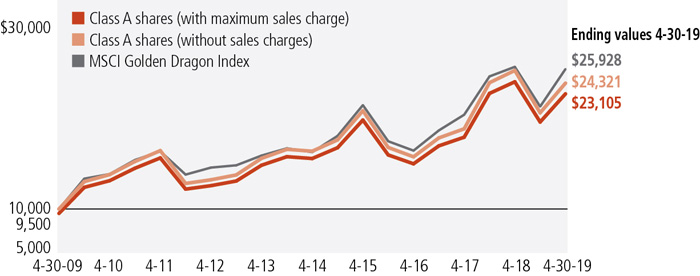
This chart and table show what happened to a hypothetical $10,000 investment in John Hancock Greater China Opportunities Fund for the share classes and periods indicated, assuming all distributions were reinvested. For comparison, we've shown the same investment in the MSCI Golden Dragon Index.
| | | | | |
| | Start date | With maximum
sales charge ($) | Without
sales charge ($) | Index ($) |
| Class B2 | 4-30-09 | 22,501 | 22,501 | 25,928 |
| Class C2 | 4-30-09 | 22,501 | 22,501 | 25,928 |
| Class I1 | 4-30-09 | 25,164 | 25,164 | 25,928 |
| Class NAV1 | 4-30-09 | 25,498 | 25,498 | 25,928 |
The MSCI Golden Dragon Index is an unmanaged free float-adjusted market capitalization index that is designed to measure equity market performance in the China region. The MSCI Golden Dragon Index captures the equity market performance of large and mid-cap China securities and non-domestic China securities listed in Hong Kong and Taiwan.
It is not possible to invest directly in an index. Index figures do not reflect expenses or sales charges, which would result in lower returns.
Footnotes related to performance pages
| 1 | For certain types of investors, as described in the fund's prospectuses. |
| 2 | The contingent deferred sales charge is not applicable. |
SEMIANNUAL REPORT | JOHN HANCOCK GREATER CHINA OPPORTUNITIES FUND 5
These examples are intended to help you understand your ongoing operating expenses of investing in the fund so you can compare these costs with the ongoing costs of investing in other mutual funds.
Understanding fund expenses
As a shareholder of the fund, you incur two types of costs:
■Transaction costs,which include sales charges (loads) on purchases or redemptions (varies by share class), minimum account fee charge, etc.
■Ongoing operating expenses, including management fees, distribution and service fees (if applicable), and other fund expenses.
We are presenting only your ongoing operating expenses here.
Actual expenses/actual returns
The first line of each share class in the table on the following page is intended to provide information about the fund’s actual ongoing operating expenses, and is based on the fund’s actual return. It assumes an account value of $1,000.00 on November 1, 2018, with the same investment held until April 30, 2019.
Together with the value of your account, you may use this information to estimate the operating expenses that you paid over the period. Simply divide your account value at April 30, 2019, by $1,000.00, then multiply it by the “expenses paid” for your share class from the table. For example, for an account value of $8,600.00, the operating expenses should be calculated as follows:
Hypothetical example for comparison purposes
The second line of each share class in the table on the following page allows you to compare the fund’s ongoing operating expenses with those of any other fund. It provides an example of the fund’s hypothetical account values and hypothetical expenses based on each class’s actual expense ratio and an assumed 5% annualized return before expenses (which is not the class’s actual return). It assumes an account value of $1,000.00 on November 1, 2018, with the same investment held until April 30, 2019. Look in any other fund shareholder report to find its hypothetical example and you will be able to compare these expenses. Please remember that these hypothetical account values and expenses may not be used to estimate the actual ending account balance or expenses you paid for the period.
| 6 | JOHN HANCOCK GREATER CHINA OPPORTUNITIES FUND | SEMIANNUAL REPORT | |
Remember, these examples do not include any transaction costs, therefore, these examples will not help you to determine the relative total costs of owning different funds. If transaction costs were included, your expenses would have been higher. See the prospectuses for details regarding transaction costs.
SHAREHOLDER EXPENSE EXAMPLE CHART
| | | Account
value on
11-1-2018 | Ending
value on
4-30-2019 | Expenses
paid during
period ended
4-30-20191 | Annualized
expense
ratio |
| Class A | Actual expenses/actual returns | $1,000.00 | $1,161.00 | $9.16 | 1.71% |
| | Hypothetical example | 1,000.00 | 1,016.30 | 8.55 | 1.71% |
| Class B | Actual expenses/actual returns | 1,000.00 | 1,157.00 | 12.89 | 2.41% |
| | Hypothetical example | 1,000.00 | 1,012.80 | 12.03 | 2.41% |
| Class C | Actual expenses/actual returns | 1,000.00 | 1,156.90 | 12.89 | 2.41% |
| | Hypothetical example | 1,000.00 | 1,012.80 | 12.03 | 2.41% |
| Class I | Actual expenses/actual returns | 1,000.00 | 1,163.00 | 7.19 | 1.34% |
| | Hypothetical example | 1,000.00 | 1,018.10 | 6.71 | 1.34% |
| Class NAV | Actual expenses/actual returns | 1,000.00 | 1,162.90 | 6.92 | 1.29% |
| | Hypothetical example | 1,000.00 | 1,018.40 | 6.46 | 1.29% |
| 1 | Expenses are equal to the annualized expense ratio, multiplied by the average account value over the period, multiplied by 181/365 (to reflect the one-half year period). |
| | SEMIANNUAL REPORT | JOHN HANCOCK GREATER CHINA OPPORTUNITIES FUND | 7 |
AS OF 4-30-19 (unaudited)
| | | | | Shares | Value |
| Common stocks 102.6% | | | | | $48,917,628 |
| (Cost $30,730,080) | | | | | |
| China 55.0% | | | | | 26,232,643 |
| 58.com, Inc., ADR (A) | | | | 10,543 | 756,881 |
| Alibaba Group Holding, Ltd., ADR (A) | | | | 20,644 | 3,830,907 |
| AviChina Industry & Technology Company, Ltd., H Shares | | | | 560,000 | 329,533 |
| BeiGene, Ltd. (A) | | | | 34,000 | 328,628 |
| BYD Company, Ltd., H Shares | | | | 124,500 | 849,547 |
| China Construction Bank Corp., H Shares | | | | 2,539,000 | 2,238,295 |
| China National Building Material Company, Ltd., H Shares | | | | 972,000 | 904,656 |
| CNOOC, Ltd. | | | | 729,000 | 1,324,108 |
| ENN Energy Holdings, Ltd. | | | | 62,400 | 589,742 |
| Geely Automobile Holdings, Ltd. | | | | 209,000 | 421,006 |
| Greentown Service Group Company, Ltd. | | | | 592,000 | 510,958 |
| Industrial & Commercial Bank of China, Ltd., H Shares | | | | 2,316,500 | 1,742,379 |
| iQIYI, Inc., ADR (A) | | | | 29,287 | 647,536 |
| Lonking Holdings, Ltd. | | | | 1,582,000 | 537,946 |
| Microport Scientific Corp. | | | | 555,000 | 523,012 |
| Minth Group, Ltd. | | | | 148,000 | 467,899 |
| Momo, Inc., ADR | | | | 17,153 | 601,556 |
| PICC Property & Casualty Company, Ltd., H Shares | | | | 364,000 | 408,965 |
| Ping An Insurance Group Company of China, Ltd., H Shares | | | | 182,000 | 2,203,049 |
| TAL Education Group, ADR (A) | | | | 17,313 | 666,031 |
| Tencent Holdings, Ltd. | | | | 109,800 | 5,411,785 |
| Yanzhou Coal Mining Company, Ltd., H Shares | | | | 556,000 | 593,595 |
| Zhongsheng Group Holdings, Ltd. | | | | 131,000 | 344,629 |
| Hong Kong 28.1% | | | | | 13,378,449 |
| AIA Group, Ltd. | | | | 235,400 | 2,410,363 |
| BOC Hong Kong Holdings, Ltd. | | | | 231,000 | 1,035,390 |
| China Education Group Holdings, Ltd. | | | | 284,000 | 440,697 |
| China Everbright Greentech, Ltd. (B) | | | | 757,000 | 556,601 |
| China Overseas Land & Investment, Ltd. | | | | 292,000 | 1,094,023 |
| CK Asset Holdings, Ltd. | | | | 113,080 | 909,224 |
| CK Hutchison Holdings, Ltd. | | | | 29,000 | 304,904 |
| Galaxy Entertainment Group, Ltd. | | | | 75,000 | 561,693 |
| Guangdong Investment, Ltd. | | | | 166,000 | 310,531 |
| HKT Trust & HKT, Ltd. | | | | 299,000 | 463,572 |
| Hong Kong Exchanges & Clearing, Ltd. | | | | 44,000 | 1,528,508 |
| Kunlun Energy Company, Ltd. | | | | 392,000 | 414,642 |
| New World Development Company, Ltd. | | | | 432,000 | 715,699 |
| Sun Art Retail Group, Ltd. | | | | 912,500 | 797,465 |
| Swire Properties, Ltd. | | | | 149,800 | 609,583 |
| 8 | JOHN HANCOCK GREATER CHINA OPPORTUNITIES FUND | SEMIANNUAL REPORT | SEE NOTES TO FINANCIAL STATEMENTS |
| | | | | Shares | Value |
| Hong Kong (continued) | | | | | |
| Techtronic Industries Company, Ltd. | | | | 46,500 | $336,497 |
| Wharf Real Estate Investment Company, Ltd. | | | | 116,000 | 889,057 |
| Taiwan 19.5% | | | | | 9,306,536 |
| Asia Cement Corp. | | | | 139,000 | 188,139 |
| China Development Financial Holding Corp. | | | | 1,079,000 | 347,804 |
| Delta Electronics, Inc. | | | | 78,000 | 411,691 |
| Formosa Chemicals & Fibre Corp. | | | | 42,000 | 151,131 |
| Formosa Plastics Corp. | | | | 93,000 | 337,508 |
| Hotai Motor Company, Ltd. | | | | 21,000 | 317,815 |
| Largan Precision Company, Ltd. | | | | 3,000 | 450,368 |
| MediaTek, Inc. | | | | 17,000 | 162,937 |
| Mega Financial Holding Company, Ltd. | | | | 427,000 | 409,945 |
| Merida Industry Company, Ltd. | | | | 25,000 | 145,683 |
| Parade Technologies, Ltd. | | | | 13,000 | 220,398 |
| Realtek Semiconductor Corp. | | | | 47,000 | 318,675 |
| Simplo Technology Company, Ltd. | | | | 34,000 | 288,759 |
| Taiwan Semiconductor Manufacturing Company, Ltd. | | | | 531,089 | 4,459,040 |
| Taiwan Union Technology Corp. | | | | 73,000 | 266,490 |
| Teco Electric & Machinery Company, Ltd. | | | | 376,000 | 281,759 |
| Win Semiconductors Corp. | | | | 48,000 | 323,063 |
| Yeong Guan Energy Technology Group Company, Ltd. | | | | 85,000 | 225,331 |
|
| Total investments (Cost $30,730,080) 102.6% | | | $48,917,628 |
| Other assets and liabilities, net (2.6%) | | | (1,250,854) |
| Total net assets 100.0% | | | | | $47,666,774 |
| The percentage shown for each investment category is the total value of the category as a percentage of the net assets of the fund. |
| Security Abbreviations and Legend |
| ADR | American Depositary Receipt |
| (A) | Non-income producing security. |
| (B) | These securities are exempt from registration under Rule 144A of the Securities Act of 1933. Such securities may be resold, normally to qualified institutional buyers, in transactions exempt from registration. |
At 4-30-19, the aggregate cost of investments for federal income tax purposes was $30,730,080. Net unrealized appreciation aggregated to $18,187,548, of which $18,856,034 related to gross unrealized appreciation and $668,486 related to gross unrealized depreciation.
| SEE NOTES TO FINANCIAL STATEMENTS | SEMIANNUAL REPORT | JOHN HANCOCK GREATER CHINA OPPORTUNITIES FUND | 9 |
STATEMENT OF ASSETS AND LIABILITIES 4-30-19 (unaudited)
| Assets | |
| Unaffiliated investments, at value (Cost $30,730,080) | $48,917,628 |
| Foreign currency, at value (Cost $83,525) | 83,452 |
| Interest receivable | 11,157 |
| Receivable for fund shares sold | 121,361 |
| Receivable for investments sold | 1,525,471 |
| Receivable from affiliates | 31,234 |
| Other assets | 3,884 |
| Total assets | 50,694,187 |
| Liabilities | |
| Due to custodian | 1,395,627 |
| Payable for investments purchased | 146,501 |
| Payable for fund shares repurchased | 1,417,663 |
| Payable to affiliates | |
| Accounting and legal services fees | 3,044 |
| Transfer agent fees | 4,147 |
| Distribution and service fees | 10,201 |
| Trustees' fees | 180 |
| Other liabilities and accrued expenses | 50,050 |
| Total liabilities | 3,027,413 |
| Net assets | $47,666,774 |
| Net assets consist of | |
| Paid-in capital | $31,018,280 |
| Total distributable earnings (loss) | 16,648,494 |
| Net assets | $47,666,774 |
| |
| Net asset value per share | |
| Based on net asset value and shares outstanding - the fund has an unlimited number of shares authorized with no par value | |
| Class A ($30,440,248 ÷ 1,427,792 shares)1 | $21.32 |
| Class B ($238,364 ÷ 11,823 shares)1 | $20.16 |
| Class C ($1,569,495 ÷ 77,829 shares)1 | $20.17 |
| Class I ($6,271,545 ÷ 295,764 shares) | $21.20 |
| Class NAV ($9,147,122 ÷ 424,026 shares) | $21.57 |
| Maximum offering price per share | |
| Class A (net asset value per share ÷ 95%)2 | $22.44 |
| 1 | Redemption price per share is equal to net asset value less any applicable contingent deferred sales charge. |
| 2 | On single retail sales of less than $50,000. On sales of $50,000 or more and on group sales the offering price is reduced. |
| 10 | JOHN HANCOCK Greater China Opportunities Fund | SEMIANNUAL REPORT | SEE NOTES TO FINANCIAL STATEMENTS |
STATEMENT OF OPERATIONS For the six months ended 4-30-19 (unaudited)
| Investment income | |
| Dividends | $93,172 |
| Interest | 1,218 |
| Total investment income | 94,390 |
| Expenses | |
| Investment management fees | 248,084 |
| Distribution and service fees | 59,523 |
| Accounting and legal services fees | 5,928 |
| Transfer agent fees | 23,321 |
| Trustees' fees | 650 |
| Custodian fees | 21,268 |
| State registration fees | 59,962 |
| Printing and postage | 15,842 |
| Professional fees | 16,152 |
| Other | 14,514 |
| Total expenses | 465,244 |
| Less expense reductions | (63,953) |
| Net expenses | 401,291 |
| Net investment loss | (306,901) |
| Realized and unrealized gain (loss) | |
| Net realized gain (loss) on | |
| Unaffiliated investments and foreign currency transactions | (1,207,083) |
| | (1,207,083) |
| Change in net unrealized appreciation (depreciation) of | |
| Unaffiliated investments and translation of assets and liabilities in foreign currencies | 9,087,292 |
| | 9,087,292 |
| Net realized and unrealized gain | 7,880,209 |
| Increase in net assets from operations | $7,573,308 |
| | |
| SEE NOTES TO FINANCIAL STATEMENTS | SEMIANNUAL REPORT | JOHN HANCOCK Greater China Opportunities Fund | 11 |
STATEMENTS OF CHANGES IN NET ASSETS
| | Six months ended
4-30-19
(unaudited) | Year ended
10-31-18 |
| Increase (decrease) in net assets | | |
| From operations | | |
| Net investment income (loss) | $(306,901) | $198,683 |
| Net realized gain (loss) | (1,207,083) | 6,744,117 |
| Change in net unrealized appreciation (depreciation) | 9,087,292 | (14,287,928) |
| Increase (decrease) in net assets resulting from operations | 7,573,308 | (7,345,128) |
| Distributions to shareholders | | |
| From net investment income and net realized gain | | |
| Class A | (3,862,419) | (1,585,593) |
| Class B | (44,442) | (27,758) |
| Class C | (241,044) | (250,189) |
| Class I | (694,485) | (239,968) |
| Class NAV | (1,101,098) | (775,525) |
| Total distributions | (5,943,488) | (2,879,033) |
| From fund share transactions | (2,230,591) | (5,374,808) |
| Total decrease | (600,771) | (15,598,969) |
| Net assets | | |
| Beginning of period | 48,267,545 | 63,866,514 |
| End of period | $47,666,774 | $48,267,545 |
| 12 | JOHN HANCOCK Greater China Opportunities Fund | SEMIANNUAL REPORT | SEE NOTES TO FINANCIAL STATEMENTS |
| CLASS A SHARES Period ended | 4-30-191 | 10-31-18 | 10-31-17 | 10-31-16 | 10-31-15 | 10-31-14 |
| Per share operating performance | | | | | | |
| Net asset value, beginning of period | $20.92 | $25.42 | $19.11 | $19.46 | $22.73 | $21.70 |
| Net investment income (loss)2 | (0.13)3 | 0.11 | 0.09 | 0.06 | 0.09 | 0.24 |
| Net realized and unrealized gain (loss) on investments | 3.15 | (3.51) | 6.45 | 1.05 | (1.18) | 1.13 |
| Total from investment operations | 3.02 | (3.40) | 6.54 | 1.11 | (1.09) | 1.37 |
| Less distributions | | | | | | |
| From net investment income | (0.06) | (0.09) | (0.23) | (0.09) | (0.27) | (0.16) |
| From net realized gain | (2.56) | (1.01) | — | (1.37) | (1.91) | (0.18) |
| Total distributions | (2.62) | (1.10) | (0.23) | (1.46) | (2.18) | (0.34) |
| Net asset value, end of period | $21.32 | $20.92 | $25.42 | $19.11 | $19.46 | $22.73 |
| Total return (%)4,5 | 16.106 | (14.05) | 34.74 | 6.38 | (4.82) | 6.39 |
| Ratios and supplemental data | | | | | | |
| Net assets, end of period (in millions) | $30 | $31 | $36 | $30 | $34 | $47 |
| Ratios (as a percentage of average net assets): | | | | | | |
| Expenses before reductions | 1.957 | 1.81 | 1.78 | 1.86 | 1.75 | 1.71 |
| Expenses including reductions | 1.717 | 1.70 | 1.63 | 1.72 | 1.71 | 1.71 |
| Net investment income (loss) | (1.32)3,7 | 0.42 | 0.44 | 0.32 | 0.44 | 1.10 |
| Portfolio turnover (%) | 20 | 52 | 63 | 55 | 82 | 123 |
| 1 | Six months ended 4-30-19. Unaudited. |
| 2 | Based on average daily shares outstanding. |
| 3 | Net investment income is affected by the timing and frequency of the declaration of dividends by the securities in which the fund invests. |
| 4 | Total returns would have been lower had certain expenses not been reduced during the applicable periods. |
| 5 | Does not reflect the effect of sales charges, if any. |
| 6 | Not annualized. |
| 7 | Annualized. |
| SEE NOTES TO FINANCIAL STATEMENTS | SEMIANNUAL REPORT | JOHN HANCOCK Greater China Opportunities Fund | 13 |
| CLASS B SHARES Period ended | 4-30-191 | 10-31-18 | 10-31-17 | 10-31-16 | 10-31-15 | 10-31-14 |
| Per share operating performance | | | | | | |
| Net asset value, beginning of period | $19.93 | $24.34 | $18.32 | $18.75 | $21.93 | $20.97 |
| Net investment income (loss)2 | (0.20)3 | (0.13) | (0.09) | (0.10) | (0.12) | 0.01 |
| Net realized and unrealized gain (loss) on investments | 2.99 | (3.27) | 6.21 | 1.04 | (1.07) | 1.13 |
| Total from investment operations | 2.79 | (3.40) | 6.12 | 0.94 | (1.19) | 1.14 |
| Less distributions | | | | | | |
| From net investment income | — | — | (0.10) | — | (0.08) | — |
| From net realized gain | (2.56) | (1.01) | — | (1.37) | (1.91) | (0.18) |
| Total distributions | (2.56) | (1.01) | (0.10) | (1.37) | (1.99) | (0.18) |
| Net asset value, end of period | $20.16 | $19.93 | $24.34 | $18.32 | $18.75 | $21.93 |
| Total return (%)4,5 | 15.706 | (14.64) | 33.68 | 5.61 | (5.51) | 5.44 |
| Ratios and supplemental data | | | | | | |
| Net assets, end of period (in millions) | $—7 | $—7 | $1 | $1 | $2 | $5 |
| Ratios (as a percentage of average net assets): | | | | | | |
| Expenses before reductions | 2.658 | 2.51 | 2.56 | 2.56 | 2.62 | 2.67 |
| Expenses including reductions | 2.418 | 2.40 | 2.41 | 2.42 | 2.47 | 2.59 |
| Net investment income (loss) | (2.05)3,8 | (0.53) | (0.48) | (0.56) | (0.58) | 0.06 |
| Portfolio turnover (%) | 20 | 52 | 63 | 55 | 82 | 123 |
| 1 | Six months ended 4-30-19. Unaudited. |
| 2 | Based on average daily shares outstanding. |
| 3 | Net investment income is affected by the timing and frequency of the declaration of dividends by the securities in which the fund invests. |
| 4 | Total returns would have been lower had certain expenses not been reduced during the applicable periods. |
| 5 | Does not reflect the effect of sales charges, if any. |
| 6 | Not annualized. |
| 7 | Less than $500,000. |
| 8 | Annualized. |
| 14 | JOHN HANCOCK Greater China Opportunities Fund | SEMIANNUAL REPORT | SEE NOTES TO FINANCIAL STATEMENTS |
| CLASS C SHARES Period ended | 4-30-191 | 10-31-18 | 10-31-17 | 10-31-16 | 10-31-15 | 10-31-14 |
| Per share operating performance | | | | | | |
| Net asset value, beginning of period | $19.94 | $24.35 | $18.33 | $18.75 | $21.92 | $20.96 |
| Net investment income (loss)2 | (0.19)3 | (0.28) | (0.08) | (0.08) | (0.06) | 0.05 |
| Net realized and unrealized gain (loss) on investments | 2.98 | (3.12) | 6.20 | 1.03 | (1.13) | 1.09 |
| Total from investment operations | 2.79 | (3.40) | 6.12 | 0.95 | (1.19) | 1.14 |
| Less distributions | | | | | | |
| From net investment income | — | — | (0.10) | — | (0.07) | — |
| From net realized gain | (2.56) | (1.01) | — | (1.37) | (1.91) | (0.18) |
| Total distributions | (2.56) | (1.01) | (0.10) | (1.37) | (1.98) | (0.18) |
| Net asset value, end of period | $20.17 | $19.94 | $24.35 | $18.33 | $18.75 | $21.92 |
| Total return (%)4,5 | 15.696 | (14.63) | 33.66 | 5.66 | (5.51) | 5.45 |
| Ratios and supplemental data | | | | | | |
| Net assets, end of period (in millions) | $2 | $2 | $6 | $6 | $7 | $9 |
| Ratios (as a percentage of average net assets): | | | | | | |
| Expenses before reductions | 2.657 | 2.51 | 2.56 | 2.56 | 2.51 | 2.58 |
| Expenses including reductions | 2.417 | 2.40 | 2.41 | 2.42 | 2.47 | 2.57 |
| Net investment income (loss) | (2.03)3,7 | (1.14) | (0.38) | (0.44) | (0.30) | 0.24 |
| Portfolio turnover (%) | 20 | 52 | 63 | 55 | 82 | 123 |
| 1 | Six months ended 4-30-19. Unaudited. |
| 2 | Based on average daily shares outstanding. |
| 3 | Net investment income is affected by the timing and frequency of the declaration of dividends by the securities in which the fund invests. |
| 4 | Total returns would have been lower had certain expenses not been reduced during the applicable periods. |
| 5 | Does not reflect the effect of sales charges, if any. |
| 6 | Not annualized. |
| 7 | Annualized. |
| SEE NOTES TO FINANCIAL STATEMENTS | SEMIANNUAL REPORT | JOHN HANCOCK Greater China Opportunities Fund | 15 |
| CLASS I SHARES Period ended | 4-30-191 | 10-31-18 | 10-31-17 | 10-31-16 | 10-31-15 | 10-31-14 |
| Per share operating performance | | | | | | |
| Net asset value, beginning of period | $20.88 | $25.35 | $19.08 | $19.44 | $22.72 | $21.71 |
| Net investment income (loss)2 | (0.10)3 | 0.20 | 0.21 | 0.13 | 0.23 | 0.45 |
| Net realized and unrealized gain (loss) on investments | 3.12 | (3.49) | 6.35 | 1.05 | (1.25) | 1.01 |
| Total from investment operations | 3.02 | (3.29) | 6.56 | 1.18 | (1.02) | 1.46 |
| Less distributions | | | | | | |
| From net investment income | (0.14) | (0.17) | (0.29) | (0.17) | (0.35) | (0.27) |
| From net realized gain | (2.56) | (1.01) | — | (1.37) | (1.91) | (0.18) |
| Total distributions | (2.70) | (1.18) | (0.29) | (1.54) | (2.26) | (0.45) |
| Net asset value, end of period | $21.20 | $20.88 | $25.35 | $19.08 | $19.44 | $22.72 |
| Total return (%)4 | 16.305 | (13.70) | 35.09 | 6.74 | (4.43) | 6.79 |
| Ratios and supplemental data | | | | | | |
| Net assets, end of period (in millions) | $6 | $5 | $5 | $3 | $2 | $4 |
| Ratios (as a percentage of average net assets): | | | | | | |
| Expenses before reductions | 1.676 | 1.52 | 1.55 | 1.55 | 1.57 | 2.14 |
| Expenses including reductions | 1.346 | 1.34 | 1.34 | 1.34 | 1.34 | 1.34 |
| Net investment income (loss) | (0.97)3,6 | 0.81 | 1.02 | 0.70 | 1.06 | 2.02 |
| Portfolio turnover (%) | 20 | 52 | 63 | 55 | 82 | 123 |
| 1 | Six months ended 4-30-19. Unaudited. |
| 2 | Based on average daily shares outstanding. |
| 3 | Net investment income is affected by the timing and frequency of the declaration of dividends by the securities in which the fund invests. |
| 4 | Total returns would have been lower had certain expenses not been reduced during the applicable periods. |
| 5 | Not annualized. |
| 6 | Annualized. |
| 16 | JOHN HANCOCK Greater China Opportunities Fund | SEMIANNUAL REPORT | SEE NOTES TO FINANCIAL STATEMENTS |
| CLASS NAV SHARES Period ended | 4-30-191 | 10-31-18 | 10-31-17 | 10-31-16 | 10-31-15 | 10-31-14 |
| Per share operating performance | | | | | | |
| Net asset value, beginning of period | $21.20 | $25.72 | $19.35 | $19.70 | $22.98 | $21.95 |
| Net investment income (loss)2 | (0.09)3 | 0.08 | 0.17 | 0.15 | 0.20 | 0.62 |
| Net realized and unrealized gain (loss) on investments | 3.17 | (3.41) | 6.50 | 1.05 | (1.21) | 0.87 |
| Total from investment operations | 3.08 | (3.33) | 6.67 | 1.20 | (1.01) | 1.49 |
| Less distributions | | | | | | |
| From net investment income | (0.15) | (0.18) | (0.30) | (0.18) | (0.36) | (0.28) |
| From net realized gain | (2.56) | (1.01) | — | (1.37) | (1.91) | (0.18) |
| Total distributions | (2.71) | (1.19) | (0.30) | (1.55) | (2.27) | (0.46) |
| Net asset value, end of period | $21.57 | $21.20 | $25.72 | $19.35 | $19.70 | $22.98 |
| Total return (%)4 | 16.295 | (13.66) | 35.17 | 6.81 | (4.36) | 6.88 |
| Ratios and supplemental data | | | | | | |
| Net assets, end of period (in millions) | $9 | $9 | $17 | $12 | $12 | $12 |
| Ratios (as a percentage of average net assets): | | | | | | |
| Expenses before reductions | 1.546 | 1.40 | 1.44 | 1.44 | 1.32 | 1.25 |
| Expenses including reductions | 1.296 | 1.29 | 1.29 | 1.29 | 1.27 | 1.24 |
| Net investment income (loss) | (0.92)3,6 | 0.31 | 0.83 | 0.81 | 0.95 | 2.80 |
| Portfolio turnover (%) | 20 | 52 | 63 | 55 | 82 | 123 |
| 1 | Six months ended 4-30-19. Unaudited. |
| 2 | Based on average daily shares outstanding. |
| 3 | Net investment income is affected by the timing and frequency of the declaration of dividends by the securities in which the fund invests. |
| 4 | Total returns would have been lower had certain expenses not been reduced during the applicable periods. |
| 5 | Not annualized. |
| 6 | Annualized. |
| SEE NOTES TO FINANCIAL STATEMENTS | SEMIANNUAL REPORT | JOHN HANCOCK Greater China Opportunities Fund | 17 |
Notes to financial statements (unaudited)
Note 1 — Organization
John Hancock Greater China Opportunities Fund (the fund) is a series of John Hancock Investment Trust III (the Trust), an open-end management investment company organized as a Massachusetts business trust and registered under the Investment Company Act of 1940, as amended (the 1940 Act). The investment objective of the fund is to seek long-term capital appreciation.
The fund may offer multiple classes of shares. The shares currently outstanding are detailed in the Statement of assets and liabilities. Class A and Class C are offered to all investors. Class B shares are closed to new investors. Class I shares are offered to institutions and certain investors.Class NAV shares are offered to John Hancock affiliated funds of funds, retirement plans for employees of John Hancock and/or Manulife Financial Corporation (MFC), and certain 529 plans. Class B shares convert to Class A shares eight years after purchase. Class C shares convert to Class A shares ten years after purchase (certain exclusions may apply). Shareholders of each class have exclusive voting rights to matters that affect that class. The distribution and service fees, if any, and transfer agent fees for each class may differ.
At its in-person meeting held March 26-28, 2019, the Board of Trustees of the Trust (the "Board") approved the closing and liquidation of the fund pursuant to a Plan of Liquidation approved by the Board. The fund was closed to new orders from shareholders to purchase shares of the fund beginning on April 30, 2019. On May 17, 2019, the fund distributed prorata all of its net assets to its shareholders, and all outstanding shares were redeemed and cancelled.
Note 2 — Significant accounting policies
The financial statements have been prepared in conformity with accounting principles generally accepted in the United States of America (US GAAP), which require management to make certain estimates and assumptions as of the date of the financial statements. Actual results could differ from those estimates and those differences could be significant. The fund qualifies as an investment company under Topic 946 of Accounting Standards Codification of US GAAP.
Events or transactions occurring after the end of the fiscal period through the date that the financial statements were issued have been evaluated in the preparation of the financial statements. The following summarizes the significant accounting policies of the fund:
Security valuation.Investments are stated at value as of the scheduled close of regular trading on the New York Stock Exchange (NYSE), normally at 4:00 p.m., Eastern Time. In case of emergency or other disruption resulting in the NYSE not opening for trading or the NYSE closing at a time other than the regularly scheduled close, the net asset value (NAV) may be determined as of the regularly scheduled close of the NYSE pursuant to the fund's Valuation Policies and Procedures.
In order to value the securities, the fund uses the following valuation techniques: Equity securities held by the fund are typically valued at the last sale price or official closing price on the exchange or principal market where the security trades. In the event there were no sales during the day or closing prices are not available, the securities are valued using the last available bid price. Foreign securities and currencies are valued in U.S. dollars based on foreign currency exchange rates supplied by an independent pricing vendor.
In certain instances, the Pricing Committee may determine to value equity securities using prices obtained from another exchange or market if trading on the exchange or market on which prices are typically obtained did not open for trading as scheduled, or if trading closed earlier than scheduled, and trading occurred as normal on another exchange or market.
Other portfolio securities and assets, for which reliable market quotations are not readily available, are valued at fair value as determined in good faith by the fund's Pricing Committee following procedures established by the Board of Trustees. The frequency with which these fair valuation procedures are used cannot be predicted and fair value of
SEMIANNUAL REPORT | JOHN HANCOCK GREATER CHINA OPPORTUNITIES FUND 18
securities may differ significantly from the value that would have been used had a ready market for such securities existed. Trading in foreign securities may be completed before the scheduled daily close of trading on the NYSE. Significant events at the issuer or market level may affect the values of securities between the time when the valuation of the securities is generally determined and the close of the NYSE. If a significant event occurs, these securities may be fair valued, as determined in good faith by the fund's Pricing Committee, following procedures established by the Board of Trustees. The fund uses fair value adjustment factors provided by an independent pricing vendor to value certain foreign securities in order to adjust for events that may occur between the close of foreign exchanges or markets and the close of the NYSE.
The fund uses a three-tier hierarchy to prioritize the pricing assumptions, referred to as inputs, used in valuation techniques to measure fair value. Level 1 includes securities valued using quoted prices in active markets for identical securities. Level 2 includes securities valued using other significant observable inputs. Observable inputs may include quoted prices for similar securities, interest rates, prepayment speeds and credit risk. Prices for securities valued using these inputs are received from independent pricing vendors and brokers and are based on an evaluation of the inputs described. Level 3 includes securities valued using significant unobservable inputs when market prices are not readily available or reliable, including the fund's own assumptions in determining the fair value of investments. Factors used in determining value may include market or issuer specific events or trends, changes in interest rates and credit quality. The inputs or methodology used for valuing securities are not necessarily an indication of the risks associated with investing in those securities. Changes in valuation techniques and related inputs may result in transfers into or out of an assigned level within the disclosure hierarchy.
The following is a summary of the values by input classification of the fund's investments as of April 30, 2019, by major security category or type:
| | | | | | |
| | Total
value at
4-30-19 | Level 1
quoted
price | Level 2
significant
observable
inputs | Level 3
significant
unobservable
inputs |
| Investments in securities: | | | | |
| Assets | | | | |
| Common stocks | | | | |
| | China | $26,232,643 | $6,502,911 | $19,729,732 | — |
| | Hong Kong | 13,378,449 | — | 13,378,449 | — |
| | Taiwan | 9,306,536 | — | 9,306,536 | — |
| Total investments in securities | $48,917,628 | $6,502,911 | $42,414,717 | — |
Security transactions and related investment income. Investment security transactions are accounted for on a trade date plus one basis for daily NAV calculations. However, for financial reporting purposes, investment transactions are reported on trade date. Interest income is accrued as earned. Dividend income is recorded on the ex-date, except for dividends of foreign securities where the dividend may not be known until after the ex-date. In those cases, dividend income, net of withholding taxes, is recorded when the fund becomes aware of the dividends. Non-cash dividends, if any, are recorded at the fair market value of the securities received. Gains and losses on securities sold are determined on the basis of identified cost and may include proceeds from litigation.
Foreign investing. Assets, including investments, and liabilities denominated in foreign currencies are translated into U.S. dollar values each day at the prevailing exchange rate. Purchases and sales of securities, income and expenses are translated into U.S. dollars at the prevailing exchange rate on the date of the transaction. The effect of changes in foreign currency exchange rates on the value of securities is reflected as a component of the realized and
SEMIANNUAL REPORT | JOHN HANCOCK GREATER CHINA OPPORTUNITIES FUND 19
unrealized gains (losses) on investments. Foreign investments are subject to a decline in the value of a foreign currency versus the U.S. dollar, which reduces the dollar value of securities denominated in that currency.
Funds that invest internationally generally carry more risk than funds that invest strictly in U.S. securities. Risks can result from differences in economic and political conditions, regulations, market practices (including higher transaction costs), accounting standards and other factors.
Line of credit.The fund may have the ability to borrow from banks for temporary or emergency purposes, including meeting redemption requests that otherwise might require the untimely sale of securities. Pursuant to the fund custodian agreement, the custodian may loan money to the fund to make properly authorized payments. The fund is obligated to repay the custodian for any overdraft, including any related costs or expenses. The custodian may have a lien, security interest or security entitlement in any fund property that is not otherwise segregated or pledged, to the extent of any overdraft, and to the maximum extent permitted by law.
The fund and other affiliated funds have entered into a syndicated line of credit agreement with Citibank, N.A. as the administrative agent that enables them to participate in a $750 million unsecured committed line of credit. Excluding commitments designated for a certain fund and subject to the needs of all other affiliated funds, the fund can borrow up to an aggregate commitment amount of $500 million, subject to asset coverage and other limitations as specified in the agreement. A commitment fee payable at the end of each calendar quarter, based on the average daily unused portion of the line of credit, is charged to each participating fund based on a combination of fixed and asset based allocations and is reflected in Other expenses on the Statement of operations. For the six months ended April 30, 2019, the fund had no borrowings under the line of credit. Commitment fees for the six months ended April 30, 2019 were $1,007.
Expenses. Within the John Hancock group of funds complex, expenses that are directly attributable to an individual fund are allocated to such fund. Expenses that are not readily attributable to a specific fund are allocated among all funds in an equitable manner, taking into consideration, among other things, the nature and type of expense and the fund's relative net assets. Expense estimates are accrued in the period to which they relate and adjustments are made when actual amounts are known.
Class allocations. Income, common expenses and realized and unrealized gains (losses) are determined at the fund level and allocated daily to each class of shares based on the net assets of the class. Class-specific expenses, such as distribution and service fees, if any, and transfer agent fees, for all classes, are charged daily at the class level based on the net assets of each class and the specific expense rates applicable to each class.
Federal income taxes. The fund intends to continue to qualify as a regulated investment company by complying with the applicable provisions of the Internal Revenue Code and will not be subject to federal income tax on taxable income that is distributed to shareholders. Therefore, no federal income tax provision is required.
As of October 31, 2018, the fund had no uncertain tax positions that would require financial statement recognition, derecognition or disclosure. The fund's federal tax returns are subject to examination by the Internal Revenue Service for a period of three years.
Distribution of income and gains. Distributions to shareholders from net investment income and net realized gains, if any, are recorded on the ex-date. The fund typically declares and pays dividends and capital gain distributions, if any, annually.
Distributions paid by the fund with respect to each class of shares are calculated in the same manner, at the same time and in the same amount, except for the effect of class level expenses that may be applied differently to each class.
SEMIANNUAL REPORT | JOHN HANCOCK GREATER CHINA OPPORTUNITIES FUND 20
Such distributions, on a tax basis, are determined in conformity with income tax regulations, which may differ from US GAAP. Distributions in excess of tax basis earnings and profits, if any, are reported in the fund's financial statements as a return of capital. The final determination of tax characteristics of the fund's distribution will occur at the end of the year and will subsequently be reported to shareholders.
Capital accounts within the financial statements are adjusted for permanent book-tax differences. These adjustments have no impact on net assets or the results of operations. Temporary book-tax differences, if any, will reverse in a subsequent period. Book-tax differences are primarily attributable to treating a portion of the proceeds from redemptions as distributions for tax purposes.
Note 3 — Guarantees and indemnifications
Under the Trust's organizational documents, its Officers and Trustees are indemnified against certain liabilities arising out of the performance of their duties to the Trust, including the fund. Additionally, in the normal course of business, the fund enters into contracts with service providers that contain general indemnification clauses. The fund's maximum exposure under these arrangements is unknown, as this would involve future claims that may be made against the fund that have not yet occurred. The risk of material loss from such claims is considered remote.
Note 4 — Fees and transactions with affiliates
John Hancock Advisers, LLC (the Advisor) serves as investment advisor for the fund. John Hancock Funds, LLC (the Distributor), an affiliate of the Advisor, serves as principal underwriter of the fund. The Advisor and the Distributor are indirect, wholly owned subsidiaries of MFC.
Management fee. The fund has an investment management agreement with the Advisor under which the fund pays a daily management fee to the Advisor equivalent, on an annual basis, to the sum of: (a) 1.00% of the first $1 billion of the fund's average daily net assets; (b) 0.95% of the next $1 billion of the fund's average daily net assets and (c) 0.90% of the fund's average daily net assets in excess of $2 billion. The Advisor has a subadvisory agreement with Manulife Investment Management (North America) Limited, an indirectly owned subsidiary of MFC and an affiliate of the Advisor. Prior to May 7, 2019, Manulife Investment Management (North America) Limited was known as John Hancock Asset Management a division of Manulife Asset Management (North America) Limited. The fund is not responsible for payment of the subadvisory fees.
The Advisor has contractually agreed to waive a portion of its management fee and/or reimburse expenses for certain funds of the John Hancock funds complex, including the fund (the participating portfolios). This waiver is based upon aggregate net assets of all the participating portfolios. The amount of the reimbursement is calculated daily and allocated among all the participating portfolios in proportion to the daily net assets of each fund. During the six months ended April 30, 2019, this waiver amounted to 0.01% of the fund's average net assets (on an annualized basis). This agreement expires on June 30, 2020, unless renewed by mutual agreement of the fund and the Advisor based upon a determination that this is appropriate under the circumstances at that time.
The Advisor has contractually agreed to reduce its management fee for the fund, or if necessary, make payment to the fund, in an amount equal to the amount by which the fund's expenses exceed 0.30% of average daily net assets. Expenses means all the expenses of the fund, excluding taxes, brokerage commissions, interest expense, litigation and indemnification expenses and other extraordinary expenses not incurred in the ordinary course of the fund's business, advisory fees, class-specific expenses, borrowing costs, prime brokerage fees, acquired fund fees and expenses paid indirectly, and short dividend expense. This current limitation expires on February 29, 2020, unless renewed by mutual agreement of the fund and Advisor based upon a determination that this is appropriate under the circumstances at that time.
SEMIANNUAL REPORT | JOHN HANCOCK GREATER CHINA OPPORTUNITIES FUND 21
The Advisor has contractually agreed to reduce its management fee or, if necessary, make payment to Class I shares to limit expenses for the class, to the extent that expense exceed 1.34% of average daily net assets of the class. Expenses exclude taxes, brokerage commissions, interest expense, acquired fund fees and expenses paid indirectly, litigation and indemnification expenses and other extraordinary expenses not incurred in the ordinary course of the fund's business, borrowing costs, prime brokerage fees, and short dividend expense. This current limitation expires on February 29, 2020, unless renewed by mutual agreement of the fund and Advisor based upon a determination that this is appropriate under the circumstances at that time.
For the six months ended April 30, 2019, the expense reduction described above amounted to the following:
| | | | | |
| Class | Expense reduction | | Class | Expense reduction |
| Class A | $39,772 | | Class I | $10,170 |
| Class B | 351 | | Class NAV | 11,478 |
| Class C | 2,182 | | Total | $63,953 |
Expenses waived or reimbursed in the current fiscal period are not subject to recapture in future fiscal periods.
The investment management fees, including the impact of the waiver and reimbursements as described above, incurred for the six months ended April 30, 2019 were equivalent to a net annual effective rate of 0.74% of the fund's average daily net assets.
Accounting and legal services. Pursuant to a service agreement, the fund reimburses the Advisor for all expenses associated with providing the administrative, financial, legal, compliance, accounting and recordkeeping services to the fund, including the preparation of all tax returns, periodic reports to shareholders and regulatory reports, among other services. These expenses are allocated to each share class based on its relative net assets at the time the expense was incurred. These accounting and legal services fees incurred for the six months ended April 30, 2019 amounted to an annual rate of 0.02% of the fund's average daily net assets.
Distribution and service plans. The fund has a distribution agreement with the Distributor. The fund has adopted distribution and service plans with respect to Class A, Class B and Class C shares pursuant to Rule 12b-1 under the 1940 Act, to pay the Distributor for services provided as the distributor of shares of the fund. The fund may pay up to the following contractual rates of distribution and service fees under these arrangements, expressed as an annual percentage of average daily net assets for each class of the fund's shares.
| | |
| Class | Rule 12b-1 fee |
| Class A | 0.30% |
| Class B | 1.00% |
| Class C | 1.00% |
Sales charges. Class A shares are assessed up-front sales charges, which resulted in payments to the Distributor amounting to $14,721 for the six months ended April 30, 2019. Of this amount, $2,396 was retained and used for printing prospectuses, advertising, sales literature and other purposes, $12,233 was paid as sales commissions to broker-dealers and $92 was paid as sales commissions to sales personnel of Signator Investors, Inc., which had been a broker-dealer affiliate of the Advisor through November 2, 2018.
Class A, Class B and Class C shares may be subject to contingent deferred sales charges (CDSCs). Certain Class A shares that are acquired through purchases of $1 million or more and are redeemed within one year of purchase are subject to a 1.00% sales charge. Class B shares that are redeemed within six years of purchase are subject to CDSCs, at declining rates, beginning at 5.00%. Class C shares that are redeemed within one year of purchase are subject to a 1.00% CDSC. CDSCs are applied to the lesser of the current market value at the time of redemption or the original
SEMIANNUAL REPORT | JOHN HANCOCK GREATER CHINA OPPORTUNITIES FUND 22
purchase cost of the shares being redeemed. Proceeds from CDSCs are used to compensate the Distributor for providing distribution-related services in connection with the sale of these shares. During the six months ended April 30, 2019, CDSCs received by the Distributor amounted to $45, $1 and $302 for Class Class A, Class B and Class C shares, respectively.
Transfer agent fees. The John Hancock group of funds has a complex-wide transfer agent agreement with John Hancock Signature Services, Inc. (Signature Services), an affiliate of the Advisor. The transfer agent fees paid to Signature Services are determined based on the cost to Signature Services (Signature Services Cost) of providing recordkeeping services. It also includes out-of-pocket expenses, including payments made to third-parties for recordkeeping services provided to their clients who invest in one or more John Hancock funds. In addition, Signature Services Cost may be reduced by certain fees that Signature Services receives in connection with retirement and small accounts. Signature Services Cost is calculated monthly and allocated, as applicable, to five categories of share classes: Retail Share and Institutional Share Classes of Non-Municipal Bond Funds, Class R6 Shares, Retirement Share Classes and Municipal Bond Share Classes. Within each of these categories, the applicable costs are allocated to the affected John Hancock affiliated funds and/or classes, based on the relative average daily net assets.
Class level expenses. Class level expenses for the six months ended April 30, 2019 were:
| | | |
| Class | Distribution and service fees | Transfer agent fees |
| Class A | $48,628 | $18,220 |
| Class B | 1,534 | 172 |
| Class C | 9,361 | 1,053 |
| Class I | — | 3,876 |
| Total | $59,523 | $23,321 |
Trustee expenses.The fund compensates each Trustee who is not an employee of the Advisor or its affiliates. The costs of paying Trustee compensation and expenses are allocated to the fund based on its net assets relative to other funds within the John Hancock group of funds complex.
Note 5 — Fund share transactions
Transactions in fund shares for the six months ended April 30, 2019 and for the year ended October 31, 2018 were as follows:
| | | | | | | | | | | | | | | | | | | | | | | | | | | |
| | | | | | | | | |
| | | | | | | | Six months ended 4-30-19 | | | | | | | | | | | | Year ended 10-31-18 | |
| | | | | Shares | | | Amount | | | | | | | | | Shares | | | Amount | |
| | Class A shares | | | | | | | | | | | | | | | | | | | |
| | Sold | | | 104,236 | | | $2,102,466 | | | | | | | | | 445,719 | | | $11,750,291 | |
| | Distributions reinvested | | | 196,520 | | | 3,692,603 | | | | | | | | | 60,500 | | | 1,502,208 | |
| | Repurchased | | | (371,677 | ) | | (7,789,336 | ) | | | | | | | | (411,610 | ) | | (10,443,262 | ) |
| | Net increase (decrease) | | | (70,921 | ) | | $(1,994,267 | ) | | | | | | | | 94,609 | | | $2,809,237 | |
| | Class B shares | | | | | | | | | | | | | | | | | | | |
| | Sold | | | 65 | | | $1,163 | | | | | | | | | 916 | | | $23,484 | |
| | Distributions reinvested | | | 2,404 | | | 42,810 | | | | | | | | | 1,104 | | | 26,277 | |
| | Repurchased | | | (9,804 | ) | | (187,511 | ) | | | | | | | | (11,908 | ) | | (289,110 | ) |
| | Net decrease | | | (7,335 | ) | | $(143,538 | ) | | | | | | | | (9,888 | ) | | $(239,349 | ) |
SEMIANNUAL REPORT | JOHN HANCOCK GREATER CHINA OPPORTUNITIES FUND 23
| | | | | | | | | | | | | | | | | | | | | | | | | | | |
| | | | | | | | | |
| | | | | | | | Six months ended 4-30-19 | | | | | | | | | | | | Year ended 10-31-18 | |
| | | | | Shares | | | Amount | | | | | | | | | Shares | | | Amount | |
| | Class C shares | | | | | | | | | | | | | | | | | | | |
| | Sold | | | 12,114 | | | $228,992 | | | | | | | | | 21,978 | | | $543,413 | |
| | Distributions reinvested | | | 11,251 | | | 200,498 | | | | | | | | | 9,735 | | | 231,784 | |
| | Repurchased | | | (45,435 | ) | | (892,848 | ) | | | | | | | | (179,731 | ) | | (4,568,304 | ) |
| | Net decrease | | | (22,070 | ) | | $(463,358 | ) | | | | | | | | (148,018 | ) | | $(3,793,107 | ) |
| | Class I shares | | | | | | | | | | | | | | | | | | | |
| | Sold | | | 186,835 | | | $3,834,396 | | | | | | | | | 227,839 | | | $5,702,995 | |
| | Distributions reinvested | | | 36,927 | | | 689,059 | | | | | | | | | 8,570 | | | 211,691 | |
| | Repurchased | | | (186,621 | ) | | (3,871,848 | ) | | | | | | | | (161,517 | ) | | (3,915,735 | ) |
| | Net increase | | | 37,141 | | | $651,607 | | | | | | | | | 74,892 | | | $1,998,951 | |
| | Class NAV shares | | | | | | | | | | | | | | | | | | | |
| | Sold | | | 42 | | | $925 | | | | | | | | | 61,594 | | | $1,485,989 | |
| | Distributions reinvested | | | 58,013 | | | 1,101,097 | | | | | | | | | 30,934 | | | 775,525 | |
| | Repurchased | | | (65,146 | ) | | (1,383,057 | ) | | | | | | | | (313,688 | ) | | (8,412,054 | ) |
| | Net decrease | | | (7,091 | ) | | $(281,035 | ) | | | | | | | | (221,160 | ) | | $(6,150,540 | ) |
| | Total net decrease | | | (70,276 | ) | | $(2,230,591 | ) | | | | | | | | (209,565 | ) | | $(5,374,808 | ) |
Affiliates of the fund owned 100% and 3% of shares of Class NAV and Class I, respectively, on April 30, 2019. Such concentration of shareholders' capital could have a material effect on the fund if such shareholders redeem from the fund.
Note 6 — Purchase and sale of securities
Purchases and sales of securities, other than short-term investments, amounted to $10,084,173 and $16,605,293, respectively, for the six months ended April 30, 2019.
Note 7 — Industry or sector risk
The fund may invest a large percentage of its assets in one or more particular industries or sectors of the economy. If a large percentage of the fund's assets are economically tied to a single or small number of industries or sectors of the economy, the fund will be less diversified than a more broadly diversified fund, and it may cause the fund to underperform if that industry or sector underperforms. In addition, focusing on a particular industry or sector may make the fund's NAV more volatile. Further, a fund that invests in particular industries or sectors is particularly susceptible to the impact of market, economic, regulatory and other factors affecting those industries or sectors.
Note 8 — Greater China risk
Investments in the Greater China region may be subject to special risks, such as less developed markets, restrictions on monetary repatriation or other adverse government actions, nationalization, or expropriation of assets. Although they are larger and/or more established than many emerging markets, the markets of Greater China function in manyways as emerging markets, and carry the high levels of risks associatedwith emerging markets. In addition, there are risks particular to the region. For example, investments in Taiwan could be adversely affected by its political relationship with China. A small number of companies and industries represent a relatively large portion of the Greater China market as a whole. All of these factors mean that the fund is more likely to experience higher volatility and lower liquidity than a portfolio that invests mainly in U.S. stocks.
SEMIANNUAL REPORT | JOHN HANCOCK GREATER CHINA OPPORTUNITIES FUND 24
Note 9 — Investment by affiliated funds
Certain investors in the fund are affiliated funds that are managed by the Advisor and its affiliates. The affiliated funds do not invest in the fund for the purpose of exercising management or control; however, this investment may represent a significant portion of the fund's net assets. At April 30, 2019, within the John Hancock group of funds complex, John Hancock Funds II Multimanager Lifestyle Aggressive Portfolio had an affiliated ownership of 5% or more at 19.2% of the fund's net assets.
SEMIANNUAL REPORT | JOHN HANCOCK GREATER CHINA OPPORTUNITIES FUND 25
| | |
Trustees
Hassell H. McClellan,Chairperson
Steven R. Pruchansky,Vice Chairperson
Andrew G. Arnott†
Charles L. Bardelis*
James R. Boyle
Peter S. Burgess*
William H. Cunningham
Grace K. Fey
Marianne Harrison†#
Theron S. Hoffman*
Deborah C. Jackson
James M. Oates
Gregory A. Russo
Officers
Andrew G. Arnott
President
Francis V. Knox, Jr.
Chief Compliance Officer
Charles A. Rizzo
Chief Financial Officer
Salvatore Schiavone
Treasurer
Christopher (Kit) Sechler**
Secretary and Chief Legal Officer
| Investment advisor
John Hancock Advisers, LLC
Subadvisor
Manulife Investment Management (North America) Limited
Portfolio Managers
Ronald Chan, CFA
Kai-Kong Chay, CFA
Principal distributor
John Hancock Funds, LLC
Custodian
Citibank, N.A.
Transfer agent
John Hancock Signature Services, Inc.
Legal counsel
K&L Gates LLP
|
* Member of the Audit Committee
† Non-Independent Trustee
#Effective 6-19-18
**Effective 9-13-18
The fund's proxy voting policies and procedures, as well as the fund proxy voting record for the most recent twelve-month period ended June 30, are available free of charge on the Securities and Exchange Commission (SEC) website at sec.gov or on our website.
All of the fund's holdings as of the end of the third month of every fiscal quarter are filed with the SEC on Form N-PORT within 60 days of the end of the fiscal quarter. The fund's Form N-PORT filings are available on our website and the SEC's website, sec.gov.
We make this information on your fund, as well asmonthly portfolio holdings, and other fund details available on our website at jhinvestments.com or by calling 800-225-5291.
| | | | |
| | You can also contact us: |
| | 800-225-5291
jhinvestments.com | Regular mail:
John Hancock Signature Services, Inc.
P.O. Box 55913
Boston, MA 02205-5913
| Express mail:
John Hancock Signature Services, Inc.
2000 Crown Colony Drive
Suite 55913
Quincy, MA 02169-0953
|
SEMIANNUAL REPORT | JOHN HANCOCK GREATER CHINA OPPORTUNITIES FUND 26
John Hancock family of funds
| | | |
DOMESTIC EQUITY FUNDS
Blue Chip Growth
Classic Value
Disciplined Value
Disciplined Value Mid Cap
Equity Income
Financial Industries
Fundamental All Cap Core
Fundamental Large Cap Core
Fundamental Large Cap Value
New Opportunities
Regional Bank
Small Cap Core
Small Cap Growth
Small Cap Value
U.S. Global Leaders Growth
U.S. Quality Growth
Value Equity
GLOBAL AND INTERNATIONAL EQUITY FUNDS
Disciplined Value International
Emerging Markets
Emerging Markets Equity
Fundamental Global Franchise
Global Equity
Global Shareholder Yield
Global Thematic Opportunities
International Dynamic Growth
International Growth
International Small Company
| | INCOME FUNDS
Bond
California Tax-Free Income
Emerging Markets Debt
Floating Rate Income
Government Income
High Yield
High Yield Municipal Bond
Income
Investment Grade Bond
Money Market
Short Duration Credit Opportunities
Spectrum Income
Strategic Income Opportunities
Tax-Free Bond
ALTERNATIVE AND SPECIALTY FUNDS
Absolute Return Currency
Alternative Asset Allocation
Disciplined Alternative Yield
Global Absolute Return Strategies
Infrastructure
Seaport Long/Short
|
A fund's investment objectives, risks, charges, and expenses should be considered carefully before investing. The prospectus contains this and other important information about the fund. To obtain a prospectus, contact your financial professional, call John Hancock Investments at 800-225-5291, or visit our website at jhinvestments.com. Please read the prospectus carefully before investing or sending money.
| | | |
ASSET ALLOCATION
Balanced
Income Allocation
Multi-Index Lifetime Portfolios
Multi-Index Preservation Portfolios
Multimanager Lifestyle Portfolios
Multimanager Lifetime Portfolios
Retirement Income 2040
EXCHANGE-TRADED FUNDS
John Hancock Multifactor Consumer Discretionary ETF
John Hancock Multifactor Consumer Staples ETF
John Hancock Multifactor Developed International ETF
John Hancock Multifactor Emerging Markets ETF
John Hancock Multifactor Energy ETF
John Hancock Multifactor Financials ETF
John Hancock Multifactor Healthcare ETF
John Hancock Multifactor Industrials ETF
John Hancock Multifactor Large Cap ETF
John Hancock Multifactor Materials ETF
John Hancock Multifactor Media and
Communications ETF
John Hancock Multifactor Mid Cap ETF
John Hancock Multifactor Small Cap ETF
John Hancock Multifactor Technology ETF
John Hancock Multifactor Utilities ETF
| | ENVIRONMENTAL, SOCIAL, AND
GOVERNANCE FUNDS
ESG All Cap Core
ESG Core Bond
ESG International Equity
ESG Large Cap Core
CLOSED-END FUNDS
Financial Opportunities
Hedged Equity & Income
Income Securities Trust
Investors Trust
Preferred Income
Preferred Income II
Preferred Income III
Premium Dividend
Tax-Advantaged Dividend Income
Tax-Advantaged Global Shareholder Yield
|
John Hancock Multifactor ETF shares are bought and sold at market price (not NAV), and are not individually redeemed
from the fund. Brokerage commissions will reduce returns.
John Hancock ETFs are distributed by Foreside Fund Services, LLC, and are subadvised by Dimensional Fund Advisors LP.
Foreside is not affiliated with John Hancock Funds, LLC or Dimensional Fund Advisors LP.
Dimensional Fund Advisors LP receives compensation from John Hancock in connection with licensing rights to the
John Hancock Dimensional indexes. Dimensional Fund Advisors LP does not sponsor, endorse, or sell, and makes no
representation as to the advisability of investing in, John Hancock Multifactor ETFs.
John Hancock Investment Management
A trusted brand
John Hancock Investment Management is a premier asset manager
representing one of America's most trusted brands, with a heritage of
financial stewardship dating back to 1862. Helping our shareholders
pursue their financial goals is at the core of everything we do. It's why
we support the role of professional financial advice and operate with
the highest standards of conduct and integrity.
A better way to invest
We serve investors globally through a unique multimanager approach:
We search the world to find proven portfolio teams with specialized
expertise for every strategy we offer, then we apply robust investment
oversight to ensure they continue to meet our uncompromising
standards and serve the best interests of our shareholders.
Results for investors
Our unique approach to asset management enables us to provide
a diverse set of investments backed by some of the world's best
managers, along with strong risk-adjusted returns across asset classes.
John Hancock Funds, LLC n Member FINRA, SIPC
200 Berkeley Street n Boston, MA 02116-5010 n 800-225-5291 n jhinvestments.com
This report is for the information of the shareholders of John Hancock Greater China Opportunities Fund. It is not authorized for distribution to prospective investors unless preceded or accompanied by a prospectus.
ITEM 2. CODE OF ETHICS.
Not applicable at this time.
ITEM 3. AUDIT COMMITTEE FINANCIAL EXPERT.
Not applicable at this time.
ITEM 4. PRINCIPAL ACCOUNTANT FEES AND SERVICES.
Not applicable at this time.
ITEM 5. AUDIT COMMITTEE OF LISTED REGISTRANTS.
Not applicable at this time.
ITEM 6. SCHEDULE OF INVESTMENTS.
(a) Not applicable.
(b) Not applicable.
ITEM 7. DISCLOSURE OF PROXY VOTING POLICIES AND PROCEDURES FOR CLOSED-END MANAGEMENT INVESTMENT COMPANIES.
Not applicable.
ITEM 8. PORTFOLIO MANAGERS OF CLOSED-END MANAGEMENT INVESTMENT COMPANIES.
Not applicable.
ITEM 9. PURCHASES OF EQUITY SECURITIES BY CLOSED-END MANAGEMENT INVESTMENT COMPANY AND AFFILIATED PURCHASERS.
Not applicable.
ITEM 10. SUBMISSION OF MATTERS TO A VOTE OF SECURITY HOLDERS.
The registrant has adopted procedures by which shareholders may recommend nominees to the registrant’s Board of Trustees. A copy of the procedures is filed as an exhibit to this Form N-CSR. See attached “John Hancock Funds – Nominating, Governance and Administration Committee Charter.”
ITEM 11. CONTROLS AND PROCEDURES.
(a) Based upon their evaluation of the registrant's disclosure controls and procedures as conducted within 90 days of the filing date of this Form N-CSR, the registrant's principal executive officer and principal financial officer have concluded that those disclosure controls and procedures provide reasonable assurance that the material information required to be disclosed by the registrant on this report is recorded, processed, summarized and reported within the time periods specified in the Securities and Exchange Commission's rules and forms.
(b) There were no changes in the registrant's internal control over financial reporting that occurred during the second fiscal quarter of the period covered by this report that have materially affected, or are reasonably likely to materially affect, the registrant's internal control over financial reporting.
ITEM 12. DISCLOSURE OF SECURITIES LENDING ACTIVITIES FOR CLOSED-END MANAGEMENT INVESTMENT COMPANIES.: Not applicable.
ITEM 13. EXHIBITS.
(a) Separate certifications for the registrant's principal executive officer and principal financial officer, as required by Section 302 of the Sarbanes-Oxley Act of 2002 and Rule 30a-2(a) under the Investment Company Act of 1940, are attached.
(b) Separate certifications for the registrant's principal executive officer and principal financial officer, as required by 18 U.S.C. Section 1350, as adopted pursuant to Section 906 of the Sarbanes-Oxley Act of 2002, and Rule 30a-2(b) under the Investment Company Act of 1940, are attached. The certifications furnished pursuant to this paragraph are not deemed to be "filed" for purposes of Section 18 of the Securities Exchange Act of 1934, or otherwise subject to the liability of that section. Such certifications are not deemed to be incorporated by reference into any filing under the Securities Act of 1933 or the Securities Exchange Act of 1934, except to the extent that the Registrant specifically incorporates them by reference.
(c)(1) Submission of Matters to a Vote of Security Holders is attached. See attached “John Hancock Funds – Nominating, Governance and Administration Committee Charter.”
SIGNATURES
Pursuant to the requirements of the Securities Exchange Act of 1934 and the Investment Company Act of 1940, the registrant has duly caused this report to be signed on its behalf by the undersigned, thereunto duly authorized.
John Hancock Investment Trust III
| | |
| By: | /s/ Andrew Arnott |
| Andrew Arnott |
| President |
| |
| Date: | June 21, 2019 |
Pursuant to the requirements of the Securities Exchange Act of 1934 and the Investment Company Act of 1940, this report has been signed below by the following persons on behalf of the registrant and in the capacities and on the dates indicated.
| | |
| By: | /s/ Andrew Arnott |
| Andrew Arnott |
| President |
| |
| Date: | June 21, 2019 |
| | |
| | |
| |
| By: | /s/ Charles A. Rizzo |
| Charles A. Rizzo |
| Chief Financial Officer |
| | |
| Date: | June 21, 2019 |