UNITED STATES
SECURITIES AND EXCHANGE COMMISSION
WASHINGTON, D. C. 20549
FORM N-CSRS
Investment Company Act file number: 811-04632
The European Equity Fund, Inc.
(Exact Name of Registrant as Specified in Charter)
875 Third Avenue
New York, NY 10022-6225
(Address of Principal Executive Offices) (Zip Code)
Registrant’s Telephone Number, including Area Code: (212) 454-4500
Diane Kenneally
100 Summer Street
Boston, MA 02110
(Name and Address of Agent for Service)
| Date of fiscal year end: | 12/31 |
| | |
| Date of reporting period: | 6/30/2022 |
| ITEM 1. | REPORT TO STOCKHOLDERS |
| | |
| | (a) |
| | |
June 30, 2022
Semiannual Report
to Shareholders
The European Equity Fund, Inc.
Ticker Symbol: EEA

Contents
The brand DWS represents DWS Group GmbH & Co. KGaA and any of its subsidiaries such as DWS Distributors, Inc. which offers investment products or DWS Investment Management Americas, Inc. and RREEF America L.L.C. which offer advisory services.
NOT FDIC/NCUA INSURED NO BANK GUARANTEE MAY LOSE VALUE NOT A DEPOSIT NOT INSURED BY ANY FEDERAL GOVERNMENT AGENCY
| | | | | | |
| 2 | | | | | The European Equity Fund, Inc. | | |
The Fund seeks long-term capital appreciation through investment primarily in equity and equity-linked securities of issuers domiciled in Europe.
Investments in funds involve risks, including the loss of principal.
The shares of most closed-end funds, including the Fund, are not continuously offered. Once issued, shares of closed-end funds are bought and sold in the open market. Shares of closed-end funds frequently trade at a discount to net asset value. The price of the Fund’s shares is determined by a number of factors, several of which are beyond the control of the Fund. Therefore, the Fund cannot predict whether its shares will trade at, below or above net asset value.
This Fund is diversified and primarily focuses its investments in equity securities of issuers domiciled in Europe, thereby increasing its vulnerability to developments in that region. Investing in foreign securities, particularly those of emerging markets, presents certain risks, such as currency fluctuations, political and economic changes, and market risks. Any fund that concentrates in a particular segment of the market or in a particular geographical region will generally be more volatile than a fund that invests more broadly.
The United States, the European Union (EU), the United Kingdom, and other countries have imposed sanctions in response to the Russian military and other actions in recent years. These sanctions have adversely affected Russian individuals, Russian issuers and the Russian economy. Russia, in turn, has imposed sanctions targeting Western individuals, businesses and products. The various sanctions have adversely affected, and may continue to adversely affect, not only the Russian economy but also the economies of many countries in Europe. The continuation of current sanctions or the imposition of additional sanctions may materially adversely affect the value of the Fund’s portfolio.
On January 31, 2020, the United Kingdom officially withdrew from the EU pursuant to a withdrawal agreement, providing for a transition period in which the United Kingdom negotiated and finalized a trade deal with the EU, the EU-UK Trade and Cooperation Agreement, provisionally applied effective January 1, 2021. As a result, as of January 1, 2021 the United Kingdom is no longer part of the EU customs union and single market, nor is it subject to EU policies and international agreements. The long-term impact of the United Kingdom’s withdrawal from the EU is still unknown and could have adverse economic and political effects on the United Kingdom, the EU and its member countries, and the global economy, including financial markets and asset valuations.
War, terrorism, sanctions, economic uncertainty, trade disputes, public health crises and related geopolitical events have led, and, in the future, may lead to significant disruptions in U.S. and world economies and markets, which may lead to increased market volatility and may have significant adverse effects on the Fund and its investments.
| | | | | | |
| The European Equity Fund, Inc. | | | | | | 3 | |
| | |
| Letter to the Shareholders | | (Unaudited) |
Dear Shareholder,
For the six-month period ended June 30, 2022, the total return of the European Equity Fund, Inc. (the “Fund”) in U.S. dollars (USD) was -22.99% based on net asset value and -24.29% based on market price. During the same period, the return of the Fund’s benchmark, the MSCI Europe Index, was -20.79%.1 The Fund’s discount to net asset value averaged 14.66% for the period in review, compared with 12.54% for the same period a year earlier.
The first half of 2022 saw the European and other global stock markets experience a steep decline along with considerable volatility. Early in the period, the principal driver of deteriorating sentiment was raised expectations for global central bank tightening. Equities moved lower in January and February on an acceleration of the expected timetable for interest rate normalization on the part of central banks, with more interest rate-sensitive growth sectors most negatively impacted. This decline was then exacerbated by the Russian invasion of Ukraine on February 24, 2022, with global equities dropping sharply in early March. Equities retraced some of their losses into the end of March, as economic activity appeared to be holding up relatively well.
As the second quarter of 2022 progressed, recession fears moved to the forefront of the market’s focus. The reasons included the ongoing war in Ukraine and COVID-19 lockdowns in China, both of which further impaired global supply chains, along with the spike in energy prices in the aftermath of Russia’s aggression. However, most alarming was the fact that inflation was once again proving far more persistent than consensus expectations, clearly pointing to a more rapid pace of rate hikes from central banks than anticipated entering the quarter. Equities embarked on another downward leg over much of June, returning by the end of the month essentially to the lows last seen in early March.
The Fund’s largest overweight is to materials and this position was the most significant detractor from performance relative to the benchmark. In particular, shares of building materials companies CRH PLC and Sika AG saw declines in excess of the broader materials sector on investor fears of a slowdown in the construction and housing markets.
| | | | |
| 4 | | | | | The European Equity Fund, Inc. |
Information technology is the Fund’s second largest overweight relative to the benchmark. This allocation also detracted, principally due to holdings of semiconductor companies while positions in software companies also weighed on return. Higher real interest rates driven by hawkish central banks and the resulting heightened fears of recession help explain the underperformance of the sector.
The Fund was also meaningfully overweight the industrials sector. Within industrials, exposure to the construction segment weighed most heavily on return, specifically positions in suppliers Ashtead Group PLC, Cie de Saint-Gobain SA and Geberit AG. Sentiment with respect to transportation companies Deutsche Post AG and DSV also suffered from anticipation of recession as well as the shift in spending from goods to services with economic reopening.
On the positive side, the Fund’s allocation to and stock selection within both the consumer discretionary and financials sectors helped offset some of the negative impact of positioning in other sectors.
Market Outlook
Incoming inflation numbers have come as a negative surprise to central bankers. The U.S. economy is very sensitive to tightening financial conditions and we expect a modest recession in the first half of 2023, as defined by two consecutive quarters of negative growth. For the Eurozone, we have raised our June 2023 European Central Bank deposit rate forecast from 0.75% to 2.0%. We expect the negative impact should be less pronounced due to a benign job market, ongoing fiscal stimulus,
| | | | | | | | |
| Sector Diversification (As a % of Equity Securities) | | 6/30/22 | | | 12/31/21 | |
| Industrials | | | 18% | | | | 17% | |
| Financials | | | 17% | | | | 16% | |
| Health Care | | | 15% | | | | 15% | |
| Materials | | | 10% | | | | 13% | |
| Information Technology | | | 10% | | | | 13% | |
| Consumer Discretionary | | | 9% | | | | 8% | |
| Communication Services | | | 7% | | | | 5% | |
| Consumer Staples | | | 7% | | | | 5% | |
| Energy | | | 4% | | | | 4% | |
| Utilities | | | 3% | | | | 4% | |
| | | | 100% | | | | 100% | |
| | | | | | |
| The European Equity Fund, Inc. | | | | | | 5 | |
post-COVID catch-up demand. However, Germany remains exposed to the rising risk of gas imports from Russia being completely cut this summer and beyond, which would likely trigger an energy crisis.
As for corporate earnings, after years of expanding profitability, we predict aggregate profit margins will fall in the coming quarters. For the next 12 months our top-down earnings estimates are 5-11% below market consensus, and we expect companies and analysts to lower their outlooks over the coming months. As a reference we remind investors that a “normal recession” has historically resulted in an approximately 15% decline in aggregate earnings per share, while “severe recessions” have led to an approximately one-third reduction in earnings. We do not anticipate such harsh cuts as we expect only a technical recession, as balance sheets of companies and consumers are still in healthy shape.
With respect to valuation, we note that equity markets remain highly sensitive to U.S. real interest rates. Therefore, we remain cautious over the near-term on equity markets. On a 12-month horizon, however, we remain constructive on equities, as we believe there is a strong possibility of an easing in fears around inflation, war and recession along with a stabilization of U.S. real rates.
| | | | | | | | | | |
Ten Largest Equity Holdings at June 30, 2022
(30.9% of Net Assets) | | Country | | Percent | |
| | 1. | | | Nestle SA | | Switzerland | | | 4.3 | % |
| | 2. | | | HSBC Holdings PLC | | United Kingdom | | | 3.6 | % |
| | 3. | | | TotalEnergies SE | | France | | | 3.6 | % |
| | 4. | | | Novo Nordisk A/S | | Denmark | | | 3.5 | % |
| | 5. | | | Roche Holding AG | | Switzerland | | | 3.1 | % |
| | 6. | | | Allianz SE | | Germany | | | 2.8 | % |
| | 7. | | | ING Groep NV | | Netherlands | | | 2.7 | % |
| | 8. | | | Sanofi | | France | | | 2.5 | % |
| | 9. | | | AXA SA | | France | | | 2.4 | % |
| | 10. | | | ASML Holding NV | | Netherlands | | | 2.4 | % |
Portfolio holdings and characteristics are subject to change and not indicative of future portfolio composition.
For more details about the Fund’s investments, see the Schedule of Investments commencing on page 10. For additional information about the Fund, including performance, dividends, presentations, press releases, market updates, daily NAV and shareholder reports, please visit dws.com.
| | | | |
| 6 | | | | | The European Equity Fund, Inc. |
From a sector point of view, we continue to believe that health care remains attractive. We tactically increased exposure to the oil sector at the end of the quarter, following the recent correction in energy stocks. Fundamentals with respect to the segment appear solid on the supply side, considering low OPEC spare capacity, limited past years’ capital expenditures and Russia-related disruptions. Inventories appear at the lower bound of their historic range ahead of the peak driving season. On the demand side, with COVID fears receding and the economy reopening, global oil demand is likely to structurally exceed pre-pandemic levels.
On June 23, 2022 at the Fund’s Annual Meeting of Stockholders, Ambassador Richard R. Burt retired from the Fund’s Board. The Board thanks Ambassador Burt for his excellent service for many years to the Fund.
Sincerely,
| | | | |
 | |  | |  |
| Christian Strenger | | Juan Barriobero de la Pisa | | Hepsen Uzcan |
| Chairman | | Portfolio Manager | | Director, President and Chief Executive Officer |
The views expressed in the preceding discussion reflect those of the portfolio management team generally through the end of the period of the report as stated on the cover. The management team’s views are subject to change at any time based on market and other conditions and should not be construed as recommendations. Past performance is no guarantee of future results. Current and future portfolio holdings are subject to risk.
| 1 | The MSCI Europe Index tracks the performance of 15 developed markets in Europe. MSCI indices are calculated using closing local market prices and translate into U.S. dollars using the London close foreign exchange rates. Index returns do not reflect any fees or expenses and it is not possible to invest directly in the MSCI Europe Index. |
| | | | | | |
| The European Equity Fund, Inc. | | | | | | 7 | |
| | |
| Performance Summary | | June 30, 2022 (Unaudited) |
All performance shown is historical, assumes reinvestment of all dividend and capital gain distributions, and does not guarantee future results. Investment return and net asset value fluctuate with changing market conditions so that, when sold, shares may be worth more or less than their original cost. Current performance may be lower or higher than the performance data quoted. Please visit dws.com for the most recent performance of the Fund.
Fund specific data and performance are provided for informational purposes only and are not intended for trading purposes.
| | | | | | | | | | | | | | | | |
| Average Annual Total Returns as of 6/30/22 | | | | | | | |
| | | | |
| | | 6-Month‡ | | | 1-Year | | | 5-Year | | | 10-Year | |
| Net Asset Value(a) | | | (22.99)% | | | | (18.17)% | | | | 2.67% | | | | 6.05% | |
| Market Price(a) | | | (24.29)% | | | | (20.50)% | | | | 1.57% | | | | 5.69% | |
| MSCI Europe Index(b) | | | (20.79)% | | | | (17.61)% | | | | 2.16% | | | | 5.44% | |
|
| Growth of an Assumed $10,000 Investment |
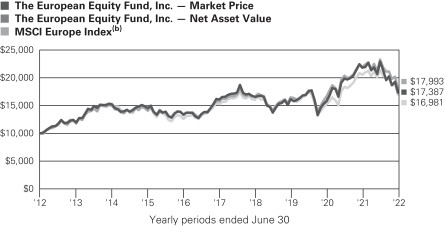
The growth of $10,000 is cumulative.
| a | Total return based on net asset value reflects changes in the Fund’s net asset value during each period. Total return based on market value reflects changes in market value during each period. Each figure includes reinvestments of income and capital gain distributions, if any, at market prices pursuant to the dividend reinvestment plan. Total returns based on net asset value and market price will differ depending upon the level of any discount from or premium to net asset value at which the Fund’s shares trade during the period. Expenses of the Fund include investment advisory and administration fees and other fund expenses. Total returns shown take into account these fees and expenses. The annualized expense ratio of the Fund for the six months ended June 30, 2022 was 1.40%. |
| | | | |
| 8 | | | | | The European Equity Fund, Inc. |
| b | The MSCI Europe Index tracks the performance of 15 developed markets in Europe. MSCI indices are calculated using closing local market prices and translate into U.S. dollars using the London close foreign exchange rates. |
| | Index returns do not reflect any fees or expenses and it is not possible to invest directly in the MSCI Europe Index. |
| ‡ | Total returns shown for periods less than one year are not annualized. |
| | | | | | | | |
| Net Asset Value and Market Price | | | | | | |
| | |
| | | As of 6/30/22 | | | As of 12/31/21 | |
| Net Asset Value | | $ | 8.37 | | | $ | 11.95 | |
| Market Price | | $ | 7.14 | | | $ | 10.37 | |
Prices and Net Asset Value fluctuate and are not guaranteed.
| | | | |
| Distribution Information | | Per Share | |
Six Months as of 6/30/22: | | | | |
Income Distribution | | $ | 0.14 | |
Capital Gains Distribution | | $ | 0.58 | |
Distributions are historical, not guaranteed and will fluctuate. Distributions do not include return of capital or other non-income sources.
| | | | | | |
| The European Equity Fund, Inc. | | | | | | 9 | |
| | |
| Schedule of Investments | | as of June 30, 2022 (Unaudited) |
| | | | | | | | |
| | | Shares | | | Value ($) | |
| Common Stocks 93.9% | | | | | | | | |
| France 25.0% | | | | | | | | |
| | |
Banks 2.1% | | | | | | | | |
| | |
BNP Paribas SA | | | 13,551 | | | | 642,712 | |
| | |
Credit Agricole SA | | | 62,675 | | | | 572,114 | |
| | | | | | | | |
| | | | | | | 1,214,826 | |
| | |
Beverages 1.3% | | | | | | | | |
Pernod Ricard SA | | | 4,349 | | | | 797,068 | |
| | |
Building Products 1.6% | | | | | | | | |
Cie de Saint-Gobain | | | 22,296 | | | | 954,447 | |
| | |
Construction & Engineering 1.7% | | | | | | | | |
Vinci SA | | | 11,305 | | | | 1,004,174 | |
| | |
Insurance 2.4% | | | | | | | | |
AXA SA | | | 62,101 | | | | 1,406,310 | |
| | |
IT Services 2.1% | | | | | | | | |
| | |
Capgemini SE | | | 3,948 | | | | 674,662 | |
| | |
Worldline SA 144A* | | | 16,049 | | | | 593,649 | |
| | | | | | | | |
| | | | | | | 1,268,311 | |
| | |
Media 1.6% | | | | | | | | |
Vivendi SE | | | 93,165 | | | | 944,429 | |
| | |
Oil, Gas & Consumable Fuels 3.6% | | | | | | | | |
TotalEnergies SE | | | 40,222 | | | | 2,118,164 | |
| | |
Personal Products 1.1% | | | | | | | | |
L’Oreal SA | | | 1,926 | | | | 663,089 | |
| | |
Pharmaceuticals 2.5% | | | | | | | | |
Sanofi | | | 14,538 | | | | 1,464,318 | |
| | |
Professional Services 3.5% | | | | | | | | |
| | |
Bureau Veritas SA | | | 28,113 | | | | 718,638 | |
| | |
Teleperformance | | | 4,382 | | | | 1,343,719 | |
| | | | | | | | |
| | | | | | | 2,062,357 | |
| |
Textiles, Apparel & Luxury Goods 1.5% | | | | | |
LVMH Moet Hennessy Louis Vuitton SE | | | 1,510 | | | | 918,333 | |
Total France (Cost $17,142,973) | | | | | | | 14,815,826 | |
| | |
| Germany 15.6% | | | | | | | | |
| | |
Air Freight & Logistics 1.9% | | | | | | | | |
Deutsche Post AG (Registered) | | | 30,253 | | | | 1,130,439 | |
| | |
Capital Markets 1.2% | | | | | | | | |
Deutsche Boerse AG | | | 4,157 | | | | 693,645 | |
The accompanying notes are an integral part of the financial statements.
| | | | |
| 10 | | | | | The European Equity Fund, Inc. |
| | | | | | | | |
| | | Shares | | | Value ($) | |
| | |
Diversified Telecommunication Services 1.9% | | | | | | | | |
Deutsche Telekom AG (Registered) | | | 57,195 | | | | 1,132,921 | |
| | |
Insurance 2.8% | | | | | | | | |
| | |
Allianz SE (Registered) | | | 8,894 | | | | 1,693,475 | |
| | |
Interactive Media & Services 0.7% | | | | | | | | |
| | |
Scout24 SE 144A | | | 7,923 | | | | 405,809 | |
| | |
Pharmaceuticals 2.2% | | | | | | | | |
Merck KGaA | | | 7,788 | | | | 1,310,919 | |
| | |
Semiconductors & Semiconductor Equipment 1.7% | | | | | | | | |
Infineon Technologies AG | | | 41,192 | | | | 994,399 | |
| | |
Software 1.3% | | | | | | | | |
SAP SE | | | 8,403 | | | | 763,709 | |
| | |
Textiles, Apparel & Luxury Goods 0.9% | | | | | | | | |
adidas AG | | | 3,033 | | | | 535,138 | |
| | |
Trading Companies & Distributors 1.0% | | | | | | | | |
Brenntag SE | | | 9,528 | | | | 618,611 | |
Total Germany (Cost $10,185,077) | | | | | | | 9,279,065 | |
| | |
| Switzerland 14.0% | | | | | | | | |
| | |
Building Products 1.1% | | | | | | | | |
Geberit AG (Registered) | | | 1,410 | | | | 675,622 | |
| | |
Chemicals 1.5% | | | | | | | | |
Sika AG (Registered) | | | 3,834 | | | | 880,919 | |
| | |
Containers & Packaging 0.6% | | | | | | | | |
SIG Combibloc Group AG* | | | 16,262 | | | | 357,000 | |
| | |
Food Products 4.3% | | | | | | | | |
Nestle SA (Registered) | | | 22,085 | | | | 2,570,394 | |
| | |
Life Sciences Tools & Services 1.6% | | | | | | | | |
Lonza Group AG (Registered) | | | 1,787 | | | | 949,956 | |
| | |
Pharmaceuticals 3.1% | | | | | | | | |
Roche Holding AG | | | 5,563 | | | | 1,850,751 | |
| | |
Semiconductors & Semiconductor Equipment 1.8% | | | | | | | | |
STMicroelectronics NV | | | 32,878 | | | | 1,031,218 | |
Total Switzerland (Cost $9,564,141) | | | | | | | 8,315,860 | |
| | |
| United Kingdom 13.6% | | | | | | | | |
| | |
Banks 3.6% | | | | | | | | |
HSBC Holdings PLC | | | 332,329 | | | | 2,160,864 | |
| | |
Commercial Services & Supplies 1.1% | | | | | | | | |
Rentokil Initial PLC | | | 115,540 | | | | 665,700 | |
The accompanying notes are an integral part of the financial statements.
| | | | | | |
| The European Equity Fund, Inc. | | | | | | 11 | |
| | | | | | | | |
| | | Shares | | | Value ($) | |
Hotels, Restaurants & Leisure 2.3% | | | | | | | | |
Compass Group PLC | | | 67,024 | | | | 1,366,968 | |
| | |
Media 1.6% | | | | | | | | |
Informa PLC* | | | 144,753 | | | | 929,261 | |
| | |
Oil, Gas & Consumable Fuels 0.6% | | | | | | | | |
Shell PLC | | | 14,767 | | | | 382,565 | |
| | |
Pharmaceuticals 1.9% | | | | | | | | |
AstraZeneca PLC | | | 8,552 | | | | 1,121,270 | |
| | |
Professional Services 1.8% | | | | | | | | |
RELX PLC | | | 38,486 | | | | 1,040,032 | |
| | |
Trading Companies & Distributors 0.7% | | | | | | | | |
Ashtead Group PLC | | | 10,049 | | | | 419,540 | |
Total United Kingdom (Cost $7,797,587) | | | | | | | 8,086,200 | |
| | |
| Netherlands 9.0% | | | | | | | | |
| | |
Automobiles 0.9% | | | | | | | | |
Stellantis NV | | | 43,160 | | | | 532,100 | |
| | |
Banks 2.7% | | | | | | | | |
ING Groep NV | | | 160,058 | | | | 1,578,190 | |
| | |
Chemicals 1.8% | | | | | | | | |
Koninklijke DSM NV | | | 7,615 | | | | 1,091,519 | |
| | |
Entertainment 1.2% | | | | | | | | |
Universal Music Group NV | | | 35,928 | | | | 718,725 | |
| | |
Semiconductors & Semiconductor Equipment 2.4% | | | | | | | | |
ASML Holding NV | | | 2,940 | | | | 1,401,178 | |
Total Netherlands (Cost $4,838,748) | | | | | | | 5,321,712 | |
| | |
| Denmark 6.0% | | | | | | | | |
| | |
Air Freight & Logistics 1.4% | | | | | | | | |
DSV A/S | | | 6,000 | | | | 836,209 | |
| | |
Electric Utilities 1.1% | | | | | | | | |
Orsted A/S 144A | | | 6,567 | | | | 685,038 | |
| | |
Pharmaceuticals 3.5% | | | | | | | | |
Novo Nordisk A/S ‘‘B’’ | | | 18,535 | | | | 2,051,539 | |
Total Denmark (Cost $2,832,350) | | | | | | | 3,572,786 | |
| | |
| Ireland 3.7% | | | | | | | | |
| | |
Construction Materials 2.2% | | | | | | | | |
CRH PLC | | | 37,229 | | | | 1,284,456 | |
| | |
Containers & Packaging 1.5% | | | | | | | | |
Smurfit Kappa Group PLC | | | 26,343 | | | | 883,535 | |
Total Ireland (Cost $3,298,822) | | | | | | | 2,167,991 | |
The accompanying notes are an integral part of the financial statements.
| | | | |
| 12 | | | | | The European Equity Fund, Inc. |
| | | | | | | | |
| | | Shares | | | Value ($) | |
| Sweden 3.1% | | | | | | | | |
| | |
Banks 1.8% | | | | | | | | |
Swedbank AB ‘‘A’’ | | | 85,000 | | | | 1,072,464 | |
| | |
Machinery 1.3% | | | | | | | | |
Atlas Copco AB ‘‘A’’ | | | 80,820 | | | | 753,712 | |
Total Sweden (Cost $2,183,460) | | | | | | | 1,826,176 | |
| | |
| Australia 2.1% | | | | | | | | |
| | |
Metals & Mining 2.1% | | | | | | | | |
BHP Group Ltd. (Cost $460,188) (a) | | | 44,336 | | | | 1,236,335 | |
| | |
| Italy 1.8% | | | | | | | | |
| | |
Electric Utilities 1.8% | | | | | | | | |
Enel SpA (Cost $1,454,623) | | | 191,033 | | | | 1,042,564 | |
Total Common Stocks (Cost $59,757,969) | | | | | | | 55,664,515 | |
| | |
| Preferred Stocks 2.7% | | | | | | | | |
| Germany 2.7% | | | | | | | | |
| | |
Automobiles 2.7% | | | | | | | | |
| | |
Porsche Automobil Holding SE | | | 12,572 | | | | 829,651 | |
| | |
Volkswagen AG | | | 5,686 | | | | 757,475 | |
| | | | | | | | |
| | | | | | | | 1,587,126 | |
Total Germany (Cost $2,520,052) | | | | | | | 1,587,126 | |
Total Preferred Stocks (Cost $2,520,052) | | | | | | | 1,587,126 | |
| | |
| Cash Equivalents 2.9% | | | | | | | | |
DWS Central Cash Management Government Fund, 1.36% (Cost $1,688,165) (c) | | | 1,688,173 | | | | 1,688,165 | |
| | |
| | | % of Net
Shares | | | Value ($) | |
| Total Investment Portfolio (Cost $63,966,186) | | | 99.5 | | | | 58,939,806 | |
| Other Assets and Liabilities, Net | | | 0.5 | | | | 326,089 | |
| |
| Net Assets | | | 100.0 | | | | 59,265,895 | |
The accompanying notes are an integral part of the financial statements.
| | | | | | |
| The European Equity Fund, Inc. | | | | | | 13 | |
A summary of the Fund’s transactions with affiliated investments during the period ended June 30, 2022 are as follows:
| | | | | | | | | | | | | | | | | | | | | | | | | | | | | | | | |
Value ($)
at
12/31/2021 | | Purchases
Cost
($) | | | Sales
Proceeds
($) | | | Net
Real-
ized
Gain/
(Loss)
($) | | | Net
Change
in
Unreal-
ized
Appreci-
ation/
(Depreci-
ation)
($) | | | Income
($) | | | Capital
Gain
Distr-
ibutions
($) | | | Number of
Shares at
6/30/2022 | | | Value ($)
at
6/30/2022 | |
| Securities Lending Collateral 0.0% | | | | | | | | | | | | | |
| DWS Government & Agency Securities Portfolio ‘‘DWS Government Cash Institutional Shares’’, 1.28% (b) (c) | |
| — | | | 0 (d) | | | | — | | | | — | | | | — | | | | 14,913 | | | | — | | | | — | | | | — | |
| Cash Equivalents 2.9% | | | | | | | | | | | | | | | | | |
| DWS Central Cash Management Government Fund, 1.36% (c) | |
| 2,841,887 | | | 16,926,728 | | | | 18,080,450 | | | | — | | | | — | | | | 4,663 | | | | — | | | | 1,688,173 | | | | 1,688,165 | |
| 2,841,887 | | | 19,251,728 | | | | 20,405,450 | | | | — | | | | — | | | | 19,576 | | | | — | | | | 1,688,173 | | | | 1,688,165 | |
| * | Non-income producing security. |
| (a) | BHP Group PLC is domiciled in Australia and is listed on the London Stock Exchange. |
| (b) | Represents cash collateral held in connection with securities lending. Income earned by the Fund is net of borrower rebates. |
| (c) | Affiliated fund managed by DWS Investment Management Americas, Inc. The rate shown is the annualized seven-day yield at period end. |
| (d) | Represents the net increase (purchases cost) or decrease (sales proceeds) in the amount invested in cash collateral for the period ended June 30, 2022. |
144A: Securities exempt from registration under Rule 144A of the Securities Act of 1933. These securities may be resold in transactions exempt from registration, normally to qualified institutional buyers.
For purposes of its industry concentration policy, the Fund classifies issuers of portfolio securities at the industry sub-group level. Certain of the categories in the above Schedule of Investments consist of multiple industry sub-groups or industries.
The accompanying notes are an integral part of the financial statements.
| | | | |
| 14 | | | | | The European Equity Fund, Inc. |
Fair Value Measurements
Various inputs are used in determining the value of the Fund’s investments. These inputs are summarized in three broad levels. Level 1 includes quoted prices in active markets for identical securities. Level 2 includes other significant observable inputs (including quoted prices for similar securities, interest rates, prepayment speeds and credit risk). Level 3 includes significant unobservable inputs (including the Fund’s own assumptions in determining the fair value of investments). The level assigned to the securities valuations may not be an indication of the risk associated with investing in those securities.
The following is a summary of the inputs used as of June 30, 2022 in valuing the Fund’s investments.
| | | | | | | | | | | | | | | | |
| Assets | | Level 1 | | | Level 2 | | | Level 3 | | | Total | |
| Common Stocks and/or Other Equity Investments (e) | | | | | |
France | | $ | 14,815,826 | | | $ | — | | | $ | — | | | $ | 14,815,826 | |
Germany | | | 10,866,191 | | | | — | | | | — | | | | 10,866,191 | |
Switzerland | | | 8,315,860 | | | | — | | | | — | | | | 8,315,860 | |
United Kingdom | | | 8,086,200 | | | | — | | | | — | | | | 8,086,200 | |
Netherlands | | | 5,321,712 | | | | — | | | | — | | | | 5,321,712 | |
Denmark | | | 3,572,786 | | | | — | | | | — | | | | 3,572,786 | |
Ireland | | | 2,167,991 | | | | — | | | | — | | | | 2,167,991 | |
Sweden | | | 1,826,176 | | | | — | | | | — | | | | 1,826,176 | |
Australia | | | 1,236,335 | | | | — | | | | — | | | | 1,236,335 | |
Italy | | | 1,042,564 | | | | — | | | | — | | | | 1,042,564 | |
| Short-Term Instruments (e) | | | 1,688,165 | | | | — | | | | — | | | | 1,688,165 | |
| Total | | $ | 58,939,806 | | | $ | — | | | $ | — | | | $ | 58,939,806 | |
| (e) | See Schedule of Investments for additional detailed categorizations. |
The accompanying notes are an integral part of the financial statements.
| | | | | | |
| The European Equity Fund, Inc. | | | | | | 15 | |
Statement of Assets and Liabilities
| | | | |
| as of June 30, 2022 (Unaudited) | | | | |
| | | | |
| |
| Assets | | | | |
| Investments in non-affiliated securities, at value (cost $62,278,021) | | $ | 57,251,641 | |
Investment in DWS Central Cash Management Government Fund
(cost $1,688,165) | | | 1,688,165 | |
| Foreign currency, at value (cost $171,469) | | | 166,415 | |
| Cash | | | 14,375 | |
| Receivable for investments sold | | | 366,361 | |
| Dividends receivable | | | 34,169 | |
| Foreign taxes recoverable | | | 281,219 | |
| Interest receivable | | | 6,946 | |
| Other assets | | | 17,347 | |
| Total assets | | | 59,826,638 | |
| |
| Liabilities | | | | |
| Payable for investments purchased | | | 387,079 | |
| Payable for Fund shares repurchased | | | 36,111 | |
| Investment advisory fee payable | | | 28,151 | |
| Payable for Directors’ fees and expenses | | | 11,386 | |
| Administration fee payable | | | 10,237 | |
| Accrued expenses and other liabilities | | | 87,779 | |
| Total liabilities | | | 560,743 | |
| Net assets | | $ | 59,265,895 | |
| |
| Net Assets Consist of | | | | |
| Distributable earnings (loss) | | | (4,566,976 | ) |
| Paid-in capital | | | 63,832,871 | |
| Net assets | | $ | 59,265,895 | |
| |
| Net Asset Value | | | | |
| |
Net assets value per share
($59,265,895 ÷ 7,078,036 shares of common stock issued and outstanding, $.001 par value, 80,000,000 shares authorized) | | $ | 8.37 | |
The accompanying notes are an integral part of the financial statements.
| | | | |
| 16 | | | | | The European Equity Fund, Inc. |
Statement of Operations
| | | | |
| for the six months ended June 30, 2022 (Unaudited) | | | | |
| | | | |
| |
| Net Investment Income | | | | |
| Income: | | | | |
| |
| Dividends (net of foreign withholding taxes of $202,206) | | $ | 1,547,373 | |
| |
| Interest | | | 6 | |
| |
| Income distributions — DWS Central Cash Management Government Fund | | | 4,662 | |
| Securities lending income, net of borrower rebates | | | 14,913 | |
| Total investment income | | | 1,566,954 | |
| Expenses: | | | | |
| |
| Investment advisory fee | | | 234,141 | |
| |
| Administration fee | | | 72,043 | |
| |
| Custody and accounting fee | | | 20,282 | |
| Services to shareholders | | | 8,706 | |
| Reports to shareholders and shareholder meeting expenses | | | 24,860 | |
| Directors’ fees and expenses | | | 28,474 | |
| Legal fees | | | 51,915 | |
| Audit and tax fees | | | 27,874 | |
| NYSE listing fee | | | 11,778 | |
| Insurance | | | 5,742 | |
| Miscellaneous | | | 11,674 | |
| Total expenses before expense reductions | | | 497,489 | |
| Expense reductions | | | (36,021 | ) |
| Total expenses after expense reductions | | | 461,468 | |
| Net investment income | | | 1,105,486 | |
| |
| Realized and Unrealized Gain (Loss) | | | | |
| Net realized gain (loss) from: | | | | |
| |
| Investments | | | 70,648 | |
| Foreign currency | | | (22,743 | ) |
| Net realized gain (loss) | | | 47,905 | |
| Change in net unrealized appreciation (depreciation) on: | | | | |
| |
| Investments | | | (20,461,512 | ) |
| Foreign currency | | | (29,172 | ) |
| Change in net unrealized appreciation (depreciation) | | | (20,490,684 | ) |
| Net gain (loss) | | | (20,442,779 | ) |
| Net increase (decrease) in net assets resulting from operations | | $ | (19,337,293 | ) |
The accompanying notes are an integral part of the financial statements.
| | | | | | |
| The European Equity Fund, Inc. | | | | | | 17 | |
Statement of Changes in Net Assets
| | | | | | | | |
| Increase (Decrease) in Net Assets | | Six Months
Ended
June 30, 2022
(Unaudited) | | | Year Ended
December 31,
2021 | |
| | | | | | | | |
| Operations: | | | | | | | | |
| | |
| Net investment income (loss) | | $ | 1,105,486 | | | $ | 1,048,191 | |
| Net realized gain (loss) | | | 47,905 | | | | 15,548,364 | |
| Change in net unrealized appreciation (depreciation) | | | (20,490,684 | ) | | | (7,764,200 | ) |
| Net increase (decrease) in net assets resulting from operations | | | (19,337,293 | ) | | | 8,832,355 | |
| Distributions to shareholders | | | (5,065,414 | ) | | | (10,179,231 | ) |
| Fund share transactions: | | | | | | | | |
| | |
| Net proceeds from reinvestment of distributions | | | 4,085,740 | | | | — | |
| Shares repurchased | | | (1,526,134 | ) | | | (4,730,559 | ) |
| Net increase (decrease) in net assets from Fund share transactions | | | 2,559,606 | | | | (4,730,559 | ) |
| Total increase (decrease) in net assets | | | (21,843,101 | ) | | | (6,077,435 | ) |
| Net assets at beginning of period | | | 81,108,996 | | | | 87,186,431 | |
| | |
| Net assets at end of period | | $ | 59,265,895 | | | $ | 81,108,996 | |
| | |
| Other Information | | | | | | | | |
| Shares outstanding at beginning of period | | | 6,788,192 | | | | 7,210,692 | |
| Shares issued from reinvestment of distributions | | | 464,944 | | | | — | |
| Shares repurchased | | | (175,100 | ) | | | (422,500 | ) |
| | |
| Shares outstanding at end of period | | | 7,078,036 | | | | 6,788,192 | |
The accompanying notes are an integral part of the financial statements.
| | | | |
| 18 | | | | | The European Equity Fund, Inc. |
Financial Highlights
| | | | | | | | | | | | | | | | | | | | | | | | | | |
| | | Six Months
Ended 6/30/22 | | | Years Ended December 31, | |
| | | (Unaudited) | | | 2021 | | | 2020 | | | 2019 | | | 2018 | | | 2017 | |
| | | | | | |
| Per Share Operating Performance | | | | | | | | | | | | | | | | | | | | | | | | |
| Net asset value, beginning of period | | | $11.95 | | | | $12.09 | | | | $10.73 | | | | $9.04 | | | | $10.97 | | | | $8.76 | |
| Income (loss) from investment operations: | | | | | | | | | | | | | | | | | | | | | | | | |
| | | | | | |
Net investment income (loss)a | | | .16 | | | | .15 | | | | .10 | | | | .15 | | | | .08 | | | | .06 | |
Net realized and unrealized gain (loss) on investments and foreign currency | | | (2.96 | ) | | | 1.11 | | | | 1.38 | | | | 2.03 | | | | (1.98 | ) | | | 2.21 | |
Total from investment operations | | | (2.80 | ) | | | 1.26 | | | | 1.48 | | | | 2.18 | | | | (1.90 | ) | | | 2.27 | |
| Less distributions from: | | | | | | | | | | | | | | | | | | | | | | | | |
Net investment income | | | (.14 | ) | | | (.11 | ) | | | (.13 | ) | | | (.13 | ) | | | (.07 | ) | | | (.09 | ) |
Net realized gains | | | (.58 | ) | | | (1.39 | ) | | | (.07 | ) | | | (.39 | ) | | | — | | | | — | |
Total distributions | | | (.72 | ) | | | (1.50 | ) | | | (.20 | ) | | | (.52 | ) | | | (.07 | ) | | | (.09 | ) |
| Dilution in net asset value from dividend reinvestment | | | (.10 | ) | | | — | | | | (.01 | ) | | | (.01 | ) | | | — | | | | — | |
| Increase resulting from share repurchases | | | .04 | | | | .10 | | | | .09 | | | | .04 | | | | .04 | | | | .03 | |
| Net asset value, end of period | | | $8.37 | | | | $11.95 | | | | $12.09 | | | | $10.73 | | | | $9.04 | | | | $10.97 | |
| Market value, end of period | | | $7.14 | | | | $10.37 | | | | $10.40 | | | | $9.38 | | | | $7.73 | | | | $9.87 | |
| | | | | | |
| Total Investment Return for the Periodb | | | | | | | | | | | | | | | | | | | | | | | | |
| Based upon market value (%) | | | (24.29 | )** | | | 15.23 | | | | 13.28 | | | | 28.29 | | | | (21.02 | ) | | | 28.97 | |
| Based upon net asset value (%) | | | (22.99 | )c** | | | 14.22 | | | | 15.12 | | | | 25.48 | | | | (16.90 | )c | | | 26.32 | c |
|
| Ratios to Average Net Assets | |
| Total expenses before expense reductions (%) | | | 1.40 | * | | | 1.28 | | | | 1.30 | | | | 1.33 | | | | 1.38 | | | | 1.45 | |
| Total expenses after expense reductions (%) | | | 1.30 | * | | | 1.28 | | | | 1.30 | | | | 1.33 | | | | 1.28 | | | | 1.43 | |
| Net investment income (%) | | | 1.54 | ** | | | 1.16 | | | | .93 | | | | 1.51 | | | | .75 | | | | .63 | |
| Portfolio turnover (%) | | | 16 | ** | | | 57 | | | | 25 | | | | 60 | | | | 58 | | | | 48 | |
| Net assets at end of period ($ thousands) | | | 59,266 | | | | 81,109 | | | | 87,186 | | | | 81,254 | | | | 70,177 | | | | 87,813 | |
| a | Based on average shares outstanding during the period. |
| b | Total investment return based on net asset value reflects changes in the Fund’s net asset value during each period. Total return based on market value reflects changes in market value during each period. Each figure includes reinvestments of dividend and capital gain distributions, if any. These figures will differ depending upon the level of any discount from or premium to net asset value at which the Fund’s shares trade during the period. |
| c | Total return would have been lower had certain expenses not been reduced. |
The accompanying notes are an integral part of the financial statements.
| | | | | | |
| The European Equity Fund, Inc. | | | | | | 19 | |
| | |
| Notes to Financial Statements | | (Unaudited) |
A. Accounting Policies
The European Equity Fund, Inc. (the “Fund”) was incorporated in Delaware on April 8, 1986 as a diversified, closed-end management investment company. Investment operations commenced on July 23, 1986. The Fund reincorporated in Maryland on August 29, 1990 and, on October 16, 1996, the Fund changed from a diversified to a non-diversified company. The Fund became a diversified fund on October 31, 2008.
The preparation of financial statements in accordance with accounting principles generally accepted in the United States of America (“U.S. GAAP”) requires management to make estimates and assumptions that affect the reported amounts and disclosures in the financial statements. Actual results could differ from those estimates. The Fund qualifies as an investment company under Topic 946 of Accounting Standards Codification of U.S. GAAP. The following is a summary of significant accounting policies followed by the Fund in the preparation of its financial statements.
Security Valuation. The Fund calculates its net asset value (“NAV”) per share for publication at the close of regular trading on Deutsche Börse XETRA, normally at 11:30 a.m., New York time.
Various inputs are used in determining the value of the Fund’s investments. These inputs are summarized in three broad levels. Level 1 includes quoted prices in active markets for identical securities. Level 2 includes other significant observable inputs (including quoted prices for similar securities, interest rates, prepayment speeds and credit risk). Level 3 includes significant unobservable inputs (including the Fund’s own assumptions in determining the fair value of investments). The level assigned to the securities valuations may not be an indication of the risk or liquidity associated with investing in those securities.
Equity securities are valued at the most recent sale price or official closing price reported on the exchange (U.S. or foreign) or over-the-counter market on which they trade prior to the time of valuation. Securities for which no sales are reported are valued at the calculated mean between the most recent bid and asked quotations on the relevant market or, if a mean cannot be determined, at the most recent bid quotation. Equity securities are generally categorized as Level 1.
Investments in open-end investment companies are valued and traded at their NAV each business day and are categorized as Level 1.
| | | | |
| 20 | | | | | The European Equity Fund, Inc. |
Purchased options are generally valued at the settlement prices established each day on the exchange on which they are traded and are categorized as Level 1.
Securities and other assets for which market quotations are not readily available or for which the above valuation procedures are deemed not to reflect fair value are valued in a manner that is intended to reflect their fair value as determined in accordance with procedures approved by the Board and are generally categorized as Level 3. In accordance with the Fund’s valuation procedures, factors considered in determining value may include, but are not limited to, the type of the security; the size of the holding; the initial cost of the security; the existence of any contractual restrictions on the security’s disposition; the price and extent of public trading in similar securities of the issuer or of comparable companies; quotations or evaluated prices from broker-dealers and/or the appropriate stock exchange (for exchange-traded securities); an analysis of the company’s or issuer’s financial statements; an evaluation of the forces that influence the issuer and the market(s) in which the security is purchased and sold; and, with respect to debt securities, the maturity, coupon, creditworthiness, currency denomination, and the movement of the market in which the security is normally traded. The value determined under these procedures may differ from published values for the same securities.
Disclosure about the classification of the fair value measurements is included in a table following the Fund’s Schedule of Investments.
Securities Transactions and Investment Income. Investment transactions are accounted for on a trade date plus one basis for daily NAV calculation. However, for financial reporting purposes, investment security transactions are reported on trade date. Interest income is recorded on the accrual basis. Dividend income is recorded on the ex-dividend date net of foreign withholding taxes. Certain dividends from foreign securities may be recorded subsequent to the ex-dividend date as soon as the Fund is informed of such dividends. Realized gains and losses from investment transactions are recorded on an identified cost basis. Proceeds from litigation payments, if any, are included in net realized gain (loss) for investments.
Securities Lending. Brown Brothers Harriman & Co., as lending agent, lends securities of the Fund to certain financial institutions under the terms of its securities lending agreement. During the term of the loans, the Fund continues to receive dividends generated by the securities and to participate in any changes in their market value. The Fund requires the borrowers of the securities to maintain collateral with the Fund consisting of either cash and/or U.S. Treasury Securities having a value at least equal to the value of the securities loaned. When the collateral falls below specified amounts, the lending agent will use its best effort to obtain additional collateral on the next business day to meet required amounts
| | | | | | |
| The European Equity Fund, Inc. | | | | | | 21 | |
under the securities lending agreement. During the six months ended June 30, 2022, the Fund invested the cash collateral into a joint trading account in DWS Government & Agency Securities Portfolio, an affiliated money market fund managed by DWS Investment Management Americas, Inc. DWS Investment Management Americas, Inc. receives a management/administration fee (0.07% annualized effective rate as of June 30, 2022) on the cash collateral invested in DWS Government & Agency Securities Portfolio. The Fund receives compensation for lending its securities either in the form of fees or by earning interest on invested cash collateral net of borrower rebates and fees paid to a lending agent. Either the Fund or the borrower may terminate the loan at any time and the borrower, after notice, is required to return borrowed securities within a standard time period. There may be risks of delay and costs in recovery of securities or even loss of rights in the collateral should the borrower of the securities fail financially. If the Fund is not able to recover securities lent, the Fund may sell the collateral and purchase a replacement investment in the market, incurring the risk that the value of the replacement security is greater than the value of the collateral. The Fund is also subject to all investment risks associated with the reinvestment of any cash collateral received, including, but not limited to, interest rate, credit and liquidity risk associated with such investments.
The Fund had no securities on loan at June 30, 2022.
Foreign Currency Translation. The books and records of the Fund are maintained in United States dollars.
Assets and liabilities denominated in foreign currency are translated into United States dollars at the prevailing exchange rates at period end. Purchases and sales of investment securities, income and expenses are translated at the rate of exchange prevailing on the respective dates of such transactions. Net realized and unrealized gains and losses on foreign currency transactions represent net gains and losses between trade and settlement dates on securities transactions, the acquisition and disposition of foreign currencies, and the difference between the amount of net investment income accrued and the U.S. dollar amount actually received. The portion of both realized and unrealized gains and losses on investments that results from fluctuations in foreign currency exchange rates is not separately disclosed but is included with net realized and unrealized gain/appreciation and loss/depreciation on investments.
At June 30, 2022, the exchange rate was EUR €1.00 to USD $1.05.
Contingencies. In the normal course of business, the Fund may enter into contracts with service providers that contain general indemnification clauses. The Fund’s maximum exposure under these arrangements is unknown, as this would involve future claims that may be made against
| | | | |
| 22 | | | | | The European Equity Fund, Inc. |
the Fund that have not yet occurred. However, based on experience, the Fund expects the risk of loss to be remote.
Taxes. The Fund’s policy is to comply with the requirements of the Internal Revenue Code, as amended, which are applicable to regulated investment companies, and to distribute all of its taxable income to its shareholders.
Additionally, the Fund may be subject to taxes imposed by the governments of countries in which it invests. Such taxes are generally based on income and/or capital gains earned or repatriated. Estimated tax liabilities on certain foreign securities are recorded on an accrual basis and are reflected as components of interest income or net change in unrealized gain/loss on investments. Tax liabilities realized as a result of security sales are reflected as a component of net realized gain/loss on investments.
At June 30, 2022, the aggregate cost of investments for federal income tax purposes was $63,966,186. The net unrealized depreciation for all investments based on tax cost was $5,026,380. This consisted of aggregate gross unrealized appreciation for all investments for which there was an excess of value over tax cost of $7,806,635 and aggregate gross unrealized depreciation for all investments for which there was an excess of tax cost over value of $12,833,015.
The Fund has reviewed the tax positions for the open tax years as of December 31, 2021 and has determined that no provision for income tax and/or uncertain tax positions is required in the Fund’s financial statements. The Fund’s federal tax returns for the prior three fiscal years remain open subject to examinations by the Internal Revenue Service.
Dividends and Distributions to Shareholders. The Fund records dividends and distributions to its shareholders on the ex-dividend date. The timing and character of certain income and capital gain distributions are determined annually in accordance with United States federal income tax regulations, which may differ from accounting principles generally accepted in the United States of America. These differences primarily relate to investments in foreign currency denominated investments and certain securities sold at a loss. As a result, net investment income (loss) and net realized gain (loss) on investment transactions for a reporting period may differ significantly from distributions during such period. Accordingly, the Fund may periodically make reclassifications among certain of its capital accounts without impacting the NAV of the Fund.
The tax character of current year distributions will be determined at the end of the current fiscal year.
| | | | | | |
| The European Equity Fund, Inc. | | | | | | 23 | |
B. Investment Advisory and Administration Agreements
The Fund is party to an Investment Advisory Agreement with DWS International GmbH (“DWSI”). The Fund also has an Administration Agreement with DWS Investment Management Americas, Inc. (“DIMA”). DWSI and DIMA are affiliated companies.
Under the Investment Advisory Agreement with DWSI, DWSI directs the investments of the Fund in accordance with its investment objectives, policies and restrictions. DWSI determines the securities, instruments and other contracts relating to investments to be purchased, sold or entered into by the Fund.
The Investment Advisory Agreement provides DWSI with a fee, computed weekly and payable monthly, at the annual rate of 0.65% of the Fund’s average weekly net assets up to and including $100 million, and 0.60% of such assets in excess of $100 million. In addition, DWSI has agreed to implement a temporary partial fee waiver. Effective January 1, 2022, the fee payable by the Fund to DWSI was reduced by 10 basis points for a one year period.
Accordingly, for the six months ended June 30, 2022, the fee pursuant to the Investment Advisory Agreement aggregated $234,141, of which $11,674 was waived resulting in an annualized rate of 0.55% of the Fund’s average daily net assets.
Under the Administration Agreement with DIMA, DIMA provides certain fund administration services to the Fund. The Administration Agreement provides DIMA with an annual fee, computed weekly and payable monthly, of 0.20% of the Fund’s average weekly net assets.
C. Transactions with Affiliates
DWS Service Company (“DSC”), an affiliate of DIMA, is the transfer agent, dividend-paying agent and shareholder service agent of the Fund. Pursuant to a sub-transfer agency agreement between DSC and DST Systems, Inc. (“DST”), DSC has delegated certain transfer agent and dividend-paying agent functions to DST. DSC compensates DST out of the fee it receives from the Fund. For the six months ended June 30, 2022, the amount charged to the Fund by DSC included in the Statement of Operations under “Services to shareholders” aggregated $5,973, of which $982 is unpaid.
Under an agreement with the Fund, DIMA is compensated for providing certain pre-press and regulatory filing services to the Fund. For the six months ended June 30, 2022, the amount charged to the Fund by DIMA included in the Statement of Operations under “Reports to shareholders and shareholder meeting expenses” aggregated $6,154, of which all is unpaid.
| | | | |
| 24 | | | | | The European Equity Fund, Inc. |
Deutsche Bank AG, the majority shareholder in the DWS Group, and its affiliates may receive brokerage commissions as a result of executing agency transactions in portfolio securities on behalf of the Fund, that the Board determined were effected in compliance with the Fund’s Rule 17e-1 procedures. For the six months ended June 30, 2022, Deutsche Bank did not receive brokerage commissions from the Fund.
Certain Officers of the Fund are also officers of DIMA.
The Fund pays each Director who is not an “interested person” of DIMA or DWS International GmbH retainer fees plus specified amounts for attended board and committee meetings.
The Fund may invest cash balances in DWS Central Cash Management Government Fund, which is managed by DIMA. The Fund indirectly bears its proportionate share of the expenses of DWS Central Cash Management Government Fund. DWS Central Cash Management Government Fund does not pay DIMA an investment management fee. DWS Central Cash Management Government Fund seeks maximum current income to the extent consistent with stability of principal.
D. Portfolio Securities
Purchases and sales of investment securities, excluding short-term investments, for the six months ended June 30, 2022, were $11,470,827 and $21,847,355, respectively.
E. Capital
During the six months ended June 30, 2022 and the year ended December 31, 2021, the Fund purchased 175,100 and 422,500 of its shares of common stock on the open market at a total cost of $1,526,134 and $4,730,559 ($8.72 and $11.20 average per share), respectively. The average discount of these purchased shares, comparing the purchase price to the NAV per share at the time of purchase, was 14.09% and 12.52%, respectively.
During the six months ended June 30, 2022, the Fund issued for dividend reinvestment 464,944 shares. The average discount of these issued shares, comparing the issue price to the NAV per share at the time of issuance, was 14.75%. During the year ended December 31, 2021 there were no reinvestments.
F. Share Repurchases
On July 24, 2020, the Fund announced that the Board of Directors approved an extension of the current repurchase authorization permitting the Fund to repurchase up to 745,000 shares during the period from August 1, 2020 through July 31, 2021. The Fund repurchased 435,155 shares between August 1, 2020 and July 31, 2021. On July 30, 2021, the
| | | | | | |
| The European Equity Fund, Inc. | | | | | | 25 | |
Fund announced that the Board of Directors approved an extension of the current repurchase authorization permitting the Fund to repurchase up to 700,849 shares during the period from August 1, 2021 through July 31, 2022. The Fund repurchased 344,400 shares between August 1, 2021 and June 30, 2022. On July 28, 2022, the Fund announced that the Board of Directors approved an extension of the current repurchase authorization permitting the Fund to repurchase up to 708,104 shares during the period from August 1, 2022 through July 31, 2023.
Repurchases will be made from time to time when they are believed to be in the best interests of the Fund. There can be no assurance that the Fund’s repurchases will reduce the spread between the market price of the Fund’s shares referred to below and its NAV per share.
Monthly updates concerning the Fund’s repurchase program are available on its Web site at dws.com.
G. Concentration of Ownership
From time to time, the Fund may have a concentration of several shareholder accounts holding a significant percentage of shares outstanding. Investment activities of these shareholders could have a material impact on the Fund. At June 30, 2022, there were two shareholders that held approximately 27% and 6%, respectively, of the outstanding shares of the Fund.
H. Other — COVID-19 Pandemic
A novel coronavirus known as COVID-19, declared a pandemic by the World Health Organization, has caused significant uncertainty, market volatility, decreased economic and other activity, increased government activity, including economic stimulus measures, and supply chain interruptions. The full effects, duration and costs of the COVID-19 pandemic are impossible to predict, and the circumstances surrounding the COVID-19 pandemic will continue to evolve, including the risk of future increased rates of infection due to significant portions of the population remaining unvaccinated and/or the lack of effectiveness of current vaccines against new variants. The pandemic has affected and may continue to affect certain countries, industries, economic sectors, companies and investment products more than others, may exacerbate existing economic, political, or social tensions and may increase the probability of an economic recession or depression. The Fund and its investments may be adversely affected by the effects of the COVID-19 pandemic, and the pandemic may result in the Fund and its service providers experiencing operational difficulties in coordinating a remote workforce and implementing their business continuity plans, among others. Management will continue to monitor the impact COVID-19 has on the Fund and reflect the consequences as appropriate in the Fund’s accounting and financial reporting.
| | | | |
| 26 | | | | | The European Equity Fund, Inc. |
| | |
| Report of Annual Meeting of Stockholders | | (Unaudited) |
The Annual Meeting of Stockholders (the “Meeting”) of The European Equity Fund, Inc. was held on June 23, 2022. At the close of business on April 29, 2022, the record date for the determination of stockholders entitled to vote at the Meeting, there were issued and outstanding 6,966,451 shares of the Fund’s common stock, each share being entitled to one vote, constituting all of the Fund’s outstanding voting securities. At the Meeting, the holders of 5,584,444 shares of the Fund’s common stock were represented in person or by proxy, constituting a quorum. At the Meeting, the following matters were voted upon by the stockholders. The resulting votes are presented below:
| 1. | To elect three (3) Class II Directors, each to serve for a term of three years and until his or her successor is elected and qualifies. |
| | | | | | | | |
| | | Number of Votes | |
| | | For | | | Withheld | |
| Dr. Holger Hatje | | | 5,344,549 | | | | 239,895 | |
| Dr. Christopher Pleister | | | 4,761,301 | | | | 823,143 | |
| Ms. Fiona Flannery | | | 5,388,362 | | | | 196,082 | |
| 2. | To elect one (1) Class III Director, to serve for a term of one year and until his successor is elected and qualifies. |
| | | | | | | | |
| | | Number of Votes | |
| | | For | | | Withheld | |
| Mr. Bernhard Koepp | | | 5,356,318 | | | | 228,126 | |
The other Directors of the Fund whose terms continued after the Meeting are Mr. Walter C. Dostmann, Dr. Wolfgang Leoni, Mr. Christian H. Strenger, Ms. Hepsen Uzcan and Mr. Christian M. Zügel.
| 3. | To ratify the appointment by the Audit Committee and the Board of Directors of Ernst & Young LLP, an independent public accounting firm, as independent auditors for the fiscal year ending December 31, 2022. |
| | | | | | | | |
| Number of Votes | |
| For | | Against | | | Abstain | |
| 5,458,238 | | | 87,567 | | | | 38,639 | |
| 4. | To approve a stockholder proposal asking the Fund to take steps to declassify the Board of Directors of the Fund. |
| | | | | | | | |
| Number of Votes | |
| For | | Against | | | Abstain | |
| 1,331,447 | | | 2,518,995 | | | | 67,240 | |
| | | | | | |
| The European Equity Fund, Inc. | | | | | | 27 | |
| | |
| Automated Information Lines | | DWS Closed-End Fund Info Line 1-800-GERMANY (1-800-437-6269) |
| Web Site | | dws.com Obtain fact sheets, financial reports, press releases and webcasts when available. |
| Written Correspondence | | DWS Attn: Secretary of the DWS Funds 100 Summer Street Boston, MA 02110 |
| Legal Counsel | | Sullivan & Cromwell LLP 125 Broad Street New York, NY 10004 |
| Dividend Reinvestment Plan Agent | | DST Systems, Inc. 333 W. 11th Street Kansas City, MO 64105 |
| Shareholder Service Agent and Transfer Agent | | DWS Service Company P.O. Box 219066 Kansas City, MO 64121-9066 1-800-GERMANY (1-800-437-6269) |
| Custodian | | Brown Brothers Harriman & Company 50 Post Office Square Boston, MA 02110 |
| Independent Registered Public Accounting Firm | | Ernst & Young LLP 200 Clarendon Street Boston, MA 02116 |
| Proxy Voting | | A description of the Fund’s policies and procedures for voting proxies for portfolio securities and information about how the Fund voted proxies related to its portfolio securities during the most recent 12-month period ended June 30 is available on our Web site — dws.com/en-us/resources/proxy-voting or on the SEC’s Web site — sec.gov. To obtain a written copy of the Fund’s policies and procedures without charge, upon request, call us toll free at 1-800-GERMANY (1-800-437-6269). |
| Portfolio Holdings | | Following the Fund’s fiscal first and third quarter-end, a complete portfolio holdings listing is posted on dws.com, and is available free of charge by contacting your financial intermediary, or if you are a direct investor, by calling (800) 728-3337. In addition, the portfolio holdings listing is filed with the SEC on the Fund’s Form N-PORT and will be available on the SEC’s Web site at sec.gov. Additional portfolio holdings for the Fund are also posted on dws.com from time to time. Please see the Fund’s current prospectus for more information. |
| | | | |
| 28 | | | | | The European Equity Fund, Inc. |
| | |
| Investment Management | | DWS International GmbH (the “Advisor”), which is part of the DWS Group GmbH & Co. KGaA (“DWS Group”), is the investment advisor for the Fund. DWS International GmbH provides a full range of investment advisory services to both institutional and retail clients. DWS International GmbH is a wholly owned subsidiary of DWS Group. DWS Group is a global organization that offers a wide range of investing expertise and resources, including hundreds of portfolio managers and analysts and an office network that reaches the world’s major investment centers. This well-resourced global investment platform brings together a wide variety of experience and investment insight across industries, regions, asset classes and investing styles. |
| Open Market Purchases by the Fund | | Notice is hereby given in accordance with Section 23(c) of the Investment Company Act of 1940 that the Fund may purchase at market prices from time to time shares of its common stock in the open market. |
| Voluntary Cash Purchase Program and Dividend Reinvestment Plan | | The Fund offers shareholders a Voluntary Cash Purchase Program and Dividend Reinvestment Plan (“Plan”) which provides for optional cash purchases and for the automatic reinvestment of dividends and distributions payable by the Fund in additional Fund shares. Plan participants may invest as little as $100 in any month and may invest up to $36,000 annually. The Plan allows current shareholders who are not already participants in the Plan and first time investors to enroll in the Plan by making an initial cash deposit of at least $250 with the plan agent. Share purchases are combined to receive a beneficial brokerage fee. A brochure is available by writing or telephoning the transfer agent: DWS Service Company P.O. Box 219066 Kansas City, MO 64105 Tel.: 1-800-GERMANY (1-800-437-6269) |
| NYSE Symbol | | EEA |
| Nasdaq Symbol | | XEEAX |
| CUSIP Number | | 298768102 |
| | | | | | |
| The European Equity Fund, Inc. | | | | | | 29 | |
Notes
There are three closed-end funds investing in European equities advised and administered by wholly owned subsidiaries of the DWS Group:
| | — | The Central and Eastern Europe Fund, Inc. — investing primarily in equity or equity-linked securities of issuers domiciled in Central and Eastern Europe (with normally at least 80% in securities of issuers domiciled in countries in Central and Eastern Europe). | |
| | — | The European Equity Fund, Inc. — investing primarily in equity or equity-linked securities of issuers domiciled in Europe (with normally at least 80% in securities of issuers domiciled in Europe). | |
| | — | The New Germany Fund, Inc. — investing primarily in equity or equity-linked securities of middle market German companies with up to 20% in other Western European companies (with no more than 15% in any single country). | |
Please consult your broker for advice on any of the above or call 1-800-GERMANY (1-800-437-6269) for shareholder reports.

EEA-3
(R-028303-10 8/22)
| | |
| | (b) Not applicable |
| | |
| ITEM 2. | CODE OF ETHICS |
| | |
| | Not applicable. |
| | |
| ITEM 3. | AUDIT COMMITTEE FINANCIAL EXPERT |
| | |
| | Not applicable |
| | |
| ITEM 4. | PRINCIPAL ACCOUNTANT FEES |
| | |
| | Not applicable |
| | |
| ITEM 5. | AUDIT COMMITTEE OF LISTED REGISTRANTS |
| | |
| | Not applicable |
| | |
| ITEM 6. | SCHEDULE OF INVESTMENTS |
| | |
| | Not applicable |
| | |
| ITEM 7. | DISCLOSURE OF PROXY VOTING POLICIES |
| | |
| | Not applicable |
| | |
| ITEM 8. | PORTFOLIO MANAGERS OF CLOSED-END MANAGEMENT INVESTMENT COMPANIES |
| | |
| | Not applicable |
| | |
| ITEM 9. | PURCHASES OF EQUITY SECURITIES BY CLOSED-END MANAGEMENT INVESTMENT COMPANY |
| | |
| Period | (a) Total Number of Shares Purchased | (b) Average Price Paid per Share | (c) Total Number of Shares Purchased as Part of Publicly Announced Plans or Programs | (d) Maximum Number of Shares that May Yet Be Purchased Under the Plans or Programs |
| | | | | |
| January 1 through January 31 | 19,000 | $ 10.05 | 19,000 | 512,549 |
| February 1 through February 29 | 51,000 | $ 9.77 | 51,000 | 461,549 |
| March 1 through March 31 | 17,601 | $ 8.75 | 17,601 | 443,948 |
| April 1 through April 30 | 6,399 | $ 8.64 | 6,399 | 437,549 |
| May 1 through May 31 | 38,906 | $ 7.86 | 38,906 | 398,643 |
| June 1 through June 30 | 42,194 | $ 7.63 | 42,194 | 356,449 |
| | | | | |
| Total | 175,100 | $ 8.72 | 175,100 | |
| | | | | |
| On July 30, 2021, the Fund announced that the Board of Directors approved an extension of the current repurchase authorization permitting the Fund to repurchase up to 700,849 shares during the period from August 1, 2021 through July 31, 2022. Under this plan, the Fund repurchased 344,400 shares in open market transactions between August 1, 2021 and June 30, 2022. |
| | | | | |
| On July 28, 2022, the Fund announced that the Board of Directors approved an extension of the current repurchase authorization permitting the Fund to repurchase up to 708,104 shares during the period from August 1, 2022 through July 31, 2023. |
| | |
| ITEM 10. | SUBMISSION OF MATTERS TO A VOTE OF SECURITY HOLDERS |
| | |
| | There were no material changes to the procedures by which stockholders may recommend nominees to the Fund’s Board. The Nominating and Governance Committee will consider nominee candidates properly submitted by stockholders in accordance with applicable law, the Fund's Articles of Incorporation or By-laws, resolutions of the Board and the qualifications and procedures set forth in the Nominating and Governance Committee Charter and this proxy statement. The Nominating and Governance Committee's Charter requires that a stockholder or group of stockholders seeking to submit a nominee candidate (i) must have beneficially owned at least 5% of the Fund's common stock for at least two years, (ii) may submit only one nominee candidate for any particular meeting of stockholders, and (iii) may submit a nominee candidate for only an annual meeting or other meeting of stockholders at which directors will be elected. The stockholder or group of stockholders must provide notice of the proposed nominee pursuant to the requirements found in the Fund's By-laws. Generally, this notice must be received not less than 90 days nor more than 120 days prior to the first anniversary of the date of mailing of the notice for the preceding year's annual meeting. Such notice shall include the specific information required by the Fund's By-laws. The Nominating and Governance Committee will evaluate nominee candidates properly submitted by stockholders on the same basis as it considers and evaluates candidates recommended by other sources. |
| | |
| ITEM 11. | CONTROLS |
| | |
| | (a) | The Chief Executive and Financial Officers concluded that the Registrant’s Disclosure Controls and Procedures are effective based on the evaluation of the Disclosure Controls and Procedures as of a date within 90 days of the filing date of this report. |
| | |
| | (b) | There have been no changes in the registrant’s internal control over financial reporting that occurred during the period covered by this report that has materially affected, or is reasonably likely to materially affect, the registrant’s internal controls over financial reporting. |
| | |
| ITEM 12. | Disclosure of Securities Lending Activities for Closed-End Management Investment Companies. |
| | |
| | Not applicable |
| | |
| ITEM 13. | EXHIBITS |
| | |
| | (a)(1) | Not applicable |
| | |
| | (a)(2) | Certification pursuant to Rule 30a-2(a) under the Investment Company Act of 1940 (17 CFR 270.30a-2(a)) is filed and attached hereto as Exhibit 99.CERT. |
| | |
| | (b) | Certification pursuant to Rule 30a-2(b) under the Investment Company Act of 1940 (17 CFR 270.30a-2(b)) is furnished and attached hereto as Exhibit 99.906CERT. |
| | | | |
SIGNATURES
Pursuant to the requirements of the Securities Exchange Act of 1934 and the Investment Company Act of 1940, the registrant has duly caused this report to be signed on its behalf by the undersigned, thereunto duly authorized.
| Registrant: | The European Equity Fund, Inc. |
| | |
| | |
| By: | /s/Hepsen Uzcan Hepsen Uzcan President |
| | |
| Date: | 8/29/2022 |
Pursuant to the requirements of the Securities Exchange Act of 1934 and the Investment Company Act of 1940, this report has been signed below by the following persons on behalf of the registrant and in the capacities and on the dates indicated.
| By: | /s/Hepsen Uzcan Hepsen Uzcan President |
| | |
| Date: | 8/29/2022 |
| | |
| | |
| | |
| By: | /s/Diane Kenneally Diane Kenneally Chief Financial Officer and Treasurer |
| | |
| Date: | 8/29/2022 |