LINEAR TECHNOLOGY CORPORATION
BOOKINGS BY END MARKET, REVENUE BY GEOGRAPHIC REGION, AND SUPPLEMENTAL FINANCIAL INFORMATION
(unaudited)
Linear Technology Corporation has been designing, manufacturing and marketing a broad line of analog integrated circuits for major companies worldwide for over three decades. The Company’s products provide an essential bridge between our analog world and the digital electronics in communications, networking, industrial, automotive, computer, medical, instrumentation, consumer, and military and aerospace systems. We generate bookings and revenue from thousands of customers worldwide and our bookings and revenues are diversified by end-market and geographical region.
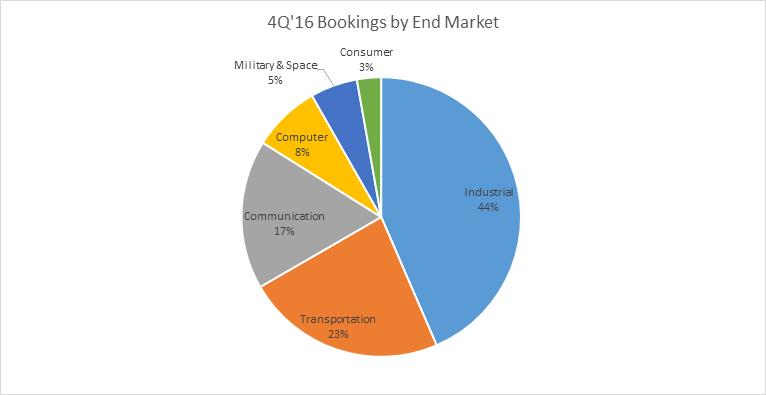
For the three months ended July 3, 2016 the categorization of bookings by end markets are as follows:
For the three months ended July 3, 2016 the categorization of revenue by geographic region are as follows:
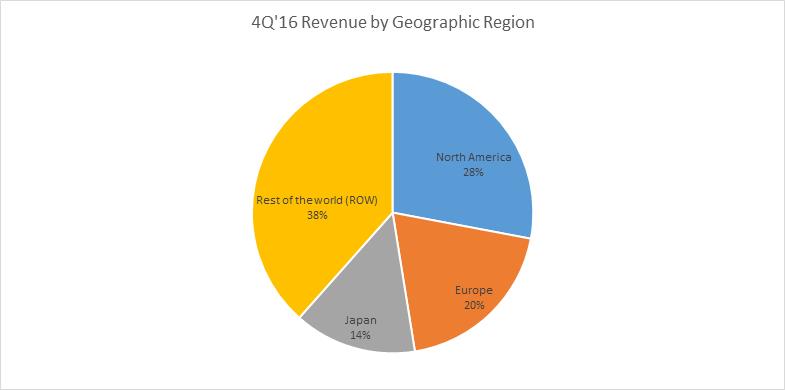
Based upon shipments made into the respective region. Demand created bookings during the period were approximately 38% in North America and 62% internationally.
For the three months ended July 3, 2016 the supplemental financial information is as follows:
REVENUES
•Revenues were up $12.6 million, 3.5% vs. Fiscal Q3 lead by an increase in shipments into the Transportation and Industrial markets.
| · | | Geographically, sales in Japan increased 10%, ROW increased 5% and North America increased by 3% while Europe decreased 2%. |
| · | | For Fiscal Q4, North American sales were 28% of total sales, Asia was 38%, Europe was 20% and Japan was 14%. |
| · | | ASP (average selling price) of our products exceeded $2 for the quarter. The last time that we had a quarterly ASP above $2 was in FY2001. This increase is due to the higher functional value LTC products bring to our customers, including our BMS (Battery Management System) and Micro-Module products. |
| · | | BMS sales grew nearly 30% last quarter and also set an all-time high for quarterly sales highlighting the strength of this business in China |
| · | | Micro-Module products also had a record sales quarter driven by the release of new products and broader acceptance of previously released Micro-Module products. |
| · | | For the quarter we had a book to bill ratio that was slightly greater than 1. |
GROSS MARGIN
•Gross Margin increased by 2 tenths to 76.4%.
•Average Selling Price increased to $2.01 up from $1.97
•Cost of Sales benefited from spreading manufacturing overhead over the higher sales base and in increase in production days.
OPERATING EXPENSES
•Research and development expenses increased by $686 thousand primarily from an increase in profit sharing, stock based compensation, legal expenses and labor costs resulting from new employees and merit increases. These increases were partially offset by a decrease in supplies, masks and travel expenses.
•Selling, general and administrative expenses increased $440 thousand primarily from an increase in profit sharing, stock based compensation and labor costs resulting from merit increases. These increases were partially offset by lower fringe benefit costs.
EFFECTIVE INCOME TAX RATE
•The Company’s effective income tax rate increased to 23.7%, up from 21.7% in the previous quarter as the prior quarter benefited from higher quarterly discrete items. The Company’s annual effective income tax rate excluding quarterly discrete items is 24.25%.
DILUTED SHARES
•Average diluted shares used in the calculation of earnings per share increased by 169 thousand shares. During the quarter the company made no open market stock repurchases.
BALANCE SHEET ITEMS
CASH AND INVESTMENTS
•Cash, cash equivalents and investments increased by $85.2 million to $1.45 billion, net of spending $13 million for capital expenditures, $78.4 million for dividends and $8.1 million for
stock purchases totaling 175 thousand shares from tax withholding on vested employee stock. The company made no open market stock repurchases during the quarter.
ACCOUNTS RECEIVABLE
•Accounts Receivable increased by $4.6 million on an increase in revenues. Days sales outstanding decreased to 38 days from 39 days.
INVENTORIES
•Inventories increased by $3 million as raw materials, work in process and finished goods inventories all increased. Raw materials increased for key components with longer lead times while work in process and finished goods increased in part in preparation of holiday periods in the Company’s overseas assembly and test operations.
•Average inventory turns remained stable at 3.7 times for the quarter on an annual basis
BOOKINGS BY REGION
| · | | The Company’s book to bill ratio for Fiscal Q4 was slightly positive. |
| o | | Bookings increased in International and decreased in North America. |
| o | | Within International, bookings increased in Rest of World (“ROW” Asia, excluding Japan), while Europe and Japan were down. |
BOOKINGS BY MARKET SECTOR
| · | | On a sequential basis, bookings were up in Computer and Consumer while bookings decreased in Industrial, Communications, Transportation and Military/Space. |
| o | | Computer was up on an increase in Notebook Computer bookings. |
| o | | Transportation was down modestly following strong bookings in Fiscal Q3. |
| · | | Industrial was 44% of bookings, the same as the previous quarter. |
| o | | Bookings in Asia and Japan increased modestly over Q3, while Europe and North America bookings were down. |
| · | | Transportation bookings decreased to 23% from 24% of total bookings. |
| o | | Bookings were up slightly in Europe and down in North America, Japan and ROW . |
| · | | Communications bookings decreased to 17% from 18% of total bookings |
| o | | Bookings were up slightly in North America and down in International. |
| · | | Computer bookings increased to 8% of total bookings, up from 6%. |
| o | | The increase was in North America where the majority of this business is booked. |
| · | | Military/Space decreased to 5% from 6% of total bookings. |
| o | | North America booking were up while bookings in Europe were down. |
| · | | Consumer increased to 3%, up from 2% last quarter. |
| · | | On a demand created basis, bookings were 62% in International and 38% in North America, the same as last period. |
BACKLOG
•The Company’s order backlog exiting the quarter was $187 million