Oppenheimer Holdings Inc. Annual Stockholders’ Meeting New York, NY May 14, 2018
WELCOME to Oppenheimer’s 2018 Annual Stockholders’ Meeting May 14, 2018 1
Safe Harbor Statement This presentation and other written or oral statements made from time to time by representatives of Oppenheimer Holdings Inc. (the “company”) may contain “forward-looking statements” within the meaning of Section 27A of the Securities Act of 1933, as amended, and Section 21E of the Securities Exchange Act of 1934, as amended. These forward-looking statements may relate to such matters as anticipated financial performance, future revenues or earnings, business prospects, new products or services, anticipated market performance and similar matters. The Private Securities Litigation Reform Act of 1995 provides a safe harbor for forward-looking statements. Forward-looking statements are neither historical facts nor assurances of future performance. Instead, they are based only on the company’s current beliefs, expectations and assumptions regarding the future of the company’s business, future plans and strategies, projections, anticipated events and trends, the economy and other future conditions. Because forward-looking statements relate to the future, they are subject to inherent uncertainties, risks and changes in circumstances that are difficult to predict and many of which are outside of the company’s control. The company cautions that a variety of factors could cause the company’s actual results to differ materially from the anticipated results or other expectations expressed in the company’s forwarding-looking statements. These risks and uncertainties include, but are not limited to, those risk factors discussed in Part I, “Item 1A. Risk Factors” of our Annual Report on Form 10-K for the year ended December 31, 2017 filed with the SEC on March 2, 2018 (the “2017 10-K”). In addition, important factors that could cause actual results to differ materially from those in the forward-looking statements include those factors discussed in Part II, “Item 7. Management’s Discussion & Analysis of Financial Condition and Results of Operations – Factors Affecting ‘Forward-Looking Statements’” of the 2017 10-K. Any forward-looking statements herein are qualified in their entirety by reference to all such factors discussed in the 2017 10-K and the company’s other SEC filings. There can be no assurance that the company has correctly or completely identified and assessed all of the factors affecting the company’s business. Therefore, you should not rely on any of these forward-looking statements. Any forward-looking statement made by the company in this presentation is based only on information currently available to the company and speaks only as of the date on which it is made. The company does not undertake any obligation to publicly update or revise any forward-looking statements, whether written or oral, that may be made from time to time, whether as a result of new information, future developments or otherwise. 2

Agenda ° Current Environment ° Business Overview ° Financial Results ° Business Segments 3
Current Environment Macro ° Economic growth in the U.S. continues to expand with hints of future inflation ° Lowest unemployment rate in over 20 years ° Early 2018 saw an increase in volatility in the equity markets ° Consumer sentiment continues to strengthen ° Short-term interest rates up 150 bps since December 2015 with more rate hikes expected in 2018 and 2019 ° Lower corporate taxes due to Tax Cuts and Jobs Act (TCJA) Industry ° Regulatory landscape (DOL Fiduciary Standard vacated by court and replaced by draft SEC Best Interest Standard) ° Active to passive investment strategy continues to drive investor flows ° Continued decline of transaction-based commission business ° Fewer financial advisors employed in securities industry ° Migration of financial advisors from wirehouses to regional firms or independent platforms ° Impact of Fintech advancements on the industry 4
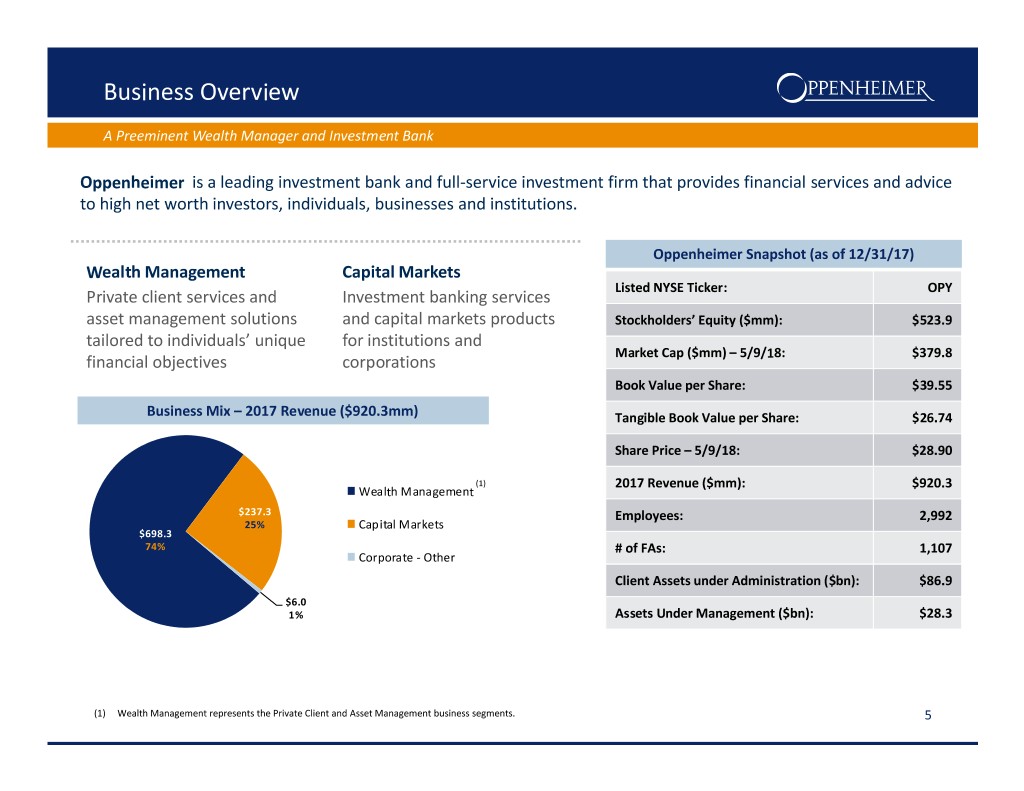
Business Overview A Preeminent Wealth Manager and Investment Bank Oppenheimer is a leading investment bank and full-service investment firm that provides financial services and advice to high net worth investors, individuals, businesses and institutions. Oppenheimer Snapshot (as of 12/31/17) Wealth Management Capital Markets Listed NYSE Ticker: OPY Private client services and Investment banking services asset management solutions and capital markets products Stockholders’ Equity ($mm): $523.9 tailored to individuals’ unique for institutions and Market Cap ($mm) – 5/9/18: $379.8 financial objectives corporations Book Value per Share: $39.55 Business Mix – 2017 Revenue ($920.3mm) Tangible Book Value per Share: $26.74 Share Price – 5/9/18: $28.90 (1) 2017 Revenue ($mm): $920.3 Wealth Management $237.3 Employees: 2,992 25% Capital Markets $698.3 74% # of FAs: 1,107 Corporate - Other Client Assets under Administration ($bn): $86.9 $6.0 1% Assets Under Management ($bn): $28.3 (1) Wealth Management represents the Private Client and Asset Management business segments. 5
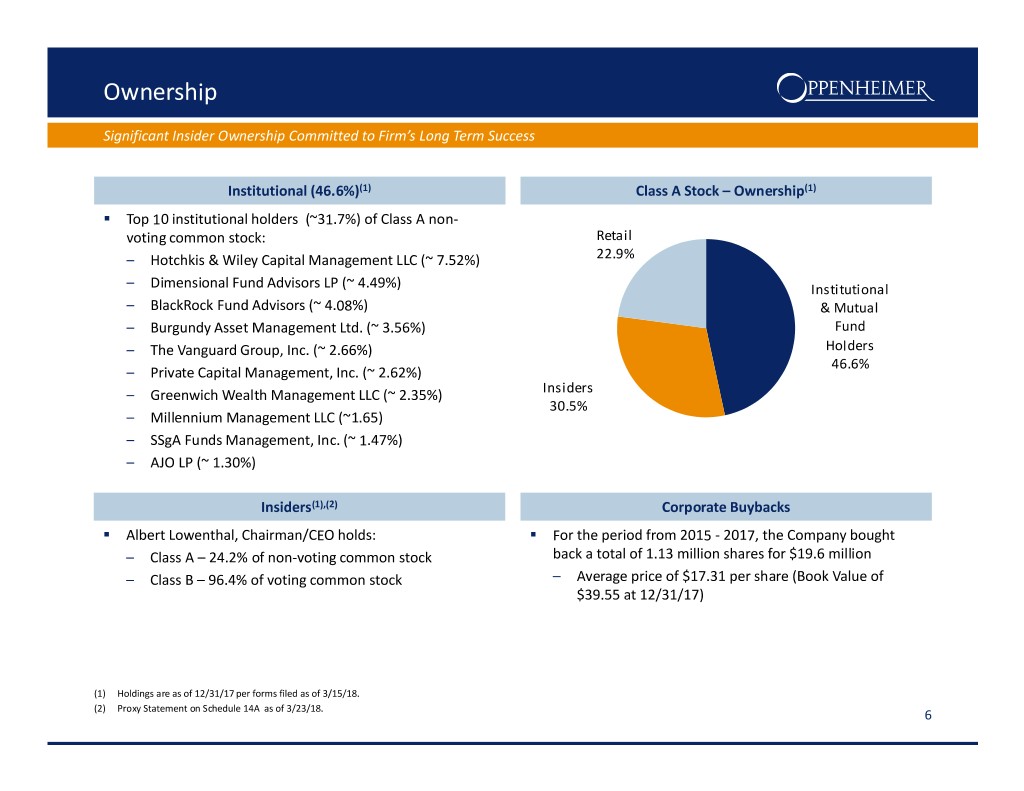
Ownership Significant Insider Ownership Committed to Firm’s Long Term Success Institutional (46.6%) (1) Class A Stock – Ownership (1) ° Top 10 institutional holders (~31.7%) of Class A non- voting common stock: Retail – Hotchkis & Wiley Capital Management LLC (~ 7.52%) 22.9% – Dimensional Fund Advisors LP (~ 4.49%) Institutional – BlackRock Fund Advisors (~ 4.08%) & Mutual – Burgundy Asset Management Ltd. (~ 3.56%) Fund – The Vanguard Group, Inc. (~ 2.66%) Holders 46.6% – Private Capital Management, Inc. (~ 2.62%) – Greenwich Wealth Management LLC (~ 2.35%) Insiders 30.5% – Millennium Management LLC (~1.65) – SSgA Funds Management, Inc. (~ 1.47%) – AJO LP (~ 1.30%) Insiders (1),(2) Corporate Buybacks ° Albert Lowenthal, Chairman/CEO holds: ° For the period from 2015 - 2017, the Company bought – Class A – 24.2% of non-voting common stock back a total of 1.13 million shares for $19.6 million – Class B – 96.4% of voting common stock – Average price of $17.31 per share (Book Value of $39.55 at 12/31/17) (1) Holdings are as of 12/31/17 per forms filed as of 3/15/18. (2) Proxy Statement on Schedule 14A as of 3/23/18. 6
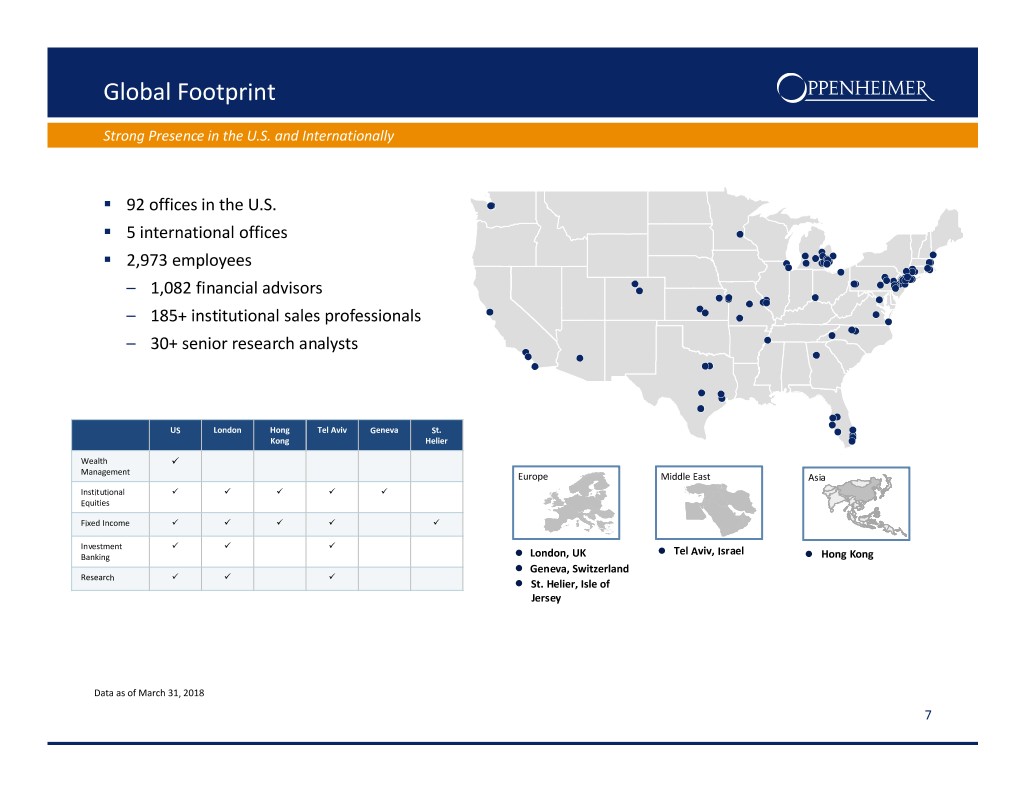
Global Footprint Strong Presence in the U.S. and Internationally ° 92 offices in the U.S. ° 5 international offices ° 2,973 employees – 1,082 financial advisors – 185+ institutional sales professionals – 30+ senior research analysts US London Hong Tel Aviv Geneva St. Kong Helier Wealth V Management Europe Middle East Asia Beijing Institutional V V V V V Shanghai Hong Kong Equities Fixed Income V V V V V Investment V V V Tel Aviv, Israel Banking London, UK Hong Kong Geneva, Switzerland Research V V V St. Helier, Isle of Jersey Data as of March 31, 2018 7
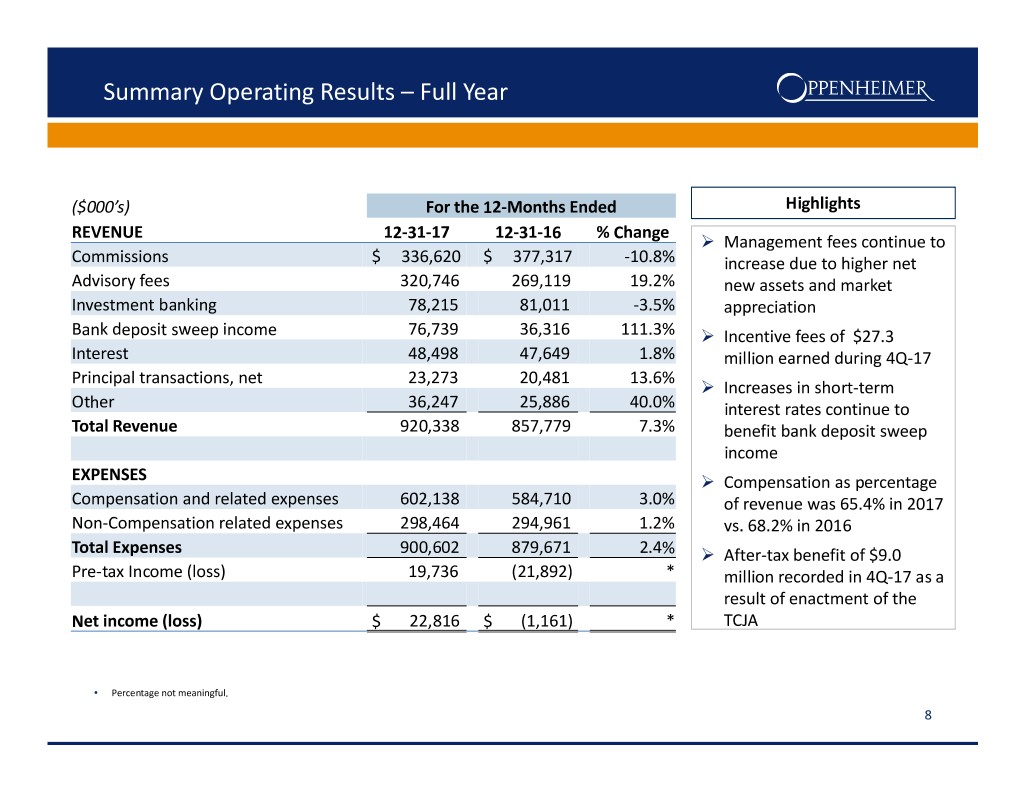
Summary Operating Results – Full Year ($000’s) For the 12-Months Ended Highlights REVENUE 12-31-17 12-31-16 % Change ‹ Management fees continue to Commissions $ 336,620 $ 377,317 -10.8% increase due to higher net Advisory fees 320,746 269,119 19.2% new assets and market Investment banking 78,215 81,011 -3.5% appreciation Bank deposit sweep income 76,739 36,316 111.3% ‹ Incentive fees of $27.3 Interest 48,498 47,649 1.8% million earned during 4Q-17 Principal transactions, net 23,273 20,481 13.6% ‹ Increases in short-term Other 36,247 25,886 40.0% interest rates continue to Total Revenue 920,338 857,779 7.3% benefit bank deposit sweep income EXPENSES ‹ Compensation as percentage Compensation and related expenses 602,138 584,710 3.0% of revenue was 65.4% in 2017 Non-Compensation related expenses 298,464 294,961 1.2% vs. 68.2% in 2016 Total Expenses 900,602 879,671 2.4% ‹ After-tax benefit of $9.0 Pre-tax Income (loss) 19,736 (21,892) * million recorded in 4Q-17 as a result of enactment of the Net income (loss) $ 22,816 $ (1,161) * TCJA • Percentage not meaningful. 8
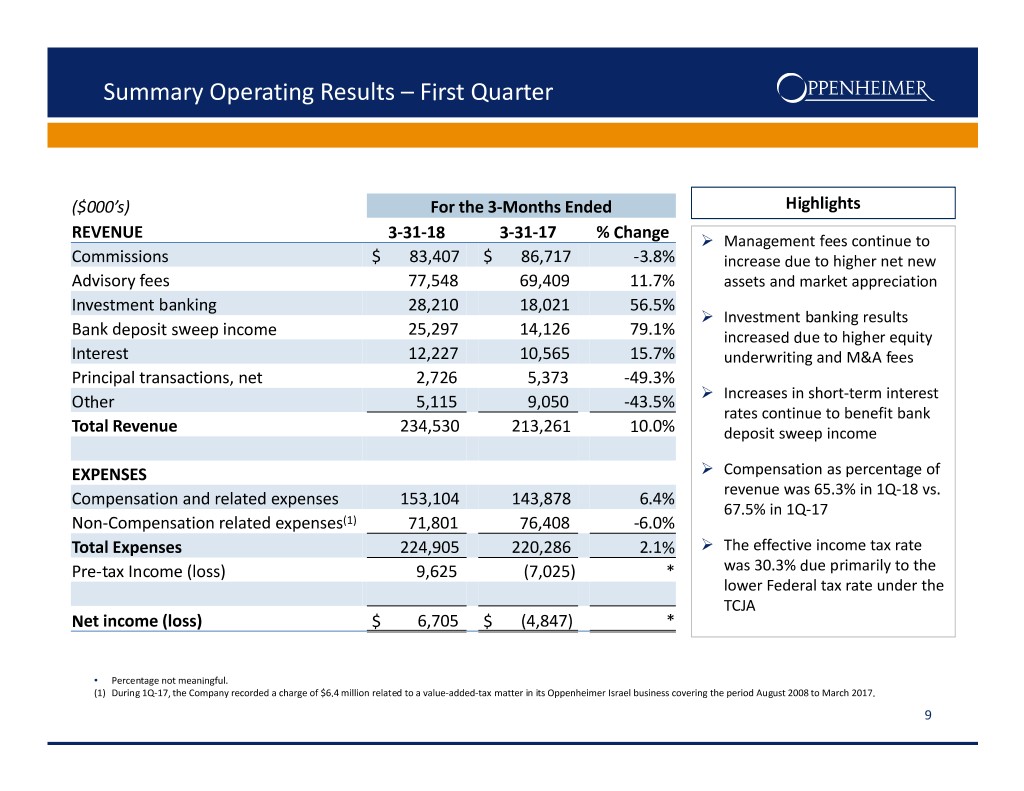
Summary Operating Results – First Quarter ($000’s) For the 3-Months Ended Highlights REVENUE 3-31-18 3-31-17 % Change ‹ Management fees continue to Commissions $ 83,407 $ 86,717 -3.8% increase due to higher net new Advisory fees 77,548 69,409 11.7% assets and market appreciation Investment banking 28,210 18,021 56.5% ‹ Investment banking results Bank deposit sweep income 25,297 14,126 79.1% increased due to higher equity Interest 12,227 10,565 15.7% underwriting and M&A fees Principal transactions, net 2,726 5,373 -49.3% Other 5,115 9,050 -43.5% ‹ Increases in short-term interest rates continue to benefit bank Total Revenue 234,530 213,261 10.0% deposit sweep income EXPENSES ‹ Compensation as percentage of revenue was 65.3% in 1Q-18 vs. Compensation and related expenses 153,104 143,878 6.4% 67.5% in 1Q-17 Non-Compensation related expenses (1) 71,801 76,408 -6.0% Total Expenses 224,905 220,286 2.1% ‹ The effective income tax rate Pre-tax Income (loss) 9,625 (7,025) * was 30.3% due primarily to the lower Federal tax rate under the TCJA Net income (loss) $ 6,705 $ (4,847) * • Percentage not meaningful. (1) During 1Q-17, the Company recorded a charge of $6.4 million related to a value-added-tax matter in its Oppenheimer Israel business covering the period August 2008 to March 2017. 9
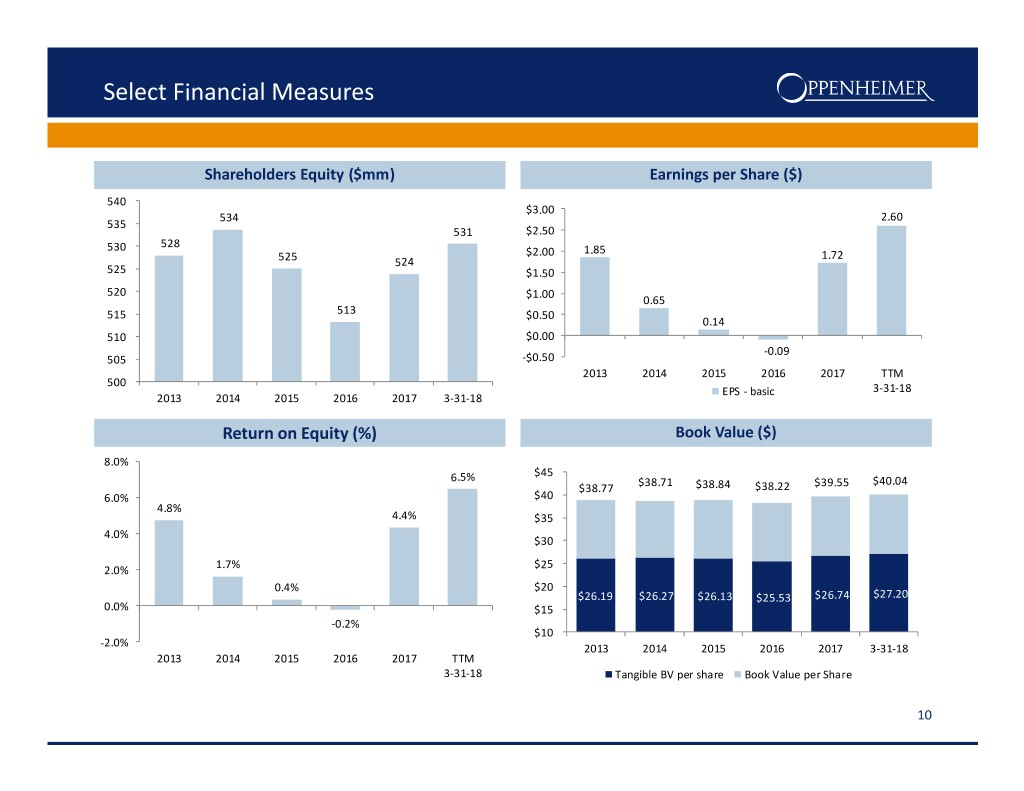
Select Financial Measures Shareholders Equity ($mm) Earnings per Share ($) 540 $3.00 534 2.60 535 531 $2.50 530 528 $2.00 1.85 1.72 525 524 525 $1.50 520 $1.00 0.65 515 513 $0.50 0.14 510 $0.00 -0.09 505 -$0.50 2013 2014 2015 2016 2017 TTM 500 EPS - basic 3-31-18 2013 2014 2015 2016 2017 3-31-18 Return on Equity (%) Book Value ($) 8.0% $45 6.5% $38.71 $40.04 $38.77 $38.84 $38.22 $39.55 6.0% $40 4.8% 4.4% $35 4.0% $30 1.7% $25 2.0% 0.4% $20 $26.19 $26.27 $26.13 $25.53 $26.74 $27.20 0.0% $15 -0.2% $10 -2.0% 2013 2014 2015 2016 2017 3-31-18 2013 2014 2015 2016 2017 TTM 3-31-18 Tangible BV per share Book Value per Share 10
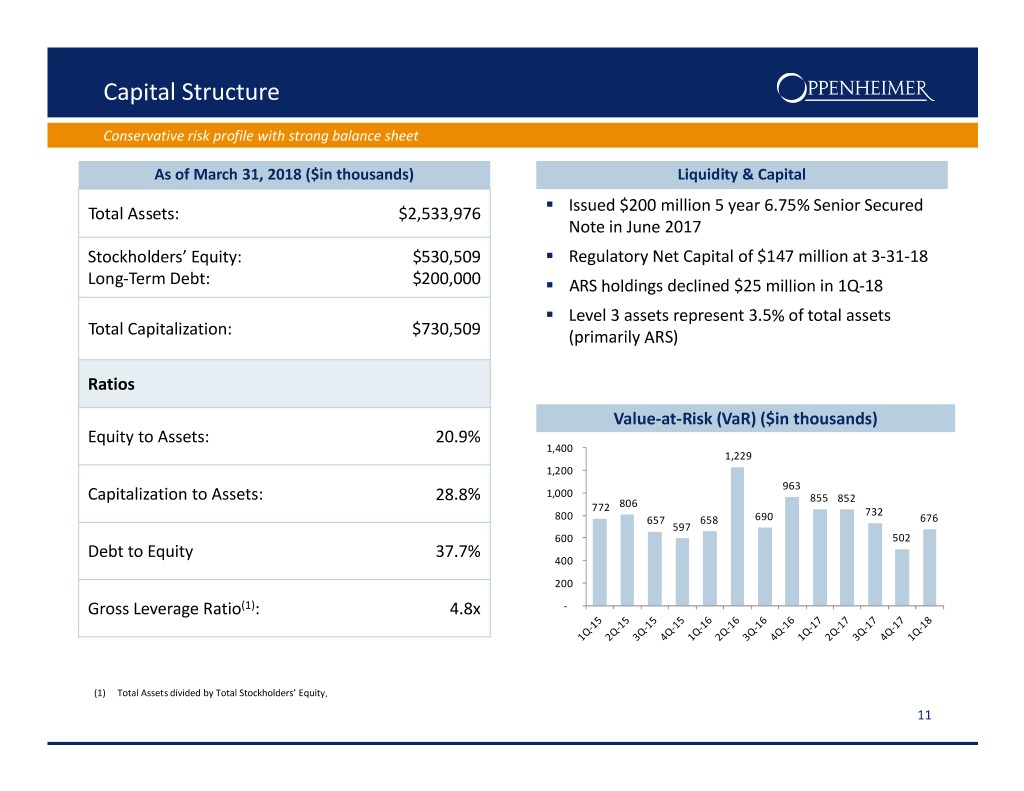
Capital Structure Conservative risk profile with strong balance sheet As of March 31, 2018 ($in thousands) Liquidity & Capital Total Assets: $2,533,976 ° Issued $200 million 5 year 6.75% Senior Secured Note in June 2017 Stockholders’ Equity: $530,509 ° Regulatory Net Capital of $147 million at 3-31-18 Long-Term Debt: $200,000 ° ARS holdings declined $25 million in 1Q-18 ° Level 3 assets represent 3.5% of total assets Total Capitalization: $730,509 (primarily ARS) Ratios Value-at-Risk (VaR) ($in thousands) Equity to Assets: 20.9% 1,400 1,229 1,200 963 Capitalization to Assets: 28.8% 1,000 806 855 852 772 732 800 657 658 690 676 597 600 502 Debt to Equity 37.7% 400 200 Gross Leverage Ratio (1) : 4.8x - (1) Total Assets divided by Total Stockholders’ Equity. 11
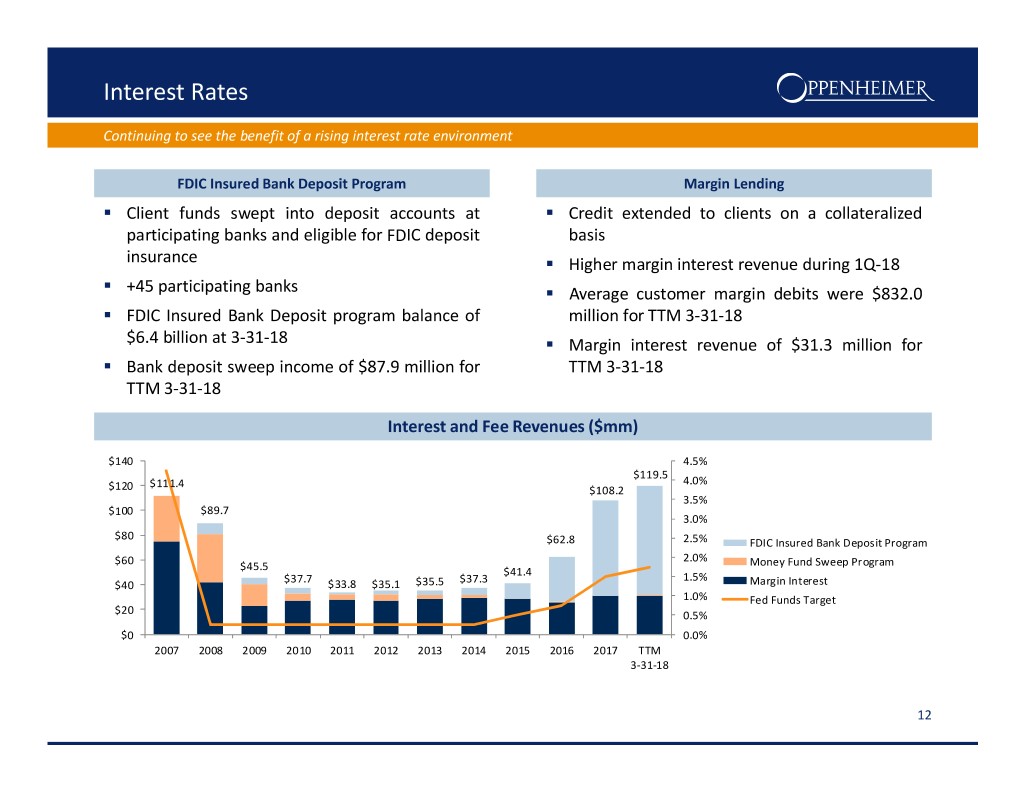
Interest Rates Continuing to see the benefit of a rising interest rate environment FDIC Insured Bank Deposit Program Margin Lending ° Client funds swept into deposit accounts at ° Credit extended to clients on a collateralized participating banks and eligible for FDIC deposit basis insurance ° Higher margin interest revenue during 1Q-18 ° +45 participating banks ° Average customer margin debits were $832.0 ° FDIC Insured Bank Deposit program balance of million for TTM 3-31-18 $6.4 billion at 3-31-18 ° Margin interest revenue of $31.3 million for ° Bank deposit sweep income of $87.9 million for TTM 3-31-18 TTM 3-31-18 Interest and Fee Revenues ($mm) $140 4.5% $119.5 $111.4 4.0% $120 $108.2 3.5% $100 $89.7 3.0% $80 $62.8 2.5% FDIC Insured Bank Deposit Program $60 2.0% Money Fund Sweep Program $45.5 $41.4 $37.7 $37.3 1.5% $40 $33.8 $35.1 $35.5 Margin Interest 1.0% Fed Funds Target $20 0.5% $0 0.0% 2007 2008 2009 2010 2011 2012 2013 2014 2015 2016 2017 TTM 3-31-18 12
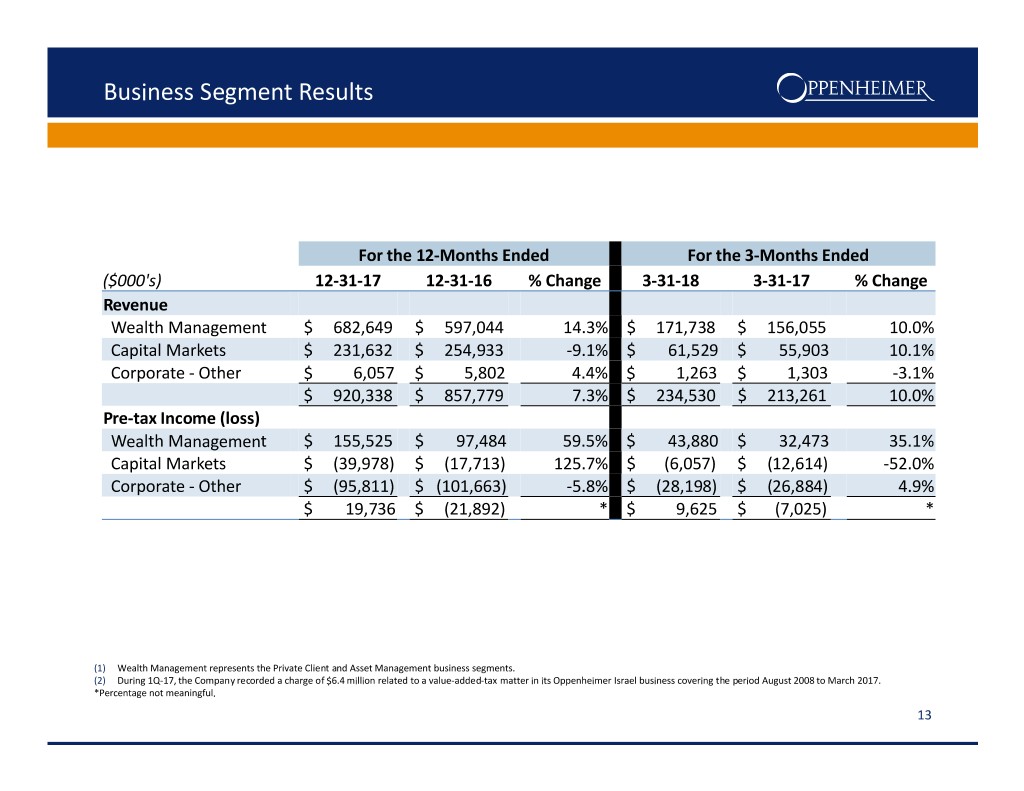
Business Segment Results For the 12-Months Ended For the 3-Months Ended ($000's) 12-31-17 12-31-16 % Change 3-31-18 3-31-17 % Change Revenue Wealth Management $ 682,649 $ 597,044 14.3% $ 171,738 $ 156,055 10.0% Capital Markets $ 231,632 $ 254,933 -9.1% $ 61,529 $ 55,903 10.1% Corporate - Other $ 6,057 $ 5,802 4.4% $ 1,263 $ 1,303 -3.1% $ 920,338 $ 857,779 7.3% $ 234,530 $ 213,261 10.0% Pre-tax Income (loss) Wealth Management $ 155,525 $ 97,484 59.5% $ 43,880 $ 32,473 35.1% Capital Markets $ (39,978) $ (17,713) 125.7% $ (6,057) $ (12,614) -52.0% Corporate - Other $ (95,811) $ (101,663) -5.8% $ (28,198) $ (26,884) 4.9% $ 19,736 $ (21,892) * $ 9,625 $ (7,025) * (1) Wealth Management represents the Private Client and Asset Management business segments. (2) During 1Q-17, the Company recorded a charge of $6.4 million related to a value-added-tax matter in its Oppenheimer Israel business covering the period August 2008 to March 2017. *Percentage not meaningful. 13
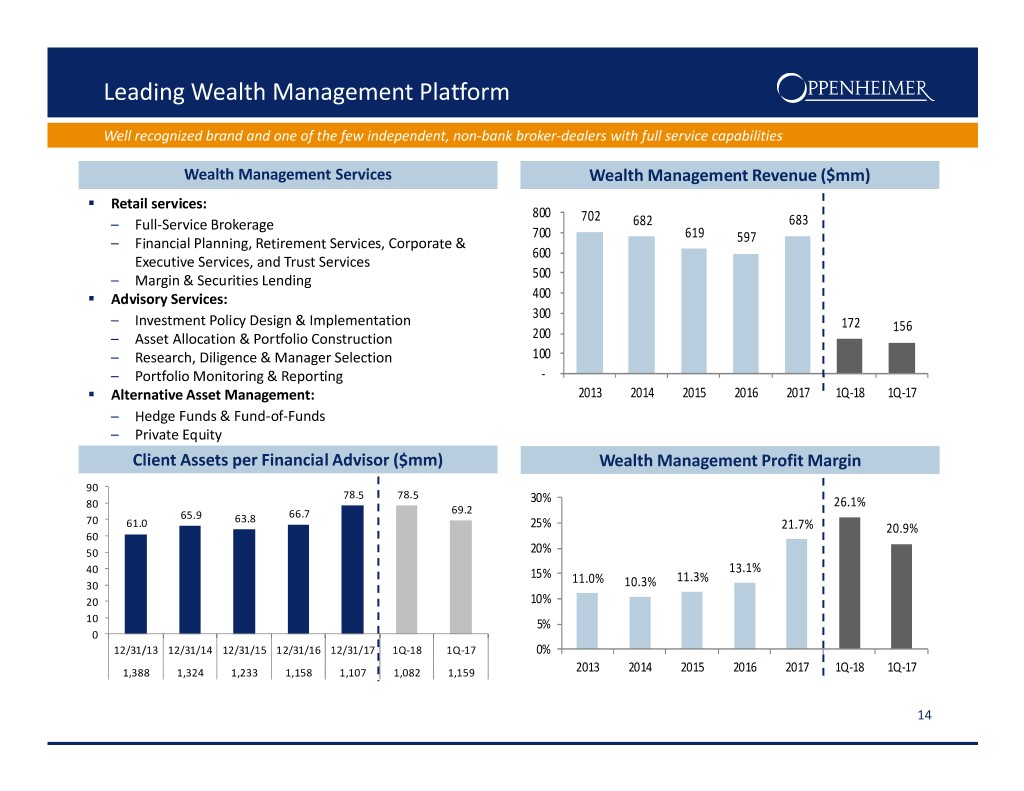
Leading Wealth Management Platform Well recognized brand and one of the few independent, non-bank broker-dealers with full service capabilities Wealth Management Services Wealth Management Revenue ($mm) ° Retail services: 800 – Full-Service Brokerage 702 682 683 700 619 597 – Financial Planning, Retirement Services, Corporate & 600 Executive Services, and Trust Services 500 – Margin & Securities Lending 400 300 ° Advisory Services: 172 200 156 – Investment Policy Design & Implementation 100 – Asset Allocation & Portfolio Construction - – Research, Diligence & Manager Selection 2013 2014 2015 2016 2017 1Q-18 1Q-17 – Portfolio Monitoring & Reporting ° Alternative Asset Management: – Hedge Funds & Fund-of-Funds – Private Equity Client Assets per Financial Advisor ($mm) Wealth Management Profit Margin 90 78.5 78.5 80 65.9 66.7 69.2 30% 26.1% 70 61.0 63.8 60 25% 21.7% 20.9% 50 20% 40 13.1% 15% 11.0% 11.3% 30 10.3% 20 10% 10 5% 0 0% 12/31/13 12/31/14 12/31/15 12/31/16 12/31/17 1Q-18 1Q-17 2013 2014 2015 2016 2017 1Q-18 1Q-17 1,388 1,324 1,233 1,158 1,107 1,082 1,159 14
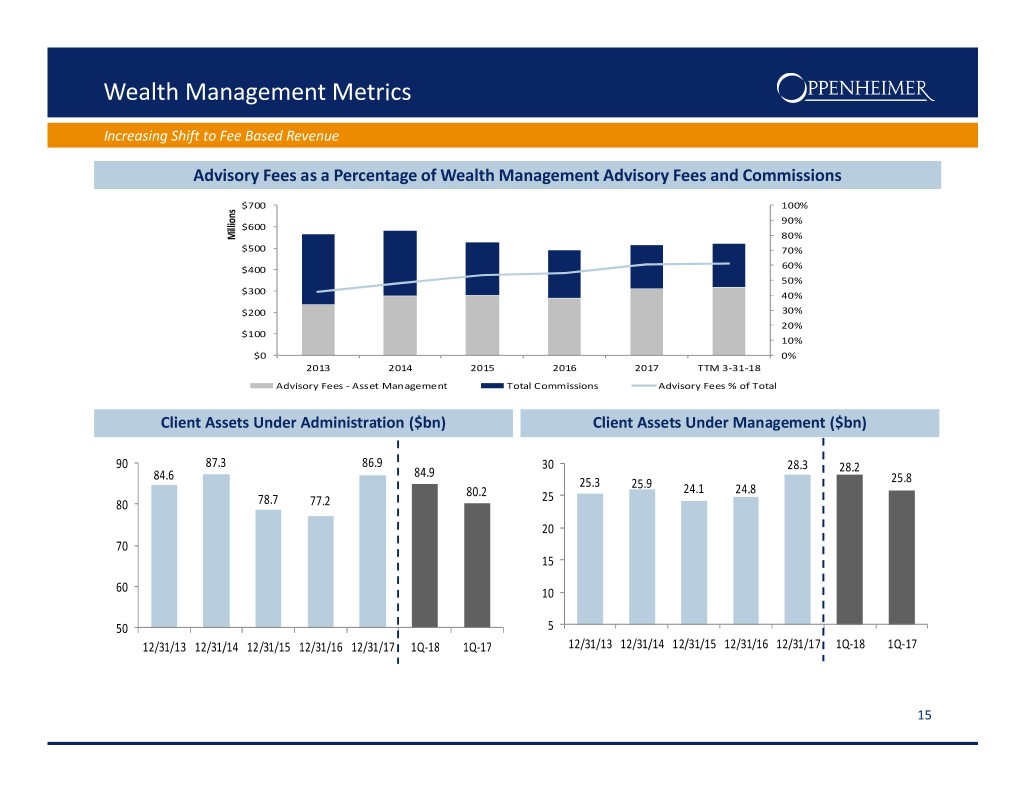
Wealth Management Metrics Increasing Shift to Fee Based Revenue Advisory Fees as a Percentage$700 of Wealth Management Advisory Fees and Commissions100% 90% $600 80% $500 70% Millions $400 60% 50% $300 40% $200 30% 20% $100 10% $0 0% 2013 2014 2015 2016 2017 TTM 3-31-18 Advisory Fees - Asset Management Total Commissions Advisory Fees % of Total Client Assets Under Administration ($bn) Client Assets Under Management ($bn) 90 87.3 86.9 30 28.3 84.6 84.9 28.2 25.3 25.8 80.2 25.9 24.1 24.8 80 78.7 77.2 25 20 70 15 60 10 50 5 12/31/13 12/31/14 12/31/15 12/31/16 12/31/17 1Q-18 1Q-17 12/31/13 12/31/14 12/31/15 12/31/16 12/31/17 1Q-18 1Q-17 15
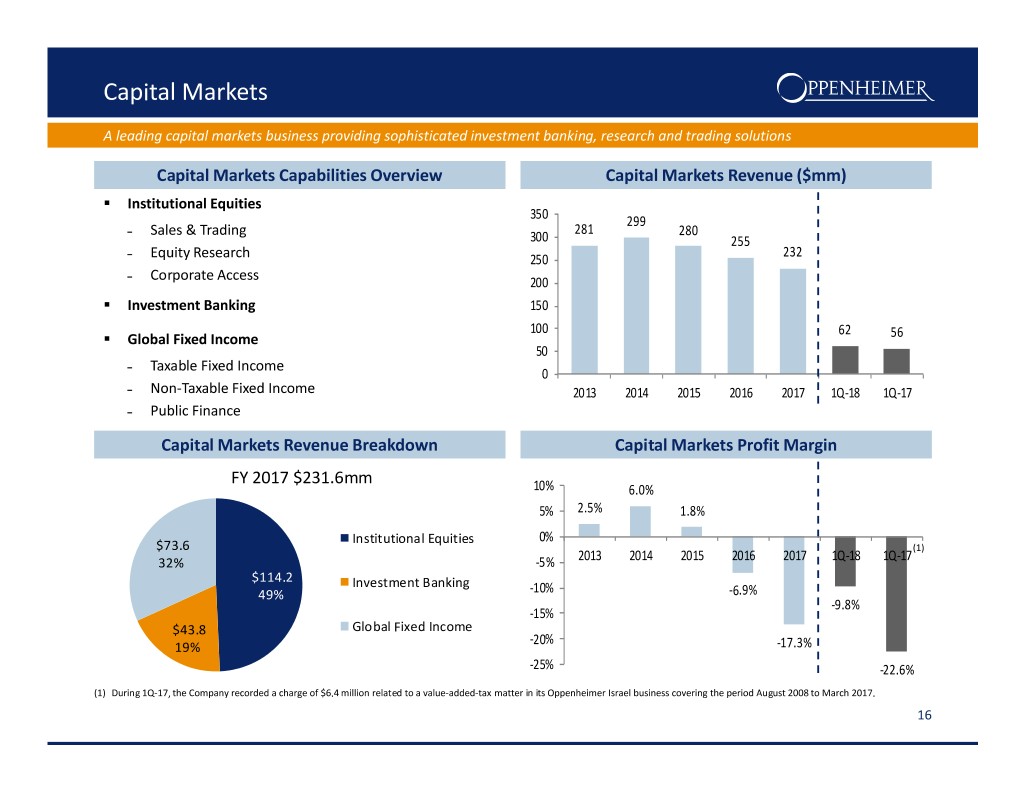
Capital Markets A leading capital markets business providing sophisticated investment banking, research and trading solutions Capital Markets Capabilities Overview Capital Markets Revenue ($mm) ° Institutional Equities 350 299 ˗ Sales & Trading 281 280 300 255 232 ˗ Equity Research 250 ˗ Corporate Access 200 150 ° Investment Banking 100 62 56 50 ° Global Fixed Income 0 ˗ Taxable Fixed Income 2013 2014 2015 2016 2017 1Q-18 1Q-17 ˗ Non-Taxable Fixed Income ˗ Public Finance Capital Markets Revenue Breakdown Capital Markets Profit Margin FY 2017 $231.6mm 10% 6.0% 5% 2.5% 1.8% Institutional Equities 0% $73.6 -5% 2013 2014 2015 2016 2017 1Q-18(1) 1Q-17 32% $114.2 -10% -6.9% Investment Banking -9.8% 49% -15% -20% -17.3% $43.8 Global Fixed Income -25% -22.6% 19% (1) During 1Q-17, the Company recorded a charge of $6.4 million related to a value-added-tax matter in its Oppenheimer Israel business covering the period August 2008 to March 2017. 16
Oppenheimer Position ° Well recognized brand with strong history ° Business model low risk and well diversified with low leverage ° Investing in technology to remain competitive and attract millennials ° Building momentum in investment banking business ° Increasing shift from transaction-based business to fee-based business ° Continue to benefit from rising interest rate environment ° Lower legal and regulatory costs ° Conservative balance sheet ° Completed $200 million debt offering which provides fixed long-term financing through 2022 at a lower coupon rate ° Investing in our future and poised for growth, organically and through acquisitions 17
