CERTIFIED SHAREHOLDER REPORT OF REGISTERED MANAGEMENT INVESTMENT COMPANIES
Investment Company Act file number:
(811-04518)
Exact name of registrant as specified in charter:
Putnam Massachusetts Tax Exempt Income Fund
Address of principal executive offices:
One Post Office Square, Boston, Massachusetts 02109
Name and address of agent for service:
Robert T. Burns, Vice President One Post Office Square Boston, Massachusetts 02109
Copy to:
Bryan Chegwidden, Esq. Ropes & Gray LLP 1211 Avenue of the Americas New York, New York 10036
Registrant’s telephone number, including area code:
(617) 292-1000
Date of fiscal year end:
May 31, 2015
Date of reporting period :
June 1, 2014 — May 31, 2015
Item 1. Report to Stockholders:
The following is a copy of the report transmitted to stockholders pursuant to Rule 30e-1 under the Investment Company Act of 1940:
Putnam Massachusetts Tax Exempt Income Fund
Annual report 5 | 31 | 15
Message from the Trustees
1
About the fund
2
Performance snapshot
4
Interview with your fund’s portfolio manager
5
Your fund’s performance
11
Your fund’s expenses
14
Terms and definitions
16
Other information for shareholders
17
Important notice regarding Putnam’s privacy policy
18
Financial statements
19
Federal tax information
40
About the Trustees
41
Officers
43
Consider these risks before investing: The value of bonds in the fund’s portfolio may fall or fail to rise over extended periods of time for a variety of reasons, including general financial market conditions, changing market perceptions of the risk of default, changes in government intervention, and factors related to a specific issuer or industry. These factors may also lead to periods of high volatility and reduced liquidity in the bond markets. Single-state investments are at risk of common economic forces and other factors affecting a state’s tax-exempt investments. This may result in greater losses and volatility. Capital gains, if any, are taxed at the federal and, in most cases, state levels. For some investors, investment income may be subject to the federal alternative minimum tax. Bond investments are subject to interest-rate risk (the risk of bond prices falling if interest rates rise) and credit risk (the risk of an issuer defaulting on interest or principal payments). Interest-rate risk is greater for longer-term bonds, and credit risk is greater for below-investment-grade bonds. Unlike bonds, funds that invest in bonds have fees and expenses. Tax-exempt bonds may be issued under the Internal Revenue Code only by limited types of issuers for limited types of projects. As a result, the fund’s investments may be focused in certain market segments and be more vulnerable to fluctuations in the values of the securities it holds than a more broadly invested fund. Interest the fund receives might be taxable. You can lose money by investing in the fund.
Message from the Trustees
Dear Fellow Shareholder:
Investors today are weighing multiple factors, including the anticipated first interest-rate increase by the U.S. Federal Reserve in nine years and mixed economic data.
Some market participants believe a potential pullback in the economy could be in store for the United States, as recent economic data indicate a slowdown. Many others, however, believe the slight contraction in gross domestic product in the first quarter may be similar to the winter weather downturn in 2014. Meanwhile, Europe has shown some early signs of recovery in the areas of both growth and inflation, despite ongoing concerns about Greece’s fiscal situation.
For the past seven years, the Fed has undertaken unprecedented measures to stimulate the economy through bond buying and interest-rate cuts. Now, the Fed is planning to raise interest rates, likely by the end of the year. While negative for bonds, a gradual rise in interest rates could potentially be positive for stocks, indicating economic growth and possibilities for higher corporate profits.
International markets, some of which have delivered solid returns in the first several months of 2015, would also be affected by higher interest rates in the United States. You will find in the following pages an update on your fund’s performance as well as a market outlook from your fund’s portfolio manager.
During a time of shifting market environments, it is important for you to consult with your financial advisor to ensure that your portfolio matches your tolerance for risk and investment goals and to make any necessary adjustments.
Putnam’s professional managers pursue consistent strategies and have experience navigating changing market conditions. They, and we, share a deep conviction that an active approach based on fundamental research can play a valuable role in your portfolio.
As always, thank you for investing with Putnam. We would also like to extend our thanks to Charles Curtis, who has retired from the Board of Trustees, for his many years of dedicated service.
Respectfully yours,
Robert L. Reynolds President and Chief Executive Officer Putnam Investments
Jameson A. Baxter Chair, Board of Trustees
July 13, 2015
Performance snapshot
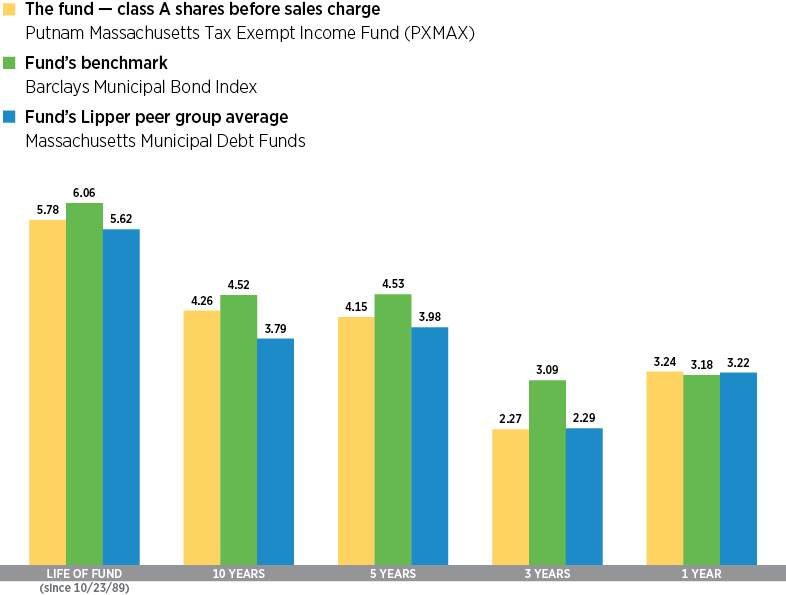
Annualized total return (%) comparison as of 5/31/15
Current performance may be lower or higher than the quoted past performance, which cannot guarantee future results. Share price, principal value, and return will fluctuate, and you may have a gain or a loss when you sell your shares. Performance of class A shares assumes reinvestment of distributions and does not account for taxes. Fund returns in the bar chart do not reflect a sales charge of 4.00%; had they, returns would have been lower. See pages 5 and 11–14 for additional performance information. For a portion of the periods, the fund had expense limitations, without which returns would have been lower. To obtain the most recent month-end performance, visit putnam.com.
4 Massachusetts Tax Exempt Income Fund
Interview with your fund’s portfolio manager
Thalia Meehan, CFA
What was the market environment like during the 12-month reporting period ended May 31, 2015?
With the U.S. unemployment rate and other economic indicators improving, speculation intensified that the U.S. Federal Reserve might raise interest rates for the first time since 2006. But expectations for monetary tightening were gradually pushed back following the economic slowdown in the first quarter of 2015. Falling energy prices also added a new dimension to the debate about growth as dramatically lower oil prices rippled through the economy and helped to ease potential inflationary pressure. Crude oil prices fell precipitously in late 2014 but bottomed out at just over $47 per barrel in March. The strong U.S. dollar, which has climbed since last summer, also had a dampening effect on the U.S. economy by making exports less competitive and affecting multinational corporate earnings by reducing the value of profits from international operations. Toward the close of the period in May, the Fed signaled that a June interest-rate increase was unlikely amid the conflicting data about the economy’s health.
Yields on U.S. Treasury bonds rose in the final weeks of the reporting period, despite lackluster growth. Why was that?
Longer-maturity U.S. Treasury bond yields climbed to seven-month highs in the closing weeks of the period amid further signs
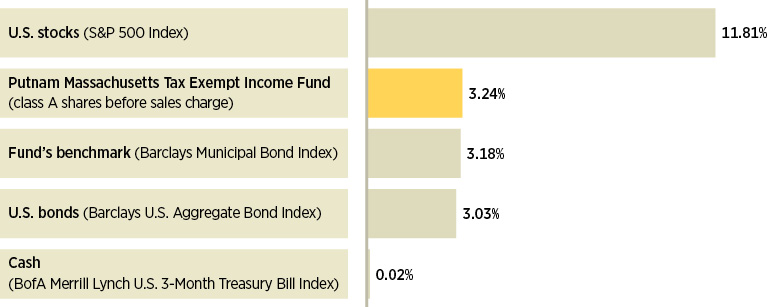
Broad market index and fund performance
This comparison shows your fund’s performance in the context of broad market indexes for the 12 months ended 5/31/15. See pages 4 and 11–14 for additional fund performance information. Index descriptions can be found on page 16.
Massachusetts Tax Exempt Income Fund 5
of improvement in the job market, which investors feared might spur the Fed to raise interest rates sooner rather than later. The announcement of a larger-than-expected 280,000 U.S. job gain in May contributed to speculation of a Fed rate hike as early as September. Since bond prices move inversely to bond yields, the selloff was a headwind for the bond market as a whole, including municipal bonds.
However, municipal bonds had other factors as a tailwind, which kept them in positive territory for the 12-month reporting period. The asset class benefited from favorable technicals [supply/demand dynamics], as inflows continued throughout the period. While supply is up significantly year over year, it has been dominated by refunding issuance, as municipal issuers replaced their older, higher-coupon bonds with lower-yield debt. The increased supply has generally been met with strong demand.
With interest rates still relatively low and fundamental credit quality stable, investors continued to seek out the yields offered by relatively riskier municipal bonds further out on the maturity spectrum as well as for those in the lower-rated, higher-yielding sectors. Consequently, credit spreads [the difference in yield between higher- and lower-quality municipal bonds] tightened during the period, resulting in slightly better returns for lower-quality investments than for higher-quality investments.
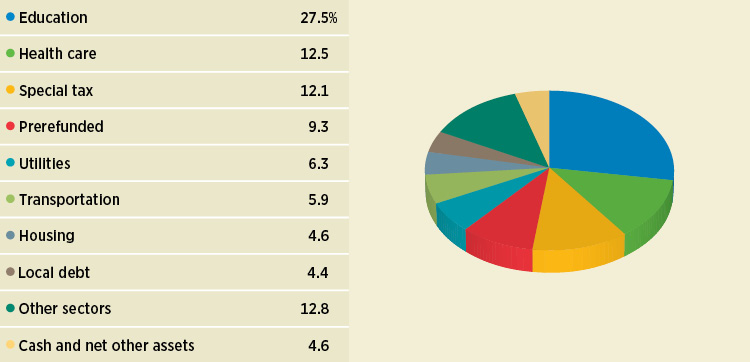
Sector allocations
Allocations are shown as a percentage of the fund’s net assets as of 5/31/15. Cash and net other assets, if any, represent the market value weights of cash, derivatives, short-term securities, and other unclassified assets in the portfolio. Summary information may differ from the information in the portfolio schedule notes included in the financial statements due to the inclusion of derivative securities, any interest accruals, and the use of different classifications of securities for presentation purposes. Holdings and allocations may vary over time.
6 Massachusetts Tax Exempt Income Fund
“In our opinion, the general fiscal health and creditworthiness of the municipal bond market are solid.”
Thalia Meehan
How did the fund perform in this environment?
The fund was well positioned for this environment, outperforming its benchmark, the Barclays Municipal Bond Index, and the average return of its Lipper peer group for the 12 months ended May 31, 2015.
Are your key investment themes, with their defensive orientation, still in place?
We maintained our slightly defensive bias in the portfolio because we believed that the municipal bond market’s attractive returns in 2014 could be attributed primarily to a combination of lower interest rates and strong market technicals. We kept the fund’s duration positioning, or interest-rate sensitivity, below the median of its Lipper peer group. We achieved this by maintaining a slightly higher-than-average cash position in the portfolio to help shelter it from price pressures, given the risk of interest rates moving higher. We also believed that carrying a slightly higher-than-average cash balance gave us greater flexibility to act swiftly in the event that timely investment opportunities presented themselves.
As for portfolio positioning, the fund retained an overweight exposure to municipal bonds rated A and Baa relative to the benchmark
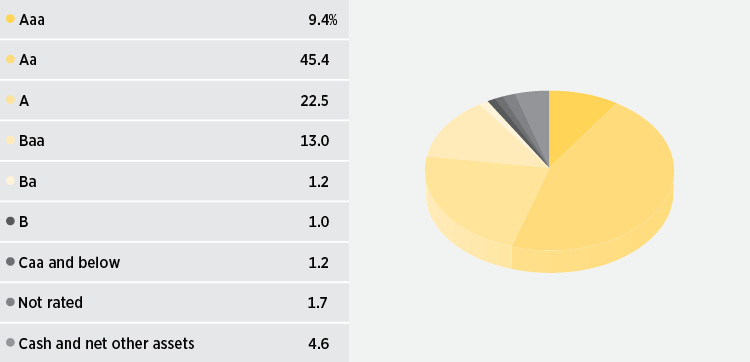
Credit quality overview
Credit qualities are shown as a percentage of the fund’s net assets as of 5/31/15. A bond rated Baa or higher (MIG3/VMIG3 or higher, for short-term debt) is considered investment grade. The chart reflects Moody’s ratings; percentages may include bonds or derivatives not rated by Moody’s but rated by Standard & Poor’s (S&P) or, if unrated by S&P, by Fitch ratings, and then included in the closest equivalent Moody’s rating based on analysis of these agencies’ respective ratings criteria. Moody’s ratings are used in recognition of its prominence among rating agencies and breadth of coverage of rated securities. Ratings may vary over time.
Cash and net other assets, if any, represent the market value weights of cash, derivatives, short-term securities, and other unclassified assets in the portfolio. The fund itself has not been rated by an independent rating agency.
Massachusetts Tax Exempt Income Fund 7
throughout the period. We continued to emphasize essential service revenue bonds, which are typically issued by state and local government entities to finance specific revenue-generating projects, and underweighted local general obligation [G.O.] bonds relative to the benchmark. These securities rely on the taxing power of the issuer and the health of the local economy to make payments from property taxes or sales and income taxes. We maintained our underweight exposure to issuers in Puerto Rico relative to the fund’s Lipper peer group, given our negative credit outlook for the Commonwealth. At the sector level, we favored transportation, higher education, continuing-care retirement communities, and essential service utilities bonds in the portfolio relative to the fund’s Lipper peer group. Overall, this positioning contributed positively to performance.
Our shorter-duration positioning was a modest detractor from relative performance versus our Lipper peers, as interest rates moved lower during the period. An underweight position in non-rated bonds versus our Lipper peers also was a headwind for performance, as demand for high-yield municipal bonds helped push prices higher.
How do you think the dramatic decline in oil prices will play out across the municipal bond market?
Lower oil and energy prices should be a net positive for the municipal bond market, in our opinion. We believe certain sectors, such as
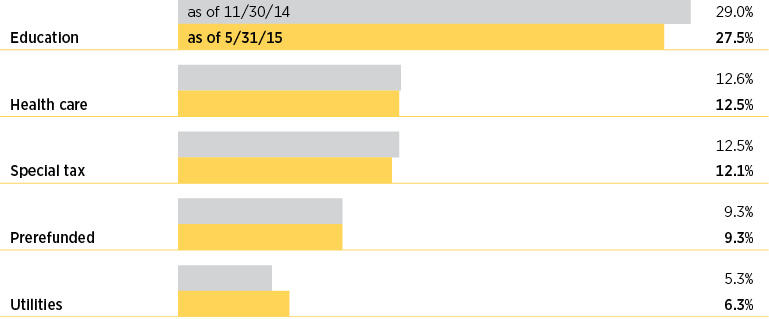
Comparison of top sector weightings
This chart shows how the fund’s top weightings have changed over the past six months. Allocations are shown as a percentage of the fund’s net assets. Current period summary information may differ from the information in the portfolio schedule notes included in the financial statements due to the inclusion of derivative securities, any interest accruals, and the use of different classifications of securities for presentation purposes. Holdings and allocations may vary over time.
8 Massachusetts Tax Exempt Income Fund
transportation — notably airlines — and toll roads, could see a positive impact from the decline in prices. However, we also believe that oil-producing states, such as Alaska, North Dakota, and Texas, are likely to see falling revenues as production decreases or ceases over a period of time. In the cases of Alaska and North Dakota, however, these states typically have not issued much municipal bond debt and have set aside what we believe are healthy reserves to ease budget pressures that typically accompany such a downturn. In the case of Texas, we believe the decline in oil and energy prices could be more widely felt. If oil prices remain low for an extended period, affected issuers may come under more pressure, in our opinion. The susceptibility of local G.O. bonds to macroeconomic developments, such as a sharp decline in oil prices, reinforces our predisposition to underweight G.O. bonds in the portfolio relative to the benchmark.
What factors are likely to influence the performance of municipal bonds in the coming months?
This past March, Fed Chair Janet Yellen stated that when rates start to increase, they might not approach long-term “normal” levels for some time. The overall dovish tone of Yellen’s statement was well received by investors, as it signaled a more gradual path to the normalization of interest rates than many investors had anticipated. As the reporting period came to a close, Yellen acknowledged weakness in some areas of the U.S. economy, but still left open the possibility of raising rates in the second half of 2015. However, we believe the Fed is unlikely to act unless it sees enough consistent data to persuade it that the U.S. recovery is accelerating. Thus, we believe questions about the timing of a Fed interest-rate hike are likely to dominate the public discourse and may fuel market volatility in the coming months until the central bank acts. Accordingly, we believe the Fed’s actions, along with the direction of longer-term U.S. Treasuries, will continue to highly influence the performance of municipal bonds in the coming months.
In our opinion, the general fiscal health and creditworthiness of the municipal bond market are solid. Despite some high-profile outliers, such as Detroit, Chicago, and Puerto Rico that have garnered much media attention, we expect defaults to remain low and that they could even decline further as the U.S. economy recovers. The default rate, which stood at 0.03% for 2014 [according to Bank of America Merrill Lynch], is a fraction of the $3.6 trillion municipal bond market, and we don’t believe defaults are likely to increase meaningfully in the foreseeable future. That said, we would expect Illinois, Chicago, and Puerto Rico to continue to be in the headlines, as they contend with budget and pension issues. [See In the News on page 10.]
Prospects for reform of the taxation of municipal bonds appear to constitute little risk at this point, in our opinion. However, we are closely monitoring the various proposals and believe any momentum for change will more likely come after the 2016 elections.
With credit spreads the tightest that they have been in five years and the prospect of Fed action inching closer, we expect performance will be driven less by price-appreciation potential and more by the tax-free income opportunities afforded by municipal bonds. In today’s low interest-rate environment, where investors continue to search for attractive yield opportunities, we believe many will look to tax-exempt investments to help them keep more of what they earn.
Thank you, Thalia, for your time and insights today.
Massachusetts Tax Exempt Income Fund 9
The views expressed in this report are exclusively those of Putnam Management and are subject to change. They are not meant as investment advice.
Please note that the holdings discussed in this report may not have been held by the fund for the entire period. Portfolio composition is subject to review in accordance with the fund’s investment strategy and may vary in the future. Current and future portfolio holdings are subject to risk. Statements in the Q&A concerning the fund’s performance or portfolio composition relative to those of the fund’s Lipper peer group may reference information produced by Lipper Inc. or through a third party.
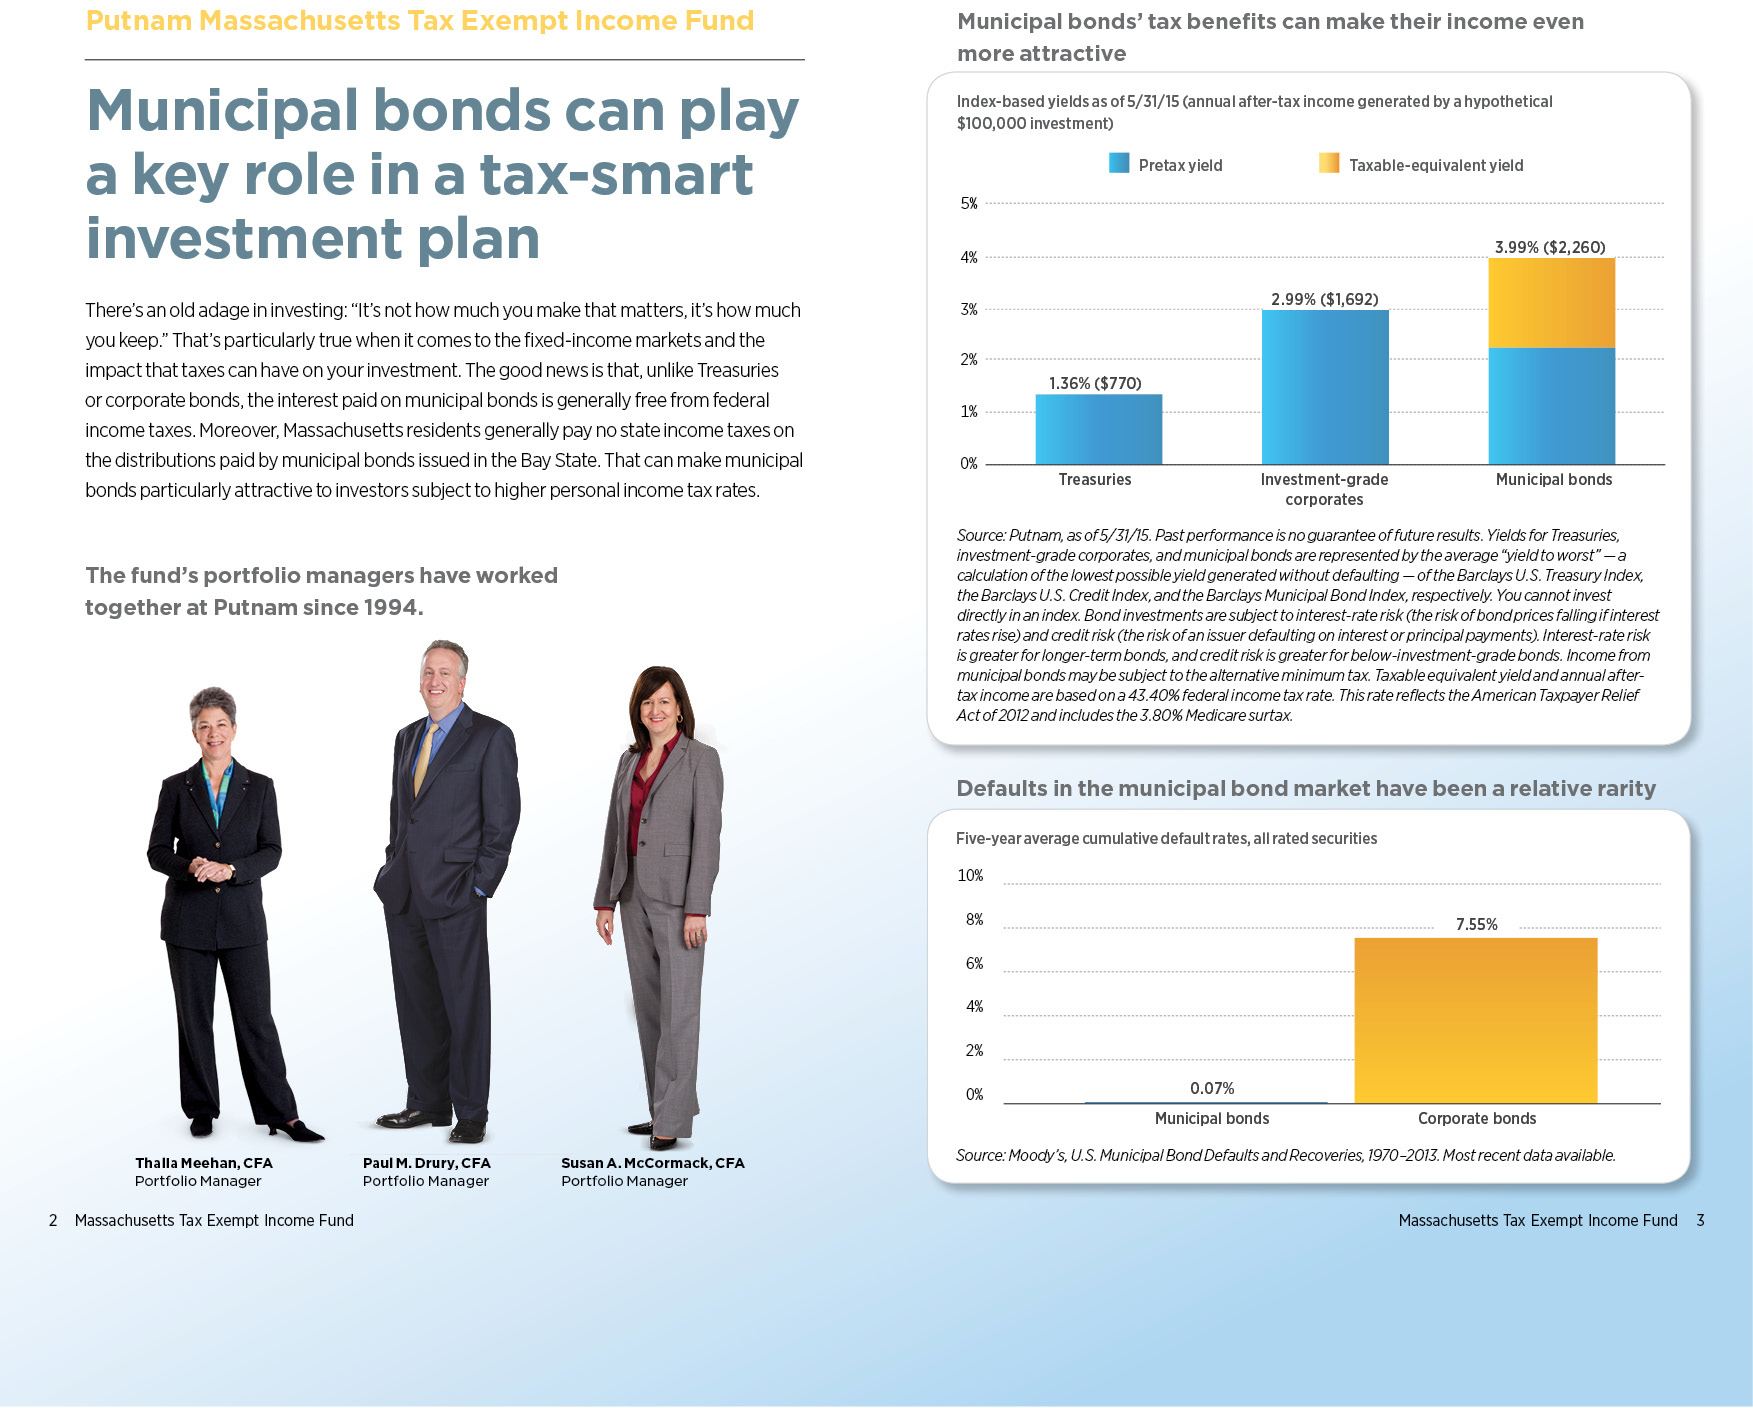
Portfolio Manager Thalia Meehan holds a B.A. from Williams College. She joined Putnam in 1989 and has been in the investment industry since 1983.
In addition to Thalia, your fund’s portfolio managers are Paul M. Drury, CFA, and Susan A. McCormack, CFA.
IN THE NEWS
Following debt crises in Detroit and Puerto Rico, Illinois and Chicago are confronting their own fiscal challenges, largely because of unfunded pension obligations. The situation could potentially lead to significantly higher taxes and/or cuts in state and city spending. Illinois has one of the worst funded state-employee pension systems in the nation. Chicago faces about $20 billion in unfunded pension liabilities. In May, Moody’s Investors Service downgraded Chicago’s bond rating to junk status. While Moody’s downgrade of the nation’s third-largest city was a newsworthy development, Chicago still holds investment-grade ratings of A- from Kroll Bond Rating Agency and BBB+ from Standard & Poor’s and Fitch Ratings. In 2013, Detroit faced myriad debts, including unfunded pensions, and became the largest U.S. city ever to seek federal bankruptcy protection. In contrast, Chicago has a more diversified economy and a broader demographic foundation. At this time, Chicago appears unlikely to declare bankruptcy, but its funding difficulties could remain in the headlines for some time. In Puerto Rico, after years of crippling government deficits, government bonds have traded at distressed levels for nearly two years. In late June, the governor of the island territory of the United States announced he would seek a moratorium with creditors, although key debt payments due July 1 were made.
10 Massachusetts Tax Exempt Income Fund
Your fund’s performance
This section shows your fund’s performance, price, and distribution information for periods ended May 31, 2015, the end of its most recent fiscal year. In accordance with regulatory requirements for mutual funds, we also include performance information as of the most recent calendar quarter-end and expense information taken from the fund’s current prospectus. Performance should always be considered in light of a fund’s investment strategy. Data represent past performance. Past performance does not guarantee future results. More recent returns may be less or more than those shown. Investment return and principal value will fluctuate, and you may have a gain or a loss when you sell your shares. Performance information does not reflect any deduction for taxes a shareholder may owe on fund distributions or on the redemption of fund shares. For the most recent month-end performance, please visit the Individual Investors section at putnam.com or call Putnam at 1-800-225-1581. Class Y shares are not available to all investors. See the Terms and Definitions section in this report for definitions of the share classes offered by your fund.
Fund performance Total return for periods ended 5/31/15
Class A
Class B
Class C
Class M
Class Y
(inception dates)
(10/23/89)
(7/15/93)
(8/19/03)
(5/12/95)
(1/2/08)
Before sales charge
After sales charge
Before CDSC
After CDSC
Before CDSC
After CDSC
Before sales charge
After sales charge
Net asset value
Annual average
(life of fund)
5.78%
5.61%
5.52%
5.52%
4.95%
4.95%
5.44%
5.30%
5.86%
10 years
51.76
45.69
44.09
44.09
40.43
40.43
47.55
42.75
54.70
Annual average
4.26
3.83
3.72
3.72��
3.45
3.45
3.97
3.62
4.46
5 years
22.56
17.66
18.82
16.82
18.00
18.00
20.90
16.97
24.03
Annual average
4.15
3.31
3.51
3.16
3.37
3.37
3.87
3.18
4.40
3 years
6.95
2.67
4.98
2.09
4.60
4.60
6.09
2.64
7.77
Annual average
2.27
0.88
1.63
0.69
1.51
1.51
1.99
0.87
2.53
1 year
3.24
–0.89
2.61
–2.39
2.44
1.45
2.96
–0.38
3.57
Current performance may be lower or higher than the quoted past performance, which cannot guarantee future results. After-sales-charge returns for class A and M shares reflect the deduction of the maximum 4.00% and 3.25% sales charge, respectively, levied at the time of purchase. Class B share returns after contingent deferred sales charge (CDSC) reflect the applicable CDSC, which is 5% in the first year, declining over time to 1% in the sixth year, and is eliminated thereafter. Class C share returns after CDSC reflect a 1% CDSC for the first year that is eliminated thereafter. Class Y shares have no initial sales charge or CDSC. Performance for class B, C, M, and Y shares before their inception is derived from the historical performance of class A shares, adjusted for the applicable sales charge (or CDSC) and the higher operating expenses for such shares, except for class Y shares, for which 12b-1 fees are not applicable.
For a portion of the periods, the fund had expense limitations, without which returns would have been lower.
Class B share performance reflects conversion to class A shares after eight years.
Massachusetts Tax Exempt Income Fund 11
Comparative index returns For periods ended 5/31/15
Barclays Municipal Bond Index
Lipper Massachusetts Municipal Debt Funds category average*
Annual average (life of fund)
6.06%
5.62%
10 years
55.65
45.12
Annual average
4.52
3.79
5 years
24.81
21.60
Annual average
4.53
3.98
3 years
9.57
7.05
Annual average
3.09
2.29
1 year
3.18
3.22
Index and Lipper results should be compared with fund performance before sales charge, before CDSC, or at net asset value.
*Over the 1-year, 3-year, 5-year, 10-year, and life-of-fund periods ended 5/31/15, there were 40, 37, 36, 29, and 9 funds, respectively, in this Lipper category.
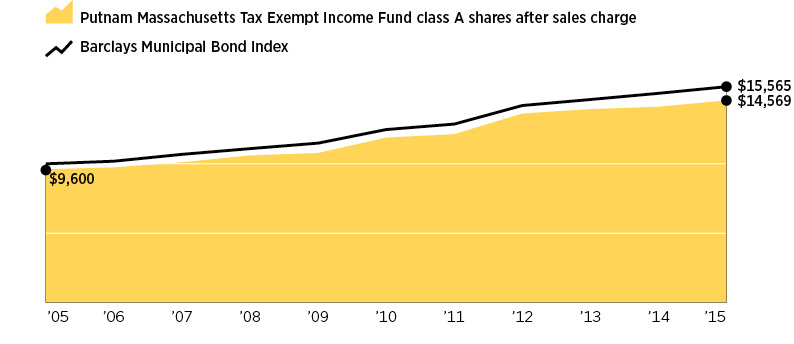
Change in the value of a $10,000 investment ($9,600 after sales charge)
Cumulative total return from 5/31/05 to 5/31/15
Past performance does not indicate future results. At the end of the same time period, a $10,000 investment in the fund’s class B and C shares would have been valued at $14,409 and $14,043, respectively, and no contingent deferred sales charges would apply. A $10,000 investment in the fund’s class M shares ($9,675 after sales charge) would have been valued at $14,275. A $10,000 investment in the fund’s class Y shares would have been valued at $15,470.
12 Massachusetts Tax Exempt Income Fund
Fund price and distribution information For the 12-month period ended 5/31/15
Distributions
Class A
Class B
Class C
Class M
Class Y
Number
12
12
12
12
12
Income 1
$0.322184
$0.261511
$0.246606
$0.295517
$0.344218
Capital gains 2
—
—
—
—
—
Total
$0.322184
$0.261511
$0.246606
$0.295517
$0.344218
Share value
Before sales charge
After sales charge
Net asset value
Net asset value
Before sales charge
After sales charge
Net asset value
5/31/14
$9.70
$10.10
$9.69
$9.72
$9.70
$10.03
$9.72
5/31/15
9.69
10.09
9.68
9.71
9.69
10.02
9.72
Current rate (end of period)
Before sales charge
After sales charge
Net asset value
Net asset value
Before sales charge
After sales charge
Net asset value
Current dividend rate 3
3.10%
2.97%
2.48%
2.32%
2.82%
2.73%
3.31%
Taxable equivalent 4
5.77
5.53
4.62
4.32
5.25
5.08
6.17
Current 30-day SEC yield 5
N/A
1.75
1.20
1.06
N/A
1.50
2.05
Taxable equivalent 4
N/A
3.26
2.24
1.97
N/A
2.79
3.82
The classification of distributions, if any, is an estimate. Before-sales-charge share value and current dividend rate for class A and M shares, if applicable, do not take into account any sales charge levied at the time of purchase. After-sales-charge share value, current dividend rate, and current 30-day SEC yield, if applicable, are calculated assuming that the maximum sales charge (4.00% for class A shares and 3.25% for class M shares) was levied at the time of purchase. Final distribution information will appear on your year-end tax forms.
1 For some investors, investment income may be subject to the federal alternative minimum tax.
2 Capital gains, if any, are taxable for federal and, in most cases, state purposes.
3 Most recent distribution, including any return of capital and excluding capital gains, annualized and divided by share price before or after sales charge at period-end.
4 Assumes maximum 46.31% federal and state combined tax rate for 2015. Results for investors subject to lower tax rates would not be as advantageous.
5 Based only on investment income and calculated using the maximum offering price for each share class, in accordance with SEC guidelines.
Massachusetts Tax Exempt Income Fund 13
Fund performance as of most recent calendar quarter Total return for periods ended 6/30/15
Class A
Class B
Class C
Class M
Class Y
(inception dates)
(10/23/89)
(7/15/93)
(8/19/03)
(5/12/95)
(1/2/08)
Before sales charge
After sales charge
Before CDSC
After CDSC
Before CDSC
After CDSC
Before sales charge
After sales charge
Net asset value
Annual average
(life of fund)
5.74%
5.58%
5.49%
5.49%
4.91%
4.91%
5.41%
5.27%
5.82%
10 years
50.30
44.28
42.86
42.86
39.08
39.08
46.13
41.38
53.09
Annual average
4.16
3.73
3.63
3.63
3.35
3.35
3.87
3.52
4.35
5 years
21.99
17.11
18.13
16.13
17.32
17.32
20.33
16.42
23.32
Annual average
4.05
3.21
3.39
3.04
3.25
3.25
3.77
3.09
4.28
3 years
6.82
2.55
4.74
1.86
4.25
4.25
5.95
2.51
7.43
Annual average
2.22
0.84
1.56
0.61
1.40
1.40
1.95
0.83
2.42
1 year
2.92
–1.20
2.17
–2.80
2.01
1.02
2.64
–0.70
3.14
See the discussion following the fund performance table on page 11 for information about the calculation of fund performance.
Your fund’s expenses
As a mutual fund investor, you pay ongoing expenses, such as management fees, distribution fees (12b-1 fees), and other expenses. Using the following information, you can estimate how these expenses affect your investment and compare them with the expenses of other funds. You may also pay one-time transaction expenses, including sales charges (loads) and redemption fees, which are not shown in this section and would have resulted in higher total expenses. For more information, see your fund’s prospectus or talk to your financial representative.
Expense ratios
Class A
Class B
Class C
Class M
Class Y
Total annual operating expenses for the fiscal year ended 5/31/14
0.77%
1.39%
1.54%
1.04%
0.54%
Annualized expense ratio for the six-month period ended 5/31/15*
0.79%
1.41%
1.56%
1.06%
0.56%
Fiscal-year expense information in this table is taken from the most recent prospectus, is subject to change, and may differ from that shown for the annualized expense ratio and in the financial highlights of this report.
Expenses are shown as a percentage of average net assets.
*For the fund’s most recent fiscal half year; may differ from expense ratios based on one-year data in the financial highlights.
14 Massachusetts Tax Exempt Income Fund
Expenses per $1,000
The following table shows the expenses you would have paid on a $1,000 investment in the fund from December 1, 2014, to May 31, 2015. It also shows how much a $1,000 investment would be worth at the close of the period, assuming actual returns and expenses.
Class A
Class B
Class C
Class M
Class Y
Expenses paid per $1,000*†
$3.95
$7.04
$7.79
$5.30
$2.80
Ending value (after expenses)
$1,006.40
$1,003.30
$1,002.50
$1,005.00
$1,007.50
*Expenses for each share class are calculated using the fund’s annualized expense ratio for each class, which represents the ongoing expenses as a percentage of average net assets for the six months ended 5/31/15. The expense ratio may differ for each share class.
†Expenses are calculated by multiplying the expense ratio by the average account value for the period; then multiplying the result by the number of days in the period; and then dividing that result by the number of days in the year.
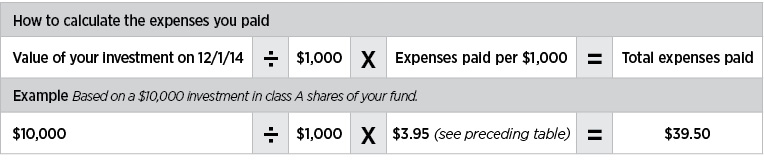
Estimate the expenses you paid
To estimate the ongoing expenses you paid for the six months ended May 31, 2015, use the following calculation method. To find the value of your investment on December 1, 2014, call Putnam at 1-800-225-1581.
Compare expenses using the SEC’s method
The Securities and Exchange Commission (SEC) has established guidelines to help investors assess fund expenses. Per these guidelines, the following table shows your fund’s expenses based on a $1,000 investment, assuming a hypothetical 5% annualized return. You can use this information to compare the ongoing expenses (but not transaction expenses or total costs) of investing in the fund with those of other funds. All mutual fund shareholder reports will provide this information to help you make this comparison. Please note that you cannot use this information to estimate your actual ending account balance and expenses paid during the period.
Class A
Class B
Class C
Class M
Class Y
Expenses paid per $1,000*†
$3.98
$7.09
$7.85
$5.34
$2.82
Ending value (after expenses)
$1,020.99
$1,017.90
$1,017.15
$1,019.65
$1,022.14
*Expenses for each share class are calculated using the fund’s annualized expense ratio for each class, which represents the ongoing expenses as a percentage of average net assets for the six months ended 5/31/15. The expense ratio may differ for each share class.
†Expenses are calculated by multiplying the expense ratio by the average account value for the six-month period; then multiplying the result by the number of days in the six-month period; and then dividing that result by the number of days in the year.
Massachusetts Tax Exempt Income Fund 15
Terms and definitions
Important terms
Total return shows how the value of the fund’s shares changed over time, assuming you held the shares through the entire period and reinvested all distributions in the fund.
Before sales charge, or net asset value, is the price, or value, of one share of a mutual fund, without a sales charge. Before-sales-charge figures fluctuate with market conditions, and are calculated by dividing the net assets of each class of shares by the number of outstanding shares in the class.
After sales charge is the price of a mutual fund share plus the maximum sales charge levied at the time of purchase. After-sales-charge performance figures shown here assume the 4.00% maximum sales charge for class A shares and 3.25% for class M shares.
Contingent deferred sales charge (CDSC) is generally a charge applied at the time of the redemption of class B or C shares and assumes redemption at the end of the period. Your fund’s class B CDSC declines over time from a 5% maximum during the first year to 1% during the sixth year. After the sixth year, the CDSC no longer applies. The CDSC for class C shares is 1% for one year after purchase.
Share classes
Class A shares are generally subject to an initial sales charge and no CDSC (except on certain redemptions of shares bought without an initial sales charge).
Class B shares are not subject to an initial sales charge and may be subject to a CDSC.
Class C shares are not subject to an initial sales charge and are subject to a CDSC only if the shares are redeemed during the first year.
Class M shares have a lower initial sales charge and a higher 12b-1 fee than class A shares and no CDSC.
Class Y shares are not subject to an initial sales charge or CDSC, and carry no 12b-1 fee. They are generally only available to corporate and institutional clients and clients in other approved programs.
Fixed-income terms
Current rate is the annual rate of return earned from dividends or interest of an investment. Current rate is expressed as a percentage of the price of a security, fund share, or principal investment.
Yield curve is a graph that plots the yields of bonds with equal credit quality against their differing maturity dates, ranging from shortest to longest. It is used as a benchmark for other debt, such as mortgage or bank lending rates.
Comparative indexes
Barclays Municipal Bond Index is an unmanaged index of long-term fixed-rate investment-grade tax-exempt bonds.
Barclays U.S. Aggregate Bond Index is an unmanaged index of U.S. investment-grade fixed-income securities.
BofA Merrill Lynch U.S. 3-Month Treasury Bill Index is an unmanaged index that seeks to measure the performance of U.S. Treasury bills available in the marketplace.
S&P 500 Index is an unmanaged index of common stock performance.
Indexes assume reinvestment of all distributions and do not account for fees. Securities and performance of a fund and an index will differ. You cannot invest directly in an index.
Lipper is a third-party industry-ranking entity that ranks mutual funds. Its rankings do not reflect sales charges. Lipper rankings are based on total return at net asset value relative to other funds that have similar current investment styles or objectives as determined by Lipper. Lipper may change a fund’s category assignment at its discretion. Lipper category averages reflect performance trends for funds within a category.
16 Massachusetts Tax Exempt Income Fund
Other information for shareholders
Proxy voting
Putnam is committed to managing our mutual funds in the best interests of our shareholders. The Putnam funds’ proxy voting guidelines and procedures, as well as information regarding how your fund voted proxies relating to portfolio securities during the 12-month period ended June 30, 2014, are available in the Individual Investors section of putnam.com, and on the Securities and Exchange Commission (SEC) website, www.sec.gov. If you have questions about finding forms on the SEC’s website, you may call the SEC at 1-800-SEC-0330. You may also obtain the Putnam funds’ proxy voting guidelines and procedures at no charge by calling Putnam’s Shareholder Services at 1-800-225-1581.
Fund portfolio holdings
The fund will file a complete schedule of its portfolio holdings with the SEC for the first and third quarters of each fiscal year on Form N-Q. Shareholders may obtain the fund’s Form N-Q on the SEC’s website at www.sec.gov. In addition, the fund’s Form N-Q may be reviewed and copied at the SEC’s Public Reference Room in Washington, D.C. You may call the SEC at 1-800-SEC-0330 for information about the SEC’s website or the operation of the Public Reference Room.
Trustee and employee fund ownership
Putnam employees and members of the Board of Trustees place their faith, confidence, and, most importantly, investment dollars in Putnam mutual funds. As of May 31, 2015, Putnam employees had approximately $504,000,000 and the Trustees had approximately $143,000,000 invested in Putnam mutual funds. These amounts include investments by the Trustees’ and employees’ immediate family members as well as investments through retirement and deferred compensation plans.
Massachusetts Tax Exempt Income Fund 17
Important notice regarding Putnam’s privacy policy
In order to conduct business with our shareholders, we must obtain certain personal information such as account holders’ names, addresses, Social Security numbers, and dates of birth. Using this information, we are able to maintain accurate records of accounts and transactions.
It is our policy to protect the confidentiality of our shareholder information, whether or not a shareholder currently owns shares of our funds. In particular, it is our policy not to sell information about you or your accounts to outside marketing firms. We have safeguards in place designed to prevent unauthorized access to our computer systems and procedures to protect personal information from unauthorized use.
Under certain circumstances, we must share account information with outside vendors who provide services to us, such as mailings and proxy solicitations. In these cases, the service providers enter into confidentiality agreements with us, and we provide only the information necessary to process transactions and perform other services related to your account. Finally, it is our policy to share account information with your financial representative, if you’ve listed one on your Putnam account.
18 Massachusetts Tax Exempt Income Fund
Financial statements
These sections of the report, as well as the accompanying Notes, preceded by the Report of Independent Registered Public Accounting Firm, constitute the fund’s financial statements.
The fund’s portfolio lists all the fund’s investments and their values as of the last day of the reporting period. Holdings are organized by asset type and industry sector, country, or state to show areas of concentration and diversification.
Statement of assets and liabilities shows how the fund’s net assets and share price are determined. All investment and non-investment assets are added together. Any unpaid expenses and other liabilities are subtracted from this total. The result is divided by the number of shares to determine the net asset value per share, which is calculated separately for each class of shares. (For funds with preferred shares, the amount subtracted from total assets includes the liquidation preference of preferred shares.)
Statement of operations shows the fund’s net investment gain or loss. This is done by first adding up all the fund’s earnings — from dividends and interest income — and subtracting its operating expenses to determine net investment income (or loss). Then, any net gain or loss the fund realized on the sales of its holdings — as well as any unrealized gains or losses over the period — is added to or subtracted from the net investment result to determine the fund’s net gain or loss for the fiscal year.
Statement of changes in net assets shows how the fund’s net assets were affected by the fund’s net investment gain or loss, by distributions to shareholders, and by changes in the number of the fund’s shares. It lists distributions and their sources (net investment income or realized capital gains) over the current reporting period and the most recent fiscal year-end. The distributions listed here may not match the sources listed in the Statement of operations because the distributions are determined on a tax basis and may be paid in a different period from the one in which they were earned.
Financial highlights provide an overview of the fund’s investment results, per-share distributions, expense ratios, net investment income ratios, and portfolio turnover in one summary table, reflecting the five most recent reporting periods. In a semiannual report, the highlights table also includes the current reporting period.
Massachusetts Tax Exempt Income Fund 19
Report of Independent Registered Public Accounting Firm
To the Trustees and Shareholders of Putnam Massachusetts Tax Exempt Income Fund:
In our opinion, the accompanying statement of assets and liabilities, including the portfolio, and the related statements of operations and of changes in net assets and the financial highlights present fairly, in all material respects, the financial position of Putnam Massachusetts Tax Exempt Income Fund (the “fund”) at May 31, 2015, and the results of its operations, the changes in its net assets and the financial highlights for each of the periods indicated, in conformity with accounting principles generally accepted in the United States of America. These financial statements and financial highlights (hereafter referred to as “financial statements”) are the responsibility of the fund’s management. Our responsibility is to express an opinion on these financial statements based on our audits. We conducted our audits of these financial statements in accordance with the standards of the Public Company Accounting Oversight Board (United States). Those standards require that we plan and perform the audit to obtain reasonable assurance about whether the financial statements are free of material misstatement. An audit includes examining, on a test basis, evidence supporting the amounts and disclosures in the financial statements, assessing the accounting principles used and significant estimates made by management, and evaluating the overall financial statement presentation. We believe that our audits, which included confirmation of investments owned at May 31, 2015 by correspondence with the custodian, provide a reasonable basis for our opinion.
PricewaterhouseCoopers LLP Boston, Massachusetts July 13, 2015
20 Massachusetts Tax Exempt Income Fund
The fund’s portfolio 5/31/15
Key to holding’s abbreviations
AGM Assured Guaranty Municipal Corporation
AGO Assured Guaranty, Ltd.
AMBAC AMBAC Indemnity Corporation
FGIC Financial Guaranty Insurance Company
FRB Floating Rate Bonds: the rate shown is the current interest rate at the close of the reporting period
G.O. Bonds General Obligation Bonds
NATL National Public Finance Guarantee Corp.
SGI Syncora Guarantee, Inc.
U.S. Govt. Coll. U.S. Government Collateralized
VRDN Variable Rate Demand Notes, which are floating-rate securities with long-term maturities that carry coupons that reset and are payable upon demand either daily, weekly or monthly. The rate shown is the current interest rate at the close of the reporting period.
MUNICIPAL BONDS AND NOTES (97.2%)*
Rating**
Principal amount
Value
California (0.5%)
CA State G.O. Bonds, 5s, 2/1/38
Aa3
$1,500,000
$1,677,780
1,677,780
Guam (1.4%)
Territory of GU, Rev. Bonds, Ser. A, 5 3/8s, 12/1/24
BBB+
1,000,000
1,125,130
Territory of GU, Bus. Privilege Tax Rev. Bonds, Ser. A, 5s, 1/1/31
Unless noted otherwise, the notes to the fund’s portfolio are for the close of the fund’s reporting period, which ran from June 1, 2014 through May 31, 2015 (the reporting period). Within the following notes to the portfolio, references to “ASC 820” represent Accounting Standards Codification 820 Fair Value Measurements and Disclosures and references to “OTC”, if any, represent over-the-counter.
*
Percentages indicated are based on net assets of $309,479,767.
**
The Moody’s, Standard & Poor’s or Fitch ratings indicated are believed to be the most recent ratings available at the close of the reporting period for the securities listed. Ratings are generally ascribed to securities at the time of issuance. While the agencies may from time to time revise such ratings, they undertake no obligation to do so, and the ratings do not necessarily represent what the agencies would ascribe to these securities at the close of the reporting period. Securities rated by Putnam are indicated by “/P.” If a security is insured, it will usually be rated by the ratings organizations based on the financial strength of the insurer. Ratings are not covered by the Report of Independent Registered Public Accounting Firm. For further details regarding security ratings, please see the Statement of Additional Information.
†
This security is non-income-producing.
On Mandatory Put Bonds, the rates shown are the current interest rates at the close of the reporting period and the dates shown represent the next mandatory put dates.
The dates shown parenthetically on prerefunded bonds represent the next prerefunding dates.
The dates shown on debt obligations are the original maturity dates.
26 Massachusetts Tax Exempt Income Fund
The fund had the following sector concentrations greater than 10% at the close of the reporting period (as a percentage of net assets):
Education
28.4%
Health care
12.5
Tax bonds
11.9
ASC 820 establishes a three-level hierarchy for disclosure of fair value measurements. The valuation hierarchy is based upon the transparency of inputs to the valuation of the fund’s investments. The three levels are defined as follows:
Level 1: Valuations based on quoted prices for identical securities in active markets.
Level 2: Valuations based on quoted prices in markets that are not active or for which all significant inputs are observable, either directly or indirectly.
Level 3: Valuations based on inputs that are unobservable and significant to the fair value measurement.
The following is a summary of the inputs used to value the fund’s net assets as of the close of the reporting period:
Valuation inputs
Investments in securities:
Level 1
Level 2
Level 3
Municipal bonds and notes
$—
$300,802,411
$19
Totals by level
$—
$300,802,411
$19
During the reporting period, transfers within the fair value hierarchy, if any, did not represent, in the aggregate, more than 1% of the fund’s net assets measured as of the end of the period.
At the start and close of the reporting period, Level 3 investments in securities represented less than 1% of the fund’s net assets and were not considered a significant portion of the fund’s portfolio.
The accompanying notes are an integral part of these financial statements.
Payable for Trustee compensation and expenses (Note 2)
100,481
Payable for administrative services (Note 2)
1,148
Payable for distribution fees (Note 2)
120,882
Distributions payable to shareholders
180,406
Other accrued expenses
91,252
Total liabilities
6,333,638
Net assets
$309,479,767
REPRESENTED BY
Paid-in capital (Unlimited shares authorized) (Notes 1 and 4)
$297,231,609
Undistributed net investment income (Note 1)
265,121
Accumulated net realized loss on investments (Note 1)
(7,564,590)
Net unrealized appreciation of investments
19,547,627
Total — Representing net assets applicable to capital shares outstanding
$309,479,767
COMPUTATION OF NET ASSET VALUE AND OFFERING PRICE
Net asset value and redemption price per class A share ($241,437,809 divided by 24,912,575 shares)
$9.69
Offering price per class A share (100/96.00 of $9.69)*
$10.09
Net asset value and offering price per class B share ($3,305,879 divided by 341,538 shares)**
$9.68
Net asset value and offering price per class C share ($30,360,708 divided by 3,127,006 shares)**
$9.71
Net asset value and redemption price per class M share ($2,648,851 divided by 273,322 shares)
$9.69
Offering price per class M share (100/96.75 of $9.69)†
$10.02
Net asset value, offering price and redemption price per class Y share ($31,726,520 divided by 3,265,070 shares)
$9.72
*
On single retail sales of less than $100,000. On sales of $100,000 or more the offering price is reduced.
**
Redemption price per share is equal to net asset value less any applicable contingent deferred sales charge.
†
On single retail sales of less than $50,000. On sales of $50,000 or more the offering price is reduced.
The accompanying notes are an integral part of these financial statements.
28 Massachusetts Tax Exempt Income Fund
Statement of operations Year ended 5/31/15
INTEREST INCOME
$12,584,250
EXPENSES
Compensation of Manager (Note 2)
$1,332,362
Investor servicing fees (Note 2)
175,470
Custodian fees (Note 2)
8,739
Trustee compensation and expenses (Note 2)
11,372
Distribution fees (Note 2)
910,064
Administrative services (Note 2)
8,062
Other
148,402
Total expenses
2,594,471
Expense reduction (Note 2)
(412)
Net expenses
2,594,059
Net investment income
9,990,191
Net realized loss on investments (Notes 1 and 3)
(2,650,789)
Net unrealized appreciation of investment during the year
2,516,957
Net loss on investments
(133,832)
Net increase in net assets resulting from operations
$9,856,359
The accompanying notes are an integral part of these financial statements.
Massachusetts Tax Exempt Income Fund 29
Statement of changes in net assets
DECREASE IN NET ASSETS
Year ended 5/31/15
Year ended 5/31/14
Operations:
Net investment income
$9,990,191
$11,252,318
Net realized loss on investments
(2,650,789)
(4,923,496)
Net unrealized appreciation (depreciation) of investments
2,516,957
(7,971,694)
Net increase (decrease) in net assets resulting from operations
9,856,359
(1,642,872)
Distributions to shareholders (Note 1):
From ordinary income
Taxable net investment income
Class A
(134,970)
(55,371)
Class B
(1,868)
(735)
Class C
(17,064)
(7,188)
Class M
(1,477)
(665)
Class Y
(15,121)
(4,809)
Net realized short-term gain on investments
Class A
—
(94,921)
Class B
—
(1,260)
Class C
—
(12,322)
Class M
—
(1,140)
Class Y
—
(8,245)
From tax-exempt net investment income
Class A
(8,061,522)
(9,076,653)
Class B
(87,884)
(95,970)
Class C
(757,791)
(900,723)
Class M
(85,131)
(100,243)
Class Y
(918,350)
(886,665)
From net realized long-term gain on investments
Class A
—
(785,738)
Class B
—
(10,431)
Class C
—
(102,000)
Class M
—
(9,440)
Class Y
—
(68,248)
Decrease from capital share transactions (Note 4)
(5,284,183)
(97,636,149)
Total decrease in net assets
(5,509,002)
(111,501,788)
NET ASSETS
Beginning of year
314,988,769
426,490,557
End of year (including undistributed net investment income of $265,121 and $436,971, respectively)
$309,479,767
$314,988,769
The accompanying notes are an integral part of these financial statements.
30 Massachusetts Tax Exempt Income Fund
This page left blank intentionally.
Massachusetts Tax Exempt Income Fund 31
Financial highlights (For a common share outstanding throughout the period)
INVESTMENT OPERATIONS:
LESS DISTRIBUTIONS:
RATIOS AND SUPPLEMENTAL DATA:
Period ended
Net asset value, beginning of period
Net investment income (loss)
Net realized and unrealized gain (loss) on investments
Total from investment operations
From net investment income
From net realized gain on investments
Total distributions
Redemption fees
Non-recurring reimbursements
Net asset value, end of period
Total return at net asset value (%)a
Net assets, end of period (in thousands)
Ratio of expenses to average net assets (%)b
Ratio of net investment income (loss) to average net assets (%)
Portfolio turnover (%)
Class A
May 31, 2015
$9.70
.32
(.01)
.31
(.32)
—
(.32)
—
—
$9.69
3.24
$241,438
.77
3.27
8
May 31, 2014
9.95
.32
(.22)
.10
(.32)
(.03)
(.35)
—
—
9.70
1.20
254,368
.77
3.41
8
May 31, 2013
10.04
.31
(.07)
.24
(.32)
(.01)
(.33)
—
—
9.95
2.36
338,606
.77
3.06
8
May 31, 2012
9.31
.37
.76
1.13
(.38)
(.02)
(.40)
—
—c,d
10.04
12.38
290,077
.77
3.84
6
May 31, 2011
9.54
.40
(.22)
.18
(.39)
(.02)
(.41)
—c
—c,e
9.31
1.97
245,228
.77
4.24
12
Class B
May 31, 2015
$9.69
.26
(.01)
.25
(.26)
—
(.26)
—
—
$9.68
2.61
$3,306
1.39
2.65
8
May 31, 2014
9.94
.27
(.23)
.04
(.26)
(.03)
(.29)
—
—
9.69
.58
3,347
1.39
2.79
8
May 31, 2013
10.03
.24
(.07)
.17
(.25)
(.01)
(.26)
—
—
9.94
1.73
4,314
1.39
2.44
8
May 31, 2012
9.30
.31
.76
1.07
(.32)
(.02)
(.34)
—
—c,d
10.03
11.68
3,737
1.40
3.22
6
May 31, 2011
9.53
.34
(.22)
.12
(.33)
(.02)
(.35)
—c
—c,e
9.30
1.36
4,526
1.40
3.58
12
Class C
May 31, 2015
$9.72
.24
—c
.24
(.25)
—
(.25)
—
—
$9.71
2.44
$30,361
1.54
2.50
8
May 31, 2014
9.97
.25
(.22)
.03
(.25)
(.03)
(.28)
—
—
9.72
.42
31,066
1.54
2.64
8
May 31, 2013
10.05
.23
(.06)
.17
(.24)
(.01)
(.25)
—
—
9.97
1.67
46,310
1.54
2.29
8
May 31, 2012
9.33
.30
.75
1.05
(.31)
(.02)
(.33)
—
—c,d
10.05
11.37
37,098
1.55
3.05
6
May 31, 2011
9.55
.32
(.20)
.12
(.32)
(.02)
(.34)
—c
—c,e
9.33
1.30
26,306
1.55
3.46
12
Class M
May 31, 2015
$9.70
.29
—c
.29
(.30)
—
(.30)
—
—
$9.69
2.96
$2,649
1.04
3.00
8
May 31, 2014
9.95
.30
(.23)
.07
(.29)
(.03)
(.32)
—
—
9.70
.93
3,102
1.04
3.14
8
May 31, 2013
10.04
.28
(.07)
.21
(.29)
(.01)
(.30)
—
—
9.95
2.08
4,033
1.04
2.79
8
May 31, 2012
9.31
.35
.75
1.10
(.35)
(.02)
(.37)
—
—c,d
10.04
12.05
4,200
1.05
3.56
6
May 31, 2011
9.54
.37
(.21)
.16
(.37)
(.02)
(.39)
—c
—c,e
9.31
1.72
3,255
1.05
3.95
12
Class Y
May 31, 2015
$9.72
.34
—c
.34
(.34)
—
(.34)
—
—
$9.72
3.57
$31,727
.54
3.51
8
May 31, 2014
9.97
.35
(.23)
.12
(.34)
(.03)
(.37)
—
—
9.72
1.43
23,107
.54
3.63
8
May 31, 2013
10.06
.33
(.07)
.26
(.34)
(.01)
(.35)
—
—
9.97
2.59
33,227
.54
3.28
8
May 31, 2012
9.33
.39
.76
1.15
(.40)
(.02)
(.42)
—
—c,d
10.06
12.59
22,254
.55
4.05
6
May 31, 2011
9.56
.42
(.22)
.20
(.41)
(.02)
(.43)
—c
—c,e
9.33
2.21
14,502
.55
4.47
12
a Total return assumes dividend reinvestment and does not reflect the effect of sales charges.
b Includes amounts paid through expense offset and/or brokerage service arrangements, if any (Note 2). Also excludes acquired fund fees and expenses, if any.
c Amount represents less than $0.01 per share.
d Reflects a non-recurring reimbursement related to restitution amounts in connection with a distribution plan approved by the Securities and Exchange Commission (SEC), which amounted to less than $0.01 per share outstanding on July 21, 2011.
e Reflects a non-recurring reimbursement related to short-term trading related lawsuits, which amounted to less than $0.01 per share outstanding on May 18, 2011.
The accompanying notes are an integral part of these financial statements.
32
Massachusetts Tax Exempt Income Fund
Massachusetts Tax Exempt Income Fund
33
Notes to financial statements 5/31/15
Within the following Notes to financial statements, references to “State Street” represent State Street Bank and Trust Company, references to “the SEC” represent the Securities and Exchange Commission, references to “Putnam Management” represent Putnam Investment Management, LLC, the fund’s manager, an indirect wholly-owned subsidiary of Putnam Investments, LLC and references to “OTC”, if any, represent over-the-counter. Unless otherwise noted, the “reporting period” represents the period from June 1, 2014 through May 31, 2015.
Putnam Massachusetts Tax Exempt Income Fund (the fund) is a Massachusetts business trust, which is registered under the Investment Company Act of 1940, as amended, as a diversified, open-end management investment company. The goal of the fund is to seek as high a level of current income exempt from federal income tax and Massachusetts personal income tax as Putnam Management believes is consistent with preservation of capital. The fund invests mainly in bonds that pay interest that is exempt from federal income tax and Massachusetts personal income tax (but that may be subject to federal alternative minimum tax (AMT)), are investment-grade in quality, and have intermediate- to long-term maturities (three years or longer). Putnam Management may consider, among other factors, credit, interest rate and prepayment risks, as well as general market conditions, when deciding whether to buy or sell investments.
The fund offers class A, class B, class C, class M and class Y shares. Class A and class M shares are sold with a maximum front-end sales charge of 4.00% and 3.25%, respectively, and generally do not pay a contingent deferred sales charge. Class B shares, which convert to class A shares after approximately eight years, do not pay a front-end sales charge and are subject to a contingent deferred sales charge if those shares are redeemed within six years of purchase. Class C shares have a one-year 1.00% contingent deferred sales charge and do not convert to class A shares. The expenses for class A, class B, class C, and class M shares may differ based on the distribution fee of each class, which is identified in Note 2. Class Y shares, which are sold at net asset value, are generally subject to the same expenses as class A, class B, class C, and class M shares, but do not bear a distribution fee. Class Y shares are not available to all investors.
In the normal course of business, the fund enters into contracts that may include agreements to indemnify another party under given circumstances. The fund’s maximum exposure under these arrangements is unknown as this would involve future claims that may be, but have not yet been, made against the fund. However, the fund’s management team expects the risk of material loss to be remote.
Note 1: Significant accounting policies
The following is a summary of significant accounting policies consistently followed by the fund in the preparation of its financial statements. The preparation of financial statements is in conformity with accounting principles generally accepted in the United States of America and requires management to make estimates and assumptions that affect the reported amounts of assets and liabilities in the financial statements and the reported amounts of increases and decreases in net assets from operations. Actual results could differ from those estimates. Subsequent events after the Statement of assets and liabilities date through the date that the financial statements were issued have been evaluated in the preparation of the financial statements.
Investment income, realized and unrealized gains and losses and expenses of the fund are borne pro-rata based on the relative net assets of each class to the total net assets of the fund, except that each class bears expenses unique to that class (including the distribution fees applicable to such classes). Each class votes as a class only with respect to its own distribution plan or other matters on which a class vote is required by law or determined by the Trustees. If the fund were liquidated, shares of each class would receive their pro-rata share of the net assets of the fund. In addition, the Trustees declare separate dividends on each class of shares.
Security valuation Portfolio securities and other investments are valued using policies and procedures adopted by the Board of Trustees. The Trustees have formed a Pricing Committee to oversee the implementation of these procedures and have delegated responsibility for valuing the fund’s assets in accordance with these procedures to Putnam Management. Putnam Management has established an internal Valuation Committee that is responsible for making fair value determinations, evaluating the effectiveness of the pricing policies of the fund and reporting to the Pricing Committee.
Tax-exempt bonds and notes are generally valued on the basis of valuations provided by an independent pricing service approved by the Trustees. Such services use information with respect to transactions in bonds, quotations from bond dealers, market transactions in comparable securities and various relationships between securities in determining value. These securities will generally be categorized as Level 2.
34 Massachusetts Tax Exempt Income Fund
Certain investments, including certain restricted and illiquid securities and derivatives, are also valued at fair value following procedures approved by the Trustees. To assess the continuing appropriateness of fair valuations, the Valuation Committee reviews and affirms the reasonableness of such valuations on a regular basis after considering all relevant information that is reasonably available. Such valuations and procedures are reviewed periodically by the Trustees. These valuations consider such factors as significant market or specific security events such as interest rate or credit quality changes, various relationships with other securities, discount rates, U.S. Treasury, U.S. swap and credit yields, index levels, convexity exposures, recovery rates, sales and other multiples and resale restrictions. These securities are classified as Level 2 or as Level 3 depending on the priority of the significant inputs. The fair value of securities is generally determined as the amount that the fund could reasonably expect to realize from an orderly disposition of such securities over a reasonable period of time. By its nature, a fair value price is a good faith estimate of the value of a security in a current sale and does not reflect an actual market price, which may be different by a material amount.
Security transactions and related investment income Security transactions are recorded on the trade date (the date the order to buy or sell is executed). Gains or losses on securities sold are determined on the identified cost basis.
Interest income is recorded on the accrual basis. All premiums/discounts are amortized/accreted on a yield-to-maturity basis. The premium in excess of the call price, if any, is amortized to the call date; thereafter, any remaining premium is amortized to maturity.
Interfund lending The fund, along with other Putnam funds, may participate in an interfund lending program pursuant to an exemptive order issued by the SEC. This program allows the fund to borrow from other Putnam funds that permit such transactions. Interfund lending transactions are subject to each fund’s investment policies and borrowing and lending limits. Interest earned or paid on the interfund lending transaction will be based on the average of certain current market rates. During the reporting period, the fund did not utilize the program.
Lines of credit The fund participates, along with other Putnam funds, in a $392.5 million unsecured committed line of credit and a $235.5 million unsecured uncommitted line of credit, both provided by State Street. Borrowings may be made for temporary or emergency purposes, including the funding of shareholder redemption requests and trade settlements. Interest is charged to the fund based on the fund’s borrowing at a rate equal to the Federal Funds rate plus 1.25% for the committed line of credit and the Federal Funds rate plus 1.30% for the uncommitted line of credit. A closing fee equal to 0.04% of the committed line of credit and 0.04% of the uncommitted line of credit has been paid by the participating funds. In addition, a commitment fee of 0.11% per annum on any unutilized portion of the committed line of credit is allocated to the participating funds based on their relative net assets and paid quarterly. During the reporting period, the fund had no borrowings against these arrangements.
Federal taxes It is the policy of the fund to distribute all of its income within the prescribed time period and otherwise comply with the provisions of the Internal Revenue Code of 1986, as amended (the Code), applicable to regulated investment companies. It is also the intention of the fund to distribute an amount sufficient to avoid imposition of any excise tax under Section 4982 of the Code.
The fund is subject to the provisions of Accounting Standards Codification 740 Income Taxes (ASC 740). ASC 740 sets forth a minimum threshold for financial statement recognition of the benefit of a tax position taken or expected to be taken in a tax return. The fund did not have a liability to record for any unrecognized tax benefits in the accompanying financial statements. No provision has been made for federal taxes on income, capital gains or unrealized appreciation on securities held nor for excise tax on income and capital gains. Each of the fund’s federal tax returns for the prior three fiscal years remains subject to examination by the Internal Revenue Service.
Under the Regulated Investment Company Modernization Act of 2010, the fund will be permitted to carry forward capital losses incurred for an unlimited period and the carry forwards will retain their character as either short-term or long-term capital losses. At May 31, 2015, the fund had the following capital loss carryovers available, to the extent allowed by the Code, to offset future net capital gain, if any:
Loss carryover
Short-term
Long-term
Total
$2,137,665
$5,016,447
$7,154,112
Pursuant to federal income tax regulations applicable to regulated investment companies, the fund has elected to defer certain capital losses of $476,452 recognized during the period between November 1, 2014 and May 31, 2015 to its fiscal year ending May 31, 2016.
Massachusetts Tax Exempt Income Fund 35
Distributions to shareholders Income dividends are recorded daily by the fund and are paid monthly. Distributions from capital gains, if any, are recorded on the ex-dividend date and paid at least annually. The amount and character of income and gains to be distributed are determined in accordance with income tax regulations which may differ from generally accepted accounting principles. These differences include temporary and/or permanent differences from late year loss deferrals and dividends payable. Reclassifications are made to the fund’s capital accounts to reflect income and gains available for distribution (or available capital loss carryovers) under income tax regulations. At the close of the reporting period, the fund reclassified $80,863 to decrease undistributed net investment income and $80,863 to decrease accumulated net realized loss.
The tax basis components of distributable earnings and the federal tax cost as of the close of the reporting period were as follows:
Unrealized appreciation
$21,260,807
Unrealized depreciation
(1,629,428)
Net unrealized appreciation
19,631,379
Undistributed tax-exempt income
445,527
Capital loss carryforward
(7,154,112)
Post-October capital loss deferral
(476,452)
Cost for federal income tax purposes
$281,171,051
Note 2: Management fee, administrative services and other transactions
The fund pays Putnam Management a management fee (based on the fund’s average net assets and computed and paid monthly) at annual rates that may vary based on the average of the aggregate net assets of most open-end funds, as defined in the fund’s management contract, sponsored by Putnam Management. Such annual rates may vary as follows:
0.590%
of the first $5 billion,
0.540%
of the next $5 billion,
0.490%
of the next $10 billion,
0.440%
of the next $10 billion,
0.390%
of the next $50 billion,
0.370%
of the next $50 billion,
0.360%
of the next $100 billion and
0.355%
of any excess thereafter.
Putnam Management has contractually agreed, through September 30, 2016, to waive fees or reimburse the fund’s expenses to the extent necessary to limit the cumulative expenses of the fund, exclusive of brokerage, interest, taxes, investment-related expenses, extraordinary expenses, acquired fund fees and expenses and payments under the fund’s investor servicing contract, investment management contract and distribution plans, on a fiscal year-to-date basis to an annual rate of 0.20% of the fund’s average net assets over such fiscal year-to-date period. During the reporting period, the fund’s expenses were not reduced as a result of this limit.
Putnam Investments Limited (PIL), an affiliate of Putnam Management, is authorized by the Trustees to manage a separate portion of the assets of the fund as determined by Putnam Management from time to time. Putnam Management pays a quarterly sub-management fee to PIL for its services at an annual rate of 0.40% of the average net assets of the portion of the fund managed by PIL.
The fund reimburses Putnam Management an allocated amount for the compensation and related expenses of certain officers of the fund and their staff who provide administrative services to the fund. The aggregate amount of all such reimbursements is determined annually by the Trustees.
Custodial functions for the fund’s assets are provided by State Street. Custody fees are based on the fund’s asset level, the number of its security holdings and transaction volumes.
Putnam Investor Services, Inc., an affiliate of Putnam Management, provides investor servicing agent functions to the fund. Putnam Investor Services, Inc. received fees for investor servicing that included (1) a per account fee for each direct and underlying non-defined contribution account (“retail account”) of the fund and each of the other funds in its specified category, which was totaled and then allocated to each fund in the category based on its average daily net assets; (2) a specified rate of the fund’s assets attributable to defined contribution plan accounts; and (3) for the portion of the fund’s fiscal year beginning after January 1, 2015, a specified rate based on the average net assets in retail accounts. Putnam Investor Services has agreed that the aggregate investor servicing fees for each fund’s retail and defined contribution accounts will not exceed an annual rate of 0.320% of the fund’s
36 Massachusetts Tax Exempt Income Fund
average assets attributable to such accounts. During the reporting period, the expenses for each class of shares related to investor servicing fees were as follows:
Class A
$139,446
Class B
1,881
Class C
17,249
Class M
1,596
Class Y
15,298
Total
$175,470
The fund has entered into expense offset arrangements with Putnam Investor Services, Inc. and State Street whereby Putnam Investor Services, Inc.’s and State Street’s fees are reduced by credits allowed on cash balances. For the reporting period, the fund’s expenses were reduced by $412 under the expense offset arrangements.
Each Independent Trustee of the fund receives an annual Trustee fee, of which $181, as a quarterly retainer, has been allocated to the fund, and an additional fee for each Trustees meeting attended. Trustees also are reimbursed for expenses they incur relating to their services as Trustees.
The fund has adopted a Trustee Fee Deferral Plan (the Deferral Plan) which allows the Trustees to defer the receipt of all or a portion of Trustees fees payable on or after July 1, 1995. The deferred fees remain invested in certain Putnam funds until distribution in accordance with the Deferral Plan.
The fund has adopted an unfunded noncontributory defined benefit pension plan (the Pension Plan) covering all Trustees of the fund who have served as a Trustee for at least five years and were first elected prior to 2004. Benefits under the Pension Plan are equal to 50% of the Trustee’s average annual attendance and retainer fees for the three years ended December 31, 2005. The retirement benefit is payable during a Trustee’s lifetime, beginning the year following retirement, for the number of years of service through December 31, 2006. Pension expense for the fund is included in Trustee compensation and expenses in the Statement of operations. Accrued pension liability is included in Payable for Trustee compensation and expenses in the Statement of assets and liabilities. The Trustees have terminated the Pension Plan with respect to any Trustee first elected after 2003.
The fund has adopted distribution plans (the Plans) with respect to its class A, class B, class C and class M shares pursuant to Rule 12b–1 under the Investment Company Act of 1940. The purpose of the Plans is to compensate Putnam Retail Management Limited Partnership, an indirect wholly-owned subsidiary of Putnam Investments, LLC, for services provided and expenses incurred in distributing shares of the fund. The Plans provide for payments by the fund to Putnam Retail Management Limited Partnership at an annual rate of up to 0.35%, 1.00%, 1.00% and 1.00% of the average net assets attributable to class A, class B, class C and class M shares, respectively. The Trustees have approved payment by the fund at the annual rate of 0.85%, 1.00% and 0.50% of the average net assets for class B, class C and class M shares, respectively. For class A shares, the annual payment rate will equal the weighted average of (i) 0.20% on the net assets of the fund attributable to class A shares purchased and paid for prior to April 1, 2005 and (ii) 0.25% on all other net assets of the fund attributable to class A shares. During the reporting period, the class specific expenses related to distribution fees were as follows:
Class A
$560,677
Class B
28,395
Class C
306,703
Class M
14,289
Total
$910,064
For the reporting period, Putnam Retail Management Limited Partnership, acting as underwriter, received net commissions of $19,262 and $101 from the sale of class A and class M shares, respectively, and received $2,837 and $528 in contingent deferred sales charges from redemptions of class B and class C shares, respectively.
A deferred sales charge of up to 1.00% is assessed on certain redemptions of class A shares. For the reporting period, Putnam Retail Management Limited Partnership, acting as underwriter, received no monies on class A redemptions.
Note 3: Purchases and sales of securities
During the reporting period, the cost of purchases and the proceeds from sales, excluding short-term investments, were as follows:
Cost of purchases
Proceeds from sales
Investments in securities (Long-term)
$24,434,638
$31,740,544
U.S. government securities (Long-term)
—
—
Total
$24,434,638
$31,740,544
Massachusetts Tax Exempt Income Fund 37
Note 4: Capital shares
At the close of the reporting period, there were an unlimited number of shares of beneficial interest authorized. Transactions in capital shares were as follows:
Year ended 5/31/15
Year ended 5/31/14
Class A
Shares
Amount
Shares
Amount
Shares sold
2,368,353
$23,105,233
2,482,051
$23,329,740
Shares issued in connection with reinvestment of distributions
697,480
6,817,859
862,655
8,120,630
3,065,833
29,923,092
3,344,706
31,450,370
Shares repurchased
(4,382,224)
(42,740,487)
(11,148,428)
(104,881,895)
Net decrease
(1,316,391)
$(12,817,395)
(7,803,722)
$(73,431,525)
Year ended 5/31/15
Year ended 5/31/14
Class B
Shares
Amount
Shares
Amount
Shares sold
46,495
$453,714
19,957
$188,338
Shares issued in connection with reinvestment of distributions
8,319
81,236
9,500
89,327
54,814
534,950
29,457
277,665
Shares repurchased
(58,773)
(573,505)
(118,004)
(1,114,548)
Net decrease
(3,959)
$(38,555)
(88,547)
$(836,883)
Year ended 5/31/15
Year ended 5/31/14
Class C
Shares
Amount
Shares
Amount
Shares sold
320,962
$3,144,891
166,535
$1,581,914
Shares issued in connection with reinvestment of distributions
56,290
551,253
77,752
732,785
377,252
3,696,144
244,287
2,314,699
Shares repurchased
(447,906)
(4,386,382)
(1,693,245)
(15,951,725)
Net decrease
(70,654)
$(690,238)
(1,448,958)
$(13,637,026)
Year ended 5/31/15
Year ended 5/31/14
Class M
Shares
Amount
Shares
Amount
Shares sold
4,544
$44,167
13,397
$126,871
Shares issued in connection with reinvestment of distributions
5,084
49,668
7,437
69,990
9,628
93,835
20,834
196,861
Shares repurchased
(56,171)
(549,561)
(106,407)
(1,002,277)
Net decrease
(46,543)
$(455,726)
(85,573)
$(805,416)
Year ended 5/31/15
Year ended 5/31/14
Class Y
Shares
Amount
Shares
Amount
Shares sold
1,309,311
$12,831,416
937,157
$8,859,148
Shares issued in connection with reinvestment of distributions
80,458
788,758
85,729
809,073
1,389,769
13,620,174
1,022,886
9,668,221
Shares repurchased
(501,448)
(4,902,443)
(1,977,747)
(18,593,520)
Net increase (decrease)
888,321
$8,717,731
(954,861)
$(8,925,299)
38 Massachusetts Tax Exempt Income Fund
Note 5: Market, credit and other risks
In the normal course of business, the fund trades financial instruments and enters into financial transactions where risk of potential loss exists due to changes in the market (market risk) or failure of the contracting party to the transaction to perform (credit risk). The fund may be exposed to additional credit risk that an institution or other entity with which the fund has unsettled or open transactions will default. The fund focuses a majority of its investments in the Commonwealth of Massachusetts and may be affected by economic and political developments in that Commonwealth.
Massachusetts Tax Exempt Income Fund 39
Federal tax information (Unaudited)
The fund has designated 98.31% of dividends paid from net investment income during the reporting period as tax exempt for Federal income tax purposes.
The Form 1099 that will be mailed to you in January 2016 will show the tax status of all distributions paid to your account in calendar 2015.
40 Massachusetts Tax Exempt Income Fund
About the Trustees
Independent Trustees
Liaquat Ahamed
Born 1952, Trustee since 2012
Principal occupations during past five years: Pulitzer Prize-winning author of Lords of Finance: The Bankers Who Broke the World, whose articles on economics have appeared in such publications as the New York Times, Foreign Affairs, and the Financial Times. Director of Aspen Insurance Co., a New York Stock Exchange company, and Chair of the Aspen Board’s Investment Committee. Trustee of the Brookings Institution.
Other directorships: The Rohatyn Group, an emerging-market fund complex that manages money for institutions
Ravi Akhoury
Born 1947, Trustee since 2009
Principal occupations during past five years: Trustee of American India Foundation and of the Rubin Museum. From 1992 to 2007, was Chairman and CEO of MacKay Shields, a multi-product investment management firm.
Other directorships: RAGE Frameworks, Inc., a private software company; English Helper, Inc., a private software company
Barbara M. Baumann
Born 1955, Trustee since 2010
Principal occupations during past five years: President and Owner of Cross Creek Energy Corporation, a strategic consultant to domestic energy firms and direct investor in energy projects. Current Board member of The Denver Foundation. Former Chair and current Board member of Girls Incorporated of Metro Denver. Member of the Finance Committee, the Children’s Hospital of Colorado.
Other directorships: Buckeye Partners, L.P., a publicly traded master limited partnership focused on pipeline transport, storage, and distribution of petroleum products; Devon Energy Corporation, a leading independent natural gas and oil exploration and production company
Jameson A. Baxter
Born 1943, Trustee since 1994, Vice Chair from 2005 to 2011, and Chair since 2011
Principal occupations during past five years: President of Baxter Associates, Inc., a private investment firm. Chair of Mutual Fund Directors Forum. Chair Emeritus of the Board of Trustees of Mount Holyoke College. Director of the Adirondack Land Trust and Trustee of the Nature Conservancy’s Adirondack Chapter.
Robert J. Darretta
Born 1946, Trustee since 2007
Principal occupations during past five years: From 2009 until 2012, served as Health Care Industry Advisor to Permira, a global private equity firm. Until April 2007, was Vice Chairman of the Board of Directors of Johnson & Johnson. Served as Johnson & Johnson’s Chief Financial Officer for a decade.
Other directorships: UnitedHealth Group, a diversified health-care company
Katinka Domotorffy
Born 1975, Trustee since 2012
Principal occupations during past five years: Voting member of the Investment Committees of the Anne Ray Charitable Trust and Margaret A. Cargill Foundation, part of the Margaret A. Cargill Philanthropies. Until 2011, Partner, Chief Investment Officer, and Global Head of Quantitative Investment Strategies at Goldman Sachs Asset Management.
Other directorships: Reach Out and Read of Greater New York, an organization dedicated to promoting childhood literacy; Great Lakes Science Center
John A. Hill
Born 1942, Trustee since 1985 and Chairman from 2000 to 2011
Principal occupations during past five years: Founder and Vice-Chairman of First Reserve Corporation, the leading private equity buyout firm focused on the worldwide energy industry. Trustee and Chairman of the Board of Trustees of Sarah Lawrence College. Member of the Advisory Board of the Millstein Center for Global Markets and Corporate Ownership at The Columbia University Law School.
Other directorships: Devon Energy Corporation, a leading independent natural gas and oil exploration and production company
Massachusetts Tax Exempt Income Fund 41
Paul L. Joskow
Born 1947, Trustee since 1997
Principal occupations during past five years: Economist and President of the Alfred P. Sloan Foundation, a philanthropic institution focused primarily on research and education on issues related to science, technology, and economic performance. Elizabeth and James Killian Professor of Economics, Emeritus at the Massachusetts Institute of Technology (MIT). Prior to 2007, served as the Director of the Center for Energy and Environmental Policy Research at MIT.
Other directorships: Yale University; Exelon Corporation, an energy company focused on power services; Boston Symphony Orchestra; Prior to April 2013, served as Director of TransCanada Corporation and TransCanada Pipelines Ltd., energy companies focused on natural gas transmission, oil pipelines and power services
Kenneth R. Leibler
Born 1949, Trustee since 2006
Principal occupations during past five years: Founder and former Chairman of Boston Options Exchange, an electronic marketplace for the trading of derivative securities. Serves on the Board of Trustees of Beth Israel Deaconess Hospital in Boston, Massachusetts. Director of Beth Israel Deaconess Care Organization. Until November 2010, director of Ruder Finn Group, a global communications and advertising firm.
Other directorships: Eversource Corporation, which operates New England’s largest energy delivery system
Robert E. Patterson
Born 1945, Trustee since 1984
Principal occupations during past five years: Co-Chairman of Cabot Properties, Inc., a private equity firm investing in commercial real estate, and Chairman of its Investment Committee. Past Chairman and Trustee of the Joslin Diabetes Center.
George Putnam, III
Born 1951, Trustee since 1984
Principal occupations during past five years: Chairman of New Generation Research, Inc., a publisher of financial advisory and other research services. Founder and President of New Generation Advisors, LLC, a registered investment advisor to private funds. Director of The Boston Family Office, LLC, a registered investment advisor.
W. Thomas Stephens
Born 1942, Trustee from 1997 to 2008 and since 2009
Principal occupations during past five years: Retired as Chairman and Chief Executive Officer of Boise Cascade, LLC, a paper, forest products, and timberland assets company, in December 2008. Prior to 2010, Director of Boise Inc., a manufacturer of paper and packaging products.
Other directorships: Prior to April 2014, served as Director of TransCanada Pipelines Ltd., an energy infrastructure company
Interested Trustee
Robert L. Reynolds*
Born 1952, Trustee since 2008 and President of the Putnam Funds since 2009
Principal occupations during past five years: President and Chief Executive Officer of Putnam Investments since 2008 and, since 2014, President and Chief Executive Officer of Great-West Financial, a financial services company that provides retirement savings plans, life insurance, and annuity and executive benefits products, and of Great-West Lifeco U.S. Inc., a holding company that owns Putnam Investments and Great-West Financial. Prior to joining Putnam Investments, served as Vice Chairman and Chief Operating Officer of Fidelity Investments from 2000 to 2007.
*Mr. Reynolds is an “interested person” (as defined in the Investment Company Act of 1940) of the fund and Putnam Investments. He is President and Chief Executive Officer of Putnam Investments, as well as the President of your fund and each of the other Putnam funds.
The address of each Trustee is One Post Office Square, Boston, MA 02109.
As of May 31, 2015, there were 117 Putnam funds. All Trustees serve as Trustees of all Putnam funds.
Each Trustee serves for an indefinite term, until his or her resignation, retirement at age 75, removal, or death.
42 Massachusetts Tax Exempt Income Fund
Officers
In addition to Robert L. Reynolds, the other officers of the fund are shown below:
Jonathan S. Horwitz (Born 1955)
Executive Vice President, Principal Executive Officer, and Compliance Liaison
Since 2004
Steven D. Krichmar (Born 1958)
Vice President and Principal Financial Officer
Since 2002
Chief of Operations, Putnam Investments and Putnam Management
Robert T. Burns (Born 1961)
Vice President and Chief Legal Officer
Since 2011
General Counsel, Putnam Investments, Putnam Management, and Putnam Retail Management
Manager of Finance, Dunkin’ Brands (2008–2010); Senior Financial Analyst, Old Mutual Asset Management (2007–2008); Senior Financial Analyst, Putnam Investments (1999–2007)
Janet C. Smith (Born 1965)
Vice President, Principal Accounting Officer, and Assistant Treasurer
Since 2007
Director of Fund Administration Services, Putnam Investments and Putnam Management
Susan G. Malloy (Born 1957)
Vice President and Assistant Treasurer
Since 2007
Director of Accounting & Control Services, Putnam Investments and Putnam Management
James P. Pappas (Born 1953)
Vice President
Since 2004
Director of Trustee Relations, Putnam Investments and Putnam Management
Mark C. Trenchard (Born 1962)
Vice President and BSA Compliance Officer
Since 2002
Director of Operational Compliance, Putnam Investments and Putnam Retail Management
Nancy E. Florek (Born 1957)
Vice President, Director of Proxy Voting and Corporate Governance, Assistant Clerk, and Associate Treasurer
Since 2000
The principal occupations of the officers for the past five years have been with the employers as shown above, although in some cases they have held different positions with such employers. The address of each officer is One Post Office Square, Boston, MA 02109.
Massachusetts Tax Exempt Income Fund 43
Services for shareholders
Investor services
Systematic investment plan Tell us how much you wish to invest regularly — weekly, semimonthly, or monthly — and the amount you choose will be transferred automatically from your checking or savings account. There’s no additional fee for this service, and you can suspend it at any time. This plan may be a great way to save for college expenses or to plan for your retirement.
Please note that regular investing does not guarantee a profit or protect against loss in a declining market. Before arranging a systematic investment plan, consider your financial ability to continue making purchases in periods when prices are low.
Systematic exchange You can make regular transfers from one Putnam fund to another Putnam fund. There are no additional fees for this service, and you can cancel or change your options at any time.
Dividends PLUS You can choose to have the dividend distributions from one of your Putnam funds automatically reinvested in another Putnam fund at no additional charge.
Free exchange privilege You can exchange money between Putnam funds free of charge, as long as they are the same class of shares. A signature guarantee is required if you are exchanging more than $500,000. The fund reserves the right to revise or terminate the exchange privilege.
Reinstatement privilege If you’ve sold Putnam shares or received a check for a dividend or capital gain, you may reinvest the proceeds with Putnam within 90 days of the transaction and they will be reinvested at the fund’s current net asset value — with no sales charge. However, reinstatement of class B shares may have special tax consequences. Ask your financial or tax representative for details.
Check-writing service You have ready access to many Putnam accounts. It’s as simple as writing a check, and there are no special fees or service charges. For more information about the check-writing service, call Putnam or visit our website.
Dollar cost averaging When you’re investing for long-term goals, it’s time, not timing, that counts. Investing on a systematic basis is a better strategy than trying to figure out when the markets will go up or down. This means investing the same amount of money regularly over a long period. This method of investing is called dollar cost averaging. When a fund’s share price declines, your investment dollars buy more shares at lower prices. When it increases, they buy fewer shares. Over time, you will pay a lower average price per share.
For more information
Visit the Individual Investors section at putnam.com A secure section of our website contains complete information on your account, including balances and transactions, updated daily. You may also conduct transactions, such as exchanges, additional investments, and address changes. Log on today to get your password.
Call us toll free at 1-800-225-1581 Ask a helpful Putnam representative or your financial advisor for details about any of these or other services, or see your prospectus.
44 Massachusetts Tax Exempt Income Fund
Fund information
Founded over 75 years ago, Putnam Investments was built around the concept that a balance between risk and reward is the hallmark of a well-rounded financial program. We manage over 100 funds across income, value, blend, growth, asset allocation, absolute return, and global sector categories.
Investment Manager
Putnam Investment Management, LLC One Post Office Square Boston, MA 02109
Investment Sub-Manager
Putnam Investments Limited 57–59 St James’s Street London, England SW1A 1LD
Marketing Services
Putnam Retail Management One Post Office Square Boston, MA 02109
Custodian
State Street Bank and Trust Company
Legal Counsel
Ropes & Gray LLP
Independent Registered Public Accounting Firm
PriceWaterhouseCoopers LLP
Trustees
Jameson A. Baxter, Chair Liaquat Ahamed Ravi Akhoury Barbara M. Baumann Robert J. Darretta Katinka Domotorffy John A. Hill Paul L. Joskow Kenneth R. Leibler Robert E. Patterson George Putnam, III Robert L. Reynolds W. Thomas Stephens
Officers
Robert L. Reynolds President
Jonathan S. Horwitz Executive Vice President, Principal Executive Officer, and Compliance Liaison
Steven D. Krichmar Vice President and Principal Financial Officer
Robert T. Burns Vice President and Chief Legal Officer
Robert R. Leveille Vice President and Chief Compliance Officer
Michael J. Higgins Vice President, Treasurer, and Clerk
Janet C. Smith Vice President, Principal Accounting Officer, and Assistant Treasurer
Susan G. Malloy Vice President and Assistant Treasurer
James P. Pappas Vice President
Mark C. Trenchard Vice President and BSA Compliance Officer
Nancy E. Florek Vice President, Director of Proxy Voting and Corporate Governance, Assistant Clerk, and Associate Treasurer
This report is for the information of shareholders of Putnam Massachusetts Tax Exempt Income Fund. It may also be used as sales literature when preceded or accompanied by the current prospectus, the most recent copy of Putnam’s Quarterly Performance Summary, and Putnam’s Quarterly Ranking Summary. For more recent performance, please visit putnam.com. Investors should carefully consider the investment objectives, risks, charges, and expenses of a fund, which are described in its prospectus. For this and other information or to request a prospectus or summary prospectus, call 1-800-225-1581 toll free. Please read the prospectus carefully before investing. The fund’s Statement of Additional Information contains additional information about the fund’s Trustees and is available without charge upon request by calling 1-800-225-1581.
Item 2. Code of Ethics:
(a) The fund’s principal executive, financial and accounting officers are employees of Putnam Investment Management, LLC, the Fund’s investment manager. As such they are subject to a comprehensive Code of Ethics adopted and administered by Putnam Investments which is designed to protect the interests of the firm and its clients. The Fund has adopted a Code of Ethics which incorporates the Code of Ethics of Putnam Investments with respect to all of its officers and Trustees who are employees of Putnam Investment Management, LLC. For this reason, the Fund has not adopted a separate code of ethics governing its principal executive, financial and accounting officers.
(c) In July 2013, the Code of Ethics of Putnam Investment Management, LLC was amended. The changes to the Code of Ethics were as follows: (i) eliminating the requirement for employees to hold their shares of Putnam mutual funds for specified periods of time, (ii) removing the requirement to preclear transactions in certain kinds of exchange-traded funds and exchange-traded notes, although reporting of all such instruments remains required; (iii) eliminating the excessive trading rule related to employee transactions in securities requiring preclearance under the Code; (iv) adding provisions related to monitoring of employee trading; (v) changing from a set number of shares to a set dollar value of stock of mid- and large-cap companies on the Restricted List that can be purchased or sold; (vi) adding a requirement starting in March 2014 for employees to generally use certain approved brokers that provide Putnam with an electronic feed of transactions and statements for their personal brokerage accounts; and (vii) certain other changes.
Item 3. Audit Committee Financial Expert:
The Funds’ Audit and Compliance Committee is comprised solely of Trustees who are “independent” (as such term has been defined by the Securities and Exchange Commission (“SEC”) in regulations implementing Section 407 of the Sarbanes-Oxley Act (the “Regulations”)). The Trustees believe that each of the members of the Audit and Compliance Committee also possess a combination of knowledge and experience with respect to financial accounting matters, as well as other attributes, that qualify them for service on the Committee. In addition, the Trustees have determined that each of Mr. Leibler, Mr. Hill, Mr. Darretta, and Ms. Baumann qualifies as an “audit committee financial expert” (as such term has been defined by the Regulations) based on their review of his or her pertinent experience and education. The SEC has stated, and the funds’ amended and restated agreement and Declaration of Trust provides, that the designation or identification of a person as an audit committee financial expert pursuant to this Item 3 of Form N-CSR does not impose on such person any duties, obligations or liability that are greater than the duties, obligations and liability imposed on such person as a member of the Audit and Compliance Committee and the Board of Trustees in the absence of such designation or identification.
Item 4. Principal Accountant Fees and Services:
The following table presents fees billed in each of the last two fiscal years for services rendered to the fund by the fund’s independent auditor:
Fiscal year ended
Audit Fees
Audit-Related Fees
Tax Fees
All Other Fees
May 31, 2015
$56,501
$ —
$11,576
$ —
May 31, 2014
$58,493
$ —
$11,522
$ —
For the fiscal years ended May 31, 2015 and May 31, 2014, the fund’s independent auditor billed aggregate non-audit fees in the amounts of $629,775 and $511,522 respectively, to the fund, Putnam Management and any entity controlling, controlled by or under common control with Putnam Management that provides ongoing services to the fund.
Audit Fees represent fees billed for the fund’s last two fiscal years relating to the audit and review of the financial statements included in annual reports and registration statements, and other services that are normally provided in connection with statutory and regulatory filings or engagements.
Audit-Related Fees represent fees billed in the fund’s last two fiscal years for services traditionally performed by the fund’s auditor, including accounting consultation for proposed transactions or concerning financial accounting and reporting standards and other audit or attest services not required by statute or regulation.
Tax Fees represent fees billed in the fund’s last two fiscal years for tax compliance, tax planning and tax advice services. Tax planning and tax advice services include assistance with tax audits, employee benefit plans and requests for rulings or technical advice from taxing authorities.
Pre-Approval Policies of the Audit and Compliance Committee. The Audit and Compliance Committee of the Putnam funds has determined that, as a matter of policy, all work performed for the funds by the funds’ independent auditors will be pre-approved by the Committee itself and thus will generally not be subject to pre-approval procedures.
The Audit and Compliance Committee also has adopted a policy to pre-approve the engagement by Putnam Management and certain of its affiliates of the funds’ independent auditors, even in circumstances where pre-approval is not required by applicable law. Any such requests by Putnam Management or certain of its affiliates are typically submitted in writing to the Committee and explain, among other things, the nature of the proposed engagement, the estimated fees, and why this work should be performed by that particular audit firm as opposed to another one. In reviewing such requests, the Committee considers, among other things, whether the provision of such services by the audit firm are compatible with the independence of the audit firm.
The following table presents fees billed by the fund’s independent auditor for services required to be approved pursuant to paragraph (c)(7)(ii) of Rule 2-01 of Regulation S-X.
Fiscal year ended
Audit-Related Fees
Tax Fees
All Other Fees
Total Non-Audit Fees
May 31, 2015
$ —
$618,199
$ —
$ —
May 31, 2014
$ —
$500,000
$ —
$ —
Item 5. Audit Committee of Listed Registrants
Not applicable
Item 6. Schedule of Investments:
The registrant’s schedule of investments in unaffiliated issuers is included in the report to shareholders in Item 1 above.
Item 7. Disclosure of Proxy Voting Policies and Procedures For Closed-End Management Investment Companies:
Not applicable
Item 8. Portfolio Managers of Closed-End Investment Companies
Not Applicable
Item 9. Purchases of Equity Securities by Closed-End Management Investment Companies and Affiliated Purchasers:
Not applicable
Item 10. Submission of Matters to a Vote of Security Holders:
Not applicable
Item 11. Controls and Procedures:
(a) The registrant’s principal executive officer and principal financial officer have concluded, based on their evaluation of the effectiveness of the design and operation of the registrant’s disclosure controls and procedures as of a date within 90 days of the filing date of this report, that the design and operation of such procedures are generally effective to provide reasonable assurance that information required to be disclosed by the registrant in this report is recorded, processed, summarized and reported within the time periods specified in the Commission’s rules and forms.
(b) Changes in internal control over financial reporting: Not applicable
Item 12. Exhibits:
(a)(1) The Code of Ethics of The Putnam Funds, which incorporates the Code of Ethics of Putnam Investments, is filed herewith.
(a)(2) Separate certifications for the principal executive officer and principal financial officer of the registrant as required by Rule 30a-2(a) under the Investment Company Act of 1940, as amended, are filed herewith.
(b) The certifications required by Rule 30a-2(b) under the Investment Company Act of 1940, as amended, are filed herewith.
SIGNATURES
Pursuant to the requirements of the Securities Exchange Act of 1934 and the Investment Company Act of 1940, the registrant has duly caused this report to be signed on its behalf by the undersigned, thereunto duly authorized.
Putnam Massachusetts Tax Exempt Income Fund
By (Signature and Title):
/s/ Janet C. Smith Janet C. Smith Principal Accounting Officer
Date: July 29, 2015
Pursuant to the requirements of the Securities Exchange Act of 1934 and the Investment Company Act of 1940, this report has been signed below by the following persons on behalf of the registrant and in the capacities and on the dates indicated.
By (Signature and Title):
/s/ Jonathan S. Horwitz Jonathan S. Horwitz Principal Executive Officer
Date: July 29, 2015
By (Signature and Title):
/s/ Steven D. Krichmar Steven D. Krichmar Principal Financial Officer
Date: July 29, 2015
We use cookies on this site to provide a more responsive and personalized service. Continuing to browse, clicking I Agree, or closing this banner indicates agreement. See our Cookie Policy for more information.