UNITED STATES
SECURITIES AND EXCHANGE COMMISSION
SECURITIES AND EXCHANGE COMMISSION
Washington, D.C. 20549
FORM 10-K/A
[X] | ANNUAL REPORT PURSUANT TO SECTION 13 OR 15(d) OF THE SECURITIES EXCHANGE ACT OF 1934. For the fiscal year ended December 31, 2007 |
OR
[ ] | TRANSITION REPORT PURSUANT TO SECTION 13 OR 15 (d) OF THE SECURITIES EXCHANGE ACT OF 1934. For the transition period from to |
Commission file number 001-13619
BROWN & BROWN, INC.
(Exact name of registrant as specified in its charter)
Florida (State or other jurisdiction of incorporation or organization) 220 South Ridgewood Avenue, Daytona Beach, FL (Address of principal executive offices) | 59-0864469 (I.R.S. Employer Identification Number) 32114 (Zip Code) | |||||||||
Registrant’s telephone number, including area code: (386) 252-9601
Registrant’s Website: www.bbinsurance.com
Registrant’s Website: www.bbinsurance.com
Securities registered pursuant to Section 12(b) of the Act: None
Title of each class COMMON STOCK, $0.10 PAR VALUE | Name of each exchange on which registered NEW YORK STOCK EXCHANGE | |||||
Securities registered pursuant to Section 12(g) of the Act: None
Indicate by check mark if the registrant is a well-known seasoned issuer, as defined in Rule 405 of the Securities Act.
Yes [X] No [ ]
Yes [X] No [ ]
Indicate by check mark if the registrant is not required to file reports pursuant to Section 13 or Section 15(d) of the Act.
Yes [ ] No [X]
Yes [ ] No [X]
NOTE: Checking the box above will not relieve any registrant required to file reports pursuant to Section 13 or 15(d) of the Exchange Act from their obligations under those Sections.
Indicate by check mark whether the registrant: (1) has filed all reports required to be filed by Section 13 or 15(d) of the Securities Exchange Act of 1934 during the preceding 12 months (or for such shorter period that the registrant was required to file such reports), and (2) has been subject to such filing requirements for the past 90 days. Yes [X] No [ ]
Indicate by check mark if disclosure of delinquent filers pursuant to Item 405 of Regulation S-K is not contained herein, and will not be contained, to the best of the registrant’s knowledge, in definitive proxy or information statements incorporated by reference in Part III of this Form 10-K or any amendment to this Form 10-K. [ ]
Indicate by check mark whether the registrant is a large accelerated filer, an accelerated filer, a non-accelerated filer, or a smaller reporting company. See the definitions of “large accelerated filer,” “accelerated filer,” and “smaller reporting company” in Rule 12b-2 of the Exchange Act. (Check one):
| Large accelerated filer [X] | Accelerated filer [ ] | |||||
| Non-accelerated filer [ ] | Smaller reporting company [ ] | |||||
Indicate by check mark whether the registrant is a shell company (as defined in Rule 12b-2 of the Exchange Act.): Yes [ ] No [X]
The aggregate market value of the voting Common Stock held by non-affiliates of the registrant, computed by reference to the last reported price at which the stock was sold on June 30, 2007 (the last business day of the registrant’s most recently completed second fiscal quarter) was $2,810,919,399.
The number of outstanding shares of the registrant’s Common Stock, $.10 par value, outstanding as of February 26, 2008 was 140,726,472.
DOCUMENTS INCORPORATED BY REFERENCE
Portions of Brown & Brown, Inc.’s Proxy Statement for the 2008 Annual Meeting of Shareholders are incorporated by reference into Part III of this Report.
Explanatory Note
This Form 10-K/A constitutes Amendment No. 1 to Brown & Brown, Inc.‘s Annual Report on Form 10-K for the period ended December 31, 2007 (“Amendment No. 1”). This Amendment No. 1 is being filed solely to correct one item of information in the “Net Income Per Share: Basic” line item for the first quarter of 2007 in the Quarterly Operating Results table of the Management’s Discussion & Analysis section (page 36 of the originally filed Annual Report on Form 10-K for the period ended December 31, 2007 (the “Original 10-K”)) from $0.46 per share to $0.43 per share to conform to the correctly stated identical line item in the Quarterly Operating Results (Unaudited) table contained in Note 15 to the Consolidated Financial Statements contained in the Original 10-K (page 66 of the Original 10-K). As no modifications to the exhibits to the Original 10-K are necessary other than updates to Exhibits 23, 31.1 and 31.2, the registrant is not re-filing any exhibits other than Exhibits 23, 31.1 and 31.2.
ANNUAL REPORT ON FORM 10-K
FOR THE FISCAL YEAR ENDED DECEMBER 31, 2007
INDEX
| Page No. | ||||||||||
|---|---|---|---|---|---|---|---|---|---|---|
| Part I | ||||||||||
| Item 1. | Business | 3 | ||||||||
| Item 1A. | Risk Factors | 11 | ||||||||
| Item 1B. | Unresolved Staff Comments | 18 | ||||||||
| Item 2. | Properties | 18 | ||||||||
| Item 3. | Legal Proceedings | 18 | ||||||||
| Item 4. | Submission of Matters to a Vote of Security Holders | 18 | ||||||||
| Part II | ||||||||||
| Item 5. | Market for the Registrant’s Common Equity, Related Stockholder Matters and Issuer Purchases of Equity Securities | 19 | ||||||||
| Item 6. | Selected Financial Data | 21 | ||||||||
| Item 7. | Management’s Discussion and Analysis of Financial Condition and Results of Operation | 22 | ||||||||
| Item 7A. | Quantitative and Qualitative Disclosures about Market Risk | 38 | ||||||||
| Item 8. | Financial Statements and Supplementary Data | 40 | ||||||||
| Item 9. | Changes in and Disagreements With Accountants on Accounting and Financial Disclosure | 71 | ||||||||
| Item 9A. | Controls and Procedures | 71 | ||||||||
| Item 9B. | Other Information | 72 | ||||||||
| Part III | ||||||||||
| Item 10. | Directors, Executive Officers and Corporate Governance | 72 | ||||||||
| Item 11. | Executive Compensation | 72 | ||||||||
| Item 12. | Security Ownership of Certain Beneficial Owners and Management and Related Stockholders Matters | 72 | ||||||||
| Item 13. | Certain Relationships and Related Transactions, and Director Independence | 72 | ||||||||
| Item 14. | Principal Accounting Fees and Services | 72 | ||||||||
| Part IV | ||||||||||
| Item 15. | Exhibits and Financial Statement Schedules | 73 | ||||||||
| Signatures | 75 | |||||||||
| Exhibit Index | 76 | |||||||||
2
PART I
ITEM 1. Business.
Disclosure Regarding Forward-Looking Statements
Brown & Brown, Inc., together with its subsidiaries (collectively, “we”, “Brown & Brown” or the “Company”), make “forward-looking statements” within the “safe harbor” provision of the Private Securities Litigation Reform Act of 1995, as amended, throughout this report and in the documents we incorporate by reference into this report. You can identify these statements by forward-looking words such as “may,” “will,” “expect,” “anticipate,” “believe,” “estimate,” “plan” and “continue” or similar words. We have based these statements on our current expectations about future events. Although we believe the expectations expressed in the forward-looking statements included in this Form 10-K and those reports, statements, information and announcements are based on reasonable assumptions within the bounds of our knowledge of our business, a number of factors could cause actual results to differ materially from those expressed in any forward-looking statements, whether oral or written, made by us or on our behalf. Many of these factors have previously been identified in filings or statements made by us or on our behalf. Important factors which could cause our actual results to differ materially from the forward-looking statements in this report include the following items, in additions to those matters described in Item 1A “Risk Factors”:
| – | material adverse changes in economic conditions in the markets we serve; |
| – | future regulatory actions and conditions in the states in which we conduct our business; |
| – | competition from others in the insurance agency, wholesale brokerage, insurance programs and service business; |
| – | a significant portion of business written by Brown & Brown is for customers located in California, Florida, Georgia, Michigan, New Jersey, New York, Pennsylvania, Texas and Washington. Accordingly, the occurrence of adverse economic conditions, an adverse regulatory climate, or a disaster in any of these states could have a material adverse effect on our business, although no such conditions have been encountered in the past; |
| – | the integration of our operations with those of businesses or assets we have acquired or may acquire in the future and the failure to realize the expected benefits of such integration; and |
| – | other risks and uncertainties as may be detailed from time to time in our public announcements and Securities and Exchange Commission (“SEC”) filings. |
Forward-looking statements that we make or that are made by others on our behalf are based on a knowledge of our business and the environment in which we operate, but because of the factors listed above, actual results may differ from those in the forward-looking statements. Consequently, these cautionary statements qualify all of the forward-looking statements we make herein. We cannot assure you that the results or developments anticipated by us will be realized or, even if substantially realized, that those results or developments will result in the expected consequences for us or affect us, our business or our operations in the way we expect. We caution readers not to place undue reliance on these forward-looking statements, which speak only as of their dates. We assume no obligation to update any of the forward-looking statements.
General
We are a diversified insurance agency, wholesale brokerage, insurance programs and service organization with origins dating from 1939, headquartered in Daytona Beach and Tampa, Florida. We market and sell to our customers insurance products and services, primarily in the property, casualty and employee benefits areas. As an agent and broker, we do not assume underwriting risks. Instead, we provide our customers with quality, non-investment insurance contracts, as well as other targeted, customized risk management products and services.
We are compensated for our services primarily by commissions paid by insurance companies and by fees paid by customers for certain services. The commission is usually a percentage of the premium paid by the insured. Commission rates generally depend upon the type of insurance, the particular insurance company and the nature
3
of the services provided by us. In some cases, a commission is shared with other agents or brokers who have acted jointly with us in a transaction. We may also receive from an insurance company a “profit-sharing contingent commission”, which is a profit-sharing commission based primarily on underwriting results, but may also contain considerations for volume, growth and/or retention. Fee revenues are generated primarily by: (1) our Services Division, which provides insurance-related services, including third-party claims administration and comprehensive medical utilization management services in both the workers’ compensation and all-lines liability arenas, as well as Medicare set-aside services, and (2) our Wholesale Brokerage and National Program Divisions which earn fees primarily for the issuing of insurance policies on behalf of insurance carriers. The amount of our revenue from commissions and fees is a function of, among other factors, continued new business production, retention of existing customers, acquisitions and fluctuations in insurance premium rates and insurable exposure units.
As of December 31, 2007, our activities were conducted in 198 locations in 38 states as follows:
| Florida | 38 | Minnesota | 3 | |||||||||||
| New York | 14 | Nevada | 3 | |||||||||||
| New Jersey | 11 | North Carolina | 3 | |||||||||||
| Texas | 11 | South Carolina | 3 | |||||||||||
| California | 10 | Wisconsin | 3 | |||||||||||
| Georgia | 8 | Connecticut | 2 | |||||||||||
| Colorado | 7 | Massachusetts | 2 | |||||||||||
| Illinois | 7 | Missouri | 2 | |||||||||||
| Pennsylvania | 7 | Montana | 2 | |||||||||||
| Virginia | 7 | New Hampshire | 2 | |||||||||||
| Washington | 7 | Alabama | 1 | |||||||||||
| Louisiana | 6 | Delaware | 1 | |||||||||||
| Arizona | 5 | Hawaii | 1 | |||||||||||
| Michigan | 5 | Kansas | 1 | |||||||||||
| Oklahoma | 5 | Nebraska | 1 | |||||||||||
| Arkansas | 4 | Ohio | 1 | |||||||||||
| Indiana | 4 | Oregon | 1 | |||||||||||
| Kentucky | 4 | Tennessee | 1 | |||||||||||
| New Mexico | 4 | West Virginia | 1 | |||||||||||
Industry Overview
Premium pricing within the property and casualty insurance underwriting (risk-bearing) industry has historically been cyclical, displaying a high degree of volatility based on prevailing economic and competitive conditions. From the mid-1980s through 1999, the property and casualty insurance industry experienced a “soft market” during which the underwriting capacity of insurance companies expanded, stimulating an increase in competition and a decrease in premium rates and related commissions. The effect of this softness in rates on our revenues was somewhat offset by our acquisitions and new business production. As a result of increasing “loss ratios” (the comparison of incurred losses plus adjustment expenses against earned premiums) of insurance companies through 1999, there was a general increase in premium rates beginning in the first quarter of 2000 and continuing into 2003. During 2003, the increases in premium rates began to moderate and, in certain lines of insurance, the premium rates decreased. In 2004, as general premium rates continued to moderate, the insurance industry experienced the worst hurricane season since 1992 (when Hurricane Andrew hit south Florida). The insured losses from the 2004 hurricane season were absorbed relatively easily by the insurance industry and the general insurance premium rates continued to soften during 2005. During the third quarter of 2005, the insurance industry experienced the worst hurricane season ever recorded. As a result of the significant losses incurred by the insurance companies from these hurricanes, the insurance premium rates in 2006 increased on coastal property, primarily in the southeastern region of the United States. In the other regions of the United States, the insurance premium rates, in general, declined during 2006. In addition to significant insurance pricing declines in the State of Florida, as discussed below, the insurance premium rates continued a gradual decline during 2007 in most of the other regions of the United States. One industry segment that was especially hit hard during 2007 was the home-building industry in southern California, and to a lesser extent Nevada, Arizona and Florida. We have a wholesale brokerage operation
4
that focuses on placing property and casualty insurance products for that home-building segment and a program operation that places errors and omissions professional liability coverages for title agents. Both of these operations’ revenues were significantly impacted by these national economic trends.
Florida Insurance Overview
Many states have established “Residual Markets”, which are governmental or quasi-governmental insurance facilities that provide coverage to individuals and/or businesses which cannot buy insurance in the private marketplace, i.e., “insurers of last resort”. These facilities can be for any type of risk or exposure; however, the most common are usually automobile or high-risk property coverage. Residual Markets can also be referred to as: FAIR Plans, Windstorm Pools, Joint Underwriting Associations, or may even be given names styled after the private sector like “Citizens Property Insurance Corporation”.
In August 2002, the Florida Legislature created “Citizens Property Insurance Corporation” (“Citizens”), to be the “insurer of last resort” in Florida and therefore charged insurance rates that were higher than the general private insurance marketplace. In each of 2004 and 2005, four major hurricanes made landfall in Florida, and as a result of the significant insurance property losses, the insurance rates increased in 2006. To counter the increased property insurance rates, the State of Florida instructed Citizens to essentially cut their property insurance rates in half beginning in January 2007. By state law, Citizens has guaranteed their rates through January 1, 2009. Therefore, Citizens became the most competitive risk-bearer on commercial habitational coastal property exposures, such as condominiums, apartments, and certain assisted living facilities. Additionally, Citizens became the only insurance market for certain homeowner policies throughout Florida. By the end of 2007, Citizens was the largest single underwriter of coastal property in Florida.
Since Citizens became the main direct competitor against the risk-bearer of our Florida Intercoastal Underwriters (“FIU”) condominium program and the excess and surplus lines insurers represented by our wholesale brokerage segment such as our Hull & Company subsidiary, these programs suffered the largest amount of revenue loss to Citizens during 2007. Citizens’ impact on our Florida Retail Division was less than on our National Program and Wholesale Brokerage Divisions, because to our Retail Offices, Citizens was now simply another risk-bearer with which to write business, although at slightly lower commission rates and a greater difficulty in placing coverage. For 2008, the insurance rates charged by Citizens are expected to be similar to their 2007 rates and therefore, the sequential year impact of Citizens’ rates may not be as significant as they were on our 2007 results.
In the second half of 2007, the standard insurance companies started to become more competitive in the casualty (liability) business, including workers’ compensation business. The rates in the Florida casualty business began to reduce as much as 20%-25% compared with 2006 rates. These competitive rates are likely to continue for at least the first half of 2008.
Current Year Company Overview
For us, 2007 was a year unlike any previous ones. For the first time since we began tracking internal revenue growth rates in 1997, we completed the year with a negative internal growth rate. Last year also consisted of four straight quarters of negative internal growth. Our total commissions and fees decreased $27.9 million or (3.4)% in 2007 and this decrease is primarily attributed to the continued “soft” insurance marketplace in the United States, the governmental involvement in the Florida insurance marketplace and the negative impact of the economy on the home-building industry. Offsetting the negative internal revenue growth was a very successful year of 41 acquisitions (including books of business) with estimated annual revenues of $108.3 million, of which $67.7 million is reflected in our 2007 revenues.
During 2007, we also recorded an $18.7 million gain on the sale of our investment in Rock-Tenn Company, which we owned for over 25 years. Additionally, during the year we recognized $13.5 million in gains on the sale of various books of business (customer accounts). The sales of these accounts were related to individual circumstances in various offices and are not indicative of any expected trends. Finally, we settled an ongoing Internal Revenue Service (“IRS”) examination of our tax years 2004-2006 for the payment of $1.1 million in interest.
5
Business Combinations
Beginning in 1993 through 2007, we acquired 278 insurance intermediary operations, including acquired books of business (customer accounts), that had aggregate estimated annual revenues of $742.3 million for the 12 calendar months immediately preceding the dates of acquisition. Of these, 41 operations were acquired during 2007, with aggregate estimated annual revenues of $108.3 million for the 12 calendar months immediately preceding the dates of acquisitions and 32 operations were acquired during 2006, with aggregate estimated annual revenues of $56.4 million for the 12 calendar months immediately preceding the dates of acquisition. During 2005, 32 operations were acquired with aggregate estimated annual revenues of $125.9 million for the 12 calendar months immediately preceding the dates of acquisition.
See Note 2 to the Consolidated Financial Statements for a summary of our 2007 and 2006 acquisitions.
From January 1, 2008 through February 29, 2008, Brown & Brown acquired the assets and assumed certain liabilities of seven insurance intermediaries, two books of business (customer accounts) and the outstanding stock of one general insurance agency. The aggregate purchase price of these acquisitions was $71,080,000, including $65,918,000 of net cash payments, the issuance of $185,000 in notes payable and the assumption of $4,977,000 of liabilities. See Note 17 to the Consolidated Financial Statements for a summary of our 2008 acquisitions.
SEGMENT INFORMATION
Our business is divided into four reportable operating segments: (1) the Retail Division; (2) the Wholesale Brokerage Division; (3) the National Programs Division; and (4) the Services Division. The Retail Division provides a broad range of insurance products and services to commercial, public entity, professional and individual customers. The Wholesale Brokerage Division markets and sells excess and surplus commercial and personal insurance, and reinsurance, primarily through independent agents and brokers. The National Programs Division is comprised of two units: Professional Programs, which provides professional liability and related package products for certain professionals; and Special Programs, which markets targeted products and services designated for specific industries, trade groups, public entities, and market niches. The Services Division provides clients with third-party claims administration, consulting for the workers’ compensation insurance market, comprehensive medical utilization management services in both workers’ compensation and all-lines liability arenas, and Medicare Secondary Payer statute compliance-related services.
The following table sets forth a summary of (1) the commissions and fees revenue generated by each of our reportable operating segments for 2007, 2006 and 2005, and (2) the percentage of our total commissions and fees revenue represented by each segment for each such period:
| | | | | | | |||||||||||||||||||||
|---|---|---|---|---|---|---|---|---|---|---|---|---|---|---|---|---|---|---|---|---|---|---|---|---|---|---|
| (in thousands, except percentages) | | 2007 | | % | | 2006 | | % | | 2005 | | % | ||||||||||||||
| Retail Division | $ | 548,038 | 59.9 | % | $ | 516,489 | 59.7 | % | $ | 489,566 | 63.1 | % | ||||||||||||||
| Wholesale Brokerage Division | 175,289 | 19.1 | 159,268 | 18.4 | 125,537 | 16.2 | ||||||||||||||||||||
| National Programs Division | 157,008 | 17.2 | 156,996 | 18.2 | 133,147 | 17.2 | ||||||||||||||||||||
| Services Division | 35,505 | 3.9 | 32,561 | 3.8 | 26,565 | 3.4 | ||||||||||||||||||||
| Other | (1,190 | ) | (0.1 | ) | (651 | ) | (0.1 | ) | 728 | 0.1 | ||||||||||||||||
| Total | $ | 914,650 | 100.0 | % | $ | 864,663 | 100.0 | % | $ | 775,543 | 100.0 | % | ||||||||||||||
See Note 16 to the Consolidated Financial Statements and “Management’s Discussion and Analysis of Financial Condition and Results of Operations” for additional segment financial data relating to our business.
Retail Division
As of December 31, 2007, our Retail Division employed 2,926 persons. Our retail insurance agency business provides a broad range of insurance products and services to commercial, public and quasi-public entity, professional and individual customers. The categories of insurance principally sold by us include: property
6
insurance relating to physical damage to property and resultant interruption of business or extra expense caused by fire, windstorm or other perils; casualty insurance relating to legal liabilities, workers’ compensation, commercial and private passenger automobile coverages; and fidelity and surety bonds. We also sell and service group and individual life, accident, disability, health, hospitalization, medical and dental insurance.
No material part of our retail business is attributable to a single customer or a few customers. During 2007, commissions and fees from our largest single Retail Division customer represented less than one percent of the Retail Division’s total commissions and fees revenue.
In connection with the selling and marketing of insurance coverages, we provide a broad range of related services to our customers, such as risk management and loss control surveys and analysis, consultation in connection with placing insurance coverages and claims processing. We believe these services are important factors in securing and retaining customers.
Wholesale Brokerage Division
At December 31, 2007, the Wholesale Brokerage Division employed 1,071 persons. The Wholesale Brokerage Division markets excess and surplus commercial insurance products and services to retail insurance agencies (including our retail offices), and reinsurance products and services to insurance companies throughout the United States. Wholesale Brokerage Division offices represent various U.S. and U.K. surplus lines insurance companies and certain offices are also Lloyd’s of London correspondents. The Wholesale Brokerage Division also represents admitted insurance companies for smaller agencies that do not have access to large insurance company representation. Excess and surplus insurance products include many insurance coverages, including personal lines homeowners, yachts, jewelry, commercial property and casualty, commercial automobile, garage, restaurant, builder’s risk and inland marine lines. Difficult-to-insure general liability and products liability coverages are a specialty, as is excess workers’ compensation coverage. Retail insurance agency business is solicited through mailings and direct contact with retail agency representatives.
In March 2005, we acquired the assets of Hull & Company, Inc. and certain affiliated companies (“Hull”) with estimated annualized revenues of $63.0 million which along with acquisitions of several other larger wholesale brokerage operations, which essentially tripled the Wholesale Brokerage Division’s 2006 and 2005 revenues over its 2004 revenues.
On January 1, 2006, we acquired the assets of Axiom Intermediaries, LLC. (“Axiom”), which specializes in treaty and facultative reinsurance brokerage services. Axiom’s total revenues in 2006 were $11.5 million.
In September 2006, we acquired the assets of Delaware Valley Underwriting Agency, Inc. and certain affiliated companies with estimated annualized revenues of $15.0 million.
In August 2007, we acquired the assets and assumed certain liabilities of The Combined Group, Inc. and certain affiliated companies with estimated annualized revenues of $12.6 million.
National Programs Division
As of December 31, 2007, our National Programs Division employed 661 persons. Our National Programs Division consists of two units: Professional Programs and Special Programs.
Professional Programs. Professional Programs provides professional liability and related package insurance products for certain professionals. Professional Programs tailors insurance products to the needs of a particular professional group; negotiates policy forms, coverages and commission rates with an insurance company; and, in certain cases, secures the formal or informal endorsement of the product by a professional association or sponsoring company. The professional groups serviced by the Professional Programs include dentists, lawyers, optometrists, opticians, insurance agents, financial service representatives, benefit administrators, real estate title agents and escrow agents. The Professional Protector Plan® for Dentists and the Lawyer’s Protector Plan® are marketed and sold primarily through a national network of independent agencies including certain of our retail offices, while certain of the professional liability programs of our CalSurance® and TitlePac® operations are principally marketed and sold directly to our insured customers. Under our agency agreements with the insurance companies that
7
underwrite these programs, we often have authority to bind coverages (subject to established guidelines), to bill and collect premiums and, in some cases, to adjust claims. For the programs that we market through independent agencies, we receive a wholesale commission or “override”, which is then shared with these independent agencies.
Below are brief descriptions of the programs offered to professional groups by the Professional Programs unit of the National Programs Division.
| – | Dentists: The Professional Protector Plan® for Dentists offers comprehensive coverage for dentists, oral surgeons, dental schools and dental students, including practice protection and professional liability. This program, initiated in 1969, is endorsed by a number of state and local dental societies and is offered in 49 states, the District of Columbia, the U.S. Virgin Islands and Puerto Rico. |
| – | Lawyers: The Lawyer’s Protector Plan® (LPP®) was introduced in 1983, 10 years after we began marketing lawyers’ professional liability insurance. This program is presently offered in 43 states, the District of Columbia and Puerto Rico. |
| – | Optometrists and Opticians: The Optometric Protector Plan® (OPP®) and the Optical Services Protector Plan® (OSPP®) were created in 1973 and 1987, respectively, to provide professional liability, package and workers’ compensation coverages exclusively for optometrists and opticians. These programs insure optometrists and opticians nationwide. |
| – | CalSurance®: CalSurance® offers professional liability programs designed for insurance agents, financial advisors, registered representatives, securities broker-dealers, benefit administrators, real estate brokers and real estate title agents. CalSurance® also sells commercial insurance packages directly to customers in certain industry niches including destination resort and luxury hotels, independent pizza restaurants, and others. An important aspect of CalSurance® is Lancer Claims Services, which provides specialty claims administration for insurance companies underwriting CalSurance® product lines. |
| – | TitlePac®: TitlePac® provides professional liability products and services designed for real estate title agents and escrow agents in 47 states and the District of Columbia. |
Special Programs. Special Programs markets targeted products and services to specific industries, trade groups, public and quasi-public entities, and market niches. All of the Special Programs, except for Parcel Insurance Plan® (PIP®), are marketed and sold primarily through independent agents, including certain of our retail offices. Parcel Insurance Plan® markets and sells its insurance product directly to insured customers. Under agency agreements with the insurance companies that underwrite these programs, we often have authority to bind coverages (subject to established guidelines), to bill and collect premiums and, in some cases, to adjust claims.
Below are brief descriptions of the Special Programs:
| – | Florida Intracoastal Underwriters, Limited Company (“FIU”) is a managing general agency that specializes in providing insurance coverage for coastal and inland high-value condominiums and apartments. FIU has developed a specialty reinsurance facility to support the underwriting activities associated with these risks. |
| – | Public Risk Underwriters®, along with our similar offices in Florida and other states, are program administrators offering tailored property and casualty insurance products, risk management consulting, third-party administration and related services designed for municipalities, schools, fire districts, and other public entities. |
| – | Proctor Financial, Inc. (“Proctor”) provides insurance programs and compliance solutions for financial institutions that service mortgage loans. Proctor’s products include lender-placed fire and flood insurance, full insurance outsourcing, mortgage impairment, and blanket equity insurance. Proctor also writes surplus lines property business for its financial institutions clients and acts as a wholesaler for this line of business. |
| – | American Specialty Insurance & Risk Services, Inc. provides insurance and risk management services for clients in professional sports, motor sports, amateur sports, and the entertainment industry. |
| – | Parcel Insurance Plan® (PIP®) is a specialty insurance agency providing insurance coverage to commercial and private shippers for small packages and parcels with insured values of less than $25,000 each. |
8
| – | Professional Risk Specialty Group is a specialty insurance agency providing liability insurance products to various professional groups. |
| – | AFC Insurance, Inc. (“AFC”) is a managing general underwriter, specializing in tailored insurance products for the health and human services industry. AFC works with retail agents in all states and targets home healthcare, group homes for the mentally and physically challenged, and drug and alcohol facilities and programs for the developmentally disabled. |
| – | Acumen Re Management Corporation is a reinsurance underwriting management organization, primarily acting as an outsourced specific excess workers’ compensation facultative reinsurance underwriting facility. |
| – | Commercial Programs serves the insurance needs of certain specialty trade/industry groups. Programs offered include: |
| – | Wholesalers & Distributors Preferred Program®. Introduced in 1997, this program provides property and casualty protection for businesses principally engaged in the wholesale-distribution industry. |
| – | Railroad Protector Plan®. Also introduced in 1997, this program is designed for contractors, manufacturers and other entities that service the needs of the railroad industry. |
| – | Environmental Protector Plan®. Introduced in 1998, this program provides a variety of specialized coverages, primarily to municipal mosquito control districts. |
| – | Food Processors Preferred ProgramSM. This program, introduced in 1998, provides property and casualty insurance protection for businesses involved in the handling and processing of various foods. |
Services Division
At December 31, 2007, our Services Division employed 266 persons and provided the following services: (1) insurance-related services, including comprehensive risk management and third-party administration (“TPA”) services for insurance entities and self-funded or fully-insured workers’ compensation and liability plans; (2) comprehensive medical utilization management services for both workers’ compensation and all-lines liability insurance plans; and (3) Medicare Secondary Payer statute compliance-related services.
The Services Division’s workers’ compensation and liability plan TPA services include claims administration, access to major reinsurance markets, cost containment consulting, services for secondary disability, and subrogation recoveries and risk management services such as loss control. In 2007, our three largest workers’ compensation contracts represented approximately 31.5% of our Services Division’s fees revenue, or approximately 1.2% of our total consolidated commissions and fees revenue. In addition, the Services Division provides managed care services, including medical networks, case management and utilization review services, certified by the American Accreditation Health Care Commission.
Employees
At December 31, 2007, we had 5,047 full-time equivalent employees. We have agreements with our sales employees and certain other employees that include provisions restricting their right to solicit our insured customers and employees after separation from employment with us. The enforceability of such agreements varies from state to state depending upon state statutes, judicial decisions and factual circumstances. The majority of these agreements are at-will and terminable by either party; however, the covenants not to solicit our insured customers and employees generally extend for a period of two years after cessation of employment.
None of our employees is represented by a labor union, and we consider our relations with our employees to be satisfactory.
Competition
The insurance intermediary business is highly competitive, and numerous firms actively compete with us for customers and insurance markets. Competition in the insurance business is largely based on innovation, quality of service and price. There are a number of firms and banks with substantially greater resources and market presence that compete with us in the southeastern United States and elsewhere. This situation is particularly pronounced outside of Florida.
9
A number of insurance companies are engaged in the direct sale of insurance, primarily to individuals, and do not pay commissions to third-party agents and brokers. In addition, the Internet continues to be a source for direct placement of personal lines business. To date, such direct writing has had little effect on our operations, primarily because our Retail Division is commercially, rather than individually, oriented.
In addition, the Gramm-Leach-Bliley Financial Services Modernization Act of 1999 and regulations enacted thereunder permit banks, securities firms and insurance companies to affiliate. As a result, the financial services industry has experienced and may experience further consolidation, which in turn has resulted and could further result in increased competition from diversified financial institutions, including competition for acquisition prospects.
Regulation, Licensing and Agency Contracts
We and/or our designated employees must be licensed to act as agents, brokers or third-party administrators by state regulatory authorities in the states in which we conduct business. Regulations and licensing laws vary by individual state and are often complex.
The applicable licensing laws and regulations in all states are subject to amendment or reinterpretation by state regulatory authorities, and such authorities are vested in most cases with relatively broad discretion as to the granting, revocation, suspension and renewal of licenses. The possibility exists that we and/or our employees could be excluded or temporarily suspended from carrying on some or all of our activities in, or otherwise subjected to penalties by, a particular state.
Available Information
We are subject to the reporting requirements of the Securities Exchange Act of 1934 and its rules and regulations. The Exchange Act requires us to file reports, proxy statements and other information with the Securities and Exchange Commission (“SEC”). We make available free of charge on our website, at www.bbinsurance.com, our annual report on Form 10-K, quarterly reports on Form 10-Q, current reports on Form 8-K, and amendments to those reports filed or furnished pursuant to Section 13(a) or 15(d) of the Securities Exchange Act of 1934, as amended (the “Exchange Act”) and the rules promulgated thereunder, as soon as reasonably practicable after electronically filing or furnishing such material to the SEC. These documents are posted on our Web site atwww.bbinsurance.com — select the “Investor Relations” link and then the “Publications & Filings” link.
Copies of these reports, proxy statements and other information can be read and copied at:
| SEC Public Reference Room 100 F Street NE Washington, D.C. 20549 |
Information on the operation of the Public Reference Room may be obtained by calling the SEC at 1-800-SEC-0330. Also the SEC maintains a Web site that contains reports, proxy statements and other information regarding issuers that file electronically with the SEC. These materials may be obtained electronically by accessing the SEC’s Web site athttp://www.sec.gov.
The charters of the Audit, Compensation and Nominating/Governance Committees of our Board of Directors as well as our Corporate Governance Principles, Code of Business Conduct and Ethics and Code of Ethics — CEO and Senior Financial Officers (including any amendments to, or waiver from, a provision of any of these charters, principles or codes) are also available on our website or upon request. Requests for copies of any of these documents should be directed in writing to Corporate Secretary, Brown & Brown, Inc., 3101 West Martin Luther King Jr. Blvd., Suite 400, Tampa, Florida 33607, or by telephone to (813) 222-4277.
10
ITEM 1A.Risk Factors
As referenced, this Annual Report on Form 10-K includes certain forward-looking statements regarding various matters. The ultimate correctness of those forward-looking statements is dependent upon a number of known and unknown risks and events, and is subject to various uncertainties and other factors that may cause our actual results, performance or achievements to be different from those expressed or implied by those statements. Undue reliance should not be placed on those forward-looking statements. The following important factors, among others, as well as those factors set forth in our other SEC filings from time to time, could affect future results and events, causing results and events to differ materially from those expressed or implied in our forward-looking statements. The risks and uncertainties described below are not the only ones facing Brown & Brown, Inc. and its subsidiaries. Additional risks and uncertainties, not presently known to us or otherwise, may also impair our business operations.
WE CANNOT ACCURATELY FORECAST OUR COMMISSION REVENUES BECAUSE OUR COMMISSIONS DEPEND ON PREMIUM RATES CHARGED BY INSURANCE COMPANIES, WHICH HISTORICALLY HAVE VARIED AND, AS A RESULT, HAVE BEEN DIFFICULT TO PREDICT.
We are primarily engaged in insurance agency and wholesale brokerage activities and derive revenues principally from commissions paid by insurance companies. Commissions are based upon a percentage of premiums paid by customers for insurance products. The amount of such commissions is therefore highly dependent on premium rates charged by insurance companies. We do not determine insurance premiums. Premium rates are determined by insurance companies based on a fluctuating market. Historically, property and casualty premiums have been cyclical in nature and have varied widely based on market conditions. From the mid-1980s through 1999, general premium levels were depressed as a result of the expanded underwriting capacity of insurance companies and increased competition. In many cases, insurance companies lowered commission rates and increased volume requirements. Significant reductions in premium rates occurred during the years 1986 through 1999. As a result of increasing “loss ratios” (the comparison of incurred losses plus loss adjustment expenses against earned premiums) experience by insurance companies through 1999, there was a general increase in premium rates beginning in the first quarter of 2000 and continuing into 2003. During 2004, there was a rapid transition as previously stable or increasing rates fell in most markets. These rate declines were most pronounced in the property and casualty market, with rates falling between 10% and 30% by year-end. Rate declines continued on a moderated basis through 2006, with the exception of premium rates on coastal property, which increased. In addition to significant insurance pricing declines in the State of Florida, the insurance premium rates continued a gradual decline during 2007 in most of the other regions of the United States. One industry segment that was especially hit hard during 2007 was the home-building industry in southern California, and to a lesser extent Nevada, Arizona and Florida. We have a wholesale brokerage operation that focuses on placing property and casualty insurance products for that home-building segment and a program operation that places errors and omissions professional liability coverages for title agents. Both of these operations’ revenues were significantly impacted by these national economic trends.
As traditional risk-bearing insurance companies continue to outsource the production of premium revenue to non-affiliated brokers or agents such as us, those insurance companies may seek to reduce further their expenses by reducing the commission rates payable to those insurance agents or brokers. The reduction of these commission rates, along with general volatility and/or declines in premiums, may significantly affect our profitability. Because we do not determine the timing or extent of premium pricing changes, we cannot accurately forecast our commission revenues, including whether they will significantly decline. As a result, our budgets for future acquisitions, capital expenditures, dividend payments, loan repayments and other expenditures may have to be adjusted to account for unexpected changes in revenues, and any decreases in premium rates may adversely affect the results of our operations.
11
OUR BUSINESS PRACTICES AND COMPENSATION ARRANGEMENTS ARE SUBJECT TO UNCERTAINTY DUE TO INVESTIGATIONS BY GOVERNMENTAL AUTHORITIES AND POTENTIAL RELATED PRIVATE LITIGATION.
The business practices and compensation arrangements of the insurance intermediary industry, including our practices and arrangements, are subject to uncertainty due to investigations by various governmental authorities and a related derivative demand from counsel for a purported shareholder which could result in a purported derivative action based on claimed improprieties in the manner in which we are compensated by insurance companies. The legislatures of various states may adopt new laws addressing contingent commission arrangements, including laws prohibiting such arrangements, and addressing disclosure of such arrangements to insureds. Various state departments of insurance may also adopt new regulations addressing these matters. While it is not possible to predict the outcome of the governmental inquiries and investigations into the insurance industry’s commission payment practices, the derivative demand or the responses by the market and government regulators, any unfavorable resolution of these matters could adversely affect our results of operations, and if such resolution included a material decrease in our profit-sharing contingent commissions, it would be likely to have an adverse effect on our results of operations.
OUR BUSINESS, RESULTS OF OPERATIONS, FINANCIAL CONDITION OR LIQUIDITY MAY BE MATERIALLY ADVERSELY AFFECTED BY ERRORS AND OMISSIONS AND THE OUTCOME OF CERTAIN ACTUAL AND POTENTIAL CLAIMS, LAWSUITS AND PROCEEDINGS.
We may be subject to various actual and potential claims, lawsuits and other proceedings relating principally to alleged errors and omissions in connection with the placement of insurance in the ordinary course of business. Because we often assist clients with matters involving substantial amounts of money, including the placement of insurance and the handling of related claims, errors and omissions claims against us may arise which allege potential liability for all or part of the amounts in question. Claimants may seek large damage awards and these claims may involve potentially significant legal costs. Such claims, lawsuits and other proceedings could, for example, include claims for damages based on allegations that our employees or sub-agents improperly failed to procure coverage, report claims on behalf of clients, provide insurance companies with complete and accurate information relating to the risks being insured or appropriately apply funds that we hold for our clients on a fiduciary basis. We have established provisions against these potential matters which we believe to be adequate in the light of current information and legal advice, and we adjust such provisions from time to time according to developments.
While most of the errors and omissions claims made against us have, subject to our self-insured deductibles, been covered by our professional indemnity insurance, our business, results of operations, financial condition and liquidity may be adversely affected if, in the future, our insurance coverage proves to be inadequate or unavailable or there is an increase in liabilities for which we self-insure. Our ability to obtain professional indemnity insurance in the amounts and with the deductibles we desire in the future may be adversely impacted by general developments in the market for such insurance or our own claims experience. In addition, claims, lawsuits and other proceedings may harm our reputation or divert management resources away from operating our business.
WE DERIVE A SIGNIFICANT PORTION OF OUR COMMISSION REVENUES FROM TWO INSURANCE COMPANIES, THE LOSS OF WHICH COULD RESULT IN ADDITIONAL EXPENSE AND LOSS OF MARKET SHARE.
For the year ended December 31, 2007, approximately 5.3% and 5.3%, respectively, of our total revenues were derived from insurance policies underwritten by two separate insurance companies, respectively. For the year ended December 31, 2006, approximately 5.3% and 4.9%, respectively, of our total revenues were derived from insurance
12
policies underwritten by two separate insurance companies, respectively. For the year ended December 31, 2005, approximately 8.0% and 5.4%, respectively, of our total revenues were derived from insurance policies underwritten by two separate insurance companies, respectively. Should either of these insurance companies seek to terminate their arrangements with us, we believe that other insurance companies are available to underwrite the business, although some additional expense and loss of market share could possibly result. No other insurance company accounts for 5% or more of our total revenues.
BECAUSE OUR BUSINESS IS HIGHLY CONCENTRATED IN CALIFORNIA, FLORIDA, GEORGIA, MICHIGAN, NEW JERSEY, NEW YORK, PENNSYLVANIA, TEXAS AND WASHINGTON, ADVERSE ECONOMIC CONDITIONS OR REGULATORY CHANGES IN THESE STATES COULD ADVERSELY AFFECT OUR FINANCIAL CONDITION.
A significant portion of our business is concentrated in California, Florida, Georgia, Michigan, New Jersey, New York, Pennsylvania, Texas and Washington. For the years ended December 31, 2007, 2006 and December 31, 2005, we derived $677.4 million or 74.1%, $640.0 million, or 74.0%, and $589.7 million, or 76.0%, of our commissions and fees from our operations located in these states, respectively. We believe that these revenues are attributable predominately to clients in these states. We believe the regulatory environment for insurance intermediaries in these states currently is no more restrictive than in other states. The insurance business is a state-regulated industry, and therefore, state legislatures may enact laws that adversely affect the insurance industry. Because our business is concentrated in a few states, we face greater exposure to unfavorable changes in regulatory conditions in those states than insurance intermediaries whose operations are more diversified through a greater number of states. In addition, the occurrence of adverse economic conditions, natural or other disasters, or other circumstances specific to or otherwise significantly impacting these states could adversely affect our financial condition, results of operations and cash flows.
OUR GROWTH STRATEGY DEPENDS IN PART ON THE ACQUISITION OF OTHER INSURANCE INTERMEDARIES, WHICH MAY NOT BE AVAILABLE ON ACCEPTABLE TERMS IN THE FUTURE AND WHICH, IF CONSUMMATED, MAY NOT BE ADVANTAGEOUS TO US.
Our growth strategy includes the acquisition of insurance agencies, brokers and other intermediaries. Our ability to successfully identify suitable acquisition candidates, complete acquisitions, integrate acquired businesses into our operations, and expand into new markets will require us to continue to implement and improve our operations, financial, and management information systems. Integrated, acquired businesses may not achieve levels of revenue, profitability, or productivity comparable to our existing operations, or otherwise perform as expected. In addition, we compete for acquisition and expansion opportunities with entities that have substantially greater resources than we do. Acquisitions also involve a number of special risks, such as: diversion of management’s attention; difficulties in the integration of acquired operations and retention of personnel; entry into unfamiliar markets; unanticipated problems or legal liabilities; and tax and accounting issues, some or all of which could have a material adverse effect on the results of our operations, our financial condition and cash flows.
WE ARE EXPANDING OUR OPERATIONS INTERNATIONALLY, WHICH MAY RESULT IN A NUMBER OF ADDITIONAL RISKS AND REQUIRE MORE MANAGEMENT TIME AND EXPENSE THAN OUR DOMESTIC OPERATIONS TO ACHIEVE PROFITABLITY.
We are planning to expand our operations to the United Kingdom, which will be the first time we’ve operated outside the United States. In addition, we intend to continue to consider additional international expansion opportunities. Our international operations may be subject to a number of risks, including:
| • | difficulties in staffing and managing foreign operations; |
| • | less flexible employee relationships, which limit our ability to prohibit employees from competing with us after their employment, and may make it difficult and expensive to terminate their employment; |
| • | political and economic instability (including acts of terrorism and outbreaks of war); |
| • | coordinating our communications and logistics across geographic distances and multiple time zones; |
13
| • | unexpected changes in regulatory requirements and laws; |
| • | adverse trade policies, and adverse changes to any of the policies of either the U.S. or any of the foreign jurisdictions in which we operate; |
| • | adverse changes in tax rates; |
| • | legal or political constraints on our ability to maintain or increase prices; |
| • | governmental restrictions on the transfer of funds to us from our operations outside the United States; and |
| • | burdens of complying with a wide variety of labor practices and foreign laws, including those relating to export and import duties, environmental policies and privacy issues. |
OUR CURRENT MARKET SHARE MAY DECREASE AS A RESULT OF INCREASED COMPETITION FROM INSURANCE COMPANIES AND THE FINANCIAL SERVICES INDUSTRY.
The insurance intermediaries business is highly competitive and we actively compete with numerous firms for clients and insurance companies, many of which have relationships with insurance companies or have a significant presence in niche insurance markets that may give them an advantage over us. Because relationships between insurance intermediaries and insurance companies or clients are often local or regional in nature, this potential competitive disadvantage is particularly pronounced outside of Florida. A number of insurance companies are engaged in the direct sale of insurance, primarily to individuals, and do not pay commissions to agents and brokers. In addition, as and to the extent that banks, securities firms and insurance companies affiliate, the financial services industry may experience further consolidation, and we therefore may experience increased competition from insurance companies and the financial services industry, as a growing number of larger financial institutions increasingly, and aggressively, offer a wider variety of financial services, including insurance, than we currently offer.
PROPOSED TORT REFORM LEGISLATION, IF ENACTED, COULD DECREASE DEMAND FOR LIABILITY INSURANCE, THEREBY REDUCING OUR COMMISSION REVENUES.
Legislation concerning tort reform has been considered, from time to time, in the United States Congress and in several states legislatures. Among the provisions considered for inclusion in such legislation have been limitations on damage awards, including punitive damages, and various restrictions applicable to class action lawsuits. Enactment of these or similar provisions by Congress, or by states in which we sell insurance, could result in a reduction in the demand for liability insurance policies or a decrease in policy limits of such policies sold, thereby reducing our commission revenues.
WE COMPETE IN A HIGHLY-REGULATED INDUSTRY, WHICH MAY RESULT IN INCREASED EXPENSES OR RESTRICTIONS ON OUR OPERATIONS.
We conduct business in most states and are subject to comprehensive regulation and supervision by government agencies in the states in which we do business. The primary purpose of such regulation and supervision is to provide safeguards for policyholders rather than to protect the interests of our stockholders. The laws of the various state jurisdictions establish supervisory agencies with broad administrative powers with respect to, among other things, licensing of entities to transact business, licensing of agents, admittance of assets, regulating premium rates, approving policy forms, regulating unfair trade and claims practices, establishing reserve requirements and solvency standards, requiring participation in guarantee funds and shared market mechanisms, and restricting payment of dividends. Also, in response to perceived excessive cost or inadequacy of available insurance, states have from time to time created state insurance funds and assigned risk pools, which compete directly, on a subsidized basis, with private insurance providers. We act as agents and brokers for such state insurance funds and assigned risk pools in California and certain other states. These state funds and pools could choose to reduce the sales or brokerage commissions we receive. Any such reductions, in a state in which we have substantial operations, such as Florida, California or New York, could substantially affect the profitability of our operations in such state, or cause us to change our marketing focus. Further, state insurance regulators and the National Association of Insurance Commissioners continually re-examine existing laws and regulations, and such re-examination may result in the
14
enactment of insurance-related laws and regulations, or the issuance of interpretations thereof, that adversely affect our business. Although we believe that we are in compliance in all material respects with applicable local, state and federal laws, rules and regulations, there can be no assurance that more restrictive laws, rules or regulations will not be adopted in the future that could make compliance more difficult or expensive. Specifically, recently adopted federal financial services modernization legislation could lead to additional federal regulation of the insurance industry in the coming years, which could result in increased expenses or restrictions on our operations.
PROFIT-SHARING CONTINGENT COMMISSIONS AND OVERRIDE COMMISSIONS PAID BY INSURANCE COMPANIES ARE LESS PREDICTABLE THAN USUAL, WHICH IMPAIRS OUR ABILITY TO PREDICT THE AMOUNT OF SUCH COMMISSIONS THAT WE WILL RECEIVE.
We derive a portion of our revenues from profit-sharing contingent commissions and override commissions paid by insurance companies. Profit-sharing contingent commissions are special revenue-sharing commissions paid by insurance companies based upon the profitability, volume and/or growth of the business placed with such companies during the prior year. We primarily receive these commissions in the first and second quarters of each year. The aggregate of these commissions generally have accounted for 5.2% to 6.6% of the previous year’s total annual revenues over the last three years. Due to the inherent uncertainty of loss in our industry and changes in underwriting criteria due in part to the high loss ratios experienced by insurance companies, we cannot predict the payment of these profit-sharing contingent commissions. Further, we have no control over the ability of insurance companies to estimate loss reserves, which affects our ability to make profit-sharing calculations. Override commissions are paid by insurance companies based on the volume of business that we place with them and are generally paid over the course of the year. Because profit-sharing contingent commissions and override commissions affect our revenues, any decrease in their payment to us could adversely affect the results of our operations and our financial condition.
WE HAVE NOT DETERMINED THE AMOUNT OF RESOURCES AND THE TIME THAT WILL BE NECESSARY TO ADEQUATELY RESPOND TO RAPID TECHNOLOGICAL CHANGE IN OUR INDUSTRY, WHICH MAY ADVERSELY AFFECT OUR BUSINESS AND OPERATING RESULTS.
Frequent technological changes, new products and services and evolving industry standards are all influencing the insurance business. The Internet, for example, is increasingly used to securely transmit benefits and related information to clients and to facilitate business-to-business information exchange and transactions. We believe that the development and implementation of new technologies will require additional investment of our capital resources in the future. We have not determined, however, the amount of resources and the time that this development and implementation may require, which may result in short-term, unexpected interruptions to our business, or may result in a competitive disadvantage in price and/or efficiency, as we endeavor to develop or implement new technologies.
QUARTERLY AND ANNUAL VARIATIONS IN OUR COMMISSIONS THAT RESULT FROM THE TIMING OF POLICY RENEWALS AND THE NET EFFECT OF NEW AND LOST BUSINESS PRODUCTION MAY HAVE UNEXPECTED EFFECTS ON OUR RESULTS OF OPERATIONS.
Our commission income (including profit-sharing contingent commissions and override commissions but excluding fees), can vary quarterly or annually due to the timing of policy renewals and the net effect of new and lost business production. The factors that cause these variations are not within our control. Specifically, customers’ demand for insurance products can influence the timing of renewals, new business and lost business (which includes policies that are not renewed), and cancellations. In addition, as discussed, we rely on insurance companies for the payment of certain commissions. Because these payments are processed internally by these insurance companies, we may not receive a payment that is otherwise expected from a particular insurance company in one of our quarters or years until after the end of that period, which can adversely affect our ability to budget for significant future expenditures. Quarterly and annual fluctuations in revenues based on increases and decreases associated with the timing of policy renewals may have an adverse effect on our financial condition, results of operations and cash flows.
15
WE MAY EXPERIENCE VOLATILITY IN OUR STOCK PRICE THAT COULD AFFECT YOUR INVESTMENT.
The market price of our common stock may be subject to significant fluctuations in response to various factors, including: quarterly fluctuations in our operating results; changes in securities analysts’ estimates of our future earnings; and our loss of significant customers or significant business developments relating to us or our competitors. Our common stock’s market price also may be affected by our ability to meet stock analysts’ earnings and other expectations and any failure to meet such expectations, even if minor, could cause the market price of our common stock to decline. In addition, stock markets have generally experienced a high level of price and volume volatility, and the market prices of equity securities of many listed companies have experienced wide price fluctuations not necessarily related to the operating performance of such companies. These broad market fluctuations may adversely affect our common stock’s market price. In the past, securities class action lawsuits frequently have been instituted against companies following periods of volatility in the market price of such companies’ securities. If any such litigation is instigated against us, it could result in substantial costs and a diversion of management’s attention and resources, which could have a material adverse effect on our business, results of operations, financial condition and cash flows.
THE LOSS OF ANY MEMBER OF OUR SENIOR MANAGEMENT TEAM, PARTICULARLY OUR CHAIRMAN AND CHIEF EXECUTIVE OFFICER, J. HYATT BROWN, COULD ADVERSELY AFFECT OUR FINANCIAL CONDITION AND FUTURE OPERATING RESULTS.
We believe that our future success partly depends on our ability to attract and retain experienced personnel, including senior management, brokers and other key personnel. The loss of any of our senior managers or other key personnel, or our inability to identify, recruit and retain such personnel, could materially and adversely affect our business, operating results and financial condition. Although we operate with a decentralized management system, the loss of the services of J. Hyatt Brown, our Chairman and Chief Executive Officer, who beneficially owned approximately 15.3% of our outstanding common stock as of February 23, 2008, and is key to the development and implementation of our business strategy, could adversely affect our financial condition and future operating results. We maintain a $5 million “key man” life insurance policy with respect to Mr. Brown. We also maintain a $20 million insurance policy on the lives of Mr. Brown and his wife. Under the terms of an agreement with Mr. and Mrs. Brown, at the option of the Brown estate, we will purchase, upon the death of the later to die of Mr. Brown or his wife, shares of our common stock owned by Mr. and Mrs. Brown up to the maximum number that would exhaust the proceeds of the policy.
CERTAIN OF OUR EXISTING STOCKHOLDERS HAVE SIGNIFICANT CONTROL OF THE COMPANY.
At February 23, 2008, our executive officers, directors and certain of their family members collectively beneficially owned approximately 20.5% of our outstanding common stock, of which J. Hyatt Brown, our Chairman and Chief Executive Officer, and his family members, which include his sons Powell Brown, our President, and Barrett Brown, also an employee of the Company, beneficially owned approximately 17%. As a result, our executive officers, directors and certain of their family members have significant influence over (1) the election of our Board of Directors, (2) the approval or disapproval of any other matters requiring stockholder approval, and (3) the affairs and policies of Brown & Brown.
CHANGES IN THE SECURITIES LAWS AND REGULATIONS HAVE INCREASED AND MAY CONTINUE TO INCREASE OUR COSTS.
The Sarbanes-Oxley Act of 2002 has required changes in some of our corporate governance, securities disclosure and compliance practices. In response to the requirements of that Act, the Securities and Exchange Commission (“SEC”) and the New York Stock Exchange have promulgated new rules on a variety of subjects. Compliance with these new rules has increased our legal and financial and accounting costs, and we expect these increased costs to continue for the foreseeable future. These developments may make it more difficult and more expensive for us to obtain director and officer liability insurance, and we may be forced to accept reduced coverage or incur substantially higher costs to obtain coverage. Likewise, these developments may make it more difficult for us to attract and retain qualified members of our Board of Directors or qualified executive officers.
16
DUE TO INHERENT LIMITATIONS, THERE CAN BE NO ASSURANCE THAT OUR SYSTEM OF DISCLOSURE AND INTERNAL CONTROLS AND PROCEDURES WILL BE SUCCESSFUL IN PREVENTING ALL ERRORS OR FRAUD, OR IN INFORMING MANAGEMENT OF ALL MATERIAL INFORMATION IN A TIMELY MANNER.
Our management, including our Chief Executive Officer and Chief Financial Officer, does not expect that our disclosure controls and internal controls and procedures will prevent all error and all fraud. A control system, no matter how well conceived and operated, can provide only reasonable, not absolute, assurance that the objectives of the control system are met. Further, the design of a control system reflects that there are resource constraints, and the benefits of controls must be considered relative to their costs. Because of the inherent limitations in all control systems, no evaluation of controls can provide absolute assurance that all control issues and instances of fraud, if any, within the company have been detected. These inherent limitations include the realities that judgments in decision-making can be faulty and that breakdowns can occur simply because of error or mistake. Additionally, controls can be circumvented by the individual acts of some persons, by collusion of two or more people, or by management override of a control.
The design of any system of controls also is based in part upon certain assumptions about the likelihood of future events, and there can be no assurance that any design will succeed in achieving its stated goals under all potential future conditions; over time, a control may become inadequate because of changes in conditions, or the degree of compliance with the policies or procedures may deteriorate. Because of the inherent limitations in a cost-effective control system, misstatements due to error or fraud may occur and may not be detected.
IF WE RECEIVE OTHER THAN AN UNQUALIFIED OPINION ON THE ADEQUACY OF OUR INTERNAL CONTROL OVER FINANCIAL REPORTING AS OF DECEMBER 31, 2008 AND FUTURE YEAR-ENDS AS REQUIRED BY SECTION 404 OF THE SARBANES-OXLEY ACT OF 2002, INVESTORS COULD LOSE CONFIDENCE IN THE RELIABILITY OF OUR FINANCIAL STATEMENTS, WHICH COULD RESULT IN A DECREASE IN THE VALUE OF YOUR SHARES.
As directed by Section 404 of the Sarbanes-Oxley Act of 2002, the SEC adopted rules requiring public companies to include an annual report on internal control over financial reporting on Form 10-K that contains an assessment by management of the effectiveness of our internal control over financial reporting. While we continuously conduct a rigorous review of our internal control over financial reporting in order to assure compliance with the Section 404 requirements, if our independent auditors interpret the Section 404 requirements and the related rules and regulations differently than we do or if our independent auditors are not satisfied with our internal control over financial reporting or with the level at which it is documented, operated or reviewed, they may issue a report other than an unqualified opinion. A report other than an unqualified opinion could result in an adverse reaction in the financial markets due to a loss of confidence in the reliability of our financial statements.
THERE ARE INHERENT UNCERTAINTIES INVOLVED IN ESTIMATES, JUDGMENTS AND ASSUMPTIONS USED IN THE PREPARATION OF FINANCIAL STATEMENTS IN ACCORDANCE WITH GAAP IN THE UNITED STATES OF AMERICA. ANY CHANGES IN ESTIMATES, JUDGMENTS AND ASSUMPTIONS COULD HAVE A MATERIAL ADVERSE EFFECT ON OUR BUSINESS, FINANCIAL POSITION AND RESULTS OF OPERATIONS.
The consolidated and condensed Consolidated Financial Statements included in the periodic reports we file with the Securities and Exchange Commission are prepared in accordance with accounting principles generally accepted in the United States of America (“GAAP”). The preparation of financial statements in accordance with GAAP involves making estimates, judgments and assumptions that affect reported amounts of assets (including intangible assets), liabilities and related reserves, revenues, expenses and income. Estimates, judgments and assumptions are inherently subject to change in the future, and any such changes could result in corresponding changes to the amounts of assets, liabilities, revenues, expenses and income, and could have a material adverse effect on our financial position, results of operations and cash flows.
17
ITEM 1B.Unresolved Staff Comments.
None.
ITEM 2.Properties.
We lease our executive offices, which are located at 220 South Ridgewood Avenue, Daytona Beach, Florida 32114, and 3101 West Martin Luther King Jr. Boulevard., Suite 400, Tampa, Florida 33607. We lease offices at each of our 198 locations with the exception of Dansville and Jamestown, New York where we own the buildings in which our offices are located. In addition, we own a building in Loreauville, Louisiana where we no longer have an office, as well as a parcel of undeveloped property outside of Lafayette, Louisiana. There are no outstanding mortgages on our owned properties. Our operating leases expire on various dates. These leases generally contain renewal options and rent escalation clauses based on increases in the lessors’ operating expenses and other charges. We expect that most leases will be renewed or replaced upon expiration. We believe that our facilities are suitable and adequate for present purposes, and that the productive capacity in such facilities is substantially being utilized. From time to time, we may have unused space and seek to sublet such space to third parties, depending on the demand for office space in the locations involved. In the future, we may need to purchase, build or lease additional facilities to meet the requirements projected in our long-term business plan. See Note 13 to the Consolidated Financial Statements for additional information on our lease commitments.
ITEM 3.Legal Proceedings.
See Note 13 to the Consolidated Financial Statements for information regarding our legal proceedings.
ITEM 4.Submission of Matters to a Vote of Security Holders.
No matters were submitted to a vote of security holders during our fourth quarter ended December 31, 2007.
18
PART II
ITEM 5.Market for Registrant’s Common Equity, Related Stockholder Matters and Issuer Purchases of Equity Securities.
Our common stock is listed on the New York Stock Exchange (“NYSE”) under the symbol “BRO”. The table below sets forth, for the quarterly periods indicated, the intra-day high and low sales prices for our common stock as reported on the NYSE Composite Tape and dividends declared on our common stock. All per-share amounts have been restated to give effect to the two-for-one common stock split effected on November 28, 2005.
| | High | | Low | | Cash Dividends Per Common Share | |||||||||
|---|---|---|---|---|---|---|---|---|---|---|---|---|---|---|
2006 | ||||||||||||||
| First Quarter | $ | 33.23 | $ | 27.86 | $ | 0.050 | ||||||||
| Second Quarter | $ | 35.25 | $ | 28.15 | $ | 0.050 | ||||||||
| Third Quarter | $ | 32.50 | $ | 27.06 | $ | 0.050 | ||||||||
| Fourth Quarter | $ | 30.77 | $ | 28.00 | $ | 0.060 | ||||||||
2007 | ||||||||||||||
| First Quarter | $ | 29.02 | $ | 26.72 | $ | 0.060 | ||||||||
| Second Quarter | $ | 28.59 | $ | 25.03 | $ | 0.060 | ||||||||
| Third Quarter | $ | 29.15 | $ | 24.65 | $ | 0.060 | ||||||||
| Fourth Quarter | $ | 27.71 | $ | 23.10 | $ | 0.070 | ||||||||
On February 15, 2008, there were 140,726,472 shares of our common stock outstanding, held by approximately 1,121 shareholders of record.
We intend to continue to pay quarterly dividends, subject to continued capital availability and determination by our Board of Directors that cash dividends continue to be in the best interests of our stockholders. Our dividend policy may be affected by, among other items, our views on potential future capital requirements, including those relating to creation and expansion of sales distribution channels and investments and acquisitions, legal risks, stock repurchase programs and challenges to our business model.
Equity Compensation Plan Information
The following table sets forth information as of December 31, 2007, with respect to compensation plans under which the Company’s equity securities are authorized for issuance:
| Plan Category | Number of Securities to be issued upon exercise of outstanding options, warrants and rights | Weighted-average exercise price of outstanding options, warrants and rights | Number of securities remaining available for future issuance under equity compensation plans | |||||||||||
|---|---|---|---|---|---|---|---|---|---|---|---|---|---|---|
| Equity compensation plans approved by shareholders | 1,253,468 | $ | 12.49 | 14,333,146 | ||||||||||
| Equity compensation plans not approved by shareholders | — | — | — | |||||||||||
| Total | 1,253,468 | $ | 12.49 | 14,333,146 | ||||||||||
Sales of Unregistered Securities
We made no sales of unregistered securities during 2007.
Issuer Purchases of Equity Securities
We did not purchase any shares of Brown & Brown, Inc. common stock during the fourth quarter of 2007.
19
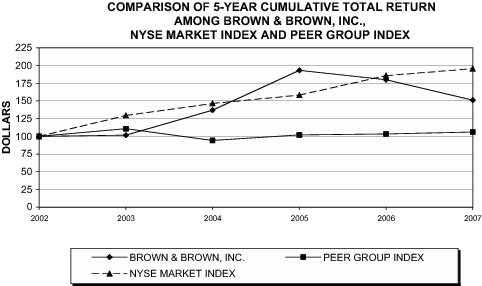
PERFORMANCE GRAPH
The following graph is a comparison of five-year cumulative total stockholder returns for our common stock as compared with the cumulative total stockholder return for the Standard & Poor’s 500 Index, and a group of peer insurance broker and agency companies (Aon Corporation, Arthur J. Gallagher & Co, Hilb, Rogal and Hobbs Company, and Marsh & McLennan Companies, Inc.). The returns of each company have been weighted according to such companies’ respective stock market capitalizations as of December 31, 2002 for the purposes of arriving at a peer group average. The total return calculations are based upon an assumed $100 investment on December 31, 2002, with all dividends reinvested.
| FISCAL YEAR ENDING | |||||||||||||||||||||||||||
|---|---|---|---|---|---|---|---|---|---|---|---|---|---|---|---|---|---|---|---|---|---|---|---|---|---|---|---|
| COMPANY/INDEX/MARKET | 12/31/2002 | 12/31/2003 | 12/31/2004 | 12/30/2005 | 12/29/2006 | 12/31/2007 | |||||||||||||||||||||
| Brown & Brown Inc | 100.00 | 101.68 | 136.78 | 193.26 | 179.78 | 151.19 | |||||||||||||||||||||
| Customer Selected Stock List | 100.00 | 110.96 | 94.31 | 101.93 | 103.31 | 106.16 | |||||||||||||||||||||
| NYSE Market Index | 100.00 | 129.55 | 146.29 | 158.37 | 185.55 | 195.46 | |||||||||||||||||||||
We caution that the stock price performance shown in the graph should not be considered indicative of potential future stock price performance.
20
ITEM 6.Selected Financial Data.
The following selected Consolidated Financial Data for each of the five fiscal years in the period ended December 31, 2007 have been derived from our Consolidated Financial Statements. Such data should be read in conjunction with Management’s Discussion and Analysis of Financial Condition and Results of Operations in Item 7 of Part II of this Annual Report and with our Consolidated Financial Statements and related Notes thereto in Item 8 of Part II of this Annual Report.
| (in thousands, except per share data, number of employees and percentages)(1) | Year Ended December 31, | ||||||||||||||||||||||
|---|---|---|---|---|---|---|---|---|---|---|---|---|---|---|---|---|---|---|---|---|---|---|---|
| 2007 | | 2006 | | 2005 | | 2004 | | 2003 | |||||||||||||||
REVENUES | |||||||||||||||||||||||
Commissions & fees(2) | $ | 914,650 | $ | 864,663 | $ | 775,543 | $ | 638,267 | $ | 545,287 | |||||||||||||
| Investment income | 30,494 | 11,479 | 6,578 | 2,715 | 1,428 | ||||||||||||||||||
| Other income, net | 14,523 | 1,862 | 3,686 | 5,952 | 4,325 | ||||||||||||||||||
| Total revenues | 959,667 | 878,004 | 785,807 | 646,934 | 551,040 | ||||||||||||||||||
EXPENSES | |||||||||||||||||||||||
| Employee compensation and benefits | �� | 444,101 | 404,891 | 374,943 | 314,221 | 268,372 | |||||||||||||||||
| Non-cash stock-based compensation | 5,667 | 5,416 | 3,337 | 2,625 | 2,272 | ||||||||||||||||||
| Other operating expenses | 131,371 | 126,492 | 105,622 | 84,927 | 74,617 | ||||||||||||||||||
| Amortization | 40,436 | 36,498 | 33,245 | 22,146 | 17,470 | ||||||||||||||||||
| Depreciation | 12,763 | 11,309 | 10,061 | 8,910 | 8,203 | ||||||||||||||||||
| Interest | 13,802 | 13,357 | 14,469 | 7,156 | 3,624 | ||||||||||||||||||
| Total expenses | 648,140 | 597,963 | 541,677 | 439,985 | 374,558 | ||||||||||||||||||
| Income before income taxes | 311,527 | 280,041 | 244,130 | 206,949 | 176,482 | ||||||||||||||||||
| Income taxes | 120,568 | 107,691 | 93,579 | 78,106 | 66,160 | ||||||||||||||||||
| Net income | $ | 190,959 | $ | 172,350 | $ | 150,551 | $ | 128,843 | $ | 110,322 | |||||||||||||
EARNINGS PER SHARE INFORMATION | |||||||||||||||||||||||
| Net income per share — diluted | $ | 1.35 | $ | 1.22 | $ | 1.08 | $ | 0.93 | $ | 0.80 | |||||||||||||
| Weighted average number of shares outstanding — diluted | 141,257 | 141,020 | 139,776 | 138,888 | 137,794 | ||||||||||||||||||
| Dividends declared per share | $ | 0.2500 | $ | 0.2100 | $ | 0.1700 | $ | 0.1450 | $ | 0.1213 | |||||||||||||
YEAR-END FINANCIAL POSITION | |||||||||||||||||||||||
| Total assets | $ | 1,960,659 | $ | 1,807,952 | $ | 1,608,660 | $ | 1,249,517 | $ | 865,854 | |||||||||||||
| Long-term debt | $ | 227,707 | $ | 226,252 | $ | 214,179 | $ | 227,063 | $ | 41,107 | |||||||||||||
Shareholders’ equity(3) | $ | 1,097,458 | $ | 929,345 | $ | 764,344 | $ | 624,325 | $ | 498,035 | |||||||||||||
| Total shares outstanding | 140,673 | 140,016 | 139,383 | 138,318 | 137,122 | ||||||||||||||||||
OTHER INFORMATION | |||||||||||||||||||||||
| Number of full-time equivalent employees | 5,047 | 4,733 | 4,540 | 3,960 | 3,517 | ||||||||||||||||||
| Revenue per average number of employees | $ | 196,251 | $ | 189,368 | $ | 184,896 | $ | 173,046 | $ | 159,699 | |||||||||||||
| Book value per share at year-end | $ | 7.80 | $ | 6.64 | $ | 5.48 | $ | 4.51 | $ | 3.63 | |||||||||||||
| Stock price at year-end | $ | 23.50 | $ | 28.21 | $ | 30.54 | $ | 21.78 | $ | 16.31 | |||||||||||||
| Stock price earnings multiple at year-end | 17.41 | 23.12 | 28.35 | 23.41 | 20.38 | ||||||||||||||||||
| Return on beginning shareholders’ equity | 21 | % | 23 | % | 24 | % | 26 | % | 28 | % | |||||||||||||
| (1) | All share and per share information has been restated to give effect to a two-for-one common stock split that became effective November 28, 2005. |
| (2) | See Note 2 to the Consolidated Financial Statements for information regarding business combination transactions which impact the comparability of this information. |
| (3) | Shareholders’ equity as of December 31, 2007, 2006, 2005, 2004 and 2003 included net increases of $13,000, $9,144,000, $4,446,000, $4,467,000 and $4,227,000, respectively, as a result of the Company’s applications of Statement of Financial Accounting Standards (“SFAS”) 115, “Accounting for Certain Investments in Debt and Equity Securities,” and SFAS 133, “Accounting for Derivatives Instruments and Hedging Activities.” |
21
ITEM 7.Management’s Discussion and Analysis of Financial Condition and Results of Operations.
General
The following discussion should be read in conjunction with our Consolidated Financial Statements and the related Notes to those Consolidated Financial Statements, included elsewhere in this Annual Report. All share and per share information has been restated to give effect to a two-for-one common stock split that became effective November 28, 2005.
We are a diversified insurance agency, wholesale brokerage and services organization headquartered in Daytona Beach and Tampa, Florida. Since 1993, our stated corporate objective has been to increase our net income per share by at least 15% every year. We have increased revenues from $95.6 million in 1993 (as originally stated, without giving effect to any subsequent acquisitions accounted for under the pooling-of-interests method of accounting) to $959.7 million in 2007, a compound annual growth rate of 17.9%. In the same period, we increased net income from $8.0 million (as originally stated, without giving effect to any subsequent acquisitions accounted for under the pooling-of-interests method of accounting) to $191.0 million in 2007, a compound annual growth rate of 25.4%. Since 1993, excluding the historical impact of poolings, our pre-tax margins (income before income taxes and minority interest divided by total revenues) improved in all but one year, and in that year, the pre-tax margin was essentially flat. These improvements have resulted primarily from net new business growth (new business production offset by lost business), revenues generated by acquisitions, continued operating efficiencies and for 2007, the sale of our investment in Rock-Tenn Company. Unlike our prior year’s results, our revenue growth in 2007 was driven primarily by the acquisition of 41 agency entities and several books of business (customer accounts) generating total annualized revenues of approximately $108.3 million.
Our commissions and fees revenue is comprised of commissions paid by insurance companies and fees paid directly by customers. Commission revenues generally represent a percentage of the premium paid by the insured and are materially affected by fluctuations in both premium rate levels charged by insurance companies and the insureds’ underlying “insurable exposure units,” which are units that insurance companies use to measure or express insurance exposed to risk (such as property values, sales and payroll levels) so as to determine what premium to charge the insured. These premium rates are established by insurance companies based upon many factors, including reinsurance rates paid by insurance carriers, none of which we control.
Beginning in 1986 and continuing through 1999, commission revenues were adversely influenced by a consistent decline in premium rates resulting from intense competition among property and casualty insurance companies for market share. This condition of a prevailing decline in premium rates, commonly referred to as a “soft market,” generally resulted in flat to reduced commissions on renewal business. The effect of this softness in rates on our commission revenues was somewhat offset by our acquisitions and net new business production. As a result of increasing “loss ratios” (the comparison of incurred losses plus adjustment expenses against earned premiums) of insurance companies through 1999, there was a general increase in premium rates beginning in the first quarter of 2000 and continuing into 2003. During 2003, the increases in premium rates began to decline, and in certain lines of insurance, premium rates decreased.
In 2004, as general premium rates continued to moderate, the insurance industry experienced the worst hurricane season since 1992 (when Hurricane Andrew hit south Florida). The insured losses from the 2004 hurricane season were absorbed relatively easily by the insurance industry and the general insurance premium rates continued to soften during 2005. During the third quarter of 2005, the insurance industry experienced the worst hurricane season ever recorded. As a result of the significant losses incurred by the insurance carriers as the result of these hurricanes, the insurance premium rates in 2006 increased on coastal property, primarily in the southeastern region of the United States. In the other regions of the United States, the insurance premium rates, in general, declined during 2006.
In addition to significant insurance pricing declines in the State of Florida, as previously discussed, the insurance premium rates continued a gradual decline during 2007 in most of the other regions of the United States. One industry segment that was especially hit hard during 2007 was the home building industry in Southern California, and to a lesser extent Nevada, Arizona and Florida. We have a wholesale brokerage operation that focus on placing property and casualty insurance products for that home building segment and a program operation that places errors and omissions professional liability coverages for title agents. Both of these operations’ revenues were negatively impacted by these national economic trends.
22
The volume of business from new and existing insured customers, fluctuations in insurable exposure units and changes in general economic and competitive conditions further impact our revenues. For example, the increasing costs of litigation settlements and awards have caused some customers to seek higher levels of insurance coverage. Conversely, level rates of inflation or general declines in economic activity could limit increases in the values of insurable exposure units. Historically, our revenues have continued to grow as a result of an intense focus on net new business growth and acquisitions, however 2007 was highlighted by very substantial governmental involvement in the Florida insurance marketplace that resulted in a substantial loss of revenues (see the “Business” section of this Annual Report on Form 10-K for further discussion of Citizens and its effect on our results of operations). We anticipate that results of operations will continue to be influenced by these competitive and economic conditions in 2007.
We also earn “profit-sharing contingent commissions,” which are profit-sharing commissions based primarily on underwriting results, but may also reflect considerations for volume, growth and/or retention. These commissions are primarily received in the first and second quarters of each year, based on underwriting results and other aforementioned considerations for the prior year(s). Over the last three years profit-sharing contingent commissions have averaged approximately 5.8% of the previous year’s total commissions and fees revenue. Profit-sharing contingent commissions are primarily included in our total commissions and fees in the Consolidated Statements of Income in the year received. The term “core commissions and fees” excludes profit-sharing contingent commissions and therefore represents the revenues earned directly from specific insurance policies sold, and specific fee-based services rendered. Recently, three national insurance companies announced the replacement of the current loss-ratio based profit-sharing contingent commission calculation with a more guaranteed fixed-based methodology, referred to as “Guaranteed Supplemental Commissions” (“GSC”). Since these new GSC are not subject to the uncertainty of loss-ratios, they are accrued throughout the year based on actual premiums written. As of December 31, 2007, $6.6 million was accrued for GSC earned during 2007, but which will not be collected until the first quarter of 2008.
Fee revenues are generated primarily by: (1) our Services Division, which provides insurance-related services, including third-party claims administration and comprehensive medical utilization management services in both the workers’ compensation and all-lines liability arenas, as well as Medicare set-aside services, and (2) our Wholesale Brokerage and National Program Divisions which earn fees primarily for the issuing of insurance policies on behalf of insurance carriers. In each of the past three years, fee revenues have increased as a percentage of our total commissions and fees, from 13.6% in 2005 to 14.3% in 2007.
Investment income, historically, consists primarily of interest earnings on premiums and advance premiums collected and held in a fiduciary capacity before being remitted to insurance companies. Our policy is to invest available funds in high-quality, short-term fixed income investment securities. Investment income also includes gains and losses realized from the sale of investments. In 2007, we sold our investment in Rock-Tenn Company which we have owned for over 25 years, for a net gain of $18.7 million.
Acquisitions
During 2007, we acquired the assets and assumed certain liabilities of 38 insurance intermediary operations, the stock of three insurance intermediaries and several books of business (customer accounts). The aggregate purchase price was $241.4 million, including $207.9 million of net cash payments, the issuance of $13.0 million in notes payable and the assumption of $20.5 million of liabilities. These acquisitions had estimated aggregate annualized revenues of $108.3 million.
During 2006, we acquired the assets and assumed certain liabilities of 32 insurance intermediary operations and several books of business (customer accounts). The aggregate purchase price was $155.9 million, including $138.7 million of net cash payments, the issuance of $3.7 million in notes payable and the assumption of $13.5 million of liabilities. These acquisitions had estimated aggregate annualized revenues of $56.4 million.
During 2005, we acquired the assets and assumed certain liabilities of 32 insurance intermediary operations and several books of business (customer accounts). The aggregate purchase price was $288.6 million, including $244.0 million of net cash payments, the issuance of $38.1 million in notes payable and the assumption of $6.5 million of liabilities. These acquisitions had estimated aggregate annualized revenues of $125.9 million.
23
Critical Accounting Policies
Our Consolidated Financial Statements are prepared in accordance with accounting principles generally accepted in the United States of America (“GAAP”). The preparation of these financial statements requires us to make estimates and judgments that affect the reported amounts of assets, liabilities, revenues and expenses. We continually evaluate our estimates, which are based on historical experience and on various other assumptions that we believe to be reasonable under the circumstances. These estimates form the basis for our judgments about the carrying values of our assets and liabilities, which values are not readily apparent from other sources. Actual results may differ from these estimates under different assumptions or conditions.
We believe that, of our significant accounting policies (see “Note 1—Summary of Significant Accounting Policies” of the Notes to Consolidated Financial Statements), the following critical accounting policies may involve a higher degree of judgment and complexity.
Revenue Recognition
Commission revenues are recognized as of the effective date of the insurance policy or the date on which the policy premium is billed to the customer, whichever is later. At that date, the earnings process has been completed, and we can reliably estimate the impact of policy cancellations for refunds and establish reserves accordingly. Management determines the policy cancellation reserve based upon historical cancellation experience adjusted by known circumstances. Subsequent commission adjustments are recognized upon notification from the insurance companies. Profit-sharing contingent commissions from insurance companies are recognized when determinable, which is when such commissions are received, or when officially notified. Fee revenues are recognized as services are rendered.
Business Combinations and Purchase Price Allocations
We have significant intangible assets that were acquired through business acquisitions. These assets consist of purchased customer accounts, noncompete agreements, and the excess of costs over the fair value of identifiable net assets acquired (goodwill). The determination of estimated useful lives and the allocation of the purchase price to the intangible assets requires significant judgment and affects the amount of future amortization and possible impairment charges.
In accordance with Statement of Financial Accounting Standards (“SFAS”) No. 141, “Business Combinations,” all of our business combinations initiated after June 30, 2001 have been accounted for using the purchase method. In connection with these acquisitions, we record the estimated value of the net tangible assets purchased and the value of the identifiable intangible assets purchased, which typically consist of purchased customer accounts and noncompete agreements. Purchased customer accounts partially include the physical records and files obtained from acquired businesses that contain information about insurance policies, customers and other matters essential to policy renewals. However, they primarily represent the present value of the underlying cash flows expected to be received over the estimated future renewal periods of the insurance policies comprising those purchased customer accounts. The valuation of purchased customer accounts involves significant estimates and assumptions concerning matters such as cancellation frequency, expenses and discount rates. Any change in these assumptions could affect the carrying value of purchased customer accounts. Noncompete agreements are valued based on the duration and any unique features of each specific agreement. Purchased customer accounts and noncompete agreements are amortized on a straight-line basis over the related estimated lives and contract periods, which range from five to 15 years. The excess of the purchase price of an acquisition over the fair value of the identifiable tangible and intangible assets is assigned to goodwill and is no longer amortized, in accordance with SFAS No. 142, “Goodwill and Other Intangible Assets” (“SFAS No. 142”).
Intangible Assets Impairment
Effective January 1, 2002, we adopted SFAS No. 142, which requires that goodwill be subject to at least an annual assessment for impairment by applying a fair-value based test. Amortizable intangible assets are amortized over their useful lives and are subject to lower-of-cost-or-market impairment testing. SFAS No. 142 requires us to compare the fair value of each reporting unit with its carrying value to determine if there is potential impairment
24
of goodwill. If the fair value of the reporting unit is less than its carrying value, an impairment loss would be recorded to the extent that the fair value of the goodwill within the reporting unit is less than its carrying value. Fair value is estimated based on multiples of revenues, and earnings before interest, income taxes, depreciation and amortization (“EBITDA”).
Management assesses the recoverability of our goodwill on an annual basis, and of our amortizable intangibles and other long-lived assets whenever events or changes in circumstances indicate that the carrying value may not be recoverable. The following factors, if present, may trigger an impairment review: (i) significant underperformance relative to historical or projected future operating results; (ii) significant negative industry or economic trends; (iii) significant decline in our stock price for a sustained period; and (iv) significant decline in our market capitalization. If the recoverability of these assets is unlikely because of the existence of one or more of the above-referenced factors, an impairment analysis is performed. Management must make assumptions regarding estimated future cash flows and other factors to determine the fair value of these assets. If these estimates or related assumptions change in the future, we may be required to revise the assessment and, if appropriate, record an impairment charge. We completed our most recent evaluation of impairment for goodwill as of November 30, 2007 and identified no impairment as a result of the evaluation.
Non-Cash Stock-Based Compensation
The Company grants stock options and non-vested stock awards (previously referred to as “restricted stock”) to its employees, officers and directors. Effective January 1, 2006, the Company adopted the provisions of SFAS No. 123R, “Share-Based Payment” (“SFAS 123R”), for its stock-based compensation plans. Among other things, SFAS 123R requires that compensation expense for all share-based awards be recognized in the financial statements based upon the grant-date fair value of those awards.
Reserves for Litigation
We are subject to numerous litigation claims that arise in the ordinary course of business. In accordance with SFAS No. 5, “Accounting for Contingencies,” if it is probable that an asset has been impaired or a liability has been incurred at the date of the financial statements and the amount of the loss is estimable, an accrual for the costs to resolve these claims is recorded in accrued expenses in the accompanying Consolidated Balance Sheets. Professional fees related to these claims are included in other operating expenses in the accompanying Consolidated Statements of Income. Management, with the assistance of inside and outside counsel, determines whether it is probable that a liability has been incurred and estimates the amount of loss based upon analysis of individual issues. New developments or changes in settlement strategy in dealing with these matters may significantly affect the required reserves and impact our net income.
Derivative Instruments
In 2002, we entered into one derivative financial instrument—an interest rate exchange agreement, or “swap”—to manage the exposure to fluctuations in interest rates on our $90 million variable rate debt. As of December 31, 2006, we maintained this swap agreement, whereby we pay a fixed rate on the notional amount to a bank and the bank pays us a variable rate on the notional amount equal to a base London InterBank Offering Rate (“LIBOR”). We have assessed this derivative as a highly effective cash flow hedge, and accordingly, changes in the fair market value of the swap are reflected in other comprehensive income. The fair market value of this instrument is determined by quotes obtained from the related counter-parties in combination with a valuation model utilizing discounted cash flows. The valuation of this derivative instrument is a significant estimate that is largely affected by changes in interest rates. As of December 31, 2007 this interest rate swap agreement expired in conjunction with the final payment on the related $90 million variable rate debt.
New Accounting Pronouncements
See Note 1 of the Notes to Consolidated Financial Statements for a discussion of the effects of the adoption of new accounting standards.
25
RESULTS OF OPERATIONS FOR THE YEARS ENDED DECEMBER 31, 2007, 2006 AND 2005
The following discussion and analysis regarding results of operations and liquidity and capital resources should be considered in conjunction with the accompanying Consolidated Financial Statements and related Notes.
Financial information relating to our Consolidated Financial Results is as follows (in thousands, except percentages):
| 2007 | Percent Change | 2006 | Percent Change | 2005 | ||||||||||||||||||
|---|---|---|---|---|---|---|---|---|---|---|---|---|---|---|---|---|---|---|---|---|---|---|
REVENUES | ||||||||||||||||||||||
| Commissions and fees | $ | 857,027 | 4.1 | % | $ | 823,615 | 11.2 | % | $ | 740,567 | ||||||||||||
| Profit-sharing contingent commissions | 57,623 | 40.4 | % | 41,048 | 17.4 | % | 34,976 | |||||||||||||||
| Investment income | 30,494 | 165.7 | % | 11,479 | 74.5 | % | 6,578 | |||||||||||||||
| Other income, net | 14,523 | 680.0 | % | 1,862 | (49.5 | )% | 3,686 | |||||||||||||||
| Total revenues | 959,667 | 9.3 | % | 878,004 | 11.7 | % | 785,807 | |||||||||||||||
EXPENSES | ||||||||||||||||||||||
| Employee compensation and benefits | 444,101 | 9.7 | % | 404,891 | 8.0 | % | 374,943 | |||||||||||||||
| Non-cash stock-based compensation | 5,667 | 4.6 | % | 5,416 | 62.3 | % | 3,337 | |||||||||||||||
| Other operating expenses | 131,371 | 3.9 | % | 126,492 | 19.8 | % | 105,622 | |||||||||||||||
| Amortization | 40,436 | 10.8 | % | 36,498 | 9.8 | % | 33,245 | |||||||||||||||
| Depreciation | 12,763 | 12.9 | % | 11,309 | 12.4 | % | 10,061 | |||||||||||||||
| Interest | 13,802 | 3.3 | % | 13,357 | (7.7 | )% | 14,469 | |||||||||||||||
| Total expenses | 648,140 | 8.4 | % | 597,963 | 10.4 | % | 541,677 | |||||||||||||||
| Income before income taxes | $ | 311,527 | 11.2 | % | $ | 280,041 | 14.7 | % | $ | 244,130 | ||||||||||||
| Net internal growth rate — core commissions and fees | (3.4 | )% | 4.0 | % | 3.1 | % | ||||||||||||||||
| Employee compensation and benefits ratio | 46.3 | % | 46.1 | % | 47.7 | % | ||||||||||||||||
| Other operating expenses ratio | 13.7 | % | 14.4 | % | 13.4 | % | ||||||||||||||||
| Capital expenditures | $ | 30,643 | $ | 14,979 | $ | 13,426 | ||||||||||||||||
| Total assets at December 31 | $ | 1,960,659 | $ | 1,807,952 | $ | 1,608,660 | ||||||||||||||||
Commissions and Fees
Commissions and fees revenue, including profit-sharing contingent commissions, increased 5.8% in 2007, 11.5% in 2006 and 21.5% in 2005. Profit-sharing contingent commissions increased $16.6 million to $57.6 million in 2007 and $6.1 million to $41.0 million in 2006, primarily as a result of a better than average year for insurance companies’ loss ratios. Core commissions and fees revenue decreased (3.4%) in 2007 and increased 4.0% in 2006 and 3.1% in 2005, when excluding commissions and fees revenue generated from acquired operations and also from divested operations. The 2007 decrease of 3.4% represents $27.9 million of net lost core commission and fees revenue, of which $23.0 million is related to our various operations impacted by the Florida insurance marketplace, $6.2 million is related to our operation that serves the home-building industry in southern California, with our remaining operations at a minimal aggregate revenue growth.
Investment Income
Investment income increased to $30.5 million in 2007, compared with $11.5 million in 2006 and $6.6 million in 2005. The increase in 2007 over 2006 of $19.0 million was primarily due to the sale of our investment in Rock-Tenn Company which we owned for over 25 years, for a net gain of $18.7 million. The increase in 2006 over 2005 was primarily the result of higher investment yields earned with higher average available cash balances.
Other Income, net
Other income consists primarily of gains and losses from the sale and disposition of assets. In 2007, gains of $13.7 million were recognized from the sale of books of business (customer accounts) as compared with $1.1 million and $2.7 million in 2006 and 2005, respectively. Although we are not in the business of selling books of businesses (customer accounts), we periodically will sell an office or a book of business (one or more customer accounts) that does not produce reasonable margins or demonstrate a potential for growth. Even though the sales of customer accounts were unusually high during 2007, we do not believe that it is indicative of a future trend.
26
Employee Compensation and Benefits
Employee compensation and benefits increased approximately 9.7% or $39.2 million in 2007, of which $33.5 million was related to acquisitions that were stand-alone offices. Of the remaining $5.7 million, the majority related to the average annual 3.5% salary increase given to non-producer employees. Additionally, during 2007, $1.6 million of the increase related to a funding true-up to the 2006 employee profit-sharing contribution. Employee compensation and benefits increased approximately 8.0% in 2006 and 19.3% in 2005, primarily as a result of acquisitions and an increase in commissions paid on net new business. Employee compensation and benefits as a percentage of total revenues were 46.1% in 2006 and 47.7% in 2005, reflecting a gradual improvement in personnel efficiencies as revenues grow. We had 5,047 full-time equivalent employees at December 31, 2007, compared with 4,733 at December 31, 2006 and 4,540 at December 31, 2005. Of the 314 net increase in full-time equivalent employees at December 31, 2007 over the prior year-end, 508 were from the acquisitions that were stand-alone offices, thus resulting in a net reduction of 194 employees in the offices existing at both year-ends.
Non-Cash Stock-Based Compensation
The Company grants stock options and non-vested stock awards to its employees, officers and directors. Effective January 1, 2006, the Company adopted the provisions of SFAS No. 123R, Share-Based Payment (“SFAS 123R”), for its stock-based compensation plans. Among other things, SFAS 123R requires that compensation expense for all share-based awards be recognized in the financial statements based upon the grant-date fair value of those awards.
Prior to January 1, 2006, the Company accounted for stock-based compensation using the recognition and measurement provisions of Accounting Principles Board Opinion No. 25, Accounting for Stock Issued to Employees (“APB No. 25”), and related interpretations, and disclosure requirements established by SFAS No. 123, Accounting for Stock-Based Compensation (“SFAS 123”), as amended by SFAS No. 148, Accounting for Stock-Based Compensation-Transitions and Disclosures (“SFAS 148”). Under APB No. 25, no compensation expense was recognized for either stock options issued under the Company’s stock compensation plans or for stock purchased under the Company’s 1990 Employee Stock Purchase Plan (“ESPP”). The pro forma effects on net income and earnings per share for stock options and ESPP awards were instead disclosed in a footnote to the financial statements. Compensation expense was previously recognized for awards of non-vested stock, based upon the market value of the common stock on the date of award, on a straight-line basis over the requisite service period with the effect of forfeitures recognized as they occurred. As such the 2005 non-cash stock-based compensation expense of $3.3 million was solely related to the Performance Stock Plan (“PSP”) grants under APB 25.
For 2007 and 2006, the non-cash stock-based compensation under SFAS 123R incorporates costs related to each of our three stock-based plans as explained in Note 11 to the consolidated financial statements.
Since the last significant company-wide grants of PSP shares occurred in January 2003 and that the five-year period for the related shares to become “awarded” expired in January 2008 as did the “unawarded” shares, we expect to grant new PSP shares to deserving office leaders and producers in February 2008. Additionally, we may issue incentive stock options (“ISO”) to certain corporate leaders. The expected annual cost of these additional PSP and ISO grants is expected to be between $1.5 million and $2.5 million.
Other Operating Expenses
As a percentage of total revenues, other operating expenses was 13.7% in 2007, 14.4% in 2006 and 13.4% in 2005. Other operating expenses in 2007 increased $4.9 million over the 2006 amount which also included a one-time $5.8 million payment to the State of Florida described below, therefore having an effective increase in cost of $10.7 million. The intermediaries acquired in 2007 that were not combined with existing company offices and became stand-alone offices, accounted for $11.1 million of the $10.7 million net increase. Thus, excluding the effects of acquisitions, the 2007 Other Operating expenses were slightly less than 2006.
For 2006, legal and professional fee expenses increased $1.7 million over the amount expended in 2005. The increase in legal and professional fee expenses was primarily the result of the various ongoing investigations and
27
litigation relating to agent and broker compensation, including profit-sharing contingent commissions, by state regulators and, to a lesser extent, by the requirements of compliance with the Sarbanes-Oxley Act of 2002. Additionally, in 2006 a total of $5.8 million was paid to State of Florida regulatory authorities and other parties, which concluded the State of Florida’s investigation of compensation paid to us (See Note 13). Excluding the impact of these increased legal and professional fee expenses and settlement payments, other operating expenses declined as a percentage of total revenues each year from 2005 to 2006, which is attributable to the effective cost containment measures brought about by our initiative designed to identify areas of excess expense. This decrease is also due to the fact that, in a net internal revenue growth environment, certain significant other operating expenses such as office rent, office supplies, data processing, and telephone costs, increase at a slower rate than commissions and fees revenue during the same period.
Amortization
Amortization expense increased $3.9 million, or 10.8% in 2007, $3.3 million, or 9.8% in 2006, and $11.1 million, or 50.1% in 2005. The increases in 2007 and 2006 were due to the amortization of additional intangible assets as a result of acquisitions completed in those years.
Depreciation
Depreciation increased 12.9% in 2007, 12.4% in 2007 and 12.9% in 2005. These increases were primarily due to the purchase of new computers, related equipment and software, corporate aircraft and the depreciation of fixed assets associated with acquisitions completed in those years.
Interest Expense
Interest expense increased $0.4 million or 3.3%, in 2007 over 2006 primarily as a result of the additional $25.0 million that was borrowed in December 2006 but which was partially offset by the $12.9 reduction in the term loan balance due to the normal quarterly principal payments. Interest expense decreased $1.1 million, or 7.7%, in 2006 over 2005 as a result of lower average debt balances due to the normal quarterly principal payments.
Income Taxes
The effective tax rate on income from operations was 38.7% in 2007, 38.5% in 2006 and 38.3% in 2005. The higher effective tax rate in 2007 and 2006, compared with 2005, was primarily the result of increased amounts of business conducted in states having higher state tax rates and a $1.1 million settlement payment to the U.S. Internal Revenue Service (“IRS”) in 2007. During 2007, the IRS concluded their audit of our 2004-2006 tax years in which they disputed our method of recognizing profit-sharing contingent commissions for tax purposes. We recognize profit-sharing contingent commissions when determinable, which is when such commissions are received, however, the IRS believes that we should estimate those monies as of each December 31. We agreed to resolve this dispute for a $1.1 million payment of interest and our agreement to accrue at each December 31, for tax purposes only, a known amount of profit-sharing contingent commissions represented by the actual amount of profit-sharing contingent commissions received in the first quarter of the related year, with a true-up adjustment to the actual amount received by the end of the following March 31. Since this method for tax purposes differs from the method used for book purposes, it will result in a current deferred tax asset as of December 31 each year with that balance reversing by the following March 31 when the related profit-sharing contingent commissions are recognized for financial accounting purposes.
28
RESULTS OF OPERATIONS — SEGMENT INFORMATION
As discussed in Note 16 of the Notes to Consolidated Financial Statements, we operate in four reportable segments: the Retail, Wholesale Brokerage, National Programs and Services Divisions. On a divisional basis, increases in amortization, depreciation and interest expenses are the result of acquisitions within a given division in a particular year. Likewise, other income in each division primarily reflects net gains on sales of customer accounts and fixed assets. As such, in evaluating the operational efficiency of a division, management places emphasis on the net internal growth rate of core commissions and fees revenue, the gradual improvement of the ratio of total employee compensation and benefits to total revenues, and the gradual improvement of the ratio of other operating expenses to total revenues.
The internal growth rates for our core commissions and fees for the three years ended December 31, 2007, 2006 and 2005, by divisional units are as follows (in thousands, except percentages):
| 2007 | For the years ended December 31, | |||||||||||||||||||||||||||||
|---|---|---|---|---|---|---|---|---|---|---|---|---|---|---|---|---|---|---|---|---|---|---|---|---|---|---|---|---|---|---|
| 2007 | 2006 | Total Net Change | Total Net Growth % | Less Acquisition Revenues | Internal Net Growth $ | Internal Net Growth % | ||||||||||||||||||||||||
| Florida Retail | $ | 175,330 | $ | 175,205 | $ | 125 | 0.1 | % | $ | 3,108 | $ | (2,983 | ) | (1.7)% | ||||||||||||||||
| National Retail | 242,762 | 202,763 | 39,999 | 19.7 | % | 40,808 | (809 | ) | (0.4)% | |||||||||||||||||||||
| Western Retail | 95,357 | 101,386 | (6,029 | ) | (5.9 | )% | 436 | (6,465 | ) | (6.4)% | ||||||||||||||||||||
Total Retail(1) | 513,449 | 479,354 | 34,095 | 7.1 | % | 44,352 | (10,257 | ) | (2.1)% | |||||||||||||||||||||
Wholesale Brokerage | 156,978 | 151,278 | 5,700 | 3.8 | % | 15,221 | (9,521 | ) | (6.3)% | |||||||||||||||||||||
| Professional Programs | 42,348 | 40,867 | 1,481 | 3.6 | % | 423 | 1,058 | 2.6% | ||||||||||||||||||||||
| Special Programs | 108,747 | 113,141 | (4,394 | ) | (3.9 | )% | 5,357 | (9,751 | ) | (8.6)% | ||||||||||||||||||||
Total National Programs | 151,095 | 154,008 | (2,913 | ) | (1.9 | )% | 5,780 | (8,693 | ) | (5.6)% | ||||||||||||||||||||
Services | 35,505 | 32,561 | 2,944 | 9.0 | % | 2,328 | 616 | 1.9% | ||||||||||||||||||||||
Total Core Commissions and Fees | $ | 857,027 | $ | 817,201 | $ | 39,826 | 4.9 | % | $ | 67,681 | $ | (27,855 | ) | (3.4)% | ||||||||||||||||
The reconciliation of the above internal growth schedule to the total Commissions and Fees included in the Consolidated Statements of Income for the years ended December, 2007 and 2006 is as follows (in thousands, except percentages):
| For the years ended December 31, | |||||||||||
|---|---|---|---|---|---|---|---|---|---|---|---|
| 2007 | 2006 | ||||||||||
| Total core commissions and fees | $ | 857,027 | $ | 817,201 | |||||||
| Profit-sharing contingent commissions | 57,623 | 41,048 | |||||||||
| Divested business | — | 6,414 | |||||||||
| Total commission & fees | $ | 914,650 | $ | 864,663 | |||||||
29
| 2006 | For the years ended December 31, | |||||||||||||||||||||||||||||
|---|---|---|---|---|---|---|---|---|---|---|---|---|---|---|---|---|---|---|---|---|---|---|---|---|---|---|---|---|---|---|
| 2006 | 2005 | Total Net Change | Total Net Growth % | Less Acquisition Revenues | Internal Net Growth $ | Internal Net Growth % | ||||||||||||||||||||||||
| Florida Retail | $ | 175,885 | $ | 155,741 | $ | 20,144 | 12.9 | % | $ | 493 | $ | 19,651 | 12.6 | % | ||||||||||||||||
| National Retail | 206,661 | 198,033 | 8,628 | 4.4 | % | 11,417 | (2,789 | ) | (1.4 | )% | ||||||||||||||||||||
| Western Retail | 103,222 | 103,951 | (729 | ) | (0.7 | )% | 4,760 | (5,489 | ) | (5.3 | )% | |||||||||||||||||||
Total Retail(1) | 485,768 | 457,725 | 28,043 | 6.1 | % | 16,670 | 11,373 | 2.5 | % | |||||||||||||||||||||
Wholesale Brokerage | 151,278 | 120,889 | 30,389 | 25.1 | % | 25,616 | 4,773 | 3.9 | % | |||||||||||||||||||||
| Professional Programs | 40,867 | 41,930 | (1,063 | ) | (2.5 | )% | 43 | (1,106 | ) | (2.6 | )% | |||||||||||||||||||
| Special Programs | 113,141 | 90,933 | 22,208 | 24.4 | % | 9,255 | 12,953 | 14.2 | % | |||||||||||||||||||||
Total National Programs | 154,008 | 132,863 | 21,145 | 15.9 | % | 9,298 | 11,847 | 8.9 | % | |||||||||||||||||||||
Services | 32,561 | 26,565 | 5,996 | 22.6 | % | 4,496 | 1,500 | 5.6 | % | |||||||||||||||||||||
Total Core Commissions and Fees | $ | 823,615 | $ | 738,042 | $ | 85,573 | 11.6 | % | $ | 56,080 | $ | 29,493 | 4.0 | % | ||||||||||||||||
The reconciliation of the above internal growth schedule to the total Commissions and Fees included in the Consolidated Statements of Income for the years ended December, 2006 and 2005 is as follows (in thousands, except percentages):
| For the years ended December 31, | |||||||||||
|---|---|---|---|---|---|---|---|---|---|---|---|
| 2006 | 2005 | ||||||||||
| Total core commissions and fees | $ | 823,615 | $ | 738,042 | |||||||
| Profit-sharing contingent commissions | 41,048 | 34,976 | |||||||||
| Divested business | — | 2,525 | |||||||||
| Total commission & fees | $ | 864,663 | $ | 775,543 | |||||||
| 2005 | For the years ended December 31, | |||||||||||||||||||||||||||||
|---|---|---|---|---|---|---|---|---|---|---|---|---|---|---|---|---|---|---|---|---|---|---|---|---|---|---|---|---|---|---|
| 2005 | 2004 | Total Net Change | Total Net Growth % | Less Acquisition Revenues | Internal Net Growth $ | Internal Net Growth % | ||||||||||||||||||||||||
| Florida Retail | $ | 155,973 | $ | 140,895 | $ | 15,078 | 10.7 | % | $ | 5,694 | $ | 9,384 | 6.7 | % | ||||||||||||||||
| National Retail | 201,112 | 182,098 | 19,014 | 10.4 | % | 20,540 | (1,526 | ) | (0.8 | )% | ||||||||||||||||||||
| Western Retail | 104,879 | 107,529 | (2,650 | ) | (2.5 | )% | 2,699 | (5,349 | ) | (5.0 | )% | |||||||||||||||||||
Total Retail(1) | 461,964 | 430,522 | 31,442 | 7.3 | % | 28,933 | 2,509 | 0.6 | % | |||||||||||||||||||||
Wholesale Brokerage | 120,889 | 38,080 | 82,809 | 217.5 | % | 73,317 | 9,492 | 24.9 | % | |||||||||||||||||||||
| Professional Programs | 41,861 | 42,463 | (602 | ) | (1.4 | )% | 715 | (1,317 | ) | (3.1 | )% | |||||||||||||||||||
| Special Programs | 89,288 | 66,601 | 22,687 | 34.1 | % | 17,155 | 5,532 | 8.3 | % | |||||||||||||||||||||
Total National Programs | 131,149 | 109,064 | 22,085 | 20.2 | % | 17,870 | 4,215 | 3.9 | % | |||||||||||||||||||||
Services | 26,565 | 24,334 | 2,231 | 9.2 | % | — | 2,231 | 9.2 | % | |||||||||||||||||||||
Total Core Commissions and Fees | $ | 740,567 | $ | 602,000 | $ | 138,567 | 23.0 | % | $ | 120,120 | $ | 18,447 | 3.1 | % | ||||||||||||||||
The reconciliation of the above internal growth schedule to the total Commissions and Fees included in the Consolidated Statements of Income for the years ended December, 2005 and 2004 is as follows (in thousands, except percentages):
30
| For the years ended December 31, | |||||||||||
|---|---|---|---|---|---|---|---|---|---|---|---|
| 2005 | 2004 | ||||||||||
| Total core commissions and fees | $ | 740,567 | $ | 602,000 | |||||||
| Profit-sharing contingent commissions | 34,976 | 30,652 | |||||||||
| Divested business | — | 5,615 | |||||||||
| Total commission & fees | $ | 775,543 | $ | 638,267 | |||||||
| (1) | The Retail segment includes commissions and fees reported in the “Other” column of the Segment Information in Note 16 which includes corporate and consolidation items. |
Retail Division
The Retail Division provides a broad range of insurance products and services to commercial, public and quasi-public, professional and individual insured customers. More than 96.1% of the Retail Division’s commissions and fees revenue are commission-based. Since the majority of our other operating expenses do not change as premiums fluctuate, we believe that most of any fluctuation in the commissions that we receive will be reflected in our pre-tax income. The Retail Division’s commissions and fees revenue accounted for 63.1% of our total consolidated commissions and fees revenue in 2005 but declined to 59.9% in 2007, mainly due to continued acquisitions in the National Programs and Wholesale Brokerage Divisions.
Financial information relating to Brown & Brown’s Retail Division is as follows (in thousands, except percentages):
| 2007 | Percent Change | 2006 | Percent Change | 2005 | ||||||||||||||||||
|---|---|---|---|---|---|---|---|---|---|---|---|---|---|---|---|---|---|---|---|---|---|---|
REVENUES | ||||||||||||||||||||||
| Commissions and fees | $ | 514,639 | 5.8 | % | $ | 486,419 | 5.5 | % | $ | 461,236 | ||||||||||||
| Profit-sharing contingent commissions | 33,399 | 11.1 | % | 30,070 | 6.1 | % | 28,330 | |||||||||||||||
| Investment income | 260 | 87.1 | % | 139 | (12.6 | )% | 159 | |||||||||||||||
| Other income, net | 14,140 | NMF% | 1,361 | (7.9 | )% | 1,477 | ||||||||||||||||
| Total revenues | 562,438 | 8.6 | % | 517,989 | 5.5 | % | 491,202 | |||||||||||||||
EXPENSES | ||||||||||||||||||||||
| Employee compensation and benefits | 263,056 | 8.5 | % | 242,469 | 4.0 | % | 233,124 | |||||||||||||||
| Non-cash stock-based compensation | 3,243 | 9.0 | % | 2,976 | 35.4 | % | 2,198 | |||||||||||||||
| Other operating expenses | 88,359 | 6.5 | % | 82,966 | 2.3 | % | 81,063 | |||||||||||||||
| Amortization | 21,659 | 12.2 | % | 19,305 | (0.3 | )% | 19,368 | |||||||||||||||
| Depreciation | 5,723 | 1.8 | % | 5,621 | (0.4 | )% | 5,641 | |||||||||||||||
| Interest | 21,094 | 11.6 | % | 18,903 | (9.7 | )% | 20,927 | |||||||||||||||
| Total expenses | 403,134 | 8.3 | % | 372,240 | 2.7 | % | 362,321 | |||||||||||||||
| Income before income taxes | $ | 159,304 | 9.3 | % | $ | 145,749 | 13.1 | % | $ | 128,881 | ||||||||||||
| Net internal growth rate — core commissions and fees | (2.1 | )% | 2.5 | % | 0.6 | % | ||||||||||||||||
| Employee compensation and benefits ratio | 46.8 | % | 46.8 | % | 47.5 | % | ||||||||||||||||
| Other operating expenses ratio | 15.7 | % | 16.0 | % | 16.5 | % | ||||||||||||||||
| Capital expenditures | $ | 5,816 | $ | 5,952 | $ | 6,186 | ||||||||||||||||
| Total assets at December 31 | $ | 1,356,772 | $ | 1,103,107 | $ | 1,002,781 | ||||||||||||||||
The Retail Division’s total revenues in 2007 increased $44.4 million to $562.4 million, a 8.6% increase over 2006. Of this increase, approximately $34.1 million was the net growth in core commissions and fees, however, $44.4 million was from acquisitions for which there were no comparable revenues in 2006; and therefore, $10.3 million was lost on a “same-store sales” basis resulting in a negative internal growth rate of 2.1%. The majority of the negative internal growth resulted from continued competitive insurance pricing in the western United States. However, the most competitive pricing in the second half of the 2007 year occurred in Florida, and this insurance pricing environment is likely to continue for at least the first half of 2008.
31
Income before income taxes in 2007 increased $13.6 million from 2006, of which $13.7 million was from an historically high amount of gains from the sales of books of business (customer accounts). Even though the sales of customer accounts were higher than normal during 2007, we do not believe that it is indicative of a future trend. The remaining decrease was due the reduced earnings from the negative growth in core commissions and fees, but offset by earnings from acquisitions.
The Retail Division’s total revenues in 2006 increased $26.8 million to $518.0 million, a 5.5% increase over 2005. Of this increase, approximately $16.7 million related to core commissions and fees revenue from acquisitions for which there were no comparable revenues in 2005. The remaining increase was primarily due to net new business growth. The Retail Division’s net internal growth rate in core commissions and fees revenue was 2.5% in 2006, excluding revenues recognized in 2006 from new acquisitions and the 2005 commissions and fees revenue from divested business. The net internal growth rate of core commissions and fees revenue for the Retail Division in 2005 was 0.6%. The increase in the net internal growth rate from core commission and fees from 2005 to 2006 primarily reflects increased premium rates for coastal property in the southeastern part of the United States, but offset by lower insurance premium rates in most other parts of the country.
Income before income taxes in 2006 increased $16.9 million to $145.7 million, a 13.1% increase over 2005. This increase was due to revenues from acquisitions, a positive net internal growth rate and the continued focus on holding our general expense growth rate to a lower percentage than our revenue growth rate.
Wholesale Brokerage Division
The Wholesale Brokerage Division markets and sells excess and surplus commercial and personal lines insurance and reinsurance, primarily through independent agents and brokers. Like the Retail and National Programs Divisions, the Wholesale Brokerage Division’s revenues are primarily commission-based.
Financial information relating to our Wholesale Brokerage Division is as follows (in thousands, except percentages):
| 2007 | Percent Change | 2006 | Percent Change | 2005 | ||||||||||||||||||
|---|---|---|---|---|---|---|---|---|---|---|---|---|---|---|---|---|---|---|---|---|---|---|
REVENUES | ||||||||||||||||||||||
| Commissions and fees | $ | 156,978 | 3.8 | % | $ | 151,278 | 25.1 | % | $ | 120,889 | ||||||||||||
| Profit-sharing contingent commissions | 18,311 | 129.2 | % | 7,990 | 71.9 | % | 4,648 | |||||||||||||||
| Investment income | 2,927 | (27.1 | )% | 4,017 | 151.2 | % | 1,599 | |||||||||||||||
| Other income (loss), net | 726 | NMF% | 61 | (365.2 | )% | (23 | ) | |||||||||||||||
| Total revenues | 178,942 | 9.5 | % | 163,346 | 28.5 | % | 127,113 | |||||||||||||||
EXPENSES | ||||||||||||||||||||||
| Employee compensation and benefits | 87,500 | 11.5 | % | 78,459 | 32.0 | % | 59,432 | |||||||||||||||
| Non-cash stock-based compensation | 791 | 52.4 | % | 519 | 216.5 | % | 164 | |||||||||||||||
| Other operating expenses | 31,522 | 10.3 | % | 28,582 | 44.3 | % | 19,808 | |||||||||||||||
| Amortization | 9,237 | 14.2 | % | 8,087 | 42.6 | % | 5,672 | |||||||||||||||
| Depreciation | 2,715 | 30.8 | % | 2,075 | 61.5 | % | 1,285 | |||||||||||||||
| Interest | 19,188 | 2.3 | % | 18,759 | 50.7 | % | 12,446 | |||||||||||||||
| Total expenses | 150,953 | 10.6 | % | 136,481 | 38.1 | % | 98,807 | |||||||||||||||
| Income before income taxes | $ | 27,989 | 4.2 | % | $ | 26,865 | (5.1 | )% | $ | 28,306 | ||||||||||||
| Net internal growth rate — core commissions and fees | (6.3 | )% | 3.9 | % | 24.9 | % | ||||||||||||||||
| Employee compensation and benefits ratio | 48.9 | % | 48.0 | % | 46.8 | % | ||||||||||||||||
| Other operating expenses ratio | 17.6 | % | 17.5 | % | 15.6 | % | ||||||||||||||||
| Capital expenditures | $ | 2,835 | $ | 2,085 | $ | 1,969 | ||||||||||||||||
| Total assets at December 31 | $ | 640,931 | $ | 618,374 | $ | 476,653 | ||||||||||||||||
32
Total revenues in 2007 increased $15.6 million over 2006, of which $10.3 million was from increased profit-sharing contingent commissions and $5.7 million from core commissions and fees. Profit-sharing contingent commissions increased as a result of higher insurance company profitability resulting from the increased premium rates during 2006 as well as new profit-sharing contingent commissions from operations acquired in 2006. Of the net increase in core commissions and fees of $5.7 million, approximately $15.2 million related to core commissions and fees revenue from acquisitions for which there were no comparable revenues in 2006. The Wholesale Brokerage Division’s net internal growth rate for core commissions and fees revenue in 2007 was (6.3)% or $9.5 million less revenues than in 2006, excluding core commissions and fees revenue recognized in 2007 from new acquisitions. The negative internal growth rate for the Wholesale Brokerage Division was primarily the result of the continuation of lost revenues from the same wholesale operations that had the most significant loss of revenues in 2006. One of those operations, which focuses on home-building construction accounts in the western region of the United States, lost $6.2 million as a result of the continued slow-down in economic activity in that region during the year as well as lower insurance premium rates. The other significantly affected operation was the Florida-based wholesale brokerage operations of Hull & Company, which lost $5.8 million of revenues in 2007 as a result of the competitive rate environment created by Citizens. Offsetting some of the lost business in Florida due to Citizens, we did have revenue growth in our binding authority operations and our reinsurance intermediary, Axiom Re.
Income before income taxes in 2007 increased $1.1 million to $28.0 million, a 4.2% increase over 2006. This increase is attributable in part to the fact that the 2007 loss from our reinsurance intermediary was $2.1 million less than in 2006, and higher earnings from our binding authority operations mainly driven by higher profit-sharing contingent commissions. Offsetting these increases, our operation that focuses on home building construction accounts in the western region of the United States had $2.9 million less income before income taxes than it earned in 2006, due to the reduction of revenues mentioned above.
Total revenues in 2006 increased $36.2 million to $163.3 million, a 28.5% increase over 2005. Of this increase, approximately $25.6 million related to core commissions and fees revenue from acquisitions for which there were no comparable revenues in 2005. The Wholesale Brokerage Division’s net internal growth rate for core commissions and fees revenue in 2006 was 3.9%, excluding core commissions and fees revenue recognized in 2006 from new acquisitions. The weaker internal growth rate than in recent years for the Wholesale Brokerage Division was primarily the result of lower revenues from two of our operations. One of those operations, which focuses on home-building construction accounts in the western region of the United States, experienced a slow-down in economic activity during the year as well as lower insurance premium rates. The second operation was the personal lines wholesale brokerage arm of Hull & Company which had significant premium capacity restrictions on placing coastal property coverage with their insurance carriers, which was not the case in 2005.
Income before income taxes in 2006 decreased $1.4 million to $26.9 million, a 5.1% decrease over 2005. This decrease is attributable in part to Axiom Re and Delaware Valley Underwriting Agency operations acquired in 2006, which had an aggregate loss before income taxes of $4.0 million as a result of initial transitional issues and net lost business. Additionally, our operation that focuses on home-building construction accounts in the western region of the United States had income before income taxes of $3.0 million less than it earned in 2005, due to the reduction of revenues mentioned above. Offsetting these losses were net increases in income before income taxes from our other wholesale brokerage operations.
National Programs Division
The National Programs Division is comprised of two units: Professional Programs, which provides professional liability and related package products for certain professionals delivered through nationwide networks of independent agents; and Special Programs, which markets targeted products and services designated for specific industries, trade groups, public and quasi-public entities and market niches. Like the Retail Division, the National Programs Division’s revenues are primarily commission-based.
33
Financial information relating to our National Programs Division is as follows (in thousands, except percentages):
| 2007 | Percent Change | 2006 | Percent Change | 2005 | ||||||||||||||||||
|---|---|---|---|---|---|---|---|---|---|---|---|---|---|---|---|---|---|---|---|---|---|---|
REVENUES | ||||||||||||||||||||||
| Commissions and fees | $ | 151,095 | (1.9 | )% | $ | 154,008 | 17.4 | % | $ | 131,149 | ||||||||||||
| Profit-sharing contingent commissions | 5,913 | 97.9 | % | 2,988 | 49.5 | % | 1,998 | |||||||||||||||
| Investment income | 513 | 18.8 | % | 432 | 17.7 | % | 367 | |||||||||||||||
| Other income, net | 27 | 35.0 | % | 20 | (95.2 | )% | 416 | |||||||||||||||
| Total revenues | 157,548 | 0.1 | % | 157,448 | 17.6 | % | 133,930 | |||||||||||||||
EXPENSES | ||||||||||||||||||||||
| Employee compensation and benefits | 62,755 | 3.4 | % | 60,692 | 11.9 | % | 54,238 | |||||||||||||||
| Non-cash stock-based compensation | 801 | 53.2 | % | 523 | 45.7 | % | 359 | |||||||||||||||
| Other operating expenses | 25,084 | (3.6 | )% | 26,014 | 27.4 | % | 20,414 | |||||||||||||||
| Amortization | 9,039 | 3.7 | % | 8,718 | 7.6 | % | 8,103 | |||||||||||||||
| Depreciation | 2,757 | 15.5 | % | 2,387 | 19.5 | % | 1,998 | |||||||||||||||
| Interest | 9,977 | (5.5 | )% | 10,554 | 1.2 | % | 10,433 | |||||||||||||||
| Total expenses | 110,413 | 1.4 | % | 108,888 | 14.0 | % | 95,545 | |||||||||||||||
| Income before income taxes | $ | 47,135 | (2.9 | )% | $ | 48,560 | 26.5 | % | $ | 38,385 | ||||||||||||
| Net internal growth rate — core commissions and fees | (5.6 | )% | 8.9 | % | 3.9 | % | ||||||||||||||||
| Employee compensation and benefits ratio | 39.8 | % | 38.5 | % | 40.5 | % | ||||||||||||||||
| Other operating expenses ratio | 15.9 | % | 16.5 | % | 15.2 | % | ||||||||||||||||
| Capital expenditures | $ | 1,831 | $ | 3,750 | $ | 3,067 | ||||||||||||||||
| Total assets at December 31 | $ | 570,295 | $ | 544,272 | $ | 445,146 | ||||||||||||||||
Total revenues in 2007 were essentially flat compared with 2006 due to the netting of different programs, some of which had very good growth and another of which lost nearly half of its revenues in 2007. Approximately $5.8 million related to core commissions and fees revenue from acquisitions for which there were no comparable revenues in 2006. The National Program Division’s net internal growth rate for core commissions and fees revenue was (5.6)% representing $8.7 million of lost revenues, excluding core commissions and fees revenue recognized in 2007 from new acquisitions. As previously discussed, when Citizens began to compete aggressively in Florida on January 1, 2007, it had the greatest impact on our condominium program at our Florida Intracoastal Underwriters (“FIU”) profit center. In 2007, FIU lost $13.4 million of core commissions and fees of the $27.2 million of total core commissions and fees that it had earned in 2006. Most of our other programs, including our lawyers and dentist professional liability programs, our public entity business, our sports and entertainment programs and our Proctor Financial operation, all had positive internal growth. Since Citizen’s impact on the insurance rates in Florida and on FIU has completed a full twelve-month period, and that Citizens’ 2007 insurance rates are guaranteed through January 1, 2009, we do not believe that the Citizens’ impact in 2008 will be as significant to FIU as it was in 2007.
Income before income taxes in 2007 decreased only $1.4 million from 2006. However, excluding the $3.0 million paid to the State of Florida regulatory authorities and other parties in 2006 that was allocated to National Programs, the net decrease was $4.4 million. Of that decrease, $10.7 million was attributable to FIU, which was offset by increased earnings from the 2007 acquisitions and the programs that had positive internal growth.
Total revenues in 2006 increased $23.5 million to $157.5 million, a 17.6% increase over 2005. Of this increase, approximately $9.3 million related to core commissions and fees revenue from acquisitions for which there were no comparable revenues in 2005. The National Program Division’s net internal growth rate for core commissions and fees revenue was 8.9%, excluding core commissions and fees revenue recognized in 2006 from new acquisitions. The majority of the internally generated growth in the 2006 core commissions and fees revenue was primarily related to increasing insurance premium rates in our condominium program at FIU profit center that occurred as a result of the 2005 and 2004 hurricane seasons as well as strong growth in the public entity business and the Proctor Financial operation.
34
Income before income taxes in 2006 increased $10.2 million to $48.6 million, a 26.5% increase over 2005, of which the majority related to the revenues derived from acquisitions completed in 2006 and the increased earnings at FIU. Additionally, in 2006 a total of $5.8 million was paid to State of Florida regulatory authorities and other parties, which concluded the State of Florida’s investigation of compensation paid to us (See Note 13). Of the $5.8 million, $3.0 million was allocated to other operating expenses in National Programs.
Services Division
The Services Division provides insurance-related services, including third-party claims administration (“TPA”) and comprehensive medical utilization management services in both the workers’ compensation and all-lines liability arenas, as well as Medicare set-aside services. Unlike our other segments, approximately 98.6% of the Services Division’s 2007 commissions and fees revenue is generated from fees, which are not significantly affected by fluctuations in general insurance premiums.
Financial information relating to our Services Division is as follows (in thousands, except percentages):
| 2007 | Percent Change | 2006 | Percent Change | 2005 | ||||||||||||||||||
|---|---|---|---|---|---|---|---|---|---|---|---|---|---|---|---|---|---|---|---|---|---|---|
REVENUES | ||||||||||||||||||||||
| Commissions and fees | $ | 35,505 | 9.0 | % | $ | 32,561 | 22.6 | % | $ | 26,565 | ||||||||||||
| Profit-sharing contingent commissions | — | — | — | — | — | |||||||||||||||||
| Investment income | 31 | (31.1 | )% | 45 | — | — | ||||||||||||||||
| Other (loss) income net | (144 | ) | (100.0 | )% | — | (100.0 | )% | 952 | ||||||||||||||
| Total revenues | 35,392 | 8.5 | % | 32,606 | 18.5 | % | 27,517 | |||||||||||||||
EXPENSES | ||||||||||||||||||||||
| Employee compensation and benefits | 19,416 | 7.0 | % | 18,147 | 16.5 | % | 15,582 | |||||||||||||||
| Non-cash stock-based compensation | 139 | 17.8 | % | 118 | (3.3 | )% | 122 | |||||||||||||||
| Other operating expenses | 5,467 | 8.0 | % | 5,062 | 16.7 | % | 4,339 | |||||||||||||||
| Amortization | 462 | 34.7 | % | 343 | 697.7 | % | 43 | |||||||||||||||
| Depreciation | 534 | 0.2 | % | 533 | 22.5 | % | 435 | |||||||||||||||
| Interest | 719 | 63.4 | % | 440 | NMF | % | 4 | |||||||||||||||
| Total expenses | 26,737 | 8.5 | % | 24,643 | 20.1 | % | 20,525 | |||||||||||||||
| Income before income taxes | $ | 8,655 | 8.7 | % | $ | 7,963 | 13.9 | % | $ | 6,992 | ||||||||||||
| Net internal growth rate — core commissions and fees | 1.9 | % | 5.6 | % | 9.2 | % | ||||||||||||||||
| Employee compensation and benefits ratio | 54.9 | % | 55.7 | % | 56.6 | % | ||||||||||||||||
| Other operating expenses ratio | 15.4 | % | 15.5 | % | 15.8 | % | ||||||||||||||||
| Capital expenditures | $ | 318 | $ | 588 | $ | 350 | ||||||||||||||||
| Total assets at December 31 | $ | 41,233 | $ | 32,554 | $ | 18,766 | ||||||||||||||||
Total revenues in 2007 increased $2.8 million over 2006, of which approximately $2.3 million related to core commissions and fees revenue from an acquisition for which there was no comparable revenues in 2006. The Services Division’s net internal growth rate for core commissions and fees revenue was 1.9% in 2007, excluding the 2006 core commissions and fees revenue from acquisitions and divested business. The positive net internal growth rates from core commissions and fees revenue primarily reflect the net new business growth from our Medicare secondary payer statute compliance-related services. The commissions and fees from our workers’ compensation and public and quasi-public entity TPA business was essentially flat in 2007 compared with 2006; however, in September 2007, one of our largest clients took the majority of its claims-paying services in-house, which will result in approximately $400,000 less revenues per month through August 2008.
Income before income taxes in 2007 increased $0.7 million over 2006, primarily due to strong net new business growth in our Medicare secondary payer statute compliance-related services.
Total revenues in 2006 increased $5.1 million to $32.6 million, a 18.5% increase over 2005. Of this increase, approximately $4.5 million related to core commissions and fees revenue from acquisitions for which there were
35
no comparable revenues in 2005. In 2006, other income was $0 compared with the 2005 other income of $1.0 million which was due to the sale of a medical TPA operation in 2004. The Services Division’s net internal growth rate for core commissions and fees revenue was 5.6% in 2006, excluding the 2005 core commissions and fees revenue from acquisitions and divested business. The positive net internal growth rates from core commissions and fees revenue primarily reflect the strong net new business growth from our workers’ compensation claims and public and quasi-public entity TPA businesses.
Income before income taxes in 2006 increased $1.0 million to $8.0 million, a 13.9% increase over 2005, primarily due to strong net new business growth and the acquisitions of an operation in the Medicare secondary payer statute compliance-related services.
Other
As discussed in Note 16 of the Notes to Consolidated Financial Statements, the “Other” column in the Segment Information table includes any income and expenses not allocated to reportable segments, and corporate-related items, including the inter-company interest expense charge to the reporting segment. During 2007 we sold all of our shares of The Rock-Tenn Company and recorded a total gain of $18.7 million.
Quarterly Operating Results
The following table sets forth our quarterly results for 2007 and 2006:
| (in thousands, except per share data) | First Quarter | Second Quarter | Third Quarter | Fourth Quarter | ||||||||||||||
|---|---|---|---|---|---|---|---|---|---|---|---|---|---|---|---|---|---|---|
| 2007 | ||||||||||||||||||
| Total revenues | $ | 258,513 | $ | 246,644 | $ | 237,284 | $ | 217,226 | ||||||||||
| Income before income taxes | $ | 98,102 | $ | 84,496 | $ | 75,435 | $ | 53,494 | ||||||||||
| Net income | $ | 59,727 | $ | 52,012 | $ | 46,216 | $ | 33,004 | ||||||||||
| Net income per share: | ||||||||||||||||||
| Basic | $ | 0.43 | $ | 0.37 | $ | 0.33 | $ | 0.23 | ||||||||||
| Diluted | $ | 0.42 | $ | 0.37 | $ | 0.33 | $ | 0.23 | ||||||||||
| 2006 | ||||||||||||||||||
| Total revenues | $ | 230,582 | $ | 220,807 | $ | 211,965 | $ | 214,650 | ||||||||||
| Income before income taxes | $ | 81,436 | $ | 70,967 | $ | 65,565 | $ | 62,073 | ||||||||||
| Net income | $ | 50,026 | $ | 44,431 | $ | 40,270 | $ | 37,623 | ||||||||||
| Net income per share: | ||||||||||||||||||
| Basic | $ | 0.36 | $ | 0.32 | $ | 0.29 | $ | 0.27 | ||||||||||
| Diluted | $ | 0.36 | $ | 0.32 | $ | 0.29 | $ | 0.27 | ||||||||||
LIQUIDITY AND CAPITAL RESOURCES
Our cash and cash equivalents of $38.2 million at December 31, 2007 reflected a decrease of $50.2 million from the $88.5 million balance at December 31, 2006. During 2007, $215.3 million of cash was provided from operating activities. Also during this period, $212.3 million of cash was used for acquisitions, $30.6 million was used for additions to fixed assets, $29.1 million was used for payments on long-term debt and $35.1 million was used for payment of dividends.
Our cash and cash equivalents of $88.5 million at December 31, 2006 reflected a decrease of $12.1 million from the $100.6 million balance at December 31, 2005. During 2006, $225.2 million of cash was provided from operating activities. Also during this period, $143.7 million of cash was used for acquisitions, $15.0 million was used for additions to fixed assets, $87.4 million was used for payments on long-term debt and $29.3 million was used for payment of dividends.
Our cash and cash equivalents of $100.6 million at December 31, 2005 reflected a decrease of $87.5 million from the $188.1 million balance at December 31, 2004. During 2005, $215.1 million of cash was provided from operating activities. Also during this period, $262.2 million of cash was used for acquisitions, $13.4 million was used for additions to fixed assets, $16.1 million was used for payments on long-term debt and $23.6 million was used for payment of dividends.
36
Our ratio of current assets to current liabilities (the “current ratio”) was 1.06 and 1.10 at December 31, 2007 and 2006, respectively.
As of December 31, 2007, our contractual cash obligations were as follows:
Contractual Cash Obligations
| (in thousands) | Total | Less Than 1 Year | 1-3 Years | 4-5 Years | After 5 Years | |||||||||||||||||
|---|---|---|---|---|---|---|---|---|---|---|---|---|---|---|---|---|---|---|---|---|---|---|
| Long-term debt | $ | 239,147 | $ | 11,443 | $ | 2,645 | $ | 100,059 | $ | 125,000 | ||||||||||||
| Capital lease obligations | 79 | 76 | 3 | — | — | |||||||||||||||||
| Other long-term liabilities | 13,635 | 11,229 | 320 | 428 | 1,658 | |||||||||||||||||
| Operating leases | 95,055 | 24,553 | 38,242 | 19,298 | 12,962 | |||||||||||||||||
| Interest obligations | 73,214 | 13,123 | 26,156 | 18,936 | 14,999 | |||||||||||||||||
| Unrecognized tax benefits | 507 | — | 507 | — | — | |||||||||||||||||
| Maximum future acquisition contingency payments | 226,206 | 120,985 | 68,332 | 36,889 | — | |||||||||||||||||
| Total contractual cash obligations | $ | 647,843 | $ | 181,409 | $ | 136,205 | $ | 175,610 | $ | 154,619 | ||||||||||||
In July 2004, we completed a private placement of $200.0 million of unsecured senior notes (the “Notes”). The $200.0 million is divided into two series: Series A, for $100.0 million due in 2011 and bearing interest at 5.57% per year; and Series B, for $100.0 million due in 2014 and bearing interest at 6.08% per year. The closing on the Series B Notes occurred on July 15, 2004. The closing on the Series A Notes occurred on September 15, 2004. We have used the proceeds from the Notes for general corporate purposes, including acquisitions and repayment of existing debt. As of December 31, 2007 and 2006 there was an outstanding balance of $200.0 million on the Notes.
On December 22, 2006, we entered into a Master Shelf and Note Purchase Agreement (the “Master Agreement”) with a national insurance company (the “Purchaser”). The Purchaser purchased Notes issued by the company in 2004. The Master Agreement provides for a $200.0 million private uncommitted shelf facility for the issuance of senior unsecured notes over a three-year period, with interest rates that may be fixed or floating and with such maturity dates, not to exceed ten (10) years, as the parties may determine. The Master Agreement includes various covenants, limitations and events of default currently customary for similar facilities for similar borrowers. The initial issuance of notes under the Master Facility occurred on December 22, 2006, through the issuance of $25.0 million in Series C Senior Notes due December 22, 2016, with a fixed interest rate of 5.66% per annum. On February 1, 2008 we issued $25 million in Series D Senior Notes due January 15, 2015 with a fixed interest rate of 5.37% per annum.
Also on December 22, 2006, we entered into a Second Amendment to Amended and Restated Revolving and Term Loan Agreement (the “Second Term Amendment”) and a Third Amendment to Revolving Loan Agreement (the “Third Revolving Amendment”) with a national banking institution, amending the existing Amended and Restated Revolving and Term Loan Agreement dated January 3, 2001 (the “Term Agreement”) and the existing Revolving Loan Agreement dated September 29, 2003, as amended (the “Revolving Agreement”), respectively. The amendments provide covenant exceptions for the Notes issued or to be issued under the Master Agreement, and relaxed or deleted certain other covenants. In the case of the Third Amendment to Revolving Loan Agreement, the lending commitment was reduced from $75.0 million to $20.0 million, the maturity date was extended from September 30, 2008 to December 20, 2011, and the applicable margins for advances and the availability fee were reduced. Based on the Company’s funded debt to EBITDA ratio, the applicable margin for Eurodollar advances changed from a range of LIBOR plus 0.625% to 1.625% to a range of LIBOR plus 0.450% to 0.875%. The applicable margin for base rate advances changed from a range of LIBOR plus 0.00% to 0.125% to the Prime Rate less 1.000%. The availability fee changed from a range of 0.175% to 0.250% to a range of 0.100% to 0.200%. The 90-day LIBOR was 4.70% and 5.36% as of December 31, 2007 and 2006, respectively. The prime rate was 7.25% and 8.25% as of December 31, 2007 and 2006, respectively. There were no borrowings against this facility at December 31, 2007 or 2006.
In January 2001, we entered into a $90.0 million unsecured seven-year term loan agreement with a national banking institution, bearing an interest rate based upon the 30-, 60- or 90-day LIBOR plus 0.50% to 1.00%, depending upon Brown & Brown’s quarterly ratio of funded debt to earnings before interest, taxes, depreciation,
37
amortization and non-cash stock grant compensation. The 90-day LIBOR was 4.70% and 5.36% as of December 31, 2007 and 2006, respectively. The loan was fully funded on January 3, 2001 and was to be repaid in equal quarterly installments of $3,200,000 through December 2007. As of December 31, 2007 the outstanding balance had been paid in full.
All four of these credit agreements require that we maintain certain financial ratios and comply with certain other covenants. We were in compliance with all such covenants as of December 31, 2007 and 2006.
Neither we nor our subsidiaries has ever incurred off-balance sheet obligations through the use of, or investment in, off-balance sheet derivative financial instruments or structured finance or special purpose entities organized as corporations, partnerships or limited liability companies or trusts.
We believe that our existing cash, cash equivalents, short-term investment portfolio and funds generated from operations, together with our Master Agreement and the Revolving Agreement described above, will be sufficient to satisfy our normal liquidity needs through at least the end of 2008. Additionally, we believe that funds generated from future operations will be sufficient to satisfy our normal liquidity needs, including the required annual principal payments on our long-term debt.
Historically, much of our cash has been used for acquisitions. If additional acquisition opportunities should become available that exceed our current cash flow, we believe that given our relatively low debt-to-total capitalization ratio, we would have the ability to raise additional capital through either the private or public debt markets.
In December 2001, a universal “shelf” registration statement that we filed with the Securities and Exchange Commission (SEC) covering the public offering and sale, from time to time, of an aggregate of up to $250 million of debt and/or equity securities, was declared effective. The net proceeds from the sale of such securities could be used to fund acquisitions and for general corporate purposes, including capital expenditures, and to meet working capital needs. A common stock follow-on offering of 5,000,000 shares in March 2002 was made pursuant to this “shelf” registration statement. As of December 31, 2007, approximately $90.0 million of the universal “shelf” registration remains available. If we needed to publicly raise additional funds, we may need to register additional securities with the SEC.
ITEM 7A.Quantitative and Qualitative Disclosures About Market Risk.
Market risk is the potential loss arising from adverse changes in market rates and prices, such as interest rates and equity prices. We are exposed to market risk through our investments, revolving credit line and term loan agreements.
Our invested assets are held as cash and cash equivalents, restricted cash and investments, available-for-sale marketable equity securities, non-marketable equity securities and certificates of deposit. These investments are subject to interest rate risk and equity price risk. The fair values of our cash and cash equivalents, restricted cash and investments, and certificates of deposit at December 31, 2007 and 2006 approximated their respective carrying values due to their short-term duration and therefore such market risk is not considered to be material.
We do not actively invest or trade in equity securities. In addition, we generally dispose of any significant equity securities received in conjunction with an acquisition shortly after the acquisition date. As of December 31, 2006, our largest security investment was 559,970 common stock shares of Rock-Tenn Company, a New York Stock Exchange listed company, which we owned for more than 25 years. Our investment in Rock-Tenn Company accounted for 81% of the total value of available-for-sale marketable equity securities, non-marketable equity securities and certificates of deposit as of December 31, 2006. In 2007, we sold our investment in Rock-Tenn Company for a net gain of $18.7 million. As of December 31, 2007, we have no remaining shares of Rock-Tenn Company and thus have no current exposure to equity price risk relating to the common stock of Rock-Tenn Company.
To hedge the risk of increasing interest rates from January 2, 2002 through the remaining six years of our seven-year $90 million term loan, on December 5, 2001 we entered into an interest rate exchange, or “swap”, agreement
38
that effectively converted the floating rate interest payments based on LIBOR to fixed interest rate payments at 4.53%. This agreement did not impact or change the required 0.50% to 1.00% credit risk spread portion of the term loan. We do not otherwise enter into derivatives, swaps or other similar financial instruments for trading or speculative purposes. As of December 31, 2007, the interest rate swap agreement expired in conjunction with final principal payment on the term loan.
39
ITEM 8.Financial Statements and Supplementary Data.
Index to Consolidated Financial Statements
| Page No. | ||||||
|---|---|---|---|---|---|---|
| Consolidated Statements of Income for the years ended December 31, 2007, 2006 and 2005 | 41 | |||||
| Consolidated Balance Sheets as of December 31, 2007 and 2006 | 42 | |||||
| Consolidated Statements of Shareholders’ Equity for the years ended December 31, 2007, 2006 and 2005 | 43 | |||||
| Consolidated Statements of Cash Flows for the years ended December 31, 2007, 2006 and 2005 | 44 | |||||
| Notes to Consolidated Financial Statements for the years ended December 31, 2007, 2006 and 2005 | 45 | |||||
| Note 1: Summary of Significant Accounting Policies | 45 | |||||
| Note 2: Business Combinations | 51 | |||||
| Note 3: Goodwill | 54 | |||||
| Note 4: Amortizable Intangible Assets | 54 | |||||
| Note 5: Investments | 55 | |||||
| Note 6: Fixed Assets | 55 | |||||
| Note 7: Accrued Expenses | 56 | |||||
| Note 8: Long-Term Debt | 56 | |||||
| Note 9: Income Taxes | 57 | |||||
| Note 10: Employee Savings Plan | 59 | |||||
| Note 11: Stock-Based Compensation | 59 | |||||
| Note 12: Supplemental Disclosures of Cash Flow Information | 62 | |||||
| Note 13: Commitments and Contingencies | 63 | |||||
| Note 14: Business Concentrations | 65 | |||||
| Note 15: Quarterly Operating Results (Unaudited) | 66 | |||||
| Note 16: Segment Information | 66 | |||||
| Note 17: Subsequent Events | 67 | |||||
| Report of Independent Registered Public Accounting Firm | 69 | |||||
| Management’s Report on Internal Control Over Financial Reporting | 70 | |||||
40
BROWN & BROWN, INC.
CONSOLIDATED STATEMENTS OF
INCOME
CONSOLIDATED STATEMENTS OF
INCOME
| Year Ended December 31, | |||||||||||||||
|---|---|---|---|---|---|---|---|---|---|---|---|---|---|---|---|
| (in thousands, except per share data) | 2007 | 2006 | 2005 | ||||||||||||
REVENUES | |||||||||||||||
| Commissions and fees | $ | 914,650 | $ | 864,663 | $ | 775,543 | |||||||||
| Investment income | 30,494 | 11,479 | 6,578 | ||||||||||||
| Other income, net | 14,523 | 1,862 | 3,686 | ||||||||||||
| Total revenues | 959,667 | 878,004 | 785,807 | ||||||||||||
EXPENSES | |||||||||||||||
| Employee compensation and benefits | 444,101 | 404,891 | 374,943 | ||||||||||||
| Non-cash stock-based compensation | 5,667 | 5,416 | 3,337 | ||||||||||||
| Other operating expenses | 131,371 | 126,492 | 105,622 | ||||||||||||
| Amortization | 40,436 | 36,498 | 33,245 | ||||||||||||
| Depreciation | 12,763 | 11,309 | 10,061 | ||||||||||||
| Interest | 13,802 | 13,357 | 14,469 | ||||||||||||
| Total expenses | 648,140 | 597,963 | 541,677 | ||||||||||||
| Income before income taxes | 311,527 | 280,041 | 244,130 | ||||||||||||
| Income taxes | 120,568 | 107,691 | 93,579 | ||||||||||||
| Net income | $ | 190,959 | $ | 172,350 | $ | 150,551 | |||||||||
| Net income per share: | |||||||||||||||
| Basic | $ | 1.36 | $ | 1.23 | $ | 1.09 | |||||||||
| Diluted | $ | 1.35 | $ | 1.22 | $ | 1.08 | |||||||||
| Weighted average number of shares outstanding: | |||||||||||||||
| Basic | 140,476 | 139,634 | 138,563 | ||||||||||||
| Diluted | 141,257 | 141,020 | 139,776 | ||||||||||||
| Dividends declared per share | $ | 0.25 | $ | 0.21 | $ | 0.17 | |||||||||
See accompanying notes to consolidated financial statements.
41
BROWN & BROWN, INC.
CONSOLIDATED
BALANCE SHEETS
CONSOLIDATED
BALANCE SHEETS
| At December 31, | |||||||||||
|---|---|---|---|---|---|---|---|---|---|---|---|
| (in thousands, except per share data) | 2007 | 2006 | |||||||||
ASSETS | |||||||||||
| Current Assets: | |||||||||||
| Cash and cash equivalents | $ | 38,234 | $ | 88,490 | |||||||
| Restricted cash and investments | 254,404 | 242,187 | |||||||||
| Short-term investments | 2,892 | 2,909 | |||||||||
| Premiums, commissions and fees receivable | 240,680 | 282,440 | |||||||||
| Deferred income taxes | 17,208 | — | |||||||||
| Other current assets | 33,964 | 32,180 | |||||||||
| Total current assets | 587,382 | 648,206 | |||||||||
| Fixed assets, net | 62,327 | 44,170 | |||||||||
| Goodwill | 846,433 | 684,521 | |||||||||
| Amortizable intangible assets, net | 443,224 | 396,069 | |||||||||
| Investments | 355 | 15,826 | |||||||||
| Other assets | 20,938 | 19,160 | |||||||||
| Total assets | $ | 1,960,659 | $ | 1,807,952 | |||||||
LIABILITIES AND SHAREHOLDERS’ EQUITY | |||||||||||
| Current Liabilities: | |||||||||||
| Premiums payable to insurance companies | $ | 394,034 | $ | 435,449 | |||||||
| Premium deposits and credits due customers | 41,211 | 33,273 | |||||||||
| Accounts payable | 18,760 | 17,854 | |||||||||
| Accrued expenses | 90,599 | 86,009 | |||||||||
| Current portion of long-term debt | 11,519 | 18,082 | |||||||||
| Total current liabilities | 556,123 | 590,667 | |||||||||
| Long-term debt | 227,707 | 226,252 | |||||||||
| Deferred income taxes, net | 65,736 | 49,721 | |||||||||
| Other liabilities | 13,635 | 11,967 | |||||||||
| Commitments and contingencies (Note 13) | |||||||||||
| Shareholders’ Equity: | |||||||||||
| Common stock, par value $0.10 per share; authorized 280,000 shares; issued and outstanding 140,673 at 2007 and 140,016 at 2006 | 14,067 | 14,002 | |||||||||
| Additional paid-in capital | 231,888 | 210,543 | |||||||||
| Retained earnings | 851,490 | 695,656 | |||||||||
| Accumulated other comprehensive income, net of related income tax effect of $8 at 2007 and $5,359 at 2006 | 13 | 9,144 | |||||||||
| Total shareholders’ equity | 1,097,458 | 929,345 | |||||||||
| Total liabilities and shareholders’ equity | $ | 1,960,659 | $ | 1,807,952 | |||||||
See accompanying notes to consolidated financial statements.
42
BROWN & BROWN, INC.
CONSOLIDATED STATEMENTS OF SHAREHOLDERS’ EQUITY
CONSOLIDATED STATEMENTS OF SHAREHOLDERS’ EQUITY
| Common Stock | ||||||||||||||||||||||||||
|---|---|---|---|---|---|---|---|---|---|---|---|---|---|---|---|---|---|---|---|---|---|---|---|---|---|---|
| (in thousands, except per share data) | Shares Outstanding | Par Value | Additional Paid-In Capital | Retained Earnings | Accumulated Other Comprehensive Income | Total | ||||||||||||||||||||
| Balance at January 1, 2005 | 138,318 | $ | 13,832 | $ | 180,364 | $ | 425,662 | $ | 4,467 | $ | 624,325 | |||||||||||||||
| Net income | 150,551 | 150,551 | ||||||||||||||||||||||||
| Net unrealized holding loss on available-for-sale securities | (512 | ) | (512 | ) | ||||||||||||||||||||||
| Net gain on cash-flow hedging derivative | 491 | 491 | ||||||||||||||||||||||||
| Comprehensive income | 150,530 | |||||||||||||||||||||||||
| Common stock issued for employee stock benefit plans | 1,057 | 105 | 12,769 | 12,874 | ||||||||||||||||||||||
| Common stock issued to directors | 8 | 1 | 180 | 181 | ||||||||||||||||||||||
| Cash dividends paid ($0.17 per share) | (23,566 | ) | (23,566 | ) | ||||||||||||||||||||||
Balance at December 31, 2005 | 139,383 | 13,938 | 193,313 | 552,647 | 4,446 | 764,344 | ||||||||||||||||||||
| Net income | 172,350 | 172,350 | ||||||||||||||||||||||||
| Net unrealized holding gain on available-for-sale securities | 4,697 | 4,697 | ||||||||||||||||||||||||
| Net gain on cash-flow hedging derivative | 1 | 1 | ||||||||||||||||||||||||
| Comprehensive income | 177,048 | |||||||||||||||||||||||||
| Common stock issued for employee stock benefit plans | 624 | 62 | 16,372 | 16,434 | ||||||||||||||||||||||
| Income tax benefit from exercise of stock options | 604 | 604 | ||||||||||||||||||||||||
| Common stock issued to directors | 9 | 2 | 254 | 256 | ||||||||||||||||||||||
| Cash dividends paid ($0.21 per share) | (29,341 | ) | (29,341 | ) | ||||||||||||||||||||||
Balance at December 31, 2006 | 140,016 | 14,002 | 210,543 | 695,656 | 9,144 | 929,345 | ||||||||||||||||||||
| Net income | 190,959 | 190,959 | ||||||||||||||||||||||||
| Net unrealized holding gain on available-for-sale securities less amounts realized from sales in the current year | (9,093 | ) | (9,093 | ) | ||||||||||||||||||||||
| Net loss on cash-flow hedging derivative | (38 | ) | (38 | ) | ||||||||||||||||||||||
| Comprehensive income | 181,828 | |||||||||||||||||||||||||
| Common stock issued for employee stock benefit plans | 647 | 64 | 16,495 | 16,559 | ||||||||||||||||||||||
| Income tax benefit from exercise of stock options | 4,564 | 4,564 | ||||||||||||||||||||||||
| Common stock issued to directors | 10 | 1 | 286 | 287 | ||||||||||||||||||||||
| Cash dividends paid ($0.25 per share) | (35,125 | ) | (35,125 | ) | ||||||||||||||||||||||
Balance at December 31, 2007 | 140,673 | $ | 14,067 | $ | 231,888 | $ | 851,490 | $ | 13 | $ | 1,097,458 | |||||||||||||||
See accompanying notes to consolidated financial statements.
43
BROWN & BROWN, INC.
CONSOLIDATED STATEMENTS OF
CASH FLOWS
CONSOLIDATED STATEMENTS OF
CASH FLOWS
| Year Ended December 31, | |||||||||||||||
|---|---|---|---|---|---|---|---|---|---|---|---|---|---|---|---|
| (in thousands) | 2007 | 2006 | 2005 | ||||||||||||
Cash flows from operating activities: | |||||||||||||||
| Net income | $ | 190,959 | $ | 172,350 | $ | 150,551 | |||||||||
| Adjustments to reconcile net income to net cash provided by operating activities: | |||||||||||||||
| Amortization | 40,436 | 36,498 | 33,245 | ||||||||||||
| Depreciation | 12,763 | 11,309 | 10,061 | ||||||||||||
| Non-cash stock-based compensation | 5,667 | 5,416 | 3,337 | ||||||||||||
| Deferred income taxes | 325 | 11,480 | 10,642 | ||||||||||||
| Net gain on sales of investments, fixed assets and customer accounts | (30,944 | ) | (781 | ) | (2,478 | ) | |||||||||
| Changes in operating assets and liabilities, net of effect from acquisitions and divestitures: | |||||||||||||||
| Restricted cash and investments (increase) | (12,217 | ) | (12,315 | ) | (82,389 | ) | |||||||||
| Premiums, commissions and fees receivable decrease (increase) | 45,059 | (23,564 | ) | (84,058 | ) | ||||||||||
| Other assets decrease (increase) | 6,357 | (6,301 | ) | 1,072 | |||||||||||
| Premiums payable to insurance companies (decrease) increase | (53,119 | ) | 27,314 | 153,032 | |||||||||||
| Premium deposits and credits due customers increase (decrease) | 6,723 | (754 | ) | 1,754 | |||||||||||
| Accounts payable increase (decrease) | 533 | (3,561 | ) | 4,377 | |||||||||||
| Accrued expenses increase | 2,913 | 8,441 | 14,854 | ||||||||||||
| Other liabilities (decrease) increase | (115 | ) | (318 | ) | 1,088 | ||||||||||
Net cash provided by operating activities | 215,340 | 225,214 | 215,088 | ||||||||||||
Cash flows from investing activities: | |||||||||||||||
| Additions to fixed assets | (30,643 | ) | (14,979 | ) | (13,426 | ) | |||||||||
| Payments for businesses acquired, net of cash acquired | (212,303 | ) | (143,737 | ) | (262,181 | ) | |||||||||
| Proceeds from sales of fixed assets and customer accounts | 6,713 | 1,399 | 2,362 | ||||||||||||
| Purchases of investments | (2,695 | ) | (211 | ) | (299 | ) | |||||||||
| Proceeds from sales of investments | 21,715 | 119 | 896 | ||||||||||||
Net cash used in investing activities | (217,213 | ) | (157,409 | ) | (272,648 | ) | |||||||||
Cash flows from financing activities: | |||||||||||||||
| Proceeds from long-term debt | — | 25,000 | — | ||||||||||||
| Payments on long-term debt | (29,142 | ) | (87,432 | ) | (16,117 | ) | |||||||||
| Borrowings on revolving credit facility | 26,320 | 40,000 | 50,000 | ||||||||||||
| Payments on revolving credit facility | (26,320 | ) | (40,000 | ) | (50,000 | ) | |||||||||
| Income tax benefit from exercise of stock options | 4,564 | 604 | — | ||||||||||||
| Issuances of common stock for employee stock benefit plans | 11,320 | 11,274 | 9,717 | ||||||||||||
| Cash dividends paid | (35,125 | ) | (29,341 | ) | (23,566 | ) | |||||||||
Net cash (used in) provided by financing activities | (48,383 | ) | (79,895 | ) | (29,966 | ) | |||||||||
Net (decrease) increase in cash and cash equivalents | (50,256 | ) | (12,090 | ) | (87,526 | ) | |||||||||
| Cash and cash equivalents at beginning of year | 88,490 | 100,580 | 188,106 | ||||||||||||
Cash and cash equivalents at end of year | $ | 38,234 | $ | 88,490 | $ | 100,580 | |||||||||
See accompanying notes to consolidated financial statements.
44
Notes to Consolidated Financial Statements
NOTE 1 • Summary of Significant Accounting Policies
Nature of Operations
Brown & Brown, Inc., a Florida corporation, and its subsidiaries (collectively, “Brown & Brown” or the “Company”) is a diversified insurance agency, wholesale brokerage, insurance programs and services organization that markets and sells to its customers insurance products and services, primarily in the property and casualty area. Brown & Brown’s business is divided into four reportable segments: the Retail Division, which provides a broad range of insurance products and services to commercial, public entity, professional and individual customers; the Wholesale Brokerage Division, which markets and sells excess and surplus commercial insurance and reinsurance, primarily through independent agents and brokers; the National Programs Division, which is comprised of two units — Professional Programs, which provides professional liability and related package products for certain professionals delivered through nationwide networks of independent agents, and Special Programs, which markets targeted products and services designated for specific industries, trade groups, governmental entities and market niches; and the Services Division, which provides insurance-related services, including third-party claims administration and comprehensive medical utilization management services in both the workers’ compensation and all-lines liability arenas, as well as Medicare set-aside services.
Principles of Consolidation
The accompanying Consolidated Financial Statements include the accounts of Brown & Brown, Inc. and its subsidiaries. All significant intercompany account balances and transactions have been eliminated in the Consolidated Financial Statements.
Revenue Recognition
Commission revenue is recognized as of the effective date of the insurance policy or the date on which the policy premium is billed to the customer, whichever is later. At that date, the earnings process has been completed and Brown & Brown can reliably estimate the impact of policy cancellations for refunds and establish reserves accordingly. The reserve for policy cancellations is based upon historical cancellation experience adjusted by known circumstances. The policy cancellation reserve was $8,339,000 and $7,432,000 at December 31, 2007 and 2006, respectively, and is periodically evaluated and adjusted as necessary. Subsequent commission adjustments are recognized upon notification from the insurance companies. Commission revenues are reported net of commissions paid to sub-brokers or co-brokers. Profit-sharing contingent commissions from insurance companies are recognized when determinable, which is when such commissions are received, or when officially notified. Fee income is recognized as services are rendered.
Use of Estimates
The preparation of Consolidated Financial Statements in conformity with accounting principles generally accepted in the United States of America (“GAAP”) requires management to make estimates and assumptions that affect the reported amounts of assets and liabilities, as well as disclosures of contingent assets and liabilities, at the date of the Consolidated Financial Statements and the reported amounts of revenues and expenses during the reporting period. Actual results may differ from those estimates.
Cash and Cash Equivalents
Cash and cash equivalents principally consist of demand deposits with financial institutions and highly liquid investments having maturities of three months or less when purchased.
Restricted Cash and Investments, and Premiums, Commissions and Fees Receivable
In its capacity as an insurance agent or broker, Brown & Brown typically collects premiums from insureds and, after deducting its authorized commissions, remits the net premiums to the appropriate insurance companies. Accordingly, as reported in the Consolidated Balance Sheets, “premiums” are receivable from insureds. Unremitted
45
net insurance premiums are held in a fiduciary capacity until disbursed by Brown & Brown. Brown & Brown invests these unremitted funds only in cash, money market accounts, tax-free variable-rate demand bonds and commercial paper held for a short term, and reports such amounts as restricted cash on the Consolidated Balance Sheets. In certain states where Brown & Brown operates, the use and investment alternatives for these funds are regulated by various state agencies. The interest income earned on these unremitted funds is reported as investment income in the Consolidated Statements of Income.
In other circumstances, the insurance companies collect the premiums directly from the insureds and remit the applicable commissions to Brown & Brown. Accordingly, as reported in the Consolidated Balance Sheets, “commissions” are receivable from insurance companies. “Fees” are primarily receivables due from customers.
Investments
Marketable equity securities held by Brown & Brown have been classified as “available-for-sale” and are reported at estimated fair value, with the accumulated other comprehensive income (unrealized gains and losses), net of related income tax effect, reported as a separate component of shareholders’ equity. Realized gains and losses and declines in value below cost that are judged to be other-than-temporary on available-for-sale securities are reflected in investment income. The cost of securities sold is based on the specific identification method. Interest and dividends on securities classified as available-for-sale are included in investment income in the Consolidated Statements of Income.
As of December 31, 2006, Brown & Brown’s marketable equity securities principally represented a long-term investment of 559,970 shares of common stock in Rock-Tenn Company. Brown & Brown’s Chief Executive Officer serves on the board of directors of Rock-Tenn Company. During 2007, Brown & Brown sold its investment in Rock Tenn for an $18,664,000 million gain in excess of our original cost basis. As of December 31, 2007, Brown & Brown’s remaining marketable equity securities were valued at less than $50,000.
Non-marketable equity securities and certificates of deposit having maturities of more than three months when purchased are reported at cost and are adjusted for other-than-temporary market value declines.
Net unrealized holding gains on available-for-sale securities included in accumulated other comprehensive income reported in shareholders’ equity were $13,000 at December 31, 2007 and $9,106,000 at December 31, 2006, net of deferred income taxes of $8,000 and $5,337,000, respectively.
Fixed Assets
Fixed assets including leasehold improvements are carried at cost, less accumulated depreciation and amortization. Expenditures for improvements are capitalized, and expenditures for maintenance and repairs are expensed to operations as incurred. Upon sale or retirement, the cost and related accumulated depreciation and amortization are removed from the accounts and the resulting gain or loss, if any, is reflected in other income. Depreciation has been determined using the straight-line method over the estimated useful lives of the related assets, which range from three to 15 years. Leasehold improvements are amortized on the straight-line method over the term of the related lease.
Goodwill and Amortizable Intangible Assets
The excess of the purchase price of an acquisition over the fair value of the identifiable tangible and amortizable intangible assets is assigned to goodwill. While goodwill is not amortizable, it is now subject to at least an annual assessment for impairment by applying a fair-value based test. Amortizable intangible assets are amortized over their economic lives and are subject to lower-of-cost-or-market impairment testing. The Company compares the fair value of each reporting unit with its carrying amount to determine if there is potential impairment of goodwill. If the fair value of the reporting unit is less than its carrying value, an impairment loss would be recorded to the extent that the fair value of the goodwill within the reporting unit is less than its carrying value. Fair value is estimated based on multiples of revenues and earnings before interest, income taxes, depreciation and amortization (“EBITDA��). Brown & Brown completed its most recent annual assessment as of November 30, 2007 and identified no impairment as a result of the evaluation.
Amortizable intangible assets are stated at cost, less accumulated amortization, and consist of purchased customer accounts and noncompete agreements. Purchased customer accounts and noncompete agreements are
46
being amortized on a straight-line basis over the related estimated lives and contract periods, which range from five to 15 years. Purchased customer accounts primarily consist of records and files that contain information about insurance policies and the related insured parties that are essential to policy renewals.
The carrying value of intangibles attributable to each division comprising Brown & Brown is periodically reviewed by management to determine if the facts and circumstances suggest that they may be impaired. In the insurance agency and wholesale brokerage industry, it is common for agencies or customer accounts to be acquired at a price determined as a multiple of either their corresponding revenues or EBITDA. Accordingly, Brown & Brown assesses the carrying value of its intangible assets by comparison of a reasonable multiple applied to either corresponding revenues or EBITDA, as well as considering the estimated future cash flows generated by the corresponding division. Any impairment identified through this assessment may require that the carrying value of related intangible assets be adjusted; however, no impairments have been recorded for the years ended December 31, 2007 and 2006.
Derivatives
Until December 2007, Brown & Brown utilized a derivative financial instrument to reduce interest rate risk. Brown & Brown does not hold or issue derivative financial instruments for trading purposes. In June 1998, the Financial Accounting Standards Board (“FASB”) issued Statement of Financial Accounting Standards (“SFAS”) No. 133, “Accounting for Derivative Instruments and Hedging Activities” (“SFAS No. 133”), which was subsequently amended by SFAS Nos. 137, 138 and 149. SFAS No. 133, as amended, establishes accounting and reporting standards for derivative instruments and hedging activities. These standards require that an entity recognize all derivatives as either assets or liabilities in its balance sheet and measure those instruments at fair value. Changes in the fair value of those instruments will be reported in earnings or other comprehensive income, depending on the use of the derivative and whether it qualifies for hedge accounting. The accounting for gains and losses associated with changes in the fair value of the derivative, and the resulting effect on the consolidated financial statements, will depend on the derivative’s hedge designation and whether the hedge is highly effective in achieving offsetting changes in the fair value of cash flows as compared to changes in the fair value of the liability being hedged. As of December 31, 2007, the interest rate exchange, or “swap”, agreement expired in conjunction with the final payment of the related term loan agreement.
Income Taxes
Brown & Brown records income tax expense using the asset and liability method of accounting for deferred income taxes. Under this method, deferred tax assets and liabilities are recognized for the expected future tax consequences of temporary differences between the financial statement carrying values and the income tax bases of Brown & Brown’s assets and liabilities.
Brown & Brown files a consolidated federal income tax return and has elected to file consolidated returns in certain states. Deferred income taxes are provided for in the Consolidated Financial Statements and relate principally to expenses charged to income for financial reporting purposes in one period and deducted for income tax purposes in other periods.
Net Income Per Share
Basic net income per share for a given period is computed by dividing net income available to shareholders by the weighted average number of shares outstanding for the period. Basic net income per share excludes dilution. Diluted net income per share reflects the potential dilution that could occur if stock options or other contracts to issue common stock were exercised or converted to common stock.
47
The following table sets forth the computation of basic net income per share and diluted net income per share:
| Year Ended December 31, | |||||||||||||||
|---|---|---|---|---|---|---|---|---|---|---|---|---|---|---|---|
| (in thousands, except per share data) | 2007 | 2006 | 2005 | ||||||||||||
| Net income | $ | 190,959 | $ | 172,350 | $ | 150,551 | |||||||||
| Weighted average number of common shares outstanding | 140,476 | 139,634 | 138,563 | ||||||||||||
| Dilutive effect of stock options using the treasury stock method | 781 | 1,386 | 1,213 | ||||||||||||
| Weighted average number of shares outstanding | 141,257 | 141,020 | 139,776 | ||||||||||||
| Net income per share: | |||||||||||||||
| Basic | $ | 1.36 | $ | 1.23 | $ | 1.09 | |||||||||
| Diluted | $ | 1.35 | $ | 1.22 | $ | 1.08 | |||||||||
All share and per share amounts in the consolidated financial statements have been restated to give effect to the two-for-one common stock split effected by Brown & Brown on November 28, 2005. The stock split was effected as a stock dividend.
Fair Value of Financial Instruments
The carrying amounts of Brown & Brown’s financial assets and liabilities, including cash and cash equivalents, restricted cash and investments, investments, premiums, commissions and fees receivable, premiums payable to insurance companies, premium deposits and credits due customers and accounts payable, at December 31, 2007 and 2006, approximate fair value because of the short-term maturity of these instruments. The carrying amount of Brown & Brown’s long-term debt approximates fair value at December 31, 2007 and 2006 since the related coupon rate approximates the current market rate. Brown & Brown’s one interest rate swap agreement is reported at its fair value as of December 31, 2006. As of December 31, 2007, this interest rate swap agreement expired at the time the related term loan agreement was paid off.
New Accounting Pronouncement
Accounting for Uncertainty in Income Taxes — In June 2006, the Financial Accounting Standards Board (“FASB”) issued Interpretation No. 48, Accounting for Uncertainty in Income Taxes—An interpretation of FASB Statement 109 (“FIN 48”). FIN 48 prescribes a recognition threshold of more-likely-than-not, and a measurement attribute for all tax positions taken or expected to be taken on a tax return, in order for those tax positions to be recognized in the financial statements. Effective January 1, 2007, the Company adopted the provisions of FIN 48 and there was no significant effect on the financial statements.
As of January 1, 2007, the Company provided a liability in the amount of $591,022 of unrecognized tax benefits related to various federal and state income tax matters. Of this amount, $591,022 would impact the Company’s effective tax rate if recognized. The Company does not expect that the amounts of unrecognized tax benefits will change significantly within the next 12 months.
The Company is no longer subject to US Federal Income Tax examination by tax authorities for the years before 2004. The Company and its subsidiaries’ state income tax returns are open to audit under the statute of limitations for the years ended December 31, 2002 through 2006. During the fourth quarter of 2007, the Internal Revenue Service (“IRS”) completed the examination of the Company’s US Federal Income Tax Return for 2004, 2005 and 2006. In addition, in the fourth quarter, the Department of Revenue for the State of Florida completed an examination of for the tax years ended December 31, 2003 through 2005.
The Company recognizes accrued interest and penalties related to uncertain tax positions in federal and state
48
income tax expense. During 2007, the Company accrued and paid $1,386,000 of interest and penalties related to the settlement of the Company’s 2004, 2005 and 2006 federal income tax audit. This amount includes $65,600 in interest and penalties related to the adoption of FIN 48 in the first quarter of 2007.
Fair Value Measurements — In September 2006, the FASB issued SFAS No. 157, Fair Value Measurements (“SFAS 157”). SFAS 157 establishes a framework for the measurement of assets and liabilities that uses fair value and expands disclosures about fair value measurements. SFAS 157 will apply whenever another GAAP standard requires (or permits) assets or liabilities to be measured at fair value but does not expand the use of fair value to any new circumstances. SFAS 157 is effective for financial statements issued for fiscal years beginning after November 15, 2007 and for all interim periods within those fiscal years. Accordingly, the Company will be required to adopt SFAS 157 in the first quarter of 2008. The Company is currently evaluating the impact that the adoption of SFAS 157 will have, if any, on its consolidated financial statements and notes thereto.
In February 2007, the FASB issued SFAS No. 159, The Fair Value Option for Financial Assets and Financial Liabilities, Including an Amendment of FASB Statement No. 115 (“SFAS 159”). SFAS 159 permits entities to choose to measure many financial assets and financial liabilities at fair value. Unrealized gains and losses on items for which the fair value option has been elected are reported in earnings. SFAS 159 is effective for fiscal years beginning after November 15, 2007. The Company is currently evaluating the potential impact this standard may have on its financial position and results of operations.
Business Combinations — In December 2007, the FASB issued SFAS No. 141(R), Business Combinations (“SFAS 141R”). SFAS 141R requires that upon initially obtaining control, an acquirer will recognize 100% of the fair values of acquired assets, including goodwill, and assumed liabilities, with only limited exceptions, even if the acquirer has not acquired 100% of its target. Additionally, contingent consideration arrangements will be fair valued at the acquisition date and included on that basis in the purchase price consideration. Transaction costs will be expensed as incurred. SFAS 141R also modifies the recognition for preacquisition contingencies, such as environmental or legal issues, restructuring plans and acquired research and development value in purchase accounting. SFAS 141R amends SFAS No. 109, Accounting for Income Taxes, to require the acquirer to recognize changes in the amount of its deferred tax benefits that are recognizable because of a business combination, either in income from continuing operations in the period of the combination or directly in contributed capital, depending on the circumstances. SFAS 141R is effective for fiscal years beginning after December 15, 2008. Adoption is prospective and early adoption is not permitted. The Company expects to adopt SFAS 141R on January 1, 2009 and is currently assessing the potential impact that the adoption could have on the Company’s financial statements.
Noncontrolling Interests in Consolidated Financial Statements — In December 2007, the FASB issued SFAS No. 160, Noncontrolling Interests in Consolidated Financial Statements (“SFAS 160”), an amendment of Accounting Research Bulletin (“ARB”) No. 51 (“ARB 51”). SFAS 160 clarifies the classification of noncontrolling interests in consolidated statements of financial position and the accounting for, and reporting of, transactions between the reporting entity and holders of such noncontrolling interests. Under SFAS 160, noncontrolling interests are considered equity and should be reported as an element of consolidated equity. Net income will encompass the total income of all consolidated subsidiaries and there will be separate disclosure on the face of the income statement of the attribution of that income between the controlling and noncontrolling interests; increases and decreases in the noncontrolling ownership interest amount will be accounted for as equity transactions. SFAS 160 is effective for the first annual reporting period beginning on or after December 15, 2008, and earlier application is prohibited. SFAS 160 is required to be adopted prospectively, except for reclassify noncontrolling interests to equity, separate from the parent’s shareholders’ equity, in the consolidated statement of financial position and recasting consolidated net income (loss) to include net income (loss) attributable to both the controlling and noncontrolling interests, both of which are required to be adopted retrospectively. Since all of our subsidiaries are 100% owned, we do not expect the adoption of SFAS 160 will have a significant impact to our financial statements.
Stock-Based Compensation — The Company grants stock options and non-vested stock awards (previously referred to as “restricted stock”) to its employees, officers and directors. Effective January 1, 2006, the Company adopted the provisions of SFAS No. 123R, Share-Based Payment (“SFAS 123R”), for its stock-based compensation plans. Among other things, SFAS 123R requires that compensation expense for all share-based awards be recognized in the financial statements based upon the grant-date fair value of those awards over the vesting period.
49
Prior to January 1, 2006, the Company accounted for stock-based compensation using the recognition and measurement provisions of Accounting Principles Board Opinion No. 25, Accounting for Stock Issued to Employees (“APB No. 25”), and related interpretations, and disclosure requirements established by SFAS No. 123, Accounting for Stock-Based Compensation (“SFAS 123”), as amended by SFAS No. 148, Accounting for Stock-Based Compensation — Transitions and Disclosures (“SFAS 148”).
Under APB No. 25, no compensation expense was recognized for either stock options issued under the Company’s stock compensation plans or for stock purchased under the Company’s 1990 Employee Stock Purchase Plan (“ESPP”). The pro forma effects on net income and earnings per share for stock options and ESPP stock purchases were instead disclosed in a footnote to the financial statements. Compensation expense was previously recognized for awards of non-vested stock, based upon the market value of the common stock on the date of award, on a straight-line basis over the requisite service period with the effect of forfeitures recognized as they occurred.
The following table represents the pro forma information for the years ended December 31, 2005 (as previously disclosed) under the Company’s stock compensation plans had the compensation cost for the stock options and common stock purchased under the ESPP been determined based on the fair value at the grant-date consistent with the method prescribed by SFAS No. 123R:
| (in thousands, except per share data) | Year Ended December 31, 2005 | |||||
|---|---|---|---|---|---|---|
| Net income as reported | $ | 150,551 | ||||
| Total stock-based employee compensation cost included in the determination of net income, net of related income tax effects | 2,061 | |||||
| Total stock-based employee compensation cost determined under fair value method for all awards, net of related income tax effects | (5,069 | ) | ||||
| Pro forma net income | $ | 147,543 | ||||
| Net income per share: | ||||||
| Basic, as reported | $ | 1.09 | ||||
| Basic, pro forma | $ | 1.06 | ||||
| Diluted, as reported | $ | 1.08 | ||||
| Diluted, pro forma | $ | 1.06 | ||||
The Company has adopted SFAS 123R using the modified-prospective transition method. Under this transition method, compensation cost recognized for the years ended December 31, 2007 and 2006 includes:
| • | Compensation cost for all share-based awards (expected to vest) granted prior to, but not yet vested as of, January 1, 2006, based upon grant-date fair value estimated in accordance with the original provisions of SFAS 123; and |
| • | Compensation cost for all share-based awards (expected to vest) granted during the years ended December 31, 2007 and 2006, based upon grant-date fair value estimated in accordance with the provisions of SFAS 123R. |
Results for prior periods have not been restated.
Upon adoption of SFAS 123R, the Company continued to use the Black-Scholes valuation model for valuing all stock options and shares purchased under the ESPP. Compensation for non-vested stock awards is measured at fair value on the grant-date based upon the number of shares expected to vest. Compensation cost for all awards will be recognized in earnings, net of estimated forfeitures, on a straight-line basis over the requisite service period. The cumulative effect of changing from recognizing compensation expense for non-vested stock awards as forfeitures occurred to recognizing compensation expense for non-vested awards net of estimated forfeitures was not material.
The adoption of SFAS 123R had the following effect on the Company for the years ended December 31, 2007 and 2006:
50
| Year Ended December 31, | |||||||||||
|---|---|---|---|---|---|---|---|---|---|---|---|
| (in thousands) | 2007 | 2006 | |||||||||
| Non-cash stock-based compensation | $ | 17 | $ | (564 | ) | ||||||
| Increase (decrease) in: | |||||||||||
| Provisions for income taxes | 7 | (217 | ) | ||||||||
| Net income | $ | 10 | $ | (347 | ) | ||||||
| Basic earnings per share | $ | — | $ | — | |||||||
| Diluted earnings per share | $ | — | $ | — | |||||||
| Deferred tax liability (asset) | $ | 7 | $ | (217 | ) | ||||||
In addition, prior to the adoption of SFAS 123R, the Company presented tax benefits resulting from the exercise of stock options as operating cash flows in the statement of cash flows. SFAS 123R requires that tax benefits associated with share-based payments be classified under financing activities in the statement of cash flows. This change in presentation in the accompanying Consolidated Statement of Cash Flows has reduced net operating cash flows and increased net financing cash flows by $4,564,000 and $604,000 for the years ended December 31, 2007 and 2006, respectively.
See Note 11 for additional information regarding the Company’s stock-based compensation plans and the assumptions used to calculate the fair value of stock-based awards.
NOTE 2 • Business Combinations
Acquisitions in 2007
During 2007, Brown & Brown acquired the assets and assumed certain liabilities of 38 insurance intermediaries, the stock of three insurance intermediaries and several books of business (customer accounts). The aggregate purchase price of these acquisitions was $241,437,000, including $207,934,000 of net cash payments, the issuance of $13,001,000 in notes payable and the assumption of $20,502,000 of liabilities. Substantially all of these acquisitions were acquired primarily to expand Brown & Brown’s core businesses and to attract and obtain the services of quality individuals. Acquisition purchase prices are typically based on a multiple of average annual operating profits earned over a one- to three-year period within a minimum and maximum price range. The initial asset allocation of an acquisition is based on the minimum purchase price, and any subsequent earn-out payment is allocated to intangible assets. Acquisitions are initially recorded at preliminary fair values. Subsequently, the Company completes the final fair value allocations and any adjustments to assets or liabilities acquired are recorded in the current period.
All of these acquisitions have been accounted for as business combinations and are as follows:
(in thousands)
| Name | Business Segment | 2007 Date of Acquisition | Net Cash Paid | Notes Payable | Recorded Purchase Price | |||||||||||||||||
|---|---|---|---|---|---|---|---|---|---|---|---|---|---|---|---|---|---|---|---|---|---|---|
| ALCOS, Inc | Retail | March 1 | $ | 30,916 | $ | 3,563 | $ | 34,479 | ||||||||||||||
| Grinspec, Inc. | Retail | April 1 | 31,952 | — | 31,952 | |||||||||||||||||
| Sobel Affilates Inc. | Retail | April 1 | 33,057 | — | 33,057 | |||||||||||||||||
| The Combined Group, Inc, et al | Wholesale Brokerage | August 1 | 24,059 | — | 24,059 | |||||||||||||||||
| Evergreen Re, Incorporated. | Wholesale Brokerage | December 1 | 11,021 | 2,000 | 13,021 | |||||||||||||||||
| Other | Various | Various | 76,929 | 7,438 | 84,367 | |||||||||||||||||
| Total | $ | 207,934 | $ | 13,001 | $ | 220,935 | ||||||||||||||||
51
The following table summarizes the estimated fair values of the aggregate assets and liabilities acquired as of the date of each acquisition:
| (in thousands) | ALCOS | Grinspec | Sobel | Combined | Evergreen | Other | Total | |||||||||||||||||||||||
|---|---|---|---|---|---|---|---|---|---|---|---|---|---|---|---|---|---|---|---|---|---|---|---|---|---|---|---|---|---|---|
| Fiduciary cash | $ | 627 | $ | — | $ | — | $ | 2,686 | $ | — | $ | 716 | $ | 4,029 | ||||||||||||||||
| Other current assets | 1,224 | 669 | 286 | — | — | 1,310 | 3,489 | |||||||||||||||||||||||
| Fixed assets | 720 | — | 50 | 212 | 40 | 649 | 1,671 | |||||||||||||||||||||||
| Goodwill | 26,873 | 19,248 | 19,663 | 12,730 | 8,456 | 56,336 | 143,306 | |||||||||||||||||||||||
| Purchased customer accounts | 10,046 | 12,498 | 13,129 | 11,051 | 4,494 | 36,882 | 88,100 | |||||||||||||||||||||||
| Noncompete agreements | 130 | — | 31 | 66 | 31 | 459 | 717 | |||||||||||||||||||||||
| Other Assets | 115 | — | — | — | — | 10 | 125 | |||||||||||||||||||||||
| Total assets acquired | 39,735 | 32,415 | 33,159 | 26,745 | 13,021 | 96,362 | 241,437 | |||||||||||||||||||||||
| Other current liabilities | (2,173 | ) | (463 | ) | (102 | ) | (1,383 | ) | — | (11,246 | ) | (15,367 | ) | |||||||||||||||||
| Deferred income taxes | (3,083 | ) | — | — | — | — | (749 | ) | (3,832 | ) | ||||||||||||||||||||
| Other liabilities | — | — | — | (1,303 | ) | — | — | (1,303 | ) | |||||||||||||||||||||
| Total liabilities assumed | (5,256 | ) | (463 | ) | (102 | ) | (2,686 | ) | — | (11,995 | ) | (20,502 | ) | |||||||||||||||||
| Net assets acquired | $ | 34,479 | $ | 31,952 | $ | 33,057 | $ | 24,059 | $ | 13,021 | $ | 84,367 | $ | 220,935 | ||||||||||||||||
The weighted average useful lives for the above acquired amortizable intangible assets are as follows: purchased customer accounts, 15.0 years; and noncompete agreements, 4.8 years.
Goodwill of $143,306,000, of which $113,462,000 is expected to be deductible for income tax purposes, was assigned to the Retail, Wholesale Brokerage, National Programs and Service Divisions in the amounts of $116,566,000, $25,810,000, $483,000 and $447,000, respectively.
The results of operations for the acquisitions completed during 2007 have been combined with those of the Company since their respective acquisitions dates. If the acquisitions had occurred as of January 1, the Company’s results of operations would be as shown in the following table. These unaudited pro forma results are not necessarily indicative of the actual results of operations that would have occurred had the acquisitions actually been made at the beginning of the respective periods:
| Year Ended December 31, | |||||||||||
|---|---|---|---|---|---|---|---|---|---|---|---|
| (in thousands, except per share data) | 2007 | 2006 | |||||||||
| (UNAUDITED) | |||||||||||
| Total revenues | $ | 1,017,711 | $ | 991,673 | |||||||
| Income before income taxes | $ | 330,525 | $ | 315,223 | |||||||
| Net income | $ | 202,605 | $ | 194,001 | |||||||
| Net income per share: | |||||||||||
| Basic | $ | 1.44 | $ | 1.39 | |||||||
| Diluted | $ | 1.43 | $ | 1.38 | |||||||
| Weighted average number of shares outstanding: | |||||||||||
| Basic | 140,476 | 139,634 | |||||||||
| Diluted | 141,257 | 141,020 | |||||||||
Additional consideration paid to sellers as a result of purchase price “earn-out” provisions are recorded as adjustments to intangible assets when the contingencies are settled. The net additional consideration paid by the Company in 2007 as a result of these adjustments totaled $18,995,000, of which $18,947,000 was allocated to goodwill and $48,000 to noncompete agreements. Of the $18,995,000 net additional consideration paid, $8,397,000 was paid in cash, $10,896,000 was issued in notes payable and $298,000 of net liabilities was forgiven. As of December 31, 2007, the maximum future contingency payments related to acquisitions totaled $226,206,000.
52
Acquisitions in 2006
During 2006, Brown & Brown acquired the assets and assumed certain liabilities of 32 entities. The aggregate purchase price of these acquisitions was $155,869,000, including $138,695,000 of net cash payments, the issuance of $3,696,000 in notes payable and the assumption of $13,478,000 of liabilities. Substantially all of these acquisitions were acquired primarily to expand Brown & Brown’s core businesses and to attract and obtain the services of quality individuals. Acquisition purchase prices are based primarily on a multiple of average annual operating profits earned over a one- to three-year period within a minimum and maximum price range. The initial asset allocation of an acquisition is based on the minimum purchase price, and any subsequent earn-out payment is allocated to goodwill.
All of these acquisitions have been accounted for as business combinations and are as follows:
(in thousands)
| Name | Business Segment | 2006 Date of Acquisition | Net Cash Paid | Notes Payable | Recorded Purchase Price | |||||||||||||||||
|---|---|---|---|---|---|---|---|---|---|---|---|---|---|---|---|---|---|---|---|---|---|---|
| Axiom Intermediaries, LLC | Wholesale Brokerage | January 1 | $ | 60,333 | $ | — | $ | 60,333 | ||||||||||||||
| Delaware Valley Underwriting Agency, Inc., et al (DVUA) | Wholesale Brokerage/ National Programs | September 30 | 46,333 | — | 46,333 | |||||||||||||||||
| Other | Various | Various | 32,029 | 3,696 | 35,725 | |||||||||||||||||
| Total | $ | 138,695 | $ | 3,696 | $ | 142,391 | ||||||||||||||||
The following table summarizes the estimated fair values of the aggregate assets and liabilities acquired as of the date of each acquisition:
| (in thousands) | Axiom | DVUA | Other | Total | ||||||||||||||
|---|---|---|---|---|---|---|---|---|---|---|---|---|---|---|---|---|---|---|
| Fiduciary cash | $ | 9,598 | $ | — | $ | — | $ | 9,598 | ||||||||||
| Other current assets | 445 | 7 | 567 | 1,019 | ||||||||||||||
| Fixed assets | 435 | 648 | 476 | 1,559 | ||||||||||||||
| Purchased customer accounts | 14,022 | 22,667 | 18,682 | 55,371 | ||||||||||||||
| Noncompete agreements | 31 | 52 | 581 | 664 | ||||||||||||||
| Goodwill | 45,600 | 24,942 | 17,107 | 87,649 | ||||||||||||||
| Other assets | — | 9 | — | 9 | ||||||||||||||
| Total assets acquired | 70,131 | 48,325 | 37,413 | 155,869 | ||||||||||||||
| Other current liabilities | (9,798 | ) | (1,843 | ) | (1,496 | ) | (13,137 | ) | ||||||||||
| Other liabilities | — | (149 | ) | (192 | ) | (341 | ) | |||||||||||
| Total liabilities assumed | (9,798 | ) | (1,992 | ) | (1,688 | ) | (13,478 | ) | ||||||||||
| Net assets acquired | $ | 60,333 | $ | 46,333 | $ | 35,725 | $ | 142,391 | ||||||||||
The weighted average useful lives for the above acquired amortizable intangible assets are as follows: purchased customer accounts, 15.0 years; and noncompete agreements, 4.8 years.
Goodwill of $87,649,000, all of which is expected to be deductible for income tax purposes, was assigned to the Retail, Wholesale Brokerage, National Programs and Service Divisions in the amounts of $6,337,000, $67,984,000, $10,561,000 and $2,767,000, respectively.
The results of operations for the acquisitions completed during 2006 have been combined with those of the Company since their respective acquisitions dates. If the acquisitions had occurred as of January 1, the Company’s results of operations would be as shown in the following table. These unaudited pro forma results are not necessarily indicative of the actual results of operations that would have occurred had the acquisitions actually been made at the beginning of the respective periods:
53
| Year Ended December 31, | |||||||||||
|---|---|---|---|---|---|---|---|---|---|---|---|
| (in thousands, except per share data) | 2006 | 2005 | |||||||||
| (UNAUDITED) | |||||||||||
| Total revenues | $ | 902,345 | $ | 842,698 | |||||||
| Income before income taxes | $ | 288,643 | $ | 263,326 | |||||||
| Net income | $ | 177,644 | $ | 162,389 | |||||||
| Net income per share: | |||||||||||
| Basic | $ | 1.27 | $ | 1.17 | |||||||
| Diluted | $ | 1.26 | $ | 1.16 | |||||||
| Weighted average number of shares outstanding: | |||||||||||
| Basic | 139,634 | 138,563 | |||||||||
| Diluted | 141,020 | 139,776 | |||||||||
Additional consideration paid to sellers as a result of purchase price “earn-out” provisions are recorded as adjustments to intangible assets when the contingencies are settled. The net additional consideration paid by the Company in 2006 as a result of these adjustments totaled $48,824,000, of which $49,221,000 was allocated to goodwill and $397,000 was a reduction of current assets. Of the $48,824,000 net additional consideration paid, $14,640,000 was paid in cash, $33,261,000 was issued in notes payable and $923,000 was assumed as net liabilities. As of December 31, 2006, the maximum future contingency payments related to acquisitions totaled $169,947,000.
NOTE 3 • Goodwill
The changes in goodwill for the years ended December 31, are as follows:
| (in thousands) | Retail | Wholesale Brokerage | National Programs | Service | Total | |||||||||||||||||
|---|---|---|---|---|---|---|---|---|---|---|---|---|---|---|---|---|---|---|---|---|---|---|
| Balance as of January 1, 2006 | $ | 292,212 | $ | 137,750 | $ | 119,022 | $ | 56 | $ | 549,040 | ||||||||||||
| Goodwill of acquired businesses | 38,681 | 72,115 | 23,307 | 2,767 | 136,870 | |||||||||||||||||
| Goodwill disposed of relating to sales of businesses | (1,389 | ) | — | — | — | (1,389 | ) | |||||||||||||||
| Balance as of December 31, 2006 | 329,504 | 209,865 | 142,329 | 2,823 | 684,521 | |||||||||||||||||
| Goodwill of acquired businesses | 124,322 | 32,865 | 4,619 | 447 | 162,253 | |||||||||||||||||
| Goodwill disposed of relating to sales of businesses | (341 | ) | — | — | — | (341 | ) | |||||||||||||||
| Balance as of December 31, 2007 | $ | 453,485 | $ | 242,730 | $ | 146,948 | $ | 3,270 | $ | 846,433 | ||||||||||||
NOTE 4 • Amortizable Intangible Assets
Amortizable intangible assets at December 31 consisted of the following:
| 2007 | 2006 | ||||||||||||||||||||||||||||||||||
|---|---|---|---|---|---|---|---|---|---|---|---|---|---|---|---|---|---|---|---|---|---|---|---|---|---|---|---|---|---|---|---|---|---|---|---|
| (in thousands) | Gross Carrying Value | Accumulated Amortization | Net Carrying Value | Weighted Average Life (years) | Gross Carrying Value | Accumulated Amortization | Net Carrying Value | Weighted Average Life (years) | |||||||||||||||||||||||||||
| Purchased customer accounts | $ | 628,123 | $ | (187,543 | ) | $ | 440,580 | 14.9 | $ | 541,967 | $ | (149,764 | ) | $ | 392,203 | 14.9 | |||||||||||||||||||
| Noncompete agreements | 25,858 | (23,214 | ) | 2,644 | 7.7 | 25,589 | (21,723 | ) | 3,866 | 7.7 | |||||||||||||||||||||||||
| Total | $ | 653,981 | $ | (210,757 | ) | $ | 443,224 | $ | 567,556 | $ | (171,487 | ) | $ | 396,069 | |||||||||||||||||||||
54
Amortization expense recorded for other amortizable intangible assets for the years ended December 31, 2007, 2006 and 2005 was $40,436,000, $36,498,000 and $33,245,000, respectively.
Amortization expense for other amortizable intangible assets for the years ending December 31, 2008, 2009, 2010, 2011 and 2012 is estimated to be $42,505,000, $42,037,000, $41,358,000, $39,936,000, and $39,320,000, respectively.
NOTE 5 • Investments
Investments at December 31 consisted of the following:
| 2007 | 2006 | ||||||||||||||||||
|---|---|---|---|---|---|---|---|---|---|---|---|---|---|---|---|---|---|---|---|
| Carrying Value | Carrying Value | ||||||||||||||||||
| (in thousands) | Current | Non- Current | Current | Non- Current | |||||||||||||||
| Available-for-sale marketable equity securities | $ | 46 | $ | — | $ | 240 | $ | 15,181 | |||||||||||
| Non-marketable equity securities and certificates of deposit | 2,846 | 355 | 2,669 | 645 | |||||||||||||||
| Total investments | $ | 2,892 | $ | 355 | $ | 2,909 | $ | 15,826 | |||||||||||
The following table summarizes available-for-sale securities at December 31:
| (in thousands) | Cost | Gross Unrealized Gains | Gross Unrealized Losses | Estimated Fair Value | ||||||||||||||
|---|---|---|---|---|---|---|---|---|---|---|---|---|---|---|---|---|---|---|
| Marketable equity securities: | ||||||||||||||||||
| 2007 | $ | 25 | $ | 21 | $ | — | $ | 46 | ||||||||||
| 2006 | $ | 550 | $ | 14,871 | $ | — | $ | 15,421 | ||||||||||
The following table summarizes the proceeds and realized gains/(losses) on non-marketable equity securities and certificates of deposit for the years ended December 31:
| (in thousands) | Proceeds | Gross Realized Gains | Gross Realized Losses | |||||||||||
|---|---|---|---|---|---|---|---|---|---|---|---|---|---|---|
| 2007 | $ | 21,715 | $ | 18,733 | $ | (780 | ) | |||||||
| 2006 | $ | 119 | $ | 25 | $ | — | ||||||||
| 2005 | $ | 896 | $ | 87 | $ | — | ||||||||
As of December 31, 2006, the Company’s largest security investment was 559,970 common stock shares of Rock-Tenn Company, a New York Stock Exchange listed company, which the Company owned for more than 25 years. The Company’s investment in Rock-Tenn Company accounted for 81% of the total value of available-for-sale marketable equity securities, non-marketable equity securities and certificates of deposit as of December 31, 2006. During 2007, the Board of Directors authorized the sale of the Company’s investment in Rock-Tenn Company, and the Company realized a gain in excess of the Company’s original cost basis of $18,664,000. As of December 31, 2007, Brown & Brown has no remaining shares of Rock-Tenn Company.
NOTE 6 • Fixed Assets
Fixed assets at December 31 consisted of the following:
| (in thousands) | 2007 | 2006 | ||||||||
|---|---|---|---|---|---|---|---|---|---|---|
| Furniture, fixtures and equipment | $ | 112,413 | $ | 90,146 | ||||||
| Leasehold improvements | 12,393 | 10,590 | ||||||||
| Land, buildings and improvements | 491 | 487 | ||||||||
| Total cost | 125,297 | 101,223 | ||||||||
| Less accumulated depreciation and amortization | (62,970 | ) | (57,053 | ) | ||||||
| Total | $ | 62,327 | $ | 44,170 | ||||||
55
Depreciation and amortization expense amounted to $12,763,000 in 2007, $11,309,000 in 2006 and $10,061,000 in 2005.
NOTE 7 • Accrued Expenses
Accrued expenses at December 31 consisted of the following:
| (in thousands) | 2007 | 2006 | ||||||||
|---|---|---|---|---|---|---|---|---|---|---|
| Accrued bonuses | $ | 41,182 | $ | 42,426 | ||||||
| Accrued compensation and benefits | 19,702 | 16,213 | ||||||||
| Reserve for policy cancellations | 8,339 | 7,432 | ||||||||
| Accrued rent and vendor expenses | 8,302 | 7,937 | ||||||||
| Accrued interest | 4,488 | 4,524 | ||||||||
| Other | 8,586 | 7,477 | ||||||||
| Total | $ | 90,599 | $ | 86,009 | ||||||
NOTE 8 • Long-Term Debt
Long-term debt at December 31 consisted of the following:
| (in thousands) | 2007 | 2006 | ||||||||
|---|---|---|---|---|---|---|---|---|---|---|
| Unsecured Senior Notes | $ | 225,000 | $ | 225,000 | ||||||
| Acquisition notes payable | 14,025 | 6,310 | ||||||||
| Revolving credit facility | — | — | ||||||||
| Term loan agreements | — | 12,857 | ||||||||
| Other notes payable | 201 | 167 | ||||||||
| Total debt | 239,226 | 244,334 | ||||||||
| Less current portion | (11,519 | ) | (18,082 | ) | ||||||
| Long-term debt | $ | 227,707 | $ | 226,252 | ||||||
In July 2004, the Company completed a private placement of $200.0 million of unsecured senior notes (the “Notes”). The $200.0 million is divided into two series: Series A, for $100.0 million due in 2011 and bearing interest at 5.57% per year; and Series B, for $100.0 million due in 2014 and bearing interest at 6.08% per year. The closing on the Series B Notes occurred on July 15, 2004. The closing on the Series A Notes occurred on September 15, 2004. Brown & Brown has used the proceeds from the Notes for general corporate purposes, including acquisitions and repayment of existing debt. As of December 31, 2007 and 2006, there was an outstanding balance of $200.0 million on the Notes.
On December 22, 2006, the Company entered into a Master Shelf and Note Purchase Agreement (the “Master Agreement”) with a national insurance company (the “Purchaser”). The Purchaser also purchased Notes issued by the Company in 2004. The Master Agreement provides for a $200.0 million private uncommitted “shelf” facility for the issuance of senior unsecured notes over a three-year period, with interest rates that may be fixed or floating and with such maturity dates, not to exceed ten (10) years, as the parties may determine. The Master Agreement includes various covenants, limitations and events of default similar to the Notes issued in 2004. The initial issuance of notes under the Master Agreement occurred on December 22, 2006, through the issuance of $25.0 million in Series C Senior Notes due December 22, 2016, with a fixed interest rate of 5.66% per annum.
56
Also on December 22, 2006, the Company entered into a Second Amendment to Amended and Restated Revolving and Term Loan Agreement (the “Second Term Amendment”) and a Third Amendment to Revolving Loan Agreement (the “Third Revolving Amendment”) with a national banking institution, amending the existing Amended and Restated Revolving and Term Loan Agreement dated January 3, 2001 (the “Term Agreement”) and the existing Revolving Loan Agreement dated September 29, 2003, as amended (the “Revolving Agreement”), respectively. The amendments provided covenant exceptions for the notes issued or to be issued under the Master Agreement, and relaxed or deleted certain other covenants. In the case of the Third Revolving Amendment, the lending commitment was reduced from $75.0 million to $20.0 million, the maturity date was extended from September 30, 2008 to December 20, 2011, and the applicable margins for advances and the availability fee were reduced. Based on the Company’s funded debt to EBITDA ratio, the applicable margin for Eurodollar advances changed from a range of London Interbank Offering Rate (“LIBOR”) LIBOR plus 0.625% to 01.625% to a range of LIBOR plus 0.450% to 0.875%. The applicable margin for base rate advances changed from a range of LIBOR plus 0.00% to 0.125% to the Prime Rate less 1.000%. The availability fee changed from a range of 0.175% to 0.250% to a range of 0.100% to 0.200%. The 90-day LIBOR was 4.70% and 5.36% as of December 31, 2007 and 2006, respectively. The prime rate was 7.5% and 8.25% as of December 31, 2007 and 2006, respectively. There were no borrowings against this facility at December 31, 2007 or 2006.
In January 2001, Brown & Brown entered into a $90.0 million unsecured seven-year Term Agreement with a national banking institution, bearing an interest rate based upon the 30-, 60- or 90-day LIBOR plus 0.50% to 1.00%, depending upon Brown & Brown’s quarterly ratio of funded debt to earnings before interest, taxes, depreciation, amortization and non-cash stock grant compensation. The 90-day LIBOR was 4.70% and 5.36% as of December 31, 2007 and 2006, respectively. The loan was fully funded on January 3, 2001 and was to be repaid in equal quarterly installments of $3,200,000 through December 2007. As of December 31, 2007 the outstanding balance had been paid in full.
All four of these credit agreements require Brown & Brown to maintain certain financial ratios and comply with certain other covenants. Brown & Brown was in compliance with all such covenants as of December 31, 2007 and 2006.
To hedge the risk of increasing interest rates from January 2, 2002 through the remaining six years of its seven-year $90 million term loan, Brown & Brown entered into an interest rate swap agreement that effectively converted the floating rate LIBOR-based interest payments to fixed interest rate payments at 4.53%. This agreement did not affect the required 0.50% to 1.00% credit risk spread portion of the term loan. In accordance with SFAS No. 133, as amended, the fair value of the interest rate swap of approximately $37,000, net of related income taxes of approximately $22,000, was recorded in other assets as of December 31, 2006, with the related change in fair value reflected as other comprehensive income. Brown & Brown has designated and assessed the derivative as a highly effective cash flow hedge. As of December 31, 2007 the interest rate swap agreement expired in conjunction with the final payment on the related Term Agreement.
Acquisition notes payable represent debt incurred to former owners of certain insurance operations acquired by Brown & Brown. These notes and future contingent payments are payable in monthly, quarterly and annual installments through April 2011, including interest in the range from 0.0% to 9.0%.
Interest paid in 2007, 2006 and 2005 was $13,838,000, $14,136,000 and $13,726,000, respectively.
At December 31, 2007, maturities of long-term debt were $11,519,000 in 2008, $491,000 in 2009, $2,157,000 in 2010, $100,059,000 in 2011, $0 in 2012 and $125,000,000 in 2013 and beyond.
57
NOTE 9 • Income Taxes
Significant components of the provision (benefit) for income taxes for the years ended December 31 are as follows:
| (in thousands) | 2007 | 2006 | 2005 | |||||||||||
|---|---|---|---|---|---|---|---|---|---|---|---|---|---|---|
| Current: | ||||||||||||||
| Federal | $ | 105,534 | $ | 83,792 | $ | 72,550 | ||||||||
| State | 14,709 | 12,419 | 10,387 | |||||||||||
| Total current provision | 120,243 | 96,211 | 82,937 | |||||||||||
| Deferred: | ||||||||||||||
| Federal | (168 | ) | 9,139 | 8,547 | ||||||||||
| State | 493 | 2,341 | 2,095 | |||||||||||
| Total deferred provision | 325 | 11,480 | 10,642 | |||||||||||
| Total tax provision | $ | 120,568 | $ | 107,691 | $ | 93,579 |
A reconciliation of the differences between the effective tax rate and the federal statutory tax rate for the years ended December 31 is as follows:
| 2007 | 2006 | 2005 | ||||||||||||
|---|---|---|---|---|---|---|---|---|---|---|---|---|---|---|
| Federal statutory tax rate | 35.0 | % | 35.0 | % | 35.0 | % | ||||||||
| State income taxes, net of federal income tax benefit | 3.2 | 3.4 | 3.3 | |||||||||||
| Non-deductible employee stock purchase plan expense | 0.4 | 0.4 | — | |||||||||||
| Interest exempt from taxation and dividend exclusion | (0.5 | ) | (0.3 | ) | (0.2 | ) | ||||||||
| Other, net | 0.6 | — | 0.2 | |||||||||||
| Effective tax rate | 38.7 | % | 38.5 | % | 38.3 | % | ||||||||
Deferred income taxes reflect the net tax effects of temporary differences between the carrying amounts of assets and liabilities for financial reporting purposes and the corresponding amounts used for income tax reporting purposes.
Significant components of Brown & Brown’s current and non-current deferred tax liabilities and assets as of December 31 are as follows:
| (in thousands) | 2007 | 2006 | ||||||||
|---|---|---|---|---|---|---|---|---|---|---|
| Current: | ||||||||||
| Current deferred tax assets: | ||||||||||
| Deferred contingent revenue | $ | 17,208 | $ | — | ||||||
| Total current deferred tax assets | $ | 17,208 | $ | — | ||||||
| (in thousands) | 2007 | 2006 | ||||||||
|---|---|---|---|---|---|---|---|---|---|---|
| Non-current: | ||||||||||
| Non-current deferred tax liabilities: | ||||||||||
| Fixed assets | $ | 3,783 | $ | 3,051 | ||||||
| Net unrealized holding gain of available-for-sale securities | 8 | 5,337 | ||||||||
| Prepaid insurance and pension | 2,522 | 2,516 | ||||||||
| Net gain on cash-flow hedging derivative | — | 22 | ||||||||
| Intangible assets | 72,943 | 51,127 | ||||||||
| Total non-current deferred tax liabilities | 79,256 | 62,053 | ||||||||
| Non current deferred tax assets: | ||||||||||
| Deferred compensation | 6,040 | 5,886 | ||||||||
| Accruals and reserves | 6,881 | 6,310 | ||||||||
| Net operating loss carryforwards | 829 | 634 | ||||||||
| Valuation allowance for deferred tax assets | (230 | ) | (498 | ) | ||||||
| Total non-current deferred tax assets | 13,520 | 12,332 | ||||||||
| Net non-current deferred tax liability | $ | 65,736 | $ | 49,721 | ||||||
Income taxes paid in 2007, 2006 and 2005 were $114,380,000, $102,761,000, and $77,143,000, respectively.
58
At December 31, 2007, Brown & Brown had net operating loss carryforwards of $406,000 and $21,807,000 for federal and state income tax reporting purposes, respectively, portions of which expire in the years 2008 through 2022. The federal carryforward was derived from insurance operations acquired by Brown & Brown in 2001. The state carryforward is derived from the operating results of certain subsidiaries.
We adopted the provision of Financial Standards Accounting Board Interpretation No. 48 Accounting for Uncertainty in Income Taxes (“FIN 48”) an interpretation of FASB Statement No. 109 on January 1, 2007. As a result of the implementation of FIN 48, we recognized no material adjustment in the liability for unrecognized income tax benefits.
A reconciliation of the beginning and ending amount of unrecognized tax benefits for 2007 is as follows:
| (in thousands) | ||||||
|---|---|---|---|---|---|---|
| Unrecognized tax benefits balance at January 1, 2007 | $ | 591 | ||||
| Gross increases for tax positions of prior years | 15,805 | |||||
| Gross decreases for tax positions of prior years | ||||||
| Settlements | (15,772 | ) | ||||
| Lapse of statute of limitations | (117 | ) | ||||
| Unrecognized tax benefits balance at December 31, 2007 | $ | 507 |
We recognize interest and penalties related to uncertain tax positions in income tax expense. As of January 1, 2007 and December 31, 2007, we had approximately $157,000 and $128,000 of accrued interest related to uncertain tax positions, respectively.
Total amount of unrecognized tax benefits that would affect our effective tax rate if recognized is $507,000 as of December 31, 2007 and $591,000 as of January 1, 2007. We do not expect our unrecognized tax benefits to change significantly over the next 12 months.
During 2007, the IRS concluded their audit of our 2004-2006 tax years in which they disputed our method of recognizing profit-sharing contingent commissions for tax purposes. We recognize profit-sharing contingent commissions when determinable, which is when such commissions are received, however, the IRS believes that we should estimate those monies as of each December 31. We agreed to resolve this dispute for a $1.1 million payment of interest and our agreement to accrue at each December 31, for tax purposes only, a known amount of profit-sharing contingent commissions represented by the actual amount of profit-sharing contingent commissions received in the first quarter of the related year, with a true-up adjustment to the actual amount received by the end of the following March 31. Since this method for tax purposes differs from the method used for book purposes, it will result in a current deferred tax asset as of December 31 each year with that balance reversing by the following March 31 when the related profit-sharing contingent commissions are recognized for financial accounting purposes.
NOTE 10 • Employee Savings Plan
Brown & Brown has an Employee Savings Plan (401(k)) under which substantially all employees with more than 30 days of service are eligible to participate. Under this plan, Brown & Brown makes matching contributions, subject to a maximum of 2.5% of each participant’s salary. Further, Brown & Brown provides for a discretionary profit-sharing contribution of 1.5% of the employee’s salary for all eligible employees. Brown & Brown’s contributions to the plan totaled $10,699,000 in 2007, $7,585,000 in 2006 and $7,762,000 in 2005.
NOTE 11 • Stock-Based Compensation
Performance Stock Plan
Brown & Brown has adopted and the shareholders have approved a performance stock plan, under which up to 14,400,000 shares of Brown & Brown’s stock (Performance Stock, also referred to as PSP) may be granted to key employees contingent on the employees’ future years of service with Brown & Brown and other criteria established by the Compensation Committee of Brown & Brown’s Board of Directors. Before participants take full title to Performance Stock, two vesting conditions must be met. Of the grants currently outstanding, specified portions will satisfy the first condition for vesting based on 20% incremental increases in the 20-trading-day average
59
stock price of Brown & Brown’s common stock from the initial grant price specified by Brown & Brown. Performance Stock that has satisfied the first vesting condition is considered to be “awarded shares.” Awarded shares are included as issued and outstanding common stock shares and are included in the calculation of basic and diluted earnings per share. Dividends are paid on awarded shares and participants may exercise voting privileges on such shares. Awarded shares satisfy the second condition for vesting on the earlier of: (i) 15 years of continuous employment with Brown & Brown from the date shares are granted to the participants; (ii) attainment of age 64; or (iii) death or disability of the participant. At December 31, 2007, 6,149,820 shares had been granted under the plan at initial stock prices ranging from $1.90 to $30.55. As of December 31, 2007, 4,686,732 shares had met the first condition for vesting and had been awarded, and 574,864 shares had satisfied both conditions for vesting and had been distributed to the participants.
The Company uses a path-depended lattice model to estimate the fair value of PSP grants on the grant-date under SFAS 123R. A summary of PSP activity for the years ended December 31, 2007 and 2006 is as follows:
| Weighted- Average Grant Date Fair Value | Granted Shares | Awarded Shares | Shares Not Yet Awarded | |||||||||||||||
|---|---|---|---|---|---|---|---|---|---|---|---|---|---|---|---|---|---|---|
| Outstanding at January 1, 2006 | $ | 5.21 | 5,851,682 | 5,125,304 | 726,378 | |||||||||||||
| Granted | $ | 18.48 | 262,260 | 868 | 261,392 | |||||||||||||
| Awarded | $ | 11.99 | — | 291,035 | (291,035 | ) | ||||||||||||
| Vested | $ | 6.43 | (28,696 | ) | (28,696 | ) | — | |||||||||||
| Forfeited | $ | 5.93 | (393,728 | ) | (352,341 | ) | (41,387 | ) | ||||||||||
| Outstanding at December 31, 2006 | $ | 5.92 | 5,691,518 | 5,036,170 | 655,348 | |||||||||||||
| Granted | $ | 15.74 | 323,495 | — | 323,495 | |||||||||||||
| Awarded | $ | — | — | — | — | |||||||||||||
| Vested | $ | 5.33 | (48,552 | ) | (48,552 | ) | — | |||||||||||
| Forfeited | $ | 8.95 | (391,505 | ) | (300,886 | ) | (90,619 | ) | ||||||||||
| Outstanding at December 31, 2007 | $ | 6.38 | 5,574,956 | 4,686,732 | 888,224 | |||||||||||||
The weighted average grant-date fair value of PSP grants for years ended December 31, 2007, 2006 and 2005 was $15.74, $18.48 and $14.39, respectively. The total fair market value of PSP grants that vested during each of the years ended December 31, 2007, 2006 and 2005 was $1,314,000, $862,000 and $1,581,000, respectively.
Employee Stock Purchase Plan
The Company has a shareholder-approved Employee Stock Purchase Plan (“ESPP”) with a total of 12,000,000 authorized shares and 4,536,970 available for future subscriptions. Employees of the Company who regularly work more than 20 hours per week are eligible to participate in the plan. Participants, through payroll deductions, may subscribe to purchase Company stock up to 10% of their compensation, to a maximum of $25,000, during each annual subscription period (August 1st to the following July 31st) at a cost of 85% of the lower of the stock price as of the beginning or ending of the stock subscription period.
For the plan year ended July 31, 2007, 2006 and 2005, the Company issued 490,213, 571,601 and 521,948 shares of common stock in the month of August 2007, 2006 and 2005, respectively. These shares were issued at an aggregate purchase price of $10,711,000 or $21.85 per share in 2007, $10,557,000 or $18.47 per share in 2006, and $9,208,000 or $17.64 per share in 2005.
For the five months ended December 31, 2007, 2006 and 2005 of the 2007-2008, 2006-2007 and 2005-2006 plan years, 233,427, 191,140 and 241,668 shares of common stock (from authorized but unissued shares), respectively, were subscribed to by participants for proceeds of approximately $4,664,000 $4,817,000 and $4,464,000, respectively.
Incentive Stock Option Plan
On April 21, 2000, Brown & Brown adopted and the shareholders approved a qualified incentive stock option plan that provides for the granting of stock options to certain key employees for up to 4,800,000 shares of common
60
stock. The objective of this plan is to provide additional performance incentives to grow Brown & Brown’s pre-tax income in excess of 15% annually. The options are granted at the most recent trading day’s closing market price, and vest over a one-to-10-year period, with a potential acceleration of the vesting period to three to six years based upon achievement of certain performance goals. All of the options expire 10 years after the grant date.
The Company uses the Black-Scholes option-pricing model to estimate the fair value of stock options on the grant-date under SFAS 123R, which is the same valuation technique previously used for pro forma disclosures under SFAS 123. The Company did not grant any options during the year ended December 31, 2007 and 2006, but did grant 12,000 shares during the year ended December 31, 2005. The weighted average fair value of the incentive stock options granted during 2005 estimated on the date of grant, using the Black-Scholes option-pricing model, was $8.51 per share. The fair value of these options granted was estimated on the date of grant using the following assumptions: dividend yield of 0.86%; expected volatility of 35.0%; risk-free interest rate of 4.5%; and an expected life of 6 years.
The risk-free interest rate is based upon the U.S. Treasury yield curve on the date of grant with a remaining term approximating the expected term of the option granted. The expected term of the options granted is derived from historical data; grantees are divided into two groups based upon expected exercise behavior and are considered separately for valuation purposes. The expected volatility is based upon the historical volatility of the Company’s common stock over the period of time equivalent to the expected term of the options granted. The dividend yield is based upon the Company’s best estimate of future dividend yield.
A summary of stock option activity for the years ended December 31, 2007, 2006 and 2005 is as follows:
| Stock Options | Shares Under Option | Weighted- Average Exercise Price | Weighted- Average Remaining Contractual Term (in years) | Aggregate Intrinsic Value (in thousands) | ||||||||||||||
|---|---|---|---|---|---|---|---|---|---|---|---|---|---|---|---|---|---|---|
| Outstanding at January 1, 2005 | 2,073,028 | $ | 10.56 | 6.9 | 36,580 | |||||||||||||
| Granted | 12,000 | $ | 22.06 | |||||||||||||||
| Exercised | (68,040 | ) | $ | 4.84 | ||||||||||||||
| Forfeited | — | $ | — | |||||||||||||||
| Expired | — | $ | — | |||||||||||||||
| Outstanding at December 31, 2005 | 2,016,988 | $ | 10.83 | 5.9 | $ | 35,064 | ||||||||||||
| Granted | — | $ | — | |||||||||||||||
| Exercised | (123,213 | ) | $ | 6.11 | ||||||||||||||
| Forfeited | (8,000 | ) | $ | 15.78 | ||||||||||||||
| Expired | — | $ | — | |||||||||||||||
| Outstanding at December 31, 2006 | 1,885,775 | $ | 11.11 | 4.9 | $ | 32,241 | ||||||||||||
| Granted | — | $ | — | |||||||||||||||
| Exercised | (632,307 | ) | $ | 8.38 | ||||||||||||||
| Forfeited | — | $ | — | |||||||||||||||
| Expired | — | $ | — | |||||||||||||||
| Outstanding at December 31, 2007 | 1,253,468 | $ | 12.49 | 4.3 | $ | 22,679 | ||||||||||||
| Ending vested and expected to vest at December 31, 2007 | 1,253,468 | $ | 12.49 | 4.3 | $ | 22,679 | ||||||||||||
| Exercisable at December 31, 2007 | 590,776 | $ | 8.68 | 3.3 | $ | 8,757 | ||||||||||||
| Exercisable at December 31, 2006 | 1,185,067 | $ | 8.29 | 4.2 | $ | 23,607 | ||||||||||||
| Exercisable at December 31, 2005 | 783,672 | $ | 4.88 | 5.2 | $ | 18,281 | ||||||||||||
The following table summarizes information about stock options outstanding at December 31, 2007:
61
| Options Outstanding | Options Exercisable | |||||||||||||||||||||||
|---|---|---|---|---|---|---|---|---|---|---|---|---|---|---|---|---|---|---|---|---|---|---|---|---|
| Exercise Price | Number Outstanding | Weighted Average Remaining Contractual Life (years) | Weighted Average Exercise Price | Number Exercisable | Weighted Average Exercise Price | |||||||||||||||||||
| $ 4.84 | 382,792 | 2.3 | $ | 4.84 | 382,792 | $ | 4.84 | |||||||||||||||||
| $14.20 | 4,000 | 3.8 | $ | 14.20 | 4,000 | $ | 14.20 | |||||||||||||||||
| $15.78 | 854,676 | 5.2 | $ | 15.78 | 203,984 | $ | 15.78 | |||||||||||||||||
| $22.06 | 12,000 | 7.0 | $ | 22.06 | — | — | ||||||||||||||||||
| Totals | 1,253,468 | 4.3 | $ | 12.49 | 590,776 | $ | 8.68 | |||||||||||||||||
The weighted average grant-date fair value of stock options granted during the year ended December 31, 2007, 2006 and 2005 was $0.00, $0.00 and $8.51, respectively. The total intrinsic value of options exercised, determined as of the date of exercise, during the years ended December 31, 2007, 2006 and 2005 was $12,675,000, $2,865,000 and $1,381,000, respectively. The total intrinsic value is calculated as the difference between the exercise price of all underlying awards and the quoted market price of the Company’s stock for all in-the-money stock options at December 31, 2007, 2006 and 2005.
There were 1,545,996 option shares available for future grant under this plan as of December 31, 2007.
Summary of Non-Cash Stock-Based Compensation Expense
The non-cash stock-based compensation expense for the years ended December 31, is as follows:
| (in thousands) | 2007 | 2006 | 2005 | |||||||||||
|---|---|---|---|---|---|---|---|---|---|---|---|---|---|---|
| Employee Stock Purchase Plan | $ | 3,234 | $ | 3,049 | $ | — | ||||||||
| Performance Stock Plan | 2,016 | 1,874 | 3,337 | |||||||||||
| Incentive Stock Option Plan | 417 | 493 | — | |||||||||||
| Total | $ | 5,667 | $ | 5,416 | $ | 3,337 | ||||||||
Summary of Unrecognized Compensation Expense
As of December 31, 2007, there was approximately $18.0 million of unrecognized compensation expense related to all non-vested share-based compensation arrangements granted under the Company’s stock-based compensation plans. That expense is expected to be recognized over a weighted-average period of 9.1 years.
NOTE 12 • Supplemental Disclosures of Cash Flow Information
Brown & Brown’s significant non-cash investing and financing activities for the years ended December 31 are summarized as follows:
| (in thousands) | 2007 | 2006 | 2005 | |||||||||||
|---|---|---|---|---|---|---|---|---|---|---|---|---|---|---|
| Unrealized holding (loss) gain on available-for-sale securities, net of tax benefit of $5,328 for 2007; net of tax effect of $2,752 for 2006; and net of tax benefit of $300 for 2005 | $ | (9,093 | ) | $ | 4,697 | $ | (512 | ) | ||||||
| Net (loss) gain on cash-flow hedging derivative, net of tax benefit of $22 for 2007, net of tax benefit of $0 for 2006; and net of tax effect of $289 for 2005 | $ | (38 | ) | $ | 1 | $ | 491 | |||||||
| Notes payable issued or assumed for purchased customer accounts | $ | 23,897 | $ | 36,957 | $ | 42,843 | ||||||||
| Notes received on the sale of fixed assets and customer accounts | $ | 9,689 | $ | 2,715 | $ | 1,855 | ||||||||
62
NOTE 13 • Commitments and Contingencies
Operating Leases
Brown & Brown leases facilities and certain items of office equipment under noncancelable operating lease arrangements expiring on various dates through 2017. The facility leases generally contain renewal options and escalation clauses based upon increases in the lessors’ operating expenses and other charges. Brown & Brown anticipates that most of these leases will be renewed or replaced upon expiration. At December 31, 2007, the aggregate future minimum lease payments under all noncancelable lease agreements were as follows:
| (in thousands) | ||||||
|---|---|---|---|---|---|---|
| 2008 | $ | 24,553 | ||||
| 2009 | 21,177 | |||||
| 2010 | 17,065 | |||||
| 2011 | 11,624 | |||||
| 2012 | 7,674 | |||||
| Thereafter | 12,962 | |||||
| Total minimum future lease payments | $ | 95,055 | ||||
Rental expense in 2007, 2006 and 2005 for operating leases totaled $33,381,000, $30,338,000 and $28,926,000, respectively.
Legal Proceedings
Governmental Investigations Regarding Compensation Practices
As disclosed in prior years, Brown & Brown, Inc. was one of more than ten insurance intermediaries named together with a number of insurance companies as defendants in putative class action lawsuits purporting to be brought on behalf of policyholders. Brown & Brown, Inc. initially became a defendant in certain of those actions in October and December of 2004. In February 2005, the Judicial Panel on Multi-District Litigation consolidated these cases, together with other putative class action lawsuits in which Brown & Brown, Inc. was not named as a party, to a single jurisdiction, the United States District Court, District of New Jersey, for pre-trial purposes. One of the consolidated actions,In Re: Employee-Benefits Insurance Antitrust Litigation, concerns employee benefits insurance and the other, styledIn Re: Insurance Brokerage Antitrust Litigation, involves other lines of insurance. These two consolidated actions are collectively referred to in this report as the “Antitrust Actions.” The complaints refer to an action, since settled, that was filed against Marsh & McLennan Companies, Inc. (“Marsh & McLennan”), the largest insurance broker in the world, by the New York State Attorney General in October 2004, and allege various improprieties and unlawful acts by the various defendants in the pricing and placement of insurance, including alleged manipulation of the insurance market by, among other things: “bid rigging” and “steering” clients to particular insurers based on considerations other than the clients’ interests; alleged entry into unlawful tying arrangements pursuant to which the placement of primary insurance contracts was conditioned upon commitments to place reinsurance through a particular broker; and alleged failure to disclose contingent commission and other allegedly improper compensation and fee arrangements.
On April 5, 2007, the United States District Court, District of New Jersey, dismissed all claims alleging violations of federal law against all defendants, including the Company, in each of the Antitrust Actions, but allowed the plaintiffs leave to file an amended complaint by May 22, 2007. Subsequently, on May 21, 2007, the plaintiffs in the Antitrust Actions settled with the Company in exchange for the Company’s agreement to waive its claims for sanctions and to reasonably cooperate with plaintiffs in the event that they seek additional information from the Company.
Since the New York State Attorney General filed the lawsuit referenced above against Marsh & McLennan in October 2004, governmental agencies in a number of states have looked or are looking into issues related to compensation practices in the insurance industry, and the Company has received and responded to written and oral requests for information and/or subpoenas seeking information related to this topic. To date, requests for information and/or subpoenas have been received from governmental agencies such as attorneys general or departments of insurance in the following states: Arkansas (Department of Insurance), Arizona (Department of Insurance), California (Department of Insurance), Connecticut (Office of Attorney General), Florida (Office of Attorney General, Department
63
of Financial Services, and Office of Insurance Regulation), Illinois (Office of Attorney General), Nevada (Department of Business & Industry, Division of Insurance), New Hampshire (Department of Insurance), New Jersey (Department of Banking and Insurance), New York (Office of Attorney General), North Carolina (Department of Insurance and Department of Justice), Oklahoma (Department of Insurance), Pennsylvania (Department of Insurance), South Carolina (Department of Insurance), Texas (Department of Insurance), Vermont (Department of Banking, Insurance, Securities & Healthcare Administration), Virginia (State Corporation Commission, Bureau of Insurance, Agent Regulation & Administration Division), Washington (Office of Insurance Commissioner) and West Virginia (Office of Attorney General). Agencies in Arizona, Virginia and Washington have concluded their respective investigations of subsidiaries of Brown & Brown, Inc. based in those states with no further action as to these entities.
As previously disclosed in our public filings, on December 8, 2006, Brown & Brown reached a settlement with the Florida government agencies identified above which terminated the joint investigation of those agencies with respect to Brown & Brown, Inc. and its subsidiaries. The settlement involved no finding of wrongdoing, no fines or penalties and no prohibition of profit-sharing compensation. Pursuant to the terms of the settlement, Brown & Brown, Inc. agreed to pay $1,800,000 to the investigating agencies to be distributed to Florida governmental entity policyholders of the Company plus $1,000,000 in attorneys’ fees and costs associated with the investigation. Additionally, a Brown & Brown, Inc. subsidiary, Program Management Services Inc., doing business as Public Risk Underwriters®, agreed to pay $3,000,000 to the investigating agencies for distribution to a local government self-insurance fund. The affirmative obligations imposed under the settlement include continued enhanced disclosures to Florida policyholders concerning compensation received by Brown & Brown, Inc. and its subsidiaries.
Some of the other insurance intermediaries and insurance companies that have been subject to governmental investigations and/or lawsuits arising out of these matters have chosen to settle some such matters. Such settlements have involved the payment of substantial sums, as well as agreements to change business practices, including agreeing to no longer pay or accept profit-sharing contingent commissions.
As previously disclosed in our public filings, offices of the Company are party to profit-sharing contingent commission agreements with certain insurance companies, including agreements providing for potential payment of revenue-sharing commissions by insurance companies based primarily on the overall profitability of the aggregate business written with that insurance company, and/or additional factors such as retention ratios and overall volume of business that an office or offices place with the insurance company. Additionally, to a lesser extent, some offices of the Company are party to override commission agreements with certain insurance companies, and these agreements provide for commission rates in excess of standard commission rates to be applied to specific lines of business, such as group health business, based primarily on the overall volume of such business that the office or offices in question place with the insurance company. The Company has not chosen to discontinue receiving profit-sharing contingent commissions or override commissions.
As previously disclosed, in 2005 a committee comprised of independent members of the Board of Directors of Brown & Brown, Inc. (the “Special Review Committee”) determined that maintenance of a derivative suit was not in the best interests of the Company, following an investigation in response to a December 2004 demand letter from counsel purporting to represent a current shareholder of Brown & Brown, Inc. (the “Demand Letter”). The Demand Letter sought the commencement of a derivative suit by Brown & Brown, Inc. against the Board of Directors and current and former officers and directors of Brown & Brown, Inc. for alleged breaches of fiduciary duty related to the Company’s participation in contingent commission agreements. The Special Review Committee’s conclusions were communicated to the purported shareholder’s counsel and there has been limited communication since then. There can be no assurance that the purported shareholder will not further pursue his allegations or that any pursuit of any such allegations would not have a material adverse effect on the Company.
In response to the foregoing events, the Company also, on its own volition, engaged outside counsel to conduct a limited internal inquiry into certain sales and marketing practices of the Company, with special emphasis on the effects of profit-sharing contingent commission agreements on the placement of insurance products by the Company for its clients. The internal inquiry resulted in several recommendations being made in January 2006 regarding disclosure of compensation, premium finance charges, the retail-wholesale interface, fee-based compensation and direct incentives from insurance companies, and the Company has been evaluating such recommendations and has adopted or is in the process of adopting these recommendations. As a result of that inquiry, and in the process of preparing responses to some of the governmental agency inquiries referenced above, management of the Company became aware of a limited number of specific, unrelated instances of questionable conduct. These matters have been
64
addressed and resolved, or are in the process of being addressed and resolved, on a case-by-case basis, and thus far the amounts involved in resolving such matters have not been, either individually or in the aggregate, material. However, there can be no assurance that the ultimate cost and ramifications of resolving these matters will not have a material adverse effect on the Company.
The Company cannot currently predict the impact or resolution of the various governmental inquiries or related matters and thus cannot reasonably estimate a range of possible loss, which could be material, or whether the resolution of these matters may harm the Company’s business and/or lead to a decrease in or elimination of profit-sharing contingent commissions and override commissions, which could have a material adverse impact on the Company’s consolidated financial condition.
Other Proceedings
The Company is involved in numerous pending or threatened proceedings by or against Brown & Brown, Inc. or one or more of its subsidiaries that arise in the ordinary course of business. The damages that may be claimed against the Company in these various proceedings are substantial, including in many instances claims for punitive or extraordinary damages. Some of these claims and lawsuits have been resolved, others are in the process of being resolved, and others are still in the investigation or discovery phase. The Company will continue to respond appropriately to these claims and lawsuits, and to vigorously protect its interests.
Among the above-referenced claims, and as previously described in the Company’s public filings, there are several threatened and pending legal claims and lawsuits against Brown & Brown, Inc. and Brown & Brown Insurance Services of Texas, Inc. (BBTX), a subsidiary of Brown & Brown, Inc., arising out of BBTX’s involvement with the procurement and placement of workers’ compensation insurance coverage for entities including several professional employer organizations. One such action, styledGreat American Insurance Company, et al. v. The Contractor’s Advantage, Inc., et al., Cause No. 2002-33960, pending in the 189th Judicial District Court in Harris County, Texas, asserts numerous causes of action, including fraud, civil conspiracy, federal Lanham Act and RICO violations, breach of fiduciary duty, breach of contract, negligence and violations of the Texas Insurance Code against BBTX, Brown & Brown, Inc. and other defendants, and seeks recovery of punitive or extraordinary damages (such as treble damages) and attorneys’ fees.
Although the ultimate outcome of the matters referenced in this section titled “Other Proceedings” cannot be ascertained and liabilities in indeterminate amounts may be imposed on Brown & Brown, Inc. or its subsidiaries, on the basis of present information, availability of insurance and legal advice received, it is the opinion of management that the disposition or ultimate determination of such claims will not have a material adverse effect on the Company’s consolidated financial position. However, as (i) one or more of the Company’s insurance carriers could take the position that portions of these claims are not covered by the Company’s insurance, (ii) to the extent that payments are made to resolve claims and lawsuits, applicable insurance policy limits are eroded, and (iii) the claims and lawsuits relating to these matters are continuing to develop, it is possible that future results of operations or cash flows for any particular quarterly or annual period could be materially affected by unfavorable resolutions of these matters.
NOTE 14 • Business Concentrations
A significant portion of business written by Brown & Brown is for customers located in California, Florida, Georgia, Michigan, New Jersey, New York, Pennsylvania, Texas and Washington. Accordingly, the occurrence of adverse economic conditions, an adverse regulatory climate, or a disaster in any of these states could have a material adverse effect on Brown & Brown’s business, although no such conditions have been encountered in the past.
.For the year ended December 31, 2007, approximately 5.3% and 5.3% of Brown & Brown’s total revenues were derived from insurance policies underwritten by two separate insurance companies, respectively. For the year ended December 31, 2006, approximately 5.3% and 4.9% of Brown & Brown’s total revenues were derived from insurance policies underwritten by the same two separate insurance companies, respectively. For the year ended December 31, 2005, approximately 8.0% and 5.4% of Brown & Brown’s total revenues were derived from insurance policies underwritten by the same two separate insurance companies, respectively. Should these insurance companies seek to terminate their arrangement with Brown & Brown, the Company believes that other insurance companies are available to underwrite the business, although some additional expense and loss of market share could possibly result. No other insurance company accounts for 5% or more of Brown & Brown’s total revenues.
65
NOTE 15 • Quarterly Operating Results (Unaudited)
Quarterly operating results for 2007 and 2006 were as follows:
| (in thousands, except per share data) | First Quarter | Second Quarter | Third Quarter | Fourth Quarter | ||||||||||||||
|---|---|---|---|---|---|---|---|---|---|---|---|---|---|---|---|---|---|---|
| 2007 | ||||||||||||||||||
| Total revenues | $ | 258,513 | $ | 246,644 | $ | 237,284 | $ | 217,226 | ||||||||||
| Total expenses | $ | 160,411 | $ | 162,148 | $ | 161,849 | $ | 163,732 | ||||||||||
| Income before income taxes | $ | 98,102 | $ | 84,496 | $ | 75,435 | $ | 53,494 | ||||||||||
| Net income | $ | 59,727 | $ | 52,012 | $ | 46,216 | $ | 33,004 | ||||||||||
| Net income per share: | ||||||||||||||||||
| Basic | $ | 0.43 | $ | 0.37 | $ | 0.33 | $ | 0.23 | ||||||||||
| Diluted | $ | 0.42 | $ | 0.37 | $ | 0.33 | $ | 0.23 | ||||||||||
| 2006 | ||||||||||||||||||
| Total revenues | $ | 230,582 | $ | 220,807 | $ | 211,965 | $ | 214,650 | ||||||||||
| Total expenses | $ | 149,146 | $ | 149,840 | $ | 146,400 | $ | 152,577 | ||||||||||
| Income before income taxes | $ | 81,436 | $ | 70,967 | $ | 65,565 | $ | 62,073 | ||||||||||
| Net income | $ | 50,026 | $ | 44,431 | $ | 40,270 | $ | 37,623 | ||||||||||
| Net income per share: | ||||||||||||||||||
| Basic | $ | 0.36 | $ | 0.32 | $ | 0.29 | $ | 0.27 | ||||||||||
| Diluted | $ | 0.36 | $ | 0.32 | $ | 0.29 | $ | 0.27 | ||||||||||
Quarterly financial information is affected by seasonal variations. The timing of profit-sharing contingent commissions, policy renewals and acquisitions may cause revenues, expenses and net income to vary significantly between quarters.
NOTE 16 • Segment Information
Brown & Brown’s business is divided into four reportable segments: the Retail Division, which provides a broad range of insurance products and services to commercial, governmental, professional and individual customers; the Wholesale Brokerage Division, which markets and sells excess and surplus commercial and personal lines insurance, and reinsurance, primarily through independent agents and brokers; the National Programs Division, which is comprised of two units — Professional Programs, which provides professional liability and related package products for certain professionals delivered through nationwide networks of independent agents, and Special Programs, which markets targeted products and services designated for specific industries, trade groups, public and quasi-public entities, and market niches; and the Services Division, which provides insurance-related services, including third-party administration, consulting for the workers’ compensation and employee benefit self-insurance markets, managed healthcare services and Medicare set-aside services. As of December 31, 2007, Brown & Brown conducted all of its operations within the United States of America.
The accounting policies of the reportable segments are the same as those described in Note 1. Brown & Brown evaluates the performance of its segments based upon revenues and income before income taxes. Inter-segment revenues are eliminated.
66
Summarized financial information concerning Brown & Brown’s reportable segments is shown in the following table. The “Other” column includes any income and expenses not allocated to reportable segments and corporate-related items, including the inter-company interest expense charge to the reporting segment.
| Year Ended December 31, 2007 | |||||||||||||||||||||||||||
|---|---|---|---|---|---|---|---|---|---|---|---|---|---|---|---|---|---|---|---|---|---|---|---|---|---|---|---|
| (in thousands) | Retail | Wholesale Brokerage | National Programs | Services | Other | Total | |||||||||||||||||||||
| Total revenues | $ | 562,438 | $ | 178,942 | $ | 157,548 | $ | 35,392 | $ | 25,347 | $ | 959,667 | |||||||||||||||
| Investment income | 260 | 2,927 | 513 | 31 | 26,763 | 30,494 | |||||||||||||||||||||
| Amortization | 21,659 | 9,237 | 9,039 | 462 | 39 | 40,436 | |||||||||||||||||||||
| Depreciation | 5,723 | 2,715 | 2,757 | 534 | 1,034 | 12,763 | |||||||||||||||||||||
| Interest expense | 21,094 | 19,188 | 9,977 | 719 | (37,176 | ) | 13,802 | ||||||||||||||||||||
| Income before income taxes | 159,304 | 27,989 | 47,135 | 8,655 | 68,444 | 311,527 | |||||||||||||||||||||
| Total assets | 1,356,772 | 640,931 | 570,295 | 41,233 | (648,572 | ) | 1,960,659 | ||||||||||||||||||||
| Capital expenditures | 5,816 | 2,835 | 1,831 | 318 | 19,843 | 30,643 | |||||||||||||||||||||
| Year Ended December 31, 2006 | |||||||||||||||||||||||||||
|---|---|---|---|---|---|---|---|---|---|---|---|---|---|---|---|---|---|---|---|---|---|---|---|---|---|---|---|
| (in thousands) | Retail | Wholesale Brokerage | National Programs | Services | Other | Total | |||||||||||||||||||||
| Total revenues | $ | 517,989 | $ | 163,346 | $ | 157,448 | $ | 32,606 | $ | 6,615 | $ | 878,004 | |||||||||||||||
| Investment income | 139 | 4,017 | 432 | 45 | 6,846 | 11,479 | |||||||||||||||||||||
| Amortization | 19,305 | 8,087 | 8,718 | 343 | 45 | 36,498 | |||||||||||||||||||||
| Depreciation | 5,621 | 2,075 | 2,387 | 533 | 693 | 11,309 | |||||||||||||||||||||
| Interest expense | 18,903 | 18,759 | 10,554 | 440 | (35,299 | ) | 13,357 | ||||||||||||||||||||
| Income before income taxes | 145,749 | 26,865 | 48,560 | 7,963 | 50,904 | 280,041 | |||||||||||||||||||||
| Total assets | 1,103,107 | 618,374 | 544,272 | 32,554 | (490,355 | ) | 1,807,952 | ||||||||||||||||||||
| Capital expenditures | 5,952 | 2,085 | 3,750 | 588 | 2,604 | 14,979 | |||||||||||||||||||||
| Year Ended December 31, 2005 | |||||||||||||||||||||||||||
|---|---|---|---|---|---|---|---|---|---|---|---|---|---|---|---|---|---|---|---|---|---|---|---|---|---|---|---|
| (in thousands) | Retail | Wholesale Brokerage | National Programs | Services | Other | Total | |||||||||||||||||||||
| Total revenues | $ | 491,202 | $ | 127,113 | $ | 133,930 | $ | 27,517 | $ | 6,045 | $ | 785,807 | |||||||||||||||
| Investment income | 159 | 1,599 | 367 | — | 4,453 | 6,578 | |||||||||||||||||||||
| Amortization | 19,368 | 5,672 | 8,103 | 43 | 59 | 33,245 | |||||||||||||||||||||
| Depreciation | 5,641 | 1,285 | 1,998 | 435 | 702 | 10,061 | |||||||||||||||||||||
| Interest expense | 20,927 | 12,446 | 10,433 | 4 | (29,341 | ) | 14,469 | ||||||||||||||||||||
| Income before income taxes | 128,881 | 28,306 | 38,385 | 6,992 | 41,566 | 244,130 | |||||||||||||||||||||
| Total assets | 1,002,781 | 476,653 | 445,146 | 18,766 | (334,686 | ) | 1,608,660 | ||||||||||||||||||||
| Capital expenditures | 6,186 | 1,969 | 3,067 | 350 | 1,854 | 13,426 | |||||||||||||||||||||
NOTE 17 • Subsequent Events
From January 1, 2008 through February 28, 2008, Brown & Brown acquired the assets and assumed certain liabilities of seven insurance intermediaries, two books of business (custom accounts) and the outstanding stock of one general insurance agency. The aggregate purchase price of these acquisitions was $71,080,000, including $65,918,000 of net cash payments, the issuance of $185,000 in notes payable and the assumption of $4,977,000 of liabilities. All of these acquisitions were acquired primarily to expand Brown & Brown’s core businesses and to attract and obtain high-quality individuals. Acquisition purchase prices are based primarily on a multiple of average annual operating profits earned over a one- to three-year period within a minimum and maximum price range. The initial asset allocation of an acquisition is based on the minimum purchase price, and any subsequent earn-out payment is allocated to intangible assets.
On February 1, 2008, we issued, under the Company’s Master Agreement, $25.0 million in Series D Senior Notes payable on January 15, 2015, with a fixed interest rate of 5.37% per annum.
67
REPORT OF INDEPENDENT REGISTERED PUBLIC ACCOUNTING FIRM
To the Board of Directors and Stockholders of
Brown & Brown, Inc.
Daytona Beach, Florida
Brown & Brown, Inc.
Daytona Beach, Florida
We have audited the accompanying consolidated balance sheets of Brown & Brown and subsidiaries (the “Company”) as of December 31, 2007 and 2006, and the related consolidated statements of income, stockholders’ equity, and cash flows for each of the three years in the period ended December 31, 2007. We also have audited the Company’s internal control over financial reporting as of December 31, 2007, based on criteria established in Internal Control — Integrated Framework issued by the Committee of Sponsoring Organizations of the Treadway Commission. As described in Management’s Report on Internal Control over Financial Reporting, management excluded from its assessment the internal control over financial reporting at ALCOS, Inc., Grinspec, Inc., Sobel Affiliates Inc., The Combined Group, Inc, et al., Murfield Insurance, Inc., Security Insurance, Inc. II, Security Risk Managers, Inc., Professional Risk Managers, Inc., JPMorgan Insurance Agency, Inc., Island Risk Management Associates, Inc., Independent Insurance Associates, Inc., McFall General Agency, Inc., Dalton Insurance Agency, L.L.C., Evergreen Re, Incorporated and Turner & Associates Insurance Agency, Inc. (collectively the “2007 Excluded Acquisitions”), which were acquired during 2007 and whose financial statements constitute 16.6% and 11.8% of net and total assets, respectively, 4.2% of revenues, and 3.4% of net income of the consolidated financial statement amounts as of and for the year ended December 31, 2007. Accordingly, our audit did not include the internal control over financial reporting at the 2007 Excluded Acquisitions. The Company’s management is responsible for these financial statements, for maintaining effective internal control over financial reporting, and for its assessment of the effectiveness of internal control over financial reporting, included in the accompanying Annual Assessment Report. Our responsibility is to express an opinion on these financial statements and an opinion on the Company’s internal control over financial reporting based on our audits.
We conducted our audits in accordance with the standards of the Public Company Accounting Oversight Board (United States). Those standards require that we plan and perform the audit to obtain reasonable assurance about whether the financial statements are free of material misstatement and whether effective internal control over financial reporting was maintained in all material respects. Our audits of the financial statements included examining, on a test basis, evidence supporting the amounts and disclosures in the financial statements, assessing the accounting principles used and significant estimates made by management, and evaluating the overall financial statement presentation. Our audit of internal control over financial reporting included obtaining an understanding of internal control over financial reporting, assessing the risk that a material weakness exists, and testing and evaluating the design and operating effectiveness of internal control based on the assessed risk. Our audits also included performing such other procedures as we considered necessary in the circumstances. We believe that our audits provide a reasonable basis for our opinions.
A company’s internal control over financial reporting is a process designed by, or under the supervision of, the company’s principal executive and principal financial officers, or persons performing similar functions, and effected by the company’s board of directors, management, and other personnel to provide reasonable assurance regarding the reliability of financial reporting and the preparation of financial statements for external purposes in accordance with generally accepted accounting principles. A company’s internal control over financial reporting includes those policies and procedures that (1) pertain to the maintenance of records that, in reasonable detail, accurately and fairly reflect the transactions and dispositions of the assets of the company; (2) provide reasonable assurance that transactions are recorded as necessary to permit preparation of financial statements in accordance with generally accepted accounting principles, and that receipts and expenditures of the company are being made only in accordance with authorizations of management and directors of the company; and (3) provide reasonable assurance regarding prevention or timely detection of unauthorized acquisition, use, or disposition of the company’s assets that could have a material effect on the financial statements.
Because of the inherent limitations of internal control over financial reporting, including the possibility of collusion or improper management override of controls, material misstatements due to error or fraud may not be prevented or detected on a timely basis. Also, projections of any evaluation of the effectiveness of the internal control over
68
financial reporting to future periods are subject to the risk that the controls may become inadequate because of changes in conditions, or that the degree of compliance with the policies or procedures may deteriorate.
In our opinion, the consolidated financial statements referred to above present fairly, in all material respects, the financial position of Brown & Brown and subsidiaries as of December 31, 2007 and 2006, and the results of their operations and their cash flows for each of the three years in the period ended December 31, 2007, in conformity with accounting principles generally accepted in the United States of America. Also, in our opinion, the Company maintained, in all material respects, effective internal control over financial reporting as of December 31, 2007, based on the criteria established in Internal Control — Integrated Framework issued by the Committee of Sponsoring Organizations of the Treadway Commission.
/s/ Deloitte & Touche LLP
Jacksonville, Florida
February 29, 2008
February 29, 2008
69
MANAGEMENT’S REPORT ON INTERNAL CONTROL OVER FINANCIAL REPORTING
The Management of Brown & Brown, Inc. and its subsidiaries (“Brown & Brown”) is responsible for establishing and maintaining adequate internal control over financial reporting, as such term is defined in Securities Exchange Act Rule 13a-15(f). Under the supervision and with the participation of management, including Brown & Brown’s principal executive officer and principal financial officer, Brown & Brown conducted an evaluation of the effectiveness of internal control over financial reporting based on the framework in Internal Control — Integrated Framework issued by the Committee of Sponsoring Organizations of the Treadway Commission.
In conducting Brown & Brown’s evaluation of this effectiveness of its internal control over financial reporting, Brown & Brown has excluded the following acquisitions completed by Brown & Brown during 2007: ALCOS, Inc., Grinspec, Inc., Sobel Affiliates Inc., The Combined Group, Inc., et al., Murfield Insurance, Inc., Security Insurance, Inc. II, Security Risk Managers, Inc., Professional Risk Managers, Inc., JPMorgan Insurance Agency, Inc., Island Risk Management Associates, Inc., Independent Insurance Associates, Inc., McFall General Agency, Inc., Dalton Insurance Agency, L.L.C., Evergreen Re, Incorporated, and Turner & Associates Insurance Agency, Inc. Collectively, these acquisitions represented 16.6% and 11.8% of net and total assets as of December 31, 2007, 4.2% of total revenue and 3.4% of net income for the year ended. Refer to Note 2 to the Consolidated Financial Statements for further discussion of these acquisitions and their impact on Brown & Brown’s Consolidated Financial Statements.
Based on Brown & Brown’s evaluation under the framework in Internal Control—Integrated Framework, management concluded that internal control over financial reporting was effective as of December 31, 2007. Management’s assessment of the effectiveness of internal control over financial reporting as of December 31, 2007 has been audited by Deloitte & Touche LLP, an independent registered public accounting firm, as stated in their report which is included herein.
Brown & Brown, Inc.
Daytona Beach, Florida
February 29, 2008
Daytona Beach, Florida
February 29, 2008
| /s/ J. Hyatt Brown | /s/ Cory T. Walker | |||||
| J. Hyatt Brown Chief Executive Officer | Cory T. Walker Chief Financial Officer | |||||
70
ITEM 9. Changes in and Disagreements with Accountants on Accounting and Financial Disclosure.
There were no changes in or disagreements with accountants on accounting and financial disclosure in 2007.
ITEM 9A. Controls and Procedures.
Evaluation of Disclosure Controls and Procedures
We carried out an evaluation (the “Evaluation”) required by Rules 13a-15 and 15d-15 under the Securities Exchange Act of 1934 (the “Exchange Act”), under the supervision and with the participation of our Chief Executive Officer (“CEO”) and Chief Financial Officer (“CFO”), of the effectiveness of our disclosure controls and procedures as defined in Rule 13a-15 and 15d-15 under the Exchange Act (“Disclosure Controls”). Based on the Evaluation, our CEO and CFO concluded that the design and operation of our Disclosure Controls provide reasonable assurance that the Disclosure Controls, as described in this Item 9A, are effective in alerting them timely to material information required to be included in our periodic SEC reports.
In conducting Brown & Brown’s evaluation of the effectiveness of its internal control over financial reporting, Brown & Brown has excluded the following acquisitions completed by Brown & Brown during 2007: ALCOS, Inc., Grinspec, Inc., Sobel Affiliates Inc., The Combined Group, Inc, et al., Murfield Insurance, Inc., Security Insurance, Inc. II, Security Risk Managers, Inc., Professional Risk Managers, Inc., JPMorgan Insurance Agency, Inc., Island Risk Management Associates, Inc., Independent Insurance Associates, Inc., McFall General Agency, Inc., Dalton Insurance Agency, L.L.C., Evergreen Re, Incorporated, and Turner & Associates Insurance Agency, Inc. Collectively, these acquisitions represented 11.8% of total assets as of December 31, 2007, 4.2% of total revenue and 3.4% of net income for the year ended December 31, 2007. Refer to Note 2 to the Consolidated Financial Statements for further discussion of these acquisitions and their impact on Brown & Brown’s Consolidated Financial Statements.
Changes in Internal Controls
There has not been any change in our internal control over financial reporting identified in connection with the Evaluation that occurred during the quarter ended December 31, 2007 that has materially affected, or is reasonably likely to materially affect, those controls.
Inherent Limitations of Internal Control Over Financial Reporting
Our management, including our CEO and CFO, does not expect that our Disclosure Controls and internal controls will prevent all error and all fraud. A control system, no matter how well conceived and operated, can provide only reasonable, not absolute, assurance that the objectives of the control system are met. Further, the design of a control system must reflect the fact that there are resource constraints, and the benefits of controls must be considered relative to their costs. Because of the inherent limitations in all control systems, no evaluation of controls can provide absolute assurance that all control issues and instances of fraud, if any, within the company have been detected. These inherent limitations include the realities that judgments in decision-making can be faulty, and that breakdowns can occur because of simple error or mistake. Additionally, controls can be circumvented by the individual acts of some persons, by collusion of two or more people, or by management override of the control.
The design of any system of controls also is based in part upon certain assumptions about the likelihood of future events, and there can be no assurance that any design will succeed in achieving its stated goals under all potential future conditions; over time, a control may become inadequate because of changes in conditions, or the degree of compliance with the policies or procedures may deteriorate. Because of the inherent limitations in a cost-effective control system, misstatements due to error or fraud may occur and not be detected.
CEO and CFO Certifications
Exhibits 31.1 and 31.2 are the Certifications of the CEO and the CFO, respectively. The Certifications are required in accordance with Section 302 of the Sarbanes-Oxley Act of 2002 (the “Section 302 Certifications”). This Item of this report, which you are currently reading, is the information concerning the Evaluation referred to in the Section 302 Certifications and this information should be read in conjunction with the Section 302 Certifications for a more complete understanding of the topics presented.
71
Management’s Report on Internal Control Over Financial Reporting
Our management is responsible for establishing and maintaining adequate internal control over financial reporting, as such term is defined in Exchange Act Rule 13a-15(f). Our internal control system was designed to provide reasonable assurance to our management and board of directors regarding the preparation and fair presentation of published financial statements. All internal control systems, no matter how well designed, have inherent limitations. Therefore, even those systems determined to be effective can provide only reasonable assurance with respect to financial statement preparation and presentation.
Under the supervision and with the participation of our management, including our principal executive officer and principal financial officer, we conducted an evaluation of the effectiveness of our internal control over financial reporting based on the framework inInternal Control — Integrated Framework issued by the Committee of Sponsoring Organizations of the Treadway Commission. Based on our evaluation under the framework inInternal Control — Integrated Framework, our management concluded that our internal control over financial reporting was effective as of December 31, 2007. Management’s Annual Report on Internal Control over Financial Reporting and the Report of Independent Registered Public Accounting Firm on Internal Controls over Financial Reporting are set forth in Part II, Item 8 of this Annual Report on Form 10-K and are included herein by reference.
ITEM 9B. Other Information.
None.
PART III
ITEM 10. Directors, Executive Officers and Corporate Governance.
The information required by this item regarding directors and executive officers is incorporated herein by reference to our definitive Proxy Statement to be filed with the SEC in connection with the Annual Meeting of Shareholders to be held in 2008 (the “2008 Proxy Statement”) under the headings “Management” and “Section 16(a) Beneficial Ownership Reporting.” We have adopted a code of ethics that applies to our principal executive officer, principal financial officer, and controller. A copy of our Code of Ethics for Chief Executive Officer and Senior Financial Officers and a copy of our Code of Business Conduct and Ethics applicable to all employees are posted on our Internet website, atwww.bbinsurance.com, and are also available upon written request. Requests for copies of our Code of Ethics should be directed in writing to Corporate Secretary, Brown & Brown, Inc., 3101 West Martin Luther King Jr. Blvd., Suite 400, Tampa, Florida 33607, or by telephone to (813) 222-4277.
ITEM 11. Executive Compensation.
The information required by this item is incorporated herein by reference to the 2008 Proxy Statement under the heading “Executive Compensation.”
ITEM 12. | Security Ownership of Certain Beneficial Owners and Management and Related Stockholder Matters. |
The information required by this item is incorporated herein by reference to the 2008 Proxy Statement under the heading “Security Ownership of Management and Certain Beneficial Owners.”
ITEM 13. | Certain Relationships and Related Transactions, and Director Independence. |
The information required by this item is incorporated herein by reference to the 2008 Proxy Statement under the heading “Management — Certain Relationships and Related Transactions.”
ITEM 14. | Principal Accounting Fees and Services. |
The information required by this item is incorporated herein by reference to the 2008 Proxy Statement under the heading “Fees Paid to Deloitte & Touche LLP.”
72
PART IV
ITEM 15. | Exhibits and Financial Statement Schedules. |
The following documents are filed as part of this Report:
| (a)1. | Financial statements |
Reference is made to the information set forth in Part II, Item 8 of this Report, which information is incorporated by reference.
| 2. | Consolidated Financial Statement Schedules. |
All required Financial Statement Schedules are included in the Consolidated Financial Statements or the Notes to Consolidated Financial Statements.
| 3. | Exhibits |
The following exhibits are filed as a part of this Report:
| 3.1 | Articles of Amendment to Articles of Incorporation (adopted April 24, 2003) (incorporated by reference to Exhibit 3a to Form 10-Q for the quarter ended March 31, 2003), and Amended and Restated Articles of Incorporation (incorporated by reference to Exhibit 3a to Form 10-Q for the quarter ended March 31, 1999). |
| 3.2 | Bylaws (incorporated by reference to Exhibit 3b to Form 10-K for the year ended December 31, 2002). |
| 10.1(a) | Lease of the Registrant for office space at 220 South Ridgewood Avenue, Daytona Beach, Florida dated August 15, 1987 (incorporated by reference to Exhibit 10a(3) to Form 10-K for the year ended December 31, 1993), as amended by Letter Agreement dated June 26, 1995; First Amendment to Lease dated August 2, 1999; Second Amendment to Lease dated December 11, 2001; Third Amendment to Lease dated August 8, 2002; and Fourth Amendment to Lease dated October 26, 2004 (incorporated by reference to Exhibit 10.2(a) to Form 10-K for the year ended December 31, 2005). |
| 10.1(b) | Lease Agreement for office space at 3101 W. Martin Luther King, Jr. Blvd., Tampa, Florida, dated July 1, 2004 and effective May 9, 2005, between Highwoods/Florida Holdings, L.P., as landlord and the Registrant, as tenant (incorporated by reference to Exhibit 10.2(b) to Form 10-K for the year ended December 31, 2005). |
| 10.1(c) | Lease Agreement for office space at Riedman Tower, Rochester, New York, dated January 3, 2001, between Riedman Corporation, as landlord, and the Registrant, as tenant (incorporated by reference to Exhibit 10b(3) to Form 10-K for the year ended December 31, 2001), and Lease for same office space at Riedman Tower, Rochester, New York, dated December 31, 2005, between Riedman Corporation, as landlord, and a subsidiary of the Registrant, as tenant (incorporated by reference to Exhibit 10.2(c) to Form 10-K for the year ended December 31, 2005). |
| 10.2 | Indemnity Agreement dated January 1, 1979, among the Registrant, Whiting National Management, Inc., and Pennsylvania Manufacturers’ Association Insurance Company (incorporated by reference to Exhibit 10g to Registration Statement No. 33-58090 on Form S-4). |
| 10.3 | Agency Agreement dated January 1, 1979 among the Registrant, Whiting National Management, Inc., and Pennsylvania Manufacturers’ Association Insurance Company (incorporated by reference to Exhibit 10h to Registration Statement No. 33-58090 on Form S-4). |
| 10.4(a) | Employment Agreement, dated as of July 29, 1999, between the Registrant and J. Hyatt Brown (incorporated by reference to Exhibit 10f to Form 10-K for the year ended December 31, 1999). |
| 10.4(b) | Portions of Employment Agreement, dated April 28, 1993 between the Registrant and Jim W. Henderson (incorporated by reference to Exhibit 10m to Form 10-K for the year ended December 31, 1993). |
| 10.4(c) | Employment Agreement, dated as of October 8, 1996, between the Registrant and J. Powell Brown. |
| 10.5 | Registrant’s 2000 Incentive Stock Option Plan (incorporated by reference to Exhibit 4 to Registration Statement No. 333-43018 on Form S-8 filed on August 3, 2000). |
| 10.6(a) | Registrant’s Stock Performance Plan (incorporated by reference to Exhibit 4 to Registration Statement No. 333-14925 on Form S-8 filed on October 28, 1996). |
73
| 10.6(b) | Registrant’s Stock Performance Plan as amended, effective January 23, 2008. |
| 10.7 | International Swap Dealers Association, Inc. Master Agreement dated as of December 5, 2001 between SunTrust Bank and the Registrant and letter agreement dated December 6, 2001, regarding confirmation of interest rate transaction (incorporated by reference to Exhibit 10p to Form 10-K for the year ended December 31, 2001). |
| 10.8 | Note Purchase Agreement, dated as of July 15, 2004, among the Company and the listed Purchasers of the 5.57% Series A Senior Notes due September 15, 2011 and 6.08% Series B Senior Notes due July 15, 2014. (incorporated by reference to Exhibit 4.1 to Form 10-Q for the quarter ended June 30, 2004). |
| 10.9 | First Amendment to Amended and Restated Revolving and Term Loan Agreement dated and effective July 15, 2004, by and between Brown & Brown, Inc. and SunTrust Bank (incorporated by reference to Exhibit 4.2 to Form 10-Q for the quarter ended June 30, 2004). |
| 10.10 | Second Amendment to Revolving Loan Agreement dated and effective July 15, 2004, by and between Brown & Brown, Inc. and SunTrust Bank (incorporated by reference to Exhibit 4.3 to Form 10-Q for the quarter ended June 30, 2004). |
| 10.11 | Revolving Loan Agreement Dated as of September 29, 2003, By and Among Brown & Brown, Inc. and SunTrust Bank (incorporated by reference to Exhibit 10a on Form 10-Q for the quarter ended September 30, 2003). |
| 10.12 | Amended and Restated Revolving and Term Loan Agreement dated January 3, 2001 by and between the Registrant and SunTrust Bank (incorporated by reference to Exhibit 4a to Form 10-K for the year ended December 31, 2000). |
| 10.13 | Extension of the Term Loan Agreement between the Registrant and SunTrust Bank (incorporated by reference to Exhibit 10b to Form 10-Q for the quarter ended September 30, 2000). |
| 10.14 | Master Shelf and Note Purchase Agreement Dated as of December 22, 2006, by and among Brown & Brown, Inc., and Prudential Investment Management, Inc. and certain Prudential affiliates as purchasers of the 5.66% Series C Senior Notes due December 22, 2016 (incorporated by reference to Exhibit 10.14 to Form 10-K for the year ended December 31, 2006). |
| 10.15 | Second Amendment to Amended and Restated Revolving and Term Loan Agreement dated as of December 22, 2006, by and between Brown & Brown, Inc. and SunTrust Bank (incorporated by reference to Exhibit 10.15 to Form 10-K for the year ended December 31, 2006). |
| 10.16 | Third Amendment to Revolving Loan Agreement dated as of December 22, 2006, by and between Brown & Brown, Inc. and SunTrust Bank (incorporated by reference to Exhibit 10.16 to Form 10-K for the year ended December 31, 2006). |
| 10.17 | Third Amendment to Amended and Restated Revolving and Term Loan Agreement dated as of January 30, 2007 by and between Brown & Brown, Inc. and SunTrust Bank (incorporated by reference to Exhibit 10.17 to Form 10-K for the year ended December 31, 2006). |
| 10.18 | Fourth Amendment to Revolving Loan Agreement dated as of January 30, 2007 by and between Brown & Brown, Inc. and SunTrust Bank (incorporated by reference to Exhibit 10.18 to Form 10-K for the year ended December 31, 2006). |
| 21 | Subsidiaries of the Registrant. |
| 23 | Consent of Deloitte & Touche LLP. |
| 24 | Powers of Attorney pursuant to which this Form 10-K has been signed on behalf of certain directors of the Registrant. |
| 31.1 | Rule 13a-14(a)/15d-14(a) Certification by the Chief Executive Officer of the Registrant. |
| 31.2 | Rule 13a-14(a)/15d-14(a) Certification by the Chief Financial Officer of the Registrant. |
| 32.1 | Section 1350 Certification by the Chief Executive Officer of the Registrant. |
| 32.2 | Section 1350 Certification by the Chief Financial Officer of the Registrant. |
74
SIGNATURES
Pursuant to the requirements of Section 13 or 15(d) of the Securities Exchange Act of 1934, the registrant has duly caused this report to be signed on its behalf by the undersigned, thereunto duly authorized.
| BROWN & BROWN, INC. Registrant | ||||||
| Date: March 20, 2008 | By: /S/ J. Hyatt Brown | |||||
| J. Hyatt Brown | ||||||
Chief Executive Officer | ||||||
Pursuant to the requirements of the Securities Exchange Act of 1934, this report has been signed below by the following persons on behalf of the registrant and in the capacities and on the date indicated.
| Signature | Title | Date | ||||||||
|---|---|---|---|---|---|---|---|---|---|---|
| /s/ J. Hyatt Brown ______________________________________ J. Hyatt Brown | Chairman of the Board and Chief Executive Officer (Principal Executive Officer) | March 20, 2008 | ||||||||
| * ______________________________________ Jim W. Henderson | Vice Chairman and Chief Operating Officer, Director | March 20, 2008 | ||||||||
| * ______________________________________ J. Powell Brown | President, Director | March 20, 2008 | ||||||||
| /s/ Cory T. Walker ______________________________________ Cory T. Walker | Sr. Vice President, Treasurer and Chief Financial Officer (Principal Financial and Accounting Officer) | March 20, 2008 | ||||||||
| * ______________________________________ Samuel P. Bell, III | Director | March 20, 2008 | ||||||||
| * ______________________________________ Hugh M. Brown | Director | March 20, 2008 | ||||||||
| * ______________________________________ Bradley Currey, Jr. | Director | March 20, 2008 | ||||||||
| * ______________________________________ Theodore J. Hoepner | Director | March 20, 2008 | ||||||||
| * ______________________________________ David H. Hughes | Director | March 20, 2008 | ||||||||
| * ______________________________________ Toni Jennings | Director | March 20, 2008 | ||||||||
| * ______________________________________ Wendell Reilly | Director | March 20, 2008 | ||||||||
| * ______________________________________ John R. Riedman | Director | March 20, 2008 | ||||||||
| * ______________________________________ Jan E. Smith | Director | March 20, 2008 | ||||||||
| * ______________________________________ Chilton D. Varner | Director | March 20, 2008 | ||||||||
| *By: | /S/ LAUREL L. GRAMMIG Laurel L. Grammig Attorney-in-Fact |
75
EXHIBIT INDEX
| 3.1 | Articles of Amendment to Articles of Incorporation (adopted April 24, 2003) (incorporated by reference to Exhibit 3a to Form 10-Q for the quarter ended March 31, 2003), and Amended and Restated Articles of Incorporation (incorporated by reference to Exhibit 3a to Form 10-Q for the quarter ended March 31, 1999). |
| 3.2 | Bylaws (incorporated by reference to Exhibit 3b to Form 10-K for the year ended December 31, 2002). |
| 10.1(a) | Lease of the Registrant for office space at 220 South Ridgewood Avenue, Daytona Beach, Florida dated August 15, 1987 (incorporated by reference to Exhibit 10a(3) to Form 10-K for the year ended December 31, 1993), as amended by Letter Agreement dated June 26, 1995; First Amendment to Lease dated August 2, 1999; Second Amendment to Lease dated December 11, 2001; Third Amendment to Lease dated August 8, 2002; and Fourth Amendment to Lease dated October 26, 2004 (incorporated by reference to Exhibit 10.2(a) to Form 10-K for the year ended December 31, 2005). |
| 10.1(b) | Lease Agreement for office space at 3101 W. Martin Luther King, Jr. Blvd., Tampa, Florida, dated July 1, 2004 and effective May 9, 2005, between Highwoods/Florida Holdings, L.P., as landlord and the Registrant, as tenant (incorporated by reference to Exhibit 10.2(b) to Form 10-K for the year ended December 31, 2005). |
| 10.1(c) | Lease Agreement for office space at Riedman Tower, Rochester, New York, dated January 3, 2001, between Riedman Corporation, as landlord, and the Registrant, as tenant (incorporated by reference to Exhibit 10b(3) to Form 10-K for the year ended December 31, 2001), and Lease for same office space at Riedman Tower, Rochester, New York, dated December 31, 2005, between Riedman Corporation, as landlord, and a subsidiary of the Registrant, as tenant (incorporated by reference to Exhibit 10.2(c) to Form 10-K for the year ended December 31, 2005). |
| 10.2 | Indemnity Agreement dated January 1, 1979, among the Registrant, Whiting National Management, Inc., and Pennsylvania Manufacturers’ Association Insurance Company (incorporated by reference to Exhibit 10g to Registration Statement No. 33-58090 on Form S-4). |
| 10.3 | Agency Agreement dated January 1, 1979 among the Registrant, Whiting National Management, Inc., and Pennsylvania Manufacturers’ Association Insurance Company (incorporated by reference to Exhibit 10h to Registration Statement No. 33-58090 on Form S-4). |
| 10.4(a) | Employment Agreement, dated as of July 29, 1999, between the Registrant and J. Hyatt Brown (incorporated by reference to Exhibit 10f to Form 10-K for the year ended December 31, 1999). |
| 10.4(b) | Portions of Employment Agreement, dated April 28, 1993 between the Registrant and Jim W. Henderson (incorporated by reference to Exhibit 10m to Form 10-K for the year ended December 31, 1993). |
| 10.4(c) | Employment Agreement, dated as of October 8, 1996, between the Registrant and J. Powell Brown (incorporated by reference to Exhibit 10.4(c) to Form 10-K for the year ended December 31, 2007). |
| 10.5 | Registrant’s 2000 Incentive Stock Option Plan (incorporated by reference to Exhibit 4 to Registration Statement No. 333-43018 on Form S-8 filed on August 3, 2000). |
| 10.6(a) | Registrant’s Stock Performance Plan (incorporated by reference to Exhibit 4 to Registration Statement No. 333-14925 on Form S-8 filed on October 28, 1996). |
| 10.6(b) | Registrant’s Stock Performance Plan as amended, effective January 23, 2008 (incorporated by reference to Exhibit 10.6(b) to Form 10-K for the year ended December 31, 2007). |
| 10.7 | International Swap Dealers Association, Inc. Master Agreement dated as of December 5, 2001 between SunTrust Bank and the Registrant and letter agreement dated December 6, 2001, regarding confirmation of interest rate transaction (incorporated by reference to Exhibit 10p to Form 10-K for the year ended December 31, 2001). |
| 10.8 | Note Purchase Agreement, dated as of July 15, 2004, among the Company and the listed Purchasers of the 5.57% Series A Senior Notes due September 15, 2011 and 6.08% Series B Senior Notes due July 15, 2014. (incorporated by reference to Exhibit 4.1 to Form 10-Q for the quarter ended June 30, 2004). |
76
| 10.9 | First Amendment to Amended and Restated Revolving and Term Loan Agreement dated and effective July 15, 2004, by and between Brown & Brown, Inc. and SunTrust Bank (incorporated by reference to Exhibit 4.2 to Form 10-Q for the quarter ended June 30, 2004). |
| 10.10 | Second Amendment to Revolving Loan Agreement dated and effective July 15, 2004, by and between Brown & Brown, Inc. and SunTrust Bank (incorporated by reference to Exhibit 4.3 to Form 10-Q for the quarter ended June 30, 2004). |
| 10.11 | Revolving Loan Agreement Dated as of September 29, 2003, By and Among Brown & Brown, Inc. and SunTrust Bank (incorporated by reference to Exhibit 10a on Form 10-Q for the quarter ended September 30, 2003). |
| 10.12 | Amended and Restated Revolving and Term Loan Agreement dated January 3, 2001 by and between the Registrant and SunTrust Bank (incorporated by reference to Exhibit 4a to Form 10-K for the year ended December 31, 2000). |
| 10.13 | Extension of the Term Loan Agreement between the Registrant and SunTrust Bank (incorporated by reference to Exhibit 10b to Form 10-Q for the quarter ended September 30, 2000). |
| 10.14 | Master Shelf and Note Purchase Agreement Dated as of December 22, 2006, by and among Brown & Brown, Inc., and Prudential Investment Management, Inc. and certain Prudential affiliates as purchasers of the 5.66% Series C Senior Notes due December 22, 2016 (incorporated by reference to Exhibit 10.14 to Form 10-K for the year ended December 31, 2006). |
| 10.15 | Second Amendment to Amended and Restated Revolving and Term Loan Agreement dated as of December 22, 2006, by and between Brown & Brown, Inc. and SunTrust Bank (incorporated by reference to Exhibit 10.15 to Form 10-K for the year ended December 31, 2006). |
| 10.16 | Third Amendment to Revolving Loan Agreement dated as of December 22, 2006, by and between Brown & Brown, Inc. and SunTrust Bank (incorporated by reference to Exhibit 10.16 to Form 10-K for the year ended December 31, 2006). |
| 10.17 | Third Amendment to Amended and Restated Revolving and Term Loan Agreement dated as of January 30, 2007 by and between Brown & Brown, Inc. and SunTrust Bank (incorporated by reference to Exhibit 10.17 to Form 10-K for the year ended December 31, 2006). |
| 10.18 | Fourth Amendment to Revolving Loan Agreement dated as of January 30, 2007 by and between Brown & Brown, Inc. and SunTrust Bank (incorporated by reference to Exhibit 10.18 to Form 10-K for the year ended December 31, 2006). |
| 21 | Subsidiaries of the Registrant (incorporated by reference to Exhibit 21 to Form 10-K for the year ended December 31, 2007). |
| 23 | Consent of Deloitte & Touche LLP. |
| 24 | Powers of Attorney pursuant to which this Form 10-K has been signed on behalf of certain directors of the Registrant (incorporated by reference to Exhibit 24 to Form 10-K for the year ended December 31, 2007). |
| 31.1 | Rule 13a-14(a)/15d-14(a) Certification by the Chief Executive Officer of the Registrant. |
| 31.2 | Rule 13a-14(a)/15d-14(a) Certification by the Chief Financial Officer of the Registrant. |
| 32.1 | Section 1350 Certification by the Chief Executive Officer of the Registrant (incorporated by reference to Exhibit 32.1 to Form 10-K for the year ended December 31, 2007). |
| 32.2 | Section 1350 Certification by the Chief Financial Officer of the Registrant (incorporated by reference to Exhibit 32.2 to Form 10-K for the year ended December 31, 2007). |
77