UNITED STATES
SECURITIES AND EXCHANGE COMMISSION
Washington, D.C. 20549
FORM N-CSR
CERTIFIED SHAREHOLDER REPORT OF REGISTERED
MANAGEMENT INVESTMENT COMPANIES
Investment Company Act file number811- 4651
John Hancock Strategic Series
(Exact name of registrant as specified in charter)
200 Berkeley Street, Boston, Massachusetts 02116
(Address of principal executive offices) (Zip code)
Salvatore Schiavone
Treasurer
200 Berkeley Street
Boston, Massachusetts 02116
(Name and address of agent for service)
Registrant's telephone number, including area code:617-663-4497
| Date of fiscal year end: | May 31 |
| Date of reporting period: | May 31, 2019 |
ITEM 1. REPORTS TO STOCKHOLDERS.
John Hancock
Income Fund
Annual report 5/31/19
Beginning on January 1, 2021, as permitted by regulations adopted by the Securities and Exchange Commission, paper copies of the Fund's shareholder reports like this one will no longer be sent by mail, unless you specifically request paper copies of the reports from the Fund or from your financial intermediary. Instead, the reports will be made available on a website, and you will be notified by mail each time a report is posted and provided with a website link to access the report.
If you already elected to receive shareholder reports electronically, you will not be affected by this change, and you do not need to take any action. You may elect to receive shareholder reports and other communications electronically by calling John Hancock Investment Management at 800-225-5291 (Class A, Class B and Class C shares) or 888-972-8696 (Class I, Class R1, Class R2, Class R3, Class R4, Class R5 and Class R6 shares) or by contacting your financial intermediary.
You may elect to receive all reports in paper, free of charge, at any time. You can inform John Hancock Investment Management or your financial intermediary that you wish to continue receiving paper copies of your shareholder reports by following the instructions listed above. Your election to receive reports in paper will apply to all funds held with John Hancock Investment Management or your financial intermediary.


A message to shareholders
Dear shareholder,
A solid and stable economy enabled the U.S. Federal Reserve (Fed) to continue normalizing monetary policy for most of 2018; however, concerns about the strength of the broader global economy and the durability of the now 10-year-old bull market led investors to dial back riskexposures. Those concerns may ultimately have been shared by the Fed, which shifted to a neutral stance on interest rates in the beginning of 2019 after three years of hikes. The markets responded favorably, with most bond indexes registering gains before hitting a patch of turbulence in May as trade turmoil between the United States and China flared again.
As always, your best resource in unpredictable markets is your financial advisor, who can help position your portfolio so that it's sufficiently diversified to meet your long-term objectives and to withstand the inevitable turbulence along the way.
On behalf of everyone at John Hancock Investment Management, I'd like to take this opportunity to welcome new shareholders and thank existing shareholders for the continued trust you've placed in us.
Sincerely,

Andrew G. Arnott
President and CEO,
John Hancock Investment Management
Head of Wealth and Asset Management,
United States and Europe
This commentary reflects the CEO's views as of this report's period end and are subject to change at any time. Diversification does not guarantee investment returns and does not eliminate risk of loss. All investments entail risks, including the possible loss of principal. For more up-to-date information, you can visit our website at jhinvestments.com.
John Hancock
Income Fund
Table of contents
| 2 | Your fund at a glance | |
| 5 | Discussion of fund performance | |
| 7 | A look at performance | |
| 9 | Your expenses | |
| 11 | Fund's investments | |
| 31 | Financial statements | |
| 35 | Financial highlights | |
| 45 | Notes to financial statements | |
| 60 | Report of independent registered public accounting firm | |
| 61 | Tax information | |
| 62 | Trustees and Officers | |
| 66 | More information |
INVESTMENT OBJECTIVE
The fund seeks a high level of current income.
AVERAGE ANNUAL TOTAL RETURNS AS OF 5/31/19 (%)
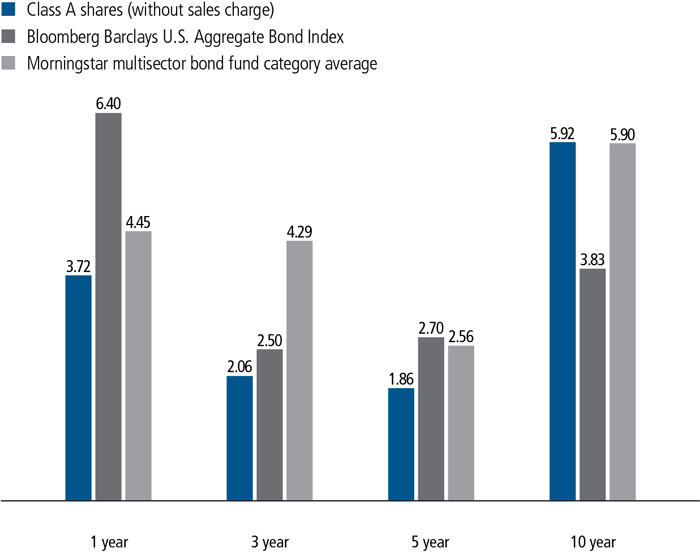
The Bloomberg Barclays U.S. Aggregate Bond Index is an unmanaged index of dollar-denominated and nonconvertible investment-grade debt issues.
It is not possible to invest directly in an index. Index figures do not reflect expenses or sales charges, which would result in lower returns.
Figures from Morningstar, Inc. include reinvested distributions and do not take into account sales charges. Actual load-adjusted performance is lower.
The past performance shown here reflects reinvested distributions and the beneficial effect of any expense reductions, and does not guarantee future results. Performance of the other share classes will vary based on the difference in the fees and expenses of those classes. Shares will fluctuate in value and, when redeemed, may be worth more or less than their original cost. Current month-end performance may be lower or higher than the performance cited, and can be found at jhinvestments.com or by calling 800-225-5291. For further information on the fund's objectives, risks, and strategy, see the fund's prospectus.
PERFORMANCE HIGHLIGHTS OVER THE LAST TWELVE MONTHS
Bonds gained and yields fell late in the period
Bonds posted solid returns as slowing economic growth and a shift in interest-rate policy by the U.S. Federal Reserve in early 2019 led to lower bond yields and rising bond prices.
Duration and currency positioning detracted
The fund's underperformance of the Bloomberg Barclays U.S. Aggregate Bond Index was driven primarily by a relatively short duration and foreign currency exposure.
Sector allocation added value
The fund's holdings of convertible bonds, nongovernment-agency mortgage-backed securities, and bank loans, all of which aren't represented in the index, contributed positively to relative performance.
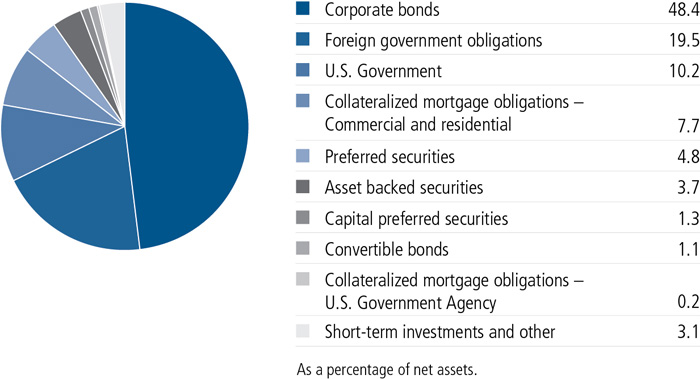
PORTFOLIO COMPOSITION AS OF 5/31/19 (%)
A note about risks
The fund is subject to various risks as described in the fund's prospectus. For more information, please refer to the "Principal risks" section of the prospectus.
COUNTRY COMPOSITION AS OF 5/31/19 (%)
| United States | 66.4 |
| Canada | 4.9 |
| Supranational | 3.5 |
| Brazil | 3.1 |
| Indonesia | 2.6 |
| Philippines | 2.3 |
| Norway | 2.0 |
| Ireland | 1.8 |
| Singapore | 1.6 |
| Netherlands | 1.4 |
| Other countries | 10.4 |
| TOTAL | 100.0 |
| As a percentage of net assets. |
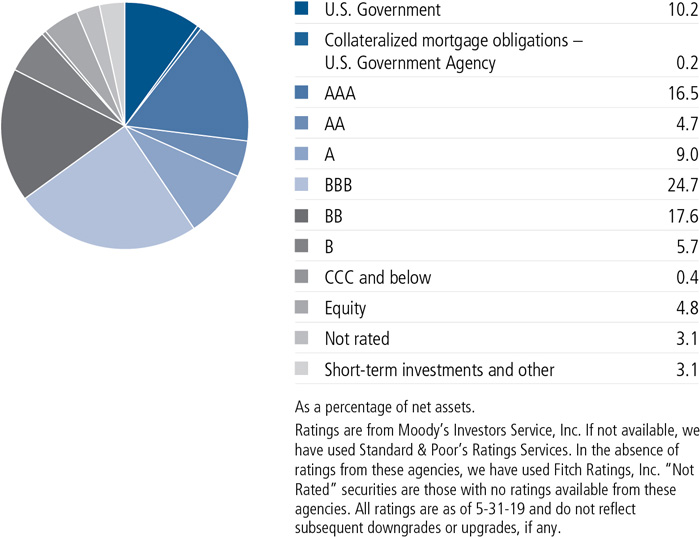
QUALITY COMPOSITION AS OF 5/31/19 (%)
Can you talk about the bond market and its performance for the 12 months ended May 31, 2019?
U.S. bonds posted solid overall returns for the period. The fund's benchmark, the Bloomberg Barclays U.S. Aggregate Bond Index, returned 6.40%. U.S. economic growth accelerated in the first half of the reporting period, driven in part by federal tax reform legislation that took effect at the beginning of 2018. In response, the U.S. Federal Reserve (Fed) raised short-term interest rates three times. Signs of slowing economic activity emerged during the second half of the 12-month period, in part due to an escalating trade war between the United States and China. As a result, the Fed pivoted to a wait-and-see approach, holding interest rates steady through the first five months of 2019.
Bond yields tracked the swings in the economy, rising during the first half of the reporting period and then falling back in the last six months. Bond yields fell especially sharply during the last two months of the period as the bond market began to price in the possibility of a Fed interest-rate cut later in the year. Investment-grade corporate bonds and commercial mortgage-backed securities were the best-performing sectors, while high-yield corporate bonds (generally those rated BB or lower) lagged.
How did the fund perform?
The fund delivered a positive return but trailed the performance of its benchmark index. One contributing factor was the fund's duration (a measure of interest-rate sensitivity), which was shorter than that of the index throughout the period. This was beneficial when bond yields were rising early in the period, but it detracted from performance when yields declined significantly during the latter half of the period.
The fund's currency exposure was also a net detractor from relative results. The U.S. dollar strengthened against most currencies for the 12 months, which weighed on the fund's holdings denominated in foreign currencies. The fund's exposure to the euro detracted the most, but holdings in emerging-market currencies, such as the Indian rupee and the Colombian peso, were also a drag on relative performance.
On the plus side, sector allocation added value. Out-of-index positions in convertible bonds, nongovernment-agency mortgage-backed securities, and bank loans contributed meaningfully to relative results, as did overweight positions in asset-backed securities and commercial mortgage-backed securities.
How was the portfolio positioned at the end of the reporting period?
In early 2019, we made some adjustments to the fund's positioning in response to changing market conditions. We eliminated the fund's holdings of bank loans, as the Fed's shift to a stable interest-rate policy made the floating-rate nature of bank loans less attractive. We invested the proceeds in a mix of high-yield and investment-grade corporate bonds, as well as U.S. Treasury securities. As part of these positioning changes, we lengthened the fund's duration, reflecting our belief that the risk of a sharp move higher in global interest rates has been tempered by moderating economic growth.
We believe an economic environment featuring slow, stable growth will be positive for bonds, and particularly corporate credit. However, given the continued uncertainty surrounding geopolitical issues such as Brexit and global trade tensions, we're maintaining the fund's relatively defensive posture with regard to interest rates and credit quality.
MANAGED BY
 | Daniel S. Janis III On the fund since 1999 Investing since 1984 |
 | Thomas C. Goggins On the fund since 2009 Investing since 1989 |
 | Kisoo Park On the fund since 2015 Investing since 1986 |
 | Christopher M. Chapman, CFA On the fund since 2017 Investing since 1999 |
![]()
TOTAL RETURNS FOR THE PERIOD ENDED MAY 31, 2019
| Average annual total returns (%) with maximum sales charge | Cumulative total returns (%) with maximum sales charge | SEC 30-day yield (%) subsidized | SEC 30-day yield (%) unsubsidized1 | ||||||||
| 1-year | 5-year | 10-year | 5-year | 10-year | as of 5-31-19 | as of 5-31-19 | |||||
| Class A | -0.43 | 1.03 | 5.50 | 5.27 | 70.80 | 2.86 | 2.85 | ||||
| Class B | -2.01 | 0.79 | 5.33 | 4.03 | 68.15 | 2.28 | 2.27 | ||||
| Class C | 1.99 | 1.15 | 5.19 | 5.90 | 65.82 | 2.28 | 2.27 | ||||
| Class I2 | 4.18 | 2.20 | 6.31 | 11.50 | 84.32 | 3.27 | 3.27 | ||||
| Class R12 | 3.35 | 1.51 | 5.60 | 7.81 | 72.43 | 2.64 | 2.63 | ||||
| Class R22,3 | 3.61 | 1.76 | 5.90 | 9.13 | 77.32 | 2.89 | 2.88 | ||||
| Class R32 | 3.46 | 1.65 | 5.71 | 8.51 | 74.25 | 2.74 | 2.73 | ||||
| Class R42 | 3.87 | 2.02 | 6.08 | 10.53 | 80.52 | 3.14 | 3.03 | ||||
| Class R52 | 4.08 | 2.22 | 6.32 | 11.61 | 84.58 | 3.33 | 3.33 | ||||
| Class R62,3 | 4.13 | 2.28 | 6.28 | 11.93 | 83.79 | 3.39 | 3.38 | ||||
| Index† | 6.40 | 2.70 | 3.83 | 14.26 | 45.57 | — | — | ||||
Performance figures assume all distributions have been reinvested. Figures reflect maximum sales charges on Class A shares of 4.0%, and the applicable contingent deferred sales charge (CDSC) on Class B and Class C shares. The returns for Class A shares have been adjusted to reflect the reduction in the maximum sales charge from 4.5% to 4.0%, effective 2-3-14. The Class B shares' CDSC declines annually between years 1 to 6 according to the following schedule: 5%, 4%, 3%, 3%, 2%, 1%. No sales charge will be assessed after the sixth year. Class C shares sold within one year of purchase are subject to a 1% CDSC. Sales charges are not applicable to Class I, Class R1, Class R2, Class R3, Class R4, Class R5, and Class R6 shares.
The expense ratios of the fund, both net (including any fee waivers and/or expense limitations) and gross (excluding any fee waivers and/or expense limitations), are set forth according to the most recent publicly available prospectus for the fund and may differ from those disclosed in the Financial highlights tables in this report. Net expenses reflect contractual expense limitations in effect until September 30, 2020 and are subject to change. Had the contractual fee waivers and expense limitations not been in place, gross expenses would apply. The expense ratios are as follows:
| Class A | Class B | Class C | Class I | Class R1 | Class R2 | Class R3 | Class R4 | Class R5 | Class R6 | |
| Gross (%) | 0.80 | 1.50 | 1.50 | 0.50 | 1.15 | 0.90 | 1.05 | 0.75 | 0.45 | 0.40 |
| Net (%) | 0.79 | 1.49 | 1.49 | 0.49 | 1.14 | 0.89 | 1.04 | 0.64 | 0.44 | 0.39 |
Please refer to the most recent prospectus and annual or semiannual report for more information on expenses and any expense limitation arrangements for each class.
The returns reflect past results and should not be considered indicative of future performance. The return and principal value of an investment will fluctuate so that shares, when redeemed, may be worth more or less than their original cost. Due to market volatility and other factors, the fund's current performance may be higher or lower than the performance shown. For current to the most recent month-end performance data, please call 800-225-5291 or visit the fund's website at jhinvestments.com.
The performance table above and the chart on the next page do not reflect the deduction of taxes that a shareholder would pay on fund distributions or the redemption of fund shares. The fund's performance results reflect any applicable fee waivers or expense reductions, without which the expenses would increase and results would have been less favorable.
| † | Index is the Bloomberg Barclays U.S. Aggregate Bond Index. |
See the following page for footnotes.
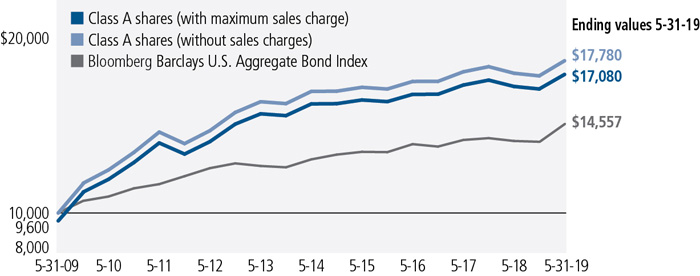
This chart and table show what happened to a hypothetical $10,000 investment in John Hancock Income Fund for the share classes and periods indicated, assuming all distributions were reinvested. For comparison, we've shown the same investment in the Bloomberg Barclays U.S. Aggregate Bond Index.
| Start date | With maximum sales charge ($) | Without sales charge ($) | Index ($) | |
| Class B4 | 5-31-09 | 16,815 | 16,815 | 14,557 |
| Class C4 | 5-31-09 | 16,582 | 16,582 | 14,557 |
| Class I2 | 5-31-09 | 18,432 | 18,432 | 14,557 |
| Class R12 | 5-31-09 | 17,243 | 17,243 | 14,557 |
| Class R22,3 | 5-31-09 | 17,732 | 17,732 | 14,557 |
| Class R32 | 5-31-09 | 17,425 | 17,425 | 14,557 |
| Class R42 | 5-31-09 | 18,052 | 18,052 | 14,557 |
| Class R52 | 5-31-09 | 18,458 | 18,458 | 14,557 |
| Class R62,3 | 5-31-09 | 18,379 | 18,379 | 14,557 |
The values shown in the chart for Class A shares with maximum sales charge have been adjusted to reflect the reduction in the Class A shares' maximum sales charge from 4.5% to 4.0%, which became effective on 2-3-14.
The Bloomberg Barclays U.S. Aggregate Bond Index is an unmanaged index of dollar-denominated and nonconvertible investment-grade debt issues.
It is not possible to invest directly in an index. Index figures do not reflect expenses or sales charges, which would result in lower returns.
Footnotes related to performance pages
| 1 | Unsubsidized yield reflects what the yield would have been without the effects of reimbursements and waivers. |
| 2 | For certain types of investors, as described in the fund's prospectus. |
| 3 | Class R2 shares were first offered on 3-1-12; Class R6 shares were first offered 9-1-11. Returns prior to these dates are those of Class A, that have not been adjusted for class-specific expenses; otherwise, returns would vary. |
| 4 | The contingent deferred sales charge is not applicable. |
| Your expenses |
| ANNUAL REPORT | JOHN HANCOCK INCOME FUND | 9 |
| Account value on 12-1-2018 | Ending value on 5-31-2019 | Expenses paid during period ended 5-31-20191 | Annualized expense ratio | ||
| Class A | Actual expenses/actual returns | $1,000.00 | $1,045.40 | $4.28 | 0.84% |
| Hypothetical example | 1,000.00 | 1,020.70 | 4.23 | 0.84% | |
| Class B | Actual expenses/actual returns | 1,000.00 | 1,041.80 | 7.84 | 1.54% |
| Hypothetical example | 1,000.00 | 1,017.30 | 7.75 | 1.54% | |
| Class C | Actual expenses/actual returns | 1,000.00 | 1,041.80 | 7.84 | 1.54% |
| Hypothetical example | 1,000.00 | 1,017.30 | 7.75 | 1.54% | |
| Class I | Actual expenses/actual returns | 1,000.00 | 1,047.00 | 2.81 | 0.55% |
| Hypothetical example | 1,000.00 | 1,022.20 | 2.77 | 0.55% | |
| Class R1 | Actual expenses/actual returns | 1,000.00 | 1,043.50 | 6.06 | 1.19% |
| Hypothetical example | 1,000.00 | 1,019.00 | 5.99 | 1.19% | |
| Class R2 | Actual expenses/actual returns | 1,000.00 | 1,045.00 | 4.79 | 0.94% |
| Hypothetical example | 1,000.00 | 1,020.20 | 4.73 | 0.94% | |
| Class R3 | Actual expenses/actual returns | 1,000.00 | 1,044.20 | 5.50 | 1.08% |
| Hypothetical example | 1,000.00 | 1,019.50 | 5.44 | 1.08% | |
| Class R4 | Actual expenses/actual returns | 1,000.00 | 1,046.20 | 3.37 | 0.66% |
| Hypothetical example | 1,000.00 | 1,021.60 | 3.33 | 0.66% | |
| Class R5 | Actual expenses/actual returns | 1,000.00 | 1,047.30 | 2.50 | 0.49% |
| Hypothetical example | 1,000.00 | 1,022.50 | 2.47 | 0.49% | |
| Class R6 | Actual expenses/actual returns | 1,000.00 | 1,045.80 | 2.19 | 0.43% |
| Hypothetical example | 1,000.00 | 1,022.80 | 2.17 | 0.43% |
| 1 | Expenses are equal to the annualized expense ratio, multiplied by the average account value over the period, multiplied by 182/365 (to reflect the one-half year period). |
| 10 | JOHN HANCOCK INCOME FUND | ANNUAL REPORT |
| Fund’s investments |
| Rate (%) | Maturity date | Par value^ | Value | ||
| U.S. Government and Agency obligations 10.2% | $182,024,394 | ||||
| (Cost $173,289,071) | |||||
| U.S. Government 10.2% | 182,024,394 | ||||
| U.S. Treasury | |||||
| Bond | 2.750 | 11-15-42 | 23,910,000 | 24,816,899 | |
| Bond | 3.000 | 02-15-49 | 19,585,000 | 21,323,169 | |
| Bond | 3.125 | 02-15-43 | 28,330,000 | 31,296,903 | |
| Bond | 4.375 | 02-15-38 | 13,300,000 | 17,389,750 | |
| Note | 2.000 | 11-15-26 | 11,350,000 | 11,312,758 | |
| Note | 2.375 | 02-29-24 | 18,345,000 | 18,721,216 | |
| Note | 2.375 | 05-15-29 | 25,140,000 | 25,676,189 | |
| Note | 2.500 | 02-15-22 | 8,250,000 | 8,379,873 | |
| Note | 2.500 | 01-31-24 | 13,600,000 | 13,943,719 | |
| Note | 2.625 | 02-15-29 | 8,790,000 | 9,163,918 | |
| Foreign government obligations 19.5% | $349,267,640 | ||||
| (Cost $380,393,256) | |||||
| Australia 0.5% | 9,493,118 | ||||
| New South Wales Treasury Corp. | 4.000 | 04-08-21 | AUD | 3,875,000 | 2,821,248 |
| Queensland Treasury Corp. | 5.500 | 06-21-21 | AUD | 5,810,000 | 4,369,616 |
| Western Australian Treasury Corp. | 2.500 | 07-23-24 | AUD | 3,175,000 | 2,302,254 |
| Austria 0.3% | 5,388,361 | ||||
| Republic of Austria (A) | 0.500 | 02-20-29 | EUR | 4,650,000 | 5,388,361 |
| Brazil 2.2% | 39,061,716 | ||||
| Federative Republic of Brazil | 4.500 | 05-30-29 | 6,685,000 | 6,618,150 | |
| Federative Republic of Brazil | 10.000 | 01-01-21 | BRL | 40,435,000 | 10,808,865 |
| Federative Republic of Brazil | 10.000 | 01-01-23 | BRL | 79,085,000 | 21,634,701 |
| Canada 3.0% | 53,976,488 | ||||
| Canada Housing Trust No. 1 (A) | 2.350 | 06-15-23 | CAD | 9,500,000 | 7,215,178 |
| Export Development Canada | 2.400 | 06-07-21 | AUD | 3,560,000 | 2,515,512 |
| Government of Canada | 0.750 | 09-01-20 | CAD | 8,595,000 | 6,295,030 |
| Government of Canada | 2.250 | 03-01-24 | CAD | 22,375,000 | 17,149,090 |
| Province of Alberta | 3.400 | 12-01-23 | CAD | 9,000,000 | 7,106,711 |
| Province of Ontario | 3.500 | 06-02-24 | CAD | 11,430,000 | 9,112,034 |
| Province of Quebec | 3.000 | 09-01-23 | CAD | 5,900,000 | 4,582,933 |
| Colombia 1.3% | 23,926,834 | ||||
| Republic of Colombia | 4.000 | 02-26-24 | 5,050,000 | 5,206,550 | |
| Republic of Colombia | 4.500 | 01-28-26 | 5,065,000 | 5,333,445 | |
| Republic of Colombia | 7.000 | 09-11-19 | COP | 12,687,100,000 | 3,782,382 |
| Republic of Colombia | 7.000 | 05-04-22 | COP | 16,787,000,000 | 5,204,147 |
| Republic of Colombia | 11.000 | 07-24-20 | COP | 13,881,200,000 | 4,400,310 |
| SEE NOTES TO FINANCIAL STATEMENTS | ANNUAL REPORT | JOHN HANCOCK INCOME FUND | 11 |
| Rate (%) | Maturity date | Par value^ | Value | ||
| Finland 0.3% | $5,104,631 | ||||
| Republic of Finland (A) | 0.500 | 09-15-28 | EUR | 4,380,000 | 5,104,631 |
| Hungary 0.5% | 9,458,507 | ||||
| Republic of Hungary | 6.375 | 03-29-21 | 8,886,000 | 9,458,507 | |
| Indonesia 2.2% | 39,126,455 | ||||
| Republic of Indonesia (A) | 2.150 | 07-18-24 | EUR | 4,335,000 | 5,084,004 |
| Republic of Indonesia | 5.625 | 05-15-23 | IDR | 15,613,000,000 | 1,027,537 |
| Republic of Indonesia (A) | 5.875 | 01-15-24 | 1,450,000 | 1,603,420 | |
| Republic of Indonesia | 6.125 | 05-15-28 | IDR | 88,584,000,000 | 5,509,649 |
| Republic of Indonesia | 6.625 | 05-15-33 | IDR | 30,647,000,000 | 1,837,171 |
| Republic of Indonesia | 7.000 | 05-15-22 | IDR | 34,066,000,000 | 2,368,927 |
| Republic of Indonesia | 7.000 | 05-15-27 | IDR | 51,733,000,000 | 3,421,352 |
| Republic of Indonesia | 7.500 | 05-15-38 | IDR | 40,237,000,000 | 2,570,615 |
| Republic of Indonesia | 8.250 | 07-15-21 | IDR | 41,859,000,000 | 2,990,910 |
| Republic of Indonesia | 8.250 | 05-15-29 | IDR | 5,604,000,000 | 401,478 |
| Republic of Indonesia | 8.375 | 03-15-24 | IDR | 44,433,000,000 | 3,206,246 |
| Republic of Indonesia | 8.375 | 09-15-26 | IDR | 49,203,000,000 | 3,549,132 |
| Republic of Indonesia | 8.750 | 05-15-31 | IDR | 48,811,000,000 | 3,545,401 |
| Republic of Indonesia | 9.000 | 03-15-29 | IDR | 26,967,000,000 | 2,010,613 |
| Ireland 1.3% | 22,900,808 | ||||
| Republic of Ireland | 3.400 | 03-18-24 | EUR | 9,843,000 | 12,934,259 |
| Republic of Ireland | 3.900 | 03-20-23 | EUR | 7,670,000 | 9,966,549 |
| Malaysia 1.2% | 20,583,968 | ||||
| Government of Malaysia | 3.620 | 11-30-21 | MYR | 8,840,000 | 2,120,315 |
| Government of Malaysia | 3.733 | 06-15-28 | MYR | 11,880,000 | 2,810,742 |
| Government of Malaysia | 3.844 | 04-15-33 | MYR | 14,961,000 | 3,472,730 |
| Government of Malaysia | 3.882 | 03-14-25 | MYR | 9,635,000 | 2,318,199 |
| Government of Malaysia | 3.899 | 11-16-27 | MYR | 12,709,000 | 3,046,609 |
| Government of Malaysia | 4.059 | 09-30-24 | MYR | 15,500,000 | 3,774,747 |
| Government of Malaysia | 4.160 | 07-15-21 | MYR | 12,538,000 | 3,040,626 |
| New Zealand 0.4% | 6,616,431 | ||||
| Dominion of New Zealand | 6.000 | 05-15-21 | NZD | 9,272,000 | 6,616,431 |
| Norway 1.2% | 21,942,246 | ||||
| Government of Norway (A) | 2.000 | 05-24-23 | NOK | 59,645,000 | 6,998,046 |
| Government of Norway (A) | 3.750 | 05-25-21 | NOK | 124,770,000 | 14,944,200 |
| Philippines 2.3% | 41,564,787 | ||||
| Republic of Philippines | 0.875 | 05-17-27 | EUR | 5,500,000 | 6,174,032 |
| Republic of Philippines | 3.375 | 01-12-20 | PHP | 39,170,000 | 741,111 |
| Republic of Philippines | 3.375 | 08-20-20 | PHP | 27,780,000 | 519,271 |
| Republic of Philippines | 3.500 | 03-20-21 | PHP | 135,240,000 | 2,502,857 |
| Republic of Philippines | 3.500 | 04-21-23 | PHP | 213,500,000 | 3,797,845 |
| 12 | JOHN HANCOCK INCOME FUND | ANNUAL REPORT | SEE NOTES TO FINANCIAL STATEMENTS |
| Rate (%) | Maturity date | Par value^ | Value | ||
| Philippines (continued) | |||||
| Republic of Philippines | 3.875 | 11-22-19 | PHP | 161,410,000 | $3,070,884 |
| Republic of Philippines | 4.250 | 04-11-20 | PHP | 86,605,000 | 1,641,693 |
| Republic of Philippines | 4.625 | 09-09-40 | PHP | 29,167,000 | 477,299 |
| Republic of Philippines | 5.500 | 03-08-23 | PHP | 107,000,000 | 2,049,620 |
| Republic of Philippines | 6.250 | 03-12-24 | PHP | 140,540,000 | 2,782,585 |
| Republic of Philippines | 6.250 | 01-14-36 | PHP | 242,000,000 | 5,190,652 |
| Republic of Philippines | 6.500 | 04-28-21 | PHP | 222,970,000 | 4,346,126 |
| Republic of Philippines | 8.000 | 07-19-31 | PHP | 356,645,000 | 8,270,812 |
| Portugal 0.6% | 10,793,091 | ||||
| Republic of Portugal (A) | 3.850 | 04-15-21 | EUR | 4,275,000 | 5,155,126 |
| Republic of Portugal (A) | 5.125 | 10-15-24 | 5,110,000 | 5,637,965 | |
| Qatar 0.5% | 9,275,463 | ||||
| State of Qatar (A) | 4.000 | 03-14-29 | 3,885,000 | 4,088,963 | |
| State of Qatar (A) | 4.817 | 03-14-49 | 4,715,000 | 5,186,500 | |
| Singapore 1.2% | 21,396,229 | ||||
| Republic of Singapore | 3.250 | 09-01-20 | SGD | 25,095,000 | 18,542,112 |
| Republic of Singapore | 3.375 | 09-01-33 | SGD | 3,470,000 | 2,854,117 |
| Sweden 0.4% | 6,504,782 | ||||
| Kingdom of Sweden (A) | 0.125 | 04-24-23 | EUR | 5,710,000 | 6,504,782 |
| United Kingdom 0.1% | 2,153,725 | ||||
| Government of United Kingdom | 3.750 | 09-07-20 | GBP | 1,640,000 | 2,153,725 |
| Corporate bonds 48.4% | $865,610,834 | ||||
| (Cost $870,876,004) | |||||
| Communication services 3.6% | 64,715,202 | ||||
| Media 3.5% | |||||
| Altice Luxembourg SA (A) | 7.625 | 02-15-25 | 4,910,000 | 4,520,637 | |
| CCO Holdings LLC (A) | 5.000 | 02-01-28 | 5,940,000 | 5,880,600 | |
| CCO Holdings LLC (A) | 5.125 | 05-01-27 | 6,035,000 | 6,038,772 | |
| Charter Communications Operating LLC | 5.050 | 03-30-29 | 6,106,000 | 6,498,061 | |
| Charter Communications Operating LLC | 5.750 | 04-01-48 | 4,680,000 | 4,934,952 | |
| CSC Holdings LLC (A) | 5.375 | 02-01-28 | 7,417,000 | 7,435,543 | |
| CSC Holdings LLC (A) | 5.500 | 04-15-27 | 3,850,000 | 3,915,643 | |
| CSC Holdings LLC (A) | 6.500 | 02-01-29 | 6,566,000 | 6,941,575 | |
| DISH DBS Corp. | 5.875 | 07-15-22 | 4,650,000 | 4,570,020 | |
| EMI Music Publishing Group North America Holdings, Inc. (A) | 7.625 | 06-15-24 | 1,826,000 | 1,929,169 | |
| Sirius XM Radio, Inc. (A) | 5.000 | 08-01-27 | 9,435,000 | 9,293,475 | |
| Wireless telecommunication services 0.1% | |||||
| T-Mobile USA, Inc. | 4.500 | 02-01-26 | 1,805,000 | 1,782,438 | |
| SEE NOTES TO FINANCIAL STATEMENTS | ANNUAL REPORT | JOHN HANCOCK INCOME FUND | 13 |
| Rate (%) | Maturity date | Par value^ | Value | ||
| Communication services (continued) | |||||
| Wireless telecommunication services (continued) | |||||
| T-Mobile USA, Inc. | 5.125 | 04-15-25 | 355,000 | $360,992 | |
| T-Mobile USA, Inc. | 6.000 | 04-15-24 | 220,000 | 228,250 | |
| T-Mobile USA, Inc. | 6.500 | 01-15-26 | 365,000 | 385,075 | |
| Consumer discretionary 2.4% | 42,289,216 | ||||
| Automobiles 0.3% | |||||
| BMW Finance NV | 1.000 | 11-14-24 | EUR | 1,495,000 | 1,704,374 |
| Ford Motor Company | 6.625 | 10-01-28 | 2,691,000 | 2,946,702 | |
| Hotels, restaurants and leisure 1.8% | |||||
| Hilton Domestic Operating Company, Inc. | 5.125 | 05-01-26 | 3,435,000 | 3,455,438 | |
| International Game Technology PLC (A) | 6.500 | 02-15-25 | 6,815,000 | 7,189,825 | |
| KFC Holding Company/Pizza Hut Holdings LLC/Taco Bell of America LLC (A) | 4.750 | 06-01-27 | 2,910,000 | 2,851,800 | |
| KFC Holding Company/Pizza Hut Holdings LLC/Taco Bell of America LLC (A) | 5.000 | 06-01-24 | 4,760,000 | 4,831,400 | |
| KFC Holding Company/Pizza Hut Holdings LLC/Taco Bell of America LLC (A) | 5.250 | 06-01-26 | 3,686,000 | 3,732,075 | |
| New Red Finance, Inc. (A) | 4.625 | 01-15-22 | 7,130,000 | 7,130,000 | |
| New Red Finance, Inc. (A) | 5.000 | 10-15-25 | 2,700,000 | 2,646,000 | |
| Internet and direct marketing retail 0.3% | |||||
| Expedia Group, Inc. | 5.000 | 02-15-26 | 5,380,000 | 5,801,602 | |
| Consumer staples 2.2% | 39,752,989 | ||||
| Beverages 0.6% | |||||
| Molson Coors Brewing Company | 1.250 | 07-15-24 | EUR | 2,975,000 | 3,373,477 |
| Molson Coors Brewing Company | 3.000 | 07-15-26 | 8,123,000 | 7,891,033 | |
| Food and staples retailing 0.4% | |||||
| Aramark Services, Inc. (A) | 5.000 | 04-01-25 | 4,440,000 | 4,417,800 | |
| Aramark Services, Inc. | 5.125 | 01-15-24 | 2,600,000 | 2,631,954 | |
| Food products 1.2% | |||||
| Darling Ingredients, Inc. (A) | 5.250 | 04-15-27 | 3,610,000 | 3,654,403 | |
| Kraft Heinz Foods Company | 3.000 | 06-01-26 | 5,050,000 | 4,765,191 | |
| Kraft Heinz Foods Company (A) | 4.875 | 02-15-25 | 4,645,000 | 4,790,937 | |
| Post Holdings, Inc. (A) | 5.000 | 08-15-26 | 475,000 | 467,281 | |
| Post Holdings, Inc. (A) | 5.500 | 03-01-25 | 4,260,000 | 4,297,275 | |
| Post Holdings, Inc. (A) | 5.750 | 03-01-27 | 3,455,000 | 3,463,638 | |
| Energy 9.6% | 171,861,841 | ||||
| Energy equipment and services 0.1% | |||||
| Schlumberger Holdings Corp. (A) | 4.300 | 05-01-29 | 1,915,000 | 1,991,106 | |
| 14 | JOHN HANCOCK INCOME FUND | ANNUAL REPORT | SEE NOTES TO FINANCIAL STATEMENTS |
| Rate (%) | Maturity date | Par value^ | Value | ||
| Energy (continued) | |||||
| Oil, gas and consumable fuels 9.5% | |||||
| Aker BP ASA (A) | 5.875 | 03-31-25 | 7,150,000 | $7,489,625 | |
| Canadian Natural Resources, Ltd. | 3.850 | 06-01-27 | 7,175,000 | 7,260,276 | |
| Chesapeake Energy Corp. (A) | 8.000 | 03-15-26 | 5,716,000 | 5,187,270 | |
| Chesapeake Energy Corp. (B) | 8.000 | 06-15-27 | 9,390,000 | 8,310,150 | |
| Concho Resources, Inc. | 4.300 | 08-15-28 | 11,905,000 | 12,588,106 | |
| Continental Resources, Inc. | 4.375 | 01-15-28 | 10,290,000 | 10,550,840 | |
| DCP Midstream Operating LP | 5.375 | 07-15-25 | 7,360,000 | 7,647,482 | |
| Diamondback Energy, Inc. | 5.375 | 05-31-25 | 5,150,000 | 5,356,000 | |
| Enbridge, Inc. | 4.250 | 12-01-26 | 7,060,000 | 7,510,010 | |
| Enterprise Products Operating LLC | 3.900 | 02-15-24 | 7,835,000 | 8,169,881 | |
| Enterprise Products Operating LLC | 4.150 | 10-16-28 | 4,720,000 | 5,004,124 | |
| Marathon Oil Corp. | 4.400 | 07-15-27 | 7,835,000 | 8,131,141 | |
| Medco Oak Tree Pte, Ltd. (A) | 7.375 | 05-14-26 | 4,075,000 | 4,000,167 | |
| MPLX LP | 4.800 | 02-15-29 | 1,845,000 | 1,958,688 | |
| Murphy Oil Corp. | 6.875 | 08-15-24 | 2,769,000 | 2,869,453 | |
| Noble Energy, Inc. | 3.850 | 01-15-28 | 2,790,000 | 2,795,922 | |
| Parsley Energy LLC (A) | 5.625 | 10-15-27 | 6,670,000 | 6,603,300 | |
| Pertamina Persero PT (A) | 4.300 | 05-20-23 | 4,970,000 | 5,119,334 | |
| Petrobras Global Finance BV | 5.750 | 02-01-29 | 6,025,000 | 6,073,742 | |
| Petrobras Global Finance BV | 6.900 | 03-19-49 | 2,885,000 | 2,882,115 | |
| Petrobras Global Finance BV | 7.375 | 01-17-27 | 4,620,000 | 5,189,646 | |
| Petrobras Global Finance BV | 8.750 | 05-23-26 | 2,010,000 | 2,422,754 | |
| Saudi Arabian Oil Company (A) | 3.500 | 04-16-29 | 1,895,000 | 1,891,408 | |
| Saudi Arabian Oil Company (A) | 4.250 | 04-16-39 | 2,855,000 | 2,850,390 | |
| Saudi Arabian Oil Company (A) | 4.375 | 04-16-49 | 4,175,000 | 4,139,668 | |
| Targa Resources Partners LP | 5.875 | 04-15-26 | 3,175,000 | 3,282,156 | |
| The Williams Companies, Inc. | 3.750 | 06-15-27 | 15,590,000 | 15,784,826 | |
| The Williams Companies, Inc. | 4.550 | 06-24-24 | 4,255,000 | 4,514,661 | |
| WPX Energy, Inc. | 5.750 | 06-01-26 | 4,320,000 | 4,287,600 | |
| Financials 12.3% | 220,579,306 | ||||
| Banks 8.9% | |||||
| Asian Development Bank | 2.450 | 01-17-24 | AUD | 3,645,000 | 2,622,442 |
| Bank of America Corp. (3.004% to 12-20-22, then 3 month LIBOR + 0.790%) | 3.004 | 12-20-23 | 7,289,000 | 7,333,499 | |
| Bank of Ireland Group PLC (A) | 4.500 | 11-25-23 | 3,435,000 | 3,534,584 | |
| BNG Bank NV | 0.250 | 02-22-23 | EUR | 3,215,000 | 3,666,911 |
| BNG Bank NV | 0.250 | 06-07-24 | EUR | 3,150,000 | 3,598,200 |
| European Investment Bank | 1.500 | 05-12-22 | NOK | 36,770,000 | 4,194,260 |
| Inter-American Development Bank | 6.500 | 08-20-19 | AUD | 3,260,000 | 2,285,221 |
| International Bank for Reconstruction & Development | 2.800 | 01-13-21 | AUD | 8,780,000 | 6,219,438 |
| SEE NOTES TO FINANCIAL STATEMENTS | ANNUAL REPORT | JOHN HANCOCK INCOME FUND | 15 |
| Rate (%) | Maturity date | Par value^ | Value | ||
| Financials (continued) | |||||
| Banks (continued) | |||||
| International Bank for Reconstruction & Development | 3.625 | 06-22-20 | NOK | 21,910,000 | $2,555,982 |
| International Bank for Reconstruction & Development | 4.625 | 10-06-21 | NZD | 5,165,000 | 3,604,317 |
| International Bank for Reconstruction & Development | 7.400 | 08-20-21 | IDR | 21,280,000,000 | 1,484,829 |
| International Bank for Reconstruction & Development | 7.625 | 01-19-23 | 4,025,000 | 4,798,621 | |
| International Finance Corp. | 2.800 | 08-15-22 | AUD | 6,505,000 | 4,693,869 |
| International Finance Corp. | 2.875 | 07-31-23 | 4,350,000 | 4,490,078 | |
| International Finance Corp. | 3.625 | 05-20-20 | NZD | 6,195,000 | 4,130,297 |
| JPMorgan Chase & Co. | 2.750 | 08-24-22 | EUR | 2,195,000 | 2,654,316 |
| JPMorgan Chase & Co. | 2.950 | 10-01-26 | 6,495,000 | 6,433,147 | |
| JPMorgan Chase & Co. | 3.625 | 12-01-27 | 1,465,000 | 1,478,721 | |
| JPMorgan Chase & Co. (3.509% to 1-23-28, then 3 month LIBOR + 0.945%) | 3.509 | 01-23-29 | 4,365,000 | 4,408,110 | |
| KfW | 0.000 | 09-15-23 | EUR | 1,675,000 | 1,899,220 |
| KfW | 0.375 | 03-15-23 | EUR | 2,415,000 | 2,777,670 |
| KfW | 2.125 | 08-15-23 | EUR | 4,370,000 | 5,394,325 |
| KfW | 6.000 | 08-20-20 | AUD | 7,710,000 | 5,639,228 |
| Nordea Eiendomskreditt AS (3 month NIBOR + 0.300%) (C) | 1.670 | 06-21-23 | NOK | 28,000,000 | 3,209,712 |
| Nordea Eiendomskreditt AS (3 month NIBOR + 0.340%) (C) | 1.710 | 06-19-24 | NOK | 24,000,000 | 2,749,180 |
| Nordic Investment Bank | 1.375 | 07-15-20 | NOK | 29,090,000 | 3,318,438 |
| Nykredit Realkredit A/S | 1.000 | 01-01-24 | DKK | 60,000,000 | 9,470,714 |
| Regions Bank | 6.450 | 06-26-37 | 1,137,000 | 1,413,239 | |
| SunTrust Banks, Inc. (5.050% to 6-15-22, then 3 month LIBOR + 3.102%) (D) | 5.050 | 06-15-22 | 4,095,000 | 4,033,575 | |
| Synovus Financial Corp. (5.750% to 12-15-20, then 3 month LIBOR + 4.182%) | 5.750 | 12-15-25 | 3,500,000 | 3,570,000 | |
| The PNC Financial Services Group, Inc. | 3.500 | 01-23-24 | 1,865,000 | 1,932,359 | |
| U.S. Bancorp | 0.850 | 06-07-24 | EUR | 2,785,000 | 3,192,345 |
| U.S. Bancorp | 3.150 | 04-27-27 | 3,405,000 | 3,488,083 | |
| U.S. Bancorp | 3.375 | 02-05-24 | 1,087,000 | 1,122,716 | |
| U.S. Bank NA | 2.650 | 05-23-22 | 13,200,000 | 13,293,354 | |
| U.S. Bank NA | 3.000 | 02-04-21 | 5,150,000 | 5,199,077 | |
| Wells Fargo & Company | 3.250 | 04-27-22 | AUD | 5,040,000 | 3,612,464 |
| Wells Fargo & Company (3 month BBSW + 1.320%) (C) | 3.394 | 07-27-21 | AUD | 4,745,000 | 3,326,844 |
| Westpac Banking Corp. | 7.250 | 02-11-20 | AUD | 5,000,000 | 3,599,295 |
| 16 | JOHN HANCOCK INCOME FUND | ANNUAL REPORT | SEE NOTES TO FINANCIAL STATEMENTS |
| Rate (%) | Maturity date | Par value^ | Value | ||
| Financials (continued) | |||||
| Banks (continued) | |||||
| Zions Bancorp NA (5.800% to 6-15-23, then 3 month LIBOR + 3.800%) (D) | 5.800 | 06-15-23 | 3,375,000 | $3,341,250 | |
| Capital markets 0.6% | |||||
| Brookfield Property REIT, Inc. (A) | 5.750 | 05-15-26 | 5,395,000 | 5,469,181 | |
| Temasek Financial I, Ltd. | 3.265 | 02-19-20 | SGD | 4,250,000 | 3,115,349 |
| The Goldman Sachs Group, Inc. | 1.375 | 05-15-24 | EUR | 2,552,000 | 2,918,287 |
| Consumer finance 0.2% | |||||
| Discover Financial Services | 4.100 | 02-09-27 | 2,795,000 | 2,828,408 | |
| Diversified financial services 1.5% | |||||
| European Financial Stability Facility | 0.125 | 10-17-23 | EUR | 5,555,000 | 6,320,481 |
| European Financial Stability Facility | 0.500 | 01-20-23 | EUR | 2,740,000 | 3,158,392 |
| European Financial Stability Facility | 1.875 | 05-23-23 | EUR | 3,530,000 | 4,288,926 |
| European Stability Mechanism | 0.125 | 04-22-24 | EUR | 4,410,000 | 5,017,547 |
| Swiss Insured Brazil Power Finance Sarl (A) | 9.850 | 07-16-32 | BRL | 31,920,000 | 8,429,542 |
| Insurance 0.7% | |||||
| American International Group, Inc. (8.175% to 5-15-38, then 3 month LIBOR + 4.195%) | 8.175 | 05-15-68 | 10,490,000 | 12,588,000 | |
| Thrifts and mortgage finance 0.4% | |||||
| MGIC Investment Corp. | 5.750 | 08-15-23 | 6,290,000 | 6,675,263 | |
| Health care 2.6% | 46,345,674 | ||||
| Health care equipment and supplies 0.2% | |||||
| Becton Dickinson Euro Finance Sarl (E) | 1.208 | 06-04-26 | EUR | 2,800,000 | 3,127,745 |
| Health care providers and services 1.7% | |||||
| HCA, Inc. | 5.000 | 03-15-24 | 5,218,000 | 5,570,010 | |
| HCA, Inc. | 5.250 | 04-15-25 | 5,040,000 | 5,426,255 | |
| HCA, Inc. | 5.375 | 02-01-25 | 10,035,000 | 10,488,783 | |
| HCA, Inc. | 7.500 | 02-15-22 | 8,755,000 | 9,586,725 | |
| Life sciences tools and services 0.4% | |||||
| Thermo Fisher Scientific, Inc. | 0.750 | 09-12-24 | EUR | 1,699,000 | 1,913,941 |
| Thermo Fisher Scientific, Inc. | 1.375 | 09-12-28 | EUR | 1,595,000 | 1,811,718 |
| Thermo Fisher Scientific, Inc. | 1.400 | 01-23-26 | EUR | 2,566,000 | 2,966,127 |
| Pharmaceuticals 0.3% | |||||
| Allergan Funding SCS | 1.250 | 06-01-24 | EUR | 1,870,000 | 2,102,708 |
| Allergan Funding SCS | 2.625 | 11-15-28 | EUR | 1,145,000 | 1,351,111 |
| Bausch Health Companies, Inc. (A) | 5.875 | 05-15-23 | 1,996,000 | 2,000,551 | |
| SEE NOTES TO FINANCIAL STATEMENTS | ANNUAL REPORT | JOHN HANCOCK INCOME FUND | 17 |
| Rate (%) | Maturity date | Par value^ | Value | ||
| Industrials 3.1% | $55,364,368 | ||||
| Airlines 0.2% | |||||
| American Airlines Group, Inc. (A) | 5.000 | 06-01-22 | 4,145,000 | 4,191,631 | |
| Commercial services and supplies 0.2% | |||||
| Cimpress NV (A) | 7.000 | 06-15-26 | 3,670,000 | 3,624,125 | |
| Construction and engineering 0.7% | |||||
| AECOM | 5.125 | 03-15-27 | 3,658,000 | 3,591,699 | |
| AECOM | 5.875 | 10-15-24 | 5,085,000 | 5,239,177 | |
| HC2 Holdings, Inc. (A) | 11.500 | 12-01-21 | 4,190,000 | 3,645,300 | |
| Industrial conglomerates 0.4% | |||||
| Icahn Enterprises LP (A) | 6.250 | 05-15-26 | 6,610,000 | 6,568,688 | |
| Professional services 0.3% | |||||
| IHS Markit, Ltd. | 4.125 | 08-01-23 | 2,436,000 | 2,525,255 | |
| IHS Markit, Ltd. | 4.250 | 05-01-29 | 3,495,000 | 3,567,661 | |
| Road and rail 0.3% | |||||
| Uber Technologies, Inc. (A) | 8.000 | 11-01-26 | 4,952,000 | 5,242,930 | |
| Trading companies and distributors 0.8% | |||||
| United Rentals North America, Inc. | 4.625 | 07-15-23 | 2,500,000 | 2,543,750 | |
| United Rentals North America, Inc. | 4.875 | 01-15-28 | 7,285,000 | 7,063,536 | |
| United Rentals North America, Inc. | 5.500 | 05-15-27 | 3,955,000 | 3,989,606 | |
| Transportation infrastructure 0.2% | |||||
| Adani Ports & Special Economic Zone, Ltd. (A) | 4.000 | 07-30-27 | 3,645,000 | 3,571,010 | |
| Information technology 5.6% | 99,940,143 | ||||
| Communications equipment 1.2% | |||||
| CommScope Technologies LLC (A) | 5.000 | 03-15-27 | 3,080,000 | 2,618,000 | |
| CommScope, Inc. (A) | 5.500 | 03-01-24 | 9,000,000 | 9,089,730 | |
| CommScope, Inc. (A) | 6.000 | 03-01-26 | 9,160,000 | 9,160,000 | |
| Electronic equipment, instruments and components 0.0% | |||||
| Jabil, Inc. | 3.950 | 01-12-28 | 227,000 | 215,400 | |
| IT services 0.8% | |||||
| Fidelity National Information Services, Inc. | 1.500 | 05-21-27 | EUR | 2,695,000 | 3,055,251 |
| Fidelity National Information Services, Inc. | 3.750 | 05-21-29 | 4,010,000 | 4,096,141 | |
| Gartner, Inc. (A) | 5.125 | 04-01-25 | 3,425,000 | 3,450,688 | |
| IBM Corp. | 2.750 | 12-21-20 | GBP | 2,525,000 | 3,269,859 |
| Semiconductors and semiconductor equipment 1.4% | |||||
| Broadcom, Inc. (A) | 4.750 | 04-15-29 | 1,493,000 | 1,471,714 | |
| KLA-Tencor Corp. | 4.100 | 03-15-29 | 4,940,000 | 5,072,852 | |
| Microchip Technology, Inc. (A) | 4.333 | 06-01-23 | 4,305,000 | 4,426,467 | |
| Micron Technology, Inc. | 5.327 | 02-06-29 | 9,000,000 | 9,069,444 | |
| NXP BV (A) | 4.625 | 06-01-23 | 4,320,000 | 4,491,936 | |
| 18 | JOHN HANCOCK INCOME FUND | ANNUAL REPORT | SEE NOTES TO FINANCIAL STATEMENTS |
| Rate (%) | Maturity date | Par value^ | Value | ||
| Information technology (continued) | |||||
| Software 0.6% | |||||
| Citrix Systems, Inc. | 4.500 | 12-01-27 | 2,655,000 | $2,707,738 | |
| SS&C Technologies, Inc. (A) | 5.500 | 09-30-27 | 4,195,000 | 4,227,302 | |
| VMware, Inc. | 2.950 | 08-21-22 | 4,595,000 | 4,594,240 | |
| Technology hardware, storage and peripherals 1.6% | |||||
| Apple, Inc. | 0.875 | 05-24-25 | EUR | 2,340,000 | 2,715,491 |
| Dell International LLC (A) | 5.300 | 10-01-29 | 4,930,000 | 5,051,853 | |
| Dell International LLC (A) | 8.100 | 07-15-36 | 7,645,000 | 9,171,170 | |
| Dell International LLC (A) | 8.350 | 07-15-46 | 7,260,000 | 8,873,862 | |
| Seagate HDD Cayman | 4.875 | 06-01-27 | 3,256,000 | 3,111,005 | |
| Materials 3.2% | 57,685,847 | ||||
| Chemicals 0.1% | |||||
| Ecolab, Inc. | 1.000 | 01-15-24 | EUR | 2,135,000 | 2,454,975 |
| Containers and packaging 3.1% | |||||
| Ardagh Packaging Finance PLC (A) | 7.250 | 05-15-24 | 4,930,000 | 5,133,363 | |
| Avery Dennison Corp. | 1.250 | 03-03-25 | EUR | 2,100,000 | 2,389,109 |
| Ball Corp. | 4.000 | 11-15-23 | 7,870,000 | 7,919,188 | |
| Ball Corp. | 4.375 | 12-15-20 | 930,000 | 946,275 | |
| Ball Corp. | 4.875 | 03-15-26 | 4,595,000 | 4,704,131 | |
| Ball Corp. | 5.000 | 03-15-22 | 2,915,000 | 3,017,317 | |
| Ball Corp. | 5.250 | 07-01-25 | 6,820,000 | 7,178,050 | |
| Crown Americas LLC | 4.500 | 01-15-23 | 5,200,000 | 5,264,376 | |
| Crown Cork & Seal Company, Inc. | 7.375 | 12-15-26 | 3,638,000 | 4,092,750 | |
| Sealed Air Corp. (A) | 4.875 | 12-01-22 | 3,285,000 | 3,383,550 | |
| Sealed Air Corp. (A) | 5.125 | 12-01-24 | 4,075,000 | 4,197,250 | |
| Sealed Air Corp. (A) | 6.500 | 12-01-20 | 6,785,000 | 7,005,513 | |
| Real estate 1.4% | 24,796,842 | ||||
| Equity real estate investment trusts 1.4% | |||||
| American Tower Corp. | 1.950 | 05-22-26 | EUR | 1,450,000 | 1,706,660 |
| American Tower Corp. | 2.250 | 01-15-22 | 2,800,000 | 2,769,076 | |
| American Tower Corp. | 3.500 | 01-31-23 | 5,016,000 | 5,134,837 | |
| Crown Castle International Corp. | 4.300 | 02-15-29 | 3,660,000 | 3,792,549 | |
| SBA Tower Trust (A) | 3.168 | 04-09-47 | 3,935,000 | 3,968,234 | |
| SBA Tower Trust (A) | 3.448 | 03-15-23 | 7,251,000 | 7,425,486 | |
| Utilities 2.4% | 42,279,406 | ||||
| Electric utilities 1.7% | |||||
| E.ON International Finance BV | 6.000 | 10-30-19 | GBP | 1,100,000 | 1,416,778 |
| Emera, Inc. (6.750% to 6-15-26, then 3 month LIBOR + 5.440%) | 6.750 | 06-15-76 | 8,188,000 | 8,781,630 | |
| FirstEnergy Transmission LLC (A) | 4.350 | 01-15-25 | 6,690,000 | 7,069,465 | |
| Israel Electric Corp., Ltd. (A) | 5.000 | 11-12-24 | 2,180,000 | 2,343,064 | |
| SEE NOTES TO FINANCIAL STATEMENTS | ANNUAL REPORT | JOHN HANCOCK INCOME FUND | 19 |
| Rate (%) | Maturity date | Par value^ | Value | ||
| Utilities (continued) | |||||
| Electric utilities (continued) | |||||
| Israel Electric Corp., Ltd. (A) | 6.875 | 06-21-23 | 1,415,000 | $1,605,494 | |
| Perusahaan Listrik Negara PT (A) | 5.450 | 05-21-28 | 2,840,000 | 3,064,545 | |
| Vistra Operations Company LLC (A) | 5.500 | 09-01-26 | 2,635,000 | 2,697,054 | |
| Vistra Operations Company LLC (A) | 5.625 | 02-15-27 | 3,280,000 | 3,373,316 | |
| Independent power and renewable electricity producers 0.7% | |||||
| Adani Green Energy UP, Ltd. (A) | 6.250 | 12-10-24 | 1,715,000 | 1,708,569 | |
| Greenko Dutch BV (A) | 5.250 | 07-24-24 | 4,285,000 | 4,096,460 | |
| The AES Corp. | 4.500 | 03-15-23 | 6,085,000 | 6,123,031 | |
| Convertible bonds 1.1% | $20,230,037 | ||||
| (Cost $19,410,680) | |||||
| Communication services 0.1% | 2,536,106 | ||||
| Media 0.1% | |||||
| DISH Network Corp. | 3.375 | 08-15-26 | 2,760,000 | 2,536,106 | |
| Health care 0.6% | 10,226,479 | ||||
| Health care providers and services 0.3% | |||||
| Anthem, Inc. | 2.750 | 10-15-42 | 1,555,000 | 5,978,003 | |
| Pharmaceuticals 0.3% | |||||
| Bayer Capital Corp. BV (A) | 5.625 | 11-22-19 | EUR | 5,600,000 | 4,248,476 |
| Information technology 0.2% | 3,207,091 | ||||
| Software 0.2% | |||||
| IAC Financeco 2, Inc. (A) | 0.875 | 06-15-26 | 3,215,000 | 3,207,091 | |
| Utilities 0.2% | 4,260,361 | ||||
| Independent power and renewable electricity producers 0.2% | |||||
| NRG Energy, Inc. | 2.750 | 06-01-48 | 4,125,000 | 4,260,361 | |
| Capital preferred securities 1.3% | $23,039,295 | ||||
| (Cost $23,371,005) | |||||
| Financials 1.3% | 23,039,295 | ||||
| Banks 1.3% | |||||
| USB Capital IX (Greater of 3 month LIBOR + 1.020% or 3.500%) (C)(D) | 3.617 | 07-01-19 | 12,943,000 | 10,095,540 | |
| Wachovia Capital Trust III (Greater of 3 month LIBOR + 0.930% or 5.570%) (C)(D) | 5.570 | 07-01-19 | 13,035,000 | 12,943,755 | |
| 20 | JOHN HANCOCK INCOME FUND | ANNUAL REPORT | SEE NOTES TO FINANCIAL STATEMENTS |
| Rate (%) | Maturity date | Par value^ | Value | ||
| Collateralized mortgage obligations 7.9% | $141,157,704 | ||||
| (Cost $140,246,521) | |||||
| Commercial and residential 7.7% | 138,402,771 | ||||
| Angel Oak Mortgage Trust I LLC Series 2018-1, Class A1 (A)(F) | 3.258 | 04-27-48 | 3,066,299 | 3,074,738 | |
| AOA Mortgage Trust Series 2015-1177, Class C (A)(F) | 3.110 | 12-13-29 | 2,040,000 | 2,031,134 | |
| Arroyo Mortgage Trust | |||||
| Series 2018-1, Class A1 (A)(F) | 3.763 | 04-25-48 | 3,990,509 | 4,078,789 | |
| Series 2019-1, Class A1 (A)(F) | 3.805 | 01-25-49 | 4,578,345 | 4,665,656 | |
| BAMLL Commercial Mortgage Securities Trust | |||||
| Series 2015-200P, Class F (A)(F) | 3.716 | 04-14-33 | 2,820,000 | 2,782,419 | |
| Series 2018-DSNY, Class A (1 month LIBOR + 0.850%) (A)(C) | 3.290 | 09-15-34 | 5,370,000 | 5,371,160 | |
| BBCMS Mortgage Trust | |||||
| Series 2015-STP, Class A (A) | 3.323 | 09-10-28 | 3,341,612 | 3,365,869 | |
| Series 2018-TALL, Class C (1 month LIBOR + 1.121%) (A)(C) | 3.561 | 03-15-37 | 5,650,000 | 5,620,974 | |
| Series 2018-TALL, Class E (1 month LIBOR + 2.437%) (A)(C) | 4.877 | 03-15-37 | 4,950,000 | 4,939,815 | |
| BX Commercial Mortgage Trust Series 2018-BIOA, Class D (1 month LIBOR + 1.321%) (A)(C) | 3.761 | 03-15-37 | 2,625,000 | 2,619,436 | |
| BXP Trust Series 2017-GM, Class A (A) | 3.379 | 06-13-39 | 4,642,000 | 4,815,418 | |
| CLNS Trust Series 2017-IKPR, Class B (1 month LIBOR + 1.000%) (A)(C) | 3.484 | 06-11-32 | 2,135,000 | 2,132,405 | |
| COLT Mortgage Loan Trust Series 2018-2, Class A1 (A)(F) | 3.470 | 07-27-48 | 2,107,293 | 2,121,966 | |
| Commercial Mortgage Trust (Bank of America Merrill Lynch/ Deutsche Bank AG) Series 2013-WWP, Class D (A) | 3.898 | 03-10-31 | 3,725,000 | 3,924,738 | |
| Credit Suisse Commercial Mortgage Trust Series 2015-GLPB, Class A (A) | 3.639 | 11-15-34 | 4,715,000 | 4,904,481 | |
| Credit Suisse Mortgage Capital Certificates Series 2019-ICE4, Class D (1 month LIBOR + 1.600%) (A)(C) | 4.063 | 05-15-36 | 3,145,000 | 3,145,000 | |
| DBCG Mortgage Trust Series 2017-BBG, Class A (1 month LIBOR + 0.700%) (A)(C) | 3.140 | 06-15-34 | 3,585,000 | 3,575,979 | |
| GAHR Commercial Mortgage Trust Series 2015-NRF, Class DFX (A)(F) | 3.495 | 12-15-34 | 3,535,000 | 3,518,798 | |
| SEE NOTES TO FINANCIAL STATEMENTS | ANNUAL REPORT | JOHN HANCOCK INCOME FUND | 21 |
| Rate (%) | Maturity date | Par value^ | Value | ||
| Commercial and residential (continued) | |||||
| GS Mortgage Securities Trust | |||||
| Series 2017-FARM, Class A (A)(F) | 3.659 | 01-10-43 | 3,550,000 | $3,714,075 | |
| Series 2018-RIVR, Class D (1 month LIBOR + 1.334%) (A)(C) | 3.773 | 07-15-35 | 2,860,000 | 2,817,155 | |
| HarborView Mortgage Loan Trust | |||||
| Series 2007-3, Class ES IO (A) | 0.350 | 05-19-47 | 19,677,508 | 340,376 | |
| Series 2007-4, Class ES IO | 0.350 | 07-19-47 | 19,977,863 | 331,890 | |
| Series 2007-6, Class ES IO (A) | 0.353 | 08-19-37 | 17,221,801 | 247,047 | |
| Hilton USA Trust | |||||
| Series 2016-HHV, Class A (A) | 3.719 | 11-05-38 | 1,450,000 | 1,509,044 | |
| Series 2016-HHV, Class B (A)(F) | 4.194 | 11-05-38 | 2,185,000 | 2,322,068 | |
| Hudson Yards Mortgage Trust Series 2016-10HY, Class A (A) | 2.835 | 08-10-38 | 5,290,000 | 5,297,058 | |
| Hudsons Bay Simon JV Trust Series 2015-HB10, Class A10 (A) | 4.154 | 08-05-34 | 5,500,000 | 5,647,988 | |
| JPMorgan Chase Commercial Mortgage Securities Trust | |||||
| Series 2015-UES, Class A (A) | 2.933 | 09-05-32 | 4,100,000 | 4,114,673 | |
| Series 2016-NINE, Class A (A)(F) | 2.949 | 10-06-38 | 4,655,000 | 4,674,771 | |
| Series 2018-PHH, Class A (1 month LIBOR + 0.910%) (A)(C) | 3.350 | 06-15-35 | 2,750,000 | 2,744,429 | |
| JPMorgan Mortgage Trust Series 2007-A1, Class 1A1 (F) | 4.435 | 07-25-35 | 1,445,602 | 1,489,348 | |
| Merrill Lynch Mortgage Investors Trust Series 2005-A2, Class A2 (F) | 4.444 | 02-25-35 | 925,760 | 936,966 | |
| Morgan Stanley Capital Barclays Bank Trust Series 2016-MART, Class A (A) | 2.200 | 09-13-31 | 6,860,000 | 6,824,384 | |
| Morgan Stanley Capital I Trust Series 2017-CLS, Class C (1 month LIBOR + 1.000%) (A)(C) | 3.440 | 11-15-34 | 1,955,000 | 1,946,962 | |
| New Residential Mortgage Loan Trust Series 2017-5A, Class A1 (1 month LIBOR + 1.500%) (A)(C) | 3.930 | 06-25-57 | 2,485,487 | 2,535,489 | |
| Olympic Tower Mortgage Trust Series 2017-OT, Class A (A) | 3.566 | 05-10-39 | 1,860,000 | 1,929,016 | |
| One Market Plaza Trust Series 2017-1MKT, Class A (A) | 3.614 | 02-10-32 | 4,025,000 | 4,170,647 | |
| Opteum Mortgage Acceptance Corp. Trust Series 2005-4, Class 1APT (1 month LIBOR + 0.310%) (C) | 2.740 | 11-25-35 | 770,045 | 770,093 | |
| 22 | JOHN HANCOCK INCOME FUND | ANNUAL REPORT | SEE NOTES TO FINANCIAL STATEMENTS |
| Rate (%) | Maturity date | Par value^ | Value | ||
| Commercial and residential (continued) | |||||
| SFAVE Commercial Mortgage Securities Trust Series 2015-5AVE, Class D (A)(F) | 4.388 | 01-05-43 | 3,995,000 | $3,556,904 | |
| Starwood Mortgage Residential Trust Series 2018-IMC1, Class A1 (A)(F) | 3.793 | 03-25-48 | 2,926,005 | 2,969,251 | |
| Structured Adjustable Rate Mortgage Loan Trust Series 2004-10, Class 2A (F) | 4.494 | 08-25-34 | 2,145,834 | 2,174,206 | |
| WaMu Mortgage Pass Through Certificates Series 2005-AR6, Class 2A1A (1 month LIBOR + 0.460%) (C) | 2.890 | 04-25-45 | 1,910,243 | 1,886,890 | |
| Wells Fargo Commercial Mortgage Trust Series 2017-SMP, Class A (1 month LIBOR + 0.750%) (A)(C) | 3.190 | 12-15-34 | 4,305,000 | 4,285,751 | |
| Worldwide Plaza Trust Series 2017-WWP, Class A (A) | 3.526 | 11-10-36 | 2,375,000 | 2,477,515 | |
| U.S. Government Agency 0.2% | 2,754,933 | ||||
| Federal Home Loan Mortgage Corp. Series 2019-DNA1, Class M1 (1 month LIBOR + 0.900%) (A)(C) | 3.377 | 01-25-49 | 2,540,000 | 2,548,316 | |
| Federal National Mortgage Association | |||||
| Series 2014-C02, Class 1M1 (1 month LIBOR + 0.950%) (C) | 3.380 | 05-25-24 | 80,058 | 80,081 | |
| Series 2016-C05, Class 2M1 (1 month LIBOR + 1.350%) (C) | 3.780 | 01-25-29 | 126,477 | 126,536 | |
| Asset backed securities 3.7% | $66,700,443 | ||||
| (Cost $65,320,940) | |||||
| Asset backed securities 3.7% | 66,700,443 | ||||
| AccessLex Institute Series 2007-A, Class A3 (3 month LIBOR + 0.300%) (C) | 2.821 | 05-25-36 | 7,053,966 | 6,957,483 | |
| Americredit Automobile Receivables Trust Series 2018-2, Class D | 4.010 | 07-18-24 | 3,085,000 | 3,204,766 | |
| Coinstar Funding LLC Series 2017-1A, Class A2 (A) | 5.216 | 04-25-47 | 6,223,000 | 6,382,751 | |
| DB Master Finance LLC | |||||
| Series 2017-1A, Class A2II (A) | 4.030 | 11-20-47 | 1,940,450 | 1,998,741 | |
| Series 2019-1A, Class A2I (A) | 3.787 | 05-20-49 | 3,375,000 | 3,460,320 | |
| Series 2019-1A, Class A2II (A) | 4.021 | 05-20-49 | 1,820,000 | 1,856,964 | |
| Domino's Pizza Master Issuer LLC | |||||
| Series 2015-1A, Class A2II (A) | 4.474 | 10-25-45 | 3,749,050 | 3,919,969 | |
| Series 2017-1A, Class A2II (A) | 3.082 | 07-25-47 | 1,844,153 | 1,842,105 | |
| SEE NOTES TO FINANCIAL STATEMENTS | ANNUAL REPORT | JOHN HANCOCK INCOME FUND | 23 |
| Rate (%) | Maturity date | Par value^ | Value | ||
| Asset backed securities (continued) | |||||
| FOCUS Brands Funding LLC Series 2017-1A, Class A2I (A) | 3.857 | 04-30-47 | 2,690,100 | $2,763,056 | |
| GSAA Home Equity Trust Series 2005-MTR1, Class A4 (1 month LIBOR + 0.370%) (C) | 2.800 | 10-25-35 | 2,294,806 | 2,294,647 | |
| Home Partners of America Trust Series 2018-1, Class A (1 month LIBOR + 0.900%) (A)(C) | 3.374 | 07-17-37 | 3,276,077 | 3,253,214 | |
| MVW Owner Trust Series 2018-1A, Class A (A) | 3.450 | 01-21-36 | 2,321,070 | 2,382,567 | |
| Santander Drive Auto Receivables Trust Series 2018-3, Class C | 3.510 | 08-15-23 | 3,025,000 | 3,077,479 | |
| Store Master Funding I-VII Series 2018-1A, Class A1 (A) | 3.960 | 10-20-48 | 4,050,585 | 4,253,009 | |
| Taco Bell Funding LLC Series 2016-1A, Class A23 (A) | 4.970 | 05-25-46 | 6,566,000 | 6,863,768 | |
| Textainer Marine Containers VII, Ltd. Series 2018-1A, Class A (A) | 4.110 | 07-20-43 | 937,180 | 959,371 | |
| Towd Point Mortgage Trust | |||||
| Series 2017-2, Class A1 (A)(F) | 2.750 | 04-25-57 | 2,219,538 | 2,215,418 | |
| Series 2017-3, Class A1 (A)(F) | 2.750 | 07-25-57 | 2,261,063 | 2,257,120 | |
| Series 2017-5, Class A1 (1 month LIBOR + 0.600%) (A)(C) | 3.030 | 02-25-57 | 3,086,757 | 3,076,406 | |
| Series 2018-4, Class A1 (A)(F) | 3.000 | 06-25-58 | 3,150,373 | 3,149,326 | |
| Verizon Owner Trust Series 2016-1A, Class A (A) | 1.420 | 01-20-21 | 532,653 | 531,963 | |
| Shares | Value | ||||
| Common stocks 0.0% | $0 | ||||
| (Cost $3,539,176) | |||||
| Communication services 0.0% | 0 | ||||
| Media 0.0% | |||||
| Vertis Holdings, Inc. (G)(H) | 300,118 | 0 | |||
| Preferred securities 4.8% | $86,492,301 | ||||
| (Cost $85,303,062) | |||||
| Financials 2.1% | 36,665,527 | ||||
| Banks 1.9% | |||||
| First Tennessee Bank NA (Greater of 3 month LIBOR + 0.850% or 3.750%), 3.750% (A)(C) | 18,420 | 13,262,400 | |||
| U.S. Bancorp, 5.500% (B) | 195,700 | 5,107,770 | |||
| U.S. Bancorp (Greater of 3 month LIBOR + 1.020% or 3.500%), 3.617% (C) | 8,257 | 6,605,600 | |||
| Wells Fargo & Company (5.850% to 9-15-23, then 3 month LIBOR + 3.090%) | 165,630 | 4,243,441 | |||
| 24 | JOHN HANCOCK INCOME FUND | ANNUAL REPORT | SEE NOTES TO FINANCIAL STATEMENTS |
| Shares | Value | ||||
| Financials (continued) | |||||
| Banks (continued) | |||||
| Zions Bancorp NA (6.950% to 9-15-23, then 3 month LIBOR + 3.890%) | 145,201 | $4,154,201 | |||
| Diversified financial services 0.2% | |||||
| AMG Capital Trust II, 5.150% | 70,045 | 3,292,115 | |||
| Health care 0.4% | 7,253,799 | ||||
| Health care equipment and supplies 0.4% | |||||
| Becton, Dickinson and Company, 6.125% (B) | 124,700 | 7,253,799 | |||
| Industrials 0.5% | 9,450,772 | ||||
| Machinery 0.5% | |||||
| Fortive Corp., 5.000% | 9,580 | 9,450,772 | |||
| Real estate 0.2% | 4,190,496 | ||||
| Equity real estate investment trusts 0.2% | |||||
| Crown Castle International Corp., 6.875% | 3,545 | 4,190,496 | |||
| Utilities 1.6% | 28,931,707 | ||||
| Electric utilities 1.3% | |||||
| American Electric Power Company, Inc., 6.125% | 205,000 | 10,842,450 | |||
| NextEra Energy, Inc., 6.123% | 189,525 | 11,932,494 | |||
| Multi-utilities 0.3% | |||||
| Dominion Energy, Inc., 6.750% | 124,530 | 6,156,763 | |||
| Contracts/ Notional amount | Value | ||||
| Purchased options 0.0% | $63,736 | ||||
| (Cost $681,820) | |||||
| Puts 0.0% | 63,736 | ||||
| Over the Counter Option on the AUD vs. JPY (Expiration Date: 6-6-19; Strike Price: AUD 74.50; Counterparty: Citibank N.A.) (H)(I) | 46,805,000 | 63,736 | |||
| Yield (%) | Shares | Value | |||
| Securities lending collateral 0.5% | $8,100,599 | ||||
| (Cost $8,100,741) | |||||
| John Hancock Collateral Trust (J) | 2.3405(K) | 809,493 | 8,100,599 | ||
| Yield* (%) | Maturity date | Par value^ | Value | ||
| Short-term investments 1.3% | $24,074,000 | ||||
| (Cost $24,072,446) | |||||
| U.S. Government Agency 0.7% | 12,429,000 | ||||
| Federal Agricultural Mortgage Corp. Discount Note | 2.250 | 06-03-19 | 2,918,000 | 2,918,000 | |
| Federal Home Loan Bank Discount Note | 2.250 | 06-03-19 | 9,511,000 | 9,511,000 | |
| SEE NOTES TO FINANCIAL STATEMENTS | ANNUAL REPORT | JOHN HANCOCK INCOME FUND | 25 |
| Par value^ | Value | ||||
| Repurchase agreement 0.6% | 11,645,000 | ||||
| Barclays Tri-Party Repurchase Agreement dated 5-31-19 at 2.450% to be repurchased at $10,813,207 on 6-3-19, collateralized by $10,220,500 U.S. Treasury Bonds, 3.000% due 2-15-47 (valued at $11,029,531, including interest) | 10,811,000 | 10,811,000 | |||
| Repurchase Agreement with State Street Corp. dated 5-31-19 at 1.300% to be repurchased at $834,090 on 6-3-19, collateralized by $845,000 U.S. Treasury Notes, 2.375% due 3-15-21 (valued at $853,021, including interest) | 834,000 | 834,000 | |||
| Total investments (Cost $1,794,604,722) 98.7% | $1,766,760,983 | ||||
| Other assets and liabilities, net 1.3% | 23,666,724 | ||||
| Total net assets 100.0% | $1,790,427,707 | ||||
| The percentage shown for each investment category is the total value of the category as a percentage of the net assets of the fund. | |
| ^All par values are denominated in U.S. dollars unless otherwise indicated. | |
| Currency Abbreviations | |
| AUD | Australian Dollar |
| BRL | Brazilian Real |
| CAD | Canadian Dollar |
| COP | Colombian Peso |
| DKK | Danish Krone |
| EUR | Euro |
| GBP | Pound Sterling |
| IDR | Indonesian Rupiah |
| JPY | Japanese Yen |
| MYR | Malaysian Ringgit |
| NOK | Norwegian Krone |
| NZD | New Zealand Dollar |
| PHP | Philippine Peso |
| SGD | Singapore Dollar |
| Security Abbreviations and Legend | |
| BBSW | Bank Bill Swap Rate |
| IO | Interest-Only Security - (Interest Tranche of Stripped Mortgage Pool). Rate shown is the annualized yield at the end of the period. |
| LIBOR | London Interbank Offered Rate |
| NIBOR | Norwegian Interbank Offered Rate |
| (A) | These securities are exempt from registration under Rule 144A of the Securities Act of 1933. Such securities may be resold, normally to qualified institutional buyers, in transactions exempt from registration. Rule 144A securities amounted to $578,238,648 or 32.3% of the fund's net assets as of 5-31-19. |
| (B) | All or a portion of this security is on loan as of 5-31-19. |
| (C) | Variable rate obligation. The coupon rate shown represents the rate at period end. |
| (D) | Perpetual bonds have no stated maturity date. Date shown as maturity date is next call date. |
| (E) | Security purchased or sold on a when-issued or delayed delivery basis. |
| 26 | JOHN HANCOCK INCOME FUND | ANNUAL REPORT | SEE NOTES TO FINANCIAL STATEMENTS |
| (F) | Variable or floating rate security, the interest rate of which adjusts periodically based on a weighted average of interest rates and prepayments on the underlying pool of assets. The interest rate shown is the current rate as of period end. |
| (G) | Security is valued using significant unobservable inputs and is classified as Level 3 in the fair value hierarchy. |
| (H) | Non-income producing security. |
| (I) | For this type of option, notional amounts are equivalent to number of contracts. |
| (J) | Investment is an affiliate of the fund, the advisor and/or subadvisor. This security represents the investment of cash collateral received for securities lending. |
| (K) | The rate shown is the annualized seven-day yield as of 5-31-19. |
| * | Yield represents either the annualized yield at the date of purchase, the stated coupon rate or, for floating rate securities, the rate at period end. |
| SEE NOTES TO FINANCIAL STATEMENTS | ANNUAL REPORT | JOHN HANCOCK INCOME FUND | 27 |
| Open contracts | Number of contracts | Position | Expiration date | Notional basis^ | Notional value^ | Unrealized appreciation (depreciation) |
| U.S. Treasury Long Bond Futures | 55 | Short | Sep 2019 | $(8,382,634) | $(8,454,452) | $(71,818) |
| $(71,818) |
| Contract to buy | Contract to sell | Counterparty (OTC) | Contractual settlement date | Unrealized appreciation | Unrealized depreciation | ||
| AUD | 51,175,845 | USD | 36,339,627 | ANZ | 6/19/2019 | — | $(821,881) |
| AUD | 16,203,051 | USD | 11,415,146 | JPM | 6/19/2019 | — | (169,688) |
| BRL | 36,871,982 | USD | 9,526,479 | CITI | 6/19/2019 | — | (142,687) |
| BRL | 28,002,362 | USD | 7,328,735 | GSI | 6/19/2019 | — | (202,231) |
| BRL | 20,453,287 | USD | 5,286,699 | SSB | 6/19/2019 | — | (81,409) |
| CAD | 3,400,000 | USD | 2,555,484 | MSCS | 6/19/2019 | — | (38,918) |
| CAD | 12,696,213 | USD | 9,511,254 | RBC | 6/19/2019 | — | (113,943) |
| CAD | 21,042,778 | USD | 15,642,239 | SSB | 6/19/2019 | — | (67,079) |
| DKK | 13,269,228 | USD | 2,026,801 | MSCS | 6/19/2019 | — | (39,116) |
| EUR | 340,000 | USD | 383,955 | BOA | 6/19/2019 | — | (3,645) |
| EUR | 28,437,364 | USD | 32,329,367 | CITI | 6/19/2019 | — | (520,501) |
| EUR | 87,249,937 | USD | 99,250,420 | GSI | 6/19/2019 | — | (1,656,230) |
| EUR | 7,059,058 | USD | 7,977,618 | HSBC | 6/19/2019 | — | (81,646) |
| EUR | 17,059,245 | USD | 19,213,460 | JPM | 6/19/2019 | — | (131,691) |
| EUR | 29,550,373 | USD | 33,771,996 | MSCS | 6/19/2019 | — | (718,164) |
| EUR | 8,937,543 | USD | 10,293,726 | SCB | 6/19/2019 | — | (296,558) |
| EUR | 10,178,944 | USD | 11,603,538 | SSB | 6/19/2019 | — | (217,790) |
| EUR | 14,236,247 | USD | 16,084,645 | UBS | 6/19/2019 | — | (160,565) |
| MXN | 335,667,658 | USD | 17,064,416 | GSI | 6/19/2019 | $17,546 | — |
| MXN | 34,856,560 | USD | 1,760,343 | SSB | 6/19/2019 | 13,490 | — |
| MXN | 276,815,629 | USD | 13,857,133 | GSI | 9/18/2019 | 17,628 | — |
| NOK | 21,095,000 | USD | 2,476,045 | GSI | 6/19/2019 | — | (64,254) |
| NOK | 31,260,041 | USD | 3,679,860 | JPM | 6/19/2019 | — | (105,899) |
| NOK | 21,706,466 | USD | 2,521,332 | UBS | 6/19/2019 | — | (39,631) |
| NZD | 8,170,084 | AUD | 7,732,575 | ANZ | 6/19/2019 | — | (20,111) |
| NZD | 3,827,102 | AUD | 3,622,061 | CITI | 6/19/2019 | — | (9,351) |
| NZD | 8,170,701 | AUD | 7,732,575 | MSCS | 6/19/2019 | — | (19,708) |
| NZD | 12,258,235 | AUD | 11,598,863 | SSB | 6/19/2019 | — | (28,132) |
| NZD | 9,768,545 | USD | 6,593,790 | ANZ | 6/19/2019 | — | (201,192) |
| NZD | 13,284,028 | USD | 9,060,473 | GSI | 6/19/2019 | — | (367,322) |
| NZD | 10,923,238 | USD | 7,480,179 | NAB | 6/19/2019 | — | (331,943) |
| NZD | 39,454,826 | USD | 26,815,740 | SSB | 6/19/2019 | — | (996,254) |
| SGD | 23,388,424 | USD | 17,221,874 | ANZ | 6/19/2019 | — | (192,708) |
| 28 | JOHN HANCOCK INCOME FUND | ANNUAL REPORT | SEE NOTES TO FINANCIAL STATEMENTS |
| Contract to buy | Contract to sell | Counterparty (OTC) | Contractual settlement date | Unrealized appreciation | Unrealized depreciation | ||
| SGD | 32,487,254 | USD | 23,996,314 | HSBC | 6/19/2019 | — | $(342,269) |
| SGD | 9,341,410 | USD | 6,809,799 | SCB | 6/19/2019 | — | (8,297) |
| USD | 68,942,309 | AUD | 95,127,349 | ANZ | 6/19/2019 | $2,920,748 | — |
| USD | 2,838,974 | AUD | 3,962,595 | MSCS | 6/19/2019 | 88,800 | — |
| USD | 5,783,823 | BRL | 22,282,708 | CITI | 6/19/2019 | 112,951 | — |
| USD | 35,480,263 | BRL | 131,842,885 | SSB | 6/19/2019 | 1,926,707 | — |
| USD | 13,742,918 | CAD | 18,416,543 | BMO | 6/19/2019 | 111,610 | — |
| USD | 5,661,685 | CAD | 7,460,000 | CIBC | 6/19/2019 | 140,043 | — |
| USD | 5,368,331 | CAD | 7,185,678 | CITI | 6/19/2019 | 49,733 | — |
| USD | 8,292,246 | CAD | 11,020,345 | GSI | 6/19/2019 | 135,356 | — |
| USD | 3,670,054 | CAD | 4,802,660 | MSCS | 6/19/2019 | 115,286 | — |
| USD | 31,974,396 | CAD | 42,785,116 | RBC | 6/19/2019 | 306,287 | — |
| USD | 8,914,398 | CAD | 12,024,481 | TD | 6/19/2019 | 14,281 | — |
| USD | 12,085,503 | DKK | 78,176,527 | MSCS | 6/19/2019 | 374,927 | — |
| USD | 16,057,564 | EUR | 14,072,323 | ANZ | 6/19/2019 | 316,843 | — |
| USD | 79,771,130 | EUR | 70,182,889 | CITI | 6/19/2019 | 1,267,437 | — |
| USD | 19,626,293 | EUR | 17,374,963 | GSI | 6/19/2019 | 191,375 | — |
| USD | 18,375,593 | EUR | 16,180,204 | HSBC | 6/19/2019 | 277,083 | — |
| USD | 243,171 | EUR | 215,000 | JPM | 6/19/2019 | 2,681 | — |
| USD | 191,942,507 | EUR | 166,724,109 | MSCS | 6/19/2019 | 5,451,776 | — |
| USD | 7,908,207 | EUR | 6,916,759 | RBC | 6/19/2019 | 171,405 | — |
| USD | 510,366 | EUR | 449,226 | SSB | 6/19/2019 | 7,880 | — |
| USD | 15,591,024 | EUR | 13,727,031 | USB | 6/19/2019 | 236,532 | — |
| USD | 26,516,405 | EUR | 23,380,480 | UBS | 6/19/2019 | 363,962 | — |
| USD | 3,440,695 | MXN | 65,928,526 | CITI | 6/19/2019 | 85,625 | — |
| USD | 10,374,227 | MXN | 200,700,732 | GSI | 6/19/2019 | 160,666 | — |
| USD | 5,733,131 | MXN | 111,712,810 | SSB | 6/19/2019 | 48,121 | — |
| USD | 6,928,566 | MXN | 135,404,974 | GSI | 9/18/2019 | 141,696 | — |
| USD | 6,928,566 | MXN | 135,966,188 | SSB | 9/18/2019 | 113,567 | — |
| USD | 41,996,787 | NOK | 354,074,909 | JPM | 6/19/2019 | 1,515,399 | — |
| USD | 65,721,858 | NZD | 95,156,671 | GSI | 6/19/2019 | 3,450,735 | — |
| USD | 21,429,190 | NZD | 32,450,524 | JPM | 6/19/2019 | 193,364 | — |
| USD | 9,557,401 | SGD | 13,035,855 | CITI | 6/19/2019 | 65,964 | — |
| USD | 45,083,904 | SGD | 61,112,935 | HSBC | 6/19/2019 | 587,433 | — |
| USD | 13,700,713 | SGD | 18,493,907 | RBC | 6/19/2019 | 235,256 | — |
| USD | 7,464,513 | SGD | 10,184,544 | SCB | 6/19/2019 | 49,123 | — |
| $21,279,316 | $(8,190,813) | ||||||
| Derivatives Currency Abbreviations | |
| AUD | Australian Dollar |
| BRL | Brazilian Real |
| CAD | Canadian Dollar |
| DKK | Danish Krone |
| SEE NOTES TO FINANCIAL STATEMENTS | ANNUAL REPORT | JOHN HANCOCK INCOME FUND | 29 |
| EUR | Euro |
| MXN | Mexican Peso |
| NOK | Norwegian Krone |
| NZD | New Zealand Dollar |
| SGD | Singapore Dollar |
| USD | U.S. Dollar |
| Derivatives Abbreviations | |
| ANZ | Australia and New Zealand Banking Group Limited |
| BMO | Bank of Montreal |
| BOA | Bank of America, N.A. |
| CIBC | Canadian Imperial Bank of Commerce |
| CITI | Citibank, N.A. |
| GSI | Goldman Sachs International |
| HSBC | HSBC Bank PLC |
| JPM | JPMorgan Chase Bank, N.A. |
| MSCS | Morgan Stanley Capital Services LLC |
| NAB | National Australia Bank Ltd. |
| OTC | Over-the-counter |
| RBC | Royal Bank of Canada |
| SCB | Standard Chartered Bank |
| SSB | State Street Bank and Trust Company |
| TD | The Toronto-Donimion Bank |
| UBS | UBS AG |
| USB | U.S. Bank N.A. |
| 30 | JOHN HANCOCK INCOME FUND | ANNUAL REPORT | SEE NOTES TO FINANCIAL STATEMENTS |
| Financial statements |
| Assets | |
| Unaffiliated investments, at value (Cost $1,786,503,981) including $7,910,140 of securities loaned | $1,758,660,384 |
| Affiliated investments, at value (Cost $8,100,741) | 8,100,599 |
| Total investments, at value (Cost $1,794,604,722) | 1,766,760,983 |
| Unrealized appreciation on forward foreign currency contracts | 21,279,316 |
| Cash | 608 |
| Foreign currency, at value(Cost $5,677,523) | 5,659,581 |
| Collateral held at broker for futures contracts | 198,000 |
| Collateral segregated at custodian for OTC derivative contracts | 540,000 |
| Dividends and interest receivable | 18,427,071 |
| Receivable for fund shares sold | 1,476,891 |
| Receivable for investments sold | 15,278,130 |
| Receivable for securities lending income | 10,677 |
| Other assets | 207,943 |
| Total assets | 1,829,839,200 |
| Liabilities | |
| Unrealized depreciation on forward foreign currency contracts | 8,190,813 |
| Payable for futures variation margin | 194,581 |
| Distributions payable | 324,259 |
| Payable for investments purchased | 14,651,168 |
| Payable for delayed delivery securities purchased | 3,125,080 |
| Payable for fund shares repurchased | 4,020,111 |
| Payable upon return of securities loaned | 8,101,446 |
| Payable to affiliates | |
| Accounting and legal services fees | 193,928 |
| Transfer agent fees | 135,693 |
| Distribution and service fees | 7,327 |
| Trustees' fees | 3,002 |
| Other liabilities and accrued expenses | 464,085 |
| Total liabilities | 39,411,493 |
| Net assets | $1,790,427,707 |
| Net assets consist of | |
| Paid-in capital | $1,987,052,382 |
| Total distributable earnings (loss) | (196,624,675) |
| Net assets | $1,790,427,707 |
| SEE NOTES TO FINANCIAL STATEMENTS | ANNUAL REPORT | JOHN HANCOCK Income Fund | 31 |
| Net asset value per share | |
| Based on net asset value and shares outstanding - the fund has an unlimited number of shares authorized with no par value | |
| Class A ($541,139,059 ÷ 86,168,749 shares)1 | $6.28 |
| Class B ($19,712,140 ÷ 3,138,512 shares)1 | $6.28 |
| Class C ($145,710,128 ÷ 23,201,303 shares)1 | $6.28 |
| Class I ($595,143,082 ÷ 94,953,446 shares) | $6.27 |
| Class R1 ($6,955,502 ÷ 1,103,959 shares) | $6.30 |
| Class R2 ($6,272,371 ÷ 1,000,043 shares) | $6.27 |
| Class R3 ($4,429,417 ÷ 705,705 shares) | $6.28 |
| Class R4 ($3,115,490 ÷ 496,044 shares) | $6.28 |
| Class R5 ($7,415,246 ÷ 1,182,684 shares) | $6.27 |
| Class R6 ($460,535,272 ÷ 73,398,010 shares) | $6.27 |
| Maximum offering price per share | |
| Class A (net asset value per share ÷ 96%)2 | $6.54 |
| 1 | Redemption price per share is equal to net asset value less any applicable contingent deferred sales charge. |
| 2 | On single retail sales of less than $100,000. On sales of $100,000 or more and on group sales the offering price is reduced. |
| 32 | JOHN HANCOCK Income Fund | ANNUAL REPORT | SEE NOTES TO FINANCIAL STATEMENTS |
| Investment income | |
| Interest | $100,061,497 |
| Dividends | 6,865,154 |
| Securities lending | 83,813 |
| Less foreign taxes withheld | (993,911) |
| Total investment income | 106,016,553 |
| Expenses | |
| Investment management fees | 8,813,420 |
| Distribution and service fees | 4,157,989 |
| Accounting and legal services fees | 569,522 |
| Transfer agent fees | 1,944,895 |
| Trustees' fees | 50,272 |
| Custodian fees | 580,623 |
| State registration fees | 210,869 |
| Printing and postage | 414,135 |
| Professional fees | 125,364 |
| Other | 127,324 |
| Total expenses | 16,994,413 |
| Less expense reductions | (289,290) |
| Net expenses | 16,705,123 |
| Net investment income | 89,311,430 |
| Realized and unrealized gain (loss) | |
| Net realized gain (loss) on | |
| Unaffiliated investments and foreign currency transactions | (142,606,655) |
| Affiliated investments | (705) |
| Futures contracts | (5,654,879) |
| Forward foreign currency contracts | 20,448,435 |
| (127,813,804) | |
| Change in net unrealized appreciation (depreciation) of | |
| Unaffiliated investments and translation of assets and liabilities in foreign currencies | 103,034,439 |
| Affiliated investments | (142) |
| Futures contracts | 8,141,894 |
| Forward foreign currency contracts | (668,752) |
| 110,507,439 | |
| Net realized and unrealized loss | (17,306,365) |
| Increase in net assets from operations | $72,005,065 |
| SEE NOTES TO FINANCIAL STATEMENTS | ANNUAL REPORT | JOHN HANCOCK Income Fund | 33 |
| Year ended 5-31-19 | Year ended 5-31-18 | |
| Increase (decrease) in net assets | ||
| From operations | ||
| Net investment income | $89,311,430 | $134,674,475 |
| Net realized loss | (127,813,804) | (12,620,289) |
| Change in net unrealized appreciation (depreciation) | 110,507,439 | (114,737,938) |
| Increase in net assets resulting from operations | 72,005,065 | 7,316,248 |
| Distributions to shareholders | ||
| From net investment income and net realized gain | ||
| Class A | (17,713,935) | — |
| Class B | (747,987) | — |
| Class C | (4,398,102) | — |
| Class I | (25,290,072) | — |
| Class R1 | (226,654) | — |
| Class R2 | (229,275) | — |
| Class R3 | (129,459) | — |
| Class R4 | (2,728,837) | — |
| Class R5 | (439,781) | — |
| Class R6 | (37,794,702) | — |
| From net investment income | ||
| Class A | — | (19,133,651) |
| Class B | — | (1,338,964) |
| Class C | — | (6,610,221) |
| Class I | — | (59,504,767) |
| Class R1 | — | (320,819) |
| Class R2 | — | (282,353) |
| Class R3 | — | (197,560) |
| Class R4 | — | (4,676,333) |
| Class R5 | — | (682,911) |
| Class R6 | — | (41,779,349) |
| Total distributions | (89,698,804) | (134,526,928) |
| From fund share transactions | (1,600,301,476) | (1,093,157,575) |
| Total decrease | (1,617,995,215) | (1,220,368,255) |
| Net assets | ||
| Beginning of year | 3,408,422,922 | 4,628,791,177 |
| End of year1 | $1,790,427,707 | $3,408,422,922 |
| 1 | Net assets - End of year includes undistributed net investment income of $55,275,691 at May 31, 2018. The SEC eliminated the requirement to disclose undistributed net investment income in the current reporting period. |
| 34 | JOHN HANCOCK Income Fund | ANNUAL REPORT | SEE NOTES TO FINANCIAL STATEMENTS |
| Financial highlights |
| CLASS A SHARES Period ended | 5-31-19 | 5-31-18 | 5-31-17 | 5-31-16 | 5-31-15 |
| Per share operating performance | |||||
| Net asset value, beginning of period | $6.25 | $6.47 | $6.47 | $6.56 | $6.71 |
| Net investment income1 | 0.20 | 0.20 | 0.17 | 0.17 | 0.24 |
| Net realized and unrealized gain (loss) on investments | 0.03 | (0.22) | 0.02 | (0.05) | (0.15) |
| Total from investment operations | 0.23 | (0.02) | 0.19 | 0.12 | 0.09 |
| Less distributions | |||||
| From net investment income | (0.20) | (0.20) | (0.19) | (0.19) | (0.24) |
| From net realized gain | — | — | — | (0.02) | — |
| Total distributions | (0.20) | (0.20) | (0.19) | (0.21) | (0.24) |
| Net asset value, end of period | $6.28 | $6.25 | $6.47 | $6.47 | $6.56 |
| Total return (%)2,3 | 3.72 | (0.43) | 2.95 | 1.82 | 1.30 |
| Ratios and supplemental data | |||||
| Net assets, end of period (in millions) | $541 | $607 | $672 | $913 | $1,007 |
| Ratios (as a percentage of average net assets): | |||||
| Expenses before reductions | 0.82 | 0.80 | 0.81 | 0.82 | 0.82 |
| Expenses including reductions | 0.81 | 0.79 | 0.81 | 0.81 | 0.81 |
| Net investment income | 3.17 | 3.03 | 2.69 | 2.67 | 3.67 |
| Portfolio turnover (%) | 58 | 48 | 41 | 37 | 51 |
| 1 | Based on average daily shares outstanding. |
| 2 | Total returns would have been lower had certain expenses not been reduced during the applicable periods. |
| 3 | Does not reflect the effect of sales charges, if any. |
| SEE NOTES TO FINANCIAL STATEMENTS | ANNUAL REPORT | JOHN HANCOCK Income Fund | 35 |
| CLASS B SHARES Period ended | 5-31-19 | 5-31-18 | 5-31-17 | 5-31-16 | 5-31-15 |
| Per share operating performance | |||||
| Net asset value, beginning of period | $6.25 | $6.47 | $6.47 | $6.56 | $6.71 |
| Net investment income1 | 0.15 | 0.15 | 0.13 | 0.13 | 0.20 |
| Net realized and unrealized gain (loss) on investments | 0.03 | (0.22) | 0.01 | (0.06) | (0.16) |
| Total from investment operations | 0.18 | (0.07) | 0.14 | 0.07 | 0.04 |
| Less distributions | |||||
| From net investment income | (0.15) | (0.15) | (0.14) | (0.14) | (0.19) |
| From net realized gain | — | — | — | (0.02) | — |
| Total distributions | (0.15) | (0.15) | (0.14) | (0.16) | (0.19) |
| Net asset value, end of period | $6.28 | $6.25 | $6.47 | $6.47 | $6.56 |
| Total return (%)2,3 | 2.99 | (1.12) | 2.24 | 1.12 | 0.59 |
| Ratios and supplemental data | |||||
| Net assets, end of period (in millions) | $20 | $42 | $71 | $98 | $120 |
| Ratios (as a percentage of average net assets): | |||||
| Expenses before reductions | 1.52 | 1.50 | 1.51 | 1.52 | 1.52 |
| Expenses including reductions | 1.51 | 1.49 | 1.51 | 1.51 | 1.51 |
| Net investment income | 2.48 | 2.32 | 1.99 | 1.98 | 2.98 |
| Portfolio turnover (%) | 58 | 48 | 41 | 37 | 51 |
| 1 | Based on average daily shares outstanding. |
| 2 | Total returns would have been lower had certain expenses not been reduced during the applicable periods. |
| 3 | Does not reflect the effect of sales charges, if any. |
| 36 | JOHN HANCOCK Income Fund | ANNUAL REPORT | SEE NOTES TO FINANCIAL STATEMENTS |
| CLASS C SHARES Period ended | 5-31-19 | 5-31-18 | 5-31-17 | 5-31-16 | 5-31-15 |
| Per share operating performance | |||||
| Net asset value, beginning of period | $6.25 | $6.47 | $6.47 | $6.56 | $6.71 |
| Net investment income1 | 0.15 | 0.15 | 0.13 | 0.13 | 0.20 |
| Net realized and unrealized gain (loss) on investments | 0.03 | (0.22) | 0.01 | (0.06) | (0.16) |
| Total from investment operations | 0.18 | (0.07) | 0.14 | 0.07 | 0.04 |
| Less distributions | |||||
| From net investment income | (0.15) | (0.15) | (0.14) | (0.14) | (0.19) |
| From net realized gain | — | — | — | (0.02) | — |
| Total distributions | (0.15) | (0.15) | (0.14) | (0.16) | (0.19) |
| Net asset value, end of period | $6.28 | $6.25 | $6.47 | $6.47 | $6.56 |
| Total return (%)2,3 | 2.99 | (1.12) | 2.24 | 1.12 | 0.59 |
| Ratios and supplemental data | |||||
| Net assets, end of period (in millions) | $146 | $211 | $320 | $413 | $479 |
| Ratios (as a percentage of average net assets): | |||||
| Expenses before reductions | 1.52 | 1.50 | 1.51 | 1.52 | 1.52 |
| Expenses including reductions | 1.51 | 1.49 | 1.51 | 1.51 | 1.51 |
| Net investment income | 2.48 | 2.32 | 2.00 | 1.98 | 2.97 |
| Portfolio turnover (%) | 58 | 48 | 41 | 37 | 51 |
| 1 | Based on average daily shares outstanding. |
| 2 | Total returns would have been lower had certain expenses not been reduced during the applicable periods. |
| 3 | Does not reflect the effect of sales charges, if any. |
| SEE NOTES TO FINANCIAL STATEMENTS | ANNUAL REPORT | JOHN HANCOCK Income Fund | 37 |
| CLASS I SHARES Period ended | 5-31-19 | 5-31-18 | 5-31-17 | 5-31-16 | 5-31-15 |
| Per share operating performance | |||||
| Net asset value, beginning of period | $6.23 | $6.46 | $6.46 | $6.55 | $6.69 |
| Net investment income1 | 0.21 | 0.21 | 0.19 | 0.19 | 0.26 |
| Net realized and unrealized gain (loss) on investments | 0.04 | (0.23) | 0.02 | (0.06) | (0.14) |
| Total from investment operations | 0.25 | (0.02) | 0.21 | 0.13 | 0.12 |
| Less distributions | |||||
| From net investment income | (0.21) | (0.21) | (0.21) | (0.20) | (0.26) |
| From net realized gain | — | — | — | (0.02) | — |
| Total distributions | (0.21) | (0.21) | (0.21) | (0.22) | (0.26) |
| Net asset value, end of period | $6.27 | $6.23 | $6.46 | $6.46 | $6.55 |
| Total return (%)2 | 4.18 | (0.29) | 3.27 | 2.14 | 1.76 |
| Ratios and supplemental data | |||||
| Net assets, end of period (in millions) | $595 | $837 | $3,080 | $3,175 | $1,357 |
| Ratios (as a percentage of average net assets): | |||||
| Expenses before reductions | 0.54 | 0.50 | 0.50 | 0.50 | 0.50 |
| Expenses including reductions | 0.53 | 0.49 | 0.49 | 0.50 | 0.50 |
| Net investment income | 3.47 | 3.31 | 3.02 | 2.96 | 3.97 |
| Portfolio turnover (%) | 58 | 48 | 41 | 37 | 51 |
| 1 | Based on average daily shares outstanding. |
| 2 | Total returns would have been lower had certain expenses not been reduced during the applicable periods. |
| 38 | JOHN HANCOCK Income Fund | ANNUAL REPORT | SEE NOTES TO FINANCIAL STATEMENTS |
| CLASS R1 SHARES Period ended | 5-31-19 | 5-31-18 | 5-31-17 | 5-31-16 | 5-31-15 |
| Per share operating performance | |||||
| Net asset value, beginning of period | $6.27 | $6.49 | $6.49 | $6.59 | $6.73 |
| Net investment income1 | 0.18 | 0.17 | 0.15 | 0.15 | 0.22 |
| Net realized and unrealized gain (loss) on investments | 0.03 | (0.22) | 0.02 | (0.07) | (0.15) |
| Total from investment operations | 0.21 | (0.05) | 0.17 | 0.08 | 0.07 |
| Less distributions | |||||
| From net investment income | (0.18) | (0.17) | (0.17) | (0.16) | (0.21) |
| From net realized gain | — | — | — | (0.02) | — |
| Total distributions | (0.18) | (0.17) | (0.17) | (0.18) | (0.21) |
| Net asset value, end of period | $6.30 | $6.27 | $6.49 | $6.49 | $6.59 |
| Total return (%)2 | 3.35 | (0.77) | 2.60 | 1.33 | 1.11 |
| Ratios and supplemental data | |||||
| Net assets, end of period (in millions) | $7 | $10 | $13 | $15 | $15 |
| Ratios (as a percentage of average net assets): | |||||
| Expenses before reductions | 1.17 | 1.15 | 1.16 | 1.16 | 1.16 |
| Expenses including reductions | 1.17 | 1.14 | 1.15 | 1.15 | 1.15 |
| Net investment income | 2.82 | 2.67 | 2.36 | 2.33 | 3.32 |
| Portfolio turnover (%) | 58 | 48 | 41 | 37 | 51 |
| 1 | Based on average daily shares outstanding. |
| 2 | Total returns would have been lower had certain expenses not been reduced during the applicable periods. |
| SEE NOTES TO FINANCIAL STATEMENTS | ANNUAL REPORT | JOHN HANCOCK Income Fund | 39 |
| CLASS R2 SHARES Period ended | 5-31-19 | 5-31-18 | 5-31-17 | 5-31-16 | 5-31-15 |
| Per share operating performance | |||||
| Net asset value, beginning of period | $6.24 | $6.46 | $6.46 | $6.55 | $6.70 |
| Net investment income1 | 0.19 | 0.19 | 0.17 | 0.17 | 0.23 |
| Net realized and unrealized gain (loss) on investments | 0.03 | (0.22) | 0.01 | (0.06) | (0.15) |
| Total from investment operations | 0.22 | (0.03) | 0.18 | 0.11 | 0.08 |
| Less distributions | |||||
| From net investment income | (0.19) | (0.19) | (0.18) | (0.18) | (0.23) |
| From net realized gain | — | — | — | (0.02) | — |
| Total distributions | (0.19) | (0.19) | (0.18) | (0.20) | (0.23) |
| Net asset value, end of period | $6.27 | $6.24 | $6.46 | $6.46 | $6.55 |
| Total return (%)2 | 3.61 | (0.54) | 2.86 | 1.58 | 1.35 |
| Ratios and supplemental data | |||||
| Net assets, end of period (in millions) | $6 | $9 | $14 | $11 | $7 |
| Ratios (as a percentage of average net assets): | |||||
| Expenses before reductions | 0.92 | 0.90 | 0.91 | 0.90 | 0.91 |
| Expenses including reductions | 0.91 | 0.89 | 0.90 | 0.90 | 0.90 |
| Net investment income | 3.07 | 2.92 | 2.62 | 2.59 | 3.52 |
| Portfolio turnover (%) | 58 | 48 | 41 | 37 | 51 |
| 1 | Based on average daily shares outstanding. |
| 2 | Total returns would have been lower had certain expenses not been reduced during the applicable periods. |
| 40 | JOHN HANCOCK Income Fund | ANNUAL REPORT | SEE NOTES TO FINANCIAL STATEMENTS |
| CLASS R3 SHARES Period ended | 5-31-19 | 5-31-18 | 5-31-17 | 5-31-16 | 5-31-15 |
| Per share operating performance | |||||
| Net asset value, beginning of period | $6.25 | $6.47 | $6.47 | $6.56 | $6.70 |
| Net investment income1 | 0.18 | 0.18 | 0.16 | 0.16 | 0.23 |
| Net realized and unrealized gain (loss) on investments | 0.03 | (0.22) | 0.01 | (0.06) | (0.15) |
| Total from investment operations | 0.21 | (0.04) | 0.17 | 0.10 | 0.08 |
| Less distributions | |||||
| From net investment income | (0.18) | (0.18) | (0.17) | (0.17) | (0.22) |
| From net realized gain | — | — | — | (0.02) | — |
| Total distributions | (0.18) | (0.18) | (0.17) | (0.19) | (0.22) |
| Net asset value, end of period | $6.28 | $6.25 | $6.47 | $6.47 | $6.56 |
| Total return (%)2 | 3.46 | (0.68) | 2.71 | 1.60 | 1.20 |
| Ratios and supplemental data | |||||
| Net assets, end of period (in millions) | $4 | $8 | $7 | $3 | $2 |
| Ratios (as a percentage of average net assets): | |||||
| Expenses before reductions | 1.07 | 1.05 | 1.06 | 1.04 | 1.06 |
| Expenses including reductions | 1.06 | 1.04 | 1.05 | 1.03 | 1.05 |
| Net investment income | 2.86 | 2.79 | 2.50 | 2.44 | 3.48 |
| Portfolio turnover (%) | 58 | 48 | 41 | 37 | 51 |
| 1 | Based on average daily shares outstanding. |
| 2 | Total returns would have been lower had certain expenses not been reduced during the applicable periods. |
| SEE NOTES TO FINANCIAL STATEMENTS | ANNUAL REPORT | JOHN HANCOCK Income Fund | 41 |
| CLASS R4 SHARES Period ended | 5-31-19 | 5-31-18 | 5-31-17 | 5-31-16 | 5-31-15 |
| Per share operating performance | |||||
| Net asset value, beginning of period | $6.25 | $6.47 | $6.47 | $6.57 | $6.71 |
| Net investment income1 | 0.20 | 0.20 | 0.19 | 0.18 | 0.25 |
| Net realized and unrealized gain (loss) on investments | 0.04 | (0.22) | 0.01 | (0.06) | (0.14) |
| Total from investment operations | 0.24 | (0.02) | 0.20 | 0.12 | 0.11 |
| Less distributions | |||||
| From net investment income | (0.21) | (0.20) | (0.20) | (0.20) | (0.25) |
| From net realized gain | — | — | — | (0.02) | — |
| Total distributions | (0.21) | (0.20) | (0.20) | (0.22) | (0.25) |
| Net asset value, end of period | $6.28 | $6.25 | $6.47 | $6.47 | $6.57 |
| Total return (%)2 | 3.87 | (0.28) | 3.11 | 1.83 | 1.62 |
| Ratios and supplemental data | |||||
| Net assets, end of period (in millions) | $3 | $143 | $145 | $139 | $45 |
| Ratios (as a percentage of average net assets): | |||||
| Expenses before reductions | 0.77 | 0.75 | 0.76 | 0.76 | 0.76 |
| Expenses including reductions | 0.67 | 0.64 | 0.65 | 0.65 | 0.65 |
| Net investment income | 3.30 | 3.18 | 2.86 | 2.82 | 3.74 |
| Portfolio turnover (%) | 58 | 48 | 41 | 37 | 51 |
| 1 | Based on average daily shares outstanding. |
| 2 | Total returns would have been lower had certain expenses not been reduced during the applicable periods. |
| 42 | JOHN HANCOCK Income Fund | ANNUAL REPORT | SEE NOTES TO FINANCIAL STATEMENTS |
| CLASS R5 SHARES Period ended | 5-31-19 | 5-31-18 | 5-31-17 | 5-31-16 | 5-31-15 |
| Per share operating performance | |||||
| Net asset value, beginning of period | $6.24 | $6.46 | $6.46 | $6.55 | $6.70 |
| Net investment income1 | 0.22 | 0.22 | 0.20 | 0.20 | 0.27 |
| Net realized and unrealized gain (loss) on investments | 0.03 | (0.22) | 0.01 | (0.06) | (0.16) |
| Total from investment operations | 0.25 | — | 0.21 | 0.14 | 0.11 |
| Less distributions | |||||
| From net investment income | (0.22) | (0.22) | (0.21) | (0.21) | (0.26) |
| From net realized gain | — | — | — | (0.02) | — |
| Total distributions | (0.22) | (0.22) | (0.21) | (0.23) | (0.26) |
| Net asset value, end of period | $6.27 | $6.24 | $6.46 | $6.46 | $6.55 |
| Total return (%)2 | 4.08 | (0.09) | 3.32 | 2.19 | 1.66 |
| Ratios and supplemental data | |||||
| Net assets, end of period (in millions) | $7 | $17 | $20 | $13 | $11 |
| Ratios (as a percentage of average net assets): | |||||
| Expenses before reductions | 0.47 | 0.45 | 0.46 | 0.46 | 0.46 |
| Expenses including reductions | 0.47 | 0.44 | 0.45 | 0.45 | 0.45 |
| Net investment income | 3.54 | 3.38 | 3.09 | 3.03 | 4.03 |
| Portfolio turnover (%) | 58 | 48 | 41 | 37 | 51 |
| 1 | Based on average daily shares outstanding. |
| 2 | Total returns would have been lower had certain expenses not been reduced during the applicable periods. |
| SEE NOTES TO FINANCIAL STATEMENTS | ANNUAL REPORT | JOHN HANCOCK Income Fund | 43 |
| CLASS R6 SHARES Period ended | 5-31-19 | 5-31-18 | 5-31-17 | 5-31-16 | 5-31-15 |
| Per share operating performance | |||||
| Net asset value, beginning of period | $6.24 | $6.46 | $6.46 | $6.56 | $6.70 |
| Net investment income1 | 0.22 | 0.22 | 0.20 | 0.20 | 0.26 |
| Net realized and unrealized gain (loss) on investments | 0.03 | (0.22) | 0.02 | (0.07) | (0.14) |
| Total from investment operations | 0.25 | — | 0.22 | 0.13 | 0.12 |
| Less distributions | |||||
| From net investment income | (0.22) | (0.22) | (0.22) | (0.21) | (0.26) |
| From net realized gain | — | — | — | (0.02) | — |
| Total distributions | (0.22) | (0.22) | (0.22) | (0.23) | (0.26) |
| Net asset value, end of period | $6.27 | $6.24 | $6.46 | $6.46 | $6.56 |
| Total return (%)2 | 4.13 | (0.03) | 3.39 | 2.10 | 1.87 |
| Ratios and supplemental data | |||||
| Net assets, end of period (in millions) | $461 | $1,525 | $288 | $191 | $175 |
| Ratios (as a percentage of average net assets): | |||||
| Expenses before reductions | 0.42 | 0.40 | 0.41 | 0.41 | 0.41 |
| Expenses including reductions | 0.42 | 0.39 | 0.38 | 0.38 | 0.39 |
| Net investment income | 3.58 | 3.45 | 3.15 | 3.10 | 3.88 |
| Portfolio turnover (%) | 58 | 48 | 41 | 37 | 51 |
| 1 | Based on average daily shares outstanding. |
| 2 | Total returns would have been lower had certain expenses not been reduced during the applicable periods. |
| 44 | JOHN HANCOCK Income Fund | ANNUAL REPORT | SEE NOTES TO FINANCIAL STATEMENTS |
| Notes to financial statements |
| ANNUAL REPORT | JOHN HANCOCK Income Fund | 45 |
| Total value at 5-31-19 | Level 1 quoted price | Level 2 significant observable inputs | Level 3 significant unobservable inputs | |
| Investments in securities: | ||||
| Assets | ||||
| U.S. Government and Agency obligations | $182,024,394 | — | $182,024,394 | — |
| Foreign government obligations | 349,267,640 | — | 349,267,640 | — |
| Corporate bonds | 865,610,834 | — | 865,610,834 | — |
| Convertible bonds | 20,230,037 | — | 20,230,037 | — |
| Capital preferred securities | 23,039,295 | — | 23,039,295 | — |
| Collateralized mortgage obligations | 141,157,704 | — | 141,157,704 | — |
| Asset backed securities | 66,700,443 | — | 66,700,443 | — |
| Preferred securities | 86,492,301 | $59,588,633 | 26,903,668 | — |
| 46 | JOHN HANCOCK Income Fund | ANNUAL REPORT |
| Total value at 5-31-19 | Level 1 quoted price | Level 2 significant observable inputs | Level 3 significant unobservable inputs | |
| Purchased options | $63,736 | — | $63,736 | — |
| Securities lending collateral | 8,100,599 | $8,100,599 | — | — |
| Short-term investments | 24,074,000 | — | 24,074,000 | — |
| Total investments in securities | $1,766,760,983 | $67,689,232 | $1,699,071,751 | — |
| Derivatives: | ||||
| Assets | ||||
| Forward foreign currency contracts | $21,279,316 | — | $21,279,316 | — |
| Liabilities | ||||
| Futures | (71,818) | $(71,818) | — | — |
| Forward foreign currency contracts | (8,190,813) | — | (8,190,813) | — |
| ANNUAL REPORT | JOHN HANCOCK Income Fund | 47 |
| 48 | JOHN HANCOCK Income Fund | ANNUAL REPORT |
| ANNUAL REPORT | JOHN HANCOCK Income Fund | 49 |
| May 31, 2019 | May 31, 2018 | |
| Ordinary Income | $89,698,804 | $134,526,928 |
| 50 | JOHN HANCOCK Income Fund | ANNUAL REPORT |
| ANNUAL REPORT | JOHN HANCOCK Income Fund | 51 |
| 52 | JOHN HANCOCK Income Fund | ANNUAL REPORT |
| Risk | Statement of assets and liabilities location | Financial instruments location | Assets derivatives fair value | Liabilities derivatives fair value |
| Interest rate | Receivable/payable for futures variation margin | Futures† | - | ($71,818) |
| Foreign currency | Unrealized appreciation / depreciation on forward foreign currency | Forward foreign currency contracts | $21,279,316 | (8,190,813) |
| Foreign currency | Unaffiliated investments, at value* | Purchased options | 63,736 | - |
| Total | $21,343,052 | ($8,262,631) | ||
| † Reflects cumulative appreciation/depreciation on futures as disclosed in the Fund's investments. Only the year end variation margin is separately disclosed on the Statement of assets and liabilities. | ||||
| * Purchased options are included in the Fund’s investments. | ||||
| OTC Financial Instruments | Asset | Liability |
| Forward foreign currency contracts | $21,279,316 | ($8,190,813) |
| Purchased options | 63,736 | - |
| Total | $21,343,052 | ($8,190,813) |
| Counterparty | Total Market Value of OTC Derivatives | Collateral Posted by Counterparty | Collateral Posted by Fund | Net Exposure |
| Australia and New Zealand Banking Group Limited | $2,001,699 | $2,001,699 | - | - |
| Bank of America, N.A. | (3,645) | - | - | ($3,645) |
| Bank of Montreal | 111,610 | - | - | 111,610 |
| Canadian Imperial Bank of Commerce | 140,043 | - | - | 140,043 |
| Citibank, N.A. | 972,907 | 838,000 | - | 134,907 |
| Goldman Sachs International | 1,824,965 | 1,511,215 | - | 313,750 |
| HSBC Bank PLC | 440,601 | 280,000 | - | 160,601 |
| JPMorgan Chase Bank, N.A. | 1,304,166 | 1,304,166 | - | - |
| Morgan Stanley Capital Services LLC | 5,214,883 | 5,214,883 | - | - |
| National Australia Bank Ltd. | (331,943) | - | $260,000 | (71,943) |
| Royal Bank of Canada | 599,005 | 599,005 | - | - |
| Standard Chartered Bank | (255,732) | - | 255,732 | - |
| State Street Bank and Trust Company | 719,101 | 719,101 | - | - |
| The Toronto-Donimion Bank | 14,281 | - | - | 14,281 |
| U.S. Bank N.A. | 236,532 | - | - | 236,532 |
| ANNUAL REPORT | JOHN HANCOCK Income Fund | 53 |
| Counterparty | Total Market Value of OTC Derivatives | Collateral Posted by Counterparty | Collateral Posted by Fund | Net Exposure |
| UBS AG | 163,766 | 141,830 | - | 21,936 |
| Totals | $13,152,239 | $12,609,899 | $515,732 | $1,058,072 |
| Statement of operations Location - Net realized gain (loss) on: | |||
| Risk | Futures contracts | Forward foreign currency contracts | Total |
| Interest rate | ($5,654,879) | - | ($5,654,879) |
| Foreign currency | - | $20,448,435 | 20,448,435 |
| Total | ($5,654,879) | $20,448,435 | $14,793,556 |
| Statement of operations Location - Change in net unrealized appreciation (depreciation) of: | ||||
| Risk | Unaffiliated investments and translation of assets and liabilities in foreign currencies1 | Futures contracts | Forward foreign currency contracts | Total |
| Interest rate | - | $8,141,894 | - | $8,141,894 |
| Foreign currency | ($618,084) | - | ($668,752) | (1,286,836) |
| Total | ($618,084) | $8,141,894 | ($668,752) | $6,855,058 |
| 1 Change in unrealized appreciation/depreciation associated with purchased options is included in this caption on the Statement of operations. | ||||
| 54 | JOHN HANCOCK Income Fund | ANNUAL REPORT |
| Class | Expense reduction |
| Class A | $43,520 |
| Class B | 2,366 |
| Class C | 13,867 |
| Class I | 57,046 |
| Class R1 | 627 |
| Class R2 | 584 |
| Class | Expense reduction |
| Class R3 | $346 |
| Class R4 | 6,537 |
| Class R5 | 979 |
| Class R6 | 83,027 |
| Total | $208,899 |
| Class | Rule 12b-1 Fee | Service fee |
| Class A | 0.30% | — |
| Class | Rule 12b-1 Fee | Service fee |
| Class B | 1.00% | — |
| ANNUAL REPORT | JOHN HANCOCK Income Fund | 55 |
| Class | Rule 12b-1 Fee | Service fee |
| Class C | 1.00% | — |
| Class R1 | 0.50% | 0.25% |
| Class R2 | 0.25% | 0.25% |
| Class | Rule 12b-1 Fee | Service fee |
| Class R3 | 0.50% | 0.15% |
| Class R4 | 0.25% | 0.10% |
| Class R5 | — | 0.05% |
| Class | Distribution and service fees | Transfer agent fees |
| Class A | $1,672,952 | $623,325 |
| Class B | 300,626 | 33,516 |
| Class C | 1,770,917 | 197,822 |
| Class I | — | 939,255 |
| Class R1 | 60,186 | 1,038 |
| Class R2 | 37,209 | 964 |
| Class R3 | 28,687 | 576 |
| 56 | JOHN HANCOCK Income Fund | ANNUAL REPORT |
| Class | Distribution and service fees | Transfer agent fees |
| Class R4 | $281,231 | $10,375 |
| Class R5 | 6,181 | 1,616 |
| Class R6 | — | 136,408 |
| Total | $4,157,989 | $1,944,895 |
| Borrower or Lender | Weighted Average Loan Balance | Days Outstanding | Weighted Average Interest Rate | Interest Income (Expense) |
| Lender | $2,764,131 | 4 | 2.137% | $656 |
| Year Ended 5-31-19 | Year Ended 5-31-18 | |||
| Shares | Amount | Shares | Amount | |
| Class A shares | ||||
| Sold | 11,855,323 | $73,461,070 | 17,201,850 | $110,012,055 |
| Distributions reinvested | 2,555,960 | 15,815,724 | 2,629,196 | 16,904,829 |
| Repurchased | (25,363,929) | (156,705,120) | (26,549,463) | (170,884,535) |
| Net decrease | (10,952,646) | $(67,428,326) | (6,718,417) | $(43,967,651) |
| Class B shares | ||||
| Sold | 30,529 | $189,787 | 37,703 | $242,998 |
| Distributions reinvested | 110,119 | 681,051 | 187,885 | 1,209,433 |
| Repurchased | (3,760,508) | (23,284,411) | (4,446,193) | (28,637,515) |
| Net decrease | (3,619,860) | $(22,413,573) | (4,220,605) | $(27,185,084) |
| Class C shares | ||||
| Sold | 1,186,551 | $7,294,888 | 1,205,231 | $7,775,484 |
| Distributions reinvested | 634,924 | 3,927,371 | 927,671 | 5,967,773 |
| Repurchased | (12,342,504) | (76,347,749) | (17,866,186) | (114,202,394) |
| Net decrease | (10,521,029) | $(65,125,490) | (15,733,284) | $(100,459,137) |
| ANNUAL REPORT | JOHN HANCOCK Income Fund | 57 |
| Year Ended 5-31-19 | Year Ended 5-31-18 | |||
| Shares | Amount | Shares | Amount | |
| Class I shares | ||||
| Sold | 35,791,365 | $220,351,855 | 46,502,079 | $299,786,118 |
| Distributions reinvested | 3,779,968 | 23,334,735 | 8,697,678 | 55,949,552 |
| Repurchased | (78,938,815) | (485,654,006) | (398,000,139) | (2,559,425,999) |
| Net decrease | (39,367,482) | $(241,967,416) | (342,800,382) | $(2,203,690,329) |
| Class R1 shares | ||||
| Sold | 196,061 | $1,218,238 | 416,209 | $2,694,261 |
| Distributions reinvested | 31,261 | 194,019 | 40,303 | 260,016 |
| Repurchased | (661,081) | (4,109,130) | (902,917) | (5,814,004) |
| Net decrease | (433,759) | $(2,696,873) | (446,405) | $(2,859,727) |
| Class R2 shares | ||||
| Sold | 230,538 | $1,427,592 | 407,737 | $2,630,942 |
| Distributions reinvested | 28,699 | 177,380 | 35,768 | 229,683 |
| Repurchased | (640,764) | (3,956,715) | (1,226,709) | (7,935,357) |
| Net decrease | (381,527) | $(2,351,743) | (783,204) | $(5,074,732) |
| Class R3 shares | ||||
| Sold | 114,170 | $707,220 | 429,477 | $2,766,886 |
| Distributions reinvested | 20,777 | 128,553 | 30,742 | 197,467 |
| Repurchased | (653,415) | (4,067,825) | (247,025) | (1,592,627) |
| Net increase (decrease) | (518,468) | $(3,232,052) | 213,194 | $1,371,726 |
| Class R4 shares | ||||
| Sold | 1,877,198 | $11,585,437 | 3,650,757 | $23,537,956 |
| Distributions reinvested | 399,222 | 2,465,771 | 727,062 | 4,674,107 |
| Repurchased | (24,688,732) | (149,934,837) | (3,820,954) | (24,604,830) |
| Net increase (decrease) | (22,412,312) | $(135,883,629) | 556,865 | $3,607,233 |
| Class R5 shares | ||||
| Sold | 379,131 | $2,342,519 | 1,334,055 | $8,575,898 |
| Distributions reinvested | 69,854 | 431,244 | 104,593 | 671,824 |
| Repurchased | (1,997,426) | (12,343,173) | (1,728,576) | (11,100,164) |
| Net decrease | (1,548,441) | $(9,569,410) | (289,928) | $(1,852,442) |
| Class R6 shares | ||||
| Sold | 23,010,725 | $142,333,550 | 318,409,833 | $2,050,624,753 |
| Distributions reinvested | 6,020,655 | 37,143,757 | 3,218,992 | 20,517,185 |
| Repurchased | (200,060,158) | (1,229,110,271) | (121,805,225) | (784,189,370) |
| Net increase (decrease) | (171,028,778) | $(1,049,632,964) | 199,823,600 | $1,286,952,568 |
| Total net decrease | (260,784,302) | $(1,600,301,476) | (170,398,566) | $(1,093,157,575) |
| 58 | JOHN HANCOCK Income Fund | ANNUAL REPORT |
| Dividends and distributions | |||||||||
| Affiliate | Beginning share amount | Shares purchased | Shares sold | Ending share amount | Income distributions received | Capital gain distributions received | Realized gain (loss) | Change in unrealized appreciation (depreciation) | Ending value |
| John Hancock Collateral Trust * | — | 15,251,655 | (14,442,162) | 809,493 | — | — | $(705) | $(142) | $8,100,599 |
| * | Refer to the Securities lending note within Note 2 for details regarding this investment. |
| ANNUAL REPORT | JOHN HANCOCK Income Fund | 59 |
| 60 | JOHN HANCOCK INCOME FUND | ANNUAL REPORT |
| ANNUAL REPORT | JOHN HANCOCK INCOME FUND | 61 |
This chart provides information about the Trustees and Officers who oversee your John Hancock fund. Officers elected by the Trustees manage the day-to-day operations of the fund and execute policies formulated by the Trustees.
Independent Trustees
| Name, year of birth Position(s) held with Trust Principal occupation(s) and other directorships during past 5 years | Trustee of the Trust since1 | Number of John Hancock funds overseen by Trustee |
| Hassell H. McClellan, Born: 1945 | 2012 | 211 |
| Trustee and Chairperson of the Board Director/Trustee, Virtus Funds (since 2008); Director, The Barnes Group (since 2010); Associate Professor, The Wallace E. Carroll School of Management, Boston College (retired 2013). Trustee (since 2005) and Chairperson of the Board (since 2017) of various trusts within the John Hancock Fund Complex. | ||
| Charles L. Bardelis,2 Born: 1941 | 2012 | 211 |
| Trustee Director, Island Commuter Corp. (marine transport). Trustee of various trusts within the John Hancock Fund Complex (since 1988). | ||
| James R. Boyle,Born: 1959 | 2015 | 211 |
| Trustee Chief Executive Officer, Foresters Financial (since 2018); Chairman and Chief Executive Officer, Zillion Group, Inc. (formerly HealthFleet, Inc.) (healthcare) (2014-2018); Executive Vice President and Chief Executive Officer, U.S. Life Insurance Division of Genworth Financial, Inc. (insurance) (January 2014-July 2014); Senior Executive Vice President, Manulife Financial, President and Chief Executive Officer, John Hancock (1999-2012); Chairman and Director, John Hancock Investment Management LLC, John Hancock Investment Management Distributors LLC, and John Hancock Variable Trust Advisers LLC (2005-2010). Trustee of various trusts within the John Hancock Fund Complex (2005-2014 and since 2015). | ||
| Peter S. Burgess,2 Born: 1942 | 2012 | 211 |
| Trustee Consultant (financial, accounting, and auditing matters) (since 1999); Certified Public Accountant; Partner, Arthur Andersen (independent public accounting firm) (prior to 1999); Director, Lincoln Educational Services Corporation (since 2004); Director, Symetra Financial Corporation (2010-2016); Director, PMA Capital Corporation (2004-2010). Trustee of various trusts within the John Hancock Fund Complex (since 2005). | ||
| William H. Cunningham, Born: 1944 | 2005 | 211 |
| Trustee Professor, University of Texas, Austin, Texas (since 1971); former Chancellor, University of Texas System and former President of the University of Texas, Austin, Texas; Chairman (since 2009) and Director (since 2006), Lincoln National Corporation (insurance); Director, Southwest Airlines (since 2000); former Director, LIN Television (2009-2014). Trustee of various trusts within the John Hancock Fund Complex (since 1986). | ||
| Grace K. Fey, Born: 1946 | 2012 | 211 |
| Trustee Chief Executive Officer, Grace Fey Advisors (since 2007); Director and Executive Vice President, Frontier Capital Management Company (1988-2007); Director, Fiduciary Trust (since 2009). Trustee of various trusts within the John Hancock Fund Complex (since 2008). | ||
Independent Trustees (continued)
| Name, year of birth Position(s) held with Trust Principal occupation(s) and other directorships during past 5 years | Trustee of the Trust since1 | Number of John Hancock funds overseen by Trustee |
| Theron S. Hoffman,2 Born: 1947 | 2012 | 211 |
| Trustee Chief Executive Officer, T. Hoffman Associates, LLC (consulting firm) (since 2003); Director, The Todd Organization (consulting firm) (2003-2010); President, Westport Resources Management (investment management consulting firm) (2006-2008); Board Member, Senior Managing Director, Partner, and Operating Head, Putnam Investments (2000-2003); Executive Vice President, The Thomson Corp. (financial and legal information publishing) (1997-2000). Trustee of various trusts within the John Hancock Fund Complex (since 2008). | ||
| Deborah C. Jackson, Born: 1952 | 2008 | 211 |
| Trustee President, Cambridge College, Cambridge, Massachusetts (since 2011); Board of Directors, National Association of Corporate Directors/New England (since 2015); Board of Directors, Association of Independent Colleges and Universities of Massachusetts (since 2014); Chief Executive Officer, American Red Cross of Massachusetts Bay (2002-2011); Board of Directors of Eastern Bank Corporation (since 2001); Board of Directors of Eastern Bank Charitable Foundation (since 2001); Board of Directors of American Student Assistance Corporation (1996-2009); Board of Directors of Boston Stock Exchange (2002-2008); Board of Directors of Harvard Pilgrim Healthcare (health benefits company) (2007-2011). Trustee of various trusts within the John Hancock Fund Complex (since 2008). | ||
| James M. Oates, Born: 1946 | 2012 | 211 |
| Trustee Managing Director, Wydown Group (financial consulting firm) (since 1994); Chairman and Director, Emerson Investment Management, Inc. (2000-2015); Independent Chairman, Hudson Castle Group, Inc. (formerly IBEX Capital Markets, Inc.) (financial services company) (1997-2011); Director, Stifel Financial (since 1996); Director, Investor Financial Services Corporation (1995-2007); Director, Connecticut River Bancorp (1998-2014); Director/Trustee, Virtus Funds (since 1988). Trustee (since 2004) and Chairperson of the Board (2005-2016) of various trusts within the John Hancock Fund Complex. | ||
| Steven R. Pruchansky, Born: 1944 | 2005 | 211 |
| Trustee and Vice Chairperson of the Board Managing Director, Pru Realty (since 2017); Chairman and Chief Executive Officer, Greenscapes of Southwest Florida, Inc. (since 2000); Director and President, Greenscapes of Southwest Florida, Inc. (until 2000); Member, Board of Advisors, First American Bank (until 2010); Managing Director, Jon James, LLC (real estate) (since 2000); Partner, Right Funding, LLC (2014-2017); Director, First Signature Bank & Trust Company (until 1991); Director, Mast Realty Trust (until 1994); President, Maxwell Building Corp. (until 1991). Trustee (since 1992), Chairperson of the Board (2011-2012), and Vice Chairperson of the Board (since 2012) of various trusts within the John Hancock Fund Complex. | ||
| Gregory A. Russo, Born: 1949 | 2009 | 211 |
| Trustee Director and Audit Committee Chairman (since 2012), and Member, Audit Committee and Finance Committee (since 2011), NCH Healthcare System, Inc. (holding company for multi-entity healthcare system); Director and Member (since 2012) and Finance Committee Chairman (since 2014), The Moorings, Inc. (nonprofit continuing care community); Vice Chairman, Risk & Regulatory Matters, KPMG LLP (KPMG) (2002-2006); Vice Chairman, Industrial Markets, KPMG (1998-2002); Chairman and Treasurer, Westchester County, New York, Chamber of Commerce (1986-1992); Director, Treasurer, and Chairman of Audit and Finance Committees, Putnam Hospital Center (1989-1995); Director and Chairman of Fundraising Campaign, United Way of Westchester and Putnam Counties, New York (1990-1995). Trustee of various trusts within the John Hancock Fund Complex (since 2008). | ||
Non-Independent Trustees3
| Name, year of birth Position(s) held with Trust Principal occupation(s) and other directorships during past 5 years | Trustee of the Trust since1 | Number of John Hancock funds overseen by Trustee |
| Andrew G. Arnott, Born: 1971 | 2017 | 211 |
| President and Non-Independent Trustee Head of Wealth and Asset Management, United States and Europe, for John Hancock and Manulife (since 2018); Executive Vice President, John Hancock Financial Services (since 2009, including prior positions); Director and Executive Vice President, John Hancock Investment Management LLC (since 2005, including prior positions); Director and Executive Vice President, John Hancock Variable Trust Advisers LLC (since 2006, including prior positions); President, John Hancock Investment Management Distributors LLC (since 2004, including prior positions); President of various trusts within the John Hancock Fund Complex (since 2007, including prior positions). | ||
| Marianne Harrison, Born: 1963 | 2018 | 211 |
| Non-Independent Trustee President and CEO, John Hancock (since 2017); President and CEO, Manulife Canadian Division (2013-2017); Member, Board of Directors, American Council of Life Insurers (ACLI) (since 2018); Member, Board of Directors, Communitech, an industry-led innovation center that fosters technology companies in Canada (since 2017); Member, Board of Directors, Manulife Assurance Canada (since 2015); Board Member, St. Mary's General Hospital Foundation (since 2014); Member, Board of Directors, Manulife Bank of Canada (since 2013); Member, Standing Committee of the Canadian Life & Health Assurance Association (since 2013); Member, Board of Directors, John Hancock USA, John Hancock Life & Health, John Hancock New York (2012-2013). Trustee of various trusts within the John Hancock Fund Complex (since 2018). | ||
Principal officers who are not Trustees
| Name, year of birth Position(s) held with Trust Principal occupation(s) during past 5 years | Officer of the Trust since |
| Francis V. Knox, Jr.,Born: 1947 | 2005 |
| Chief Compliance Officer Vice President, John Hancock Financial Services (since 2005); Chief Compliance Officer, various trusts within the John Hancock Fund Complex, John Hancock Investment Management LLC, and John Hancock Variable Trust Advisers LLC (since 2005). | |
| Charles A. Rizzo, Born: 1957 | 2007 |
| Chief Financial Officer Vice President, John Hancock Financial Services (since 2008); Senior Vice President, John Hancock Investment Management LLC and John Hancock Variable Trust Advisers LLC (since 2008); Chief Financial Officer of various trusts within the John Hancock Fund Complex (since 2007). | |
| Salvatore Schiavone, Born: 1965 | 2010 |
| Treasurer Assistant Vice President, John Hancock Financial Services (since 2007); Vice President, John Hancock Investment Management LLC and John Hancock Variable Trust Advisers LLC (since 2007); Treasurer of various trusts within the John Hancock Fund Complex (since 2007, including prior positions). | |
Principal officers who are notTrustees (continued)
| Name, year of birth Position(s) held with Trust Principal occupation(s) during past 5 years | Officer of the Trust since | |
| Christopher (Kit) Sechler,Born: 1973 | 2018 | |
| Chief Legal Officer and Secretary Vice President and Deputy Chief Counsel, John Hancock Investments (since 2015); Assistant Vice President and Senior Counsel (2009-2015), John Hancock Investments; Chief Legal Officer and Secretary of various trusts within the John Hancock Fund Complex (since 2018); Assistant Secretary of John Hancock Investment Management, LLC and John Hancock Variable Trust Advisers LLC (since 2009). | ||
The business address for all Trustees and Officers is 200 Berkeley Street, Boston, Massachusetts 02116-5023.
The Statement of Additional Information of the fund includes additional information about members of the Board of Trustees of the Trust and is available without charge, upon request, by calling 800-225-5291.
| 1 | Each Trustee holds office until his or her successor is elected and qualified, or until the Trustee's death, retirement, resignation, or removal. Mr. Boyle has served as Trustee at various times prior to the date listed in the table. |
| 2 | Member of the Audit Committee. |
| 3 | The Trustee is a Non-Independent Trustee due to current or former positions with the Advisor and certain affiliates. |
Trustees Hassell H. McClellan,Chairperson Officers Andrew G. Arnott Francis V. Knox, Jr. Charles A. Rizzo Salvatore Schiavone Christopher (Kit) Sechler** | Investment advisor John Hancock Investment Management LLC Subadvisor Manulife Investment Management (US) LLC Christopher M. Chapman, CFA Principal distributor John Hancock Investment Management Distributors LLC Custodian State Street Bank and Trust Company Transfer agent John Hancock Signature Services, Inc. Legal counsel K&L Gates LLP Independent registered public accounting firm PricewaterhouseCoopers LLP |
* Member of the Audit Committee
† Non-Independent Trustee
# Effective 6-19-18
** Effective 9-13-18
The fund's proxy voting policies and procedures, as well as the fund proxy voting record for the most recent twelve-month period ended June 30, are available free of charge on the Securities and Exchange Commission (SEC) website at sec.gov or on our website.
All of the fund's holdings as of the end of the third month of every fiscal quarter are filed with the SEC on Form N-PORT within 60 days of the end of the fiscal quarter. The fund's Form N-PORT filings are available on our website and the SEC's website, sec.gov.
We make this information on your fund, as well asmonthly portfolio holdings, and other fund details available on our website at jhinvestments.com or by calling 800-225-5291.
| You can also contact us: | |||
| 800-225-5291 jhinvestments.com | Regular mail: John Hancock Signature Services, Inc. | Express mail: John Hancock Signature Services, Inc. | |
John Hancock family of funds
DOMESTIC EQUITY FUNDS Blue Chip Growth Classic Value Disciplined Value Disciplined Value Mid Cap Equity Income Financial Industries Fundamental All Cap Core Fundamental Large Cap Core Fundamental Large Cap Value New Opportunities Regional Bank Small Cap Core Small Cap Growth Small Cap Value U.S. Global Leaders Growth U.S. Quality Growth Value Equity GLOBAL AND INTERNATIONAL EQUITY FUNDS Disciplined Value International Emerging Markets Emerging Markets Equity Fundamental Global Franchise Global Equity Global Shareholder Yield Global Thematic Opportunities International Dynamic Growth International Growth International Small Company | INCOME FUNDS Bond California Tax-Free Income Emerging Markets Debt Floating Rate Income Government Income High Yield High Yield Municipal Bond Income Investment Grade Bond Money Market Short Duration Bond Short Duration Credit Opportunities Spectrum Income Strategic Income Opportunities Tax-Free Bond ALTERNATIVE AND SPECIALTY FUNDS Absolute Return Currency Alternative Asset Allocation Disciplined Alternative Yield Global Absolute Return Strategies Infrastructure Seaport Long/Short |
A fund's investment objectives, risks, charges, and expenses should be considered carefully before investing. The prospectus contains this and other important information about the fund. To obtain a prospectus, contact your financial professional, call John Hancock Investments at 800-225-5291, or visit our website at jhinvestments.com. Please read the prospectus carefully before investing or sending money.
ASSET ALLOCATION Balanced Income Allocation Multi-Index Lifetime Portfolios Multi-Index Preservation Portfolios Multimanager Lifestyle Portfolios Multimanager Lifetime Portfolios Retirement Income 2040 EXCHANGE-TRADED FUNDS John Hancock Multifactor Consumer Discretionary ETF John Hancock Multifactor Consumer Staples ETF John Hancock Multifactor Developed International ETF John Hancock Multifactor Emerging Markets ETF John Hancock Multifactor Energy ETF John Hancock Multifactor Financials ETF John Hancock Multifactor Healthcare ETF John Hancock Multifactor Industrials ETF John Hancock Multifactor Large Cap ETF John Hancock Multifactor Materials ETF John Hancock Multifactor Media and John Hancock Multifactor Mid Cap ETF John Hancock Multifactor Small Cap ETF John Hancock Multifactor Technology ETF John Hancock Multifactor Utilities ETF | ENVIRONMENTAL, SOCIAL, AND ESG All Cap Core ESG Core Bond ESG International Equity ESG Large Cap Core CLOSED-END FUNDS Financial Opportunities Hedged Equity & Income Income Securities Trust Investors Trust Preferred Income Preferred Income II Preferred Income III Premium Dividend Tax-Advantaged Dividend Income Tax-Advantaged Global Shareholder Yield |
John Hancock Multifactor ETF shares are bought and sold at market price (not NAV), and are not individually redeemed
from the fund. Brokerage commissions will reduce returns.
John Hancock ETFs are distributed by Foreside Fund Services, LLC, and are subadvised by Dimensional Fund Advisors LP.
Foreside is not affiliated with John Hancock Funds, LLC or Dimensional Fund Advisors LP.
Dimensional Fund Advisors LP receives compensation from John Hancock in connection with licensing rights to the
John Hancock Dimensional indexes. Dimensional Fund Advisors LP does not sponsor, endorse, or sell, and makes no
representation as to the advisability of investing in, John Hancock Multifactor ETFs.
John Hancock Investment Management
A trusted brand
John Hancock Investment Management is a premier asset manager
representing one of America's most trusted brands, with a heritage of
financial stewardship dating back to 1862. Helping our shareholders
pursue their financial goals is at the core of everything we do. It's why
we support the role of professional financial advice and operate with
the highest standards of conduct and integrity.
A better way to invest
We serve investors globally through a unique multimanager approach:
We search the world to find proven portfolio teams with specialized
expertise for every strategy we offer, then we apply robust investment
oversight to ensure they continue to meet our uncompromising
standards and serve the best interests of our shareholders.
Results for investors
Our unique approach to asset management enables us to provide
a diverse set of investments backed by some of the world's best
managers, along with strong risk-adjusted returns across asset classes.
![]()
John Hancock Investment Management Distributors, LLC n Member FINRA, SIPC
200 Berkeley Street n Boston, MA 02116-5010 n 800-225-5291 n jhinvestments.com
This report is for the information of the shareholders of John Hancock Income Fund. It is not authorized for distribution to prospective investors unless preceded or accompanied by a prospectus.
| MF876868 | 91A 5/19 7/19 |
ITEM 2. CODE OF ETHICS.
As of the end of the year, May 31, 2019, the registrant has adopted a code of ethics, as defined in Item 2 of Form N-CSR, that applies to its Chief Executive Officer, Chief Financial Officer and Treasurer (respectively, the principal executive officer, the principal financial officer and the principal accounting officer, the “Covered Officers”). A copy of the code of ethics is filed as an exhibit to this Form N-CSR.
ITEM 3. AUDIT COMMITTEE FINANCIAL EXPERT.
Peter S. Burgess is the audit committee financial expert and is “independent”, pursuant to general instructions on Form N-CSR Item 3.
ITEM 4. PRINCIPAL ACCOUNTANT FEES AND SERVICES.
(a) Audit Fees
The aggregate fees billed for professional services rendered by the principal accountant for the audits of the registrant’s annual financial statements or services that are normally provided by the accountant in connection with statutory and regulatory filings or engagements amounted to the following for the fiscal years ended May 31, 2019 and 2018. These fees were billed to the registrant and were approved by the registrant’s audit committee.
| Fund | May 31, 2019 | May 31, 2018 | ||
| John Hancock Income Fund | $ | 69,798 | $ | 71,398 |
(b) Audit-Related Services
Audit-related fees for assurance and related services by the principal accountant are billed to the registrant or to the registrant’s investment adviser (not including any sub-adviser whose role is primarily portfolio management and is subcontracted with or overseen by another investment adviser), and any entity controlling, controlled by, or under common control with the adviser ("control affiliates") that provides ongoing services to the registrant. The nature of the services provided was affiliated service provider internal controls reviews. Additionally, amounts billed to control affiliates were $113,000 and $110,200 for the fiscal years ended May 31, 2019 and 2018, respectively.
| Fund | May 31, 2019 | May 31, 2018 | ||
| John Hancock Income Fund | $ | 571 | $ | 540 |
(c) Tax Fees
The aggregate fees billed for professional services rendered by the principal accountant for tax compliance, tax advice and tax planning (“tax fees”) amounted to the following for the fiscal years ended May 31, 2019 and 2018. The nature of the services comprising the tax fees was the review of the registrant’s tax returns and tax distribution requirements. These fees were billed to the registrant and were approved by the registrant’s audit committee.
| Fund | May 31, 2019 | May 31, 2018 | ||
| John Hancock Income Fund | $ | 3,825 | $ | 3,825 |
(d) All Other Fees
Other fees billed for professional services rendered by the principal accountant to the registrant or to the control affiliates for the fiscal years ended May 31, 2019 and 2018 amounted to the following:
| Fund | May 31, 2019 | May 31, 2018 | ||
| John Hancock Income Fund | $ | 89 | $ | 234 |
(e)(1) Audit Committee Pre-Approval Policies and Procedures:
The trust’s Audit Committee must pre-approve all audit and non-audit services provided by the independent registered public accounting firm (the “Auditor”) relating to the operations or financial reporting of the funds. Prior to the commencement of any audit or non-audit services to a fund, the Audit Committee reviews the services to determine whether they are appropriate and permissible under applicable law.
The trust’s Audit Committee has adopted policies and procedures to, among other purposes, provide a framework for the Committee’s consideration of audit-related and non-audit services by the Auditor. The policies and procedures require that any audit-related and non-audit service provided by the Auditor and any non-audit service provided by the Auditor to a fund service provider that relates directly to the operations and financial reporting of a fund are subject to approval by the Audit Committee before such service is provided. Audit-related services provided by the Auditor that are expected to exceed $25,000 per year/per fund are subject to specific pre-approval by the Audit Committee. Tax services provided by the Auditor that are expected to exceed $30,000 per year/per fund are subject to specific pre-approval by the Audit Committee.
All audit services, as well as the audit-related and non-audit services that are expected to exceed the amounts stated above, must be approved in advance of provision of the service by formal resolution of the Audit Committee. At the regularly scheduled Audit Committee meetings, the Committee reviews a report summarizing the services, including fees, provided by the Auditor.
(e)(2) Services approved pursuant to paragraph (c)(7)(i)(C) of Rule 2-01 of Regulation S-X:
Audit-Related Fees, Tax Fees and All Other Fees:
There were no amounts that were approved by the Audit Committee pursuant to the de minimis exception under Rule 2-01 of Regulation S-X.
(f) According to the registrant’s principal accountant for the fiscal year ended May 31, 2019, the percentage of hours spent on the audit of the registrant's financial statements for the most recent fiscal year that were attributed to work performed by persons who were not full-time, permanent employees of principal accountant was less than 50%.
(g) The aggregate non-audit fees billed by the registrant's principal accountant for non- audit services rendered to the registrant and rendered to the registrant's control affiliates for the fiscal years ended May 31, 2019 and 2018 amounted to the following:
| Trust | May 31, 2019 | May 31, 2018 | ||
| John Hancock Strategic Series | $ | 919,444 | $ | 6,716,119 |
(h) The audit committee of the registrant has considered the non-audit services provided by the registrant’s principal accountant to the control affiliates and has determined that the services that were not pre-approved are compatible with maintaining the principal accountant's independence.
ITEM 5. AUDIT COMMITTEE OF LISTED REGISTRANTS.
The registrant has a separately-designated standing audit committee comprised of independent trustees. The members of the audit committee are as follows:
Peter S. Burgess - Chairman
Charles L. Bardelis
Theron S. Hoffman
ITEM 6. SCHEDULE OF INVESTMENTS.
(a) Not applicable.
(b) Not applicable.
ITEM 7. DISCLOSURE OF PROXY VOTING POLICIES AND PROCEDURES FOR CLOSED-END MANAGEMENT INVESTMENT COMPANIES.
Not applicable.
ITEM 8. PORTFOLIO MANAGERS OF CLOSED-END MANAGEMENT INVESTMENT COMPANIES.
Not applicable.
ITEM 9. PURCHASES OF EQUITY SECURITIES BY CLOSED-END MANAGEMENT INVESTMENT COMPANY AND AFFILIATED PURCHASERS.
Not applicable.
ITEM 10. SUBMISSION OF MATTERS TO A VOTE OF SECURITY HOLDERS.
The registrant has adopted procedures by which shareholders may recommend nominees to the registrant’s Board of Trustees. A copy of the procedures is filed as an exhibit to this Form N-CSR. See attached “John Hancock Funds – Nominating, Governance and Administration Committee Charter”.
ITEM 11. CONTROLS AND PROCEDURES.
(a) Based upon their evaluation of the registrant's disclosure controls and procedures as conducted within 90 days of the filing date of this Form N-CSR, the registrant's principal executive officer and principal financial officer have concluded that those disclosure controls and procedures provide reasonable assurance that the material information required to be disclosed by the registrant on this report is recorded, processed, summarized and reported within the time periods specified in the Securities and Exchange Commission's rules and forms.
(b) There were no changes in the registrant's internal control over financial reporting that occurred during the fourth fiscal quarter of the period covered by this report that have materially affected, or are reasonably likely to materially affect, the registrant's internal control over financial reporting.
ITEM 12. DISCLOSURE OF SECURITIES LENDING ACTIVITIES FOR CLOSED-END MANAGEMENT INVESTMENT COMPANIES.: Not applicable.
ITEM 13. EXHIBITS.
(a)(1) Code of Ethics for Covered Officers is attached.
(a)(2) Separate certifications for the registrant's principal executive officer and principal financial officer, as required by Section 302 of the Sarbanes-Oxley Act of 2002 and Rule 30a-2(a) under the Investment Company Act of 1940, are attached.
(b)(1) Separate certifications for the registrant's principal executive officer and principal financial officer, as required by 18 U.S.C. Section 1350, as adopted pursuant to Section 906 of the Sarbanes-Oxley Act of 2002, and Rule 30a-2(b) under the Investment Company Act of 1940, are attached. The certifications furnished pursuant to this paragraph are not deemed to be "filed" for purposes of Section 18 of the Securities Exchange Act of 1934, or otherwise subject to the liability of that section. Such certifications are not deemed to be incorporated by reference into any filing under the Securities Act of 1933 or the Securities Exchange Act of 1934, except to the extent that the Registrant specifically incorporates them by reference.
(c)(1) Submission of Matters to a Vote of Security Holders is attached. See attached “John Hancock Funds – Nominating, Governance and Administration Committee Charter”.
SIGNATURES
Pursuant to the requirements of the Securities Exchange Act of 1934 and the InvestmentCompany Act of 1940, the registrant has duly caused this report to be signed on its behalf by the undersigned, thereunto duly authorized.
John Hancock Strategic Series
| By: | /s/ Andrew Arnott | |
| Andrew Arnott | ||
| President | ||
| Date: | July 22, 2019 | |
Pursuant to the requirements of the Securities Exchange Act of 1934 and the Investment Company Act of 1940, this report has been signed below by the following persons on behalf of the registrant and in the capacities and on the dates indicated.
| By: | /s/ Andrew Arnott | |
| Andrew Arnott | ||
| President | ||
| Date: | July 22, 2019 | |
| By: | /s/ Charles A. Rizzo | |
| Charles A. Rizzo | ||
| Chief Financial Officer | ||
| Date: | July 22, 2019 | |