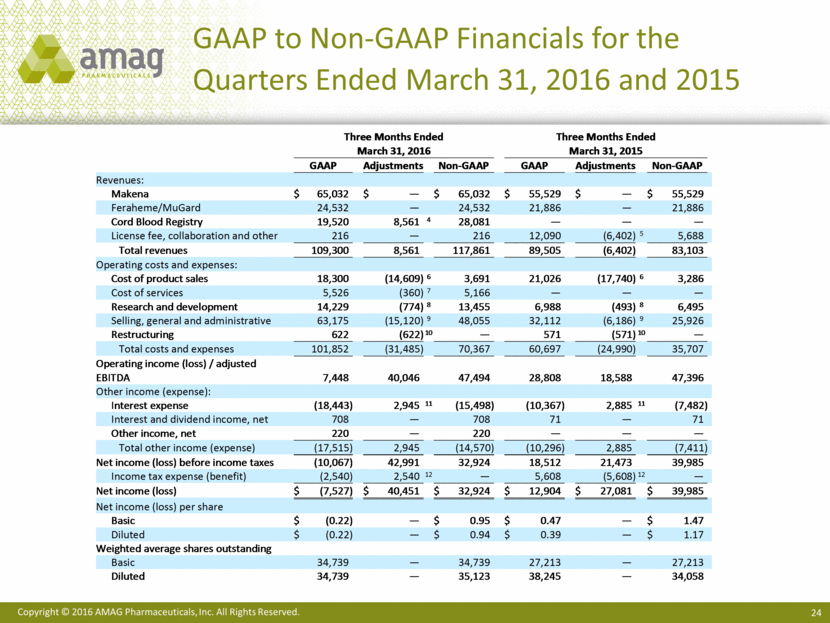
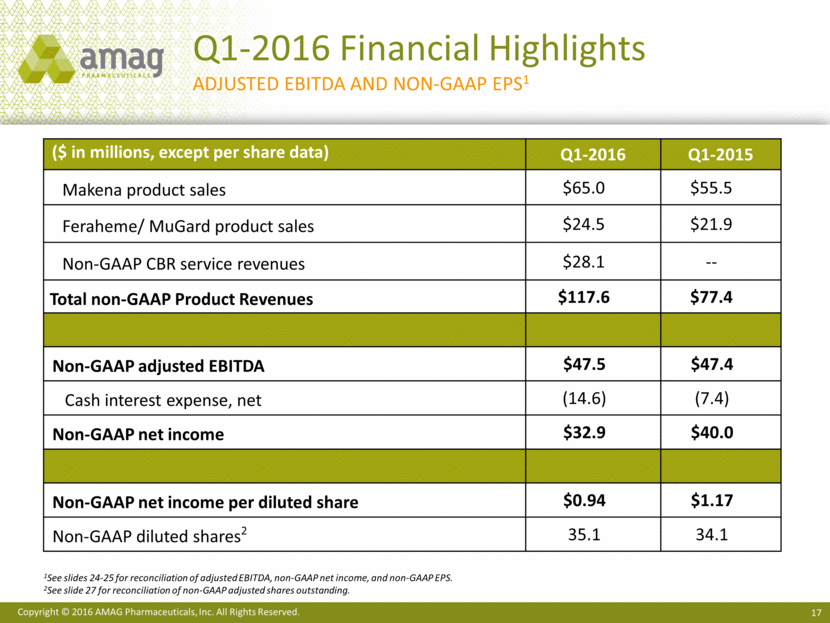
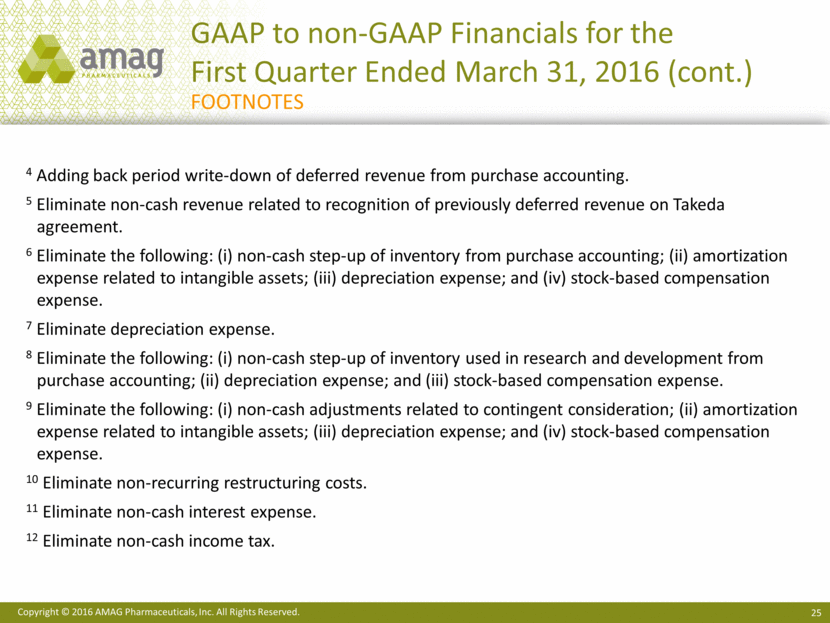
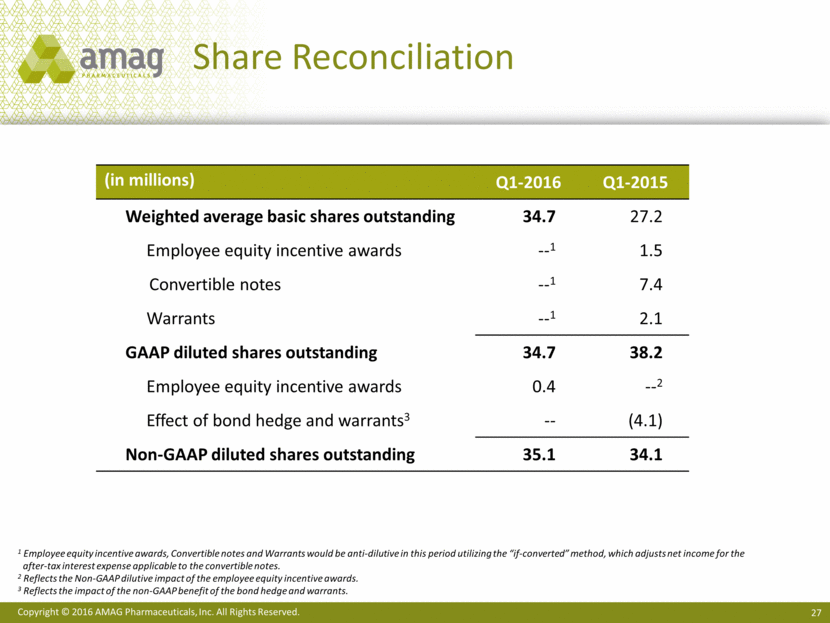
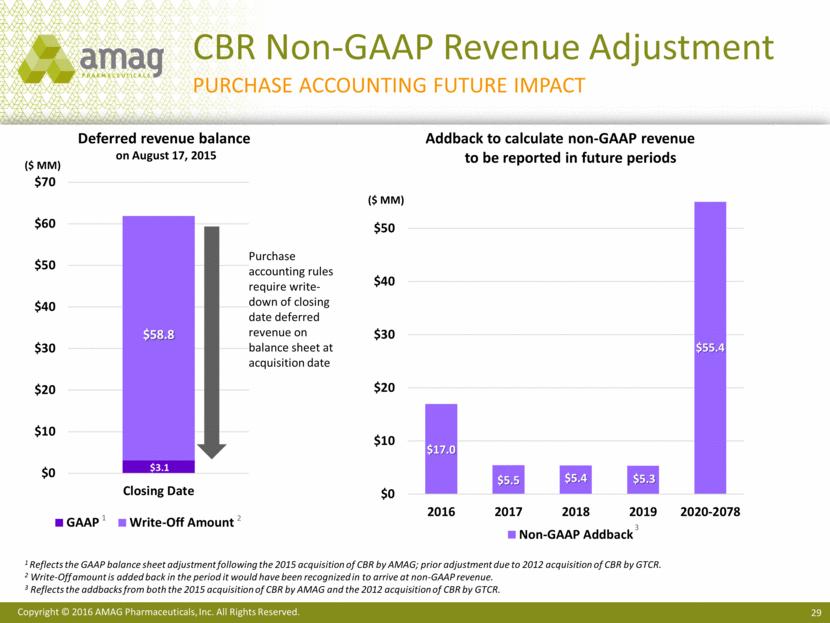
GAAP to Non-GAAP Financials for the Quarters Ended March 31, 2016 and 2015 Three Months Ended Three Months Ended March 31, 2016 March 31, 2015 GAAP Adjustments Non - GAAP GAAP Adjustments Non - GAAP Revenues: Makena $ 65,032 $ — $ 65,032 $ 55,529 $ — $ 55,529 Feraheme/MuGard 24,532 — 24,532 21,886 — 21,886 Cord Blood Registry 19,520 8,561 4 28,081 — — — License fee, collaboration and other 216 — 216 12,090 (6,402) 5 5,688 Total revenues 109,300 8,561 117,861 89,505 (6,402) 83,103 Operating costs and expenses: Cost of product sales 18,300 (14,609) 6 3,691 21,026 (17,740) 6 3,286 Cost of services 5,526 (360) 7 5,166 — — — Research and development 14,229 (774) 8 13,455 6,988 (493) 8 6,495 Selling, general and administrative 63,175 (15,120) 9 48,055 32,112 (6,186) 9 25,926 Restructuring 622 (622) 10 — 571 (571) 10 — Total costs and expenses 101, 852 (31,485) 70,367 60,697 (24,990) 35,707 Operating income (loss) / adjusted EBITDA 7,448 40,046 47,494 28,808 18,588 47,396 Other income (expense): Interest expense (18,443) 2,945 11 (15,498) (10,367) 2,885 11 (7,482) Interest and dividend income, net 708 — 708 71 — 71 Other income, net 220 — 220 — — — Total other income (expense) (17,515) 2,945 (14,570) (10,296) 2,885 (7,411) Net income (loss) before income taxes (10,067) 42,991 32,924 18,512 21,473 39,985 Income tax expense (benefit) (2,540) 2,540 12 — 5,608 (5,608) 12 — Net income (loss) $ (7,527) $ 40,451 $ 32,924 $ 12,904 $ 27,081 $ 39,985 Net income (loss) per share Basic $ (0.22) — $ 0.95 $ 0.47 — $ 1.47 Diluted $ (0.22) — $ 0.94 $ 0.39 — $ 1.17 Weighted average shares outstanding Basic 34,739 — 34,739 27,213 — 27,213 Diluted 34,739 — 35,123 38,245 — 34,058