UNITED STATES
SECURITIES AND EXCHANGE COMMISSION
Washington, D.C. 20549
SCHEDULE 14A
Consent Statement Pursuant to Section 14(a) of the
Securities Exchange Act of 1934
(Amendment No. )
Filed by the Registrant ¨ Filed by a Party other than the Registrant x
Check the appropriate box:
| | |
| ¨ | | Preliminary Consent Statement |
| |
| ¨ | | Confidential, for Use of the Commission Only (as permitted by Rule 14a-6(e)(2)) |
| |
| ¨ | | Definitive Consent Statement |
| |
| ¨ | | Definitive Additional Materials |
| |
| x | | Soliciting Material Pursuant to § 240.14a-12 |
Health Management Associates, Inc.
(Name of Registrant as Specified In Its Charter)
Glenview Capital Partners, L.P.
Glenview Capital Master Fund, Ltd.
Glenview Institutional Partners, L.P.
Glenview Offshore Opportunity Master Fund, Ltd.
Glenview Capital Opportunity Fund, L.P.
Glenview Capital Management, LLC
Larry Robbins
(Name of Person(s) Filing Consent Statement, if other than the Registrant)
Payment of Filing Fee (check the appropriate box):
| | | | |
| |
| x | | No fee required. |
| |
| ¨ | | Fee computed on table below per Exchange Act Rule 14a-6(i)(4) and 0-11. |
| | |
| | 1) | | Title of each class of securities to which transaction applies: |
| | | | |
| | 2) | | Aggregate number of securities to which transaction applies: |
| | | | |
| | 3) | | Per unit price or other underlying value of transaction computed pursuant to Exchange Act Rule 0-11 (set forth the amount on which the filing fee is calculated and state how it was determined): |
| | | | |
| | 4) | | Proposed maximum aggregate value of transaction: |
| | | | |
| | 5) | | Total fee paid: |
| | |
| | | | |
| | | | |
| |
| ¨ | | Fee paid previously with preliminary materials. |
| |
| ¨ | | Check box if any part of the fee is offset as provided by Exchange Act Rule 0-11(a)(2) and identify the filing for which the offsetting fee was paid previously. Identify the previous filing by registration statement number, or the Form or Schedule and the date of its filing. |
| | |
| | 1) | | Amount Previously Paid: |
| | | | |
| | 2) | | Form, Schedule or Registration Statement No.: |
| | | | |
| | 3) | | Filing Party: |
| | | | |
| | 4) | | Date Filed: |
| | | | |
On July 10, 2013, Glenview Capital Partners, L.P., Glenview Capital Master Fund, Ltd., Glenview Institutional Partners, L.P., Glenview Offshore Opportunity Master Fund, Ltd., Glenview Capital Opportunity Fund, L.P., Glenview Capital Management, LLC and Larry Robbins posted updated slides to a slide presentation relating to Health Management Associates, Inc. previously posted on June 25, 2013 and as theretofore updated to www.revitalizehma.com. A copy of the updated slides of the slide presentation is filed herewith as Exhibit 1.
Exhibit 1
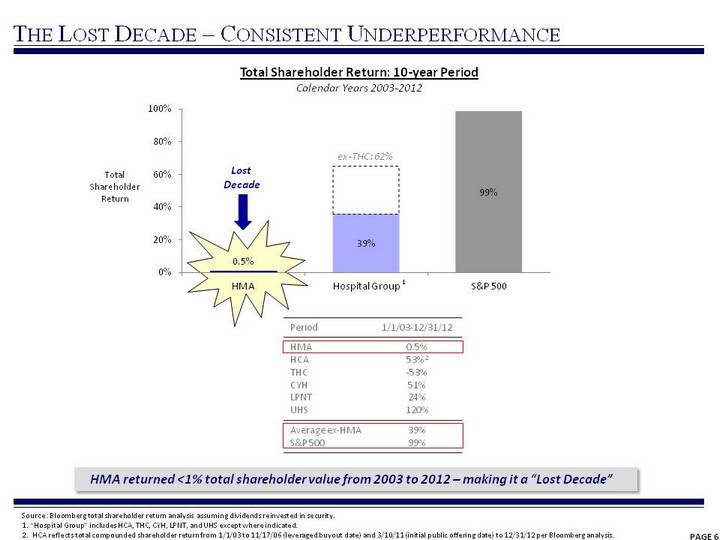
| (CHART) PAGE 6 The Lost Decade - Consistent Underperformance Source: Bloomberg total shareholder return analysis assuming dividends reinvested in security. 1. "Hospital Group" includes HCA, THC, CYH, LPNT, and UHS except where indicated. 2. HCA reflects total compounded shareholder return from 1/1/03 to 11/17/06 (leveraged buyout date) and 3/10/11 (initial public offering date) to 12/31/12 per Bloomberg analysis. HMA returned <1% total shareholder value from 2003 to 2012 - making it a "Lost Decade" Total Shareholder Return: 10-year Period Calendar Years 2003-2012 Period 1/1/03-12/31/12 HMA HCA THC CYH LPNT UHS 0.5% 53%2 -53% 51% 24% 120% Average ex-HMA S&P 500 39% 99% ex-THC: 62% Lost Decade Total Shareholder Return 1 |

| PAGE 7 Total Shareholder Return - Consistent Underperformance HMA's total shareholder return has sharply and consistently lagged other publicly traded hospital companies Total Shareholder Return 3-year period ending 5/6/13 Total Shareholder Return 5-year period ending 5/6/13 Total Shareholder Return 1-year period ending 5/6/13 (CHART) (CHART) (CHART) Delta: HMA vs. Hospital Group Delta: HMA vs. Hospital Group Delta: HMA vs. Hospital Group Source: Bloomberg total shareholder return analysis assuming dividends reinvested in security. 1. "Hospital Group" includes HCA, THC, CYH, LPNT, and UHS, except where noted. 2. 3, 5, and 10-year data excludes HCA. (CHART) Total Shareholder Return 10-year period ending 5/6/13 Delta: HMA vs. Hospital Group Cumulative Cumulative HMA Hospital Group1,2 Underperformance 20% 124% -104% Cumulative Cumulative HMA Hospital Group1,2 Underperformance 26% 66% -40% Cumulative Cumulative HMA Hospital Group1,2 Underperformance 48% 74% -26% Cumulative Cumulative HMA Hospital Group1 Underperformance 58% 78% -20% |

| PAGE 16 The Board's misaligned incentive compensation structure has been tied exclusively to aggregate EBITDA growth - as opposed to any per share metrics Board has misguided view that aggregate measures like EBITDA growth drive share price performance, whereas they place no emphasis on per share measures like EPS and FCF per share 2012 Proxy - "For 2012, the compensation committee used Adjusted EBITDA as the sole performance metric under the annual and long-term incentive compensation programs because it believes that Adjusted EBITDA provides a simple and understandable measure of our recurring profitability and it is highly correlated to our stock price performance" However, despite 86% EBITDA growth - through an acquisition led strategy - HMA's total shareholder return (TSR) suffered (<1% versus the Hospital Group's TSR1 of 39%) Aggregate growth metrics are not appropriate to be the key or sole performance metric for incentive compensation Board's Incentive Compensation Plan is Misaligned It is noteworthy that in HMA's Annual Letters to Shareholders and Partners it makes no mention of this all-important EBITDA metric. Rather, in the one communication directly from the CEO and Chairman each year to shareholders, the only operating data that they speak to is Revenue, Operating Income, EPS, and Cash from Continuing Operations - no mention at all to EBITDA growth - the sole metric used to pay incentive compensation Source: Bloomberg total shareholder return analysis assuming dividends reinvested in security. 1. "Hospital Group" includes HCA, THC, CYH, LPNT, and UHS except where indicated. HCA reflects total compounded shareholder return from 1/1/03 to 11/17/06 (leveraged buyout date) and 3/10/11 (initial public offering date) to 12/31/12 per Bloomberg analysis. |
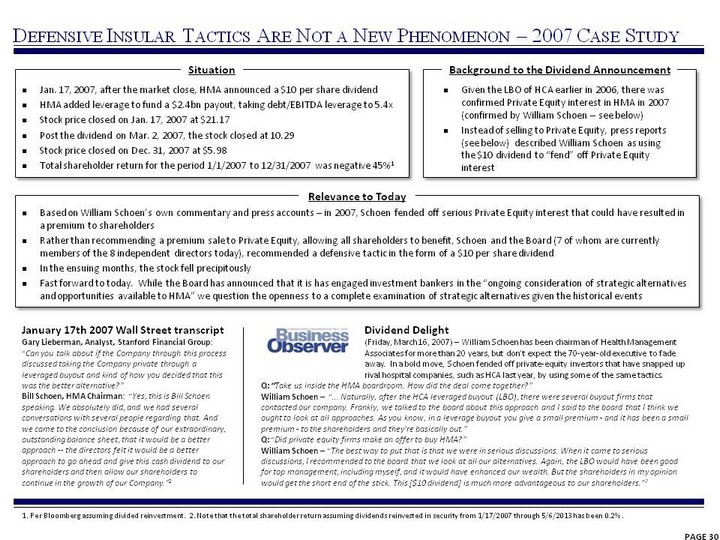
| PAGE 30 Defensive Insular Tactics Are Not a New Phenomenon - 2007 Case Study 1. Per Bloomberg assuming divided reinvestment. 2. Note that the total shareholder return assuming dividends reinvested in security from 1/17/2007 through 5/6/2013 has been 0.2% . Given the LBO of HCA earlier in 2006, there was confirmed Private Equity interest in HMA in 2007 (confirmed by William Schoen - see below) Instead of selling to Private Equity, press reports (see below) described William Schoen as using the $10 dividend to "fend" off Private Equity interest Situation Background to the Dividend Announcement Relevance to Today Jan. 17, 2007, after the market close, HMA announced a $10 per share dividend HMA added leverage to fund a $2.4bn payout, taking debt/EBITDA leverage to 5.4x Stock price closed on Jan. 17, 2007 at $21.17 Post the dividend on Mar. 2, 2007, the stock closed at 10.29 Stock price closed on Dec. 31, 2007 at $5.98 Total shareholder return for the period 1/1/2007 to 12/31/2007 was negative 45%1 Based on William Schoen's own commentary and press accounts - in 2007, Schoen fended off serious Private Equity interest that could have resulted in a premium to shareholders Rather than recommending a premium sale to Private Equity, allowing all shareholders to benefit, Schoen and the Board (7 of whom are currently members of the 8 independent directors today), recommended a defensive tactic in the form of a $10 per share dividend In the ensuing months, the stock fell precipitously Fast forward to today. While the Board has announced that it is has engaged investment bankers in the "ongoing consideration of strategic alternatives and opportunities available to HMA" we question the openness to a complete examination of strategic alternatives given the historical events Q: "Take us inside the HMA boardroom. How did the deal come together?" William Schoen - "... Naturally, after the HCA leveraged buyout (LBO), there were several buyout firms that contacted our company. Frankly, we talked to the board about this approach and I said to the board that I think we ought to look at all approaches. As you know, in a leverage buyout you give a small premium - and it has been a small premium - to the shareholders and they're basically out." Q: "Did private equity firms make an offer to buy HMA?" William Schoen - "The best way to put that is that we were in serious discussions. When it came to serious discussions, I recommended to the board that we look at all our alternatives. Again, the LBO would have been good for top management, including myself, and it would have enhanced our wealth. But the shareholders in my opinion would get the short end of the stick. This [$10 dividend] is much more advantageous to our shareholders."2 Dividend Delight (Friday, March 16, 2007) - William Schoen has been chairman of Health Management Associates for more than 20 years, but don't expect the 70-year-old executive to fade away. In a bold move, Schoen fended off private-equity investors that have snapped up rival hospital companies, such as HCA last year, by using some of the same tactics. January 17th 2007 Wall Street transcript Gary Lieberman, Analyst, Stanford Financial Group: "Can you talk about if the Company through this process discussed taking the Company private through a leveraged buyout and kind of how you decided that this was the better alternative?" Bill Schoen, HMA Chairman: "Yes, this is Bill Schoen speaking. We absolutely did, and we had several conversations with several people regarding that. And we came to the conclusion because of our extraordinary, outstanding balance sheet, that it would be a better approach -- the directors felt it would be a better approach to go ahead and give this cash dividend to our shareholders and then allow our shareholders to continue in the growth of our Company."2 |