UNITED STATES
SECURITIES AND EXCHANGE COMMISSION
Washington, D.C. 20549
SCHEDULE 14A INFORMATION
Proxy Statement Pursuant to Section 14(a) of the
Securities Exchange Act of 1934
Filed by the Registrant x Filed by a Party other than the Registrant ¨
Check the appropriate box:
| ¨ | Preliminary Proxy Statement | |
| ¨ | Confidential, for Use of the Commission Only (as permitted by Rule 14a-6(e)(2)) | |
| ¨ | Definitive Proxy Statement | |
| x | Definitive Additional Materials | |
| ¨ | Soliciting Material Pursuant to § 240.14a-12 |
Health Management Associates, Inc.
(Name of Registrant as Specified in Its Charter)
(Name of Person(s) Filing Proxy Statement, if Other Than the Registrant)
Payment of Filing Fee (Check the appropriate box):
| x | No fee required. | |||
| ¨ | Fee computed on table below per Exchange Act Rules 14a-6(i)(1) and 0-11. | |||
| (1) | Title of each class of securities to which transaction applies:
| |||
| (2) | Aggregate number of securities to which transaction applies:
| |||
| (3) | Per unit price or other underlying value of transaction computed pursuant to Exchange Act Rule 0-11 (set forth the amount on which the filing fee is calculated and state how it was determined):
| |||
| (4) | Proposed maximum aggregate value of transaction:
| |||
| (5) | Total fee paid:
| |||
| ¨ | Fee paid previously with preliminary materials. | |||
| ¨ | Check box if any part of the fee is offset as provided by Exchange Act Rule 0-11(a)(2) and identify the filing for which the offsetting fee was paid previously. Identify the previous filing by registration statement number, or the Form or Schedule and the date of its filing. | |||
| (1) | Amount previously Paid:
| |||
| (2) | Form, Schedule or Registration Statement No.:
| |||
| (3) | Filing Party:
| |||
| (4) | Date Filed:
| |||
 This presentation is provided for the recipient only and cannot be reproduced or shared without Health Management Associates, Inc.’s expressed consent © 2013 Health Management Associates, Inc. Creating Shareholder Value Presentation by the Health Management Board of Directors |
 © 2013 Health Management Associates, Inc.. 2 Forward-looking statements This presentation contains forward-looking statements within the meaning of Section 27A of the Securities Act of 1933, as amended, and Section 21E of the Securities Exchange Act of 1934, as amended. Forward-looking statements are subject to risks, uncertainties and assumptions and are identified by words such as “expects,” “estimates,” “projects,” “anticipates,” “believes,” “intends,” “plans,” “may,” “continues,” “should,” “could” and other similar words. All statements addressing operating performance, events or developments that Health Management Associates, Inc. (“Health Management”) expects or anticipates will occur in the future, including but not limited to incurrence of indebtedness, projections of revenue, income or loss, capital expenditures, earnings per share, debt structure, bad debt expense, capital structure, repayment of indebtedness, the amount and timing of funds under the meaningful use measurement standard of various HCIT incentive programs, other financial items and operating statistics, statements regarding the plans and objectives of management for future operations, innovations, or market service development, statements regarding acquisitions, joint ventures, divestitures and other proposed or contemplated transactions (including but not limited to statements regarding the potential for future acquisitions and perceived benefits of acquisitions), statements of future economic performance, statements regarding legal proceedings and other loss contingencies, statements regarding market risk exposures, statements regarding the effects and/or interpretations of recently enacted or future health care laws and regulations, statements of the assumptions underlying or relating to any of the foregoing statements, and other statements that are other than statements of historical fact, are considered to be “forward-looking statements.” Because they are forward-looking, such statements should be evaluated in light of important risk factors and uncertainties. These risk factors and uncertainties are more fully described in Health Management’s most recent Annual Report on Form 10-K, including under the heading entitled “Risk Factors.” Should one or more of these risks or uncertainties materialize, or should any of Health Management’s underlying assumptions prove incorrect, actual results could vary materially from those currently anticipated. In addition, undue reliance should not be placed on Health Management’s forward-looking statements. Except as required by law, Health Management disclaims any obligation to update its risk factors or to publicly announce updates to the forward- looking statements contained herein to reflect new information, future events or other developments. |
 © 2013 Health Management Associates, Inc.. 3 Additional information Health Management and its directors and executive officers are deemed to be participants in the solicitation of consent revocations from Health Management stockholders in connection with the consent solicitation conducted by Glenview Capital Partners, L.P. and certain of its affiliates. Health Management filed, on July 19, 2013, a definitive consent revocation statement with the SEC in response to the consent solicitation conducted by Glenview Capital Partners, L.P. and certain of its affiliates. STOCKHOLDERS ARE URGED TO READ THE CONSENT REVOCATION STATEMENT AND ACCOMPANYING WHITE CONSENT REVOCATION CARD (INCLUDING ANY AMENDMENTS OR SUPPLEMENTS THERETO) AND ANY OTHER RELEVANT DOCUMENTS THAT HEALTH MANAGEMENT WILL FILE WITH THE SEC WHEN THEY BECOME AVAILABLE BECAUSE THEY WILL CONTAIN IMPORTANT INFORMATION. Information about Health Management executive officers and directors, and their direct or indirect interests, by security holdings or otherwise, is set forth (i) in the definitive consent revocation statement, (ii) in the proxy statement for Health Management’s 2013 Annual Meeting of Stockholders, which was filed with the SEC on April 4, 2013, and (iii) in other materials to be filed with the SEC. Investors and security holders may obtain free copies of these documents (when they are available) and other documents filed with the SEC at the SEC’s web site at www.sec.gov. In addition, the documents filed by Health Management with the SEC may be obtained free of charge by contacting Health Management at Health Management, Attn: Investor Relations, (239) 598-3131. Health Management’s filings with the SEC are also available on its website at ir.hma.com. |
 © 2013 Health Management Associates, Inc.. 4 I. Business Performance Overview II. Health Management Board and Governance Drive Value III. Strong Operational Performance and Shareholder Returns IV. Strategic Positioning for Success V. Summary Agenda |
 © 2013 Health Management Associates, Inc.. 5 I. Business Performance Overview * * * * * * * * * * * * * * |
 © 2013 Health Management Associates, Inc.. 6 Health Management has achieved consistent growth and solid business results despite a challenging and evolving healthcare environment » Sustained revenue and adjusted EBITDA growth, and stock performance outpacing major indices through the past several years, including the financial downturn » Outstanding cost structure, operating margins and return on invested capital » Comprehensive and aggressive response to regulatory issues » Board has consistently delivered value creation initiatives, including special dividend, accretive acquisitions and strategic partnerships » Together Board and management team continue to drive attractive growth/business development opportunities, operational improvements and the highest-quality medical care The Health Management Board is currently engaged in a review of strategic alternatives and opportunities that should be completed without distraction Overview |
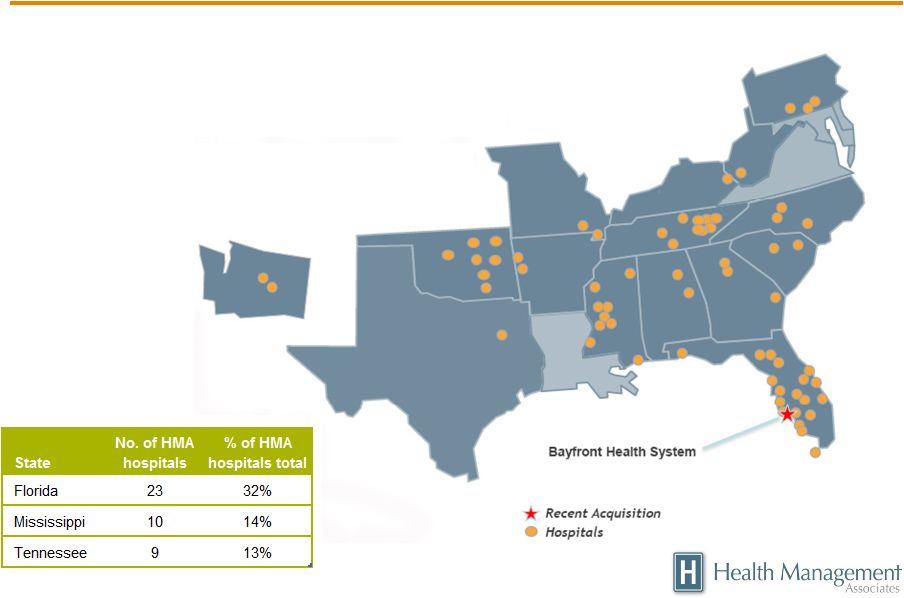 © 2013 Health Management Associates, Inc.. 7 Leading hospital operator with record of growth and value creation • A focus on non-urban markets • 71 hospitals in 15 states • Located primarily in the southeastern U.S. • Strong presence in areas with favorable demographic trends |
 © 2013 Health Management Associates, Inc.. 8 Long-term history of performance and growth Net Revenue (1) (millions) 1 Net Revenue before provision for doubtful accounts 2 See Appendix SOURCE: Company Reports Adjusted EBITDA (2) (millions) |
 © 2013 Health Management Associates, Inc.. 9 • Demonstrated record of strategic actions to create value: » Creating efficiencies through scale across 71 hospital locations » Successful turnarounds of acquired hospital operations » Industry-leading cost structure and financial performance » High quality of care » Greater returns than S&P 500 and S&P Health Care indices since December 2007 • Capital allocation strategy has also supported value creation goals: » Completed accretive acquisitions » Entered strategic partnerships » Returned $10 per share via $2.4 billion special dividend in March 2007 Focused on shareholder value creation |
 © 2013 Health Management Associates, Inc.. 10 History of dividend and share repurchases in millions, 1999-2007 SOURCE: Company Reports • Over several years (1999-2007), Health Management repurchased over one-half billion in stock • In that same period, the company paid $2.6 billion in dividends, including $2.4 billion in 2007 Share Repurchase Dividend $ 559.2 $ 2,575.7 |
 © 2013 Health Management Associates, Inc.. 11 II. Health Management Board and Governance Drive Shareholder Value |
 © 2013 Health Management Associates, Inc.. 12 Kent P. Dauten – Managing Director, Keystone Capital Investor with transactional, capital markets and financial experience Pascal J. Goldschmidt, MD – Senior VP for Medical Affairs and Dean of the University of Miami School of Medicine Distinguished physician who serves as head of a major healthcare system and a premier medical school Donald E. Kiernan – Former Chief Financial Officer, SBC Communications Long-time senior-level financial and accounting executive with diverse expertise Robert A. Knox – Senior Managing Director, Cornerstone Equity Investors Investor with extensive business leadership and investment/financial experience Vicki A. O’Meara – Executive Vice President and President of Services & Solutions, Pitney Bowes Business leader and attorney, experienced as corporate general counsel and in senior government positions William J. Schoen – Chairman of the Board of Directors, Health Management Associates One of Health Management’s founders and a former CEO with extensive experience in healthcare and the industrial sector William C. Steere Jr. – Chairman Emeritus, Pfizer Former chairman and CEO of one of the healthcare industry’s leading companies Randolph W. Westerfield, Ph.D. – Dean Emeritus, Professor at the University of Southern California Marshall School of Business Distinguished long-time dean and faculty member at prestigious business schools Board of Directors with history of value creation Directors were re-elected on May 21 with near-unanimous support, excluding Glenview Health Management’s Board is comprised of individuals who combine relevant business and healthcare experience, with exceptional judgment, to create long-term value |
 © 2013 Health Management Associates, Inc.. 13 • All directors independent (except CEO) • Separate chairman and CEO, and lead director • Annual election of all directors; No staggered Board - promoting consistency and longevity; protecting shareholders • Shareholders have right to call special meetings, act by written consent • ISS supported management’s “Say on Pay” resolution, provided strongest support rating of “Low Concern” with respect to pay-for-performance and compensation risk Health Management’s corporate governance reflects best practices that promote shareholder interests • Health Management given a QuickScore Governance Rating of 1 by ISS, reflecting lowest risk ratings on scale from 1 to 10. Also earned Compensation Pillar QuickScore of 1, lowest risk rating • CEO pay was 0.88x median compensation, per ISS peer group analysis |
 © 2013 Health Management Associates, Inc.. 14 Health Management continues to be led by dynamic, experienced and accomplished executives at all levels of the organization » Corporate-level executives with long and successful track records in the health care industry, leading all of Health Management’s critical functions » Group Presidents with management teams oversee Health Management’s hospital operations in its operating regions » Division CEOs and hospital CEOs responsible for the efficient operations of Health Management’s 71 hospitals and, above all, ensuring quality of care Executive leadership Group leadership Hospital leadership Deep bench, long-tenured local market leadership Health Management executives are successfully navigating the company through an evolving and challenging healthcare environment |
 © 2013 Health Management Associates, Inc.. 15 III. Strong Operational Performance and Shareholder Returns * * * * * * * * * * * * |
 © 2013 Health Management Associates, Inc.. 16 Recent performance reflects growth story 2009 SOURCE: Annual Reports Continuing Operations CAGR³ (%) 7,469 6,216 678 Total revenue¹ ($ Millions) Revenues per AA ($) Operating costs² per AA ($) Adjusted EBITDA³ ($ Millions) 8,485 7,095 963 4,050 5,878 1 Net revenue, less the provision for doubtful accounts 2 Operating costs include salaries and benefits, supplies, rent, and other operating cost line items 3 Compound annual growth rate calculated using 2009 – 2012 2012 Revenues have been growing… Margins have been preserved… Adjusted EBITDA has increased… |
 © 2013 Health Management Associates, Inc.. 17 Strengthening financial profile following $2.4 billion special dividend to shareholders Leverage (Debt/EBITDA) Interest Coverage (EBITDA/Interest Expense) SOURCE: Company Reports *Note: Health Management returned $2.4 billion to shareholders via a $10 per share one-time special cash dividend on March 1, 2007 |
 © 2013 Health Management Associates, Inc.. 18 Health Management continues to lead in operating margin vs. peers EBITDA margin, 2009 - 2012 2012 2011 2010 2009 Percent SOURCE: Quarterly Reports on Form 10-Q and/or Annual Reports on Form 10-K *VHS based on FYE 6/30 Peer group excludes HCA given difference in asset and market type HMA CFA Level II curriculum, 2013 “EV/EBITDA is a valuation indicator for the overall company rather than solely its common stock.” |
 © 2013 Health Management Associates, Inc.. 19 Health Management continues to lead in returns on invested capital vs. peers SOURCE: Compustat; ROIC Methodology adopted by Valuation; Independent analyses Peer group excludes HCA given difference in asset and market type *Jiang & Koller (2007). How to Choose Between Growth and ROIC. McKinsey on Finance Anthology 2011 ROIC (including goodwill) 2012 2011 2010 2009 Percent, without capitalized operating leases HMA “Value-minded executives know that although growth is good, returns on invested capital (ROIC) can be an equally – or still more – important indicator of value creation.” McKinsey on Finance Anthology 2011* |
 © 2013 Health Management Associates, Inc.. 20 Health Management maintains efficient cost structure vs. peers 2012 SOURCE: Quarterly Reports on Form 10-Q and/or Annual Reports on Form 10-K Peer group excludes HCA given difference in asset and market type Average cost per Adjusted Admission (AA)¹ THC CYH HMA VHS LPNT $ 6,305 $ 7,095 $ 10,479 $ 9,964 $ 8,211 1 Cost per AA without a case mix adjustment or local market differences $ 8,411 Avg Average Peer average cost per AA is 19% higher than Health Management |
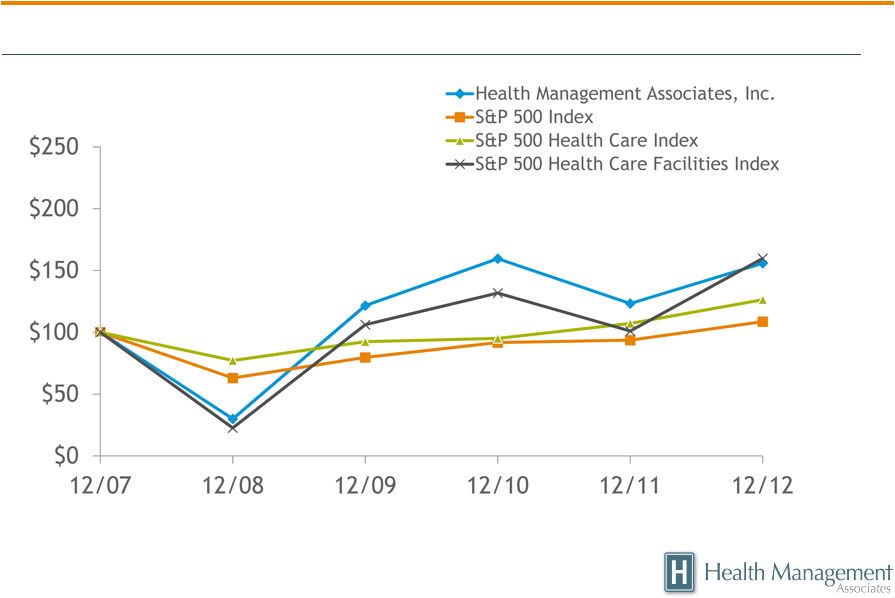 © 2013 Health Management Associates, Inc.. 21 Total return to shareholders based on stock price (Includes reinvestment of dividends) Comparison of Cumulative Five Year Total Return SOURCE: Company reports; prepared by Capital IQ (S&P) |
 © 2013 Health Management Associates, Inc.. 22 IV. Strategic Positioning for Success * * * * * * * * * * * * * * |
 © 2013 Health Management Associates, Inc.. 23 • Strong presence in growth markets • Net beneficiary of healthcare reform • Ongoing strategic franchise development via successful acquisitions • Expanding clinical and non-acute affiliations position for population health management • Quality clinical programs across portfolio • Forward-looking plan for success Health Management is well-positioned for continued success in evolving market |
 © 2013 Health Management Associates, Inc.. 24 Strong portfolio presence in growth areas Note: Includes trends like inpatient to outpatient shifts, epidemiological trends, public policy, etc. SOURCE: Independent Analysis - proprietary modeling/methodologies % CAGR, 2011-2016 Inpatient admissions, growth by county Health Management hospitals by area growth prospects 1.6+ 0.8 - 1.6 0 - 0.8 -0.8 - 0 -1.4 - -0.8 Less than -1.4 12 22 17 15 2 2 |
 © 2013 Health Management Associates, Inc.. 25 Net beneficiary of healthcare reform, based on early view 2016 207 2015 -125 189 -169 -77 175 2014 Government reimbursement Coverage Shifts Total Impact in Bold Annual impact on operating EBITDA –Base Case 1 $ Millions NOT CUMULATIVE 98 64 38 Impact on EBITDA 1 No expansion in FL, TX, MS, GA, AL. Full expansion in all other states SOURCE: Independent analysis - proprietary modeling/methodologies Disclaimer: projections are not meant to be a definitive, but a future viewpoint of possible financial impact Range of impact based on ACA as originally written - does not take into account recent delays of implementation and state decisions |
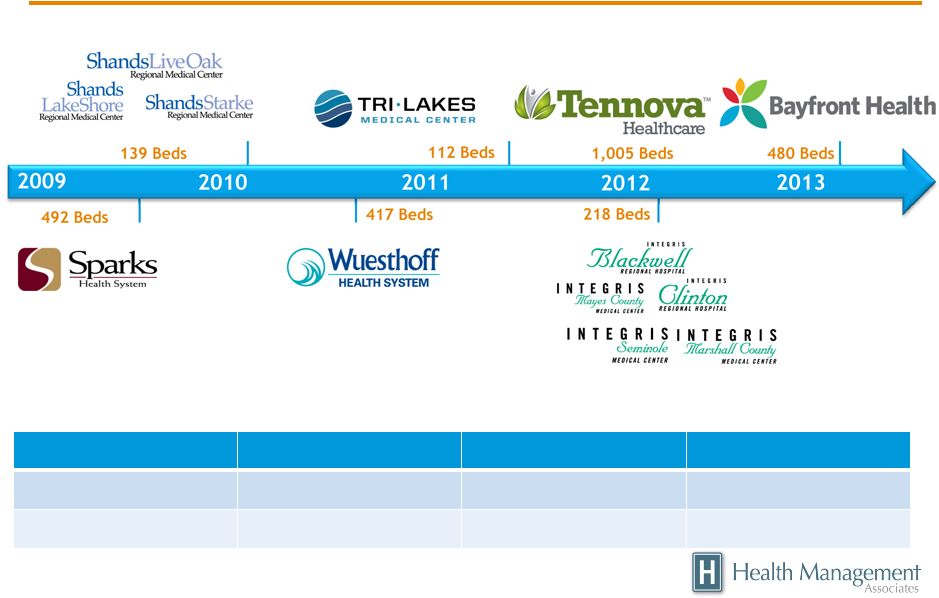 © 2013 Health Management Associates, Inc.. 26 Proven track record of successful partnerships 2009 (in millions) 2010 2011 2012 Net Revenue* $ 372 $ 845 $ 1,461 EBITDA $ 41 $ 75 $ 208 *Net Revenue before provision for doubtful accounts SOURCE: Company Reports Growing Revenue & EBITDA Contribution |
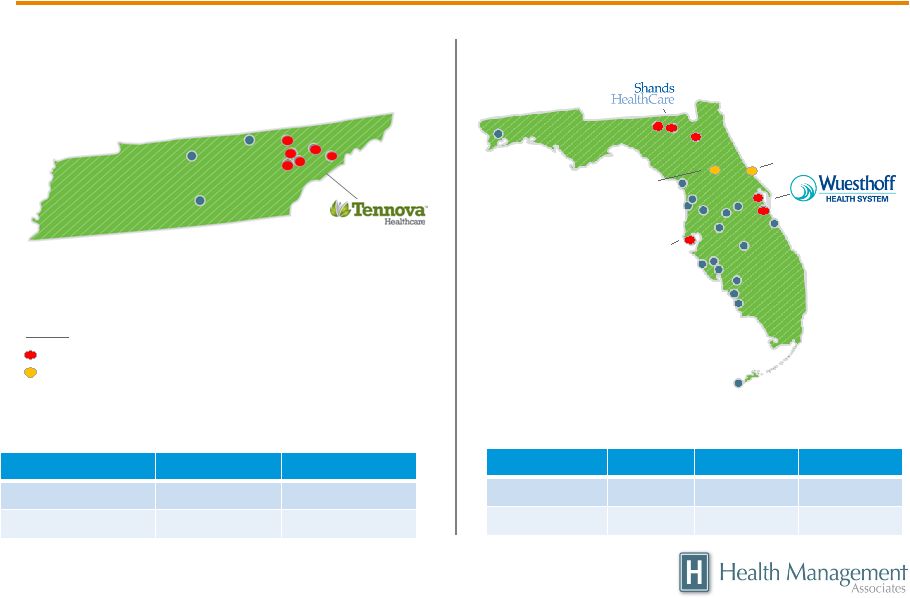 © 2013 Health Management Associates, Inc.. 27 Bert Fish Munroe Bayfront In exclusive negotiations Recent Acquisitions Legend (in millions) 2011 2012 Net Revenue* $ 153 $ 657 EBITDA $ 5 $ 96 *Net Revenue before provision for doubtful accounts SOURCE: Company Reports Tennova Revenue & EBITDA Revenue Contribution (in millions) 2010 2011 2012 Net Revenue* $ 118 $ 423 $ 421 EBITDA $ .4 $ 31 $ 53 Wuesthoff & Shands Revenue & EBITDA Contribution Extending Tennessee franchise Extending Florida franchise Enhancing shareholder value through strategic franchise development |
 © 2013 Health Management Associates, Inc.. 28 Extensive clinical affiliations and non-acute relationships strengthen population management Integrated Healthcare Organization • Clinical Affiliation • Ambulatory Care • Physician EHR and Practice Management • Health Management Home Health Network • Alternative Provider Organization |
 © 2013 Health Management Associates, Inc.. 29 • Completed transaction to partner with the 480- bed Bayfront Health System in St. Petersburg, FL • New Payor Partnership with Florida Blue - Accountable Provider Organization • Signed LOI to Lease 421-bed Munroe Regional in Ocala, FL • Announced Management Services Division • Selected to begin exclusive negotiations toward an agreement to operate 112-bed Bert Fish Medical Center in New Smyrna Beach, FL April 2013 May 2013 June 2013 Strong pipeline momentum |
 © 2013 Health Management Associates, Inc.. 30 • 97%* of our hospitals/health systems are accredited by The Joint Commission and have received Gold Seal of Approval • A majority of our hospitals/health systems are Top Performers on Key Quality Measures by The Joint Commission • 27% of our hospitals/health systems have received Chest Pain Center Accreditation by the Society of Cardiovascular Patient Care or AHCA (Florida) 97% 64% 27% 25% Health Management is a top performer among select investor-owned organizations in complication rates and core measures Continually improving quality of care * 1 hospital applying as replacement facility; 1 hospital recently acquired with no previous TJC accreditation • 25% of our hospitals/health systems are certified as Comprehensive/Primary Stroke Centers by The Joint Commission, AHCA (Florida), or OSDH (Oklahoma) |
 © 2013 Health Management Associates, Inc.. 31 The Health Management Board has a forward-looking plan for success The Board’s plan responds to the dynamics of today’s healthcare marketplace: » Center-led capabilities: Improving home office capability to take advantage of scale and improve overall efficiencies and performance » Differentiated product/service offerings: Developing products and services that align us with payors and providers to improve our competitive advantage » Superior Clinical Care: Working closely with our physicians and clinicians to develop our clinical operations to improve efficiencies and further advance quality of care » Market Based Competition: Creating margin growth by developing next generation services/capabilities that offer direct value to payors and patients » Non-Core or Inorganic Growth: Creating and sustaining competitive advantage through vertical integration to increase service offerings and broaden clinical capabilities The Glenview ‘plan’ is unrealistic in today’s environment and would be detrimental to shareholder value |
 © 2013 Health Management Associates, Inc.. 32 • Health Management is working steadily to address ongoing regulatory investigations and related litigation: » Represented by world-class legal counsel » Cooperating fully with investigations, supported by Board and management » Vigorously defending company practices and conduct » Not allowing investigations to become a distraction that compromises quality of care » Investigations are similar to what many other hospital companies have faced. Health Management is one of the few publicly-traded hospital companies that has never been subject to a corporate integrity agreement Government investigations being diligently addressed |
 © 2013 Health Management Associates, Inc.. 33 V. Summary * * * * * * * * * * * * * * |
 © 2013 Health Management Associates, Inc.. 34 Health Management has achieved consistent growth and solid business results despite a challenging and evolving healthcare environment » Sustained revenue and adjusted EBITDA growth, and stock performance outpacing major indices through the past several years, including during the financial downturn » Outstanding cost structure, operating margins and return on invested capital » Comprehensive and aggressive response to regulatory issues » Board has consistently delivered value creation initiatives, including share repurchases, special dividends, accretive acquisitions and strategic partnerships » Together Board and management team continue to drive attractive growth/business development opportunities, operational improvements and the highest-quality medical care Summary |
 © 2013 Health Management Associates, Inc.. 35 The Health Management Board is comprised of the right group of business leaders at a challenging time: » Board re-elected on May 21 with average approval of 85%, reflecting near unanimous support (given Glenview withheld votes from all Directors) » Directors posses exceptional experience in healthcare, finance, legal and other areas, as well as deep understanding of Health Management’s opportunities and challenges » Have presided over strong operational results, quality of care and stock performance The Board’s record does not support the wholesale changes Glenview has asked shareholders to make. Also consider: » Neither Glenview nor its nominees has put forth any real plan for the future » Virtually every suggestion made by Glenview is being considered and/or has been implemented » Glenview proposes handing over management to a restructuring firm that is unfamiliar with the company The Health Management Board is engaged in a review of strategic alternatives and opportunities that should be completed without distraction – We urge you to reject the Glenview proposals Health Management Board is providing strong leadership during a challenging time |
 © 2013 Health Management Associates, Inc.. 36 Appendix * * * * * * * * * * * * * * |
 © 2013 Health Management Associates, Inc.. 37 The Health Management Board William J. Schoen, Chairman Mr. Schoen has more than 25 years of experience as Health Management’s President, Chief Executive Officer and Chairman. This experience provides Mr. Schoen a deep and unique understanding of Health Management and the health care industry. Additionally, Mr. Schoen has broad business experience, having served as chief executive officer or chairman with companies in the consumer products and banking industries and utilizes this broad experience in reviewing and advising Health Management with respect to its business plans, budgets, business strategies, commercial and investment banking relationships, and potential capital markets transactions. Kent P. Dauten, Audit Committee Chair Mr. Dauten has over 30 years of experience in the venture capital, private equity and investment advisory fields. Mr. Dauten has served on Health Management’s board of directors for approximately 30 years, which affords him valuable insight and perspective on its operations. Mr. Dauten has extensive experience leading organizations, dealing with capital market transactions and acquisition matters and is experienced in overall financial risk identification, assessment and management. Pascal J. Goldschmidt, M.D. Dr. Goldschmidt has extensive experience in the health care industry, including experience as the chief executive officer of a health care and hospital system and dean of a premier medical school and managing physicians and other health care professionals. At a time of substantial and rapid change, Dr. Goldschmidt brings a comprehensive and deep understanding of the challenges and opportunities in the industry to Health Management’s board of directors. |
 © 2013 Health Management Associates, Inc.. 38 The Health Management Board, Continued Donald E. Kiernan, Corporate Governance and Nominating Committee Chair Mr. Kiernan has 20 years of experience as a Certified Public Accountant in private practice, including management positions with an international public accounting firm, and served in senior leadership capacities, including Treasurer and Chief Financial Officer, for more than a decade with a Fortune 50 company. He brings particular expertise in financial management, accounting, information technology and corporate governance to Health Management’s board of directors. Mr. Kiernan has also been a director of eight public companies over the past 20 years, with service on audit, finance, compensation and governance committees, giving him important experience and perspective that is valuable to Health Management’s board of directors. Robert A. Knox, Lead Director, Compensation Committee Chair Mr. Knox has significant senior leadership experience and expertise in the investment and financial services industries. Mr. Knox has broad experience leading significant organizations and has more than 25 years of experience on Health Management’s board of directors, as well as extensive leadership positions on other boards. This broad experience provides him with critical insight and perspective on Health Management’s operations. Vicki A. O’Meara Ms. O’Meara has substantial legal, operational and governmental experience, as well as expertise in corporate governance and strategic planning. Ms. O’Meara’s operational experience includes responsibility for both the profitability of a large operating division and the human resources function of a large public company. Her experience in senior governmental leadership positions provides her with a perspective on legislative process and issues that is valuable to Health Management’s board of directors given the central role of health care reform in national politics. |
 © 2013 Health Management Associates, Inc.. 39 The Health Management Board, Continued William C. Steere, Jr. As former Chairman and Chief Executive Officer of Pfizer Inc., a Fortune 50 company, Mr. Steere is widely regarded as one of the most distinguished leaders of the pharmaceutical industry, bringing substantial expertise leading a large public company, as well as deep and comprehensive knowledge of, and experience with, the pharmaceutical industry, to Health Management’s board of directors. In addition, from his board positions with medical institutions such as the New York University Medical Center and Memorial Sloan-Kettering Cancer Center, Mr. Steere has in-depth knowledge of the health care industry. Randolph W. Westerfield, Ph.D. Dr. Westerfield has extensive financial expertise and broad experience leading organizations, having served in senior leadership capacities and on the finance faculties of two of the country’s leading business schools for more than 40 years. Dr. Westerfield’s previous service as a member of the audit committee of a registered investment company and as a member of the audit committee and the chair of the compensation committee of another public company gives him important experience and perspective that is valuable to Health Management’s board of directors. |
 © 2013 Health Management Associates, Inc.. 40 Health Management existing Long Term Debt Bank Borrowings Rate Amount (as of 6/30/2013) Revolving Credit Facility due 2016 Libor + 2.50%* $ 150,000,000 Term Loan A due 2016 Libor + 2.50%* 633,369,000 Term Loan B due 2018 Libor + 2.75%* (Floor .75%) 1,357,805,000 Senior Notes due 2020 7.375% 875,000,000 Senior Notes due 2016 6.125% 400,000,000 Other Various 280,852,000 Long Term Debt $ 3,697,026,000 Pro Forma Weighted Average Interest Rate 4.47% *Fluctuates with Health Management’s leverage ratio |
 © 2013 Health Management Associates, Inc.. 41 Capital allocation - alternative strategy evaluative impact (In 000’s) Average Variable Debt Outstanding 2012: $ 2,069,813 Average Fixed Rate Spread: 0.981% Incremental Interest Expense: $ 20,306 Per Share: $ 0.05 |
 © 2013 Health Management Associates, Inc.. 42 Adjusted EBITDA (1) Adjusted EBITDA is defined as consolidated net income before discontinued operations, net gains (losses) on sales of assets, net interest and other income, interest expense, income taxes and depreciation and amortization. Adjusted EBITDA margin is defined as Adjusted EBITDA divided by net revenue. Adjusted EBITDA is not a measure determined in accordance with generally accepted accounting principles in the United States, commonly known as GAAP. Nevertheless, Health Management believes that providing non-GAAP information such as Adjusted EBITDA is important for investors and the readers of Health Management’s consolidated financial statements as it is commonly used as an analytical indicator within the healthcare industry and Health Management’s debt facilities contain covenants that use Adjusted EBITDA in their calculations. Because Adjusted EBITDA is a non-GAAP measure and is thus susceptible to varying calculations, Adjusted EBITDA, as presented, may not be directly comparable to other similarly titled measures used by other companies. 12/31/2012 12/31/2011 12/31/2010 12/31/2009 12/31/2008 Consolidated net income 191,242 $ 203,925 $ 172,248 $ 163,941 $ 184,157 $ Adjustments: Loss from discontinued operations, net of income taxes 7,617 2,409 13,526 (2,959) 26,358 Provision for income taxes 102,622 106,071 101,049 82,721 118,580 (Gains) Losses on sales of assets, net 4,790 1,325 (711) (1,244) (169,614) Interest and other income, net (4,552) (3,096) (8,086) (3,752) (416) Interest expense 312,547 222,747 211,673 217,941 245,405 Gains on early extinguishment of debt, net (16,202) (15,194) Write-offs of deferred debt issuance costs - 24,595 - 444 1,497 Depreciation and amortization 348,941 267,900 241,873 237,534 232,301 Adjusted EBITDA 963,207 825,876 731,572 678,424 623,074 Health Management Associates Adjusted EBITDA (1) 2008 through 2012 |