
4Q19 Earnings Presentation MARCH 16, 2020
Safe Harbor 2 The information contained in this presentation and discussion contains “forward-looking statements” (within the meaning of the Private Securities Litigation Reform Act of 1995) regarding the future performance of the Company, including statements about the effects on the Company from (i) restructuring initiatives, (ii) the potential sale of the GEFCO business, (iii) increases in international demand, and (iv) product demand in North America. These forward-looking statements reflect management’s expectations and are based upon currently available information, and the Company undertakes no obligation to update or revise such statements. These statements are not guarantees of performance and are inherently subject to risks and uncertainties, many of which cannot be predicted or anticipated. Future events and actual results, financial or otherwise, could differ materially from those expressed in or implied by the forward-looking statements. Important factors that could cause future events or actual results to differ materially include: general uncertainty in the economy, oil, gas and liquid asphalt prices, rising steel prices, decreased funding for highway projects, the relative strength/weakness of the dollar to foreign currencies, production capacity, general business conditions in the industry, demand for the Company’s products, seasonality and cyclicality in operating results, seasonality of sales volumes or lower than expected sales volumes, lower than expected margins on custom equipment orders, competitive activity, tax rates and the impact of future legislation thereon, and those other factors listed from time to time in the Company’s reports filed with the Securities and Exchange Commission, including but not limited to the Company’s annual report on Form 10-K for the year ended December 31, 2018.

Astec overview & 4Q19 Highlights Barry Ruffalo | President & CEO
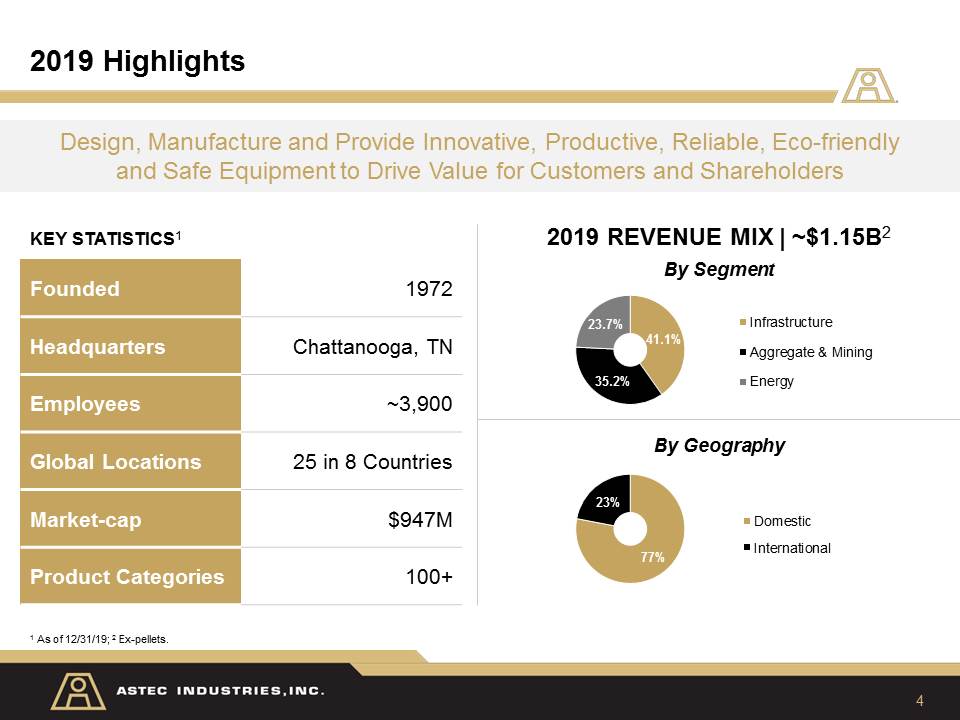
4 2019 Highlights KEY STATISTICS1 Founded 1972 Headquarters Chattanooga, TN Employees ~3,900 Global Locations 25 in 8 Countries Market-cap $947M Product Categories 100+ Design, Manufacture and Provide Innovative, Productive, Reliable, Eco-friendlyand Safe Equipment to Drive Value for Customers and Shareholders By Segment By Geography 2019 REVENUE MIX | ~$1.15B2 1 As of 12/31/19; 2 Ex-pellets.

5 4Q19 Financial Performance Note: All comparisons are YoY, unless otherwise stated. 1 See Appendix for GAAP to Non-GAAP reconciliation table. 2 Calculated by dividing LTM Adjusted FCF by Adjusted Net Income. INCOME STATEMENT BALANCE SHEET AND CASH FLOW Revenues decreased 10.7% to $283.2MAdj. Gross Profit1 decreased 280 bps to 21.2%Adj. EBITDA1 decreased 51.0% to $13.7MAdj. EBITDA1 margin decreased 390 bps to 4.9%Adj. EPS1 decreased 41.0% to $0.36 Adj. FCF of $24.8MAdj. FCF Conversion2 of 300%Cash position $48.9MDividends of $2.5M or $0.11 per share
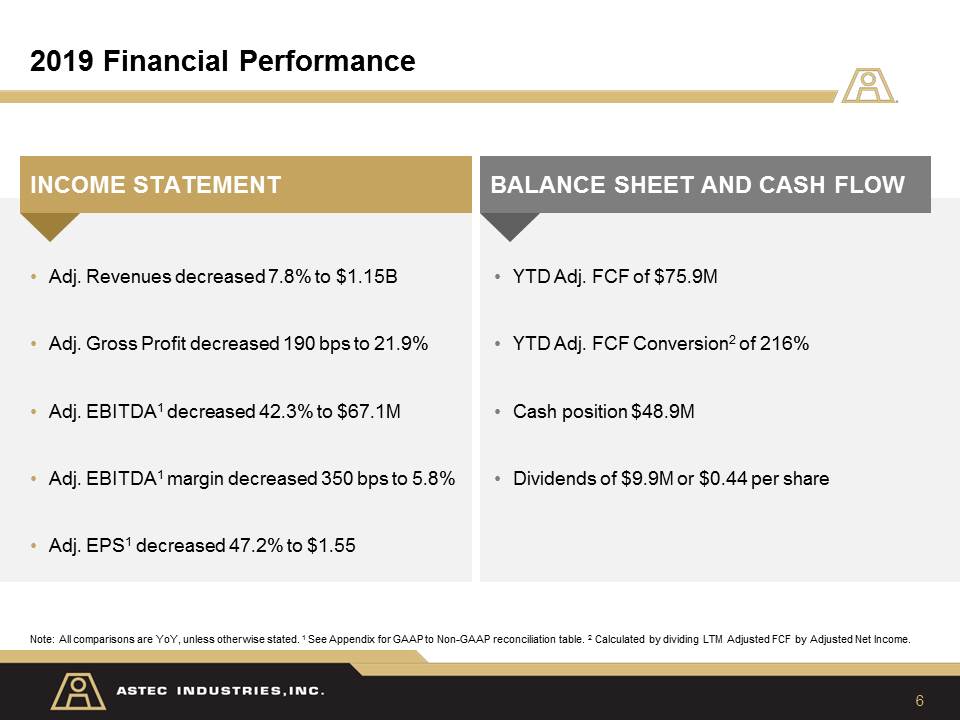
6 2019 Financial Performance Note: All comparisons are YoY, unless otherwise stated. 1 See Appendix for GAAP to Non-GAAP reconciliation table. 2 Calculated by dividing LTM Adjusted FCF by Adjusted Net Income. INCOME STATEMENT BALANCE SHEET AND CASH FLOW Adj. Revenues decreased 7.8% to $1.15BAdj. Gross Profit decreased 190 bps to 21.9%Adj. EBITDA1 decreased 42.3% to $67.1MAdj. EBITDA1 margin decreased 350 bps to 5.8%Adj. EPS1 decreased 47.2% to $1.55 YTD Adj. FCF of $75.9MYTD Adj. FCF Conversion2 of 216%Cash position $48.9MDividends of $9.9M or $0.44 per share

Total company & Segment financial results Becky Weyenberg | Chief financial Officer
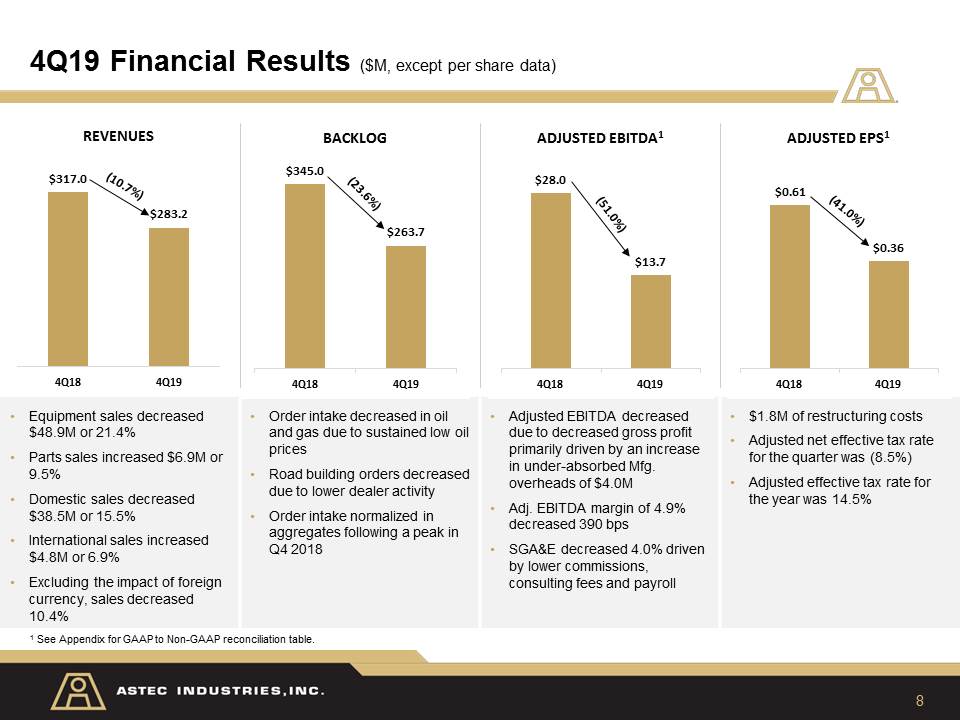
8 4Q19 Financial Results ($M, except per share data) 1 See Appendix for GAAP to Non-GAAP reconciliation table. Equipment sales decreased $48.9M or 21.4%Parts sales increased $6.9M or 9.5%Domestic sales decreased $38.5M or 15.5%International sales increased $4.8M or 6.9%Excluding the impact of foreign currency, sales decreased 10.4% Order intake decreased in oil and gas due to sustained low oil pricesRoad building orders decreased due to lower dealer activityOrder intake normalized in aggregates following a peak in Q4 2018 Adjusted EBITDA decreased due to decreased gross profit primarily driven by an increase in under-absorbed Mfg. overheads of $4.0MAdj. EBITDA margin of 4.9% decreased 390 bpsSGA&E decreased 4.0% driven by lower commissions, consulting fees and payroll $1.8M of restructuring costsAdjusted net effective tax rate for the quarter was (8.5%)Adjusted effective tax rate for the year was 14.5%
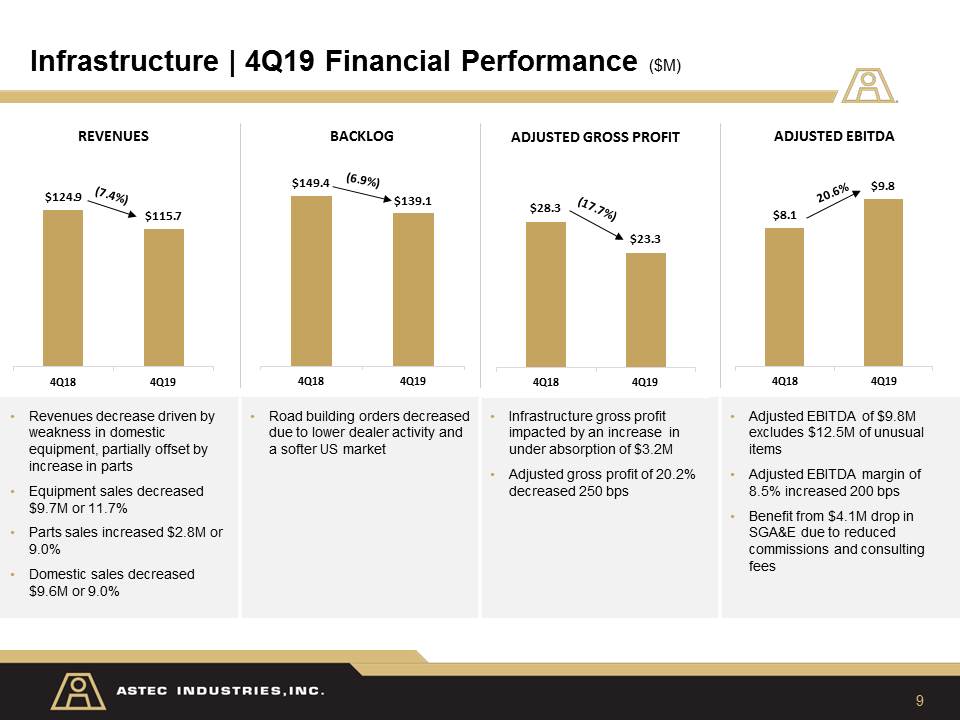
9 Infrastructure | 4Q19 Financial Performance ($M) Revenues decrease driven by weakness in domestic equipment, partially offset by increase in partsEquipment sales decreased $9.7M or 11.7% Parts sales increased $2.8M or 9.0%Domestic sales decreased $9.6M or 9.0% Road building orders decreased due to lower dealer activity and a softer US market Infrastructure gross profit impacted by an increase in under absorption of $3.2MAdjusted gross profit of 20.2% decreased 250 bps Adjusted EBITDA of $9.8M excludes $12.5M of unusual itemsAdjusted EBITDA margin of 8.5% increased 200 bpsBenefit from $4.1M drop in SGA&E due to reduced commissions and consulting fees
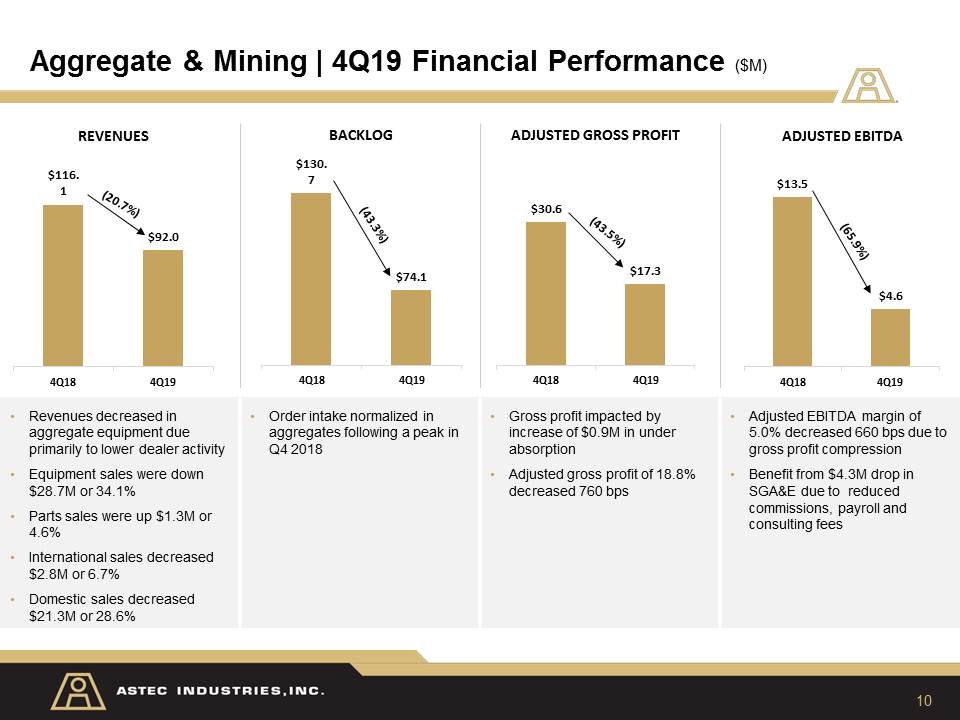
10 Aggregate & Mining | 4Q19 Financial Performance ($M) Revenues decreased in aggregate equipment due primarily to lower dealer activityEquipment sales were down $28.7M or 34.1%Parts sales were up $1.3M or 4.6%International sales decreased $2.8M or 6.7%Domestic sales decreased $21.3M or 28.6% Order intake normalized in aggregates following a peak in Q4 2018 Gross profit impacted by increase of $0.9M in under absorptionAdjusted gross profit of 18.8% decreased 760 bps Adjusted EBITDA margin of 5.0% decreased 660 bps due to gross profit compressionBenefit from $4.3M drop in SGA&E due to reduced commissions, payroll and consulting fees
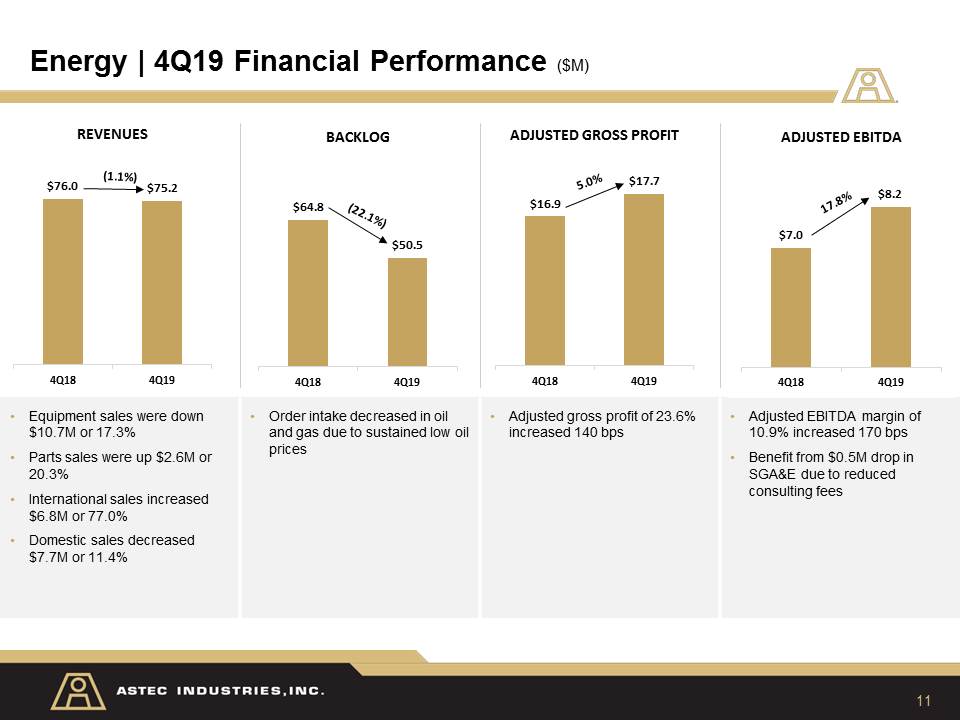
11 Energy | 4Q19 Financial Performance ($M) Equipment sales were down $10.7M or 17.3%Parts sales were up $2.6M or 20.3%International sales increased $6.8M or 77.0%Domestic sales decreased $7.7M or 11.4% Order intake decreased in oil and gas due to sustained low oil prices Adjusted gross profit of 23.6% increased 140 bps Adjusted EBITDA margin of 10.9% increased 170 bpsBenefit from $0.5M drop in SGA&E due to reduced consulting fees
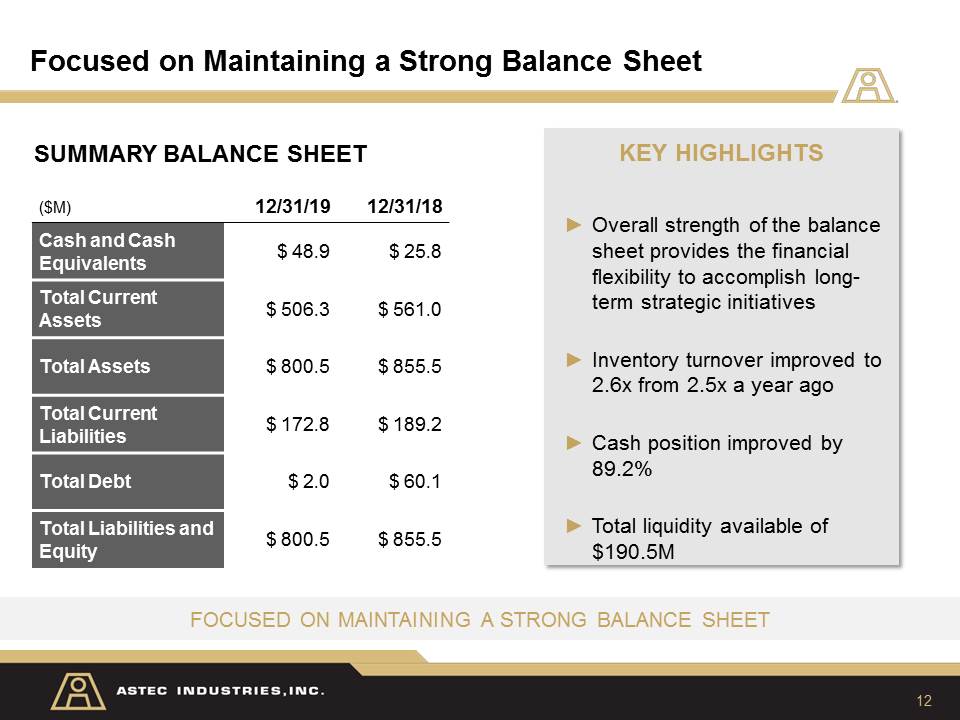
12 Focused on Maintaining a Strong Balance Sheet Focused on Maintaining a Strong Balance Sheet KEY HIGHLIGHTSOverall strength of the balance sheet provides the financial flexibility to accomplish long-term strategic initiativesInventory turnover improved to 2.6x from 2.5x a year ago Cash position improved by 89.2%Total liquidity available of $190.5M ($M) 12/31/19 12/31/18 Cash and Cash Equivalents $ 48.9 $ 25.8 Total Current Assets $ 506.3 $ 561.0 Total Assets $ 800.5 $ 855.5 Total Current Liabilities $ 172.8 $ 189.2 Total Debt $ 2.0 $ 60.1 Total Liabilities and Equity $ 800.5 $ 855.5 SUMMARY BALANCE SHEET
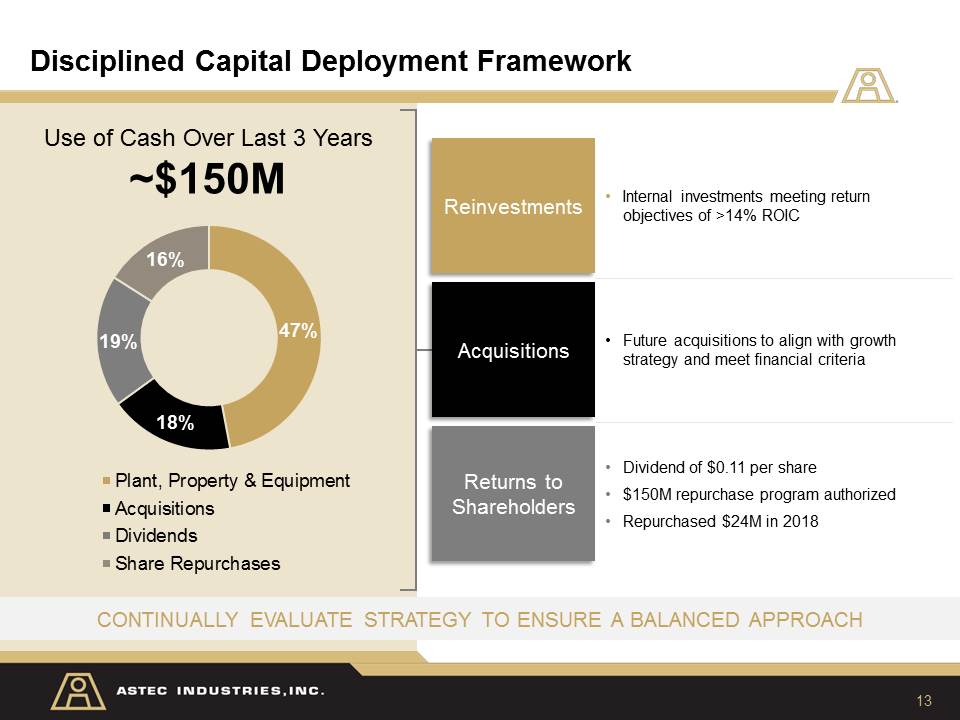
13 Disciplined Capital Deployment Framework Continually evaluate strategy to ensure a balanced approach Use of Cash Over Last 3 Years~$150M Reinvestments Acquisitions Returns to Shareholders Internal investments meeting return objectives of >14% ROIC Future acquisitions to align with growth strategy and meet financial criteria Dividend of $0.11 per share$150M repurchase program authorizedRepurchased $24M in 2018
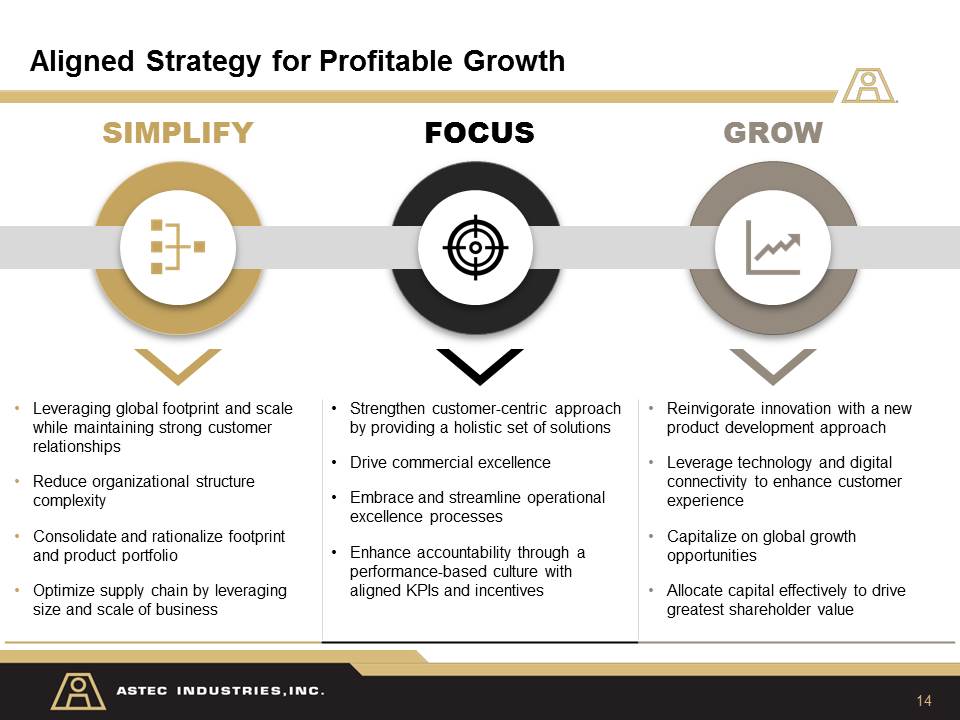
Aligned Strategy for Profitable Growth 14 FOCUS SIMPLIFY GROW Leveraging global footprint and scale while maintaining strong customer relationships Reduce organizational structure complexityConsolidate and rationalize footprint and product portfolioOptimize supply chain by leveraging size and scale of business Strengthen customer-centric approach by providing a holistic set of solutionsDrive commercial excellence Embrace and streamline operational excellence processes Enhance accountability through a performance-based culture with aligned KPIs and incentives Reinvigorate innovation with a new product development approachLeverage technology and digital connectivity to enhance customer experienceCapitalize on global growth opportunitiesAllocate capital effectively to drive greatest shareholder value
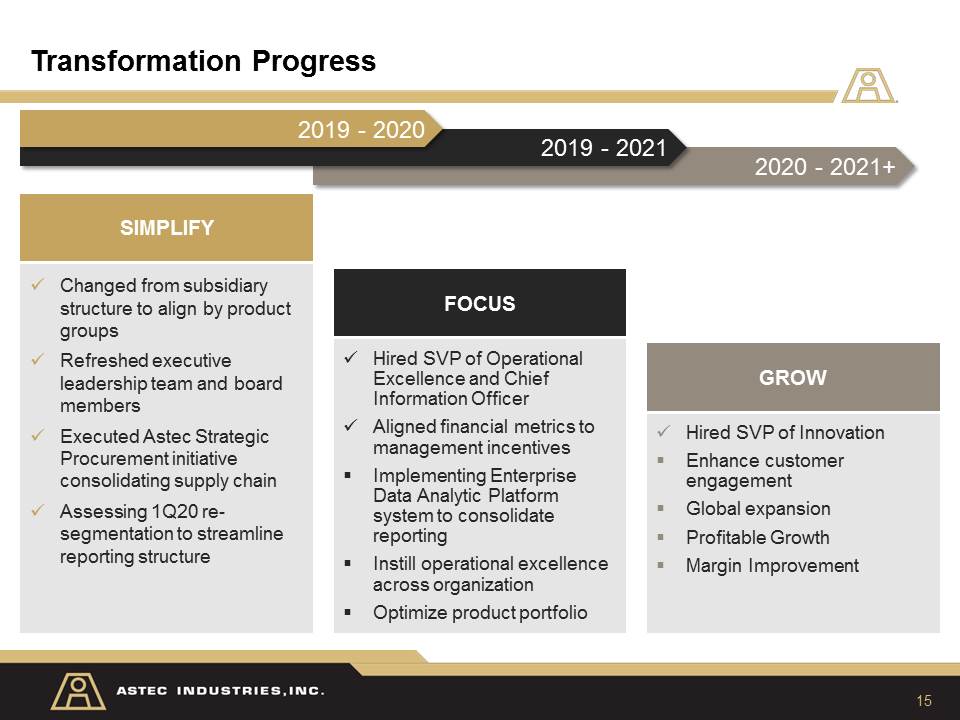
Transformation Progress 15 Changed from subsidiary structure to align by product groupsRefreshed executive leadership team and board membersExecuted Astec Strategic Procurement initiative consolidating supply chainAssessing 1Q20 re-segmentation to streamline reporting structure SIMPLIFY Hired SVP of Operational Excellence and Chief Information OfficerAligned financial metrics to management incentivesImplementing Enterprise Data Analytic Platform system to consolidate reportingInstill operational excellence across organizationOptimize product portfolio FOCUS Hired SVP of InnovationEnhance customer engagement Global expansionProfitable GrowthMargin Improvement GROW 2020 - 2021+ 2019 - 2021 2019 - 2020
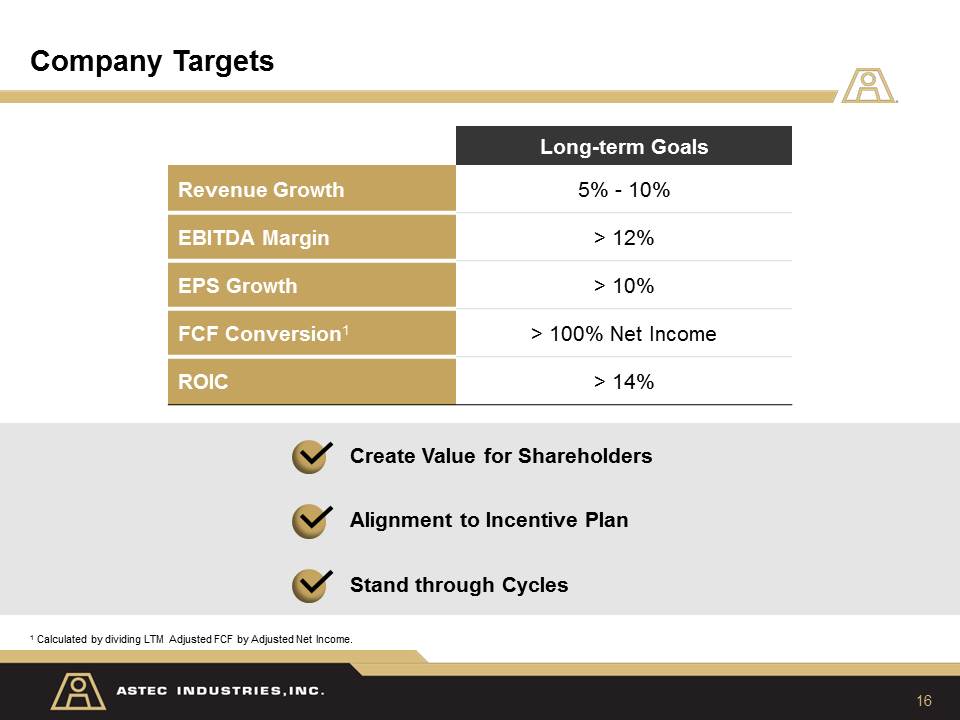
Company Targets 16 Long-term Goals Revenue Growth 5% - 10% EBITDA Margin > 12% EPS Growth > 10% FCF Conversion1 > 100% Net Income ROIC > 14% Create Value for Shareholders Alignment to Incentive Plan Stand through Cycles 1 Calculated by dividing LTM Adjusted FCF by Adjusted Net Income.

Q&A

18 Contact Information STEVE ANDERSONSVP of Administration, Investor Relations & Corporate SecretaryPhone: 423-553-5934Email: sanderson@astecindustries.com

Appendix
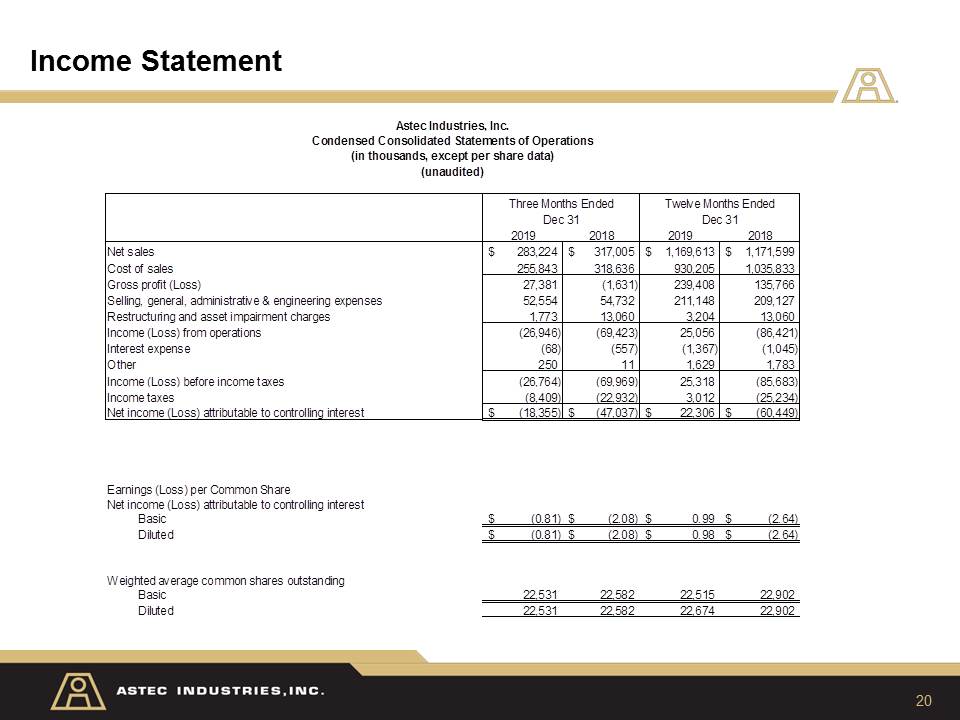
20 Income Statement
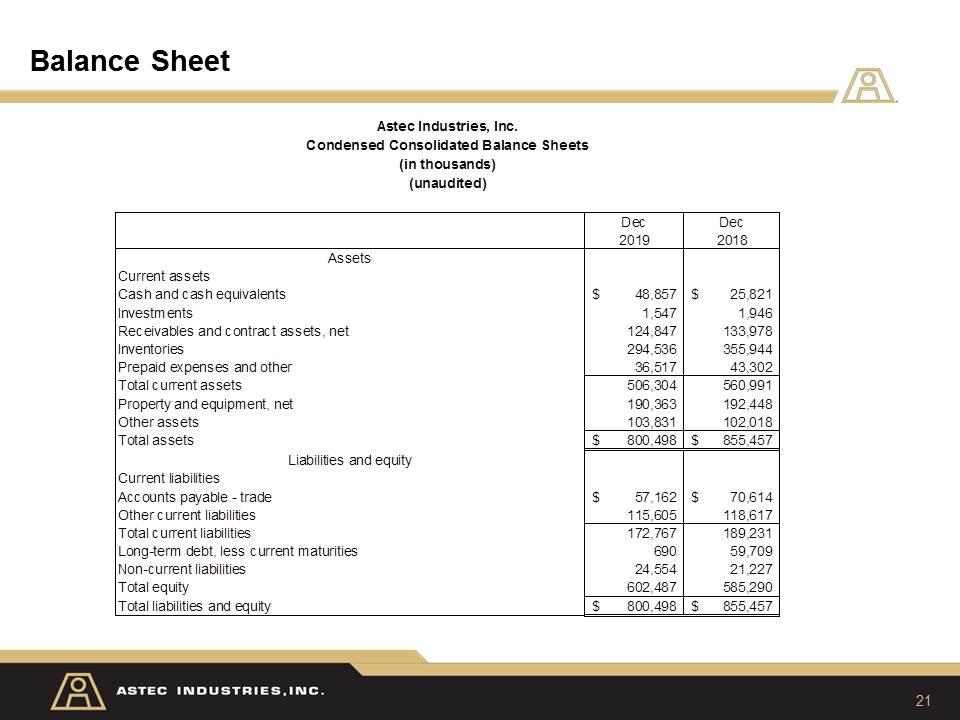
21 Balance Sheet
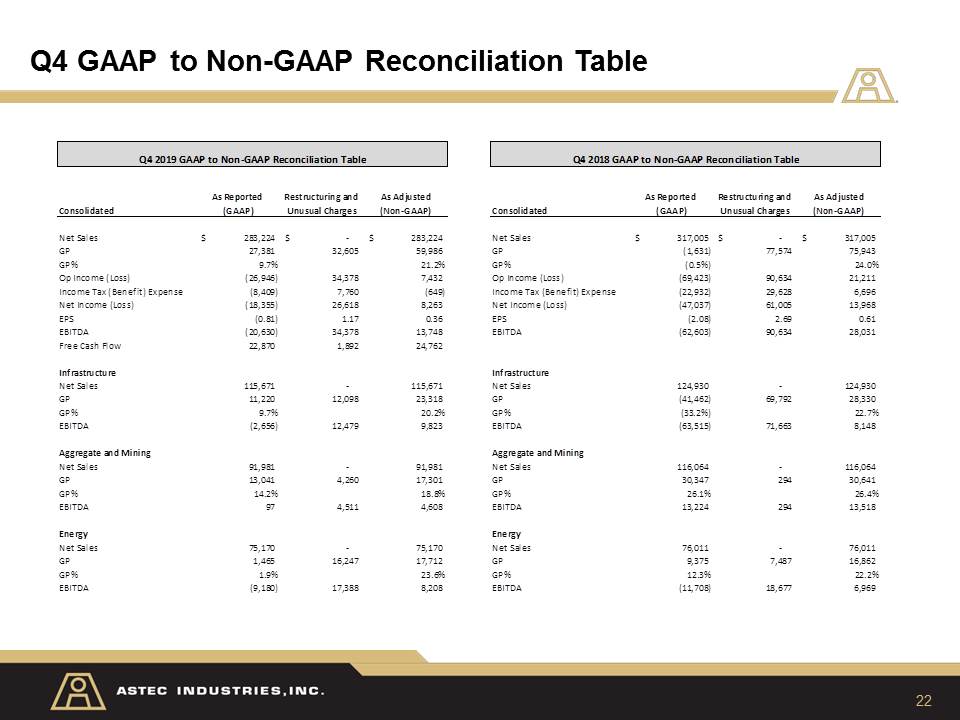
22 Q4 GAAP to Non-GAAP Reconciliation Table
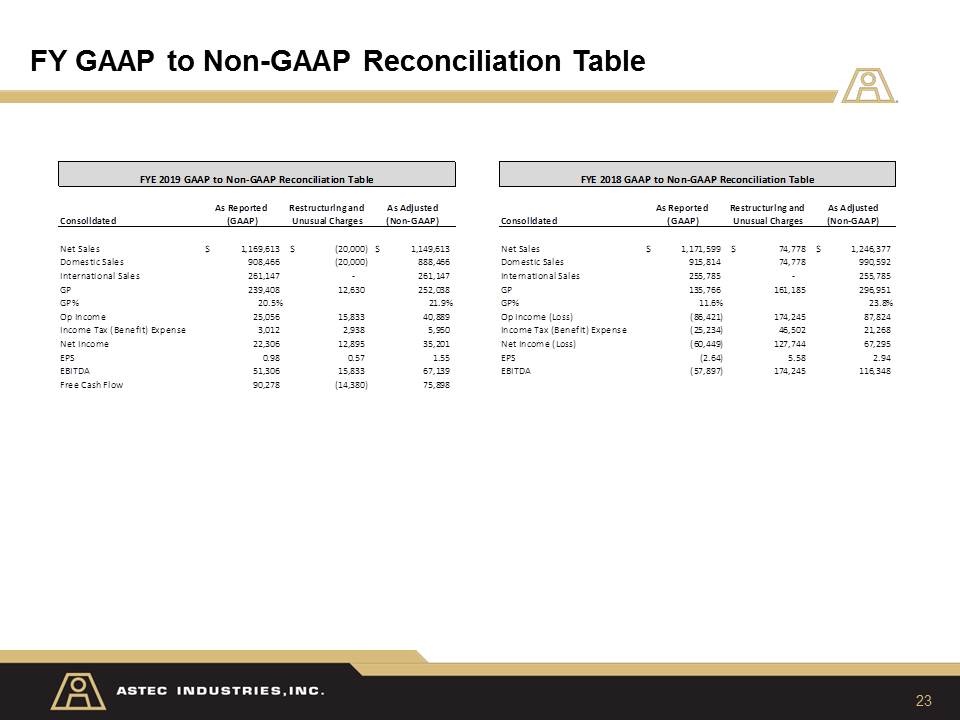
23 FY GAAP to Non-GAAP Reconciliation Table