
Exhibit 99.2 3Q20 Earnings Presentation November 4, 2020

Safe Harbor Certain statements contained in this presentation relate to future events and expectations and are “forward-looking statements” (within the meaning of the Private Securities Litigation Reform Act of 1995) regarding the future performance of the Company. Words such as "believe," "estimate," "will be," "will," "would," “may,” "expect," "anticipate," "plan," "project," "intend," "could," "should" or other similar words or expressions often identify forward-looking statements. However, the absence of these words does not mean that the statement is not forward-looking. All statements other than statements of historical fact are forward-looking statements, including, without limitation, statements regarding our outlook, projections, forecasts or trend descriptions. These statements do not guarantee future performance and speak only as of the date they are made, and we do not undertake to update our forward-looking statements. Because forward-looking statements involve risks and uncertainties, actual results could differ materially. Such risks and uncertainties, many of which are beyond the control of the Company, include among others: the impact of the COVID-19 pandemic on the global demand for the Company’s products; the impacts of the COVID-19 pandemic on the Company’s financial condition and business operations; general uncertainty in the economy; pricing, demand and availability of steel, oil and liquid asphalt; decreased funding for highway projects; the relative strength/weakness of the dollar to foreign currencies; production capacity; general business conditions in the industry; demand for the Company’s products; seasonality and cyclicality in operating results; seasonality of sales volumes or lower than expected sales volumes; lower than expected margins on custom equipment orders; competitive activity; tax rates and the impact of future legislation thereon; and those other factors, risks and uncertainties that are more specifically set forth from time to time in the Company’s reports filed with the Securities and Exchange Commission, including but not limited to the Company’s annual report on Form 10-K for the year ended December 31, 2019. NON-GAAP FINANCIAL MEASURES: In an effort to provide investors with additional information regarding the Company’s results, the Company refers to various GAAP (U.S. generally accepted accounting principles) and non-GAAP financial measures which management believes provides useful information to investors. These non-GAAP financial measures have no standardized meaning prescribed by U.S. GAAP and therefore are unlikely to be comparable to the calculation of similar measures for other companies. Management of the Company does not intend these items to be considered in isolation or as a substitute for the related GAAP measures. Nonetheless, this non-GAAP information can be useful in understanding the Company's operating results and the performance of its core business. Management of the Company uses both GAAP and non-GAAP financial measures to establish internal budgets and targets and to evaluate the Company’s financial performance against such budgets and targets. 3Q20 Earnings Presentation | 2

Astec Overview & 3Q20 Highlights Barry Ruffalo | President & CEO 3Q20 Earnings Presentation
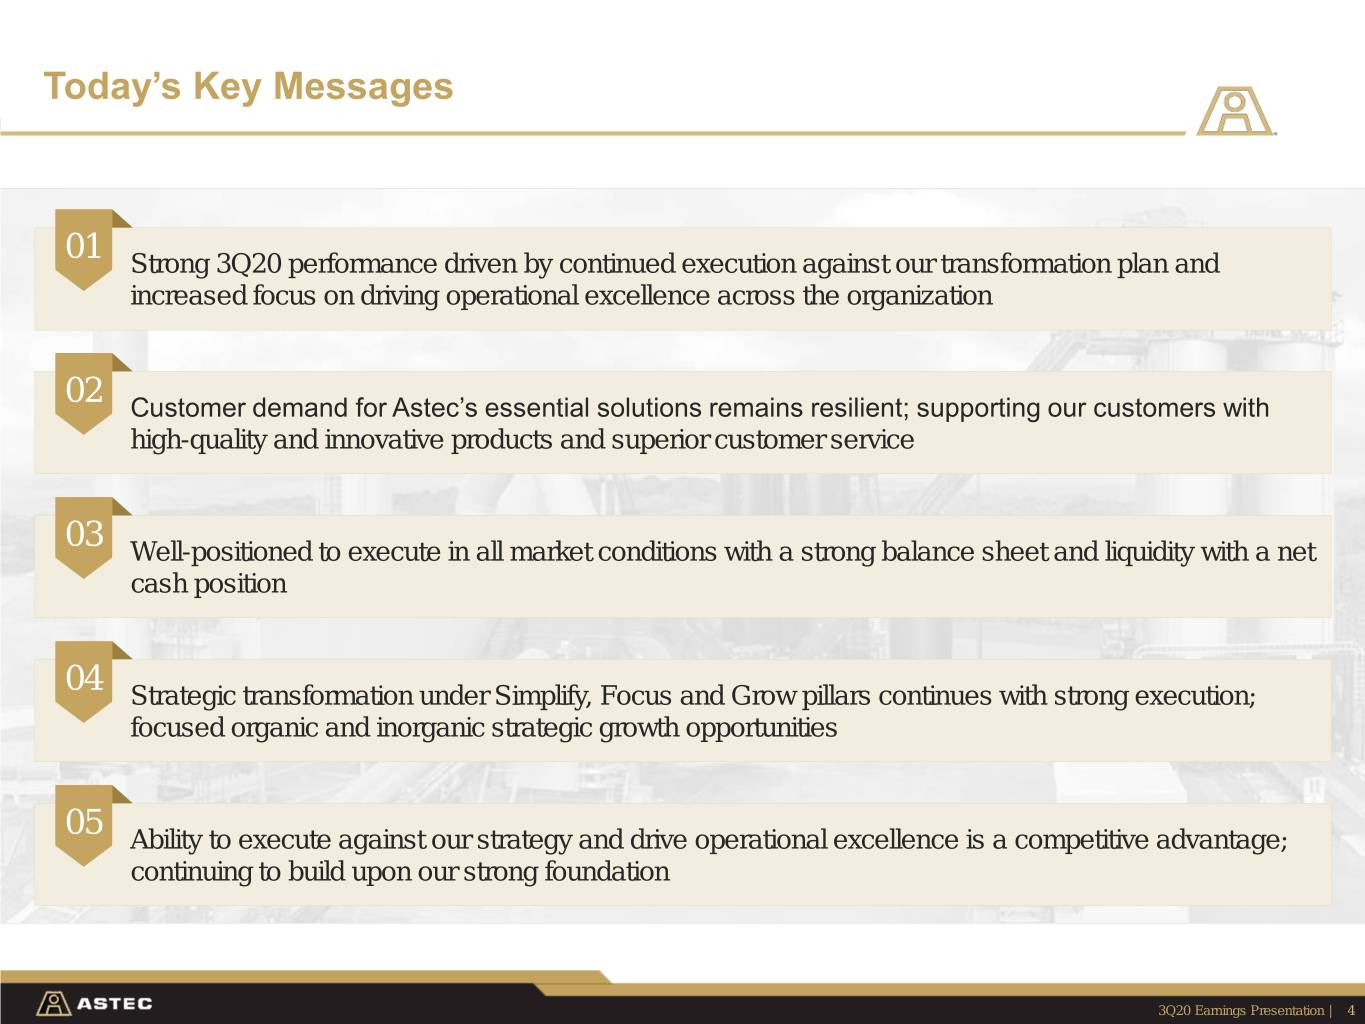
Today’s Key Messages 01 Strong 3Q20 performance driven by continued execution against our transformation plan and increased focus on driving operational excellence across the organization 02 Customer demand for Astec’s essential solutions remains resilient; supporting our customers with high-quality and innovative products and superior customer service 03 Well-positioned to execute in all market conditions with a strong balance sheet and liquidity with a net cash position 04 Strategic transformation under Simplify, Focus and Grow pillars continues with strong execution; focused organic and inorganic strategic growth opportunities 05 Ability to execute against our strategy and drive operational excellence is a competitive advantage; continuing to build upon our strong foundation 3Q20 Earnings Presentation | 4
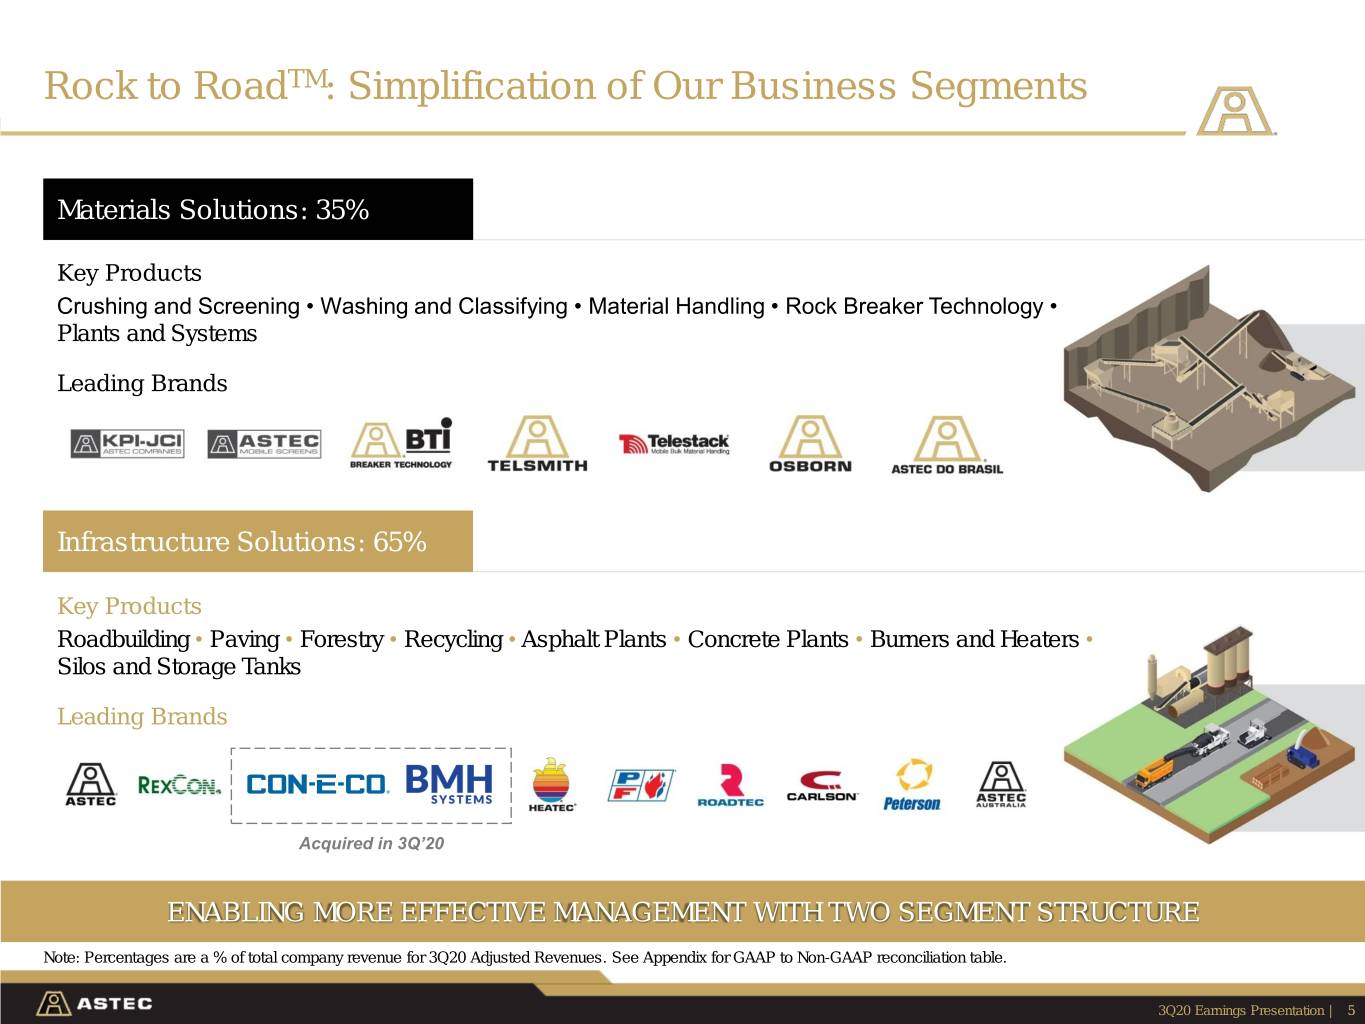
Rock to RoadTM: Simplification of Our Business Segments Materials Solutions: 35% Key Products Crushing and Screening • Washing and Classifying • Material Handling • Rock Breaker Technology • Plants and Systems Leading Brands Infrastructure Solutions: 65% Key Products Roadbuilding • Paving • Forestry • Recycling • Asphalt Plants • Concrete Plants • Burners and Heaters • Silos and Storage Tanks Leading Brands Acquired in 3Q’20 ENABLING MORE EFFECTIVE MANAGEMENT WITH TWO SEGMENT STRUCTURE Note: Percentages are a % of total company revenue for 3Q20 Adjusted Revenues. See Appendix for GAAP to Non-GAAP reconciliation table. 3Q20 Earnings Presentation | 5
Operations and COVID-19 Update Operational Excellence is a Competitive Advantage ✓ COVID-19 Task Force continues to actively manage the pandemic situation with a focus on keeping our employees, customers and suppliers safe ✓ Following on-site precautions such as frequent handwashing, social distancing, regular cleaning of surfaces and health screening procedures, including temperature checks ✓ Remain focused on manufacturing, selling and servicing our products with appropriate precautions ✓ Currently, 30% of office staff is working remotely; intent to bring all employees back to the office once the pandemic subsides ✓ All of our factories are open, with limited disruption to operations PROACTIVELY MANAGING THROUGH THE PANDEMIC WITH NO SIGNIFICANT DISRUPTIONS 3Q20 Earnings Presentation | 6

Business Dynamics and Observations Current Transformation to Simplify, Focus, and Grow Strategy Has Reduced Organizational Structure Complexity and Enabled More Efficient COVID-19 Response and Sharing of Best Practices ✓ Recent 12-month extension of FAST Act driving increased customer confidence and visibility ✓ Bipartisan support for U.S. infrastructure construction; both House and Senate calling for funding increases ✓ Customers are still working and need our solutions; some have discussed caution with capex decisions ✓ Limited impact YTD and situation remains fluid for the remainder of 2020 PROACTIVELY MONITORING THE ENVIRONMENT TO QUICKLY REACT TO CHANGES IN DEMAND 3Q20 Earnings Presentation | 7

Total Company & Segment Results Becky Weyenberg | Chief Financial Officer 3Q20 Earnings Presentation
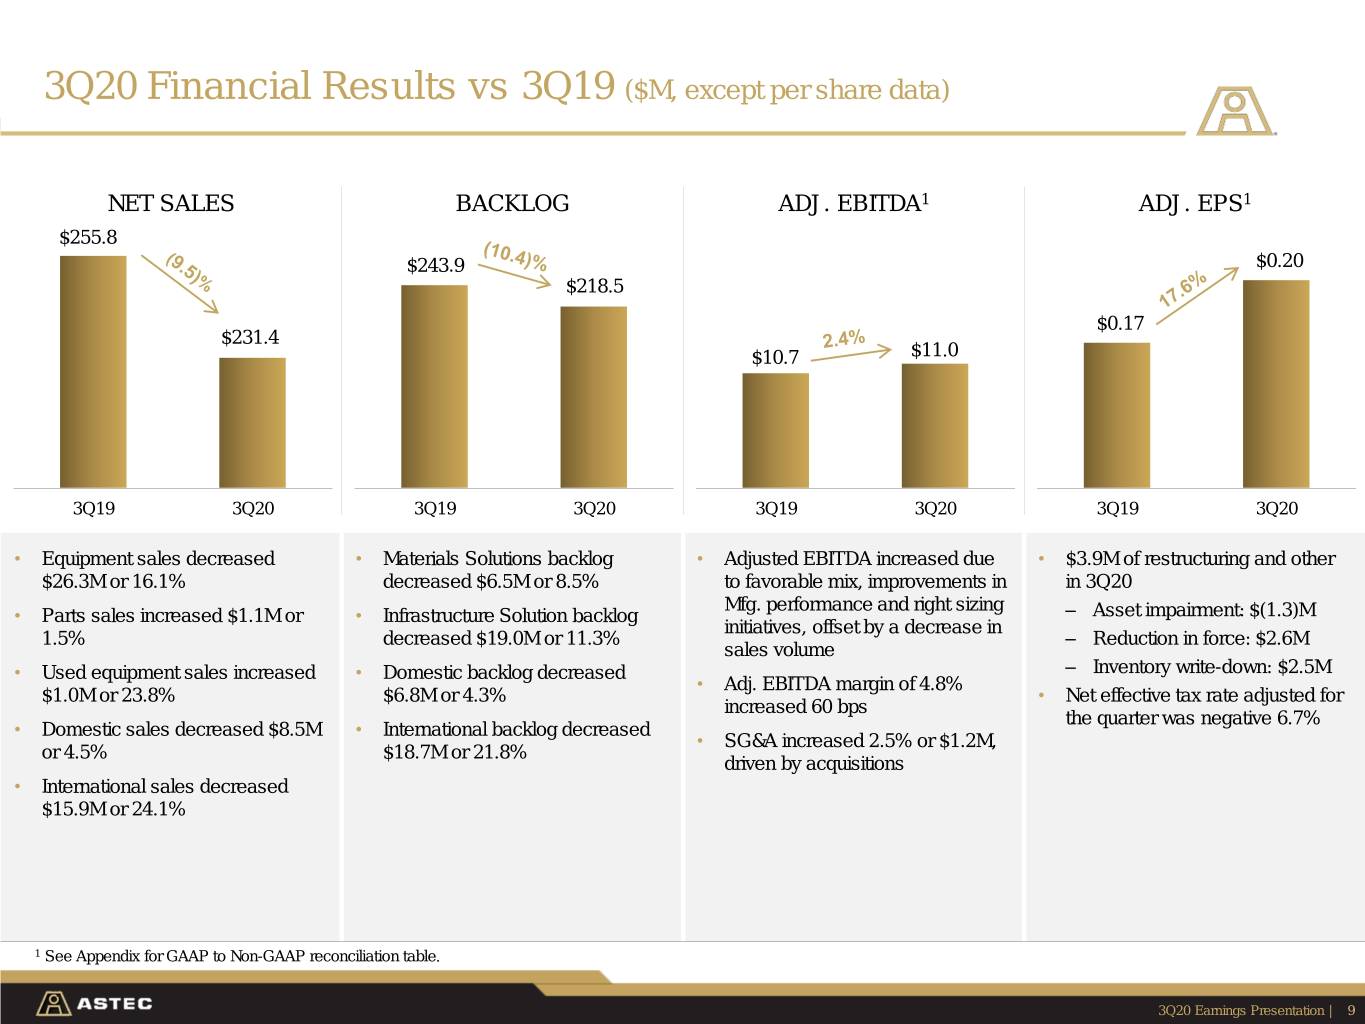
3Q20 Financial Results vs 3Q19 ($M, except per share data) NET SALES BACKLOG ADJ. EBITDA1 ADJ. EPS1 $255.8 $243.9 $0.20 $218.5 $0.17 $231.4 $10.7 $11.0 3Q19 3Q20 3Q19 3Q20 3Q19 3Q20 3Q19 3Q20 • Equipment sales decreased • Materials Solutions backlog • Adjusted EBITDA increased due • $3.9M of restructuring and other $26.3M or 16.1% decreased $6.5M or 8.5% to favorable mix, improvements in in 3Q20 Mfg. performance and right sizing • Parts sales increased $1.1M or • Infrastructure Solution backlog ‒ Asset impairment: $(1.3)M initiatives, offset by a decrease in 1.5% decreased $19.0M or 11.3% ‒ Reduction in force: $2.6M sales volume • Used equipment sales increased • Domestic backlog decreased ‒ Inventory write-down: $2.5M • Adj. EBITDA margin of 4.8% $1.0M or 23.8% $6.8M or 4.3% • Net effective tax rate adjusted for increased 60 bps the quarter was negative 6.7% • Domestic sales decreased $8.5M • International backlog decreased • SG&A increased 2.5% or $1.2M, or 4.5% $18.7M or 21.8% driven by acquisitions • International sales decreased $15.9M or 24.1% 1 See Appendix for GAAP to Non-GAAP reconciliation table. 3Q20 Earnings Presentation | 9
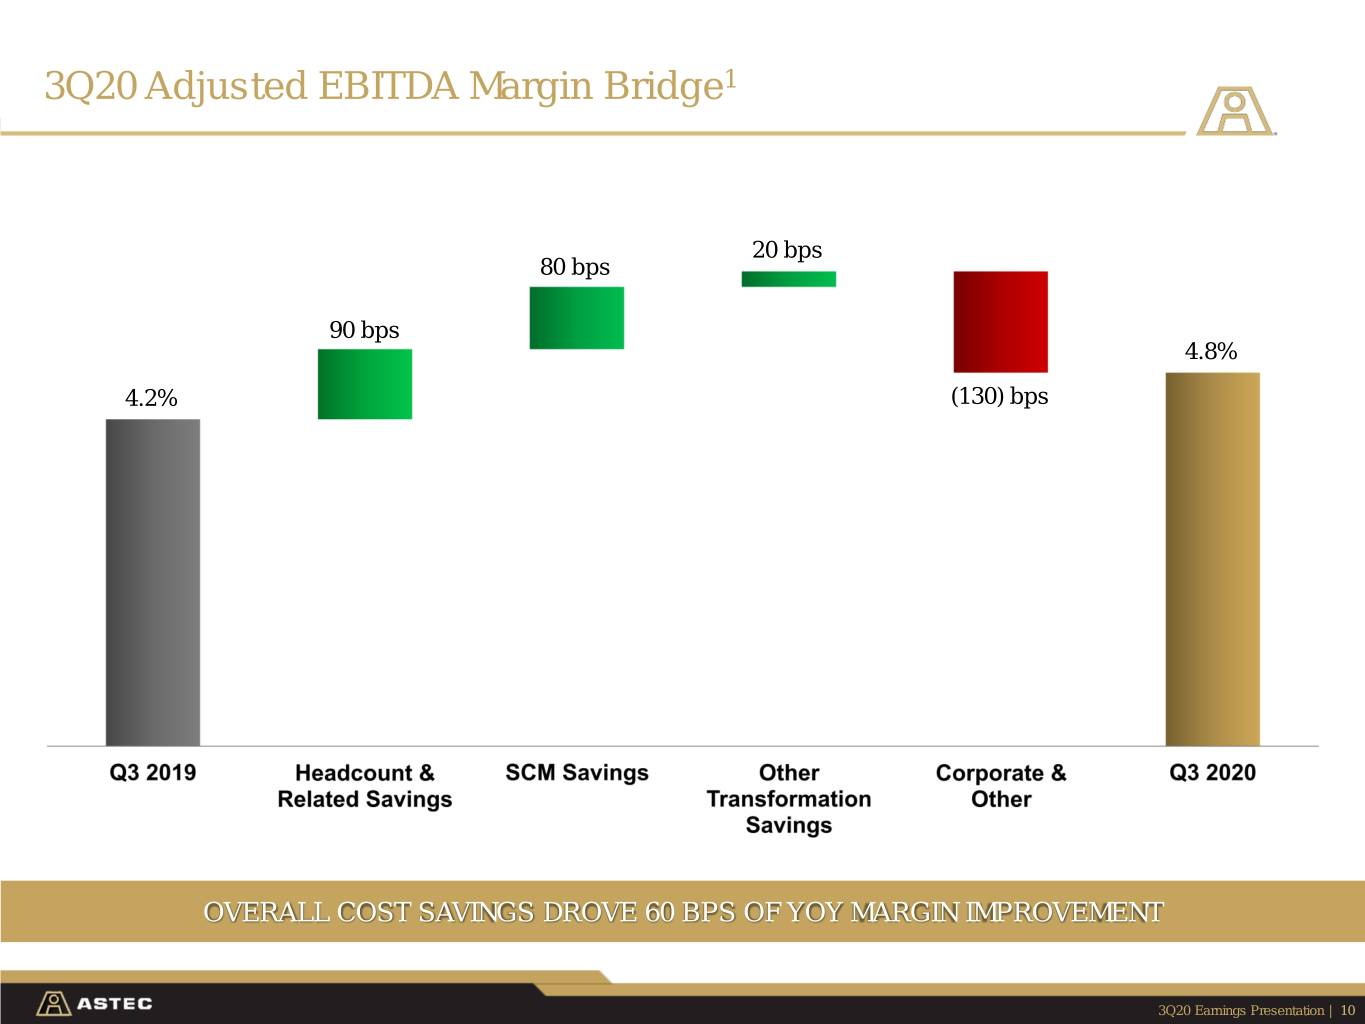
3Q20 Adjusted EBITDA Margin Bridge1 20 bps 80 bps 90 bps 4.8% 4.2% (130) bps OVERALL COST SAVINGS DROVE 60 BPS OF YOY MARGIN IMPROVEMENT 3Q20 Earnings Presentation | 10
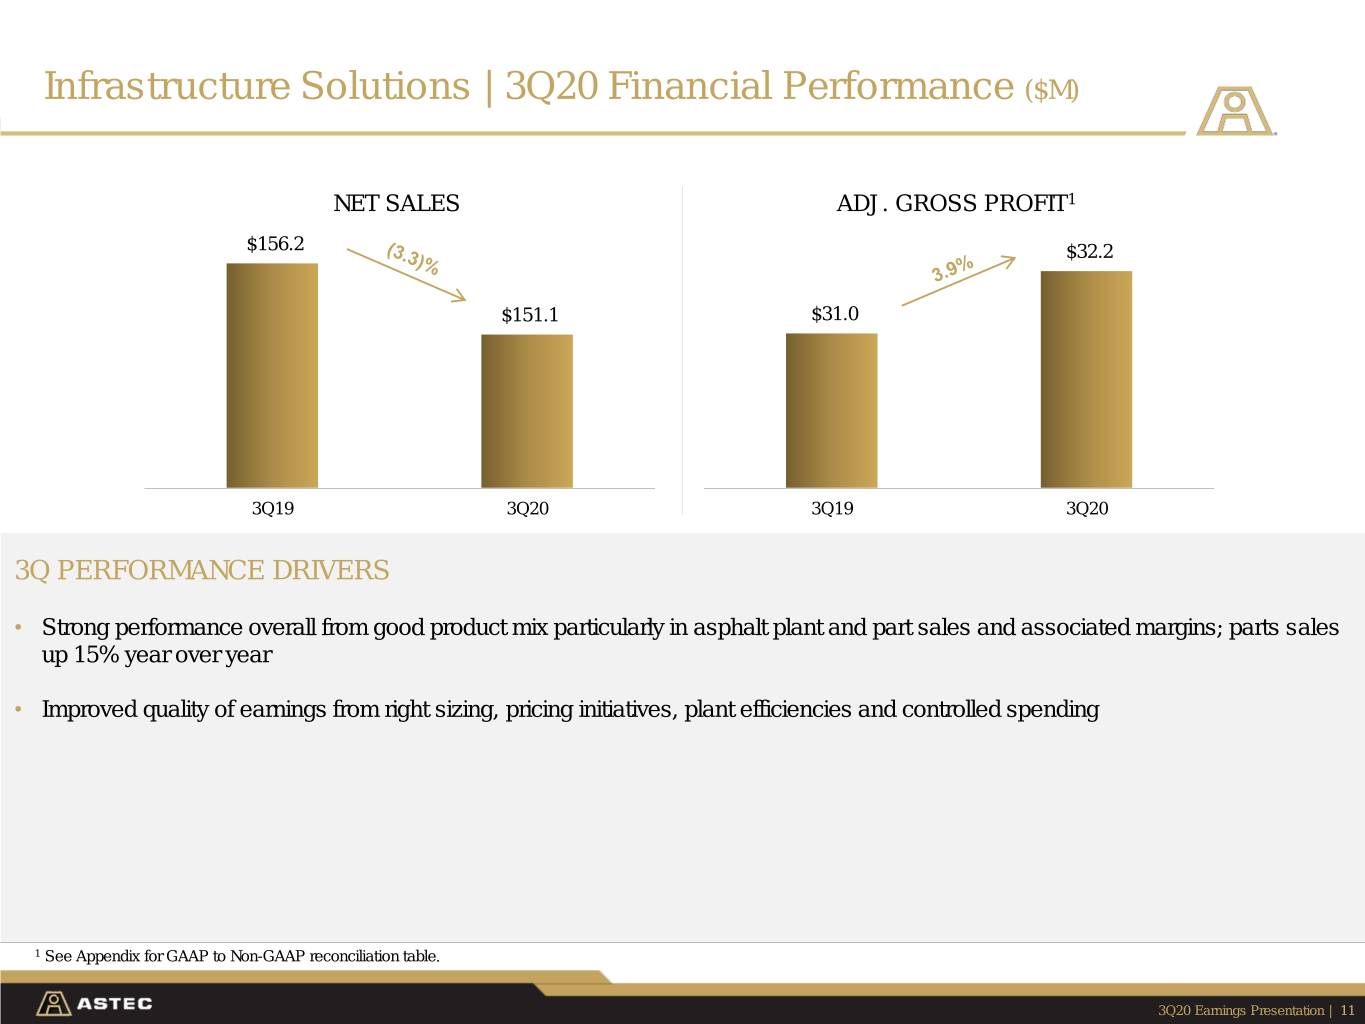
Infrastructure Solutions | 3Q20 Financial Performance ($M) NET SALES ADJ. GROSS PROFIT1 $156.2 $32.2 $151.1 $31.0 3Q19 3Q20 3Q19 3Q20 3Q PERFORMANCE DRIVERS • Strong performance overall from good product mix particularly in asphalt plant and part sales and associated margins; parts sales up 15% year over year • Improved quality of earnings from right sizing, pricing initiatives, plant efficiencies and controlled spending 1 See Appendix for GAAP to Non-GAAP reconciliation table. 3Q20 Earnings Presentation | 11

Materials Solutions | 3Q20 Financial Performance ($M) NET SALES GROSS PROFIT $99.6 (0.7)% $20.8 $20.7 $80.3 3Q19 3Q20 3Q19 3Q20 3Q PERFORMANCE DRIVERS • Strong domestic order intake coming out of 3Q • Right sizing initiatives taken in 2019 and 2020 to maximize utilization of our manufacturing footprint capacity improving margin despite declining revenue • Additional earnings improvement from controlled spending • Efforts underway to further leverage global footprint for deliveries to end customer 1 See Appendix for GAAP to Non-GAAP reconciliation table. 3Q20 Earnings Presentation | 12

YTD20 Financial Results vs YTD19 ($M, except per share data) ADJ. NET SALES1 BACKLOG ADJ. EBITDA1 ADJ. EPS1 $866.4 $1.86 $243.9 $60.5 $785.6 $218.5 $53.4 $1.18 YTD19 YTD20 YTD19 YTD20 YTD19 YTD20 YTD19 YTD20 • Equipment sales decreased • Materials Solutions backlog • Adjusted EBITDA increased due • $14.5M of restructuring and other $77.7M or 13.7% decreased $6.5M or 8.5% to favorable mix and in YTD20 improvements in Mfg. • Parts sales decreased $10.5M or • Infrastructure Solutions backlog ‒ Asset impairment $4.0M performance, offset by a decrease 4.4% decreased $19.0M or 11.3% in sales volume ‒ Inventory write-down $4.4M • Used equipment sales increased • Domestic backlog decreased ‒ Reduction in force $6.3M • Adj. EBITDA margin of 7.7% $10.5M or 87.7% $6.8M or 4.3% increased 170 bps • Use of CARES Act NOL • Domestic sales decreased • International backlog decreased carryback for a $9.5M tax • SG&A decreased 6.8% or $10.8M $42.1M or 6.2% $18.7M or 21.8% reduction, or $0.42 impact; net driven by reductions in consulting effective tax rate adjusted for the • International sales decreased fees, travel and employee year to date was negative 2.5% $38.7M or 20.6% expenses 1 See Appendix for GAAP to Non-GAAP reconciliation table. 3Q20 Earnings Presentation | 13
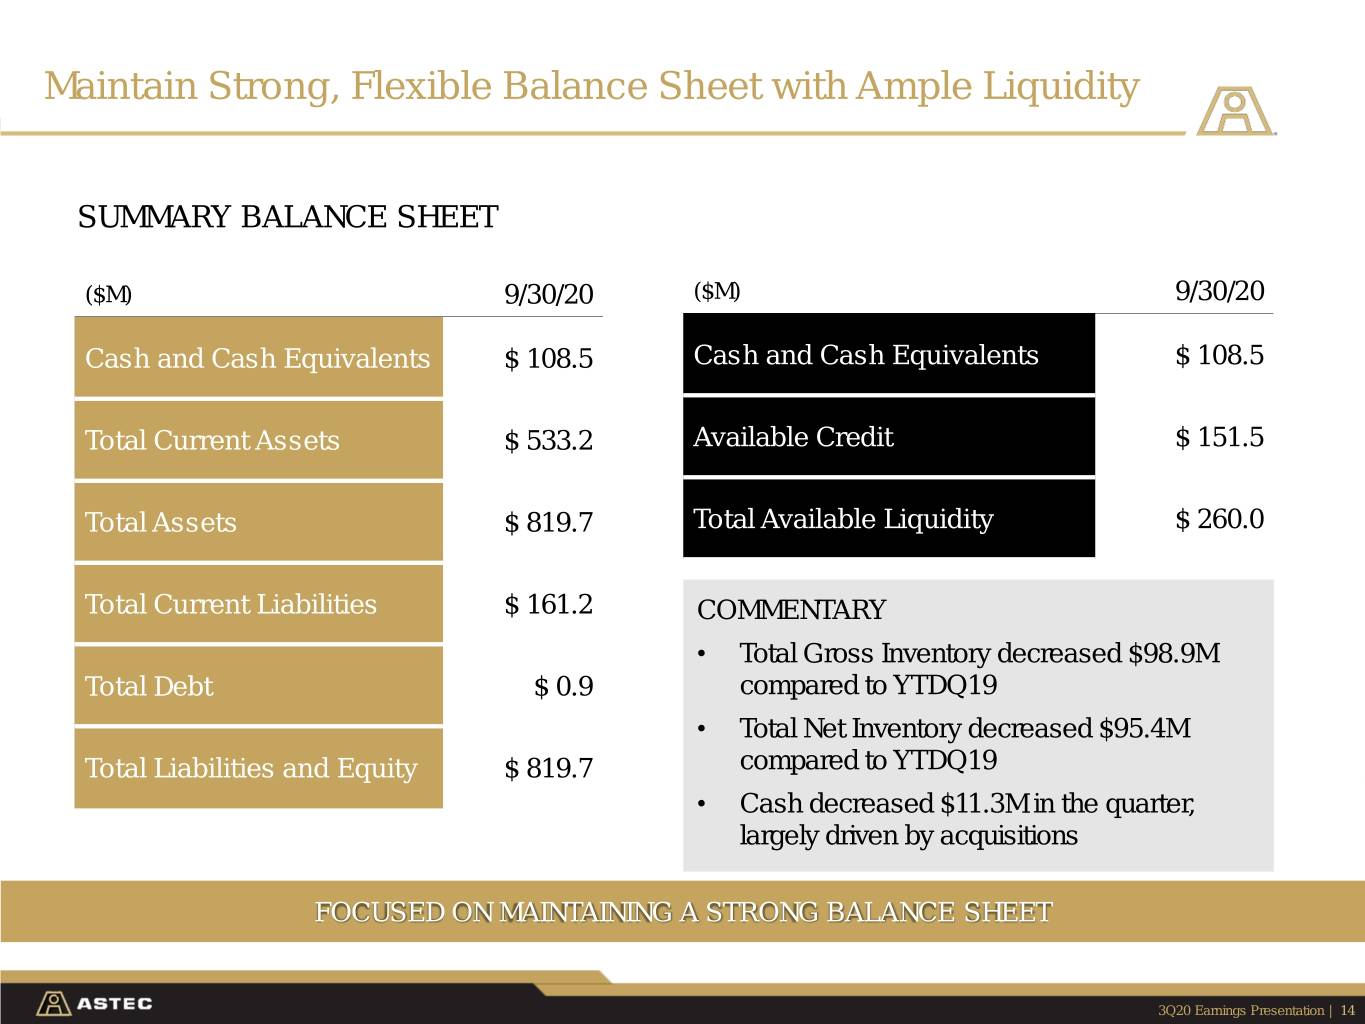
Maintain Strong, Flexible Balance Sheet with Ample Liquidity SUMMARY BALANCE SHEET ($M) 9/30/20 ($M) 9/30/20 Cash and Cash Equivalents $ 108.5 Cash and Cash Equivalents $ 108.5 Total Current Assets $ 533.2 Available Credit $ 151.5 Total Assets $ 819.7 Total Available Liquidity $ 260.0 Total Current Liabilities $ 161.2 COMMENTARY • Total Gross Inventory decreased $98.9M Total Debt $ 0.9 compared to YTDQ19 • Total Net Inventory decreased $95.4M Total Liabilities and Equity $ 819.7 compared to YTDQ19 • Cash decreased $11.3M in the quarter, largely driven by acquisitions FOCUSED ON MAINTAINING A STRONG BALANCE SHEET 3Q20 Earnings Presentation | 14

Disciplined Capital Deployment Framework Use of Cash Over Last 3 Years ~$175M Adjustments Given Current Environment Plant, Property • Internal investments meeting Continue to target > 14% 14% return objectives of >14% ROIC for new & Equipment ROIC investments 38% 17% • Future acquisitions to align Continue to focus on Acquisitions with growth strategy and meet strategic alignment and financial criteria financial discipline 31% Plant, Property & Equipment • Dividend of $0.11 per share Returns to • $150M repurchase program No buybacks expected Acquisitions Shareholders authorized in near term Dividends • Repurchased $24M in 2018 Share Repurchases CONTINUALLY EVALUATE STRATEGY TO ENSURE A BALANCED APPROACH 3Q20 Earnings Presentation | 15

Strategic M&A Approach Aligns to Our Growth Strategy Value Chain Gaps Financial Criteria Close to Core Attractive with Deeper Markets / Aligns Penetration to Macro Trends EPS Accretion in First Full Year Strategic Acquisition Filters Meet or Exceed #1 or #2 Market Recurring Leadership Long-term Financial Metrics Revenue Position Accelerate Investment in Technology and Innovation CONTINUE TO FOCUS ON STRATEGIC ALIGNMENT AND FINANCIAL DISCIPLINE 3Q20 Earnings Presentation | 16
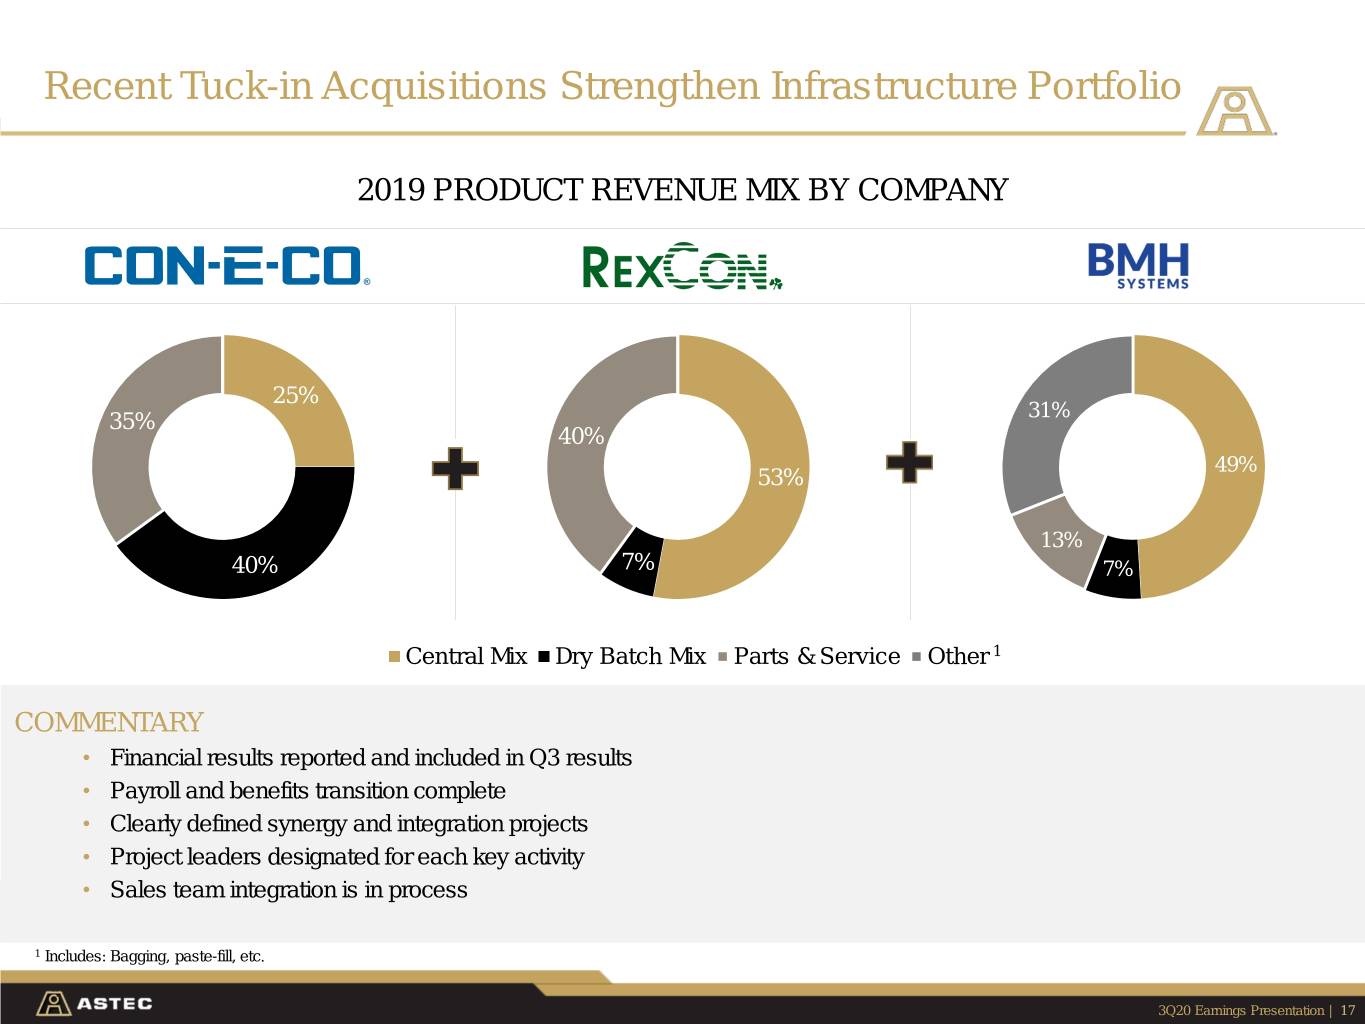
Recent Tuck-in Acquisitions Strengthen Infrastructure Portfolio 2019 PRODUCT REVENUE MIX BY COMPANY 25% 35% 31% 40% 49% 53% 13% 40% 7% 7% Central Mix Dry Batch Mix Parts & Service Other 1 COMMENTARY • Financial results reported and included in Q3 results • Payroll and benefits transition complete • Clearly defined synergy and integration projects • Project leaders designated for each key activity • Sales team integration is in process CONSISTENT WITH OUR PROFITABLE GROWTH STRATEGY TO ENHANCE SHAREHOLDER VALUE 1 Includes: Bagging, paste-fill, etc. 3Q20 Earnings Presentation | 17
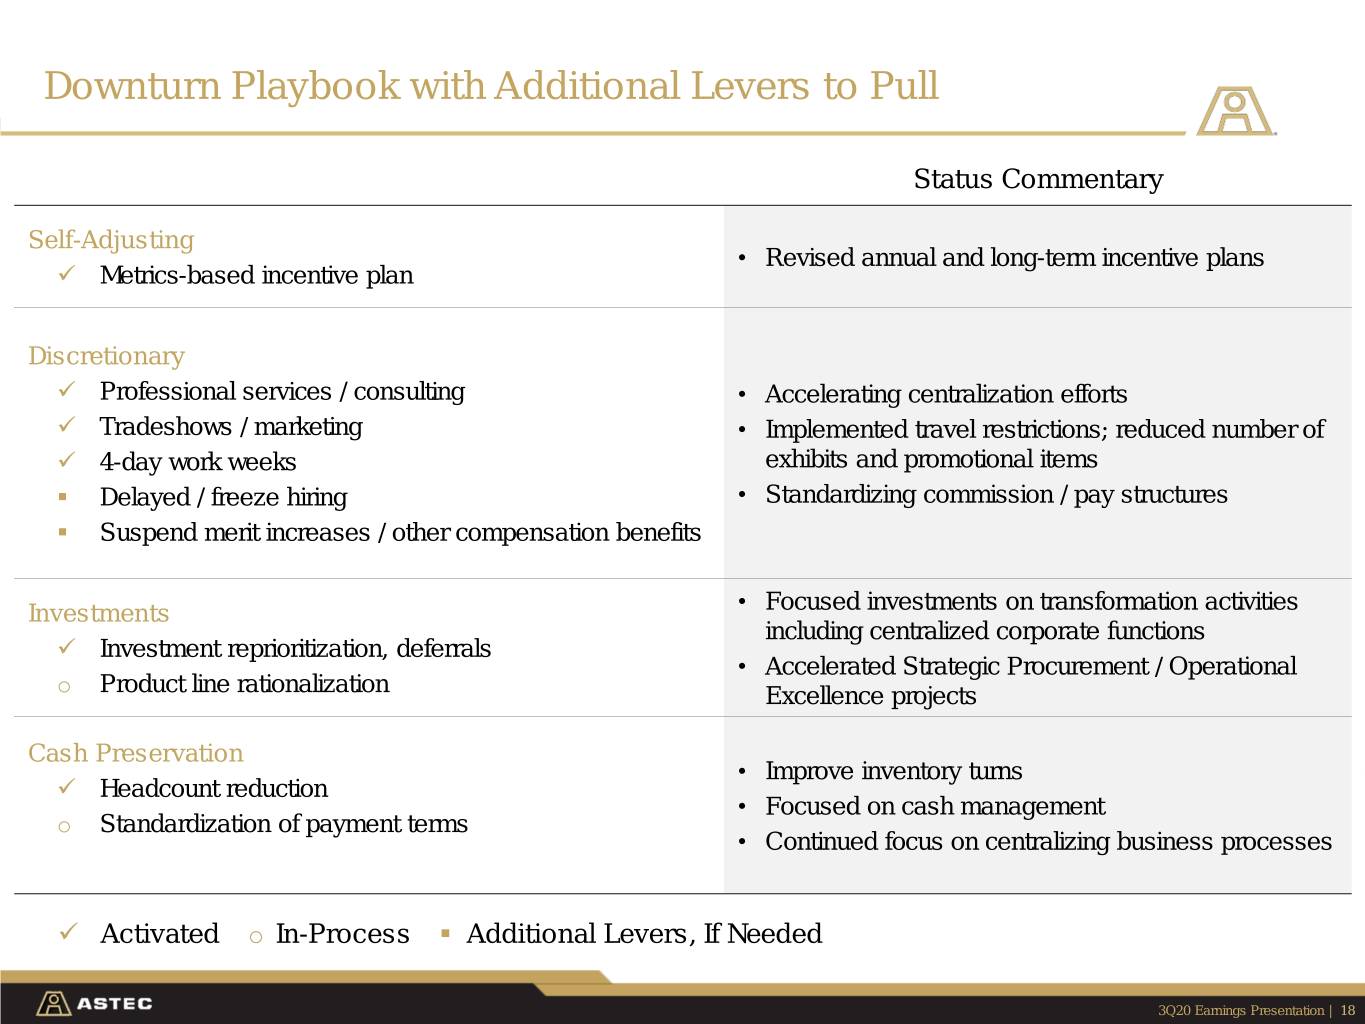
Downturn Playbook with Additional Levers to Pull Status Commentary Self-Adjusting • Revised annual and long-term incentive plans ✓ Metrics-based incentive plan Discretionary ✓ Professional services / consulting • Accelerating centralization efforts ✓ Tradeshows / marketing • Implemented travel restrictions; reduced number of ✓ 4-day work weeks exhibits and promotional items ▪ Delayed / freeze hiring • Standardizing commission / pay structures ▪ Suspend merit increases / other compensation benefits Investments • Focused investments on transformation activities including centralized corporate functions ✓ Investment reprioritization, deferrals • Accelerated Strategic Procurement / Operational o Product line rationalization Excellence projects Cash Preservation • Improve inventory turns ✓ Headcount reduction • Focused on cash management o Standardization of payment terms • Continued focus on centralizing business processes ✓ Activated o In-Process ▪ Additional Levers, If Needed 3Q20 Earnings Presentation | 18

Our Profitable Growth Strategy Remains Consistent SIMPLIFY FOCUS GROW • Leverage global footprint and scale • Strengthen customer-centric approach • Reinvigorate innovation with a new while maintaining strong customer by providing a holistic set of solutions product development approach relationships • Drive commercial excellence • Leverage technology and digital • Reduce organizational structure connectivity to enhance customer complexity • Embrace and streamline operational experience excellence processes • Consolidate and rationalize footprint • Capitalize on global growth and product portfolio • Enhance accountability through a opportunities performance-based culture with • Optimize supply chain by leveraging aligned KPIs and incentives • Allocate capital effectively to drive size and scale of business greatest shareholder value 3Q20 Earnings Presentation | 19

Update on Our Transformation Progress 2019 - 2020 2019 - 2021 2020 - 2021+ SIMPLIFY ✓ Changed from subsidiary structure to align by product groups FOCUS ✓ Refreshed executive leadership team and board members ✓ Hired SVP of Operational Excellence and Chief Information Officer GROW ✓ Executed Astec Strategic ✓ Aligned financial metrics to Procurement initiative consolidating ✓ Reinvigorate focus on innovation; new management incentives supply chain Innovation Council ✓ Implementing Enterprise Data ✓ 1Q20 re-segmentation to two ▪ Enhance customer engagement segment reporting structure Analytic Platform system to consolidate reporting ▪ Global expansion ✓ Within Infrastructure Solutions, integrated five service teams into a ✓ Completed divestiture of GEFCO ▪ Profitable growth unified service and construction team; (Enid; O&G products) one support call center ▪ Margin improvement ▪ Further drive operational excellence ✓ Rationalizing three sites in Hameln, across organization ▪ Disciplined and strategic acquisitions Germany, Albuquerque, NM and ▪ Optimize product portfolio with Mequon, WI to further streamline ongoing rationalization operations ▪ Improve working capital turns – clear ✓ Completed ▪ In-Process action plan in place 3Q20 Earnings Presentation | 20

Key Investment Highlights Leadership positions within attractive niche markets in industries 1 benefitting from long-term secular trends including population growth, urbanization and aging infrastructure Industry-leading reputation for innovation, high-quality products 2 and superior customer service Recurring, high-margin aftermarket revenue driven by a large 3 global installed base Strong balance sheet and liquidity with net cash position to 4 execute through challenging market conditions; our products are essential for building infrastructure Strategic transformation with Simplify, Focus, and Grow pillars; 5 cost savings initiatives underway and new organizational structure to drive profitable growth 3Q20 Earnings Presentation | 21

Q&A 3Q20 Earnings Presentation

Contact Information STEVE ANDERSON SVP of Administration & Investor Relations, Secretary Phone: 423-553-5934 Email: sanderson@astecindustries.com 3Q20 Earnings Presentation | 23

Appendix 3Q20 Earnings Presentation

Company Targets LONG-TERM GOALS 5% - 10% > 12% > 10% > 100% > 14% REVENUE GROWTH EBITDA MARGIN EPS GROWTH Net Income ROIC FCF CONVERSION1 Create Value for Shareholders Alignment to Incentive Plan Stand through Cycles 1 Calculated by dividing LTM Adjusted FCF by Adjusted Net Income. 3Q20 Earnings Presentation | 25

Income Statement Condensed Consolidated Statements of Income (In millions, except shares in thousands and per share amounts; unaudited) Three Months Ended Nine Months Ended September 30, September 30, 2020 2019 2020 2019 Net sales $ 231.4 $ 255.8 $ 785.6 $ 886.4 Cost of sales 181.0 203.9 601.5 674.4 Gross profit 50.4 51.9 184.1 212.0 Operating expenses: Selling, general and administrative 48.8 47.6 147.8 158.6 Restructuring and asset impairment charges 2.4 0.9 11.1 1.4 Total operating expenses 51.2 48.5 158.9 160.0 Operating income (loss) (0.8) 3.4 25.2 52.0 Other income (expense): Interest expense (0.1) (0.2) (0.3) (1.3) Other income, net of expenses 1.3 0.4 2.1 1.3 Income before income taxes 0.4 3.6 27.0 52.0 Provision (benefit) from income taxes (1.2) 0.6 (4.5) 11.4 Net income 1.6 3.0 31.5 40.6 Net loss attributable to non-controlling interest — — 0.1 0.1 Net income attributable to controlling interest $ 1.6 $ 3.0 $ 31.6 $ 40.7 Earnings per common share Basic $ 0.07 $ 0.13 $ 1.40 $ 1.81 Diluted 0.07 0.13 1.38 1.79 Weighted-average shares outstanding Basic 22,615 22,523 22,593 22,510 Diluted 22,946 22,684 22,838 22,666 Note: Numbers may not foot or cross-foot due to rounding. 3Q20 Earnings Presentation | 26
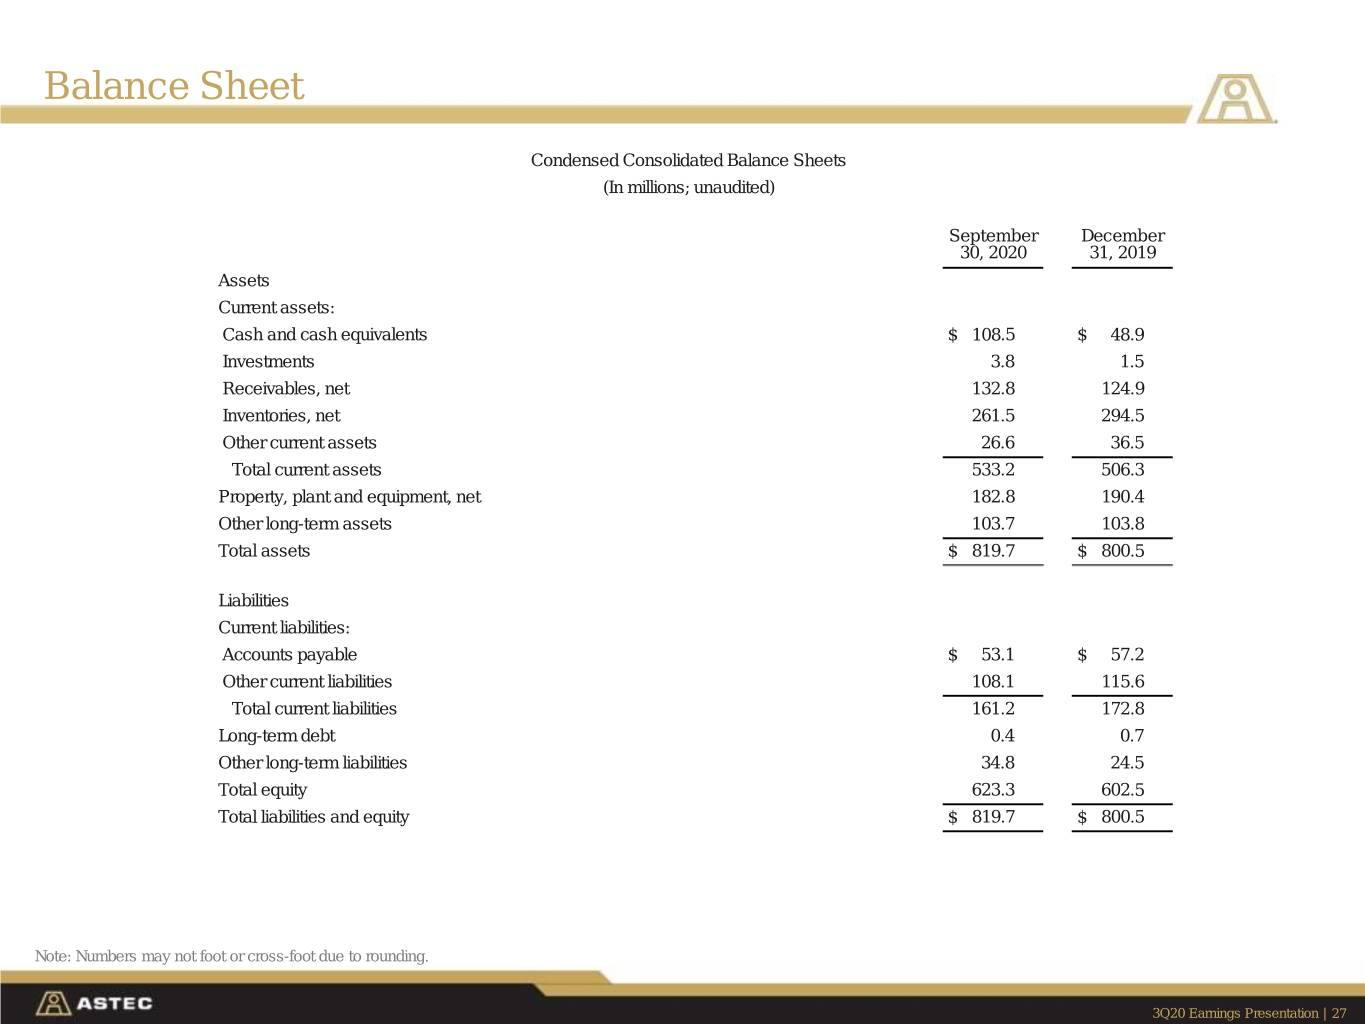
Balance Sheet Condensed Consolidated Balance Sheets (In millions; unaudited) September December 30, 2020 31, 2019 Assets Current assets: Cash and cash equivalents $ 108.5 $ 48.9 Investments 3.8 1.5 Receivables, net 132.8 124.9 Inventories, net 261.5 294.5 Other current assets 26.6 36.5 Total current assets 533.2 506.3 Property, plant and equipment, net 182.8 190.4 Other long-term assets 103.7 103.8 Total assets $ 819.7 $ 800.5 Liabilities Current liabilities: Accounts payable $ 53.1 $ 57.2 Other current liabilities 108.1 115.6 Total current liabilities 161.2 172.8 Long-term debt 0.4 0.7 Other long-term liabilities 34.8 24.5 Total equity 623.3 602.5 Total liabilities and equity $ 819.7 $ 800.5 Note: Numbers may not foot or cross-foot due to rounding. 3Q20 Earnings Presentation | 27
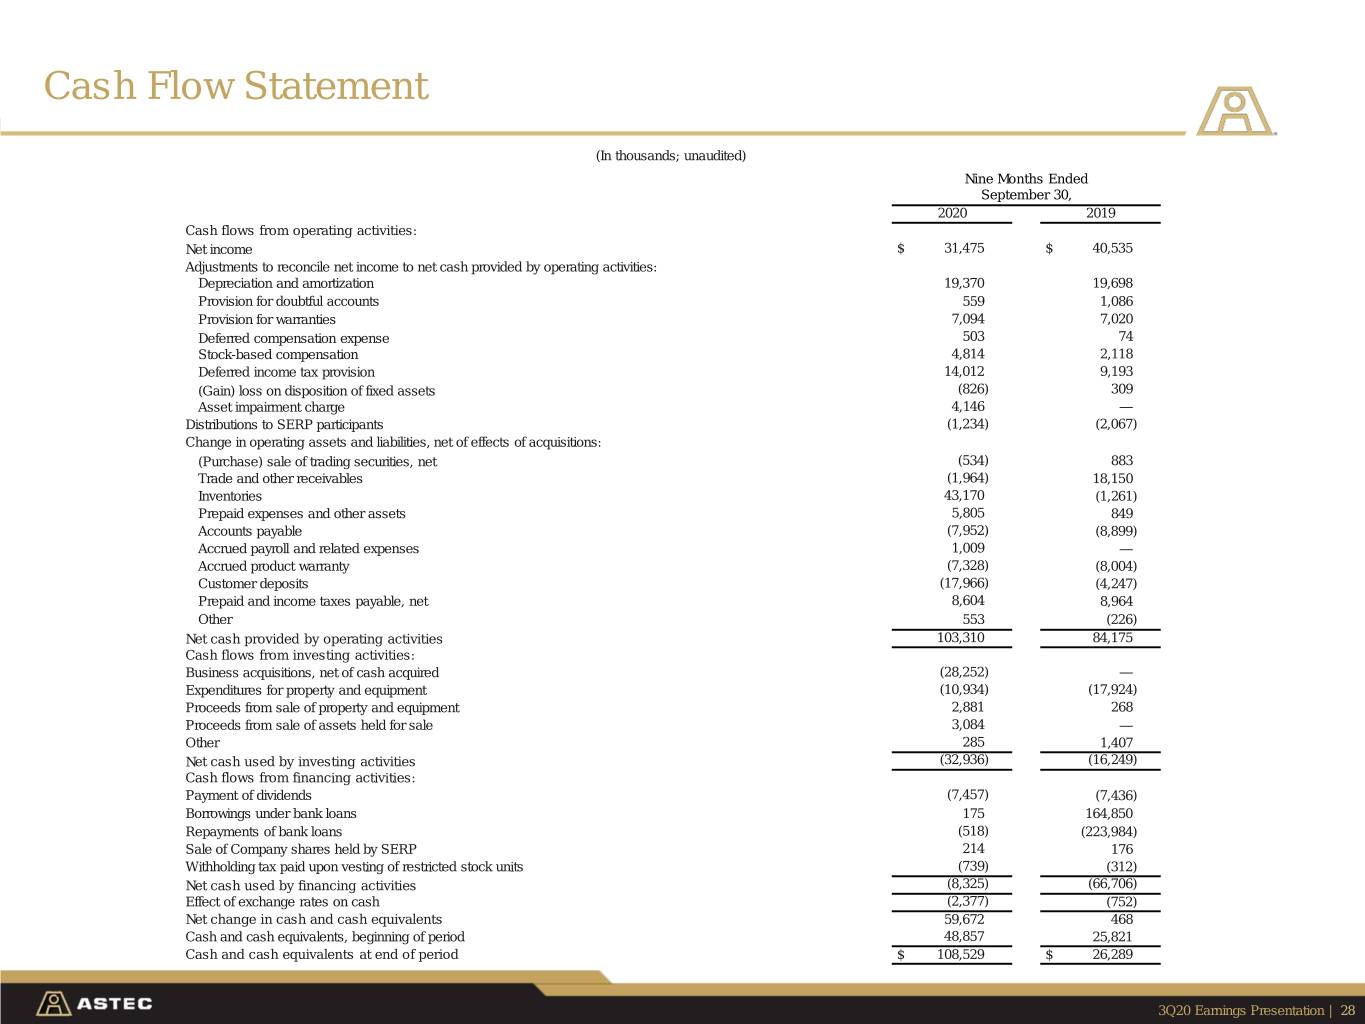
Cash Flow Statement (In thousands; unaudited) Nine Months Ended September 30, 2020 2019 Cash flows from operating activities: Net income $ 31,475 $ 40,535 Adjustments to reconcile net income to net cash provided by operating activities: Depreciation and amortization 19,370 19,698 Provision for doubtful accounts 559 1,086 Provision for warranties 7,094 7,020 Deferred compensation expense 503 74 Stock-based compensation 4,814 2,118 Deferred income tax provision 14,012 9,193 (Gain) loss on disposition of fixed assets (826) 309 Asset impairment charge 4,146 — Distributions to SERP participants (1,234) (2,067) Change in operating assets and liabilities, net of effects of acquisitions: (Purchase) sale of trading securities, net (534) 883 Trade and other receivables (1,964) 18,150 Inventories 43,170 (1,261) Prepaid expenses and other assets 5,805 849 Accounts payable (7,952) (8,899) Accrued payroll and related expenses 1,009 — Accrued product warranty (7,328) (8,004) Customer deposits (17,966) (4,247) Prepaid and income taxes payable, net 8,604 8,964 Other 553 (226) Net cash provided by operating activities 103,310 84,175 Cash flows from investing activities: Business acquisitions, net of cash acquired (28,252) — Expenditures for property and equipment (10,934) (17,924) Proceeds from sale of property and equipment 2,881 268 Proceeds from sale of assets held for sale 3,084 — Other 285 1,407 Net cash used by investing activities (32,936) (16,249) Cash flows from financing activities: Payment of dividends (7,457) (7,436) Borrowings under bank loans 175 164,850 Repayments of bank loans (518) (223,984) Sale of Company shares held by SERP 214 176 Withholding tax paid upon vesting of restricted stock units (739) (312) Net cash used by financing activities (8,325) (66,706) Effect of exchange rates on cash (2,377) (752) Net change in cash and cash equivalents 59,672 468 Cash and cash equivalents, beginning of period 48,857 25,821 Cash and cash equivalents at end of period $ 108,529 $ 26,289 3Q20 Earnings Presentation | 28
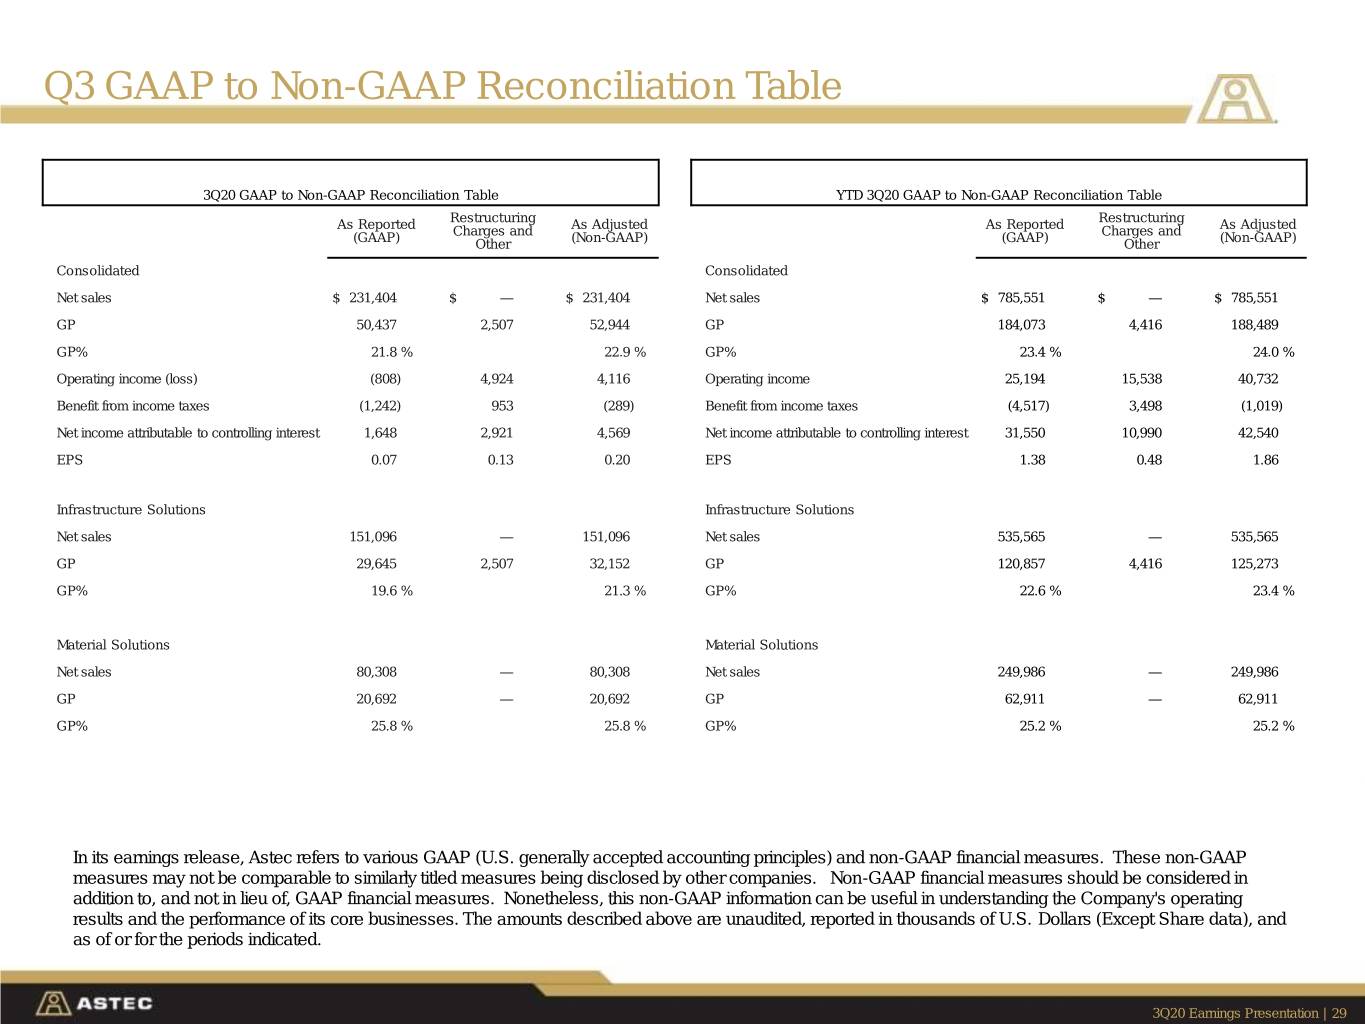
Q3 GAAP to Non-GAAP Reconciliation Table 3Q20 GAAP to Non-GAAP Reconciliation Table YTD 3Q20 GAAP to Non-GAAP Reconciliation Table Restructuring Restructuring As Reported Charges and As Adjusted As Reported Charges and As Adjusted (GAAP) Other (Non-GAAP) (GAAP) Other (Non-GAAP) Consolidated Consolidated Net sales $ 231,404 $ — $ 231,404 Net sales $ 785,551 $ — $ 785,551 GP 50,437 2,507 52,944 GP 184,073 4,416 188,489 GP% 21.8 % 22.9 % GP% 23.4 % 24.0 % Operating income (loss) (808) 4,924 4,116 Operating income 25,194 15,538 40,732 Benefit from income taxes (1,242) 953 (289) Benefit from income taxes (4,517) 3,498 (1,019) Net income attributable to controlling interest 1,648 2,921 4,569 Net income attributable to controlling interest 31,550 10,990 42,540 EPS 0.07 0.13 0.20 EPS 1.38 0.48 1.86 Infrastructure Solutions Infrastructure Solutions Net sales 151,096 — 151,096 Net sales 535,565 — 535,565 GP 29,645 2,507 32,152 GP 120,857 4,416 125,273 GP% 19.6 % 21.3 % GP% 22.6 % 23.4 % Material Solutions Material Solutions Net sales 80,308 — 80,308 Net sales 249,986 — 249,986 GP 20,692 — 20,692 GP 62,911 — 62,911 GP% 25.8 % 25.8 % GP% 25.2 % 25.2 % In its earnings release, Astec refers to various GAAP (U.S. generally accepted accounting principles) and non-GAAP financial measures. These non-GAAP measures may not be comparable to similarly titled measures being disclosed by other companies. Non-GAAP financial measures should be considered in addition to, and not in lieu of, GAAP financial measures. Nonetheless, this non-GAAP information can be useful in understanding the Company's operating results and the performance of its core businesses. The amounts described above are unaudited, reported in thousands of U.S. Dollars (Except Share data), and as of or for the periods indicated. 3Q20 Earnings Presentation | 29

GAAP vs Non-GAAP Adj. EPS Reconciliation (In thousands, except share and per share amounts; unaudited) Three Months Ended Nine Months Ended September 30, September 30, 2020 2019 2020 2019 Net income attributable to controlling interest $ 1,648 $ 3,010 $ 31,550 $ 40,662 Plus: Restructuring and other 3,874 875 12,842 (18,569) Plus: Goodwill impairment — — 1,646 — Less: Benefit (provision) from income taxe (953) (132) (3,498) 4,598 Adjusted net income attributable to controlling interest $ 4,569 $ 3,753 $ 42,540 $ 26,691 Diluted EPS $ 0.07 $ 0.13 $ 1.38 $ 1.79 Plus: Restructuring and other 0.17 0.04 0.56 (0.81) Plus: Goodwill impairment — — 0.07 — Less: Benefit (provision) from income taxes (0.04) — (0.15) 0.20 Adjusted EPS $ 0.20 $ 0.17 $ 1.86 $ 1.18 In its earnings release, Astec refers to various GAAP (U.S. generally accepted accounting principles) and non-GAAP financial measures. These non-GAAP measures may not be comparable to similarly titled measures being disclosed by other companies. Non-GAAP financial measures should be considered in addition to, and not in lieu of, GAAP financial measures. Nonetheless, this non-GAAP information can be useful in understanding the Company's operating results and the performance of its core businesses. The amounts described above are unaudited, reported in thousands of U.S. Dollars (Except Share data), and as of or for the periods indicated. 3Q20 Earnings Presentation | 30
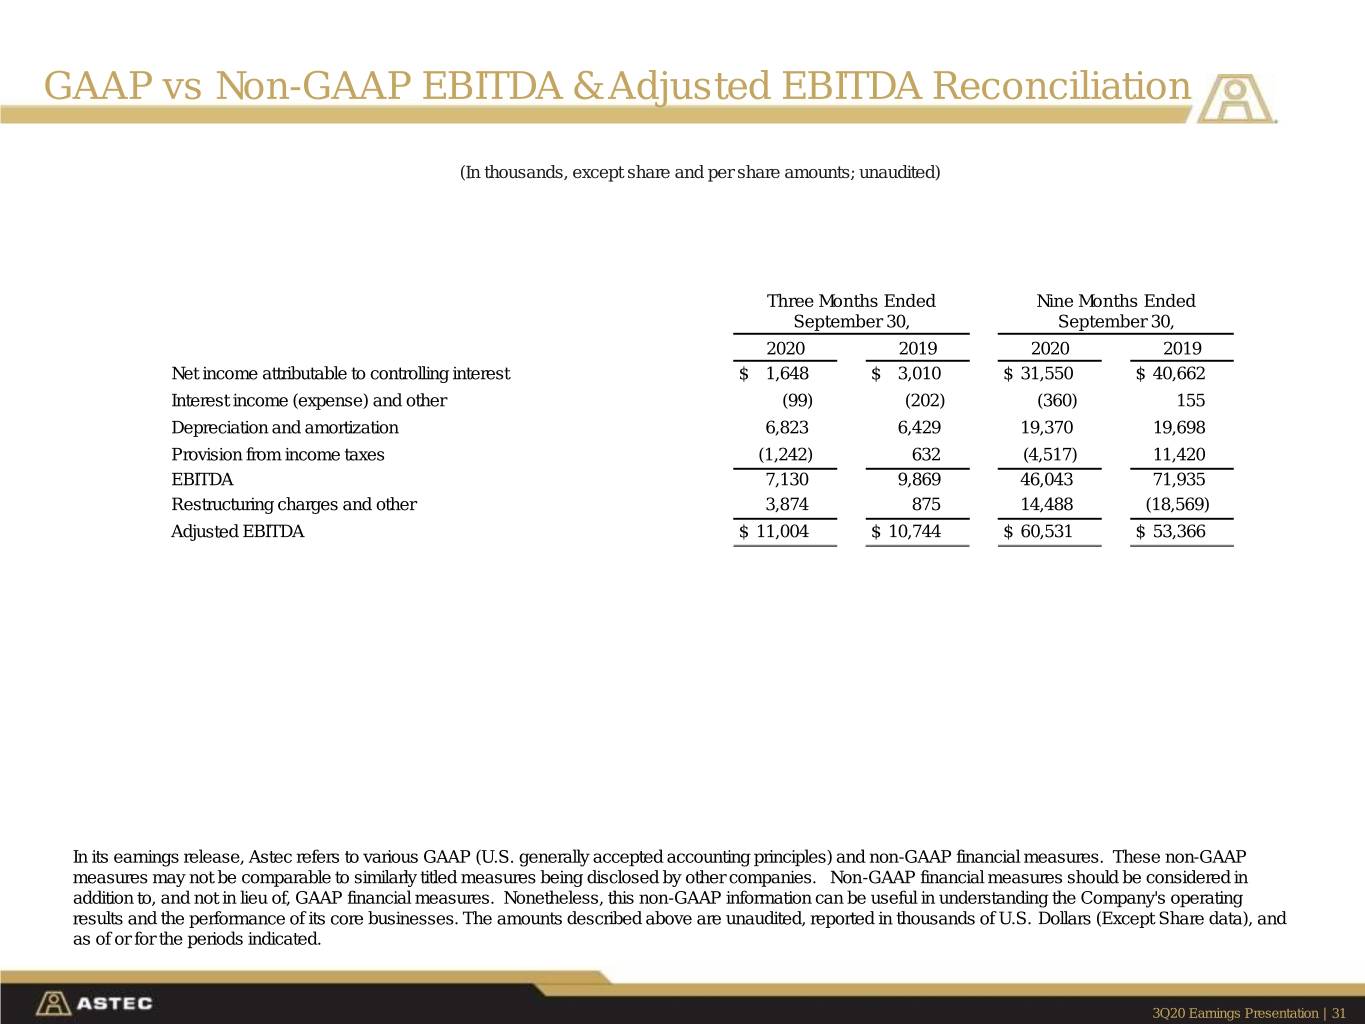
GAAP vs Non-GAAP EBITDA & Adjusted EBITDA Reconciliation (In thousands, except share and per share amounts; unaudited) Three Months Ended Nine Months Ended September 30, September 30, 2020 2019 2020 2019 Net income attributable to controlling interest $ 1,648 $ 3,010 $ 31,550 $ 40,662 Interest income (expense) and other (99) (202) (360) 155 Depreciation and amortization 6,823 6,429 19,370 19,698 Provision from income taxes (1,242) 632 (4,517) 11,420 EBITDA 7,130 9,869 46,043 71,935 Restructuring charges and other 3,874 875 14,488 (18,569) Adjusted EBITDA $ 11,004 $ 10,744 $ 60,531 $ 53,366 In its earnings release, Astec refers to various GAAP (U.S. generally accepted accounting principles) and non-GAAP financial measures. These non-GAAP measures may not be comparable to similarly titled measures being disclosed by other companies. Non-GAAP financial measures should be considered in addition to, and not in lieu of, GAAP financial measures. Nonetheless, this non-GAAP information can be useful in understanding the Company's operating results and the performance of its core businesses. The amounts described above are unaudited, reported in thousands of U.S. Dollars (Except Share data), and as of or for the periods indicated. 3Q20 Earnings Presentation | 31