Washington, D.C. 20549
Thomas H. Dinsmore
ELLSWORTH FUND LTD.
Steven B. King, Esq.
ELLSWORTH FUND LTD.
2011 Annual Report
September 30, 2011
2011 Annual Report
September 30, 2011
Ellsworth Fund Ltd. operates as a closed-end, diversified management investment company and invests primarily in convertible securities, with the objectives of providing income and the potential for capital appreciation; which objectives the Fund considers to be relatively equal, over the long-term, due to the nature of the securities in which it invests.
Highlights
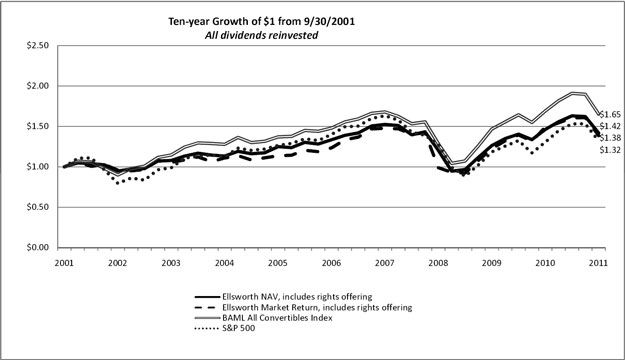
Performance through September 30, 2011 with dividends reinvested
| | | Calendar | | | | | | Annualized | | | 10 Year | |
| | | YTD | | | 1 Year | | | 5 Years | | | 10 Years | | | Volatility * | |
| Ellsworth market price | | | (10.31 | )% | | | (7.13 | )% | | | 2.29 | % | | | 3.10 | % | | | 16.38 | % |
| Ellsworth net asset value | | | (8.73 | ) | | | (2.82 | ) | | | 1.64 | | | | 3.82 | | | | 12.61 | |
Bank of America Merrill Lynch All U.S. Convertibles Index | | | (9.08 | ) | | | (2.31 | ) | | | 2.24 | | | | 5.15 | | | | 12.72 | |
| S&P 500 Index | | | (8.69 | ) | | | 1.14 | | | | (1.18 | ) | | | 2.81 | | | | 16.09 | |
Bank of America Merrill Lynch All U.S. Convertibles Index and S&P 500® Index performance in the table above are from Bloomberg L.P. pricing service.
Ellsworth’s performance has not been adjusted for the fiscal 2004 rights offering; net asset value dilution was 2.21%. Performance data represents past results and does not reflect future performance.
* Volatility is a measure of risk based on the standard deviation of the return. The greater the volatility, the greater the chance of a profit or risk of a loss.
Quarterly History of NAV and Market Price
| | | Net Asset Values | | | Market Prices | |
| Qtr. Ended | | High | | | Low | | | Close | | | High | | | Low | | | Close | |
| 12/31/10 | | $ | 8.38 | | | $ | 7.93 | | | $ | 8.38 | | | $ | 7.35 | | | $ | 7.01 | | | $ | 7.35 | |
| 3/31/11 | | | 8.73 | | | | 8.42 | | | | 8.71 | | | | 7.65 | | | | 7.34 | | | | 7.58 | |
| 6/30/11 | | | 8.88 | | | | 8.35 | | | | 8.61 | | | | 7.80 | | | | 7.36 | | | | 7.54 | |
| 9/30/11 | | | 8.74 | | | | 7.46 | | | | 7.46 | | | | 7.71 | | | | 6.30 | | | | 6.43 | |
Dividend Distributions (12 Months)
| Record | | Payment | | | | | Capital | | | | | | Corporate | |
| Date | | Date | | Income | | | Gains | | | Total | | | Deduction # | |
| 10/21/10 | | 11/24/10 | | | $ | 0.071 | | | $ | — | | | $ | 0.071 | | | | 27% | |
| 2/10/11 | | 2/24/11 | | | | 0.061 | | | | — | | | | 0.061 | | | | 36 | |
| 5/12/11 | | 5/26/11 | | | | 0.061 | | | | — | | | | 0.061 | | | | 36 | |
| 8/11/11 | | 8/25/11 | | | | 0.061 | | | | — | | | | 0.061 | | | | 36 | |
| | | | | | $ | 0.254 | | | $ | — | | | $ | 0.254 | | | | | |
# Percentage of each ordinary income distribution qualifying for the corporate dividend received tax deduction.
ELLSWORTH FUND LTD. 2011 ANNUAL REPORT TO SHAREHOLDERS
To Our Shareholders
November 21, 2011
In the three months ended September 30, 2011, U.S. and Global equities markets endured their worst quarter in three years. The overall volatility of equity markets and the continued decline in interest rates in the U.S. has affected the convertible securities market. Reducing debt and fixed charges has become an important goal for many corporations; consequently, we have seen a drop in issuance of convertible securities as potential issuers are reluctant to come to market.
Although the convertible securities market is still a good place to find appropriate investments, it has become narrower in scope. As a result of this trend, Ellsworth Fund has been expanding its exposure to common stocks with significant dividend yields. We anticipate that convertible securities will continue to make up the vast majority of our holdings for the foreseeable future (they are currently over 85%); however, we expect to also continue using dividend paying common stocks to broaden the portfolio’s exposure to companies and industries with poor convertible securities exposure.
As of October 31, 2011 the cumulative value of the Bank of America Merrill Lynch All U.S. Convertibles Index (BAML Index) was $201 billion, down from $232 billion at year end 2010. The Index added 30 new issues worth $8.2 billion over the six months ended October 31, 2011. There are 525 issues in the BAML Index which represent approximately 89% of the dollar-denominated U.S. convertible securities market. The index has an average current yield of 3.53% and a premium-to-conversion value of 52%. The average equity sensitivity measure (parity delta) of the index has dropped further to 0.58, implying the index is less sensitive to stock price movements. We believe that convertible securities, taken in the aggregate, are fairly valued. There are, however, numerous issues that appear undervalued.
Performance for the Fund’s fourth fiscal quarter of 2011 (ended September 30) was enhanced by exposure to the Utilities and Financial Services industries. Performance was held back, however, by the Fund’s exposure to the Energy and Transportation industries.
The Fund’s net asset value (NAV) outperformed the BAML Index for the calendar year-to-date, one- and five-year periods, but underperformed for the ten-year period ended September 30, 2011 (when the NAV is adjusted for the fiscal 2004 rights offering and the fact that the Index does not include expenses). The Fund’s market return outperformed the BAML Index for the five years ended September 30, 2011 but underperformed for the calendar year-to-date, one- and ten-year periods.
Ellsworth seeks to provide total returns to shareholders that compare favorably to those provided by equity markets, but with less volatility. We therefore note that the Fund’s NAV and shares outperformed equities, as represented by the S&P 500® Index, for the five- and ten- year periods presented; the NAV did so with lower 10-year volatility, as measured by standard deviation, than that experienced by the S&P 500® Index. The Fund’s NAV return was also less volatile than the BAML Index for the 10 years, as measured by standard deviation.
We have put an updated version of our White Paper on Convertible Securities on our website. This document is intended to provide a solid introduction to the U.S. convertible securities market.
continued on the following page
Page 1
ELLSWORTH FUND LTD. 2011 ANNUAL REPORT TO SHAREHOLDERS
To Our Shareholders (continued)
At its October 17, 2011 meeting, the Board of Trustees declared a distribution of $0.061 per share, consisting of undistributed net investment income. The distribution is payable on November 23, 2011 to shareholders of record on October 28, 2011.
The 2012 annual meeting of shareholders will be held on January 13, 2012. Information about the location of the meeting will be included in the proxy statement, scheduled to be mailed to shareholders on November 28, 2011. All shareholders are welcome to attend and we hope to see you there.
Thomas H. Dinsmore
Chairman of the Board
Page 2
ELLSWORTH FUND LTD. 2011 ANNUAL REPORT TO SHAREHOLDERS
Largest Investment Holdings by underlying common stock
| | | Value | | | % Total | |
| | | (Note 1) | | | Net Assets | |
| | | | | | | |
| Intel Corp. | | $ | 2,709,375 | | | | 2.7 | % |
Intel is a semiconductor chip maker. The company is engaged in developing advanced integrated digital technology products, primarily integrated circuits, for industries such as computing and communications. | | | | | | | | |
| | | | | | | | | |
| EMC Corp. | | | 2,690,875 | | | | 2.7 | |
EMC and its subsidiaries develop, deliver and support the information technology (IT) industry’s range of information infrastructure technologies and solutions. | | | | | | | | |
| | | | | | | | | |
| Nuance Communications, Inc. | | | 2,525,000 | | | | 2.5 | |
Nuance is a provider of speech, imaging and keypad solutions for businesses, organizations and consumers worldwide. The company’s solutions are used for tasks and services, such as requesting information from a phone-based, self-service solution, dictating medical records, searching the mobile Web by voice, entering a destination into a navigation system, or working with portable document format (PDF) documents. | | | | | | | | |
| | | | | | | | | |
| Chesapeake Energy Corp. | | | 2,225,000 | | | | 2.2 | |
Produces oil and natural gas. The company’s operations are focused on developmental drilling and producing property acquisitions in onshore natural gas producing areas of the United States and Canada. | | | | | | | | |
| | | | | | | | | |
| Equinix, Inc. | | | 2,220,625 | | | | 2.2 | |
Equinix provides core Internet exchange services to networks, Internet infrastructure companies, enterprises and content providers. | | | | | | | | |
| | | | | | | | | |
| Verizon Communications Inc. | | | 2,208,000 | | | | 2.2 | |
Verizon is a holding company, and through its subsidiaries is a provider of communications services. These include wireless voice and data services and equipment sales, and voice, Internet access, broadband video and data which are provided to consumer, business and government customers across the United States. | | | | | | | | |
| | | | | | | | | |
| Wells Fargo & Company | | | 2,066,120 | | | | 2.1 | |
Wells Fargo is a diversified financial services company, providing retail, commercial and corporate banking services through banking stores located in 39 states and the District of Columbia. | | | | | | | | |
| | | | | | | | | |
| AT&T Inc. | | | 1,996,400 | | | | 2.0 | |
AT&T Inc. is a holding company, and provides telecommunications services in the United States and worldwide. These services include wireless communications, local exchange services, long-distance services, data/broadband and Internet services, video services, managed networking, wholesale services and directory advertising and publishing. | | | | | | | | |
| | | | | | | | | |
| SBA Communications Corp. | | | 1,691,875 | | | | 1.7 | |
SBA owns and operates wireless communications infrastructure in the United States. The company offers both site leasing and site development services. | | | | | | | | |
| | | | | | | | | |
| Total | | $ | 20,333,270 | | | | 20.3 | % |
Page 3
ELLSWORTH FUND LTD. 2011 ANNUAL REPORT TO SHAREHOLDERS
Major Industry Exposure
| | | % Total | |
| | | Net Assets | |
| | | | |
| Telecommunications | | | 12.7 | % |
| Energy | | | 11.6 | |
| Pharmaceuticals | | | 10.5 | |
| Financial Services | | | 8.5 | |
| Computer Software | | | 7.2 | |
| Semiconductors | | | 6.9 | |
| Banking/Savings and Loan | | | 5.9 | |
| Healthcare | | | 5.5 | |
| Metals and Mining | | | 5.2 | |
| Computer Hardware | | | 3.0 | |
| | | | | |
| Total | | | 77.0 | % |
Major Portfolio Changes by underlying common stock |
| Six months ended September 30, 2011 |
| ADDITIONS | | REDUCTIONS |
| | | |
| A123 Systems, Inc. | | ADC Telecommunications, Inc. |
| | | |
| Chesapeake Energy Corp. | | Cephalon, Inc. |
| | | |
| Digital River, Inc. | | Charles River Laboratories Int’l, Inc. |
| | | |
| Equinix, Inc. | | CommScope, Inc. |
| | | |
| Fifth Third Bancorp | | Equinix, Inc. |
| | | |
| General Motors Co. | | Ford Motor Co. |
| | | |
| JinkoSolar Holding Co., Ltd. | | Kinetic Concepts, Inc. |
| | | |
| Metlife, Inc. | | LifePoint Hospitals, Inc. |
| | | |
| Micron Technology, Inc. | | LSB Industries, Inc. |
| | | |
| NextEra Energy, Inc. | | McMoRan Exploration Co. |
| | | |
| PPL Corp. | | NII Holdings, Inc. |
| | | |
| SBA Communications Corp. | | Owens-Illinois, Inc. |
| | | |
| Stanley Black & Decker, Inc. | | SBA Communications Corp. |
| | | |
| SunPower Corp. | | SunPower Corp. |
| | | |
| United Continental Holdings, Inc. | | Titan International, Inc. |
| | | |
| WebMD Health Corp. | | United Continental Holdings, Inc. |
Page 4
ELLSWORTH FUND LTD. 2011 ANNUAL REPORT TO SHAREHOLDERS
Portfolio of Investments September 30, 2011
| | | Principal | | | Identified | | | Value | |
| | | Amount | | | Cost | | | (Note 1) | |
| CONVERTIBLE BONDS AND NOTES - 61.3% | | | | | | | | | |
| | | | | | | | | | |
| Aerospace and Defense - 0.5% | | | | | | | | | |
| Kaman Corp., 3.25%, Due 11/15/17, (BBB) | | $ | 500,000 | | | $ | 527,864 | | | $ | 536,250 | |
| | | | | | | | | | | | | |
| Automotive - 1.3% | | | | | | | | | | | | |
| A123 Systems, Inc., 3.75%, Due 4/15/16, (BB) | | | 1,000,000 | | | | 1,000,000 | | | | 652,500 | |
| Titan International, Inc., 5.625%, Due 1/15/17, (B) | | | 375,000 | | | | 386,817 | | | | 658,125 | |
| | | | | | | | 1,386,817 | | | | 1,310,625 | |
| Computer Hardware - 3.0% | | | | | | | | | | | | |
| EMC Corp., 1.75%, Due 12/1/13, (A) | | | 1,900,000 | | | | 2,033,761 | | | | 2,690,875 | |
| NetApp, Inc., 1.75%, Due 6/1/13, (A) | | | 250,000 | | | | 372,714 | | | | 304,375 | |
| | | | | | | | 2,406,475 | | | | 2,995,250 | |
| Computer Software - 6.7% | | | | | | | | | | | | |
| Digital River, Inc., 2.00%, Due 11/1/30, (BB) | | | 1,100,000 | | | | 1,098,423 | | | | 941,875 | |
| Electronic Arts, Inc., 0.75%, Due 7/15/16, (BBB) (1) | | | 500,000 | | | | 499,155 | | | | 482,500 | |
| Microsoft Corp., Due 6/15/13, (AAA) (2) | | | 500,000 | | | | 500,000 | | | | 508,125 | |
| Nuance Communications, Inc., 2.75%, Due 8/15/27, (BB) | | | 2,000,000 | | | | 2,131,120 | | | | 2,525,000 | |
| RightNow Technologies, Inc., 2.50%, Due 11/15/30, (NR) | | | 250,000 | | | | 250,000 | | | | 323,750 | |
| Rovi Corp., 2.625%, Due 2/15/40, (BBB) | | | 750,000 | | | | 854,555 | | | | 870,938 | |
| THQ, Inc., 5.00%, Due 8/15/14, (BB) | | | 750,000 | | | | 711,212 | | | | 651,562 | |
| WebMD Health Corp., 2.50%, Due 1/31/18, (BBB) | | | 500,000 | | | | 495,469 | | | | 406,875 | |
| | | | | | | | 6,539,934 | | | | 6,710,625 | |
| Construction Material - 0.5% | | | | | | | | | | | | |
| CEMEX, S.A.B. de C.V., 4.875%, Due 3/15/15, (NR) | | | 1,000,000 | | | | 1,030,200 | | | | 478,750 | |
| | | | | | | | | | | | | |
| Consumer Goods - 0.8% | | | | | | | | | | | | |
| Iconix Brand Group, Inc., 2.50%, Due 6/1/16, (A) (1) | | | 500,000 | | | | 493,460 | | | | 468,750 | |
| Regis Corp., 5.00%, Due 7/15/14, (BB) | | | 250,000 | | | | 250,000 | | | | 291,562 | |
| | | | | | | | 743,460 | | | | 760,312 | |
| Data Processing - 0.4% | | | | | | | | | | | | |
| CSG Systems International, Inc., 3.00%, Due 3/1/17, (A) | | | 500,000 | | | | 530,331 | | | | 442,500 | |
| | | | | | | | | | | | | |
| Energy - 4.9% | | | | | | | | | | | | |
| Endeavour International Corp., 5.50%, Due 7/15/16, (BB) (1) | | | 500,000 | | | | 500,000 | | | | 418,200 | |
| Goodrich Petroleum Corp., 5.00%, Due 10/1/29, (CCC) | | | 1,000,000 | | | | 1,014,090 | | | | 906,250 | |
| JinkoSolar Holding Co. Ltd., 4.00%, Due 5/15/16, (NR) (1) | | | 1,000,000 | | | | 1,000,000 | | | | 291,250 | |
| Oil States International, Inc., 2.375%, Due 7/1/25, (BB) | | | 250,000 | | | | 209,077 | | | | 406,562 | |
| Renesola Ltd., 4.125%, Due 3/15/18, (NR) (1) | | | 500,000 | | | | 500,000 | | | | 217,500 | |
| SunPower Corp., 4.75%, Due 4/15/14, (BB) | | | 500,000 | | | | 544,254 | | | | 437,500 | |
| SunPower Corp., 4.50%, Due 3/15/15, (BB) | | | 1,250,000 | | | | 1,270,060 | | | | 1,057,812 | |
| Transocean Ltd., 1.50%, Due 12/15/37, (BBB) | | | 500,000 | | | | 461,787 | | | | 486,875 | |
| Trina Solar Ltd., 4.00%, Due 7/15/13, (NR) | | | 1,000,000 | | | | 1,003,359 | | | | 623,750 | |
| | | | | | | | 6,502,627 | | | | 4,845,699 | |
| Financial Services - 5.9% | | | | | | | | | | | | |
| Annaly Capital Management, Inc., 4.00%, Due 2/15/15, (NR) | | | 750,000 | | | | 743,331 | | | | 863,438 | |
| BGC Partners, Inc., 4.50%, Due 7/15/16, (BBB) (1) | | | 250,000 | | | | 250,000 | | | | 226,250 | |
| Euronet Worldwide, Inc., 3.50%, Due 10/15/25, (BB) (3) | | | 1,000,000 | | | | 1,367,274 | | | | 995,000 | |
| Knight Capital Group, Inc., 3.50%, Due 3/15/15, (NR) | | | 750,000 | | | | 751,602 | | | | 703,125 | |
| National Financial Partners Corp., 4.00%, Due 6/15/17, (NR) | | | 750,000 | | | | 750,000 | | | | 812,812 | |
| Old Republic International Corp., 8.00%, Due 5/15/12, (BBB) | | | 1,250,000 | | | | 1,267,473 | | | | 1,276,562 | |
| Tower Group, Inc., 5.00%, Due 9/15/14, (NR) | | | 1,000,000 | | | | 1,068,313 | | | | 1,050,000 | |
| | | | | | | | 6,197,993 | | | | 5,927,187 | |
| Foods - 0.5% | | | | | | | | | | | | |
| Chiquita Brands International, Inc., 4.25%, Due 8/15/16, (B) | | | 581,000 | | | | 565,535 | | | | 519,995 | |
| | | | | | | | | | | | | |
| Healthcare - 5.5% | | | | | | | | | | | | |
| Chemed Corp., 1.875%, Due 5/15/14, (AA) | | | 890,000 | | | | 881,185 | | | | 887,775 | |
| China Medical Technologies, Inc., 4.00%, Due 8/15/13, (NR) | | | 1,100,000 | | | | 1,075,982 | | | | 706,750 | |
| Insulet Corp., 3.75%, Due 6/15/16, (BB) | | | 500,000 | | | | 505,356 | | | | 460,000 | |
| Integra LifeSciences Holdings Corp., 2.375%, Due 6/1/12, (BBB) (1) | | | 567,000 | | | | 557,052 | | | | 564,165 | |
continued
See accompanying notes to financial statements
Page 5
ELLSWORTH FUND LTD. 2011 ANNUAL REPORT TO SHAREHOLDERS
Portfolio of Investments September 30, 2011 (continued)
| | | Principal | | | Identified | | | Value | |
| | | Amount | | | Cost | | | (Note 1) | |
| CONVERTIBLE BONDS AND NOTES - continued | | | | | | | | | |
| | | | | | | | | | |
| Healthcare - continued | | | | | | | | | |
| Integra LifeSciences Holdings Corp., 1.625%, Due 12/15/16, (BBB) (1) | | $ | 750,000 | | | $ | 717,956 | | | $ | 683,438 | |
| Kinetic Concepts, Inc., 3.25%, Due 4/15/15, (BB) | | | 500,000 | | | | 500,000 | | | | 705,625 | |
| NuVasive, Inc., 2.75%, Due 7/1/17, (BB) | | | 250,000 | | | | 250,300 | | | | 210,000 | |
| Omnicare, Inc., 3.25%, Due 12/15/35, (B) (3) | | | 254,000 | | | | 332,607 | | | | 230,822 | |
| Sonosite, Inc., 3.75%, Due 7/15/14, (BBB) | | | 1,000,000 | | | | 961,613 | | | | 1,057,500 | |
| | | | | | | | 5,782,051 | | | | 5,506,075 | |
| Machinery - 0.5% | | | | | | | | | | | | |
| Chart Industries, Inc., 2.00%, Due 8/1/18, (B) | | | 500,000 | | | | 502,752 | | | | 467,500 | |
| | | | | | | | | | | | | |
| Metals and Mining - 3.1% | | | | | | | | | | | | |
| Jaguar Mining, Inc., 4.50%, Due 11/1/14, (BB) | | | 525,000 | | | | 523,590 | | | | 429,188 | |
| Kaiser Aluminum Corp., 4.50%, Due 4/1/15, (BB) | | | 1,000,000 | | | | 1,017,542 | | | | 1,137,700 | |
| Northgate Minerals Corp., 3.50%, Due 10/1/16, (NR) | | | 600,000 | | | | 605,494 | | | | 666,750 | |
| RTI International Metals, Inc., 3.00%, Due 12/1/15, (BB) | | | 475,000 | | | | 492,606 | | | | 475,000 | |
| United States Steel Corp., 4.00%, Due 5/15/14, (BB) | | | 375,000 | | | | 535,850 | | | | 392,812 | |
| | | | | | | | 3,175,082 | | | | 3,101,450 | |
| Pharmaceuticals - 8.0% | | | | | | | | | | | | |
| Akorn, Inc., 3.50%, Due 6/1/16, (AA) (1) | | | 250,000 | | | | 250,000 | | | | 281,875 | |
| Amgen, Inc., 0.375%, Due 2/1/13, (A) | | | 1,000,000 | | | | 995,305 | | | | 987,500 | |
| Amylin Pharmaceuticals, Inc., 3.00%, Due 6/15/14, (BB) | | | 500,000 | | | | 462,890 | | | | 447,500 | |
| Cubist Pharmaceuticals, Inc., 2.25%, Due 6/15/13, (AA) | | | 750,000 | | | | 743,354 | | | | 943,125 | |
| Gilead Sciences, Inc., 1.00%, Due 5/1/14, (A) | | | 750,000 | | | | 774,805 | | | | 814,688 | |
| Gilead Sciences, Inc., 1.625%, Due 5/1/16, (A) | | | 750,000 | | | | 791,435 | | | | 856,875 | |
| Intermune, Inc., 2.50%, Due 9/15/18, (BB) | | | 50,000 | | | | 50,000 | | | | 46,970 | |
| Millipore Corp. (Merck KGA), 3.75%, Due 6/1/26, (BBB) (3,4) | | | 750,000 | | | | 786,393 | | | | 894,675 | |
| Mylan, Inc., 1.25%, Due 3/15/12, (BB) | | | 1,000,000 | | | | 1,003,029 | | | | 1,002,500 | |
| Mylan, Inc., 3.75%, Due 9/15/15, (BB) | | | 250,000 | | | | 398,684 | | | | 363,750 | |
| Onyx Pharmaceuticals, Inc., 4.00%, Due 8/15/16, (BBB) | | | 750,000 | | | | 770,737 | | | | 848,438 | |
| Salix Pharmaceuticals, Inc., 2.75%, Due 5/15/15, (A) | | | 500,000 | | | | 523,766 | | | | 500,000 | |
| | | | | | | | 7,550,398 | | | | 7,987,896 | |
| Real Estate - 1.6% | | | | | | | | | | | | |
| Corporate Office Properties Trust, 4.25%, Due 4/15/30, (NR) | | | 500,000 | | | | 495,236 | | | | 469,375 | |
| Lexington Realty Trust, 6.00%, Due 1/15/30, (NR) | | | 1,000,000 | | | | 1,000,000 | | | | 1,140,000 | |
| | | | | | | | 1,495,236 | | | | 1,609,375 | |
| Semiconductors - 6.9% | | | | | | | | | | | | |
| Intel Corp., 2.95%, Due 12/15/35, (A) (3) | | | 1,500,000 | | | | 1,816,891 | | | | 1,528,125 | |
| Intel Corp., 3.25%, Due 8/1/39, (A) | | | 1,000,000 | | | | 1,105,672 | | | | 1,181,250 | |
| Mentor Graphics Corp., 4.00%, Due 4/1/31, (BBB) (1) | | | 250,000 | | | | 253,385 | | | | 228,438 | |
| Micron Technology, Inc., 1.50%, Due 8/1/31, (BB) (1) | | | 625,000 | | | | 579,458 | | | | 483,594 | |
| Micron Technology, Inc., 1.875%, Due 8/1/31, (BB) (1) | | | 750,000 | | | | 699,625 | | | | 577,500 | |
| Novellus Systems, Inc., 2.625%, Due 5/15/41, (A) (1,3) | | | 500,000 | | | | 501,840 | | | | 434,375 | |
| Photronics, Inc., 3.25%, Due 4/1/16, (A) (1) | | | 500,000 | | | | 495,089 | | | | 446,875 | |
| Rudolph Technologies, Inc., 3.75%, Due 7/15/16, (AA) (1) | | | 500,000 | | | | 500,000 | | | | 415,625 | |
| SanDisk Corp., 1.50%, Due 8/15/17, (BB) | | | 1,000,000 | | | | 997,343 | | | | 1,048,750 | |
| Xilinx, Inc., 2.625%, Due 6/15/17, (BBB) | | | 500,000 | | | | 563,606 | | | | 568,750 | |
| | | | | | | | 7,512,909 | | | | 6,913,282 | |
| Telecommunications - 7.6% | | | | | | | | | | | | |
| Alaska Communications Systems Group, Inc., 6.25%, Due 5/1/18, (BB) (1) | | | 750,000 | | | | 707,685 | | | | 675,938 | |
| Anixter International, Inc., 1.00%, Due 2/15/13, (B) | | | 750,000 | | | | 770,542 | | | | 767,812 | |
| Equinix, Inc., 3.00%, Due 10/15/14, (B) | | | 1,500,000 | | | | 1,587,230 | | | | 1,576,875 | |
| Equinix, Inc., 4.75%, Due 6/15/16, (B) | | | 500,000 | | | | 615,628 | | | | 643,750 | |
| Finisar Corp., 5.00%, Due 10/15/29, (NR) | | | 75,000 | | | | 77,061 | | | | 143,344 | |
| General Cable Corp., 4.50%, Due 11/15/29, (B) | | | 780,000 | | | | 933,738 | | | | 705,900 | |
| InterDigital, Inc., 2.50%, Due 3/15/16, (A) (1) | | | 375,000 | | | | 396,167 | | | | 412,969 | |
| SBA Communications Corp., 4.00%, Due 10/1/14, (BBB) | | | 500,000 | | | | 683,711 | | | | 649,375 | |
| SBA Communications Corp., 1.875%, Due 5/1/13, (BBB) | | | 1,000,000 | | | | 1,020,374 | | | | 1,042,500 | |
| TeleCommunication Systems, Inc., 4.50%, Due 11/1/14, (BB) | | | 1,000,000 | | | | 960,789 | | | | 957,500 | |
| | | | | | | | 7,752,925 | | | | 7,575,963 | |
See accompanying notes to financial statements
Page 6
ELLSWORTH FUND LTD. 2011 ANNUAL REPORT TO SHAREHOLDERS
Portfolio of Investments September 30, 2011 (continued)
| | | | | | | | | | |
| | | Principal | | | Identified | | | Value | |
| | | Amount | | | Cost | | | (Note 1) | |
| CONVERTIBLE BONDS AND NOTES - continued | | | | | | | | | |
| | | | | | | | | | |
| Transportation - 1.8% | | | | | | | | | |
| Dryships, Inc., 5.00%, Due 12/1/14, (NR) | | $ | 750,000 | | | $ | 750,000 | | | $ | 465,938 | |
| The Greenbrier Companies, Inc., 3.50%, Due 4/1/18, (BB) | | | 375,000 | | | | 384,658 | | | | 269,531 | |
| Hawaiian Holdings, Inc., 5.00%, Due 3/15/16, (BB) | | | 500,000 | | | | 512,790 | | | | 438,125 | |
| Ultrapetrol (Bahamas) Ltd., 7.25%, Due 1/15/17, (NR) (1) | | | 750,000 | | | | 757,964 | | | | 631,875 | |
| | | | | | | | 2,405,412 | | | | 1,805,469 | |
| Travel & Leisure - 1.8% | | | | | | | | | | | | |
| Home Inns & Motels Management, 2.00%, Due 12/15/15, (NR) | | | 500,000 | | | | 500,000 | | | | 380,000 | |
| MGM Resorts International, 4.25%, Due 4/15/15, (CCC) | | | 750,000 | | | | 758,920 | | | | 660,938 | |
| Morgans Hotel Group Co., 2.375%, Due 10/15/14, (BB) | | | 1,000,000 | | | | 1,012,293 | | | | 755,000 | |
| | | | | | | | 2,271,213 | | | | 1,795,938 | |
| | | | | | | | | | | | | |
| TOTAL CONVERTIBLE BONDS AND NOTES | | | | | | | 64,879,214 | | | | 61,290,141 | |
| | | | | | | | | | | | | |
| CORPORATE BONDS - 0.2% | | | | | | | | | | | | |
| | | | | | | | | | | | | |
| Finance - 0.2% | | | | | | | | | | | | |
| Lehman Brothers Holdings, Inc., 1.00%, Due 3/23/09, (NR) (5) | | | 1,500,000 | | | | 1,642,751 | | | | 225,000 | |
| | | | | | | | | | | | | |
| CONVERTIBLE PREFERRED STOCKS - 14.2% | | | | | | | | | | | | |
| | | Shares | | | | | | | | | |
| Banking/Savings and Loan - 5.9% | | | | | | | | | | | | |
| Bank of America Corp., 7.25%, (BB) | | | 1,600 | | | | 1,390,555 | | | | 1,225,584 | |
| Fifth Third Bancorp., 8.50%, (BB) | | | 12,000 | | | | 1,699,635 | | | | 1,540,560 | |
| New York Community Capital Trust V, 6.00%, (BB) | | | 24,000 | | | | 1,043,554 | | | | 1,068,000 | |
| Wells Fargo & Co., 7.50%, (A) | | | 2,000 | | | | 1,262,262 | | | | 2,066,120 | |
| | | | | | | | 5,396,006 | | | | 5,900,264 | |
| Energy - 2.8% | | | | | | | | | | | | |
| ATP Oil & Gas Corp., 8.00%, (NR) | | | 10,000 | | | | 951,875 | | | | 593,075 | |
| Chesapeake Energy Corp., 5.00%, (B) | | | 25,000 | | | | 2,264,505 | | | | 2,225,000 | |
| Whiting Petroleum Corp., 6.25%, (B) | | | 131 | | | | 13,075 | | | | 21,746 | |
| | | | | | | | 3,229,455 | | | | 2,839,821 | |
| Financial Services - 0.6% | | | | | | | | | | | | |
| Hartford Financial Services Group, Inc., 7.25%, (BB) | | | 30,000 | | | | 744,969 | | | | 577,800 | |
| | | | | | | | | | | | | |
| Foods - 0.7% | | | | | | | | | | | | |
| Bunge Ltd., 4.875%, (BB) | | | 7,500 | | | | 669,375 | | | | 690,000 | |
| | | | | | | | | | | | | |
| Real Estate - 0.5% | | | | | | | | | | | | |
| Health Care REIT, Inc., 6.50%, (BB) | | | 10,000 | | | | 500,000 | | | | 463,000 | |
| | | | | | | | | | | | | |
| Retail - 0.8% | | | | | | | | | | | | |
| Amerivon Holdings LLC, (NR) (1,4,6) | | | 572,925 | | | | 1,500,000 | | | | 760,858 | |
| Amerivon Holdings LLC, (NR) (1,4,6) | | | 272,728 | | | | 0 | | | | 2,727 | |
| | | | | | | | 1,500,000 | | | | 763,585 | |
| Telecommunications - 0.9% | | | | | | | | | | | | |
| Crown Castle International Corp., 6.25%, (B) | | | 16,000 | | | | 975,998 | | | | 942,000 | |
| | | | | | | | | | | | | |
| Tools - 1.0% | | | | | | | | | | | | |
| Stanley Black & Decker, Inc., 4.75%, (BBB) | | | 10,000 | | | | 1,060,250 | | | | 1,032,400 | |
| | | | | | | | | | | | | |
| Utilities - 1.0% | | | | | | | | | | | | |
| PPL Corp., 9.50%, (NR) | | | 18,500 | | | | 1,002,114 | | | | 1,024,900 | |
| | | | | | | | | | | | | |
| TOTAL CONVERTIBLE PREFERRED STOCKS | | | | | | | 15,078,167 | | | | 14,233,770 | |
See accompanying notes to financial statements
Page 7
ELLSWORTH FUND LTD. 2011 ANNUAL REPORT TO SHAREHOLDERS
Portfolio of Investments September 30, 2011 (continued)
| | | | | | Identified | | | Value | |
| | | Shares | | | Cost | | | (Note 1) | |
| MANDATORY CONVERTIBLE SECURITIES - 11.1% (7) | | | | | | | | | |
| | | | | | | | | | |
| Automotive - 1.4% | | | | | | | | | |
| General Motors Co., 4.75%, Due 12/1/13, (NR) | | | 40,000 | | | $ | 2,063,356 | | | $ | 1,403,200 | |
| | | | | | | | | | | | | |
| Data Processing - 0.3% | | | | | | | | | | | | |
| Unisys Corp., 6.25%, Due 3/1/14, (B) | | | 5,000 | | | | 471,589 | | | | 270,850 | |
| | | | | | | | | | | | | |
| Energy - 3.2% | | | | | | | | | | | | |
| Apache Corp., 6.00%, Due 8/1/13, (A) | | | 25,000 | | | | 1,401,796 | | | | 1,279,250 | |
| Great Plains Energy, Inc., 12.00%, Due 6/15/12, (NR) | | | 25,000 | | | | 1,362,057 | | | | 1,500,000 | |
| UBS AG Exchangeable Note (GTAT), 6.75%, Due 9/15/13, (AA) | | | 20,000 | | | | 500,000 | | | | 464,600 | |
| | | | | | | | 3,263,853 | | | | 3,243,850 | |
| Financial Services - 1.8% | | | | | | | | | | | | |
| Citigroup, Inc., 7.50%, Due 12/15/12, (A) | | | 14,000 | | | | 1,505,758 | | | | 1,114,820 | |
| MetLife, Inc., 5.00%, Due 10/8/14, (BBB) | | | 12,500 | | | | 1,036,000 | | | | 707,000 | |
| | | | | | | | 2,541,758 | | | | 1,821,820 | |
| Foods - 0.6% | | | | | | | | | | | | |
| 2009 Dole Food ACES Trust, 7.00%, Due 11/1/12, (NR) | | | 60,000 | | | | 546,765 | | | | 602,814 | |
| | | | | | | | | | | | | |
| Home Building - 0.2% | | | | | | | | | | | | |
| Beazer Homes USA, Inc., 7.25%, Due 8/15/13, (CCC) | | | 17,500 | | | | 437,500 | | | | 173,775 | |
| | | | | | | | | | | | | |
| Metals and Mining - 2.1% | | | | | | | | | | | | |
| AngloGold Ashanti Ltd., 6.00%, Due 9/15/13, (NR) | | | 5,900 | | | | 298,465 | | | | 288,923 | |
| UBS AG Exchangeable Note (SWC), 9.375%, Due 6/15/12, (AA) | | | 12,000 | | | | 305,760 | | | | 143,400 | |
| Vale Capital II (Vale S.A.), 6.75%, Due 6/15/12, (NR) | | | 25,700 | | | | 2,147,656 | | | | 1,681,396 | |
| | | | | | | | 2,751,881 | | | | 2,113,719 | |
| Transportation - 0.5% | | | | | | | | | | | | |
| 2010 Swift Mandatory Common Exchange Security Trust, 6.00%, | | | | | | | | | | | | |
| Due 12/31/13, (NR) | | | 60,000 | | | | 710,850 | | | | 459,000 | |
| | | | | | | | | | | | | |
| Utilities - 1.0% | | | | | | | | | | | | |
| NextEra Energy, Inc., 7.00%, Due 9/1/13, (NR) | | | 20,000 | | | | 1,002,500 | | | | 992,000 | |
| | | | | | | | | | | | | |
| TOTAL MANDATORY CONVERTIBLE SECURITIES (7) | | | | | | | 13,790,052 | | | | 11,081,028 | |
| | | | | | | | | | | | | |
| | | | | | | | | | | | | |
| COMMON STOCKS - 8.4% | | | | | | | | | | | | |
| | | | | | | | | | | | | |
| Computer Software - 0.5% | | | | | | | | | | | | |
| Microsoft Corp | | | 20,000 | | | | 503,600 | | | | 497,800 | |
| | | | | | | | | | | | | |
| Energy - 0.7% | | | | | | | | | | | | |
| ConocoPhillips | | | 11,282 | | | | 1,000,000 | | | | 714,376 | |
| | | | | | | | | | | | | |
| Media and Entertainment - 0.5% | | | | | | | | | | | | |
| The Walt Disney Co | | | 15,000 | | | | 454,782 | | | | 452,400 | |
| | | | | | | | | | | | | |
| Pharmaceuticals - 2.5% | | | | | | | | | | | | |
| Abbott Laboratories | | | 15,000 | | | | 738,000 | | | | 767,100 | |
| Bristol Myers Squibb Co | | | 30,000 | | | | 847,962 | | | | 941,400 | |
| Merck & Co, Inc | | | 23,651 | | | | 819,400 | | | | 773,624 | |
| | | | | | | | 2,405,362 | | | | 2,482,124 | |
| Telecommunications - 4.2% | | | | | | | | | | | | |
| AT&T, Inc | | | 70,000 | | | | 2,024,136 | | | | 1,996,400 | |
| Verizon Communications, Inc | | | 60,000 | | | | 1,842,540 | | | | 2,208,000 | |
| | | | | | | | 3,866,676 | | | | 4,204,400 | |
| | | | | | | | | | | | | |
| TOTAL COMMON STOCKS | | | | | | | 8,230,420 | | | | 8,351,100 | |
See accompanying notes to financial statements
Page 8
ELLSWORTH FUND LTD. 2011 ANNUAL REPORT TO SHAREHOLDERS
Portfolio of Investments September 30, 2011 (continued)
| | | Identified | | | Value | |
| | | Cost | | | (Note 1) | |
| | | | | | | |
| Total Convertible Bonds and Notes - 61.3% | | $ | 64,879,214 | | | $ | 61,290,141 | |
| Total Corporate Bonds and Notes - 0.2% | | | 1,642,751 | | | | 225,000 | |
| Total Convertible Preferred Stocks - 14.2% | | | 15,078,167 | | | | 14,233,770 | |
| Total Mandatory Convertible Securities - 11.1% | | | 13,790,052 | | | | 11,081,028 | |
| Total Common Stocks - 8.4% | | | 8,230,420 | | | | 8,351,100 | |
| Total Investments - 95.2% | | $ | 103,620,604 | | | | 95,181,039 | |
| | | | | | | | | |
| Other Assets and Liabilities, Net - 4.8% | | | | | | | 4,826,743 | |
| Total Net Assets - 100.0% | | | | | | $ | 100,007,782 | |
| (1) | Security not registered under the Securities Act of 1933, as amended (the “Securities Act”) (e.g., the security was purchased in a Rule 144A or a Regulation D transaction). The security may be resold only pursuant to an exemption from registration under the Securities Act, typically to qualified institutional buyers. The Fund generally has no rights to demand registration of such securities. The aggregate market value of these unregistered securities at September 30, 2011 was $8,704,702, which represented 8.7% of the Fund’s net assets. |
| | |
| (2) | Non-income producing security. |
| | |
| (3) | Contingent payment debt instrument which accrues contingent interest. See Note 1(e). |
| | |
| (4) | Investment is valued at fair value as determined in good faith pursuant to procedures adopted by the Board of Trustees. It is possible that the estimated value may differ significantly from the amount that might ultimately be realized in the near term, and the difference could be material. The fair value of these securities amounted to $1,658,260 at September 30, 2011, which represented 1.7% of the Fund’s net assets. |
| | |
| (5) | Security in default. |
| | |
| (6) | Restricted securities include securities that have not been registered under the Securities Act of 1933, as amended, and securities that are subject to restrictions on resale. The Fund may invest in restricted securities that are consistent with the Fund’s investment objective and investment strategies. In some cases, the issuer of restricted securities has agreed to register such securities for resale, at the issuer’s expense either upon demand by the Fund or in connection with another registered offering of the securities. Investments in restricted securities are valued at fair value as determined in good faith in accordance with procedures adopted by the Board of Trustees. It is possible that the estimated value may differ significantly from the amount that might ultimately be realized in the near term, and the difference could be material. As of September 30, 2011, the Fund was invested in the following restricted securities: |
| | | | | | | | | | Price | | | | % Net |
| | Security | | Acquisition Date | | Shares | | Cost | | per Share | | Value | | Assets |
| | Amerivon Holdings LLC | | April 1, 2010 | | 572,925 | | $1,500,000 | | $1.328 | | $760,858 | | 0.8% |
| | series A cv. pfd. | | | | | | | | | | | | |
| | Amerivon Holdings LLC | | April 1, 2010 | | 272,728 | | 0 | | 0.010 | | 2,727 | | 0.0% |
| | common equity units | | | | | | | | | | | | |
| (7) | Mandatory Convertible Securities are required to be converted on the dates listed; they generally may be converted prior to these dates at the option of the holder. See Note 1(h). |
| Investment Abbreviations | | Summary of Portfolio Ratings * | |
| | | | | % of |
| ACES | Automatic Common Exchange Securities. | | | Portfolio |
| ADR | American Depositary Receipts. | | | | |
| ADS | American Depositary Shares. | | AAA | 1 | |
| BONUSES | Bifurcated Option Note Unit Securities. | | AA | 4 | |
| T-DECS | Tangible Dividend Enhanced Common Stock. | | A | 20 | |
| | | | BBB | 19 | |
| | | | BB | 21 | |
| | | | B | 12 | |
| Ratings in parentheses by Moody’s Investors Service, Inc. or Standard & Poor’s. | | CCC & below | 3 | |
| NR is used whenever a rating is unavailable. | | Not Rated | 20 | |
| | | | | |
| | | * Excludes equity securities and cash. | |
See accompanying notes to financial statements
Page 9
ELLSWORTH FUND LTD. 2011 ANNUAL REPORT TO SHAREHOLDERS
Statement of Assets and Liabilities
| | | September 30, 2011 | |
| Assets: | | | |
| Investments at value (cost $103,620,604) (Note 1) | | $ | 95,181,039 | |
| Cash | | | 3,251,726 | |
| Receivable for securities sold | | | 2,450,527 | |
| Dividends and interest receivable | | | 732,834 | |
| Other assets | | | 31,800 | |
| Total assets | | | 101,647,926 | |
| Liabilities: | | | | |
| Payable for securities purchased | | | 1,539,236 | |
| Accrued management fee (Note 2) | | | 66,869 | |
| Accrued expenses | | | 34,039 | |
| Total liabilities | | | 1,640,144 | |
| | | | | |
| Net Assets: | | $ | 100,007,782 | |
| Net Assets consist of: | | | | |
| Capital shares (unlimited shares of $0.01 par value authorized) (Note 3) | | $ | 134,091 | |
| Additional paid-in capital | | | 117,400,407 | |
| Undistributed net investment income | | | 477,628 | |
| Accumulated net realized loss from investment transactions | | | (9,564,779 | ) |
| Unrealized appreciation on investments | | | (8,439,565 | ) |
| Net Assets | | $ | 100,007,782 | |
| Net asset value per share ($100,007,782 ÷ 13,409,101 outstanding shares) | | $ | 7.46 | |
| | | | | |
| Statement of Operations | | | | |
| For the Year Ended September 30, 2011 | | | | |
| Investment Income (Note 1): | | | | |
| Interest | | $ | 2,022,922 | |
| Dividends | | | 2,145,646 | |
| Total Income | | | 4,168,568 | |
| Expenses (Note 2): | | | | |
| Management fee | | | 798,234 | |
| Custodian | | | 15,164 | |
| Transfer agent | | | 26,400 | |
| Legal fees | | | 64,549 | |
| Audit fees | | | 39,100 | |
| Trustees’ fees | | | 85,000 | |
| Administrative services fees | | | 54,664 | |
| Reports to shareholders | | | 35,051 | |
| Insurance | | | 26,803 | |
| Other | | | 41,622 | |
| Total Expenses | | | 1,186,587 | |
| Net Investment Income | | | 2,981,981 | |
| Realized and Unrealized Gain on Investments: | | | | |
| Net realized gain from investment transactions | | | 4,883,644 | |
| Net unrealized appreciation (depreciation) of investments | | | (11,031,595 | ) |
| Net loss on investments | | | (6,147,951 | ) |
| Net Increase in Net Assets Resulting from Operations | | $ | (3,165,970 | ) |
See accompanying notes to financial statements
Page 10
ELLSWORTH FUND LTD. 2011 ANNUAL REPORT TO SHAREHOLDERS
Statements of Changes in Net Assets
| For the Years Ended September 30, 2011 and 2010 | | | | | | |
| | | 2011 | | | 2010 | |
| Change in net assets from operations: | | | | | | |
| Net investment income | | $ | 2,981,981 | | | $ | 3,446,483 | |
| Net realized gain from investment transactions | | | 4,883,644 | | | | 4,634,484 | |
| Net change in unrealized appreciation (depreciation) of investments | | | (11,031,595 | ) | | | 6,680,773 | |
| Net change in net assets resulting from operations | | | (3,165,970 | ) | | | 14,761,740 | |
| | | | | | | | | |
| Distributions to shareholders from: | | | | | | | | |
| Net investment income | | | (3,402,358 | ) | | | (4,013,350 | ) |
| Net realized gain on investments | | | — | | | | — | |
| Total distributions | | | (3,402,358 | ) | | | (4,013,350 | ) |
| | | | | | | | | |
| Capital share transactions (Note 3) | | | 343,391 | | | | 511,372 | |
| | | | | | | | | |
| Change in net assets | | | (6,224,937 | ) | | | 11,259,762 | |
| | | | | | | | | |
| Net assets at beginning of year | | | 106,232,719 | | | | 94,972,957 | |
| | | | | | | | | |
| Net assets at end of year | | $ | 100,007,782 | | | $ | 106,232,719 | |
| | | | | | | | | |
| Undistributed net investment income at end of year | | $ | 477,628 | | | $ | 789,831 | |
Financial Highlights Selected data for a share of beneficial interest outstanding: |
| | | | |
| | | 2011 | | | 2010 | | | 2009 | | | 2008 | | | 2007 | |
| Operating Performance: | | | | | | | | | | | | | | | |
| Net asset value, beginning of year | | $ | 7.95 | | | $ | 7.15 | | | $ | 7.18 | | | $ | 10.27 | | | $ | 9.60 | |
| Net investment income | | | 0.22 | | | | 0.26 | | | | 0.33 | | | | 0.31 | | | | 0.33 | |
| Net realized and unrealized gain (loss) | | | (0.46 | ) | | | 0.84 | | | | (0.04 | ) | | | (2.24 | ) | | | 1.00 | |
| Total from investment operations | | | (0.24 | ) | | | 1.10 | | | | 0.29 | | | | (1.93 | ) | | | 1.33 | |
| Less Distributions: | | | | | | | | | | | | | | | | | | | | |
| Dividends from net investment income | | | (0.25 | ) | | | (0.30 | ) | | | (0.32 | ) | | | (0.33 | ) | | | (0.39 | ) |
| Distributions from realized gains | | | — | | | | — | | | | — | | | | (0.83 | ) | | | (0.27 | ) |
| Total distributions | | | (0.49 | ) | | | (0.30 | ) | | | (0.32 | ) | | | (1.16 | ) | | | (0.66 | ) |
| Net asset value, end of year | | $ | 7.46 | | | $ | 7.95 | | | $ | 7.15 | | | $ | 7.18 | | | $ | 10.27 | |
| Market value, end of year | | $ | 6.43 | | | $ | 7.17 | | | $ | 6.16 | | | $ | 5.30 | | | $ | 9.09 | |
| Total Return (a): | | | | | | | | | | | | | | | | | | | | |
| Market value (%) | | | (7.13 | ) | | | 21.9 | | | | 23.9 | | | | (33.3 | ) | | | 19.6 | |
| Net asset value (%) | | | (2.82 | ) | | | 16.4 | | | | 6.1 | | | | (21.0 | ) | | | 14.4 | |
| Ratios/Supplemental Data: | | | | | | | | | | | | | | | | | | | | |
| Net assets, end of year (in thousands) | | $ | 100,008 | | | $ | 106,233 | | | $ | 94,973 | | | $ | 94,497 | | | $ | 129,952 | |
| Ratio of expenses to average net assets (%) | | | 1.1 | | | | 1.1 | | | | 1.2 | | | | 1.1 | | | | 1.1 | |
| Ratio of net investment income to | | | | | | | | | | | | | | | | | | | | |
| average net assets (%) | | | 2.6 | | | | 3.5 | | | | 5.5 | | | | 3.6 | | | | 3.4 | |
| Portfolio turnover rate (%) | | | 47 | | | | 62 | | | | 71 | | | | 61 | | | | 84 | |
| (a) | Market value total return is calculated assuming a purchase of Fund shares on the opening of the first business day and a sale on the closing of the last business day of each period reported. Dividends and distributions are assumed for the purposes of this calculation to be reinvested at prices obtained under the Fund’s Automatic Dividend Investment and Cash Payment Plan. Net asset value total return is calculated on the same basis, except that the Fund’s net asset value is used on the purchase and sale dates instead of market value. |
See accompanying notes to financial statements
Page 11
ELLSWORTH FUND LTD. 2011 ANNUAL REPORT TO SHAREHOLDERS
Notes to Financial Statements
NOTE 1 - ORGANIZATION AND SIGNIFICANT ACCOUNTING POLICIES
(a) Organization - Ellsworth Fund Ltd. (the “Fund”), is registered under the Investment Company Act of 1940, as amended, as a diversified, closed-end management investment company.
(b) Indemnification - Under the Fund’s organizational documents, each trustee, officer or other agent of the Fund (including the Fund’s investment adviser) is indemnified against certain liabilities that may arise out of performance of their duties to the Fund. Additionally, in the normal course of business, the Fund enters into contracts that contain a variety of indemnification clauses. The Fund’s maximum exposure under these arrangements is unknown, as this would involve future claims that may be made against the Fund that have not yet occurred. The risk of material loss as a result of such indemnification is considered remote.
(c) Security Valuation - Investments in securities traded on a national securities exchange are valued at market using the last reported sales price, supplied by an independent pricing service, as of the close of regular trading. Listed securities, for which no sales were reported, are valued at the mean between closing reported bid and asked prices as of the close of regular trading. Unlisted securities traded in the over-the-counter market are valued using an evaluated quote provided by the independent pricing service, or, if an evaluated quote is unavailable, such securities are valued using prices received from dealers, provided that if the dealer supplies both bid and asked prices, the price to be used is the mean of the bid and asked prices. The independent pricing service derives an evaluated quote by obtaining dealer quotes, analyzing the listed markets, reviewing trade execution data and employing sensitivity analysis. Evaluated quotes may also reflect appropriate factors such as individual characteristics of the issue, communications with broker-dealers, and other market data. Securities for which quotations are not readily available, restricted securities and other assets are valued at fair value as determined in good faith pursuant to procedures approved by the Board of Trustees. Short-term debt securities with original maturities of 60 days or less are valued at amortized cost.
The Fund has adopted authoritative fair valuation accounting standards which establish an authoritative definition of fair value and set out a hierarchy for measuring fair value. These standards require additional disclosures about the various inputs and valuation techniques used to develop the measurements of fair value and a discussion in changes in valuation techniques and related inputs during the period. These inputs are summarized in the three broad levels listed below:
Level 1 - Quoted unadjusted prices for identical instruments in active markets.
Level 2 - Quoted prices for similar instruments in active markets; quoted prices for identical or similar instruments in markets that are not active; and model-driven valuation in which all significant inputs and significant value drivers are observable in active markets. Level 2 inputs are those in markets for which there are few transactions, the prices are not current, little public information exists or instances where prices vary substantially over time or among brokered market makers, and those received from an independent pricing service.
Level 3 - Model derived valuations in which one or more significant inputs or significant value drivers are unobservable. Unobservable inputs are those inputs that reflect the Fund’s own assumptions that market participants would use to price an asset or liability based on the best available information.
The availability of observable inputs can vary from security to security and is affected by a wide variety of factors, including, for example, the type of security, whether the security is new and not yet established in the marketplace, the liquidity of the markets, and other characteristics particular to the security. To the extent that valuation is based on models or inputs that are less observable or unobservable in the market, the determination of fair value requires more judgment. Accordingly, the degree of judgment exercised in determining fair value is greatest for instruments categorized in Level 3.
The net change in unrealized appreciation (depreciation) from Level 3 investments held as of September 30, 2011 was 13,585 and is included in Net unrealized appreciation (depreciation) of investments on the Statement of Operations. Transfers into, or out of, Level 3 are valued utilizing values as of the end of the period. Transfers into Level 3 were due to a decline in market activity (e.g., frequency of trades), which resulted in a lack of available market inputs to determine price.
Page 12
ELLSWORTH FUND LTD. 2011 ANNUAL REPORT TO SHAREHOLDERS
Notes to Financial Statements (continued)
NOTE 1 - ORGANIZATION AND SIGNIFICANT ACCOUNTING POLICIES (continued)
The following is a summary of the inputs used to value the net assets of Ellsworth Fund Ltd. as of September 30, 2011:
| | | Level 1 | | | Level 2 | | | Level 3 | | | Total | |
| | | | | | | | | | | | | |
| Investments in Securities: | | | | | | | | | | | | |
| Common Stocks: | | | | | | | | | | | | |
| Computer Software | | $ | 497,800 | | | $ | — | | | $ | — | | | $ | 497,800 | |
| Energy | | | 714,376 | | | | — | | | | — | | | | 714,376 | |
| Media and Entertainment | | | 452,400 | | | | — | | | | — | | | | 452,400 | |
| Pharmaceuticals | | | 2,482,124 | | | | — | | | | — | | | | 2,482,124 | |
| Telecommunications | | | 4,204,400 | | | | — | | | | — | | | | 4,204,400 | |
| Total Common Stocks | | | 8,351,100 | | | | — | | | | — | | | | 8,351,100 | |
| | | | | | | | | | | | | | | | | |
| Convertible Bonds and Notes | | | — | | | | 60,395,466 | | | | 894,675 | | | | 61,290,141 | |
| Convertible Preferred Stocks | | | — | | | | 13,470,185 | | | | 763,585 | | | | 14,233,770 | |
| Mandatory Convertible Securities | | | — | | | | 11,081,028 | | | | — | | | | 11,081,028 | |
| Corporate Bonds and Notes | | | — | | | | 225,000 | | | | — | | | | 225,000 | |
| Total Investments | | $ | 8,351,100 | | | $ | 85,171,679 | | | $ | 1,658,260 | | | $ | 95,181,039 | |
The following is a reconciliation of assets for which level 3 inputs were used in determining value:
| | | Convertible | | | | | | Convertible | | | | |
| | | Bonds and | | | Corporate Bonds | | | Preferred | | | | |
| | | Notes | | | and Notes | | | Stocks | | | Total | |
| | | | | | | | | | | | | |
| Beginning balance | | $ | — | | | $ | — | | | $ | 750,000 | | | $ | 750,000 | |
| | | | | | | | | | | | | | | | | |
| Change in unrealized | | | | | | | | | | | | | | | | |
| appreciation (depreciation) | | | — | | | | — | | | | 13,585 | | | | 13,585 | |
| | | | | | | | | | | | | | | | | |
| Net transfers in/out of level 3 | | | 894,675 | | | | — | | | | — | | | | 894,675 | |
| | | | | | | | | | | | | | | | | |
| Ending balance | | $ | 894,675 | | | $ | — | | | $ | 763,585 | | | $ | 1,658,260 | |
In May 2011, the Financial Accounting Standards Board issued Accounting Standards Update (“ASU”) No. 2011-04 “Amendments to Achieve Common Fair Value Measurement and Disclosure Requirements in U.S. GAAP and International Financial Reporting Standards (“IFRS”)”. ASU 2011-04 includes common requirements for measurement of and disclosure about fair value between U.S. GAAP and IFRS. ASU 2011-04 will require reporting to entities to disclose the following information for fair value measurements categorized within Level 3 of the fair value hierarchy: quantitative information about the unobservable inputs used in the fair value measurement, the valuation processes used by the reporting entity, and a narrative description of the sensitivity of the fair value measurement to changes in observable inputs and the interrelationships between those unobservable inputs. In addition, ASU 2011-04 will require reporting to entities to make disclosures about amounts and reasons for all transfers in an out of Level 1 and Level 2 fair value measurements. The new and revised disclosures are effective for interim and annual reporting periods beginning after December 15, 2011. At this time, management is evaluating the implications of ASU 2011-04 and its impact on the financial statements.
Page 13
ELLSWORTH FUND LTD. 2011 ANNUAL REPORT TO SHAREHOLDERS
Notes to Financial Statements (continued)
NOTE 1 - ORGANIZATION AND SIGNIFICANT ACCOUNTING POLICIES (continued)
(d) Federal Income Taxes - The Fund’s policy is to distribute substantially all of its taxable income within the prescribed time and to otherwise comply with the provisions of the Internal Revenue Code applicable to regulated investment companies. Therefore, no provision for federal income or excise taxes is believed necessary.
The Fund recognizes the tax benefits of uncertain tax positions only where the position is “more-likely-than-not” to be sustained assuming examination by taxing authorities. Management of the Fund has analyzed the Fund’s tax positions, and has concluded that no liability for unrecognized tax benefits should be recorded related to uncertain tax positions taken on returns filed for open tax years (2008-2010), or expected to be taken in the Fund’s 2011 tax returns. The major tax authority for the Fund is the Internal Revenue Service. The Fund is not aware of any tax positions for which it is reasonably likely that the total amounts of unrecognized tax benefits will significantly change in the next twelve months.
(e) Securities Transactions and Related Investment Income - Securities transactions are accounted for on the trade date (the date the order to buy or sell is executed) with gain or loss on the sale of securities being determined based upon identified cost. Dividend income is recorded on the ex-dividend date and interest income is recorded on the accrual basis, including accretion of discounts and amortization of non-equity premium. For certain securities, known as “contingent payment debt instruments,” Federal tax regulations require the Fund to record non-cash, “contingent” interest income in addition to interest income actually received. Contingent interest income amounted to approximately 2 cents per share for the twelve months ended September 30, 2011. In addition, Federal tax regulations require the Fund to reclassify realized gains (losses) on contingent payment debt instruments to interest income. At September 30, 2011, there were unrealized losses of approximately 5 cents per share on contingent payment debt instruments.
(f) Distributions to Shareholders - Distributions to shareholders from net investment income are recorded by the Fund on the ex-dividend date. Distributions from capital gains, if any, are recorded on the ex-dividend date and paid annually.
The amount and character of income and capital gains to be distributed are determined in accordance with income tax regulations, which may differ from generally accepted accounting principles. The tax character of distributions paid during the fiscal years ended September 30, 2011 and 2010 were as follows:
| | | 2011 | | | 2010 | |
| Ordinary income | | $ | 3,402,358 | | | $ | 4,013,350 | |
| Net realized gain on investments | | | — | | | | — | |
| | | $ | 3,402,358 | | | $ | 4,013,350 | |
At September 30, 2011, the components of distributable earnings and federal tax cost were as follows:
| Unrealized appreciation | | $ | 4,661,352 | |
| Unrealized depreciation | | | (13,773,908 | ) |
| Net unrealized depreciation | | | (9,112,556 | ) |
| | | | | |
| Undistributed ordinary income | | | 765,928 | |
| Capital loss carryforward | | | (9,180,088 | ) |
| Total distributable net earnings | | $ | (17,526,716 | ) |
| | | | | |
| Cost for federal income tax purposes | | $ | 104,293,595 | |
To the extent the Fund’s net realized capital gains, if any, can be offset by capital loss carryforwards, it is the policy of the Fund not to distribute such gains. As determined at September 30, 2011, the Fund had unused capital loss carryforwards of $9,180,088 which expire in 2018, available for federal income tax purposes to offset net realized capital gains.
The differences between book-basis and tax-basis unrealized appreciation/(depreciation) is attributable to differing methods of recognizing interest and ordinary income on bonds for tax purposes.
Page 14
ELLSWORTH FUND LTD. 2011 ANNUAL REPORT TO SHAREHOLDERS
Notes to Financial Statements (continued)
NOTE 1 - ORGANIZATION AND SIGNIFICANT ACCOUNTING POLICIES (continued)
(g) Use of Estimates - The preparation of financial statements in conformity with GAAP requires management to make estimates and assumptions that affect the reported amounts of assets and liabilities at the date of the financial statements, and the reported amounts of revenue and expenses during the reporting period. Actual results could differ from those estimates.
(h) Market Risk - It is the Fund’s policy to invest at least 65% of its assets in convertible securities. Although convertible securities do derive part of their value from that of the securities into which they are convertible, they are not considered derivative financial instruments. However, the Fund’s mandatory convertible securities include features which render them more sensitive to price changes of their underlying securities. Thus they expose the Fund to greater downside risk than traditional convertible securities, but generally less than that of the underlying common stock. The market value of those securities was $11,081,028 at September 30, 2011, representing 11.1% of net assets.
(i) Reclassification of Capital Accounts - Accounting principles generally accepted in the United States require that certain components of net assets relating to permanent differences be reclassified between financial and tax reporting. These reclassifications have no effect on net assets or net asset value per share. At September 30, 2011 the Fund increased net investment income by $108,174 and increased accumulated net realized loss on investments by $108,174.
NOTE 2 - MANAGEMENT FEE AND OTHER TRANSACTIONS WITH AFFILIATES
The Fund has entered into an investment advisory agreement with Dinsmore Capital Management Co. (“Dinsmore Capital”). Pursuant to the investment advisory agreement, Dinsmore Capital provides the Fund with investment advice, office space and facilities. Under the terms of the investment advisory agreement, the Fund pays Dinsmore Capital on the last day of each month an advisory fee for such month computed at an annual rate of 0.75% of the first $100,000,000 and 0.50% of the excess over $100,000,000 of the Fund’s net asset value in such month.
The Fund, pursuant to an administrative services agreement with Dinsmore Capital, has agreed to pay Dinsmore Capital for certain accounting and other administrative services provided to the Fund. Under the administrative services agreement, the Fund pays Dinsmore Capital on the last day of each month a fee for such month computed at an annual rate of 0.05% of the Fund’s net asset value in such month.
Certain officers and trustees of the Fund are officers and directors of Dinsmore Capital.
NOTE 3 - PORTFOLIO ACTIVITY
At September 30, 2011, there were 13,409,101 shares of beneficial interest outstanding, with a par value of $0.01 per share. During the twelve months ended September 30, 2011, 48,638 shares were issued in connection with reinvestment of dividends from net investment income, resulting in an increase in paid-in capital of $343,391.
Purchases and sales of investments, exclusive of corporate short-term notes, aggregated $54,969,583 and $51,244,978, respectively, for the twelve months ended September 30, 2011.
NOTE 4 - SUBSEQUENT EVENTS
In preparing the financial statements as of September 30, 2011, management considered the impact of subsequent events for potential recognition or disclosure in these financial statements.
Page 15
ELLSWORTH FUND LTD. 2011 ANNUAL REPORT TO SHAREHOLDERS
Report of Independent Registered
Public Accounting Firm
To the Shareholders and Board of Trustees of
Ellsworth Fund Ltd.
We have audited the accompanying statement of assets and liabilities, including the portfolio of investments of Ellsworth Fund Ltd. (the “Fund”) as of September 30, 2011, and the related statement of operations for the year then ended, the statements of changes in net assets for each of the two years in the period then ended, and the financial highlights for each of the five years in the period then ended. These financial statements and financial highlights are the responsibility of the Fund’s management. Our responsibility is to express an opinion on these financial statements and financial highlights based on our audits.
We conducted our audits in accordance with the standards of the Public Company Accounting Oversight Board (United States). Those standards require that we plan and perform the audit to obtain reasonable assurance about whether the financial statements and financial highlights are free of material misstatement. The Fund is not required to have, nor were we engaged to perform an audit of the Fund’s internal control over financial reporting. Our audits included consideration of internal control over financial reporting as a basis for designing audit procedures that are appropriate in the circumstances, but not for the purpose of expressing an opinion on the effectiveness of the Fund’s internal control over financial reporting. Accordingly, we express no such opinion. An audit also includes examining, on a test basis, evidence supporting the amounts and disclosures in the financial statements. Our procedures included confirmation of securities owned as of September 30, 2011, by correspondence with the custodian and brokers or by other appropriate auditing procedures where replies from brokers were not received. An audit also includes assessing the accounting principles used and significant estimates made by management, as well as evaluating the overall financial statement presentation. We believe that our audits provide a reasonable basis for our opinion.
In our opinion, the financial statements and financial highlights referred to above present fairly, in all material respects, the financial position of Ellsworth Fund Ltd. as of September 30, 2011, the results of its operations for the year then ended, the changes in its net assets for each of the two years in the period then ended and its financial highlights for each of the five years in the period then ended, in conformity with accounting principles generally accepted in the United States of America.
TAIT, WELLER & BAKER LLP
Philadelphia, Pennsylvania
November 22, 2011
Page 16
ELLSWORTH FUND LTD. 2011 ANNUAL REPORT TO SHAREHOLDERS
Miscellaneous Notes
Automatic Dividend Investment and Cash Payment Plan
The Fund has an Automatic Dividend Investment and Cash Payment Plan (the “Plan”). Any shareholder may elect to join the Plan by sending an application to American Stock Transfer & Trust Company, P.O. Box 922, Wall Street Station, New York, NY 10269-0560 (the “Plan Agent”). You may also obtain information about the Plan, as well as the Plan application, by calling the Plan Agent toll free at (800) 937-5449. If your shares are held by a broker or other nominee, you should instruct the nominee to join the Plan on your behalf. Some brokers may require that your shares be taken out of the broker’s “street name” and re-registered in your own name. Shareholders should also contact their broker to determine whether shares acquired through participation in the Plan can be transferred to another broker and thereafter, whether the shareholder can continue to participate in the Plan.
Under the Plan, all dividends and distributions are automatically invested in additional Fund shares. Depending on the circumstances, shares may either be issued by the Fund or acquired through open market purchases at the current market price or net asset value, whichever is lower (but not less than 95% of market price). For the first three fiscal quarter distributions, when the market price is lower, the Plan Agent will combine your dividends with those of other Plan participants and purchase shares in the market, thereby taking advantage of the lower commissions on larger purchases. There is no other charge for this service. For the fourth quarter distribution when the market price is lower, the Fund will issue shares at the market price.
All dividends and distributions made by the Fund (including capital gain dividends and dividends designated as qualified dividend income, which are eligible for taxation at lower rates) remain taxable to Plan participants, regardless of whether such dividends and distributions are reinvested in additional shares of the Fund through open market purchases or through the issuance of new shares. Plan participants will be treated as receiving the cash used to purchase shares on the open market and, in the case of any dividend or distribution made in the form of newly issued shares, will be treated as receiving an amount equal to the fair market value of such shares as of the reinvestment date. Accordingly, a shareholder may incur a tax liability even though such shareholder has not received a cash distribution with which to pay the tax.
Plan participants may also voluntarily send cash payments of $100 to $10,000 per month to the Plan Agent, to be combined with other Plan monies, for purchase of additional Fund shares in the open market. You pay only a bank service charge of $1.25 per transaction, plus your proportionate share of the brokerage commission. All shares and fractional shares purchased will be held by the Plan Agent in your dividend reinvestment account. You may deposit with the Plan Agent any Fund share certificates you hold, for a one-time fee of $7.50.
At any time, a Plan participant may instruct the Plan Agent to liquidate all or any portion of such Plan participant’s account. To do so, a Plan participant must deliver written notice to the Plan Agent prior to the record date of any dividend or distribution requesting either liquidation or a share certificate. The Plan Agent will combine all liquidation requests it receives from Plan participants on a particular day and will then sell shares of the Fund that are subject to liquidation requests in the open market. The amount of proceeds a Plan participant will receive shall be determined by the average sales price per share, after deducting brokerage commissions, of all shares sold by the Plan Agent for all Plan participants who have given the Plan Agent liquidation requests.
The Plan Agent or the Fund may terminate the Plan for any reason at any time by sending written notice addressed to the Plan participant’s address as shown on the Plan Agent’s records. Following the date of termination, the Plan Agent shall send the Plan participant either the proceeds of liquidation, or a share certificate or certificates for the full shares held by the Plan Agent in the Plan participant’s account. Additionally, a check will be sent for the value of any fractional interest in the Plan participant’s account based on the market price of the Fund’s shares on that date.
Page 17
ELLSWORTH FUND LTD. 2011 ANNUAL REPORT TO SHAREHOLDERS
Miscellaneous Notes (continued)
Notice of Privacy Policy
The Fund has adopted a privacy policy in order to protect the confidentiality of nonpublic personal information that we have about you. We receive personal information, such as your name, address and account balances, when transactions occur in Fund shares registered in your name.
We may disclose this information to companies that perform services for the Fund, such as the Fund’s transfer agent or proxy solicitors. These companies may only use this information in connection with the services they provide to the Fund, and not for any other purpose. We will not otherwise disclose any nonpublic personal information about our shareholders or former shareholders to anyone else, except as required by law.
Access to nonpublic information about you is restricted to our employees and service providers who need that information in order to provide services to you. We maintain physical, electronic and procedural safeguards that comply with federal standards to guard your nonpublic personal information.
For More Information About Portfolio Holdings
In addition to the semi-annual and annual reports that Ellsworth delivers to shareholders and makes available through the Fund’s public website, the Fund files a complete schedule of portfolio holdings with the Securities and Exchange Commission (SEC) for the Fund’s first and third fiscal quarters on Form N-Q. Ellsworth does not deliver the schedule of portfolio holdings for the first and third fiscal quarters to shareholders, however the schedule is posted to the Fund’s public website, www.ellsworthfund.com. You may obtain the Form N-Q filings by accessing the SEC’s website at www.sec.gov. You may also review and copy them at the SEC’s Public Reference Room in Washington, DC. Information on the operation of the SEC’s Public Reference Room may be obtained by calling the SEC at (800) SEC-0330.
Proxy Voting Policies and Procedures / Proxy Voting Record
The Fund’s policies and procedures with respect to the voting of proxies relating to the Fund’s portfolio securities is available without charge, upon request, by calling (800) 914-1177, or at our website at www.ellsworthfund.com. This information is also available on the SEC’s website at www.sec.gov. In addition, information on how the Fund voted such proxies relating to portfolio securities during the most recent twelve-month period ended June 30, is available without charge at the above sources.
Declared Distribution
A distribution of $0.061 per share, derived from net investment income, was declared on October 17, 2011, payable November 23, 2011 to shareholders of record at the close of business October 28, 2011.
The Fund is a member of the Closed-End Fund Association (CEFA), a non-profit national trade association (www.cefa.com). Thomas H. Dinsmore, Chairman and Chief Executive Officer of the Fund, is on the executive board.
Pursuant to Section 23 of the Investment Company Act of 1940, notice is hereby given that the Fund may in the future purchase beneficial shares of Ellsworth Fund Ltd. from time to time, at such times, and in such amounts, as may be deemed advantageous to the Fund. Nothing herein shall be considered a commitment to purchase such shares.
Page 18
ELLSWORTH FUND LTD. 2011 ANNUAL REPORT TO SHAREHOLDERS
Trustees
| Each trustee is also a trustee of Bancroft Fund Ltd. (Bancroft) (a closed-end management investment company). Dinsmore Capital Management Co. (Dinsmore Capital) is the Fund’s investment adviser and is also the investment adviser to Bancroft. Because of this connection, the Fund and Bancroft make up a Fund Complex. Therefore, each trustee oversees two investment companies in the Fund Complex. |
| | | |
| Personal Information | | Principal Occupation(s) During Past Five Years; Other Directorship(s) |
| INDEPENDENT TRUSTEES | | |
| | | |
Kinchen C. Bizzell, CFA 65 Madison Avenue, Suite 550 Morristown, NJ 07960 Term expires 2012 Trustee since 2008 - Born 1954 | | Senior Counselor with Burson-Marsteller (a global public relations and communications firm); Trustee of Bancroft. |
| | | |
| | | |
Elizabeth C. Bogan, Ph.D. 65 Madison Avenue, Suite 550 Morristown, NJ 07960 Term expires 2013 Trustee since 1986 - Born 1944 | | Senior Lecturer in Economics at Princeton University; Trustee of Bancroft. |
| | | |
| | | |
Daniel D. Harding, CFA 65 Madison Avenue, Suite 550 Morristown, NJ 07960 Term expires 2014 Trustee since 2007 - Born 1952 | | Since 2008, managing partner of a private investment fund. Prior to 2008, Senior Advisor with Harding Loevner Management LP (an investment advisory firm); Trustee of Bancroft; Director of Legg Mason Trust Co. (global asset management firm). |
| | | |
| | | |
Nicolas W. Platt 65 Madison Avenue, Suite 550 Morristown, NJ 07960 Term expires 2013 Trustee since 1997 - Born 1953 | | Since May 2011, partner at Point Capital Partners, LLC, a private merchant bank. Formerly Managing Director, FD Americas, the Strategic Communications segment of FTI Consulting Inc. (an international consulting company)(March 2009 to May 2011) and Managing Director, Rodman & Renshaw, LLC (August 2006 to March 2009). Prior to August 2006, President of CNC-US (an international consulting company); Trustee of Bancroft. |
| | | |
| | | |
| INTERESTED TRUSTEES | | |
Thomas H. Dinsmore, CFA (1) 65 Madison Avenue, Suite 550 Morristown, NJ 07960 Term expires 2014 Trustee since 1986 Chairman of the Board since 1996 - Born 1953 | | Chairman and Chief Executive Officer of the Fund, Bancroft and Dinsmore Capital; Trustee of Bancroft and Director of Dinsmore Capital. |
| | | |
| | | |
Jane D. O’Keeffe (1) 65 Madison Avenue, Suite 550 Morristown, NJ 07960 Term expires 2012 Trustee since 1995 - Born 1955 | | President of the Fund, Bancroft and Dinsmore Capital; Trustee of Bancroft and Director of Dinsmore Capital. |
| | | |
(1) Mr. Dinsmore and Ms. O’Keeffe are considered interested persons because they are officers and directors of Dinsmore Capital. They are brother and sister.
Page 19
ELLSWORTH FUND LTD. 2011 ANNUAL REPORT TO SHAREHOLDERS
Principal Officers
The business address of each officer is 65 Madison Avenue, Suite 550, Morristown, NJ 07960. Officers are elected by and serve at the pleasure of the Board of Trustees. Each officer holds office until the annual meeting to be held in 2012, and thereafter until his or her respective successor is duly elected and qualified. |
| Personal Information | | Principal Occupation(s) During Past Five Years |
| | | |
Thomas H. Dinsmore, CFA(1,3,4) Trustee, Chairman and Chief Executive Officer Officer since 1986 Born 1953 | | Trustee, Chairman and Chief Executive Officer of the Fund, Bancroft and Dinsmore Capital. |
| | | |
| | | |
Jane D. O’Keeffe (1,4,5) Trustee and President Officer since 1994 Born 1955 | | Trustee and President of the Fund, Bancroft and Dinsmore Capital. |
| | | |
| | | |
Gary I. Levine (2) Executive Vice President, Chief Financial Officer and Secretary
Officer since 1986 Born 1957 | | Executive Vice President and Chief Financial Officer of the Fund, Bancroft and Dinsmore Capital since 2004. Secretary of the Fund, Bancroft and Dinsmore Capital. Treasurer of Dinsmore Capital. |
| | | |
| | | |
James A. Dinsmore, CFA (3,5) Vice President Officer since 2007 Born 1982 | | Vice President of the Fund, Bancroft Fund and Dinsmore Capital since 2009. |
| | | |
| | | |
H. Tucker Lake, Jr. (4) Vice President Officer since 1994 Born 1947 | | Vice President of the Fund, Bancroft and Dinsmore Capital. |
| | | |
| | | |
Germaine M. Ortiz (2) Vice President Officer since 1996 Born 1969 | | Vice President of the Fund, Bancroft and Dinsmore Capital. |
| | | |
| | | |
Mercedes A. Pierre Vice President and Chief Compliance Officer Officer since 1998 Born 1961 | | Vice President and Chief Compliance Officer of the Fund, Bancroft and Dinsmore Capital since 2004. |
| | | |
| (1) Mr. Thomas Dinsmore and Ms. O’Keeffe are brother and sister. |
| (2) Ms. Ortiz is the first cousin of Mr. Levine’s wife. |
| (3) Mr. Thomas Dinsmore is the father of Mr. James Dinsmore. |
| (4) Mr. Lake is the first cousin of Mr. Thomas Dinsmore and Ms. O’Keeffe. |
| (5) Ms. O’Keeffe is the aunt of Mr. James Dinsmore. |
Page 20
| Board of Trustees | Internet |
KINCHEN C. BIZZELL, CFA | www.ellsworthfund.com |
ELIZABETH C. BOGAN, Ph.D. | email: info@ellsworthfund.com |
THOMAS H. DINSMORE, CFA | |
DANIEL D. HARDING, CFA | Shareholder Services and Transfer Agent |
JANE D. O’KEEFFE | American Stock Transfer & Trust Company, LLC |
NICOLAS W. PLATT | 6201 15th Avenue |
| | Brooklyn, NY 11219 |
| | (800) 937-5449 |
| | www.amstock.com |
| Officers | |
| | Investment Adviser |
THOMAS H. DINSMORE, CFA | Dinsmore Capital Management Co. |
| Chairman of the Board and Chief Executive Officer | 65 Madison Avenue, Suite 550 |
| | Morristown, NJ 07960 |
JANE D. O’KEEFFE | (973) 631-1177 |
| President | |
| | |
GARY I. LEVINE | Custodian |
| Executive Vice President, Chief Financial Officer and Secretary | Brown Brothers Harriman & Co. |
| | |
JAMES A. DINSMORE, CFA | Beneficial Share Listing |
| Vice President | NYSE Amex Exchange Symbol: ECF |
| | |
H. TUCKER LAKE, JR. | Legal Counsel |
| Vice President | Ballard Spahr LLP |
| | |
GERMAINE M. ORTIZ | Independent Registered Public Accounting Firm |
| Vice President | Tait, Weller & Baker LLP |
| | |
MERCEDES A. PIERRE | |
| Vice President and Chief Compliance Officer | |
| | |
JUDITH M. DOUGHERTY | |
| Assistant Vice President and Assistant Secretary | |
| | |
JOANN VENEZIA | |
| Assistant Vice President | |
ELLSWORTH FUND LTD.
65 MADISON AVENUE, SUITE 550
MORRISTOWN, NEW JERSEY 07960
www.ellsworthfund.com

ITEM 2. CODE OF ETHICS.
On April 16, 2007, the Board of Trustees of Ellsworth Fund Ltd. (the “Fund”) adopted a code of ethics that applies to the Fund’s principal executive officer (the “PEO”) and principal financial officer (the “PFO”). The code of ethics is available on the Fund’s website at www.ellsworthfund.com. Since the code of ethics was adopted, there have been no amendments to it nor have any waivers from any of its provisions been granted.
ITEM 3. AUDIT COMMITTEE FINANCIAL EXPERT.
The Board of Trustees of the Fund has determined that Trustee and Audit Committee Chair, Daniel D. Harding, who is “independent” as such term is used in Form N-CSR, possesses the attributes required to be considered an audit committee financial expert under applicable federal securities laws.
ITEM 4. PRINCIPAL ACCOUNTANT FEES AND SERVICES.
Set forth in the table below are the aggregate fees billed to the Fund by its principal accountant, Tait, Weller & Baker LLP (“Tait Weller”), for professional services rendered to the Fund during the Fund’s last two fiscal years ended September 30, 2011 and 2010.
Fiscal
Year-End September 30 | | Audit Fees (1) | | | Audit-Related Fees (2) | | | Tax Fees (3) | | | All Other Fees | |
| 2010 | | $ | 35,100 | | | $ | 0 | | | $ | 3,000 | | | $ | 0 | |
| 2011 | | $ | 36,000 | | | $ | 0 | | | $ | 3,100 | | | $ | 0 | |
| (1) | The Fund’s Audit Committee pre-approves all Audit Fees, without exception. |
| (2) | The Fund’s Audit Committee pre-approves all Audit-Related Fees, with exceptions. For the Fund’s last two fiscal years ended September 30, 2011 and 2010, no Audit-Related Fees were approved by the Fund’s Audit Committee pursuant to Rule 2-01(c)(7)(i)(C) of Regulation S-X, which waives the pre-approval requirement for certain de minimus fees. |
| (3) | “Tax Fees” include those fees billed by Tait Weller in connection with its review of the Fund’s income tax returns for fiscal years 2010 and 2011. The Fund’s Audit Committee pre-approves all Tax Fees, with exceptions. For the Fund’s last two fiscal years ended September 30, 2010 and 2011, no Tax Fees were approved by the Fund’s Audit Committee pursuant to Rule
2-01(c)(7)(i)(C) of Regulation S-X, which waives the pre-approval requirement for certain de minimus fees. |
Non-Audit Services
During each of the last two fiscal years ended September 30, 2010 and 2011, Tait Weller did not provide any non-audit services to the Fund, with the exception of the services for which the Fund paid the Tax Fees noted above. Tait Weller did not provide any non-audit services to the Fund’s investment adviser, Dinsmore Capital Management Co. (“Dinsmore Capital”) or its affiliates or otherwise bill the Fund or Dinsmore Capital or its affiliates for any such non-audit services.
Audit Committee Pre-Approval Policies and Procedures
The Audit Committee pre-approves all audit and permissible non-audit services that are proposed to be provided to the Fund by its independent registered public accountant before they are provided to the Fund. Such pre-approval also includes the proposed fees to be charged by the independent registered public accountant for such services. The Audit Committee may delegate the pre-approval of audit and permissible non-audit services and related fees to one or more members of the Audit Committee who are “independent,” as such term is used in Form N-CSR. Any such member’s decision to pre-approve audit and/or non-audit services and related fees is presented to the full Audit Committee, solely for informational purposes, at its next scheduled meeting.
The Audit Committee also pre-approves non-audit services to be provided by the Fund’s independent registered public accountant to the Fund’s investment adviser if the engagement relates directly to the operations and financial reporting of the Fund and if the Fund’s independent registered public accountant is the same as, or affiliated with, the investment adviser’s independent registered public accountant.
ITEM 5. AUDIT COMMITTEE OF LISTED REGISTRANTS.
(a) The Fund has a separately-designated standing Audit Committee established in accordance with Section 3(a)(58)(A) of the Securities Exchange Act of 1934, as amended (the “Exchange Act”), and the members of such committee are:
KINCHEN C. BIZZELL
ELIZABETH C. BOGAN, PH.D.
DANIEL D. HARDING (Chair)
(b) Not applicable.
ITEM 6. INVESTMENTS.
The Schedule of Investments in securities of unaffiliated issuers as of September 30, 2011 is included as part of the report to shareholders, filed under Item 1 of this certified shareholder report on Form N-CSR.
ITEM 7. DISCLOSURE OF PROXY VOTING POLICIES AND PROCEDURES FOR CLOSED-END MANAGEMENT INVESTMENT COMPANIES.
Bancroft Fund Ltd.
Ellsworth Fund Ltd.
Dinsmore Capital Management Co.
Proxy Voting Guidelines
(Adopted March 26, 2009)
These proxy voting guidelines have been adopted by the Boards of Trustees of Bancroft Fund Ltd. and Ellsworth Fund Ltd. (collectively, the “Funds”), as well as by the Board of Directors of Dinsmore Capital Management Co. (“Dinsmore Capital”).
The Boards of Trustees of the Funds have delegated to Dinsmore Capital responsibility for voting proxies received by the Funds in their capacities as shareholders of various companies. The Boards recognize that, due to the nature of the Funds’ investments, the Funds do not frequently receive proxies.
Dinsmore Capital exercises its voting responsibility with the overall goal of maximizing the value of the Funds’ investments. The portfolio managers at Dinsmore Capital oversee the voting policies and decisions for the Funds. In evaluating voting issues, the portfolio managers may consider information from many sources, including management of a company presenting a proposal, shareholder groups, research analysts, and independent proxy research services.
Set forth below are the proxy voting guidelines:
A. Matters Related to the Board of Directors
1. The Funds generally will support the election of nominees recommended by management for election as directors. In determining whether to support a particular nominee, Dinsmore Capital will consider whether the election of that nominee will cause a company to have less than a majority of independent directors.
2. The Funds generally will support proposals to de-classify boards of directors if fewer than 66 2/3% of the directors are independent, and will generally vote against proposals to classify boards of directors.
3. The Funds generally will withhold a vote in favor of a director who has served on a committee which has approved excessive compensation arrangements or proposed equity-based compensation plans that unduly dilute the ownership interests of stockholders.
B. Matters Related to Independent Auditors
1. The Funds generally will vote in favor of independent accountants approved by the company. Prior to such vote, however, Dinsmore Capital will take into consideration whether non-audit fees make up more than 50 to 75% of the total fees paid by the company to the independent auditors, and the nature of the non-audit services provided.
C. Corporate Governance Matters
1. Except as provided in Section E.1, as a general rule, the Funds will vote against proposals recommended by management of a company that are being made primarily to implement anti-takeover measures, and will vote in favor of proposals to eliminate policies that are primarily intended to act as anti-takeover measures.
2. Subject to the other provisions of these guidelines, including without limitation provision C.1. above, the Funds generally will vote in accordance with management’s recommendations regarding routine matters, including the following:
a. Fixing number of directors;
b. Stock splits; and
c. Change of state of incorporation for specific corporate purposes.
D. Matters Related to Equity-Based Compensation Plans
1. The Funds generally will vote in favor of broad-based stock option plans for executives, employees or directors which would not increase the aggregate number of shares of stock available for grant under all currently active plans to over 10% of the total number of shares outstanding.
2. The Funds generally will vote in favor of employee stock purchase plans and employee stock ownership plans permitting purchase of company stock at 85% or more of fair market value.
E. Contested Matters
1. Contested situations will be evaluated on a case by case basis by the portfolio manager or analyst at Dinsmore Capital principally responsible for the particular portfolio security.
F. Miscellaneous Matters
1. The Funds may in their discretion abstain from voting shares that have been recently sold.
2. The Funds generally will abstain from voting on issues relating to social and/or political responsibility.
3. Proposals that are not covered by the above-stated guidelines will be evaluated on a case by case basis by the portfolio manager or analyst at Dinsmore Capital principally responsible for the particular portfolio security.
G. Material Conflicts of Interest
1. Conflicts of interest may arise from time to time between Dinsmore Capital and the Funds. Examples of conflicts of interests include:
a. Dinsmore Capital may manage a pension plan, administer employee benefit plans, or provide services to a company whose management is soliciting proxies;
b. Dinsmore Capital or its officers or directors may have a business or personal relationship with corporate directors, candidates for directorships, or participants in proxy contests;
c. Dinsmore Capital may hold a position in a security contrary to shareholder interests.
2. If a conflict of interest arises with respect to a proxy voting matter, the portfolio manager will promptly notify the Funds’ Audit Committee and counsel for independent trustees and the proxies will be voted in accordance with direction received from the Audit Committee.
H. Amendments
1. Any proposed material amendment to these Guidelines shall be submitted for review and approval to:
a. the Funds’ Board of Trustees, including a majority of the disinterested trustees; and
b. the Adviser’s Board of Directors.
2. Non-material amendments to these Guidelines may be made by the Chair of the Funds, upon consultation with counsel to the Funds and the Funds’ Chief Compliance Officer, and will be reported to the Funds’ Board of Trustees at their next scheduled in-person meeting.
ITEM 8. PORTFOLIO MANAGERS OF CLOSED-END MANAGEMENT INVESTMENT COMPANIES.
(a) (1) As of December 9, 2011, Mr. Thomas H. Dinsmore, Chairman and Chief Executive Officer, Ms. Jane D. O’Keeffe, President, and Mr. James A. Dinsmore, Vice President, comprise the three-person portfolio management team of Ellsworth Fund Ltd. (the “Fund”). Mr. Thomas H. Dinsmore has served as portfolio manager since 1996. Ms. O’Keeffe and Mr. James Dinsmore became co-portfolio managers on January 1, 2011. Mr. Thomas H. Dinsmore is the lead member of the portfolio management team.
Since 1994, Ms. O’Keeffe has served as President of the Fund and of Dinsmore Capital (the “Advisor”), as well as Managing Director of Research for the Advisor. Mr. James A. Dinsmore has served as Vice President of the Fund and of the Advisor since 2007 and also has been a research analyst for the Advisor since 2004.
Messrs. Thomas H. Dinsmore and James A. Dinsmore and Ms. O’Keeffe receive investment recommendations from a team of research analysts prior to making investment decisions about transactions in the portfolio. Generally, the co-portfolio managers make decisions jointly about any transactions in the Fund’s portfolio, but each co-portfolio manager may do so independently as well.
(2) The portfolio management team comprised of Mr. Thomas H. Dinsmore, Ms. Jane D. O’Keeffe and Mr. James A. Dinsmore is also primarily responsible for the day-to-day management of one registered investment company, Bancroft Fund Ltd. (“Bancroft”), with total assets of $95,833,222 as of December 2, 2011. The portfolio management team does not manage any accounts or assets with performance-based advisory fees. Mr. Thomas Dinsmore is Chairman and Chief Executive Officer, Ms. O’Keeffe is President and Mr. James Dinsmore is Vice President of Ellsworth. This information is as of December 9, 2011. The Fund and Bancroft have similar investment objectives and strategies. As a result, material conflicts of interest may arise between the two funds if a security is not available in a sufficient amount to fill open orders for both funds. To deal with these situations, the investment adviser for the Fund and Bancroft have
adopted Trade Allocation Procedures (the “Allocation Procedures”). The Allocation Procedures set forth a method to allocate a partially filled order among the funds. Pursuant to the method, the amount of shares that each fund purchases is allocated pro rata based on the dollar amount of each fund’s intended trade or, if the order is subject to a minimum lot size, as closely as possibly to such an allocation.
The Allocation Procedures permit Dinsmore Capital to allocate an order in a way that is different from the method set forth above if (i) each fund is treated fairly and equitably and neither fund is given preferential treatment, and (ii) the allocation is reviewed by the chief compliance officer of Dinsmore Capital.
(3) This information is as of December 9, 2011. The Portfolio Management team is compensated by Dinsmore Capital through a three-component plan, consisting of a fixed base salary, annual cash bonus, and benefit retirement plan. Their compensation is reviewed and approved by Dinsmore Capital’s Board of Directors annually. Their compensation may be adjusted from year to year based on the perception of Dinsmore Capital’s Board of Directors of the team’s overall performance and their management responsibilities. Their compensation is not based on (i) a formula specifically tied to the performance of the Fund or Bancroft, including performance against an index or (ii) the value of assets held in the Fund’s portfolio.
(4) As of December 9, 2011, Mr. Thomas Dinsmore’s beneficial ownership in the Fund’s shares was in the range of $100,001-$500,000. Ms. O’Keeffe’s beneficial ownership in the Fund’s shares was also in the range of $100,001-$500,000. Mr. James Dinsmore’s beneficial ownership in the Fund’s shares was in the range of $50,001-$100,000.
ITEM 9. PURCHASES OF EQUITY SECURITIES BY CLOSED-END MANAGEMENT INVESTMENT COMPANY AND AFFILIATED PURCHASERS.
During the period covered by this report, there were no purchases made by or on behalf of the Fund or any “affiliated purchaser,” as defined in Rule 10b-18(a)(3) under the Exchange Act, as amended (17 CFR 240.10b-18(a)(3)), of shares or other units of any class of the Fund’s equity securities registered by the Fund pursuant to Section 12 of the Exchange Act (15 U.S.C. 781).
ITEM 10. SUBMISSION OF MATTERS TO A VOTE OF SECURITY HOLDERS.
There have been no material changes to the procedures by which shareholders may recommend nominees to the Fund’s Board of Trustees since those procedures were last disclosed in response to the requirements of Item 407(c)(2)(iv) of Regulation S-K (17 CFR 229.407) (as required by Item 22(b)(15) of Schedule 14A (17 CFR 240.14a-101)), or Item 10 of Form N-CSR.
ITEM 11. CONTROLS AND PROCEDURES.
Conclusions of principal officers concerning the effectiveness of controls and procedures:
(a) As of December 9, 2011, an evaluation was performed under the supervision and with the participation of the officers of the Fund, including the PEO and the PFO, to assess the effectiveness of the Fund’s disclosure controls and procedures, as that term is defined in Rule 30a-3(c) (17 CFR 270.30a-3(c)) under the Investment Company Act of 1940, as amended (the “Act”). Based on that evaluation, as required by Rule 30a-3(b) under the Act (17 CFR 270.30a-3(b)) and Rules 13a-15(b) or 15d-15(b) under the Exchange Act (17 CFR 240.13a-15(b) or 240.15d-15(b)), the Fund’s officers, including the PEO and PFO, concluded that, as of December 9, 2011, the Fund’s disclosure controls and procedures were reasonably designed so as to ensure: (1) that information required to be disclosed by the Fund on Form N-CSR is recorded, processed, summarized and reported within the time periods specified by the rules and forms of the Securities and Exchange Commission and (2) that material information relating to the Fund is made known to the PEO and PFO as appropriate to allow timely decisions regarding required disclosure.
(b) There have been no changes in the Fund’s internal control over financial reporting (as defined in Rule 30a-3(d) under the Act (17 CFR 270.30a-3(d)) that occurred during the second fiscal quarter of the period covered by this report that has materially affected, or is reasonably likely to materially affect, the Fund’s internal control over financial reporting.
ITEM 12. EXHIBITS.
(a)(1) Not applicable. See Fund’s response to Item 2, above.
(a)(2) Certifications of the principal executive officer and the principal financial officer pursuant to Rule 30a-2(a) under the Act (17 CFR 270.30a-2(a)), are attached hereto.
(a)(3) There were no written solicitations to purchase securities under Rule 23c-1 under the Act (17 CFR 270.23c-1) sent or given during the period covered by the report by or on behalf of the Fund to ten or more persons.
(b) Certifications of the principal executive officer and the principal financial officer, as required by Rule 30a-2(b) under the Act (17 CFR 270.30a-2(b)), Rule 13a-14(b) or Rule 15d-14(b) under the Exchange Act (17 CFR 240.13a-14(b) or 240.15d-14(b)), and Section 1350 of Chapter 63 of Title 18 of the United States Code (18 U.S.C. 1350) are attached hereto.
SIGNATURES
Pursuant to the requirements of the Securities Exchange Act of 1934 and the Investment Company Act of 1940, the registrant has duly caused this report to be signed on its behalf by the undersigned, thereunto duly authorized.
Ellsworth Fund Ltd.
By: /s/ Thomas H. Dinsmore
Thomas H. Dinsmore
Chairman of the Board and
Chief Executive Officer
(Principal Executive Officer)
Date: December 9, 2011
Pursuant to the requirements of the Securities Exchange Act of 1934 and the Investment Company Act of 1940, this report has been signed below by the following persons on behalf of the registrant and in the capacities and on the dates indicated.
By: /s/ Thomas H. Dinsmore
Thomas H. Dinsmore
Chairman of the Board and
Chief Executive Officer
(Principal Executive Officer)
Date: December 9, 2011
By: /s/ Gary I. Levine
Gary I. Levine
Chief Financial Officer
(Principal Financial Officer)
Date: December 9, 2011