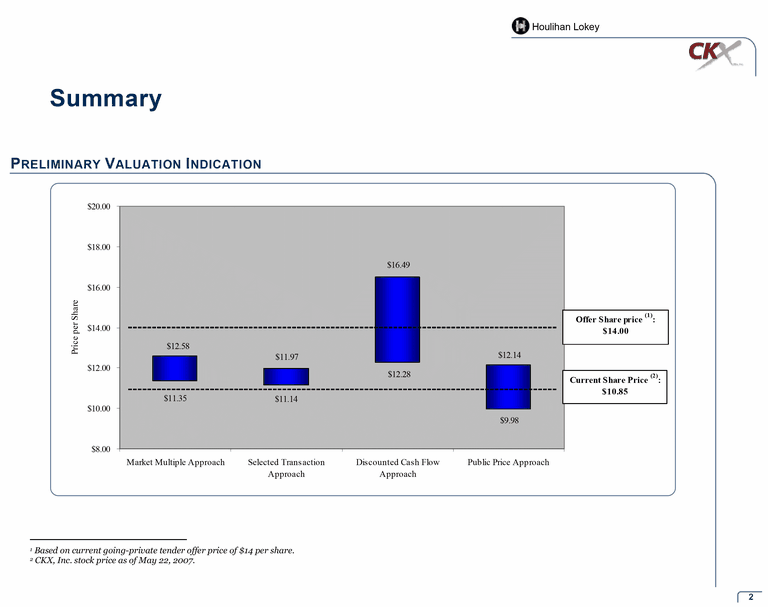
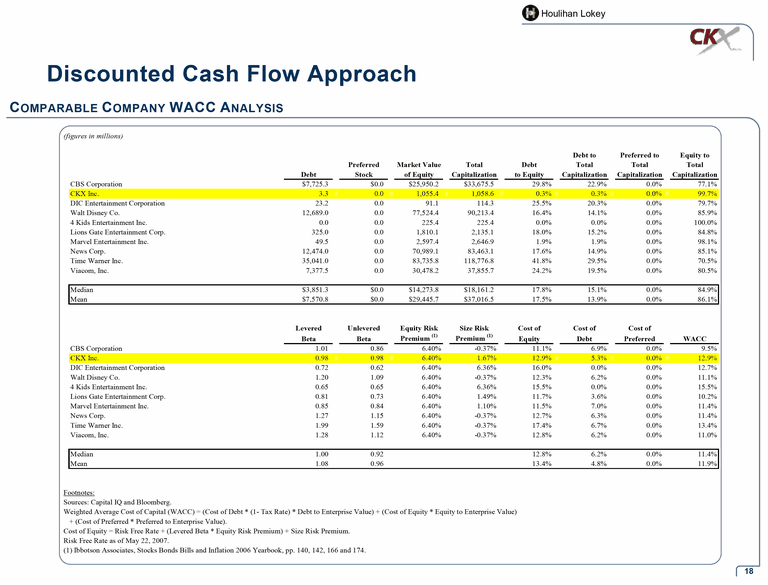
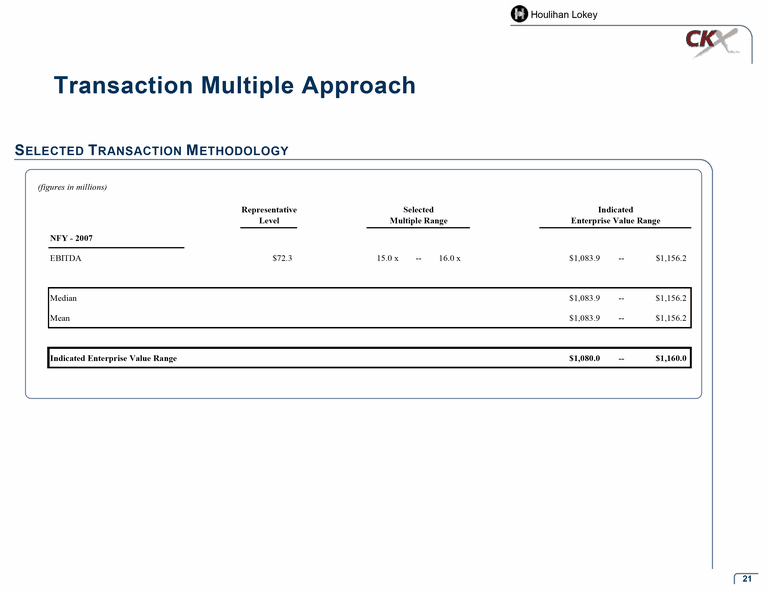
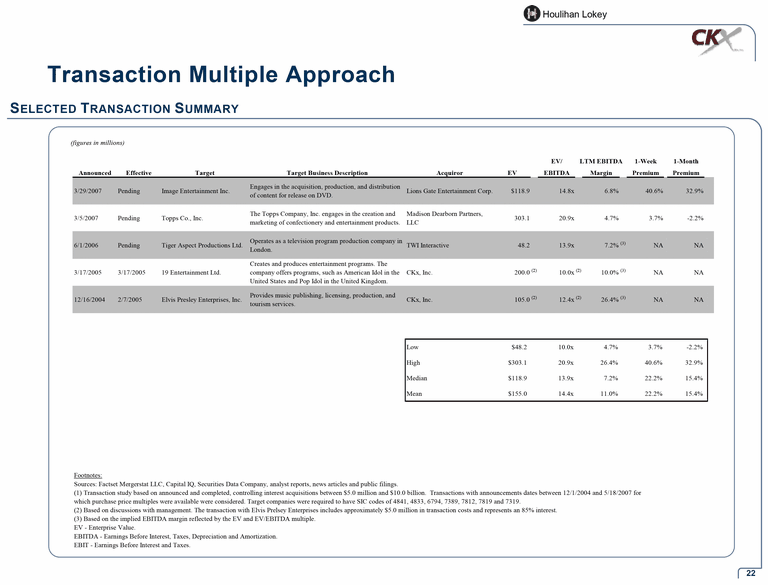
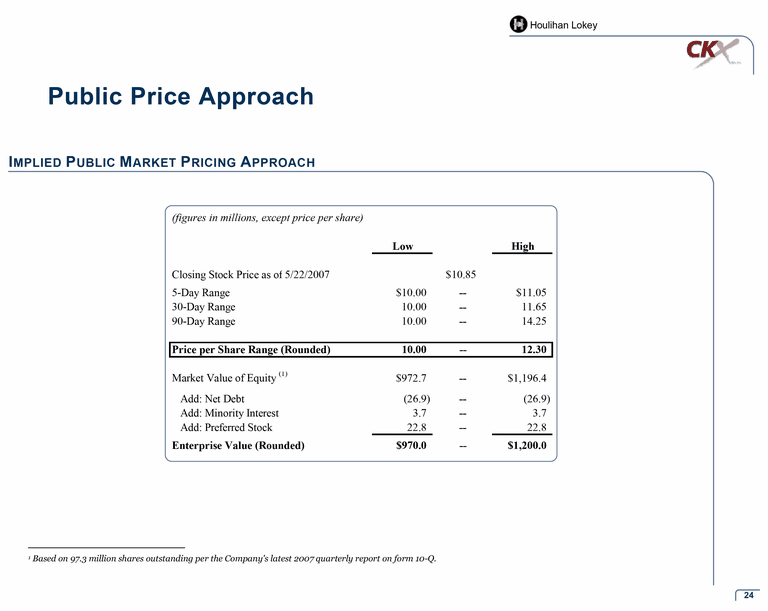
| Houlihan LokeyDiscounted Cash Flow Approach COMPARABLE COMPANY WACC ANALYSIS(figures in millions)Debt to Preferred to Equity to Preferred Market Value Total Debt Total Total & nbsp; Total Debt Stock of Equity Capitalization to Equity Capitalization Capitalization Capitalization CBS Corporation $7,725.3 # $0.0 # $25,950.2 # $33,675.5 # 29.8% # 22.9% # 0.0% # 77.1% CKX Inc. 3.3 # 0.0 # 1,055.4 # 1,058.6 # 0.3% # 0.3% # 0.0% # 99.7% DIC Entertainment Corporation 23.2 # 0.0 # 91.1 # 114.3 # 25.5% # 20.3% # 0.0% # 79.7% Walt Disney Co. 12,689.0 # 0.0 # 77,524.4 # 90,213.4 # 16.4% # 14.1% # 0.0% # 85.9% 4 Kids Entertainment Inc. 0.0 # 0.0 # 225.4 # 225.4 # 0.0% # 0.0% # 0.0% # 100.0% Lions Gate Entertainment Corp. 325.0 # 0.0 # 1,810.1 # 2,135.1 # 18.0% # 15.2% # 0.0% # 84.8% Marvel Entertainment Inc. 49.5 # 0.0 # 2,597.4 # 2,646.9 # 1.9% # 1.9% # 0.0% # 98.1% News Corp. 12,474.0 # 0.0 # 70,989.1 # 83,463.1 # 17.6% # 14.9% # 0.0% # 85.1% Time Warner Inc. 35,041.0 # 0.0 # 83,735.8 # 118,776.8 # 41.8% # 29.5% # 0.0% # 70.5% Viacom, Inc. 7,377.5 # 0.0 # 30,478.2 # 37,855.7 # 24.2% # 19.5% # 0.0% # 80.5% Median $3,851.3 $0.0 $14,273.8$18,161.2 17.8% 15.1% 0.0% 84.9% Mean $7,570.8 $0.0 $29,445.7 $37,016.5 17.5% 13.9% 0.0% 86.1%Levered Unlevered Equity RiskSize Risk Cost of Cost of ; Cost of Beta Beta Premium (1) Premium (1) Equity Debt Preferred WACC CBS Corporation 1.01 # 0.86 # 6.40% -0.37% 11.1% # 6.9% # 0.0% # 9.5% CKX Inc. 0.98 # 0.98 # 6.40% 1.67% 12.9% # 5.3% # 0.0% # 12.9% DIC Entertainment Corporation 0.72 # 0.62 # 6.40% 6.36% 16.0% # 0.0% # 0.0% # 12.7% Walt Disney Co. 1.20 # 1.09 # 6.40% -0.37% 12.3% # 6.2% # 0.0% # 11.1% 4 Kids Entertainment Inc. 0.65 # 0.65 # 6.40% 6.36% 15.5% # 0.0% # 0.0% # 15.5% Lions Gate Entertainment Corp. 0.81 # 0.73 # 6.40% 1.49% 11.7% # 3.6% # 0.0% # 10.2% Marvel Entertainment Inc. 0.85 # 0.84 # 6.40% 1.10% 11.5% # 7.0% # 0.0% # 11.4% News Corp. 1.27 # 1.15 # 6.40% -0.37% 12.7% # 6.3% # 0.0% # 11.4% Time Warner Inc. 1.99 # 1.59 # 6.40% -0.37% 17.4% # 6.7% # 0.0% # 13.4% Viacom, Inc. 1.28 # 1.12 # 6.40% -0.37% 12.8% # 6.2% # 0.0% # 11.0%Median 1.00 0.92 12.8% 6.2% 0.0% 11.4% Mean 1.08 0.96 13.4% 4.8% 0.0% 11.9%Footnotes:Sources: Capital IQ and Bloomberg. Weighted Average Cost of Capital (WACC) = (Cost of Debt * (1- Tax Rate) * Debt toEnterprise Value) + (Cost of Equity * Equity to Enterprise Value) + (Cost of Preferred * Preferred to Enterprise Value).Cost of Equity = Risk Free Rate + (Levered Beta * Equity Risk Premium) + Size Risk Premium. Risk Free Rate as of May 22, 2007.(1) Ibbotson Associates, Stocks Bonds Bills and Inflation 2006 Yearbook, pp. 14 0, 142, 166 and 174.18 |
