UNITED STATES
SECURITIES AND EXCHANGE COMMISSION
Washington, D.C. 20549
FORMN-CSR
CERTIFIED SHAREHOLDER REPORT OF REGISTERED MANAGEMENT INVESTMENT
COMPANIES
| Investment Company Act file number: | 811- 04661 | |
| Exact name of registrant as specified in charter: | Prudential Global Total Return Fund, Inc. | |
| Address of principal executive offices: | 655 Broad Street, 17th Floor | |
| Newark, New Jersey 07102 | ||
| Name and address of agent for service: | Andrew R. French | |
| 655 Broad Street, 17th Floor | ||
| Newark, New Jersey 07102 | ||
| Registrant’s telephone number, including area code: | 800-225-1852 | |
| Date of fiscal year end: | 10/31/2019 | |
| Date of reporting period: | 10/31/2019 | |
Item 1 – Reports to Stockholders

PGIM GLOBAL TOTAL RETURN FUND
ANNUAL REPORT
OCTOBER 31, 2019
COMING SOON: PAPERLESS SHAREHOLDER REPORTS
Beginning on January 1, 2021, as permitted by regulations adopted by the Securities and Exchange Commission, paper copies of the Fund’s annual and semiannual shareholder reports will no longer be sent by mail, unless you specifically request paper copies of the reports. Instead, the reports will be made available on the Fund’s website (pgiminvestments.com), and you will be notified by mail each time a report is posted and provided with a website link to access the report.
If you already elected to receive shareholder reports electronically, you will not be affected by this change and you need not take any action. You may elect to receive shareholder reports and other communications from the Fund electronically anytime by contacting your financial intermediary (such as a broker-dealer or bank) or, if you are a direct investor, by calling 1-800-225-1852 or by sending an email request to PGIM Investments at shareholderreports@pgim.com.
You may elect to receive all future reports in paper free of charge. If you invest through a financial intermediary, you can contact your financial intermediary or follow instructions included with this notice to elect to continue to receive paper copies of your shareholder reports. If you invest directly with the Fund, you can call 1-800-225-1852 or send an email request to shareholderreports@pgim.com to let the Fund know you wish to continue receiving paper copies of your shareholder reports. Your election to receive reports in paper will apply to all funds held in your account if you invest through your financial intermediary or all funds held with the fund complex if you invest directly with the Fund.

To enroll in e-delivery, go to pgiminvestments.com/edelivery
| Objective:Total return, made up of current income and capital appreciation |
Highlights(unaudited)
| • | Overall, duration and yield curve positioning, as well as sector and issuer selection, were all large contributors to the Fund’s performance over the reporting period. |
| • | Strong sector and issuer selection across developed sovereign debt, European peripheral issuers (i.e., non-core European countries), high yield corporates,high-quality structured products, and emerging markets agencies added to performance for the period. Looking at specific issuers, overweights to Greece, Italy and Portugal, as well as an underweight to France were among the largest contributors to performance. |
| • | Positioning in developed Treasuries hurt the Fund’s performance over the reporting period. |
| • | Looking at specific issuers, overweights to Argentina and Lebanon were among the largest detractors from performance. |
This report is not authorized for distribution to prospective investors unless preceded or accompanied by a current prospectus.
The views expressed in this report and information about the Fund’s portfolio holdings are for the period covered by this report and are subject to change thereafter.
Mutual funds are distributed by Prudential Investment Management Services LLC (PIMS), member SIPC. PGIM Fixed Income is a unit of PGIM, Inc. (PGIM), a registered investment adviser. PIMS and PGIM are Prudential Financial companies.© 2019 Prudential Financial, Inc. and its related entities. PGIM and the PGIM logo are service marks of Prudential Financial, Inc. and its related entities, registered in many jurisdictions worldwide.
| 2 | Visit our website at pgiminvestments.com |
| 5 | ||||
| 6 | ||||
| 7 | ||||
| 10 | ||||
| 13 | ||||
| 15 | ||||
| PGIM Global Total Return Fund | 3 |
This Page Intentionally Left Blank

Dear Shareholder:
We hope you find the annual report for the PGIM Global Total Return Fund informative and useful. The report covers performance for the 12-month period that ended October 31, 2019.
While the US economy remained healthy, with rising corporate profits and strong job growth, the Federal Reserve cut interest rates three times in the latter half of the period. The cuts were a proactive attempt by the Fed to extend the longest domestic economic expansion on record as growth in many regions weakened. China in particular showed signs of slowing amid trade tensions with the US, and turmoil in the United Kingdom continued as it negotiates an exit from the European Union.
The interest-rate cuts helped boost the performance of stocks globally. For the period overall, large-cap US equities along with stocks in developed and emerging foreign markets all rose by double digits. Small-cap US stocks posted a single-digit gain. This positive performance came despite significant volatility early in the period. Equities plunged at the end of 2018 on concerns about China’s economy, a potential global trade war, higher interest rates, and worries that profit growth might slow. Stocks reversed course early in 2019, rising sharply after the Fed moderated its position on additional rate hikes for the remainder of the year.
The overall US bond market posted strong returns during the period on a significant rally in interest rates that saw the 10-year US Treasury yield decline from over 3% to under 2%. Investment-grade corporate bonds led the way with a double-digit gain, while corporate high yield and municipal bonds each had a return in the high single digits. Globally, bonds in developed markets delivered strong returns, and emerging markets debt rose by double digits.
Regarding your investments with PGIM, we believe it is important to maintain a diversified portfolio of funds consistent with your tolerance for risk, time horizon, and financial goals. Your financial advisor can help you create a diversified investment plan that may include funds covering all the basic asset classes and that reflects your personal investor profile and risk tolerance. However, diversification and asset allocation strategies do not assure a profit or protect against loss in declining markets.
At PGIM Investments, we consider it a great privilege and responsibility to help investors participate in opportunities across global markets while meeting their toughest investment challenges. PGIM is a top-10 global investment manager with more than $1 trillion in assets under management. This scale and investment expertise allow us to deliver actively managed funds and strategies to meet the needs of investors around the globe.
Thank you for choosing our family of funds.
Sincerely,

Stuart S. Parker, President
PGIM Global Total Return Fund
December 16, 2019
| PGIM Global Total Return Fund | 5 |
Your Fund’s Performance(unaudited)
Performance data quoted represents past performance. Past performance does not guarantee future results. The investment return and principal value of an investment will fluctuate, so that an investor’s shares, when redeemed, may be worth more or less than their original cost. Current performance may be lower or higher than the past performance data quoted. An investor may obtain performance data as of the most recent month-end by visiting our website atpgiminvestments.com or by calling (800) 225-1852.
| Average Annual Total Returns as of 10/31/19 (with sales charges) | ||||||||||||||
| One Year (%) | Five Years (%) | Ten Years (%) | Since Inception (%) | |||||||||||
| Class A | 11.31 | 3.35 | 4.66 | — | ||||||||||
| Class B | 9.20 | 3.09 | 4.23 | — | ||||||||||
| Class C | 13.21 | 3.30 | 4.29 | — | ||||||||||
| Class Z | 15.25 | 4.33 | 5.28 | — | ||||||||||
| Class R2 | 14.81 | N/A | N/A | 5.27 (12/27/17) | ||||||||||
| Class R4 | 14.92 | N/A | N/A | 5.54 (12/27/17) | ||||||||||
| Class R6 | 15.25 | 4.29 | N/A | 4.35 (2/3/12) | ||||||||||
| Bloomberg Barclays Global Aggregate Bond Index |
| |||||||||||||
| 9.54 | 2.13 | 2.36 | — | |||||||||||
Average Annual Total Returns as of 10/31/19 (without sales charges) | ||||||||||||||
| One Year (%) | Five Years (%) | Ten Years (%) | Since Inception (%) | |||||||||||
| Class A | 15.05 | 4.03 | 5.00 | — | ||||||||||
| Class B | 14.20 | 3.27 | 4.23 | — | ||||||||||
| Class C | 14.21 | 3.30 | 4.29 | — | ||||||||||
| Class Z | 15.25 | 4.33 | 5.28 | — | ||||||||||
| Class R2 | 14.81 | N/A | N/A | 5.27 (12/27/17) | ||||||||||
| Class R4 | 14.92 | N/A | N/A | 5.54 (12/27/17) | ||||||||||
| Class R6 | 15.25 | 4.29 | N/A | 4.35 (2/3/12) | ||||||||||
| Bloomberg Barclays Global Aggregate Bond Index |
| |||||||||||||
| 9.54 | 2.13 | 2.36 | — | |||||||||||
| 6 | Visit our website at pgiminvestments.com |
Growth of a $10,000 Investment(unaudited)
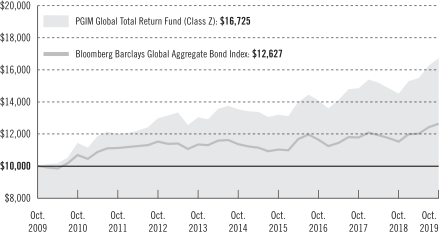
The graph compares a $10,000 investment in Fund’s Class Z shares with a similar investment in the Bloomberg Barclays Global Aggregate Bond Index by portraying the initial account values at the beginning of the 10-year period for Class Z shares (October 31, 2009) and the account values at the end of the current fiscal year (October 31, 2019) as measured on a quarterly basis. For purposes of the graph, and unless otherwise indicated, it has been assumed that (a) all recurring fees (including management fees) were deducted; and (b) all dividends and distributions were reinvested. The line graph provides information for Class Z shares only. As indicated in the tables provided earlier, performance for other share classes will vary due to the differing charges and expenses applicable to each share class (as indicated in the following paragraphs). Without waiver of fees and/or expense reimbursements, if any, the Fund’s returns would have been lower.
Past performance does not predict future performance. Total returns and the ending account values in the graph include changes in share price and reinvestment of dividends and capital gains distributions in a hypothetical investment for the periods shown. The Fund’s total returns do not reflect the deduction of income taxes on an individual’s investment. Taxes may reduce your actual investment returns on income or gains paid by the Fund or any gains you may realize if you sell your shares.
Source: PGIM Investments LLC and Lipper Inc.
Since Inception returns are provided for any share class with less than 10 fiscal years of returns. Since Inception returns for the Index are measured from the closest month-end to the class’ inception date.
| PGIM Global Total Return Fund | 7 |
Your Fund’s Performance(continued)
The returns in the tables do not reflect the deduction of taxes that a shareholder would pay on Fund distributions or following the redemption of Fund shares. The average annual total returns take into account applicable sales charges, which are described for each share class in the table below.
| Class A | Class B* | Class C | Class Z | Class R2 | Class R4 | Class R6 | ||||||||
| Maximum initial sales charge | For purchases on or after July 15, 2019: 3.25% of the public offering price. For purchases prior to July 15, 2019: 4.50% of the public offering price | None | None | None | None | None | None | |||||||
| Contingent deferred sales charge (CDSC) (as a percentage of the lower of the original purchase price or the net asset value at redemption) | For purchases on or after July 15, 2019: 1.00% on sales of $500,000 or more made within 12 months of purchase. For purchases prior to July 15, 2019: 1.00% on sales of $1 million or more made within 12 months of purchase. | 5.00% (Yr. 1) 4.00% (Yr. 2) 3.00% (Yr. 3) 2.00% (Yr. 4) 1.00% (Yr. 5/6) 0.00% (Yr. 7) | 1.00% on sales made within 12 months of purchase | None | None | None | None | |||||||
| Annual distribution and service(12b-1) fees (shown as a percentage of average daily net assets) | 0.25% | 1.00% | 1.00% | None | 0.25% | None | None | |||||||
| Shareholder service fees | None | None | None | None | 0.10% | 0.10% | None | |||||||
*Class B shares are closed to all purchase activity and no additional Class B shares may be purchased or acquired except by exchange from Class B shares of another Fund or through dividend or capital gains reinvestment.
Benchmark Definitions
Bloomberg Barclays Global Aggregate Bond Index—The Bloomberg Barclays Global Aggregate Bond Index is an unmanaged index of global investment-grade fixed income markets. The three major components of this index are the US Aggregate, the Pan-European Aggregate, and the Asian-Pacific Aggregate Indices. The Index also includes euro dollar and euro-yen corporate bonds, and Canadian government, agency, and corporate securities. The average annual total returns for the Index measured from the month-end closest to the inception date of the Fund’s Class R2 and Class R4 shares are 3.10% and 1.57% for Class R6 shares.
| 8 | Visit our website at pgiminvestments.com |
Investors cannot invest directly in an index or average. The returns for the Index would be lower if they included the effects of sales charges, operating expenses of a mutual fund, or taxes.
| Distributions and Yields as of 10/31/19 | ||||||
| Total Distributions Paid for 12 Months ($) | SEC 30-Day Subsidized Yield* (%) | SEC 30-Day Unsubsidized Yield** (%) | ||||
| Class A | 0.23 | 1.93 | 1.83 | |||
| Class B | 0.18 | 1.25 | 6.85 | |||
| Class C | 0.18 | 1.25 | 1.41 | |||
| Class Z | 0.25 | 2.24 | 2.15 | |||
| Class R2 | 0.22 | 1.79 | 2.37 | |||
| Class R4 | 0.24 | 2.04 | 1.96 | |||
| Class R6 | 0.26 | 2.28 | 2.28 | |||
*SEC 30-Day Subsidized Yield (%)—A standardized yield calculation created by the Securities and Exchange Commission, it reflects the income earned during a 30-day period, after the deduction of the Fund’s net expenses (net of any expense waivers or reimbursements). The investor experience is represented by the SEC 30-Day Subsidized Yield.
**SEC 30-Day Unsubsidized Yield (%)—A standardized yield calculation created by the Securities and Exchange Commission, it reflects the income earned during a 30-day period, after the deduction of the Fund’s gross expenses. The investor experience is represented by the SEC 30-Day Subsidized Yield.
| Credit Quality expressed as a percentage of total investments as of 10/31/19 (%) | ||||
| AAA | 22.0 | |||
| AA | 8.4 | |||
| A | 19.3 | |||
| BBB | 26.7 | |||
| BB | 10.1 | |||
| B | 5.0 | |||
| CCC | 0.7 | |||
| Not Rated | 9.0 | |||
| Cash/Cash Equivalents | –1.2 | |||
| Total | 100.0 | |||
Source: PGIM Fixed Income
Credit ratings reflect the highest rating assigned by a nationally recognized statistical rating organization (NRSRO) such as Moody’s Investors Service, Inc. (Moody’s), S&P Global Ratings (S&P), or Fitch, Inc. (Fitch). Credit ratings reflect the common nomenclature used by both S&P and Fitch. Where applicable, ratings are converted to the comparable S&P/Fitch rating tier nomenclature. These rating agencies are independent and are widely used. The Not Rated category consists of securities that have not been rated by a NRSRO. Credit ratings are subject to change.
| PGIM Global Total Return Fund | 9 |
Strategy and Performance Overview(unaudited)
How did the Fund perform?
ThePGIM Global Total Return Fund’s Class Z shares returned 15.25% in the 12-month reporting period that ended October 31, 2019, outperforming the 9.54% return of the Bloomberg Barclays Global Aggregate Bond Index (the Index).
What were the market conditions?
| • | The fourth quarter of 2018 represented a major shift in market sentiment across global asset classes. Interest rates peaked in early October and aggressively rallied as Brexit worries, fears of an escalating trade war, weaker economic data, and a hawkish Federal Reserve (Fed) punished risk assets, sending developed-market interest rates to yearly lows. As the fourth quarter concluded, the yield on 10-year German government bunds and Japanese government bonds (JGB) plummeted to depths not seen in years, while the 10-year US Treasury note yield ended the quarter just above its low from early in 2018. Additionally, after beginning the quarter higher, the yield on Italy’s 10-year BTP government bond declined below 3% for the first time since September 2018 as Italy slowly moved its 2019 budget target closer to the European Commission’s suggestion. |
| • | The decline in rates throughout most of first quarter of 2019 accelerated late in the quarter after the latest dovish pivots by the European Central Bank (ECB) and the Fed. The breadth of the decline left 10-year yields in several countries at multi-year or record lows. The Fed continued its pivot into the March Federal Open Market Committee (FOMC) meeting when the median federal funds rate projections for 2019, 2020, and 2021 each fell by 50 basis points (bps). (One basis point is 0.01%.) The FOMC also indicated that the balance sheet roll-off—a policy widely viewed as a modest tightening measure—would slow in May and end in September 2019. The ongoing weakness in European economic and inflation data (e.g., the precipitous decline in Germany’s March Purchasing Managers’ Index to 44.7 from more than 62 in late 2017) led to a bull flattening along the bund yield curve. (A yield curve is a series of points that graphically shows the yields on fixed income securities that have the same credit quality but different maturities.) |
| • | Interest rates across the G4 tumbled throughout the second quarter of 2019 (Japan: –7 bps, Germany: –25 bps, UK: –17 bps, and US Treasuries: –40 bps), driven by lackluster global economic data, lingering US-China trade tensions, and rising probabilities of easier global monetary policies. The Fed’s shift toward a more accommodative stance culminated in its June meeting with a drop in the median estimate of the long-run neutral fed funds rate from 2.8% to 2.5%—the top of its target range—as the third quarter of 2019 commenced. European economic and inflation data remained soft in the second quarter, which contributed to a bull flattening of the bunds curve. |
| • | Developed market interest rates took another leg down in the third quarter of 2019 as central banks collectively eased policies to counter signs of mounting global economic weakness and uncertainty. It was the second consecutive quarter of double-digit basis |
| 10 | Visit our website at pgiminvestments.com |
point declines for US and German 10-year yields (down 35 bps and 25 bps to 1.67% and –0.57%, respectively), while the Japanese 10-year yield also fell deeper into negative territory (down 10 bps to –0.22%). As the fourth quarter of 2019 progresses, US Treasury yields remain elevated in a global context, particularly with nearly $15 trillion in negative-yielding debt outstanding. In Europe, the ECB’s decision to renew its asset purchases creates a supportive backdrop for rates, particularly at the 7-year point of the German bund and French Oat markets. After the Bank of Japan (BoJ) mentioned the desirability of a steeper yield curve to support the banking sector, it subsequently announced reduced purchases at the back of the curve. Looking ahead, the BoJ may take additional steps in its attempt to steepen the yield curve. |
| • | Front-end Treasury yields fell, and the curve steepened in October 2019 as US-China trade uncertainty and weaker-than-expected US economic data drove a flight to safety. As part of the Fed’s expected 25-bp reduction in the targeted federal funds range, the FOMC removed a reference to “act as appropriate” to sustain the economic expansion, signaling for many that it is done cutting rates for now. UK gilt yields rose 14-16 bps as the risk of a no-deal Brexit receded, and the 10-year bund yields closed 16 bps higher to –0.41%. Elsewhere, the JGB curve flattened, with the 10-year JGB yield higher by 7 bps for the month. |
What worked?
| • | Overall, duration and yield curve positioning, as well as sector and issuer selection, were all large contributors to the Fund’s performance over the reporting period. |
| • | Strong sector and issuer selection across developed sovereign debt, European peripheral issuers (i.e., non-core European countries), high yield corporates, high-quality structured products, and emerging markets agencies added to performance for the period. Looking at specific issuers, overweights to Greece, Italy and Portugal, as well as an underweight to France were among the largest contributors to performance. |
| • | In developed rates, a long duration position in the US was the largest contributor to performance. In emerging markets, long-duration positioning in Brazilian rates was a strong contributor to performance. (Duration is a measure of the interest-rate sensitivity of a bond portfolio or debt securities that is expressed as a number of years.) A curve flattener in euro rates also added value. |
| • | Although overall currency positioning hurt performance, overweights to the Russian ruble, Thai baht, and Egyptian pound helped to offset some of the losses. |
What didn’t work?
| • | Positioning in developed Treasuries hurt the Fund’s performance over the reporting period. |
| • | Looking at specific issuers, overweights to Argentina and Lebanon were among the largest detractors from performance. |
| PGIM Global Total Return Fund | 11 |
Strategy and Performance Overview(continued)
| • | In developed rates, duration positioning in Canadian rates modestly hurt performance. In emerging rates, duration positioning in the Czech Republic was a slight detractor. |
| • | Currency positioning hurt performance over the period. An overweight to the Norwegian krone and underweights to the euro and South African rand were among the largest detractors from performance. |
Did the Fund use derivatives?
| • | The Fund used interest-rate futures and swaps to implement its investment strategy, as well as to help manage duration and yield curve exposure. The use of interest-rate futures had a negative impact on the Fund’s performance while the use of interest rate swaps added to performance. |
| • | Credit derivatives, primarily in the form of credit default swap index (CDX) positions, were used to either add risk exposure to certain issuers or to hedge credit risk imposed by certain issuers. Overall, credit derivative exposure added value during the reporting period. |
| • | In addition, to implement most currency strategies, the Fund employed foreign exchange derivatives, which negatively impacted performance. |
Current outlook
| • | PGIM Fixed Income maintains its positive view of fundamentals in the credit sectors of fixed income with positioning in spread sectors, including high yield, emerging market, and structured product sectors such as commercial mortgage-backed securities (CMBS) and asset-backed securities (ABS). Within CMBS, PGIM Fixed Income continues to find value in high-quality securities of new-issue conduit deals. In ABS, the Fund is maintaining an up-in-quality focus (with some exceptions) as capital stack/issuer valuations remain compressed. PGIM Fixed Income is constructive on US high yield and continues to like independent power producers and US consumer-related names. PGIM Fixed Income remains cautious on commodities but is looking at unique opportunities in natural gas and health care. The Fund ended the period with an underweight to investment-grade corporates. As we enter the later stage of the credit cycle, PGIM Fixed Income continues to favor better-quality financials and electric utilities over industrials. |
| • | The Fund is overweight in debt of European peripheral countries, as well as a select group of emerging market issuers, in mostly sovereign issues. The Fund has a very small allocation to government-related sectors, including Treasuries and agencies, as PGIM Fixed Income finds more compelling value in the aforementioned sectors. |
| • | In currency positioning relative to the Index, the Fund is underweight to the Swiss franc and the euro while maintaining an overweight to the US dollar and the Japanese yen. The Fund maintains a select set of small allocations, both underweight and overweight, within emerging market and “commodity” currencies, such as overweight exposure to the Singapore dollar, Norwegian krone, and Russian ruble, while taking underweight exposures to the Taiwan dollar and Indonesian rupiah. |
| 12 | Visit our website at pgiminvestments.com |
As a shareholder of the Fund, you incur two types of costs: (1) transaction costs, including sales charges (loads) on purchase payments and redemptions, as applicable, and (2) ongoing costs, including management fees, distribution and/or service (12b-1) fees, and other Fund expenses, as applicable. This example is intended to help you understand your ongoing costs (in dollars) of investing in the Fund and to compare these costs with the ongoing costs of investing in other mutual funds.
The example is based on an investment of $1,000 held through the six-month period ended October 31, 2019. The example is for illustrative purposes only; you should consult the Prospectus for information on initial and subsequent minimum investment requirements.
Actual Expenses
The first line for each share class in the table on the following page provides information about actual account values and actual expenses. You may use the information on this line, together with the amount you invested, to estimate the expenses that you paid over the period. Simply divide your account value by $1,000 (for example, an $8,600 account value ÷ $1,000 = 8.6), then multiply the result by the number on the first line under the heading “Expenses Paid During the Six-Month Period” to estimate the expenses you paid on your account during this period.
Hypothetical Example for Comparison Purposes
The second line for each share class in the table on the following page provides information about hypothetical account values and hypothetical expenses based on the Fund’s actual expense ratio and an assumed rate of return of 5% per year before expenses, which is not the Fund’s actual return. The hypothetical account values and expenses may not be used to estimate the actual ending account balance or expenses you paid for the period. You may use this information to compare the ongoing costs of investing in the Fund and other funds. To do so, compare this 5% hypothetical example with the 5% hypothetical examples that appear in the shareholder reports of the other funds.
The Fund’s transfer agent may charge additional fees to holders of certain accounts that are not included in the expenses shown in the table on the following page. These fees apply to individual retirement accounts (IRAs) and Section 403(b) accounts. As of the close of the six-month period covered by the table, IRA fees included an annual maintenance fee of $15 per account (subject to a maximum annual maintenance fee of $25 for all accounts held by the same shareholder). Section 403(b) accounts are charged an annual $25 fiduciary maintenance fee. Some of the fees may vary in amount, or may be waived, based on your total account balance or the number of PGIM funds, including the Fund, that you own. You should consider the additional fees that were charged to your Fund account over the six-month period when you estimate the total ongoing expenses paid over the period
| PGIM Global Total Return Fund | 13 |
Fees and Expenses(continued)
and the impact of these fees on your ending account value, as these additional expenses are not reflected in the information provided in the expense table. Additional fees have the effect of reducing investment returns.
Please note that the expenses shown in the table are meant to highlight your ongoing costs only and do not reflect any transactional costs such as sales charges (loads). Therefore, the second line for each share class in the table is useful in comparing ongoing costs only and will not help you determine the relative total costs of owning different funds. In addition, if these transactional costs were included, your costs would have been higher.
| PGIM Global Total Return Fund | Beginning Account May 1, 2019 | Ending Account October 31, 2019 | Annualized Expense Ratio Based on the Six-Month Period | Expenses Paid During the Six-Month Period* | ||||||||||||||
| Class A | Actual | $ | 1,000.00 | $ | 1,079.50 | 0.88 | % | $ | 4.61 | |||||||||
| Hypothetical | $ | 1,000.00 | $ | 1,020.77 | 0.88 | % | $ | 4.48 | ||||||||||
| Class B | Actual | $ | 1,000.00 | $ | 1,075.40 | 1.63 | % | $ | 8.53 | |||||||||
| Hypothetical | $ | 1,000.00 | $ | 1,016.99 | 1.63 | % | $ | 8.29 | ||||||||||
| Class C | Actual | $ | 1,000.00 | $ | 1,075.50 | 1.63 | % | $ | 8.53 | |||||||||
| Hypothetical | $ | 1,000.00 | $ | 1,016.99 | 1.63 | % | $ | 8.29 | ||||||||||
| Class Z | Actual | $ | 1,000.00 | $ | 1,080.40 | 0.63 | % | $ | 3.30 | |||||||||
| Hypothetical | $ | 1,000.00 | $ | 1,022.03 | 0.63 | % | $ | 3.21 | ||||||||||
| Class R2 | Actual | $ | 1,000.00 | $ | 1,077.50 | 1.08 | % | $ | 5.66 | |||||||||
| Hypothetical | $ | 1,000.00 | $ | 1,019.76 | 1.08 | % | $ | 5.50 | ||||||||||
| Class R4 | Actual | $ | 1,000.00 | $ | 1,078.90 | 0.83 | % | $ | 4.35 | |||||||||
| Hypothetical | $ | 1,000.00 | $ | 1,021.02 | 0.83 | % | $ | 4.23 | ||||||||||
| Class R6 | Actual | $ | 1,000.00 | $ | 1,080.40 | 0.56 | % | $ | 2.94 | |||||||||
| Hypothetical | $ | 1,000.00 | $ | 1,022.38 | 0.56 | % | $ | 2.85 | ||||||||||
*Fund expenses (net of fee waivers or subsidies, if any) for each share class are equal to the annualized expense ratio for each share class (provided in the table), multiplied by the average account value over the period, multiplied by the 184 days in the six-month period ended October 31, 2019, and divided by the 365 days in the Fund’s fiscal year ended October 31, 2019 (to reflect the six-month period). Expenses presented in the table include the expenses of any underlying portfolios in which the Fund may invest.
| 14 | Visit our website at pgiminvestments.com |
Schedule of Investments
as of October 31, 2019
| Description | Interest Rate | Maturity Date | Principal Amount (000)# | Value | ||||||||||||
LONG-TERM INVESTMENTS 97.7% | ||||||||||||||||
ASSET-BACKED SECURITIES 19.4% | ||||||||||||||||
Cayman Islands 11.7% | ||||||||||||||||
Anchorage Capital CLO Ltd., | 3.534 | %(c) | 07/22/32 | 20,000 | $ | 19,993,932 | ||||||||||
ArrowMark Colorado Holdings, | 3.281 | (c) | 07/15/29 | 500 | 499,392 | |||||||||||
Atlas Senior Loan Fund Ltd., | 3.301 | (c) | 01/16/30 | 500 | 499,069 | |||||||||||
Bain Capital Credit CLO, | 2.894 | (c) | 04/23/31 | 3,500 | 3,449,453 | |||||||||||
Battalion CLO Ltd., | 3.343 | (c) | 07/18/30 | 2,000 | 1,995,948 | |||||||||||
Benefit Street Partners CLO Ltd., | ||||||||||||||||
Series 2013-IIA, Class A1R, 144A, 3 Month LIBOR + 1.250% (Cap N/A, Floor 0.000%) | 3.251 | (c) | 07/15/29 | 1,250 | 1,246,589 | |||||||||||
Series 2017-12A, Class A1, 144A, 3 Month LIBOR + 1.250% (Cap N/A, Floor 0.000%) | 3.251 | (c) | 10/15/30 | 750 | 746,474 | |||||||||||
BlueMountain CLO Ltd., | 3.446 | (c) | 08/20/32 | 11,000 | 10,986,868 | |||||||||||
Brookside Mill CLO Ltd., | 3.352 | (c) | 01/17/28 | 4,000 | 3,912,502 | |||||||||||
Canyon Capital CLO Ltd., | 3.251 | (c) | 04/15/29 | 3,750 | 3,731,295 | |||||||||||
Carlyle Global Market Strategies CLO Ltd., | ||||||||||||||||
Series 2014-01A, Class A1R2, 144A, 3 Month LIBOR + 0.970% (Cap N/A, Floor 0.970%) | 2.972 | (c) | 04/17/31 | 9,000 | 8,910,554 | |||||||||||
Series 2015-05A, Class A1R, 144A, 3 Month LIBOR + 1.320% (Cap N/A, Floor 1.320%) | 3.286 | (c) | 01/20/32 | 8,500 | 8,492,739 | |||||||||||
Carlyle US CLO Ltd., | 2.986 | (c) | 04/20/31 | 12,500 | 12,340,874 | |||||||||||
Catamaran CLO Ltd., | 3.213 | (c) | 04/22/30 | 2,500 | 2,485,662 | |||||||||||
See Notes to Financial Statements.
| PGIM Global Total Return Fund | 15 |
Schedule of Investments(continued)
as of October 31, 2019
| Description | Interest Rate | Maturity Date | Principal Amount (000)# | Value | ||||||||||||
ASSET-BACKED SECURITIES (Continued) | ||||||||||||||||
Cayman Islands (cont’d.) | ||||||||||||||||
CBAM Ltd., | — | %(p) | 10/20/32 | 25,000 | $ | 24,999,975 | ||||||||||
Cent CLO Ltd., | 2.966 | (c) | 04/30/31 | 15,000 | 14,836,932 | |||||||||||
Elevation CLO Ltd., | 3.673 | (c) | 04/18/27 | 10,000 | 9,976,594 | |||||||||||
Greywolf CLO Ltd., | 2.966 | (c) | 04/26/31 | 7,000 | 6,880,341 | |||||||||||
HPS Loan Management Ltd., | 3.486 | (c) | 07/22/32 | 20,000 | 19,925,636 | |||||||||||
ICG US CLO Ltd., | 3.214 | (c) | 10/23/29 | 3,500 | 3,485,160 | |||||||||||
KVK CLO Ltd., | 3.786 | (c) | 05/20/29 | 5,000 | 4,928,574 | |||||||||||
Mariner CLO Ltd., | 3.050 | (c) | 04/25/31 | 6,250 | 6,193,037 | |||||||||||
MidOcean Credit CLO, | ||||||||||||||||
Series 2016-05A, Class AR, 144A, 3 Month LIBOR + 1.120% (Cap N/A, Floor 0.000%) | 3.086 | (c) | 07/19/28 | 8,000 | 7,981,599 | |||||||||||
Series 2018-08A, Class B, 144A, 3 Month LIBOR + 1.650% (Cap N/A, Floor 0.000%) | 3.786 | (c) | 02/20/31 | 2,000 | 1,965,078 | |||||||||||
Series 2018-09A, Class A1, 144A, 3 Month LIBOR + 1.150% (Cap N/A, Floor 1.150%) | 3.116 | (c) | 07/20/31 | 2,000 | 1,975,535 | |||||||||||
Mountain View CLO Ltd., | 3.781 | (c) | 07/15/31 | 5,750 | 5,685,185 | |||||||||||
OCP CLO Ltd., | ||||||||||||||||
Series 2017-13A, Class A1A, 144A, 3 Month LIBOR + 1.260% (Cap N/A, Floor 0.000%) | 3.261 | (c) | 07/15/30 | 750 | 747,826 | |||||||||||
Series 2019-17A, Class A1, 144A, 3 Month LIBOR + 1.330% (Cap N/A, Floor 1.330%) | 3.627 | (c) | 07/20/32 | 5,000 | 4,982,924 | |||||||||||
OZLM Ltd., | ||||||||||||||||
Series 2014-06A, Class A1S, 144A, 3 Month LIBOR + 1.080% (Cap N/A, Floor 0.000%) | 3.082 | (c) | 04/17/31 | 5,500 | 5,419,694 | |||||||||||
See Notes to Financial Statements.
| 16 |
| Description | Interest Rate | Maturity Date | Principal Amount (000)# | Value | ||||||||||||
ASSET-BACKED SECURITIES (Continued) | ||||||||||||||||
Cayman Islands (cont’d.) | ||||||||||||||||
OZLM Ltd., (cont’d.) | ||||||||||||||||
Series 2014-06A, Class A2AS, 144A, 3 Month LIBOR + 1.750% (Cap N/A, Floor 0.000%) | 3.752 | %(c) | 04/17/31 | 2,000 | $ | 1,979,616 | ||||||||||
Series 2015-11A, Class A1R, 144A, 3 Month LIBOR + 1.250% (Cap N/A, Floor 0.000%) | 3.186 | (c) | 10/30/30 | 1,000 | 994,746 | |||||||||||
Series 2018-20A, Class A1, 144A, 3 Month LIBOR + 1.050% (Cap N/A, Floor 0.000%) | 3.016 | (c) | 04/20/31 | 5,000 | 4,933,067 | |||||||||||
Series 2018-20A, Class A2, 144A, 3 Month LIBOR + 1.650% (Cap N/A, Floor 0.000%) | 3.616 | (c) | 04/20/31 | 3,000 | 2,949,570 | |||||||||||
Series 2019-24A, Class A1A, 144A, 3 Month LIBOR + 1.390% (Cap N/A, Floor 0.000%) | 3.546 | (c) | 07/20/32 | 8,000 | 7,999,584 | |||||||||||
Palmer Square CLO Ltd., | 3.236 | (c) | 07/20/30 | 1,750 | 1,743,459 | |||||||||||
Regatta Funding Ltd., | 3.252 | (c) | 10/17/30 | 2,000 | 1,987,888 | |||||||||||
Shackleton CLO Ltd., | ||||||||||||||||
Series 2014-05RA, Class A, 144A, 3 Month LIBOR + 1.100% (Cap N/A, Floor 0.000%) | 3.309 | (c) | 05/07/31 | 5,000 | 4,944,016 | |||||||||||
Series 2014-05RA, Class B, 144A, 3 Month LIBOR + 1.700% (Cap N/A, Floor 0.000%) | 3.909 | (c) | 05/07/31 | 6,500 | 6,409,813 | |||||||||||
Silver Creek CLO Ltd., | 3.206 | (c) | 07/20/30 | 500 | 499,324 | |||||||||||
Sound Point CLO Ltd., | ||||||||||||||||
Series 2016-02A, Class BR, 144A, 3 Month LIBOR + 1.800% (Cap N/A, Floor 1.800%) | 3.766 | (c) | 10/20/28 | 3,000 | 3,006,808 | |||||||||||
Series 2016-03A, Class AR, 144A, 3 Month LIBOR + 1.150% (Cap N/A, Floor 0.000%) | 3.084 | (c) | 01/23/29 | 8,000 | 7,970,342 | |||||||||||
Series 2017-03A, Class A1B, 144A, 3 Month LIBOR + 1.220% (Cap N/A, Floor 0.000%) | 3.186 | (c) | 10/20/30 | 500 | 497,163 | |||||||||||
TCW CLO Ltd., | 2.990 | (c) | 04/25/31 | 15,000 | 14,848,257 | |||||||||||
Telos CLO Ltd., | 3.302 | (c) | 07/17/26 | 963 | 961,708 | |||||||||||
TIAA CLO Ltd., | 3.166 | (c) | 07/20/31 | 2,000 | 1,980,343 | |||||||||||
See Notes to Financial Statements.
| PGIM Global Total Return Fund | 17 |
Schedule of Investments(continued)
as of October 31, 2019
| Description | Interest Rate | Maturity Date | Principal Amount (000)# | Value | ||||||||||||
ASSET-BACKED SECURITIES (Continued) | ||||||||||||||||
Cayman Islands (cont’d.) | ||||||||||||||||
TICP CLO Ltd., | 3.266 | %(c) | 07/20/27 | 5,187 | $ | 5,066,608 | ||||||||||
Trinitas CLO Ltd., | 3.401 | (c) | 07/15/27 | 5,000 | 4,943,767 | |||||||||||
Tryon Park CLO Ltd., | 3.501 | (c) | 04/15/29 | 3,700 | 3,641,823 | |||||||||||
Voya CLO Ltd., | 2.910 | (c) | 04/25/31 | 4,500 | 4,432,690 | |||||||||||
Wellfleet CLO Ltd., | ||||||||||||||||
Series 2017-02A, Class A1, 144A, 3 Month LIBOR + 1.250% (Cap N/A, Floor 0.000%) | 3.216 | (c) | 10/20/29 | 1,500 | 1,496,282 | |||||||||||
Series 2017-03A, Class A1, 144A, 3 Month LIBOR + 1.150% (Cap N/A, Floor 1.150%) | 3.152 | (c) | 01/17/31 | 2,500 | 2,472,618 | |||||||||||
York CLO Ltd., | 3.103 | (c) | 01/22/31 | 5,000 | 4,967,201 | |||||||||||
Zais CLO Ltd., | ||||||||||||||||
Series 2015-03A, Class A2R, 144A, 3 Month LIBOR + 2.190% (Cap N/A, Floor 0.000%) | 4.191 | (c) | 07/15/31 | 8,500 | 8,252,198 | |||||||||||
Series 2017-01A, Class A1, 144A, 3 Month LIBOR + 1.370% (Cap N/A, Floor 0.000%) | 3.371 | (c) | 07/15/29 | 4,250 | 4,222,157 | |||||||||||
Series 2017-02A, Class A, 144A, 3 Month LIBOR + 1.290% (Cap N/A, Floor 0.000%) | 3.291 | (c) | 04/15/30 | 750 | 740,086 | |||||||||||
Series 2018-01A, Class A, 144A, 3 Month LIBOR + 0.950% (Cap N/A, Floor 0.000%) | 2.951 | (c) | 04/15/29 | 7,250 | 7,183,937 | |||||||||||
|
| |||||||||||||||
| 310,400,512 | ||||||||||||||||
Ireland 1.7% | ||||||||||||||||
Anchorage Capital Europe CLO, | 1.500 | 01/15/31 | EUR | 8,250 | 9,197,488 | |||||||||||
Arbour CLO DAC, | 1.920 | 03/15/29 | EUR | 4,000 | 4,461,282 | |||||||||||
Armada Euro CLO DAC, | 1.500 | 11/15/31 | EUR | 1,500 | 1,672,293 | |||||||||||
Carlyle Euro CLO Ltd., | 1.400 | (c) | 08/15/32 | EUR | 8,000 | 8,908,008 | ||||||||||
See Notes to Financial Statements.
| 18 |
| Description | Interest Rate | Maturity Date | Principal Amount (000)# | Value | ||||||||||||
ASSET-BACKED SECURITIES (Continued) | ||||||||||||||||
Ireland (cont’d.) | ||||||||||||||||
Hayfin Emerald CLO DAC, | 2.650 | % | 05/27/32 | EUR | 4,000 | $ | 4,460,433 | |||||||||
OAK Hill European Credit Partners DAC, | 1.150 | 01/20/32 | EUR | 3,000 | 3,352,184 | |||||||||||
St. Paul’s CLO DAC, | 0.750 | (c) | 10/15/30 | EUR | 11,000 | 12,268,300 | ||||||||||
|
| |||||||||||||||
| 44,319,988 | ||||||||||||||||
Netherlands 0.0% | ||||||||||||||||
St. Paul’s CLO DAC, | 2.400 | 04/30/30 | EUR | 1,000 | 1,114,566 | |||||||||||
Spain 0.3% | ||||||||||||||||
TFS, | 2.900 | (c) | 03/16/23 | EUR | 7,620 | 8,481,300 | ||||||||||
United States 5.7% | ||||||||||||||||
ABFC Trust, | 2.523 | (c) | 06/25/34 | 754 | 751,155 | |||||||||||
ACE Securities Corp. Home Equity Loan Trust, | 2.783 | (c) | 04/25/35 | 246 | 246,284 | |||||||||||
Ameriquest Mortgage Securities, Inc., Asset-Backed Pass-Through Certificates, | ||||||||||||||||
Series 2002-02, Class M3, 1 Month LIBOR + 2.655% (Cap N/A, Floor 1.770%) | 4.478 | (c) | 08/25/32 | 512 | 510,070 | |||||||||||
Series 2002-03, Class M3, 1 Month LIBOR + 2.850% (Cap N/A, Floor 1.900%) | 4.673 | (c) | 08/25/32 | 257 | 257,624 | |||||||||||
Series 2004-R08, Class M1, 1 Month LIBOR + 0.960% (Cap N/A, Floor 0.640%) | 2.783 | (c) | 09/25/34 | 33 | 32,824 | |||||||||||
Argent Securities, Inc., Asset-Backed Pass-Through Certificates, | ||||||||||||||||
Series 2004-W06, Class M1, 1 Month LIBOR + 0.825% (Cap N/A, Floor 0.550%) | 2.648 | (c) | 05/25/34 | 49 | 49,340 | |||||||||||
Series 2005-W02, Class A2C, 1 Month LIBOR + 0.360% (Cap N/A, Floor 0.360%) | 2.183 | (c) | 10/25/35 | 396 | 396,711 | |||||||||||
See Notes to Financial Statements.
| PGIM Global Total Return Fund | 19 |
Schedule of Investments(continued)
as of October 31, 2019
| Description | Interest Rate | Maturity Date | Principal Amount (000)# | Value | ||||||||||||
ASSET-BACKED SECURITIES (Continued) | ||||||||||||||||
United States (cont’d.) | ||||||||||||||||
Battalion CLO Ltd., | 3.194 | %(c) | 05/17/31 | 15,000 | $ | 14,777,832 | ||||||||||
Chase Funding Loan Acquisition Trust, | 2.623 | (c) | 05/25/34 | 183 | 183,516 | |||||||||||
Chase Funding Trust, | 2.423 | (c) | 05/25/33 | 789 | 771,237 | |||||||||||
CHEC Loan Trust, | 2.823 | (c) | 07/25/34 | 679 | 676,847 | |||||||||||
CIT Mortgage Loan Trust, | 3.173 | (c) | 10/25/37 | 1,121 | 1,133,150 | |||||||||||
Countrywide Asset-Backed Certificates, | 3.323 | (c) | 03/25/33 | 119 | 119,450 | |||||||||||
Credit Suisse Mortgage Trust, | ||||||||||||||||
Series 2016-RPL01, Class A1, 144A, 1 Month LIBOR + 3.150% (Cap N/A, Floor 3.150%) | 5.182 | (c) | 12/26/46 | 1,225 | 1,229,592 | |||||||||||
Series 2018-RPL08, Class A1, 144A | 4.125 | (cc) | 07/25/58 | 3,019 | 3,047,056 | |||||||||||
EquiFirst Mortgage Loan Trust, | 2.303 | (c) | 01/25/34 | 679 | 663,152 | |||||||||||
Ford Credit Floorplan Master Owner Trust, | 4.060 | 11/15/30 | 5,000 | 5,550,676 | ||||||||||||
Laurel Road Prime Student Loan Trust, | ||||||||||||||||
Series 2018-A, Class A, 144A | — | (p) | 02/25/43 | 3,430 | 3,903,773 | |||||||||||
Series 2018-C, Class A, 144A | — | (p) | 08/25/43 | 3,239 | 3,335,185 | |||||||||||
Series 2019-A, Class R, 144A | — | (p) | 10/25/48 | 8,200 | 577,712 | |||||||||||
Legacy Mortgage Asset Trust, | ||||||||||||||||
Series 2019-GS01, Class A1, 144A | 4.000 | 01/25/59 | 1,773 | 1,794,580 | ||||||||||||
Series 2019-GS02, Class A1, 144A | 3.750 | 01/25/59 | 2,021 | 2,038,989 | ||||||||||||
Series 2019-GS03, Class A1, 144A | 3.750 | 04/25/59 | 1,028 | 1,040,518 | ||||||||||||
Series 2019-GS04, Class A1, 144A | 3.438 | 05/25/59 | 3,168 | 3,194,532 | ||||||||||||
Series 2019-SL01, Class A, 144A | 4.000 | (cc) | 12/28/54 | 1,290 | 1,301,953 | |||||||||||
Lendmark Funding Trust, | ||||||||||||||||
Series 2017-02A, Class B, 144A | 3.380 | 05/20/26 | 2,000 | 2,000,023 | ||||||||||||
Series 2017-02A, Class C, 144A | 4.330 | 05/20/26 | 700 | 701,159 | ||||||||||||
Series 2019-02A, Class A, 144A | 2.780 | 04/20/28 | 2,300 | 2,299,395 | ||||||||||||
See Notes to Financial Statements.
| 20 |
| Description | Interest Rate | Maturity Date | Principal Amount (000)# | Value | ||||||||||||
ASSET-BACKED SECURITIES (Continued) | ||||||||||||||||
United States (cont’d.) | ||||||||||||||||
Long Beach Mortgage Loan Trust, | ||||||||||||||||
Series 2003-04, Class AV1, 1 Month LIBOR + 0.620% (Cap N/A, Floor 0.310%) | 2.443 | %(c) | 08/25/33 | 787 | $ | 794,098 | ||||||||||
Series 2004-03, Class M1, 1 Month LIBOR + 0.855% (Cap N/A, Floor 0.570%) | 2.678 | (c) | 07/25/34 | 151 | 145,786 | |||||||||||
LSFVT, | 4.483 | (c) | 05/02/22 | 7,248 | 7,247,808 | |||||||||||
MASTR Asset-Backed Securities Trust, | 2.723 | (c) | 04/25/34 | 1,477 | 1,465,695 | |||||||||||
Merrill Lynch Mortgage Investors Trust, | 3.023 | (c) | 08/25/35 | 57 | 57,413 | |||||||||||
Morgan Stanley ABS Capital I, Inc. Trust, | 2.873 | (c) | 09/25/33 | 141 | 141,023 | |||||||||||
Morgan Stanley Dean Witter Capital I, Inc. Trust, | 2.803 | (c) | 02/25/33 | 208 | 208,428 | |||||||||||
OneMain Direct Auto Receivables Trust, | ||||||||||||||||
Series 2017-01A, Class C, 144A | 3.910 | 08/16/21 | 1,900 | 1,903,366 | ||||||||||||
Series 2017-02A, Class D, 144A | 3.420 | 10/15/24 | 700 | 705,992 | ||||||||||||
Series 2017-02A, Class E, 144A | 4.740 | 11/14/25 | 1,000 | 1,016,569 | ||||||||||||
Series 2019-01A, Class A, 144A | 3.630 | 09/14/27 | 5,900 | 6,145,667 | ||||||||||||
Series 2019-01A, Class B, 144A | 3.950 | 11/14/28 | 1,300 | 1,366,097 | ||||||||||||
OneMain Financial Issuance Trust, | ||||||||||||||||
Series 2016-01A, Class A, 144A | 3.660 | 02/20/29 | 267 | 268,017 | ||||||||||||
Series 2017-01A, Class C, 144A | 3.350 | 09/14/32 | 400 | 402,322 | ||||||||||||
Oportun Funding LLC, | ||||||||||||||||
Series 2017-A, Class A, 144A | 3.230 | 06/08/23 | 1,000 | 1,000,564 | ||||||||||||
Series 2017-B, Class A, 144A | 3.220 | 10/10/23 | 2,600 | 2,607,419 | ||||||||||||
Series 2018-A, Class A, 144A | 3.610 | 03/08/24 | 1,330 | 1,345,190 | ||||||||||||
Series 2018-C, Class A, 144A | 4.100 | 10/08/24 | 2,450 | 2,512,147 | ||||||||||||
Series 2018-D, Class A, 144A | 4.150 | 12/09/24 | 1,500 | 1,541,035 | ||||||||||||
Series 2019-A, Class B, 144A | 3.870 | 08/08/25 | 4,158 | 4,189,120 | ||||||||||||
Option One Mortgage Acceptance Corp., Asset-Backed Certificates, | 2.483 | (c) | 11/25/33 | 750 | 744,271 | |||||||||||
Park Avenue Funding Trust, | 3.644 | (c) | 11/27/20 | 8,620 | 8,619,881 | |||||||||||
See Notes to Financial Statements.
| PGIM Global Total Return Fund | 21 |
Schedule of Investments(continued)
as of October 31, 2019
| Description | Interest Rate | Maturity Date | Principal Amount (000)# | Value | ||||||||||||
ASSET-BACKED SECURITIES (Continued) | ||||||||||||||||
United States (cont’d.) | ||||||||||||||||
PNMAC FMSR Issuer Trust, | 4.173 | %(c) | 04/25/23 | 4,290 | $ | 4,241,030 | ||||||||||
PNMAC GMSR Issuer Trust, | ||||||||||||||||
Series 2018-GT01, Class A, 144A, 1 Month LIBOR + 2.850% (Cap N/A, Floor 2.850%) | 4.673 | (c) | 02/25/23 | 1,020 | 1,026,310 | |||||||||||
Series 2018-GT02, Class A, 144A, 1 Month LIBOR + 2.650% (Cap N/A, Floor 0.000%) | 4.473 | (c) | 08/25/25 | 2,300 | 2,307,975 | |||||||||||
Popular ABS Mortgage Pass-Through Trust, | 4.253 | (cc) | 09/25/34 | 110 | 114,616 | |||||||||||
SLM Student Loan Trust, | ||||||||||||||||
Series 2004-02X, Class A6, 3 Month EURIBOR + 0.550% (Cap N/A, Floor 0.000%) | 0.148 | (c) | 07/25/39 | EUR | 3,520 | 3,802,402 | ||||||||||
Series 2007-02, Class B, 3 Month LIBOR + 0.170% (Cap N/A, Floor 0.000%) | 2.110 | (c) | 07/25/25 | 6,600 | 5,997,094 | |||||||||||
SoFi Alternative Trust, | ||||||||||||||||
Series 2019-B, Class PT, 144A | — | (p) | 12/15/45 | 11,915 | 12,338,137 | |||||||||||
Series 2019-D, Class 1PT, 144A | 2.460 | (cc) | 01/16/46 | 12,700 | 13,119,344 | |||||||||||
Springleaf Funding Trust, | 3.860 | 07/15/30 | 800 | 818,310 | ||||||||||||
Structured Asset Securities Corp. Mortgage Loan Trust, | 2.253 | (c) | 05/25/35 | 22 | 22,180 | |||||||||||
TH MSR Issuer Trust, | 4.623 | (c) | 06/25/24 | 9,330 | 9,325,987 | |||||||||||
|
| |||||||||||||||
| 150,125,628 | ||||||||||||||||
|
| |||||||||||||||
TOTAL ASSET-BACKED SECURITIES | 514,441,994 | |||||||||||||||
|
| |||||||||||||||
BANK LOANS 0.3% | ||||||||||||||||
United Kingdom 0.2% | ||||||||||||||||
BBD Bidco Ltd., | — | (p) | 09/30/26 | GBP | 2,125 | 2,764,089 | ||||||||||
Ceva Sante Animale SA, | 4.750 | (c) | 04/13/26 | EUR | 1,575 | 1,761,616 | ||||||||||
Richmond UK Bidco Ltd., | 4.963 | (c) | 03/03/24 | GBP | 133 | 166,790 | ||||||||||
|
| |||||||||||||||
| 4,692,495 | ||||||||||||||||
See Notes to Financial Statements.
| 22 |
| Description | Interest Rate | Maturity Date | Principal Amount (000)# | Value | ||||||||||||
BANK LOANS (Continued) | ||||||||||||||||
United States 0.1% | ||||||||||||||||
Aleris International, Inc., | 6.536 | %(c) | 02/27/23 | 2,970 | $ | 2,968,069 | ||||||||||
|
| |||||||||||||||
TOTAL BANK LOANS | 7,660,564 | |||||||||||||||
|
| |||||||||||||||
COMMERCIAL MORTGAGE-BACKED SECURITIES 7.0% |
| |||||||||||||||
United Kingdom 0.0% | ||||||||||||||||
Salus European Loan Conduit DAC, | 2.299 | (c) | 01/23/29 | GBP | 500 | 649,877 | ||||||||||
United States 7.0% | ||||||||||||||||
20 Times Square Trust, | ||||||||||||||||
Series 2018-20TS, Class G, 144A | 3.100 | (cc) | 05/15/35 | 1,000 | 969,662 | |||||||||||
Series 2018-20TS, Class H, 144A | 3.100 | (cc) | 05/15/35 | 1,000 | 952,300 | |||||||||||
BANK, | ||||||||||||||||
Series 2017-BNK05, Class A3 | 3.020 | 06/15/60 | 3,600 | 3,715,480 | ||||||||||||
Series 2017-BNK06, Class A3 | 3.125 | 07/15/60 | 4,400 | 4,552,425 | ||||||||||||
Series 2017-BNK07, Class A4 | 3.175 | 09/15/60 | 5,000 | 5,276,513 | ||||||||||||
Series 2017-BNK09, Class A3 | 3.279 | 11/15/54 | 3,000 | 3,190,602 | ||||||||||||
Series 2019-BN21, Class A3 | 2.458 | 10/17/52 | 6,293 | 6,312,268 | ||||||||||||
Benchmark Mortgage Trust, | ||||||||||||||||
Series 2018-B02, Class A3 | 3.544 | 02/15/51 | 5,000 | 5,282,137 | ||||||||||||
Series 2018-B03, Class A3 | 3.746 | 04/10/51 | 7,200 | 7,671,921 | ||||||||||||
BX Commercial Mortgage Trust, | ||||||||||||||||
Series 2019-XL, Class F, 144A, 1 Month LIBOR + 2.000% (Cap N/A, Floor 2.000%) | 4.000 | (c) | 10/15/36 | 3,300 | 3,304,192 | |||||||||||
Series 2019-XL, Class G, 144A, 1 Month LIBOR + 2.300% (Cap N/A, Floor 2.300%) | 4.300 | (c) | 10/15/36 | 3,400 | 3,405,378 | |||||||||||
Cantor Commercial Real Estate Lending, | 2.647 | 11/15/52 | 16,531 | 16,747,049 | ||||||||||||
Citigroup Commercial Mortgage Trust, | ||||||||||||||||
Series 2014-GC21, Class XB, IO | 0.438 | (cc) | 05/10/47 | 27,500 | 548,933 | |||||||||||
Series 2016-GC37, Class XB, IO | 0.688 | (cc) | 04/10/49 | 33,868 | 1,424,939 | |||||||||||
Series 2016-P04, Class XB, IO | 1.347 | (cc) | 07/10/49 | 9,100 | 743,634 | |||||||||||
Series 2017-P08, Class A2 | 3.109 | 09/15/50 | 2,000 | 2,080,542 | ||||||||||||
Series 2018-B02, Class A3 | 3.744 | 03/10/51 | 7,500 | 8,233,514 | ||||||||||||
COMM Mortgage Trust, | ||||||||||||||||
Series 2012-CR01, Class XA, IO | 1.858 | (cc) | 05/15/45 | 3,446 | 134,191 | |||||||||||
Series 2014-CR19, Class A3 | 3.530 | 08/10/47 | 465 | 465,138 | ||||||||||||
See Notes to Financial Statements.
| PGIM Global Total Return Fund | 23 |
Schedule of Investments(continued)
as of October 31, 2019
| Description | Interest Rate | Maturity Date | Principal Amount (000)# | Value | ||||||||||||
COMMERCIAL MORTGAGE-BACKED SECURITIES (Continued) | ||||||||||||||||
United States (cont’d.) | ||||||||||||||||
COMM Mortgage Trust, (cont’d.) | ||||||||||||||||
Series 2014-UBS04, Class XB, IO, 144A | 0.214 | %(cc) | 08/10/47 | 50,000 | $ | 520,905 | ||||||||||
Series 2015-CR24, Class A4 | 3.432 | 08/10/48 | 4,100 | 4,335,289 | ||||||||||||
Credit Suisse Mortgage Capital Certificates, | 4.064 | (c) | 05/15/36 | 4,700 | 4,717,677 | |||||||||||
CSAIL Commercial Mortgage Trust, | ||||||||||||||||
Series 2018-CX11, Class A3 | 4.095 | 04/15/51 | 2,250 | 2,435,929 | ||||||||||||
Series 2019-C17, Class A3 | 2.769 | 09/15/52 | 12,444 | 12,673,619 | ||||||||||||
DBJPM Mortgage Trust, | ||||||||||||||||
Series 2016-C03, Class A3 | 2.362 | 08/10/49 | 1,500 | 1,499,034 | ||||||||||||
Series 2017-C06, Class A3 | 3.269 | 06/10/50 | 4,400 | 4,586,196 | ||||||||||||
DBWF Mortgage Trust, | 3.808 | (cc) | 12/10/36 | 3,000 | 2,999,807 | |||||||||||
Eleven Madison Mortgage Trust, | 3.555 | (cc) | 09/10/35 | 500 | 526,062 | |||||||||||
FHLMC Multifamily Structured Pass-Through Certificates, | ||||||||||||||||
Series K006, Class AX1, IO | 0.880 | (cc) | 01/25/20 | 9,135 | 186 | |||||||||||
Series K007, Class X1, IO | 1.030 | (cc) | 04/25/20 | 18,843 | 32,870 | |||||||||||
Series K008, Class X1, IO | 1.480 | (cc) | 06/25/20 | 10,710 | 58,637 | |||||||||||
Series K019, Class X1, IO | 1.601 | (cc) | 03/25/22 | 9,071 | 295,823 | |||||||||||
Series K020, Class X1, IO | 1.393 | (cc) | 05/25/22 | 10,551 | 315,346 | |||||||||||
Series K025, Class X1, IO | 0.823 | (cc) | 10/25/22 | 18,402 | 395,371 | |||||||||||
Series K037, Class X1, IO | 0.979 | (cc) | 01/25/24 | 10,533 | 365,280 | |||||||||||
Series K043, Class X1, IO | 0.538 | (cc) | 12/25/24 | 12,208 | 298,065 | |||||||||||
Series K049, Class X1, IO | 0.602 | (cc) | 07/25/25 | 40,959 | 1,196,886 | |||||||||||
Series K052, Class X1, IO | 0.662 | (cc) | 11/25/25 | 12,280 | 415,354 | |||||||||||
Series K053, Class X1, IO | 0.888 | (cc) | 12/25/25 | 45,635 | 2,143,681 | |||||||||||
Series K054, Class X1, IO | 1.174 | (cc) | 01/25/26 | 30,958 | 1,944,856 | |||||||||||
Series K058, Class X1, IO | 0.928 | (cc) | 08/25/26 | 41,451 | 2,251,491 | |||||||||||
Series K090, Class X1, IO | 0.705 | (cc) | 02/25/29 | 22,992 | 1,361,005 | |||||||||||
Series K717, Class X1, IO | 0.470 | (cc) | 09/25/21 | 10,926 | 78,409 | |||||||||||
Series Q001, Class XA, IO | 2.234 | (cc) | 02/25/32 | 6,499 | 880,522 | |||||||||||
GS Mortgage Securities Trust, | ||||||||||||||||
Series 2014-GC20, Class XB, IO | 0.436 | (cc) | 04/10/47 | 30,000 | 558,444 | |||||||||||
Series 2014-GC22, Class XB, IO | 0.300 | (cc) | 06/10/47 | 35,000 | 553,896 | |||||||||||
Series 2014-GC24, Class XB, IO | 0.021 | (cc) | 09/10/47 | 83,262 | 71,672 | |||||||||||
Series 2014-GC26, Class XB, IO | 0.302 | (cc) | 11/10/47 | 56,483 | 937,612 | |||||||||||
Series 2018-GS09, Class A3 | 3.727 | 03/10/51 | 7,000 | 7,662,786 | ||||||||||||
JPMBB Commercial Mortgage Securities Trust, | 3.515 | 03/15/49 | 1,500 | 1,554,506 | ||||||||||||
See Notes to Financial Statements.
| 24 |
| Description | Interest Rate | Maturity Date | Principal Amount (000)# | Value | ||||||||||||
COMMERCIAL MORTGAGE-BACKED SECURITIES (Continued) | ||||||||||||||||
United States (cont’d.) | ||||||||||||||||
JPMCC Commercial Mortgage Securities Trust, | ||||||||||||||||
Series 2017-JP05, Class A3 | 3.342 | % | 03/15/50 | 1,600 | $ | 1,661,505 | ||||||||||
Series 2017-JP06, Class A3 | 3.109 | 07/15/50 | 4,600 | 4,728,522 | ||||||||||||
Series 2017-JP07, Class A3 | 3.379 | 09/15/50 | 5,100 | 5,361,435 | ||||||||||||
Morgan Stanley Bank of America Merrill Lynch Trust, | ||||||||||||||||
Series 2015-C24, Class XA, IO | 0.766 | (cc) | 05/15/48 | 26,156 | 921,025 | |||||||||||
Series 2016-C31, Class A3 | 2.731 | 11/15/49 | 2,211 | 2,250,459 | ||||||||||||
Morgan Stanley Capital I Trust, | ||||||||||||||||
Series 2016-UBS09, Class A2 | 2.982 | 03/15/49 | 459 | 467,373 | ||||||||||||
Series 2017-H01, Class A3 | 3.153 | 06/15/50 | 4,500 | 4,665,892 | ||||||||||||
UBS Commercial Mortgage Trust, | ||||||||||||||||
Series 2017-C04, Class A3 | 3.301 | 10/15/50 | 6,500 | 6,882,919 | ||||||||||||
Series 2017-C06, Class A3 | 3.581 | 12/15/50 | 5,000 | 5,290,361 | ||||||||||||
Series 2017-C07, Class A3 | 3.418 | 12/15/50 | 4,400 | 4,693,275 | ||||||||||||
UBS-Barclays Commercial Mortgage Trust, | 1.311 | (cc) | 05/10/63 | 4,371 | 128,464 | |||||||||||
Wells Fargo Commercial Mortgage Trust, | ||||||||||||||||
Series 2016-C35, Class XB, IO | 0.936 | (cc) | 07/15/48 | 24,000 | 1,401,218 | |||||||||||
Series 2016-LC24, Class XB, IO | 1.012 | (cc) | 10/15/49 | 20,910 | 1,313,572 | |||||||||||
Series 2017-C40, Class A3 | 3.317 | 10/15/50 | 2,600 | �� | 2,762,807 | |||||||||||
Series 2018-C43, Class A3 | 3.746 | 03/15/51 | 8,350 | 9,091,287 | ||||||||||||
|
| |||||||||||||||
| 184,298,148 | ||||||||||||||||
|
| |||||||||||||||
TOTAL COMMERCIAL MORTGAGE-BACKED SECURITIES | 184,948,025 | |||||||||||||||
|
| |||||||||||||||
CORPORATE BONDS 30.1% | ||||||||||||||||
Australia 0.0% | ||||||||||||||||
Westpac Banking Corp., | 4.350 | 01/19/21 | CNH | 8,770 | 1,261,466 | |||||||||||
Brazil 0.4% | ||||||||||||||||
Petrobras Global Finance BV, | ||||||||||||||||
Gtd. Notes(a) | 5.375 | 10/01/29 | GBP | 5,000 | 7,112,896 | |||||||||||
Gtd. Notes | 6.625 | 01/16/34 | GBP | 850 | 1,309,498 | |||||||||||
Gtd. Notes, EMTN | 6.250 | 12/14/26 | GBP | 905 | 1,386,235 | |||||||||||
|
| |||||||||||||||
| 9,808,629 | ||||||||||||||||
See Notes to Financial Statements.
| PGIM Global Total Return Fund | 25 |
Schedule of Investments(continued)
as of October 31, 2019
| Description | Interest Rate | Maturity Date | Principal Amount (000)# | Value | ||||||||||||
CORPORATE BONDS (Continued) | ||||||||||||||||
Canada 0.7% | ||||||||||||||||
Barrick Gold Corp., | 5.250 | % | 04/01/42 | 35 | $ | 42,718 | ||||||||||
Barrick North America Finance LLC, | 5.700 | 05/30/41 | 45 | 57,207 | ||||||||||||
Barrick PD Australia Finance Pty Ltd., | 5.950 | 10/15/39 | 50 | 63,761 | ||||||||||||
Bombardier, Inc., | ||||||||||||||||
Sr. Unsec’d. Notes, 144A | 7.500 | 12/01/24 | 4,050 | 3,925,969 | ||||||||||||
Sr. Unsec’d. Notes, 144A | 7.875 | 04/15/27 | 1,335 | 1,261,575 | ||||||||||||
Brookfield Residential Properties, Inc./Brookfield Residential US Corp., | 6.250 | 09/15/27 | 2,500 | 2,550,000 | ||||||||||||
Cenovus Energy, Inc., | 4.250 | 04/15/27 | 3,500 | 3,687,499 | ||||||||||||
Hydro-Quebec, | ||||||||||||||||
Gov’t. Gtd. Notes | 9.400 | 02/01/21 | 730 | �� | 795,574 | |||||||||||
Gov’t. Gtd. Notes, MTN | 8.400 | 03/28/25 | 654 | 860,225 | ||||||||||||
Gov’t. Gtd. Notes, Series HE | 8.625 | 06/15/29 | 600 | 902,334 | ||||||||||||
Kinross Gold Corp., | 5.950 | 03/15/24 | 1,000 | 1,105,300 | ||||||||||||
Methanex Corp., | 4.250 | 12/01/24 | 1,500 | 1,527,013 | ||||||||||||
Nutrien Ltd., | ||||||||||||||||
Sr. Unsec’d. Notes | 3.375 | 03/15/25 | 1,450 | 1,507,407 | ||||||||||||
Sr. Unsec’d. Notes(a) | 4.200 | 04/01/29 | 490 | 541,815 | ||||||||||||
Sr. Unsec’d. Notes | 6.125 | 01/15/41 | 25 | 31,039 | ||||||||||||
Rogers Communications, Inc., | 3.250 | 05/01/29 | CAD | 700 | 544,035 | |||||||||||
|
| |||||||||||||||
| 19,403,471 | ||||||||||||||||
China 0.9% | ||||||||||||||||
Aircraft Finance Co. Ltd., | ||||||||||||||||
Sr. Sec’d. Notes, Series B | 4.100 | 03/29/26 | 3,250 | 3,363,750 | ||||||||||||
Sr. Sec’d. Notes, Series C | 3.955 | 03/29/23 | 10,048 | 10,401,589 | ||||||||||||
Bank of China Ltd., | 3.300 | 04/17/22 | CNH | 2,000 | 284,344 | |||||||||||
China Development Bank, | ||||||||||||||||
Sr. Unsec’d. Notes, EMTN | 0.500 | 06/01/21 | EUR | 1,000 | 1,124,334 | |||||||||||
Sr. Unsec’d. Notes, EMTN | 4.350 | 08/06/24 | CNH | 2,000 | 295,534 | |||||||||||
Sr. Unsec’d. Notes, EMTN | 4.350 | 09/19/24 | CNH | 1,650 | 244,050 | |||||||||||
See Notes to Financial Statements.
| 26 |
| Description | Interest Rate | Maturity Date | Principal Amount (000)# | Value | ||||||||||||
CORPORATE BONDS (Continued) | ||||||||||||||||
China (cont’d.) | ||||||||||||||||
CNAC HK Finbridge Co. Ltd., | 1.750 | % | 06/14/22 | EUR | 5,500 | $ | 6,314,752 | |||||||||
Sinopec Century Bright Capital Investment Ltd., | 4.500 | 10/31/21 | CNH | 10,000 | 1,450,042 | |||||||||||
|
| |||||||||||||||
| 23,478,395 | ||||||||||||||||
Denmark 0.0% | ||||||||||||||||
Danske Bank A/S, | 3.244 | (ff) | 12/20/25 | 1,095 | 1,111,533 | |||||||||||
Dominican Republic 0.0% | ||||||||||||||||
Mestenio Ltd. for Dominican Republic, | 8.500 | 01/02/20 | 187 | 188,674 | ||||||||||||
France 2.4% | ||||||||||||||||
BNP Paribas SA, | ||||||||||||||||
Sr. Unsec’d. Notes, 144A | 3.375 | 01/09/25 | 4,800 | 4,981,738 | ||||||||||||
Sr. Unsec’d. Notes, EMTN^ | 6.420 | 09/11/23 | MXN | 250 | 12,402 | |||||||||||
Credit Agricole Assurances SA, | 4.250 | (ff) | — | (rr) | EUR | 2,000 | 2,456,448 | |||||||||
Credit Agricole SA, | 2.375 | 01/22/25 | 12,300 | 12,332,719 | ||||||||||||
Dexia Credit Local SA, | 2.125 | 02/12/25 | GBP | 1,000 | 1,363,786 | |||||||||||
La Poste SA, | 1.450 | 11/30/28 | EUR | 600 | 730,900 | |||||||||||
Loxam SAS, | ||||||||||||||||
Sec’d. Notes | 3.500 | 05/03/23 | EUR | 1,800 | 2,012,559 | |||||||||||
Sr. Sec’d. Notes, 144A | 2.875 | 04/15/26 | EUR | 1,100 | 1,202,293 | |||||||||||
Sr. Sub. Notes | 4.500 | 04/15/27 | EUR | 1,200 | 1,234,637 | |||||||||||
Sr. Sub. Notes | 5.750 | 07/15/27 | EUR | 4,500 | 4,840,681 | |||||||||||
Sr. Sub. Notes, 144A | 4.500 | 04/15/27 | EUR | 1,100 | 1,131,751 | |||||||||||
SNCF Mobilites, | 5.375 | 03/18/27 | GBP | 1,622 | 2,717,764 | |||||||||||
SNCF Reseau, | ||||||||||||||||
Sr. Unsec’d. Notes | 4.700 | 06/01/35 | CAD | 2,100 | 1,989,699 | |||||||||||
Sr. Unsec’d. Notes, EMTN | 5.250 | 12/07/28 | GBP | 1,000 | 1,744,526 | |||||||||||
See Notes to Financial Statements.
| PGIM Global Total Return Fund | 27 |
Schedule of Investments(continued)
as of October 31, 2019
| Description | Interest Rate | Maturity Date | Principal Amount (000)# | Value | ||||||||||||
CORPORATE BONDS (Continued) | ||||||||||||||||
France (cont’d.) | ||||||||||||||||
Societe Generale SA, | ||||||||||||||||
Sr. Unsec’d. Notes, 144A | 2.625 | % | 10/16/24 | 18,960 | $ | 18,833,339 | ||||||||||
Sr. Unsec’d. Notes, 144A, MTN | 3.875 | 03/28/24 | 5,055 | 5,308,024 | ||||||||||||
|
| |||||||||||||||
| 62,893,266 | ||||||||||||||||
Germany 0.6% | ||||||||||||||||
BMW Finance NV, | 4.250 | 10/18/20 | CNH | 5,000 | 716,755 | |||||||||||
Daimler International Finance BV, | ||||||||||||||||
Gtd. Notes | 4.800 | 04/09/21 | CNH | 5,000 | 725,504 | |||||||||||
Gtd. Notes, EMTN | 4.500 | 09/21/21 | CNH | 16,000 | 2,322,431 | |||||||||||
Deutsche Bahn Finance GmbH, | 3.800 | 09/27/27 | AUD | 900 | 699,904 | |||||||||||
Deutsche Bank AG, | ||||||||||||||||
Sr. Unsec’d. Notes(a) | 3.950 | 02/27/23 | 3,040 | 3,110,530 | ||||||||||||
Sr. Unsec’d. Notes | 4.250 | 02/04/21 | 2,760 | 2,814,374 | ||||||||||||
Sr. Unsec’d. Notes, EMTN | 4.300 | 05/19/20 | CNH | 16,000 | 2,274,298 | |||||||||||
Unsec’d. Notes | 4.629 | (s) | 11/07/22 | 1,814 | 1,635,829 | |||||||||||
Kreditanstalt fuer Wiederaufbau, | 4.700 | 06/02/37 | CAD | 179 | 179,942 | |||||||||||
Volkswagen International Finance NV, | ||||||||||||||||
Gtd. Notes | 2.700 | (ff) | — | (rr) | EUR | 1,000 | 1,148,759 | |||||||||
Gtd. Notes | 3.750 | (ff) | — | (rr) | EUR | 500 | 579,120 | |||||||||
|
| |||||||||||||||
| 16,207,446 | ||||||||||||||||
Hungary 0.0% | ||||||||||||||||
MFB Magyar Fejlesztesi Bank Zrt, | 6.250 | 10/21/20 | 400 | 414,664 | ||||||||||||
Indonesia 0.3% | ||||||||||||||||
Pertamina Persero PT, | 4.300 | 05/20/23 | 500 | 526,475 | ||||||||||||
Perusahaan Listrik Negara PT, | ||||||||||||||||
Sr. Unsec’d. Notes, 144A | 1.875 | 11/05/31 | EUR | 4,900 | 5,426,606 | |||||||||||
Sr. Unsec’d. Notes, 144A | 2.875 | 10/25/25 | EUR | 900 | 1,103,264 | |||||||||||
|
| |||||||||||||||
| 7,056,345 | ||||||||||||||||
Israel 0.3% | ||||||||||||||||
Israel Electric Corp. Ltd., | ||||||||||||||||
Sr. Sec’d. Notes, 144A, GMTN | 4.250 | 08/14/28 | 3,100 | 3,363,221 | ||||||||||||
See Notes to Financial Statements.
| 28 |
| Description | Interest Rate | Maturity Date | Principal Amount (000)# | Value | ||||||||||||
CORPORATE BONDS (Continued) | ||||||||||||||||
Israel (cont’d.) | ||||||||||||||||
Israel Electric Corp. Ltd., (cont’d.) | ||||||||||||||||
Sr. Sec’d. Notes, EMTN | 3.700 | % | 05/23/30 | JPY | 100,000 | $ | 1,112,992 | |||||||||
Sr. Sec’d. Notes, EMTN | 7.750 | 12/15/27 | 2,500 | 3,296,550 | ||||||||||||
|
| |||||||||||||||
| 7,772,763 | ||||||||||||||||
Italy 0.3% | ||||||||||||||||
Agenzia Nazionale per l’Attrazione degli Investimenti e lo Sviluppo d’Impresa, | 1.375 | 07/20/22 | EUR | 1,000 | 1,134,015 | |||||||||||
Assicurazioni Generali SpA, | 5.500 | (ff) | 10/27/47 | EUR | 2,075 | 2,782,882 | ||||||||||
Intesa Sanpaolo SpA, | ||||||||||||||||
Sr. Unsec’d. Notes, 144A | 3.125 | 07/14/22 | 2,500 | 2,522,954 | ||||||||||||
Sr. Unsec’d. Notes, 144A | 3.375 | 01/12/23 | 310 | 313,834 | ||||||||||||
Rossini Sarl, | 6.750 | 10/30/25 | EUR | 1,980 | 2,440,827 | |||||||||||
|
| |||||||||||||||
| 9,194,512 | ||||||||||||||||
Japan 0.2% | ||||||||||||||||
East Japan Railway Co., | 5.250 | 04/22/33 | GBP | 1,500 | 2,825,846 | |||||||||||
Mitsubishi UFJ Financial Group, Inc., | 3.761 | 07/26/23 | 2,100 | 2,212,095 | ||||||||||||
|
| |||||||||||||||
| 5,037,941 | ||||||||||||||||
Kazakhstan 0.2% | ||||||||||||||||
Kazakhstan Temir Zholy National Co. JSC, | ||||||||||||||||
Gtd. Notes | 3.250 | 12/05/23 | CHF | 2,500 | 2,753,903 | |||||||||||
Gtd. Notes | 3.638 | 06/20/22 | CHF | 2,500 | 2,710,948 | |||||||||||
|
| |||||||||||||||
| 5,464,851 | ||||||||||||||||
Luxembourg 0.4% | ||||||||||||||||
ARD Finance SA, | 6.625 | 09/15/23 | EUR | 8,825 | 10,187,503 | |||||||||||
Mexico 1.0% | ||||||||||||||||
Petroleos Mexicanos, | ||||||||||||||||
Gtd. Notes | 3.625 | 11/24/25 | EUR | 11,520 | 13,081,734 | |||||||||||
Gtd. Notes, EMTN(a) | 1.875 | 04/21/22 | EUR | 1,200 | 1,359,908 | |||||||||||
See Notes to Financial Statements.
| PGIM Global Total Return Fund | 29 |
Schedule of Investments(continued)
as of October 31, 2019
| Description | Interest Rate | Maturity Date | Principal Amount (000)# | Value | ||||||||||||
CORPORATE BONDS (Continued) | ||||||||||||||||
Mexico (cont’d.) | ||||||||||||||||
Petroleos Mexicanos, (cont’d.) | ||||||||||||||||
Gtd. Notes, EMTN | 3.750 | % | 02/21/24 | EUR | 3,300 | $ | 3,882,917 | |||||||||
Gtd. Notes, EMTN | 3.750 | 04/16/26 | EUR | 700 | 786,706 | |||||||||||
Gtd. Notes, EMTN | 4.875 | 02/21/28 | EUR | 4,100 | 4,818,514 | |||||||||||
Gtd. Notes, EMTN | 5.125 | 03/15/23 | EUR | 600 | 741,438 | |||||||||||
Gtd. Notes, EMTN | 8.250 | 06/02/22 | GBP | 528 | 771,148 | |||||||||||
|
| |||||||||||||||
| 25,442,365 | ||||||||||||||||
Netherlands 0.7% | ||||||||||||||||
ABN AMRO Bank NV, | 4.750 | 07/28/25 | 500 | 541,700 | ||||||||||||
BNG Bank NV, | ||||||||||||||||
Sr. Unsec’d. Notes | 5.150 | 03/07/25 | CAD | 1,000 | 874,778 | |||||||||||
Sr. Unsec’d. Notes, EMTN | 0.500 | 03/03/21 | NZD | 3,000 | 1,894,635 | |||||||||||
Sr. Unsec’d. Notes, EMTN | 0.500 | 03/29/21 | NZD | 2,200 | 1,388,166 | |||||||||||
Sr. Unsec’d. Notes, EMTN | 0.500 | 05/12/21 | ZAR | 10,000 | 586,564 | |||||||||||
Sr. Unsec’d. Notes, EMTN | 0.500 | 06/22/21 | ZAR | 6,000 | 348,603 | |||||||||||
Sr. Unsec’d. Notes, EMTN | 0.500 | 06/07/22 | ZAR | 10,000 | 543,220 | |||||||||||
Sr. Unsec’d. Notes, EMTN | 0.500 | 08/15/22 | ZAR | 30,000 | 1,560,448 | |||||||||||
Sr. Unsec’d. Notes, EMTN | 7.000 | 12/09/21 | AUD | 2,000 | 1,540,460 | |||||||||||
Sr. Unsec’d. Notes, MTN | 3.184 | (s) | 04/05/28 | CAD | 700 | 437,884 | ||||||||||
ING Bank NV, | 5.800 | 09/25/23 | 500 | 555,871 | ||||||||||||
ING Groep NV, | 4.050 | 04/09/29 | 2,815 | 3,104,151 | ||||||||||||
United Group BV, | 4.875 | 07/01/24 | EUR | 900 | 1,036,392 | |||||||||||
Ziggo Bond Co. BV, | 4.625 | 01/15/25 | EUR | 2,155 | 2,473,437 | |||||||||||
Ziggo BV, | 4.250 | 01/15/27 | EUR | 1,876 | 2,253,598 | |||||||||||
|
| |||||||||||||||
| 19,139,907 | ||||||||||||||||
Peru 0.1% | ||||||||||||||||
Lima Metro Line 2 Finance Ltd., | 5.875 | 07/05/34 | 110 | 128,787 | ||||||||||||
Peru Enhanced Pass-Through Finance Ltd., | 2.119 | (s) | 06/02/25 | 2,062 | 1,907,154 | |||||||||||
|
| |||||||||||||||
| 2,035,941 | ||||||||||||||||
See Notes to Financial Statements.
| 30 |
| Description | Interest Rate | Maturity Date | Principal Amount (000)# | Value | ||||||||||||
CORPORATE BONDS (Continued) | ||||||||||||||||
Poland 0.1% | ||||||||||||||||
Bank Gospodarstwa Krajowego, | ||||||||||||||||
Gov’t. Gtd. Notes | 1.375 | % | 06/01/25 | EUR | 500 | $ | 598,492 | |||||||||
Gov’t. Gtd. Notes | 1.625 | 04/30/28 | EUR | 600 | 746,055 | |||||||||||
Gov’t. Gtd. Notes, EMTN | 1.750 | 05/06/26 | EUR | 1,500 | 1,846,228 | |||||||||||
|
| |||||||||||||||
| 3,190,775 | ||||||||||||||||
Portugal 0.2% | ||||||||||||||||
CP-Comboios de Portugal EPE, | 5.700 | 03/05/30 | EUR | 3,000 | 4,854,680 | |||||||||||
Infraestruturas de Portugal SA, | 4.250 | 12/13/21 | EUR | 1,000 | 1,210,014 | |||||||||||
|
| |||||||||||||||
| 6,064,694 | ||||||||||||||||
Qatar 0.0% | ||||||||||||||||
QNB Finance Ltd., | 5.250 | 06/21/21 | CNH | 1,440 | 209,162 | |||||||||||
Russia 0.3% | ||||||||||||||||
Gazprom OAO Via Gaz Capital SA, | ||||||||||||||||
Sr. Unsec’d. Notes | 2.250 | 07/19/22 | CHF | 1,000 | 1,061,277 | |||||||||||
Sr. Unsec’d. Notes | 4.250 | 04/06/24 | GBP | 3,800 | 5,324,337 | |||||||||||
Sr. Unsec’d. Notes, EMTN | 5.338 | 09/25/20 | GBP | 1,200 | 1,604,960 | |||||||||||
|
| |||||||||||||||
| 7,990,574 | ||||||||||||||||
Singapore 0.0% | ||||||||||||||||
Temasek Financial I Ltd., | 3.265 | 02/19/20 | SGD | 500 | 368,948 | |||||||||||
South Africa 0.1% | ||||||||||||||||
Eskom Holdings SOC Ltd., | ||||||||||||||||
Gov’t. Gtd. Notes, 144A, MTN | 6.350 | 08/10/28 | 1,350 | 1,427,973 | ||||||||||||
Gov’t. Gtd. Notes, MTN | 6.350 | 08/10/28 | 2,000 | 2,115,516 | ||||||||||||
|
| |||||||||||||||
| 3,543,489 | ||||||||||||||||
South Korea 0.4% | ||||||||||||||||
Korea Development Bank (The), | 4.500 | 11/10/20 | CNH | 16,000 | 2,301,496 | |||||||||||
Korea Expressway Corp., | 3.030 | 05/11/32 | CAD | 7,500 | 5,991,174 | |||||||||||
See Notes to Financial Statements.
| PGIM Global Total Return Fund | 31 |
Schedule of Investments(continued)
as of October 31, 2019
| Description | Interest Rate | Maturity Date | Principal Amount (000)# | Value | ||||||||||||
CORPORATE BONDS (Continued) | ||||||||||||||||
South Korea (cont’d.) | ||||||||||||||||
Korea Hydro & Nuclear Power Co. Ltd., | 3.350 | % | 03/13/28 | HKD | 2,000 | $ | 267,308 | |||||||||
KT Corp., | 0.220 | 07/19/22 | JPY | 100,000 | 922,647 | |||||||||||
|
| |||||||||||||||
| 9,482,625 | ||||||||||||||||
Spain 0.3% | ||||||||||||||||
Adif-Alta Velocidad, | ||||||||||||||||
Sr. Unsec’d. Notes, EMTN | 1.875 | 01/28/25 | EUR | 2,000 | 2,434,258 | |||||||||||
Sr. Unsec’d. Notes, EMTN | 3.500 | 05/27/24 | EUR | 400 | 515,969 | |||||||||||
Banco Santander SA, | 3.800 | 02/23/28 | 2,200 | 2,320,318 | ||||||||||||
Codere Finance 2 Luxembourg SA, | 7.625 | 11/01/21 | 2,000 | 1,716,000 | ||||||||||||
|
| |||||||||||||||
| 6,986,545 | ||||||||||||||||
Supranational Bank 1.4% | ||||||||||||||||
African Development Bank, | ||||||||||||||||
Sr. Unsec’d. Notes, EMTN | 0.500 | 09/29/20 | AUD | 445 | 304,708 | |||||||||||
Sr. Unsec’d. Notes, EMTN | 0.500 | 09/21/21 | NZD | 4,000 | 2,513,127 | |||||||||||
Sr. Unsec’d. Notes, EMTN | 0.500 | 03/13/23 | MXN | 20,000 | 771,341 | |||||||||||
Corp. Andina de Fomento, | ||||||||||||||||
Sr. Unsec’d. Notes | 2.750 | 01/06/23 | 1,350 | 1,367,577 | ||||||||||||
Sr. Unsec’d. Notes | 4.375 | 06/15/22 | 3,300 | 3,472,590 | ||||||||||||
Sr. Unsec’d. Notes, MTN | 4.000 | 03/31/21 | AUD | 1,636 | 1,159,971 | |||||||||||
EUROFIMA, | 5.150 | 12/13/19 | CAD | 540 | 411,382 | |||||||||||
European Bank for Reconstruction & Development, | ||||||||||||||||
Sr. Unsec’d. Notes, GMTN | 0.500 | 09/01/23 | AUD | 400 | 262,713 | |||||||||||
Sr. Unsec’d. Notes, GMTN | 0.500 | 11/21/23 | AUD | 1,200 | 794,862 | |||||||||||
Sr. Unsec’d. Notes, GMTN | 6.450 | 12/13/22 | IDR | 60,560,000 | 4,317,332 | |||||||||||
European Investment Bank, | ||||||||||||||||
Sr. Unsec’d. Notes, 144A, EMTN | 4.600 | 01/30/37 | CAD | 1,500 | 1,490,263 | |||||||||||
Sr. Unsec’d. Notes, EMTN | 0.500 | 06/21/23 | AUD | 2,500 | 1,670,048 | |||||||||||
Sr. Unsec’d. Notes, EMTN | 0.500 | 07/21/23 | AUD | 800 | 533,835 | |||||||||||
Sr. Unsec’d. Notes, EMTN | 0.500 | 08/10/23 | AUD | 1,210 | 807,589 | |||||||||||
Sr. Unsec’d. Notes, EMTN | 0.500 | 10/26/23 | AUD | 6,930 | 4,603,761 | |||||||||||
Sr. Unsec’d. Notes, EMTN | 1.250 | 05/12/25 | SEK | 16,500 | 1,802,103 | |||||||||||
Sr. Unsec’d. Notes, EMTN | 1.250 | 11/12/29 | SEK | 10,000 | 1,101,885 | |||||||||||
Sr. Unsec’d. Notes, EMTN | 3.250 | 05/24/23 | NOK | 10,000 | 1,145,479 | |||||||||||
Sr. Unsec’d. Notes, EMTN | 4.600 | 01/30/37 | CAD | 550 | 539,009 | |||||||||||
See Notes to Financial Statements.
| 32 |
| Description | Interest Rate | Maturity Date | Principal Amount (000)# | Value | ||||||||||||
CORPORATE BONDS (Continued) | ||||||||||||||||
Supranational Bank (cont’d.) | ||||||||||||||||
Inter-American Development Bank, | ||||||||||||||||
Sr. Unsec’d. Notes, EMTN | 0.500 | % | 05/23/23 | CAD | 744 | $ | 539,061 | |||||||||
Unsec’d. Notes, EMTN | 0.500 | 10/30/20 | ZAR | 2,250 | 138,554 | |||||||||||
Unsec’d. Notes, EMTN | 0.500 | 11/30/20 | ZAR | 1,840 | 112,990 | |||||||||||
International Bank for Reconstruction & Development, | ||||||||||||||||
Sr. Unsec’d. Notes, EMTN | 0.500 | 03/07/22 | AUD | 1,145 | 770,352 | |||||||||||
Sr. Unsec’d. Notes, EMTN | 0.500 | 03/28/22 | AUD | 200 | 134,471 | |||||||||||
Sr. Unsec’d. Notes, EMTN | 0.500 | 07/29/22 | AUD | 350 | 234,104 | |||||||||||
International Finance Corp., | ||||||||||||||||
Sr. Unsec’d. Notes | 4.250 | 07/13/20 | PEN | 6,000 | 1,800,768 | |||||||||||
Sr. Unsec’d. Notes, GMTN | 6.000 | 07/25/22 | MXN | 20,000 | 1,015,101 | |||||||||||
Nordic Investment Bank, | 3.875 | 09/02/25 | NZD | 2,000 | 1,444,648 | |||||||||||
North American Development Bank, | 2.400 | 10/26/22 | 750 | 759,107 | ||||||||||||
|
| |||||||||||||||
| 36,018,731 | ||||||||||||||||
Switzerland 0.5% | ||||||||||||||||
Credit Suisse Group AG, | ||||||||||||||||
Sr. Unsec’d. Notes, 144A | 2.593 | (ff) | 09/11/25 | 1,390 | 1,385,900 | |||||||||||
Sr. Unsec’d. Notes, 144A | 4.207 | (ff) | 06/12/24 | 2,850 | 3,009,818 | |||||||||||
Sr. Unsec’d. Notes, 144A | 4.282 | 01/09/28 | 2,975 | 3,233,427 | ||||||||||||
Credit Suisse Group Funding Guernsey Ltd., | 1.000 | 04/14/23 | CHF | 1,000 | 1,047,136 | |||||||||||
UBS Group AG, | ||||||||||||||||
Gtd. Notes, 144A | 2.859 | (ff) | 08/15/23 | 990 | 1,004,306 | |||||||||||
Gtd. Notes, 144A | 3.491 | 05/23/23 | 1,100 | 1,133,758 | ||||||||||||
Gtd. Notes, 144A | 4.125 | 09/24/25 | 2,500 | 2,724,675 | ||||||||||||
|
| |||||||||||||||
| 13,539,020 | ||||||||||||||||
Tunisia 0.0% | ||||||||||||||||
Banque Centrale de Tunisie International Bond, | 4.200 | 03/17/31 | JPY | 100,000 | 733,401 | |||||||||||
Ukraine 0.1% | ||||||||||||||||
NAK Naftogaz Ukraine via Kondor Finance PLC, | 7.125 | 07/19/24 | EUR | 1,100 | 1,282,430 | |||||||||||
See Notes to Financial Statements.
| PGIM Global Total Return Fund | 33 |
Schedule of Investments(continued)
as of October 31, 2019
| Description | Interest Rate | Maturity Date | Principal Amount (000)# | Value | ||||||||||||
CORPORATE BONDS (Continued) | ||||||||||||||||
United Arab Emirates 0.4% | ||||||||||||||||
Abu Dhabi National Energy Co. PJSC, | 4.375 | % | 04/23/25 | 1,070 | $ | 1,147,575 | ||||||||||
DP World PLC, | 4.250 | 09/25/30 | GBP | 1,840 | 2,631,847 | |||||||||||
Emirates NBD PJSC, | 4.750 | 02/09/28 | AUD | 1,490 | 1,159,770 | |||||||||||
Emirates Telecommunications Group Co. PJSC, | 2.750 | 06/18/26 | EUR | 4,000 | 5,140,105 | |||||||||||
First Abu Dhabi Bank PJSC, | 4.500 | 09/10/21 | CNH | 8,000 | 1,150,077 | |||||||||||
|
| |||||||||||||||
| 11,229,374 | ||||||||||||||||
United Kingdom 2.6% | ||||||||||||||||
Barclays PLC, | ||||||||||||||||
Sr. Unsec’d. Notes | 4.375 | 01/12/26 | 800 | 859,655 | ||||||||||||
Sr. Unsec’d. Notes, MTN(a) | 4.972 | (ff) | 05/16/29 | 5,520 | 6,218,258 | |||||||||||
Sub. Notes | 5.200 | 05/12/26 | 3,780 | 4,099,658 | ||||||||||||
Co-operative Group Holdings 2011 Ltd., | 7.500 | 07/08/26 | GBP | 2,400 | 3,541,437 | |||||||||||
CPUK Finance Ltd., | ||||||||||||||||
Sec’d. Notes, 144A | 4.250 | 02/28/47 | GBP | 185 | 242,641 | |||||||||||
Sec’d. Notes, 144A | 4.875 | 02/28/47 | GBP | 110 | 146,052 | |||||||||||
eG Global Finance PLC, | ||||||||||||||||
Sr. Sec’d. Notes, 144A | 4.375 | 02/07/25 | EUR | 5,500 | 5,963,056 | |||||||||||
Sr. Sec’d. Notes, 144A | 6.250 | 10/30/25 | EUR | 3,200 | 3,684,951 | |||||||||||
HSBC Bank PLC, | ||||||||||||||||
Sr. Unsec’d. Notes, 144A, EMTN^ | 3.120 | 04/04/26 | CNH | 36,800 | 5,188,697 | |||||||||||
Sr. Unsec’d. Notes, EMTN | 2.400 | (ff) | 09/28/24 | 2,358 | 2,287,020 | |||||||||||
HSBC Holdings PLC, | ||||||||||||||||
Sr. Unsec’d. Notes(a) | 3.973 | (ff) | 05/22/30 | 2,400 | 2,589,085 | |||||||||||
Sub. Notes(a) | 4.250 | 08/18/25 | 1,255 | 1,341,074 | ||||||||||||
Ladbrokes Group Finance PLC, | 5.125 | 09/08/23 | GBP | 1,900 | 2,644,030 | |||||||||||
Lloyds Banking Group PLC, | ||||||||||||||||
Sr. Unsec’d. Notes | 2.907 | (ff) | 11/07/23 | 1,850 | 1,876,052 | |||||||||||
Sub. Notes | 4.582 | 12/10/25 | 2,250 | 2,422,121 | ||||||||||||
Pinewood Finance Co. Ltd., | ||||||||||||||||
Sr. Sec’d. Notes, 144A | 3.250 | 09/30/25 | GBP | 1,700 | 2,251,642 | |||||||||||
Royal Bank of Scotland Group PLC, | ||||||||||||||||
Sr. Unsec’d. Notes(a) | 3.875 | 09/12/23 | 1,000 | 1,042,772 | ||||||||||||
Sr. Unsec’d. Notes | 4.269 | (ff) | 03/22/25 | 5,860 | 6,212,000 | |||||||||||
See Notes to Financial Statements.
| 34 |
| Description | Interest Rate | Maturity Date | Principal Amount (000)# | Value | ||||||||||||
CORPORATE BONDS (Continued) | ||||||||||||||||
United Kingdom (cont’d.) | ||||||||||||||||
Royal Bank of Scotland Group PLC, (cont’d.) | ||||||||||||||||
Sr. Unsec’d. Notes | 4.445 | %(ff) | 05/08/30 | 2,500 | $ | 2,747,356 | ||||||||||
Sr. Unsec’d. Notes, EMTN | 2.000 | (ff) | 03/08/23 | EUR | 700 | 811,554 | ||||||||||
Sr. Unsec’d. Notes, EMTN | 2.500 | 03/22/23 | EUR | 1,500 | 1,794,774 | |||||||||||
Santander UK Group Holdings PLC, | 3.571 | 01/10/23 | 3,065 | 3,132,131 | ||||||||||||
Stonegate Pub Co. Financing PLC, | ||||||||||||||||
Sr. Sec’d. Notes | 4.875 | 03/15/22 | GBP | 458 | 605,449 | |||||||||||
Sr. Sec’d. Notes, 144A, 3 Month GBP LIBOR + 6.250% | 7.031 | (c) | 03/15/22 | GBP | 2,500 | 3,246,471 | ||||||||||
Tesco Corporate Treasury Services PLC, | 2.500 | 07/01/24 | EUR | 750 | 906,406 | |||||||||||
Virgin Media Secured Finance PLC, | 5.000 | 04/15/27 | GBP | 2,600 | 3,545,473 | |||||||||||
|
| |||||||||||||||
| 69,399,815 | ||||||||||||||||
United States 15.2% | ||||||||||||||||
Actuant Corp., | 5.625 | 06/15/22 | 400 | 404,000 | ||||||||||||
Adient Global Holdings Ltd., | 3.500 | 08/15/24 | EUR | 1,234 | 1,156,020 | |||||||||||
Altria Group, Inc., | 3.125 | 06/15/31 | EUR | 2,900 | 3,563,519 | |||||||||||
AMC Entertainment Holdings, Inc., | 5.875 | 11/15/26 | 827 | 753,604 | ||||||||||||
American Axle & Manufacturing, Inc., | 6.625 | 10/15/22 | 2,500 | 2,512,500 | ||||||||||||
American International Group, Inc., | 1.875 | 06/21/27 | EUR | 2,100 | 2,531,561 | |||||||||||
Amgen, Inc., | 2.600 | 08/19/26 | 600 | 606,276 | ||||||||||||
Anthem, Inc., | ||||||||||||||||
Sr. Unsec’d. Notes(a) | 2.875 | 09/15/29 | 5,715 | 5,659,941 | ||||||||||||
Sr. Unsec’d. Notes | 4.101 | 03/01/28 | 1,005 | 1,092,832 | ||||||||||||
Ascent Resources Utica Holdings LLC/ARU Finance Corp., | ||||||||||||||||
Sr. Unsec’d. Notes, 144A | 7.000 | 11/01/26 | 575 | 439,875 | ||||||||||||
Sr. Unsec’d. Notes, 144A | 10.000 | 04/01/22 | 375 | 354,863 | ||||||||||||
AT&T, Inc., | ||||||||||||||||
Sr. Unsec’d. Notes | 3.800 | 02/15/27 | 85 | 90,955 | ||||||||||||
Sr. Unsec’d. Notes | 4.550 | 03/09/49 | 5,000 | 5,375,253 | ||||||||||||
Sr. Unsec’d. Notes | 4.850 | 03/01/39 | 1,200 | 1,359,275 | ||||||||||||
See Notes to Financial Statements.
| PGIM Global Total Return Fund | 35 |
Schedule of Investments(continued)
as of October 31, 2019
| Description | Interest Rate | Maturity Date | Principal Amount (000)# | Value | ||||||||||||
CORPORATE BONDS (Continued) | ||||||||||||||||
United States (cont’d.) | ||||||||||||||||
AT&T, Inc., (cont’d.) | ||||||||||||||||
Sr. Unsec’d. Notes | 4.850 | % | 05/25/47 | CAD | 150 | $ | 121,006 | |||||||||
Sr. Unsec’d. Notes | 5.100 | 11/25/48 | CAD | 4,575 | 3,817,638 | |||||||||||
Sr. Unsec’d. Notes | 5.250 | 03/01/37 | 70 | 82,388 | ||||||||||||
Sr. Unsec’d. Notes, EMTN | 7.000 | 04/30/40 | GBP | 1,550 | 3,187,230 | |||||||||||
Ball Corp., | 4.375 | 12/15/23 | EUR | 200 | 258,417 | |||||||||||
Bank of America Corp., | ||||||||||||||||
Sr. Unsec’d. Notes | 3.419 | (ff) | 12/20/28 | 4,519 | 4,734,613 | |||||||||||
Sr. Unsec’d. Notes, EMTN | — | (p) | 03/31/22 | EUR | 1,143 | 1,509,986 | ||||||||||
Sr. Unsec’d. Notes, EMTN | 1.939 | (s) | 05/31/21 | EUR | 1,100 | 1,459,606 | ||||||||||
Sr. Unsec’d. Notes, EMTN | 5.145 | (cc) | 06/27/22 | EUR | 500 | 624,345 | ||||||||||
Sr. Unsec’d. Notes, MTN(a) | 2.884 | (ff) | 10/22/30 | 7,620 | 7,669,232 | |||||||||||
Sr. Unsec’d. Notes, MTN | 3.194 | (ff) | 07/23/30 | 5,140 | 5,298,862 | |||||||||||
Bausch Health Americas, Inc., | 8.500 | 01/31/27 | 550 | 618,750 | ||||||||||||
Bausch Health Cos., Inc., | ||||||||||||||||
Gtd. Notes, 144A | 6.125 | 04/15/25 | 1,500 | 1,557,187 | ||||||||||||
Gtd. Notes, 144A | 7.250 | 05/30/29 | 400 | 440,500 | ||||||||||||
Sr. Sec’d. Notes, 144A | 5.750 | 08/15/27 | 215 | 233,477 | ||||||||||||
Beazer Homes USA, Inc., | ||||||||||||||||
Gtd. Notes | 6.750 | 03/15/25 | 2,075 | 2,147,625 | ||||||||||||
Sr. Unsec’d. Notes, 144A(a) | 7.250 | 10/15/29 | 1,675 | 1,762,937 | ||||||||||||
Berkshire Hathaway, Inc., | ||||||||||||||||
Sr. Unsec’d. Notes | 0.440 | 09/13/29 | JPY | 350,000 | 3,231,148 | |||||||||||
Sr. Unsec’d. Notes | 0.787 | 09/13/34 | JPY | 100,000 | 919,492 | |||||||||||
Bristol-Myers Squibb Co., | ||||||||||||||||
Sr. Unsec’d. Notes, 144A | 3.200 | 06/15/26 | 1,670 | 1,773,918 | ||||||||||||
Sr. Unsec’d. Notes, 144A | 3.400 | 07/26/29 | 3,790 | 4,078,255 | ||||||||||||
Brixmor Operating Partnership LP, | ||||||||||||||||
Sr. Unsec’d. Notes | 3.650 | 06/15/24 | 2,000 | 2,087,074 | ||||||||||||
Sr. Unsec’d. Notes | 4.125 | 05/15/29 | 2,865 | 3,095,720 | ||||||||||||
Broadcom, Inc., | ||||||||||||||||
Gtd. Notes, 144A | 3.125 | 04/15/21 | 3,285 | 3,324,223 | ||||||||||||
Gtd. Notes, 144A | 3.125 | 10/15/22 | 2,520 | 2,567,575 | ||||||||||||
Caledonia Generating LLC, | 1.950 | 02/28/22 | 90 | 90,478 | ||||||||||||
Calpine Corp., | 5.750 | 01/15/25 | 4,750 | 4,868,750 | ||||||||||||
CCO Holdings LLC/CCO Holdings Capital Corp., | ||||||||||||||||
Sr. Unsec’d. Notes, 144A | 5.375 | 06/01/29 | 675 | 720,563 | ||||||||||||
Sr. Unsec’d. Notes, 144A(a) | 5.500 | 05/01/26 | 1,000 | 1,053,750 | ||||||||||||
See Notes to Financial Statements.
| 36 |
| Description | Interest Rate | Maturity Date | Principal Amount (000)# | Value | ||||||||||||
CORPORATE BONDS (Continued) | ||||||||||||||||
United States (cont’d.) | ||||||||||||||||
Celgene Corp., | 3.450 | % | 11/15/27 | 3,345 | $ | 3,576,029 | ||||||||||
CF Industries, Inc., | ||||||||||||||||
Gtd. Notes(a) | 3.450 | 06/01/23 | 600 | 609,000 | ||||||||||||
Sr. Sec’d. Notes, 144A | 4.500 | 12/01/26 | 6,451 | 7,030,892 | ||||||||||||
Charter Communications Operating LLC/Charter Communications Operating Capital, | ||||||||||||||||
Sr. Sec’d. Notes(a) | 4.800 | 03/01/50 | 1,980 | 2,008,990 | ||||||||||||
Sr. Sec’d. Notes | 6.384 | 10/23/35 | 2,357 | 2,896,299 | ||||||||||||
CHS/Community Health Systems, Inc., | 8.125 | 06/30/24 | 696 | 528,960 | ||||||||||||
Cigna Corp., | 3.050 | 11/30/22 | 3,000 | 3,065,984 | ||||||||||||
Citigroup Global Markets Holdings, Inc., | 2.500 | (cc) | 06/12/24 | 8,256 | 8,538,801 | |||||||||||
Citigroup, Inc., | ||||||||||||||||
Jr. Sub. Notes, Series P | 5.950 | (ff) | — | (rr) | 700 | 749,000 | ||||||||||
Sr. Unsec’d. Notes | 2.750 | 04/25/22 | 600 | 609,134 | ||||||||||||
Sub. Notes | 4.400 | 06/10/25 | 3,000 | 3,252,347 | ||||||||||||
Clear Channel Worldwide Holdings, Inc., | 9.250 | 02/15/24 | 1,872 | 2,059,200 | ||||||||||||
Comcast Corp., | 3.150 | 02/15/28 | 2,000 | 2,101,549 | ||||||||||||
Continental Airlines 2010-1 Class A Pass-Through Trust, | 4.750 | 07/12/22 | 42 | 43,480 | ||||||||||||
CVS Health Corp., | 4.300 | 03/25/28 | 2,175 | 2,361,009 | ||||||||||||
Dana Financing Luxembourg Sarl, | 6.500 | 06/01/26 | 2,700 | 2,835,000 | ||||||||||||
Delta Air Lines 2007-1 Class A Pass-Through Trust, | 6.821 | 02/10/24 | 124 | 135,431 | ||||||||||||
DH Europe Finance II Sarl, | ||||||||||||||||
Gtd. Notes | 0.200 | 03/18/26 | EUR | 4,800 | 5,300,923 | |||||||||||
Gtd. Notes | 0.450 | 03/18/28 | EUR | 2,200 | 2,431,086 | |||||||||||
Diamond BC BV, | 5.625 | 08/15/25 | EUR | 6,900 | 7,042,986 | |||||||||||
Diamond Sports Group LLC/Diamond Sports Finance Co., | 6.625 | 08/15/27 | 1,240 | 1,277,200 | ||||||||||||
Discovery Communications LLC, | 3.450 | 03/15/25 | 2,500 | 2,591,511 | ||||||||||||
See Notes to Financial Statements.
| PGIM Global Total Return Fund | 37 |
Schedule of Investments(continued)
as of October 31, 2019
| Description | Interest Rate | Maturity Date | Principal Amount (000)# | Value | ||||||||||||
CORPORATE BONDS (Continued) | ||||||||||||||||
United States (cont’d.) | ||||||||||||||||
Discovery Communications LLC, (cont’d.) | ||||||||||||||||
Gtd. Notes | 5.300 | % | 05/15/49 | 180 | $ | 201,078 | ||||||||||
DISH DBS Corp., | 7.750 | 07/01/26 | 3,000 | 3,026,550 | ||||||||||||
Dow Chemical Co. (The), | ||||||||||||||||
Sr. Unsec’d. Notes | 9.400 | 05/15/39 | 152 | 250,085 | ||||||||||||
Sr. Unsec’d. Notes, 144A | 3.625 | 05/15/26 | 720 | 755,277 | ||||||||||||
Eastman Chemical Co., | 4.500 | 12/01/28 | 600 | 667,289 | ||||||||||||
Eli Lilly & Co., | 0.625 | 11/01/31 | EUR | 3,000 | 3,342,822 | |||||||||||
Embarq Corp., | 7.995 | 06/01/36 | 6,150 | 6,088,500 | ||||||||||||
Energizer Gamma Acquisition BV, | 4.625 | 07/15/26 | EUR | 7,661 | 9,009,021 | |||||||||||
Enterprise Products Operating LLC, | 4.150 | 10/16/28 | 1,665 | 1,836,752 | ||||||||||||
ERAC USA Finance LLC, | 7.000 | 10/15/37 | 190 | 269,296 | ||||||||||||
Everi Payments, Inc., | 7.500 | 12/15/25 | 2,529 | 2,664,934 | ||||||||||||
Ferrellgas Partners LP/Ferrellgas Partners Finance Corp., | 8.625 | 06/15/20 | 750 | 427,500 | ||||||||||||
Fidelity National Information Services, Inc., | ||||||||||||||||
Sr. Unsec’d. Notes | 1.100 | 07/15/24 | EUR | 2,300 | 2,664,945 | |||||||||||
Sr. Unsec’d. Notes | 1.500 | 05/21/27 | EUR | 7,600 | 9,006,353 | |||||||||||
Ford Motor Credit Co. LLC, | ||||||||||||||||
Sr. Unsec’d. Notes | 4.134 | 08/04/25 | 200 | 199,268 | ||||||||||||
Sr. Unsec’d. Notes | 4.687 | 06/09/25 | 2,015 | 2,060,921 | ||||||||||||
Sr. Unsec’d. Notes, EMTN | 4.125 | 06/20/24 | SGD | 2,000 | 1,464,066 | |||||||||||
General Motors Financial Co., Inc., | ||||||||||||||||
Gtd. Notes | 3.200 | 07/06/21 | 370 | 374,482 | ||||||||||||
Gtd. Notes | 3.850 | 01/05/28 | 2,900 | 2,901,427 | ||||||||||||
Gtd. Notes | 3.950 | 04/13/24 | 250 | 258,797 | ||||||||||||
Goldman Sachs Group, Inc. (The), | ||||||||||||||||
Jr. Sub. Notes, Series L, 3 Month LIBOR + 3.884% | 6.065 | (c) | — | (rr) | 1,549 | 1,553,182 | ||||||||||
Jr. Sub. Notes, Series M | 5.375 | (ff) | — | (rr) | 700 | 710,199 | ||||||||||
Sr. Unsec’d. Notes | 3.500 | 01/23/25 | 1,500 | 1,567,991 | ||||||||||||
Sr. Unsec’d. Notes, EMTN | — | (p) | 08/12/25 | EUR | 1,665 | 1,764,311 | ||||||||||
Sr. Unsec’d. Notes, EMTN | 1.000 | 08/06/24 | JPY | 100,000 | 946,172 | |||||||||||
Sr. Unsec’d. Notes, EMTN | 1.433 | (s) | 12/15/23 | EUR | 200 | 216,001 | ||||||||||
See Notes to Financial Statements.
| 38 |
| Description | Interest Rate | Maturity Date | Principal Amount (000)# | Value | ||||||||||||
CORPORATE BONDS (Continued) | ||||||||||||||||
United States (cont’d.) | ||||||||||||||||
Goldman Sachs Group, Inc. (The), (cont’d.) | ||||||||||||||||
Sr. Unsec’d. Notes, EMTN | 2.500 | %(cc) | 05/31/24 | 4,904 | $ | 5,072,965 | ||||||||||
Sub. Notes | 4.750 | 10/12/21 | EUR | 3,000 | 3,638,579 | |||||||||||
HCA, Inc., | ||||||||||||||||
Gtd. Notes | 5.625 | 09/01/28 | 1,200 | 1,348,500 | ||||||||||||
Sr. Sec’d. Notes | 5.250 | 04/15/25 | 3,000 | 3,346,281 | ||||||||||||
Sr. Sec’d. Notes(a) | 5.250 | 06/15/49 | 1,500 | 1,660,950 | ||||||||||||
Hyundai Capital America, | 3.000 | 06/20/22 | 2,000 | 2,020,721 | ||||||||||||
International Paper Co., | 7.300 | 11/15/39 | 75 | 102,777 | ||||||||||||
IQVIA, Inc., | 2.250 | 01/15/28 | EUR | 1,800 | 2,050,702 | |||||||||||
Jabil, Inc., | 4.700 | 09/15/22 | 655 | 693,730 | ||||||||||||
JBS USA LUX SA/JBS USA Finance, Inc., | 5.750 | 06/15/25 | 470 | 488,213 | ||||||||||||
JBS USA LUX SA/JBS USA Food Co./JBS USA Finance, Inc., | ||||||||||||||||
Gtd. Notes, 144A | 6.500 | 04/15/29 | 1,150 | 1,279,409 | ||||||||||||
Sr. Unsec’d. Notes, 144A | 5.500 | 01/15/30 | 100 | 107,750 | ||||||||||||
John Sevier Combined Cycle Generation LLC, | 4.626 | 01/15/42 | 3,672 | 4,386,503 | ||||||||||||
JPMorgan Chase & Co., | ||||||||||||||||
Jr. Sub. Notes, Series I, 3 Month LIBOR + 3.470% | 5.406 | (c) | — | (rr) | 219 | 220,314 | ||||||||||
Jr. Sub. Notes, Series V, 3 Month LIBOR + 3.320% | 5.419 | (c) | — | (rr) | 1,000 | 1,006,250 | ||||||||||
Jr. Sub. Notes, Series X | 6.100 | (ff) | — | (rr) | 1,980 | 2,173,684 | ||||||||||
Jr. Sub. Notes, Series Z | 5.300 | (ff) | — | (rr) | 1,410 | 1,431,150 | ||||||||||
Sr. Unsec’d. Notes | 3.509 | (ff) | 01/23/29 | 3,200 | 3,383,293 | |||||||||||
Sr. Unsec’d. Notes | 3.702 | (ff) | 05/06/30 | 1,590 | 1,710,408 | |||||||||||
KB Home, | ||||||||||||||||
Gtd. Notes | 6.875 | 06/15/27 | 1,650 | 1,881,000 | ||||||||||||
Gtd. Notes | 7.500 | 09/15/22 | 1,000 | 1,127,500 | ||||||||||||
Kinder Morgan Energy Partners LP, | 4.150 | 02/01/24 | 2,000 | 2,129,895 | ||||||||||||
Kraft Heinz Foods Co., | ||||||||||||||||
Gtd. Notes | 3.000 | 06/01/26 | 2,000 | 1,993,112 | ||||||||||||
Gtd. Notes, 144A | 3.750 | 04/01/30 | 3,535 | 3,613,011 | ||||||||||||
Gtd. Notes, 144A | 4.875 | 10/01/49 | 3,200 | 3,298,345 | ||||||||||||
Lehman Brothers Holdings, Inc., | 6.875 | 05/02/18 | (d) | 100 | 1,300 | |||||||||||
See Notes to Financial Statements.
| PGIM Global Total Return Fund | 39 |
Schedule of Investments(continued)
as of October 31, 2019
| Description | Interest Rate | Maturity Date | Principal Amount (000)# | Value | ||||||||||||
CORPORATE BONDS (Continued) | ||||||||||||||||
United States (cont’d.) | ||||||||||||||||
Liberty Mutual Group, Inc., | ||||||||||||||||
Gtd. Notes, 144A | 2.750 | % | 05/04/26 | EUR | 1,000 | $ | 1,251,800 | |||||||||
Gtd. Notes, 144A | 3.951 | 10/15/50 | 90 | 92,895 | ||||||||||||
LYB International Finance III LLC, | 4.200 | 10/15/49 | 960 | 960,209 | ||||||||||||
Mars, Inc., | 3.600 | 04/01/34 | 420 | 469,974 | ||||||||||||
Marsh & McLennan Cos., Inc., | 1.979 | 03/21/30 | EUR | 4,700 | 5,766,803 | |||||||||||
McDonald’s Corp., | 3.800 | 03/08/29 | AUD | 4,770 | 3,622,340 | |||||||||||
Medtronic Global Holdings SCA, | ||||||||||||||||
Gtd. Notes | 1.500 | 07/02/39 | EUR | 500 | 577,112 | |||||||||||
Gtd. Notes | 1.625 | 03/07/31 | EUR | 2,500 | 3,085,477 | |||||||||||
Gtd. Notes | 1.750 | 07/02/49 | EUR | 2,100 | 2,359,064 | |||||||||||
Gtd. Notes | 2.250 | 03/07/39 | EUR | 1,910 | 2,496,366 | |||||||||||
Morgan Guaranty Trust Co., | 1.395 | (s) | 01/21/27 | EUR | 1,595,000 | 846,923 | ||||||||||
Morgan Stanley, | ||||||||||||||||
Jr. Sub. Notes, Series H, 3 Month LIBOR + 3.610% | 5.611 | (c) | — | (rr) | 1,415 | 1,423,490 | ||||||||||
Sr. Unsec’d. Notes, EMTN | 0.637 | (ff) | 07/26/24 | EUR | 5,000 | 5,667,083 | ||||||||||
Sr. Unsec’d. Notes, EMTN | 1.342 | (ff) | 10/23/26 | EUR | 600 | 703,295 | ||||||||||
Sr. Unsec’d. Notes, GMTN | 1.375 | 10/27/26 | EUR | 1,600 | 1,893,108 | |||||||||||
MPLX LP, | ||||||||||||||||
Sr. Unsec’d. Notes | 4.000 | 03/15/28 | 515 | 535,171 | ||||||||||||
Sr. Unsec’d. Notes | 4.125 | 03/01/27 | 2,000 | 2,100,352 | ||||||||||||
MPT Operating Partnership LP/MPT Finance Corp., | 3.325 | 03/24/25 | EUR | 1,700 | 2,103,433 | |||||||||||
Nationstar Mortgage Holdings, Inc., | 8.125 | 07/15/23 | 1,540 | 1,632,400 | ||||||||||||
Newell Brands, Inc., | 4.200 | 04/01/26 | 1,300 | 1,358,694 | ||||||||||||
Newfield Exploration Co., | 5.625 | 07/01/24 | 7,200 | 7,888,101 | ||||||||||||
Norfolk Southern Corp., | ||||||||||||||||
Sr. Unsec’d. Notes | 3.942 | 11/01/47 | 232 | 254,481 | ||||||||||||
Sr. Unsec’d. Notes | 4.050 | 08/15/52 | 165 | 182,996 | ||||||||||||
NRG Energy, Inc., | ||||||||||||||||
Gtd. Notes(a) | 6.625 | 01/15/27 | 1,725 | 1,869,469 | ||||||||||||
Sr. Sec’d. Notes, 144A | 3.750 | 06/15/24 | 5,600 | 5,809,892 | ||||||||||||
Occidental Petroleum Corp., | ||||||||||||||||
Sr. Unsec’d. Notes | 2.600 | 08/13/21 | 965 | 971,436 | ||||||||||||
See Notes to Financial Statements.
| 40 |
| Description | Interest Rate | Maturity Date | Principal Amount (000)# | Value | ||||||||||||
CORPORATE BONDS (Continued) | ||||||||||||||||
United States (cont’d.) | ||||||||||||||||
Occidental Petroleum Corp., (cont’d.) | ||||||||||||||||
Sr. Unsec’d. Notes | 2.700 | % | 08/15/22 | 1,320 | $ | 1,333,997 | ||||||||||
Sr. Unsec’d. Notes | 6.450 | 09/15/36 | 35 | 42,821 | ||||||||||||
ONEOK Partners LP, | 4.900 | 03/15/25 | 2,000 | 2,199,741 | ||||||||||||
ONEOK, Inc., | 4.450 | 09/01/49 | 2,000 | 1,994,263 | ||||||||||||
PetSmart, Inc., | 5.875 | 06/01/25 | 565 | 556,525 | ||||||||||||
Phillips 66 Partners LP, | 3.605 | 02/15/25 | 2,000 | 2,092,932 | ||||||||||||
Plains All American Pipeline LP/PAA Finance Corp., | ||||||||||||||||
Sr. Unsec’d. Notes | 3.550 | 12/15/29 | 2,055 | 1,957,479 | ||||||||||||
Sr. Unsec’d. Notes | 4.900 | 02/15/45 | 2,350 | 2,256,451 | ||||||||||||
PVH Corp., | ||||||||||||||||
Sr. Unsec’d. Notes, 144A | 3.125 | 12/15/27 | EUR | 575 | 712,746 | |||||||||||
Sr. Unsec’d. Notes, 144A | 3.625 | 07/15/24 | EUR | 840 | 1,047,955 | |||||||||||
Sally Holdings LLC/Sally Capital, Inc., | 5.625 | 12/01/25 | 4,525 | 4,672,062 | ||||||||||||
Schlumberger Holdings Corp., | ||||||||||||||||
Sr. Unsec’d. Notes, 144A | 3.900 | 05/17/28 | 1,955 | 2,065,613 | ||||||||||||
Sr. Unsec’d. Notes, 144A | 4.000 | 12/21/25 | 129 | 137,928 | ||||||||||||
Scientific Games International, Inc., | ||||||||||||||||
Gtd. Notes | 6.250 | 09/01/20 | 1,300 | 1,301,625 | ||||||||||||
Gtd. Notes | 6.625 | 05/15/21 | 1,537 | 1,556,212 | ||||||||||||
Service Properties Trust, | 4.350 | 10/01/24 | 3,600 | 3,682,142 | ||||||||||||
Shire Acquisitions Investments Ireland DAC, | 3.200 | 09/23/26 | 2,470 | 2,553,862 | ||||||||||||
Spectrum Brands, Inc., | 4.000 | 10/01/26 | EUR | 675 | 792,812 | |||||||||||
Sprint Capital Corp., | 8.750 | 03/15/32 | 4,325 | 5,273,818 | ||||||||||||
Sprint Corp., | 7.625 | 02/15/25 | 300 | 329,625 | ||||||||||||
Stryker Corp., | 2.625 | 11/30/30 | EUR | 2,300 | 3,077,202 | |||||||||||
Sunoco Logistics Partners Operations LP, | 5.400 | 10/01/47 | 2,200 | 2,362,164 | ||||||||||||
Tallgrass Energy Partners LP/Tallgrass Energy Finance Corp., | 5.500 | 01/15/28 | 2,800 | 2,625,000 | ||||||||||||
See Notes to Financial Statements.
| PGIM Global Total Return Fund | 41 |
Schedule of Investments(continued)
as of October 31, 2019
| Description | Interest Rate | Maturity Date | Principal Amount (000)# | Value | ||||||||||||
CORPORATE BONDS (Continued) | ||||||||||||||||
United States (cont’d.) | ||||||||||||||||
Tenet Healthcare Corp., | ||||||||||||||||
Sec’d. Notes, 144A(a) | 6.250 | % | 02/01/27 | 1,200 | $ | 1,267,500 | ||||||||||
Sr. Sec’d. Notes, 144A | 5.125 | 11/01/27 | 1,005 | 1,047,692 | ||||||||||||
Sr. Unsec’d. Notes(a) | 6.750 | 06/15/23 | 875 | 927,500 | ||||||||||||
Sr. Unsec’d. Notes | 8.125 | 04/01/22 | 2,250 | 2,435,625 | ||||||||||||
Thermo Fisher Scientific, Inc., | ||||||||||||||||
Sr. Unsec’d. Notes | 0.500 | 03/01/28 | EUR | 4,500 | 4,993,756 | |||||||||||
Sr. Unsec’d. Notes | 2.875 | 07/24/37 | EUR | 450 | 618,101 | |||||||||||
Tote Shipholdings, Inc., | 3.400 | 10/16/40 | 108 | 113,988 | ||||||||||||
Toyota Motor Credit Corp., | 2.600 | (cc) | 10/24/25 | 3,148 | 3,283,679 | |||||||||||
U.S. Concrete, Inc., | 6.375 | 06/01/24 | 1,675 | 1,743,541 | ||||||||||||
United Airlines 2007-1 Class A Pass-Through Trust, | 6.636 | 01/02/24 | 63 | 66,882 | ||||||||||||
United Rentals North America, Inc., | ||||||||||||||||
Gtd. Notes | 4.875 | 01/15/28 | 3,115 | 3,216,237 | ||||||||||||
Gtd. Notes | 5.250 | 01/15/30 | 2,340 | 2,459,925 | ||||||||||||
Gtd. Notes(a) | 5.500 | 05/15/27 | 500 | 527,188 | ||||||||||||
Verizon Communications, Inc., | ||||||||||||||||
Sr. Unsec’d. Notes | 1.250 | 04/08/30 | EUR | 5,000 | 5,887,970 | |||||||||||
Sr. Unsec’d. Notes | 2.500 | 04/08/31 | GBP | 1,400 | 1,920,305 | |||||||||||
Vistra Operations Co. LLC, | ||||||||||||||||
Gtd. Notes, 144A | 5.000 | 07/31/27 | 3,520 | 3,643,200 | ||||||||||||
Welltower, Inc., | ||||||||||||||||
Sr. Unsec’d. Notes | 3.100 | 01/15/30 | 5,600 | 5,672,025 | ||||||||||||
William Lyon Homes, Inc., | ||||||||||||||||
Gtd. Notes | 5.875 | 01/31/25 | 2,350 | 2,391,125 | ||||||||||||
Gtd. Notes | 7.000 | 08/15/22 | 114 | 114,285 | ||||||||||||
Gtd. Notes, 144A | 6.625 | 07/15/27 | 755 | 794,637 | ||||||||||||
Williams Cos., Inc. (The), | ||||||||||||||||
Sr. Unsec’d. Notes | 3.750 | 06/15/27 | 2,000 | 2,082,340 | ||||||||||||
Sr. Unsec’d. Notes | 4.000 | 09/15/25 | 1,500 | 1,592,266 | ||||||||||||
Xerox Corp., | 4.125 | 03/15/23 | 460 | 469,775 | ||||||||||||
XPO Logistics, Inc., | 6.750 | 08/15/24 | 530 | 572,400 | ||||||||||||
|
| |||||||||||||||
| 403,062,872 | ||||||||||||||||
|
| |||||||||||||||
TOTAL CORPORATE BONDS | 799,202,127 | |||||||||||||||
|
| |||||||||||||||
See Notes to Financial Statements.
| 42 |
| Description | Interest Rate | Maturity Date | Principal Amount (000)# | Value | ||||||||||||
MUNICIPAL BONDS 0.0% | ||||||||||||||||
Puerto Rico | ||||||||||||||||
Puerto Rico Sales Tax Financing Corp. | ||||||||||||||||
Revenue Bonds | 0.535 | %(s) | 08/01/41 | 315 | $ | 230,030 | ||||||||||
Revenue Bonds | 0.816 | (s) | 08/01/41 | 104 | 14,137 | |||||||||||
Revenue Bonds, Series A-1 | 4.550 | 07/01/40 | 5 | 5,111 | ||||||||||||
Revenue Bonds, Series A-1 | 4.750 | 07/01/53 | 40 | 41,316 | ||||||||||||
Revenue Bonds, Series A-1 | 5.000 | 07/01/58 | 102 | 107,080 | ||||||||||||
Revenue Bonds, Series A-1 | 5.181 | (s) | 07/01/46 | 142 | 36,920 | |||||||||||
Revenue Bonds, Series A-1 | 5.374 | (s) | 07/01/51 | 115 | 22,297 | |||||||||||
|
| |||||||||||||||
TOTAL MUNICIPAL BONDS | 456,891 | |||||||||||||||
|
| |||||||||||||||
RESIDENTIAL MORTGAGE-BACKED SECURITIES 3.6% | ||||||||||||||||
Bermuda 1.2% | ||||||||||||||||
Bellemeade Re Ltd., | ||||||||||||||||
Series 2017-01, Class M1, 144A, 1 Month LIBOR + 1.700% (Cap N/A, Floor 0.000%) | 3.523 | (c) | 10/25/27 | 244 | 244,266 | |||||||||||
Series 2018-01A, Class M1B, 144A, 1 Month LIBOR + 1.600% (Cap N/A, Floor 0.000%) | 3.423 | (c) | 04/25/28 | 1,295 | 1,295,885 | |||||||||||
Series 2018-02A, Class M1A, 144A, 1 Month LIBOR + 0.950% (Cap N/A, Floor 0.000%) | 2.773 | (c) | 08/25/28 | 561 | 560,656 | |||||||||||
Series 2018-02A, Class M1B, 144A, 1 Month LIBOR + 1.350% (Cap N/A, Floor 0.000%) | 3.173 | (c) | 08/25/28 | 750 | 751,203 | |||||||||||
Series 2018-02A, Class M1C, 144A, 1 Month LIBOR + 1.600% (Cap N/A, Floor 0.000%) | 3.423 | (c) | 08/25/28 | 750 | 751,370 | |||||||||||
Series 2018-03A, Class M1A, 144A, 1 Month LIBOR + 1.200% (Cap N/A, Floor 1.200%) | 3.023 | (c) | 10/25/28 | 414 | 414,341 | |||||||||||
Series 2018-03A, Class M1B, 144A, 1 Month LIBOR + 1.850% (Cap N/A, Floor 1.850%) | 3.673 | (c) | 10/25/28 | 950 | 949,998 | |||||||||||
Series 2019-02A, Class M1A, 144A, 1 Month LIBOR + 1.000% (Cap N/A, Floor 1.000%) | 2.823 | (c) | 04/25/29 | 4,175 | 4,174,890 | |||||||||||
Series 2019-02A, Class M1B, 144A, 1 Month LIBOR + 1.450% (Cap N/A, Floor 1.450%) | 3.273 | (c) | 04/25/29 | 1,630 | 1,629,998 | |||||||||||
Series 2019-03A, Class M1A, 144A, 1 Month LIBOR + 1.100% (Cap N/A, Floor 1.100%) | 2.923 | (c) | 07/25/29 | 3,600 | 3,602,440 | |||||||||||
Series 2019-03A, Class M1B, 144A, 1 Month LIBOR + 1.600% (Cap N/A, Floor 1.600%) | 3.423 | (c) | 07/25/29 | 2,400 | 2,402,377 | |||||||||||
Series 2019-04A, Class M1A, 144A, 1 Month LIBOR + 1.400% (Cap N/A, Floor 1.400%) | 3.314 | (c) | 10/25/29 | 5,000 | 5,000,046 | |||||||||||
Series 2019-04A, Class M1B, 144A, 1 Month LIBOR + 2.000% (Cap N/A, Floor 2.000%) | 3.914 | (c) | 10/25/29 | 4,500 | 4,500,022 | |||||||||||
See Notes to Financial Statements.
| PGIM Global Total Return Fund | 43 |
Schedule of Investments(continued)
as of October 31, 2019
| Description | Interest Rate | Maturity Date | Principal Amount (000)# | Value | ||||||||||||
RESIDENTIAL MORTGAGE-BACKED SECURITIES (Continued) | ||||||||||||||||
Bermuda (cont’d.) | ||||||||||||||||
Eagle Re Ltd., | ||||||||||||||||
Series 2019-01, Class M1A, 144A, 1 Month LIBOR + 1.250% (Cap N/A, Floor 0.000%) | 3.073 | %(c) | 04/25/29 | 900 | $ | 899,550 | ||||||||||
Series 2019-01, Class M1B, 144A, 1 Month LIBOR + 1.800% (Cap N/A, Floor 0.000%) | 3.623 | (c) | 04/25/29 | 1,030 | 1,032,519 | |||||||||||
Home Re Ltd., | 3.473 | (c) | 05/25/29 | 1,370 | 1,371,249 | |||||||||||
Oaktown Re II Ltd., | 3.373 | (c) | 07/25/28 | 678 | 678,360 | |||||||||||
Oaktown Re III Ltd., | 3.223 | (c) | 07/25/29 | 600 | 600,893 | |||||||||||
Radnor Re Ltd., | 3.223 | (c) | 03/25/28 | 941 | 940,947 | |||||||||||
|
| |||||||||||||||
| 31,801,010 | ||||||||||||||||
United Kingdom 0.2% | ||||||||||||||||
Paragon Mortgages PLC, | ||||||||||||||||
Series 11X, Class BB, 3 Month EURIBOR + 0.480% (Cap N/A, Floor 0.000%) | 0.062 | (c) | 10/15/41 | EUR | 2,481 | 2,608,925 | ||||||||||
Series 12X, Class B1B, 3 Month EURIBOR + 0.480% (Cap N/A, Floor 0.000%) | 0.078 | (c) | 11/15/38 | EUR | 1,228 | 1,277,319 | ||||||||||
Towd Point Mortgage Funding Vantage PLC, | 1.961 | (c) | 02/20/54 | GBP | 725 | 938,708 | ||||||||||
|
| |||||||||||||||
| 4,824,952 | ||||||||||||||||
United States 2.2% | ||||||||||||||||
APS Resecuritization Trust, | 2.182 | (c) | 07/27/57 | 1,669 | 1,651,328 | |||||||||||
Banc of America Funding Trust, | 3.559 | (c) | 09/26/45 | 258 | 261,348 | |||||||||||
BVRT Financing Trust, | 3.996 | 09/15/21 | 22,400 | 22,400,000 | ||||||||||||
See Notes to Financial Statements.
| 44 |
| Description | Interest Rate | Maturity Date | Principal Amount (000)# | Value | ||||||||||||
RESIDENTIAL MORTGAGE-BACKED SECURITIES (Continued) | ||||||||||||||||
United States (cont’d.) | ||||||||||||||||
Central Park Funding Trust, | ||||||||||||||||
Series 2018-01, Class A, 144A, 1 Month LIBOR + 1.500% (Cap N/A, Floor 1.500%) | 3.532 | %(c) | 11/01/23 | 3,500 | $ | 3,500,000 | ||||||||||
Series 2019-02, Class PT, 144A, 1 Month LIBOR + 1.500% (Cap N/A, Floor 1.500%) | 3.516 | (c) | 04/25/23 | 5,735 | 5,734,928 | |||||||||||
CIM Trust, | ||||||||||||||||
Series 2017-02, Class A1, 144A, 1 Month LIBOR + 2.000% (Cap N/A, Floor 2.000%) | 4.032 | (c) | 12/25/57 | 1,936 | 1,950,498 | |||||||||||
Series 2017-03, Class A1, 144A, 1 Month LIBOR + 2.000% (Cap N/A, Floor 0.000%) | 4.032 | (c) | 01/25/57 | 1,709 | 1,744,765 | |||||||||||
Series 2017-08, Class A1, 144A | 3.000 | (cc) | 12/25/65 | 2,115 | 2,120,283 | |||||||||||
Fannie Mae Connecticut Avenue Securities, | 3.273 | (c) | 01/25/29 | 48 | 47,753 | |||||||||||
Freddie Mac Structured Agency Credit Risk Debt Notes, | ||||||||||||||||
Series 2015-DNA01, Class M3, 1 Month LIBOR + 3.300% (Cap N/A, Floor 0.000%) | 5.123 | (c) | 10/25/27 | 1,000 | 1,062,993 | |||||||||||
Series 2016-HQA02, Class M2, 1 Month LIBOR + 2.250% (Cap N/A, Floor 0.000%) | 4.073 | (c) | 11/25/28 | 235 | 236,391 | |||||||||||
Series 2019-DNA01, Class M2, 144A, 1 Month LIBOR + 2.650% (Cap N/A, Floor 0.000%) | 4.473 | (c) | 01/25/49 | 470 | 476,104 | |||||||||||
IndyMac INDX Mortgage Loan Trust, | 4.288 | (cc) | 02/25/35 | 1,001 | 1,006,209 | |||||||||||
LSTAR Securities Investment Trust, | ||||||||||||||||
Series 2018-02, Class A1, 144A, 1 Month LIBOR + 1.500% (Cap N/A, Floor 0.000%) | 3.532 | (c) | 04/01/23 | 2,216 | 2,212,603 | |||||||||||
Series 2019-02, Class A1, 144A, 1 Month LIBOR + 1.500% (Cap N/A, Floor 0.000%) | 3.532 | (c) | 04/01/24 | 1,517 | 1,512,178 | |||||||||||
MRA Issuance Trust, | 3.071 | (c) | 01/31/20 | 6,500 | 6,499,149 | |||||||||||
New Residential Mortgage Loan Trust, | 2.573 | (c) | 01/25/48 | 1,787 | 1,782,965 | |||||||||||
Park Avenue Funding Trust, | ||||||||||||||||
Series 2019-01, Class PT, 144A, 1 Month LIBOR + 1.500% (Cap N/A, Floor 1.500%) | 3.304 | (c) | 11/27/20 | 1,023 | 1,022,905 | |||||||||||
Series 2019-03, Class PT, 144A, 1 Month LIBOR + 1.500% (Cap N/A, Floor 1.500%) | 3.304 | (c) | 01/27/21 | 2,976 | 2,976,466 | |||||||||||
|
| |||||||||||||||
| 58,198,866 | ||||||||||||||||
|
| |||||||||||||||
TOTAL RESIDENTIAL MORTGAGE-BACKED SECURITIES | 94,824,828 | |||||||||||||||
|
| |||||||||||||||
See Notes to Financial Statements.
| PGIM Global Total Return Fund | 45 |
Schedule of Investments(continued)
as of October 31, 2019
| Description | Interest Rate | Maturity Date | Principal Amount (000)# | Value | ||||||||||||
SOVEREIGN BONDS 37.0% | ||||||||||||||||
Albania 0.1% | ||||||||||||||||
Albania Government International Bond, | ||||||||||||||||
Sr. Unsec’d. Notes | 3.500 | % | 10/09/25 | EUR | 1,000 | $ | 1,207,774 | |||||||||
Sr. Unsec’d. Notes | 5.750 | 11/12/20 | EUR | 352 | 414,178 | |||||||||||
Sr. Unsec’d. Notes, 144A | 3.500 | 10/09/25 | EUR | 1,000 | 1,207,774 | |||||||||||
|
| |||||||||||||||
| 2,829,726 | ||||||||||||||||
Argentina 0.6% | ||||||||||||||||
Argentine Republic Government International Bond, | ||||||||||||||||
Bonds | 3.380 | (cc) | 12/31/38 | EUR | 1,000 | 431,175 | ||||||||||
Bonds | 4.330 | 12/31/33 | JPY | 519,215 | 1,455,380 | |||||||||||
Sr. Unsec’d. Notes | 0.670 | (cc) | 12/31/38 | JPY | 194,978 | 568,739 | ||||||||||
Sr. Unsec’d. Notes^ | 0.670 | (cc) | 12/31/38 | JPY | 42,213 | 119,712 | ||||||||||
Sr. Unsec’d. Notes | 3.375 | 10/12/20 | CHF | 3,860 | 1,936,847 | |||||||||||
Sr. Unsec’d. Notes | 5.000 | 01/15/27 | EUR | 3,000 | 1,266,825 | |||||||||||
Sr. Unsec’d. Notes | 5.250 | 01/15/28 | EUR | 2,540 | 1,069,405 | |||||||||||
Sr. Unsec’d. Notes | 7.820 | 12/31/33 | EUR | 17,202 | 8,999,499 | |||||||||||
Provincia de Buenos Aires, | 5.375 | 01/20/23 | EUR | 1,100 | 403,627 | |||||||||||
|
| |||||||||||||||
| 16,251,209 | ||||||||||||||||
Australia 0.1% | ||||||||||||||||
Australia Government Bond, | ||||||||||||||||
Sr. Unsec’d. Notes, Series 142 | 4.250 | 04/21/26 | AUD | 600 | 498,151 | |||||||||||
Sr. Unsec’d. Notes, Series 150 | 3.000 | 03/21/47 | AUD | 2,400 | 2,118,845 | |||||||||||
|
| |||||||||||||||
| 2,616,996 | ||||||||||||||||
Austria 0.2% | ||||||||||||||||
Republic of Austria Government International Bond, | ||||||||||||||||
Sr. Unsec’d. Notes, 144A, EMTN | 5.000 | 12/20/24 | CAD | 3,500 | 3,010,542 | |||||||||||
Sr. Unsec’d. Notes, 144A, MTN | 5.375 | 12/01/34 | CAD | 1,440 | 1,479,286 | |||||||||||
|
| |||||||||||||||
| 4,489,828 | ||||||||||||||||
Belgium 0.2% | ||||||||||||||||
Kingdom of Belgium Government International Bond, | ||||||||||||||||
Notes, 144A | 8.875 | 12/01/24 | 750 | 980,139 | ||||||||||||
Sr. Unsec’d. Notes | 9.375 | 02/21/20 | GBP | 2,402 | 3,186,640 | |||||||||||
Unsec’d. Notes, EMTN | 5.700 | 05/28/32 | GBP | 650 | 1,272,107 | |||||||||||
|
| |||||||||||||||
| 5,438,886 | ||||||||||||||||
See Notes to Financial Statements.
| 46 |
| Description | Interest Rate | Maturity Date | Principal Amount (000)# | Value | ||||||||||||
SOVEREIGN BONDS (Continued) | ||||||||||||||||
Brazil 1.7% | ||||||||||||||||
Brazil Loan Trust 1, | 5.477 | % | 07/24/23 | 10,393 | $ | 10,795,910 | ||||||||||
Brazil Minas SPE via State of Minas Gerais, | 5.333 | 02/15/28 | 24,287 | 25,804,649 | ||||||||||||
Brazilian Government International Bond, | 2.875 | 04/01/21 | EUR | 7,128 | 8,236,530 | |||||||||||
|
| |||||||||||||||
| 44,837,089 | ||||||||||||||||
Bulgaria 0.3% | ||||||||||||||||
Bulgaria Government International Bond, | 3.125 | 03/26/35 | EUR | 6,352 | 9,325,744 | |||||||||||
Canada 0.2% | ||||||||||||||||
Canadian Government Bond, | 4.000 | 06/01/41 | CAD | 650 | 708,728 | |||||||||||
City of Toronto Canada, | ||||||||||||||||
Sr. Unsec’d. Notes | 3.500 | 06/02/36 | CAD | 2,000 | 1,689,773 | |||||||||||
Unsec’d. Notes | 2.650 | 11/09/29 | CAD | 775 | 602,454 | |||||||||||
Province of British Columbia, | 7.875 | 11/30/23 | CAD | 2,122 | 1,971,823 | |||||||||||
Province of Manitoba, | 8.800 | 01/15/20 | 360 | 364,676 | ||||||||||||
Province of Nova Scotia, | 8.250 | 11/15/19 | 20 | 20,035 | ||||||||||||
Province of Quebec, | ||||||||||||||||
Unsec’d. Notes, MTN | 6.350 | 01/30/26 | 500 | 608,940 | ||||||||||||
Unsec’d. Notes, MTN | 7.140 | 02/27/26 | 430 | 544,414 | ||||||||||||
|
| |||||||||||||||
| 6,510,843 | ||||||||||||||||
Cayman Islands 0.1% | ||||||||||||||||
Cayman Islands Government Bond, | 5.950 | 11/24/19 | 2,150 | 2,147,312 | ||||||||||||
Chile 0.0% | ||||||||||||||||
Chile Government International Bond, | ||||||||||||||||
Sr. Unsec’d. Notes | 1.440 | 02/01/29 | EUR | 450 | 544,304 | |||||||||||
Sr. Unsec’d. Notes | 1.750 | 01/20/26 | EUR | 240 | 290,221 | |||||||||||
|
| |||||||||||||||
| 834,525 | ||||||||||||||||
See Notes to Financial Statements.
| PGIM Global Total Return Fund | 47 |
Schedule of Investments(continued)
as of October 31, 2019
| Description | Interest Rate | Maturity Date | Principal Amount (000)# | Value | ||||||||||||
SOVEREIGN BONDS (Continued) | ||||||||||||||||
China 0.4% | ||||||||||||||||
China Government Bond, | ||||||||||||||||
Sr. Unsec’d. Notes | 3.160 | % | 06/27/23 | CNH | 5,000 | $ | 717,004 | |||||||||
Sr. Unsec’d. Notes | 3.380 | 11/21/24 | CNH | 500 | 72,535 | |||||||||||
Sr. Unsec’d. Notes | 3.390 | 05/21/25 | CNH | 2,000 | 290,863 | |||||||||||
Sr. Unsec’d. Notes | 3.480 | 06/29/27 | CNH | 2,000 | 291,072 | |||||||||||
Sr. Unsec’d. Notes | 3.600 | 06/27/28 | CNH | 1,000 | 146,690 | |||||||||||
Sr. Unsec’d. Notes | 3.600 | 05/21/30 | CNH | 3,000 | 440,040 | |||||||||||
Sr. Unsec’d. Notes | 4.000 | 11/30/35 | CNH | 10,000 | 1,542,070 | |||||||||||
Sr. Unsec’d. Notes | 4.100 | 05/21/45 | CNH | 13,500 | 2,025,134 | |||||||||||
Sr. Unsec’d. Notes | 4.400 | 12/12/46 | CNH | 10,000 | 1,562,232 | |||||||||||
Unsec’d. Notes, Series 1906 | 3.290 | 05/23/29 | CNH | 10,000 | 1,419,734 | |||||||||||
Export-Import Bank of China (The), | 4.400 | 05/14/24 | CNH | 13,000 | 1,921,649 | |||||||||||
|
| |||||||||||||||
| 10,429,023 | ||||||||||||||||
Colombia 0.9% | ||||||||||||||||
Colombia Government International Bond, | ||||||||||||||||
Sr. Unsec’d. Notes | 4.000 | 02/26/24 | 1,000 | 1,057,080 | ||||||||||||
Sr. Unsec’d. Notes | 8.375 | 02/15/27 | 2,701 | 3,184,985 | ||||||||||||
Sr. Unsec’d. Notes | 10.375 | 01/28/33 | 1,401 | 2,250,707 | ||||||||||||
Sr. Unsec’d. Notes | 11.750 | 02/25/20 | 1,726 | 1,775,640 | ||||||||||||
Sr. Unsec’d. Notes, EMTN(a) | 3.875 | 03/22/26 | EUR | 12,518 | 16,579,074 | |||||||||||
|
| |||||||||||||||
| 24,847,486 | ||||||||||||||||
Croatia 0.6% | ||||||||||||||||
Croatia Government International Bond, | ||||||||||||||||
Sr. Unsec’d. Notes | 2.750 | 01/27/30 | EUR | 3,000 | 4,043,654 | |||||||||||
Sr. Unsec’d. Notes | 3.000 | 03/20/27 | EUR | 4,500 | 5,947,257 | |||||||||||
Sr. Unsec’d. Notes | 3.875 | 05/30/22 | EUR | 3,000 | 3,674,829 | |||||||||||
Sr. Unsec’d. Notes | 5.500 | 04/04/23 | 1,000 | 1,104,904 | ||||||||||||
Sr. Unsec’d. Notes | 6.375 | 03/24/21 | 500 | 527,792 | ||||||||||||
Sr. Unsec’d. Notes | 6.625 | 07/14/20 | 1,000 | 1,029,540 | ||||||||||||
|
| |||||||||||||||
| 16,327,976 | ||||||||||||||||
Cyprus 2.0% | ||||||||||||||||
Cyprus Government International Bond, | ||||||||||||||||
Sr. Unsec’d. Notes, EMTN | 2.375 | 09/25/28 | EUR | 4,700 | 6,104,561 | |||||||||||
Sr. Unsec’d. Notes, EMTN | 2.750 | 06/27/24 | EUR | 2,000 | 2,508,211 | |||||||||||
Sr. Unsec’d. Notes, EMTN | 2.750 | 02/26/34 | EUR | 8,500 | 11,805,165 | |||||||||||
See Notes to Financial Statements.
| 48 |
| Description | Interest Rate | Maturity Date | Principal Amount (000)# | Value | ||||||||||||
SOVEREIGN BONDS (Continued) | ||||||||||||||||
Cyprus (cont’d.) | ||||||||||||||||
Cyprus Government International Bond, (cont’d.) | ||||||||||||||||
Sr. Unsec’d. Notes, EMTN | 3.750 | % | 07/26/23 | EUR | 12,755 | $ | 16,208,707 | |||||||||
Sr. Unsec’d. Notes, EMTN | 4.250 | 11/04/25 | EUR | 11,814 | 16,284,831 | |||||||||||
|
| |||||||||||||||
| 52,911,475 | ||||||||||||||||
Denmark 0.1% | ||||||||||||||||
Denmark Government Bond, | ||||||||||||||||
Bonds | 0.500 | 11/15/27 | DKK | 12,110 | 1,957,497 | |||||||||||
Bonds | 1.750 | 11/15/25 | DKK | 3,520 | 601,019 | |||||||||||
Bonds | 3.000 | 11/15/21 | DKK | 3,000 | 482,177 | |||||||||||
Bonds | 4.500 | 11/15/39 | DKK | 1,800 | 525,037 | |||||||||||
|
| |||||||||||||||
| 3,565,730 | ||||||||||||||||
Dominican Republic 0.2% | ||||||||||||||||
Dominican Republic International Bond, | ||||||||||||||||
Sr. Unsec’d. Notes | 5.875 | 04/18/24 | 1,306 | 1,392,536 | ||||||||||||
Sr. Unsec’d. Notes | 7.500 | 05/06/21 | 3,333 | 3,475,033 | ||||||||||||
|
| |||||||||||||||
| 4,867,569 | ||||||||||||||||
Egypt 0.1% | ||||||||||||||||
Egypt Government International Bond, | ||||||||||||||||
Sr. Unsec’d. Notes, 144A | 5.577 | 02/21/23 | 1,835 | 1,880,648 | ||||||||||||
Sr. Unsec’d. Notes, 144A, MTN | 4.750 | 04/16/26 | EUR | 700 | 799,681 | |||||||||||
|
| |||||||||||||||
| 2,680,329 | ||||||||||||||||
Finland 0.1% | ||||||||||||||||
Finland Government International Bond, | 6.950 | 02/15/26 | 600 | 758,729 | ||||||||||||
Municipality Finance PLC, | 3.050 | 09/24/32 | SEK | 13,000 | 1,670,450 | |||||||||||
|
| |||||||||||||||
| 2,429,179 | ||||||||||||||||
Greece 2.6% | ||||||||||||||||
Hellenic Republic Government Bond, | ||||||||||||||||
Bonds | — | (p) | 10/15/42 | EUR | 270,000 | 1,129,241 | ||||||||||
Bonds | 3.000 | (cc) | 02/24/23 | EUR | 3,199 | 3,932,020 | ||||||||||
Bonds | 3.000 | (cc) | 02/24/24 | EUR | 4,038 | 5,085,530 | ||||||||||
Bonds | 3.000 | (cc) | 02/24/25 | EUR | 2,297 | 2,959,305 | ||||||||||
See Notes to Financial Statements.
| PGIM Global Total Return Fund | 49 |
Schedule of Investments(continued)
as of October 31, 2019
| Description | Interest Rate | Maturity Date | Principal Amount (000)# | Value | ||||||||||||
SOVEREIGN BONDS (Continued) | ||||||||||||||||
Greece (cont’d.) | ||||||||||||||||
Hellenic Republic Government Bond, (cont’d.) | ||||||||||||||||
Bonds | 3.000 | %(cc) | 02/24/26 | EUR | 1,828 | $ | 2,408,781 | |||||||||
Bonds | 3.000 | (cc) | 02/24/27 | EUR | 5,116 | 6,796,077 | ||||||||||
Bonds | 3.000 | (cc) | 02/24/28 | EUR | 1,565 | 2,118,785 | ||||||||||
Bonds | 3.000 | (cc) | 02/24/29 | EUR | 2,287 | 3,122,278 | ||||||||||
Bonds | 3.000 | (cc) | 02/24/30 | EUR | 200 | 275,225 | ||||||||||
Bonds | 3.000 | (cc) | 02/24/31 | EUR | 3,611 | 5,025,732 | ||||||||||
Bonds | 3.000 | (cc) | 02/24/32 | EUR | 1,208 | 1,690,841 | ||||||||||
Bonds | 3.000 | (cc) | 02/24/33 | EUR | 217 | 302,898 | ||||||||||
Bonds | 3.000 | (cc) | 02/24/34 | EUR | 579 | 813,638 | ||||||||||
Bonds | 3.000 | (cc) | 02/24/35 | EUR | 2,126 | 2,978,866 | ||||||||||
Bonds | 3.000 | (cc) | 02/24/36 | EUR | 611 | 857,318 | ||||||||||
Bonds | 3.000 | (cc) | 02/24/37 | EUR | 478 | 679,707 | ||||||||||
Bonds | 3.000 | (cc) | 02/24/38 | EUR | 962 | 1,370,744 | ||||||||||
Bonds | 3.000 | (cc) | 02/24/39 | EUR | 931 | 1,332,658 | ||||||||||
Bonds | 3.000 | (cc) | 02/24/40 | EUR | 575 | 824,139 | ||||||||||
Bonds | 3.000 | (cc) | 02/24/41 | EUR | 557 | 800,715 | ||||||||||
Bonds | 3.000 | (cc) | 02/24/42 | EUR | 568 | 822,550 | ||||||||||
Bonds | 3.900 | 01/30/33 | EUR | 2,710 | 3,837,452 | |||||||||||
Bonds | 4.000 | 01/30/37 | EUR | 1,260 | 1,825,688 | |||||||||||
Bonds | 4.200 | 01/30/42 | EUR | 2,380 | 3,634,689 | |||||||||||
Hellenic Republic Government International Bond, | ||||||||||||||||
Sr. Unsec’d. Notes | 5.200 | 07/17/34 | EUR | 8,000 | 12,521,270 | |||||||||||
Sr. Unsec’d. Notes | 6.140 | 04/14/28 | EUR | 1,700 | 2,577,598 | |||||||||||
|
| |||||||||||||||
| 69,723,745 | ||||||||||||||||
Guernsey 0.1% | ||||||||||||||||
States of Guernsey Bond, | 3.375 | 12/12/46 | GBP | 1,280 | 2,116,137 | |||||||||||
Hong Kong 0.1% | ||||||||||||||||
Hong Kong Sukuk 2017 Ltd., | 3.132 | 02/28/27 | 1,500 | 1,566,144 | ||||||||||||
Hungary 0.6% | ||||||||||||||||
Hungary Government International Bond, | ||||||||||||||||
Sr. Unsec’d. Notes | 1.250 | 10/22/25 | EUR | 2,000 | 2,385,601 | |||||||||||
Sr. Unsec’d. Notes | 4.300 | 12/19/21 | CNH | 32,500 | 4,639,495 | |||||||||||
Sr. Unsec’d. Notes | 5.375 | 02/21/23 | 4,850 | 5,308,131 | ||||||||||||
Sr. Unsec’d. Notes | 5.750 | 11/22/23 | 3,050 | 3,445,890 | ||||||||||||
|
| |||||||||||||||
| 15,779,117 | ||||||||||||||||
See Notes to Financial Statements.
| 50 |
| Description | Interest Rate | Maturity Date | Principal Amount (000)# | Value | ||||||||||||
SOVEREIGN BONDS (Continued) | ||||||||||||||||
Iceland 0.1% | ||||||||||||||||
Iceland Government International Bond, | ||||||||||||||||
Sr. Unsec’d. Notes | 5.875 | % | 05/11/22 | 1,000 | $ | 1,096,018 | ||||||||||
Sr. Unsec’d. Notes, EMTN | 0.500 | 12/20/22 | EUR | 500 | 567,632 | |||||||||||
|
| |||||||||||||||
| 1,663,650 | ||||||||||||||||
Indonesia 1.5% | ||||||||||||||||
Indonesia Government International Bond, | ||||||||||||||||
Sr. Unsec’d. Notes | 1.400 | 10/30/31 | EUR | 600 | 665,834 | |||||||||||
Sr. Unsec’d. Notes | 1.750 | 04/24/25 | EUR | 1,600 | 1,868,350 | |||||||||||
Sr. Unsec’d. Notes | 3.375 | 07/30/25 | EUR | 12,005 | 15,266,875 | |||||||||||
Sr. Unsec’d. Notes, EMTN | 2.150 | 07/18/24 | EUR | 3,395 | 4,035,637 | |||||||||||
Sr. Unsec’d. Notes, EMTN | 2.625 | 06/14/23 | EUR | 1,000 | 1,196,494 | |||||||||||
Sr. Unsec’d. Notes, EMTN | 2.875 | 07/08/21 | EUR | 4,546 | 5,285,189 | |||||||||||
Sr. Unsec’d. Notes, EMTN | 3.750 | 06/14/28 | EUR | 7,780 | 10,525,242 | |||||||||||
|
| |||||||||||||||
| 38,843,621 | ||||||||||||||||
Iraq 0.1% | ||||||||||||||||
Iraq International Bond, | 6.752 | 03/09/23 | 1,700 | 1,712,614 | ||||||||||||
Isle of Man 0.4% | ||||||||||||||||
Isle of Man Government International Bond, | ||||||||||||||||
Unsec’d. Notes | 5.375 | 08/14/34 | GBP | 1,600 | 3,072,513 | |||||||||||
Unsec’d. Notes | 5.625 | 03/29/30 | GBP | 4,000 | 7,235,971 | |||||||||||
|
| |||||||||||||||
| 10,308,484 | ||||||||||||||||
Israel 0.4% | ||||||||||||||||
Israel Government International Bond, | ||||||||||||||||
Sr. Unsec’d. Notes, EMTN | 1.500 | 01/18/27 | EUR | 1,600 | 1,950,437 | |||||||||||
Sr. Unsec’d. Notes, EMTN | 1.500 | 01/16/29 | EUR | 1,000 | 1,229,730 | |||||||||||
Sr. Unsec’d. Notes, EMTN | 2.875 | 01/29/24 | EUR | 1,000 | 1,253,374 | |||||||||||
Sr. Unsec’d. Notes, EMTN | 6.875 | 10/21/34 | GBP | 2,610 | 5,353,935 | |||||||||||
|
| |||||||||||||||
| 9,787,476 | ||||||||||||||||
Italy 4.9% | ||||||||||||||||
Cassa Del Trentino SPA, | 1.160 | 06/17/26 | EUR | 712 | 757,180 | |||||||||||
City of Rome Italy, | 5.345 | 01/27/48 | EUR | 2,000 | 3,547,135 | |||||||||||
See Notes to Financial Statements.
| PGIM Global Total Return Fund | 51 |
Schedule of Investments(continued)
as of October 31, 2019
| Description | Interest Rate | Maturity Date | Principal Amount (000)# | Value | ||||||||||||
SOVEREIGN BONDS (Continued) | ||||||||||||||||
Italy (cont’d.) | ||||||||||||||||
Italy Buoni Poliennali Del Tesoro, | ||||||||||||||||
Bonds | 6.500 | % | 11/01/27 | EUR | 2,695 | $ | 4,344,247 | |||||||||
Bonds, 144A | 2.800 | 03/01/67 | EUR | 2,100 | 2,702,378 | |||||||||||
Unsec’d. Notes, 144A | 3.350 | 03/01/35 | EUR | 13,940 | 19,523,841 | |||||||||||
Italy Certificati di Credito del Tesoro, | 0.142 | (c) | 09/15/25 | EUR | 5,200 | 5,707,695 | ||||||||||
Region of Lazio, | 3.088 | 03/31/43 | EUR | 1,902 | 2,421,046 | |||||||||||
Republic of Italy Government International Bond, | ||||||||||||||||
Sr. Unsec’d. Notes | 2.375 | 10/17/24 | 500 | 495,651 | ||||||||||||
Sr. Unsec’d. Notes | 2.875 | 10/17/29 | 400 | 391,899 | ||||||||||||
Sr. Unsec’d. Notes | 4.000 | 10/17/49 | 500 | 499,672 | ||||||||||||
Sr. Unsec’d. Notes, EMTN, EURIBOR ICE SWAP 11:00 Fft 10Y Index + 0.000% (Cap 7.000%, Floor 2.000%) | 2.000 | (c) | 06/15/20 | EUR | 1,550 | 1,749,477 | ||||||||||
Sr. Unsec’d. Notes, EMTN | 3.444 | 12/31/24 | EUR | 2,571 | 2,979,992 | |||||||||||
Sr. Unsec’d. Notes, EMTN, EURIBOR ICE SWAP 11:00 + 0.000% (Cap N/A, Floor 4.250%) | 4.250 | (c) | 06/28/29 | EUR | 5,892 | 8,259,447 | ||||||||||
Sr. Unsec’d. Notes, EMTN | 5.125 | 07/31/24 | EUR | 14,455 | 19,553,770 | |||||||||||
Sr. Unsec’d. Notes, EMTN | 5.200 | 07/31/34 | EUR | 250 | 404,517 | |||||||||||
Sr. Unsec’d. Notes, EMTN | 5.250 | 12/07/34 | GBP | 1,090 | 1,850,277 | |||||||||||
Sr. Unsec’d. Notes, EMTN | 6.000 | 08/04/28 | GBP | 28,265 | 46,994,511 | |||||||||||
Sr. Unsec’d. Notes, MTN | 5.375 | 06/15/33 | 4,780 | 5,744,973 | ||||||||||||
Republic of Italy Government International Bond Strips Coupon, | 3.518 | (s) | 03/27/23 | 775 | 709,733 | |||||||||||
|
| |||||||||||||||
| 128,637,441 | ||||||||||||||||
Japan 1.2% | ||||||||||||||||
Japan Finance Organization for Municipalities, | ||||||||||||||||
Sr. Unsec’d. Notes, EMTN | 3.060 | 12/21/20 | AUD | 2,000 | 1,404,949 | |||||||||||
Sr. Unsec’d. Notes, GMTN | 0.875 | 09/22/21 | EUR | 2,535 | 2,888,717 | |||||||||||
Japan Government Thirty Year Bond, | 0.400 | 06/20/49 | JPY | 89,000 | 826,771 | |||||||||||
Japan Government Twenty Year Bond, | ||||||||||||||||
Sr. Unsec’d. Notes, Series 133 | 1.800 | 12/20/31 | JPY | 148,000 | 1,677,160 | |||||||||||
Sr. Unsec’d. Notes, Series 149 | 1.500 | 06/20/34 | JPY | 50,000 | 559,663 | |||||||||||
Sr. Unsec’d. Notes, Series 150(k) | 1.400 | 09/20/34 | JPY | 145,000 | 1,605,876 | |||||||||||
Sr. Unsec’d. Notes, Series 156 | 0.400 | 03/20/36 | JPY | 100,000 | 966,756 | |||||||||||
Sr. Unsec’d. Notes, Series 157 | 0.200 | 06/20/36 | JPY | 450,000 | 4,209,723 | |||||||||||
Sr. Unsec’d. Notes, Series 159 | 0.600 | 12/20/36 | JPY | 665,000 | 6,620,627 | |||||||||||
Sr. Unsec’d. Notes, Series 160 | 0.700 | 03/20/37 | JPY | 150,000 | 1,518,099 | |||||||||||
See Notes to Financial Statements.
| 52 |
| Description | Interest Rate | Maturity Date | Principal Amount (000)# | Value | ||||||||||||
SOVEREIGN BONDS (Continued) | ||||||||||||||||
Japan (cont’d.) | ||||||||||||||||
Japan Government Twenty Year Bond, (cont’d.) | ||||||||||||||||
Sr. Unsec’d. Notes, Series 165 | 0.500 | % | 06/20/38 | JPY | 514,000 | $ | 5,020,579 | |||||||||
Sr. Unsec’d. Notes, Series 168 | 0.400 | 03/20/39 | JPY | 150,000 | 1,435,466 | |||||||||||
Japanese Government CPI Linked Bond, | 0.100 | 03/10/27 | JPY | 220,700 | 2,112,100 | |||||||||||
|
| |||||||||||||||
| 30,846,486 | ||||||||||||||||
Jersey 0.0% | ||||||||||||||||
Jersey International Bond, | 3.750 | 06/09/54 | GBP | 100 | 187,562 | |||||||||||
Kazakhstan 0.3% | ||||||||||||||||
Kazakhstan Government International Bond, | ||||||||||||||||
Sr. Unsec’d. Notes, 144A, MTN | 1.500 | 09/30/34 | EUR | 3,200 | 3,553,235 | |||||||||||
Sr. Unsec’d. Notes, 144A, MTN | 2.375 | 11/09/28 | EUR | 3,765 | 4,726,092 | |||||||||||
|
| |||||||||||||||
| 8,279,327 | ||||||||||||||||
Kuwait 0.1% | ||||||||||||||||
Kuwait International Government Bond, | 2.750 | 03/20/22 | 2,050 | 2,078,684 | ||||||||||||
Latvia 0.0% | ||||||||||||||||
Latvia Government International Bond, | 2.625 | 01/21/21 | EUR | 200 | 230,537 | |||||||||||
Lithuania 0.2% | ||||||||||||||||
Lithuania Government Bond, | 0.600 | 06/29/23 | EUR | 200 | 227,122 | |||||||||||
Lithuania Government International Bond, | 6.625 | 02/01/22 | 4,420 | 4,868,497 | ||||||||||||
|
| |||||||||||||||
| 5,095,619 | ||||||||||||||||
Malaysia 0.3% | ||||||||||||||||
Malaysia Government Bond, | ||||||||||||||||
Sr. Unsec’d. Notes, Series 111 | 4.160 | 07/15/21 | MYR | 6,500 | 1,582,557 | |||||||||||
Sr. Unsec’d. Notes, Series 217 | 4.059 | 09/30/24 | MYR | 10,000 | 2,470,296 | |||||||||||
Sr. Unsec’d. Notes, Series 314 | 4.048 | 09/30/21 | MYR | 20,916 | 5,091,674 | |||||||||||
Sr. Unsec’d. Notes, Series 416 | 3.620 | 11/30/21 | MYR | 15 | 3,626 | |||||||||||
|
| |||||||||||||||
| 9,148,153 | ||||||||||||||||
See Notes to Financial Statements.
| PGIM Global Total Return Fund | 53 |
Schedule of Investments(continued)
as of October 31, 2019
| Description | Interest Rate | Maturity Date | Principal Amount (000)# | Value | ||||||||||||
SOVEREIGN BONDS (Continued) | ||||||||||||||||
Mexico 1.3% | ||||||||||||||||
Mexico Government International Bond, | ||||||||||||||||
Sr. Unsec’d. Notes(a) | 2.750 | % | 04/22/23 | EUR | 4,375 | $ | 5,288,090 | |||||||||
Sr. Unsec’d. Notes | 2.875 | 04/08/39 | EUR | 2,300 | 2,897,382 | |||||||||||
Sr. Unsec’d. Notes | 4.000 | 03/15/2115 | EUR | 950 | 1,185,355 | |||||||||||
Sr. Unsec’d. Notes, EMTN | 1.750 | 04/17/28 | EUR | 800 | 940,198 | |||||||||||
Sr. Unsec’d. Notes, EMTN | 5.625 | 03/19/2114 | GBP | 340 | 486,663 | |||||||||||
Sr. Unsec’d. Notes, GMTN | 1.625 | 03/06/24 | EUR | 8,870 | 10,425,730 | |||||||||||
Sr. Unsec’d. Notes, GMTN | 6.750 | 02/06/24 | GBP | 6,621 | 10,313,256 | |||||||||||
Sr. Unsec’d. Notes, MTN | 7.500 | 04/08/33 | 875 | 1,234,323 | ||||||||||||
Sr. Unsec’d. Notes, Series 25 | 0.600 | 04/20/23 | JPY | 100,000 | 925,788 | |||||||||||
|
| |||||||||||||||
| 33,696,785 | ||||||||||||||||
Montenegro 0.1% | ||||||||||||||||
Montenegro Government International Bond, | ||||||||||||||||
Sr. Unsec’d. Notes | 3.875 | 03/18/20 | EUR | 500 | 564,053 | |||||||||||
Sr. Unsec’d. Notes, 144A | 3.375 | 04/21/25 | EUR | 750 | 892,937 | |||||||||||
|
| |||||||||||||||
| 1,456,990 | ||||||||||||||||
New Zealand 0.2% | ||||||||||||||||
Auckland Council, | ||||||||||||||||
Sr. Sec’d. Notes | 2.900 | 09/16/27 | AUD | 1,000 | 744,801 | |||||||||||
Sr. Sec’d. Notes | 3.500 | 03/09/26 | AUD | 2,000 | 1,525,290 | |||||||||||
New Zealand Government Bond, | 4.500 | 04/15/27 | NZD | 1,500 | 1,188,403 | |||||||||||
New Zealand Local Government Funding Agency Bond, | ||||||||||||||||
Gov’t. Gtd. Notes | 2.750 | 04/15/25 | NZD | 1,800 | 1,224,127 | |||||||||||
Gov’t. Gtd. Notes | 3.500 | 04/14/33 | NZD | 500 | 364,678 | |||||||||||
Gov’t. Gtd. Notes | 4.500 | 04/15/27 | NZD | 1,800 | 1,372,575 | |||||||||||
|
| |||||||||||||||
| 6,419,874 | ||||||||||||||||
North Macedonia 0.2% | ||||||||||||||||
North Macedonia Government International Bond, | ||||||||||||||||
Sr. Unsec’d. Notes | 3.975 | 07/24/21 | EUR | 2,000 | 2,359,399 | |||||||||||
Sr. Unsec’d. Notes | 5.625 | 07/26/23 | EUR | 1,000 | 1,307,689 | |||||||||||
Sr. Unsec’d. Notes, 144A | 3.975 | 07/24/21 | EUR | 500 | 589,850 | |||||||||||
|
| |||||||||||||||
| 4,256,938 | ||||||||||||||||
See Notes to Financial Statements.
| 54 |
| Description | Interest Rate | Maturity Date | Principal Amount (000)# | Value | ||||||||||||
SOVEREIGN BONDS (Continued) | ||||||||||||||||
Norway 0.1% | ||||||||||||||||
City of Oslo, | ||||||||||||||||
Sr. Unsec’d. Notes | 3.600 | % | 12/06/22 | NOK | 1,000 | $ | 113,877 | |||||||||
Sr. Unsec’d. Notes | 3.650 | 11/08/23 | NOK | 9,000 | 1,038,418 | |||||||||||
Sr. Unsec’d. Notes | 4.900 | 11/04/19 | NOK | 5,000 | 543,706 | |||||||||||
City of Oslo Norway, | 2.300 | 12/01/27 | NOK | 3,000 | 328,960 | |||||||||||
|
| |||||||||||||||
| 2,024,961 | ||||||||||||||||
Panama 0.4% | ||||||||||||||||
Panama Government International Bond, | ||||||||||||||||
Sr. Unsec’d. Notes | 4.000 | 09/22/24 | 400 | 428,000 | ||||||||||||
Sr. Unsec’d. Notes | 8.125 | 04/28/34 | 3,799 | 5,522,834 | ||||||||||||
Sr. Unsec’d. Notes | 9.375 | 01/16/23 | 1,553 | 1,898,558 | ||||||||||||
Sr. Unsec’d. Notes | 9.375 | 04/01/29 | 800 | 1,222,008 | ||||||||||||
Sr. Unsec’d. Notes | 10.750 | 05/15/20 | 275 | 287,312 | ||||||||||||
|
| |||||||||||||||
| 9,358,712 | ||||||||||||||||
Peru 0.9% | ||||||||||||||||
Peruvian Government International Bond, | ||||||||||||||||
Sr. Unsec’d. Notes | 2.750 | 01/30/26 | EUR | 9,087 | 11,654,941 | |||||||||||
Sr. Unsec’d. Notes | 3.750 | 03/01/30 | EUR | 8,375 | 12,120,224 | |||||||||||
|
| |||||||||||||||
| 23,775,165 | ||||||||||||||||
Philippines 0.3% | ||||||||||||||||
Philippine Government International Bond, | ||||||||||||||||
Sr. Unsec’d. Notes, EMTN | 0.875 | 05/17/27 | EUR | 1,000 | 1,145,971 | |||||||||||
Sr. Unsec’d. Notes, Series 15 | 0.590 | 08/15/29 | JPY | 100,000 | 920,449 | |||||||||||
Unsec’d. Notes | 3.580 | 05/20/22 | CNH | 40,000 | 5,665,011 | |||||||||||
|
| |||||||||||||||
| 7,731,431 | ||||||||||||||||
Portugal 2.8% | ||||||||||||||||
Metropolitano de Lisboa EPE, | 4.799 | 12/07/27 | EUR | 2,150 | 3,234,242 | |||||||||||
Parpublica-Participacoes Publicas SGPS SA, | 3.750 | 07/05/21 | EUR | 1,500 | 1,777,824 | |||||||||||
Portugal Government International Bond, | ||||||||||||||||
Sr. Unsec’d. Notes | 4.090 | 06/03/22 | CNH | 70,800 | 10,036,155 | |||||||||||
Sr. Unsec’d. Notes, EMTN | 5.125 | 10/15/24 | 4,971 | 5,648,482 | ||||||||||||
See Notes to Financial Statements.
| PGIM Global Total Return Fund | 55 |
Schedule of Investments(continued)
as of October 31, 2019
| Description | Interest Rate | Maturity Date | Principal Amount (000)# | Value | ||||||||||||
SOVEREIGN BONDS (Continued) | ||||||||||||||||
Portugal (cont’d.) | ||||||||||||||||
Portugal Obrigacoes do Tesouro OT, | ||||||||||||||||
Sr. Unsec’d. Notes, 144A | 3.875 | % | 02/15/30 | EUR | 27,065 | $ | 41,359,819 | |||||||||
Sr. Unsec’d. Notes, 144A | 4.100 | 04/15/37 | EUR | 6,500 | 11,234,502 | |||||||||||
|
| |||||||||||||||
| 73,291,024 | ||||||||||||||||
Qatar 0.1% | ||||||||||||||||
Qatar Government International Bond, | ||||||||||||||||
Sr. Unsec’d. Notes, 144A | 3.875 | 04/23/23 | 1,040 | 1,096,975 | ||||||||||||
Sr. Unsec’d. Notes, 144A | 4.500 | 04/23/28 | 2,000 | 2,285,160 | ||||||||||||
|
| |||||||||||||||
| 3,382,135 | ||||||||||||||||
Romania 0.7% | ||||||||||||||||
Romanian Government International Bond, | ||||||||||||||||
Sr. Unsec’d. Notes, 144A, MTN | 2.500 | 02/08/30 | EUR | 4,150 | 5,069,359 | |||||||||||
Sr. Unsec’d. Notes, EMTN | 2.375 | 04/19/27 | EUR | 1,000 | 1,236,589 | |||||||||||
Sr. Unsec’d. Notes, EMTN | 3.875 | 10/29/35 | EUR | 1,000 | 1,328,057 | |||||||||||
Sr. Unsec’d. Notes, EMTN | 4.125 | 03/11/39 | EUR | 1,000 | 1,344,048 | |||||||||||
Sr. Unsec’d. Notes, EMTN | 4.375 | 08/22/23 | 1,000 | 1,068,260 | ||||||||||||
Sr. Unsec’d. Notes, EMTN | 6.750 | 02/07/22 | 300 | 329,284 | ||||||||||||
Unsec’d. Notes, 144A, MTN | 2.124 | 07/16/31 | EUR | 3,600 | 4,155,608 | |||||||||||
Unsec’d. Notes, 144A, MTN | 2.875 | 05/26/28 | EUR | 1,100 | 1,395,274 | |||||||||||
Unsec’d. Notes, EMTN | 2.124 | 07/16/31 | EUR | 2,000 | 2,308,671 | |||||||||||
Unsec’d. Notes, MTN | 2.875 | 05/26/28 | EUR | 700 | 887,901 | |||||||||||
|
| |||||||||||||||
| 19,123,051 | ||||||||||||||||
Russia 0.4% | ||||||||||||||||
Russian Federal Bond - OFZ, | 6.900 | 05/23/29 | RUB | 61,000 | 986,607 | |||||||||||
Russian Foreign Bond - Eurobond, | ||||||||||||||||
Sr. Unsec’d. Notes | 2.875 | 12/04/25 | EUR | 7,900 | 9,933,463 | |||||||||||
Sr. Unsec’d. Notes | 4.500 | 04/04/22 | 400 | 420,802 | ||||||||||||
|
| |||||||||||||||
| 11,340,872 | ||||||||||||||||
Saudi Arabia 0.6% | ||||||||||||||||
KSA Sukuk Ltd., | 2.894 | 04/20/22 | 1,000 | 1,015,000 | ||||||||||||
Saudi Government International Bond, | ||||||||||||||||
Sr. Unsec’d. Notes, 144A | 2.000 | 07/09/39 | EUR | 5,945 | 6,995,134 | |||||||||||
Sr. Unsec’d. Notes, 144A, MTN | 2.375 | 10/26/21 | 1,200 | 1,202,100 | ||||||||||||
See Notes to Financial Statements.
| 56 |
| Description | Interest Rate | Maturity Date | Principal Amount (000)# | Value | ||||||||||||
SOVEREIGN BONDS (Continued) | ||||||||||||||||
Saudi Arabia (cont’d.) | ||||||||||||||||
Saudi Government International Bond, (cont’d.) | ||||||||||||||||
Sr. Unsec’d. Notes, 144A, MTN | 2.875 | % | 03/04/23 | 3,335 | $ | 3,403,968 | ||||||||||
Sr. Unsec’d. Notes, 144A, MTN | 4.000 | 04/17/25 | 1,135 | 1,219,024 | ||||||||||||
Sr. Unsec’d. Notes, EMTN | 2.875 | 03/04/23 | 1,300 | 1,326,884 | ||||||||||||
|
| |||||||||||||||
| 15,162,110 | ||||||||||||||||
Senegal 0.1% | ||||||||||||||||
Senegal Government International Bond, | 4.750 | 03/13/28 | EUR | 1,395 | 1,608,664 | |||||||||||
Serbia 0.6% | ||||||||||||||||
Serbia International Bond, | ||||||||||||||||
Sr. Unsec’d. Notes | 7.250 | 09/28/21 | 8,690 | 9,480,790 | ||||||||||||
Sr. Unsec’d. Notes, 144A | 1.500 | 06/26/29 | EUR | 6,600 | 7,572,976 | |||||||||||
Sr. Unsec’d. Notes, 144A | 7.250 | 09/28/21 | 200 | 218,200 | ||||||||||||
|
| |||||||||||||||
| 17,271,966 | ||||||||||||||||
Slovenia 0.3% | ||||||||||||||||
Slovenia Government International Bond, | 5.250 | 02/18/24 | 7,922 | 8,964,995 | ||||||||||||
South Africa 0.3% | ||||||||||||||||
Republic of South Africa Government Bond, | ||||||||||||||||
Sr. Unsec’d. Notes, Series R186 | 10.500 | 12/21/26 | ZAR | 5,000 | 362,993 | |||||||||||
Sr. Unsec’d. Notes, Series R213 | 7.000 | 02/28/31 | ZAR | 1,800 | 99,301 | |||||||||||
Republic of South Africa Government International | ||||||||||||||||
Bond, | ||||||||||||||||
Sr. Unsec’d. Notes(a) | 3.750 | 07/24/26 | EUR | 5,415 | 6,654,638 | |||||||||||
Sr. Unsec’d. Notes, EMTN | 3.800 | 09/07/21 | JPY | 100,000 | 964,200 | |||||||||||
ZAR Sovereign Capital Fund Pty Ltd., | 3.903 | 06/24/20 | 1,000 | 1,003,360 | ||||||||||||
|
| |||||||||||||||
| 9,084,492 | ||||||||||||||||
South Korea 0.2% | ||||||||||||||||
Export-Import Bank of Korea, | ||||||||||||||||
Sr. Unsec’d. Notes, 144A, MTN | 8.000 | 05/15/24 | IDR | 6,800,000 | 503,659 | |||||||||||
Sr. Unsec’d. Notes, EMTN | 7.250 | 12/07/24 | IDR | 10,000,000 | 712,502 | |||||||||||
Sr. Unsec’d. Notes, MTN | 2.711 | 12/05/19 | CAD | 200 | 151,911 | |||||||||||
Sr. Unsec’d. Notes, MTN | 3.500 | 07/28/21 | NZD | 2,000 | 1,319,728 | |||||||||||
See Notes to Financial Statements.
| PGIM Global Total Return Fund | 57 |
Schedule of Investments(continued)
as of October 31, 2019
| Description | Interest Rate | Maturity Date | Principal Amount (000)# | Value | ||||||||||||
SOVEREIGN BONDS (Continued) | ||||||||||||||||
South Korea (cont’d.) | ||||||||||||||||
Korea International Bond, | ||||||||||||||||
Sr. Unsec’d. Notes | 2.125 | % | 06/10/24 | EUR | 1,100 | $ | 1,344,311 | |||||||||
Sr. Unsec’d. Notes | 4.250 | 12/07/21 | EUR | 1,700 | 2,074,614 | |||||||||||
|
| |||||||||||||||
| 6,106,725 | ||||||||||||||||
Spain 3.6% | ||||||||||||||||
Autonomous Community of Catalonia, | ||||||||||||||||
Sr. Unsec’d. Notes | 4.950 | 02/11/20 | EUR | 2,000 | 2,257,827 | |||||||||||
Sr. Unsec’d. Notes, EMTN | 4.900 | 09/15/21 | EUR | 600 | 722,719 | |||||||||||
Sr. Unsec’d. Notes, EMTN, EURIBOR ICE SWAP 11:00 Fft 10Y Index + 0.000% (Cap 12.000%, Floor 5.480%)^ | 5.480 | (c) | 05/11/29 | EUR | 1,000 | 1,445,886 | ||||||||||
Sr. Unsec’d. Notes, EMTN | 5.900 | 05/28/30 | EUR | 3,000 | 4,489,621 | |||||||||||
Instituto de Credito Oficial, | ||||||||||||||||
Gov’t. Gtd. Notes, EMTN | 3.250 | 06/28/24 | CHF | 1,300 | 1,524,262 | |||||||||||
Gov’t. Gtd. Notes, EMTN | 5.000 | 03/31/20 | CAD | 1,800 | 1,382,546 | |||||||||||
Gov’t. Gtd. Notes, GMTN | 0.963 | 09/22/22 | SEK | 32,000 | 3,358,149 | |||||||||||
Spain Government Bond, | ||||||||||||||||
Bonds, 144A(k) | 5.150 | 10/31/28 | EUR | 8,120 | 13,078,618 | |||||||||||
Sr. Unsec’d. Notes, 144A(k) | 1.400 | 04/30/28 | EUR | 6,410 | 7,922,431 | |||||||||||
Sr. Unsec’d. Notes, 144A(k) | 1.400 | 07/30/28 | EUR | 2,000 | 2,472,598 | |||||||||||
Sr. Unsec’d. Notes, 144A(k) | 1.450 | 10/31/27 | EUR | 5,170 | 6,390,916 | |||||||||||
Sr. Unsec’d. Notes, 144A | 1.850 | 07/30/35 | EUR | 14,525 | 19,087,173 | |||||||||||
Sr. Unsec’d. Notes, 144A(k) | 1.950 | 07/30/30 | EUR | 1,300 | 1,701,997 | |||||||||||
Sr. Unsec’d. Notes, 144A | 3.450 | 07/30/66 | EUR | 4,200 | 7,800,558 | |||||||||||
Unsec’d. Notes, 144A | 1.300 | 10/31/26 | EUR | 565 | 687,002 | |||||||||||
Spain Government International Bond, | ||||||||||||||||
Sr. Unsec’d. Notes, EMTN | 5.010 | 11/21/44 | 1,500 | 1,726,933 | ||||||||||||
Sr. Unsec’d. Notes, EMTN | 5.250 | 04/06/29 | GBP | 11,424 | 19,107,782 | |||||||||||
|
| |||||||||||||||
| 95,157,018 | ||||||||||||||||
Sweden 0.1% | ||||||||||||||||
Kommuninvest I Sverige AB, | ||||||||||||||||
Gov’t. Gtd. Notes, EMTN | 0.625 | 11/13/23 | SEK | 15,000 | 1,578,028 | |||||||||||
Gov’t. Gtd. Notes, EMTN | 1.500 | 05/12/25 | SEK | 7,000 | 770,785 | |||||||||||
Gov’t. Gtd. Notes, MTN | 4.750 | 08/17/22 | AUD | 200 | 150,030 | |||||||||||
Svensk Exportkredit AB, | ||||||||||||||||
Sr. Unsec’d. Notes, EMTN | 4.200 | 12/16/20 | AUD | 700 | 499,046 | |||||||||||
Sr. Unsec’d. Notes, EMTN | 8.904 | (s) | 06/25/27 | ZAR | 1,400 | 47,495 | ||||||||||
|
| |||||||||||||||
| 3,045,384 | ||||||||||||||||
See Notes to Financial Statements.
| 58 |
| Description | Interest Rate | Maturity Date | Principal Amount (000)# | Value | ||||||||||||
SOVEREIGN BONDS (Continued) | ||||||||||||||||
Thailand 0.1% | ||||||||||||||||
Thailand Government Bond, | 3.650 | % | 06/20/31 | THB | 45,000 | $ | 1,813,551 | |||||||||
Turkey 0.6% | ||||||||||||||||
Turkey Government International Bond, | ||||||||||||||||
Sr. Unsec’d. Notes | 4.625 | 03/31/25 | EUR | 5,000 | 5,743,795 | |||||||||||
Sr. Unsec’d. Notes | 5.200 | 02/16/26 | EUR | 3,530 | 4,126,773 | |||||||||||
Sr. Unsec’d. Notes | 5.750 | 03/22/24 | 1,000 | 1,007,464 | ||||||||||||
Sr. Unsec’d. Notes | 7.000 | 06/05/20 | 2,000 | 2,040,120 | ||||||||||||
Sr. Unsec’d. Notes | 7.500 | 11/07/19 | 510 | 510,000 | ||||||||||||
Sr. Unsec’d. Notes, EMTN | 3.250 | 06/14/25 | EUR | 3,550 | 3,840,535 | |||||||||||
|
| |||||||||||||||
| 17,268,687 | ||||||||||||||||
Ukraine 0.8% | ||||||||||||||||
Ukraine Government International Bond, | ||||||||||||||||
Sr. Unsec’d. Notes | 6.750 | 06/20/26 | EUR | 11,100 | 13,673,274 | |||||||||||
Sr. Unsec’d. Notes | 7.375 | 09/25/32 | 3,600 | 3,765,593 | ||||||||||||
Sr. Unsec’d. Notes | 7.750 | 09/01/24 | 1,875 | 2,008,594 | ||||||||||||
Sr. Unsec’d. Notes | 7.750 | 09/01/25 | 400 | 429,000 | ||||||||||||
Sr. Unsec’d. Notes | 7.750 | 09/01/26 | 500 | 536,875 | ||||||||||||
|
| |||||||||||||||
| 20,413,336 | ||||||||||||||||
United Arab Emirates 0.6% | ||||||||||||||||
Abu Dhabi Government International Bond, | ||||||||||||||||
Sr. Unsec’d. Notes | 2.500 | 10/11/22 | 498 | 503,129 | ||||||||||||
Sr. Unsec’d. Notes, 144A | 2.500 | 10/11/22 | 2,365 | 2,389,360 | ||||||||||||
Dubai DOF Sukuk Ltd., | 6.450 | 05/02/22 | 6,423 | 7,002,676 | ||||||||||||
RAK Capital, | 3.094 | 03/31/25 | 1,400 | 1,409,464 | ||||||||||||
Sharjah Sukuk Ltd., | 3.764 | 09/17/24 | 3,800 | 3,986,291 | ||||||||||||
Sharjah Sukuk Program Ltd., | 4.226 | 03/14/28 | 1,200 | 1,297,884 | ||||||||||||
|
| |||||||||||||||
| 16,588,804 | ||||||||||||||||
United Kingdom 0.7% | ||||||||||||||||
United Kingdom Gilt, | ||||||||||||||||
Bonds | 1.625 | 10/22/28 | GBP | 1,400 | 1,986,265 | |||||||||||
Bonds(k) | 3.250 | 01/22/44 | GBP | 100 | 187,797 | |||||||||||
See Notes to Financial Statements.
| PGIM Global Total Return Fund | 59 |
Schedule of Investments(continued)
as of October 31, 2019
| Description | Interest Rate | Maturity Date | Principal Amount (000)# | Value | ||||||||||||
SOVEREIGN BONDS (Continued) | ||||||||||||||||
United Kingdom (cont’d.) | ||||||||||||||||
United Kingdom Gilt, (cont’d.) | ||||||||||||||||
Bonds(k) | 3.500 | % | 01/22/45 | GBP | 2,310 | $ | 4,549,819 | |||||||||
Bonds(k) | 4.250 | 03/07/36 | GBP | 6,140 | 11,939,717 | |||||||||||
Bonds(k) | 4.250 | 09/07/39 | GBP | 180 | 367,576 | |||||||||||
|
| |||||||||||||||
| 19,031,174 | ||||||||||||||||
Uruguay 0.1% | ||||||||||||||||
Uruguay Government International Bond, | ||||||||||||||||
Sr. Unsec’d. Notes | 4.375 | 10/27/27 | 394 | 434,471 | ||||||||||||
Sr. Unsec’d. Notes | 4.375 | 01/23/31 | 625 | 696,692 | ||||||||||||
Sr. Unsec’d. Notes(a) | 6.875 | 09/28/25 | 2,202 | 2,631,412 | ||||||||||||
|
| |||||||||||||||
| 3,762,575 | ||||||||||||||||
|
| |||||||||||||||
TOTAL SOVEREIGN BONDS | 980,483,141 | |||||||||||||||
|
| |||||||||||||||
U.S. GOVERNMENT AGENCY OBLIGATIONS 0.2% | ||||||||||||||||
Federal National Mortgage Assoc. | 5.375 | 12/07/28 | GBP | 1,007 | 1,773,108 | |||||||||||
Tennessee Valley Authority | ||||||||||||||||
Sr. Unsec’d. Notes | 5.350 | 06/07/21 | GBP | 1,217 | 1,677,912 | |||||||||||
Sr. Unsec’d. Notes | 5.625 | 06/07/32 | GBP | 1,391 | 2,650,121 | |||||||||||
|
| |||||||||||||||
TOTAL U.S. GOVERNMENT AGENCY OBLIGATIONS | 6,101,141 | |||||||||||||||
|
| |||||||||||||||
U.S. TREASURY OBLIGATIONS 0.1% | ||||||||||||||||
U.S. Treasury Notes(h)(k) | 2.125 | 05/15/25 | 750 | 772,061 | ||||||||||||
U.S. Treasury Notes(h) | 2.625 | 08/31/20 | 4 | 4,032 | ||||||||||||
U.S. Treasury Strips Coupon(h) | 1.881 | (s) | 05/15/31 | 400 | 321,985 | |||||||||||
U.S. Treasury Strips Coupon(h) | 1.898 | (s) | 08/15/29 | 400 | 335,224 | |||||||||||
U.S. Treasury Strips Coupon(h) | 2.100 | (s) | 11/15/35 | 800 | 574,144 | |||||||||||
U.S. Treasury Strips Coupon(h)(k) | 2.264 | (s) | 08/15/40 | 800 | 504,384 | |||||||||||
|
| |||||||||||||||
TOTAL U.S. TREASURY OBLIGATIONS | 2,511,830 | |||||||||||||||
|
| |||||||||||||||
See Notes to Financial Statements.
| 60 |
| Description | Shares | Value | ||||||||||||||
COMMON STOCK 0.0% | ||||||||||||||||
Colombia | ||||||||||||||||
Frontera Energy Corp. | 2,232 | $ | 17,789 | |||||||||||||
|
| |||||||||||||||
PREFERRED STOCK 0.0% | ||||||||||||||||
United States | ||||||||||||||||
Citigroup Capital XIII, 8.306% | 4,000 | 109,160 | ||||||||||||||
|
| |||||||||||||||
TOTAL LONG-TERM INVESTMENTS | 2,590,757,490 | |||||||||||||||
|
| |||||||||||||||
SHORT-TERM INVESTMENTS 7.7% | ||||||||||||||||
AFFILIATED MUTUAL FUNDS 4.3% | ||||||||||||||||
PGIM Core Ultra Short Bond Fund(w) | 35,146,324 | 35,146,324 | ||||||||||||||
PGIM Institutional Money Market Fund | 78,407,357 | 78,423,038 | ||||||||||||||
|
| |||||||||||||||
TOTAL AFFILIATED MUTUAL FUNDS | 113,569,362 | |||||||||||||||
|
| |||||||||||||||
OPTIONS PURCHASED*~ 3.4% | 90,696,665 | |||||||||||||||
|
| |||||||||||||||
TOTAL SHORT-TERM INVESTMENTS | 204,266,027 | |||||||||||||||
|
| |||||||||||||||
TOTAL INVESTMENTS, BEFORE OPTIONS WRITTEN 105.4% | 2,795,023,517 | |||||||||||||||
|
| |||||||||||||||
OPTIONS WRITTEN*~ (2.8)% | (74,312,430 | ) | ||||||||||||||
|
| |||||||||||||||
TOTAL INVESTMENTS, NET OF OPTIONS WRITTEN 102.6% | 2,720,711,087 | |||||||||||||||
Liabilities in excess of other assets(z) (2.6)% | (69,477,077 | ) | ||||||||||||||
|
| |||||||||||||||
NET ASSETS 100.0% | $ | 2,651,234,010 | ||||||||||||||
|
| |||||||||||||||
Below is a list of the abbreviation(s) used in the annual report:
AED—United Arab Emirates Dirham
AUD—Australian Dollar
BRL—Brazilian Real
See Notes to Financial Statements.
| PGIM Global Total Return Fund | 61 |
Schedule of Investments(continued)
as of October 31, 2019
CAD—Canadian Dollar
CHF—Swiss Franc
CLP—Chilean Peso
CNH—Chinese Renminbi
COP—Colombian Peso
CZK—Czech Koruna
DKK—Danish Krone
EGP—Egyptian Pound
EUR—Euro
GBP—British Pound
HKD—Hong Kong Dollar
HUF—Hungarian Forint
IDR—Indonesian Rupiah
ILS—Israeli Shekel
INR—Indian Rupee
JPY—Japanese Yen
KRW—South Korean Won
MXN—Mexican Peso
MYR—Malaysian Ringgit
NOK—Norwegian Krone
NZD—New Zealand Dollar
PEN—Peruvian Nuevo Sol
PHP—Philippine Peso
PLN—Polish Zloty
RUB—Russian Ruble
SAR—Saudi Arabian Riyal
SEK—Swedish Krona
SGD—Singapore Dollar
THB—Thai Baht
TRY—Turkish Lira
TWD—New Taiwanese Dollar
USD—US Dollar
ZAR—South African Rand
144A—Security was purchased pursuant to Rule 144A under the Securities Act of 1933 and, pursuant to the requirements of Rule 144A, may not be resold except to qualified institutional buyers.
A—Annual payment frequency for swaps
ABS—Asset-Backed Security
BBR—New Zealand Bank Bill Rate
BBSW—Australian Bank Bill Swap Reference Rate
BIBOR—Bangkok Interbank Offered Rate
BROIS—Brazil Overnight Index Swap
BUBOR—Budapest Interbank Offered Rate
CIBOR—Copenhagen Interbank Offered Rate
CLO—Collateralized Loan Obligation
CLOIS—Sinacofi Chile Interbank Rate Average
CMS—Constant Maturity Swap
COOIS—Colombia Overnight Interbank Reference Rate
CPI—Consumer Price Index
EIBOR—Emirates Interbank Offered Rate
EMTN—Euro Medium Term Note
EONIA—Euro Overnight Index Average
EURIBOR—Euro Interbank Offered Rate
See Notes to Financial Statements.
| 62 |
GMAC—General Motors Acceptance Corporation
GMTN—Global Medium Term Note
HIBOR—Hong Kong Interbank Offered Rate
HICP—Harmonised Index of Consumer Prices
ICE—Intercontinental Exchange
IO—Interest Only (Principal amount represents notional)
JIBAR—Johannesburg Interbank Agreed Rate
KLIBOR—Kuala Lumpur Interbank Offered Rate
KWCDC—Korean Won Certificate of Deposit
LIBOR—London Interbank Offered Rate
M—Monthly payment frequency for swaps
MTN—Medium Term Note
NIBOR—Norwegian Interbank Offered Rate
OFZ—Obligatsyi Federal’novo Zaima (Federal Loan Obligations)
OTC—Over-the-counter
PIK—Payment-in-Kind
PJSC—Public Joint-Stock Company
PRIBOR—Prague Interbank Offered Rate
Q—Quarterly payment frequency for swaps
S—Semiannual payment frequency for swaps
SIBOR—Singapore Interbank Offered Rate
SONIA—Sterling Overnight Index Average
STIBOR—Stockholm Interbank Offered Rate
Strips—Separate Trading of Registered Interest and Principal of Securities
T—Swap payment upon termination
TAIBOR—Taiwan Interbank Offered Rate
TELBOR—Tel Aviv Interbank Offered Rate
USOIS—United States Overnight Index Swap
WIBOR—Warsaw Interbank Offered Rate
| * | Non-income producing security. |
| # | Principal or notional amount is shown in U.S. dollars unless otherwise stated. |
| ~ | See tables subsequent to the Schedule of Investments for options detail. |
| ^ | Indicates a Level 3 security. The aggregate value of Level 3 securities is $36,463,742 and 1.4% of net assets. |
| (a) | All or a portion of security is on loan. The aggregate market value of such securities, including those sold and pending settlement, is $75,921,590; cash collateral of $78,288,204 (included in liabilities) was received with which the Fund purchased highly liquid short-term investments. |
| (b) | Represents security purchased with cash collateral received for securities on loan and includes dividend reinvestment. |
| (c) | Variable rate instrument. The interest rate shown reflects the rate in effect at October 31, 2019. |
| (cc) | Variable rate instrument. The rate shown is based on the latest available information as of October 31, 2019. Certain variable rate securities are not based on a published reference rate and spread but are determined by the issuer or agent and are based on current market conditions. These securities do not indicate a reference rate and spread in their description. |
| (d) | Represents issuer in default on interest payments and/or principal repayment. Non-income producing security. Such securities may be post-maturity. |
| (ff) | Variable rate security. Security may be issued at a fixed coupon rate, which converts to a variable rate at a specified date. Rate shown is the rate in effect as of period end. |
| (h) | Represents security, or a portion thereof, segregated as collateral for OTC derivatives. |
| (k) | Represents security, or a portion thereof, segregated as collateral for centrally cleared/exchange-traded derivatives. |
| (p) | Interest rate not available as of October 31, 2019. |
| (rr) | Perpetual security with no stated maturity date. |
| (s) | Represents zero coupon bond or principal only security. Rate represents yield to maturity at purchase date. |
See Notes to Financial Statements.
| PGIM Global Total Return Fund | 63 |
Schedule of Investments(continued)
as of October 31, 2019
| (w) | PGIM Investments LLC, the manager of the Fund, also serves as manager of the PGIM Core Ultra Short Bond Fund and PGIM Institutional Money Market Fund. |
| (z) | Includes net unrealized appreciation/(depreciation) and/or market value of the below holdings which are excluded from the Schedule of Investments: |
Options Purchased:
OTC Traded
Description | Call/ Put | Counterparty | Expiration Date | Strike | Contracts | Notional Amount (000)# | Value | |||||||||||||||||||||
2-Year 10 CMS Curve CAP | Call | Barclays Bank PLC | 11/21/19 | 0.12 | % | — | 7,600 | $ | 2,896 | |||||||||||||||||||
2- Year 10 CMS Curve CAP | Call | Morgan Stanley & Co. International PLC | 11/21/19 | 0.13 | % | — | 5,000 | 1,231 | ||||||||||||||||||||
2- Year 10 CMS Curve CAP | Call | Barclays Bank PLC | 07/12/21 | 0.11 | % | — | 4,495 | 50,335 | ||||||||||||||||||||
2- Year 10 CMS Curve CAP | Call | Bank of America, N.A. | 08/16/21 | 0.15 | % | — | 10,926 | 114,518 | ||||||||||||||||||||
2- Year 10 CMS Curve CAP | Call | Bank of America, N.A. | 08/20/21 | 0.15 | % | — | 21,689 | 234,635 | ||||||||||||||||||||
2- Year 10 CMS Curve CAP | Call | Bank of America, N.A. | 09/13/21 | 0.14 | % | — | 22,000 | 249,514 | ||||||||||||||||||||
2- Year 10 CMS Curve CAP | Call | Barclays Bank PLC | 11/09/21 | 0.21 | % | — | 4,370 | 45,769 | ||||||||||||||||||||
Currency Option AUD vs JPY | Call | Deutsche Bank AG | 11/25/20 | 92.00 | — | AUD | 30,400 | 9,624 | ||||||||||||||||||||
Currency Option EUR vs GBP | Call | Morgan Stanley & Co. International PLC | 01/20/20 | 1.00 | — | EUR | 66,400 | 20,648 | ||||||||||||||||||||
Currency Option EUR vs TRY | Call | BNP Paribas S.A. | 04/28/20 | 10.00 | — | EUR | 35,500 | 99,010 | ||||||||||||||||||||
Currency Option EUR vs TRY | Call | Morgan Stanley & Co. International PLC | 07/28/20 | 12.00 | — | EUR | 35,500 | 138,117 | ||||||||||||||||||||
Currency Option EUR vs ZAR | Call | Deutsche Bank AG | 11/25/19 | 27.00 | — | EUR | 14,000 | 1 | ||||||||||||||||||||
Currency Option EUR vs ZAR | Call | Morgan Stanley & Co. International PLC | 12/24/19 | 24.00 | — | EUR | 14,750 | 262 | ||||||||||||||||||||
Currency Option EUR vs ZAR | Call | Goldman Sachs International | 08/27/20 | 28.00 | — | EUR | 34,500 | |||||||||||||||||||||
| 64,611 | ||||||||||||||||||||||||||||
Currency Option EUR vs ZAR | Call | Goldman Sachs International | 12/21/20 | 21.00 | — | EUR | 35,000 | 955,392 | ||||||||||||||||||||
Currency Option EUR vs ZAR | Call | Morgan Stanley & Co. International PLC | 12/21/20 | 25.00 | — | EUR | 70,000 | 630,393 | ||||||||||||||||||||
Currency Option USD vs BRL | Call | Citibank, N.A. | 12/19/19 | 6.00 | — | 56,000 | 87 | |||||||||||||||||||||
Currency Option USD vs BRL | Call | Deutsche Bank AG | 12/20/19 | 5.00 | — | 32,500 | 1,887 | |||||||||||||||||||||
Currency Option USD vs BRL | Call | Deutsche Bank AG | 03/27/20 | 4.65 | — | 33,000 | 141,122 | |||||||||||||||||||||
See Notes to Financial Statements.
| 64 |
Options Purchased (continued):
OTC Traded
Description | Call/ Put | Counterparty | Expiration Date | Strike | Contracts | Notional Amount (000)# | Value | |||||||||||||||||||||
Currency Option USD vs BRL | Call | Morgan Stanley & Co. International PLC | 07/27/20 | 6.50 | — | 80,000 | $ | 50,622 | ||||||||||||||||||||
Currency Option USD vs BRL | Call | Morgan Stanley & Co. International PLC | 08/27/20 | 8.50 | — | 40,000 | 7,384 | |||||||||||||||||||||
Currency Option USD vs BRL | Call | Citibank, N.A. | 12/21/20 | 5.25 | — | 80,000 | 700,765 | |||||||||||||||||||||
Currency Option USD vs BRL | Call | Morgan Stanley & Co. International PLC | 01/27/21 | 4.00 | — | 41,000 | 2,889,202 | |||||||||||||||||||||
Currency Option USD vs BRL | Call | Citibank, N.A. | 01/27/21 | 4.00 | — | 15,000 | 1,057,025 | |||||||||||||||||||||
Currency Option USD vs BRL | Call | Bank of America, N.A. | 09/28/21 | 4.50 | — | 75,000 | 3,640,628 | |||||||||||||||||||||
Currency Option USD vs CHF | Call | Goldman Sachs International | 10/28/20 | 1.00 | — | 40,000 | 336,509 | |||||||||||||||||||||
Currency Option USD vs CHF | Call | Morgan Stanley & Co. International PLC | 10/28/20 | 1.00 | — | 15,500 | 130,397 | |||||||||||||||||||||
Currency Option USD vs ILS | Call | Citibank, N.A. | 02/26/20 | 3.95 | — | 33,000 | 6,777 | |||||||||||||||||||||
Currency Option USD vs ILS | Call | Bank of America, N.A. | 06/28/21 | 3.60 | — | 66,000 | 828,793 | |||||||||||||||||||||
Currency Option USD vs INR | Call | Bank of America, N.A. | 03/31/20 | 88.00 | — | 75,000 | 5,937 | |||||||||||||||||||||
Currency Option USD vs INR | Call | Goldman Sachs International | 10/28/20 | 90.00 | — | 40,000 | 45,813 | |||||||||||||||||||||
Currency Option USD vs INR | Call | Goldman Sachs International | 02/24/21 | 79.00 | — | 56,000 | 793,326 | |||||||||||||||||||||
Currency Option USD vs INR | Call | Bank of America, N.A. | 02/24/21 | 86.00 | — | 112,000 | 507,105 | |||||||||||||||||||||
Currency Option USD vs JPY | Call | Morgan Stanley & Co. International PLC | 01/27/21 | 110.00 | — | 22,000 | 241,862 | |||||||||||||||||||||
Currency Option USD vs JPY | Call | Deutsche Bank AG | 10/27/23 | 115.00 | — | 40,000 | 365,518 | |||||||||||||||||||||
Currency Option USD vs JPY | Call | Barclays Bank PLC | 10/27/23 | 115.00 | — | 72,000 | 657,932 | |||||||||||||||||||||
Currency Option USD vs JPY | Call | Goldman Sachs International | 10/27/23 | 115.00 | — | 112,000 | 1,023,450 | |||||||||||||||||||||
Currency Option USD vs JPY | Call | Bank of America, N.A. | 10/27/23 | 115.00 | — | 76,700 | 700,880 | |||||||||||||||||||||
Currency Option USD vs KRW | Call | Goldman Sachs International | 12/20/19 | 1,200.00 | — | 18,000 | 39,797 | |||||||||||||||||||||
Currency Option USD vs KRW | Call | BNP Paribas S.A. | 12/20/19 | 1,350.00 | — | 36,000 | 521 | |||||||||||||||||||||
See Notes to Financial Statements.
| PGIM Global Total Return Fund | 65 |
Schedule of Investments(continued)
as of October 31, 2019
Options Purchased (continued):
OTC Traded
Description | Call/ Put | Counterparty | Expiration Date | Strike | Contracts | Notional Amount (000)# | Value | |||||||||||||||||||||
Currency Option USD vs KRW | Call | HSBC Bank USA, N.A. | 01/29/20 | 1,500.00 | — | 69,500 | $ | 619 | ||||||||||||||||||||
Currency Option USD vs KRW | Call | Morgan Stanley & Co. International PLC | 02/26/20 | 1,275.00 | — | 69,500 | 72,957 | |||||||||||||||||||||
Currency Option USD vs KRW | Call | BNP Paribas S.A. | 10/28/20 | 1,165.00 | — | 29,750 | 740,680 | |||||||||||||||||||||
Currency Option USD vs KRW | Call | HSBC Bank USA, N.A. | 07/28/21 | 1,275.00 | — | 69,500 | 905,234 | |||||||||||||||||||||
Currency Option USD vs MXN | Call | Morgan Stanley & Co. International PLC | 12/26/19 | 22.00 | — | 16,000 | 4,737 | |||||||||||||||||||||
Currency Option USD vs MXN | Call | Citibank, N.A. | 12/26/19 | 26.00 | — | 32,000 | 328 | |||||||||||||||||||||
Currency Option USD vs MXN | Call | Morgan Stanley & Co. International PLC | 02/26/20 | 30.00 | — | 59,500 | 3,975 | |||||||||||||||||||||
Currency Option USD vs MXN | Call | Deutsche Bank AG | 04/28/20 | 26.00 | — | 55,500 | 40,827 | |||||||||||||||||||||
Currency Option USD vs MXN | Call | Morgan Stanley & Co. International PLC | 10/28/20 | 31.00 | — | 120,000 | 165,209 | |||||||||||||||||||||
Currency Option USD vs MXN | Call | Morgan Stanley & Co. International PLC | 01/27/21 | 22.00 | — | 61,500 | 1,684,012 | |||||||||||||||||||||
Currency Option USD vs MXN | Call | Goldman Sachs International | 01/27/21 | 22.00 | — | 21,750 | 595,565 | |||||||||||||||||||||
Currency Option USD vs MXN | Call | Citibank, N.A. | 01/27/21 | 26.50 | — | 166,500 | 1,168,893 | |||||||||||||||||||||
Currency Option USD vs MXN | Call | Morgan Stanley & Co. International PLC | 04/27/21 | 22.00 | — | 59,500 | 2,107,147 | |||||||||||||||||||||
Currency Option USD vs MXN | Call | Morgan Stanley & Co. International PLC | 04/26/23 | 26.00 | — | 59,500 | 3,809,825 | |||||||||||||||||||||
Currency Option USD vs RUB | Call | Citibank, N.A. | 12/23/19 | 85.00 | — | 18,000 | 279 | |||||||||||||||||||||
Currency Option USD vs RUB | Call | Deutsche Bank AG | 02/27/20 | 82.00 | — | 77,500 | 43,033 | |||||||||||||||||||||
Currency Option USD vs RUB | Call | BNP Paribas S.A. | 03/30/20 | 95.00 | — | 33,000 | 7,582 | |||||||||||||||||||||
Currency Option USD vs RUB | Call | Deutsche Bank AG | 10/29/20 | 68.00 | — | 77,500 | 2,755,131 | |||||||||||||||||||||
Currency Option USD vs RUB | Call | Goldman Sachs International | 12/22/20 | 95.00 | — | 56,000 | 245,943 | |||||||||||||||||||||
Currency Option USD vs RUB | Call | Goldman Sachs International | 04/28/21 | 75.00 | — | 59,500 | 1,680,773 | |||||||||||||||||||||
Currency Option USD vs RUB | Call | Deutsche Bank AG | 04/28/21 | 90.00 | — | 119,000 | 1,166,602 | |||||||||||||||||||||
See Notes to Financial Statements.
| 66 |
Options Purchased (continued):
OTC Traded
Description | Call/ Put | Counterparty | Expiration Date | Strike | Contracts | Notional Amount (000)# | Value | |||||||||||||||||||||
Currency Option USD vs TRY | Call | Goldman Sachs International | 12/23/19 | 6.00 | — | 18,000 | $ | 141,206 | ||||||||||||||||||||
Currency Option USD vs TRY | Call | Goldman Sachs International | 04/03/20 | 15.00 | — | 65,250 | 12,480 | |||||||||||||||||||||
Currency Option USD vs TRY | Call | Morgan Stanley & Co. International PLC | 04/29/20 | 7.00 | — | 41,000 | 426,995 | |||||||||||||||||||||
Currency Option USD vs TRY | Call | Deutsche Bank AG | 10/29/20 | 9.00 | — | 40,000 | 496,819 | |||||||||||||||||||||
Currency Option USD vs TRY | Call | Morgan Stanley & Co. International PLC | 10/29/20 | 9.00 | — | 16,000 | 198,728 | |||||||||||||||||||||
Currency Option USD vs TRY | Call | Goldman Sachs International | 10/29/20 | 12.00 | — | 112,000 | 574,460 | |||||||||||||||||||||
Currency Option USD vs TRY | Call | Morgan Stanley & Co. International PLC | 02/25/21 | 10.00 | — | 56,000 | 902,209 | |||||||||||||||||||||
Currency Option USD vs TRY | Call | Goldman Sachs International | 02/25/21 | 15.00 | — | 112,000 | 672,481 | |||||||||||||||||||||
Currency Option USD vs TRY | Call | Goldman Sachs International | 09/29/21 | 10.00 | — | 65,250 | 2,040,028 | |||||||||||||||||||||
Currency Option USD vs ZAR | Call | Morgan Stanley & Co. International PLC | 11/20/19 | 21.00 | — | 122,000 | 144 | |||||||||||||||||||||
Currency Option USD vs ZAR | Call | Morgan Stanley & Co. International PLC | 12/24/19 | 14.00 | — | 18,000 | 1,443,711 | |||||||||||||||||||||
Currency Option USD vs ZAR | Call | BNP Paribas S.A. | 12/24/19 | 17.00 | — | 36,000 | 69,352 | |||||||||||||||||||||
Currency Option USD vs ZAR | Call | Goldman Sachs International | 07/27/20 | 25.00 | — | 40,000 | 51,065 | |||||||||||||||||||||
Currency Option USD vs ZAR | Call | Goldman Sachs International | 09/28/20 | 17.00 | — | 40,000 | 1,335,447 | |||||||||||||||||||||
Currency Option USD vs ZAR | Call | Morgan Stanley & Co. International PLC | 09/28/20 | 21.00 | — | 14,000 | 102,065 | |||||||||||||||||||||
Currency Option USD vs ZAR | Call | Citibank, N.A. | 09/28/20 | 21.00 | — | 66,000 | 481,164 | |||||||||||||||||||||
Currency Option USD vs ZAR | Call | Goldman Sachs International | 01/27/21 | 15.00 | — | 40,000 | 4,000,280 | |||||||||||||||||||||
Currency Option USD vs ZAR | Call | Morgan Stanley & Co. International PLC | 01/27/21 | 15.00 | — | 16,000 | 1,600,112 | |||||||||||||||||||||
Currency Option USD vs ZAR | Call | Deutsche Bank AG | 01/27/21 | 20.00 | — | 112,000 | 2,073,773 | |||||||||||||||||||||
Currency Option AUD vs JPY | Put | Deutsche Bank AG | 12/10/19 | 54.00 | — | AUD | 356,000 | 376 | ||||||||||||||||||||
Currency Option AUD vs JPY | Put | Deutsche Bank AG | 01/29/20 | 73.00 | — | | AUD | | 220,000 | 1,679,262 | ||||||||||||||||||
See Notes to Financial Statements.
| PGIM Global Total Return Fund | 67 |
Schedule of Investments(continued)
as of October 31, 2019
Options Purchased (continued):
OTC Traded
Description | Call/ Put | Counterparty | Expiration Date | Strike | Contracts | Notional Amount (000)# | Value | |||||||||||||||||||||
Currency Option AUD vs JPY | Put | Morgan Stanley & Co. International PLC | 01/29/20 | 82.00 | — | AUD | 110,000 | $ | 8,091,938 | |||||||||||||||||||
Currency Option AUD vs JPY | Put | Deutsche Bank AG | 02/26/20 | 67.00 | — | AUD | 150,000 | 246,830 | ||||||||||||||||||||
Currency Option AUD vs JPY | Put | BNP Paribas S.A. | 02/26/20 | 76.00 | — | AUD | 75,000 | 1,781,741 | ||||||||||||||||||||
Currency Option AUD vs JPY | Put | Deutsche Bank AG | 12/28/20 | 60.00 | — | AUD | 117,000 | 500,598 | ||||||||||||||||||||
Currency Option AUD vs JPY | Put | Goldman Sachs International | 12/28/20 | 68.00 | — | AUD | 58,500 | 754,903 | ||||||||||||||||||||
Currency Option AUD vs JPY | Put | Morgan Stanley & Co. International PLC | 05/26/21 | 62.00 | — | AUD | 356,000 | 3,135,449 | ||||||||||||||||||||
Currency Option AUD vs JPY | Put | Deutsche Bank AG | 05/26/21 | 70.00 | — | AUD | 356,000 | 8,294,118 | ||||||||||||||||||||
Currency Option AUD vs JPY | Put | Morgan Stanley & Co. International PLC | 07/28/21 | 65.00 | — | AUD | 178,000 | 2,525,426 | ||||||||||||||||||||
Currency Option AUD vs USD | Put | Citibank, N.A. | 01/29/20 | 0.69 | — | AUD | 23,000 | 209,747 | ||||||||||||||||||||
Currency Option EUR vs GBP | Put | Morgan Stanley & Co. International PLC | 10/28/20 | 0.80 | — | EUR | 66,400 | 265,998 | ||||||||||||||||||||
Currency Option EUR vs TRY | Put | Goldman Sachs International | 04/28/20 | 6.00 | — | EUR | 35,500 | 170,042 | ||||||||||||||||||||
Currency Option EUR vs TRY | Put | BNP Paribas S.A. | 07/28/20 | 7.00 | — | EUR | 35,500 | 2,400,186 | ||||||||||||||||||||
Currency Option GBP vs JPY | Put | Bank of America, N.A. | 12/10/19 | 100.00 | — | GBP | 53,100 | 279 | ||||||||||||||||||||
Currency Option GBP vs JPY | Put | Bank of America, N.A. | 09/28/20 | 125.00 | — | GBP | 53,100 | 837,820 | ||||||||||||||||||||
Currency Option GBP vs USD | Put | HSBC Bank USA, N.A. | 11/25/19 | 1.15 | — | GBP | 12,500 | 145 | ||||||||||||||||||||
Currency Option GBP vs USD | Put | Citibank, N.A. | 11/25/19 | 1.30 | — | GBP | 12,500 | 165,747 | ||||||||||||||||||||
Currency Option GBP vs USD | Put | Morgan Stanley & Co. International PLC | 07/27/20 | 1.23 | — | GBP | 53,100 | 821,459 | ||||||||||||||||||||
Currency Option GBP vs USD | Put | Morgan Stanley & Co. International PLC | 09/28/20 | 1.16 | — | GBP | 83,200 | 668,681 | ||||||||||||||||||||
Currency Option GBP vs USD | Put | HSBC Bank USA, N.A. | 09/28/20 | 1.28 | — | GBP | 32,000 | 1,031,745 | ||||||||||||||||||||
Currency Option GBP vs USD | Put | Goldman Sachs International | 09/28/20 | 1.28 | — | GBP | 9,600 | 309,523 | ||||||||||||||||||||
Currency Option USD vs BRL | Put | JPMorgan Chase Bank, N.A. | 03/27/20 | 3.10 | — | 33,000 | 1,541 | |||||||||||||||||||||
See Notes to Financial Statements.
| 68 |
Options Purchased (continued):
OTC Traded
Description | Call/ Put | Counterparty | Expiration Date | Strike | Contracts | Notional Amount (000)# | Value | |||||||||||||||||||||
Currency Option USD vs BRL | Put | Deutsche Bank AG | 06/26/20 | 3.50 | — | 40,000 | $ | 95,152 | ||||||||||||||||||||
Currency Option USD vs BRL | Put | Morgan Stanley & Co. International PLC | 08/27/20 | 3.25 | — | 40,000 | 35,523 | |||||||||||||||||||||
Currency Option USD vs BRL | Put | Deutsche Bank AG | 08/27/20 | 3.50 | — | 40,000 | 142,300 | |||||||||||||||||||||
Currency Option USD vs BRL | Put | Citibank, N.A. | 03/29/21 | 3.75 | — | 119,000 | 2,381,285 | |||||||||||||||||||||
Currency Option USD vs INR | Put | BNP Paribas S.A. | 12/21/20 | 69.00 | — | 20,000 | 69,544 | |||||||||||||||||||||
Currency Option USD vs JPY | Put | Deutsche Bank AG | 11/06/19 | 85.00 | — | 112,000 | — | |||||||||||||||||||||
Currency Option USD vs JPY | Put | Citibank, N.A. | 11/18/19 | 97.50 | — | 71,100 | 390 | |||||||||||||||||||||
Currency Option USD vs JPY | Put | Bank of America, N.A. | 01/30/20 | 92.00 | — | 155,000 | 18,409 | |||||||||||||||||||||
Currency Option USD vs JPY | Put | Citibank, N.A. | 03/27/20 | 105.50 | — | 71,100 | 747,595 | |||||||||||||||||||||
Currency Option USD vs JPY | Put | Bank of America, N.A. | 01/27/21 | 91.00 | — | 112,000 | 517,907 | |||||||||||||||||||||
Currency Option USD vs MXN | Put | Citibank, N.A. | 04/28/20 | 17.00 | — | 55,500 | 23,435 | |||||||||||||||||||||
Currency Option USD vs MXN | Put | Deutsche Bank AG | 10/28/20 | 18.00 | — | 40,000 | 232,019 | |||||||||||||||||||||
Currency Option USD vs RUB | Put | BNP Paribas S.A. | 12/22/20 | 66.00 | — | 56,000 | 1,888,033 | |||||||||||||||||||||
Currency Option USD vs TRY | Put | Goldman Sachs International | 04/29/20 | 4.00 | — | 41,000 | 1,844 | |||||||||||||||||||||
Currency Option USD vs ZAR | Put | BNP Paribas S.A. | 07/27/20 | 12.00 | — | 40,000 | 26,372 | |||||||||||||||||||||
|
| |||||||||||||||||||||||||||
Total OTC Traded(cost $169,154,317) | $ | 90,685,527 | ||||||||||||||||||||||||||
|
| |||||||||||||||||||||||||||
OTC Swaptions
Description | Call/ Put | Counterparty | Expiration Date | Strike | Receive | Pay | Notional Amount (000)# | Value | ||||||||||||||||||
iTraxx.XO.31.V1, 06/20/24 | Put | Citibank, N.A. | 12/18/19 | 4.00 | % | iTraxx.XO.31. V1(Q) | 4.00%(Q) | EUR 20,000 | $ | 11,138 | ||||||||||||||||
|
| |||||||||||||||||||||||||
(cost $44,190) |
| |||||||||||||||||||||||||
Total Options Purchased (cost $169,198,507) |
| $ | 90,696,665 | |||||||||||||||||||||||
|
| |||||||||||||||||||||||||
See Notes to Financial Statements.
| PGIM Global Total Return Fund | 69 |
Schedule of Investments(continued)
as of October 31, 2019
Options Written:
OTC Traded
Description | Call/ Put | Counterparty | Expiration Date | Strike | Contracts | Notional Amount (000)# | Value | |||||||||||||||||||||
Currency Option AUD vs JPY | Call | Morgan Stanley & Co. International PLC | 11/25/20 | 92.00 | — | AUD | 30,400 | $ | (9,624 | ) | ||||||||||||||||||
Currency Option EUR vs GBP | Call | Morgan Stanley & Co. International PLC | 10/28/20 | 0.95 | — | EUR | 66,400 | (638,352 | ) | |||||||||||||||||||
Currency Option EUR vs TRY | Call | Goldman Sachs International | 04/28/20 | 10.00 | — | EUR | 35,500 | (99,010 | ) | |||||||||||||||||||
Currency Option EUR vs TRY | Call | BNP Paribas S.A. | 07/28/20 | 12.00 | — | EUR | 35,500 | (138,117 | ) | |||||||||||||||||||
Currency Option EUR vs ZAR | Call | Citibank, N.A. | 11/25/19 | 27.00 | — | EUR | 14,000 | (1 | ) | |||||||||||||||||||
Currency Option EUR vs ZAR | Call | Deutsche Bank AG | 12/24/19 | 24.00 | — | EUR | 14,750 | (262 | ) | |||||||||||||||||||
Currency Option EUR vs ZAR | Call | Morgan Stanley & Co. International PLC | 08/27/20 | 28.00 | — | EUR | 34,500 | (64,611 | ) | |||||||||||||||||||
Currency Option EUR vs ZAR | Call | Morgan Stanley & Co. International PLC | 12/21/20 | 21.00 | — | EUR | 35,000 | (955,392 | ) | |||||||||||||||||||
Currency Option EUR vs ZAR | Call | Goldman Sachs International | 12/21/20 | 25.00 | — | EUR | 70,000 | (630,393 | ) | |||||||||||||||||||
Currency Option USD vs BRL | Call | JPMorgan Chase Bank, N.A. | 12/20/19 | 5.00 | — | 18,000 | (1,045 | ) | ||||||||||||||||||||
Currency Option USD vs BRL | Call | JPMorgan Chase Bank, N.A. | 12/20/19 | 5.00 | — | 14,500 | (842 | ) | ||||||||||||||||||||
Currency Option USD vs BRL | Call | Bank of America, N.A. | 03/27/20 | 4.50 | — | 75,000 | (513,173 | ) | ||||||||||||||||||||
Currency Option USD vs BRL | Call | JPMorgan Chase Bank, N.A. | 03/27/20 | 4.65 | — | 33,000 | (141,122 | ) | ||||||||||||||||||||
Currency Option USD vs BRL | Call | Deutsche Bank AG | 07/27/20 | 6.50 | — | 80,000 | (50,622 | ) | ||||||||||||||||||||
Currency Option USD vs BRL | Call | Deutsche Bank AG | 08/27/20 | 8.50 | — | 40,000 | (7,384 | ) | ||||||||||||||||||||
Currency Option USD vs BRL | Call | Morgan Stanley & Co. International PLC | 12/21/20 | 5.25 | — | 80,000 | (700,765 | ) | ||||||||||||||||||||
Currency Option USD vs BRL | Call | Morgan Stanley & Co. International PLC | 01/27/21 | 5.00 | — | 82,000 | (1,160,509 | ) | ||||||||||||||||||||
Currency Option USD vs BRL | Call | Citibank, N.A. | 01/27/21 | 5.00 | — | 30,000 | (424,577 | ) | ||||||||||||||||||||
Currency Option USD vs CHF | Call | Bank of America, N.A. | 10/28/20 | 1.00 | — | 55,500 | (466,906 | ) | ||||||||||||||||||||
Currency Option USD vs ILS | Call | Citibank, N.A. | 02/26/20 | 3.60 | — | 33,000 | (128,403 | ) | ||||||||||||||||||||
Currency Option USD vs ILS | Call | Bank of America, N.A. | 06/28/21 | 3.95 | — | 66,000 | (230,841 | ) | ||||||||||||||||||||
Currency Option USD vs INR | Call | HSBC Bank USA, N.A. | 10/28/20 | 90.00 | — | 40,000 | (45,813 | ) | ||||||||||||||||||||
See Notes to Financial Statements.
| 70 |
Options Written (continued):
OTC Traded
Description | Call/ Put | Counterparty | Expiration Date | Strike | Contracts | Notional Amount (000)# | Value | |||||||||||||||||||||
Currency Option USD vs INR | Call | Bank of America, N.A. | 02/24/21 | 79.00 | — | 56,000 | $ | (793,326 | ) | |||||||||||||||||||
Currency Option USD vs INR | Call | Goldman Sachs International | 02/24/21 | 86.00 | — | 112,000 | (507,105 | ) | ||||||||||||||||||||
Currency Option USD vs INR | Call | Bank of America, N.A. | 09/28/21 | 88.00 | — | 75,000 | (612,047 | ) | ||||||||||||||||||||
Currency Option USD vs JPY | Call | Citibank, N.A. | 01/27/21 | 110.00 | — | 22,000 | (241,862 | ) | ||||||||||||||||||||
Currency Option USD vs KRW | Call | BNP Paribas S.A. | 12/20/19 | 1,200.00 | — | 18,000 | (39,797 | ) | ||||||||||||||||||||
Currency Option USD vs KRW | Call | Goldman Sachs International | 12/20/19 | 1,350.00 | — | 36,000 | (521 | ) | ||||||||||||||||||||
Currency Option USD vs KRW | Call | HSBC Bank USA, N.A. | 02/26/20 | 1,275.00 | — | 69,500 | (72,957 | ) | ||||||||||||||||||||
Currency Option USD vs KRW | Call | Morgan Stanley & Co. International PLC | 05/27/20 | 1,250.00 | — | 69,500 | (299,218 | ) | ||||||||||||||||||||
Currency Option USD vs KRW | Call | Deutsche Bank AG | 10/28/20 | 1,165.00 | — | 29,750 | (740,680 | ) | ||||||||||||||||||||
Currency Option USD vs KRW | Call | HSBC Bank USA, N.A. | 07/28/21 | 1,500.00 | — | 69,500 | (229,401 | ) | ||||||||||||||||||||
Currency Option USD vs MXN | Call | Citibank, N.A. | 12/26/19 | 22.00 | — | 16,000 | (4,737 | ) | ||||||||||||||||||||
Currency Option USD vs MXN | Call | Morgan Stanley & Co. International PLC | 12/26/19 | 26.00 | — | 32,000 | (328 | ) | ||||||||||||||||||||
Currency Option USD vs MXN | Call | Citibank, N.A. | 04/28/20 | 26.00 | — | 55,500 | (40,827 | ) | ||||||||||||||||||||
Currency Option USD vs MXN | Call | Morgan Stanley & Co. International PLC | 05/27/20 | 22.00 | — | 59,500 | (450,395 | ) | ||||||||||||||||||||
Currency Option USD vs MXN | Call | Deutsche Bank AG | 10/28/20 | 31.00 | — | 120,000 | (165,209 | ) | ||||||||||||||||||||
Currency Option USD vs MXN | Call | Citibank, N.A. | 01/27/21 | 22.00 | — | 83,250 | (2,279,577 | ) | ||||||||||||||||||||
Currency Option USD vs MXN | Call | Morgan Stanley & Co. International PLC | 01/27/21 | 26.50 | — | 123,000 | (863,506 | ) | ||||||||||||||||||||
Currency Option USD vs MXN | Call | Goldman Sachs International | 01/27/21 | 26.50 | — | 43,500 | (305,386 | ) | ||||||||||||||||||||
Currency Option USD vs MXN | Call | Morgan Stanley & Co. International PLC | 04/27/21 | 26.00 | — | 59,500 | (684,518 | ) | ||||||||||||||||||||
Currency Option USD vs MXN | Call | Morgan Stanley & Co. International PLC | 04/27/21 | 26.00 | — | 59,500 | (684,518 | ) | ||||||||||||||||||||
Currency Option USD vs RUB | Call | Goldman Sachs International | 12/23/19 | 85.00 | — | 18,000 | (279 | ) | ||||||||||||||||||||
See Notes to Financial Statements.
| PGIM Global Total Return Fund | 71 |
Schedule of Investments(continued)
as of October 31, 2019
Options Written (continued):
OTC Traded
Description | Call/ Put | Counterparty | Expiration Date | Strike | Contracts | Notional Amount (000)# | Value | |||||||||||||||||||||
Currency Option USD vs RUB | Call | Citibank, N.A. | 03/30/20 | 95.00 | — | 33,000 | $ | (7,582 | ) | |||||||||||||||||||
Currency Option USD vs RUB | Call | Deutsche Bank AG | 10/29/20 | 75.00 | — | 155,000 | (2,289,914 | ) | ||||||||||||||||||||
Currency Option USD vs RUB | Call | BNP Paribas S.A. | 12/22/20 | 95.00 | — | 56,000 | (245,943 | ) | ||||||||||||||||||||
Currency Option USD vs RUB | Call | Deutsche Bank AG | 04/28/21 | 75.00 | — | 59,500 | (1,680,773 | ) | ||||||||||||||||||||
Currency Option USD vs RUB | Call | Goldman Sachs International | 04/28/21 | 90.00 | — | 119,000 | (1,166,602 | ) | ||||||||||||||||||||
Currency Option USD vs TRY | Call | BNP Paribas S.A. | 12/23/19 | 6.00 | — | 18,000 | (141,206 | ) | ||||||||||||||||||||
Currency Option USD vs TRY | Call | Goldman Sachs International | 04/29/20 | 7.00 | — | 41,000 | (426,995 | ) | ||||||||||||||||||||
Currency Option USD vs TRY | Call | Goldman Sachs International | 10/29/20 | 9.00 | — | 56,000 | (695,547 | ) | ||||||||||||||||||||
Currency Option USD vs TRY | Call | Deutsche Bank AG | 10/29/20 | 12.00 | — | 80,000 | (410,328 | ) | ||||||||||||||||||||
Currency Option USD vs TRY | Call | Morgan Stanley & Co. International PLC | 10/29/20 | 12.00 | — | 32,000 | (164,131 | ) | ||||||||||||||||||||
Currency Option USD vs TRY | Call | Goldman Sachs International | 02/25/21 | 10.00 | — | 56,000 | (902,209 | ) | ||||||||||||||||||||
Currency Option USD vs TRY | Call | Morgan Stanley & Co. International PLC | 02/25/21 | 15.00 | — | 112,000 | (672,481 | ) | ||||||||||||||||||||
Currency Option USD vs TRY | Call | Goldman Sachs International | 09/29/21 | 15.00 | — | 130,500 | (1,775,264 | ) | ||||||||||||||||||||
Currency Option USD vs ZAR | Call | BNP Paribas S.A. | 12/24/19 | 14.00 | — | 18,000 | (1,443,711 | ) | ||||||||||||||||||||
Currency Option USD vs ZAR | Call | Morgan Stanley & Co. International PLC | 12/24/19 | 17.00 | — | 36,000 | (69,352 | ) | ||||||||||||||||||||
Currency Option USD vs ZAR | Call | BNP Paribas S.A. | 07/27/20 | 25.00 | — | 40,000 | (51,065 | ) | ||||||||||||||||||||
Currency Option USD vs ZAR | Call | Morgan Stanley & Co. International PLC | 09/28/20 | 17.00 | — | 40,000 | (1,335,447 | ) | ||||||||||||||||||||
Currency Option USD vs ZAR | Call | Goldman Sachs International | 09/28/20 | 21.00 | — | 80,000 | (583,229 | ) | ||||||||||||||||||||
Currency Option USD vs ZAR | Call | Deutsche Bank AG | 01/27/21 | 15.00 | — | 56,000 | (5,600,392 | ) | ||||||||||||||||||||
Currency Option USD vs ZAR | Call | Goldman Sachs International | 01/27/21 | 20.00 | — | 80,000 | (1,481,267 | ) | ||||||||||||||||||||
Currency Option USD vs ZAR | Call | Morgan Stanley & Co. International PLC | 01/27/21 | 20.00 | — | 32,000 | (592,507 | ) | ||||||||||||||||||||
See Notes to Financial Statements.
| 72 |
Options Written (continued):
OTC Traded
Description | Call/ Put | Counterparty | Expiration Date | Strike | Contracts | Notional Amount (000)# | Value | |||||||||||||||||||||
Currency Option AUD vs JPY | Put | Morgan Stanley & Co. International PLC | 01/29/20 | 73.00 | — | AUD | 220,000 | $ | (1,679,262 | ) | ||||||||||||||||||
Currency Option AUD vs JPY | Put | Deutsche Bank AG | 01/29/20 | 82.00 | — | AUD | 110,000 | (8,091,938 | ) | |||||||||||||||||||
Currency Option AUD vs JPY | Put | BNP Paribas S.A. | 02/26/20 | 67.00 | — | AUD | 150,000 | (246,830 | ) | |||||||||||||||||||
Currency Option AUD vs JPY | Put | Deutsche Bank AG | 02/26/20 | 76.00 | — | AUD | 75,000 | (1,781,741 | ) | |||||||||||||||||||
Currency Option AUD vs JPY | Put | Goldman Sachs International | 12/28/20 | 60.00 | — | AUD | 117,000 | (500,598 | ) | |||||||||||||||||||
Currency Option AUD vs JPY | Put | Deutsche Bank AG | 12/28/20 | 68.00 | — | AUD | 58,500 | (754,903 | ) | |||||||||||||||||||
Currency Option AUD vs JPY | Put | Deutsche Bank AG | 05/26/21 | 62.00 | — | AUD | 712,000 | (6,270,898 | ) | |||||||||||||||||||
Currency Option AUD vs JPY | Put | Morgan Stanley & Co. International PLC | 05/26/21 | 70.00 | — | AUD | 178,000 | (4,147,059 | ) | |||||||||||||||||||
Currency Option AUD vs JPY | Put | Morgan Stanley & Co. International PLC | 07/28/21 | 56.00 | — | AUD | 356,000 | (1,867,027 | ) | |||||||||||||||||||
Currency Option AUD vs USD | Put | Morgan Stanley & Co. International PLC | 01/29/20 | 0.69 | — | AUD | 23,000 | (209,747 | ) | |||||||||||||||||||
Currency Option EUR vs TRY | Put | Morgan Stanley & Co. International PLC | 04/28/20 | 6.00 | — | EUR | 35,500 | (170,042 | ) | |||||||||||||||||||
Currency Option EUR vs TRY | Put | Morgan Stanley & Co. International PLC | 07/28/20 | 7.00 | — | EUR | 35,500 | (2,400,186 | ) | |||||||||||||||||||
Currency Option GBP vs JPY | Put | Bank of America, N.A. | 09/28/20 | 115.00 | — | GBP | 106,200 | (767,473 | ) | |||||||||||||||||||
Currency Option GBP vs USD | Put | Citibank, N.A. | 11/25/19 | 1.15 | — | GBP | 12,500 | (145 | ) | |||||||||||||||||||
Currency Option GBP vs USD | Put | HSBC Bank USA, N.A. | 11/25/19 | 1.30 | — | GBP | 12,500 | (165,747 | ) | |||||||||||||||||||
Currency Option GBP vs USD | Put | Bank of America, N.A. | 07/27/20 | 1.23 | — | GBP | 53,100 | (821,459 | ) | |||||||||||||||||||
Currency Option GBP vs USD | Put | HSBC Bank USA, N.A. | 09/28/20 | 1.16 | — | GBP | 64,000 | (514,370 | ) | |||||||||||||||||||
Currency Option GBP vs USD | Put | Goldman Sachs International | 09/28/20 | 1.16 | — | GBP | 19,200 | (154,311 | ) | |||||||||||||||||||
Currency Option GBP vs USD | Put | Morgan Stanley & Co. International PLC | 09/28/20 | 1.28 | — | GBP | 41,600 | (1,341,268 | ) | |||||||||||||||||||
Currency Option USD vs BRL | Put | Deutsche Bank AG | 03/27/20 | 3.10 | — | 33,000 | (1,541 | ) | ||||||||||||||||||||
Currency Option USD vs BRL | Put | Citibank, N.A. | 06/26/20 | 3.50 | — | 40,000 | (95,152 | ) | ||||||||||||||||||||
See Notes to Financial Statements.
| PGIM Global Total Return Fund | 73 |
Schedule of Investments(continued)
as of October 31, 2019
Options Written (continued):
OTC Traded
Description | Call/ Put | Counterparty | Expiration Date | Strike | Contracts | Notional Amount (000)# | Value | |||||||||||||||||||||
Currency Option USD vs BRL | Put | Citibank, N.A. | 08/27/20 | 3.25 | — | 40,000 | $ | (35,523 | ) | |||||||||||||||||||
Currency Option USD vs BRL | Put | Morgan Stanley & Co. International PLC | 08/27/20 | 3.50 | — | 40,000 | (142,300 | ) | ||||||||||||||||||||
Currency Option USD vs INR | Put | Goldman Sachs International | 12/21/20 | 69.00 | — | 20,000 | (69,544 | ) | ||||||||||||||||||||
Currency Option USD vs JPY | Put | Citibank, N.A. | 03/27/20 | 101.50 | — | 142,200 | (543,612 | ) | ||||||||||||||||||||
Currency Option USD vs JPY | Put | Bank of America, N.A. | 10/28/20 | 98.00 | — | 155,000 | (1,260,503 | ) | ||||||||||||||||||||
Currency Option USD vs JPY | Put | Morgan Stanley & Co. International PLC | 01/27/21 | 91.00 | — | 40,000 | (184,967 | ) | ||||||||||||||||||||
Currency Option USD vs JPY | Put | Barclays Bank PLC | 01/27/21 | 91.00 | — | 72,000 | (332,940 | ) | ||||||||||||||||||||
Currency Option USD vs MXN | Put | Morgan Stanley & Co. International PLC | 04/28/20 | 17.00 | — | 55,500 | (23,435 | ) | ||||||||||||||||||||
Currency Option USD vs MXN | Put | Morgan Stanley & Co. International PLC | 10/28/20 | 18.00 | — | 40,000 | (232,019 | ) | ||||||||||||||||||||
Currency Option USD vs RUB | Put | Goldman Sachs International | 12/22/20 | 66.00 | — | 56,000 | (1,888,033 | ) | ||||||||||||||||||||
Currency Option USD vs TRY | Put | Deutsche Bank AG | 04/29/20 | 4.00 | — | 41,000 | (1,844 | ) | ||||||||||||||||||||
Currency Option USD vs ZAR | Put | Goldman Sachs International | 07/27/20 | 12.00 | — | 40,000 | (26,372 | ) | ||||||||||||||||||||
|
| |||||||||||||||||||||||||||
Total OTC Traded (premiums received $149,160,081) | $ | (73,882,692 | ) | |||||||||||||||||||||||||
|
| |||||||||||||||||||||||||||
OTC Swaptions
Description | Call/ Put | Counterparty | Expiration Date | Strike | Receive | Pay | Notional Amount (000)# | Value | ||||||||||||||||
2- Year Interest Rate Swap, 01/08/22 | Put | Morgan Stanley &Co. International PLC | 01/06/20 | (0.12 | )% | (0.12)%(S) | 6 Month JPY LIBOR(S) | JPY | 1,000,000 | $ | (5,053 | ) | ||||||||||||
2- Year Interest Rate Swap, 01/08/22 | Put | JPMorgan Chase Bank, N.A. | 01/06/20 | (0.10 | )% | (0.10)%(S) | 6 Month JPY LIBOR(S) | JPY | 2,000,000 | (6,363 | ) | |||||||||||||
5- Year Interest Rate Swap, 01/15/25 | Put | JPMorgan Chase Bank, N.A. | 01/10/20 | 0.00 | % | 0.00%(S) | 6 Month JPY LIBOR(S) | JPY | 950,000 | (1,455 | ) | |||||||||||||
See Notes to Financial Statements.
| 74 |
Options Written (continued):
OTC Swaptions
Description | Call/ Put | Counterparty | Expiration Date | Strike | Receive | Pay | Notional Amount (000)# | Value | ||||||||||||||||||
20-Year Interest Rate Swap, 01/08/40 | Put | JPMorgan Chase Bank, N.A. | 01/06/20 | 0.23% | 0.23%(S) | 6 Month JPY LIBOR(S) | JPY | 1,200,000 | $ | (88,473 | ) | |||||||||||||||
20-Year Interest Rate Swap, 01/08/40 | Put | JPMorgan Chase Bank, N.A. | 01/06/20 | 0.25% | 0.25%(S) | 6 Month JPY LIBOR(S) | JPY | 1,500,000 | (87,306 | ) | ||||||||||||||||
iTraxx.XO.31.V1, 06/20/24 | Put | Citibank, N.A. | 06/17/20 | 4.00% | 4.00%(Q) | iTraxx.XO.31. V1(Q) | EUR | 20,000 | (241,088 | ) | ||||||||||||||||
|
| |||||||||||||||||||||||||
Total OTC Swaptions (premiums received $422,002) |
| $ | (429,738 | ) | ||||||||||||||||||||||
|
| |||||||||||||||||||||||||
Total Options Written(premiums received $149,582,083) | $ | (74,312,430 | ) | |||||||||||||||||||||||
|
| |||||||||||||||||||||||||
Futures contracts outstanding at October 31, 2019:
| Number of Contracts | Type | Expiration Date | Current Notional Amount | Value / Unrealized Appreciation (Depreciation) | ||||||||||||
| Long Positions: | ||||||||||||||||
| 6,896 | 5 Year U.S. Treasury Notes | Dec. 2019 | $ | 822,024,785 | $ | (3,682,399 | ) | |||||||||
| 2 | 10 Year Canadian Government Bonds | Dec. 2019 | 215,686 | (2,690 | ) | |||||||||||
| 3,301 | 10 Year U.S. Treasury Notes | Dec. 2019 | 430,110,001 | (1,342,549 | ) | |||||||||||
| 19 | 10 Year U.S. Ultra Treasury Notes | Dec. 2019 | 2,700,078 | (42,314 | ) | |||||||||||
| 255 | 20 Year U.S. Treasury Bonds | Dec. 2019 | 41,150,625 | (129,751 | ) | |||||||||||
| 20 | 30 Year Euro Buxl | Dec. 2019 | 4,683,368 | (253,413 | ) | |||||||||||
| 1,157 | 30 Year U.S. Ultra Treasury Bonds | Dec. 2019 | 219,540,750 | (4,995,527 | ) | |||||||||||
|
| |||||||||||||||
| (10,448,643 | ) | |||||||||||||||
|
| |||||||||||||||
| Short Positions: | ||||||||||||||||
| 5,680 | 2 Year U.S. Treasury Notes | Dec. 2019 | 1,224,616,872 | 2,210,970 | ||||||||||||
| 1,311 | 5 Year Euro-Bobl | Dec. 2019 | 196,835,750 | 2,461,427 | ||||||||||||
| 718 | 10 Year Euro-Bund | Dec. 2019 | 137,542,900 | 2,964,603 | ||||||||||||
| 157 | 10 Year U.K. Gilt | Dec. 2019 | 27,015,664 | (36,983 | ) | |||||||||||
| 2,226 | Euro Schatz Index | Dec. 2019 | 278,231,460 | 1,265,088 | ||||||||||||
|
| |||||||||||||||
| 8,865,105 | ||||||||||||||||
|
| |||||||||||||||
| $ | (1,583,538 | ) | ||||||||||||||
|
| |||||||||||||||
See Notes to Financial Statements.
| PGIM Global Total Return Fund | 75 |
Schedule of Investments(continued)
as of October 31, 2019
Forward foreign currency exchange contracts outstanding at October 31, 2019:
Purchase Contracts | Counterparty | Notional Amount (000) | Value at Settlement Date | Current Value | Unrealized Appreciation | Unrealized Depreciation | ||||||||||||||||
OTC Forward Foreign Currency Exchange Contracts: |
| |||||||||||||||||||||
Australian Dollar, | ||||||||||||||||||||||
Expiring 11/27/19 | Bank of America, N.A. | AUD | 2,168 | $ | 1,474,000 | $ | 1,495,897 | $ | 21,897 | $ | — | |||||||||||
Expiring 11/27/19 | Bank of America, N.A. | AUD | 1,489 | 1,023,000 | 1,027,082 | 4,082 | — | |||||||||||||||
Expiring 11/27/19 | Citibank, N.A. | AUD | 1,842 | 1,247,000 | 1,270,579 | 23,579 | — | |||||||||||||||
Expiring 11/27/19 | Citibank, N.A. | AUD | 1,618 | 1,093,000 | 1,116,133 | 23,133 | — | |||||||||||||||
Expiring 11/27/19 | JPMorgan Chase Bank, N.A. | AUD | 1,748 | 1,201,000 | 1,205,753 | 4,753 | — | |||||||||||||||
Expiring 11/27/19 | The Toronto-Dominion Bank | AUD | 2,449 | 1,655,000 | 1,689,356 | 34,356 | — | |||||||||||||||
Expiring 11/27/19 | UBS AG | AUD | 340 | 230,322 | 234,663 | 4,341 | — | |||||||||||||||
Expiring 01/22/20 | BNP Paribas S.A. | AUD | 2,724 | 1,874,000 | 1,881,832 | 7,832 | — | |||||||||||||||
Expiring 01/22/20 | HSBC Bank USA, N.A. | AUD | 3,114 | 2,138,000 | 2,150,885 | 12,885 | — | |||||||||||||||
Expiring 01/22/20 | UBS AG | AUD | 3,544 | 2,438,000 | 2,448,193 | 10,193 | — | |||||||||||||||
Expiring 01/31/20 | Citibank, N.A. | AUD | 3,238 | 2,594,998 | 2,237,199 | — | (357,799 | ) | ||||||||||||||
Expiring 01/31/20 | Citibank, N.A. | AUD | 2,637 | 1,966,670 | 1,822,196 | — | (144,474 | ) | ||||||||||||||
Expiring 02/28/20 | Bank of America, N.A. | AUD | 8,916 | 6,402,013 | 6,163,770 | — | (238,243 | ) | ||||||||||||||
Expiring 02/28/20 | Morgan Stanley & Co. International PLC | AUD | 3,865 | 2,706,729 | 2,671,486 | — | (35,243 | ) | ||||||||||||||
Expiring 11/30/20 | Morgan Stanley & Co. International PLC | AUD | 2,729 | 1,959,198 | 1,893,949 | — | (65,249 | ) | ||||||||||||||
Expiring 11/30/20 | Morgan Stanley & Co. International PLC | AUD | 2,177 | 1,530,938 | 1,511,293 | — | (19,645 | ) | ||||||||||||||
Expiring 12/30/20 | JPMorgan Chase Bank, N.A. | AUD | 1,555 | 1,067,927 | 1,079,628 | 11,701 | — | |||||||||||||||
Expiring 12/30/20 | Morgan Stanley & Co. International PLC | AUD | 13,961 | 9,819,051 | 9,693,053 | — | (125,998 | ) | ||||||||||||||
Expiring 05/28/21 | JPMorgan Chase Bank, N.A. | AUD | 10,828 | 7,450,379 | 7,528,426 | 78,047 | — | |||||||||||||||
Expiring 10/31/23 | JPMorgan Chase Bank, N.A. | AUD | 4,867 | 3,379,499 | 3,400,880 | 21,381 | — | |||||||||||||||
See Notes to Financial Statements.
| 76 |
Forward foreign currency exchange contracts outstanding at October 31, 2019 (continued):
Purchase Contracts | Counterparty | Notional Amount (000) | Value at Settlement Date | Current Value | Unrealized Appreciation | Unrealized Depreciation | ||||||||||||||||
OTC Forward Foreign Currency Exchange Contracts (cont’d.): |
| |||||||||||||||||||||
Brazilian Real, | ||||||||||||||||||||||
Expiring 11/04/19 | BNP Paribas S.A. | BRL | 59,797 | $ | 14,993,223 | $ | 14,906,299 | $ | — | $ | (86,924 | ) | ||||||||||
Expiring 11/04/19 | Citibank, N.A. | BRL | 2,799 | 685,000 | 697,797 | 12,797 | — | |||||||||||||||
Expiring 11/04/19 | HSBC Bank USA, N.A. | BRL | 3,022 | 742,000 | 753,272 | 11,272 | — | |||||||||||||||
Expiring 11/04/19 | JPMorgan Chase Bank, N.A. | BRL | 50,215 | 12,332,900 | 12,517,615 | 184,715 | — | |||||||||||||||
Expiring 12/03/19 | JPMorgan Chase Bank, N.A. | BRL | 2,679 | 670,000 | 666,638 | — | (3,362 | ) | ||||||||||||||
Expiring 12/24/19 | Bank of America, N.A. | BRL | 8,327 | 2,011,000 | 2,069,851 | 58,851 | — | |||||||||||||||
Expiring 12/24/19 | Bank of America, N.A. | BRL | 8,071 | 1,941,000 | 2,006,101 | 65,101 | — | |||||||||||||||
Expiring 12/24/19 | Barclays Bank PLC | BRL | 8,407 | 2,089,000 | 2,089,745 | 745 | — | |||||||||||||||
Expiring 12/24/19 | Barclays Bank PLC | BRL | 6,164 | 1,468,000 | 1,532,198 | 64,198 | — | |||||||||||||||
Expiring 12/24/19 | Barclays Bank PLC | BRL | 2,271 | 656,862 | 564,601 | — | (92,261 | ) | ||||||||||||||
Expiring 12/24/19 | Barclays Bank PLC | BRL | 455 | 130,617 | 113,041 | — | (17,576 | ) | ||||||||||||||
Expiring 12/24/19 | BNP Paribas S.A. | BRL | 8,106 | 1,967,000 | 2,014,883 | 47,883 | — | |||||||||||||||
Expiring 12/24/19 | BNP Paribas S.A. | BRL | 7,141 | 1,707,000 | 1,775,030 | 68,030 | — | |||||||||||||||
Expiring 12/24/19 | Citibank, N.A. | BRL | 3,650 | 933,553 | 907,316 | — | (26,237 | ) | ||||||||||||||
Expiring 12/24/19 | Deutsche Bank AG | BRL | 24,458 | 6,069,000 | 6,079,460 | 10,460 | — | |||||||||||||||
Expiring 12/24/19 | Deutsche Bank AG | BRL | 2,805 | 674,000 | 697,109 | 23,109 | — | |||||||||||||||
Expiring 12/24/19 | HSBC Bank USA, N.A. | BRL | 9,763 | 2,400,000 | 2,426,746 | 26,746 | — | |||||||||||||||
Expiring 12/24/19 | JPMorgan Chase Bank, N.A. | BRL | 10,505 | 2,515,000 | 2,611,231 | 96,231 | — | |||||||||||||||
Expiring 12/24/19 | JPMorgan Chase Bank, N.A. | BRL | 5,254 | 1,320,000 | 1,305,870 | — | (14,130 | ) | ||||||||||||||
Expiring 12/24/19 | Morgan Stanley & Co. International PLC | BRL | 9,741 | 2,407,000 | 2,421,320 | 14,320 | — | |||||||||||||||
Expiring 12/24/19 | The Toronto-Dominion Bank | BRL | 6,847 | 1,631,000 | 1,702,001 | 71,001 | — | |||||||||||||||
See Notes to Financial Statements.
| PGIM Global Total Return Fund | 77 |
Schedule of Investments(continued)
as of October 31, 2019
Forward foreign currency exchange contracts outstanding at October 31, 2019 (continued):
Purchase Contracts | Counterparty | Notional Amount (000) | Value at Settlement Date | Current Value | Unrealized Appreciation | Unrealized Depreciation | ||||||||||||||||
OTC Forward Foreign Currency Exchange Contracts (cont’d.): |
| |||||||||||||||||||||
Brazilian Real (cont’d.), |
| |||||||||||||||||||||
Expiring 12/24/19 | UBS AG | BRL | 12,983 | $ | 3,223,000 | $ | 3,227,033 | $ | 4,033 | $ | — | |||||||||||
Expiring 03/31/20 | Citibank, N.A. | BRL | 4,505 | 1,128,217 | 1,114,457 | — | (13,760 | ) | ||||||||||||||
Expiring 03/31/20 | Deutsche Bank AG | BRL | 47,153 | 11,550,000 | 11,664,863 | 114,863 | — | |||||||||||||||
Expiring 06/30/20 | Citibank, N.A. | BRL | 31,480 | 7,893,000 | 7,748,582 | — | (144,418 | ) | ||||||||||||||
Expiring 06/30/20 | Deutsche Bank AG | BRL | 53,533 | 12,146,000 | 13,176,711 | 1,030,711 | — | |||||||||||||||
Expiring 06/30/20 | Morgan Stanley & Co. International PLC | BRL | 3,592 | 881,000 | 884,093 | 3,093 | — | |||||||||||||||
Expiring 06/30/20 | Morgan Stanley & Co. International PLC | BRL | 386 | 96,033 | 95,065 | — | (968 | ) | ||||||||||||||
Expiring 07/29/20 | Citibank, N.A. | BRL | 8,833 | 2,190,265 | 2,170,486 | — | (19,779 | ) | ||||||||||||||
Expiring 07/29/20 | Deutsche Bank AG | BRL | 10,985 | 2,758,413 | 2,699,276 | — | (59,137 | ) | ||||||||||||||
Expiring 07/29/20 | Morgan Stanley & Co. International PLC | BRL | 9,411 | 2,413,000 | 2,312,353 | — | (100,647 | ) | ||||||||||||||
Expiring 08/31/20 | Citibank, N.A. | BRL | 15,315 | 3,813,000 | 3,755,512 | — | (57,488 | ) | ||||||||||||||
Expiring 08/31/20 | Morgan Stanley & Co. International PLC | BRL | 16,155 | 3,967,000 | 3,961,569 | — | (5,431 | ) | ||||||||||||||
Expiring 12/23/20 | Citibank, N.A. | BRL | 70,083 | 17,106,000 | 17,048,941 | — | (57,059 | ) | ||||||||||||||
Expiring 01/29/21 | Citibank, N.A. | BRL | 31,144 | 7,402,000 | 7,553,818 | 151,818 | — | |||||||||||||||
Expiring 01/29/21 | Citibank, N.A. | BRL | 20,672 | 4,950,547 | 5,013,901 | 63,354 | — | |||||||||||||||
Expiring 01/29/21 | Morgan Stanley & Co. International PLC | BRL | 11,133 | 2,780,000 | 2,700,141 | — | (79,859 | ) | ||||||||||||||
Expiring 03/31/21 | Citibank, N.A. | BRL | 41,302 | 9,998,790 | 9,968,883 | — | (29,907 | ) | ||||||||||||||
Expiring 09/30/21 | Bank of America, N.A. | BRL | 139,851 | 31,675,000 | 33,269,788 | 1,594,788 | — | |||||||||||||||
British Pound, | ||||||||||||||||||||||
Expiring 11/27/19 | Citibank, N.A. | GBP | 2,666 | 3,624,960 | 3,456,319 | — | (168,641 | ) | ||||||||||||||
Expiring 11/27/19 | HSBC Bank USA, N.A. | GBP | 3,188 | 4,129,544 | 4,132,648 | 3,104 | — | |||||||||||||||
See Notes to Financial Statements.
| 78 |
Forward foreign currency exchange contracts outstanding at October 31, 2019 (continued):
Purchase Contracts | Counterparty | Notional Amount (000) | Value at Settlement Date | Current Value | Unrealized Appreciation | Unrealized Depreciation | ||||||||||||||||
OTC Forward Foreign Currency Exchange Contracts (cont’d.): |
| |||||||||||||||||||||
British Pound (cont’d.), |
| |||||||||||||||||||||
Expiring 01/17/20 | Barclays Bank PLC | GBP | 5,740 | $ | 7,421,324 | $ | 7,454,824 | $ | 33,500 | $ | — | |||||||||||
Expiring 01/17/20 | Barclays Bank PLC | GBP | 1,448 | 1,869,000 | 1,880,715 | 11,715 | — | |||||||||||||||
Expiring 01/17/20 | BNP Paribas S.A. | GBP | 2,155 | 2,796,000 | 2,799,173 | 3,173 | — | |||||||||||||||
Expiring 01/17/20 | Citibank, N.A. | GBP | 1,560 | 2,000,000 | 2,026,420 | 26,420 | — | |||||||||||||||
Expiring 01/17/20 | HSBC Bank USA, N.A. | GBP | 2,751 | 3,545,753 | 3,572,886 | 27,133 | — | |||||||||||||||
Expiring 01/17/20 | Morgan Stanley & Co. International PLC | GBP | 2,611 | 3,361,000 | 3,390,867 | 29,867 | — | |||||||||||||||
Expiring 01/17/20 | Morgan Stanley & Co. International PLC | GBP | 1,796 | 2,315,536 | 2,332,417 | 16,881 | — | |||||||||||||||
Expiring 01/17/20 | Morgan Stanley & Co. International PLC | GBP | 1,727 | 2,226,000 | 2,242,899 | 16,899 | — | |||||||||||||||
Expiring 07/29/20 | HSBC Bank USA, N.A. | GBP | 3,655 | 4,766,741 | 4,767,530 | 789 | — | |||||||||||||||
Expiring 07/29/20 | Morgan Stanley & Co. International PLC | GBP | 20,442 | 25,926,180 | 26,664,254 | 738,074 | — | |||||||||||||||
Canadian Dollar, | ||||||||||||||||||||||
Expiring 01/22/20 | Barclays Bank PLC | CAD | 45,611 | 34,742,367 | 34,645,173 | — | (97,194 | ) | ||||||||||||||
Expiring 01/22/20 | Barclays Bank PLC | CAD | 3,286 | 2,518,000 | 2,496,119 | — | (21,881 | ) | ||||||||||||||
Expiring 01/22/20 | BNP Paribas S.A. | CAD | 2,257 | 1,727,000 | 1,714,526 | — | (12,474 | ) | ||||||||||||||
Expiring 01/22/20 | Morgan Stanley & Co. International PLC | CAD | 2,401 | 1,839,288 | 1,824,047 | — | (15,241 | ) | ||||||||||||||
Chilean Peso, | ||||||||||||||||||||||
Expiring 12/18/19 | Barclays Bank PLC | CLP | 1,200,359 | 1,682,000 | 1,620,562 | — | (61,438 | ) | ||||||||||||||
Expiring 12/18/19 | Barclays Bank PLC | CLP | 667,672 | 929,000 | 901,400 | — | (27,600 | ) | ||||||||||||||
Expiring 12/18/19 | BNP Paribas S.A. | CLP | 1,773,507 | 2,453,610 | 2,394,348 | — | (59,262 | ) | ||||||||||||||
Expiring 12/18/19 | BNP Paribas S.A. | CLP | 1,122,832 | 1,548,000 | 1,515,895 | — | (32,105 | ) | ||||||||||||||
Expiring 12/18/19 | BNP Paribas S.A. | CLP | 792,851 | 1,100,500 | 1,070,400 | — | (30,100 | ) | ||||||||||||||
Expiring 12/18/19 | BNP Paribas S.A. | CLP | 527,850 | 731,500 | 712,632 | — | (18,868 | ) | ||||||||||||||
See Notes to Financial Statements.
| PGIM Global Total Return Fund | 79 |
Schedule of Investments(continued)
as of October 31, 2019
Forward foreign currency exchange contracts outstanding at October 31, 2019 (continued):
Purchase Contracts | Counterparty | Notional Amount (000) | Value at Settlement Date | Current Value | Unrealized Appreciation | Unrealized Depreciation | ||||||||||||||||
OTC Forward Foreign Currency Exchange Contracts (cont’d.): |
| |||||||||||||||||||||
Chilean Peso (cont’d.), |
| |||||||||||||||||||||
Expiring 12/18/19 | Goldman Sachs International | CLP | 801,745 | $ | 1,107,000 | $ | 1,082,407 | $ | — | $ | (24,593 | ) | ||||||||||
Expiring 12/18/19 | JPMorgan Chase Bank, N.A. | CLP | 1,427,434 | 1,979,290 | 1,927,128 | — | (52,162 | ) | ||||||||||||||
Expiring 12/18/19 | JPMorgan Chase Bank, N.A. | CLP | 1,040,051 | 1,431,000 | 1,404,135 | — | (26,865 | ) | ||||||||||||||
Expiring 12/18/19 | UBS AG | CLP | 4,093,279 | 5,652,600 | 5,526,189 | — | (126,411 | ) | ||||||||||||||
Expiring 12/18/19 | UBS AG | CLP | 1,168,052 | 1,647,000 | 1,576,945 | — | (70,055 | ) | ||||||||||||||
Expiring 12/18/19 | UBS AG | CLP | 929,866 | 1,284,700 | 1,255,378 | — | (29,322 | ) | ||||||||||||||
Chinese Renminbi, | ||||||||||||||||||||||
Expiring 02/14/20 | BNP Paribas S.A. | CNH | 15,169 | 2,141,000 | 2,146,004 | 5,004 | — | |||||||||||||||
Expiring 02/14/20 | BNP Paribas S.A. | CNH | 14,470 | 2,049,000 | 2,047,079 | — | (1,921 | ) | ||||||||||||||
Expiring 02/14/20 | Citibank, N.A. | CNH | 12,740 | 1,800,000 | 1,802,348 | 2,348 | — | |||||||||||||||
Expiring 02/14/20 | HSBC Bank USA, N.A. | CNH | 321,231 | 45,329,974 | 45,444,907 | 114,933 | — | |||||||||||||||
Expiring 02/14/20 | JPMorgan Chase Bank, N.A. | CNH | 52,305 | 7,412,363 | 7,399,698 | — | (12,665 | ) | ||||||||||||||
Expiring 02/28/20 | Citibank, N.A. | CNH | 9,688 | 1,375,694 | 1,370,109 | — | (5,585 | ) | ||||||||||||||
Expiring 02/28/20 | HSBC Bank USA, N.A. | CNH | 9,677 | 1,428,763 | 1,368,569 | — | (60,194 | ) | ||||||||||||||
Expiring 02/28/20 | Morgan Stanley & Co. International PLC | CNH | 52,452 | 8,077,000 | 7,417,799 | — | (659,201 | ) | ||||||||||||||
Expiring 05/14/21 | Citibank, N.A. | CNH | 61,753 | 8,849,734 | 8,624,834 | — | (224,900 | ) | ||||||||||||||
Colombian Peso, | ||||||||||||||||||||||
Expiring 12/18/19 | Citibank, N.A. | COP | 2,474,496 | 716,000 | 730,778 | 14,778 | — | |||||||||||||||
Czech Koruna, | ||||||||||||||||||||||
Expiring 01/17/20 | Citibank, N.A. | CZK | 32,380 | 1,410,914 | 1,417,094 | 6,180 | — | |||||||||||||||
Expiring 01/17/20 | Citibank, N.A. | CZK | 28,709 | 1,253,000 | 1,256,472 | 3,472 | — | |||||||||||||||
Expiring 01/17/20 | Citibank, N.A. | CZK | 25,955 | 1,113,000 | 1,135,924 | 22,924 | — | |||||||||||||||
See Notes to Financial Statements.
| 80 |
Forward foreign currency exchange contracts outstanding at October 31, 2019 (continued):
Purchase Contracts | Counterparty | Notional Amount (000) | Value at Settlement Date | Current Value | Unrealized Appreciation | Unrealized Depreciation | ||||||||||||||||
OTC Forward Foreign Currency Exchange Contracts (cont’d.): |
| |||||||||||||||||||||
Czech Koruna (cont’d.), |
| |||||||||||||||||||||
Expiring 01/17/20 | Morgan Stanley & Co. International PLC | CZK | 55,939 | $ | 2,432,000 | $ | 2,448,179 | $ | 16,179 | $ | — | |||||||||||
Expiring 01/17/20 | Morgan Stanley & Co. International PLC | CZK | 39,667 | 1,696,000 | 1,736,036 | 40,036 | — | |||||||||||||||
Expiring 01/17/20 | Morgan Stanley & Co. International PLC | CZK | 34,287 | 1,497,000 | 1,500,584 | 3,584 | — | |||||||||||||||
Expiring 01/17/20 | UBS AG | CZK | 23,379 | 1,016,000 | 1,023,194 | 7,194 | — | |||||||||||||||
Danish Krone, | ||||||||||||||||||||||
Expiring 01/17/20 | Morgan Stanley & Co. International PLC | DKK | 4,224 | 629,873 | 634,487 | 4,614 | — | |||||||||||||||
Egyptian Pound, | ||||||||||||||||||||||
Expiring 11/27/19 | Citibank, N.A. | EGP | 25,351 | 1,470,500 | 1,559,450 | 88,950 | — | |||||||||||||||
Expiring 11/27/19 | Citibank, N.A. | EGP | 16,499 | 957,268 | 1,014,878 | 57,610 | — | |||||||||||||||
Expiring 12/18/19 | Citibank, N.A. | EGP | 45,082 | 2,598,171 | 2,757,169 | 158,998 | — | |||||||||||||||
Expiring 12/23/19 | Citibank, N.A. | EGP | 13,829 | 820,000 | 844,616 | 24,616 | — | |||||||||||||||
Expiring 12/23/19 | Morgan Stanley & Co. International PLC | EGP | 23,925 | 1,415,706 | 1,461,231 | 45,525 | — | |||||||||||||||
Expiring 12/23/19 | Morgan Stanley & Co. International PLC | EGP | 10,067 | 595,706 | 614,862 | 19,156 | — | |||||||||||||||
Expiring 01/21/20 | Citibank, N.A. | EGP | 35,645 | 2,041,520 | 2,161,493 | 119,973 | — | |||||||||||||||
Expiring 01/28/20 | Citibank, N.A. | EGP | 28,597 | 1,683,417 | 1,731,267 | 47,850 | — | |||||||||||||||
Expiring 01/28/20 | Citibank, N.A. | EGP | 15,748 | 920,915 | 953,364 | 32,449 | — | |||||||||||||||
Expiring 01/30/20 | Citibank, N.A. | EGP | 27,542 | 1,635,003 | 1,666,634 | 31,631 | — | |||||||||||||||
Expiring 01/30/20 | Citibank, N.A. | EGP | 19,151 | 1,098,729 | 1,158,881 | 60,152 | — | |||||||||||||||
Euro, | ||||||||||||||||||||||
Expiring 11/27/19 | JPMorgan Chase Bank, N.A. | EUR | 457 | 510,906 | 510,249 | — | (657 | ) | ||||||||||||||
Expiring 01/17/20 | Bank of America, N.A. | EUR | 2,745 | 3,059,450 | 3,078,526 | 19,076 | — | |||||||||||||||
Expiring 01/17/20 | Barclays Bank PLC | EUR | 3,468 | 3,888,000 | 3,889,808 | 1,808 | — | |||||||||||||||
See Notes to Financial Statements.
| PGIM Global Total Return Fund | 81 |
Schedule of Investments(continued)
as of October 31, 2019
Forward foreign currency exchange contracts outstanding at October 31, 2019 (continued):
Purchase Contracts | Counterparty | Notional Amount (000) | Value at Settlement Date | Current Value | Unrealized Appreciation | Unrealized Depreciation | ||||||||||||||||
OTC Forward Foreign Currency Exchange Contracts (cont’d.): |
| |||||||||||||||||||||
Euro (cont’d.), |
| |||||||||||||||||||||
Expiring 01/17/20 | Barclays Bank PLC | EUR | 3,378 | $ | 3,794,000 | $ | 3,788,869 | $ | — | $ | (5,131 | ) | ||||||||||
Expiring 01/17/20 | Barclays Bank PLC | EUR | 2,867 | 3,190,000 | 3,215,695 | 25,695 | — | |||||||||||||||
Expiring 01/17/20 | Barclays Bank PLC | EUR | 1,154 | 1,291,000 | 1,293,909 | 2,909 | — | |||||||||||||||
Expiring 01/17/20 | BNP Paribas S.A. | EUR | 974 | 1,091,000 | 1,092,451 | 1,451 | — | |||||||||||||||
Expiring 01/17/20 | Citibank, N.A. | EUR | 7,532 | 8,368,508 | 8,447,679 | 79,171 | — | |||||||||||||||
Expiring 01/17/20 | HSBC Bank USA, N.A. | EUR | 14,665 | 16,450,718 | 16,447,122 | — | (3,596 | ) | ||||||||||||||
Expiring 01/17/20 | Morgan Stanley & Co. International PLC | EUR | 6,016 | 6,754,818 | 6,746,492 | — | (8,326 | ) | ||||||||||||||
Expiring 01/17/20 | Morgan Stanley & Co. International PLC | EUR | 4,314 | 4,813,176 | 4,838,400 | 25,224 | — | |||||||||||||||
Expiring 01/17/20 | Morgan Stanley & Co. International PLC | EUR | 3,446 | 3,859,094 | 3,864,167 | 5,073 | — | |||||||||||||||
Expiring 01/17/20 | Morgan Stanley & Co. International PLC | EUR | 2,947 | 3,300,000 | 3,305,051 | 5,051 | — | |||||||||||||||
Expiring 01/31/20 | Morgan Stanley & Co. International PLC | EUR | 2,685 | 3,258,785 | 3,013,671 | — | (245,114 | ) | ||||||||||||||
Expiring 02/28/20 | Bank of America, N.A. | EUR | 3,265 | 4,271,600 | 3,670,802 | — | (600,798 | ) | ||||||||||||||
Expiring 02/28/20 | BNP Paribas S.A. | EUR | 5,554 | 6,285,740 | 6,244,298 | — | (41,442 | ) | ||||||||||||||
Expiring 02/28/20 | Morgan Stanley & Co. International PLC | EUR | 4,574 | 5,300,809 | 5,142,495 | — | (158,314 | ) | ||||||||||||||
Expiring 02/28/20 | Morgan Stanley & Co. International PLC | EUR | 3,595 | 4,373,117 | 4,041,631 | — | (331,486 | ) | ||||||||||||||
Hungarian Forint, | ||||||||||||||||||||||
Expiring 01/17/20 | Citibank, N.A. | HUF | 393,425 | 1,314,000 | 1,341,355 | 27,355 | — | |||||||||||||||
Expiring 01/17/20 | Citibank, N.A. | HUF | 339,841 | 1,154,532 | 1,158,663 | 4,131 | — | |||||||||||||||
Expiring 01/17/20 | Citibank, N.A. | HUF | 234,893 | 799,000 | 800,852 | 1,852 | — | |||||||||||||||
Expiring 01/17/20 | JPMorgan Chase Bank, N.A. | HUF | 445,723 | 1,491,000 | 1,519,663 | 28,663 | — | |||||||||||||||
Indian Rupee, | ||||||||||||||||||||||
Expiring 11/27/19 | Citibank, N.A. | INR | 98,280 | 1,385,000 | 1,378,460 | — | (6,540 | ) | ||||||||||||||
See Notes to Financial Statements.
| 82 |
Forward foreign currency exchange contracts outstanding at October 31, 2019 (continued):
Purchase Contracts | Counterparty | Notional Amount (000) | Value at Settlement Date | Current Value | Unrealized Appreciation | Unrealized Depreciation | ||||||||||||||||
OTC Forward Foreign Currency Exchange Contracts (cont’d.): |
| |||||||||||||||||||||
Indian Rupee (cont’d.), |
| |||||||||||||||||||||
Expiring 11/27/19 | JPMorgan Chase Bank, N.A. | INR | 67,769 | $ | 931,945 | $ | 950,524 | $ | 18,579 | $ | — | |||||||||||
Expiring 11/27/19 | Morgan Stanley & Co. International PLC | INR | 87,544 | 1,210,000 | 1,227,877 | 17,877 | — | |||||||||||||||
Expiring 12/18/19 | Barclays Bank PLC | INR | 96,049 | 1,349,000 | 1,343,737 | — | (5,263 | ) | ||||||||||||||
Expiring 12/18/19 | Barclays Bank PLC | INR | 75,249 | 1,034,000 | 1,052,750 | 18,750 | — | |||||||||||||||
Expiring 12/18/19 | Citibank, N.A. | INR | 613,957 | 8,424,502 | 8,589,346 | 164,844 | — | |||||||||||||||
Expiring 12/18/19 | Citibank, N.A. | INR | 338,095 | 4,682,964 | 4,730,004 | 47,040 | — | |||||||||||||||
Expiring 12/18/19 | HSBC Bank USA, N.A. | INR | 1,445,609 | 19,896,902 | 20,224,295 | 327,393 | — | |||||||||||||||
Expiring 12/18/19 | HSBC Bank USA, N.A. | INR | 97,193 | 1,364,000 | 1,359,747 | — | (4,253 | ) | ||||||||||||||
Expiring 12/18/19 | JPMorgan Chase Bank, N.A. | INR | 148,220 | 2,047,000 | 2,073,623 | 26,623 | — | |||||||||||||||
Expiring 12/18/19 | JPMorgan Chase Bank, N.A. | INR | 135,497 | 1,884,000 | 1,895,627 | 11,627 | — | |||||||||||||||
Expiring 10/30/20 | Goldman Sachs International | INR | 341,407 | 4,510,000 | 4,604,763 | 94,763 | — | |||||||||||||||
Expiring 12/23/20 | Goldman Sachs International | INR | 216,223 | 2,832,000 | 2,897,634 | 65,634 | — | |||||||||||||||
Expiring 02/26/21 | Morgan Stanley & Co. International PLC | INR | 364,682 | 4,915,513 | 4,849,718 | — | (65,795 | ) | ||||||||||||||
Indonesian Rupiah, | ||||||||||||||||||||||
Expiring 12/18/19 | BNP Paribas S.A. | IDR | 20,522,294 | 1,459,000 | 1,449,602 | — | (9,398 | ) | ||||||||||||||
Expiring 12/18/19 | Citibank, N.A. | IDR | 20,072,704 | 1,424,000 | 1,417,845 | — | (6,155 | ) | ||||||||||||||
Expiring 12/18/19 | HSBC Bank USA, N.A. | IDR | 83,669,809 | 5,930,000 | 5,910,057 | — | (19,943 | ) | ||||||||||||||
Expiring 12/18/19 | HSBC Bank USA, N.A. | IDR | 19,172,580 | 1,337,000 | 1,354,264 | 17,264 | — | |||||||||||||||
Expiring 12/18/19 | JPMorgan Chase Bank, N.A. | IDR | 17,308,380 | 1,207,000 | 1,222,586 | 15,586 | — | |||||||||||||||
Israeli Shekel, | ||||||||||||||||||||||
Expiring 11/27/19 | BNP Paribas S.A. | ILS | 4,183 | 1,202,000 | 1,188,458 | — | (13,542 | ) | ||||||||||||||
Expiring 11/29/19 | Citibank, N.A. | ILS | 162,159 | 44,635,000 | 46,075,511 | 1,440,511 | — | |||||||||||||||
See Notes to Financial Statements.
| PGIM Global Total Return Fund | 83 |
Schedule of Investments(continued)
as of October 31, 2019
Forward foreign currency exchange contracts outstanding at October 31, 2019 (continued):
Purchase Contracts | Counterparty | Notional Amount (000) | Value at Settlement Date | Current Value | Unrealized Appreciation | Unrealized Depreciation | ||||||||||||||||
OTC Forward Foreign Currency Exchange Contracts (cont’d.): |
| |||||||||||||||||||||
Israeli Shekel (cont’d.), |
| |||||||||||||||||||||
Expiring 12/18/19 | Bank of America, N.A. | ILS | 9,501 | $ | 2,726,000 | $ | 2,702,533 | $ | — | $ | (23,467 | ) | ||||||||||
Expiring 12/18/19 | Barclays Bank PLC | ILS | 7,683 | 2,216,000 | 2,185,389 | — | (30,611 | ) | ||||||||||||||
Expiring 12/18/19 | Barclays Bank PLC | ILS | 5,978 | 1,719,000 | 1,700,412 | — | (18,588 | ) | ||||||||||||||
Expiring 12/18/19 | Barclays Bank PLC | ILS | 4,933 | 1,424,000 | 1,403,240 | — | (20,760 | ) | ||||||||||||||
Expiring 12/18/19 | Barclays Bank PLC | ILS | 4,069 | 1,163,020 | 1,157,279 | — | (5,741 | ) | ||||||||||||||
Expiring 12/18/19 | Barclays Bank PLC | ILS | 2,431 | 695,730 | 691,423 | — | (4,307 | ) | ||||||||||||||
Expiring 12/18/19 | Citibank, N.A. | ILS | 8,616 | 2,468,000 | 2,450,618 | — | (17,382 | ) | ||||||||||||||
Expiring 12/18/19 | Citibank, N.A. | ILS | 8,452 | 2,394,000 | 2,403,922 | 9,922 | — | |||||||||||||||
Expiring 12/18/19 | Citibank, N.A. | ILS | 7,628 | 2,167,000 | 2,169,741 | 2,741 | — | |||||||||||||||
Expiring 12/18/19 | Citibank, N.A. | ILS | 5,229 | 1,500,800 | 1,487,240 | — | (13,560 | ) | ||||||||||||||
Expiring 12/18/19 | Citibank, N.A. | ILS | 5,039 | 1,437,000 | 1,433,376 | — | (3,624 | ) | ||||||||||||||
Expiring 12/18/19 | JPMorgan Chase Bank, N.A. | ILS | 12,856 | 3,652,299 | 3,656,809 | 4,510 | — | |||||||||||||||
Expiring 12/18/19 | JPMorgan Chase Bank, N.A. | ILS | 7,739 | 2,203,560 | 2,201,106 | — | (2,454 | ) | ||||||||||||||
Expiring 06/30/21 | Bank of America, N.A. | ILS | 47,344 | 13,695,000 | 13,855,084 | 160,084 | — | |||||||||||||||
Japanese Yen, | ||||||||||||||||||||||
Expiring 11/27/19 | Bank of America, N.A. | JPY | 387,097 | 3,672,000 | 3,590,098 | — | (81,902 | ) | ||||||||||||||
Expiring 11/27/19 | Bank of America, N.A. | JPY | 123,526 | 1,154,000 | 1,145,637 | — | (8,363 | ) | ||||||||||||||
Expiring 11/27/19 | Citibank, N.A. | JPY | 183,326 | 1,698,000 | 1,700,243 | 2,243 | — | |||||||||||||||
Expiring 11/27/19 | Deutsche Bank AG | JPY | 405,920 | 3,880,000 | 3,764,675 | — | (115,325 | ) | ||||||||||||||
Expiring 11/27/19 | Deutsche Bank AG | JPY | 280,887 | 2,626,000 | 2,605,066 | — | (20,934 | ) | ||||||||||||||
Expiring 11/27/19 | HSBC Bank USA, N.A. | JPY | 357,612 | 3,396,000 | 3,316,648 | — | (79,352 | ) | ||||||||||||||
See Notes to Financial Statements.
| 84 |
Forward foreign currency exchange contracts outstanding at October 31, 2019 (continued):
Purchase Contracts | Counterparty | Notional Amount (000) | Value at Settlement Date | Current Value | Unrealized Appreciation | Unrealized Depreciation | ||||||||||||||||
OTC Forward Foreign Currency Exchange Contracts (cont’d.): |
| |||||||||||||||||||||
Japanese Yen (cont’d.), |
| |||||||||||||||||||||
Expiring 11/27/19 | HSBC Bank USA, N.A. | JPY | 126,017 | $ | 1,175,000 | $ | 1,168,739 | $ | — | $ | (6,261 | ) | ||||||||||
Expiring 11/27/19 | UBS AG | JPY | 198,235 | 1,854,000 | 1,838,514 | — | (15,486 | ) | ||||||||||||||
Expiring 01/17/20 | Barclays Bank PLC | JPY | 245,800 | 2,277,000 | 2,288,405 | 11,405 | — | |||||||||||||||
Expiring 01/17/20 | BNP Paribas S.A. | JPY | 116,396 | 1,078,000 | 1,083,654 | 5,654 | — | |||||||||||||||
Expiring 01/17/20 | Citibank, N.A. | JPY | 452,416 | 4,183,928 | 4,212,010 | 28,082 | — | |||||||||||||||
Expiring 01/17/20 | Citibank, N.A. | JPY | 126,634 | 1,174,000 | 1,178,966 | 4,966 | — | |||||||||||||||
Expiring 01/17/20 | Morgan Stanley & Co. International PLC | JPY | 36,934,776 | 343,108,537 | 343,863,939 | 755,402 | — | |||||||||||||||
Expiring 01/17/20 | Morgan Stanley & Co. International PLC | JPY | 500,521 | 4,621,066 | 4,659,865 | 38,799 | — | |||||||||||||||
Expiring 01/17/20 | Morgan Stanley & Co. International PLC | JPY | 219,068 | 2,030,010 | 2,039,534 | 9,524 | — | |||||||||||||||
Expiring 07/29/20 | Deutsche Bank AG | JPY | 508,232 | 4,838,000 | 4,783,727 | — | (54,273 | ) | ||||||||||||||
Expiring 10/30/20 | Bank of America, N.A. | JPY | 2,675,066 | 25,122,000 | 25,304,601 | 182,601 | — | |||||||||||||||
Expiring 01/29/21 | Barclays Bank PLC | JPY | 743,615 | 7,152,000 | 7,067,976 | — | (84,024 | ) | ||||||||||||||
Expiring 01/29/21 | Barclays Bank PLC | JPY | 438,351 | 4,154,000 | 4,166,475 | 12,475 | — | |||||||||||||||
Expiring 01/29/21 | Citibank, N.A. | JPY | 449,088 | 4,477,000 | 4,268,530 | — | (208,470 | ) | ||||||||||||||
Expiring 01/29/21 | Morgan Stanley & Co. International PLC | JPY | 1,488,986 | 14,485,000 | 14,152,640 | — | (332,360 | ) | ||||||||||||||
Expiring 10/31/23 | Bank of America, N.A. | JPY | 1,051,903 | 10,538,000 | 10,581,143 | 43,143 | — | |||||||||||||||
Expiring 10/31/23 | Barclays Bank PLC | JPY | 525,393 | 5,512,000 | 5,284,951 | — | (227,049 | ) | ||||||||||||||
Expiring 10/31/23 | Barclays Bank PLC | JPY | 406,236 | 4,196,000 | 4,086,344 | — | (109,656 | ) | ||||||||||||||
Expiring 10/31/23 | Deutsche Bank AG | JPY | 511,039 | 5,354,000 | 5,140,568 | — | (213,432 | ) | ||||||||||||||
Expiring 10/31/23 | Goldman Sachs International | JPY | 1,254,996 | 12,881,000 | 12,624,062 | — | (256,938 | ) | ||||||||||||||
See Notes to Financial Statements.
| PGIM Global Total Return Fund | 85 |
Schedule of Investments(continued)
as of October 31, 2019
Forward foreign currency exchange contracts outstanding at October 31, 2019 (continued):
Purchase Contracts | Counterparty | Notional Amount (000) | Value at Settlement Date | Current Value | Unrealized Appreciation | Unrealized Depreciation | ||||||||||||||||
OTC Forward Foreign Currency Exchange Contracts (cont’d.): |
| |||||||||||||||||||||
Mexican Peso, |
| |||||||||||||||||||||
Expiring 11/27/19 | Bank of America, N.A. | MXN | 56,697 | $ | 2,948,000 | $ | 2,934,816 | $ | — | $ | (13,184 | ) | ||||||||||
Expiring 11/27/19 | Bank of America, N.A. | MXN | 27,836 | 1,374,000 | 1,440,859 | 66,859 | — | |||||||||||||||
Expiring 11/27/19 | BNP Paribas S.A. | MXN | 102,235 | 5,089,285 | 5,292,011 | 202,726 | — | |||||||||||||||
Expiring 11/27/19 | Goldman Sachs International | MXN | 57,032 | 2,837,000 | 2,952,184 | 115,184 | — | |||||||||||||||
Expiring 11/27/19 | HSBC Bank USA, N.A. | MXN | 25,623 | 1,286,000 | 1,326,327 | 40,327 | — | |||||||||||||||
Expiring 11/27/19 | HSBC Bank USA, N.A. | MXN | 20,429 | 1,023,000 | 1,057,471 | 34,471 | — | |||||||||||||||
Expiring 11/27/19 | Morgan Stanley & Co. International PLC | MXN | 115,429 | 5,818,000 | 5,974,996 | 156,996 | — | |||||||||||||||
Expiring 12/18/19 | Barclays Bank PLC | MXN | 31,371 | 1,629,000 | 1,618,725 | — | (10,275 | ) | ||||||||||||||
Expiring 12/18/19 | Barclays Bank PLC | MXN | 18,202 | 937,000 | 939,208 | 2,208 | — | |||||||||||||||
Expiring 12/18/19 | Citibank, N.A. | MXN | 18,642 | 964,000 | 961,924 | — | (2,076 | ) | ||||||||||||||
Expiring 12/18/19 | Goldman Sachs International | MXN | 16,851 | 866,000 | 869,470 | 3,470 | — | |||||||||||||||
Expiring 12/18/19 | Goldman Sachs International | MXN | 11,496 | 583,104 | 593,154 | 10,050 | — | |||||||||||||||
Expiring 12/18/19 | HSBC Bank USA, N.A. | MXN | 56,479 | 2,872,845 | 2,914,226 | 41,381 | — | |||||||||||||||
Expiring 12/18/19 | HSBC Bank USA, N.A. | MXN | 27,552 | 1,415,000 | 1,421,635 | 6,635 | — | |||||||||||||||
Expiring 12/18/19 | JPMorgan Chase Bank, N.A. | MXN | 350,770 | 17,383,362 | 18,099,280 | 715,918 | — | |||||||||||||||
Expiring 12/18/19 | Morgan Stanley & Co. International PLC | MXN | 35,882 | 1,858,000 | 1,851,471 | — | (6,529 | ) | ||||||||||||||
Expiring 12/18/19 | Morgan Stanley & Co. International PLC | MXN | 22,378 | 1,126,000 | 1,154,669 | 28,669 | — | |||||||||||||||
Expiring 12/18/19 | UBS AG | MXN | 30,931 | 1,603,000 | 1,595,983 | — | (7,017 | ) | ||||||||||||||
Expiring 12/30/19 | Citibank, N.A. | MXN | 22,199 | 1,083,120 | 1,143,204 | 60,084 | — | |||||||||||||||
Expiring 12/30/19 | Goldman Sachs International | MXN | 13,330 | 651,931 | 686,461 | 34,530 | — | |||||||||||||||
Expiring 02/28/20 | Morgan Stanley & Co. International PLC | MXN | 54,622 | 2,804,000 | 2,789,303 | — | (14,697 | ) | ||||||||||||||
See Notes to Financial Statements.
| 86 |
Forward foreign currency exchange contracts outstanding at October 31, 2019 (continued):
Purchase Contracts | Counterparty | Notional Amount (000) | Value at Settlement Date | Current Value | Unrealized Appreciation | Unrealized Depreciation | ||||||||||||||||
OTC Forward Foreign Currency Exchange Contracts (cont’d.): |
| |||||||||||||||||||||
Mexican Peso (cont’d.), |
| |||||||||||||||||||||
Expiring 04/30/20 | Citibank, N.A. | MXN | 32,853 | $ | 1,591,718 | $ | 1,662,688 | $ | 70,970 | $ | — | |||||||||||
Expiring 04/30/20 | Deutsche Bank AG | MXN | 274,693 | 12,385,000 | 13,902,177 | 1,517,177 | — | |||||||||||||||
Expiring 04/30/20 | JPMorgan Chase Bank, N.A. | MXN | 14,776 | 725,000 | 747,786 | 22,786 | — | |||||||||||||||
Expiring 04/30/20 | Morgan Stanley & Co. International PLC | MXN | 80,903 | 3,920,000 | 4,094,485 | 174,485 | — | |||||||||||||||
Expiring 10/30/20 | Citibank, N.A. | MXN | 39,210 | 1,822,826 | 1,936,165 | 113,339 | — | |||||||||||||||
Expiring 10/30/20 | Morgan Stanley & Co. International PLC | MXN | 313,935 | 14,803,000 | 15,501,786 | 698,786 | — | |||||||||||||||
Expiring 01/29/21 | Goldman Sachs International | MXN | 104,180 | 4,878,269 | 5,087,484 | 209,215 | — | |||||||||||||||
Expiring 01/29/21 | Goldman Sachs International | MXN | 23,874 | 1,117,000 | 1,165,832 | 48,832 | — | |||||||||||||||
Expiring 01/29/21 | Morgan Stanley & Co. International PLC | MXN | 36,698 | 1,702,000 | 1,792,074 | 90,074 | — | |||||||||||||||
Expiring 04/29/21 | JPMorgan Chase Bank, N.A. | MXN | 100,978 | 4,601,957 | 4,877,824 | 275,867 | — | |||||||||||||||
Expiring 04/29/21 | Morgan Stanley & Co. International PLC | MXN | 482,401 | 22,718,000 | 23,302,661 | 584,661 | — | |||||||||||||||
Expiring 04/28/23 | JPMorgan Chase Bank, N.A. | MXN | 110,648 | 4,577,425 | 4,890,685 | 313,260 | — | |||||||||||||||
Expiring 04/28/23 | Morgan Stanley & Co. International PLC | MXN | 352,530 | 14,859,000 | 15,581,983 | 722,983 | — | |||||||||||||||
New Taiwanese Dollar, |
| |||||||||||||||||||||
Expiring 12/18/19 | Barclays Bank PLC | TWD | 96,754 | 3,193,000 | 3,194,527 | 1,527 | — | |||||||||||||||
Expiring 12/18/19 | Barclays Bank PLC | TWD | 56,160 | 1,859,000 | 1,854,242 | — | (4,758 | ) | ||||||||||||||
Expiring 12/18/19 | Barclays Bank PLC | TWD | 47,473 | 1,566,000 | 1,567,421 | 1,421 | — | |||||||||||||||
Expiring 12/18/19 | Credit Suisse International | TWD | 118,167 | 3,855,000 | 3,901,519 | 46,519 | — | |||||||||||||||
Expiring 12/18/19 | JPMorgan Chase Bank, N.A. | TWD | 386,066 | 12,608,720 | 12,746,717 | 137,997 | — | |||||||||||||||
Expiring 12/18/19 | JPMorgan Chase Bank, N.A. | TWD | 60,420 | 1,962,000 | 1,994,874 | 32,874 | — | |||||||||||||||
New Zealand Dollar, | ||||||||||||||||||||||
Expiring 01/22/20 | Barclays Bank PLC | NZD | 3,215 | 2,057,000 | 2,064,353 | 7,353 | — | |||||||||||||||
See Notes to Financial Statements.
| PGIM Global Total Return Fund | 87 |
Schedule of Investments(continued)
as of October 31, 2019
Forward foreign currency exchange contracts outstanding at October 31, 2019 (continued):
Purchase Contracts | Counterparty | Notional Amount (000) | Value at Settlement Date | Current Value | Unrealized Appreciation | Unrealized Depreciation | ||||||||||||||||
OTC Forward Foreign Currency Exchange Contracts (cont’d.): |
| |||||||||||||||||||||
New Zealand Dollar (cont’d.), |
| |||||||||||||||||||||
Expiring 01/22/20 | BNP Paribas S.A. | NZD | 2,874 | $ | 1,846,000 | $ | 1,845,489 | $ | — | $ | (511 | ) | ||||||||||
Expiring 01/22/20 | Deutsche Bank AG | NZD | 3,087 | 1,970,367 | 1,982,048 | 11,681 | — | |||||||||||||||
Norwegian Krone, | ||||||||||||||||||||||
Expiring 01/17/20 | Bank of America, N.A. | NOK | 169,128 | 18,573,899 | 18,400,445 | — | (173,454 | ) | ||||||||||||||
Expiring 01/17/20 | JPMorgan Chase Bank, N.A. | NOK | 160,749 | 17,685,375 | 17,488,856 | — | (196,519 | ) | ||||||||||||||
Expiring 01/17/20 | Morgan Stanley & Co. International PLC | NOK | 15,683 | 1,704,334 | 1,706,289 | 1,955 | — | |||||||||||||||
Peruvian Nuevo Sol, |
| |||||||||||||||||||||
Expiring 12/18/19 | Bank of America, N.A. | PEN | 7,724 | 2,278,000 | 2,305,934 | 27,934 | — | |||||||||||||||
Expiring 12/18/19 | BNP Paribas S.A. | PEN | 33,781 | 9,994,369 | 10,084,701 | 90,332 | — | |||||||||||||||
Expiring 12/18/19 | BNP Paribas S.A. | PEN | 5,761 | 1,704,000 | 1,719,783 | 15,783 | — | |||||||||||||||
Expiring 12/18/19 | BNP Paribas S.A. | PEN | 5,219 | 1,536,000 | 1,558,185 | 22,185 | — | |||||||||||||||
Expiring 12/18/19 | BNP Paribas S.A. | PEN | 4,913 | 1,443,000 | 1,466,726 | 23,726 | — | |||||||||||||||
Expiring 12/18/19 | Citibank, N.A. | PEN | 5,568 | 1,646,000 | 1,662,351 | 16,351 | — | |||||||||||||||
Expiring 12/18/19 | HSBC Bank USA, N.A. | PEN | 4,724 | 1,405,000 | 1,410,191 | 5,191 | — | |||||||||||||||
Philippine Peso, |
| |||||||||||||||||||||
Expiring 12/18/19 | Barclays Bank PLC | PHP | 174,943 | 3,419,600 | 3,439,250 | 19,650 | — | |||||||||||||||
Expiring 12/18/19 | Credit Suisse International | PHP | 112,183 | 2,196,000 | 2,205,424 | 9,424 | — | |||||||||||||||
Expiring 12/18/19 | Goldman Sachs International | PHP | 80,259 | 1,553,000 | 1,577,830 | 24,830 | — | |||||||||||||||
Expiring 12/18/19 | JPMorgan Chase Bank, N.A. | PHP | 260,657 | 4,990,329 | 5,124,321 | 133,992 | — | |||||||||||||||
Expiring 12/18/19 | Morgan Stanley & Co. International PLC | PHP | 103,190 | 1,977,000 | 2,028,626 | 51,626 | — | |||||||||||||||
Polish Zloty, |
| |||||||||||||||||||||
Expiring 01/17/20 | Barclays Bank PLC | PLN | 5,458 | 1,424,000 | 1,429,364 | 5,364 | — | |||||||||||||||
Expiring 01/17/20 | Citibank, N.A. | PLN | 7,545 | 1,939,000 | 1,975,939 | 36,939 | — | |||||||||||||||
See Notes to Financial Statements.
| 88 |
Forward foreign currency exchange contracts outstanding at October 31, 2019 (continued):
Purchase Contracts | Counterparty | Notional Amount (000) | Value at Settlement Date | Current Value | Unrealized Appreciation | Unrealized Depreciation | ||||||||||||||||
OTC Forward Foreign Currency Exchange Contracts (cont’d.): |
| |||||||||||||||||||||
Polish Zloty (cont’d.), |
| |||||||||||||||||||||
Expiring 01/17/20 | Citibank, N.A. | PLN | 6,066 | $ | 1,562,000 | $ | 1,588,517 | $ | 26,517 | $ | — | |||||||||||
Expiring 01/17/20 | Citibank, N.A. | PLN | 4,379 | 1,143,000 | 1,146,737 | 3,737 | — | |||||||||||||||
Expiring 01/17/20 | HSBC Bank USA, N.A. | PLN | 7,039 | 1,832,000 | 1,843,483 | 11,483 | — | |||||||||||||||
Expiring 01/17/20 | JPMorgan Chase Bank, N.A. | PLN | 15,629 | 4,020,869 | 4,092,961 | 72,092 | — | |||||||||||||||
Expiring 01/17/20 | JPMorgan Chase Bank, N.A. | PLN | 3,738 | 970,000 | 979,034 | 9,034 | — | |||||||||||||||
Expiring 01/17/20 | Morgan Stanley & Co. International PLC | PLN | 7,576 | 1,979,000 | 1,983,982 | 4,982 | — | |||||||||||||||
Expiring 01/17/20 | Morgan Stanley & Co. International PLC | PLN | 3,810 | 990,000 | 997,756 | 7,756 | — | |||||||||||||||
Expiring 01/17/20 | UBS AG | PLN | 4,145 | 1,079,000 | 1,085,594 | 6,594 | — | |||||||||||||||
Russian Ruble, | ||||||||||||||||||||||
Expiring 11/27/19 | Barclays Bank PLC | RUB | 69,800 | 1,035,000 | 1,084,261 | 49,261 | — | |||||||||||||||
Expiring 11/27/19 | Citibank, N.A. | RUB | 208,445 | 3,116,634 | 3,237,932 | 121,298 | — | |||||||||||||||
Expiring 12/18/19 | Barclays Bank PLC | RUB | 188,966 | 2,926,646 | 2,926,116 | — | (530 | ) | ||||||||||||||
Expiring 12/18/19 | Barclays Bank PLC | RUB | 83,478 | 1,260,000 | 1,292,642 | 32,642 | — | |||||||||||||||
Expiring 12/18/19 | Barclays Bank PLC | RUB | 80,912 | 1,244,000 | 1,252,905 | 8,905 | — | |||||||||||||||
Expiring 12/18/19 | Barclays Bank PLC | RUB | 67,821 | 1,044,000 | 1,050,198 | 6,198 | — | |||||||||||||||
Expiring 12/18/19 | Barclays Bank PLC | RUB | 64,362 | 982,000 | 996,633 | 14,633 | — | |||||||||||||||
Expiring 12/18/19 | Barclays Bank PLC | RUB | 57,081 | 862,000 | 883,895 | 21,895 | — | |||||||||||||||
Expiring 12/18/19 | Citibank, N.A. | RUB | 114,996 | 1,776,000 | 1,780,697 | 4,697 | — | |||||||||||||||
Expiring 12/18/19 | Citibank, N.A. | RUB | 80,736 | 1,207,000 | 1,250,189 | 43,189 | — | |||||||||||||||
Expiring 12/18/19 | Citibank, N.A. | RUB | 57,716 | 888,000 | 893,718 | 5,718 | — | |||||||||||||||
Expiring 12/18/19 | Credit Suisse International | RUB | 173,111 | 2,683,685 | 2,680,602 | — | (3,083 | ) | ||||||||||||||
See Notes to Financial Statements.
| PGIM Global Total Return Fund | 89 |
Schedule of Investments(continued)
as of October 31, 2019
Forward foreign currency exchange contracts outstanding at October 31, 2019 (continued):
Purchase Contracts | Counterparty | Notional Amount (000) | Value at Settlement Date | Current Value | Unrealized Appreciation | Unrealized Depreciation | ||||||||||||||||
OTC Forward Foreign Currency Exchange Contracts (cont’d.): |
| |||||||||||||||||||||
Russian Ruble (cont’d.), |
| |||||||||||||||||||||
Expiring 12/18/19 | JPMorgan Chase Bank, N.A. | RUB | 91,210 | $ | 1,409,300 | $ | 1,412,373 | $ | 3,073 | $ | — | |||||||||||
Expiring 12/18/19 | Morgan Stanley & Co. International PLC | RUB | 981,316 | 14,441,741 | 15,195,549 | 753,808 | — | |||||||||||||||
Expiring 12/18/19 | Morgan Stanley & Co. International PLC | RUB | 556,206 | 8,220,000 | 8,612,779 | 392,779 | — | |||||||||||||||
Expiring 12/24/19 | Citibank, N.A. | RUB | 229,300 | 3,345,000 | 3,547,486 | 202,486 | — | |||||||||||||||
Expiring 03/31/20 | Barclays Bank PLC | RUB | 303,830 | 4,367,880 | 4,647,254 | 279,374 | — | |||||||||||||||
Expiring 03/31/20 | BNP Paribas S.A. | RUB | 262,176 | 3,690,000 | 4,010,141 | 320,141 | — | |||||||||||||||
Expiring 10/30/20 | Deutsche Bank AG | RUB | 106,001 | 1,594,000 | 1,582,401 | — | (11,599 | ) | ||||||||||||||
Expiring 12/23/20 | Goldman Sachs International | RUB | 1,725,271 | 24,720,000 | 25,599,629 | 879,629 | — | |||||||||||||||
Expiring 04/29/21 | Goldman Sachs International | RUB | 135,453 | 1,909,000 | 1,981,719 | 72,719 | — | |||||||||||||||
Saudi Arabian Riyal, | ||||||||||||||||||||||
Expiring 11/12/19 | Goldman Sachs International | SAR | 57,150 | 15,198,255 | 15,239,269 | 41,014 | — | |||||||||||||||
Singapore Dollar, | ||||||||||||||||||||||
Expiring 12/18/19 | Barclays Bank PLC | SGD | 3,517 | 2,582,000 | 2,586,333 | 4,333 | — | |||||||||||||||
Expiring 12/18/19 | Barclays Bank PLC | SGD | 2,270 | 1,669,000 | 1,669,170 | 170 | — | |||||||||||||||
Expiring 12/18/19 | Barclays Bank PLC | SGD | 1,820 | 1,321,000 | 1,338,780 | 17,780 | — | |||||||||||||||
Expiring 12/18/19 | Citibank, N.A. | SGD | 5,470 | 3,979,506 | 4,022,465 | 42,959 | — | |||||||||||||||
Expiring 12/18/19 | Citibank, N.A. | SGD | 2,975 | 2,183,000 | 2,187,750 | 4,750 | — | |||||||||||||||
Expiring 12/18/19 | Citibank, N.A. | SGD | 2,710 | 1,968,000 | 1,993,188 | 25,188 | — | |||||||||||||||
Expiring 12/18/19 | Citibank, N.A. | SGD | 1,762 | 1,286,875 | 1,295,802 | 8,927 | — | |||||||||||||||
Expiring 12/18/19 | Goldman Sachs International | SGD | 22,795 | 16,746,900 | 16,764,040 | 17,140 | — | |||||||||||||||
Expiring 12/18/19 | Goldman Sachs International | SGD | 2,362 | 1,735,000 | 1,736,695 | 1,695 | — | |||||||||||||||
Expiring 12/18/19 | HSBC Bank USA, N.A. | SGD | 3,565 | 2,617,000 | 2,621,838 | 4,838 | — | |||||||||||||||
See Notes to Financial Statements.
| 90 |
Forward foreign currency exchange contracts outstanding at October 31, 2019 (continued):
Purchase Contracts | Counterparty | Notional Amount (000) | Value at Settlement Date | Current Value | Unrealized Appreciation | Unrealized Depreciation | ||||||||||||||||
OTC Forward Foreign Currency Exchange Contracts (cont’d.): |
| |||||||||||||||||||||
Singapore Dollar (cont’d.), |
| |||||||||||||||||||||
Expiring 12/18/19 | HSBC Bank USA, N.A. | SGD | 1,583 | $ | 1,161,428 | $ | 1,163,890 | $ | 2,462 | $ | — | |||||||||||
Expiring 12/18/19 | JPMorgan Chase Bank, N.A. | SGD | 4,247 | 3,119,000 | 3,123,142 | 4,142 | — | |||||||||||||||
Expiring 12/18/19 | JPMorgan Chase Bank, N.A. | SGD | 4,119 | 3,026,000 | 3,029,024 | 3,024 | — | |||||||||||||||
Expiring 12/18/19 | JPMorgan Chase Bank, N.A. | SGD | 2,732 | 2,008,000 | 2,009,312 | 1,312 | — | |||||||||||||||
Expiring 12/18/19 | JPMorgan Chase Bank, N.A. | SGD | 2,259 | 1,633,000 | 1,661,523 | 28,523 | — | |||||||||||||||
Expiring 12/18/19 | Morgan Stanley & Co. International PLC | SGD | 4,948 | 3,597,000 | 3,639,163 | 42,163 | — | |||||||||||||||
Expiring 12/18/19 | Morgan Stanley & Co. International PLC | SGD | 3,078 | 2,244,000 | 2,263,636 | 19,636 | — | |||||||||||||||
Expiring 12/18/19 | Morgan Stanley & Co. International PLC | SGD | 2,597 | 1,906,000 | 1,909,629 | 3,629 | — | |||||||||||||||
South African Rand, | ||||||||||||||||||||||
Expiring 11/27/19 | Citibank, N.A. | ZAR | 16,270 | 1,097,000 | 1,072,853 | — | (24,147 | ) | ||||||||||||||
Expiring 11/27/19 | HSBC Bank USA, N.A. | ZAR | 17,345 | 1,145,000 | 1,143,688 | — | (1,312 | ) | ||||||||||||||
Expiring 11/27/19 | JPMorgan Chase Bank, N.A. | ZAR | 24,229 | 1,867,699 | 1,597,607 | — | (270,092 | ) | ||||||||||||||
Expiring 11/27/19 | JPMorgan Chase Bank, N.A. | ZAR | 14,069 | 945,000 | 927,695 | — | (17,305 | ) | ||||||||||||||
Expiring 12/18/19 | Barclays Bank PLC | ZAR | 19,353 | 1,299,000 | 1,272,398 | — | (26,602 | ) | ||||||||||||||
Expiring 12/18/19 | Barclays Bank PLC | ZAR | 10,274 | 698,000 | 675,461 | — | (22,539 | ) | ||||||||||||||
Expiring 12/18/19 | Citibank, N.A. | ZAR | 20,312 | 1,359,000 | 1,335,413 | — | (23,587 | ) | ||||||||||||||
Expiring 12/18/19 | HSBC Bank USA, N.A. | ZAR | 18,967 | 1,272,000 | 1,247,006 | — | (24,994 | ) | ||||||||||||||
Expiring 12/18/19 | JPMorgan Chase Bank, N.A. | ZAR | 44,497 | 2,891,659 | 2,925,464 | 33,805 | — | |||||||||||||||
Expiring 12/18/19 | JPMorgan Chase Bank, N.A. | ZAR | 39,645 | 2,610,273 | 2,606,482 | — | (3,791 | ) | ||||||||||||||
Expiring 12/18/19 | JPMorgan Chase Bank, N.A. | ZAR | 12,590 | 858,000 | 827,714 | — | (30,286 | ) | ||||||||||||||
Expiring 12/18/19 | JPMorgan Chase Bank, N.A. | ZAR | 7,763 | 499,235 | 510,388 | 11,153 | — | |||||||||||||||
See Notes to Financial Statements.
| PGIM Global Total Return Fund | 91 |
Schedule of Investments(continued)
as of October 31, 2019
Forward foreign currency exchange contracts outstanding at October 31, 2019 (continued):
Purchase Contracts | Counterparty | Notional Amount (000) | Value at Settlement Date | Current Value | Unrealized Appreciation | Unrealized Depreciation | ||||||||||||||||
OTC Forward Foreign Currency Exchange Contracts (cont’d.): |
| |||||||||||||||||||||
South African Rand (cont’d.), |
| |||||||||||||||||||||
Expiring 12/18/19 | The Toronto- Dominion Bank | ZAR | 12,511 | $ | 848,000 | $ | 822,521 | $ | — | $ | (25,479 | ) | ||||||||||
Expiring 12/18/19 | UBS AG | ZAR | 15,354 | 1,010,000 | 1,009,486 | — | (514 | ) | ||||||||||||||
Expiring 12/30/19 | Barclays Bank PLC | ZAR | 19,528 | 1,517,561 | 1,281,519 | — | (236,042 | ) | ||||||||||||||
Expiring 12/30/19 | BNP Paribas S.A. | ZAR | 41,262 | 2,607,000 | 2,707,777 | 100,777 | — | |||||||||||||||
Expiring 03/31/20 | Morgan Stanley & Co. International PLC | ZAR | 17,083 | 1,176,953 | 1,107,784 | — | (69,169 | ) | ||||||||||||||
Expiring 03/31/20 | UBS AG | ZAR | 28,239 | 1,831,000 | 1,831,261 | 261 | — | |||||||||||||||
Expiring 03/31/20 | UBS AG | ZAR | 21,550 | 1,510,705 | 1,397,480 | — | (113,225 | ) | ||||||||||||||
Expiring 07/29/20 | Goldman Sachs International | ZAR | 83,989 | 5,653,000 | 5,359,433 | — | (293,567 | ) | ||||||||||||||
Expiring 07/29/20 | Morgan Stanley & Co. International PLC | ZAR | 72,056 | 4,889,655 | 4,597,976 | — | (291,679 | ) | ||||||||||||||
Expiring 08/31/20 | BNP Paribas S.A. | ZAR | 45,248 | 3,035,141 | 2,874,235 | — | (160,906 | ) | ||||||||||||||
Expiring 09/30/20 | Barclays Bank PLC | ZAR | 60,930 | 4,051,742 | 3,854,540 | — | (197,202 | ) | ||||||||||||||
Expiring 09/30/20 | Citibank, N.A. | ZAR | 141,062 | 8,689,000 | 8,923,792 | 234,792 | — | |||||||||||||||
Expiring 09/30/20 | Morgan Stanley & Co. International PLC | ZAR | 11,451 | 750,000 | 724,400 | — | (25,600 | ) | ||||||||||||||
Expiring 01/29/21 | Barclays Bank PLC | ZAR | 82,671 | 5,095,122 | 5,142,570 | 47,448 | — | |||||||||||||||
Expiring 01/29/21 | Goldman Sachs International | ZAR | 53,446 | 3,511,000 | 3,324,638 | — | (186,362 | ) | ||||||||||||||
Expiring 01/29/21 | Morgan Stanley & Co. International PLC | ZAR | 120,569 | 8,081,000 | 7,500,004 | — | (580,996 | ) | ||||||||||||||
South Korean Won, | ||||||||||||||||||||||
Expiring 11/27/19 | Barclays Bank PLC | KRW | 1,596,256 | 1,328,000 | 1,364,684 | 36,684 | — | |||||||||||||||
Expiring 11/27/19 | Barclays Bank PLC | KRW | 1,247,554 | 1,033,000 | 1,066,569 | 33,569 | — | |||||||||||||||
Expiring 11/27/19 | JPMorgan Chase Bank, N.A. | KRW | 1,469,657 | 1,246,000 | 1,256,451 | 10,451 | — | |||||||||||||||
Expiring 11/27/19 | JPMorgan Chase Bank, N.A. | KRW | 257,396 | 213,316 | 220,055 | 6,739 | — | |||||||||||||||
See Notes to Financial Statements.
| 92 |
Forward foreign currency exchange contracts outstanding at October 31, 2019 (continued):
Purchase Contracts | Counterparty | Notional Amount (000) | Value at Settlement Date | Current Value | Unrealized Appreciation | Unrealized Depreciation | ||||||||||||||||
OTC Forward Foreign Currency Exchange Contracts (cont’d.): |
| |||||||||||||||||||||
South Korean Won (cont’d.), |
| |||||||||||||||||||||
Expiring 11/27/19 | Morgan Stanley & Co. International PLC | KRW | 1,867,134 | $ | 1,571,000 | $ | 1,596,265 | $ | 25,265 | $ | — | |||||||||||
Expiring 11/27/19 | Morgan Stanley & Co. International PLC | KRW | 1,483,910 | 1,267,000 | 1,268,637 | 1,637 | — | |||||||||||||||
Expiring 11/27/19 | UBS AG | KRW | 1,790,940 | 1,520,000 | 1,531,125 | 11,125 | — | |||||||||||||||
Expiring 12/18/19 | Barclays Bank PLC | KRW | 3,014,901 | 2,565,000 | 2,578,696 | 13,696 | — | |||||||||||||||
Expiring 12/18/19 | Barclays Bank PLC | KRW | 2,340,046 | 1,967,252 | 2,001,481 | 34,229 | — | |||||||||||||||
Expiring 12/18/19 | Barclays Bank PLC | KRW | 1,628,666 | 1,377,307 | 1,393,025 | 15,718 | — | |||||||||||||||
Expiring 12/18/19 | BNP Paribas S.A. | KRW | 2,947,581 | 2,478,000 | 2,521,116 | 43,116 | — | |||||||||||||||
Expiring 12/18/19 | Citibank, N.A. | KRW | 24,781,459 | 20,617,712 | 21,196,004 | 578,292 | — | |||||||||||||||
Expiring 12/18/19 | HSBC Bank USA, N.A. | KRW | 5,008,128 | 4,214,000 | 4,283,538 | 69,538 | — | |||||||||||||||
Expiring 12/18/19 | HSBC Bank USA, N.A. | KRW | 3,576,482 | 3,010,000 | 3,059,026 | 49,026 | — | |||||||||||||||
Expiring 12/18/19 | HSBC Bank USA, N.A. | KRW | 3,527,395 | 2,956,000 | 3,017,041 | 61,041 | — | |||||||||||||||
Expiring 12/18/19 | JPMorgan Chase Bank, N.A. | KRW | 4,124,789 | 3,534,545 | 3,528,003 | — | (6,542 | ) | ||||||||||||||
Expiring 12/18/19 | JPMorgan Chase Bank, N.A. | KRW | 3,199,980 | 2,692,000 | 2,736,998 | 44,998 | — | |||||||||||||||
Expiring 12/18/19 | JPMorgan Chase Bank, N.A. | KRW | 2,096,842 | 1,790,000 | 1,793,465 | 3,465 | — | |||||||||||||||
Expiring 12/18/19 | JPMorgan Chase Bank, N.A. | KRW | 2,080,996 | 1,767,000 | 1,779,911 | 12,911 | — | |||||||||||||||
Expiring 02/28/20 | Morgan Stanley & Co. International PLC | KRW | 4,461,441 | 3,823,000 | 3,823,826 | 826 | — | |||||||||||||||
Expiring 10/30/20 | BNP Paribas S.A. | KRW | 10,138,442 | 8,909,000 | 8,750,736 | — | (158,264 | ) | ||||||||||||||
Expiring 10/30/20 | JPMorgan Chase Bank, N.A. | KRW | 3,104,580 | 2,605,388 | 2,679,639 | 74,251 | — | |||||||||||||||
Expiring 07/30/21 | HSBC Bank USA, N.A. | KRW | 15,153,153 | 12,858,000 | 13,177,309 | 319,309 | — | |||||||||||||||
Swedish Krona, | ||||||||||||||||||||||
Expiring 01/17/20 | Barclays Bank PLC | SEK | 24,683 | 2,557,000 | 2,568,163 | 11,163 | — | |||||||||||||||
See Notes to Financial Statements.
| PGIM Global Total Return Fund | 93 |
Schedule of Investments(continued)
as of October 31, 2019
Forward foreign currency exchange contracts outstanding at October 31, 2019 (continued):
Purchase Contracts | Counterparty | Notional Amount (000) | Value at Settlement Date | Current Value | Unrealized Appreciation | Unrealized Depreciation | ||||||||||||||||
OTC Forward Foreign Currency Exchange Contracts (cont’d.): |
| |||||||||||||||||||||
Swedish Krona (cont’d.), |
| |||||||||||||||||||||
Expiring 01/17/20 | Barclays Bank PLC | SEK | 16,495 | $ | 1,715,000 | $ | 1,716,207 | $ | 1,207 | $ | — | |||||||||||
Expiring 01/17/20 | BNP Paribas S.A. | SEK | 14,799 | 1,547,000 | 1,539,790 | — | (7,210 | ) | ||||||||||||||
Swiss Franc, | ||||||||||||||||||||||
Expiring 01/17/20 | BNP Paribas S.A. | CHF | 1,131 | 1,149,000 | 1,154,213 | 5,213 | — | |||||||||||||||
Expiring 01/17/20 | BNP Paribas S.A. | CHF | 1,112 | 1,135,000 | 1,134,143 | — | (857 | ) | ||||||||||||||
Expiring 01/17/20 | Morgan Stanley & Co. International PLC | CHF | 1,419 | 1,433,000 | 1,447,783 | 14,783 | — | |||||||||||||||
Expiring 01/17/20 | Morgan Stanley & Co. International PLC | CHF | 1,282 | 1,301,700 | 1,307,778 | 6,078 | — | |||||||||||||||
Expiring 10/30/20 | Goldman Sachs International | CHF | 8,271 | 8,946,000 | 8,601,884 | — | (344,116 | ) | ||||||||||||||
Expiring 10/30/20 | Morgan Stanley & Co. International PLC | CHF | 3,720 | 3,945,000 | 3,868,739 | — | (76,261 | ) | ||||||||||||||
Expiring 10/30/20 | UBS AG | CHF | 3,887 | 4,001,182 | 4,042,008 | 40,826 | — | |||||||||||||||
Thai Baht, | ||||||||||||||||||||||
Expiring 12/18/19 | Barclays Bank PLC | THB | 62,472 | 2,026,000 | 2,070,034 | 44,034 | — | |||||||||||||||
Expiring 12/18/19 | Barclays Bank PLC | THB | 39,302 | 1,289,021 | 1,302,301 | 13,280 | — | |||||||||||||||
Expiring 12/18/19 | BNP Paribas S.A. | THB | 67,109 | 2,207,000 | 2,223,704 | 16,704 | — | |||||||||||||||
Expiring 12/18/19 | Citibank, N.A. | THB | 72,971 | 2,387,000 | 2,417,920 | 30,920 | — | |||||||||||||||
Expiring 12/18/19 | Citibank, N.A. | THB | 55,388 | 1,808,000 | 1,835,314 | 27,314 | — | |||||||||||||||
Expiring 12/18/19 | Citibank, N.A. | THB | 54,657 | 1,785,000 | 1,811,079 | 26,079 | — | |||||||||||||||
Expiring 12/18/19 | Credit Suisse International | THB | 165,392 | 5,376,000 | 5,480,356 | 104,356 | — | |||||||||||||||
Expiring 12/18/19 | Goldman Sachs International | THB | 97,446 | 3,193,000 | 3,228,932 | 35,932 | — | |||||||||||||||
Expiring 12/18/19 | HSBC Bank USA, N.A. | THB | 121,122 | 3,966,000 | 4,013,430 | 47,430 | — | |||||||||||||||
Expiring 12/18/19 | HSBC Bank USA, N.A. | THB | 46,909 | 1,536,000 | 1,554,369 | 18,369 | — | |||||||||||||||
Expiring 12/18/19 | JPMorgan Chase Bank, N.A. | THB | 192,252 | 6,264,930 | 6,370,370 | 105,440 | — | |||||||||||||||
See Notes to Financial Statements.
| 94 |
Forward foreign currency exchange contracts outstanding at October 31, 2019 (continued):
Purchase Contracts | Counterparty | Notional Amount (000) | Value at Settlement Date | Current Value | Unrealized Appreciation | Unrealized Depreciation | ||||||||||||||||
OTC Forward Foreign Currency Exchange Contracts (cont’d.): |
| |||||||||||||||||||||
Thai Baht (cont’d.), |
| |||||||||||||||||||||
Expiring 12/18/19 | JPMorgan Chase Bank, N.A. | THB | 73,337 | $ | 2,414,000 | $ | 2,430,071 | $ | 16,071 | $ | — | |||||||||||
Expiring 12/18/19 | JPMorgan Chase Bank, N.A. | THB | 69,600 | 2,276,000 | 2,306,236 | 30,236 | — | |||||||||||||||
Expiring 12/18/19 | JPMorgan Chase Bank, N.A. | THB | 50,832 | 1,661,000 | 1,684,332 | 23,332 | — | |||||||||||||||
Expiring 12/18/19 | Morgan Stanley & Co. International PLC | THB | 77,670 | 2,537,000 | 2,573,645 | 36,645 | — | |||||||||||||||
Expiring 12/18/19 | UBS AG | THB | 54,518 | 1,791,000 | 1,806,484 | 15,484 | — | |||||||||||||||
Turkish Lira, | ||||||||||||||||||||||
Expiring 11/27/19 | HSBC Bank USA, N.A. | TRY | 7,221 | 1,201,000 | 1,253,811 | 52,811 | — | |||||||||||||||
Expiring 11/27/19 | HSBC Bank USA, N.A. | TRY | 6,478 | 1,115,000 | 1,124,788 | 9,788 | — | |||||||||||||||
Expiring 12/18/19 | Barclays Bank PLC | TRY | 17,200 | 2,940,326 | 2,970,038 | 29,712 | — | |||||||||||||||
Expiring 12/18/19 | Barclays Bank PLC | TRY | 16,597 | 2,834,100 | 2,865,979 | 31,879 | — | |||||||||||||||
Expiring 12/18/19 | Barclays Bank PLC | TRY | 11,011 | 1,882,683 | 1,901,357 | 18,674 | — | |||||||||||||||
Expiring 12/18/19 | Barclays Bank PLC | TRY | 10,529 | 1,814,300 | 1,818,197 | 3,897 | — | |||||||||||||||
Expiring 12/18/19 | Barclays Bank PLC | TRY | 4,265 | 724,000 | 736,496 | 12,496 | — | |||||||||||||||
Expiring 12/18/19 | Barclays Bank PLC | TRY | 3,932 | 681,000 | 678,994 | — | (2,006 | ) | ||||||||||||||
Expiring 12/18/19 | Citibank, N.A. | TRY | 4,982 | 856,000 | 860,294 | 4,294 | — | |||||||||||||||
Expiring 12/18/19 | Goldman Sachs International | TRY | 15,745 | 2,683,685 | 2,718,738 | 35,053 | — | |||||||||||||||
Expiring 12/18/19 | Goldman Sachs International | TRY | 12,078 | 2,073,500 | 2,085,509 | 12,009 | — | |||||||||||||||
Expiring 12/18/19 | UBS AG | TRY | 4,756 | 812,000 | 821,302 | 9,302 | — | |||||||||||||||
Expiring 12/24/19 | Goldman Sachs International | TRY | 33,041 | 5,976,000 | 5,696,715 | — | (279,285 | ) | ||||||||||||||
Expiring 01/31/20 | Barclays Bank PLC | TRY | 6,169 | 939,663 | 1,053,376 | 113,713 | — | |||||||||||||||
Expiring 04/30/20 | Barclays Bank PLC | TRY | 11,663 | 1,698,566 | 1,947,048 | 248,482 | — | |||||||||||||||
See Notes to Financial Statements.
| PGIM Global Total Return Fund | 95 |
Schedule of Investments(continued)
as of October 31, 2019
Forward foreign currency exchange contracts outstanding at October 31, 2019 (continued):
Purchase Contracts | Counterparty | Notional Amount (000) | Value at Settlement Date | Current Value | Unrealized Appreciation | Unrealized Depreciation | ||||||||||||||||
OTC Forward Foreign Currency Exchange Contracts (cont’d.): |
| |||||||||||||||||||||
Turkish Lira (cont’d.), |
| |||||||||||||||||||||
Expiring 04/30/20 | Citibank, N.A. | TRY | 5,178 | $ | 881,000 | $ | 864,458 | $ | — | $ | (16,542 | ) | ||||||||||
Expiring 04/30/20 | Deutsche Bank AG | TRY | 3,736 | 373,000 | 623,618 | 250,618 | — | |||||||||||||||
Expiring 04/30/20 | Morgan Stanley & Co. International PLC | TRY | 90,834 | 14,164,000 | 15,163,723 | 999,723 | — | |||||||||||||||
Expiring 06/30/20 | Bank of America, N.A. | TRY | 7,742 | 1,162,000 | 1,272,671 | 110,671 | — | |||||||||||||||
Expiring 06/30/20 | Deutsche Bank AG | TRY | 175,019 | 16,910,000 | 28,771,523 | 11,861,523 | — | |||||||||||||||
Expiring 07/29/20 | Barclays Bank PLC | TRY | 37,033 | 5,158,486 | 6,044,008 | 885,522 | — | |||||||||||||||
Expiring 10/30/20 | Barclays Bank PLC | TRY | 6,807 | 978,311 | 1,085,844 | 107,533 | — | |||||||||||||||
Expiring 10/30/20 | Morgan Stanley & Co. International PLC | TRY | 4,818 | 697,000 | 768,575 | 71,575 | — | |||||||||||||||
Expiring 02/26/21 | Barclays Bank PLC | TRY | 26,637 | 3,375,579 | 4,116,059 | 740,480 | — | |||||||||||||||
Expiring 02/26/21 | Barclays Bank PLC | TRY | 14,639 | 2,008,630 | 2,262,150 | 253,520 | — | |||||||||||||||
Expiring 02/26/21 | Barclays Bank PLC | TRY | 10,093 | 1,396,000 | 1,559,642 | 163,642 | — | |||||||||||||||
Expiring 02/26/21 | Morgan Stanley & Co. International PLC | TRY | 154,606 | 18,616,000 | 23,890,611 | 5,274,611 | — | |||||||||||||||
Expiring 05/28/21 | BNP Paribas S.A. | TRY | 10,016 | 1,287,000 | 1,511,499 | 224,499 | — | |||||||||||||||
Expiring 05/28/21 | Goldman Sachs International | TRY | 3,514 | 507,678 | 530,234 | 22,556 | — | |||||||||||||||
|
|
|
|
|
|
|
| |||||||||||||||
| $ | 1,929,414,475 | $ | 1,962,725,454 | 44,386,034 | (11,075,055 | ) | ||||||||||||||||
|
|
|
|
|
|
|
| |||||||||||||||
Sale Contracts | Counterparty | Notional Amount (000) | Value at Settlement Date | Current Value | Unrealized Appreciation | Unrealized Depreciation | ||||||||||||||||
OTC Forward Foreign Currency Exchange Contracts: |
| |||||||||||||||||||||
Australian Dollar, | ||||||||||||||||||||||
Expiring 11/27/19 | Bank of America, N.A. | AUD | 3,836 | $ | 2,606,000 | $ | 2,646,458 | $ | — | $ | (40,458 | ) | ||||||||||
Expiring 11/27/19 | Barclays Bank PLC | AUD | 1,728 | 1,187,000 | 1,192,138 | — | (5,138 | ) | ||||||||||||||
See Notes to Financial Statements.
| 96 |
Forward foreign currency exchange contracts outstanding at October 31, 2019 (continued):
Sale Contracts | Counterparty | Notional Amount (000) | Value at Settlement Date | Current Value | Unrealized Appreciation | Unrealized Depreciation | ||||||||||||||||
OTC Forward Foreign Currency Exchange Contracts (cont’d.): |
| |||||||||||||||||||||
Australian Dollar (cont’d.), |
| |||||||||||||||||||||
Expiring 11/27/19 | HSBC Bank USA, N.A. | AUD | 1,935 | $ | 1,314,000 | $ | 1,334,636 | $ | — | $ | (20,636 | ) | ||||||||||
Expiring 11/27/19 | JPMorgan Chase Bank, N.A. | AUD | 2,668 | 1,808,000 | 1,840,718 | — | (32,718 | ) | ||||||||||||||
Expiring 01/22/20 | Barclays Bank PLC | AUD | 2,850 | 1,950,000 | 1,969,027 | — | (19,027 | ) | ||||||||||||||
Expiring 01/22/20 | BNP Paribas S.A. | AUD | 1,859 | 1,283,000 | 1,283,920 | — | (920 | ) | ||||||||||||||
Expiring 01/22/20 | HSBC Bank USA, N.A. | AUD | 23,445 | 16,051,539 | 16,195,421 | — | (143,882 | ) | ||||||||||||||
Expiring 01/31/20 | JPMorgan Chase Bank, N.A. | AUD | 2,107 | 1,437,854 | 1,456,009 | — | (18,155 | ) | ||||||||||||||
Expiring 01/31/20 | Morgan Stanley & Co. International PLC | AUD | 7,980 | 5,765,949 | 5,513,542 | 252,407 | — | |||||||||||||||
Expiring 11/27/20 | JPMorgan Chase Bank, N.A. | AUD | 2,575 | 1,766,733 | 1,787,250 | — | (20,517 | ) | ||||||||||||||
Brazilian Real, | ||||||||||||||||||||||
Expiring 11/04/19 | Barclays Bank PLC | BRL | 7,543 | 1,798,000 | 1,880,399 | — | (82,399 | ) | ||||||||||||||
Expiring 11/04/19 | JPMorgan Chase Bank, N.A. | BRL | 2,537 | 610,000 | 632,527 | — | (22,527 | ) | ||||||||||||||
Expiring 11/04/19 | Morgan Stanley & Co. International PLC | BRL | 4,062 | 981,000 | 1,012,471 | — | (31,471 | ) | ||||||||||||||
Expiring 11/04/19 | The Toronto- Dominion Bank | BRL | 101,691 | 24,398,401 | 25,349,587 | — | (951,186 | ) | ||||||||||||||
Expiring 12/03/19 | BNP Paribas S.A. | BRL | 59,797 | 14,969,202 | 14,879,566 | 89,636 | — | |||||||||||||||
Expiring 12/24/19 | Bank of America, N.A. | BRL | 11,601 | 2,840,000 | 2,883,721 | — | (43,721 | ) | ||||||||||||||
Expiring 12/24/19 | Bank of America, N.A. | BRL | 5,473 | 1,311,000 | 1,360,511 | — | (49,511 | ) | ||||||||||||||
Expiring 12/24/19 | Bank of America, N.A. | BRL | 4,121 | 1,021,000 | 1,024,409 | — | (3,409 | ) | ||||||||||||||
Expiring 12/24/19 | Barclays Bank PLC | BRL | 7,792 | 1,910,000 | 1,936,935 | — | (26,935 | ) | ||||||||||||||
Expiring 12/24/19 | Barclays Bank PLC | BRL | 6,336 | 1,527,000 | 1,574,838 | — | (47,838 | ) | ||||||||||||||
Expiring 12/24/19 | Barclays Bank PLC | BRL | 4,824 | 1,171,000 | 1,199,069 | — | (28,069 | ) | ||||||||||||||
Expiring 12/24/19 | BNP Paribas S.A. | BRL | 4,618 | 1,112,000 | 1,147,832 | — | (35,832 | ) | ||||||||||||||
See Notes to Financial Statements.
| PGIM Global Total Return Fund | 97 |
Schedule of Investments(continued)
as of October 31, 2019
Forward foreign currency exchange contracts outstanding at October 31, 2019 (continued):
Sale Contracts | Counterparty | Notional Amount (000) | Value at Settlement Date | Current Value | Unrealized Appreciation | Unrealized Depreciation | ||||||||||||||||
OTC Forward Foreign Currency Exchange Contracts (cont’d.): |
| |||||||||||||||||||||
Brazilian Real (cont’d.), |
| |||||||||||||||||||||
Expiring 12/24/19 | BNP Paribas S.A. | BRL | 4,604 | $ | 1,143,000 | $ | 1,144,302 | $ | — | $ | (1,302 | ) | ||||||||||
Expiring 12/24/19 | BNP Paribas S.A. | BRL | 3,945 | 975,000 | 980,485 | — | (5,485 | ) | ||||||||||||||
Expiring 12/24/19 | Citibank, N.A. | BRL | 13,908 | 3,455,000 | 3,457,090 | — | (2,090 | ) | ||||||||||||||
Expiring 12/24/19 | Citibank, N.A. | BRL | 8,360 | 2,090,000 | 2,078,017 | 11,983 | — | |||||||||||||||
Expiring 12/24/19 | Citibank, N.A. | BRL | 7,535 | 1,817,000 | 1,872,974 | — | (55,974 | ) | ||||||||||||||
Expiring 12/24/19 | Citibank, N.A. | BRL | 4,634 | 1,127,000 | 1,151,745 | — | (24,745 | ) | ||||||||||||||
Expiring 12/24/19 | Citibank, N.A. | BRL | 3,746 | 914,000 | 931,183 | — | (17,183 | ) | ||||||||||||||
Expiring 12/24/19 | JPMorgan Chase Bank, N.A. | BRL | 7,093 | 1,998,000 | 1,763,058 | 234,942 | — | |||||||||||||||
Expiring 12/24/19 | JPMorgan Chase Bank, N.A. | BRL | 5,126 | 1,450,000 | 1,274,090 | 175,910 | — | |||||||||||||||
Expiring 12/24/19 | Morgan Stanley & Co. International PLC | BRL | 5,850 | 1,466,000 | 1,454,169 | 11,831 | — | |||||||||||||||
Expiring 12/24/19 | UBS AG | BRL | 3,166 | 790,000 | 787,042 | 2,958 | — | |||||||||||||||
Expiring 03/31/20 | Bank of America, N.A. | BRL | 79,613 | 18,932,000 | 19,694,938 | — | (762,938 | ) | ||||||||||||||
Expiring 03/31/20 | JPMorgan Chase Bank, N.A. | BRL | 42,174 | 11,787,000 | 10,433,141 | 1,353,859 | — | |||||||||||||||
Expiring 03/31/20 | JPMorgan Chase Bank, N.A. | BRL | 9,484 | 2,282,267 | 2,346,179 | — | (63,912 | ) | ||||||||||||||
Expiring 06/30/20 | Deutsche Bank AG | BRL | 88,992 | 21,600,000 | 21,904,451 | — | (304,451 | ) | ||||||||||||||
Expiring 07/29/20 | Deutsche Bank AG | BRL | 29,229 | 6,610,000 | 7,182,115 | — | (572,115 | ) | ||||||||||||||
Expiring 08/31/20 | Citibank, N.A. | BRL | 2,686 | 663,819 | 658,596 | 5,223 | — | |||||||||||||||
Expiring 08/31/20 | Deutsche Bank AG | BRL | 28,784 | 6,280,000 | 7,058,484 | — | (778,484 | ) | ||||||||||||||
Expiring 12/23/20 | Citibank, N.A. | BRL | 19,657 | 4,824,000 | 4,781,974 | 42,026 | — | |||||||||||||||
Expiring 12/23/20 | Citibank, N.A. | BRL | 4,358 | 1,065,453 | 1,060,240 | 5,213 | — | |||||||||||||||
Expiring 12/23/20 | Morgan Stanley & Co. International PLC | BRL | 46,068 | 11,571,000 | 11,206,726 | 364,274 | — | |||||||||||||||
See Notes to Financial Statements.
| 98 |
Forward foreign currency exchange contracts outstanding at October 31, 2019 (continued):
Sale Contracts | Counterparty | Notional Amount (000) | Value at Settlement Date | Current Value | Unrealized Appreciation | Unrealized Depreciation | ||||||||||||||||
OTC Forward Foreign Currency Exchange Contracts (cont’d.): |
| |||||||||||||||||||||
Brazilian Real (cont’d.), |
| |||||||||||||||||||||
Expiring 01/29/21 | Citibank, N.A. | BRL | 43,567 | $ | 10,642,000 | $ | 10,567,051 | $ | 74,949 | $ | — | |||||||||||
Expiring 03/31/21 | Citibank, N.A. | BRL | 122,798 | 28,955,000 | 29,639,253 | — | (684,253 | ) | ||||||||||||||
Expiring 03/31/21 | Morgan Stanley & Co. International PLC | BRL | 23,832 | 5,878,515 | 5,752,105 | 126,410 | — | |||||||||||||||
British Pound, | ||||||||||||||||||||||
Expiring 11/27/19 | HSBC Bank USA, N.A. | GBP | 1,436 | 2,110,202 | 1,861,693 | 248,509 | — | |||||||||||||||
Expiring 11/27/19 | HSBC Bank USA, N.A. | GBP | 1,229 | 1,580,000 | 1,592,745 | — | (12,745 | ) | ||||||||||||||
Expiring 11/27/19 | JPMorgan Chase Bank, N.A. | GBP | 911 | 1,333,917 | 1,181,620 | 152,297 | — | |||||||||||||||
Expiring 11/27/19 | UBS AG | GBP | 292 | 419,347 | 378,831 | 40,516 | — | |||||||||||||||
Expiring 01/17/20 | Barclays Bank PLC | GBP | 3,229 | 4,162,000 | 4,193,696 | — | (31,696 | ) | ||||||||||||||
Expiring 01/17/20 | Barclays Bank PLC | GBP | 2,171 | 2,793,000 | 2,818,998 | — | (25,998 | ) | ||||||||||||||
Expiring 01/17/20 | Barclays Bank PLC | GBP | 2,016 | 2,608,000 | 2,617,768 | — | (9,768 | ) | ||||||||||||||
Expiring 01/17/20 | Barclays Bank PLC | GBP | 1,644 | 2,144,000 | 2,135,754 | 8,246 | — | |||||||||||||||
Expiring 01/17/20 | Citibank, N.A. | GBP | 18,824 | 23,714,889 | 24,448,397 | — | (733,508 | ) | ||||||||||||||
Expiring 01/17/20 | Citibank, N.A. | GBP | 741 | 958,436 | 962,411 | — | (3,975 | ) | ||||||||||||||
Expiring 01/17/20 | Deutsche Bank AG | GBP | 18,824 | 23,863,978 | 24,448,399 | — | (584,421 | ) | ||||||||||||||
Expiring 01/17/20 | Morgan Stanley & Co. International PLC | GBP | 4,207 | 5,462,288 | 5,464,298 | — | (2,010 | ) | ||||||||||||||
Expiring 01/17/20 | Morgan Stanley & Co. International PLC | GBP | 3,863 | 4,970,973 | 5,016,533 | — | (45,560 | ) | ||||||||||||||
Expiring 01/17/20 | Morgan Stanley & Co. International PLC | GBP | 3,849 | 4,977,000 | 4,998,513 | — | (21,513 | ) | ||||||||||||||
Expiring 01/17/20 | Morgan Stanley & Co. International PLC | GBP | 1,526 | 1,972,844 | 1,981,372 | — | (8,528 | ) | ||||||||||||||
Expiring 07/29/20 | Bank of America, N.A. | GBP | 24,097 | 30,055,465 | 31,431,783 | — | (1,376,318 | ) | ||||||||||||||
Chilean Peso, | ||||||||||||||||||||||
Expiring 12/18/19 | JPMorgan Chase Bank, N.A. | CLP | 18,408,731 | 25,532,220 | 24,852,964 | 679,256 | — | |||||||||||||||
See Notes to Financial Statements.
| PGIM Global Total Return Fund | 99 |
Schedule of Investments(continued)
as of October 31, 2019
Forward foreign currency exchange contracts outstanding at October 31, 2019 (continued):
Sale Contracts | Counterparty | Notional Amount (000) | Value at Settlement Date | Current Value | Unrealized Appreciation | Unrealized Depreciation | ||||||||||||||||
OTC Forward Foreign Currency Exchange Contracts (cont’d.): |
| |||||||||||||||||||||
Chilean Peso (cont’d.), |
| |||||||||||||||||||||
Expiring 12/18/19 | Morgan Stanley & Co. International PLC | CLP | 9,204,365 | $ | 12,766,110 | $ | 12,426,482 | $ | 339,628 | $ | — | |||||||||||
Expiring 12/18/19 | Morgan Stanley & Co. International PLC | CLP | 9,204,365 | 12,941,111 | 12,426,482 | 514,629 | — | |||||||||||||||
Expiring 12/18/19 | Morgan Stanley & Co. International PLC | CLP | 647,181 | 896,000 | 873,735 | 22,265 | — | |||||||||||||||
Chinese Renminbi, | ||||||||||||||||||||||
Expiring 01/23/20 | HSBC Bank USA, N.A. | CNH | 100,754 | 14,218,915 | 14,261,965 | — | (43,050 | ) | ||||||||||||||
Expiring 02/14/20 | BNP Paribas S.A. | CNH | 112,843 | 15,905,460 | 15,964,014 | — | (58,554 | ) | ||||||||||||||
Expiring 02/28/20 | Morgan Stanley & Co. International PLC | CNH | 71,818 | 10,657,000 | 10,156,477 | 500,523 | — | |||||||||||||||
Expiring 05/14/21 | JPMorgan Chase Bank, N.A. | CNH | 61,753 | 8,864,088 | 8,624,834 | 239,254 | — | |||||||||||||||
Colombian Peso, | ||||||||||||||||||||||
Expiring 12/18/19 | Barclays Bank PLC | COP | 5,061,417 | 1,497,000 | 1,494,757 | 2,243 | — | |||||||||||||||
Expiring 12/18/19 | Barclays Bank PLC | COP | 4,576,540 | 1,351,000 | 1,351,561 | — | (561 | ) | ||||||||||||||
Expiring 12/18/19 | Barclays Bank PLC | COP | 3,100,652 | 917,000 | 915,697 | 1,303 | — | |||||||||||||||
Expiring 12/18/19 | BNP Paribas S.A. | COP | 3,735,625 | 1,075,000 | 1,103,219 | — | (28,219 | ) | ||||||||||||||
Expiring 12/18/19 | BNP Paribas S.A. | COP | 3,221,649 | 933,000 | 951,430 | — | (18,430 | ) | ||||||||||||||
Expiring 12/18/19 | Goldman Sachs International | COP | 12,060,315 | 3,550,284 | 3,561,699 | — | (11,415 | ) | ||||||||||||||
Expiring 12/18/19 | Goldman Sachs International | COP | 4,494,980 | 1,324,000 | 1,327,475 | — | (3,475 | ) | ||||||||||||||
Expiring 12/18/19 | Goldman Sachs International | COP | 2,155,483 | 638,000 | 636,566 | 1,434 | — | |||||||||||||||
Expiring 12/18/19 | JPMorgan Chase Bank, N.A. | COP | 29,235,611 | 8,527,231 | 8,633,974 | — | (106,743 | ) | ||||||||||||||
Expiring 12/18/19 | JPMorgan Chase Bank, N.A. | COP | 10,079,584 | 2,966,669 | 2,976,742 | — | (10,073 | ) | ||||||||||||||
Expiring 12/18/19 | JPMorgan Chase Bank, N.A. | COP | 4,766,253 | 1,409,300 | 1,407,588 | 1,712 | — | |||||||||||||||
Expiring 12/18/19 | UBS AG | COP | 5,180,692 | 1,495,000 | 1,529,982 | — | (34,982 | ) | ||||||||||||||
Expiring 12/18/19 | UBS AG | COP | 2,457,750 | 725,000 | 725,832 | — | (832 | ) | ||||||||||||||
See Notes to Financial Statements.
| 100 |
Forward foreign currency exchange contracts outstanding at October 31, 2019 (continued):
Sale Contracts | Counterparty | Notional Amount (000) | Value at Settlement Date | Current Value | Unrealized Appreciation | Unrealized Depreciation | ||||||||||||||||
OTC Forward Foreign Currency Exchange Contracts (cont’d.): |
| |||||||||||||||||||||
Czech Koruna, |
| |||||||||||||||||||||
Expiring 01/17/20 | Barclays Bank PLC | CZK | 59,003 | $ | 2,525,376 | $ | 2,582,251 | $ | — | $ | (56,875 | ) | ||||||||||
Egyptian Pound, | ||||||||||||||||||||||
Expiring 12/23/19 | Citibank, N.A. | EGP | 38,075 | 2,288,147 | 2,325,408 | — | (37,261 | ) | ||||||||||||||
Expiring 12/23/19 | Citibank, N.A. | EGP | 9,747 | 587,090 | 595,302 | — | (8,212 | ) | ||||||||||||||
Euro, | ||||||||||||||||||||||
Expiring 11/27/19 | Citibank, N.A. | EUR | 494 | 646,795 | 552,430 | 94,365 | — | |||||||||||||||
Expiring 11/27/19 | Deutsche Bank AG | EUR | 3,440 | 3,840,832 | 3,842,943 | — | (2,111 | ) | ||||||||||||||
Expiring 11/27/19 | Deutsche Bank AG | EUR | 1,480 | 1,654,000 | 1,653,992 | 8 | — | |||||||||||||||
Expiring 11/27/19 | Morgan Stanley & Co. International PLC | EUR | 654 | 788,438 | 730,177 | 58,261 | — | |||||||||||||||
Expiring 12/30/19 | Deutsche Bank AG | EUR | 727 | 937,525 | 814,531 | 122,994 | — | |||||||||||||||
Expiring 01/17/20 | Barclays Bank PLC | EUR | 5,076 | 5,692,279 | 5,692,525 | — | (246 | ) | ||||||||||||||
Expiring 01/17/20 | BNP Paribas S.A. | EUR | 2,439 | 2,724,000 | 2,735,374 | — | (11,374 | ) | ||||||||||||||
Expiring 01/17/20 | BNP Paribas S.A. | EUR | 2,219 | 2,480,000 | 2,488,383 | — | (8,383 | ) | ||||||||||||||
Expiring 01/17/20 | BNP Paribas S.A. | EUR | 1,805 | 2,024,000 | 2,024,069 | — | (69 | ) | ||||||||||||||
Expiring 01/17/20 | Citibank, N.A. | EUR | 2,279 | 2,552,892 | 2,555,626 | — | (2,734 | ) | ||||||||||||||
Expiring 01/17/20 | Deutsche Bank AG | EUR | 5,390 | 6,042,077 | 6,045,346 | — | (3,269 | ) | ||||||||||||||
Expiring 01/17/20 | HSBC Bank USA, N.A. | EUR | 91,974 | 102,101,213 | 103,148,922 | — | (1,047,709 | ) | ||||||||||||||
Expiring 01/17/20 | JPMorgan Chase Bank, N.A. | EUR | 98,656 | 109,590,417 | 110,642,717 | — | (1,052,300 | ) | ||||||||||||||
Expiring 01/17/20 | UBS AG | EUR | 107,154 | 118,714,111 | 120,173,699 | — | (1,459,588 | ) | ||||||||||||||
Expiring 02/28/20 | Bank of America, N.A. | EUR | 6,895 | 8,400,868 | 7,751,968 | 648,900 | — | |||||||||||||||
Expiring 02/28/20 | BNP Paribas S.A. | EUR | 9,958 | 12,566,000 | 11,195,663 | 1,370,337 | — | |||||||||||||||
Expiring 07/29/20 | The Toronto- Dominion Bank | EUR | 2,015 | 2,399,318 | 2,285,482 | 113,836 | — | |||||||||||||||
See Notes to Financial Statements.
| PGIM Global Total Return Fund | 101 |
Schedule of Investments(continued)
as of October 31, 2019
Forward foreign currency exchange contracts outstanding at October 31, 2019 (continued):
Sale Contracts | Counterparty | Notional Amount (000) | Value at Settlement Date | Current Value | Unrealized Appreciation | Unrealized Depreciation | ||||||||||||||||
OTC Forward Foreign Currency Exchange Contracts (cont’d.): |
| |||||||||||||||||||||
Euro (cont’d.), |
| |||||||||||||||||||||
Expiring 07/29/20 | UBS AG | EUR | 3,951 | $ | 4,814,659 | $ | 4,482,367 | $ | 332,292 | $ | — | |||||||||||
Hungarian Forint, | ||||||||||||||||||||||
Expiring 01/17/20 | Barclays Bank PLC | HUF | 421,925 | 1,433,000 | 1,438,526 | — | (5,526 | ) | ||||||||||||||
Expiring 01/17/20 | Barclays Bank PLC | HUF | 298,134 | 1,010,000 | 1,016,469 | — | (6,469 | ) | ||||||||||||||
Expiring 01/17/20 | Barclays Bank PLC | HUF | 272,036 | 921,000 | 927,487 | — | (6,487 | ) | ||||||||||||||
Expiring 01/17/20 | The Toronto- Dominion Bank | HUF | 6,070,382 | 20,337,993 | 20,696,554 | — | (358,561 | ) | ||||||||||||||
Indian Rupee, | ||||||||||||||||||||||
Expiring 12/18/19 | Bank of America, N.A. | INR | 148,946 | 2,072,000 | 2,083,773 | — | (11,773 | ) | ||||||||||||||
Expiring 12/18/19 | Barclays Bank PLC | INR | 105,513 | 1,472,000 | 1,476,142 | — | (4,142 | ) | ||||||||||||||
Expiring 12/18/19 | BNP Paribas S.A. | INR | 83,344 | 1,159,000 | 1,165,991 | — | (6,991 | ) | ||||||||||||||
Expiring 12/18/19 | Citibank, N.A. | INR | 111,989 | 1,563,000 | 1,566,739 | — | (3,739 | ) | ||||||||||||||
Expiring 12/18/19 | HSBC Bank USA, N.A. | INR | 405,698 | 5,639,014 | 5,675,781 | — | (36,767 | ) | ||||||||||||||
Expiring 12/18/19 | HSBC Bank USA, N.A. | INR | 192,707 | 2,683,685 | 2,695,995 | — | (12,310 | ) | ||||||||||||||
Expiring 12/18/19 | HSBC Bank USA, N.A. | INR | 153,104 | 2,138,000 | 2,141,944 | — | (3,944 | ) | ||||||||||||||
Expiring 12/18/19 | Morgan Stanley & Co. International PLC | INR | 112,080 | 1,567,000 | 1,568,012 | — | (1,012 | ) | ||||||||||||||
Expiring 10/30/20 | HSBC Bank USA, N.A. | INR | 450,791 | 5,890,000 | 6,080,094 | — | (190,094 | ) | ||||||||||||||
Expiring 12/23/20 | BNP Paribas S.A. | INR | 257,208 | 3,333,000 | 3,446,872 | — | (113,872 | ) | ||||||||||||||
Expiring 02/26/21 | Bank of America, N.A. | INR | 257,903 | 3,425,000 | 3,429,714 | — | (4,714 | ) | ||||||||||||||
Expiring 02/26/21 | Goldman Sachs International | INR | 96,088 | 1,250,000 | 1,277,819 | — | (27,819 | ) | ||||||||||||||
Expiring 09/30/21 | Bank of America, N.A. | INR | 896,369 | 11,578,000 | 11,624,496 | — | (46,496 | ) | ||||||||||||||
Indonesian Rupiah, | ||||||||||||||||||||||
Expiring 12/18/19 | Barclays Bank PLC | IDR | 58,883,153 | 4,127,806 | 4,159,240 | — | (31,434 | ) | ||||||||||||||
See Notes to Financial Statements.
| 102 |
Forward foreign currency exchange contracts outstanding at October 31, 2019 (continued):
Sale Contracts | Counterparty | Notional Amount (000) | Value at Settlement Date | Current Value | Unrealized Appreciation | Unrealized Depreciation | ||||||||||||||||
OTC Forward Foreign Currency Exchange Contracts (cont’d.): |
| |||||||||||||||||||||
Indonesian Rupiah (cont’d.), |
| |||||||||||||||||||||
Expiring 12/18/19 | Barclays Bank PLC | IDR | 22,483,142 | $ | 1,593,419 | $ | 1,588,107 | $ | 5,312 | $ | — | |||||||||||
Expiring 12/18/19 | Barclays Bank PLC | IDR | 18,448,390 | 1,291,000 | 1,303,111 | — | (12,111 | ) | ||||||||||||||
Expiring 12/18/19 | BNP Paribas S.A. | IDR | 15,876,728 | 1,114,000 | 1,121,460 | — | (7,460 | ) | ||||||||||||||
Expiring 12/18/19 | BNP Paribas S.A. | IDR | 15,438,038 | 1,078,000 | 1,090,473 | — | (12,473 | ) | ||||||||||||||
Expiring 12/18/19 | Citibank, N.A. | IDR | 28,196,964 | 1,993,000 | 1,991,706 | 1,294 | — | |||||||||||||||
Expiring 12/18/19 | Citibank, N.A. | IDR | 23,505,900 | 1,650,000 | 1,660,350 | — | (10,350 | ) | ||||||||||||||
Expiring 12/18/19 | HSBC Bank USA, N.A. | IDR | 287,277,000 | 19,971,983 | 20,291,948 | — | (319,965 | ) | ||||||||||||||
Expiring 12/18/19 | HSBC Bank USA, N.A. | IDR | 42,045,592 | 2,971,000 | 2,969,910 | 1,090 | — | |||||||||||||||
Expiring 12/18/19 | HSBC Bank USA, N.A. | IDR | 32,279,998 | 2,257,000 | 2,280,113 | — | (23,113 | ) | ||||||||||||||
Expiring 12/18/19 | JPMorgan Chase Bank, N.A. | IDR | 34,083,705 | 2,391,000 | 2,407,519 | — | (16,519 | ) | ||||||||||||||
Expiring 12/18/19 | JPMorgan Chase Bank, N.A. | IDR | 16,603,840 | 1,166,000 | 1,172,820 | — | (6,820 | ) | ||||||||||||||
Israeli Shekel, | ||||||||||||||||||||||
Expiring 11/27/19 | Bank of America, N.A. | ILS | 7,454 | 2,129,162 | 2,117,697 | 11,465 | — | |||||||||||||||
Expiring 11/29/19 | Goldman Sachs International | ILS | 161,802 | 44,635,000 | 45,974,051 | — | (1,339,051 | ) | ||||||||||||||
Expiring 12/18/19 | Barclays Bank PLC | ILS | 34,727 | 9,903,894 | 9,877,369 | 26,525 | — | |||||||||||||||
Expiring 12/18/19 | Citibank, N.A. | ILS | 6,047 | 1,713,000 | 1,719,838 | — | (6,838 | ) | ||||||||||||||
Expiring 12/18/19 | Citibank, N.A. | ILS | 5,573 | 1,577,000 | 1,585,043 | — | (8,043 | ) | ||||||||||||||
Expiring 12/18/19 | Citibank, N.A. | ILS | 4,963 | 1,408,000 | 1,411,642 | — | (3,642 | ) | ||||||||||||||
Expiring 12/18/19 | HSBC Bank USA, N.A. | ILS | 5,498 | 1,560,000 | 1,563,796 | — | (3,796 | ) | ||||||||||||||
Expiring 02/28/20 | Citibank, N.A. | ILS | 25,386 | 7,273,000 | 7,249,183 | 23,817 | — | |||||||||||||||
Japanese Yen, | ||||||||||||||||||||||
Expiring 11/27/19 | Bank of America, N.A. | JPY | 217,559 | 2,004,000 | 2,017,736 | — | (13,736 | ) | ||||||||||||||
See Notes to Financial Statements.
| PGIM Global Total Return Fund | 103 |
Schedule of Investments(continued)
as of October 31, 2019
Forward foreign currency exchange contracts outstanding at October 31, 2019 (continued):
Sale Contracts | Counterparty | Notional Amount (000) | Value at Settlement Date | Current Value | Unrealized Appreciation | Unrealized Depreciation | ||||||||||||||||
OTC Forward Foreign Currency Exchange Contracts (cont’d.): |
| |||||||||||||||||||||
Japanese Yen (cont’d.), |
| |||||||||||||||||||||
Expiring 11/27/19 | Bank of America, N.A. | JPY | 192,409 | $ | 1,803,000 | $ | 1,784,485 | $ | 18,515 | $ | — | |||||||||||
Expiring 11/27/19 | Bank of America, N.A. | JPY | 130,849 | 1,229,000 | 1,213,546 | 15,454 | — | |||||||||||||||
Expiring 11/27/19 | Barclays Bank PLC | JPY | 122,654 | 1,127,000 | 1,137,548 | — | (10,548 | ) | ||||||||||||||
Expiring 11/27/19 | Citibank, N.A. | JPY | 185,510 | 1,766,000 | 1,720,495 | 45,505 | — | |||||||||||||||
Expiring 11/27/19 | Citibank, N.A. | JPY | 161,287 | 1,486,000 | 1,495,848 | — | (9,848 | ) | ||||||||||||||
Expiring 11/27/19 | Citibank, N.A. | JPY | 149,970 | 1,385,000 | 1,390,887 | — | (5,887 | ) | ||||||||||||||
Expiring 11/27/19 | Citibank, N.A. | JPY | 115,177 | 1,071,000 | 1,068,197 | 2,803 | — | |||||||||||||||
Expiring 11/27/19 | Deutsche Bank AG | JPY | 181,894 | 1,706,000 | 1,686,964 | 19,036 | — | |||||||||||||||
Expiring 11/27/19 | Goldman Sachs International | JPY | 278,933 | 2,597,000 | 2,586,946 | 10,054 | — | |||||||||||||||
Expiring 11/27/19 | Goldman Sachs International | JPY | 155,104 | 1,473,000 | 1,438,497 | 34,503 | — | |||||||||||||||
Expiring 11/27/19 | HSBC Bank USA, N.A. | JPY | 215,742 | 2,024,000 | 2,000,884 | 23,116 | — | |||||||||||||||
Expiring 11/27/19 | HSBC Bank USA, N.A. | JPY | 121,144 | 1,137,000 | 1,123,540 | 13,460 | — | |||||||||||||||
Expiring 11/27/19 | Morgan Stanley & Co. International PLC | JPY | 562,055 | 5,314,000 | 5,212,732 | 101,268 | — | |||||||||||||||
Expiring 11/27/19 | The Toronto-Dominion Bank | JPY | 152,949 | 1,453,000 | 1,418,511 | 34,489 | — | |||||||||||||||
Expiring 01/17/20 | BNP Paribas S.A. | JPY | 295,355 | 2,727,000 | 2,749,764 | — | (22,764 | ) | ||||||||||||||
Expiring 02/28/20 | Citibank, N.A. | JPY | 781,856 | 7,365,508 | 7,296,737 | 68,771 | — | |||||||||||||||
Expiring 03/31/20 | Citibank, N.A. | JPY | 79,712 | 747,000 | 745,319 | 1,681 | — | |||||||||||||||
Expiring 07/29/20 | Deutsche Bank AG | JPY | 556,025 | 5,341,000 | 5,233,577 | 107,423 | — | |||||||||||||||
Expiring 11/30/20 | JPMorgan Chase Bank, N.A. | JPY | 358,416 | 3,431,792 | 3,395,947 | 35,845 | — | |||||||||||||||
Expiring 12/30/20 | Bank of America, N.A. | JPY | 717,296 | 6,918,360 | 6,807,030 | 111,330 | — | |||||||||||||||
Expiring 01/29/21 | Bank of America, N.A. | JPY | 931,761 | 8,797,000 | 8,856,280 | — | (59,280 | ) | ||||||||||||||
See Notes to Financial Statements.
| 104 |
Forward foreign currency exchange contracts outstanding at October 31, 2019 (continued):
Sale Contracts | Counterparty | Notional Amount (000) | Value at Settlement Date | Current Value | Unrealized Appreciation | Unrealized Depreciation | ||||||||||||||||
OTC Forward Foreign Currency Exchange Contracts (cont’d.): |
| |||||||||||||||||||||
Japanese Yen (cont’d.), |
| |||||||||||||||||||||
Expiring 01/29/21 | Citibank, N.A. | JPY | 1,010,155 | $ | 9,887,000 | $ | 9,601,408 | $ | 285,592 | $ | — | |||||||||||
Expiring 01/29/21 | Deutsche Bank AG | JPY | 1,353,580 | 12,882,038 | 12,865,627 | 16,411 | — | |||||||||||||||
Expiring 10/31/23 | Citibank, N.A. | JPY | 628,883 | 6,526,054 | 6,325,965 | 200,089 | — | |||||||||||||||
Malaysian Ringgit, | �� | |||||||||||||||||||||
Expiring 12/18/19 | Goldman Sachs International | MYR | 17,450 | 4,167,242 | 4,187,456 | — | (20,214 | ) | ||||||||||||||
Mexican Peso, | ||||||||||||||||||||||
Expiring 11/27/19 | Goldman Sachs International | MXN | 24,931 | 1,298,000 | 1,290,508 | 7,492 | — | |||||||||||||||
Expiring 11/27/19 | HSBC Bank USA, N.A. | MXN | 34,180 | 1,757,000 | 1,769,251 | — | (12,251 | ) | ||||||||||||||
Expiring 11/27/19 | HSBC Bank USA, N.A. | MXN | 21,981 | 1,123,000 | 1,137,801 | — | (14,801 | ) | ||||||||||||||
Expiring 11/27/19 | JPMorgan Chase Bank, N.A. | MXN | 184,527 | 9,074,362 | 9,551,740 | — | (477,378 | ) | ||||||||||||||
Expiring 11/27/19 | Morgan Stanley & Co. International PLC | MXN | 222,867 | 11,359,000 | 11,536,337 | — | (177,337 | ) | ||||||||||||||
Expiring 12/18/19 | Barclays Bank PLC | MXN | 19,065 | 971,000 | 983,725 | — | (12,725 | ) | ||||||||||||||
Expiring 12/18/19 | Barclays Bank PLC | MXN | 17,956 | 911,000 | 926,512 | — | (15,512 | ) | ||||||||||||||
Expiring 12/18/19 | Citibank, N.A. | MXN | 61,331 | 3,184,000 | 3,164,624 | 19,376 | — | |||||||||||||||
Expiring 12/18/19 | JPMorgan Chase Bank, N.A. | MXN | 57,001 | 2,895,767 | 2,941,184 | — | (45,417 | ) | ||||||||||||||
Expiring 12/18/19 | JPMorgan Chase Bank, N.A. | MXN | 15,968 | 810,000 | 823,945 | — | (13,945 | ) | ||||||||||||||
Expiring 12/30/19 | Citibank, N.A. | MXN | 11,746 | 572,000 | 604,868 | — | (32,868 | ) | ||||||||||||||
Expiring 12/30/19 | Morgan Stanley & Co. International PLC | MXN | 23,784 | 1,074,000 | 1,224,798 | — | (150,798 | ) | ||||||||||||||
Expiring 02/28/20 | Morgan Stanley & Co. International PLC | MXN | 109,456 | 5,438,000 | 5,589,442 | — | (151,442 | ) | ||||||||||||||
Expiring 04/30/20 | Citibank, N.A. | MXN | 325,325 | 15,608,000 | 16,464,667 | — | (856,667 | ) | ||||||||||||||
Expiring 04/30/20 | UBS AG | MXN | 30,055 | 1,325,000 | 1,521,088 | — | (196,088 | ) | ||||||||||||||
Expiring 05/29/20 | Morgan Stanley & Co. International PLC | MXN | 183,646 | 9,299,000 | 9,256,784 | 42,216 | — | |||||||||||||||
See Notes to Financial Statements.
| PGIM Global Total Return Fund | 105 |
Schedule of Investments(continued)
as of October 31, 2019
Forward foreign currency exchange contracts outstanding at October 31, 2019 (continued):
Sale Contracts | Counterparty | Notional Amount (000) | Value at Settlement Date | Current Value | Unrealized Appreciation | Unrealized Depreciation | ||||||||||||||||
OTC Forward Foreign Currency Exchange Contracts (cont’d.): |
| |||||||||||||||||||||
Mexican Peso (cont’d.), |
| |||||||||||||||||||||
Expiring 10/30/20 | Deutsche Bank AG | MXN | 459,398 | $ | 20,095,000 | $ | 22,684,617 | $ | — | $ | (2,589,617 | ) | ||||||||||
Expiring 01/29/21 | Citibank, N.A. | MXN | 173,457 | 8,253,000 | 8,470,524 | — | (217,524 | ) | ||||||||||||||
Expiring 04/29/21 | Morgan Stanley & Co. International PLC | MXN | 238,725 | 11,024,000 | 11,531,740 | — | (507,740 | ) | ||||||||||||||
Expiring 04/29/21 | Morgan Stanley & Co. International PLC | MXN | 138,424 | 6,479,000 | 6,686,646 | — | (207,646 | ) | ||||||||||||||
New Taiwanese Dollar, | ||||||||||||||||||||||
Expiring 12/18/19 | Barclays Bank PLC | TWD | 108,281 | 3,523,052 | 3,575,103 | — | (52,051 | ) | ||||||||||||||
Expiring 12/18/19 | Barclays Bank PLC | TWD | 50,031 | 1,649,000 | 1,651,857 | — | (2,857 | ) | ||||||||||||||
Expiring 12/18/19 | BNP Paribas S.A. | TWD | 97,307 | 3,155,000 | 3,212,760 | — | (57,760 | ) | ||||||||||||||
Expiring 12/18/19 | BNP Paribas S.A. | TWD | 64,747 | 2,113,000 | 2,137,730 | — | (24,730 | ) | ||||||||||||||
Expiring 12/18/19 | Credit Suisse International | TWD | 1,062,229 | 34,208,586 | 35,071,510 | — | (862,924 | ) | ||||||||||||||
Expiring 12/18/19 | Credit Suisse International | TWD | 63,252 | 2,044,000 | 2,088,371 | — | (44,371 | ) | ||||||||||||||
Expiring 12/18/19 | Goldman Sachs International | TWD | 125,605 | 4,135,000 | 4,147,080 | — | (12,080 | ) | ||||||||||||||
Expiring 12/18/19 | Goldman Sachs International | TWD | 95,343 | 3,075,000 | 3,147,946 | — | (72,946 | ) | ||||||||||||||
Expiring 12/18/19 | HSBC Bank USA, N.A. | TWD | 122,905 | 3,970,000 | 4,057,938 | — | (87,938 | ) | ||||||||||||||
Expiring 12/18/19 | HSBC Bank USA, N.A. | TWD | 118,648 | 3,877,000 | 3,917,384 | — | (40,384 | ) | ||||||||||||||
Expiring 12/18/19 | JPMorgan Chase Bank, N.A. | TWD | 71,881 | 2,327,000 | 2,373,289 | — | (46,289 | ) | ||||||||||||||
Expiring 12/18/19 | JPMorgan Chase Bank, N.A. | TWD | 48,539 | 1,595,000 | 1,602,609 | — | (7,609 | ) | ||||||||||||||
Expiring 12/18/19 | JPMorgan Chase Bank, N.A. | TWD | 47,255 | 1,538,000 | 1,560,215 | — | (22,215 | ) | ||||||||||||||
Expiring 12/18/19 | JPMorgan Chase Bank, N.A. | TWD | 46,093 | 1,506,000 | 1,521,836 | — | (15,836 | ) | ||||||||||||||
New Zealand Dollar, | ||||||||||||||||||||||
Expiring 01/22/20 | Barclays Bank PLC | NZD | 2,033 | 1,292,000 | 1,305,556 | — | (13,556 | ) | ||||||||||||||
Expiring 01/22/20 | Morgan Stanley & Co. International PLC | NZD | 43,734 | 27,753,434 | 28,082,189 | — | (328,755 | ) | ||||||||||||||
See Notes to Financial Statements.
| 106 |
Forward foreign currency exchange contracts outstanding at October 31, 2019 (continued):
Sale Contracts | Counterparty | Notional Amount (000) | Value at Settlement Date | Current Value | Unrealized Appreciation | Unrealized Depreciation | ||||||||||||||||
OTC Forward Foreign Currency Exchange Contracts (cont’d.): |
| |||||||||||||||||||||
New Zealand Dollar (cont’d.), |
| |||||||||||||||||||||
Expiring 01/22/20 | The Toronto-Dominion Bank | NZD | 1,595 | $ | 1,020,000 | $ | 1,024,171 | $ | — | $ | (4,171 | ) | ||||||||||
Norwegian Krone, | ||||||||||||||||||||||
Expiring 01/17/20 | Barclays Bank PLC | NOK | 19,501 | 2,127,000 | 2,121,574 | 5,426 | — | |||||||||||||||
Expiring 01/17/20 | BNP Paribas S.A. | NOK | 17,484 | 1,918,000 | 1,902,238 | 15,762 | — | |||||||||||||||
Peruvian Nuevo Sol, | ||||||||||||||||||||||
Expiring 12/18/19 | Bank of America, N.A. | PEN | 14,321 | 4,252,200 | 4,275,400 | — | (23,200 | ) | ||||||||||||||
Expiring 12/18/19 | Bank of America, N.A. | PEN | 7,310 | 2,178,000 | 2,182,146 | — | (4,146 | ) | ||||||||||||||
Expiring 12/18/19 | Bank of America, N.A. | PEN | 5,794 | 1,727,000 | 1,729,720 | — | (2,720 | ) | ||||||||||||||
Expiring 12/18/19 | BNP Paribas S.A. | PEN | 4,607 | 1,372,000 | 1,375,410 | — | (3,410 | ) | ||||||||||||||
Expiring 12/18/19 | Citibank, N.A. | PEN | 5,545 | 1,663,000 | 1,655,442 | 7,558 | — | |||||||||||||||
Expiring 12/18/19 | Goldman Sachs International | PEN | 6,452 | 1,931,000 | 1,926,028 | 4,972 | — | |||||||||||||||
Expiring 12/18/19 | JPMorgan Chase Bank, N.A. | PEN | 5,642 | 1,677,000 | 1,684,247 | — | (7,247 | ) | ||||||||||||||
Expiring 12/18/19 | JPMorgan Chase Bank, N.A. | PEN | 5,450 | 1,613,000 | 1,626,856 | — | (13,856 | ) | ||||||||||||||
Expiring 12/18/19 | JPMorgan Chase Bank, N.A. | PEN | 4,946 | 1,473,000 | 1,476,419 | — | (3,419 | ) | ||||||||||||||
Philippine Peso, | ||||||||||||||||||||||
Expiring 12/18/19 | Barclays Bank PLC | PHP | 114,102 | 2,189,000 | 2,243,149 | — | (54,149 | ) | ||||||||||||||
Expiring 12/18/19 | Goldman Sachs International | PHP | 72,744 | 1,400,000 | 1,430,091 | — | (30,091 | ) | ||||||||||||||
Expiring 12/18/19 | HSBC Bank USA, N.A. | PHP | 173,739 | 3,311,000 | 3,415,576 | — | (104,576 | ) | ||||||||||||||
Expiring 12/18/19 | HSBC Bank USA, N.A. | PHP | 120,095 | 2,287,000 | 2,360,973 | — | (73,973 | ) | ||||||||||||||
Expiring 12/18/19 | HSBC Bank USA, N.A. | PHP | 115,305 | 2,203,000 | 2,266,807 | — | (63,807 | ) | ||||||||||||||
Expiring 12/18/19 | JPMorgan Chase Bank, N.A. | PHP | 71,174 | 1,364,000 | 1,399,216 | — | (35,216 | ) | ||||||||||||||
Expiring 12/18/19 | Morgan Stanley & Co. International PLC | PHP | 120,004 | 2,286,000 | 2,359,177 | — | (73,177 | ) | ||||||||||||||
See Notes to Financial Statements.
| PGIM Global Total Return Fund | 107 |
Schedule of Investments(continued)
as of October 31, 2019
Forward foreign currency exchange contracts outstanding at October 31, 2019 (continued):
Sale Contracts | Counterparty | Notional Amount (000) | Value at Settlement Date | Current Value | Unrealized Appreciation | Unrealized Depreciation | ||||||||||||||||
OTC Forward Foreign Currency Exchange Contracts (cont’d.): |
| |||||||||||||||||||||
Russian Ruble, |
| |||||||||||||||||||||
Expiring 12/18/19 | Bank of America, N.A. | RUB | 78,218 | $ | 1,187,000 | $ | 1,211,194 | $ | — | $ | (24,194 | ) | ||||||||||
Expiring 12/18/19 | Barclays Bank PLC | RUB | 112,483 | 1,704,000 | 1,741,780 | — | (37,780 | ) | ||||||||||||||
Expiring 12/18/19 | Barclays Bank PLC | RUB | 53,378 | 819,000 | 826,556 | — | (7,556 | ) | ||||||||||||||
Expiring 12/18/19 | Citibank, N.A. | RUB | 69,404 | 1,060,000 | 1,074,704 | — | (14,704 | ) | ||||||||||||||
Expiring 12/18/19 | JPMorgan Chase Bank, N.A. | RUB | 43,297 | 666,000 | 670,443 | — | (4,443 | ) | ||||||||||||||
Expiring 12/24/19 | Barclays Bank PLC | RUB | 48,233 | 739,309 | 746,203 | — | (6,894 | ) | ||||||||||||||
Expiring 12/24/19 | Goldman Sachs International | RUB | 124,622 | 2,031,000 | 1,928,024 | 102,976 | — | |||||||||||||||
Expiring 12/24/19 | JPMorgan Chase Bank, N.A. | RUB | 56,445 | 757,906 | 873,259 | — | (115,353 | ) | ||||||||||||||
Expiring 03/31/20 | Citibank, N.A. | RUB | 305,303 | 4,444,000 | 4,669,786 | — | (225,786 | ) | ||||||||||||||
Expiring 03/31/20 | JPMorgan Chase Bank, N.A. | RUB | 315,168 | 4,163,386 | 4,820,685 | — | (657,299 | ) | ||||||||||||||
Expiring 12/23/20 | BNP Paribas S.A. | RUB | 1,300,164 | 17,637,000 | 19,291,887 | — | (1,654,887 | ) | ||||||||||||||
Expiring 12/23/20 | BNP Paribas S.A. | RUB | 511,647 | 7,179,000 | 7,591,842 | — | (412,842 | ) | ||||||||||||||
Expiring 04/29/21 | Deutsche Bank AG | RUB | 310,353 | 4,577,000 | 4,540,551 | 36,449 | — | |||||||||||||||
Saudi Arabian Riyal, | ||||||||||||||||||||||
Expiring 11/12/19 | Goldman Sachs International | SAR | 57,150 | 15,000,000 | 15,239,269 | — | (239,269 | ) | ||||||||||||||
Singapore Dollar, | ||||||||||||||||||||||
Expiring 12/18/19 | Barclays Bank PLC | SGD | 2,401 | 1,746,000 | 1,766,065 | — | (20,065 | ) | ||||||||||||||
Expiring 12/18/19 | Goldman Sachs International | SGD | 15,039 | 10,806,239 | 11,059,821 | — | (253,582 | ) | ||||||||||||||
Expiring 12/18/19 | HSBC Bank USA, N.A. | SGD | 2,517 | 1,835,000 | 1,850,970 | — | (15,970 | ) | ||||||||||||||
Expiring 12/18/19 | JPMorgan Chase Bank, N.A. | SGD | 2,240 | 1,643,000 | 1,647,040 | — | (4,040 | ) | ||||||||||||||
South African Rand, | ||||||||||||||||||||||
Expiring 11/27/19 | BNP Paribas S.A. | ZAR | 22,693 | 1,477,602 | 1,496,317 | — | (18,715 | ) | ||||||||||||||
See Notes to Financial Statements.
| 108 |
Forward foreign currency exchange contracts outstanding at October 31, 2019 (continued):
Sale Contracts | Counterparty | Notional Amount (000) | Value at Settlement Date | Current Value | Unrealized Appreciation | Unrealized Depreciation | ||||||||||||||||
OTC Forward Foreign Currency Exchange Contracts (cont’d.): |
| |||||||||||||||||||||
South African Rand (cont’d.), |
| |||||||||||||||||||||
Expiring 12/18/19 | Barclays Bank PLC | ZAR | 64,777 | $ | 4,224,652 | $ | 4,258,763 | $ | — | $ | (34,111 | ) | ||||||||||
Expiring 12/18/19 | Barclays Bank PLC | ZAR | 45,939 | 3,064,200 | 3,020,299 | 43,901 | — | |||||||||||||||
Expiring 12/18/19 | Barclays Bank PLC | ZAR | 42,458 | 2,809,423 | 2,791,439 | 17,984 | — | |||||||||||||||
Expiring 12/18/19 | Barclays Bank PLC | ZAR | 40,371 | 2,678,587 | 2,654,230 | 24,357 | — | |||||||||||||||
Expiring 12/18/19 | Barclays Bank PLC | ZAR | 40,057 | 2,683,685 | 2,633,578 | 50,107 | — | |||||||||||||||
Expiring 12/18/19 | Citibank, N.A. | ZAR | 43,831 | 2,867,303 | 2,881,713 | — | (14,410 | ) | ||||||||||||||
Expiring 12/18/19 | Citibank, N.A. | ZAR | 9,846 | 649,000 | 647,319 | 1,681 | — | |||||||||||||||
Expiring 12/18/19 | JPMorgan Chase Bank, N.A. | ZAR | 48,039 | 3,230,616 | 3,158,340 | 72,276 | — | |||||||||||||||
Expiring 12/30/19 | Goldman Sachs International | ZAR | 27,540 | 1,738,000 | 1,807,300 | — | (69,300 | ) | ||||||||||||||
Expiring 12/30/19 | JPMorgan Chase Bank, N.A. | ZAR | 5,953 | 394,516 | 390,680 | 3,836 | — | |||||||||||||||
Expiring 03/31/20 | Barclays Bank PLC | ZAR | 18,478 | 1,229,000 | 1,198,255 | 30,745 | — | |||||||||||||||
Expiring 03/31/20 | Goldman Sachs International | ZAR | 18,263 | 1,154,000 | 1,184,290 | — | (30,290 | ) | ||||||||||||||
Expiring 03/31/20 | JPMorgan Chase Bank, N.A. | ZAR | 47,759 | 3,124,596 | 3,097,087 | 27,509 | — | |||||||||||||||
Expiring 07/29/20 | BNP Paribas S.A. | ZAR | 145,671 | 8,926,000 | 9,295,408 | — | (369,408 | ) | ||||||||||||||
Expiring 09/30/20 | Goldman Sachs International | ZAR | 27,092 | 1,693,000 | 1,713,900 | — | (20,900 | ) | ||||||||||||||
Expiring 09/30/20 | Morgan Stanley & Co. International PLC | ZAR | 139,816 | 9,509,000 | 8,844,969 | 664,031 | — | |||||||||||||||
Expiring 01/29/21 | Deutsche Bank AG | ZAR | 217,589 | 13,853,000 | 13,535,199 | 317,801 | — | |||||||||||||||
Expiring 01/29/21 | Morgan Stanley & Co. International PLC | ZAR | 91,483 | 5,897,000 | 5,690,737 | 206,263 | — | |||||||||||||||
South Korean Won, | ||||||||||||||||||||||
Expiring 11/27/19 | JPMorgan Chase Bank, N.A. | KRW | 1,804,668 | 1,489,000 | 1,542,862 | — | (53,862 | ) | ||||||||||||||
Expiring 12/18/19 | HSBC Bank USA, N.A. | KRW | 2,353,878 | 1,972,000 | 2,013,312 | — | (41,312 | ) | ||||||||||||||
See Notes to Financial Statements.
| PGIM Global Total Return Fund | 109 |
Schedule of Investments(continued)
as of October 31, 2019
Forward foreign currency exchange contracts outstanding at October 31, 2019 (continued):
Sale Contracts | Counterparty | Notional Amount (000) | Value at Settlement Date | Current Value | Unrealized Appreciation | Unrealized Depreciation | ||||||||||||||||
OTC Forward Foreign Currency Exchange Contracts (cont’d.): |
| |||||||||||||||||||||
South Korean Won (cont’d.), |
| |||||||||||||||||||||
Expiring 12/18/19 | JPMorgan Chase Bank, N.A. | KRW | 1,878,520 | $ | 1,567,000 | $ | 1,606,730 | $ | — | $ | (39,730 | ) | ||||||||||
Expiring 12/18/19 | JPMorgan Chase Bank, N.A. | KRW | 1,819,762 | 1,519,000 | 1,556,473 | — | (37,473 | ) | ||||||||||||||
Expiring 12/18/19 | The Toronto- Dominion Bank | KRW | 1,218,144 | 1,012,000 | 1,041,900 | — | (29,900 | ) | ||||||||||||||
Expiring 12/24/19 | Goldman Sachs International | KRW | 79,350 | 75,000 | 67,878 | 7,122 | — | |||||||||||||||
Expiring 02/28/20 | HSBC Bank USA, N.A. | KRW | 14,797,332 | 12,336,250 | 12,682,546 | — | (346,296 | ) | ||||||||||||||
Expiring 05/29/20 | Morgan Stanley & Co. International PLC | KRW | 12,067,847 | 10,356,000 | 10,368,607 | — | (12,607 | ) | ||||||||||||||
Expiring 10/30/20 | Deutsche Bank AG | KRW | 13,243,022 | 11,446,000 | 11,430,374 | 15,626 | — | |||||||||||||||
Swedish Krona, | ||||||||||||||||||||||
Expiring 01/17/20 | Barclays Bank PLC | SEK | 15,770 | 1,613,000 | 1,640,785 | — | (27,785 | ) | ||||||||||||||
Expiring 01/17/20 | BNP Paribas S.A. | SEK | 16,686 | 1,725,000 | 1,736,121 | — | (11,121 | ) | ||||||||||||||
Expiring 01/17/20 | Morgan Stanley & Co. International PLC | SEK | 88,113 | 9,045,432 | 9,167,931 | — | (122,499 | ) | ||||||||||||||
Swiss Franc, | ||||||||||||||||||||||
Expiring 01/17/20 | Barclays Bank PLC | CHF | 2,332 | 2,367,000 | 2,378,459 | — | (11,459 | ) | ||||||||||||||
Expiring 01/17/20 | Barclays Bank PLC | CHF | 1,140 | 1,155,000 | 1,162,806 | — | (7,806 | ) | ||||||||||||||
Expiring 01/17/20 | Morgan Stanley & Co. International PLC | CHF | 2,078 | 2,118,000 | 2,119,448 | — | (1,448 | ) | ||||||||||||||
Expiring 01/17/20 | UBS AG | CHF | 26,804 | 27,037,975 | 27,343,648 | — | (305,673 | ) | ||||||||||||||
Expiring 10/30/20 | Bank of America, N.A. | CHF | 11,723 | 12,407,000 | 12,191,676 | 215,324 | — | |||||||||||||||
Expiring 10/30/20 | Morgan Stanley & Co. International PLC | CHF | 4,155 | 4,379,565 | 4,320,956 | 58,609 | — | |||||||||||||||
Thai Baht, | ||||||||||||||||||||||
Expiring 12/18/19 | Barclays Bank PLC | THB | 70,490 | 2,289,000 | 2,335,716 | — | (46,716 | ) | ||||||||||||||
Expiring 12/18/19 | Citibank, N.A. | THB | 55,457 | 1,802,000 | 1,837,582 | — | (35,582 | ) | ||||||||||||||
Expiring 12/18/19 | Goldman Sachs International | THB | 79,035 | 2,569,000 | 2,618,877 | — | (49,877 | ) | ||||||||||||||
See Notes to Financial Statements.
| 110 |
Forward foreign currency exchange contracts outstanding at October 31, 2019 (continued):
Sale Contracts | Counterparty | Notional Amount (000) | Value at Settlement Date | Current Value | Unrealized Appreciation | Unrealized Depreciation | ||||||||||||||||
OTC Forward Foreign Currency Exchange Contracts (cont’d.): |
| |||||||||||||||||||||
Thai Baht (cont’d.), |
| |||||||||||||||||||||
Expiring 12/18/19 | HSBC Bank USA, N.A. | THB | 77,288 | $ | 2,556,000 | $ | 2,560,990 | $ | — | $ | (4,990 | ) | ||||||||||
Expiring 12/18/19 | HSBC Bank USA, N.A. | THB | 67,680 | 2,206,000 | 2,242,616 | — | (36,616 | ) | ||||||||||||||
Expiring 12/18/19 | JPMorgan Chase Bank, N.A. | THB | 78,715 | 2,603,000 | 2,608,254 | — | (5,254 | ) | ||||||||||||||
Expiring 12/18/19 | JPMorgan Chase Bank, N.A. | THB | 46,015 | 1,494,000 | 1,524,738 | — | (30,738 | ) | ||||||||||||||
Turkish Lira, | ||||||||||||||||||||||
Expiring 11/27/19 | HSBC Bank USA, N.A. | TRY | 6,870 | 1,150,000 | 1,192,839 | — | (42,839 | ) | ||||||||||||||
Expiring 12/18/19 | Barclays Bank PLC | TRY | 6,845 | 1,149,000 | 1,182,043 | — | (33,043 | ) | ||||||||||||||
Expiring 12/18/19 | Barclays Bank PLC | TRY | 5,847 | 965,000 | 1,009,631 | — | (44,631 | ) | ||||||||||||||
Expiring 12/18/19 | Barclays Bank PLC | TRY | 5,505 | 914,000 | 950,622 | — | (36,622 | ) | ||||||||||||||
Expiring 12/18/19 | Barclays Bank PLC | TRY | 4,472 | 750,000 | 772,177 | — | (22,177 | ) | ||||||||||||||
Expiring 12/18/19 | Barclays Bank PLC | TRY | 2,775 | 461,000 | 479,169 | — | (18,169 | ) | ||||||||||||||
Expiring 12/18/19 | JPMorgan Chase Bank, N.A. | TRY | 37,646 | 6,226,039 | 6,500,554 | — | (274,515 | ) | ||||||||||||||
Expiring 12/18/19 | JPMorgan Chase Bank, N.A. | TRY | 12,773 | 2,106,006 | 2,205,590 | — | (99,584 | ) | ||||||||||||||
Expiring 12/18/19 | JPMorgan Chase Bank, N.A. | TRY | 5,762 | 965,000 | 994,951 | — | (29,951 | ) | ||||||||||||||
Expiring 12/18/19 | Morgan Stanley & Co. International PLC | TRY | 6,893 | 1,139,000 | 1,190,294 | — | (51,294 | ) | ||||||||||||||
Expiring 12/18/19 | Morgan Stanley & Co. International PLC | TRY | 4,163 | 681,000 | 718,846 | — | (37,846 | ) | ||||||||||||||
Expiring 12/24/19 | BNP Paribas S.A. | TRY | 13,966 | 3,000,000 | 2,407,888 | 592,112 | — | |||||||||||||||
Expiring 12/24/19 | JPMorgan Chase Bank, N.A. | TRY | 19,075 | 3,367,238 | 3,288,827 | 78,411 | — | |||||||||||||||
Expiring 01/31/20 | JPMorgan Chase Bank, N.A. | TRY | 28,531 | 4,984,414 | 4,871,437 | 112,977 | — | |||||||||||||||
Expiring 04/30/20 | Citibank, N.A. | TRY | 42,024 | 5,553,900 | 7,015,389 | — | (1,461,489 | ) | ||||||||||||||
Expiring 04/30/20 | Citibank, N.A. | TRY | 17,501 | 2,708,904 | 2,921,584 | — | (212,680 | ) | ||||||||||||||
See Notes to Financial Statements.
| PGIM Global Total Return Fund | 111 |
Schedule of Investments(continued)
as of October 31, 2019
Forward foreign currency exchange contracts outstanding at October 31, 2019 (continued):
Sale Contracts | Counterparty | Notional Amount (000) | Value at Settlement Date | Current Value | Unrealized Appreciation | Unrealized Depreciation | ||||||||||||||||
OTC Forward Foreign Currency Exchange Contracts (cont’d.): |
| |||||||||||||||||||||
Turkish Lira (cont’d.), |
| |||||||||||||||||||||
Expiring 04/30/20 | Citibank, N.A. | TRY | 6,043 | $ | 841,000 | $ | 1,008,745 | $ | — | $ | (167,745 | ) | ||||||||||
Expiring 04/30/20 | Goldman Sachs International | TRY | 62,763 | 10,884,000 | 10,477,544 | 406,456 | — | |||||||||||||||
Expiring 04/30/20 | JPMorgan Chase Bank, N.A. | TRY | 11,919 | 1,844,000 | 1,989,767 | — | (145,767 | ) | ||||||||||||||
Expiring 06/30/20 | Barclays Bank PLC | TRY | 55,902 | 7,876,880 | 9,189,840 | — | (1,312,960 | ) | ||||||||||||||
Expiring 06/30/20 | Citibank, N.A. | TRY | 19,012 | 1,978,358 | 3,125,411 | — | (1,147,053 | ) | ||||||||||||||
Expiring 06/30/20 | Citibank, N.A. | TRY | 9,131 | 948,000 | 1,501,080 | — | (553,080 | ) | ||||||||||||||
Expiring 06/30/20 | JPMorgan Chase Bank, N.A. | TRY | 17,985 | 2,452,000 | 2,956,659 | — | (504,659 | ) | ||||||||||||||
Expiring 06/30/20 | Morgan Stanley & Co. International PLC | TRY | 80,729 | 12,254,000 | 13,271,205 | — | (1,017,205 | ) | ||||||||||||||
Expiring 10/30/20 | Deutsche Bank AG | TRY | 6,465 | 851,000 | 1,031,357 | — | (180,357 | ) | ||||||||||||||
Expiring 10/30/20 | Goldman Sachs International | TRY | 7,043 | 1,015,000 | 1,123,490 | — | (108,490 | ) | ||||||||||||||
Expiring 02/26/21 | Citibank, N.A. | TRY | 40,469 | 4,975,000 | 6,253,530 | — | (1,278,530 | ) | ||||||||||||||
Expiring 02/26/21 | Citibank, N.A. | TRY | 21,754 | 2,583,626 | 3,361,576 | — | (777,950 | ) | ||||||||||||||
Expiring 02/26/21 | Goldman Sachs International | TRY | 28,731 | 4,314,000 | 4,439,720 | — | (125,720 | ) | ||||||||||||||
Expiring 02/26/21 | JPMorgan Chase Bank, N.A. | TRY | 28,291 | 3,398,374 | 4,371,764 | — | (973,390 | ) | ||||||||||||||
Expiring 02/26/21 | Morgan Stanley & Co. International PLC | TRY | 97,117 | 13,447,000 | 15,007,079 | — | (1,560,079 | ) | ||||||||||||||
Expiring 05/28/21 | Goldman Sachs International | TRY | 13,530 | 1,814,000 | 2,041,734 | — | (227,734 | ) | ||||||||||||||
|
|
|
|
|
|
|
| |||||||||||||||
| $ | 1,771,696,828 | $ | 1,799,417,906 | 12,648,632 | (40,369,710 | ) | ||||||||||||||||
|
|
|
|
|
|
|
| |||||||||||||||
| $ | 57,034,666 | $ | (51,444,765 | ) | ||||||||||||||||||
|
|
|
| |||||||||||||||||||
See Notes to Financial Statements.
| 112 |
Cross currency exchange contracts outstanding at October 31, 2019:
Settlement | Type | Notional Amount (000) | In Exchange For (000) | Unrealized Appreciation | Unrealized Depreciation | Counterparty | ||||||||||||||
OTC Cross Currency Exchange Contracts: | ||||||||||||||||||||
11/27/19 | Buy | EUR | 2,122 | ZAR | 41,069 | $ | — | $ | (337,231 | ) | Citibank, N.A. | |||||||||
11/27/19 | Buy | ZAR | 16,840 | EUR | 974 | 22,231 | — | Deutsche Bank AG | ||||||||||||
12/30/19 | Buy | EUR | 1,930 | ZAR | 33,514 | — | (37,006 | ) | Deutsche Bank AG | |||||||||||
12/30/19 | Buy | ZAR | 19,940 | EUR | 1,203 | — | (39,301 | ) | Morgan Stanley & Co. International PLC | |||||||||||
01/31/20 | Buy | AUD | 4,212 | JPY | 327,609 | — | (142,281 | ) | Deutsche Bank AG | |||||||||||
01/31/20 | Buy | EUR | 2,420 | TRY | 14,760 | 196,135 | — | Goldman Sachs International | ||||||||||||
01/31/20 | Buy | TRY | 37,121 | EUR | 5,105 | 608,255 | — | Goldman Sachs International | ||||||||||||
02/28/20 | Buy | AUD | 6,000 | JPY | 472,950 | — | (266,162 | ) | BNP Paribas S.A. | |||||||||||
02/28/20 | Buy | JPY | 1,415,148 | AUD | 18,781 | 224,051 | — | Deutsche Bank AG | ||||||||||||
03/31/20 | Buy | EUR | 7,374 | ZAR | 124,584 | 227,430 | �� | — | Morgan Stanley & Co. International PLC | |||||||||||
03/31/20 | Buy | ZAR | 142,211 | EUR | 7,654 | 600,273 | — | Morgan Stanley & Co. International PLC | ||||||||||||
04/30/20 | Buy | EUR | 12,312 | TRY | 92,869 | — | (1,609,836 | ) | Goldman Sachs International | |||||||||||
04/30/20 | Buy | TRY | 121,707 | EUR | 13,219 | 5,400,496 | — | BNP Paribas S.A. | ||||||||||||
07/29/20 | Buy | EUR | 14,276 | TRY | 138,149 | — | (6,352,124 | ) | BNP Paribas S.A. | |||||||||||
07/29/20 | Buy | TRY | 101,116 | EUR | 8,310 | 7,075,965 | — | Morgan Stanley & Co. International PLC | ||||||||||||
08/31/20 | Buy | EUR | 4,792 | ZAR | 92,438 | — | (425,711 | ) | Morgan Stanley & Co. International PLC | |||||||||||
08/31/20 | Buy | ZAR | 41,149 | EUR | 2,332 | — | (36,435 | ) | Goldman Sachs International | |||||||||||
09/30/20 | Buy | JPY | 92,412 | GBP | 706 | — | (49,345 | ) | Bank of America, N.A. | |||||||||||
10/30/20 | Buy | EUR | 19,400 | GBP | 17,029 | — | (133,304 | ) | Morgan Stanley & Co. International PLC | |||||||||||
11/27/20 | Buy | AUD | 2,575 | JPY | 191,838 | — | (30,098 | ) | Morgan Stanley & Co. International PLC | |||||||||||
11/30/20 | Buy | JPY | 382,815 | AUD | 4,906 | 221,881 | — | Deutsche Bank AG | ||||||||||||
12/23/20 | Buy | EUR | 598 | ZAR | 10,827 | 6,907 | — | Goldman Sachs International | ||||||||||||
12/23/20 | Buy | EUR | 1,738 | ZAR | 29,854 | 120,977 | — | Morgan Stanley & Co. International PLC | ||||||||||||
12/30/20 | Buy | AUD | 787 | JPY | 59,639 | — | (19,554 | ) | Goldman Sachs International | |||||||||||
12/30/20 | Buy | JPY | 167,838 | AUD | 2,277 | 11,845 | — | Deutsche Bank AG | ||||||||||||
12/30/20 | Buy | JPY | 1,033,015 | AUD | 14,026 | 64,978 | — | Deutsche Bank AG | ||||||||||||
05/28/21 | Buy | AUD | 6,194 | JPY | 451,976 | — | (16,598 | ) | Deutsche Bank AG | |||||||||||
05/28/21 | Buy | JPY | 641,372 | AUD | 9,247 | — | (294,516 | ) | Morgan Stanley & Co. International PLC | |||||||||||
07/30/21 | Buy | AUD | 12,549 | JPY | 866,195 | 417,290 | — | Morgan Stanley & Co. International PLC | ||||||||||||
10/31/23 | Buy | AUD | 8,947 | JPY | 599,449 | 221,947 | — | Deutsche Bank AG | ||||||||||||
10/31/23 | Buy | JPY | 277,535 | AUD | 3,979 | 11,362 | — | Goldman Sachs International | ||||||||||||
10/31/23 | Buy | JPY | 671,731 | AUD | 9,835 | — | (115,366 | ) | Morgan Stanley & Co. International PLC | |||||||||||
|
|
|
| |||||||||||||||||
See Notes to Financial Statements.
| PGIM Global Total Return Fund | 113 |
Schedule of Investments(continued)
as of October 31, 2019
Cross currency exchange contracts outstanding at October 31, 2019 (continued):
Settlement | Type | Notional Amount (000) | In Exchange For (000) | Unrealized Appreciation | Unrealized Depreciation | Counterparty | ||||||||||||||||
OTC Cross Currency Exchange Contracts (cont’d.): |
| |||||||||||||||||||||
| $ | 15,432,023 | $ | (9,904,868 | ) | ||||||||||||||||||
|
|
|
| |||||||||||||||||||
Credit default swap agreements outstanding at October 31, 2019:
Reference Entity/ Obligation | Termination Date | Fixed Rate | Notional Amount (000)#(3) | Implied Credit Spread at October 31, 2019(4) | Fair Value | Upfront Premiums Paid (Received) | Unrealized Appreciation (Depreciation) | Counterparty | ||||||||||||||||||||||
OTC Packaged Credit Default Swap Agreements on corporate and/or sovereign issues—Sell Protection(2)*: | ||||||||||||||||||||||||||||||
Federation of Malaysia (D01) | 12/20/22 | 1.000%(Q) | 1,500 | 0.280 | % | $ | 37,656 | $ | (1,269 | ) | $ | 38,925 | Citibank, N.A. | |||||||||||||||||
People’s Republic of China (D01) | 12/20/22 | 1.000%(Q) | 5,000 | 0.223 | % | 132,736 | (4,230 | ) | 136,966 | Citibank, N.A. | ||||||||||||||||||||
Republic of Argentina (D01) | 12/20/22 | 1.000%(Q) | 1,500 | 117.935 | % | (943,244 | ) | (1,269 | ) | (941,975 | ) | Citibank, N.A. | ||||||||||||||||||
Republic of Brazil (D01) | 12/20/22 | 1.000%(Q) | 7,500 | 0.731 | % | 70,459 | (6,345 | ) | 76,804 | Citibank, N.A. | ||||||||||||||||||||
Republic of Chile (D01) | 12/20/22 | 1.000%(Q) | 1,500 | 0.245 | % | 36,721 | (1,269 | ) | 37,990 | Citibank, N.A. | ||||||||||||||||||||
Republic of Colombia (D01) | 12/20/22 | 1.000%(Q) | 2,000 | 0.444 | % | 36,555 | (1,692 | ) | 38,247 | Citibank, N.A. | ||||||||||||||||||||
Republic of Indonesia (D01) | 12/20/22 | 1.000%(Q) | 2,000 | 0.517 | % | 38,382 | (1,692 | ) | 40,074 | Citibank, N.A. | ||||||||||||||||||||
Republic of Panama (D01) | 12/20/22 | 1.000%(Q) | 1,500 | 0.245 | % | 36,731 | (1,269 | ) | 38,000 | Citibank, N.A. | ||||||||||||||||||||
Republic of Peru (D01) | 12/20/22 | 1.000%(Q) | 1,500 | 0.251 | % | 36,437 | (1,269 | ) | 37,706 | Citibank, N.A. | ||||||||||||||||||||
Republic of Philippines (D01) | 12/20/22 | 1.000%(Q) | 1,500 | 0.267 | % | 38,148 | (1,269 | ) | 39,417 | Citibank, N.A. | ||||||||||||||||||||
Republic of South Africa (D01) | 12/20/22 | 1.000%(Q) | 4,500 | 1.340 | % | (41,113 | ) | (3,807 | ) | (37,306 | ) | Citibank, N.A. | ||||||||||||||||||
Republic of Turkey (D01) | 12/20/22 | 1.000%(Q) | 7,500 | 2.780 | % | (385,724 | ) | (6,345 | ) | (379,379 | ) | Citibank, N.A. | ||||||||||||||||||
See Notes to Financial Statements.
| 114 |
Credit default swap agreements outstanding at October 31, 2019 (continued):
Reference | Termination Date | Fixed Rate | Notional Amount (000)#(3) | Implied Credit Spread at October 31, 2019(4) | Fair Value | Upfront Premiums Paid (Received) | Unrealized Appreciation (Depreciation) | Counterparty | ||||||||||||||||||||||
OTC Packaged Credit Default Swap Agreements on corporate and/or sovereign issues—Sell Protection(2)* (cont’d.): | ||||||||||||||||||||||||||||||
Russian Federation (D01) | 12/20/22 | 1.000%(Q) | 4,500 | 0.434 | % | $ | 83,609 | $ | (3,807 | ) | $ | 87,416 | Citibank, N.A. | |||||||||||||||||
United Mexican States (D01) | 12/20/22 | 1.000%(Q) | 6,500 | 0.525 | % | 102,444 | (5,499 | ) | 107,943 | Citibank, N.A. | ||||||||||||||||||||
Federation of Malaysia (D02) | 06/20/23 | 1.000%(Q) | 2,250 | 0.354 | % | 60,043 | (1,002 | ) | 61,045 | Barclays Bank PLC | ||||||||||||||||||||
People’s Republic of China (D02) | 06/20/23 | 1.000%(Q) | 8,250 | 0.300 | % | 233,002 | (3,673 | ) | 236,675 | Barclays Bank PLC | ||||||||||||||||||||
Republic of Argentina (D02) | 06/20/23 | 1.000%(Q) | 2,250 | 113.240 | % | (1,423,629 | ) | (1,002 | ) | (1,422,627 | ) | Barclays Bank PLC | ||||||||||||||||||
Republic of Brazil (D02) | 06/20/23 | 1.000%(Q) | 11,250 | 0.855 | % | 70,671 | (5,009 | ) | 75,680 | Barclays Bank PLC | ||||||||||||||||||||
Republic of Chile (D02) | 06/20/23 | 1.000%(Q) | 2,250 | 0.287 | % | 59,721 | (1,002 | ) | 60,723 | Barclays Bank PLC | ||||||||||||||||||||
Republic of Colombia (D02) | 06/20/23 | 1.000%(Q) | 3,000 | 0.530 | % | 53,441 | (1,336 | ) | 54,777 | Barclays Bank PLC | ||||||||||||||||||||
Republic of Indonesia (D02) | 06/20/23 | 1.000%(Q) | 3,000 | 0.636 | % | 55,701 | (1,336 | ) | 57,037 | Barclays Bank PLC | ||||||||||||||||||||
Republic of Lebanon (D02) | 06/20/23 | 1.000%(Q) | 2,250 | 22.800 | % | (990,585 | ) | (1,002 | ) | (989,583 | ) | Barclays Bank PLC | ||||||||||||||||||
Republic of Panama (D02) | 06/20/23 | 1.000%(Q) | 2,250 | 0.308 | % | 58,035 | (1,002 | ) | 59,037 | Barclays Bank PLC | ||||||||||||||||||||
Republic of Peru (D02) | 06/20/23 | 1.000%(Q) | 2,250 | 0.320 | % | 57,133 | (1,002 | ) | 58,135 | Barclays Bank PLC | ||||||||||||||||||||
Republic of Philippines (D02) | 06/20/23 | 1.000%(Q) | 2,250 | 0.329 | % | 61,620 | (1,002 | ) | 62,622 | Barclays Bank PLC | ||||||||||||||||||||
Republic of South Africa (D02) | 06/20/23 | 1.000%(Q) | 6,750 | 1.474 | % | (108,161 | ) | (3,005 | ) | (105,156 | ) | Barclays Bank PLC | ||||||||||||||||||
Republic of Turkey (D02) | 06/20/23 | 1.000%(Q) | 10,500 | 2.961 | % | (682,413 | ) | (4,675 | ) | (677,738 | ) | Barclays Bank PLC | ||||||||||||||||||
See Notes to Financial Statements.
| PGIM Global Total Return Fund | 115 |
Schedule of Investments(continued)
as of October 31, 2019
Credit default swap agreements outstanding at October 31, 2019 (continued):
Reference Entity/ Obligation | Termination Date | Fixed Rate | Notional Amount (000)#(3) | Implied Credit Spread at October 31, 2019(4) | Fair Value | Upfront Premiums Paid (Received) | Unrealized Appreciation (Depreciation) | Counterparty | ||||||||||||||||||||||
OTC Packaged Credit Default Swap Agreements on corporate and/or sovereign issues—Sell Protection(2)* (cont’d.): | ||||||||||||||||||||||||||||||
Russian Federation (D02) | 06/20/23 | 1.000%(Q) | 6,750 | 0.513 | % | $ | 123,383 | $ | (3,005 | ) | $ | 126,388 | Barclays Bank PLC | |||||||||||||||||
United Mexican States (D02) | 06/20/23 | 1.000%(Q) | 9,750 | 0.624 | % | 141,231 | (4,341 | ) | 145,572 | Barclays Bank PLC | ||||||||||||||||||||
Federation of Malaysia (D03) | 12/20/23 | 1.000%(Q) | 1,500 | 0.409 | % | 42,384 | (3,400 | ) | 45,784 | Citibank, N.A. | ||||||||||||||||||||
People’s Republic of China (D03) | 12/20/23 | 1.000%(Q) | 5,000 | 0.359 | % | 149,629 | (11,333 | ) | 160,962 | Citibank, N.A. | ||||||||||||||||||||
Republic of Argentina (D03) | 12/20/23 | 1.000%(Q) | 1,500 | 109.387 | % | (954,319 | ) | (3,400 | ) | (950,919 | ) | Citibank, N.A. | ||||||||||||||||||
Republic of Brazil (D03) | 12/20/23 | 1.000%(Q) | 7,500 | 0.949 | % | 24,070 | (16,999 | ) | 41,069 | Citibank, N.A. | ||||||||||||||||||||
Republic of Chile (D03) | 12/20/23 | 1.000%(Q) | 1,500 | 0.320 | % | 42,889 | (3,400 | ) | 46,289 | Citibank, N.A. | ||||||||||||||||||||
Republic of Colombia (D03) | 12/20/23 | 1.000%(Q) | 2,000 | 0.596 | % | 34,707 | (4,533 | ) | 39,240 | Citibank, N.A. | ||||||||||||||||||||
Republic of Indonesia (D03) | 12/20/23 | 1.000%(Q) | 2,000 | 0.726 | % | 35,900 | (4,533 | ) | 40,433 | Citibank, N.A. | ||||||||||||||||||||
Republic of Lebanon (D03) | 12/20/23 | 1.000%(Q) | 1,500 | 21.270 | % | (667,577 | ) | (3,400 | ) | (664,177 | ) | Citibank, N.A. | ||||||||||||||||||
Republic of Panama (D03) | 12/20/23 | 1.000%(Q) | 1,500 | 0.357 | % | 40,637 | (3,400 | ) | 44,037 | Citibank, N.A. | ||||||||||||||||||||
Republic of Peru (D03) | 12/20/23 | 1.000%(Q) | 1,500 | 0.372 | % | 39,729 | (3,400 | ) | 43,129 | Citibank, N.A. | ||||||||||||||||||||
Republic of Philippines (D03) | 12/20/23 | 1.000%(Q) | 1,500 | 0.376 | % | 43,992 | (3,400 | ) | 47,392 | Citibank, N.A. | ||||||||||||||||||||
Republic of South Africa (D03) | 12/20/23 | 1.000%(Q) | 4,500 | 1.590 | % | (102,531 | ) | (10,200 | ) | (92,331 | ) | Citibank, N.A. | ||||||||||||||||||
Republic of Turkey (D03) | 12/20/23 | 1.000%(Q) | 7,500 | 3.098 | % | (586,121 | ) | (16,999 | ) | (569,122 | ) | Citibank, N.A. | ||||||||||||||||||
See Notes to Financial Statements.
| 116 |
Credit default swap agreements outstanding at October 31, 2019 (continued):
Reference Entity/ Obligation | Termination Date | Fixed Rate | Notional Amount (000)#(3) | Implied Credit Spread at October 31, 2019(4) | Fair Value | Upfront Premiums Paid (Received) | Unrealized Appreciation (Depreciation) | Counterparty | ||||||||||||||||||||||
OTC Packaged Credit Default Swap Agreements on corporate and/or sovereign issues—Sell Protection(2)* (cont’d.): | ||||||||||||||||||||||||||||||
Russian Federation (D03) | 12/20/23 | 1.000%(Q) | 4,500 | 0.576 | % | $ | 80,913 | $ | (10,200 | ) | $ | 91,113 | Citibank, N.A. | |||||||||||||||||
United Mexican States (D03) | 12/20/23 | 1.000%(Q) | 6,500 | 0.699 | % | 85,948 | (14,733 | ) | 100,681 | Citibank, N.A. | ||||||||||||||||||||
Federation of Malaysia (D04) | 06/20/24 | 1.000%(Q) | 2,000 | 0.487 | % | 57,189 | (2,105 | ) | 59,294 | Citibank, N.A. | ||||||||||||||||||||
Kingdom of Saudi Arabia (D04) | 06/20/24 | 1.000%(Q) | 1,500 | 0.634 | % | 26,314 | (1,579 | ) | 27,893 | Citibank, N.A. | ||||||||||||||||||||
People’s Republic of China (D04) | 06/20/24 | 1.000%(Q) | 4,500 | 0.443 | % | 135,937 | (4,737 | ) | 140,674 | Citibank, N.A. | ||||||||||||||||||||
Republic of Argentina (D04) | 06/20/24 | 1.000%(Q) | 3,000 | 106.194 | % | (1,917,818 | ) | (3,158 | ) | (1,914,660 | ) | Citibank, N.A. | ||||||||||||||||||
Republic of Brazil (D04) | 06/20/24 | 1.000%(Q) | 6,500 | 1.095 | % | (19,891 | ) | (6,842 | ) | (13,049 | ) | Citibank, N.A. | ||||||||||||||||||
Republic of Chile (D04) | 06/20/24 | 1.000%(Q) | 1,500 | 0.384 | % | 43,285 | (1,579 | ) | 44,864 | Citibank, N.A. | ||||||||||||||||||||
Republic of Colombia (D04) | 06/20/24 | 1.000%(Q) | 2,000 | 0.720 | % | 27,384 | (2,105 | ) | 29,489 | Citibank, N.A. | ||||||||||||||||||||
Republic of Indonesia (D04) | 06/20/24 | 1.000%(Q) | 3,500 | 0.855 | % | 53,433 | (3,684 | ) | 57,117 | Citibank, N.A. | ||||||||||||||||||||
Republic of Peru (D04) | 06/20/24 | 1.000%(Q) | 1,500 | 0.459 | % | 38,194 | (1,579 | ) | 39,773 | Citibank, N.A. | ||||||||||||||||||||
Republic of Philippines (D04) | 06/20/24 | 1.000%(Q) | 1,500 | 0.449 | % | 44,934 | (1,579 | ) | 46,513 | Citibank, N.A. | ||||||||||||||||||||
Republic of South Africa (D04) | 06/20/24 | 1.000%(Q) | 4,000 | 1.738 | % | (127,870 | ) | (3,781 | ) | (124,089 | ) | Citibank, N.A. | ||||||||||||||||||
Republic of Turkey (D04) | 06/20/24 | 1.000%(Q) | 6,500 | 3.233 | % | (598,181 | ) | (6,842 | ) | (591,339 | ) | Citibank, N.A. | ||||||||||||||||||
Russian Federation (D04) | 06/20/24 | 1.000%(Q) | 4,000 | 0.676 | % | 61,476 | (4,211 | ) | 65,687 | Citibank, N.A. | ||||||||||||||||||||
See Notes to Financial Statements.
| PGIM Global Total Return Fund | 117 |
Schedule of Investments(continued)
as of October 31, 2019
Credit default swap agreements outstanding at October 31, 2019 (continued):
Reference | Termination Date | Fixed Rate | Notional Amount (000)#(3) | Implied Credit Spread at October 31, 2019(4) | Fair Value | Upfront Premiums Paid (Received) | Unrealized Appreciation (Depreciation) | Counterparty | ||||||||||||||||||||||
OTC Packaged Credit Default Swap Agreements on corporate and/or sovereign issues—Sell Protection(2)* (cont’d.): | ||||||||||||||||||||||||||||||
State of Qatar (D04) | 06/20/24 | 1.000%(Q) | 1,500 | 0.408 | % | $ | 41,700 | $ | (1,579 | ) | $ | 43,279 | Citibank, N.A. | |||||||||||||||||
United Mexican States (D04) | 06/20/24 | 1.000%(Q) | 6,500 | 0.825 | % | 58,179 | (6,842 | ) | 65,021 | Citibank, N.A. | ||||||||||||||||||||
Emirate of Abu Dhabi (D05) | 12/20/24 | 1.000%(Q) | 600 | 0.462 | % | 16,698 | (447 | ) | 17,145 | Morgan Stanley & Co. International PLC | ||||||||||||||||||||
Federation of Malaysia (D05) | 12/20/24 | 1.000%(Q) | 1,200 | 0.549 | % | 34,713 | (895 | ) | 35,608 | Morgan Stanley & Co. International PLC | ||||||||||||||||||||
Kingdom of Saudi Arabia (D05) | 12/20/24 | 1.000%(Q) | 600 | 0.705 | % | 9,428 | (447 | ) | 9,875 | Morgan Stanley & Co. International PLC | ||||||||||||||||||||
People’s Republic of China (D05) | 12/20/24 | 1.000%(Q) | 2,700 | 0.510 | % | 82,312 | (2,013 | ) | 84,325 | Morgan Stanley & Co. International PLC | ||||||||||||||||||||
Republic of Argentina (D05) | 12/20/24 | 1.000%(Q) | 1,500 | 103.524 | % | (963,004 | ) | (1,118 | ) | (961,886 | ) | Morgan Stanley & Co. International PLC | ||||||||||||||||||
Republic of Brazil (D05) | 12/20/24 | 1.000%(Q) | 3,600 | 1.213 | % | (33,061 | ) | (2,684 | ) | (30,377 | ) | Morgan Stanley & Co. International PLC | ||||||||||||||||||
Republic of Chile (D05) | 12/20/24 | 1.000%(Q) | 600 | 0.436 | % | 17,470 | (447 | ) | 17,917 | Morgan Stanley & Co. International PLC | ||||||||||||||||||||
Republic of Colombia (D05) | 12/20/24 | 1.000%(Q) | 1,500 | 0.818 | % | 15,152 | (1,118 | ) | 16,270 | Morgan Stanley & Co. International PLC | ||||||||||||||||||||
Republic of Indonesia (D05) | 12/20/24 | 1.000%(Q) | 2,400 | 0.957 | % | 30,332 | (1,790 | ) | 32,122 | Morgan Stanley & Co. International PLC | ||||||||||||||||||||
See Notes to Financial Statements.
| 118 |
Credit default swap agreements outstanding at October 31, 2019 (continued):
Reference | Termination Date | Fixed Rate | Notional Amount (000)#(3) | Implied Credit Spread at October 31, 2019(4) | Fair Value | Upfront Premiums Paid (Received) | Unrealized Appreciation (Depreciation) | Counterparty | ||||||||||||||||||||||
OTC Packaged Credit Default Swap Agreements on corporate and/or sovereign issues—Sell Protection(2)* (cont’d.): | ||||||||||||||||||||||||||||||
Republic of Lebanon (D05) | 12/20/24 | 1.000%(Q) | 600 | 18.956 | % | $ | (272,670 | ) | $ | (447 | ) | $ | (272,223 | ) | Morgan Stanley & Co. International PLC | |||||||||||||||
Republic of Panama (D05) | 12/20/24 | 1.000%(Q) | 600 | 0.502 | % | 15,495 | (447 | ) | 15,942 | Morgan Stanley & Co. International PLC | ||||||||||||||||||||
Republic of Peru (D05) | 12/20/24 | 1.000%(Q) | 600 | 0.530 | % | 14,673 | (447 | ) | 15,120 | Morgan Stanley & Co. International PLC | ||||||||||||||||||||
Republic of Philippines (D05) | 12/20/24 | 1.000%(Q) | 600 | 0.508 | % | 18,345 | (447 | ) | 18,792 | Morgan Stanley & Co. International PLC | ||||||||||||||||||||
Republic of South Africa (D05) | 12/20/24 | 1.000%(Q) | 2,700 | 1.857 | % | (110,416 | ) | (2,013 | ) | (108,403 | ) | Morgan Stanley & Co. International PLC | ||||||||||||||||||
Republic of Turkey (D05) | 12/20/24 | 1.000%(Q) | 3,600 | 3.341 | % | (379,400 | ) | (2,684 | ) | (376,716 | ) | Morgan Stanley & Co. International PLC | ||||||||||||||||||
Russian Federation (D05) | 12/20/24 | 1.000%(Q) | 2,400 | 0.756 | % | 30,727 | (1,790 | ) | 32,517 | Morgan Stanley & Co. International PLC | ||||||||||||||||||||
State of Qatar (D05) | 12/20/24 | 1.000%(Q) | 600 | 0.467 | % | 16,562 | (447 | ) | 17,009 | Morgan Stanley & Co. International PLC | ||||||||||||||||||||
United Mexican States (D05) | 12/20/24 | 1.000%(Q) | 3,600 | 0.927 | % | 17,153 | (2,684 | ) | 19,837 | Morgan Stanley & Co. International PLC | ||||||||||||||||||||
|
|
|
|
|
| |||||||||||||||||||||||||
| $ | (8,155,986 | ) | $ | (262,322 | ) | $ | (7,893,664 | ) | ||||||||||||||||||||||
|
|
|
|
|
| |||||||||||||||||||||||||
See Notes to Financial Statements.
| PGIM Global Total Return Fund | 119 |
Schedule of Investments(continued)
as of October 31, 2019
Credit default swap agreements outstanding at October 31, 2019 (continued):
Reference Entity/ Obligation | Termination Date | Fixed Rate | Notional Amount (000)#(3) | Fair Value | Upfront Premiums Paid (Received) | Unrealized Appreciation (Depreciation) | Counterparty | |||||||||||||||||||
OTC Packaged Credit Default Swap Agreements on credit indices—Buy Protection(1)*: | ||||||||||||||||||||||||||
CDX.EM.28.V2 (D01) | 12/20/22 | 1.000%(Q) | 48,500 | $ | 687,923 | $ | (26,215 | ) | $ | 714,138 | Citibank, N.A. | |||||||||||||||
CDX.EM.29.V1 (D02) | 06/20/23 | 1.000%(Q) | 75,000 | 1,971,863 | (41,196 | ) | 2,013,059 | Barclays Bank PLC | ||||||||||||||||||
CDX.EM.30.V1 (D03) | 12/20/23 | 1.000%(Q) | 50,000 | 1,560,138 | 44,568 | 1,515,570 | Citibank, N.A. | |||||||||||||||||||
CDX.EM.31.V1 (D04) | 06/20/24 | 1.000%(Q) | 50,000 | 1,958,410 | (51,991 | ) | 2,010,401 | Citibank, N.A. | ||||||||||||||||||
CDX.EM.32.V1 (D05) | 12/20/24 | 1.000%(Q) | 30,000 | 1,357,066 | (34,226 | ) | 1,391,292 | Morgan Stanley & Co. International PLC | ||||||||||||||||||
|
|
|
|
|
| |||||||||||||||||||||
| $ | 7,535,400 | $ | (109,060 | ) | $ | 7,644,460 | ||||||||||||||||||||
|
|
|
|
|
| |||||||||||||||||||||
| * | The Fund entered into multiple credit default swap agreements in a packaged trade consisting of two parts. The Fund bought/sold protection on an Emerging Market CDX Index and bought/sold protection on the countries which comprise the index. The up-front premium is attached to the index of the trade. Each swap is priced individually. If any of the component swaps are closed out early, the Index exposure will be reduced by an amount proportionate to the terminated swap(s). Individual packages in the tables above are denoted by the corresponding footnotes (D01 - D05). |
Reference | Termination Date | Fixed Rate | Notional Amount (000)#(3) | Implied Credit Spread at October 31, 2019(4) | Fair Value | Upfront Premiums Paid (Received) | Unrealized Appreciation (Depreciation) | Counterparty | ||||||||||||||||||||||
OTC Credit Default Swap Agreements on asset-backed securities—Sell Protection(2)^: | ||||||||||||||||||||||||||||||
American Money Management Corp. | 11/26/19 | 1.000%(M) | 490 | * | $ | 367 | $ | — | $ | 367 | Goldman Sachs International | |||||||||||||||||||
Anchorage CLO Ltd. | 11/26/19 | 0.500%(M) | EUR | 1,149 | * | 534 | — | 534 | Goldman Sachs International | |||||||||||||||||||||
Anchorage CLO Ltd. | 11/26/19 | 1.000%(M) | EUR | 1,094 | * | 1,016 | — | 1,016 | Goldman Sachs International | |||||||||||||||||||||
AXA CLO Ltd. | 11/26/19 | 0.500%(M) | EUR | 573 | * | 266 | — | 266 | Goldman Sachs International | |||||||||||||||||||||
Bardin Hill Loan Advisors European Funding | 11/26/19 | 1.000%(M) | EUR | 675 | * | 627 | — | 627 | Goldman Sachs International | |||||||||||||||||||||
Barings CLO | 11/26/19 | 1.000%(M) | 79 | * | 59 | — | 59 | Goldman Sachs International | ||||||||||||||||||||||
Bear Stearns Asset Backed Securities | 11/27/19 | 1.250%(M) | 2,083 | * | 2,022 | — | 2,022 | Goldman Sachs International | ||||||||||||||||||||||
See Notes to Financial Statements.
| 120 |
Credit default swap agreements outstanding at October 31, 2019 (continued):
Reference | Termination Date | Fixed Rate | Notional Amount (000)#(3) | Implied Credit Spread at October 31, 2019(4) | Fair Value | Upfront Premiums Paid (Received) | Unrealized Appreciation (Depreciation) | Counterparty | ||||||||||||||||||||||
OTC Credit Default Swap Agreements on asset-backed securities—Sell Protection(2)^ (cont’d.): | ||||||||||||||||||||||||||||||
Bear Stearns Asset Backed Securities | 11/27/19 | 1.250%(M) | 1,165 | * | $ | 1,131 | $ | — | $ | 1,131 | Goldman Sachs International | |||||||||||||||||||
BlueMountain CLO | 11/26/19 | 1.000%(M) | 232 | * | 174 | — | 174 | Goldman Sachs International | ||||||||||||||||||||||
Cairn CLO BV | 11/26/19 | 1.000%(M) | EUR | 562 | * | 522 | — | 522 | Goldman Sachs International | |||||||||||||||||||||
Canyon CLO | 11/26/19 | 0.500%(M) | 164 | * | 61 | — | 61 | Goldman Sachs International | ||||||||||||||||||||||
CIFC CLO | 11/26/19 | 1.000%(M) | 175 | * | 131 | — | 131 | Goldman Sachs International | ||||||||||||||||||||||
Citigroup Commercial Mortgage Trust | 11/26/19 | 1.250%(M) | 939 | * | 945 | — | 945 | Goldman Sachs International | ||||||||||||||||||||||
Citigroup Commercial Mortgage Trust | 11/26/19 | 1.250%(M) | 596 | 6.940 | % | 599 | — | 599 | Goldman Sachs International | |||||||||||||||||||||
Citigroup Commercial Mortgage Trust | 11/26/19 | 1.250%(M) | 547 | * | 551 | — | 551 | Goldman Sachs International | ||||||||||||||||||||||
Citigroup Commercial Mortgage Trust | 11/26/19 | 1.250%(M) | 319 | 4.670 | % | 321 | — | 321 | Goldman Sachs International | |||||||||||||||||||||
COMM Mortgage Trust | 11/26/19 | 1.250%(M) | 1,095 | * | 1,101 | — | 1,101 | Goldman Sachs International | ||||||||||||||||||||||
COMM Mortgage Trust | 11/26/19 | 1.250%(M) | 865 | 19.740 | % | 870 | — | 870 | Goldman Sachs International | |||||||||||||||||||||
COMM Mortgage Trust | 11/26/19 | 1.250%(M) | 802 | * | 807 | — | 807 | Goldman Sachs International | ||||||||||||||||||||||
COMM Mortgage Trust | 11/26/19 | 1.250%(M) | 620 | * | 624 | — | 624 | Goldman Sachs International | ||||||||||||||||||||||
See Notes to Financial Statements.
| PGIM Global Total Return Fund | 121 |
Schedule of Investments(continued)
as of October 31, 2019
Credit default swap agreements outstanding at October 31, 2019 (continued):
Reference Entity/ Obligation | Termination Date | Fixed Rate | Notional Amount (000)#(3) | Implied Credit Spread at October 31, 2019(4) | Fair Value | Upfront Premiums Paid (Received) | Unrealized Appreciation (Depreciation) | Counterparty | ||||||||||||||||||||||
OTC Credit Default Swap Agreements on asset-backed securities—Sell Protection(2)^ (cont’d.): | ||||||||||||||||||||||||||||||
COMM Mortgage Trust | 11/26/19 | 1.250%(M) | 576 | 6.940 | % | $ | 579 | $ | — | $ | 579 | Goldman Sachs International | ||||||||||||||||||
COMM Mortgage Trust | 11/26/19 | 1.250%(M) | 390 | 7.460 | % | 392 | — | 392 | Goldman Sachs International | |||||||||||||||||||||
Commerzbank AG CLO | 11/26/19 | 1.000%(M) | EUR | 558 | * | 519 | — | 519 | Goldman Sachs International | |||||||||||||||||||||
Connecticut Avenue Securities | 11/27/19 | 1.250%(M) | 4,446 | * | 4,318 | — | 4,318 | Goldman Sachs International | ||||||||||||||||||||||
Connecticut Avenue Securities | 11/27/19 | 1.250%(M) | 2,941 | * | 2,856 | — | 2,856 | Goldman Sachs International | ||||||||||||||||||||||
CSAM CLO | 11/26/19 | 1.000%(M) | 152 | * | 114 | — | 114 | Goldman Sachs International | ||||||||||||||||||||||
DFG CLO | 11/26/19 | 1.000%(M) | 135 | * | 101 | — | 101 | Goldman Sachs International | ||||||||||||||||||||||
Ellington CLO | 11/26/19 | 1.000%(M) | 2,744 | * | 2,056 | — | 2,056 | Goldman Sachs International | ||||||||||||||||||||||
Equity One Home Equity | 11/27/19 | 1.250%(M) | 769 | * | 747 | — | 747 | Goldman Sachs International | ||||||||||||||||||||||
Fannie Mae Connecticut Avenue Securities | 11/27/19 | 1.250%(M) | 2,715 | * | 2,637 | — | 2,637 | Goldman Sachs International | ||||||||||||||||||||||
Fannie Mae Connecticut Avenue Securities | 11/27/19 | 1.250%(M) | 1,573 | * | 1,527 | — | 1,527 | Goldman Sachs International | ||||||||||||||||||||||
Fannie Mae Connecticut Avenue Securities | 11/27/19 | 1.250%(M) | 1,103 | * | 1,071 | — | 1,071 | Goldman Sachs International | ||||||||||||||||||||||
Fannie Mae Connecticut Avenue Securities | 11/27/19 | 1.250%(M) | 669 | * | 650 | — | 650 | Goldman Sachs International | ||||||||||||||||||||||
See Notes to Financial Statements.
| 122 |
Credit default swap agreements outstanding at October 31, 2019 (continued):
Reference Entity/ Obligation | Termination Date | Fixed Rate | Notional Amount (000)#(3) | Implied Credit Spread at October 31, 2019(4) | Fair Value | Upfront Premiums Paid (Received) | Unrealized Appreciation (Depreciation) | Counterparty | ||||||||||||||||||||||
OTC Credit Default Swap Agreements on asset-backed securities—Sell Protection(2)^ (cont’d.): | ||||||||||||||||||||||||||||||
Freddie Mac Structured Agency Credit Risk | 11/27/19 | 1.250%(M) | 1,191 | * | $ | 1,157 | $ | — | $ | 1,157 | Goldman Sachs International | |||||||||||||||||||
GMAC Home Equity | 11/27/19 | 1.250%(M) | 497 | * | 483 | — | 483 | Goldman Sachs International | ||||||||||||||||||||||
GMAC Home Equity | 11/27/19 | 1.250%(M) | 466 | * | 453 | — | 453 | Goldman Sachs International | ||||||||||||||||||||||
GS Mortgage Securities Trust | 11/26/19 | 1.250%(M) | 519 | 7.460 | % | 522 | — | 522 | Goldman Sachs International | |||||||||||||||||||||
GS Mortgage Securities Trust | 11/26/19 | 1.250%(M) | 501 | * | 504 | — | 504 | Goldman Sachs International | ||||||||||||||||||||||
GSO CLO | 11/26/19 | 1.000%(M) | 240 | * | 180 | — | 180 | Goldman Sachs International | ||||||||||||||||||||||
GSR Mortgage Loan Trust | 11/27/19 | 1.250%(M) | 864 | * | 839 | — | 839 | Goldman Sachs International | ||||||||||||||||||||||
ICG CLO Ltd. | 11/26/19 | 0.500%(M) | 407 | * | 11 | — | 11 | Goldman Sachs International | ||||||||||||||||||||||
Invesco CLO | 11/26/19 | 0.500%(M) | 179 | * | 67 | — | 67 | Goldman Sachs International | ||||||||||||||||||||||
JPMBB Commercial Mortgage Securities Trust | 11/26/19 | 1.250%(M) | 1,388 | 8.827 | % | 1,396 | — | 1,396 | Goldman Sachs International | |||||||||||||||||||||
JPMBB Commercial Mortgage Securities Trust | 11/26/19 | 1.250%(M) | 879 | * | 884 | — | 884 | Goldman Sachs International | ||||||||||||||||||||||
JPMorgan Chase Commercial Mortgage Securities | 11/26/19 | 1.250%(M) | 511 | * | 514 | — | 514 | Goldman Sachs International | ||||||||||||||||||||||
JPMorgan Chase Commercial Mortgage Securities | 11/26/19 | 1.250%(M) | 190 | * | 191 | — | 191 | Goldman Sachs International | ||||||||||||||||||||||
See Notes to Financial Statements.
| PGIM Global Total Return Fund | 123 |
Schedule of Investments(continued)
as of October 31, 2019
Credit default swap agreements outstanding at October 31, 2019 (continued):
Reference Entity/ Obligation | Termination Date | Fixed Rate | Notional Amount (000)#(3) | Implied Credit Spread at October 31, 2019(4) | Fair Value | Upfront Premiums Paid (Received) | Unrealized Appreciation (Depreciation) | Counterparty | ||||||||||||||||||||||
OTC Credit Default Swap Agreements on asset-backed securities—Sell Protection(2)^ (cont’d.): | ||||||||||||||||||||||||||||||
LCM CLO | 11/26/19 | 1.000%(M) | 153 | * | $ | 115 | $ | — | $ | 115 | Goldman Sachs International | |||||||||||||||||||
Lehman Home Equity | 11/27/19 | 1.250%(M) | 409 | * | 398 | — | 398 | Goldman Sachs International | ||||||||||||||||||||||
MJX CLO | 11/26/19 | 0.500%(M) | 190 | * | 71 | — | 71 | Goldman Sachs International | ||||||||||||||||||||||
Morgan Stanley Home Equity | 11/27/19 | 1.250%(M) | 470 | * | 456 | — | 456 | Goldman Sachs International | ||||||||||||||||||||||
Oak Hill CLO | 11/26/19 | 1.000%(M) | EUR | 641 | * | 595 | — | 595 | Goldman Sachs International | |||||||||||||||||||||
Och-Ziff CLO | 11/26/19 | 0.500%(M) | 504 | * | 189 | — | 189 | Goldman Sachs International | ||||||||||||||||||||||
Octagon CLO | 11/26/19 | 1.000%(M) | 39 | * | 29 | — | 29 | Goldman Sachs International | ||||||||||||||||||||||
Octagon Investment Partners XV Ltd. | 11/26/19 | 1.000%(M) | 331 | * | 248 | — | 248 | Goldman Sachs International | ||||||||||||||||||||||
Palmer Square CLO Ltd. | 11/26/19 | 0.500%(M) | 228 | * | 86 | — | 86 | Goldman Sachs International | ||||||||||||||||||||||
PineBridge Investments CLO | 11/26/19 | 0.500%(M) | 138 | * | 52 | — | 52 | Goldman Sachs International | ||||||||||||||||||||||
Shenkman Capital Manangement, Inc. | 11/26/19 | 1.000%(M) | 85 | * | 64 | — | 64 | Goldman Sachs International | ||||||||||||||||||||||
Sound Point CLO Ltd. | 11/26/19 | 0.500%(M) | 1,153 | * | 432 | — | 432 | Goldman Sachs International | ||||||||||||||||||||||
Sound Point CLO Ltd. | 11/26/19 | 0.500%(M) | 553 | * | 207 | — | 207 | Goldman Sachs International | ||||||||||||||||||||||
See Notes to Financial Statements.
| 124 |
Credit default swap agreements outstanding at October 31, 2019 (continued):
Reference Entity/ Obligation | Termination Date | Fixed Rate | Notional Amount (000)#(3) | Implied Credit Spread at October 31, 2019(4) | Fair Value | Upfront Premiums Paid (Received) | Unrealized Appreciation (Depreciation) | Counterparty | ||||||||||||||||||||||
OTC Credit Default Swap Agreements on asset-backed securities—Sell Protection(2)^ (cont’d.): | ||||||||||||||||||||||||||||||
Sound Point CLO Ltd. | 11/26/19 | 1.000%(M) | 540 | * | $ | 404 | $ | — | $ | 404 | Goldman Sachs International | |||||||||||||||||||
Sound Point CLO Ltd. | 11/26/19 | 1.000%(M) | 87 | * | 65 | — | 65 | Goldman Sachs International | ||||||||||||||||||||||
Steele Creek | 11/26/19 | 1.000%(M) | 412 | * | 308 | — | 308 | Goldman Sachs International | ||||||||||||||||||||||
Structured Agency Credit Risk | 11/27/19 | 1.250%(M) | 2,889 | * | 2,805 | — | 2,805 | Goldman Sachs International | ||||||||||||||||||||||
Structured Agency Credit Risk | 11/27/19 | 1.250%(M) | 1,437 | * | 1,396 | — | 1,396 | Goldman Sachs International | ||||||||||||||||||||||
Structured Agency Credit Risk | 11/27/19 | 1.250%(M) | 1,331 | * | 1,293 | — | 1,293 | Goldman Sachs International | ||||||||||||||||||||||
THL CLO | 11/26/19 | 0.500%(M) | 232 | * | 87 | — | 87 | Goldman Sachs International | ||||||||||||||||||||||
Voya CLO Ltd. | 11/26/19 | 1.000%(M) | 398 | * | 298 | — | 298 | Goldman Sachs International | ||||||||||||||||||||||
Wellfleet CLO | 11/26/19 | 0.500%(M) | 344 | * | 129 | — | 129 | Goldman Sachs International | ||||||||||||||||||||||
Wells Fargo Commercial Mortgage Trust | 11/26/19 | 1.250%(M) | 1,687 | * | 1,697 | — | 1,697 | Goldman Sachs International | ||||||||||||||||||||||
Wells Fargo Commercial Mortgage Trust | 11/26/19 | 1.250%(M) | 315 | * | 317 | — | 317 | Goldman Sachs International | ||||||||||||||||||||||
|
|
|
|
|
| |||||||||||||||||||||||||
| $ | 49,237 | $ | — | $ | 49,237 | |||||||||||||||||||||||||
|
|
|
|
|
| |||||||||||||||||||||||||
See Notes to Financial Statements.
| PGIM Global Total Return Fund | 125 |
Schedule of Investments(continued)
as of October 31, 2019
Credit default swap agreements outstanding at October 31, 2019 (continued):
Reference Entity/ Obligation | Termination Date | Fixed Rate | Notional Amount (000)#(3) | Fair Value | Upfront Premiums Paid (Received) | Unrealized Appreciation (Depreciation) | Counterparty | |||||||||||||||||||
OTC Credit Default Swap Agreements on corporate and/or sovereign issues—Buy Protection(1): | ||||||||||||||||||||||||||
Assicurazioni Generali SpA | 06/20/23 | 1.000%(Q) | EUR | 2,000 | $ | (15,544 | ) | $ | 97,114 | $ | (112,658 | ) | Barclays Bank PLC | |||||||||||||
Central Bank of Tunisia | 12/20/22 | 1.000%(Q) | 700 | 46,452 | 45,196 | 1,256 | Barclays Bank PLC | |||||||||||||||||||
Eskom Holdings SOC Ltd. | 12/20/23 | 1.000%(Q) | EUR | 2,640 | 273,423 | 492,035 | (218,612 | ) | Deutsche Bank AG | |||||||||||||||||
Hellenic Republic | 06/20/23 | 1.000%(Q) | 1,400 | (2,177 | ) | 101,181 | (103,358 | ) | Bank of America, N.A. | |||||||||||||||||
Kingdom of Spain | 06/20/23 | 1.000%(Q) | 3,200 | (98,547 | ) | (59,198 | ) | (39,349 | ) | Bank of America, N.A. | ||||||||||||||||
Petroleos Mexicanos | 06/20/20 | 1.000%(Q) | 5,450 | (28,641 | ) | 17,462 | (46,103 | ) | Citibank, N.A. | |||||||||||||||||
Petroleos Mexicanos | 06/20/20 | 1.000%(Q) | 2,690 | (14,136 | ) | 8,482 | (22,618 | ) | Citibank, N.A. | |||||||||||||||||
Republic of Argentina | 06/20/24 | 5.000%(Q) | 9,585 | 5,826,437 | 5,792,192 | 34,245 | Citibank, N.A. | |||||||||||||||||||
Republic of Italy | 06/20/23 | 1.000%(Q) | 14,270 | (220,767 | ) | 148,293 | (369,060 | ) | Citibank, N.A. | |||||||||||||||||
Republic of Italy | 06/20/23 | 1.000%(Q) | EUR | 12,700 | (183,535 | ) | 94,868 | (278,403 | ) | Barclays Bank PLC | ||||||||||||||||
Republic of Italy | 06/20/23 | 1.000%(Q) | EUR | 10,455 | (151,091 | ) | 107,839 | (258,930 | ) | Barclays Bank PLC | ||||||||||||||||
Republic of Italy | 06/20/23 | 1.000%(Q) | 3,700 | (57,242 | ) | 43,187 | (100,429 | ) | Citibank, N.A. | |||||||||||||||||
Republic of Italy | 06/20/28 | 1.000%(Q) | EUR | 5,145 | 73,654 | 274,606 | (200,952 | ) | Barclays Bank PLC | |||||||||||||||||
|
|
|
|
|
| |||||||||||||||||||||
| $ | 5,448,286 | $ | 7,163,257 | $ | (1,714,971 | ) | ||||||||||||||||||||
|
|
|
|
|
| |||||||||||||||||||||
Reference Entity/ Obligation | Termination Date | Fixed Rate | Notional Amount (000)#(3) | Implied Credit Spread at October 31, 2019(4) | Fair Value | Upfront Premiums Paid (Received) | Unrealized Appreciation (Depreciation) | Counterparty | ||||||||||||||||||||||
OTC Credit Default Swap Agreements on corporate and/or sovereign issues—Sell Protection(2): | ||||||||||||||||||||||||||||||
Arab Republic of Egypt | 06/20/20 | 1.000%(Q) | 1,000 | 1.515 | % | $ | (2,115 | ) | $ | (12,105 | ) | $ | 9,990 | Deutsche Bank AG | ||||||||||||||||
AT&T, Inc. | 06/20/20 | 1.000%(Q) | 1,000 | 0.146 | % | 6,643 | 5,494 | 1,149 | BNP Paribas S.A. | |||||||||||||||||||||
Deutsche Bank AG | 12/20/19 | 1.000%(Q) | EUR | 1,000 | 0.216 | % | 2,518 | 1,354 | 1,164 | Bank of America, N.A. | ||||||||||||||||||||
Eskom Holdings SOC Ltd. | 12/20/23 | 1.000%(Q) | 3,000 | 3.416 | % | (267,530 | ) | (479,838 | ) | 212,308 | Deutsche Bank AG | |||||||||||||||||||
Federation of Malaysia | 12/20/19 | 1.000%(Q) | 2,000 | 0.063 | % | 4,924 | 2,743 | 2,181 | Barclays Bank PLC | |||||||||||||||||||||
Federation of Malaysia | 12/20/19 | 1.000%(Q) | 2,000 | 0.063 | % | 4,924 | 2,663 | 2,261 | HSBC Bank USA, N.A. | |||||||||||||||||||||
Generalitat de Cataluna | 12/20/22 | 1.000%(Q) | 2,960 | 2.782 | % | (148,631 | ) | (363,324 | ) | 214,693 | Citibank, N.A. | |||||||||||||||||||
See Notes to Financial Statements.
| 126 |
Credit default swap agreements outstanding at October 31, 2019 (continued):
Reference Entity/ Obligation | Termination Date | Fixed Rate | Notional Amount (000)#(3) | Implied Credit Spread at October 31, 2019(4) | Fair Value | Upfront Premiums Paid (Received) | Unrealized Appreciation (Depreciation) | Counterparty | ||||||||||||||||||||||
OTC Credit Default Swap Agreements on corporate and/or sovereign issues—Sell Protection(2) (cont’d.): | ||||||||||||||||||||||||||||||
Government of Jamaica | 12/20/19 | 1.000%(Q) | 1,000 | 2.778 | % | $ | (1,286 | ) | $ | (733 | ) | $ | (553 | ) | Credit Suisse International | |||||||||||||||
Hellenic Republic | 06/20/22 | 1.000%(Q) | 410 | 0.916 | % | 1,367 | (56,359 | ) | 57,726 | Citibank, N.A. | ||||||||||||||||||||
Hellenic Republic | 06/20/22 | 1.000%(Q) | 200 | 0.916 | % | 667 | (28,271 | ) | 28,938 | Goldman Sachs International | ||||||||||||||||||||
Hellenic Republic | 12/20/22 | 1.000%(Q) | 500 | 1.016 | % | 333 | (40,810 | ) | 41,143 | Citibank, N.A. | ||||||||||||||||||||
Hellenic Republic | 06/20/23 | 1.000%(Q) | 1,400 | 1.188 | % | (7,545 | ) | (126,224 | ) | 118,679 | Bank of America, N.A. | |||||||||||||||||||
Hellenic Republic | 06/20/23 | 1.000%(Q) | 300 | 1.188 | % | (1,617 | ) | (24,756 | ) | 23,139 | Citibank, N.A. | |||||||||||||||||||
Hellenic Republic | 06/20/24 | 1.000%(Q) | 1,000 | 1.456 | % | (18,673 | ) | (188,814 | ) | 170,141 | Barclays Bank PLC | |||||||||||||||||||
Kingdom of Belgium | 03/20/20 | 1.000%(Q) | 3,000 | 0.021 | % | 14,925 | (5,259 | ) | 20,184 | JPMorgan Chase Bank, N.A. | ||||||||||||||||||||
Kingdom of Belgium | 12/20/24 | 1.000%(Q) | 3,500 | 0.177 | % | 147,499 | 18,479 | 129,020 | HSBC Bank USA, N.A. | |||||||||||||||||||||
Kingdom of Belgium | 06/20/26 | 1.000%(Q) | 4,000 | 0.245 | % | 196,189 | 92,816 | 103,373 | Barclays Bank PLC | |||||||||||||||||||||
Kingdom of Denmark | 06/20/26 | 0.250%(Q) | 1,000 | 0.146 | % | 6,914 | (15,095 | ) | 22,009 | Goldman Sachs International | ||||||||||||||||||||
Kingdom of Saudi Arabia | 12/20/21 | 1.000%(Q) | 1,900 | 0.255 | % | 32,201 | (29,440 | ) | 61,641 | Barclays Bank PLC | ||||||||||||||||||||
Kingdom of Saudi Arabia | 06/20/22 | 1.000%(Q) | 3,000 | 0.335 | % | 55,377 | 39,635 | 15,742 | HSBC Bank USA, N.A. | |||||||||||||||||||||
Kingdom of Spain | 09/20/20 | 1.000%(Q) | 2,500 | 0.066 | % | 23,753 | 521 | 23,232 | Barclays Bank PLC | |||||||||||||||||||||
Kingdom of Spain | 06/20/21 | 1.000%(Q) | 700 | 0.085 | % | 11,271 | (5,415 | ) | 16,686 | Deutsche Bank AG | ||||||||||||||||||||
Kingdom of Spain | 09/20/21 | 1.000%(Q) | 1,500 | 0.092 | % | 27,332 | 13,471 | 13,861 | HSBC Bank USA, N.A. | |||||||||||||||||||||
Kingdom of Spain | 06/20/23 | 1.000%(Q) | 42,665 | 0.256 | % | 1,179,576 | 382,983 | 796,593 | Bank of America, N.A. | |||||||||||||||||||||
Kingdom of Spain | 06/20/23 | 1.000%(Q) | 3,200 | 0.256 | % | 88,472 | 40,894 | 47,578 | Bank of America, N.A. | |||||||||||||||||||||
See Notes to Financial Statements.
| PGIM Global Total Return Fund | 127 |
Schedule of Investments(continued)
as of October 31, 2019
Credit default swap agreements outstanding at October 31, 2019 (continued):
Reference Entity/ | Termination Date | Fixed Rate | Notional Amount (000)#(3) | Implied Credit Spread at October 31, 2019(4) | Fair Value | Upfront Premiums Paid (Received) | Unrealized Appreciation (Depreciation) | Counterparty | ||||||||||||||||||||||
OTC Credit Default Swap Agreements on corporate and/or sovereign issues—Sell Protection(2) (cont’d.): | ||||||||||||||||||||||||||||||
Kingdom of Spain | 06/20/24 | 1.000%(Q) | 700 | 0.216 | % | $ | 25,564 | $ | (22,175 | ) | $ | 47,739 | Deutsche Bank AG | |||||||||||||||||
Kingdom of Sweden | 06/20/26 | 0.250%(Q) | 1,000 | 0.152 | % | 6,516 | (14,270 | ) | 20,786 | Goldman Sachs International | ||||||||||||||||||||
Kingdom of Thailand | 12/20/21 | 1.000%(Q) | 2,100 | 0.104 | % | 42,383 | 2,290 | 40,093 | Barclays Bank PLC | |||||||||||||||||||||
Oriental Republic of Uruguay | 06/20/20 | 1.000%(Q) | 4,250 | 0.449 | % | 19,956 | (13,356 | ) | 33,312 | Citibank, N.A. | ||||||||||||||||||||
Oriental Republic of Uruguay | 06/20/21 | 1.000%(Q) | 800 | 0.624 | % | 5,811 | (5,680 | ) | 11,491 | Citibank, N.A. | ||||||||||||||||||||
People’s Republic of China | 12/20/19 | 1.000%(Q) | 2,000 | 0.045 | % | 4,974 | 3,390 | 1,584 | Citibank, N.A. | |||||||||||||||||||||
People’s Republic of China | 12/20/19 | 1.000%(Q) | 1,000 | 0.045 | % | 2,487 | 1,695 | 792 | HSBC Bank USA, N.A. | |||||||||||||||||||||
People’s Republic of China | 06/20/21 | 1.000%(Q) | 4,000 | 0.085 | % | 64,404 | (32,334 | ) | 96,738 | Deutsche Bank AG | ||||||||||||||||||||
People’s Republic of China | 12/20/21 | 1.000%(Q) | 1,600 | 0.103 | % | 32,347 | (3,979 | ) | 36,326 | Citibank, N.A. | ||||||||||||||||||||
People’s Republic of China | 12/20/21 | 1.000%(Q) | 1,500 | 0.103 | % | 30,325 | (3,216 | ) | 33,541 | Barclays Bank PLC | ||||||||||||||||||||
People’s Republic of China | 03/20/22 | 1.000%(Q) | 2,000 | 0.127 | % | 43,579 | (17,144 | ) | 60,723 | Goldman Sachs International | ||||||||||||||||||||
People’s Republic of China | 03/20/22 | 1.000%(Q) | 1,000 | 0.127 | % | 21,789 | (13,417 | ) | 35,206 | Deutsche Bank AG | ||||||||||||||||||||
Petroleos Mexicanos | 09/20/21 | 1.000%(Q) | 2,500 | 1.107 | % | (2,051 | ) | (51,626 | ) | 49,575 | Goldman Sachs International | |||||||||||||||||||
Republic of Argentina | 06/20/29 | 5.000%(Q) | 9,585 | 80.552 | % | (5,875,851 | ) | (5,917,063 | ) | 41,212 | Citibank, N.A. | |||||||||||||||||||
Republic of Chile | 12/20/21 | 1.000%(Q) | 2,500 | 0.180 | % | 46,423 | 2,195 | 44,228 | Deutsche Bank AG | |||||||||||||||||||||
See Notes to Financial Statements.
| 128 |
Credit default swap agreements outstanding at October 31, 2019 (continued):
Reference Entity/ Obligation | Termination Date | Fixed Rate | Notional Amount (000)#(3) | Implied Credit Spread at October 31, 2019(4) | Fair Value | Upfront Premiums Paid (Received) | Unrealized Appreciation (Depreciation) | Counterparty | ||||||||||||||||||||||
OTC Credit Default Swap Agreements on corporate and/or sovereign issues—Sell Protection(2) (cont’d.): | ||||||||||||||||||||||||||||||
Republic of Colombia | 12/20/21 | 1.000%(Q) | 2,000 | 0.345 | % | $ | 30,063 | $ | (31,197 | ) | $ | 61,260 | HSBC Bank USA, N.A. | |||||||||||||||||
Republic of Colombia | 06/20/23 | 1.000%(Q) | 5,000 | 0.530 | % | 89,068 | 2,992 | 86,076 | Deutsche Bank AG | |||||||||||||||||||||
Republic of Colombia | 12/20/26 | 1.000%(Q) | 1,000 | 1.155 | % | (9,108 | ) | (83,323 | ) | 74,215 | Citibank, N.A. | |||||||||||||||||||
Republic of France | 12/20/19 | 0.250%(Q) | 7,000 | 0.026 | % | 4,212 | (17,878 | ) | 22,090 | HSBC Bank USA, N.A. | ||||||||||||||||||||
Republic of France | 12/20/19 | 0.250%(Q) | 2,500 | 0.026 | % | 1,505 | (2,520 | ) | 4,025 | Goldman Sachs International | ||||||||||||||||||||
Republic of France | 03/20/20 | 0.250%(Q) | 3,000 | 0.015 | % | 3,615 | (68,432 | ) | 72,047 | JPMorgan Chase Bank, N.A. | ||||||||||||||||||||
Republic of Hungary | 06/20/22 | 1.000%(Q) | 3,550 | 0.361 | % | 63,124 | (17,749 | ) | 80,873 | Citibank, N.A. | ||||||||||||||||||||
Republic of Indonesia | 06/20/23 | 1.000%(Q) | 13,885 | 0.509 | % | 257,803 | (72,752 | ) | 330,555 | Citibank, N.A. | ||||||||||||||||||||
Republic of Ireland | 06/20/21 | 1.000%(Q) | 700 | 0.063 | % | 11,515 | 2,182 | 9,333 | Deutsche Bank AG | |||||||||||||||||||||
Republic of Ireland | 06/20/23 | 1.000%(Q) | 4,080 | 0.184 | % | 123,419 | 40,656 | 82,763 | Goldman Sachs International | |||||||||||||||||||||
Republic of Ireland | 06/20/24 | 1.000%(Q) | 4,000 | 0.244 | % | 140,975 | 75,193 | 65,782 | JPMorgan Chase Bank, N.A. | |||||||||||||||||||||
Republic of Ireland | 06/20/24 | 1.000%(Q) | 700 | 0.191 | % | 26,369 | (7,777 | ) | 34,146 | Deutsche Bank AG | ||||||||||||||||||||
Republic of Ireland | 12/20/26 | 1.000%(Q) | 3,100 | 0.348 | % | 140,126 | (2,411 | ) | 142,537 | JPMorgan Chase Bank, N.A. | ||||||||||||||||||||
Republic of Ireland | 12/20/26 | 1.000%(Q) | 2,000 | 0.348 | % | 90,404 | 4,657 | 85,747 | Goldman Sachs International | |||||||||||||||||||||
Republic of Ireland | 06/20/27 | 1.000%(Q) | 2,800 | 0.369 | % | 130,291 | 65,087 | 65,204 | Morgan Stanley & Co. International PLC | |||||||||||||||||||||
Republic of Italy | 06/20/20 | 1.000%(Q) | 6,000 | 0.238 | % | 36,310 | (7,020 | ) | 43,330 | HSBC Bank USA, N.A. | ||||||||||||||||||||
See Notes to Financial Statements.
| PGIM Global Total Return Fund | 129 |
Schedule of Investments(continued)
as of October 31, 2019
Credit default swap agreements outstanding at October 31, 2019 (continued):
Reference Entity/ Obligation | Termination Date | Fixed Rate | Notional Amount (000)#(3) | Implied Credit Spread at October 31, 2019(4) | Fair Value | Upfront Premiums Paid (Received) | Unrealized Appreciation (Depreciation) | Counterparty | ||||||||||||||||||||||
OTC Credit Default Swap Agreements on corporate and/or sovereign issues—Sell Protection(2) (cont’d.): | ||||||||||||||||||||||||||||||
Republic of Italy | 09/20/20 | 1.000%(Q) | 1,500 | 0.292 | % | $ | 11,207 | $ | (7,531 | ) | $ | 18,738 | Barclays Bank PLC | |||||||||||||||||
Republic of Italy | 03/20/22 | 1.000%(Q) | 3,000 | 0.638 | % | 28,947 | (84,597 | ) | 113,544 | Goldman Sachs International | ||||||||||||||||||||
Republic of Italy | 03/20/22 | 1.000%(Q) | 3,000 | 0.638 | % | 28,947 | (84,532 | ) | 113,479 | JPMorgan Chase Bank, N.A. | ||||||||||||||||||||
Republic of Italy | 06/20/23 | 1.000%(Q) | 18,300 | 0.888 | % | 93,405 | (872,521 | ) | 965,926 | Bank of America, N.A. | ||||||||||||||||||||
Republic of Italy | 06/20/23 | 1.000%(Q) | 15,000 | 0.888 | % | 76,561 | (284,100 | ) | 360,661 | Barclays Bank PLC | ||||||||||||||||||||
Republic of Italy | 06/20/23 | 1.000%(Q) | 14,270 | 0.888 | % | 72,835 | (627,136 | ) | 699,971 | Citibank, N.A. | ||||||||||||||||||||
Republic of Italy | 06/20/23 | 1.000%(Q) | 13,405 | 0.888 | % | 68,420 | (458,966 | ) | 527,386 | Morgan Stanley & Co. International PLC | ||||||||||||||||||||
Republic of Italy | 06/20/23 | 1.000%(Q) | 4,000 | 0.888 | % | 20,416 | — | 20,416 | Morgan Stanley & Co. International PLC | |||||||||||||||||||||
Republic of Italy | 06/20/23 | 1.000%(Q) | 3,700 | 0.888 | % | 18,885 | (167,716 | ) | 186,601 | Citibank, N.A. | ||||||||||||||||||||
Republic of Italy | 06/20/24 | 1.000%(Q) | 6,000 | 1.066 | % | (10,438 | ) | (289,165 | ) | 278,727 | Bank of America, N.A. | |||||||||||||||||||
Republic of Italy | 06/20/24 | 1.000%(Q) | 900 | 0.743 | % | 11,342 | (44,408 | ) | 55,750 | Deutsche Bank AG | ||||||||||||||||||||
Republic of Italy | 06/20/26 | 1.000%(Q) | 5,000 | 1.360 | % | (103,063 | ) | (336,891 | ) | 233,828 | BNP Paribas S.A. | |||||||||||||||||||
Republic of Italy | 06/20/26 | 1.000%(Q) | 4,200 | 1.360 | % | (86,573 | ) | (217,980 | ) | 131,407 | Bank of America, N.A. | |||||||||||||||||||
Republic of Italy | 12/20/26 | 1.000%(Q) | 400 | 1.411 | % | (10,126 | ) | (33,711 | ) | 23,585 | HSBC Bank USA, N.A. | |||||||||||||||||||
Republic of Kazakhstan | 06/20/23 | 1.000%(Q) | 7,695 | 0.411 | % | 170,009 | — | 170,009 | Citibank, N.A. | |||||||||||||||||||||
Republic of Korea | 12/20/19 | 1.000%(Q) | 2,630 | 0.118 | % | 6,275 | 3,163 | 3,112 | Citibank, N.A. | |||||||||||||||||||||
Republic of Panama | 12/20/20 | 1.000%(Q) | 5,500 | 0.105 | % | 62,499 | (129,670 | ) | 192,169 | JPMorgan Chase Bank, N.A. | ||||||||||||||||||||
See Notes to Financial Statements.
| 130 |
Credit default swap agreements outstanding at October 31, 2019 (continued):
Reference Entity/ Obligation | Termination Date | Fixed Rate | Notional Amount (000)#(3) | Implied Credit Spread at October 31, 2019(4) | Fair Value | Upfront Premiums Paid (Received) | Unrealized Appreciation (Depreciation) | Counterparty | ||||||||||||||||||||||
OTC Credit Default Swap Agreements on corporate and/or sovereign issues—Sell Protection(2) (cont’d.): | ||||||||||||||||||||||||||||||
Republic of Panama | 06/20/22 | 1.000%(Q) | 5,000 | 0.210 | % | $ | 108,693 | $ | 34,497 | $ | 74,196 | Citibank, N.A. | ||||||||||||||||||
Republic of Peru | 03/20/22 | 1.000%(Q) | 3,000 | 0.196 | % | 60,443 | (82,578 | ) | 143,021 | Barclays Bank PLC | ||||||||||||||||||||
Republic of Portugal | 06/20/21 | 1.000%(Q) | 700 | 0.101 | % | 11,086 | (31,561 | ) | 42,647 | Deutsche Bank AG | ||||||||||||||||||||
Republic of Portugal | 12/20/23 | 1.000%(Q) | 4,130 | 0.287 | % | 123,507 | (1,644 | ) | 125,151 | Morgan Stanley & Co. International PLC | ||||||||||||||||||||
Republic of Portugal | 06/20/24 | 1.000%(Q) | 400 | 0.248 | % | 14,006 | (34,741 | ) | 48,747 | Deutsche Bank AG | ||||||||||||||||||||
Republic of Serbia | 06/20/21 | 1.000%(Q) | 2,000 | 0.208 | % | 28,137 | 21,050 | 7,087 | BNP Paribas S.A. | |||||||||||||||||||||
Republic of Slovenia | 06/20/24 | 1.000%(Q) | 900 | 0.704 | % | 12,934 | (60,889 | ) | 73,823 | HSBC Bank USA, N.A. | ||||||||||||||||||||
Republic of South Africa | 06/20/23 | 1.000%(Q) | 5,000 | 1.494 | % | (80,119 | ) | (103,805 | ) | 23,686 | Deutsche Bank AG | |||||||||||||||||||
Republic of South Africa | 12/20/23 | 1.000%(Q) | 3,000 | 1.611 | % | (68,354 | ) | (141,962 | ) | 73,608 | Bank of America, N.A. | |||||||||||||||||||
Republic of Turkey | 12/20/19 | 1.000%(Q) | 1,000 | 0.576 | % | 1,753 | (273 | ) | 2,026 | Credit Suisse International | ||||||||||||||||||||
Republic of Turkey | 03/20/20 | 1.000%(Q) | 2,000 | 0.667 | % | 4,917 | (27,675 | ) | 32,592 | JPMorgan Chase Bank, N.A. | ||||||||||||||||||||
Republic of Turkey | 06/20/23 | 1.000%(Q) | 5,510 | 2.961 | % | (358,104 | ) | (637,641 | ) | 279,537 | BNP Paribas S.A. | |||||||||||||||||||
Republic of Turkey | 06/20/23 | 1.000%(Q) | 2,760 | 2.961 | % | (179,377 | ) | (310,297 | ) | 130,920 | BNP Paribas S.A. | |||||||||||||||||||
Republic of Ukraine | 06/20/20 | 5.000%(Q) | 1,800 | 3.105 | % | 32,101 | 21,948 | 10,153 | Citibank, N.A. | |||||||||||||||||||||
Republic of Uruguay | 06/20/21 | 1.000%(Q) | 400 | 0.624 | % | 2,905 | (3,982 | ) | 6,887 | Citibank, N.A. | ||||||||||||||||||||
Republic of Uruguay | 12/20/21 | 1.000%(Q) | 1,500 | 0.698 | % | 11,285 | (16,347 | ) | 27,632 | Citibank, N.A. | ||||||||||||||||||||
Russian Federation | 12/20/21 | 1.000%(Q) | 8,525 | 0.295 | % | 137,260 | (373,662 | ) | 510,922 | Barclays Bank PLC | ||||||||||||||||||||
Russian Federation | 12/20/21 | 1.000%(Q) | 3,000 | 0.295 | % | 48,303 | (135,832 | ) | 184,135 | Barclays Bank PLC | ||||||||||||||||||||
See Notes to Financial Statements.
| PGIM Global Total Return Fund | 131 |
Schedule of Investments(continued)
as of October 31, 2019
Credit default swap agreements outstanding at October 31, 2019 (continued):
Reference Entity/ Obligation | Termination Date | Fixed Rate | Notional Amount (000)#(3) | Implied Credit Spread at October 31, 2019(4) | Fair Value | Upfront Premiums Paid (Received) | Unrealized Appreciation (Depreciation) | Counterparty | ||||||||||||||||||||||
OTC Credit Default Swap Agreements on corporate and/or sovereign issues—Sell Protection(2) (cont’d.): | ||||||||||||||||||||||||||||||
Russian Federation | 12/20/22 | 1.000%(Q) | 7,350 | 0.434 | % | $ | 136,563 | $ | (14,508 | ) | $ | 151,071 | Citibank, N.A. | |||||||||||||||||
Russian Federation | 06/20/23 | 1.000%(Q) | 7,000 | 0.518 | % | 127,953 | (97,648 | ) | 225,601 | Morgan Stanley & Co. International PLC | ||||||||||||||||||||
Russian Federation | 06/20/23 | 1.000%(Q) | 4,000 | 0.518 | % | 73,116 | (66,826 | ) | 139,942 | Morgan Stanley & Co. International PLC | ||||||||||||||||||||
Russian Federation | 06/20/23 | 1.000%(Q) | 1,640 | 0.518 | % | 29,978 | (27,032 | ) | 57,010 | BNP Paribas S.A. | ||||||||||||||||||||
Russian Federation | 12/20/26 | 1.000%(Q) | 1,200 | 1.084 | % | (5,301 | ) | (120,263 | ) | 114,962 | Barclays Bank PLC | |||||||||||||||||||
State of Illinois | 12/20/22 | 1.000%(Q) | 2,725 | 1.122 | % | (6,804 | ) | (91,064 | ) | 84,260 | Citibank, N.A. | |||||||||||||||||||
State of Illinois | 12/20/24 | 1.000%(Q) | 2,800 | 1.582 | % | (72,622 | ) | (172,976 | ) | 100,354 | Goldman Sachs International | |||||||||||||||||||
State of Illinois | 06/20/28 | 1.000%(Q) | 1,000 | 2.224 | % | (83,802 | ) | (107,363 | ) | 23,561 | Citibank, N.A. | |||||||||||||||||||
T-Mobile, Inc. | 12/20/19 | 5.000%(Q) | 4,830 | 0.144 | % | 60,596 | 31,791 | 28,805 | Credit Suisse International | |||||||||||||||||||||
|
|
|
|
|
| |||||||||||||||||||||||||
| $ | (2,403,564 | ) | $ | (13,167,416 | ) | $ | 10,763,852 | |||||||||||||||||||||||
|
|
|
|
|
| |||||||||||||||||||||||||
Reference Entity/ Obligation | Termination Date | Fixed Rate | Notional Amount (000)#(3) | Implied Credit Spread at October 31, 2019(4) | Value at Trade Date | Value at October 31, 2019 | Unrealized Appreciation (Depreciation) | |||||||||||||||||||||
Centrally Cleared Credit Default Swap Agreements on credit indices—Sell Protection(2): |
| |||||||||||||||||||||||||||
CDX.NA.HY.25.V8 | 12/20/20 | 5.000%(Q) | 27,900 | * | $ | 767,250 | $ | 885,398 | $ | 118,148 | ||||||||||||||||||
CDX.NA.HY.33.V1 | 12/20/24 | 5.000%(Q) | 36,300 | 3.391 | % | 2,440,167 | 2,799,798 | 359,631 | ||||||||||||||||||||
|
|
|
|
|
| |||||||||||||||||||||||
| $ | 3,207,417 | $ | 3,685,196 | $ | 477,779 | |||||||||||||||||||||||
|
|
|
|
|
| |||||||||||||||||||||||
See Notes to Financial Statements.
| 132 |
Credit default swap agreements outstanding at October 31, 2019 (continued):
Reference Entity/ Obligation | Termination Date | Fixed Rate | Notional Amount (000)#(3) | Implied Credit Spread at October 31, 2019(4) | Fair Value | Upfront Premiums Paid (Received) | Unrealized Appreciation (Depreciation) | Counterparty | ||||||||||||||||||||||
OTC Credit Default Swap Agreements on credit indices—Sell Protection(2): | ||||||||||||||||||||||||||||||
CDX.EM.27.V2 | 06/20/22 | 1.000%(Q) | 10,670 | 1.535 | % | $ | (132,581 | ) | $ | (366,227 | ) | $ | 233,646 | Citibank, N.A. | ||||||||||||||||
CMBX.NA.6.AA | 05/11/63 | 1.500%(M) | 5,000 | * | 103,679 | (27,896 | ) | 131,575 | JPMorgan Securities LLC | |||||||||||||||||||||
|
|
|
|
|
| |||||||||||||||||||||||||
| $ | (28,902 | ) | $ | (394,123 | ) | $ | 365,221 | |||||||||||||||||||||||
|
|
|
|
|
| |||||||||||||||||||||||||
The Fund entered into credit default swaps (“CDS”) to provide a measure of protection against defaults or to take an active long or short position with respect to the likelihood of a particular issuer’s default or the reference entity’s credit soundness. CDS contracts generally trade based on a spread which represents the cost a protection buyer has to pay the protection seller. The protection buyer is said to be short the credit as the value of the contract rises the more the credit deteriorates. The value of the CDS contract increases for the protection buyer if the spread increases.
| (1) | If the Fund is a buyer of protection, it pays the fixed rate. When a credit event occurs, as defined under the terms of that particular swap agreement, the Fund will either (i) receive from the seller of protection an amount equal to the notional amount of the swap and make delivery of the referenced obligation or underlying securities comprising the referenced index or (ii) receive a net settlement amount in the form of cash or securities equal to the notional amount of the swap less the recovery value of the referenced obligation or underlying securities comprising the referenced index. |
| (2) | If the Fund is a seller of protection, it receives the fixed rate. When a credit event occurs, as defined under the terms of that particular swap agreement, the Fund will either (i) pay to the buyer of protection an amount equal to the notional amount of the swap and take delivery of the referenced obligation or underlying securities comprising the referenced index or (ii) pay a net settlement amount in the form of cash or securities equal to the notional amount of the swap less the recovery value of the referenced obligation or underlying securities comprising the referenced index. |
| (3) | Notional amount represents the maximum potential amount the Fund could be required to pay as a seller of credit protection or receive as a buyer of credit protection if a credit event occurs as defined under the terms of that particular swap agreement. |
| (4) | Implied credit spreads, represented in absolute terms, utilized in determining the fair value of credit default swap agreements where the Fund is the seller of protection as of the reporting date serve as an indicator of the current status of the payment/ performance risk and represent the likelihood of risk of default for the credit derivative. The implied credit spread of a particular referenced entity reflects the cost of buying/selling protection and may include up-front payments required to be made to enter into the agreement. Wider credit spreads represent a deterioration of the referenced entity’s credit soundness and a greater likelihood of risk of default or other credit event occurring as defined under the terms of the agreement. |
| * | When an implied credit spread is not available, reference the fair value of credit default swap agreements on credit |
See Notes to Financial Statements.
| PGIM Global Total Return Fund | 133 |
Schedule of Investments(continued)
as of October 31, 2019
| indices and asset-backed securities. Where the Fund is the seller of protection, it serves as an indicator of the current status of the payment/performance risk and represents the likelihood of an expected liability (or profit) for the credit derivative should the notional amount of the swap agreement be closed/sold as of the reporting date. Increasing fair value in absolute terms, when compared to the notional amount of the swap, represents a deterioration of the referenced entity’s credit soundness and a greater likelihood of risk of default or other credit event occurring as defined under the terms of the agreement. |
Currency swap agreements outstanding at October 31, 2019:
Notional Amount (000)# | Fund Receives | Notional Amount (000)# | Fund Pays | Counterparty | Termination Date | Fair Value | Upfront Premiums Paid (Received) | Unrealized Appreciation (Depreciation) | ||||||||||||||||||
OTC Currency Swap Agreement: | ||||||||||||||||||||||||||
| IDR 50,000,000 | 8.220%(S) | 3,454 | 6 Month LIBOR(S) | Citibank, N.A. | 11/29/23 | $ | 538,228 | $ | — | $ | 538,228 | |||||||||||||||
|
|
|
|
|
| |||||||||||||||||||||
Inflation swap agreements outstanding at October 31, 2019:
Notional | Termination Date | Fixed Rate | Floating Rate | Value at Trade Date | Value at October 31, 2019 | Unrealized Appreciation (Depreciation) | ||||||||||||||||
Centrally Cleared Inflation Swap Agreements: | ||||||||||||||||||||||
| EUR 14,000 | 05/15/23 | 1.485%(T) | France CPI ex Tobacco Household(1)(T) | $ | — | $ | (404,653 | ) | $ | (404,653 | ) | |||||||||||
| EUR 14,000 | 05/15/23 | 1.510%(T) | Eurostat Eurozone HICP ex Tobacco(2)(T) | — | 386,579 | 386,579 | ||||||||||||||||
|
|
|
|
|
| |||||||||||||||||
| $ | — | $ | (18,074 | ) | $ | (18,074 | ) | |||||||||||||||
|
|
|
|
|
| |||||||||||||||||
| (1) | The Fund pays the fixed rate and receives the floating rate. |
| (2) | The Fund pays the floating rate and receives the fixed rate. |
Interest rate swap agreements outstanding at October 31, 2019:
Notional Amount (000)# | Termination Date | Fixed Rate | Floating Rate | Value at Trade Date | Value at October 31, 2019 | Unrealized Appreciation (Depreciation) | ||||||||||||||||
| Centrally Cleared Interest Rate Swap Agreements: | ||||||||||||||||||||||
| AUD 2,240 | 10/27/21 | 2.173%(S) | 6 Month BBSW(2)(S) | $ | (230 | ) | $ | 37,822 | $ | 38,052 | ||||||||||||
| AUD 4,000 | 09/21/22 | 3.830%(S) | 6 Month BBSW(2)(S) | (72,198 | ) | 236,212 | 308,410 | |||||||||||||||
| AUD 7,580 | 09/25/22 | 2.958%(S) | 6 Month BBSW(2)(S) | — | 210,431 | 210,431 | ||||||||||||||||
| AUD 1,000 | 05/02/26 | 2.650%(S) | 6 Month BBSW(2)(S) | 120 | 71,140 | 71,020 | ||||||||||||||||
| AUD 2,700 | 06/06/27 | 2.661%(S) | 6 Month BBSW(2)(S) | — | 213,806 | 213,806 | ||||||||||||||||
| AUD 6,450 | 12/03/29 | 2.700%(S) | 6 Month BBSW(2)(S) | 527,707 | 621,605 | 93,898 | ||||||||||||||||
See Notes to Financial Statements.
| 134 |
Interest rate swap agreements outstanding at October 31, 2019 (continued):
Notional | Termination Date | Fixed Rate | Floating Rate | Value at Trade Date | Value at October 31, 2019 | Unrealized Appreciation (Depreciation) | ||||||||||||||||||||
Centrally Cleared Interest Rate Swap Agreements (cont’d.): |
| |||||||||||||||||||||||||
| AUD | 5,835 | 07/19/32 | 3.130%(S) | 6 Month BBSW(2)(S) | $ | — | $ | 833,688 | $ | 833,688 | ||||||||||||||||
| AUD | 1,600 | 07/28/32 | 3.137%(S) | 6 Month BBSW(2)(S) | — | 229,851 | 229,851 | |||||||||||||||||||
| AUD | 2,000 | 12/19/32 | 4.423%(S) | 6 Month BBSW(2)(S) | (5,183 | ) | 514,904 | 520,087 | ||||||||||||||||||
| AUD | 10,000 | 07/10/33 | 2.987%(S) | 6 Month BBSW(2)(S) | 156,993 | 1,365,448 | 1,208,455 | |||||||||||||||||||
| BRL | 27,355 | 01/02/25 | 6.540%(T) | 1 Day BROIS(2)(T) | — | 244,794 | 244,794 | |||||||||||||||||||
| BRL | 26,379 | 01/02/25 | 9.475%(T) | 1 Day BROIS(2)(T) | — | 1,856,414 | 1,856,414 | |||||||||||||||||||
| BRL | 25,280 | 01/02/25 | 9.560%(T) | 1 Day BROIS(2)(T) | — | 1,841,549 | 1,841,549 | |||||||||||||||||||
| BRL | 31,910 | 01/02/25 | 9.943%(T) | 1 Day BROIS(2)(T) | — | 2,737,289 | 2,737,289 | |||||||||||||||||||
| BRL | 7,002 | 01/02/25 | 9.985%(T) | 1 Day BROIS(2)(T) | — | 653,614 | 653,614 | |||||||||||||||||||
| BRL | 30,470 | 01/02/25 | 11.080%(T) | 1 Day BROIS(2)(T) | — | 3,112,837 | 3,112,837 | |||||||||||||||||||
| BRL | 6,247 | 01/02/25 | 12.090%(T) | 1 Day BROIS(2)(T) | — | 754,729 | 754,729 | |||||||||||||||||||
| BRL | 31,992 | 01/04/27 | 6.910%(T) | 1 Day BROIS(2)(T) | — | 468,145 | 468,145 | |||||||||||||||||||
| BRL | 31,229 | 01/04/27 | 6.912%(T) | 1 Day BROIS(2)(T) | — | 455,586 | 455,586 | |||||||||||||||||||
| CAD | 28,155 | 01/09/20 | 1.716%(S) | 3 Month Canadian Banker’s Acceptance(2)(S) | (66,076 | ) | (28,114 | ) | 37,962 | |||||||||||||||||
| CAD | 3,550 | 03/07/21 | 0.983%(S) | 3 Month Canadian Banker’s Acceptance(2)(S) | 124 | (35,032 | ) | (35,156 | ) | |||||||||||||||||
| CAD | 23,700 | 08/17/22 | 2.370%(S) | 3 Month Canadian Banker’s Acceptance(2)(S) | (249,113 | ) | 299,638 | 548,751 | ||||||||||||||||||
| CAD | 1,500 | 04/22/26 | 1.670%(S) | 3 Month Canadian Banker’s Acceptance(2)(S) | 127 | (6,837 | ) | (6,964 | ) | |||||||||||||||||
See Notes to Financial Statements.
| PGIM Global Total Return Fund | 135 |
Schedule of Investments(continued)
as of October 31, 2019
Interest rate swap agreements outstanding at October 31, 2019 (continued):
Notional | Termination Date | Fixed Rate | Floating Rate | Value at Trade Date | Value at October 31, 2019 | Unrealized Appreciation (Depreciation) | ||||||||||||||||||||
Centrally Cleared Interest Rate Swap Agreements (cont’d.): |
| |||||||||||||||||||||||||
| CAD | 3,070 | 06/25/30 | 2.651%(S) | 3 Month Canadian Banker’s Acceptance(2)(S) | $ | 83,226 | $ | 186,322 | $ | 103,096 | ||||||||||||||||
| CAD | 4,325 | 03/26/33 | 2.718%(S) | 3 Month Canadian Banker’s Acceptance(2)(S) | (92 | ) | 310,091 | 310,183 | ||||||||||||||||||
| CAD | 1,500 | 05/30/37 | 2.240%(S) | 3 Month Canadian Banker’s Acceptance(2)(S) | (41 | ) | 41,417 | 41,458 | ||||||||||||||||||
| CAD | 4,345 | 01/09/38 | 2.720%(S) | 3 Month Canadian Banker’s Acceptance(2)(S) | (37,095 | ) | 371,960 | 409,055 | ||||||||||||||||||
| CAD | 2,500 | 12/03/38 | 2.800%(S) | 3 Month Canadian Banker’s Acceptance(2)(S) | 109,547 | 246,487 | 136,940 | |||||||||||||||||||
| CAD | 1,550 | 12/03/48 | 2.800%(S) | 3 Month Canadian Banker’s Acceptance(2)(S) | 283,267 | 220,012 | (63,255 | ) | ||||||||||||||||||
| CHF | 2,400 | 10/21/21 | (0.522)%(A) | 6 Month CHF LIBOR(2)(S) | 162 | 8,075 | 7,913 | |||||||||||||||||||
| CHF | 14,500 | 01/31/29 | 0.260%(A) | 6 Month CHF LIBOR(2)(S) | 71,638 | 822,548 | 750,910 | |||||||||||||||||||
| CHF | 800 | 10/17/31 | 0.033%(A) | 6 Month CHF LIBOR(2)(S) | 163 | 16,233 | 16,070 | |||||||||||||||||||
| CHF | 700 | 04/03/33 | 0.687%(A) | 6 Month CHF LIBOR(2)(S) | — | 77,834 | 77,834 | |||||||||||||||||||
| CLP | 3,010,200 | 07/12/29 | 3.135%(S) | 1 Day CLOIS(2)(S) | — | 109,015 | 109,015 | |||||||||||||||||||
| CLP | 6,480,000 | 10/24/29 | 2.790%(S) | 1 Day CLOIS(2)(S) | — | (68,669 | ) | (68,669 | ) | |||||||||||||||||
| CNH | 50,870 | 03/13/24 | 2.945%(Q) | 7 Day China Fixing Repo Rates(2)(Q) | 53 | (40,047 | ) | (40,100 | ) | |||||||||||||||||
| CNH | 33,000 | 03/18/24 | 2.945%(Q) | 7 Day China Fixing Repo Rates(2)(Q) | 34 | (26,363 | ) | (26,397 | ) | |||||||||||||||||
See Notes to Financial Statements.
| 136 |
Interest rate swap agreements outstanding at October 31, 2019 (continued):
Notional Amount (000)# | Termination Date | Fixed Rate | Floating Rate | Value at Trade Date | Value at October 31, 2019 | Unrealized Appreciation (Depreciation) | ||||||||||||||||||||
Centrally Cleared Interest Rate Swap Agreements (cont’d.): |
| |||||||||||||||||||||||||
| CNH | 43,200 | 04/01/24 | 2.923%(Q) | 7 Day China Fixing Repo Rates(2)(Q) | $ | 50 | $ | (40,706 | ) | $ | (40,756 | ) | ||||||||||||||
| CNH | 23,500 | 06/19/24 | 2.900%(Q) | 7 Day China Fixing Repo Rates(2)(Q) | 28 | (28,418 | ) | (28,446 | ) | |||||||||||||||||
| CNH | 125,090 | 06/20/24 | 2.900%(Q) | 7 Day China Fixing Repo Rates(2)(Q) | 149 | (151,273 | ) | (151,422 | ) | |||||||||||||||||
| CNH | 28,500 | 07/01/24 | 2.900%(Q) | 7 Day China Fixing Repo Rates(2)(Q) | (52 | ) | (34,639 | ) | (34,587 | ) | ||||||||||||||||
| CNH | 78,000 | 09/03/24 | 2.860%(Q) | 7 Day China Fixing Repo Rates(2)(Q) | (125 | ) | (123,050 | ) | (122,925 | ) | ||||||||||||||||
| CNH | 24,300 | 09/19/24 | 2.940%(Q) | 7 Day China Fixing Repo Rates(2)(Q) | (23 | ) | (26,330 | ) | (26,307 | ) | ||||||||||||||||
| CNH | 76,000 | 10/09/24 | 2.860%(Q) | 7 Day China Fixing Repo Rates(2)(Q) | (47 | ) | (125,339 | ) | (125,292 | ) | ||||||||||||||||
| CNH | 9,600 | 10/10/24 | 2.860%(Q) | 7 Day China Fixing Repo Rates(2)(Q) | (6 | ) | (15,955 | ) | (15,949 | ) | ||||||||||||||||
| CNH | 98,660 | 11/01/24 | 3.120%(Q) | 7 Day China Fixing Repo Rates(2)(Q) | (368 | ) | 321 | 689 | ||||||||||||||||||
| COP | 25,830,000 | 07/19/28 | 6.150%(Q) | 1 Day COOIS(2)(Q) | — | 489,899 | 489,899 | |||||||||||||||||||
| COP | 6,310,000 | 07/27/28 | 6.200%(Q) | 1 Day COOIS(2)(Q) | 3,948 | 125,475 | 121,527 | |||||||||||||||||||
| COP | 13,388,000 | 11/28/28 | 6.380%(Q) | 1 Day COOIS(2)(Q) | — | 329,648 | 329,648 | |||||||||||||||||||
| CZK | 1,453,420 | 05/31/20 | 2.138%(A) | 3 Month PRIBOR(1)(Q) | — | (320,051 | ) | (320,051 | ) | |||||||||||||||||
| CZK | 500,000 | 03/14/21 | 2.143%(A) | 6 Month PRIBOR(2)(S) | — | 233,029 | 233,029 | |||||||||||||||||||
| CZK | 213,000 | 04/27/22 | 0.925%(A) | 6 Month PRIBOR(2)(S) | — | (206,314 | ) | (206,314 | ) | |||||||||||||||||
| CZK | 193,410 | 06/29/22 | 0.895%(A) | 6 Month PRIBOR(2)(S) | — | (282,735 | ) | (282,735 | ) | |||||||||||||||||
| CZK | 250,000 | 11/17/22 | 1.505%(A) | 6 Month PRIBOR(2)(S) | — | (97,136 | ) | (97,136 | ) | |||||||||||||||||
See Notes to Financial Statements.
| PGIM Global Total Return Fund | 137 |
Schedule of Investments(continued)
as of October 31, 2019
Interest rate swap agreements outstanding at October 31, 2019 (continued):
Notional Amount (000)# | Termination Date | Fixed Rate | Floating Rate | Value at Trade Date | Value at October 31, 2019 | Unrealized Appreciation (Depreciation) | ||||||||||||||||||||
Centrally Cleared Interest Rate Swap Agreements (cont’d.): |
| |||||||||||||||||||||||||
| CZK | 427,500 | 01/31/24 | 1.930%(A) | 6 Month PRIBOR(1)(S) | $ | — | $ | (264,776 | ) | $ | (264,776 | ) | ||||||||||||||
| CZK | 205,715 | 03/14/24 | 1.950%(A) | 6 Month PRIBOR(1)(S) | — | (149,350 | ) | (149,350 | ) | |||||||||||||||||
| CZK | 508,480 | 06/20/24 | 1.623%(A) | 6 Month PRIBOR(1)(S) | — | 199,994 | 199,994 | |||||||||||||||||||
| CZK | 108,675 | 04/27/27 | 1.300%(A) | 6 Month PRIBOR(1)(S) | — | 40,963 | 40,963 | |||||||||||||||||||
| CZK | 155,500 | 06/29/27 | 1.175%(A) | 6 Month PRIBOR(1)(S) | 139,131 | 188,213 | 49,082 | |||||||||||||||||||
| DKK | 15,000 | 01/27/20 | 0.385%(A) | 6 Month CIBOR(2)(S) | 30 | 11,820 | 11,790 | |||||||||||||||||||
| DKK | 20,900 | 10/17/21 | 0.185%(A) | 6 Month CIBOR(2)(S) | (59,047 | ) | 29,625 | 88,672 | ||||||||||||||||||
| DKK | 13,600 | 05/04/25 | 0.825%(A) | 6 Month CIBOR(2)(S) | 38 | 121,308 | 121,270 | |||||||||||||||||||
| DKK | 5,000 | 08/29/26 | 0.580%(A) | 6 Month CIBOR(2)(S) | 28 | 35,487 | 35,459 | |||||||||||||||||||
| DKK | 1,300 | 10/21/26 | 0.673%(A) | 6 Month CIBOR(2)(S) | 23 | 10,305 | 10,282 | |||||||||||||||||||
| DKK | 13,000 | 03/15/27 | 1.123%(A) | 6 Month CIBOR(2)(S) | — | 186,820 | 186,820 | |||||||||||||||||||
| DKK | 1,865 | 06/22/27 | 0.987%(A) | 6 Month CIBOR(2)(S) | — | 23,437 | 23,437 | |||||||||||||||||||
| EUR | 1,000 | 05/29/20 | 0.373%(A) | 6 Month EURIBOR(2)(S) | 171 | 7,495 | 7,324 | |||||||||||||||||||
| EUR | 610 | 07/02/21 | 0.994%(A) | 6 Month EURIBOR(2)(S) | 170 | 18,548 | 18,378 | |||||||||||||||||||
| EUR | 700 | 08/14/21 | 0.841%(A) | 3 Month EURIBOR(2)(Q) | 172 | 20,299 | 20,127 | |||||||||||||||||||
| EUR | 650 | 03/02/22 | 0.072%(A) | 6 Month EURIBOR(2)(S) | (63,289 | ) | 8,484 | 71,773 | ||||||||||||||||||
| EUR | 8,200 | 06/29/22 | 0.219%(A) | 6 Month EURIBOR(1)(S) | — | (157,449 | ) | (157,449 | ) | |||||||||||||||||
| EUR | 21,000 | 09/08/22 | 0.140%(A) | 6 Month EURIBOR(1)(S) | — | (358,943 | ) | (358,943 | ) | |||||||||||||||||
| EUR | 1,000 | 06/04/29 | 2.002%(A) | 6 Month EURIBOR(2)(S) | 177 | 228,824 | 228,647 | |||||||||||||||||||
| EUR | 3,260 | 11/11/29 | 1.453%(A) | 6 Month EURIBOR(2)(S) | 304,696 | 587,003 | 282,307 | |||||||||||||||||||
| EUR | 1,800 | 01/14/30 | 1.022%(A) | 6 Month EURIBOR(2)(S) | 180 | 224,963 | 224,783 | |||||||||||||||||||
See Notes to Financial Statements.
| 138 |
Interest rate swap agreements outstanding at October 31, 2019 (continued):
Notional Amount (000)# | Termination Date | Fixed Rate | Floating Rate | Value at Trade Date | Value at October 31, 2019 | Unrealized Appreciation (Depreciation) | ||||||||||||||||||||
Centrally Cleared Interest Rate Swap Agreements (cont’d.): |
| |||||||||||||||||||||||||
| EUR | 2,000 | 03/02/31 | 0.825%(A) | 6 Month EURIBOR(2)(S) | $ | (76,215 | ) | $ | 202,024 | $ | 278,239 | |||||||||||||||
| EUR | 700 | 04/07/31 | 0.819%(A) | 6 Month EURIBOR(2)(S) | 178 | 69,167 | 68,989 | |||||||||||||||||||
| EUR | 450 | 05/03/31 | 1.048%(A) | 6 Month EURIBOR(2)(S) | 179 | 58,570 | 58,391 | |||||||||||||||||||
| EUR | 1,500 | 07/04/31 | 0.672%(A) | 6 Month EURIBOR(2)(S) | 181 | 116,354 | 116,173 | |||||||||||||||||||
| EUR | 570 | 08/02/31 | 0.584%(A) | 6 Month EURIBOR(2)(S) | 174 | 36,950 | 36,776 | |||||||||||||||||||
| EUR | 1,500 | 08/26/31 | 0.562%(A) | 6 Month EURIBOR(2)(S) | 184 | 91,955 | 91,771 | |||||||||||||||||||
| EUR | 700 | 09/09/31 | 0.558%(A) | 6 Month EURIBOR(2)(S) | 176 | 42,292 | 42,116 | |||||||||||||||||||
| EUR | 1,700 | 12/14/31 | 1.217%(A) | 6 Month EURIBOR(2)(S) | 176 | 274,300 | 274,124 | |||||||||||||||||||
| EUR | 1,850 | 12/19/31 | 1.160%(A) | 6 Month EURIBOR(2)(S) | 565 | 282,610 | 282,045 | |||||||||||||||||||
| EUR | 2,300 | 12/19/31 | 1.161%(A) | 6 Month EURIBOR(2)(S) | (14,197 | ) | 351,691 | 365,888 | ||||||||||||||||||
| EUR | 2,600 | 12/27/31 | 1.082%(A) | 6 Month EURIBOR(2)(S) | 13,245 | 367,308 | 354,063 | |||||||||||||||||||
| EUR | 6,400 | 02/23/32 | 1.180%(A) | 6 Month EURIBOR(2)(S) | 220 | 987,655 | 987,435 | |||||||||||||||||||
| EUR | 4,680 | 03/29/32 | 1.170%(A) | 6 Month EURIBOR(2)(S) | 1,893 | 708,326 | 706,433 | |||||||||||||||||||
| EUR | 1,400 | 04/04/32 | 1.145%(A) | 6 Month EURIBOR(2)(S) | — | 206,399 | 206,399 | |||||||||||||||||||
| EUR | 2,000 | 04/10/32 | 1.105%(A) | 6 Month EURIBOR(2)(S) | — | 282,862 | 282,862 | |||||||||||||||||||
| EUR | 4,150 | 05/11/32 | 1.100%(A) | 6 Month EURIBOR(2)(S) | (105,096 | ) | 583,442 | 688,538 | ||||||||||||||||||
| EUR | 7,000 | 06/28/32 | 0.785%(A) | 6 Month EURIBOR(2)(S) | (68,585 | ) | 650,682 | 719,267 | ||||||||||||||||||
| EUR | 3,050 | 10/30/32 | 1.302%(A) | 6 Month EURIBOR(2)(S) | — | 502,672 | 502,672 | |||||||||||||||||||
| EUR | 14,225 | 05/11/33 | 1.000%(A) | 6 Month EURIBOR(2)(S) | (419,212 | ) | 1,816,375 | 2,235,587 | ||||||||||||||||||
| EUR | 3,135 | 12/28/35 | 1.559%(A) | 6 Month EURIBOR(2)(S) | 48,090 | 764,277 | 716,187 | |||||||||||||||||||
| EUR | 2,155 | 06/02/36 | 1.072%(A) | 6 Month EURIBOR(2)(S) | 195,507 | 315,880 | 120,373 | |||||||||||||||||||
See Notes to Financial Statements.
| PGIM Global Total Return Fund | 139 |
Schedule of Investments(continued)
as of October 31, 2019
Interest rate swap agreements outstanding at October 31, 2019 (continued):
Notional Amount (000)# | Termination Date | Fixed Rate | Floating Rate | Value at Trade Date | Value at October 31, 2019 | Unrealized Appreciation (Depreciation) | ||||||||||||||||||||
Centrally Cleared Interest Rate Swap Agreements (cont’d.): |
| |||||||||||||||||||||||||
| EUR | 600 | 09/26/36 | 0.749%(A) | 6 Month EURIBOR(2)(S) | $ | 177 | $ | 48,891 | $ | 48,714 | ||||||||||||||||
| EUR | 600 | 09/28/36 | 0.729%(A) | 6 Month EURIBOR(2)(S) | 178 | 46,588 | 46,410 | |||||||||||||||||||
| EUR | 1,000 | 11/02/36 | 0.958%(A) | 6 Month EURIBOR(2)(S) | 180 | 131,960 | 131,780 | |||||||||||||||||||
| EUR | 1,500 | 02/02/37 | 1.355%(A) | 6 Month EURIBOR(2)(S) | 188 | 314,382 | 314,194 | |||||||||||||||||||
| EUR | 365 | 05/11/39 | 1.100%(A) | 1 Day EONIA(2)(A) | 69,878 | 72,550 | 2,672 | |||||||||||||||||||
| EUR | 3,190 | 05/11/42 | 1.350%(A) | 6 Month EURIBOR(2)(S) | (188,099 | ) | 767,243 | 955,342 | ||||||||||||||||||
| EUR | 1,235 | 07/04/42 | 1.001%(A) | 6 Month EURIBOR(2)(S) | (143,527 | ) | 186,062 | 329,589 | ||||||||||||||||||
| EUR | 1,000 | 03/30/46 | 1.058%(A) | 6 Month EURIBOR(2)(S) | (5,530 | ) | 188,532 | 194,062 | ||||||||||||||||||
| EUR | 9,135 | 05/11/49 | 1.450%(A) | 6 Month EURIBOR(2)(S) | 685,553 | 3,075,220 | 2,389,667 | |||||||||||||||||||
| GBP | 1,500 | 03/02/20 | 0.338%(A) | 1 Day SONIA(1)(A) | — | 7,101 | 7,101 | |||||||||||||||||||
| GBP | 510 | 06/30/21 | 2.469%(S) | 6 Month GBP LIBOR(2)(S) | 203 | 22,130 | 21,927 | |||||||||||||||||||
| GBP | 12,450 | 12/07/27 | 1.110%(A) | 1 Day SONIA(1)(A) | — | (773,666 | ) | (773,666 | ) | |||||||||||||||||
| GBP | 2,320 | 05/08/29 | 1.100%(A) | 1 Day SONIA(1)(A) | (85,429 | ) | (158,221 | ) | (72,792 | ) | ||||||||||||||||
| GBP | 4,680 | 05/08/34 | 1.300%(S) | 6 Month GBP LIBOR(2)(S) | (209,403 | ) | 363,889 | 573,292 | ||||||||||||||||||
| GBP | 650 | 05/08/44 | 1.250%(A) | 1 Day SONIA(2)(A) | 100,918 | 116,826 | 15,908 | |||||||||||||||||||
| GBP | 9,200 | 03/09/46 | 1.648%(S) | 6 Month GBP LIBOR(2)(S) | (209,582 | ) | 2,129,844 | 2,339,426 | ||||||||||||||||||
| GBP | 2,440 | 05/08/49 | 1.250%(A) | 1 Day SONIA(2)(A) | 603,445 | 519,289 | (84,156 | ) | ||||||||||||||||||
| GBP | 740 | 05/08/49 | 1.400%(S) | 6 Month GBP LIBOR(2)(S) | (39,399 | ) | 126,989 | 166,388 | ||||||||||||||||||
| HKD | 151,850 | 03/13/21 | 2.138%(Q) | 3 Month HIBOR(2)(Q) | — | 46,226 | 46,226 | |||||||||||||||||||
| HKD | 171,690 | 03/13/21 | 2.145%(Q) | 3 Month HIBOR(2)(Q) | — | 54,712 | 54,712 | |||||||||||||||||||
| HKD | 100,000 | 04/01/21 | 1.850%(Q) | 3 Month HIBOR(2)(Q) | (31 | ) | (20,228 | ) | (20,197 | ) | ||||||||||||||||
See Notes to Financial Statements.
| 140 |
Interest rate swap agreements outstanding at October 31, 2019 (continued):
Notional Amount (000)# | Termination Date | Fixed Rate | Floating Rate | Value at Trade Date | Value at October 31, 2019 | Unrealized Appreciation (Depreciation) | ||||||||||||||||||||
Centrally Cleared Interest Rate Swap Agreements (cont’d.): |
| |||||||||||||||||||||||||
| HKD | 95,120 | 09/03/26 | 1.538%(Q) | 3 Month HIBOR(1)(Q) | $ | (535 | ) | $ | 212,068 | $ | 212,603 | |||||||||||||||
| HUF | 11,800,000 | 06/21/20 | 1.400%(A) | 3 Month BUBOR(2)(Q) | — | 495,976 | 495,976 | |||||||||||||||||||
| HUF | 2,698,000 | 07/02/20 | 1.065%(A) | 6 Month BUBOR(2)(S) | (4,845 | ) | 71,240 | 76,085 | ||||||||||||||||||
| HUF | 370,000 | 03/18/26 | 2.140%(A) | 6 Month BUBOR(2)(S) | 16,300 | 118,006 | 101,706 | |||||||||||||||||||
| HUF | 1,667,000 | 12/23/26 | 3.755%(A) | 6 Month BUBOR(2)(S) | 41 | 711,723 | 711,682 | |||||||||||||||||||
| HUF | 6,237,270 | 06/12/28 | 3.750%(A) | 6 Month BUBOR(2)(S) | — | 2,263,087 | 2,263,087 | |||||||||||||||||||
| HUF | 1,677,900 | 07/15/29 | 1.650%(A) | 6 Month BUBOR(2)(S) | — | 245,214 | 245,214 | |||||||||||||||||||
| JPY | 19,585,210 | 12/17/20 | 0.015%(S) | 6 Month JPY LIBOR(1)(S) | — | (195,719 | ) | (195,719 | ) | |||||||||||||||||
| JPY | 4,887,930 | 01/29/21 | (0.014)%(S) | 6 Month JPY LIBOR(1)(S) | — | (44,632 | ) | (44,632 | ) | |||||||||||||||||
| JPY | 32,800 | 07/04/21 | (0.156)%(S) | 6 Month JPY LIBOR(2)(S) | (15,013 | ) | (417 | ) | 14,596 | |||||||||||||||||
| JPY | 4,595,280 | 12/03/23 | 0.050%(S) | 6 Month JPY LIBOR(1)(S) | (39,626 | ) | (305,236 | ) | (265,610 | ) | ||||||||||||||||
| JPY | 3,276,010 | 12/20/24 | 0.126%(S) | 6 Month JPY LIBOR(2)(S) | (53,955 | ) | 381,026 | 434,981 | ||||||||||||||||||
| JPY | 135,000 | 02/20/29 | 1.260%(S) | 6 Month JPY LIBOR(2)(S) | 49,802 | 152,534 | 102,732 | |||||||||||||||||||
| JPY | 50,000 | 04/02/29 | 1.288%(S) | 6 Month JPY LIBOR(2)(S) | 5 | 57,526 | 57,521 | |||||||||||||||||||
| JPY | 100,000 | 08/18/29 | 1.070%(S) | 6 Month JPY LIBOR(2)(S) | 10 | 99,940 | 99,930 | |||||||||||||||||||
| JPY | 100,000 | 08/28/29 | 1.043%(S) | 6 Month JPY LIBOR(2)(S) | 10 | 97,129 | 97,119 | |||||||||||||||||||
| JPY | 200,000 | 09/09/29 | 1.061%(S) | 6 Month JPY LIBOR(2)(S) | (1,275 | ) | 197,782 | 199,057 | ||||||||||||||||||
| JPY | 655,000 | 09/29/29 | 1.064%(S) | 6 Month JPY LIBOR(2)(S) | 411,209 | 647,963 | 236,754 | |||||||||||||||||||
| JPY | 200,000 | 04/01/31 | 0.319%(S) | 6 Month JPY LIBOR(2)(S) | 25 | 58,977 | 58,952 | |||||||||||||||||||
| JPY | 215,000 | 05/06/31 | 0.354%(S) | 6 Month JPY LIBOR(2)(S) | 28 | 74,114 | 74,086 | |||||||||||||||||||
| JPY | 150,000 | 07/07/31 | 0.071%(S) | 6 Month JPY LIBOR(2)(S) | 15 | 3,624 | 3,609 | |||||||||||||||||||
See Notes to Financial Statements.
| PGIM Global Total Return Fund | 141 |
Schedule of Investments(continued)
as of October 31, 2019
Interest rate swap agreements outstanding at October 31, 2019 (continued):
Notional Amount (000)# | Termination Date | Fixed Rate | Floating Rate | Value at Trade Date | Value at October 31, 2019 | Unrealized Appreciation (Depreciation) | ||||||||||||||||||||
Centrally Cleared Interest Rate Swap Agreements (cont’d.): |
| |||||||||||||||||||||||||
| JPY | 256,500 | 08/15/31 | 0.223%(S) | 6 Month JPY LIBOR(2)(S) | $ | 25 | $ | 49,026 | $ | 49,001 | ||||||||||||||||
| JPY | 130,000 | 08/30/31 | 0.217%(S) | 6 Month JPY LIBOR(2)(S) | 13 | 23,793 | 23,780 | |||||||||||||||||||
| JPY | 120,000 | 09/08/31 | 0.316%(S) | 6 Month JPY LIBOR(2)(S) | 12 | 35,129 | 35,117 | |||||||||||||||||||
| JPY | 190,000 | 09/21/31 | 0.328%(S) | 6 Month JPY LIBOR(2)(S) | 27 | 57,850 | 57,823 | |||||||||||||||||||
| JPY | 350,000 | 10/14/31 | 0.270%(S) | 6 Month JPY LIBOR(2)(S) | 47 | 83,317 | 83,270 | |||||||||||||||||||
| JPY | 200,000 | 04/06/32 | 0.484%(S) | 6 Month JPY LIBOR(2)(S) | — | 96,629 | 96,629 | |||||||||||||||||||
| JPY | 159,520 | 04/07/32 | 0.491%(S) | 6 Month JPY LIBOR(2)(S) | — | 78,400 | 78,400 | |||||||||||||||||||
| JPY | 140,000 | 06/07/32 | 0.451%(S) | 6 Month JPY LIBOR(2)(S) | — | 64,210 | 64,210 | |||||||||||||||||||
| JPY | 71,000 | 09/21/32 | 0.463%(S) | 6 Month JPY LIBOR(2)(S) | — | 32,900 | 32,900 | |||||||||||||||||||
| JPY | 160,000 | 11/14/32 | 2.390%(S) | 6 Month JPY LIBOR(2)(S) | (26,599 | ) | 334,416 | 361,015 | ||||||||||||||||||
| JPY | 180,000 | 11/05/34 | 1.293%(S) | 6 Month JPY LIBOR(2)(S) | 85,259 | 302,975 | 217,716 | |||||||||||||||||||
| JPY | 70,000 | 12/03/34 | 1.265%(S) | 6 Month JPY LIBOR(2)(S) | 9 | 114,788 | 114,779 | |||||||||||||||||||
| JPY | 260,000 | 01/07/35 | 1.108%(S) | 6 Month JPY LIBOR(2)(S) | 31 | 366,690 | 366,659 | |||||||||||||||||||
| JPY | 50,000 | 01/22/35 | 0.950%(S) | 6 Month JPY LIBOR(2)(S) | 7 | 59,088 | 59,081 | |||||||||||||||||||
| JPY | 120,000 | 02/12/35 | 1.161%(S) | 6 Month JPY LIBOR(2)(S) | 15 | 178,030 | 178,015 | |||||||||||||||||||
| JPY | 320,000 | 02/24/35 | 1.200%(S) | 6 Month JPY LIBOR(2)(S) | 40 | 492,442 | 492,402 | |||||||||||||||||||
| JPY | 160,000 | 03/03/35 | 1.153%(S) | 6 Month JPY LIBOR(2)(S) | 20 | 234,977 | 234,957 | |||||||||||||||||||
| JPY | 90,000 | 02/04/36 | 0.816%(S) | 6 Month JPY LIBOR(2)(S) | 11 | 92,166 | 92,155 | |||||||||||||||||||
| JPY | 65,000 | 05/16/36 | 0.446%(S) | 6 Month JPY LIBOR(2)(S) | 9 | 30,043 | 30,034 | |||||||||||||||||||
| JPY | 110,000 | 05/27/36 | 0.460%(S) | 6 Month JPY LIBOR(2)(S) | 18 | 53,043 | 53,025 | |||||||||||||||||||
| JPY | 60,000 | 07/22/36 | 0.240%(S) | 6 Month JPY LIBOR(2)(S) | 11 | 7,787 | 7,776 | |||||||||||||||||||
See Notes to Financial Statements.
| 142 |
Interest rate swap agreements outstanding at October 31, 2019 (continued):
Notional Amount (000)# | Termination Date | Fixed Rate | Floating Rate | Value at Trade Date | Value at October 31, 2019 | Unrealized Appreciation (Depreciation) | ||||||||||||||||||||
Centrally Cleared Interest Rate Swap Agreements (cont’d.): |
| |||||||||||||||||||||||||
| JPY | 300,000 | 10/04/36 | 0.363%(S) | 6 Month JPY LIBOR(2)(S) | $ | 42 | $ | 94,225 | $ | 94,183 | ||||||||||||||||
| JPY | 150,000 | 11/02/36 | 0.423%(S) | 6 Month JPY LIBOR(2)(S) | 21 | 63,728 | 63,707 | |||||||||||||||||||
| JPY | 400,000 | 12/14/36 | 0.723%(S) | 6 Month JPY LIBOR(2)(S) | 49 | 362,418 | 362,369 | |||||||||||||||||||
| JPY | 150,000 | 12/22/36 | �� | 0.641%(S) | 6 Month JPY LIBOR(2)(S) | 19 | 115,999 | 115,980 | ||||||||||||||||||
| JPY | 250,000 | 01/06/37 | 0.675%(S) | 6 Month JPY LIBOR(2)(S) | 30 | 206,809 | 206,779 | |||||||||||||||||||
| JPY | 275,500 | 02/15/37 | 0.729%(S) | 6 Month JPY LIBOR(2)(S) | 34 | 250,793 | 250,759 | |||||||||||||||||||
| JPY | 130,000 | 02/23/37 | 0.748%(S) | 6 Month JPY LIBOR(2)(S) | 17 | 122,195 | 122,178 | |||||||||||||||||||
| JPY | 100,000 | 03/02/37 | 0.686%(S) | 6 Month JPY LIBOR(2)(S) | — | 83,843 | 83,843 | |||||||||||||||||||
| JPY | 273,000 | 03/09/37 | 0.701%(S) | 6 Month JPY LIBOR(2)(S) | 15,040 | 235,299 | 220,259 | |||||||||||||||||||
| JPY | 200,000 | 03/29/37 | 0.684%(S) | 6 Month JPY LIBOR(2)(S) | — | 166,275 | 166,275 | |||||||||||||||||||
| JPY | 94,310 | 05/08/37 | 0.623%(S) | 6 Month JPY LIBOR(2)(S) | — | 71,184 | 71,184 | |||||||||||||||||||
| JPY | 200,000 | 05/15/37 | 0.688%(S) | 6 Month JPY LIBOR(2)(S) | — | 172,653 | 172,653 | |||||||||||||||||||
| JPY | 150,000 | 06/02/37 | 0.640%(S) | 6 Month JPY LIBOR(2)(S) | — | 117,101 | 117,101 | |||||||||||||||||||
| JPY | 80,000 | 06/19/37 | 0.625%(S) | 6 Month JPY LIBOR(2)(S) | — | 60,315 | 60,315 | |||||||||||||||||||
| JPY | 82,000 | 06/21/37 | 0.628%(S) | 6 Month JPY LIBOR(2)(S) | — | 62,158 | 62,158 | |||||||||||||||||||
| JPY | 125,000 | 06/30/37 | 0.629%(S) | 6 Month JPY LIBOR(2)(S) | — | 94,954 | 94,954 | |||||||||||||||||||
| JPY | 105,000 | 07/04/37 | 0.659%(S) | 6 Month JPY LIBOR(2)(S) | — | 85,009 | 85,009 | |||||||||||||||||||
| JPY | 285,000 | 07/26/37 | 0.676%(S) | 6 Month JPY LIBOR(2)(S) | — | 239,295 | 239,295 | |||||||||||||||||||
| JPY | 117,300 | 08/02/37 | 0.683%(S) | 6 Month JPY LIBOR(2)(S) | — | 99,258 | 99,258 | |||||||||||||||||||
| JPY | 160,000 | 08/09/37 | 0.679%(S) | 6 Month JPY LIBOR(2)(S) | — | 134,084 | 134,084 | |||||||||||||||||||
| JPY | 500,000 | 09/04/37 | 0.663%(S) | 6 Month JPY LIBOR(2)(S) | — | 406,241 | 406,241 | |||||||||||||||||||
See Notes to Financial Statements.
| PGIM Global Total Return Fund | 143 |
Schedule of Investments(continued)
as of October 31, 2019
Interest rate swap agreements outstanding at October 31, 2019 (continued):
Notional Amount (000)# | Termination Date | Fixed Rate | Floating Rate | Value at Trade Date | Value at October 31, 2019 | Unrealized Appreciation (Depreciation) | ||||||||||||||||||||
Centrally Cleared Interest Rate Swap Agreements (cont’d.): |
| |||||||||||||||||||||||||
| JPY | 175,000 | 09/27/37 | 0.670%(S) | 6 Month JPY LIBOR(2)(S) | $ | — | $ | 143,852 | $ | 143,852 | ||||||||||||||||
| JPY | 300,000 | 11/02/37 | 0.734%(S) | 6 Month JPY LIBOR(2)(S) | — | 287,124 | 287,124 | |||||||||||||||||||
| JPY | 350,000 | 12/04/37 | 0.730%(S) | 6 Month JPY LIBOR(2)(S) | — | 331,245 | 331,245 | |||||||||||||||||||
| JPY | 900,000 | 01/04/38 | 0.757%(S) | 6 Month JPY LIBOR(2)(S) | 155,193 | 890,283 | 735,090 | |||||||||||||||||||
| JPY | 224,000 | 01/11/38 | 0.831%(S) | 6 Month JPY LIBOR(2)(S) | — | 249,998 | 249,998 | |||||||||||||||||||
| JPY | 800,000 | 03/28/38 | 0.656%(S) | 6 Month JPY LIBOR(2)(S) | — | 645,571 | 645,571 | |||||||||||||||||||
| JPY | 1,000,000 | 04/04/38 | 0.681%(S) | 6 Month JPY LIBOR(2)(S) | — | 843,299 | 843,299 | |||||||||||||||||||
| JPY | 675,000 | 04/06/38 | 0.655%(S) | 6 Month JPY LIBOR(2)(S) | — | 539,569 | 539,569 | |||||||||||||||||||
| JPY | 1,815,000 | 04/18/38 | 0.675%(S) | 6 Month JPY LIBOR(2)(S) | (49,290 | ) | 1,510,205 | 1,559,495 | ||||||||||||||||||
| JPY | 600,000 | 08/10/38 | 0.822%(S) | 6 Month JPY LIBOR(2)(S) | — | 664,428 | 664,428 | |||||||||||||||||||
| JPY | 2,430,385 | 12/03/38 | 0.600%(S) | 6 Month JPY LIBOR(2)(S) | 615,776 | 1,772,483 | 1,156,707 | |||||||||||||||||||
| JPY | 969,000 | 12/03/39 | 0.650%(S) | 6 Month JPY LIBOR(2)(S) | 669,542 | 807,706 | 138,164 | |||||||||||||||||||
| JPY | 166,000 | 05/09/43 | 0.820%(S) | 6 Month JPY LIBOR(2)(S) | — | 208,075 | 208,075 | |||||||||||||||||||
| JPY | 610,000 | 07/04/43 | 0.763%(S) | 6 Month JPY LIBOR(2)(S) | — | 683,091 | 683,091 | |||||||||||||||||||
| JPY | 110,291 | 04/15/46 | 0.560%(S) | 6 Month JPY LIBOR(2)(S) | — | 73,469 | 73,469 | |||||||||||||||||||
| JPY | 26,000 | 10/04/47 | 0.942%(S) | 6 Month JPY LIBOR(2)(S) | — | 43,056 | 43,056 | |||||||||||||||||||
| JPY | 560,000 | 11/24/47 | 0.888%(S) | 6 Month JPY LIBOR(2)(S) | — | 868,008 | 868,008 | |||||||||||||||||||
| KRW | 20,090,000 | 08/16/20 | 1.915%(Q) | 3 Month KWCDC(2)(Q) | — | 85,570 | 85,570 | |||||||||||||||||||
| KRW | 46,100,000 | 01/07/21 | 1.733%(Q) | 3 Month KWCDC(2)(Q) | — | 163,122 | 163,122 | |||||||||||||||||||
| KRW | 8,170,000 | 08/16/23 | 2.060%(Q) | 3 Month KWCDC(1)(Q) | — | (194,922 | ) | (194,922 | ) | |||||||||||||||||
| KRW | 20,447,900 | 09/10/28 | 2.043%(Q) | 3 Month KWCDC(2)(Q) | 763,039 | 1,005,269 | 242,230 | |||||||||||||||||||
See Notes to Financial Statements.
| 144 |
Interest rate swap agreements outstanding at October 31, 2019 (continued):
Notional Amount (000)# | Termination Date | Fixed Rate | Floating Rate | Value at Trade Date | Value at October 31, 2019 | Unrealized Appreciation (Depreciation) | ||||||||||||||||||||
Centrally Cleared Interest Rate Swap Agreements (cont’d.): |
| |||||||||||||||||||||||||
| KRW | 3,120,000 | 10/18/29 | 1.313%(Q) | 3 Month KWCDC(2)(Q) | $ | 10 | $ | (15,092 | ) | $ | (15,102 | ) | ||||||||||||||
| MXN | 33,500 | 10/12/27 | 7.350%(M) | 28 Day Mexican Interbank Rate(2)(M) | — | 92,863 | 92,863 | |||||||||||||||||||
| MXN | 305,790 | 02/27/29 | 8.260%(M) | 28 Day Mexican Interbank Rate(2)(M) | 93,256 | 1,911,462 | 1,818,206 | |||||||||||||||||||
| NOK | 29,500 | 02/23/23 | 1.350%(A) | 6 Month NIBOR(2)(S) | (3,643 | ) | (34,974 | ) | (31,331 | ) | ||||||||||||||||
| NOK | 26,300 | 03/15/27 | 2.103%(A) | 6 Month NIBOR(2)(S) | 18,690 | 87,236 | 68,546 | |||||||||||||||||||
| NOK | 6,725 | 06/23/27 | 1.825%(A) | 6 Month NIBOR(2)(S) | — | 194 | 194 | |||||||||||||||||||
| NOK | 20,000 | 04/18/28 | 2.215%(A) | 6 Month NIBOR(2)(S) | — | 90,014 | 90,014 | |||||||||||||||||||
| NOK | 36,000 | 02/07/29 | 2.083%(A) | 6 Month NIBOR(2)(S) | — | 125,757 | 125,757 | |||||||||||||||||||
| NOK | 48,000 | 10/07/29 | 1.660%(A) | 6 Month NIBOR(2)(S) | — | (91,650 | ) | (91,650 | ) | |||||||||||||||||
| NZD | 8,700 | 05/01/20 | 3.628%(S) | 3 Month BBR(2)(Q) | 214,368 | 152,027 | (62,341 | ) | ||||||||||||||||||
| NZD | 1,235 | 10/03/22 | 2.740%(S) | 3 Month BBR(2)(Q) | — | 39,976 | 39,976 | |||||||||||||||||||
| NZD | 2,830 | 04/26/23 | 2.733%(S) | 3 Month BBR(2)(Q) | (67,254 | ) | 105,635 | 172,889 | ||||||||||||||||||
| NZD | 1,750 | 03/13/24 | 5.080%(S) | 3 Month BBR(2)(Q) | 28,107 | 198,392 | 170,285 | |||||||||||||||||||
| NZD | 2,500 | 03/15/24 | 3.355%(S) | 3 Month BBR(2)(Q) | 2,492 | 161,185 | 158,693 | |||||||||||||||||||
| NZD | 1,550 | 07/04/24 | 3.100%(S) | 3 Month BBR(2)(Q) | — | 100,817 | 100,817 | |||||||||||||||||||
| NZD | 3,500 | 01/10/27 | 3.420%(S) | 3 Month BBR(2)(Q) | 73,670 | 362,788 | 289,118 | |||||||||||||||||||
| NZD | 5,000 | 04/18/28 | 3.193%(S) | 3 Month BBR(2)(Q) | — | 489,421 | 489,421 | |||||||||||||||||||
| NZD | 6,450 | 11/28/28 | 2.950%(S) | 3 Month BBR(2)(Q) | — | 612,876 | 612,876 | |||||||||||||||||||
| NZD | 9,250 | 07/22/29 | 1.768%(S) | 3 Month BBR(2)(Q) | — | 227,456 | 227,456 | |||||||||||||||||||
| NZD | 9,000 | 10/07/29 | 1.130%(S) | 3 Month BBR(2)(Q) | — | (155,913 | ) | (155,913 | ) | |||||||||||||||||
See Notes to Financial Statements.
| PGIM Global Total Return Fund | 145 |
Schedule of Investments(continued)
as of October 31, 2019
Interest rate swap agreements outstanding at October 31, 2019 (continued):
Notional Amount (000)# | Termination Date | Fixed Rate | Floating Rate | Value at Trade Date | Value at October 31, 2019 | Unrealized Appreciation (Depreciation) | ||||||||||||||||||||
Centrally Cleared Interest Rate Swap Agreements (cont’d.): |
| |||||||||||||||||||||||||
| PLN | 73,670 | 08/24/23 | 2.390%(A) | 6 Month WIBOR(2)(S) | $ | — | $ | 488,715 | $ | 488,715 | ||||||||||||||||
| PLN | 11,000 | 09/09/23 | 1.900%(A) | 6 Month WIBOR(2)(S) | (435,493 | ) | 18,448 | 453,941 | ||||||||||||||||||
| PLN | 60,110 | 11/13/23 | 2.570%(A) | 6 Month WIBOR(2)(S) | — | 772,574 | 772,574 | |||||||||||||||||||
| PLN | 18,100 | 04/11/24 | 2.020%(A) | 6 Month WIBOR(2)(S) | 27,242 | 105,714 | 78,472 | |||||||||||||||||||
| PLN | 83,750 | 06/21/24 | 1.750%(A) | 6 Month WIBOR(2)(S) | — | 11,408 | 11,408 | |||||||||||||||||||
| PLN | 30,000 | 03/28/28 | 2.895%(A) | 6 Month WIBOR(2)(S) | — | 815,055 | 815,055 | |||||||||||||||||||
| PLN | 24,980 | 06/12/28 | 3.070%(A) | 6 Month WIBOR(1)(S) | — | (712,730 | ) | (712,730 | ) | |||||||||||||||||
| PLN | 3,540 | 07/11/28 | 2.935%(A) | 6 Month WIBOR(2)(S) | — | 90,250 | 90,250 | |||||||||||||||||||
| SEK | 20,000 | 01/20/20 | 0.485%(A) | 3 Month STIBOR(2)(Q) | 28 | 10,454 | 10,426 | |||||||||||||||||||
| SEK | 13,000 | 09/15/21 | (0.003)%(A) | 3 Month STIBOR(2)(Q) | 26 | (3,382 | ) | (3,408 | ) | |||||||||||||||||
| SEK | 27,200 | 12/15/21 | 0.203%(A) | 3 Month STIBOR(2)(Q) | (607 | ) | 9,375 | 9,982 | ||||||||||||||||||
| SEK | 12,700 | 04/25/23 | 0.750%(A) | 3 Month STIBOR(2)(Q) | 30 | 32,876 | 32,846 | |||||||||||||||||||
| SEK | 38,380 | 07/11/23 | 0.458%(A) | 3 Month STIBOR(2)(Q) | — | 51,507 | 51,507 | |||||||||||||||||||
| SEK | 15,550 | 03/15/24 | 0.840%(A) | 3 Month STIBOR(2)(Q) | — | 56,136 | 56,136 | |||||||||||||||||||
| SEK | 12,700 | 08/29/24 | 1.657%(A) | 3 Month STIBOR(2)(Q) | 22,804 | 97,556 | 74,752 | |||||||||||||||||||
| SEK | 3,000 | 11/16/25 | 1.485%(A) | 3 Month STIBOR(2)(Q) | 20 | 27,872 | 27,852 | |||||||||||||||||||
| SEK | 6,000 | 12/09/25 | 1.505%(A) | 3 Month STIBOR(2)(Q) | 23 | 56,347 | 56,324 | |||||||||||||||||||
| SEK | 15,000 | 06/27/26 | 1.001%(A) | 3 Month STIBOR(2)(Q) | 33 | 81,153 | 81,120 | |||||||||||||||||||
| SEK | 15,390 | 06/22/27 | 1.031%(A) | 3 Month STIBOR(2)(Q) | — | 92,781 | 92,781 | |||||||||||||||||||
| SEK | 58,000 | 03/27/28 | 1.267%(A) | 3 Month STIBOR(2)(Q) | — | 504,354 | 504,354 | |||||||||||||||||||
| SEK | 8,535 | 07/11/28 | 1.141%(A) | 3 Month STIBOR(2)(Q) | — | 62,316 | 62,316 | |||||||||||||||||||
See Notes to Financial Statements.
| 146 |
Interest rate swap agreements outstanding at October 31, 2019 (continued):
Notional Amount (000)# | Termination Date | Fixed Rate | Floating Rate | Value at Trade Date | Value at October 31, 2019 | Unrealized Appreciation (Depreciation) | ||||||||||||||||||||
Centrally Cleared Interest Rate Swap Agreements (cont’d.): |
| |||||||||||||||||||||||||
| SEK | 33,000 | 11/28/28 | 1.188%(A) | 3 Month STIBOR(2)(Q) | $ | 55,811 | $ | 284,125 | $ | 228,314 | ||||||||||||||||
| SEK | 40,000 | 06/20/29 | 0.550%(A) | 3 Month STIBOR(2)(Q) | — | 61,113 | 61,113 | |||||||||||||||||||
| SEK | 16,000 | 10/07/29 | 0.180%(A) | 3 Month STIBOR(2)(Q) | — | (40,976 | ) | (40,976 | ) | |||||||||||||||||
| SGD | 15,540 | 05/21/23 | 2.030%(S) | 6 Month SIBOR(1)(S) | — | (222,180 | ) | (222,180 | ) | |||||||||||||||||
| SGD | 10,240 | 03/19/24 | 2.025%(S) | 6 Month SIBOR(2)(S) | — | 165,886 | 165,886 | |||||||||||||||||||
| SGD | 8,330 | 05/21/28 | 2.436%(S) | 6 Month SIBOR(2)(S) | — | 404,107 | 404,107 | |||||||||||||||||||
| SGD | 6,000 | 04/02/29 | 2.170%(S) | 6 Month SIBOR(2)(S) | — | 192,998 | 192,998 | |||||||||||||||||||
| SGD | 3,610 | 10/21/29 | 1.685%(S) | 6 Month SIBOR(2)(S) | — | (1,552 | ) | (1,552 | ) | |||||||||||||||||
| 214,220 | 03/12/20 | 2.405%(T) | 1 Day USOIS(2)(T) | 555 | 864,698 | 864,143 | ||||||||||||||||||||
| 112,940 | 04/25/20 | 2.328%(A) | 1 Day USOIS(2)(A) | (1,830 | ) | 521,549 | 523,379 | |||||||||||||||||||
| 49,312 | 03/31/21 | 2.173%(A) | 1 Day USOIS(2)(A) | (17,203 | ) | 585,815 | 603,018 | |||||||||||||||||||
| 81,840 | 06/15/21 | 1.830%(S) | 3 Month LIBOR(2)(Q) | — | 272,702 | 272,702 | ||||||||||||||||||||
| 45,100 | 09/15/21 | 1.381%(S) | 3 Month LIBOR(2)(Q) | (7,092 | ) | (99,461 | ) | (92,369 | ) | |||||||||||||||||
| 131,350 | 09/15/21 | 1.480%(S) | 3 Month LIBOR(2)(Q) | 35,480 | (74,922 | ) | (110,402 | ) | ||||||||||||||||||
| 21,270 | 09/15/21 | 1.604%(S) | 3 Month LIBOR(2)(Q) | 99,531 | 31,979 | (67,552 | ) | |||||||||||||||||||
| 20,575 | 05/31/22 | 2.353%(A) | 1 Day USOIS(1)(A) | — | (577,593 | ) | (577,593 | ) | ||||||||||||||||||
| 137,145 | 08/31/22 | 2.550%(A) | 1 Day USOIS(1)(A) | 4,472 | (5,156,338 | ) | (5,160,810 | ) | ||||||||||||||||||
| 31,820 | 11/30/22 | 2.614%(A) | 1 Day USOIS(1)(A) | — | (1,416,706 | ) | (1,416,706 | ) | ||||||||||||||||||
| 39,730 | 02/15/24 | 2.167%(S) | 3 Month LIBOR(1)(Q) | — | (1,126,044 | ) | (1,126,044 | ) | ||||||||||||||||||
| 41,965 | 02/15/24 | 2.183%(S) | 3 Month LIBOR(1)(Q) | (61,081 | ) | (1,219,738 | ) | (1,158,657 | ) | |||||||||||||||||
| 24,920 | 02/29/24 | 1.520%(S) | 3 Month LIBOR(2)(Q) | — | 67,724 | 67,724 | ||||||||||||||||||||
See Notes to Financial Statements.
| PGIM Global Total Return Fund | 147 |
Schedule of Investments(continued)
as of October 31, 2019
Interest rate swap agreements outstanding at October 31, 2019 (continued):
Notional Amount (000)# | Termination Date | Fixed Rate | Floating Rate | Value at Trade Date | Value at October 31, 2019 | Unrealized Appreciation (Depreciation) | ||||||||||||||||||||
Centrally Cleared Interest Rate Swap Agreements (cont’d.): |
| |||||||||||||||||||||||||
| 9,950 | 08/15/24 | 2.168%(S) | 3 Month LIBOR(1)(Q) | $ | — | $ | (315,493 | ) | $ | (315,493 | ) | |||||||||||||||
| 79,885 | 08/15/24 | 2.170%(S) | 3 Month LIBOR(1)(Q) | 239,360 | (2,539,441 | ) | (2,778,801 | ) | ||||||||||||||||||
| 30,545 | 08/15/24 | 2.176%(S) | 3 Month LIBOR(1)(Q) | 100,339 | (979,242 | ) | (1,079,581 | ) | ||||||||||||||||||
| 62,410 | 11/15/24 | 2.334%(S) | 3 Month LIBOR(1)(Q) | 203,394 | (2,961,624 | ) | (3,165,018 | ) | ||||||||||||||||||
| 27,885 | 02/28/25 | 2.454%(A) | 1 Day USOIS(1)(A) | 31,281 | (1,805,041 | ) | (1,836,322 | ) | ||||||||||||||||||
| 22,935 | 02/28/25 | 3.019%(S) | 3 Month LIBOR(1)(Q) | — | (1,835,308 | ) | (1,835,308 | ) | ||||||||||||||||||
| 95,077 | 05/31/25 | 2.998%(S) | 3 Month LIBOR(1)(Q) | (64,153 | ) | (8,559,275 | ) | (8,495,122 | ) | |||||||||||||||||
| 11,910 | 07/31/25 | 2.802%(A) | 1 Day USOIS(1)(A) | — | (1,065,973 | ) | (1,065,973 | ) | ||||||||||||||||||
| 35,410 | 07/31/25 | 3.105%(S) | 3 Month LIBOR(1)(Q) | 27,937 | (3,437,537 | ) | (3,465,474 | ) | ||||||||||||||||||
| 69,779 | 07/31/25 | 3.109%(S) | 3 Month LIBOR(1)(Q) | 47,715 | (6,791,856 | ) | (6,839,571 | ) | ||||||||||||||||||
| 1,170 | 01/08/26 | 2.210%(S) | 3 Month LIBOR(1)(Q) | 46,093 | (55,681 | ) | (101,774 | ) | ||||||||||||||||||
| 9,325 | 01/31/26 | 2.236%(S) | 3 Month LIBOR(1)(Q) | — | (464,058 | ) | (464,058 | ) | ||||||||||||||||||
| 79,626 | 01/31/26 | 2.269%(A) | 1 Day USOIS(1)(A) | (566,781 | ) | (4,988,568 | ) | (4,421,787 | ) | |||||||||||||||||
| 24,625 | 01/31/26 | 2.406%(S) | 3 Month LIBOR(1)(Q) | (43,922 | ) | (1,486,885 | ) | (1,442,963 | ) | |||||||||||||||||
| 33,465 | 03/12/26 | 2.290%(A) | 1 Day USOIS(1)(A) | 1,911 | (2,158,811 | ) | (2,160,722 | ) | ||||||||||||||||||
| 87,978 | 04/30/26 | 1.876%(S) | 3 Month LIBOR(1)(Q) | (229,891 | ) | (2,043,147 | ) | (1,813,256 | ) | |||||||||||||||||
| 13,586 | 02/15/27 | 1.824%(A) | 1 Day USOIS(1)(A) | 138,472 | (487,580 | ) | (626,052 | ) | ||||||||||||||||||
| 4,710 | 02/15/27 | 1.899%(A) | 1 Day USOIS(1)(A) | 22,823 | (196,471 | ) | (219,294 | ) | ||||||||||||||||||
| 3,045 | 02/15/27 | 1.965%(A) | 1 Day USOIS(1)(A) | — | (142,563 | ) | (142,563 | ) | ||||||||||||||||||
| 11,425 | 02/15/27 | 2.068%(A) | 1 Day USOIS(1)(A) | (6,540 | ) | (625,751 | ) | (619,211 | ) | |||||||||||||||||
| 3,560 | 05/15/27 | 1.823%(A) | 1 Day USOIS(1)(A) | — | (135,576 | ) | (135,576 | ) | ||||||||||||||||||
See Notes to Financial Statements.
| 148 |
Interest rate swap agreements outstanding at October 31, 2019 (continued):
Notional Amount (000)# | Termination Date | Fixed Rate | Floating Rate | Value at Trade Date | Value at October 31, 2019 | Unrealized Appreciation (Depreciation) | ||||||||||||||||||||
Centrally Cleared Interest Rate Swap Agreements (cont’d.): |
| |||||||||||||||||||||||||
| 6,645 | 05/15/27 | 2.295%(S) | 3 Month LIBOR(1)(Q) | $ | (19,143 | ) | $ | (405,098 | ) | $ | (385,955 | ) | ||||||||||||||
| 6,140 | 05/21/28 | 2.421%(S) | 3 Month LIBOR(1)(Q) | — | (468,666 | ) | (468,666 | ) | ||||||||||||||||||
| 2,405 | 08/15/28 | 2.579%(A) | 1 Day USOIS(1)(A) | (19,477 | ) | (259,159 | ) | (239,682 | ) | |||||||||||||||||
| 1,680 | 02/15/42 | 1.369%(A) | 1 Day USOIS(1)(A) | 180 | 59,462 | 59,282 | ||||||||||||||||||||
| 1,160 | 11/15/43 | 2.659%(S) | 3 Month LIBOR(1)(Q) | — | (214,981 | ) | (214,981 | ) | ||||||||||||||||||
| 9,755 | 08/15/44 | 2.392%(A) | 1 Day USOIS(1)(A) | — | (1,774,641 | ) | (1,774,641 | ) | ||||||||||||||||||
| 845 | 09/27/46 | 1.380%(A) | 1 Day USOIS(1)(A) | 165 | 29,028 | 28,863 | ||||||||||||||||||||
| 790 | 04/09/48 | 2.545%(S) | 3 Month LIBOR(1)(Q) | — | (138,499 | ) | (138,499 | ) | ||||||||||||||||||
| 735 | 05/08/48 | 2.627%(S) | 3 Month LIBOR(1)(Q) | — | (148,490 | ) | (148,490 | ) | ||||||||||||||||||
| ZAR | 755,000 | 02/28/21 | 7.150%(Q) | 3 Month JIBAR(2)(Q) | — | 313,839 | 313,839 | |||||||||||||||||||
| ZAR | 228,000 | 06/21/21 | 7.465%(Q) | 3 Month JIBAR(2)(Q) | (979 | ) | 191,013 | 191,992 | ||||||||||||||||||
| ZAR | 665,000 | 02/28/24 | 7.475%(Q) | 3 Month JIBAR(1)(Q) | — | (808,447 | ) | (808,447 | ) | |||||||||||||||||
| ZAR | 16,800 | 05/12/26 | 8.680%(Q) | 3 Month JIBAR(2)(Q) | 18 | 82,091 | 82,073 | |||||||||||||||||||
| ZAR | 27,500 | 06/30/27 | 8.015%(Q) | 3 Month JIBAR(2)(Q) | (155 | ) | 56,694 | 56,849 | ||||||||||||||||||
| ZAR | 68,200 | 11/07/27 | 8.360%(Q) | 3 Month JIBAR(2)(Q) | 53 | 238,380 | 238,327 | |||||||||||||||||||
| ZAR | 43,090 | 01/17/28 | 7.833%(Q) | 3 Month JIBAR(2)(Q) | — | 46,349 | 46,349 | |||||||||||||||||||
| ZAR | 35,000 | 04/16/28 | 7.655%(Q) | 3 Month JIBAR(2)(Q) | (1,219 | ) | 7,443 | 8,662 | ||||||||||||||||||
| ZAR | 176,800 | 07/16/28 | 8.170%(Q) | 3 Month JIBAR(2)(Q) | 696 | 406,635 | 405,939 | |||||||||||||||||||
| ZAR | 200,000 | 02/28/29 | 8.035%(Q) | 3 Month JIBAR(2)(Q) | — | 310,352 | 310,352 | |||||||||||||||||||
See Notes to Financial Statements.
| PGIM Global Total Return Fund | 149 |
Schedule of Investments(continued)
as of October 31, 2019
Interest rate swap agreements outstanding at October 31, 2019 (continued):
Notional | Termination Date | Fixed Rate | Floating Rate | Value at Trade Date | Value at October 31, 2019 | Unrealized Appreciaton (Depreciation) | ||||||||||||||||||||
Centrally Cleared Interest Rate Swap Agreements (cont’d.): |
| |||||||||||||||||||||||||
| ZAR | 46,800 | 06/21/29 | 7.685%(Q) | 3 Month JIBAR(2)(Q) | $ | (234 | ) | $ | (12,672 | ) | $ | (12,438 | ) | |||||||||||||
| ZAR | 140,000 | 10/03/29 | 7.580%(Q) | 3 Month JIBAR(2)(Q) | — | (132,019 | ) | (132,019 | ) | |||||||||||||||||
|
|
|
|
|
| |||||||||||||||||||||
| $ | 3,867,401 | $ | 13,625,169 | $ | 9,757,768 | |||||||||||||||||||||
|
|
|
|
|
| |||||||||||||||||||||
Notional Amount (000)# | Termination Date | Fixed Rate | Floating Rate | Fair Value | Upfront Premiums Paid (Received) | Unrealized Appreciation (Depreciation) | Counterparty | |||||||||||||||||||||
OTC Interest Rate Swap Agreements: | ||||||||||||||||||||||||||||
| AED | 35,805 | 02/25/29 | 3.750%(A) | 3 Month EIBOR(2)(Q) | $ | 1,116,761 | $ | — | $ | 1,116,761 | HSBC Bank USA, N.A. | |||||||||||||||||
| CLP | 2,890,000 | 02/09/27 | 4.120%(S) | 1 Day CLOIS(2)(S) | 432,861 | — | 432,861 | Morgan Stanley &Co. International PLC | ||||||||||||||||||||
| CLP | 94,000 | 12/19/27 | 4.370%(S) | 1 Day CLOIS(2)(S) | 17,173 | — | 17,173 | Morgan Stanley &Co. International PLC | ||||||||||||||||||||
| CLP | 2,420,000 | 12/20/27 | 4.260%(S) | 1 Day CLOIS(2)(S) | 393,897 | — | 393,897 | Morgan Stanley &Co. International PLC | ||||||||||||||||||||
| CLP | 842,800 | 01/23/28 | 4.245%(S) | 1 Day CLOIS(2)(S) | 137,739 | — | 137,739 | Morgan Stanley &Co. International PLC | ||||||||||||||||||||
| CLP | 2,168,000 | 01/26/28 | 4.210%(S) | 1 Day CLOIS(2)(S) | 351,066 | — | 351,066 | Morgan Stanley &Co. International PLC | ||||||||||||||||||||
| CLP | 1,080,000 | 02/01/28 | 4.200%(S) | 1 Day CLOIS(2)(S) | 173,369 | — | 173,369 | Morgan Stanley &Co. International PLC | ||||||||||||||||||||
| CLP | 1,750,000 | 03/27/28 | 4.220%(S) | 1 Day CLOIS(2)(S) | 278,077 | — | 278,077 | Citibank, N.A. | ||||||||||||||||||||
| CLP | 2,092,000 | 05/17/28 | 4.270%(S) | 1 Day CLOIS(2)(S) | 362,533 | — | 362,533 | Citibank, N.A. | ||||||||||||||||||||
See Notes to Financial Statements.
| 150 |
Interest rate swap agreements outstanding at October 31, 2019 (continued):
Notional | Termination Date | Fixed Rate | Floating Rate | Fair Value | Upfront Premiums Paid (Received) | Unrealized Appreciation (Depreciation) | Counterparty | |||||||||||||||||||||
OTC Interest Rate Swap Agreements (cont’d.): | ||||||||||||||||||||||||||||
| CNH | 52,500 | 08/15/23 | 3.115%(Q) | 7 Day China Fixing Repo Rates(2)(Q) | $ | 22,462 | $ | (93 | ) | $ | 22,555 | UBS AG | ||||||||||||||||
| CNH | 10,000 | 04/02/26 | 3.120%(Q) | 7 Day China Fixing Repo Rates(2)(Q) | (7,319 | ) | 3 | (7,322 | ) | Citibank, N.A. | ||||||||||||||||||
| COP | 4,351,000 | 11/01/26 | 6.590%(Q) | 1 Day COOIS(2)(Q) | 128,778 | — | 128,778 | Morgan Stanley &Co. International PLC | ||||||||||||||||||||
| COP | 10,220,000 | 11/04/26 | 6.770%(Q) | 1 Day COOIS(2)(Q) | 335,725 | — | 335,725 | Morgan Stanley &Co. International PLC | ||||||||||||||||||||
| COP | 13,700,000 | 06/02/27 | 5.910%(Q) | 1 Day COOIS(2)(Q) | 221,617 | — | 221,617 | Morgan Stanley &Co. International PLC | ||||||||||||||||||||
| COP | 5,437,000 | 01/23/28 | 6.035%(Q) | 1 Day COOIS(2)(Q) | 93,528 | — | 93,528 | Morgan Stanley &Co. International PLC | ||||||||||||||||||||
| COP | 6,670,000 | 01/26/28 | 6.000%(Q) | 1 Day COOIS(2)(Q) | 107,898 | — | 107,898 | Morgan Stanley &Co. International PLC | ||||||||||||||||||||
| COP | 5,607,000 | 02/01/28 | 6.020%(Q) | 1 Day COOIS(2)(Q) | 101,779 | — | 101,779 | Morgan Stanley &Co. International PLC | ||||||||||||||||||||
| COP | 13,000,000 | 03/27/28 | 6.150%(Q) | 1 Day COOIS(2)(Q) | 256,689 | — | 256,689 | Citibank, N.A. | ||||||||||||||||||||
| COP | 7,890,000 | 05/17/28 | 5.990%(Q) | 1 Day COOIS(2)(Q) | 132,487 | — | 132,487 | Citibank, N.A. | ||||||||||||||||||||
| COP | 9,400,000 | 07/18/28 | 6.150%(Q) | 1 Day COOIS(2)(Q) | 178,774 | — | 178,774 | Morgan Stanley &Co. International PLC | ||||||||||||||||||||
| ILS | 7,500 | 12/09/22 | 1.530%(A) | 3 Month TELBOR(2)(Q) | 114,964 | — | 114,964 | Citibank, N.A. | ||||||||||||||||||||
| ILS | 3,200 | 03/06/23 | 3.525%(A) | 3 Month TELBOR(2)(Q) | 120,280 | — | 120,280 | Deutsche Bank AG | ||||||||||||||||||||
See Notes to Financial Statements.
| PGIM Global Total Return Fund | 151 |
Schedule of Investments(continued)
as of October 31, 2019
Interest rate swap agreements outstanding at October 31, 2019 (continued):
Notional | Termination Date | Fixed Rate | Floating Rate | Fair Value | Upfront Premiums Paid (Received) | Unrealized Appreciation (Depreciation) | Counterparty | |||||||||||||||||||||
OTC Interest Rate Swap Agreements (cont’d.): | ||||||||||||||||||||||||||||
| ILS | 4,200 | 06/27/23 | 3.730%(A) | 3 Month TELBOR(2)(Q) | $ | 165,737 | $ | — | $ | 165,737 | Credit Suisse International | |||||||||||||||||
| ILS | 3,000 | 04/26/26 | 1.685%(A) | 3 Month TELBOR(2)(Q) | 69,708 | — | 69,708 | JPMorgan Chase Bank, N.A. | ||||||||||||||||||||
| ILS | 5,000 | 06/24/26 | 1.660%(A) | 3 Month TELBOR(2)(Q) | 110,324 | — | 110,324 | Citibank, N.A. | ||||||||||||||||||||
| ILS | 4,000 | 09/19/26 | 1.600%(A) | 3 Month TELBOR(2)(Q) | 79,858 | — | 79,858 | Barclays Bank PLC | ||||||||||||||||||||
| ILS | 7,000 | 01/12/27 | 1.975%(A) | 3 Month TELBOR(2)(Q) | 221,731 | — | 221,731 | Citibank, N.A. | ||||||||||||||||||||
| ILS | 3,000 | 03/15/27 | 2.130%(A) | 3 Month TELBOR(2)(Q) | 103,194 | — | 103,194 | Citibank, N.A. | ||||||||||||||||||||
| ILS | 2,745 | 06/22/27 | 1.845%(A) | 3 Month TELBOR(2)(Q) | 73,853 | — | 73,853 | Citibank, N.A. | ||||||||||||||||||||
| ILS | 5,600 | 04/26/28 | 1.915%(A) | 3 Month TELBOR(2)(Q) | 169,043 | — | 169,043 | BNP Paribas S.A. | ||||||||||||||||||||
| ILS | 38,930 | 07/16/28 | 2.045%(A) | 3 Month TELBOR(2)(Q) | 1,258,578 | — | 1,258,578 | JPMorgan Chase Bank, N.A. | ||||||||||||||||||||
| ILS | 8,050 | 03/13/29 | 1.840%(A) | 3 Month TELBOR(2)(Q) | 233,811 | — | 233,811 | HSBC Bank USA, N.A. | ||||||||||||||||||||
| ILS | 12,160 | 07/12/29 | 1.411%(A) | 3 Month TELBOR(2)(Q) | 192,173 | (3,365 | ) | 195,538 | Citibank, N.A. | |||||||||||||||||||
| ILS | 5,000 | 10/07/29 | 0.885%(A) | 3 Month TELBOR(2)(Q) | (1,618 | ) | — | (1,618 | ) | Goldman Sachs International | ||||||||||||||||||
| JPY | 35,000 | 12/14/32 | 1.575%(S) | 6 Month JPY LIBOR(2)(S) | 65,621 | — | 65,621 | HSBC Bank USA, N.A. | ||||||||||||||||||||
| KRW | 1,500,000 | 08/14/21 | 2.773%(Q) | 3 Month KRW LIBOR(2)(Q) | 36,014 | — | 36,014 | HSBC Bank USA, N.A. | ||||||||||||||||||||
| KRW | 655,000 | 10/07/22 | 1.765%(Q) | 3 Month KRW LIBOR(2)(Q) | 6,874 | — | 6,874 | JPMorgan Chase Bank, N.A. | ||||||||||||||||||||
| KRW | 3,300,000 | 04/17/23 | 2.170%(Q) | 3 Month KWCDC(2)(Q) | 80,763 | (155 | ) | 80,918 | Morgan Stanley &Co. International PLC | |||||||||||||||||||
| KRW | 900,000 | 11/05/24 | 2.425%(Q) | 3 Month KRW LIBOR(2)(Q) | 42,248 | — | 42,248 | Citibank, N.A. | ||||||||||||||||||||
| KRW | 1,485,000 | 10/28/26 | 1.520%(Q) | 3 Month KRW LIBOR(2)(Q) | 15,328 | (13 | ) | 15,341 | JPMorgan Chase Bank, N.A. | |||||||||||||||||||
| KRW | 2,040,000 | 04/26/27 | 1.880%(Q) | 3 Month KRW LIBOR(2)(Q) | 66,887 | — | 66,887 | Morgan Stanley &Co. International PLC | ||||||||||||||||||||
See Notes to Financial Statements.
| 152 |
Interest rate swap agreements outstanding at October 31, 2019 (continued):
Notional | Termination Date | Fixed Rate | Floating Rate | Fair Value | Upfront Premiums Paid (Received) | Unrealized Appreciation (Depreciation) | Counterparty | |||||||||||||||||||||
OTC Interest Rate Swap Agreements (cont’d.): | ||||||||||||||||||||||||||||
| KRW | 1,280,000 | 10/17/28 | 1.450%(Q) | 3 Month KRW LIBOR(2)(Q) | $ | 8,010 | $ | — | $ | 8,010 | Citibank, N.A. | |||||||||||||||||
| KRW | 520,000 | 01/27/31 | 1.870%(Q) | 3 Month KRW LIBOR(2)(Q) | 22,672 | — | 22,672 | JPMorgan Chase Bank, N.A. | ||||||||||||||||||||
| MYR | 16,000 | 08/19/23 | 3.445%(Q) | 3 Month KLIBOR(2)(Q) | 23,669 | — | 23,669 | Morgan Stanley &Co. International PLC | ||||||||||||||||||||
| MYR | 1,700 | 04/28/25 | 4.040%(Q) | 3 Month KLIBOR(2)(Q) | 15,209 | — | 15,209 | Citibank, N.A. | ||||||||||||||||||||
| MYR | 3,160 | 07/11/29 | 3.528%(Q) | 3 Month KLIBOR(2)(Q) | 10,864 | (6 | ) | 10,870 | Morgan Stanley &Co. International PLC | |||||||||||||||||||
| RUB | 857,170 | 05/17/24 | 8.660%(A) | 3 Month MosPRIME(2)(Q) | 634,726 | — | 634,726 | Goldman Sachs International | ||||||||||||||||||||
| RUB | 857,170 | 05/20/24 | 8.700%(A) | 3 Month MosPRIME(2)(Q) | 647,147 | — | 647,147 | Goldman Sachs International | ||||||||||||||||||||
| RUB | 820,000 | 06/20/29 | 9.580%(A) | 3 Month MosPRIME(2)(Q) | 996,448 | — | 996,448 | Goldman Sachs International | ||||||||||||||||||||
| THB | 550,000 | 08/08/20 | 1.840%(S) | 6 Month BIBOR(2)(S) | 67,976 | — | 67,976 | Citibank, N.A. | ||||||||||||||||||||
| THB | 120,000 | 08/23/23 | 1.920%(S) | 6 Month BIBOR(2)(S) | 84,850 | — | 84,850 | Morgan Stanley &Co. International PLC | ||||||||||||||||||||
| THB | 60,000 | 07/04/24 | 1.590%(S) | 6 Month BIBOR(2)(S) | 14,736 | — | 14,736 | Morgan Stanley &Co. International PLC | ||||||||||||||||||||
| THB | 28,900 | 04/30/25 | 2.560%(S) | 6 Month BIBOR(2)(S) | 58,061 | — | 58,061 | Citibank, N.A. | ||||||||||||||||||||
| TWD | 115,500 | 03/17/21 | 0.780%(Q) | 3 Month TAIBOR(2)(Q) | 6,221 | — | 6,221 | Barclays Bank PLC | ||||||||||||||||||||
| ZAR | 40,930 | 03/22/42 | 7.800%(Q) | 3 Month JIBAR(2)(Q) | (112,347 | ) | — | (112,347 | ) | Deutsche Bank AG | ||||||||||||||||||
| ZAR | 89,400 | 09/22/42 | 8.020%(Q) | 3 Month JIBAR(2)(Q) | (104,801 | ) | — | (104,801 | ) | Deutsche Bank AG | ||||||||||||||||||
See Notes to Financial Statements.
| PGIM Global Total Return Fund | 153 |
Schedule of Investments(continued)
as of October 31, 2019
Interest rate swap agreements outstanding at October 31, 2019 (continued):
Notional | Termination Date | Fixed Rate | Floating Rate | Fair Value | Upfront Premiums Paid (Received) | Unrealized Appreciation (Depreciation) | Counterparty | |||||||||||||||||||
OTC Interest Rate Swap Agreements (cont’d.): | ||||||||||||||||||||||||||
| ZAR 38,700 | 03/22/47 | 7.650%(Q) | 3 Month JIBAR(1)(Q) | $ | 133,326 | $ | — | $ | 133,326 | Deutsche Bank AG | ||||||||||||||||
| ZAR 83,965 | 09/22/47 | 7.890%(Q) | 3 Month JIBAR(1)(Q) | 131,871 | — | 131,871 | Deutsche Bank AG | |||||||||||||||||||
|
|
|
|
|
| |||||||||||||||||||||
| $ | 10,699,903 | $ | (3,629 | ) | $ | 10,703,532 | ||||||||||||||||||||
|
|
|
|
|
| |||||||||||||||||||||
| (1) | The Fund pays the fixed rate and receives the floating rate. |
| (2) | The Fund pays the floating rate and receives the fixed rate. |
Balances Reported in the Statement of Assets and Liabilities for OTC Swap Agreements:
| Premiums Paid | Premiums Received | Unrealized Appreciation | Unrealized Depreciation | |||||||||||||
| OTC Swap Agreements | $ | 8,180,865 | $ | (14,954,158 | ) | $ | 33,656,063 | $ | (13,200,168 | ) | ||||||
Summary of Collateral for Centrally Cleared/Exchange-traded Derivatives:
Cash and securities segregated as collateral, including pending settlement for closed positions, to cover requirements for centrally cleared/exchange-traded derivatives are listed by broker as follows:
Broker | Cash and/or Foreign Currency | Securities Market Value | ||||||
| Citigroup Global Markets, Inc. | $ | — | $ | 28,384,140 | ||||
| JPMorgan Securities LLC | 221,000 | 17,934,162 | ||||||
|
|
|
| |||||
| Total | $ | 221,000 | $ | 46,318,302 | ||||
|
|
|
| |||||
Fair Value Measurements:
Various inputs are used in determining the value of the Fund’s investments. These inputs are summarized in the three broad levels listed below.
Level 1—unadjusted quoted prices generally in active markets for identical securities.
Level 2—quoted prices for similar securities, interest rates and yield curves, prepayment speeds, foreign currency exchange rates and other observable inputs.
Level 3—unobservable inputs for securities valued in accordance with Board approved fair valuation procedures.
See Notes to Financial Statements.
| 154 |
The following is a summary of the inputs used as of October 31, 2019 in valuing such portfolio securities:
| Level 1 | Level 2 | Level 3 | ||||||||||
Investments in Securities | ||||||||||||
Assets | ||||||||||||
Asset-Backed Securities | ||||||||||||
Cayman Islands | $ | — | $ | 310,400,512 | $ | — | ||||||
Ireland | — | 44,319,988 | — | |||||||||
Netherlands | — | 1,114,566 | — | |||||||||
Spain | — | 8,481,300 | — | |||||||||
United States | — | 142,877,820 | 7,247,808 | |||||||||
Bank Loans | ||||||||||||
United Kingdom | — | 4,692,495 | — | |||||||||
United States | — | 2,968,069 | — | |||||||||
Commercial Mortgage-Backed Securities | ||||||||||||
United Kingdom | — | 649,877 | — | |||||||||
United States | — | 184,298,148 | — | |||||||||
Corporate Bonds | ||||||||||||
Australia | — | 1,261,466 | — | |||||||||
Brazil | — | 9,808,629 | — | |||||||||
Canada | — | 19,403,471 | — | |||||||||
China | — | 23,478,395 | — | |||||||||
Denmark | — | 1,111,533 | — | |||||||||
Dominican Republic | — | 188,674 | — | |||||||||
France | — | 62,880,864 | 12,402 | |||||||||
Germany | — | 16,207,446 | — | |||||||||
Hungary | — | 414,664 | — | |||||||||
Indonesia | — | 7,056,345 | — | |||||||||
Israel | — | 7,772,763 | — | |||||||||
Italy | — | 9,194,512 | — | |||||||||
Japan | — | 5,037,941 | — | |||||||||
Kazakhstan | — | 5,464,851 | — | |||||||||
Luxembourg | — | 10,187,503 | — | |||||||||
Mexico | — | 25,442,365 | — | |||||||||
Netherlands | — | 19,139,907 | — | |||||||||
Peru | — | 2,035,941 | — | |||||||||
Poland | — | 3,190,775 | — | |||||||||
Portugal | — | 6,064,694 | — | |||||||||
Qatar | — | 209,162 | — | |||||||||
Russia | — | 7,990,574 | — | |||||||||
Singapore | — | 368,948 | — | |||||||||
South Africa | — | 3,543,489 | — | |||||||||
South Korea | — | 9,482,625 | — | |||||||||
Spain | — | 6,986,545 | — | |||||||||
Supranational Bank | — | 36,018,731 | — | |||||||||
Switzerland | — | 13,539,020 | — | |||||||||
Tunisia | — | 733,401 | — | |||||||||
Ukraine | — | 1,282,430 | — | |||||||||
United Arab Emirates | — | 11,229,374 | — | |||||||||
United Kingdom | — | 64,211,118 | 5,188,697 | |||||||||
United States | — | 403,062,872 | — | |||||||||
See Notes to Financial Statements.
| PGIM Global Total Return Fund | 155 |
Schedule of Investments(continued)
as of October 31, 2019
| Level 1 | Level 2 | Level 3 | ||||||||||
Investments in Securities (continued) | ||||||||||||
Assets (continued) | ||||||||||||
Municipal Bonds | ||||||||||||
Puerto Rico | $ | — | $ | 456,891 | $ | — | ||||||
Residential Mortgage-Backed Securities | ||||||||||||
Bermuda | — | 31,801,010 | — | |||||||||
United Kingdom | — | 4,824,952 | — | |||||||||
United States | — | 35,798,866 | 22,400,000 | |||||||||
Sovereign Bonds | ||||||||||||
Albania | — | 2,829,726 | — | |||||||||
Argentina | — | 16,131,497 | 119,712 | |||||||||
Australia | — | 2,616,996 | — | |||||||||
Austria | — | 4,489,828 | — | |||||||||
Belgium | — | 5,438,886 | — | |||||||||
Brazil | — | 44,837,089 | — | |||||||||
Bulgaria | — | 9,325,744 | — | |||||||||
Canada | — | 6,510,843 | — | |||||||||
Cayman Islands | — | 2,147,312 | — | |||||||||
Chile | — | 834,525 | — | |||||||||
China | — | 10,429,023 | — | |||||||||
Colombia | — | 24,847,486 | — | |||||||||
Croatia | — | 16,327,976 | — | |||||||||
Cyprus | — | 52,911,475 | — | |||||||||
Denmark | — | 3,565,730 | — | |||||||||
Dominican Republic | — | 4,867,569 | — | |||||||||
Egypt | — | 2,680,329 | — | |||||||||
Finland | — | 2,429,179 | — | |||||||||
Greece | — | 69,723,745 | — | |||||||||
Guernsey | — | 2,116,137 | — | |||||||||
Hong Kong | — | 1,566,144 | — | |||||||||
Hungary | — | 15,779,117 | — | |||||||||
Iceland | — | 1,663,650 | — | |||||||||
Indonesia | — | 38,843,621 | — | |||||||||
Iraq | — | 1,712,614 | — | |||||||||
Isle of Man | — | 10,308,484 | — | |||||||||
Israel | — | 9,787,476 | — | |||||||||
Italy | — | 128,637,441 | — | |||||||||
Japan | — | 30,846,486 | — | |||||||||
Jersey | — | 187,562 | — | |||||||||
Kazakhstan | — | 8,279,327 | — | |||||||||
Kuwait | — | 2,078,684 | — | |||||||||
Latvia | — | 230,537 | — | |||||||||
Lithuania | — | 5,095,619 | — | |||||||||
Malaysia | — | 9,148,153 | — | |||||||||
Mexico | — | 33,696,785 | — | |||||||||
Montenegro | — | 1,456,990 | — | |||||||||
New Zealand | — | 6,419,874 | — | |||||||||
North Macedonia | — | 4,256,938 | — | |||||||||
Norway | — | 2,024,961 | — | |||||||||
See Notes to Financial Statements.
| 156 |
| Level 1 | Level 2 | Level 3 | ||||||||||
Investments in Securities (continued) | ||||||||||||
Assets (continued) | ||||||||||||
Sovereign Bonds (continued) | ||||||||||||
Panama | $ | — | $ | 9,358,712 | $ | — | ||||||
Peru | — | 23,775,165 | — | |||||||||
Philippines | — | 7,731,431 | — | |||||||||
Portugal | — | 73,291,024 | — | |||||||||
Qatar | — | 3,382,135 | — | |||||||||
Romania | — | 19,123,051 | — | |||||||||
Russia | — | 11,340,872 | — | |||||||||
Saudi Arabia | — | 15,162,110 | — | |||||||||
Senegal | — | 1,608,664 | — | |||||||||
Serbia | — | 17,271,966 | — | |||||||||
Slovenia | — | 8,964,995 | — | |||||||||
South Africa | — | 9,084,492 | — | |||||||||
South Korea | — | 6,106,725 | — | |||||||||
Spain | — | 93,711,132 | 1,445,886 | |||||||||
Sweden | — | 3,045,384 | — | |||||||||
Thailand | — | 1,813,551 | — | |||||||||
Turkey | — | 17,268,687 | — | |||||||||
Ukraine | — | 20,413,336 | — | |||||||||
United Arab Emirates | — | 16,588,804 | — | |||||||||
United Kingdom | — | 19,031,174 | — | |||||||||
Uruguay | — | 3,762,575 | — | |||||||||
U.S. Government Agency Obligations | — | 6,101,141 | — | |||||||||
U.S. Treasury Obligations | — | 2,511,830 | — | |||||||||
Common Stock | 17,789 | — | — | |||||||||
Preferred Stock | 109,160 | — | — | |||||||||
Affiliated Mutual Funds | 113,569,362 | — | — | |||||||||
Options Purchased | — | 90,696,665 | — | |||||||||
|
|
|
|
|
| |||||||
Total | $ | 113,696,311 | $ | 2,644,912,701 | $ | 36,414,505 | ||||||
|
|
|
|
|
| |||||||
Liabilities | ||||||||||||
Options Written | $ | — | $ | (74,312,430 | ) | $ | — | |||||
|
|
|
|
|
| |||||||
Other Financial Instruments* | ||||||||||||
Assets | ||||||||||||
Futures Contracts | $ | 8,902,088 | $ | — | $ | — | ||||||
OTC Forward Foreign Currency Exchange Contracts | — | 57,034,666 | — | |||||||||
OTC Cross Currency Exchange Contracts | — | 15,432,023 | — | |||||||||
OTC Packaged Credit Default Swap Agreements | — | 10,687,142 | — | |||||||||
Centrally Cleared Credit Default Swap Agreements | — | 477,779 | — | |||||||||
OTC Credit Default Swap Agreements | — | 11,319,171 | 49,237 | |||||||||
OTC Currency Swap Agreement | — | 538,228 | — | |||||||||
Centrally Cleared Inflation Swap Agreement | — | 386,579 | — | |||||||||
See Notes to Financial Statements.
| PGIM Global Total Return Fund | 157 |
Schedule of Investments(continued)
as of October 31, 2019
| Level 1 | Level 2 | Level 3 | ||||||||||
Other Financial Instruments* (continued) | ||||||||||||
Assets (continued) | ||||||||||||
Centrally Cleared Interest Rate Swap Agreements | $ | — | $ | 72,427,494 | $ | — | ||||||
OTC Interest Rate Swap Agreements | — | 10,925,988 | — | |||||||||
|
|
|
|
|
| |||||||
Total | $ | 8,902,088 | $ | 179,229,070 | $ | 49,237 | ||||||
|
|
|
|
|
| |||||||
Liabilities | ||||||||||||
Futures Contracts | $ | (10,485,626 | ) | $ | — | $ | — | |||||
OTC Forward Foreign Currency Exchange Contracts | — | (51,444,765 | ) | — | ||||||||
OTC Cross Currency Exchange Contracts | — | (9,904,868 | ) | — | ||||||||
OTC Packaged Credit Default Swap Agreements | — | (11,307,728 | ) | — | ||||||||
OTC Credit Default Swap Agreements | — | (8,303,351 | ) | — | ||||||||
Centrally Cleared Inflation Swap Agreement | — | (404,653 | ) | — | ||||||||
Centrally Cleared Interest Rate Swap Agreements | — | (62,669,726 | ) | — | ||||||||
OTC Interest Rate Swap Agreements | — | (226,085 | ) | — | ||||||||
|
|
|
|
|
| |||||||
Total | $ | (10,485,626 | ) | $ | (144,261,176 | ) | $ | — | ||||
|
|
|
|
|
| |||||||
| * | Other financial instruments are derivative instruments not reflected in the Schedule of Investments, such as futures, forwards and centrally cleared swap contracts, which are recorded at the unrealized appreciation (depreciation) on the instrument, and OTC swap contracts which are recorded at fair value. |
The following is a reconciliation of assets in which unobservable inputs (Level 3) were used in determining fair value:
| Asset-Backed Securities United States | Bank Loans | Corporate Bonds | Residential Mortgage-Backed Securities | |||||||||||||
Balance as of 10/31/18 | $ | 12,695,642 | $ | 262,834 | $ | 144,688 | $ | — | ||||||||
Realized gain (loss) | 24,921 | (1,362 | ) | — | — | |||||||||||
Change in unrealized appreciation (depreciation) | 5,284 | (1,880 | ) | (268,571 | ) | — | ||||||||||
Purchases/Exchanges/Issuances | 7,680,000 | — | 5,458,969 | 22,400,000 | ||||||||||||
Sales/Paydowns | (13,166,036 | ) | (259,592 | ) | — | — | ||||||||||
Accrued discount/premium | 7,997 | — | 218 | — | ||||||||||||
Transfers into of Level 3 | — | — | 10,483 | — | ||||||||||||
Transfers out of Level 3 | — | — | (144,688 | ) | — | |||||||||||
|
|
|
|
|
|
|
| |||||||||
Balance as of 10/31/19 | $ | 7,247,808 | $ | — | $ | 5,201,099 | $ | 22,400,000 | ||||||||
|
|
|
|
|
|
|
| |||||||||
Change in unrealized appreciation (depreciation) relating to securities still held at reporting period end | $ | — | $ | — | $ | (268,571 | ) | $ | — | |||||||
|
|
|
|
|
|
|
| |||||||||
| Sovereign Bonds | Options Written | OTC Credit Default Swap Agreements | OTC Forward Rate Agreements | |||||||||||||
Balance as of 10/31/18 | $ | — | $ | (4,755 | ) | $ | 8,043 | $ | (271,942 | ) | ||||||
See Notes to Financial Statements.
| 158 |
| Sovereign Bonds | Options Written | OTC Credit Default Swap Agreements | OTC Forward Rate Agreements | |||||||||||||
Realized gain (loss) | $ | — | $ | 21,624 | $ | 7,746 | $ | (239,058 | ) | |||||||
Change in unrealized appreciation (depreciation) | 66,481 | (16,869 | ) | 49,237 | 272,001 | |||||||||||
Purchases/Exchanges/Issuances | 1,509,040 | — | — | — | ||||||||||||
Sales/Paydowns | — | — | (15,789 | ) | 238,999 | |||||||||||
Accrued discount/premium | (9,923 | ) | — | — | — | |||||||||||
Transfers into of Level 3 | — | — | — | — | ||||||||||||
Transfers out of Level 3 | — | — | — | — | ||||||||||||
|
|
|
|
|
|
|
| |||||||||
Balance as of 10/31/19 | $ | 1,565,598 | $ | — | $ | 49,237 | $ | — | ||||||||
|
|
|
|
|
|
|
| |||||||||
Change in unrealized appreciation (depreciation) relating to securities still held at reporting period end | $ | 66,481 | $ | — | $ | 49,237 | $ | — | ||||||||
|
|
|
|
|
|
|
| |||||||||
Level 3 securities as presented in the table above are being fair valued using pricing methodologies approved by Board, which contain unobservable inputs as follows:
Level 3 Securities | Fair Value as of October 31, 2019 | Valuation Methodology | Unobservable Inputs | |||||||||
Asset-Backed Securities | ||||||||||||
United States | $ | 7,247,808 | Pricing at Cost | Unadjusted Purchase Price | ||||||||
Corporate Bonds | 5,201,099 | Evaluated Bid | Comparable Security Data | |||||||||
Residential Mortgage-Backed Securities | 22,400,000 | Pricing at Cost | Unadjusted Purchase Price | |||||||||
Sovereign Bonds | 1,565,598 | Evaluated Bid | Comparable Security Data | |||||||||
OTC Credit Default Swap Agreements | 49,237 | Market Approach | Single Broker Indicative Quote | |||||||||
|
| |||||||||||
| $ | 36,463,742 | |||||||||||
|
| |||||||||||
It is the Company’s policy to recognize transfers in and transfers out at the fair value as of the beginning of period. Securities transferred levels as follows:
Investments in Securities | Amount Transferred | Level Transfer | Logic | |||||||
Corporate Bonds | $ | (144,688 | ) | L3 to L2 | Single Broker Indicative to Evaluated Bid | |||||
Corporate Bonds | $ | 10,483 | L2 to L3 | Evaluated Bid to Comparable Security Data | ||||||
See Notes to Financial Statements.
| PGIM Global Total Return Fund | 159 |
Schedule of Investments(continued)
as of October 31, 2019
Industry Classification:
The industry classification of investments and liabilities in excess of other assets shown as a percentage of net assets as of October 31, 2019 were as follows (unaudited):
Sovereign Bonds | 37.0 | % | ||
Collateralized Loan Obligations | 14.0 | |||
Banks | 7.9 | |||
Commercial Mortgage-Backed Securities | 7.0 | |||
Residential Mortgage-Backed Securities | 4.8 | |||
Affiliated Mutual Funds (3.0% represents investments purchased with collateral from securities on loan) | 4.3 | |||
Options Purchased | 3.4 | |||
Oil & Gas | 2.4 | |||
Student Loans | 2.0 | |||
Telecommunications | 1.6 | |||
Electric | 1.5 | |||
Multi-National | 1.4 | |||
Pipelines | 1.2 | |||
Diversified Financial Services | 1.0 | |||
Healthcare-Products | 1.0 | |||
Media | 1.0 | |||
Commercial Services | 0.9 | |||
Retail | 0.9 | |||
Consumer Loans | 0.9 | |||
Pharmaceuticals | 0.9 | |||
Transportation | 0.8 | |||
Chemicals | 0.7 | |||
Healthcare-Services | 0.7 | |||
Insurance | 0.7 | |||
Auto Manufacturers | 0.7 | |||
Automobiles | 0.6 | |||
Real Estate Investment Trusts (REITs) | 0.6 | |||
Other | 0.6 | |||
Foods | 0.5 | |||
Software | 0.5 | |||
Home Builders | 0.5 | |||
Entertainment | 0.5 | |||
Packaging & Containers | 0.4 | |||
Electrical Components & Equipment | 0.3 | % | ||
Household Products/Wares | 0.3 | |||
Auto Parts & Equipment | 0.3 | |||
Aerospace & Defense | 0.3 | |||
U.S. Government Agency Obligations | 0.2 | |||
Semiconductors | 0.2 | |||
Home Equity Loans | 0.1 | |||
Mining | 0.1 | |||
Biotechnology | 0.1 | |||
Agriculture | 0.1 | |||
Computers | 0.1 | |||
U.S. Treasury Obligations | 0.1 | |||
Oil & Gas Services | 0.1 | |||
Building Materials | 0.1 | |||
Housewares | 0.1 | |||
Apparel | 0.0 | * | ||
Internet | 0.0 | * | ||
Electronics | 0.0 | * | ||
Office/Business Equipment | 0.0 | * | ||
Municipal Bonds | 0.0 | * | ||
Miscellaneous Manufacturing | 0.0 | * | ||
Investment Companies | 0.0 | * | ||
Airlines | 0.0 | * | ||
Leisure Time | 0.0 | * | ||
Forest Products & Paper | 0.0 | * | ||
Oil, Gas & Consumable Fuels | 0.0 | * | ||
|
| |||
| 105.4 | ||||
Options Written | (2.8 | ) | ||
Liabilities in excess of other assets | (2.6 | ) | ||
|
| |||
| 100.0 | % | |||
|
|
| * | Less than +/- 0.05% |
Effects of Derivative Instruments on the Financial Statements and Primary Underlying Risk Exposure:
The Fund invested in derivative instruments during the reporting period. The primary types of risk associated with these derivative instruments are credit contracts risk, foreign exchange contracts risk and interest rate contracts risk. See the Notes to Financial Statements for additional detail regarding these derivative instruments and their risks. The effect of such derivative instruments on the Fund’s financial position and financial performance as reflected in the Statement of Assets and Liabilities and Statement of Operations is presented in the summary below.
See Notes to Financial Statements.
| 160 |
Fair values of derivative instruments as of October 31, 2019 as presented in the Statement of Assets and Liabilities:
Asset Derivatives | Liability Derivatives | |||||||||||
Derivatives not accounted | Statement of | Fair Value | Statement of | Fair Value | ||||||||
| Credit contracts | Due from/to broker—variation margin swaps | $ | 477,779 | * | — | $ | — | |||||
| Credit contracts | Premiums paid for OTC swap agreements | 8,180,862 | Premiums received for OTC swap agreements | 14,950,526 | ||||||||
| Credit contracts | Unaffiliated investments | 11,138 | Options written outstanding, at value | 241,088 | ||||||||
| Credit contracts | Unrealized appreciation on OTC swap agreements | 22,188,215 | Unrealized depreciation on OTC swap agreements | 12,974,080 | ||||||||
| Foreign exchange contracts | Unaffiliated investments | 89,986,629 | Options written outstanding, at value | 73,882,692 | ||||||||
| Foreign exchange contracts | Unrealized appreciation on OTC cross currency exchange contracts | 15,432,023 | Unrealized depreciation on OTC cross currency exchange contracts | 9,904,868 | ||||||||
| Foreign exchange contracts | Unrealized appreciation on OTC forward foreign currency exchange contracts | 57,034,666 | Unrealized depreciation on OTC forward foreign currency exchange contracts | 51,444,765 | ||||||||
| Interest rate contracts | Due from/to broker–variation margin futures | 8,902,088 | * | Due from/to broker—variation margin futures | 10,485,626 | * | ||||||
| Interest rate contracts | Due from/to broker—variation margin swaps | 72,814,073 | * | Due from/to broker—variation margin swaps | 63,074,379 | * | ||||||
| Interest rate contracts | Premiums paid for OTC swap agreements | 3 | Premiums received for OTC swap agreements | 3,632 | ||||||||
| Interest rate contracts | Unaffiliated investments | 698,898 | Options written outstanding, at value | 188,650 | ||||||||
| Interest rate contracts | Unrealized appreciation on OTC swap agreements | 11,467,848 | Unrealized depreciation on OTC swap agreements | 226,088 | ||||||||
|
|
|
| |||||||||
| $ | 287,194,222 | $ | 237,376,394 | |||||||||
|
|
|
| |||||||||
| * | Includes cumulative appreciation (depreciation) as reported in the schedule of open futures and centrally cleared swap contracts. Only unsettled variation margin receivable (payable) is reported within the Statement of Assets and Liabilities. |
See Notes to Financial Statements.
| PGIM Global Total Return Fund | 161 |
Schedule of Investments(continued)
as of October 31, 2019
The effects of derivative instruments on the Statement of Operations for the year ended October 31, 2019 are as follows:
Amount of Realized Gain (Loss) on Derivatives Recognized in Income | ||||||||||||||||||||||||
Derivatives not accounted | Options Purchased(1) | Options Written | Futures | Forward & Cross Currency Exchange Contracts | Forward Rate Agreements | Swaps | ||||||||||||||||||
Credit contracts | $ | (1,339,073 | ) | $ | 1,762,871 | $ | — | $ | — | $ | — | $ | 10,273,540 | |||||||||||
Foreign exchange contracts | (33,841,071 | ) | 24,900,122 | — | 17,609,494 | — | — | |||||||||||||||||
Interest rate contracts | (837,034 | ) | 377,455 | 79,711,921 | — | (313,027 | ) | 10,881,816 | ||||||||||||||||
|
|
|
|
|
|
|
|
|
|
|
| |||||||||||||
Total | $ | (36,017,178 | ) | $ | 27,040,448 | $ | 79,711,921 | $ | 17,609,494 | $ | (313,027 | ) | $ | 21,155,356 | ||||||||||
|
|
|
|
|
|
|
|
|
|
|
| |||||||||||||
| (1) | Included in net realized gain (loss) on investment transactions in the Statement of Operations. |
Change in Unrealized Appreciation (Depreciation) on Derivatives Recognized in Income | ||||||||||||||||||||||||
Derivatives not accounted | Options Purchased(2) | Options Written | Futures | Forward & Cross Currency Exchange Contracts | Forward Rate Agreements | Swaps | ||||||||||||||||||
Credit contracts | $ | 1,785 | $ | (249,501 | ) | $ | — | $ | — | $ | — | $ | 5,374,607 | |||||||||||
Foreign exchange contracts | (65,929,273 | ) | 76,682,287 | — | (11,435,250 | ) | — | — | ||||||||||||||||
Interest rate contracts | 301,478 | 161,575 | 14,760,650 | — | 271,942 | (6,107,270 | ) | |||||||||||||||||
|
|
|
|
|
|
|
|
|
|
|
| |||||||||||||
Total | $ | (65,626,010 | ) | $ | 76,594,361 | $ | 14,760,650 | $ | (11,435,250 | ) | $ | 271,942 | $ | (732,663 | ) | |||||||||
|
|
|
|
|
|
|
|
|
|
|
| |||||||||||||
| (2) | Included in net change in unrealized appreciation (depreciation) on investments in the Statement of Operations. |
For the year ended October 31, 2019, the Fund’s average volume of derivative activities is as follows:
Options | Options Written(2) | Futures Contracts— Long Positions(2) | Futures Contracts— Short Positions(2) | Forward Foreign Currency Exchange Contracts— Purchased(3) | ||||||||||||||
| $ | 125,926,596 | $ | 4,270,890,312 | $ | 1,484,826,831 | $ | 1,348,205,988 | $ | 1,514,113,001 | |||||||||
Forward Foreign | Cross Currency Exchange Contracts(4) | Forward Rate Agreements(2) | Inflation Swap Agreements(2) | Interest Rate Swap Agreements(2) | ||||||||||||||
| $ | 1,454,646,465 | $ | 181,067,448 | $ | 103,840,000 | $ | 53,596,968 | $ | 3,853,103,239 | |||||||||
| Credit Default Swap Agreements— Buy Protection(2) | Credit Default Swap Agreements— Sell Protection(2) | Currency Swap Agreements(2) | ||||||||
| $ | 301,066,316 | $ | 642,758,399 | $ | 2,763,200 | |||||
See Notes to Financial Statements.
| 162 |
| (1) | Cost. |
| (2) | Notional Amount in USD. |
| (3) | Value at Settlement Date. |
| (4) | Value at Trade Date. |
Financial Instruments/Transactions—Summary of Offsetting and Netting Arrangements:
The Fund invested in OTC derivatives and entered into financial instruments/transactions during the reporting period that are either offset in accordance with current requirements or are subject to enforceable master netting arrangements or similar agreements that permit offsetting. The information about offsetting and related netting arrangements for OTC derivatives and financial instruments/transactions where the legal right to set-off exists is presented in the summary below.
Offsetting of financial instrument/transaction assets and liabilities:
Description | Gross Market Value of Recognized Assets/ (Liabilities) | Collateral Pledged/ (Received)(2) | Net Amount | |||||||||
Securities on Loan | $ | 75,921,590 | $ | (75,921,590 | ) | $ | — | |||||
|
| |||||||||||
Offsetting of OTC derivative assets and liabilities:
Counterparty | Gross Amounts of Recognized Assets(1) | Gross Amounts of Recognized Liabilities(1) | Net Amounts of Recognized Assets/ (Liabilities) | Collateral Pledged/ (Received)(2) | Net Amount | |||||||||||||||
Bank of America, N.A. | $ | 13,972,594 | $ | (10,970,855 | ) | $ | 3,001,739 | $ | (3,001,739 | ) | $ | — | ||||||||
Barclays Bank PLC | 10,072,292 | (9,237,938 | ) | 834,354 | (834,354 | ) | — | |||||||||||||
BNP Paribas S.A. | 16,660,711 | (13,755,601 | ) | 2,905,110 | (2,905,110 | ) | — | |||||||||||||
Citibank, N.A. | 29,908,561 | (29,672,303 | ) | 236,258 | — | 236,258 | ||||||||||||||
Credit Suisse International | 388,658 | (911,937 | ) | (523,279 | ) | 430,000 | (93,279 | ) | ||||||||||||
Deutsche Bank AG | 36,155,976 | (34,757,175 | ) | 1,398,801 | (1,398,801 | ) | — | |||||||||||||
Goldman Sachs International | 21,908,196 | (17,293,721 | ) | 4,614,475 | (3,043,418 | ) | 1,571,057 | |||||||||||||
HSBC Bank USA, N.A. | 5,453,451 | (4,122,652 | ) | 1,330,799 | (1,330,799 | ) | — | |||||||||||||
JPMorgan Chase Bank, N.A. | 7,885,943 | (6,296,197 | ) | 1,589,746 | (1,586,654 | ) | 3,092 | |||||||||||||
JPMorgan Securities LLC | 131,575 | (27,896 | ) | 103,679 | — | 103,679 | ||||||||||||||
Morgan Stanley & Co. International PLC | 61,700,969 | (33,041,531 | ) | 28,659,438 | (25,176,250 | ) | 3,483,188 | |||||||||||||
See Notes to Financial Statements.
| PGIM Global Total Return Fund | 163 |
Schedule of Investments(continued)
as of October 31, 2019
Counterparty | Gross Amounts of Recognized Assets(1) | Gross Amounts of Recognized Liabilities(1) | Net Amounts of Recognized Assets/ (Liabilities) | Collateral Pledged/ (Received)(2) | Net Amount | |||||||||||||||
The Toronto-Dominion Bank | $ | 253,682 | $ | (1,369,297 | ) | $ | (1,115,615 | ) | $ | 1,115,615 | $ | — | ||||||||
UBS AG | 507,674 | (2,359,286 | ) | (1,851,612 | ) | 1,428,351 | (423,261 | ) | ||||||||||||
|
|
|
|
|
|
|
|
|
| |||||||||||
| $ | 205,000,282 | $ | (163,816,389 | ) | $ | 41,183,893 | $ | (36,303,159 | ) | $ | 4,880,734 | |||||||||
|
|
|
|
|
|
|
|
|
| |||||||||||
| (1) | Includes unrealized appreciation/(depreciation) on swaps and forwards, premiums paid/(received) on swap agreements and market value of purchased and written options, as represented on the Statement of Assets and Liabilities. |
| (2) | Collateral amount disclosed by the Fund is limited to the market value of financial instruments/transactions and the Fund’s OTC derivative exposure by counterparty. |
See Notes to Financial Statements.
| 164 |
Statement of Assets and Liabilities
as of October 31, 2019
Assets | ||||
Investments at value, including securities on loan of $75,921,590: | ||||
Unaffiliated investments (cost $2,711,755,478) | $ | 2,681,454,155 | ||
Affiliated investments (cost $113,558,342) | 113,569,362 | |||
Cash | 3,575,104 | |||
Foreign currency, at value (cost $1,427,254) | 1,433,196 | |||
Cash segregated for counterparty—OTC | 1,127,000 | |||
Unrealized appreciation on OTC forward foreign currency exchange contracts | 57,034,666 | |||
Unrealized appreciation on OTC swap agreements | 33,656,063 | |||
Dividends and interest receivable | 25,813,161 | |||
Receivable for Fund shares sold | 21,368,745 | |||
Unrealized appreciation on OTC cross currency exchange contracts | 15,432,023 | |||
Due from broker—variation margin futures | 8,819,553 | |||
Premiums paid for OTC swap agreements | 8,180,865 | |||
Receivable for investments sold | 3,106,529 | |||
Deposit with broker for centrally cleared/exchange-traded derivatives | 221,000 | |||
Tax reclaim receivable | 11,013 | |||
Prepaid expenses | 15,336 | |||
|
| |||
Total Assets | 2,974,817,771 | |||
|
| |||
Liabilities | ||||
Payable to broker for collateral for securities on loan | 78,288,204 | |||
Options written outstanding, at value (proceeds received $149,582,083) | 74,312,430 | |||
Payable for investments purchased | 65,725,945 | |||
Unrealized depreciation on OTC forward foreign currency exchange contracts | 51,444,765 | |||
Premiums received for OTC swap agreements | 14,954,158 | |||
Unrealized depreciation on OTC swap agreements | 13,200,168 | |||
Unrealized depreciation on OTC cross currency exchange contracts | 9,904,868 | |||
Payable for Fund shares reacquired | 8,831,631 | |||
Due to broker—variation margin swaps | 4,812,428 | |||
Management fee payable | 976,952 | |||
Accrued expenses and other liabilities | 639,799 | |||
Dividends payable | 382,422 | |||
Distribution fee payable | 76,463 | |||
Affiliated transfer agent fee payable | 33,527 | |||
Affiliated shareholder servicing fees payable | 1 | |||
|
| |||
Total Liabilities | 323,583,761 | |||
|
| |||
Net Assets | $ | 2,651,234,010 | ||
|
| |||
Net assets were comprised of: | ||||
Common stock, at par | $ | 3,720,175 | ||
Paid-in capital in excess of par | 2,516,894,630 | |||
Total distributable earnings (loss) | 130,619,205 | |||
|
| |||
Net assets, October 31, 2019 | $ | 2,651,234,010 | ||
|
| |||
See Notes to Financial Statements.
| PGIM Global Total Return Fund | 165 |
Statement of Assets and Liabilities
as of October 31, 2019
Class A | ||||
Net asset value and redemption price per share, | $ | 7.07 | ||
Maximum sales charge (3.25% of offering price) | 0.24 | |||
|
| |||
Maximum offering price to public | $ | 7.31 | ||
|
| |||
Class B | ||||
Net asset value, offering price and redemption price per share, | $ | 7.07 | ||
|
| |||
Class C | ||||
Net asset value, offering price and redemption price per share, | $ | 7.06 | ||
|
| |||
Class Z | ||||
Net asset value, offering price and redemption price per share, | $ | 7.11 | ||
|
| |||
Class R2 | ||||
Net asset value, offering price and redemption price per share, | $ | 7.16 | ||
|
| |||
Class R4 | ||||
Net asset value, offering price and redemption price per share, | $ | 7.16 | ||
|
| |||
Class R6 | ||||
Net asset value, offering price and redemption price per share, | $ | 7.16 | ||
|
| |||
See Notes to Financial Statements.
| 166 |
Statement of Operations
Year Ended October 31, 2019
Net Investment Income (Loss) |
| |||
Income | ||||
Interest income (net of $28,327 foreign withholding tax) | $ | 64,798,587 | ||
Affiliated dividend income | 903,940 | |||
Unaffiliated dividend income (net of $363 foreign withholding tax) | 214,464 | |||
Income from securities lending, net (including affiliated income of $67,639) | 172,341 | |||
|
| |||
Total income | 66,089,332 | |||
|
| |||
Expenses | ||||
Management fee | 10,195,093 | |||
Distribution fee(a) | 830,589 | |||
Shareholder servicing fees (including affiliated expense of $8)(a) | 882 | |||
Transfer agent’s fees and expenses (including affiliated expense of $169,435)(a) | 1,526,281 | |||
Custodian and accounting fees | 470,289 | |||
Shareholders’ reports | 368,864 | |||
Registration fees(a) | 161,797 | |||
SEC registration fees | 70,639 | |||
Audit fee | 67,991 | |||
Directors’ fees | 45,684 | |||
Legal fees and expenses | 28,824 | |||
Miscellaneous | 49,663 | |||
|
| |||
Total expenses | 13,816,596 | |||
Less: Fee waiver and/or expense reimbursement(a) | (768,107 | ) | ||
|
| |||
Net expenses | 13,048,489 | |||
|
| |||
Net investment income (loss) | 53,040,843 | |||
|
| |||
Realized And Unrealized Gain (Loss) On Investment And Foreign Currency Transactions | ||||
Net realized gain (loss) on: | ||||
Investment transactions (including affiliated of $(595)) | (31,376,373 | ) | ||
Futures transactions | 79,711,921 | |||
Forward rate agreement transactions | (313,027 | ) | ||
Forward and cross currency contract transactions | 17,609,494 | |||
Options written transactions | 27,040,448 | |||
Swap agreement transactions | 21,155,356 | |||
Foreign currency transactions | (7,370,081 | ) | ||
|
| |||
| 106,457,738 | ||||
|
| |||
Net change in unrealized appreciation (depreciation) on: | ||||
Investments (including affiliated of $9,339) | 45,300,882 | |||
Futures | 14,760,650 | |||
Forward rate agreements | 271,942 | |||
Forward and cross currency contracts | (11,435,250 | ) | ||
Options written | 76,594,361 | |||
Swap agreements | (732,663 | ) | ||
Foreign currencies | 319,291 | |||
|
| |||
| 125,079,213 | ||||
|
| |||
Net gain (loss) on investment and foreign currency transactions | 231,536,951 | |||
|
| |||
Net Increase (Decrease) In Net Assets Resulting From Operations | $ | 284,577,794 | ||
|
| |||
See Notes to Financial Statements.
| PGIM Global Total Return Fund | 167 |
Statement of Operations
Year Ended October 31, 2019
| (a) | Class specific expenses and waivers were as follows: |
| Class A | Class B | Class C | Class Z | Class R2 | Class R4 | Class R6 | ||||||||||||||||||||||
Distribution fee | 471,587 | 15,597 | 343,209 | — | 196 | — | — | |||||||||||||||||||||
Shareholder servicing fees | — | — | — | — | 78 | 804 | — | |||||||||||||||||||||
Transfer agent’s fees and expenses | 386,366 | 4,829 | 36,442 | 1,076,809 | 314 | 1,341 | 20,180 | |||||||||||||||||||||
Registration fees | 16,272 | 9,336 | 9,683 | 44,137 | 14,502 | 14,502 | 53,365 | |||||||||||||||||||||
Fee waiver and/or expense reimbursement | (260,712 | ) | (13,002 | ) | (20,469 | ) | (444,808 | ) | (14,679 | ) | (14,437 | ) | — | |||||||||||||||
See Notes to Financial Statements.
| 168 |
Statements of Changes in Net Assets
| Year Ended October 31, | ||||||||
| 2019 | 2018 | |||||||
Increase (Decrease) in Net Assets | ||||||||
Operations | ||||||||
Net investment income (loss) | $ | 53,040,843 | $ | 35,170,559 | ||||
Net realized gain (loss) on investment and foreign currency transactions | 106,457,738 | (14,370,524 | ) | |||||
Net change in unrealized appreciation (depreciation) on investments and foreign currencies | 125,079,213 | (78,618,439 | ) | |||||
|
|
|
| |||||
Net increase (decrease) in net assets resulting from operations | 284,577,794 | (57,818,404 | ) | |||||
|
|
|
| |||||
Dividends and Distributions | ||||||||
Distributions from distributable earnings | ||||||||
Class A | (6,499,137 | ) | (6,137,953 | ) | ||||
Class B | (42,631 | ) | (71,940 | ) | ||||
Class C | (927,851 | ) | (917,726 | ) | ||||
Class Z | (32,622,407 | ) | (22,966,009 | ) | ||||
Class R2 | (2,460 | ) | (255 | ) | ||||
Class R4 | (27,693 | ) | (1,015 | ) | ||||
Class R6 | (34,603,598 | ) | (22,571,586 | ) | ||||
|
|
|
| |||||
| (74,725,777 | ) | (52,666,484 | ) | |||||
|
|
|
| |||||
Fund share transactions (Net of share conversions) | ||||||||
Net proceeds from shares sold | 1,278,611,890 | 1,290,833,238 | ||||||
Net asset value of shares issued in reinvestment of dividends and distributions | 70,499,011 | 48,731,606 | ||||||
Cost of shares reacquired | (656,622,268 | ) | (540,533,576 | ) | ||||
|
|
|
| |||||
Net increase (decrease) in net assets from Fund share transactions | 692,488,633 | 799,031,268 | ||||||
|
|
|
| |||||
Total increase (decrease) | 902,340,650 | 688,546,380 | ||||||
Net Assets: | ||||||||
Beginning of year | 1,748,893,360 | 1,060,346,980 | ||||||
|
|
|
| |||||
End of year | $ | 2,651,234,010 | $ | 1,748,893,360 | ||||
|
|
|
| |||||
See Notes to Financial Statements.
| PGIM Global Total Return Fund | 169 |
Notes to Financial Statements
Prudential Global Total Return Fund, Inc. (the “Company”) is registered under the Investment Company Act of 1940, as amended (“1940 Act”), as an open-end management investment company and currently consists of two funds: PGIM Global Total Return (USD Hedged) Fund and PGIM Global Total Return Fund, each of which are non-diversified funds for purposes of the 1940 Act. These financial statements relate only to the PGIM Global Total Return Fund (the “Fund”).
The investment objective of the Fund is to seek total return, made up of current income and capital appreciation.
1. Accounting Policies
The Fund follows the investment company accounting and reporting guidance of the Financial Accounting Standards Board (“FASB”) Accounting Standard Codification (“ASC”) Topic 946 Financial Services —Investment Companies. The following accounting policies conform to U.S. generally accepted accounting principles. The Fund consistently follows such policies in the preparation of its financial statements.
Securities Valuation:The Fund holds securities and other assets and liabilities that are fair valued at the close of each day (generally, 4:00 PM Eastern time) the New York Stock Exchange (“NYSE”) is open for trading. Fair value is the price that would be received to sell an asset or paid to transfer a liability in an orderly transaction between market participants on the measurement date. The Company’s Board of Directors (the “Board”) has adopted valuation procedures for security valuation under which fair valuation responsibilities have been delegated to PGIM Investments LLC (“PGIM Investments” or the “Manager”). Pursuant to the Board’s delegation, the Manager has established a Valuation Committee responsible for supervising the fair valuation of portfolio securities and other assets and liabilities. The valuation procedures permit the Fund to utilize independent pricing vendor services, quotations from market makers, and alternative valuation methods when market quotations are either not readily available or not deemed representative of fair value. A record of the Valuation Committee’s actions is subject to the Board’s review, approval, and ratification at its next regularly scheduled quarterly meeting.
For the fiscal reporting year-end, securities and other assets and liabilities were fair valued at the close of the last U.S. business day. Trading in certain foreign securities may occur when the NYSE is closed (including weekends and holidays). Because such foreign securities trade in markets that are open on weekends and U.S. holidays, the values of some of the Company’s foreign investments may change on days when investors cannot purchase or redeem Fund shares.
| 170 |
Various inputs determine how the Fund’s investments are valued, all of which are categorized according to the three broad levels (Level 1, 2, or 3) detailed in the Schedule of Investments and referred to herein as the “fair value hierarchy” in accordance with FASB ASC Topic 820 - Fair Value Measurements and Disclosures.
Derivative instruments, such as futures or options, that are traded on a national securities exchange are valued at the last sale price as of the close of trading on the applicable exchange where the security principally trades. Securities traded via NASDAQ are valued at the NASDAQ official closing price. To the extent these securities are valued at the last sale price or NASDAQ official closing price, they are classified as Level 1 in the fair value hierarchy. In the event that no sale or official closing price on valuation date exists, these securities are generally valued at the mean between the last reported bid and ask prices, or at the last bid price in the absence of an ask price. These securities are classified as Level 2 in the fair value hierarchy.
Investments in open-end, non-exchange-traded mutual funds are valued at their net asset values as of the close of the NYSE on the date of valuation. These securities are classified as Level 1 in the fair value hierarchy since they may be purchased or sold at their net asset values on the date of valuation.
Fixed income securities traded in the OTC market are generally classified as Level 2 in the fair value hierarchy. Such fixed income securities are typically valued using the market approach which generally involves obtaining data from an approved independent third-party vendor source. The Fund utilizes the market approach as the primary method to value securities when market prices of identical or comparable instruments are available. The third-party vendors’ valuation techniques used to derive the evaluated bid price are based on evaluating observable inputs, including but not limited to, yield curves, yield spreads, credit ratings, deal terms, tranche level attributes, default rates, cash flows, prepayment speeds, broker/dealer quotations and reported trades. Certain Level 3 securities are also valued using the market approach when obtaining a single broker quote or when utilizing transaction prices for identical securities that have been used in excess of five business days. During the reporting period, there were no changes to report with respect to the valuation approach and/or valuation techniques discussed above.
Bank loans are generally valued at prices provided by approved independent pricing vendors. The pricing vendors utilize broker/dealer quotations and provide prices based on the average of such quotations. Bank loans valued using such vendor prices are generally classified as Level 2 in the fair value hierarchy. Bank loans valued based on a single broker quote or at the original transaction price in excess of five business days are classified as Level 3 in the fair value hierarchy.
OTC and centrally cleared derivative instruments are generally classified as Level 2 in the fair value hierarchy. Such derivative instruments are typically valued using the market approach and/or income approach which generally involves obtaining data from an approved independent third-party vendor source. The Fund utilizes the market approach
| PGIM Global Total Return Fund | 171 |
Notes to Financial Statements(continued)
when quoted prices in broker-dealer markets are available but also includes consideration of alternative valuation approaches, including the income approach. In the absence of reliable market quotations, the income approach is typically utilized for purposes of valuing derivatives such as interest rate swaps based on a discounted cash flow analysis whereby the value of the instrument is equal to the present value of its future cash inflows or outflows. Such analysis includes projecting future cash flows and determining the discount rate (including the present value factors that affect the discount rate) used to discount the future cash flows. In addition, the third-party vendors’ valuation techniques used to derive the evaluated derivative price is based on evaluating observable inputs, including but not limited to, underlying asset prices, indices, spreads, interest rates and exchange rates. Certain derivatives may be classified as Level 3 when valued using the market approach by obtaining a single broker quote or when utilizing unobservable inputs in the income approach. During the reporting period, there were no changes to report with respect to the valuation approach and/or valuation techniques discussed above.
Securities and other assets that cannot be priced according to the methods described above are valued based on pricing methodologies approved by the Board. In the event that unobservable inputs are used when determining such valuations, the securities will be classified as Level 3 in the fair value hierarchy.
When determining the fair value of securities, some of the factors influencing the valuation include: the nature of any restrictions on disposition of the securities; assessment of the general liquidity of the securities; the issuer’s financial condition and the markets in which it does business; the cost of the investment; the size of the holding and the capitalization of the issuer; the prices of any recent transactions or bids/offers for such securities or any comparable securities; any available analyst media or other reports or information deemed reliable by the Manager regarding the issuer or the markets or industry in which it operates. Using fair value to price securities may result in a value that is different from a security’s most recent closing price and from the price used by other unaffiliated mutual funds to calculate their net asset values.
Illiquid Securities:Pursuant to Rule 22e-4 under the 1940 Act, the Fund has adopted a Board approved Liquidity Risk Management Program (“LRMP”) that requires, among other things, that the Fund limit its illiquid investments that are assets to no more than 15% of net assets. Illiquid securities are those that, because of the absence of a readily available market or due to legal or contractual restrictions on resale, may not reasonably be expected to be sold or disposed of in current market conditions in seven calendar days or less without the sale or disposition significantly changing the market value of the investment. The Fund may find it difficult to sell illiquid securities at the time considered most advantageous by its subadviser and may incur transaction costs that would not be incurred in the sale of securities that were freely marketable.
| 172 |
Restricted Securities:Securities acquired in unregistered, private sales from the issuing company or from an affiliate of the issuer are considered restricted as to disposition under federal securities law (“restricted securities”). Such restricted securities are valued pursuant to the valuation procedures noted above. Restricted securities that would otherwise be considered illiquid investments pursuant to the Fund’s LRMP because of legal restrictions on resale to the general public may be traded among qualified institutional buyers under Rule 144A of the Securities Act of 1933. Therefore, these Rule 144A securities, as well as commercial paper that is sold in private placements under Section 4(2) of the Securities Act of 1933, may be classified higher than “illiquid” under the LRMP (i.e. “moderately liquid” or “less liquid” investments). However, the liquidity of the Fund’s investments in restricted securities could be impaired if trading does not develop or declines.
Connecticut Avenue Securities (CAS) and Structured Agency Credit Risk (STACR):The Fund purchased government controlled Fannie Mae and Freddie Mac securities that transfer most of the cost of defaults to private investors including the Fund. These are insurance-like products that are called CAS by Fannie Mae and STACR securities by Freddie Mac. Payments on the securities are based primarily on the performance of a reference pool of underlying mortgages. With such securities, the Fund could lose some or all of its principal if the underlying mortgages experience credit defaults.
Foreign Currency Translation:The books and records of the Fund are maintained in U.S. dollars. Foreign currency amounts are translated into U.S. dollars on the following basis:
(i) market value of investment securities, other assets and liabilities—at the current rates of exchange;
(ii) purchases and sales of investment securities, income and expenses—at the rates of exchange prevailing on the respective dates of such transactions.
Although the net assets of the Fund are presented at the foreign exchange rates and market values at the close of the period, the Fund does not generally isolate that portion of the results of operations arising as a result of changes in the foreign exchange rates from the fluctuations arising from changes in the market prices of long-term portfolio securities held at the end of the period. Similarly, the Fund does not isolate the effect of changes in foreign exchange rates from the fluctuations arising from changes in the market prices of long-term portfolio securities sold during the period. Accordingly, holding period realized foreign currency gains (losses) are included in the reported net realized gains (losses) on investment transactions. Notwithstanding the above, the Fund does isolate the effect of fluctuations in foreign currency exchange rates when determining the gain (loss) upon the sale or maturity of foreign currency denominated debt obligations; such amounts are included in net realized gains (losses) on foreign currency transactions.
Additionally, net realized gains (losses) on foreign currency transactions represent net foreign exchange gains (losses) from the disposition of holdings of foreign currencies, currency gains (losses) realized between the trade and settlement dates on forward
| PGIM Global Total Return Fund | 173 |
Notes to Financial Statements(continued)
currency transactions, and the difference between the amounts of interest, dividends and foreign withholding taxes recorded on the Company’s books and the U.S. dollar equivalent amounts actually received or paid. Net unrealized currency gains (losses) arise from valuing foreign currency denominated assets and liabilities (other than investments) at period end exchange rates.
Forward and Cross Currency Contracts:A forward currency contract is a commitment to purchase or sell a foreign currency at a future date at a negotiated forward rate. The Fund enters into forward currency contracts, as defined in the prospectus, in order to hedge its exposure to changes in foreign currency exchange rates on its foreign portfolio holdings or on specific receivables and payables denominated in a foreign currency and to gain exposure to certain currencies. The contracts are valued daily at current forward exchange rates and any unrealized gain (loss) is included in net unrealized appreciation (depreciation) on forward and cross currency contracts. Gain (loss) is realized on the settlement date of the contract equal to the difference between the settlement value of the original and negotiated forward contracts. This gain (loss), if any, is included in net realized gain (loss) on forward and cross currency contract transactions. Risks may arise upon entering into these contracts from the potential inability of the counterparties to meet the terms of their contracts. Forward currency contracts involve risks from currency exchange rate and credit risk in excess of the amounts reflected on the Statement of Assets and Liabilities. The Fund’s maximum risk of loss from counterparty credit risk is the net value of the cash flows to be received from the counterparty at the end of the contract’s life. A cross currency contract is a forward contract where a specified amount of one foreign currency will be exchanged for a specified amount of another foreign currency.
Options:The Fund purchased or wrote options in order to hedge against adverse market movements or fluctuations in value caused by changes in prevailing interest rates, value of equities or foreign currency exchange rates with respect to securities or financial instruments which the Fund currently owns or intends to purchase. The Fund may also use options to gain additional market exposure. The Fund’s principal reason for writing options is to realize, through receipt of premiums, a greater current return than would be realized on the underlying security alone. When the Fund purchases an option, it pays a premium and an amount equal to that premium is recorded as an asset. When the Fund writes an option, it receives a premium and an amount equal to that premium is recorded as a liability. The asset or liability is adjusted daily to reflect the current market value of the option. If an option expires unexercised, the Fund realizes a gain (loss) to the extent of the premium received or paid. If an option is exercised, the premium received or paid is recorded as an adjustment to the proceeds from the sale or the cost of the purchase in determining whether the Fund has realized a gain (loss). The difference between the premium and the amount received or paid at the closing of a purchase or sale transaction is also treated as a realized gain (loss). Gain (loss) on purchased options is included in net realized gain (loss) on investment transactions. Gain (loss) on written options is presented separately as net realized gain (loss) on options written transactions.
| 174 |
The Fund, as writer of an option, may have no control over whether the underlying securities or financial instruments may be sold (called) or purchased (put). As a result, the Fund bears the market risk of an unfavorable change in the price of the security or financial instrument underlying the written option. The Fund, as purchaser of an OTC option, bears the risk of the potential inability of the counterparties to meet the terms of their contracts. With exchange-traded options contracts, there is minimal counterparty credit risk to the Fund since the exchanges’ clearinghouse acts as counterparty to all exchange-traded options and guarantees the options contracts against default.
When the Fund writes an option on a swap, an amount equal to any premium received by the Fund is recorded as a liability and is subsequently adjusted to the current market value of the written option on the swap. If a call option on a swap is exercised, the Fund becomes obligated to pay a fixed interest rate (noted as the strike price) and receive a variable interest rate on a notional amount. If a put option on a swap is exercised, the Fund becomes obligated to pay a variable interest rate and receive a fixed interest rate (noted as the strike price) on a notional amount. Premiums received from writing options on swaps that expire or are exercised are treated as realized gains upon the expiration or exercise of such options on swaps. The risk associated with writing put and call options on swaps is that the Fund will be obligated to be party to a swap agreement if an option on a swap is exercised.
Financial Futures Contracts:A financial futures contract is an agreement to purchase (long) or sell (short) an agreed amount of securities at a set price for delivery on a future date. Upon entering into a financial futures contract, the Fund is required to pledge to the broker an amount of cash and/or other assets equal to a certain percentage of the contract amount. This amount is known as the “initial margin.” Subsequent payments, known as “variation margin,” are made or received by the Fund each day, depending on the daily fluctuations in the value of the underlying security. Such variation margin is recorded for financial statement purposes on a daily basis as unrealized gain (loss). When the contract expires or is closed, the gain (loss) is realized and is presented in the Statement of Operations as net realized gain (loss) on futures transactions.
The Fund invested in financial futures contracts in order to hedge its existing portfolio securities, or securities the Fund intends to purchase, against fluctuations in value caused by changes in prevailing interest rates. Should interest rates move unexpectedly, the Fund may not achieve the anticipated benefits of the financial futures contracts and may realize a loss. The use of futures transactions involves the risk of imperfect correlation in movements in the price of futures contracts, interest rates and the underlying hedged assets. Since futures contracts are exchange-traded, there is minimal counterparty credit risk to the Fund since the exchanges’ clearinghouse acts as counterparty to all exchange-traded futures and guarantees the futures contracts against default.
| PGIM Global Total Return Fund | 175 |
Notes to Financial Statements(continued)
Bank Loans:The Fund invested in bank loans. Bank loans include fixed and floating rate loans that are privately negotiated between a corporate borrower and one or more financial institutions, including, but not limited to, term loans, revolvers, and other instruments issued in the bank loan market. The Fund may acquire interests in loans directly (by way of assignment from the selling institution) or indirectly (by way of the purchase of a participation interest from the selling institution). Under a bank loan assignment, the Fund generally will succeed to all the rights and obligations of an assigning lending institution and becomes a lender under the loan agreement with the relevant borrower in connection with that loan. Under a bank loan participation, the Fund generally will have a contractual relationship only with the lender, not with the relevant borrower. As a result, the Fund generally will have the right to receive payments of principal, interest, and any fees to which it is entitled only from the lender selling the participation and only upon receipt by the lender of the payments from the relevant borrower. The Fund may not directly benefit from the collateral supporting the debt obligation in which it has purchased the participation. As a result, the Fund will assume the credit risk of both the borrower and the institution selling the participation to the Fund.
Forward Rate Agreements:Forward rate agreements represent an agreement between counterparties to exchange cash flows based on the difference between two interest rates, applied to a notional principal amount on a fixed future date. The Fund entered into forward rate agreements to gain yield exposure based on anticipated market conditions at the specified termination date of the agreement.
Swap Agreements:The Fund entered into certain types of swap agreements detailed in the disclosures below. A swap agreement is an agreement to exchange the return generated by one instrument for the return generated by another instrument. Swap agreements are negotiated in the OTC market and may be executed either directly with a counterparty (“OTC-traded”) or through a central clearing facility, such as a registered exchange. Swap agreements are valued daily at current market value and any change in value is included in the net unrealized appreciation (depreciation) on swap agreements. Centrally cleared swaps pay or receive an amount known as “variation margin”, based on daily changes in the valuation of the swap contract. Any upfront premiums paid and received are shown as swap premiums paid and swap premiums received in the Statement of Assets and Liabilities. Risk of loss may exceed amounts recognized on the Statement of Assets and Liabilities. Swap agreements outstanding at period end, if any, are listed on the Schedule of Investments.
Interest Rate Swaps:Interest rate swaps represent an agreement between counterparties to exchange cash flows based on the difference between two interest rates, applied to a notional principal amount for a specified period. The Fund is subject to interest rate risk exposure in the normal course of pursuing its investment objective. The Fund used interest rate swaps to maintain its ability to generate steady cash flow by receiving a stream of fixed
| 176 |
rate payments or to increase exposure to prevailing market rates by receiving floating rate payments. The Fund’s maximum risk of loss from counterparty credit risk is the discounted net present value of the cash flows to be received from the counterparty over the contract’s remaining life.
Inflation Swaps:The Fund entered into inflation swap agreements to protect against fluctuations in inflation rates. Inflation swaps are characterized by one party paying a fixed rate in exchange for a floating rate that is derived from an inflation index, such as the Consumer Price Index or UK Retail Price Index. Inflation swaps subject the Fund to interest rate risk.
Credit Default Swaps (“CDS”):CDS involve one party (the protection buyer) making a stream of payments to another party (the protection seller) in exchange for the right to receive a specified payment in the event of a default or as a result of a default (collectively a “credit event”) for the referenced entity (typically corporate issues or sovereign issues of an emerging country) on its obligation; or in the event of a write-down, principal shortfall, interest shortfall or default of all or part of the referenced entities comprising a credit index.
The Fund is subject to credit risk in the normal course of pursuing its investment objectives, and as such, has entered into CDS contracts to provide a measure of protection against defaults or to take an active long or short position with respect to the likelihood of a particular issuer’s default or the reference entity’s credit soundness. CDS contracts generally trade based on a spread which represents the cost a protection buyer has to pay the protection seller. The protection buyer is said to be short the credit as the value of the contract rises the more the credit deteriorates. The value of the CDS contract increases for the protection buyer if the spread increases. The Fund’s maximum risk of loss from counterparty credit risk for purchased CDS is the inability of the counterparty to honor the contract up to the notional value due to a credit event.
As a seller of protection on credit default swap agreements, the Fund generally receives an agreed upon payment from the buyer of protection throughout the term of the swap, provided no credit event occurs. As the seller, the Fund effectively increases its investment risk because, in addition to its total net assets, the Fund may be subject to investment exposure on the notional amount of the swap.
The maximum amount of the payment that the Fund, as a seller of protection, could be required to make under a credit default swap agreement would be equal to the notional amount of the underlying security or index contract as a result of a credit event. This potential amount will be partially offset by any recovery values of the respective referenced obligations, or net amounts received from the settlement of buy protection credit default swap agreements which the Fund entered into for the same referenced entity or index. As a buyer of protection, the Fund generally receives an amount up to the notional value of the swap if a credit event occurs.
| PGIM Global Total Return Fund | 177 |
Notes to Financial Statements(continued)
Implied credit spreads, represented in absolute terms, utilized in determining the market value of credit default swap agreements where the Fund is the seller of protection as of period end are disclosed in the footnotes to the Schedule of Investments, if applicable. These spreads serve as indicators of the current status of the payment/performance risk and represent the likelihood of default risk for the credit derivative. The implied credit spread of a particular referenced entity reflects the cost of buying/selling protection and may include upfront payments required to enter into the agreement. Wider credit spreads and increased market value in absolute terms, when compared to the notional amount of the swap, represent a deterioration of the referenced entity’s credit soundness and a greater likelihood of risk of default or other credit event occurring as defined under the terms of the agreement.
Currency Swaps:The Fund entered into currency swap agreements primarily to gain yield exposure on foreign bonds. Currency swap agreements involve two parties exchanging two different currencies with an agreement to reverse the exchange at a later date at specified exchange rates.
Master Netting Arrangements:The Company, on behalf of the Fund, is subject to various Master Agreements, or netting arrangements, with select counterparties. These are agreements which a subadviser may have negotiated and entered into on behalf of all or a portion of the Fund. A master netting arrangement between the Fund and the counterparty permits the Fund to offset amounts payable by the Fund to the same counterparty against amounts to be received; and by the receipt of collateral from the counterparty by the Fund to cover the Fund’s exposure to the counterparty. However, there is no assurance that such mitigating factors are easily enforceable. In addition to master netting arrangements, the right to set-off exists when all the conditions are met such that each of the parties owes the other determinable amounts, the reporting party has the right to set-off the amount owed with the amount owed by the other party, the reporting party intends to set-off and the right of set-off is enforceable by law. During the reporting period, there was no intention to settle on a net basis and all amounts are presented on a gross basis on the Statement of Assets and Liabilities.
The Company, on behalf of the Fund, is a party to International Swaps and Derivatives Association, Inc. (“ISDA”) Master Agreements with certain counterparties that govern OTC derivative and foreign exchange contracts entered into from time to time. The Master Agreements may contain provisions regarding, among other things, the parties’ general obligations, representations, agreements, collateral requirements, events of default and early termination. With respect to certain counterparties, in accordance with the terms of the Master Agreements, collateral posted to the Fund is held in a segregated account by the Fund’s custodian and with respect to those amounts which can be sold or re-pledged, is presented in the Schedule of Investments. Collateral pledged by the Fund is segregated by
| 178 |
the Fund’s custodian and identified in the Schedule of Investments. Collateral can be in the form of cash or debt securities issued by the U.S. Government or related agencies or other securities as agreed to by the Fund and the applicable counterparty. Collateral requirements are determined based on the Fund’s net position with each counterparty. Termination events applicable to the Fund may occur upon a decline in the Fund’s net assets below a specified threshold over a certain period of time. Termination events applicable to counterparties may occur upon a decline in the counterparty’s long-term and short-term credit ratings below a specified level. In each case, upon occurrence, the other party may elect to terminate early and cause settlement of all derivative and foreign exchange contracts outstanding, including the payment of any losses and costs resulting from such early termination, as reasonably determined by the terminating party. Any decision by one or more of the Fund’s counterparties to elect early termination could impact the Fund’s future derivative activity.
In addition to each instrument’s primary underlying risk exposure (e.g. interest rate, credit, equity or foreign exchange, etc.), swap agreements involve, to varying degrees, elements of credit, market and documentation risk. Such risks involve the possibility that no liquid market for these agreements will exist, the counterparty to the agreement may default on its obligation to perform or disagree on the contractual terms of the agreement, and changes in net interest rates will be unfavorable. In connection with these agreements, securities in the portfolio may be identified or received as collateral from the counterparty in accordance with the terms of the respective swap agreements to provide or receive assets of value and to serve as recourse in the event of default or bankruptcy/insolvency of either party. Such OTC derivative agreements include conditions which, when materialized, give the counterparty the right to cause an early termination of the transactions under those agreements. Any election by the counterparty for early termination of the contract(s) may impact the amounts reported on financial statements.
As of October 31, 2019, the Fund has not met conditions under such agreements which give the counterparty the right to call for an early termination.
Forward currency contracts, forward rate agreements, written options, short sales, swaps and financial futures contracts involve elements of both market and credit risk in excess of the amounts reflected on the Statement of Assets and Liabilities. Such risks may be mitigated by engaging in master netting arrangements.
Payment-In-Kind:The Fund invested in the open market or receive pursuant to debt restructuring, securities that pay-in-kind (PIK) the interest due on such debt instruments. The PIK interest, computed at the contractual rate specified, is added to the existing principal balance of the debt when issued bonds have same terms as the bond or recorded as a separate bond when terms are different from the existing debt, and is recorded as interest income.
Securities Lending:The Fund lends its portfolio securities to banks and broker-dealers. The loans are secured by collateral at least equal to the market value of the securities loaned. Collateral pledged by each borrower is invested in an affiliated money market fund and is
| PGIM Global Total Return Fund | 179 |
Notes to Financial Statements(continued)
marked to market daily, based on the previous day’s market value, such that the value of the collateral exceeds the value of the loaned securities. In the event of significant appreciation in value of securities on loan on the last business day of the reporting period, the financial statements may reflect a collateral value that is less than the market value of the loaned securities. Such shortfall is remedied as described above. Loans are subject to termination at the option of the borrower or the Fund. Upon termination of the loan, the borrower will return to the Fund securities identical to the loaned securities. Should the borrower of the securities fail financially, the Fund has the right to repurchase the securities in the open market using the collateral.
The Fund recognizes income, net of any rebate and securities lending agent fees, for lending its securities in the form of fees or interest on the investment of any cash received as collateral. The borrower receives all interest and dividends from the securities loaned and such payments are passed back to the lender in amounts equivalent thereto. The Fund also continues to recognize any unrealized gain (loss) in the market price of the securities loaned and on the change in the value of the collateral invested that may occur during the term of the loan. In addition, realized gain (loss) is recognized on changes in the value of the collateral invested upon liquidation of the collateral. Net earnings from securities lending are disclosed on the Statement of Operations as “Income from securities lending, net”.
Securities Transactions and Net Investment Income:Securities transactions are recorded on the trade date. Realized gains (losses) from investment and currency transactions are calculated on the specific identification method. Dividend income is recorded on the ex-date, or for certain foreign securities, when the Fund becomes aware of such dividends. Interest income, including amortization of premium and accretion of discount on debt securities, as required, is recorded on the accrual basis. Expenses are recorded on an accrual basis, which may require the use of certain estimates by management that may differ from actual. Net investment income or loss (other than class specific expenses and waivers, which are allocated as noted below) and unrealized and realized gains (losses) are allocated daily to each class of shares based upon the relative proportion of adjusted net assets of each class at the beginning of the day. Class specific expenses and waivers, where applicable, are charged to the respective share classes. Class specific expenses include distribution fees and distribution fee waivers, shareholder servicing fees, transfer agent’s fees and expenses, registration fees and fee waivers and/or expense reimbursements, as applicable.
Taxes:It is the Fund’s policy to continue to meet the requirements of the Internal Revenue Code applicable to regulated investment companies and to distribute all of its taxable net investment income and capital gains, if any, to its shareholders. Therefore, no federal
| 180 |
income tax provision is required. Withholding taxes on foreign dividends, interest and capital gains, if any, are recorded, net of reclaimable amounts, at the time the related income is earned.
Dividends and Distributions:The Fund expects to declare dividends of its net investment income daily and pay such dividends monthly. Distributions of net realized capital and currency gains, if any, are declared and paid at least annually. Dividends and distributions to shareholders, which are determined in accordance with federal income tax regulations and which may differ from generally accepted accounting principles, are recorded on the ex-date. Permanent book/tax differences relating to income and gain (loss) are reclassified between total distributable earnings (loss) and paid-in capital in excess of par, as appropriate.
Estimates:The preparation of financial statements requires management to make estimates and assumptions that affect the reported amounts and disclosures in the financial statements. Actual results could differ from those estimates.
2. Agreements
The Company, on behalf of the Fund, has a management agreement with the Manager. Pursuant to this agreement, the Manager has responsibility for all investment advisory services and supervises the subadviser’s performance of such services. In addition, under the management agreement, the Manager provides all of the administrative functions necessary for the organization, operation and management of the Fund. The Manager administers the corporate affairs of the Fund and, in connection therewith, furnishes the Fund with office facilities, together with those ordinary clerical and bookkeeping services which are not being furnished by the Fund’s custodian and the Fund’s transfer agent. The Manager is also responsible for the staffing and management of dedicated groups of legal, marketing, compliance and related personnel necessary for the operation of the Fund. The legal, marketing, compliance and related personnel are also responsible for the management and oversight of the various service providers to the Fund, including, but not limited to, the custodian, transfer agent, and accounting agent.
The Manager has entered into a subadvisory agreement with PGIM, Inc., which provides subadvisory services to the Fund through its PGIM Fixed Income unit. The subadvisory agreement provides that PGIM, Inc. will furnish investment advisory services in connection with the management of the Fund. In connection therewith, PGIM, Inc. is obligated to keep certain books and records of the Fund. The Manager pays for the services of PGIM, Inc., the cost of compensation of officers of the Fund, occupancy and certain clerical and bookkeeping costs of the Fund. The Fund bears all other costs and expenses.
The management fee paid to the Manager is accrued daily and payable monthly at an annual rate of 0.50% of the Fund’s average daily net assets up to $2 billion and 0.485% of such assets in excess of $2 billion. The effective management fee rate before any waivers and/or expense reimbursements was 0.50% for the year ended October 31, 2019.
| PGIM Global Total Return Fund | 181 |
Notes to Financial Statements(continued)
The Manager has contractually agreed, through February 28, 2021, to limit total annual operating expenses after fee waivers and/or expense reimbursements to 0.88% of average daily net assets for Class A shares, 1.63% of average daily net assets for Class B shares, 1.63% of average daily net assets for Class C shares, 0.63% of average daily net assets for Class Z shares 1.08% of average daily net assets for Class R2 shares, 0.83% of average daily net assets for Class R4 shares, and 0.58% of average daily net assets for Class R6 shares. This contractual waiver excludes interest, brokerage, taxes (such as income and foreign withholding taxes, stamp duty and deferred tax expenses), acquired fund fees and expenses, extraordinary expenses, and certain other Fund expenses such as dividend and interest expense and broker charges on short sales. Where applicable, the Manager agrees to waive management fees or shared operating expenses on any share class to the same extent that it waives similar expenses on any other share class and, in addition, total annual operating expenses for Class R6 shares will not exceed total annual operating expenses for Class Z shares. Fees and/or expenses waived and/or reimbursed by the Manager may be recouped by the Manager within the same fiscal year during which such waiver/reimbursement is made if such recoupment can be realized without exceeding the expense limit in effect at the time of the recoupment for that fiscal year.
The Company, on behalf of the Fund, has a distribution agreement with Prudential Investment Management Services LLC (“PIMS”), which acts as the distributor of the Class A, Class B, Class C, Class Z, Class R2, Class R4 and Class R6 shares of the Fund. The Fund compensates PIMS for distributing and servicing the Fund’s Class A, Class B, Class C and Class R2 shares, pursuant to the plans of distribution (the “Distribution Plans”), regardless of expenses actually incurred by PIMS. The distribution fees are accrued daily and payable monthly. No distribution or service fees are paid to PIMS as distributor of the Class Z, Class R4 or Class R6 shares of the Fund.
Pursuant to the Distribution Plans, the Fund compensates PIMS for distribution related activities at an annual rate of up to 0.25%, 1%, 1% and 0.25% of the average daily net assets of the Class A, Class B, Class C and Class R2 shares, respectively.
The Fund has adopted a Shareholder Services Plan with respect to Class R2 and Class R4 shares. Under the terms of the Shareholder Services Plan, Class R2 and Class R4 shares are authorized to pay to Prudential Mutual Fund Services LLC (“PMFS”), its affiliates or third-party service providers, as compensation for services rendered to the shareholders of such Class R2 or Class R4 shares, a shareholder service fee at an annual rate of 0.10% of the average daily net assets attributable to Class R2 and Class R4 shares. The shareholder service fee is accrued daily and paid monthly.
For the year ended October 31, 2019, PIMS received $459,834 in front-end sales charges resulting from sales of Class A shares. Additionally, for the year ended October 31, 2019,
| 182 |
PIMS received $669 and $4,068 in contingent deferred sales charges imposed upon redemptions by certain Class B and Class C shareholders, respectively. From these fees, PIMS paid such sales charges to broker-dealers, who in turn paid commissions to salespersons and incurred other distribution costs.
PGIM Investments, PGIM, Inc. and PIMS are indirect, wholly-owned subsidiaries of Prudential Financial, Inc. (“Prudential”).
3. Other Transactions with Affiliates
Prudential Mutual Fund Services LLC (“PMFS”), an affiliate of PGIM Investments and an indirect, wholly-owned subsidiary of Prudential, serves as the Company’s transfer agent. Transfer agent’s fees and expenses in the Statement of Operations include certain out-of-pocket expenses paid to non-affiliates, where applicable.
The Fund may invest its overnight sweep cash in the PGIM Core Ultra Short Bond Fund (the “Core Fund”), and its securities lending cash collateral in the PGIM Institutional Money Market Fund (the “Money Market Fund”), each a series of Prudential Investment Portfolios 2, registered under the 1940 Act and managed by PGIM Investments. Through the Fund’s investments in the mentioned underlying funds, PGIM Investments and/or its affiliates are paid fees or reimbursed for providing their services. In addition to the realized and unrealized gains on investments in the Core Fund and Money Market Fund, earnings from such investments are disclosed on the Statement of Operations as “Affiliated dividend income” and “Income from securities lending, net”, respectively.
The Fund may enter into certain securities purchase or sale transactions under Board approved Rule 17a-7 procedures. Rule 17a-7 is an exemptive rule under the 1940 Act, that subject to certain conditions, permits purchase and sale transactions among affiliated investment companies, or between an investment company and a person that is affiliated solely by reason of having a common (or affiliated) investment adviser, common directors, and/or common officers. Pursuant to the Rule 17a-7 procedures and consistent with guidance issued by the SEC, the Company’s Chief Compliance Officer (“CCO”) prepares a quarterly summary of all such transactions for submission to the Board, together with the CCO’s written representation that all such 17a-7 transactions were effected in accordance with the Company’s Rule 17a-7 procedures. For the year ended October 31, 2019, no 17a-7 transactions were entered into by the Fund.
4. Portfolio Securities
The aggregate cost of purchases and proceeds from sales of portfolio securities (excluding short-term investments and U.S. Government securities) for the year ended October 31, 2019, were $1,375,657,332 and $512,592,994, respectively.
| PGIM Global Total Return Fund | 183 |
Notes to Financial Statements(continued)
A summary of the cost of purchases and proceeds from sales of shares of affiliated investments for the year ended October 31, 2019, is presented as follows:
| Value, Beginning of Year | Cost of Purchases | Proceeds from Sales | Change in Unrealized Gain (Loss) | Realized Gain (Loss) | Value, End of Year | Shares, End of Year | Income | |||||||||||||||||||||||
PGIM Core Ultra Short Bond Fund* | ||||||||||||||||||||||||||||||
| $ | 4,343,643 | $ | 707,596,636 | $ | 676,793,955 | $ | — | $ | — | $ | 35,146,324 | 35,146,324 | $ | 903,940 | ||||||||||||||||
PGIM Institutional Money Market Fund* | ||||||||||||||||||||||||||||||
| 28,961,591 | 257,548,708 | 208,096,005 | 9,339 | (595 | ) | 78,423,038 | 78,407,357 | 67,639 | ** | |||||||||||||||||||||
|
|
|
|
|
|
|
|
|
|
|
|
|
| |||||||||||||||||
| $ | 33,305,234 | $ | 965,145,344 | $ | 884,889,960 | $ | 9,339 | $ | (595 | ) | $ | 113,569,362 | $ | 971,579 | ||||||||||||||||
|
|
|
|
|
|
|
|
|
|
|
|
|
| |||||||||||||||||
| * | The Funds did not have any capital gain distributions during the reporting period. |
| ** | This amount is included in “Income from securities lending, net” on the Statement of Operations. |
5. Distributions and Tax Information
Distributions to shareholders, which are determined in accordance with federal income tax regulations and which may differ from generally accepted accounting principles, are recorded on the ex-date.
For the year ended October 31, 2019, the tax character of dividends paid by the Fund was $74,725,777 of ordinary income. For the year ended October 31, 2018, the tax character of dividends paid by the Fund was $52,666,484 of ordinary income.
As of October 31, 2019, the accumulated undistributed earnings on a tax basis were $42,173,182 of ordinary income and $47,383,443 of long-term capital gains.
The United States federal income tax basis of the Fund’s investments and the net unrealized appreciation as of October 31, 2019 were as follows:
Tax Basis | Gross | Gross | Net Appreciation | |||
| $2,712,699,678 | $337,617,229 | $(296,172,227) | $41,445,002 |
The differences between book basis and tax basis is primarily attributable to deferred losses on wash sales, amortization of premiums, straddle loss deferrals, futures contracts, and other cost basis differences between financial and tax accounting.
The Fund utilized approximately $28,426,000 of its capital loss carryforward to offset net taxable gains realized in the fiscal year ended October 31, 2019.
| 184 |
The Manager has analyzed the Fund’s tax positions taken on federal, state and local income tax returns for all open tax years and has concluded that no provision for income tax is required in the Fund’s financial statements for the current reporting period. Since tax authorities can examine previously filed tax returns, the Fund’s U.S. federal and state tax returns for each of the four fiscal years up to the most recent fiscal year ended October 31, 2019 are subject to such review.
6. Capital and Ownership
The Fund offers Class A, Class B, Class C, Class Z, Class R2, Class R4 and Class R6 shares. Class A shares are sold with a maximum front-end sales charge of 3.25%. Investors who purchase $1 million or more (prior to July 15, 2019, $500,000 or more on or after July 15, 2019) of Class A shares and sell those shares within 12 months of purchase are subject to a contingent deferred sales charge (“CDSC”) of 1.00% on sales although these purchases are not subject to a front-end sales charge. The Class A CDSC is waived for certain retirement and/or benefit plans. A special exchange privilege is also available for shareholders who qualified to purchase Class A shares at net asset value. Class B shares are sold with a CDSC which declines from 5% to zero depending on the period of time the shares are held. Class B shares will automatically convert to Class A shares on a monthly basis approximately seven years after purchase. Class B shares are closed to new purchases. Class C shares are sold with a CDSC of 1% on sales made within 12 months of purchase. Class C shares will automatically convert to Class A shares on a monthly basis approximately 10 years after purchase. Class Z, Class R2, Class R4 and Class R6 shares are not subject to any sales or redemption charge and are available exclusively for sale to a limited group of investors.
Under certain circumstances, an exchange may be made from specified share classes of the Fund to one or more other share classes of the Fund as presented in the table of transactions in shares of common stock.
There are 2 billion shares of common stock, at $0.01 par value per share, authorized and divided into eight classes, designated Class A, Class B, Class C, Class Z, Class R2, Class R4, Class R6 and Class T, each of which consists of 200 million, 50 million, 320 million, 650 million, 90 million, 90 million, 475 million and 125 million authorized shares, respectively. The Fund currently does not have any Class T shares outstanding.
As of October 31, 2019, Prudential, through its affiliated entities, including affiliated funds (if applicable), owned 1,536 Class R2 shares and 1,543 Class R4 shares of the Fund. At reporting period end, five shareholders of record, each holding greater than 5% of the Fund, held 67% of the Fund’s outstanding shares.
| PGIM Global Total Return Fund | 185 |
Notes to Financial Statements(continued)
Transactions in shares of common stock were as follows:
Class A | Shares | Amount | ||||||
Year ended October 31, 2019: | ||||||||
Shares sold | 8,626,388 | $ | 58,869,961 | |||||
Shares issued in reinvestment of dividends and distributions | 869,100 | 5,881,730 | ||||||
Shares reacquired | (7,179,586 | ) | (47,765,362 | ) | ||||
|
|
|
| |||||
Net increase (decrease) in shares outstanding before conversion | 2,315,902 | 16,986,329 | ||||||
Shares issued upon conversion from other share class(es) | 894,338 | 6,049,809 | ||||||
Shares reacquired upon conversion into other share class(es) | (1,500,946 | ) | (10,144,021 | ) | ||||
|
|
|
| |||||
Net increase (decrease) in shares outstanding | 1,709,294 | $ | 12,892,117 | |||||
|
|
|
| |||||
Year ended October 31, 2018: | ||||||||
Shares sold | 10,889,230 | $ | 73,367,027 | |||||
Shares issued in reinvestment of dividends and distributions | 834,881 | 5,561,624 | ||||||
Shares reacquired | (6,967,781 | ) | (46,330,288 | ) | ||||
|
|
|
| |||||
Net increase (decrease) in shares outstanding before conversion | 4,756,330 | 32,598,363 | ||||||
Shares issued upon conversion from other share class(es) | 556,745 | 3,674,264 | ||||||
Shares reacquired upon conversion into other share class(es) | (2,290,951 | ) | (15,493,924 | ) | ||||
|
|
|
| |||||
Net increase (decrease) in shares outstanding | 3,022,124 | $ | 20,778,703 | |||||
|
|
|
| |||||
Class B | ||||||||
Year ended October 31, 2019: | ||||||||
Shares sold | 8,031 | $ | 55,457 | |||||
Shares issued in reinvestment of dividends and distributions | 5,057 | 33,909 | ||||||
Shares reacquired | (61,689 | ) | (413,717 | ) | ||||
|
|
|
| |||||
Net increase (decrease) in shares outstanding before conversion | (48,601 | ) | (324,351 | ) | ||||
Shares reacquired upon conversion into other share class(es) | (134,821 | ) | (894,677 | ) | ||||
|
|
|
| |||||
Net increase (decrease) in shares outstanding | (183,422 | ) | $ | (1,219,028 | ) | |||
|
|
|
| |||||
Year ended October 31, 2018: | ||||||||
Shares sold | 37,578 | $ | 257,275 | |||||
Shares issued in reinvestment of dividends and distributions | 8,772 | 58,565 | ||||||
Shares reacquired | (85,878 | ) | (571,206 | ) | ||||
|
|
|
| |||||
Net increase (decrease) in shares outstanding before conversion | (39,528 | ) | (255,366 | ) | ||||
Shares reacquired upon conversion into other share class(es) | (95,908 | ) | (633,247 | ) | ||||
|
|
|
| |||||
Net increase (decrease) in shares outstanding | (135,436 | ) | $ | (888,613 | ) | |||
|
|
|
| |||||
| 186 |
Class C | Shares | Amount | ||||||
Year ended October 31, 2019: | ||||||||
Shares sold | 1,453,960 | $ | 9,924,265 | |||||
Shares issued in reinvestment of dividends and distributions | 123,773 | 835,031 | ||||||
Shares reacquired | (1,261,928 | ) | (8,362,063 | ) | ||||
|
|
|
| |||||
Net increase (decrease) in shares outstanding before conversion | 315,805 | 2,397,233 | ||||||
Shares reacquired upon conversion into other share class(es) | (499,862 | ) | (3,376,849 | ) | ||||
|
|
|
| |||||
Net increase (decrease) in shares outstanding | (184,057 | ) | $ | (979,616 | ) | |||
|
|
|
| |||||
Year ended October 31, 2018: | ||||||||
Shares sold | 2,294,887 | $ | 15,542,300 | |||||
Shares issued in reinvestment of dividends and distributions | 121,101 | 804,239 | ||||||
Shares reacquired | (1,378,941 | ) | (9,141,921 | ) | ||||
|
|
|
| |||||
Net increase (decrease) in shares outstanding before conversion | 1,037,047 | 7,204,618 | ||||||
Shares reacquired upon conversion into other share class(es) | (224,152 | ) | (1,509,290 | ) | ||||
|
|
|
| |||||
Net increase (decrease) in shares outstanding | 812,895 | $ | 5,695,328 | |||||
|
|
|
| |||||
Class Z | ||||||||
Year ended October 31, 2019: | ||||||||
Shares sold | 101,299,181 | $ | 695,981,186 | |||||
Shares issued in reinvestment of dividends and distributions | 4,272,244 | 29,167,212 | ||||||
Shares reacquired | (50,070,369 | ) | (335,456,106 | ) | ||||
|
|
|
| |||||
Net increase (decrease) in shares outstanding before conversion | 55,501,056 | 389,692,292 | ||||||
Shares issued upon conversion from other share class(es) | 1,837,669 | 12,473,906 | ||||||
Shares reacquired upon conversion into other share class(es) | (577,277 | ) | (3,926,593 | ) | ||||
|
|
|
| |||||
Net increase (decrease) in shares outstanding | 56,761,448 | $ | 398,239,605 | |||||
|
|
|
| |||||
Year ended October 31, 2018: | ||||||||
Shares sold | 103,397,910 | $ | 701,748,505 | |||||
Shares issued in reinvestment of dividends and distributions | 2,967,604 | 19,758,448 | ||||||
Shares reacquired | (45,990,012 | ) | (305,303,771 | ) | ||||
|
|
|
| |||||
Net increase (decrease) in shares outstanding before conversion | 60,375,502 | 416,203,182 | ||||||
Shares issued upon conversion from other share class(es) | 2,449,265 | 16,637,716 | ||||||
Shares reacquired upon conversion into other share class(es) | (736,644 | ) | (4,882,979 | ) | ||||
|
|
|
| |||||
Net increase (decrease) in shares outstanding | 62,088,123 | $ | 427,957,919 | |||||
|
|
|
| |||||
Class R2 | ||||||||
Year ended October 31, 2019: | ||||||||
Shares sold | 27,417 | $ | 188,844 | |||||
Shares issued in reinvestment of dividends and distributions | 350 | 2,460 | ||||||
Shares reacquired | (3,564 | ) | (24,048 | ) | ||||
|
|
|
| |||||
Net increase (decrease) in shares outstanding | 24,203 | $ | 167,256 | |||||
|
|
|
| |||||
Period ended October 31, 2018*: | ||||||||
Shares sold | 1,571 | $ | 10,785 | |||||
Shares issued in reinvestment of dividends and distributions | 38 | 255 | ||||||
|
|
|
| |||||
Net increase (decrease) in shares outstanding | 1,609 | $ | 11,040 | |||||
|
|
|
| |||||
| PGIM Global Total Return Fund | 187 |
Notes to Financial Statements(continued)
Class R4 | Shares | Amount | ||||||
Year ended October 31, 2019: | ||||||||
Shares sold | 204,018 | $ | 1,392,468 | |||||
Shares issued in reinvestment of dividends and distributions | 3,698 | 25,648 | ||||||
Shares reacquired | (24,596 | ) | (169,687 | ) | ||||
|
|
|
| |||||
Net increase (decrease) in shares outstanding | 183,120 | $ | 1,248,429 | |||||
|
|
|
| |||||
Period ended October 31, 2018*: | ||||||||
Shares sold | 19,550 | $ | 129,371 | |||||
Shares issued in reinvestment of dividends and distributions | 155 | 1,015 | ||||||
|
|
|
| |||||
Net increase (decrease) in shares outstanding | 19,705 | $ | 130,386 | |||||
|
|
|
| |||||
Class R6 | ||||||||
Year ended October 31, 2019: | ||||||||
Shares sold | 74,822,385 | $ | 512,199,709 | |||||
Shares issued in reinvestment of dividends and distributions | 5,030,242 | 34,553,021 | ||||||
Shares reacquired | (38,842,656 | ) | (264,431,285 | ) | ||||
|
|
|
| |||||
Net increase (decrease) in shares outstanding before conversion | 41,009,971 | 282,321,445 | ||||||
Shares issued upon conversion from other share class(es) | 150,984 | 1,023,277 | ||||||
Shares reacquired upon conversion into other share class(es) | (177,538 | ) | (1,204,852 | ) | ||||
|
|
|
| |||||
Net increase (decrease) in shares outstanding | 40,983,417 | $ | 282,139,870 | |||||
|
|
|
| |||||
Year ended October 31, 2018: | ||||||||
Shares sold | 73,698,438 | $ | 499,777,975 | |||||
Shares issued in reinvestment of dividends and distributions | 3,356,092 | 22,547,460 | ||||||
Shares reacquired | (26,619,916 | ) | (179,186,390 | ) | ||||
|
|
|
| |||||
Net increase (decrease) in shares outstanding before conversion | 50,434,614 | 343,139,045 | ||||||
Shares issued upon conversion from other share class(es) | 363,933 | 2,442,152 | ||||||
Shares reacquired upon conversion into other share class(es) | (34,169 | ) | (234,692 | ) | ||||
|
|
|
| |||||
Net increase (decrease) in shares outstanding | 50,764,378 | $ | 345,346,505 | |||||
|
|
|
| |||||
| * | Commencement of offering was December 27, 2017. |
7. Borrowings
The Company, on behalf of the Fund, along with other affiliated registered investment companies (the “Funds”), is a party to a Syndicated Credit Agreement (“SCA”) with a group of banks. The purpose of the SCA is to provide an alternative source of temporary funding for capital share redemptions. The table below provides details of the current SCA in effect at the reporting period-end as well as the prior SCA.
| Current SCA | Prior SCA | |||
Term of Commitment | 10/3/2019 – 10/1/2020 | 10/4/2018 – 10/2/2019 | ||
Total Commitment | $ 900 million | $ 900 million | ||
Annualized Commitment Fee on the Unused Portion of the SCA | 0.15% | 0.15% |
| 188 |
| Current SCA | Prior SCA | |||
Annualized Interest Rate on Borrowings | 1.20% plus the higher of (1) the effective federal funds rate, (2) the one-month LIBOR rate or (3) zero percent | 1.25% plus the higher of (1) the effective federal funds rate, (2) the one-month LIBOR rate or (3) zero percent |
Certain affiliated registered investment companies that are parties to the SCA include portfolios that are subject to a predetermined mathematical formula used to manage certain benefit guarantees offered under variable annuity contracts. The formula may result in large scale asset flows into and out of these portfolios. Consequently, these portfolios may be more likely to utilize the SCA for purposes of funding redemptions. It may be possible for those portfolios to fully exhaust the committed amount of the SCA, thereby requiring the Manager to allocate available funding per a Board-approved methodology designed to treat the Funds in the SCA equitably.
The Fund utilized the SCA during the year ended October 31, 2019. The average daily balance for the 7 days that the Fund had loans outstanding during the period was approximately $3,913,286, borrowed at a weighted average interest rate of 3.58%. The maximum loan outstanding amount during the period was $6,039,000. At October 31, 2019, the Fund did not have an outstanding loan amount.
8. Risks of Investing in the Fund
The Fund’s risks include, but are not limited to, some or all of the risks discussed below:
Bond Obligations Risk:The Company’s holdings, share price, yield and total return may fluctuate in response to bond market movements. The value of bonds may decline for issuer-related reasons, including management performance, financial leverage and reduced demand for the issuer’s goods and services. Certain types of fixed-income obligations also may be subject to “call and redemption risk,” which is the risk that the issuer may call a bond held by the Fund for redemption before it matures and the Fund may not be able to reinvest at the same level and therefore would earn less income.
Derivatives Risk:Derivatives involve special risks and costs and may result in losses to the Fund. The successful use of derivatives requires sophisticated management, and, to the extent that derivatives are used, the Fund will depend on the subadviser’s ability to analyze and manage derivative transactions. The prices of derivatives may move in unexpected ways, especially in abnormal market conditions. Some derivatives are “leveraged” and therefore may magnify or otherwise increase investment losses to the Fund. Other risks arise from the potential inability to terminate or sell derivatives positions. A liquid secondary market may not always exist for the Fund’s derivatives positions. In fact, many OTC derivative instruments will not have liquidity beyond the counterparty to the instrument. OTC derivative instruments also involve the risk that the other party will not meet its obligations to the Fund.
| PGIM Global Total Return Fund | 189 |
Notes to Financial Statements(continued)
Emerging Markets Risk:The risks of foreign investments are greater for investments in or exposed to emerging markets. Emerging market countries typically have economic and political systems that are less fully developed, and can be expected to be less stable, than those of more developed countries. For example, the economies of such countries can be subject to rapid and unpredictable rates of inflation or deflation. Low trading volumes may result in a lack of liquidity and price volatility.
Foreign Securities Risk:The Fund’s investments in securities of foreign issuers or issuers with significant exposure to foreign markets involve additional risk. Foreign countries in which the Fund may invest may have markets that are less liquid, less regulated and more volatile than US markets. The value of the Fund’s investments may decline because of factors affecting the particular issuer as well as foreign markets and issuers generally, such as unfavorable government actions, and political or financial instability.
Interest Rate Risk:The value of an investment may go down when interest rates rise. A rise in rates tends to have a greater impact on the prices of longer term or duration securities. When interest rates fall, the issuers of debt obligations may prepay principal more quickly than expected, and the Fund may be required to reinvest the proceeds at a lower interest rate. This is referred to as “prepayment risk.” When interest rates rise, debt obligations may be repaid more slowly than expected, and the value of the Fund’s holdings may fall sharply. This is referred to as “extension risk. The Fund may face a heightened level of interest rate risk as a result of the U.S. Federal Reserve Board’s policies. The Fund’s investments may lose value if short-term or long-term interest rates rise sharply or in a manner not anticipated by the subadviser.
Liquidity Risk:The Fund may invest in instruments that trade in lower volumes and are less liquid than other investments. Liquidity risk exists when particular investments made by the Fund are difficult to purchase or sell. Liquidity risk includes the risk that the Fund may make investments that may become less liquid in response to market developments or adverse investor perceptions. Investments that are illiquid or that trade in lower volumes may be more difficult to value. If the Fund is forced to sell these investments to pay redemption proceeds or for other reasons, the Fund may lose money. In addition, when there is no willing buyer and investments may not reasonably be expected to be sold or disposed of in current market conditions in seven calendar days or less without the sale or disposition significantly changing the market value of the investment, the Fund may incur higher transaction costs when executing trade orders of a given size. The reduction in dealer market-making capacity in the fixed-income markets that has occurred in recent years also has the potential to reduce liquidity. An inability to sell a portfolio position can adversely affect the Fund’s value or prevent the Fund from being able to take advantage of other investment opportunities.
| 190 |
Market and Credit Risk:Securities markets may be volatile and the market prices of the Fund’s securities may decline. Securities fluctuate in price based on changes in an issuer’s financial condition and overall market and economic conditions. If the market prices of the securities owned by the Fund fall, the value of an investment in the Fund will decline. Additionally, the Fund may also be exposed to credit risk in the event that an issuer or guarantor fails to perform or that an institution or entity with which the Fund has unsettled or open transactions defaults.
Mortgage-Backed and Other Asset-Backed Securities Risk:Mortgage-related securities are usually pass-through instruments that pay investors a share of all interest and principal payments from an underlying pool of fixed or adjustable rate mortgages. Asset-backed securities are another type of pass-through instruments that pays interest based upon the cash flow of an underlying pool of assets, such as automobile loans or credit card receivables. Asset-backed securities can also be collateralized by a portfolio of corporate bonds including junk bonds or other securities. The values of mortgage-backed and asset-backed securities vary with changes in interest rates and are particularly sensitive to prepayments (the risk is that the underlying debt instruments may be partially or wholly prepaid during periods of falling interest rates, which could require the Fund to reinvest in lower yielding debt instruments) or extensions (the risk is that rising interest rates may cause the underlying debt instruments to be repaid more slowly by the debtor, causing the value of the securities to fall). Asset-backed securities are also subject to liquidity risk.
Non-diversification Risk:A non-diversified Fund may invest a greater percentage of its assets in the securities of a single company or industry than a diversified fund. Investing in a non-diversified fund involves greater risk than investing in a diversified fund because a loss resulting from the decline in value of any one security may represent a greater portion of the total assets of a non-diversified fund.
9. Recent Accounting Pronouncements and Reporting Updates
In August 2018, the FASB issued Accounting Standards Update (“ASU”) No. 2018-13, which changes certain fair value measurement disclosure requirements. The new ASU, in addition to other modifications and additions, removes the requirement to disclose the amount and reasons for transfers between Level 1 and Level 2 of the fair value hierarchy, and the Fund’s policy for the timing of transfers between levels. The amendments are effective for financial statements issued for fiscal years beginning after December 15, 2019, and interim periods within those fiscal years. The Manager has evaluated the implications of certain provisions of the ASU and has determined to early adopt aspects related to the removal and modification of certain fair value measurement disclosures under the ASU effective immediately. The Manager continues to evaluate certain other provisions of the ASU and does not expect a material impact to financial statement disclosures.
| PGIM Global Total Return Fund | 191 |
Financial Highlights
| Class A Shares | ||||||||||||||||||||
| Year Ended October 31, | ||||||||||||||||||||
| 2019 | 2018 | 2017 | 2016 | 2015 | ||||||||||||||||
| Per Share Operating Performance(a): | ||||||||||||||||||||
| Net Asset Value, Beginning of Year | $6.36 | $6.75 | $6.64 | $6.45 | $6.88 | |||||||||||||||
| Income (loss) from investment operations: | ||||||||||||||||||||
| Net investment income (loss) | 0.16 | 0.14 | 0.14 | 0.17 | 0.17 | |||||||||||||||
| Net realized and unrealized gain (loss) on investment and foreign currency transactions | 0.78 | (0.31 | ) | 0.19 | 0.25 | (0.37 | ) | |||||||||||||
| Total from investment operations | 0.94 | (0.17 | ) | 0.33 | 0.42 | (0.20 | ) | |||||||||||||
| Less Dividends and Distributions: | ||||||||||||||||||||
| Dividends from net investment income* | (0.23 | ) | (0.22 | ) | (0.13 | ) | (0.12 | ) | (0.04 | ) | ||||||||||
| Tax return of capital distributions | - | - | (0.05 | ) | (0.03 | ) | (0.19 | ) | ||||||||||||
| Distributions from net realized gains | - | - | (0.04 | ) | (0.08 | ) | - | |||||||||||||
| Total dividends and distributions | (0.23 | ) | (0.22 | ) | (0.22 | ) | (0.23 | ) | (0.23 | ) | ||||||||||
| Net asset value, end of year | $7.07 | $6.36 | $6.75 | $6.64 | $6.45 | |||||||||||||||
| Total Return(b): | 15.05% | (2.65)% | 5.12% | 6.60% | (2.90)% | |||||||||||||||
| Ratios/Supplemental Data: | ||||||||||||||||||||
| Net assets, end of year (000) | $216,708 | $184,064 | $174,732 | $202,770 | $157,404 | |||||||||||||||
| Average net assets (000) | $188,633 | $187,975 | $175,014 | $169,299 | $175,942 | |||||||||||||||
| Ratios to average net assets(c)(d)(e): | ||||||||||||||||||||
| Expenses after waivers and/or expense reimbursement | 0.88% | 0.88% | 0.88% | 0.97% | 1.05% | |||||||||||||||
| Expenses before waivers and/or expense reimbursement | 1.02% | 1.02% | 0.99% | 1.14% | 1.24% | |||||||||||||||
| Net investment income (loss) | 2.40% | 2.11% | 2.12% | 2.57% | 2.50% | |||||||||||||||
| Portfolio turnover rate(f) | 37% | 40% | 75% | 86% | 95% | |||||||||||||||
| * | Dividends from net investment income may include other items that are ordinary income for tax purposes. |
| (a) | Calculated based on average shares outstanding during the year. |
| (b) | Total return does not consider the effects of sales loads. Total return is calculated assuming a purchase of a share on the first day and a sale on the last day of each year reported and includes reinvestment of dividends and distributions, if any. Total returns may reflect adjustments to conform to generally accepted accounting principles. |
| (c) | Does not include expenses of the underlying funds in which the Fund invests. |
| (d) | Effective March 9, 2015, the contractual distribution and service (12b-1) fees were reduced from 0.30% to 0.25% of the average daily net assets and the 0.05% contractual 12b-1 fee waiver was terminated. |
| (e) | Effective November 1, 2017, class specific expenses include transfer agent fees and expenses and registration fees, which are charged to their respective share class. |
| (f) | The Fund’s portfolio turnover rate is calculated in accordance with regulatory requirements, without regard to transactions involving short-term investments and certain derivatives. If such transactions were included, the Fund’s portfolio turnover rate may be higher. |
See Notes to Financial Statements.
| 192 |
| Class B Shares | ||||||||||||||||||||
| Year Ended October 31, | ||||||||||||||||||||
| 2019 | 2018 | 2017 | 2016 | 2015 | ||||||||||||||||
| Per Share Operating Performance(a): | ||||||||||||||||||||
| Net Asset Value, Beginning of Year | $6.36 | $6.74 | $6.64 | $6.44 | $6.88 | |||||||||||||||
| Income (loss) from investment operations: | ||||||||||||||||||||
| Net investment income (loss) | 0.11 | 0.09 | 0.09 | 0.12 | 0.12 | |||||||||||||||
| Net realized and unrealized gain (loss) on investment and foreign currency transactions | 0.78 | (0.30 | ) | 0.18 | 0.26 | (0.38 | ) | |||||||||||||
| Total from investment operations | 0.89 | (0.21 | ) | 0.27 | 0.38 | (0.26 | ) | |||||||||||||
| Less Dividends and Distributions: | ||||||||||||||||||||
| Dividends from net investment income* | (0.18 | ) | (0.17 | ) | (0.10 | ) | (0.08 | ) | (0.03 | ) | ||||||||||
| Tax return of capital distributions | - | - | (0.03 | ) | (0.02 | ) | (0.15 | ) | ||||||||||||
| Distributions from net realized gains | - | - | (0.04 | ) | (0.08 | ) | - | |||||||||||||
| Total dividends and distributions | (0.18 | ) | (0.17 | ) | (0.17 | ) | (0.18 | ) | (0.18 | ) | ||||||||||
| Net asset value, end of year | $7.07 | $6.36 | $6.74 | $6.64 | $6.44 | |||||||||||||||
| Total Return(b): | 14.20% | (3.23)% | 4.20% | 5.99% | (3.75)% | |||||||||||||||
| Ratios/Supplemental Data: | ||||||||||||||||||||
| Net assets, end of year (000) | $1,114 | $2,168 | $3,212 | $4,202 | $4,660 | |||||||||||||||
| Average net assets (000) | $1,560 | $2,885 | $3,559 | $4,457 | $5,469 | |||||||||||||||
| Ratios to average net assets(c)(d): | ||||||||||||||||||||
| Expenses after waivers and/or expense reimbursement | 1.63% | 1.63% | 1.63% | 1.72% | 1.80% | |||||||||||||||
| Expenses before waivers and/or expense reimbursement | 2.46% | 2.37% | 1.74% | 1.89% | 1.97% | |||||||||||||||
| Net investment income (loss) | 1.70% | 1.34% | 1.39% | 1.85% | 1.77% | |||||||||||||||
| Portfolio turnover rate(e) | 37% | 40% | 75% | 86% | 95% | |||||||||||||||
| * | Dividends from net investment income may include other items that are ordinary income for tax purposes. |
| (a) | Calculated based on average shares outstanding during the year. |
| (b) | Total return does not consider the effects of sales loads. Total return is calculated assuming a purchase of a share on the first day and a sale on the last day of each year reported and includes reinvestment of dividends and distributions, if any. Total returns may reflect adjustments to conform to generally accepted accounting principles. |
| (c) | Does not include expenses of the underlying funds in which the Fund invests. |
| (d) | Effective November 1, 2017, class specific expenses include transfer agent fees and expenses and registration fees, which are charged to their respective share class. |
| (e) | The Fund’s portfolio turnover rate is calculated in accordance with regulatory requirements, without regard to transactions involving short-term investments and certain derivatives. If such transactions were included, the Fund’s portfolio turnover rate may be higher. |
See Notes to Financial Statements.
| PGIM Global Total Return Fund | 193 |
Financial Highlights(continued)
| Class C Shares | ||||||||||||||||||||
| Year Ended October 31, | ||||||||||||||||||||
| 2019 | 2018 | 2017 | 2016 | 2015 | ||||||||||||||||
| Per Share Operating Performance(a): | ||||||||||||||||||||
| Net Asset Value, Beginning of Year | $6.35 | $6.73 | $6.63 | $6.44 | $6.86 | |||||||||||||||
| Income (loss) from investment operations: | ||||||||||||||||||||
| Net investment income (loss) | 0.11 | 0.09 | 0.09 | 0.12 | 0.12 | |||||||||||||||
| Net realized and unrealized gain (loss) on investment and foreign currency transactions | 0.78 | (0.30 | ) | 0.18 | 0.25 | (0.36 | ) | |||||||||||||
| Total from investment operations | 0.89 | (0.21 | ) | 0.27 | 0.37 | (0.24 | ) | |||||||||||||
| Less Dividends and Distributions: | ||||||||||||||||||||
| Dividends from net investment income* | (0.18 | ) | (0.17 | ) | (0.10 | ) | (0.08 | ) | (0.03 | ) | ||||||||||
| Tax return of capital distributions | - | - | (0.03 | ) | (0.02 | ) | (0.15 | ) | ||||||||||||
| Distributions from net realized gains | - | - | (0.04 | ) | (0.08 | ) | - | |||||||||||||
| Total dividends and distributions | (0.18 | ) | (0.17 | ) | (0.17 | ) | (0.18 | ) | (0.18 | ) | ||||||||||
| Net asset value, end of year | $7.06 | $6.35 | $6.73 | $6.63 | $6.44 | |||||||||||||||
| Total Return(b): | 14.21% | (3.24)% | 4.19% | 5.82% | (3.48)% | |||||||||||||||
| Ratios/Supplemental Data: | ||||||||||||||||||||
| Net assets, end of year (000) | $37,486 | $34,889 | $31,509 | $35,848 | $29,427 | |||||||||||||||
| Average net assets (000) | $34,321 | $36,335 | $31,191 | $30,873 | $33,144 | |||||||||||||||
| Ratios to average net assets(c)(d): | ||||||||||||||||||||
| Expenses after waivers and/or expense reimbursement | 1.63% | 1.63% | 1.63% | 1.72% | 1.80% | |||||||||||||||
| Expenses before waivers and/or expense reimbursement | 1.69% | 1.73% | 1.74% | 1.89% | 1.97% | |||||||||||||||
| Net investment income (loss) | 1.65% | 1.37% | 1.39% | 1.83% | 1.76% | |||||||||||||||
| Portfolio turnover rate(e) | 37% | 40% | 75% | 86% | 95% | |||||||||||||||
| * | Dividends from net investment income may include other items that are ordinary income for tax purposes. |
| (a) | Calculated based on average shares outstanding during the year. |
| (b) | Total return does not consider the effects of sales loads. Total return is calculated assuming a purchase of a share on the first day and a sale on the last day of each year reported and includes reinvestment of dividends and distributions, if any. Total returns may reflect adjustments to conform to generally accepted accounting principles. |
| (c) | Does not include expenses of the underlying funds in which the Fund invests. |
| (d) | Effective November 1, 2017, class specific expenses include transfer agent fees and expenses and registration fees, which are charged to their respective share class. |
| (e) | The Fund’s portfolio turnover rate is calculated in accordance with regulatory requirements, without regard to transactions involving short-term investments and certain derivatives. If such transactions were included, the Fund’s portfolio turnover rate may be higher. |
See Notes to Financial Statements.
| 194 |
| Class Z Shares | ||||||||||||||||||||
| Year Ended October 31, | ||||||||||||||||||||
| 2019 | 2018 | 2017 | 2016 | 2015 | ||||||||||||||||
| Per Share Operating Performance(a): | ||||||||||||||||||||
| Net Asset Value, Beginning of Year | $6.40 | $6.78 | $6.67 | $6.47 | $6.90 | |||||||||||||||
| Income (loss) from investment operations: | ||||||||||||||||||||
| Net investment income (loss) | 0.18 | 0.16 | 0.15 | 0.18 | 0.18 | |||||||||||||||
| Net realized and unrealized gain (loss) on investment and foreign currency transactions | 0.78 | (0.31 | ) | 0.20 | 0.27 | (0.36 | ) | |||||||||||||
| Total from investment operations | 0.96 | (0.15 | ) | 0.35 | 0.45 | (0.18 | ) | |||||||||||||
| Less Dividends and Distributions: | ||||||||||||||||||||
| Dividends from net investment income* | (0.25 | ) | (0.23 | ) | (0.15 | ) | (0.14 | ) | (0.05 | ) | ||||||||||
| Tax return of capital distributions | - | - | (0.05 | ) | (0.03 | ) | (0.20 | ) | ||||||||||||
| Distributions from net realized gains | - | - | (0.04 | ) | (0.08 | ) | - | |||||||||||||
| Total dividends and distributions | (0.25 | ) | (0.23 | ) | (0.24 | ) | (0.25 | ) | (0.25 | ) | ||||||||||
| Net asset value, end of year | $7.11 | $6.40 | $6.78 | $6.67 | $6.47 | |||||||||||||||
| Total Return(b): | 15.25% | (2.25)% | 5.35% | 7.00% | (2.66)% | |||||||||||||||
| Ratios/Supplemental Data: | ||||||||||||||||||||
| Net assets, end of year (000) | $1,254,507 | $765,708 | $390,194 | $303,960 | $115,119 | |||||||||||||||
| Average net assets (000) | $888,961 | $648,173 | $340,627 | $153,146 | $129,045 | |||||||||||||||
| Ratios to average net assets(c)(d): | ||||||||||||||||||||
| Expenses after waivers and/or expense reimbursement | 0.63% | 0.63% | 0.63% | 0.72% | 0.80% | |||||||||||||||
| Expenses before waivers and/or expense reimbursement | 0.68% | 0.71% | 0.74% | 0.89% | 0.96% | |||||||||||||||
| Net investment income (loss) | 2.61% | 2.39% | 2.35% | 2.77% | 2.73% | |||||||||||||||
| Portfolio turnover rate(e) | 37% | 40% | 75% | 86% | 95% | |||||||||||||||
| * | Dividends from net investment income may include other items that are ordinary income for tax purposes. |
| (a) | Calculated based on average shares outstanding during the year. |
| (b) | Total return is calculated assuming a purchase of a share on the first day and a sale on the last day of each year reported and includes reinvestment of dividends and distributions, if any. Total returns may reflect adjustments to conform to generally accepted accounting principles. |
| (c) | Does not include expenses of the underlying funds in which the Fund invests. |
| (d) | Effective November 1, 2017, class specific expenses include transfer agent fees and expenses and registration fees, which are charged to their respective share class. |
| (e) | The Fund’s portfolio turnover rate is calculated in accordance with regulatory requirements, without regard to transactions involving short-term investments and certain derivatives. If such transactions were included, the Fund’s portfolio turnover rate may be higher. |
See Notes to Financial Statements.
| PGIM Global Total Return Fund | 195 |
Financial Highlights(continued)
| Class R2 Shares | ||||||||||||
| Year Ended October 31, 2019 | December 27, 2017(a) through October 31, 2018 | |||||||||||
| Per Share Operating Performance(b): | ||||||||||||
| Net Asset Value, Beginning of Period | $6.44 | $6.90 | ||||||||||
| Income (loss) from investment operations: | ||||||||||||
| Net investment income (loss) | 0.15 | 0.09 | ||||||||||
| Net realized and unrealized gain (loss) on investment and foreign currency transactions | 0.79 | (0.38 | ) | |||||||||
| Total from investment operations | 0.94 | (0.29 | ) | |||||||||
| Less Dividends and Distributions: | ||||||||||||
| Dividends from net investment income* | (0.22 | ) | (0.17 | ) | ||||||||
| Net asset value, end of period | $7.16 | $6.44 | ||||||||||
| Total Return(c): | 14.81% | (4.24)% | ||||||||||
| Ratios/Supplemental Data: | ||||||||||||
| Net assets, end of period (000) | $185 | $10 | ||||||||||
| Average net assets (000) | $78 | $10 | ||||||||||
| Ratios to average net assets(d): | ||||||||||||
| Expenses after waivers and/or expense reimbursement | 1.08% | 1.08% | (e) | |||||||||
| Expenses before waivers and/or expense reimbursement | 19.82% | 236.32% | (e) | |||||||||
| Net investment income (loss) | 2.11% | 1.67% | (e) | |||||||||
| Portfolio turnover rate(f) | 37% | 40% | ||||||||||
| * | Dividends from net investment income may include other items that are ordinary income for tax purposes. |
| (a) | Commencement of offering. |
| (b) | Calculated based on average shares outstanding during the period. |
| (c) | Total return is calculated assuming a purchase of a share on the first day and a sale on the last day of each period reported and includes reinvestment of dividends and distributions, if any. Total returns may reflect adjustments to conform to generally accepted accounting principles. Total returns for periods less than one full year are not annualized. |
| (d) | Does not include expenses of the underlying funds in which the Fund invests. |
| (e) | Annualized. |
| (f) | The Fund’s portfolio turnover rate is calculated in accordance with regulatory requirements, without regard to transactions involving short-term investments and certain derivatives. If such transactions were included, the Fund’s portfolio turnover rate may be higher. |
See Notes to Financial Statements.
| 196 |
| Class R4 Shares | ||||||||||||
| Year Ended October 31, 2019 | December 27, 2017(a) through 2018 | |||||||||||
| Per Share Operating Performance(b): | ||||||||||||
| Net Asset Value, Beginning of Period | $6.45 | $6.90 | ||||||||||
| Income (loss) from investment operations: | ||||||||||||
| Net investment income (loss) | 0.16 | 0.12 | ||||||||||
| Net realized and unrealized gain (loss) on investment and foreign currency transactions | 0.79 | (0.38 | ) | |||||||||
| Total from investment operations | 0.95 | (0.26 | ) | |||||||||
| Less Dividends and Distributions: | ||||||||||||
| Dividends from net investment income* | (0.24 | ) | (0.19 | ) | ||||||||
| Net asset value, end of period | $7.16 | $6.45 | ||||||||||
| Total Return(c): | 14.92% | (3.88)% | ||||||||||
| Ratios/Supplemental Data: | ||||||||||||
| Net assets, end of period (000) | $1,453 | $127 | ||||||||||
| Average net assets (000) | $804 | $33 | ||||||||||
| Ratios to average net assets(d): | ||||||||||||
| Expenses after waivers and/or expense reimbursement | 0.83% | 0.83% | (e) | |||||||||
| Expenses before waivers and/or expense reimbursement | 2.63% | 70.94% | (e) | |||||||||
| Net investment income (loss) | 2.34% | 2.23% | (e) | |||||||||
| Portfolio turnover rate(f) | 37% | 40% | ||||||||||
| * | Dividends from net investment income may include other items that are ordinary income for tax purposes. |
| (a) | Commencement of offering. |
| (b) | Calculated based on average shares outstanding during the period. |
| (c) | Total return is calculated assuming a purchase of a share on the first day and a sale on the last day of each period reported and includes reinvestment of dividends and distributions, if any. Total returns may reflect adjustments to conform to generally accepted accounting principles. Total returns for periods less than one full year are not annualized. |
| (d) | Does not include expenses of the underlying funds in which the Fund invests. |
| (e) | Annualized. |
| (f) | The Fund’s portfolio turnover rate is calculated in accordance with regulatory requirements, without regard to transactions involving short-term investments and certain derivatives. If such transactions were included, the Fund’s portfolio turnover rate may be higher. |
See Notes to Financial Statements.
| PGIM Global Total Return Fund | 197 |
Financial Highlights(continued)
| Class R6 Shares | ||||||||||||||||||||
| Year Ended October 31, | ||||||||||||||||||||
| 2019 | 2018 | 2017 | 2016 | 2015 | ||||||||||||||||
| Per Share Operating Performance(a): | ||||||||||||||||||||
| Net Asset Value, Beginning of Year | $6.44 | $6.82 | $6.72 | $6.53 | $6.97 | |||||||||||||||
| Income (loss) from investment operations: | ||||||||||||||||||||
| Net investment income (loss) | 0.18 | 0.16 | 0.16 | 0.19 | 0.17 | |||||||||||||||
| Net realized and unrealized gain (loss) on investment and foreign currency transactions | 0.80 | (0.30 | ) | 0.18 | 0.26 | (0.36 | ) | |||||||||||||
| Total from investment operations | 0.98 | (0.14 | ) | 0.34 | 0.45 | (0.19 | ) | |||||||||||||
| Less Dividends and Distributions: | ||||||||||||||||||||
| Dividends from net investment income* | (0.26 | ) | (0.24 | ) | (0.15 | ) | (0.15 | ) | (0.05 | ) | ||||||||||
| Tax return of capital distributions | - | - | (0.05 | ) | (0.03 | ) | (0.20 | ) | ||||||||||||
| Distributions from net realized gains | - | - | (0.04 | ) | (0.08 | ) | - | |||||||||||||
| Total dividends and distributions | (0.26 | ) | (0.24 | ) | (0.24 | ) | (0.26 | ) | (0.25 | ) | ||||||||||
| Net asset value, end of year | $7.16 | $6.44 | $6.82 | $6.72 | $6.53 | |||||||||||||||
| Total Return(b): | 15.25% | (2.19)% | 5.21% | 6.90% | (2.71)% | |||||||||||||||
| Ratios/Supplemental Data: | ||||||||||||||||||||
| Net assets, end of year (000) | $1,139,781 | $761,927 | $460,700 | $61,713 | $27,141 | |||||||||||||||
| Average net assets (000) | $925,868 | $636,670 | $271,620 | $40,135 | $19,157 | |||||||||||||||
| Ratios to average net assets(c)(d): | ||||||||||||||||||||
| Expenses after waivers and/or expense reimbursement | 0.56% | 0.58% | 0.58% | 0.59% | 0.72% | |||||||||||||||
| Expenses before waivers and/or expense reimbursement | 0.56% | 0.58% | 0.59% | 0.76% | 0.82% | |||||||||||||||
| Net investment income (loss) | 2.67% | 2.39% | 2.33% | 2.86% | 2.64% | |||||||||||||||
| Portfolio turnover rate(e) | 37% | 40% | 75% | 86% | 95% | |||||||||||||||
| * | Dividends from net investment income may include other items that are ordinary income for tax purposes. |
| (a) | Calculated based on average shares outstanding during the year. |
| (b) | Total return is calculated assuming a purchase of a share on the first day and a sale on the last day of each year reported and includes reinvestment of dividends and distributions, if any. Total returns may reflect adjustments to conform to generally accepted accounting principles. |
| (c) | Does not include expenses of the underlying funds in which the Fund invests. |
| (d) | Effective November 1, 2017, class specific expenses include transfer agent fees and expenses and registration fees, which are charged to their respective share class. |
| (e) | The Fund’s portfolio turnover rate is calculated in accordance with regulatory requirements, without regard to transactions involving short-term investments and certain derivatives. If such transactions were included, the Fund’s portfolio turnover rate may be higher. |
See Notes to Financial Statements.
| 198 |
Report of Independent Registered Public Accounting Firm
To the Shareholders of PGIM Global Total Return Fund and Board of Directors
Prudential Global Total Return Fund, Inc.:
Opinion on the Financial Statements
We have audited the accompanying statement of assets and liabilities of PGIM Global Total Return Fund, a series of Prudential Global Total Return Fund, Inc., (the Fund), including the schedule of investments, as of October 31, 2019, the related statement of operations for the year then ended, the statements of changes in net assets for each of the years in thetwo-year period ended October 31, 2019, and the related notes (collectively, the financial statements) and the financial highlights for the years or period indicated therein. In our opinion, the financial statements and financial highlights present fairly, in all material respects, the financial position of the Fund as of October 31, 2019, the results of its operations for the year then ended, the changes in its net assets for each of the years in thetwo-year period ended October 31, 2019, and the financial highlights for the years or period indicated therein, in conformity with U.S. generally accepted accounting principles.
Basis for Opinion
These financial statements and financial highlights are the responsibility of the Fund’s management. Our responsibility is to express an opinion on these financial statements and financial highlights based on our audits. We are a public accounting firm registered with the Public Company Accounting Oversight Board (United States) (PCAOB) and are required to be independent with respect to the Fund in accordance with the U.S. federal securities laws and the applicable rules and regulations of the Securities and Exchange Commission and the PCAOB.
We conducted our audits in accordance with the standards of the PCAOB. Those standards require that we plan and perform the audit to obtain reasonable assurance about whether the financial statements and financial highlights are free of material misstatement, whether due to error or fraud. Our audits included performing procedures to assess the risks of material misstatement of the financial statements and financial highlights, whether due to error or fraud, and performing procedures that respond to those risks. Such procedures included examining, on a test basis, evidence regarding the amounts and disclosures in the financial statements and financial highlights. Such procedures also included confirmation of securities owned as of October 31, 2019, by correspondence with the custodian, transfer agent, and brokers, or by other appropriate auditing procedures when replies were not received. Our audits also included evaluating the accounting principles used and significant estimates made by management, as well as evaluating the overall presentation of the financial statements and financial highlights. We believe that our audits provide a reasonable basis for our opinion.

We have served as the auditor of one or more PGIM and/or Prudential Retail investment companies since 2003.
New York, New York
December 19, 2019
| PGIM Global Total Return Fund | 199 |
Federal Income Tax Information(unaudited)
For the year ended October 31, 2019, the Fund reports the maximum amount allowable but not less than 41.70% as interest related dividends in accordance with Sections 871(k)(1) and 881(e)(1) of the Internal Revenue Code.
In January 2020, you will be advised on IRS Form1099-DIV or substitute1099-DIV as to the federal tax status of distributions received by you in calendar year 2019.
| 200 |
INFORMATION ABOUT BOARD MEMBERS AND OFFICERS(unaudited)
Information about Board Members and Officers of the Fund is set forth below. Board Members who are not deemed to be “interested persons” of the Fund, as defined in the 1940 Act, are referred to as “Independent Board Members.” Board Members who are deemed to be “interested persons” of the Fund are referred to as “Interested Board Members.” The Board Members are responsible for the overall supervision of the operations of the Fund and perform the various duties imposed on the directors of investment companies by the 1940 Act. The Board in turn elects the Officers, who are responsible for administering theday-to-day operations of the Fund.
| Independent Board Members | ||||||
Name Date of Birth Position(s) Portfolios Overseen | Principal Occupation(s) During Past Five Years | Other Directorships Held During Past Five Years | Length of Board Service | |||
Ellen S. Alberding 3/11/58 Board Member Portfolios Overseen: 96 | President and Board Member, The Joyce Foundation (charitable foundation) (since 2002); Vice Chair, City Colleges of Chicago (community college system) (2011-2015); Trustee, National Park Foundation (charitable foundation for national park system) (2009-2018); Trustee, Economic Club of Chicago (since 2009); Trustee, Loyola University (since 2018). | None. | Since September 2013 | |||
Kevin J. Bannon 7/13/52 Board Member Portfolios Overseen: 96 | Retired; Managing Director (April2008-May 2015) and Chief Investment Officer (October 2008-November 2013) of Highmount Capital LLC (registered investment adviser); formerly Executive Vice President and Chief Investment Officer (April 1993-August 2007) of Bank of New York Company; President (May2003-May 2007) of BNY Hamilton Family of Mutual Funds. | Director of Urstadt Biddle Properties (equity real estate investment trust) (since September 2008). | Since July 2008 | |||
PGIM Global Total Return Fund
| Independent Board Members | ||||||
Name Date of Birth Position(s) Portfolios Overseen | Principal Occupation(s) During Past Five Years | Other Directorships Past Five Years | Length of Board Service | |||
Linda W. Bynoe 7/9/52 Board Member Portfolios Overseen: 96 | President and Chief Executive Officer (since March 1995) and formerly Chief Operating Officer (December 1989-February 1995) of Telemat Ltd. (management consulting); formerly Vice President (January 1985-June 1989) at Morgan Stanley & Co. (broker-dealer). | Director of Anixter International, Inc. (communication products distributor) (since January 2006); Director of Northern Trust Corporation (financial services) (since April 2006); Trustee of Equity Residential (residential real estate) (since December 2009). | Since March 2005 | |||
Barry H. Evans 11/2/60 Board Member Portfolios Overseen: 95 | Retired; formerly President (2005 – 2016), Global Chief Operating Officer (2014– 2016), Chief Investment Officer – Global Head of Fixed Income (1998-2014), and various portfolio manager roles (1986-2006), Manulife Asset Management U.S. | Formerly Director, Manulife Trust Company(2011-2018); formerly Director, Manulife Asset Management Limited (2015-2017); formerly Chairman of the Board of Directors of Manulife Asset Management U.S. (2005-2016); formerly Chairman of the Board, Declaration Investment Management and Research (2008-2016). | Since September 2017 | |||
Keith F. Hartstein 10/13/56 Board Member & Independent Chair Portfolios Overseen: 96 | Retired; Member (since November 2014) of the Governing Council of the Independent Directors Council (organization of independent mutual fund directors); formerly President and Chief Executive Officer (2005-2012), Senior Vice President (2004-2005), Senior Vice President of Sales and Marketing (1997-2004), and various executive management positions (1990-1997), John Hancock Funds, LLC (asset management); Chairman, Investment Company Institute’s Sales Force Marketing Committee (2003-2008). | None. | Since September 2013 | |||
Visit our website at pgiminvestments.com
| Independent Board Members | ||||||
Name Date of Birth Position(s) Portfolios Overseen | Principal Occupation(s) During Past Five Years | Other Directorships Past Five Years | Length of Board Service | |||
Laurie Simon Hodrick 9/29/62 Board Member Portfolios Overseen: 95 | A. Barton Hepburn Professor Emerita of Economics in the Faculty of Business, Columbia Business School (since 2018); Visiting Professor of Law, Stanford Law School (since 2015); Visiting Fellow at the Hoover Institution, Stanford University (since 2015); Sole Member, ReidCourt LLC (since 2008) (a consulting firm); formerly A. Barton Hepburn Professor of Economics in the Faculty of Business, Columbia Business School (1996-2017); formerly Managing Director, Global Head of Alternative Investment Strategies, Deutsche Bank (2006-2008). | Independent Director, Synnex Corporation (since April 2019) (information technology); Independent Director, Kabbage, Inc. (since July 2018) (financial services); Independent Director, Corporate Capital Trust (2017-2018) (a business development company). | Since September 2017 | |||
Michael S. Hyland, CFA 10/4/45 Board Member Portfolios Overseen: 96 | Retired (since February 2005); formerly Senior Managing Director (July 2001-February 2005) of Bear Stearns & Co, Inc.; Global Partner, INVESCO (1999-2001); Managing Director and President of Salomon Brothers Asset Management (1989-1999). | None. | Since July 2008 | |||
Brian K. Reid 9/22/61 Board Member Portfolios Overseen: 95 | Retired; formerly Chief Economist for the Investment Company Institute (ICI) (2005-2017); formerly Senior Economist and Director of Industry and Financial Analysis at the ICI (1998-2004); formerly Senior Economist, Industry and Financial Analysis at the ICI (1996-1998); formerly Staff Economist at the Federal Reserve Board (1989-1996); Director, ICI Mutual Insurance Company (2012-2017). | None. | Since March 2018 | |||
PGIM Global Total Return Fund
Independent Board Members | ||||||
Name Date of Birth Position(s) Portfolios Overseen | Principal Occupation(s) During Past Five Years | Other Directorships Past Five Years | Length of Board Service | |||
Grace C. Torres 6/28/59 Board Member Portfolios Overseen: 95 | Retired; formerly Treasurer and Principal Financial and Accounting Officer of the PGIM Funds, Target Funds, Advanced Series Trust, Prudential Variable Contract Accounts and The Prudential Series Fund (1998-June 2014); Assistant Treasurer (March 1999-June 2014) and Senior Vice President (September 1999-June 2014) of PGIM Investments LLC; Assistant Treasurer (May 2003-June 2014) and Vice President (June 2005-June 2014) of AST Investment Services, Inc.; Senior Vice President and Assistant Treasurer (May 2003-June 2014) of Prudential Annuities Advisory Services, Inc. | Formerly Director (July 2015-January 2018) of Sun Bancorp, Inc. N.A. and Sun National Bank; Director (since January 2018) of OceanFirst Financial Corp. and OceanFirst Bank. | Since November 2014 | |||
Interested Board Members | ||||||
Name Date of Birth Position(s) Portfolios Overseen | Principal Occupation(s) During Past Five Years | Other Directorships Past Five Years | Length of Board Service | |||
Stuart S. Parker 10/5/62 Board Member & President Portfolios Overseen: 96 | President of PGIM Investments LLC (formerly known as Prudential Investments LLC) (since January 2012); Executive Vice President of Prudential Investment Management Services LLC (since December 2012); formerly Executive Vice President of Jennison Associates LLC and Head of Retail Distribution of PGIM Investments LLC (June 2005-December 2011). | None. | Since January 2012 | |||
Visit our website at pgiminvestments.com
Interested Board Members | ||||||
Name Date of Birth Position(s) Portfolios Overseen | Principal Occupation(s) During Past Five Years | Other Directorships Held During Past Five Years | Length of Board Service | |||
Scott E. Benjamin 5/21/73 Board Member & Vice President Portfolios Overseen:96 | Executive Vice President (since June 2009) of PGIM Investments LLC; Executive Vice President (June 2009-June 2012) and Vice President (since June 2012) of Prudential Investment Management Services LLC; Executive Vice President (since September 2009) of AST Investment Services, Inc.; Senior Vice President of Product Development and Marketing, PGIM Investments (since February 2006); formerly Vice President of Product Development and Product Management, PGIM Investments LLC (2003-2006). | None. | Since March 2010 | |||
| Fund Officers(a) | ||||
Name Date of Birth Fund Position | Principal Occupation(s) During Past Five Years | Length of Service as Fund Officer | ||
Raymond A. O’Hara 9/11/55 Chief Legal Officer | Vice President and Corporate Counsel (since July 2010) of Prudential Insurance Company of America (Prudential); Vice President (March 2011-Present) of Pruco Life Insurance Company and Pruco Life Insurance Company of New Jersey; Vice President and Corporate Counsel (March 2011-Present) of Prudential Annuities Life Assurance Corporation; Chief Legal Officer of PGIM Investments LLC (since June 2012); Chief Legal Officer of Prudential Mutual Fund Services LLC (since June 2012) and Corporate Counsel of AST Investment Services, Inc. (since June 2012); formerly Assistant Vice President and Corporate Counsel (September 2008-July 2010) of The Hartford Financial Services Group, Inc.; formerly Associate (September 1980-December 1987) and Partner (January 1988–August 2008) of Blazzard & Hasenauer, P.C. (formerly, Blazzard, Grodd & Hasenauer, P.C.). | Since June 2012 | ||
PGIM Global Total Return Fund
| Fund Officers(a) | ||||
Name Date of Birth Fund Position | Principal Occupation(s) During Past Five Years | Length of Service as Fund Officer | ||
Dino Capasso 8/19/74 Chief Compliance Officer | Chief Compliance Officer (July 2019-Present) of PGIM Investments LLC; Chief Compliance Officer (July 2019-Present) of the PGIM Funds, Target Funds, Advanced Series Trust, The Prudential Series Fund, Prudential’s Gibraltar Fund, Inc., PGIM Global High Yield Fund, Inc., and PGIM High Yield Bond Fund, Inc.; Vice President and Deputy Chief Compliance Officer (June 2017-2019) of PGIM Investments LLC; formerly, Senior Vice President and Senior Counsel (January 2016-June 2017), and Vice President and Counsel (February 2012-December 2015) of Pacific Investment Management Company LLC. | Since March 2018 | ||
Andrew R. French 12/22/62 Secretary | Vice President of PGIM Investments LLC (December 2018-Present); formerly Vice President and Corporate Counsel (February 2010-December 2018) of Prudential; formerly Director and Corporate Counsel (2006-2010) of Prudential; Vice President and Assistant Secretary (since January 2007) of PGIM Investments LLC; Vice President and Assistant Secretary (since January 2007) of Prudential Mutual Fund Services LLC. | Since October 2006 | ||
Jonathan D. Shain 8/9/58 Assistant Secretary | Vice President and Corporate Counsel (since August 1998) of Prudential; Vice President and Assistant Secretary (since May 2001) of PGIM Investments LLC; Vice President and Assistant Secretary (since February 2001) of Prudential Mutual Fund Services LLC; formerly Vice President and Assistant Secretary (May 2003-June 2005) of AST Investment Services, Inc. | Since May 2005 | ||
Claudia DiGiacomo 10/14/74 Assistant Secretary | Vice President and Corporate Counsel (since January 2005) of Prudential; Vice President and Assistant Secretary of PGIM Investments LLC (since December 2005); formerly Associate at Sidley Austin Brown & Wood LLP (1999-2004). | Since December 2005 | ||
Diana N. Huffman 4/14/82 Assistant Secretary | Vice President and Corporate Counsel (since September 2015) of Prudential; formerly Associate at Willkie Farr & Gallagher LLP (2009-2015). | Since March 2019 | ||
Kelly A. Coyne 8/8/68 Assistant Secretary | Director, Investment Operations of Prudential Mutual Fund Services LLC (since 2010). | Since March 2015 | ||
Christian J. Kelly 5/5/75 Treasurer and Principal Financial and Accounting Officer | Vice President, Head of Fund Administration of PGIM Investments LLC (since November 2018); formerly, Director of Fund Administration of Lord Abbett & Co. LLC (2009-2018), Treasurer and Principal Accounting Officer of the Lord Abbett Family of Funds (2017-2018); Director of Accounting, Avenue Capital Group (2008-2009); Senior Manager, Investment Management Practice of Deloitte & Touche LLP (1998-2007). | Since January 2019 | ||
Visit our website at pgiminvestments.com
| Fund Officers(a) | ||||
Name Date of Birth Fund Position | Principal Occupation(s) During Past Five Years | Length of Service as Fund Officer | ||
Lana Lomuti 6/7/67 Assistant Treasurer | Vice President (since 2007) and Director (2005-2007), within PGIM Investments Fund Administration; formerly Assistant Treasurer (December 2007-February 2014) of The Greater China Fund, Inc. | Since April 2014 | ||
Russ Shupak 10/08/73 Assistant Treasurer | Vice President (since 2017) and Director (2013-2017), within PGIM Investments Fund Administration. | Since October 2019 | ||
Deborah Conway 3/26/69 Assistant Treasurer | Vice President (since 2017) and Director (2007-2017), within PGIM Investments Fund Administration. | Since October 2019 | ||
Elyse M. McLaughlin 1/20/74 Assistant Treasurer | Vice President (since 2017) and Director (2011-2017), within PGIM Investments Fund Administration. | Since October 2019 | ||
Charles H. Smith 1/11/73 Anti-Money Laundering Compliance Officer | Vice President, Corporate Compliance, Anti-Money Laundering Unit (since January 2015) of Prudential; committee member of the American Council of Life Insurers Anti-Money Laundering and Critical Infrastructure Committee (since January 2016); formerly Global Head of Economic Sanctions Compliance at AIG Property Casualty (February 2007-December 2014); Assistant Attorney General at the New York State Attorney General’s Office, Division of Public Advocacy. (August 1998-January 2007). | Since January 2017 | ||
(a) Excludes Mr. Parker and Mr. Benjamin, interested Board Members who also serve as President and Vice President, respectively.
Explanatory Notes to Tables:
| ∎ | Board Members are deemed to be “Interested,” as defined in the 1940 Act, by reason of their affiliation with PGIM Investments LLC and/or an affiliate of PGIM Investments LLC. |
| ∎ | Unless otherwise noted, the address of all Board Members and Officers is c/o PGIM Investments LLC, 655 Broad Street, Newark, New Jersey 07102-4410. |
| ∎ | There is no set term of office for Board Members or Officers. The Board Members have adopted a retirement policy, which calls for the retirement of Board Members on December 31 of the year in which they reach the age of 75. |
| ∎ | “Other Directorships Held” includes only directorships of companies required to register or file reports with the SEC under the 1934 Act (that is, “public companies”) or other investment companies registered under the 1940 Act. |
| ∎ | “Portfolios Overseen” includes all investment companies managed by PGIM Investments LLC. The investment companies for which PGIM Investments LLC serves as manager include the PGIM Funds, The Prudential Variable Contract Accounts, PGIM ETF Trust, PGIM High Yield Bond Fund, Inc., PGIM Global High Yield Fund, Inc., The Prudential Series Fund, Prudential’s Gibraltar Fund, Inc. and the Advanced Series Trust. |
PGIM Global Total Return Fund
Approval of Advisory Agreements(unaudited)
The Fund’s Board of Directors
The Board of Directors (the “Board”) of PGIM Global Total Return Fund1 (the “Fund”) consists of eleven individuals, nine of whom are not “interested persons” of the Fund, as defined in the Investment Company Act of 1940, as amended (the “1940 Act”) (the “Independent Directors”).2 The Board is responsible for the oversight of the Fund and its operations, and performs the various duties imposed on the directors of investment companies by the 1940 Act. The Independent Directors have retained independent legal counsel to assist them in connection with their duties. The Chair of the Board is an Independent Director. The Board has established four standing committees: the Audit Committee, the Nominating and Governance Committee, and two Investment Committees. Each committee is chaired by, and composed of, Independent Directors.
Annual Approval of the Fund’s Advisory Agreements
As required under the 1940 Act, the Board determines annually whether to renew the Fund’s management agreement with PGIM Investments LLC (“PGIM Investments”), the Fund’s subadvisory agreement with PGIM, Inc. (“PGIM”), on behalf of its PGIM Fixed Income unit, and the Fund’ssub-subadvisory agreement with PGIM Limited (“PGIML”). In considering the renewal of the agreements, the Board, including all of the Independent Directors, met on May 30, 2019 and on June11-13, 2019 and approved the renewal of the agreements through July 31, 2020, after concluding that the renewal of the agreements was in the best interests of the Fund and its shareholders.
In advance of the meetings, the Board requested and received materials relating to the agreements, and had the opportunity to ask questions and request further information in connection with its consideration. Among other things, the Board considered comparative fee information from PGIM Investments, PGIM, and where appropriate, affiliates of PGIM. Also, the Board considered comparisons with other mutual funds in relevant Peer Universes and Peer Groups, as is further discussed below.
In approving the agreements, the Board, including the Independent Directors advised by independent legal counsel, considered the factors it deemed relevant, including the nature, quality and extent of services provided by PGIM Investments, the subadviser, and, as relevant, its affiliates, the performance of the Fund, the profitability of PGIM Investments and its affiliates, expenses and fees, and the potential for economies of scale that may be shared with the Fund and its shareholders as the Fund’s assets grow. In their deliberations, the Directors did not identify any single factor which alone was responsible for the Board’s decision to approve the agreements with respect to the Fund. In connection with its
| 1 | PGIM Global Total Return Fund is a series of Prudential Global Total Return Fund, Inc. |
| 2 | Grace C. Torres was an Interested Director of the Fund at the time the Board considered and approved the renewal of the Fund’s advisory agreements, but has since become an Independent Director of the Fund. |
| PGIM Global Total Return Fund | ||
Approval of Advisory Agreements(continued)
deliberations, the Board considered information provided by PGIM Investments throughout the year at regular Board meetings, presentations from portfolio managers and other information, as well as information furnished at or in advance of the meetings on May 30, 2019 and on June11-13, 2019.
The Directors determined that the overall arrangements between the Fund and PGIM Investments, which serves as the Fund’s investment manager pursuant to a management agreement, between PGIM Investments and PGIM, which, through its PGIM Fixed Income unit, serves as the Fund’s subadviser pursuant to the terms of a subadvisory agreement with PGIM Investments, and between PGIM and PGIML, which serves as the Fund’ssub-subadviser pursuant to the terms of asub-subadvisory agreement with PGIM, are in the best interests of the Fund and its shareholders in light of the services performed, fees charged and such other matters as the Directors considered relevant in the exercise of their business judgment.
The material factors and conclusions that formed the basis for the Directors’ reaching their determinations to approve the continuance of the agreements are separately discussed below.
Nature, Quality and Extent of Services
The Board received and considered information regarding the nature, quality and extent of services provided to the Fund by PGIM Investments, PGIM Fixed Income, and PGIML. The Board noted that PGIM Fixed Income and PGIML are affiliated with PGIM Investments. The Board considered the services provided by PGIM Investments, including but not limited to the oversight of the subadviser andsub-subadviser for the Fund, as well as the provision of fund recordkeeping, compliance and other services to the Fund, and PGIM Investments’ role as administrator for the Fund’s liquidity risk management program. With respect to PGIM Investments’ oversight of the subadviser andsub-subadviser, the Board noted that PGIM Investments’ Strategic Investment Research Group (“SIRG”), which is a business unit of PGIM Investments, is responsible for monitoring and reporting to PGIM Investments’ senior management on the performance and operations of the subadviser andsub-subadviser. The Board also considered that PGIM Investments pays the salaries of all of the officers and interested Directors of the Fund who are part of Fund management. The Board also considered the investment subadvisory services provided by PGIM Fixed Income and PGIML, including investment research and security selection, as well as adherence to the Fund’s investment restrictions and compliance with applicable Fund policies and procedures. The Board considered PGIM Investments’ evaluation of the subadviser andsub-subadviser, as well as PGIM Investments’ recommendation, based on its review of the subadviser andsub-subadviser, to renew the subadvisory andsub-subadvisory agreements.
| Visit our website at pgiminvestments.com |
The Board considered the qualifications, backgrounds and responsibilities of PGIM Investments’ senior management responsible for the oversight of the Fund, PGIM Fixed Income, and PGIML, and also considered the qualifications, backgrounds and responsibilities of PGIM Fixed Income’s portfolio managers who are responsible for theday-to-day management of the Fund’s portfolio. The Board was provided with information pertaining to PGIM Investments’, PGIM Fixed Income’s, and PGIML’s organizational structure, senior management, investment operations, and other relevant information pertaining to PGIM Investments, PGIM Fixed Income, and PGIML. The Board also noted that it received favorable compliance reports from the Fund’s Chief Compliance Officer (“CCO”) as to PGIM Investments, PGIM Fixed Income, and PGIML.
The Board concluded that it was satisfied with the nature, extent and quality of the investment management services provided by PGIM Investments, the subadvisory services provided to the Fund by PGIM Fixed Income, and thesub-subadvisory services provided by PGIML, and that there was a reasonable basis on which to conclude that the Fund benefits from the services provided by PGIM Investments, PGIM Fixed Income, and PGIML under the management, subadvisory andsub-subadvisory agreements.
Costs of Services and Profits Realized by PGIM Investments
The Board was provided with information on the profitability of PGIM Investments and its affiliates in serving as the Fund’s investment manager. The Board discussed with PGIM Investments the methodology utilized in assembling the information regarding profitability and considered its reasonableness. The Board recognized that it is difficult to make comparisons of profitability from fund management contracts because comparative information is not generally publicly available and is affected by numerous factors, including the structure of the particular adviser, the types of funds it manages, its business mix, numerous assumptions regarding allocations and the adviser’s capital structure and cost of capital. Taking these factors into account, the Board concluded that the profitability of PGIM Investments and its affiliates in relation to the services rendered was not unreasonable.
Economies of Scale
The Board received and discussed information concerning economies of scale that PGIM Investments may realize as the Fund’s assets grow beyond current levels. The Board noted that the management fee schedule for the Fund includes breakpoints, which have the effect of decreasing the fee rate as assets increase. During the course of time, the Board has considered information regarding the launch date of the Fund, the management fees of the Fund compared to those of similarly managed funds and PGIM Investments’ investment in the Fund over time. The Board noted that economies of scale can be shared with the Fund in other ways, including low management fees from inception, additional
| PGIM Global Total Return Fund | ||
Approval of Advisory Agreements(continued)
technological and personnel investments to enhance shareholder services, and maintaining existing expense structures in the face of a rising cost environment. The Board also considered PGIM Investments’ assertion that it continually evaluates the management fee schedule of the Fund and the potential to share economies of scale through breakpoints or fee waivers as asset levels increase.
The Board recognized the inherent limitations of any analysis of economies of scale, stemming largely from the Board’s understanding that most of PGIM Investments’ costs are not specific to individual funds, but rather are incurred across a variety of products and services.
Other Benefits to PGIM Investments, PGIM Fixed Income, and PGIML
The Board considered potential ancillary benefits that might be received by PGIM Investments, PGIM Fixed Income, PGIML and their affiliates as a result of their relationship with the Fund. The Board concluded that potential benefits to be derived by PGIM Investments included transfer agency fees received by the Fund’s transfer agent (which is affiliated with PGIM Investments), as well as benefits to its reputation or other intangible benefits resulting from PGIM Investments’ association with the Fund. The Board concluded that the potential benefits to be derived by PGIM Fixed Income and PGIML included the ability to use soft dollar credits, as well as the potential benefits consistent with those generally resulting from an increase in assets under management, specifically, potential access to additional research resources and benefits to their reputations. The Board concluded that the benefits derived by PGIM Investments, PGIM Fixed Income, and PGIML were consistent with the types of benefits generally derived by investment managers and subadvisers to mutual funds.
Performance of the Fund / Fees and Expenses
The Board considered certain additional factors and made related conclusions relating to the historical performance of the Fund for theone-, three-, five- andten-year periods ended December 31, 2018.
The Board also considered the Fund’s actual management fee, as well as the Fund’s net total expense ratio, for the fiscal year ended October 31, 2018. The Board considered the management fee for the Fund as compared to the management fee charged by PGIM Investments to other funds and the fee charged by other advisers to comparable mutual funds in a Peer Group. The actual management fee represents the fee rate actually paid by Fund shareholders and includes any fee waivers or reimbursements. The net total expense ratio for the Fund represents the actual expense ratio incurred by Fund shareholders.
| Visit our website at pgiminvestments.com |
The mutual funds included in the Peer Universe, which was used to consider performance, and the Peer Group, which was used to consider expenses and fees, were objectively determined by Broadridge, an independent provider of mutual fund data. In certain circumstances, PGIM Investments also provided supplemental Peer Universe or Peer Group information, for reasons addressed with the Board. The comparisons placed the Fund in various quartiles over various periods, with the first quartile being the best 25% of the mutual funds (for performance, the best performing mutual funds and, for expenses, the lowest cost mutual funds).
The section below summarizes key factors considered by the Board and the Board’s conclusions regarding the Fund’s performance, fees and overall expenses. net performance comparisons (which reflect the impact on performance of fund expenses, or any subsidies, expense caps or waivers that may be applicable) with the Peer Universe, actual management fees with the Peer Group (which reflect the impact of any subsidies or fee waivers), and net total expenses with the Peer Group, each of which were key factors considered by the Board.
| Net Performance | 1 Year | 3 Years | 5 Years | 10 Years | ||||
2nd Quartile | 1st Quartile | 1st Quartile | 1st Quartile | |||||
| Actual Management Fees:1st Quartile | ||||||||
| Net Total Expenses: 1st Quartile | ||||||||
| • | The Board noted that the Fund outperformed its benchmark index over the three-, five- andten-year periods, though it underperformed over theone-year period. |
| • | The Board and PGIM Investments agreed to retain the Fund’s existing contractual expense cap which (exclusive of certain fees and expenses) caps total annual operating expenses at 0.88% for Class A shares, 1.63% for Class B shares, 1.63% for Class C shares, 0.63% for Class Z shares, 1.08% for Class R2 shares, 0.83% for Class R4 shares, and 0.58% for Class R6 shares through February 29, 2020. |
| • | In addition, PGIM Investments will waive management fees or shared operating expenses on any share class to the same extent that it waives such expenses on any other share class, and has agreed that total annual fund operating expenses for Class R6 shares will not exceed total annual fund operating expenses for Class Z shares. |
| • | The Board concluded that, in light of the above, it would be in the best interests of the Fund and its shareholders to renew the agreements. |
| • | The Board concluded that the management fees (including subadvisory fees) and total expenses were reasonable in light of the services provided. |
* * *
After full consideration of these factors, the Board concluded that the approval of the agreements was in the best interests of the Fund and its shareholders.
| PGIM Global Total Return Fund | ||
Supplement dated December 18, 2019
to the Currently Effective Summary Prospectus, Prospectus
and Statement of Additional Information of the Funds Listed Below
This supplement should be read in conjunction with your Summary Prospectus, Statutory Prospectus and Statement of Additional Information, be retained for future reference and is in addition to any existing Fund supplements.
The Board of Directors/Trustees for each Fund listed below has approved the conversion of all issued and outstanding Class B shares of the Funds to Class A shares of the same Fund, effective on or about June 26, 2020.
As a result, effective on or about the close of business on June 26, 2020, all of the issued and outstanding Class B shares of a Fund will be converted into Class A shares of that Fund with the same relative aggregate net asset value as the Class B shares held immediately prior to the conversion. Class A shares currently have lower total expense ratios, and equal or lower distribution fees and shareholder servicing fees payable under the Fund’s 12b-1 plan than Class B shares. No sales load, fee, or other charge will be imposed on the conversion of these shares. Class A shares are not subject to the contingent deferred sales charge (if any) currently charged on the redemption of Class B shares. Please refer to your Fund’s Prospectus for more information regarding Class A shares. The conversion is not expected to be a taxable event for federal income tax purposes and should not result in recognition of gain or loss by converting shareholders.
LR1263
The Prudential Investment Portfolios, Inc.
PGIM Balanced Fund
PGIM Jennison Focused Value Fund
PGIM Jennison Growth Fund
Prudential Investment Portfolios 3
PGIM Jennison Focused Growth Fund
PGIM QMA Large-Cap Value Fund
PGIM Real Assets Fund
Prudential Investment Portfolios 4
PGIM Muni High Income Fund
Prudential Investment Portfolios 5
PGIM Jennison Diversified Growth Fund
Prudential Investment Portfolios 6
PGIM California Muni Income Fund
Prudential Investment Portfolios 7
PGIM Jennison Value Fund
Prudential Investment Portfolios 9
PGIM QMA Large-Cap Core Equity Fund
Prudential Investment Portfolios, Inc. 10
PGIM Jennison Global Equity Income Fund
PGIM QMA Mid-Cap Value Fund
Prudential Investment Portfolios 12
PGIM Global Real Estate Fund
PGIM US Real Estate Fund
Prudential Investment Portfolios, Inc. 14
PGIM Government Income Fund
Prudential Investment Portfolios, Inc. 15
PGIM High Yield Fund
Prudential Investment Portfolios 16
PGIM Income Builder Fund
Prudential Investment Portfolios, Inc. 17
PGIM Total Return Bond Fund
Prudential Investment Portfolios 18
PGIM Jennison 20/20 Focus Fund
Prudential Global Total Return Fund, Inc.
PGIM Global Total Return Fund
Prudential Jennison Blend Fund, Inc.
PGIM Jennison Blend Fund
Prudential Jennison Mid-Cap Growth Fund, Inc.
PGIM Jennison Mid-Cap Growth Fund
Prudential Jennison Natural Resources Fund, Inc.
PGIM Jennison Natural Resources Fund
Prudential Jennison Small Company Fund, Inc.
PGIM Jennison Small Company Fund
Prudential Government Money Market Fund, Inc.
PGIM Government Money Market Fund
Prudential National Muni Fund, Inc.
PGIM National Muni Fund
Prudential Sector Funds, Inc.
PGIM Jennison Financial Services Fund
PGIM Jennison Health Sciences Fund
PGIM Jennison Utility Fund
Prudential Short-Term Corporate Bond Fund, Inc.
PGIM Short-Term Corporate Bond Fund
Prudential World Fund, Inc.
PGIM QMA International Equity Fund
| ∎ TELEPHONE | ∎ WEBSITE | |||
655 Broad Street Newark, NJ 07102 | (800) 225-1852 | pgiminvestments.com | ||
| PROXY VOTING |
| The Board of Directors of the Fund has delegated to the Fund’s subadviser the responsibility for voting any proxies and maintaining proxy recordkeeping with respect to the Fund. A description of these proxy voting policies and procedures is available without charge, upon request, by calling(800) 225-1852. Information regarding how the Fund voted proxies relating to portfolio securities during the most recent 12-month period ended June 30 is available on the Fund’s website and on the Securities and Exchange Commission’s website. |
| DIRECTORS |
| Ellen S. Alberding • Kevin J. Bannon• Scott E. Benjamin• Linda W. Bynoe• Barry H. Evans• Keith F. Hartstein• Laurie Simon Hodrick• Michael S. Hyland• Stuart S. Parker• Brian K. Reid• Grace C. Torres |
| OFFICERS |
| Stuart S. Parker,President• Scott E. Benjamin,Vice President• Christian J. Kelly,Treasurer and Principal Financial and Accounting Officer• Raymond A. O’Hara,Chief Legal Officer• Dino Capasso,Chief Compliance Officer• Charles H. Smith,Anti-Money Laundering Compliance Officer• Andrew R. French,Secretary• Jonathan D. Shain,Assistant Secretary• Claudia DiGiacomo,Assistant Secretary• Diana N. Huffman,Assistant Secretary• Kelly A. Coyne,Assistant Secretary• Lana Lomuti,Assistant Treasurer• Russ Shupak,Assistant Treasurer• Elyse McLaughlin,Assistant Treasurer• Deborah Conway,Assistant Treasurer |
| MANAGER | PGIM Investments LLC | 655 Broad Street Newark, NJ 07102 | ||
| ||||
| SUBADVISER | PGIM Fixed Income | 655 Broad Street Newark, NJ 07102 | ||
| ||||
| DISTRIBUTOR | Prudential Investment Management Services LLC | 655 Broad Street Newark, NJ 07102 | ||
| ||||
| CUSTODIAN | The Bank of New York Mellon | 240 Greenwich Street New York, NY 10286 | ||
| ||||
| TRANSFER AGENT | Prudential Mutual Fund Services LLC | PO Box 9658 Providence, RI 02940 | ||
| ||||
| INDEPENDENT REGISTERED PUBLIC ACCOUNTING FIRM | KPMG LLP | 345 Park Avenue New York, NY 10154 | ||
| ||||
| FUND COUNSEL | Willkie Farr & Gallagher LLP | 787 Seventh Avenue New York, NY 10019 | ||
| ||||
| An investor should consider the investment objectives, risks, charges, and expenses of the Fund carefully before investing. The prospectus and summary prospectus contain this and other information about the Fund. An investor may obtain the prospectus and summary prospectus by visiting our website atpgiminvestments.com or by calling(800) 225-1852. The prospectus and summary prospectus should be read carefully before investing. |
| E-DELIVERY |
| To receive your mutual fund documents online, go topgiminvestments.com/edelivery and enroll. Instead of receiving printed documents by mail, you will receive notification via email when new materials are available. You can cancel your enrollment or change your email address at any time by visiting the website address above. |
| SHAREHOLDER COMMUNICATIONS WITH DIRECTORS |
| Shareholders can communicate directly with the Board of Directors by writing to the Chair of the Board, PGIM Global Total Return Fund, PGIM Investments, Attn: Board of Directors, 655 Broad Street, Newark, NJ 07102. Shareholders can communicate directly with an individual Director by writing to the same address. Communications are not screened before being delivered to the addressee. |
| AVAILABILITY OF PORTFOLIO HOLDINGS |
| The Fund files its complete schedule of portfolio holdings with the Securities and Exchange Commission on Form N-PORT. The Fund’s Form N-PORT filings are available on the Commission’s website at sec.gov. Form N-PORT is filed with the Commission quarterly, and each Fund’s full portfolio holdings as of the first and third fiscal quarter-ends (as of the third month of the Fund’s fiscal quarter for reporting periods on or after September 30, 2019) will be made publicly available 60 days after the end of each quarter at sec.gov. |
| The Fund’s Statement of Additional Information contains additional information about the Fund’s Directors and is available without charge, upon request, by calling (800) 225-1852. |
Mutual Funds:
| ARE NOT INSURED BY THE FDIC OR ANY FEDERAL GOVERNMENT AGENCY | MAY LOSE VALUE | ARE NOT A DEPOSIT OF OR GUARANTEED BY ANY BANK OR ANY BANK AFFILIATE |
PGIM GLOBAL TOTAL RETURN FUND
| SHARE CLASS | A | B | C | Z | R2 | R4 | R6 | |||||||
| NASDAQ | GTRAX | PBTRX | PCTRX | PZTRX | PGTOX | PGTSX | PGTQX | |||||||
| CUSIP | 74439A103 | 74439A202 | 74439A301 | 74439A400 | 74439A863 | 74439A855 | 74439A509 |
MF169E

PGIM GLOBAL TOTAL RETURN (USD HEDGED) FUND
ANNUAL REPORT
OCTOBER 31, 2019
COMING SOON: PAPERLESS SHAREHOLDER REPORTS
Beginning on January 1, 2021, as permitted by regulations adopted by the Securities and Exchange Commission, paper copies of the Fund’s annual and semiannual shareholder reports will no longer be sent by mail, unless you specifically request paper copies of the reports. Instead, the reports will be made available on the Fund’s website (pgiminvestments.com), and you will be notified by mail each time a report is posted and provided with a website link to access the report.
If you already elected to receive shareholder reports electronically, you will not be affected by this change and you need not take any action. You may elect to receive shareholder reports and other communications from the Fund electronically anytime by contacting your financial intermediary (such as a broker-dealer or bank) or, if you are a direct investor, by calling 1-800-225-1852 or by sending an email request to PGIM Investments at shareholderreports@pgim.com.
You may elect to receive all future reports in paper free of charge. If you invest through a financial intermediary, you can contact your financial intermediary or follow instructions included with this notice to elect to continue to receive paper copies of your shareholder reports. If you invest directly with the Fund, you can call 1-800-225-1852 or send an email request to shareholderreports@pgim.com to let the Fund know you wish to continue receiving paper copies of your shareholder reports. Your election to receive reports in paper will apply to all funds held in your account if you invest through your financial intermediary or all funds held with the fund complex if you invest directly with the Fund.

To enroll in e-delivery, go to pgiminvestments.com/edelivery
| Objective:Total return, through a combination of current income and capital appreciation |
Highlights(unaudited)
| • | Overall, duration and yield curve positioning, as well as sector and issuer selection, were all large contributors to the Fund’s performance over the reporting period. |
| • | Strong sector and issuer selection across developed sovereign debt, European peripheral issuers (i.e., non-core European countries), high yield corporates, investment-grade corporates, high-quality structured products, and emerging markets agencies added to performance for the period. Looking at specific issuers, overweights to Greece, Italy and Portugal as well as an underweight to France were among the largest contributors to performance. |
| • | Positioning in developed Treasuries and emerging regional authorities hurt the Fund’s performance over the reporting period. |
| • | Looking at specific issuers, overweights to Argentina and the Province of Buenos Aires were among the largest detractors from performance. |
This report is not authorized for distribution to prospective investors unless preceded or accompanied by a current prospectus.
The views expressed in this report and information about the Fund’s portfolio holdings are for the period covered by this report and are subject to change thereafter.
Mutual funds are distributed by Prudential Investment Management Services LLC (PIMS), member SIPC. PGIM Fixed Income is a unit of PGIM, Inc. (PGIM), a registered investment adviser. PIMS and PGIM are Prudential Financial companies.© 2019 Prudential Financial, Inc. and its related entities. PGIM and the PGIM logo are service marks of Prudential Financial, Inc. and its related entities, registered in many jurisdictions worldwide.
| 2 | Visit our website at pgiminvestments.com |
| 5 | ||||
| 6 | ||||
| 7 | ||||
| 10 | ||||
| 13 | ||||
| 15 | ||||
| PGIM Global Total Return (USD Hedged) Fund | 3 |
This Page Intentionally Left Blank

Dear Shareholder:
We hope you find the annual report for the PGIM Global Total Return (USD Hedged) Fund informative and useful. The report covers performance for the 12-month period that ended October 31, 2019.
While the US economy remained healthy, with rising corporate profits and strong job growth, the Federal Reserve cut interest rates three times in the latter half of the period. The cuts were a proactive attempt by the Fed to extend the longest domestic economic expansion on record as growth in many regions weakened. China in particular showed signs of slowing amid trade tensions with the US, and turmoil in the United Kingdom continued as it negotiates an exit from the European Union.
The interest-rate cuts helped boost the performance of stocks globally. For the period overall, large-cap US equities along with stocks in developed and emerging foreign markets all rose by double digits. Small-cap US stocks posted a single-digit gain. This positive performance came despite significant volatility early in the period. Equities plunged at the end of 2018 on concerns about China’s economy, a potential global trade war, higher interest rates, and worries that profit growth might slow. Stocks reversed course early in 2019, rising sharply after the Fed moderated its position on additional rate hikes for the remainder of the year.
The overall US bond market posted strong returns during the period on a significant rally in interest rates that saw the 10-year US Treasury yield decline from over 3% to under 2%. Investment-grade corporate bonds led the way with a double-digit gain, while corporate high yield and municipal bonds each had a return in the high single digits. Globally, bonds in developed markets delivered strong returns, and emerging markets debt rose by double digits.
Regarding your investments with PGIM, we believe it is important to maintain a diversified portfolio of funds consistent with your tolerance for risk, time horizon, and financial goals. Your financial advisor can help you create a diversified investment plan that may include funds covering all the basic asset classes and that reflects your personal investor profile and risk tolerance. However, diversification and asset allocation strategies do not assure a profit or protect against loss in declining markets.
At PGIM Investments, we consider it a great privilege and responsibility to help investors participate in opportunities across global markets while meeting their toughest investment challenges. PGIM is a top-10 global investment manager with more than $1 trillion in assets under management. This scale and investment expertise allow us to deliver actively managed funds and strategies to meet the needs of investors around the globe.
Thank you for choosing our family of funds.
Sincerely,

Stuart S. Parker, President
PGIM Global Total Return (USD Hedged) Fund
December 16, 2019
| PGIM Global Total Return (USD Hedged) Fund | 5 |
Your Fund’s Performance(unaudited)
Performance data quoted represents past performance. Past performance does not guarantee future results. The investment return and principal value of an investment will fluctuate, so that an investor’s shares, when redeemed, may be worth more or less than their original cost. Current performance may be lower or higher than the past performance data quoted. An investor may obtain performance data as of the most recent month-end by visiting our website atpgiminvestments.com or by calling (800) 225-1852.
| Average Annual Total Returns as of 10/31/19 (with sales charges) | ||||
| One Year (%) | Since Inception (%) | |||
| Class A | 12.62 | 5.06 (12/12/17) | ||
| Class C | 14.59 | 6.14 (12/12/17) | ||
| Class Z | 16.71 | 7.19 (12/12/17) | ||
| Class R6 | 16.79 | 7.25 (12/12/17) | ||
| Bloomberg Barclays Global Aggregate (USD Hedged) Index | ||||
| 10.67 | 5.46 | |||
Average Annual Total Returns as of 10/31/19 | ||||
| One Year (%) | Since Inception (%) | |||
| Class A | 16.40 | 6.91 (12/12/17) | ||
| Class C | 15.59 | 6.14 (12/12/17) | ||
| Class Z | 16.71 | 7.19 (12/12/17) | ||
| Class R6 | 16.79 | 7.25 (12/12/17) | ||
| Bloomberg Barclays Global Aggregate (USD Hedged) Index | ||||
| 10.67 | 5.46 | |||
| 6 | Visit our website at pgiminvestments.com |
Growth of a $10,000 Investment(unaudited)
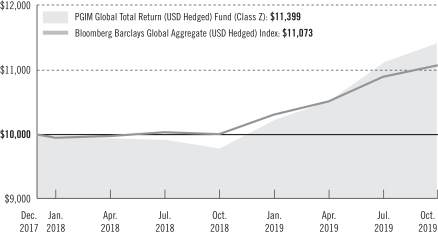
The graph compares a $10,000 investment in the Fund’s Class Z shares with a similar investment in the Bloomberg Barclays Global Aggregate (USD Hedged) Index by portraying the initial account values at the commencement of operations for Class Z shares (December 12, 2017) and the account values at the end of the current fiscal period (October 31, 2019) as measured on a quarterly basis. For purposes of the graph, and unless otherwise indicated, it has been assumed that (a) all recurring fees (including management fees) were deducted; and (b) all dividends and distributions were reinvested. The line graph provides information for Class Z shares only. As indicated in the tables provided earlier, performance for other share classes will vary due to the differing charges and expenses applicable to each share class (as indicated in the following paragraphs). Without waiver of fees and/or expense reimbursements, if any, the Fund’s returns would have been lower.
Past performance does not predict future performance. Total returns and the ending account values in the graph include changes in share price and reinvestment of dividends and capital gains distributions in a hypothetical investment for the periods shown. The Fund’s total returns do not reflect the deduction of income taxes on an individual’s investment. Taxes may reduce your actual investment returns on income or gains paid by the Fund or any gains you may realize if you sell your shares.
Source: PGIM Investments LLC and Lipper Inc.
Since Inception returns for the Index are measured from the closest month-end to the Fund’s inception date.
| PGIM Global Total Return (USD Hedged) Fund | 7 |
Your Fund’s Performance(continued)
The returns in the tables do not reflect the deduction of taxes that a shareholder would pay on Fund distributions or following the redemption of Fund shares. The average annual total returns take into account applicable sales charges, which are described for each share class in the table below.
| Class A | Class C | Class Z | Class R6 | |||||
| Maximum initial sales charge | For purchases on or after July 15, 2019: 3.25% of the public offering price. For purchases prior to July 15, 2019: 4.50% of the public offering price | None | None | None | ||||
| Contingent deferred sales charge (CDSC) (as a percentage of the lower of the original purchase price or the net asset value at redemption) | For purchases on or after July 15, 2019: 1.00% on sales of $500,000 or more made within 12 months of purchase. For purchases prior to July 15, 2019: 1.00% on sales of $1 million or more made within 12 months of purchase. | 1.00% on sales made within 12 months of purchase | None | None | ||||
| Annual distribution and service(12b-1) fees (shown as a percentage of average daily net assets) | 0.25% | 1.00% | None | None | ||||
Benchmark Definitions
Bloomberg Barclays Global Aggregate (USD Hedged) Index—The Bloomberg Barclays Global Aggregate (USD Hedged) Index is an unmanaged index of global investment-grade fixed income markets. The three major components of this index are the US Aggregate, the Pan-European Aggregate, and the Asian-Pacific Aggregate Indices. Returns for the index are hedged to the US Dollar.
Investors cannot invest directly in an index or average. The returns for the Index would be lower if they included the effects of sales charges, operating expenses of a mutual fund, or taxes.
| 8 | Visit our website at pgiminvestments.com |
| Distributions and Yields as of 10/31/19 | ||||||
| Total Distributions Paid for 12 Months ($) | SEC 30-Day Subsidized Yield* (%) | SEC 30-Day Unsubsidized Yield** (%) | ||||
| Class A | 0.56 | 1.55 | 0.03 | |||
| Class C | 0.49 | 1.12 | –5.97 | |||
| Class Z | 0.59 | 2.12 | –0.30 | |||
| Class R6 | 0.59 | 2.17 | 0.85 | |||
*SEC 30-Day Subsidized Yield (%)—A standardized yield calculation created by the Securities and Exchange Commission, it reflects the income earned during a 30-day period, after the deduction of the Fund’s net expenses (net of any expense waivers or reimbursements). The investor experience is represented by the SEC 30-Day Subsidized Yield.
**SEC 30-Day Unsubsidized Yield (%)—A standardized yield calculation created by the Securities and Exchange Commission, it reflects the income earned during a 30-day period, after the deduction of the Fund’s gross expenses. The investor experience is represented by the SEC 30-Day Subsidized Yield.
| Credit Quality expressed as a percentage of total investments as of 10/31/19 (%) | ||||
| AAA | 22.2 | |||
| AA | 8.9 | |||
| A | 20.8 | |||
| BBB | 29.0 | |||
| BB | 8.4 | |||
| B | 4.7 | |||
| CCC | 0.6 | |||
| Not Rated | 5.1 | |||
| Cash/Cash Equivalents | 0.3 | |||
| Total | 100.0 | |||
Source: PGIM Fixed Income
Credit ratings reflect the highest rating assigned by a nationally recognized statistical rating organization (NRSRO) such as Moody’s Investors Service, Inc. (Moody’s), S&P Global Ratings (S&P), or Fitch, Inc. (Fitch). Credit ratings reflect the common nomenclature used by both S&P and Fitch. Where applicable, ratings are converted to the comparable S&P/Fitch rating tier nomenclature. These rating agencies are independent and are widely used. The Not Rated category consists of securities that have not been rated by a NRSRO. Credit ratings are subject to change.
| PGIM Global Total Return (USD Hedged) Fund | 9 |
Strategy and Performance Overview(unaudited)
How did the Fund perform?
ThePGIM Global Total Return (US Hedged) Fund’s Class Z shares returned 16.71% in the 12-month reporting period that ended October 31, 2019, outperforming the 10.67% return of the Bloomberg Barclays Global Aggregate (US Hedged) Index (the Index).
What were the market conditions?
| • | The fourth quarter of 2018 represented a major shift in market sentiment across global asset classes. Interest rates peaked in early October and aggressively rallied as Brexit worries, fears of an escalating trade war, weaker economic data, and a hawkish Federal Reserve (Fed) punished risk assets, sending developed-market interest rates to yearly lows. As the fourth quarter concluded, the yield on 10-year German government bunds and Japanese government bonds (JGB) plummeted to depths not seen in years, while the 10-year US Treasury note yield ended the quarter just above its low from early in 2018. Additionally, after beginning the quarter higher, the yield on Italy’s 10-year BTP government bond declined below 3% for the first time since September 2018 as Italy slowly moved its 2019 budget target closer to the European Commission’s suggestion. |
| • | The decline in rates throughout most of first quarter of 2019 accelerated late in the quarter after the latest dovish pivots by the European Central Bank (ECB) and the Fed. The breadth of the decline left 10-year yields in several countries at multi-year or record lows. The Fed continued its pivot into the March Federal Open Market Committee (FOMC) meeting when the median federal funds rate projections for 2019, 2020, and 2021 each fell by 50 basis points (bps). (One basis point is 0.01%.) The FOMC also indicated that the balance sheet roll-off—a policy widely viewed as a modest tightening measure—would slow in May and end in September 2019. The ongoing weakness in European economic and inflation data (e.g., the precipitous decline in Germany’s March Purchasing Managers’ Index to 44.7 from more than 62 in late 2017) led to a bull flattening along the bund yield curve. (A yield curve is a series of points that graphically shows the yields on fixed income securities that have the same credit quality but different maturities.) |
| • | Interest rates across the G4 tumbled throughout the second quarter of 2019 (Japan: –7 bps, Germany: –25 bps, UK: –17 bps, and US Treasuries: –40 bps), driven by lackluster global economic data, lingering US-China trade tensions, and rising probabilities of easier global monetary policies. The Fed’s shift toward a more accommodative stance culminated in its June meeting with a drop in the median estimate of the long-run neutral fed funds rate from 2.8% to 2.5%—the top of its target range—as the third quarter of 2019 commenced. European economic and inflation data remained soft in the second quarter, which contributed to a bull flattening of the bunds curve. |
| • | Developed market rates took another leg down in the third quarter of 2019 as central banks collectively eased policies to counter signs of mounting global economic weakness and uncertainty. It was the second consecutive quarter of double-digit basis point |
| 10 | Visit our website at pgiminvestments.com |
declines for US and German 10-year yields (down 35 bps and 25 bps to 1.67% and –0.57%, respectively), while the Japanese 10-year yield also fell deeper into negative territory (down 10 bps to -0.22%). As the fourth quarter of 2019 progresses, US Treasury yields remain elevated in a global context, particularly with nearly $15 trillion in negative-yielding debt outstanding. In Europe, the ECB’s decision to renew its asset purchases creates a supportive backdrop for rates, particularly at the 7-year point of the German bund and French Oat markets. After the Bank of Japan (BoJ) mentioned the desirability of a steeper yield curve to support the banking sector, it subsequently announced reduced purchases at the back of the curve. Looking ahead, the BoJ may take additional steps in its attempt to steepen the yield curve. |
| • | Front-end Treasury yields fell, and the curve steepened in October 2019 as US-China trade uncertainty and weaker-than-expected US economic data drove a flight to safety. As part of the Fed’s expected 25-bp reduction in the targeted federal funds range, the FOMC removed a reference to “act as appropriate” to sustain the economic expansion, signaling for many that it is done cutting rates for now. UK gilt yields rose 14-16 bps as the risk of a no-deal Brexit receded, and the 10-year bund yields closed 16 bps higher to –0.41%. Elsewhere, the JGB curve flattened, with the 10-year JGB yield higher by 7 bps for the month. |
What worked?
| • | Overall, duration and yield curve positioning, as well as sector and issuer selection, were all large contributors to the Fund’s performance over the reporting period. |
| • | Strong sector and issuer selection across developed sovereign debt, European peripheral issuers (i.e., non-core European countries), high yield corporates, investment-grade corporates, high-quality structured products, and emerging markets agencies added to performance for the period. Looking at specific issuers, overweights to Greece, Italy and Portugal as well as an underweight to France were among the largest contributors to performance. |
| • | In developed rates, a long duration position in the US was the largest contributor to performance. In emerging markets, long duration positioning in Brazilian rates was a strong contributor to performance. (Duration is a measure of the interest rate sensitivity of a bond portfolio or debt securities that is expressed as a number of years.) A curve flattener in euro rates also added value. |
| • | Although overall currency positioning hurt performance, overweights to the Russian ruble, Mexican peso, and Egyptian pound helped to offset some of the losses. |
What didn’t work?
| • | Positioning in developed Treasuries and emerging regional authorities hurt the Fund’s performance over the reporting period. |
| • | Looking at specific issuers, overweights to Argentina and the Province of Buenos Aires were among the largest detractors from performance. |
| PGIM Global Total Return (USD Hedged) Fund | 11 |
Strategy and Performance Overview(continued)
| • | In developed rates, duration positioning in Canadian rates modestly hurt performance. In emerging rates, duration positioning in the Czech Republic was a slight detractor. |
| • | Currency positioning hurt performance over the period. An overweight to the Norwegian krone and underweights to the euro and South African rand were among the largest detractors from performance. |
Did the Fund use derivatives?
| • | The Fund used interest-rate futures and swaps to implement its investment strategy, as well as to help manage duration and yield curve exposure. The use of interest-rate futures had a negative impact on the Fund’s performance while the use of interest-rate swaps added to performance. |
| • | Credit derivatives, primarily in the form of credit default swap index (CDX) positions, were used to either add risk exposure to certain issuers or to hedge credit risk imposed by certain issuers. Overall, credit derivative exposure added value during the reporting period. |
| • | In addition, to implement most currency strategies, the Fund employed foreign exchange derivatives, which negatively impacted performance. |
Current outlook
| • | PGIM Fixed Income maintains its positive view of fundamentals in the credit sectors of fixed income with positioning in spread sectors, including high yield, emerging market, and structured product sectors such as commercial mortgage-backed securities (CMBS) and asset-backed securities (ABS). Within CMBS, PGIM Fixed Income continues to find value in high-quality securities of new-issue conduit deals. In ABS, the Fund is maintaining an up-in-quality focus (with some exceptions) as capital stack/issuer valuations remain compressed. PGIM Fixed Income is constructive on US high yield and continues to like independent power producers and US consumer-related names. PGIM Fixed Income remains cautious on commodities but is looking at unique opportunities in natural gas and health care. The Fund ended the period with an underweight to investment-grade corporates. As we enter the later stage of the credit cycle, PGIM Fixed Income continues to favor better-quality financials and electric utilities over industrials. |
| • | The Fund is overweight in debt of European peripheral countries, as well as a select group of emerging market issuers, in mostly sovereign issues. The Fund has a very small allocation to government-related sectors, including Treasuries and agencies, as PGIM Fixed Income finds more compelling value in the aforementioned sectors. |
| • | In currency positioning relative to the Index, the Fund is underweight to the Swiss franc and the euro while maintaining an overweight to the US dollar and the Japanese yen. The Fund maintains a select set of small allocations, both underweight and overweight, within emerging market and “commodity” currencies, such as overweight exposure to the Singapore dollar, Norwegian krone, and Russian ruble, while taking underweight exposures to the Taiwan dollar and Indonesian rupiah. |
| 12 | Visit our website at pgiminvestments.com |
As a shareholder of the Fund, you incur two types of costs: (1) transaction costs, including sales charges (loads) on purchase payments and redemptions, as applicable, and (2) ongoing costs, including management fees, distribution and/or service (12b-1) fees, and other Fund expenses, as applicable. This example is intended to help you understand your ongoing costs (in dollars) of investing in the Fund and to compare these costs with the ongoing costs of investing in other mutual funds.
The example is based on an investment of $1,000 held through the six-month period ended October 31, 2019. The example is for illustrative purposes only; you should consult the Prospectus for information on initial and subsequent minimum investment requirements.
Actual Expenses
The first line for each share class in the table on the following page provides information about actual account values and actual expenses. You may use the information on this line, together with the amount you invested, to estimate the expenses that you paid over the period. Simply divide your account value by $1,000 (for example, an $8,600 account value ÷ $1,000 = 8.6), then multiply the result by the number on the first line under the heading “Expenses Paid During the Six-Month Period” to estimate the expenses you paid on your account during this period.
Hypothetical Example for Comparison Purposes
The second line for each share class in the table on the following page provides information about hypothetical account values and hypothetical expenses based on the Fund’s actual expense ratio and an assumed rate of return of 5% per year before expenses, which is not the Fund’s actual return. The hypothetical account values and expenses may not be used to estimate the actual ending account balance or expenses you paid for the period. You may use this information to compare the ongoing costs of investing in the Fund and other funds. To do so, compare this 5% hypothetical example with the 5% hypothetical examples that appear in the shareholder reports of the other funds.
The Fund’s transfer agent may charge additional fees to holders of certain accounts that are not included in the expenses shown in the table on the following page. These fees apply to individual retirement accounts (IRAs) and Section 403(b) accounts. As of the close of the six-month period covered by the table, IRA fees included an annual maintenance fee of $15 per account (subject to a maximum annual maintenance fee of $25 for all accounts held by the same shareholder). Section 403(b) accounts are charged an annual $25 fiduciary maintenance fee. Some of the fees may vary in amount, or may be waived, based on your total account balance or the number of PGIM funds, including the Fund, that you own. You should consider the additional fees that were charged to your Fund account over the six-month period when you estimate the total ongoing expenses paid over the period
| PGIM Global Total Return (USD Hedged) Fund | 13 |
Fees and Expenses(continued)
and the impact of these fees on your ending account value, as these additional expenses are not reflected in the information provided in the expense table. Additional fees have the effect of reducing investment returns.
Please note that the expenses shown in the table are meant to highlight your ongoing costs only and do not reflect any transactional costs such as sales charges (loads). Therefore, the second line for each share class in the table is useful in comparing ongoing costs only and will not help you determine the relative total costs of owning different funds. In addition, if these transactional costs were included, your costs would have been higher.
| PGIM Global Total Return (USD Hedged) Fund | Beginning Account May 1, 2019 | Ending Account October 31, 2019 | Annualized Expense Ratio Based on the Six-Month Period | Expenses Paid During the Six-Month Period* | ||||||||||||||
| Class A | Actual | $ | 1,000.00 | $ | 1,084.40 | 0.88 | % | $ | 4.62 | |||||||||
| Hypothetical | $ | 1,000.00 | $ | 1,020.77 | 0.88 | % | $ | 4.48 | ||||||||||
| Class C | Actual | $ | 1,000.00 | $ | 1,080.80 | 1.63 | % | $ | 8.55 | |||||||||
| Hypothetical | $ | 1,000.00 | $ | 1,016.99 | 1.63 | % | $ | 8.29 | ||||||||||
| Class Z | Actual | $ | 1,000.00 | $ | 1,086.00 | 0.63 | % | $ | 3.31 | |||||||||
| Hypothetical | $ | 1,000.00 | $ | 1,022.03 | 0.63 | % | $ | 3.21 | ||||||||||
| Class R6 | Actual | $ | 1,000.00 | $ | 1,086.40 | 0.58 | % | $ | 3.05 | |||||||||
| Hypothetical | $ | 1,000.00 | $ | 1,022.28 | 0.58 | % | $ | 2.96 | ||||||||||
*Fund expenses (net of fee waivers or subsidies, if any) for each share class are equal to the annualized expense ratio for each share class (provided in the table), multiplied by the average account value over the period, multiplied by the 184 days in the six-month period ended October 31, 2019, and divided by the 365 days in the Fund’s fiscal year ended October 31, 2019 (to reflect the six-month period). Expenses presented in the table include the expenses of any underlying portfolios in which the Fund may invest.
| 14 | Visit our website at pgiminvestments.com |
Schedule of Investments
as of October 31, 2019
| Description | Interest Rate | Maturity Date | Principal Amount (000)# | Value | ||||||||||||
LONG-TERM INVESTMENTS 97.5% |
| |||||||||||||||
ASSET-BACKED SECURITIES 17.4% |
| |||||||||||||||
Cayman Islands 11.5% | ||||||||||||||||
Bain Capital Credit CLO, | 2.894 | %(c) | 04/23/31 | 250 | $ | 246,390 | ||||||||||
BlueMountain CLO Ltd., | 3.446 | (c) | 08/20/32 | 250 | 249,702 | |||||||||||
Brookside Mill CLO Ltd., | 3.352 | (c) | 01/17/28 | 250 | 244,531 | |||||||||||
Carlyle Global Market Strategies CLO Ltd., | 2.972 | (c) | 04/17/31 | 250 | 247,515 | |||||||||||
CBAM Ltd., | — | (p) | 10/20/32 | 250 | 250,000 | |||||||||||
Cent CLO Ltd., | 2.966 | (c) | 04/30/31 | 250 | 247,282 | |||||||||||
Greenwood Park CLO Ltd., | 3.011 | (c) | 04/15/31 | 250 | 246,792 | |||||||||||
Greywolf CLO Ltd., | 2.966 | (c) | 04/26/31 | 250 | 245,726 | |||||||||||
HPS Loan Management Ltd., | 3.486 | (c) | 07/22/32 | 250 | 249,070 | |||||||||||
MidOcean Credit CLO, | ||||||||||||||||
Series2018-08A, Class A1, 144A, 3 Month LIBOR + 1.150% (Cap N/A, Floor 0.000%) | 3.286 | (c) | 02/20/31 | 250 | 247,769 | |||||||||||
Series2018-08A, Class B, 144A, 3 Month LIBOR + 1.650% (Cap N/A, Floor 0.000%) | 3.786 | (c) | 02/20/31 | 250 | 245,635 | |||||||||||
OZLM Ltd., | 3.752 | (c) | 04/17/31 | 250 | 247,452 | |||||||||||
Telos CLO Ltd., | 3.242 | (c) | 01/17/30 | 250 | 248,219 | |||||||||||
TICP CLO Ltd., | 3.266 | (c) | 07/20/27 | 250 | 244,174 | |||||||||||
See Notes to Financial Statements.
| PGIM Global Total Return (USD Hedged) Fund | 15 |
Schedule of Investments(continued)
as of October 31, 2019
| Description | Interest Rate | Maturity Date | Principal Amount (000)# | Value | ||||||||||||||||
ASSET-BACKED SECURITIES (Continued) |
| |||||||||||||||||||
Cayman Islands (cont’d.) | ||||||||||||||||||||
Tryon Park CLO Ltd., | 3.501 | %(c) | 04/15/29 | 250 | $ | 246,069 | ||||||||||||||
Voya CLO Ltd., | 2.910 | (c) | 04/25/31 | 250 | 246,261 | |||||||||||||||
|
| |||||||||||||||||||
| 3,952,587 | ||||||||||||||||||||
Ireland 1.6% | ||||||||||||||||||||
Arbour CLO DAC, | 1.920 | 03/15/29 | EUR | 250 | 278,830 | |||||||||||||||
Armada Euro CLO DAC, | 1.500 | 11/15/31 | EUR | 250 | 278,716 | |||||||||||||||
|
| |||||||||||||||||||
| 557,546 | ||||||||||||||||||||
Spain 0.4% | ||||||||||||||||||||
TFS, | 2.900 | (c) | 03/16/23 | EUR | 128 | 142,543 | ||||||||||||||
United States 3.9% | ||||||||||||||||||||
Battalion CLO Ltd., | 3.194 | (c) | 05/17/31 | 250 | 246,297 | |||||||||||||||
Citibank Credit Card Issuance Trust, | 3.960 | 10/13/30 | 100 | 113,543 | ||||||||||||||||
Lendmark Funding Trust, | ||||||||||||||||||||
Series2019-01A, Class A, 144A | 3.000 | 12/20/27 | 100 | 100,691 | ||||||||||||||||
Series2019-02A, Class A, 144A | 2.780 | 04/20/28 | 200 | 199,947 | ||||||||||||||||
OneMain Direct Auto Receivables Trust, | 3.630 | 09/14/27 | 100 | 104,164 | ||||||||||||||||
Oportun Funding LLC, | 3.610 | 03/08/24 | 250 | 252,855 | ||||||||||||||||
PNMAC GMSR Issuer Trust, | ||||||||||||||||||||
Series 2018-GT01, Class A, 144A, 1 Month LIBOR + 2.850% (Cap N/A, Floor 2.850%) | 4.673 | (c) | 02/25/23 | 100 | 100,619 | |||||||||||||||
Series 2018-GT02, Class A, 144A, 1 Month LIBOR + 2.650% (Cap N/A, Floor 0.000%) | 4.473 | (c) | 08/25/25 | 100 | 100,347 | |||||||||||||||
See Notes to Financial Statements.
| 16 |
| Description | Interest Rate | Maturity Date | Principal Amount (000)# | Value | ||||||||||||
ASSET-BACKED SECURITIES (Continued) | ||||||||||||||||
United States (cont’d.) | ||||||||||||||||
TH MSR Issuer Trust, | 4.623 | %(c) | 06/25/24 | 120 | $ | 119,948 | ||||||||||
|
| |||||||||||||||
| 1,338,411 | ||||||||||||||||
|
| |||||||||||||||
TOTAL ASSET-BACKED SECURITIES | 5,991,087 | |||||||||||||||
|
| |||||||||||||||
COMMERCIAL MORTGAGE-BACKED SECURITIES 8.4% |
| |||||||||||||||
United States | ||||||||||||||||
BANK, | 3.428 | 02/15/61 | 250 | 268,460 | ||||||||||||
Benchmark Mortgage Trust, | ||||||||||||||||
Series2018-B01, Class A3 | 3.355 | 01/15/51 | 175 | 182,881 | ||||||||||||
Series2018-B02, Class A3 | 3.544 | 02/15/51 | 200 | 211,286 | ||||||||||||
Series2018-B03, Class A3 | 3.746 | 04/10/51 | 125 | 133,193 | ||||||||||||
BX Commercial Mortgage Trust, | ||||||||||||||||
Series2019-XL, Class F, 144A, 1 Month LIBOR + 2.000% (Cap N/A, Floor 2.000%) | 4.000 | (c) | 10/15/36 | 100 | 100,127 | |||||||||||
Series2019-XL, Class G, 144A, 1 Month LIBOR + 2.300% (Cap N/A, Floor 2.300%) | 4.300 | (c) | 10/15/36 | 100 | 100,158 | |||||||||||
Citigroup Commercial Mortgage Trust, | 3.744 | 03/10/51 | 150 | 164,670 | ||||||||||||
Credit Suisse Mortgage Capital Certificates, | 4.064 | (c) | 05/15/36 | 100 | 100,376 | |||||||||||
FHLMC Multifamily Structured Pass-Through Certificates, | 0.662 | (cc) | 11/25/25 | 4,581 | 154,947 | |||||||||||
GS Mortgage Securities Trust, | 3.727 | 03/10/51 | 125 | 136,835 | ||||||||||||
UBS Commercial Mortgage Trust, | ||||||||||||||||
Series2017-C07, Class A3 | 3.418 | 12/15/50 | 750 | 799,990 | ||||||||||||
Series2018-C08, Class A3 | 3.720 | 02/15/51 | 250 | 272,190 | ||||||||||||
Wells Fargo Commercial Mortgage Trust, | 2.684 | 10/15/49 | 250 | 254,645 | ||||||||||||
|
| |||||||||||||||
TOTAL COMMERCIAL MORTGAGE-BACKED SECURITIES | 2,879,758 | |||||||||||||||
|
| |||||||||||||||
See Notes to Financial Statements.
| PGIM Global Total Return (USD Hedged) Fund | 17 |
Schedule of Investments(continued)
as of October 31, 2019
| Description | Interest Rate | Maturity Date | Principal Amount (000)# | Value | ||||||||||||||||
CORPORATE BONDS 31.0% | ||||||||||||||||||||
Canada 0.9% | ||||||||||||||||||||
Bombardier, Inc., | ||||||||||||||||||||
Sr. Unsec’d. Notes, 144A | 7.500 | % | 12/01/24 | 25 | $ | 24,234 | ||||||||||||||
Sr. Unsec’d. Notes, 144A | 7.500 | 03/15/25 | 25 | 23,906 | ||||||||||||||||
Sr. Unsec’d. Notes, 144A | 7.875 | 04/15/27 | 40 | 37,800 | ||||||||||||||||
Hydro-Quebec, | 9.375 | 04/15/30 | 150 | 242,493 | ||||||||||||||||
|
| |||||||||||||||||||
| 328,433 | ||||||||||||||||||||
China 1.3% | ||||||||||||||||||||
Aircraft Finance Co. Ltd., | 4.100 | 03/29/26 | 200 | 207,000 | ||||||||||||||||
CNAC HK Finbridge Co. Ltd., | 1.750 | 06/14/22 | EUR | 100 | 114,814 | |||||||||||||||
Sinopec Group Overseas Development 2015 Ltd., | 1.000 | 04/28/22 | EUR | 100 | 113,680 | |||||||||||||||
|
| |||||||||||||||||||
| 435,494 | ||||||||||||||||||||
France 1.4% | ||||||||||||||||||||
Credit Agricole Assurances SA, | 4.250 | (ff) | — | (rr) | EUR | 100 | 122,822 | |||||||||||||
SNCF Reseau, | 4.700 | 06/01/35 | CAD | 100 | 94,748 | |||||||||||||||
Societe Generale SA, | 3.875 | 03/28/24 | 255 | 267,764 | ||||||||||||||||
|
| |||||||||||||||||||
| 485,334 | ||||||||||||||||||||
Germany 1.4% | ||||||||||||||||||||
Deutsche Bahn Finance GmbH, | 3.800 | 09/27/27 | AUD | 100 | 77,767 | |||||||||||||||
Deutsche Bank AG, | 4.250 | 02/04/21 | 200 | 203,940 | ||||||||||||||||
Takko Luxembourg SCA, | 5.375 | 11/15/23 | EUR | 100 | 103,124 | |||||||||||||||
Volkswagen International Finance NV, | 2.700 | (ff) | — | (rr) | EUR | 100 | 114,876 | |||||||||||||
|
| |||||||||||||||||||
| 499,707 | ||||||||||||||||||||
See Notes to Financial Statements.
| 18 |
| Description | Interest Rate | Maturity Date | Principal Amount (000)# | Value | ||||||||||||||||
CORPORATE BONDS (Continued) | ||||||||||||||||||||
Indonesia 0.3% | ||||||||||||||||||||
Perusahaan Listrik Negara PT, | 1.875 | % | 11/05/31 | EUR | 100 | $ | 110,747 | |||||||||||||
Italy 1.3% | ||||||||||||||||||||
Assicurazioni Generali SpA, | 5.500 | (ff) | 10/27/47 | EUR | 100 | 134,115 | ||||||||||||||
Intesa Sanpaolo SpA, | 3.375 | 01/12/23 | 200 | 202,473 | ||||||||||||||||
Rossini Sarl, | 6.750 | 10/30/25 | EUR | 100 | 123,274 | |||||||||||||||
|
| |||||||||||||||||||
| 459,862 | ||||||||||||||||||||
Kazakhstan 0.3% | ||||||||||||||||||||
Kazakhstan Temir Zholy National Co. JSC, | ||||||||||||||||||||
Gtd. Notes | 3.250 | 12/05/23 | CHF | 50 | 55,078 | |||||||||||||||
Gtd. Notes | 3.638 | 06/20/22 | CHF | 50 | 54,219 | |||||||||||||||
|
| |||||||||||||||||||
| 109,297 | ||||||||||||||||||||
Mexico 1.0% | ||||||||||||||||||||
Petroleos Mexicanos, | 3.625 | 11/24/25 | EUR | 300 | 340,670 | |||||||||||||||
Netherlands 0.4% | ||||||||||||||||||||
Nederlandse Waterschapsbank NV, | 3.400 | 07/22/25 | AUD | 200 | 151,968 | |||||||||||||||
Peru 0.6% | ||||||||||||||||||||
Peru Enhanced Pass-Through Finance Ltd., | 1.963 | (s) | 06/02/25 | 206 | 190,715 | |||||||||||||||
Russia 0.4% | ||||||||||||||||||||
Gazprom OAO Via Gaz Capital SA, | 4.250 | 04/06/24 | GBP | 100 | 140,114 | |||||||||||||||
Spain 0.4% | ||||||||||||||||||||
Adif-Alta Velocidad, | 1.875 | 01/28/25 | EUR | 100 | 121,713 | |||||||||||||||
See Notes to Financial Statements.
| PGIM Global Total Return (USD Hedged) Fund | 19 |
Schedule of Investments(continued)
as of October 31, 2019
| Description | Interest Rate | Maturity Date | Principal Amount (000)# | Value | ||||||||||||||||
CORPORATE BONDS (Continued) | ||||||||||||||||||||
Supranational Bank 0.4% | ||||||||||||||||||||
African Development Bank, | 0.500 | % | 09/21/21 | NZD | 200 | $ | 125,656 | |||||||||||||
Switzerland 1.4% | ||||||||||||||||||||
Credit Suisse Group AG, | 2.593 | (ff) | 09/11/25 | 250 | 249,263 | |||||||||||||||
UBS Group AG, | 4.125 | 09/24/25 | 200 | 217,974 | ||||||||||||||||
|
| |||||||||||||||||||
| 467,237 | ||||||||||||||||||||
United Arab Emirates 0.4% | ||||||||||||||||||||
First Abu Dhabi Bank PJSC, | 4.800 | 06/01/21 | CNY | 1,000 | 144,150 | |||||||||||||||
United Kingdom 3.2% | ||||||||||||||||||||
Barclays PLC, | 3.932 | (ff) | 05/07/25 | 200 | 208,638 | |||||||||||||||
BAT Capital Corp., | 2.789 | 09/06/24 | 200 | 199,009 | ||||||||||||||||
CPUK Finance Ltd., | 4.875 | 02/28/47 | GBP | 100 | 132,774 | |||||||||||||||
DS Smith PLC, | 1.375 | 07/26/24 | EUR | 100 | 115,099 | |||||||||||||||
eG Global Finance PLC, | 6.250 | 10/30/25 | EUR | 100 | 115,155 | |||||||||||||||
Royal Bank of Scotland Group PLC, | 3.875 | 09/12/23 | 200 | 208,555 | ||||||||||||||||
Stonegate Pub Co. Financing PLC, | 7.031 | (c) | 03/15/22 | GBP | 100 | 129,859 | ||||||||||||||
|
| |||||||||||||||||||
| 1,109,089 | ||||||||||||||||||||
United States 15.9% | ||||||||||||||||||||
AMC Entertainment Holdings, Inc., | 5.875 | 11/15/26 | 50 | 45,562 | ||||||||||||||||
American Axle & Manufacturing, Inc., | 6.500 | 04/01/27 | 50 | 47,375 | ||||||||||||||||
American International Group, Inc., | 1.875 | 06/21/27 | EUR | 100 | 120,551 | |||||||||||||||
Anthem, Inc., | 2.875 | 09/15/29 | 100 | 99,037 | ||||||||||||||||
See Notes to Financial Statements.
| 20 |
| Description | Interest Rate | Maturity Date | Principal Amount (000)# | Value | ||||||||||||
CORPORATE BONDS (Continued) | ||||||||||||||||
United States (cont’d.) | ||||||||||||||||
Ascent Resources Utica Holdings LLC/ARU Finance Corp., | 7.000 | % | 11/01/26 | 25 | $ | 19,125 | ||||||||||
Ashton Woods USA LLC/Ashton Woods Finance Co., | 9.875 | 04/01/27 | 50 | 55,750 | ||||||||||||
AT&T, Inc., | ||||||||||||||||
Sr. Unsec’d. Notes | 4.550 | 03/09/49 | 60 | 64,503 | ||||||||||||
Sr. Unsec’d. Notes | 4.750 | 05/15/46 | 85 | 94,294 | ||||||||||||
Bank of America Corp., | ||||||||||||||||
Sr. Unsec’d. Notes, MTN | 2.884 | (ff) | 10/22/30 | 170 | 171,098 | |||||||||||
Sr. Unsec’d. Notes, MTN | 3.194 | (ff) | 07/23/30 | 85 | 87,627 | |||||||||||
Bausch Health Americas, Inc., | 8.500 | 01/31/27 | 10 | 11,250 | ||||||||||||
Bausch Health Cos., Inc., | ||||||||||||||||
Gtd. Notes, 144A | 7.250 | 05/30/29 | 10 | 11,012 | ||||||||||||
Sr. Sec’d. Notes, 144A | 5.750 | 08/15/27 | 5 | 5,430 | ||||||||||||
Beazer Homes USA, Inc., | ||||||||||||||||
Gtd. Notes | 6.750 | 03/15/25 | 50 | 51,750 | ||||||||||||
Sr. Unsec’d. Notes, 144A | 7.250 | 10/15/29 | 20 | 21,050 | ||||||||||||
Bristol-Myers Squibb Co., | ||||||||||||||||
Sr. Unsec’d. Notes, 144A | 3.200 | 06/15/26 | 25 | 26,556 | ||||||||||||
Sr. Unsec’d. Notes, 144A | 3.400 | 07/26/29 | 75 | 80,704 | ||||||||||||
Brixmor Operating Partnership LP, | 4.125 | 05/15/29 | 65 | 70,234 | ||||||||||||
Broadcom, Inc., | ||||||||||||||||
Gtd. Notes, 144A | 3.125 | 04/15/21 | 55 | 55,657 | ||||||||||||
Gtd. Notes, 144A | 3.125 | 10/15/22 | 45 | 45,850 | ||||||||||||
Calpine Corp., | 5.750 | 01/15/25 | 50 | 51,250 | ||||||||||||
CCO Holdings LLC/CCO Holdings Capital Corp., | 5.000 | 02/01/28 | 75 | 78,469 | ||||||||||||
Celgene Corp., | 3.450 | 11/15/27 | 100 | 106,907 | ||||||||||||
Charter Communications Operating LLC/Charter Communications Operating Capital, | ||||||||||||||||
Sr. Sec’d. Notes | 4.800 | 03/01/50 | 35 | 35,512 | ||||||||||||
Sr. Sec’d. Notes | 6.384 | 10/23/35 | 100 | 122,881 | ||||||||||||
Clear Channel Worldwide Holdings, Inc., | 9.250 | 02/15/24 | 46 | 50,600 | ||||||||||||
CVS Health Corp., | 4.300 | 03/25/28 | 10 | 10,855 | ||||||||||||
See Notes to Financial Statements.
| PGIM Global Total Return (USD Hedged) Fund | 21 |
Schedule of Investments (continued)
as of October 31, 2019
| Description | Interest Rate | Maturity Date | Principal Amount (000)# | Value | ||||||||||||||
CORPORATE BONDS (Continued) | ||||||||||||||||||
United States (cont’d.) | ||||||||||||||||||
Dana Financing Luxembourg Sarl, | 6.500 | % | 06/01/26 | 50 | $ | 52,500 | ||||||||||||
DH Europe Finance II Sarl, | ||||||||||||||||||
Gtd. Notes | 0.200 | 03/18/26 | EUR | 100 | 110,436 | |||||||||||||
Gtd. Notes | 0.450 | 03/18/28 | EUR | 100 | 110,504 | |||||||||||||
Diamond Sports Group LLC/Diamond Sports Finance Co., | 6.625 | 08/15/27 | 20 | 20,600 | ||||||||||||||
Discovery Communications LLC, | 4.900 | 03/11/26 | 100 | 111,685 | ||||||||||||||
DISH DBS Corp., | 7.750 | 07/01/26 | 75 | 75,664 | ||||||||||||||
Embarq Corp., | 7.995 | 06/01/36 | 75 | 74,250 | ||||||||||||||
Energizer Gamma Acquisition BV, | 4.625 | 07/15/26 | EUR | 100 | 117,596 | |||||||||||||
Everi Payments, Inc., | 7.500 | 12/15/25 | 25 | 26,344 | ||||||||||||||
Fidelity National Information Services, Inc., | 1.500 | 05/21/27 | EUR | 100 | 118,505 | |||||||||||||
Goldman Sachs Group, Inc. (The), | 4.750 | 10/12/21 | EUR | 150 | 181,929 | |||||||||||||
HCA, Inc., | 5.250 | 04/15/25 | 100 | 111,543 | ||||||||||||||
JBS USA LUX SA/JBS USA Food Co./JBS USA Finance, Inc., | 6.500 | 04/15/29 | 25 | 27,813 | ||||||||||||||
JPMorgan Chase & Co., | 3.702 | (ff) | 05/06/30 | 65 | 69,922 | |||||||||||||
Kinder Morgan, Inc., | 4.300 | 03/01/28 | 200 | 217,477 | ||||||||||||||
Kraft Heinz Foods Co., | ||||||||||||||||||
Gtd. Notes | 3.000 | 06/01/26 | 100 | 99,656 | ||||||||||||||
Gtd. Notes, 144A | 4.875 | 10/01/49 | 20 | 20,615 | ||||||||||||||
Liberty Mutual Group, Inc., | 2.750 | 05/04/26 | EUR | 100 | 125,180 | |||||||||||||
Marsh & McLennan Cos., Inc., | 1.349 | 09/21/26 | EUR | 100 | 117,506 | |||||||||||||
Medtronic Global Holdings SCA, | ||||||||||||||||||
Gtd. Notes | 1.000 | 07/02/31 | EUR | 100 | 115,291 | |||||||||||||
Gtd. Notes | 1.125 | 03/07/27 | EUR | 100 | 118,135 | |||||||||||||
See Notes to Financial Statements.
| 22 |
| Description | Interest Rate | Maturity Date | Principal Amount (000)# | Value | ||||||||||||||||
CORPORATE BONDS (Continued) | ||||||||||||||||||||
United States (cont’d.) | ||||||||||||||||||||
Morgan Stanley, | ||||||||||||||||||||
Sr. Unsec’d. Notes, EMTN | 1.342 | %(ff) | 10/23/26 | EUR | 100 | $ | 117,216 | |||||||||||||
Sub. Notes, GMTN | 4.350 | 09/08/26 | 100 | 108,964 | ||||||||||||||||
MPLX LP, | 4.000 | 03/15/28 | 25 | 25,979 | ||||||||||||||||
Nationstar Mortgage Holdings, Inc., | 8.125 | 07/15/23 | 15 | 15,900 | ||||||||||||||||
Newell Brands, Inc., | 4.200 | 04/01/26 | 100 | 104,515 | ||||||||||||||||
NRG Energy, Inc., | 5.750 | 01/15/28 | 53 | 57,372 | ||||||||||||||||
Occidental Petroleum Corp., | ||||||||||||||||||||
Sr. Unsec’d. Notes | 2.600 | 08/13/21 | 15 | 15,100 | ||||||||||||||||
Sr. Unsec’d. Notes | 2.700 | 08/15/22 | 25 | 25,265 | ||||||||||||||||
ONEOK, Inc., | 4.450 | 09/01/49 | 120 | 119,656 | ||||||||||||||||
Sally Holdings LLC/Sally Capital, Inc., | ||||||||||||||||||||
Gtd. Notes | 5.500 | 11/01/23 | 50 | 50,500 | ||||||||||||||||
Gtd. Notes | 5.625 | 12/01/25 | 25 | 25,812 | ||||||||||||||||
Scientific Games International, Inc., | 6.625 | 05/15/21 | 50 | 50,625 | ||||||||||||||||
Shire Acquisitions Investments Ireland DAC, | 3.200 | 09/23/26 | 25 | 25,849 | ||||||||||||||||
Sprint Capital Corp., | 8.750 | 03/15/32 | 50 | 60,969 | ||||||||||||||||
Stryker Corp., | 2.625 | 11/30/30 | EUR | 100 | 133,791 | |||||||||||||||
Tallgrass Energy Partners LP/Tallgrass Energy Finance Corp., | 5.500 | 01/15/28 | 50 | 46,875 | ||||||||||||||||
Tenet Healthcare Corp., | ||||||||||||||||||||
Sec’d. Notes, 144A | 6.250 | 02/01/27 | 50 | 52,812 | ||||||||||||||||
Sr. Unsec’d. Notes | 6.750 | 06/15/23 | 25 | 26,500 | ||||||||||||||||
Thermo Fisher Scientific, Inc., | 0.500 | 03/01/28 | EUR | 100 | 110,972 | |||||||||||||||
United Airlines2019-2 Class AA Pass-Through Trust, Pass-Through Certificates | 2.700 | 11/01/33 | 25 | 25,062 | ||||||||||||||||
United Rentals North America, Inc., | ||||||||||||||||||||
Gtd. Notes | 5.250 | 01/15/30 | 10 | 10,513 | ||||||||||||||||
Gtd. Notes | 5.500 | 05/15/27 | 100 | 105,437 | ||||||||||||||||
Verizon Communications, Inc., | 1.250 | 04/08/30 | EUR | 100 | 117,759 | |||||||||||||||
See Notes to Financial Statements.
| PGIM Global Total Return (USD Hedged) Fund | 23 |
Schedule of Investments (continued)
as of October 31, 2019
| Description | Interest Rate | Maturity Date | Principal Amount (000)# | Value | ||||||||||||||||
CORPORATE BONDS (Continued) | ||||||||||||||||||||
United States (cont’d.) | ||||||||||||||||||||
Vistra Operations Co. LLC, | 5.000 | % | 07/31/27 | 45 | $ | 46,575 | ||||||||||||||
Welltower, Inc., | 3.100 | 01/15/30 | 70 | 70,900 | ||||||||||||||||
William Lyon Homes, Inc., | 6.000 | 09/01/23 | 50 | 51,750 | ||||||||||||||||
Williams Cos., Inc. (The), | 3.600 | 03/15/22 | 100 | 102,904 | ||||||||||||||||
Zimmer Biomet Holdings, Inc., | 1.414 | 12/13/22 | EUR | 100 | 115,634 | |||||||||||||||
|
| |||||||||||||||||||
| 5,485,246 | ||||||||||||||||||||
|
| |||||||||||||||||||
TOTAL CORPORATE BONDS |
| 10,705,432 | ||||||||||||||||||
|
| |||||||||||||||||||
RESIDENTIAL MORTGAGE-BACKED SECURITIES 1.1% | ||||||||||||||||||||
Bermuda 0.4% | ||||||||||||||||||||
Bellemeade Re Ltd., | 3.423 | (c) | 04/25/28 | 148 | 148,329 | |||||||||||||||
United States 0.7% | ||||||||||||||||||||
GS Mortgage-Backed Securities Trust, | 2.625 | (cc) | 01/25/59 | 92 | 91,556 | |||||||||||||||
Legacy Mortgage Asset Trust, | 3.858 | 09/25/59 | 100 | 99,998 | ||||||||||||||||
LSTAR Securities Investment Trust, | 3.532 | (c) | 04/01/23 | 35 | 35,241 | |||||||||||||||
|
| |||||||||||||||||||
| 226,795 | ||||||||||||||||||||
|
| |||||||||||||||||||
TOTAL RESIDENTIAL MORTGAGE-BACKED SECURITIES |
| 375,124 | ||||||||||||||||||
|
| |||||||||||||||||||
See Notes to Financial Statements.
| 24 |
| Description | Interest Rate | Maturity Date | Principal Amount (000)# | Value | ||||||||||||||
SOVEREIGN BONDS 37.2% | ||||||||||||||||||
Argentina 0.6% | ||||||||||||||||||
Argentine Republic Government International Bond, | 7.820 | % | 12/31/33 | EUR | 310 | $ | 161,991 | |||||||||||
Provincia de Buenos Aires, | 5.375 | 01/20/23 | EUR | 100 | 36,693 | |||||||||||||
|
| |||||||||||||||||
| 198,684 | ||||||||||||||||||
Austria 0.5% | ||||||||||||||||||
Republic of Austria Government International Bond, | 5.375 | 12/01/34 | CAD | 160 | 164,365 | |||||||||||||
Brazil 2.0% | ||||||||||||||||||
Brazil Loan Trust 1, | 5.477 | 07/24/23 | 112 | 116,623 | ||||||||||||||
Brazil Minas SPE via State of Minas Gerais, | 5.333 | 02/15/28 | 540 | 573,756 | ||||||||||||||
|
| |||||||||||||||||
| 690,379 | ||||||||||||||||||
Bulgaria 0.4% | ||||||||||||||||||
Bulgaria Government International Bond, | 3.125 | 03/26/35 | EUR | 100 | 146,816 | |||||||||||||
Canada 0.3% | ||||||||||||||||||
City of Toronto Canada, | 3.500 | 12/06/21 | CAD | 150 | 117,623 | |||||||||||||
Chile 0.4% | ||||||||||||||||||
Chile Government International Bond, | 1.440 | 02/01/29 | EUR | 115 | 139,100 | |||||||||||||
China 0.4% | ||||||||||||||||||
Export-Import Bank of China (The), | 4.400 | 05/14/24 | CNY | 1,000 | 147,819 | |||||||||||||
Colombia 1.9% | ||||||||||||||||||
Colombia Government International Bond, | 3.875 | 03/22/26 | EUR | 500 | 662,209 | |||||||||||||
Croatia 0.7% | ||||||||||||||||||
Croatia Government International Bond, | 6.000 | 01/26/24 | 200 | 229,864 | ||||||||||||||
See Notes to Financial Statements.
| PGIM Global Total Return (USD Hedged) Fund | 25 |
Schedule of Investments (continued)
as of October 31, 2019
| Description | Interest Rate | Maturity Date | Principal Amount (000)# | Value | ||||||||||||||||
SOVEREIGN BONDS (Continued) | ||||||||||||||||||||
Cyprus 1.8% | ||||||||||||||||||||
Cyprus Government International Bond, | ||||||||||||||||||||
Sr. Unsec’d. Notes, EMTN | 2.750 | % | 06/27/24 | EUR | 300 | $ | 376,232 | |||||||||||||
Sr. Unsec’d. Notes, EMTN | 2.750 | 02/26/34 | EUR | 100 | 138,884 | |||||||||||||||
Sr. Unsec’d. Notes, EMTN | 2.750 | 05/03/49 | EUR | 30 | 43,707 | |||||||||||||||
Sr. Unsec’d. Notes, EMTN | 4.250 | 11/04/25 | EUR | 50 | 68,922 | |||||||||||||||
|
| |||||||||||||||||||
| 627,745 | ||||||||||||||||||||
Dominican Republic 0.3% | ||||||||||||||||||||
Dominican Republic International Bond, | 5.950 | 01/25/27 | 100 | 109,751 | ||||||||||||||||
Germany 0.4% | ||||||||||||||||||||
Bundesrepublik Deutschland Bundesanleihe, | 0.250 | 02/15/29 | EUR | 115 | 136,660 | |||||||||||||||
Greece 2.2% | ||||||||||||||||||||
Hellenic Republic Government Bond, | ||||||||||||||||||||
Bonds | 0.000 | (cc) | 10/15/42 | EUR | 5,000 | 20,912 | ||||||||||||||
Bonds | 3.000 | (cc) | 02/24/37 | EUR | 440 | 625,672 | ||||||||||||||
Sr. Unsec’d. Notes, 144A | 3.375 | 02/15/25 | EUR | 20 | 25,587 | |||||||||||||||
Hellenic Republic Government International Bond, | 5.200 | 07/17/34 | EUR | 50 | 78,258 | |||||||||||||||
|
| |||||||||||||||||||
| 750,429 | ||||||||||||||||||||
Hungary 0.5% | ||||||||||||||||||||
Hungary Government International Bond, | ||||||||||||||||||||
Sr. Unsec’d. Notes | 1.750 | 10/10/27 | EUR | 100 | 125,536 | |||||||||||||||
Sr. Unsec’d. Notes | 4.300 | 12/19/21 | CNY | 300 | 42,860 | |||||||||||||||
|
| |||||||||||||||||||
| 168,396 | ||||||||||||||||||||
Indonesia 1.7% | ||||||||||||||||||||
Indonesia Government International Bond, | ||||||||||||||||||||
Sr. Unsec’d. Notes | 1.750 | 04/24/25 | EUR | 200 | 233,544 | |||||||||||||||
Sr. Unsec’d. Notes | 3.375 | 07/30/25 | EUR | 100 | 127,171 | |||||||||||||||
Sr. Unsec’d. Notes, EMTN | 4.125 | 01/15/25 | 200 | 212,870 | ||||||||||||||||
|
| |||||||||||||||||||
| 573,585 | ||||||||||||||||||||
See Notes to Financial Statements.
| 26 |
| Description | Interest Rate | Maturity Date | Principal Amount (000)# | Value | ||||||||||||||||
SOVEREIGN BONDS (Continued) | ||||||||||||||||||||
Israel 0.4% | ||||||||||||||||||||
Israel Government International Bond, | 1.500 | % | 01/18/27 | EUR | 100 | $ | 121,902 | |||||||||||||
Italy 4.3% | ||||||||||||||||||||
City of Rome Italy, | 5.345 | 01/27/48 | EUR | 50 | 88,678 | |||||||||||||||
Italy Buoni Poliennali Del Tesoro, | ||||||||||||||||||||
Bonds, 144A | 2.800 | 03/01/67 | EUR | 105 | 135,119 | |||||||||||||||
Unsec’d. Notes, 144A | 3.350 | 03/01/35 | EUR | 400 | 560,225 | |||||||||||||||
Republic of Italy Government International Bond, | ||||||||||||||||||||
Sr. Unsec’d. Notes, EMTN, EURIBOR ICE SWAP 11:00 Fft 10Y Index + 0.000% (Cap 7.000%, Floor 2.000%) | 2.000 | (c) | 06/15/20 | EUR | 100 | 112,870 | ||||||||||||||
Sr. Unsec’d. Notes, EMTN | 5.125 | 07/31/24 | EUR | 350 | 473,457 | |||||||||||||||
Sr. Unsec’d. Notes, EMTN | 6.000 | 08/04/28 | GBP | 60 | 99,758 | |||||||||||||||
|
| |||||||||||||||||||
| 1,470,107 | ||||||||||||||||||||
Japan 0.7% | ||||||||||||||||||||
Japan Government Thirty Year Bond, | 0.400 | 06/20/49 | JPY | 5,000 | 46,448 | |||||||||||||||
Japan Government Twenty Year Bond, | ||||||||||||||||||||
Sr. Unsec’d. Notes, Series 168 | 0.400 | 03/20/39 | JPY | 10,000 | 95,698 | |||||||||||||||
Sr. Unsec’d. Notes, Series 169 | 0.300 | 06/20/39 | JPY | 10,000 | 93,888 | |||||||||||||||
|
| |||||||||||||||||||
| 236,034 | ||||||||||||||||||||
Kazakhstan 0.4% | ||||||||||||||||||||
Kazakhstan Government International Bond, | 2.375 | 11/09/28 | EUR | 115 | 144,356 | |||||||||||||||
Malaysia 0.3% | ||||||||||||||||||||
Malaysia Government Bond, | 4.048 | 09/30/21 | MYR | 457 | 111,250 | |||||||||||||||
Mexico 1.4% | ||||||||||||||||||||
Mexico Government International Bond, | ||||||||||||||||||||
Sr. Unsec’d. Notes | 2.875 | 04/08/39 | EUR | 100 | 125,973 | |||||||||||||||
Sr. Unsec’d. Notes, EMTN | 1.750 | 04/17/28 | EUR | 100 | 117,525 | |||||||||||||||
Sr. Unsec’d. Notes, GMTN | 6.750 | 02/06/24 | GBP | 150 | 233,649 | |||||||||||||||
|
| |||||||||||||||||||
| 477,147 | ||||||||||||||||||||
See Notes to Financial Statements.
| PGIM Global Total Return (USD Hedged) Fund | 27 |
Schedule of Investments(continued)
as of October 31, 2019
| Description | Interest Rate | Maturity Date | Principal Amount (000)# | Value | ||||||||||||||||
SOVEREIGN BONDS (Continued) | ||||||||||||||||||||
New Zealand 0.4% | ||||||||||||||||||||
New Zealand Local Government Funding Agency Bond, | 4.500 | % | 04/15/27 | NZD | 200 | $ | 152,508 | |||||||||||||
Panama 0.6% | ||||||||||||||||||||
Panama Government International Bond, | 3.875 | 03/17/28 | 200 | 217,502 | ||||||||||||||||
Peru 0.7% | ||||||||||||||||||||
Peruvian Government International Bond, | 2.750 | 01/30/26 | EUR | 200 | 256,519 | |||||||||||||||
Poland 0.6% | ||||||||||||||||||||
Republic of Poland Government International Bond, | 5.000 | 03/23/22 | 200 | 214,132 | ||||||||||||||||
Portugal 3.1% | ||||||||||||||||||||
Portugal Government International Bond, | 5.125 | 10/15/24 | 600 | 85,052 | ||||||||||||||||
Portugal Obrigacoes do Tesouro OT, | ||||||||||||||||||||
Sr. Unsec’d. Notes, 144A | 3.875 | 02/15/30 | EUR | 435 | 664,753 | |||||||||||||||
Sr. Unsec’d. Notes, 144A | 4.100 | 04/15/37 | EUR | 195 | 337,035 | |||||||||||||||
|
| |||||||||||||||||||
| 1,086,840 | ||||||||||||||||||||
Romania 0.6% | ||||||||||||||||||||
Romanian Government International Bond, | ||||||||||||||||||||
Sr. Unsec’d. Notes, EMTN | 3.875 | 10/29/35 | EUR | 100 | 132,806 | |||||||||||||||
Unsec’d. Notes, 144A, MTN | 2.124 | 07/16/31 | EUR | 50 | 57,717 | |||||||||||||||
|
| |||||||||||||||||||
| 190,523 | ||||||||||||||||||||
Russia 0.7% | ||||||||||||||||||||
Russian Foreign Bond - Eurobond, | 2.875 | 12/04/25 | EUR | 200 | 251,480 | |||||||||||||||
Saudi Arabia 1.0% | ||||||||||||||||||||
Saudi Government International Bond, | ||||||||||||||||||||
Sr. Unsec’d. Notes, 144A | 2.000 | 07/09/39 | EUR | 125 | 147,080 | |||||||||||||||
Sr. Unsec’d. Notes, EMTN | 2.875 | 03/04/23 | 200 | 204,136 | ||||||||||||||||
|
| |||||||||||||||||||
| 351,216 | ||||||||||||||||||||
See Notes to Financial Statements.
| 28 |
| Description | Interest Rate | Maturity Date | Principal Amount (000)# | Value | ||||||||||||||||
SOVEREIGN BONDS (Continued) | ||||||||||||||||||||
Senegal 0.3% | ||||||||||||||||||||
Senegal Government International Bond, | 4.750 | % | 03/13/28 | EUR | 100 | $ | 115,316 | |||||||||||||
Serbia 0.7% | ||||||||||||||||||||
Serbia International Bond, | 1.500 | 06/26/29 | EUR | 200 | 229,484 | |||||||||||||||
Spain 4.1% | ||||||||||||||||||||
Instituto de Credito Oficial, | 0.963 | 09/22/22 | SEK | 1,000 | 104,942 | |||||||||||||||
Spain Government Bond, | ||||||||||||||||||||
Bonds, 144A | 5.150 | 10/31/28 | EUR | 200 | 322,133 | |||||||||||||||
Sr. Unsec’d. Notes, 144A | 1.850 | 07/30/35 | EUR | 270 | 354,805 | |||||||||||||||
Sr. Unsec’d. Notes, 144A | 3.450 | 07/30/66 | EUR | 60 | 111,437 | |||||||||||||||
Unsec’d. Notes, 144A | 1.300 | 10/31/26 | EUR | 285 | 346,541 | |||||||||||||||
Spain Government International Bond, | 5.250 | 04/06/29 | GBP | 100 | 167,260 | |||||||||||||||
|
| |||||||||||||||||||
| 1,407,118 | ||||||||||||||||||||
Sweden 0.3% | ||||||||||||||||||||
Svensk Exportkredit AB, | 0.500 | 03/15/22 | ZAR | 2,000 | 111,491 | |||||||||||||||
Turkey 0.7% | ||||||||||||||||||||
Turkey Government International Bond, | ||||||||||||||||||||
Sr. Unsec’d. Notes | 5.200 | 02/16/26 | EUR | 100 | 116,906 | |||||||||||||||
Sr. Unsec’d. Notes, EMTN | 3.250 | 06/14/25 | EUR | 100 | 108,184 | |||||||||||||||
|
| |||||||||||||||||||
| 225,090 | ||||||||||||||||||||
Ukraine 0.7% | ||||||||||||||||||||
Ukraine Government International Bond, | 6.750 | 06/20/26 | EUR | 200 | 246,365 | |||||||||||||||
United Arab Emirates 0.6% | ||||||||||||||||||||
Abu Dhabi Government International Bond, | 2.500 | 10/11/22 | 200 | 202,060 | ||||||||||||||||
United Kingdom 0.2% | ||||||||||||||||||||
United Kingdom Gilt, | 1.750 | 01/22/49 | GBP | 35 | 52,304 | |||||||||||||||
See Notes to Financial Statements.
| PGIM Global Total Return (USD Hedged) Fund | 29 |
Schedule of Investments(continued)
as of October 31, 2019
| Description | Interest Rate | Maturity Date | Principal Amount (000)# | Value | ||||||||||||
SOVEREIGN BONDS (Continued) | ||||||||||||||||
Uruguay 0.3% | ||||||||||||||||
Uruguay Government International Bond, | ||||||||||||||||
Sr. Unsec’d. Notes | 4.375 | % | 10/27/27 | 39 | $ | 43,447 | ||||||||||
Sr. Unsec’d. Notes | 4.375 | 01/23/31 | 63 | 69,669 | ||||||||||||
|
| |||||||||||||||
| 113,116 | ||||||||||||||||
|
| |||||||||||||||
TOTAL SOVEREIGN BONDS | 12,847,285 | |||||||||||||||
|
| |||||||||||||||
U.S. GOVERNMENT AGENCY OBLIGATION 0.2% | ||||||||||||||||
Indonesia Government USAID Bond | 9.300 | 07/01/20^ | 65 | 66,397 | ||||||||||||
|
| |||||||||||||||
U.S. TREASURY OBLIGATION 2.2% | ||||||||||||||||
U.S. Treasury Bonds(k) | 2.750 | 08/15/47 | 675 | 754,392 | ||||||||||||
|
| |||||||||||||||
TOTAL LONG-TERM INVESTMENTS | 33,619,475 | |||||||||||||||
|
| |||||||||||||||
Shares | ||||||||||||||||
SHORT-TERM INVESTMENTS 2.2% |
| |||||||||||||||
AFFILIATED MUTUAL FUNDS 2.2% |
| |||||||||||||||
PGIM Core Ultra Short Bond Fund(w) | 752,873 | 752,873 | ||||||||||||||
PGIM Institutional Money Market Fund(w) | 6 | 6 | ||||||||||||||
|
| |||||||||||||||
TOTAL AFFILIATED MUTUAL FUNDS | 752,879 | |||||||||||||||
|
| |||||||||||||||
OPTIONS PURCHASED*~ 0.0% | 10,122 | |||||||||||||||
|
| |||||||||||||||
TOTAL SHORT-TERM INVESTMENTS | 763,001 | |||||||||||||||
|
| |||||||||||||||
TOTAL INVESTMENTS 99.7% | 34,382,476 | |||||||||||||||
Other assets in excess of liabilities(z) 0.3% | 111,250 | |||||||||||||||
|
| |||||||||||||||
NET ASSETS 100.0% | $ | 34,493,726 | ||||||||||||||
|
| |||||||||||||||
See Notes to Financial Statements.
| 30 |
Below is a list of the abbreviation(s) used in the annual report:
AED—United Arab Emirates Dirham
AUD—Australian Dollar
BRL—Brazilian Real
CAD—Canadian Dollar
CHF—Swiss Franc
CLP—Chilean Peso
CNH—Chinese Renminbi
CNY—China Yuan
COP—Colombian Peso
CZK—Czech Koruna
EGP—Egyptian Pound
EUR—Euro
GBP—British Pound
HKD—Hong Kong Dollar
HUF—Hungarian Forint
IDR—Indonesian Rupiah
ILS—Israeli Shekel
INR—Indian Rupee
JPY—Japanese Yen
KRW—South Korean Won
MXN—Mexican Peso
MYR—Malaysian Ringgit
NOK—Norwegian Krone
NZD—New Zealand Dollar
PEN—Peruvian Nuevo Sol
PHP—Philippine Peso
PLN—Polish Zloty
RUB—Russian Ruble
SEK—Swedish Krona
SGD—Singapore Dollar
THB—Thai Baht
TRY—Turkish Lira
TWD—New Taiwanese Dollar
USD—US Dollar
ZAR—South African Rand
144A—Security was purchased pursuant to Rule 144A under the Securities Act of 1933 and, pursuant to the requirements of Rule 144A, may not be resold except to qualified institutional buyers.
A—Annual payment frequency for swaps
BBR—New Zealand Bank Bill Rate
BBSW—Australian Bank Bill Swap Reference Rate
BIBOR—Bangkok Interbank Offered Rate
BROIS—Brazil Overnight Index Swap
BUBOR—Budapest Interbank Offered Rate
CDX—Credit Derivative Index
CLO—Collateralized Loan Obligation
CLOIS—Sinacofi Chile Interbank Rate Average
CMBX—Commercial Mortgage-Backed Index
CMS—Constant Maturity Swap
COOIS—Colombia Overnight Interbank Reference Rate
CPI—Consumer Price Index
See Notes to Financial Statements.
| PGIM Global Total Return (USD Hedged) Fund | 31 |
Schedule of Investments(continued)
as of October 31, 2019
EIBOR—Emirates Interbank Offered Rate
EMTN—Euro Medium Term Note
EURIBOR—Euro Interbank Offered Rate
FHLMC—Federal Home Loan Mortgage Corporation
GMAC—General Motors Acceptance Corporation
GMTN—Global Medium Term Note
HIBOR—Hong Kong Interbank Offered Rate
HICP—Harmonised Index of Consumer Prices
ICE—Intercontinental Exchange
IO—Interest Only (Principal amount represents notional)
JIBAR—Johannesburg Interbank Agreed Rate
KLIBOR—Kuala Lumpur Interbank Offered Rate
KWCDC—Korean Won Certificate of Deposit
LIBOR—London Interbank Offered Rate
M—Monthly payment frequency for swaps
MOSPRIME—Moscow Prime Offered Rate
MTN—Medium Term Note
NIBOR—Norwegian Interbank Offered Rate
OTC—Over-the-counter
PJSC—Public Joint-Stock Company
PRIBOR—Prague Interbank Offered Rate
Q—Quarterly payment frequency for swaps
REITs—Real Estate Investment Trust
S—Semiannual payment frequency for swaps
SIBOR—Singapore Interbank Offered Rate
SONIA—Sterling Overnight Index Average
STIBOR—Stockholm Interbank Offered Rate
T—Swap payment upon termination
TELBOR—Tel Aviv Interbank Offered Rate
USAID—United States Agency for International Development
USOIS—United States Overnight Index Swap
WIBOR—Warsaw Interbank Offered Rate
| * | Non-income producing security. |
| # | Principal or notional amount is shown in U.S. dollars unless otherwise stated. |
| ~ | See tables subsequent to the Schedule of Investments for options detail. |
| ^ | Indicates a Level 3 security. The aggregate value of Level 3 securities is $67,024 and 0.2% of net assets. |
| (c) | Variable rate instrument. The interest rate shown reflects the rate in effect at October 31, 2019. |
| (cc) | Variable rate instrument. The rate shown is based on the latest available information as of October 31, 2019. Certain variable rate securities are not based on a published reference rate and spread but are determined by the issuer or agent and are based on current market conditions. These securities do not indicate a reference rate and spread in their description. |
| (ff) | Variable rate security. Security may be issued at a fixed coupon rate, which converts to a variable rate at a specified date. Rate shown is the rate in effect as of period end. |
| (k) | Represents security, or a portion thereof, segregated as collateral for centrally cleared/exchange-traded derivatives. |
| (p) | Interest rate not available as of October 31, 2019. |
| (rr) | Perpetual security with no stated maturity date. |
| (s) | Represents zero coupon bond or principal only security. Rate represents yield to maturity at purchase date. |
| (w) | PGIM Investments LLC, the manager of the Fund, also serves as manager of the PGIM Core Ultra Short Bond Fund and PGIM Institutional Money Market Fund. |
| (z) | Includes net unrealized appreciation/(depreciation) and/or market value of the below holdings which are excluded from the Schedule of Investments: |
See Notes to Financial Statements.
| 32 |
Options Purchased:
OTC Traded
Description | Call/ Put | Counterparty | Expiration Date | Strike | Contracts | Notional Amount (000)# | Value | |||||||||||||||||
2-Year 10 CMS Curve CAP | Call | Barclays Bank PLC Morgan Stanley & Co. | 11/21/19 | 0.12 | % | — | 100 | $ | 38 | |||||||||||||||
2-Year 10 CMS Curve CAP | Call | International PLC | 11/21/19 | 0.13 | % | — | 100 | 25 | ||||||||||||||||
2-Year 10 CMS Curve CAP | Call | Barclays Bank PLC | 07/12/21 | 0.11 | % | — | 65 | 728 | ||||||||||||||||
2-Year 10 CMS Curve CAP | Call | Bank of America, N.A. | 08/16/21 | 0.15 | % | — | 158 | 1,656 | ||||||||||||||||
2-Year 10 CMS Curve CAP | Call | Bank of America, N.A. | 08/20/21 | 0.15 | % | — | 313 | 3,386 | ||||||||||||||||
2-Year 10 CMS Curve CAP | Call | Bank of America, N.A. | 09/13/21 | 0.14 | % | — | 320 | 3,629 | ||||||||||||||||
2-Year 10 CMS Curve CAP | Call | Barclays Bank PLC | 11/09/21 | 0.21 | % | — | 63 | 660 | ||||||||||||||||
|
| |||||||||||||||||||||||
Total Options Purchased |
| $ | 10,122 | |||||||||||||||||||||
|
| |||||||||||||||||||||||
Futures contracts outstanding at October 31, 2019:
| Number of Contracts | Type | Expiration Date | Current Notional Amount | Value / Unrealized Appreciation (Depreciation) | ||||||||||||
| Long Positions: | ||||||||||||||||
| 100 | 5 Year U.S. Treasury Notes | Dec. 2019 | $ | 11,920,313 | $ | (57,610 | ) | |||||||||
| 1 | 10 Year Canadian Government Bonds | Dec. 2019 | 107,843 | (1,344 | ) | |||||||||||
| 2 | 10 Year U.K. Gilt | Dec. 2019 | 344,149 | (738 | ) | |||||||||||
| 27 | 10 Year U.S. Treasury Notes | Dec. 2019 | 3,518,016 | (1,964 | ) | |||||||||||
| 1 | 10 Year U.S. Ultra Treasury Notes | Dec. 2019 | 142,109 | (2,539 | ) | |||||||||||
| 5 | 20 Year U.S. Treasury Bonds | Dec. 2019 | 806,875 | (2,149 | ) | |||||||||||
| 11 | 30 Year U.S. Ultra Treasury Bonds | Dec. 2019 | 2,087,250 | (33,691 | ) | |||||||||||
|
| |||||||||||||||
| (100,035 | ) | |||||||||||||||
|
| |||||||||||||||
| Short Positions: | ||||||||||||||||
| 79 | 2 Year U.S. Treasury Notes | Dec. 2019 | 17,032,523 | 33,611 | ||||||||||||
| 23 | 5 Year Euro-Bobl | Dec. 2019 | 3,453,259 | 49,395 | ||||||||||||
| 17 | 10 Year Euro-Bund | Dec. 2019 | 3,256,587 | 39,398 | ||||||||||||
| 33 | Euro Schatz Index | Dec. 2019 | 4,124,725 | 17,838 | ||||||||||||
|
| |||||||||||||||
| 140,242 | ||||||||||||||||
|
| |||||||||||||||
| $ | 40,207 | |||||||||||||||
|
| |||||||||||||||
Forward foreign currency exchange contracts outstanding at October 31, 2019:
Purchase Contracts | Counterparty | Notional Amount (000) | Value at Settlement Date | Current Value | Unrealized Appreciation | Unrealized Depreciation | ||||||||||||||||||||
OTC Forward Foreign Currency Exchange Contracts: |
| |||||||||||||||||||||||||
Brazilian Real, | ||||||||||||||||||||||||||
Expiring 11/04/19 | BNP Paribas S.A. | BRL | 650 | $ | 162,876 | $ | 161,932 | $ | — | $ | (944 | ) | ||||||||||||||
See Notes to Financial Statements.
| PGIM Global Total Return (USD Hedged) Fund | 33 |
Schedule of Investments (continued)
as of October 31, 2019
Forward foreign currency exchange contracts outstanding at October 31, 2019 (continued):
Purchase Contracts | Counterparty | Notional Amount (000) | Value at Settlement Date | Current Value | Unrealized Appreciation | Unrealized Depreciation | ||||||||||||||||||
OTC Forward Foreign Currency Exchange Contracts (cont’d.): |
| |||||||||||||||||||||||
Brazilian Real (cont’d.), | ||||||||||||||||||||||||
Expiring 11/04/19 | JPMorgan Chase Bank, N.A. | BRL | 594 | $ | 146,000 | $ | 148,187 | $ | 2,187 | $ | — | |||||||||||||
British Pound, | ||||||||||||||||||||||||
Expiring 01/17/20 | Barclays Bank PLC | GBP | 66 | 85,337 | 85,722 | 385 | — | |||||||||||||||||
Expiring 01/17/20 | Barclays Bank PLC | GBP | 26 | 33,421 | 33,459 | 38 | — | |||||||||||||||||
Expiring 01/17/20 | BNP Paribas S.A. | GBP | 57 | 74,000 | 74,084 | 84 | — | |||||||||||||||||
Expiring 01/17/20 | Morgan Stanley & Co. International PLC | GBP | 54 | 70,000 | 70,622 | 622 | — | |||||||||||||||||
Canadian Dollar, | ||||||||||||||||||||||||
Expiring 01/22/20 | Morgan Stanley & Co. International PLC | CAD | 111 | 84,000 | 84,043 | 43 | — | |||||||||||||||||
Chilean Peso, | ||||||||||||||||||||||||
Expiring 12/18/19 | BNP Paribas S.A. | CLP | 22,084 | 30,553 | 29,815 | — | (738 | ) | ||||||||||||||||
Expiring 12/18/19 | BNP Paribas S.A. | CLP | 18,768 | 26,051 | 25,338 | — | (713 | ) | ||||||||||||||||
Expiring 12/18/19 | BNP Paribas S.A. | CLP | 17,996 | 24,810 | 24,295 | — | (515 | ) | ||||||||||||||||
Expiring 12/18/19 | Goldman Sachs International | CLP | 55,754 | 78,000 | 75,272 | — | (2,728 | ) | ||||||||||||||||
Expiring 12/18/19 | JPMorgan Chase Bank, N.A. | CLP | 17,775 | 24,647 | 23,997 | — | (650 | ) | ||||||||||||||||
Expiring 12/18/19 | UBS AG | CLP | 50,509 | 69,750 | 68,190 | — | (1,560 | ) | ||||||||||||||||
Expiring 12/18/19 | UBS AG | CLP | 9,409 | 13,000 | 12,703 | — | (297 | ) | ||||||||||||||||
Chinese Renminbi, | ||||||||||||||||||||||||
Expiring 02/14/20 | HSBC Bank USA, N.A. | CNH | 168 | 23,661 | 23,721 | 60 | — | |||||||||||||||||
Expiring 05/14/21 | Citibank, N.A. | CNH | 854 | 122,358 | 119,249 | — | (3,109 | ) | ||||||||||||||||
Czech Koruna, | ||||||||||||||||||||||||
Expiring 01/17/20 | Morgan Stanley & Co. International PLC | CZK | 1,848 | 79,000 | 80,865 | 1,865 | — | |||||||||||||||||
Expiring 01/17/20 | Morgan Stanley & Co. International PLC | CZK | 1,466 | 64,000 | 64,153 | 153 | — | |||||||||||||||||
Egyptian Pound, | ||||||||||||||||||||||||
Expiring 11/27/19 | Citibank, N.A. | EGP | 335 | 19,437 | 20,613 | 1,176 | — | |||||||||||||||||
See Notes to Financial Statements.
| 34 |
Forward foreign currency exchange contracts outstanding at October 31, 2019 (continued):
Purchase Contracts | Counterparty | Notional Amount (000) | Value at Settlement Date | Current Value | Unrealized Appreciation | Unrealized Depreciation | ||||||||||||||||||
OTC Forward Foreign Currency Exchange Contracts (cont’d.): |
| |||||||||||||||||||||||
Egyptian Pound (cont’d.), | ||||||||||||||||||||||||
Expiring 11/27/19 | Citibank, N.A. | EGP | 218 | $ | 12,654 | $ | 13,415 | $ | 761 | $ | — | |||||||||||||
Expiring 12/18/19 | Citibank, N.A. | EGP | 653 | 37,652 | 39,956 | 2,304 | — | |||||||||||||||||
Expiring 12/23/19 | Citibank, N.A. | EGP | 169 | 10,000 | 10,300 | 300 | — | |||||||||||||||||
Expiring 12/23/19 | Morgan Stanley & Co. International PLC | EGP | 307 | 18,195 | 18,780 | 585 | — | |||||||||||||||||
Expiring 12/23/19 | Morgan Stanley & Co. International PLC | EGP | 138 | 8,195 | 8,459 | 264 | — | |||||||||||||||||
Expiring 01/21/20 | Citibank, N.A. | EGP | 508 | 29,093 | 30,803 | 1,710 | — | |||||||||||||||||
Expiring 01/28/20 | Citibank, N.A. | EGP | 393 | 23,125 | 23,782 | 657 | — | |||||||||||||||||
Expiring 01/28/20 | Citibank, N.A. | EGP | 216 | 12,634 | 13,079 | 445 | — | |||||||||||||||||
Expiring 01/30/20 | Citibank, N.A. | EGP | 268 | 15,351 | 16,191 | 840 | — | |||||||||||||||||
Euro, | ||||||||||||||||||||||||
Expiring 11/04/19 | Citibank, N.A. | EUR | 4,162 | 4,612,098 | 4,643,027 | 30,929 | — | |||||||||||||||||
Expiring 11/04/19 | JPMorgan Chase Bank, N.A. | EUR | 4,162 | 4,621,462 | 4,643,027 | 21,565 | — | |||||||||||||||||
Expiring 01/17/20 | Barclays Bank PLC | EUR | 102 | 114,000 | 113,846 | — | (154 | ) | ||||||||||||||||
Expiring 01/17/20 | Barclays Bank PLC | EUR | 85 | 95,000 | 95,765 | 765 | — | |||||||||||||||||
Expiring 01/17/20 | Goldman Sachs International | EUR | 71 | 79,261 | 79,257 | — | (4 | ) | ||||||||||||||||
Indian Rupee, | ||||||||||||||||||||||||
Expiring 12/18/19 | Barclays Bank PLC | INR | 3,141 | 44,219 | 43,943 | — | (276 | ) | ||||||||||||||||
Expiring 12/18/19 | Citibank, N.A. | INR | 7,899 | 108,391 | 110,512 | 2,121 | — | |||||||||||||||||
Expiring 12/18/19 | HSBC Bank USA, N.A. | INR | 18,599 | 255,996 | 260,208 | 4,212 | — | |||||||||||||||||
Expiring 12/18/19 | JPMorgan Chase Bank, N.A. | INR | 5,865 | 81,000 | 82,053 | 1,053 | — | |||||||||||||||||
Indonesian Rupiah, | ||||||||||||||||||||||||
Expiring 12/18/19 | HSBC Bank USA, N.A. | IDR | 1,128,766 | 80,000 | 79,731 | — | (269 | ) | ||||||||||||||||
See Notes to Financial Statements.
| PGIM Global Total Return (USD Hedged) Fund | 35 |
Schedule of Investments (continued)
as of October 31, 2019
Forward foreign currency exchange contracts outstanding at October 31, 2019 (continued):
Purchase Contracts | Counterparty | Notional Amount (000) | Value at Settlement Date | Current Value | Unrealized Appreciation | Unrealized Depreciation | ||||||||||||||||||
OTC Forward Foreign Currency Exchange Contracts (cont’d.): |
| |||||||||||||||||||||||
Israeli Shekel, | ||||||||||||||||||||||||
Expiring 11/29/19 | Citibank, N.A. | ILS | 2,289 | $ | 630,000 | $ | 650,332 | $ | 20,332 | $ | — | |||||||||||||
Expiring 12/18/19 | Barclays Bank PLC | ILS | 319 | 92,000 | 90,659 | — | (1,341 | ) | ||||||||||||||||
Expiring 12/18/19 | Barclays Bank PLC | ILS | 312 | 89,000 | 88,727 | — | (273 | ) | ||||||||||||||||
Expiring 12/18/19 | Barclays Bank PLC | ILS | 38 | 10,981 | 10,927 | — | (54 | ) | ||||||||||||||||
Expiring 12/18/19 | Barclays Bank PLC | ILS | 23 | 6,569 | 6,528 | — | (41 | ) | ||||||||||||||||
Expiring 12/18/19 | Citibank, N.A. | ILS | 45 | 12,800 | 12,684 | — | (116 | ) | ||||||||||||||||
Expiring 12/18/19 | JPMorgan Chase Bank, N.A. | ILS | 162 | 46,071 | 46,128 | 57 | — | |||||||||||||||||
Expiring 12/18/19 | JPMorgan Chase Bank, N.A. | ILS | 98 | 27,797 | 27,766 | — | (31 | ) | ||||||||||||||||
Japanese Yen, | ||||||||||||||||||||||||
Expiring 01/17/20 | Barclays Bank PLC | JPY | 3,281 | 30,510 | 30,549 | 39 | — | |||||||||||||||||
Mexican Peso, | ||||||||||||||||||||||||
Expiring 12/18/19 | Barclays Bank PLC | MXN | 1,406 | 73,000 | 72,540 | — | (460 | ) | ||||||||||||||||
Expiring 12/18/19 | JPMorgan Chase Bank, N.A. | MXN | 4,189 | 207,581 | 216,130 | 8,549 | — | |||||||||||||||||
New Taiwanese Dollar, | ||||||||||||||||||||||||
Expiring 12/18/19 | JPMorgan Chase Bank, N.A. | TWD | 3,579 | 116,880 | 118,159 | 1,279 | — | |||||||||||||||||
Norwegian Krone, | ||||||||||||||||||||||||
Expiring 01/17/20 | Bank of America, N.A. | NOK | 1,826 | 200,584 | 198,711 | — | (1,873 | ) | ||||||||||||||||
Expiring 01/17/20 | JPMorgan Chase Bank, N.A. | NOK | 1,736 | 190,989 | 188,867 | — | (2,122 | ) | ||||||||||||||||
Expiring 01/17/20 | Morgan Stanley & Co. International PLC | NOK | 540 | 58,730 | 58,797 | 67 | — | |||||||||||||||||
Peruvian Nuevo Sol, | ||||||||||||||||||||||||
Expiring 12/18/19 | BNP Paribas S.A. | PEN | 632 | 187,013 | 188,703 | 1,690 | — | |||||||||||||||||
Philippine Peso, | ||||||||||||||||||||||||
Expiring 12/18/19 | JPMorgan Chase Bank, N.A. | PHP | 1,452 | 27,799 | 28,545 | 746 | — | |||||||||||||||||
Expiring 12/18/19 | Morgan Stanley & Co. International PLC | PHP | 4,123 | 79,000 | 81,063 | 2,063 | — | |||||||||||||||||
See Notes to Financial Statements.
| 36 |
Forward foreign currency exchange contracts outstanding at October 31, 2019 (continued):
Purchase Contracts | Counterparty | Notional Amount (000) | Value at Settlement Date | Current Value | Unrealized Appreciation | Unrealized Depreciation | ||||||||||||||||||
OTC Forward Foreign Currency Exchange Contracts (cont’d.): |
| |||||||||||||||||||||||
Polish Zloty, | ||||||||||||||||||||||||
Expiring 01/17/20 | Citibank, N.A. | PLN | 256 | $ | 66,000 | $ | 67,120 | $ | 1,120 | $ | — | |||||||||||||
Expiring 01/17/20 | UBS AG | PLN | 269 | 70,000 | 70,428 | 428 | — | |||||||||||||||||
Russian Ruble, | ||||||||||||||||||||||||
Expiring 12/18/19 | Citibank, N.A. | RUB | 3,756 | 58,000 | 58,153 | 153 | — | |||||||||||||||||
Expiring 12/18/19 | Credit Suisse International | RUB | 2,325 | 36,038 | 35,997 | — | (41 | ) | ||||||||||||||||
Expiring 12/18/19 | JPMorgan Chase Bank, N.A. | RUB | 2,861 | 44,200 | 44,296 | 96 | — | |||||||||||||||||
Expiring 12/18/19 | Morgan Stanley & Co. International PLC | RUB | 11,238 | 165,384 | 174,016 | 8,632 | — | |||||||||||||||||
Expiring 12/18/19 | Morgan Stanley & Co. International PLC | RUB | 9,473 | 140,000 | 146,690 | 6,690 | — | |||||||||||||||||
Singapore Dollar, | ||||||||||||||||||||||||
Expiring 12/18/19 | Citibank, N.A. | SGD | 144 | 106,000 | 106,231 | 231 | — | |||||||||||||||||
Expiring 12/18/19 | Citibank, N.A. | SGD | 113 | 81,975 | 82,860 | 885 | — | |||||||||||||||||
Expiring 12/18/19 | Citibank, N.A. | SGD | 92 | 67,000 | 67,858 | 858 | — | |||||||||||||||||
Expiring 12/18/19 | Goldman Sachs International | SGD | 288 | 211,300 | 211,516 | 216 | — | |||||||||||||||||
Expiring 12/18/19 | JPMorgan Chase Bank, N.A. | SGD | 155 | 114,000 | 114,151 | 151 | — | |||||||||||||||||
South African Rand, | ||||||||||||||||||||||||
Expiring 12/18/19 | JPMorgan Chase Bank, N.A. | ZAR | 589 | 38,763 | 38,707 | — | (56 | ) | ||||||||||||||||
Expiring 12/18/19 | JPMorgan Chase Bank, N.A. | ZAR | 567 | 36,876 | 37,307 | 431 | — | |||||||||||||||||
Expiring 12/18/19 | JPMorgan Chase Bank, N.A. | ZAR | 100 | 6,426 | 6,570 | 144 | — | |||||||||||||||||
Expiring 12/18/19 | The Toronto-Dominion Bank | ZAR | 620 | 42,000 | 40,738 | — | (1,262 | ) | ||||||||||||||||
South Korean Won, | ||||||||||||||||||||||||
Expiring 12/18/19 | HSBC Bank USA, N.A. | KRW | 110,977 | 93,000 | 94,920 | 1,920 | — | |||||||||||||||||
Expiring 12/18/19 | HSBC Bank USA, N.A. | KRW | 108,149 | 91,000 | 92,502 | 1,502 | — | |||||||||||||||||
Expiring 12/18/19 | JPMorgan Chase Bank, N.A. | KRW | 92,719 | 78,000 | 79,304 | 1,304 | — | |||||||||||||||||
See Notes to Financial Statements.
| PGIM Global Total Return (USD Hedged) Fund | 37 |
Schedule of Investments (continued)
as of October 31, 2019
Forward foreign currency exchange contracts outstanding at October 31, 2019 (continued):
Purchase Contracts | Counterparty | Notional Amount (000) | Value at Settlement Date | Current Value | Unrealized Appreciation | Unrealized Depreciation | ||||||||||||||||||||
OTC Forward Foreign Currency Exchange Contracts (cont’d.): |
| |||||||||||||||||||||||||
South Korean Won (cont’d.), | ||||||||||||||||||||||||||
Expiring 12/18/19 | JPMorgan Chase Bank, N.A. | KRW | 51,817 | $ | 44,402 | $ | 44,320 | $ | — | $ | (82 | ) | ||||||||||||||
Swiss Franc, | ||||||||||||||||||||||||||
Expiring 01/17/20 | Morgan Stanley & Co. International PLC | CHF | 17 | 17,100 | 17,180 | 80 | — | |||||||||||||||||||
Thai Baht, | ||||||||||||||||||||||||||
Expiring 12/18/19 | Citibank, N.A. | THB | 2,082 | 68,000 | 68,993 | 993 | — | |||||||||||||||||||
Expiring 12/18/19 | Goldman Sachs International | THB | 3,052 | 100,000 | 101,125 | 1,125 | — | |||||||||||||||||||
Expiring 12/18/19 | HSBC Bank USA, N.A. | THB | 2,596 | 85,000 | 86,017 | 1,017 | — | |||||||||||||||||||
Expiring 12/18/19 | UBS AG | THB | 3,379 | 111,000 | 111,960 | 960 | — | |||||||||||||||||||
Turkish Lira, | ||||||||||||||||||||||||||
Expiring 12/18/19 | Barclays Bank PLC | TRY | 219 | 37,374 | 37,795 | 421 | — | |||||||||||||||||||
Expiring 12/18/19 | Barclays Bank PLC | TRY | 216 | 36,996 | 37,370 | 374 | — | |||||||||||||||||||
Expiring 12/18/19 | Barclays Bank PLC | TRY | 151 | 25,806 | 26,062 | 256 | — | |||||||||||||||||||
Expiring 12/18/19 | Barclays Bank PLC | TRY | 142 | 24,400 | 24,452 | 52 | — | |||||||||||||||||||
Expiring 12/18/19 | Citibank, N.A. | TRY | 210 | 36,000 | 36,181 | 181 | — | |||||||||||||||||||
Expiring 12/18/19 | Goldman Sachs International | TRY | 211 | 36,038 | 36,509 | 471 | — | |||||||||||||||||||
Expiring 12/18/19 | Goldman Sachs International | TRY | 151 | 26,000 | 26,151 | 151 | — | |||||||||||||||||||
|
|
|
|
|
|
|
| |||||||||||||||||||
| $ | 15,770,609 | $ | 15,891,688 | 140,788 | (19,709 | ) | ||||||||||||||||||||
|
|
|
|
|
|
|
| |||||||||||||||||||
Sale Contracts | Counterparty | Notional Amount (000) | Value at Settlement Date | Current Value | Unrealized Appreciation | Unrealized Depreciation | ||||||||||||||||||||
OTC Forward Foreign Currency Exchange Contracts: |
| |||||||||||||||||||||||||
Australian Dollar, | ||||||||||||||||||||||||||
Expiring 01/22/20 | HSBC Bank USA, N.A. | AUD | 666 | $ | 456,019 | $ | 460,107 | $ | — | $ | (4,088 | ) | ||||||||||||||
See Notes to Financial Statements.
| 38 |
Forward foreign currency exchange contracts outstanding at October 31, 2019 (continued):
Sale Contracts | Counterparty | Notional Amount (000) | Value at Settlement Date | Current Value | Unrealized Appreciation | Unrealized Depreciation | ||||||||||||||||||
OTC Forward Foreign Currency Exchange Contracts (cont’d.): |
| |||||||||||||||||||||||
Brazilian Real, | ||||||||||||||||||||||||
Expiring 11/04/19 | The Toronto-Dominion Bank | BRL | 1,244 | $ | 298,482 | $ | 310,118 | $ | — | $ | (11,636 | ) | ||||||||||||
Expiring 12/03/19 | BNP Paribas S.A. | BRL | 650 | 162,615 | 161,641 | 974 | — | |||||||||||||||||
British Pound, | ||||||||||||||||||||||||
Expiring 01/17/20 | Barclays Bank PLC | GBP | 75 | 97,000 | 97,739 | — | (739 | ) | ||||||||||||||||
Expiring 01/17/20 | Barclays Bank PLC | GBP | 46 | 60,000 | 60,225 | — | (225 | ) | ||||||||||||||||
Expiring 01/17/20 | Citibank, N.A. | GBP | 368 | 463,077 | 477,400 | — | (14,323 | ) | ||||||||||||||||
Expiring 01/17/20 | Deutsche Bank AG | GBP | 368 | 465,988 | 477,400 | — | (11,412 | ) | ||||||||||||||||
Expiring 01/17/20 | Morgan Stanley & Co. International PLC | GBP | 49 | 63,000 | 63,272 | — | (272 | ) | ||||||||||||||||
Expiring 01/17/20 | UBS AG | GBP | 36 | 46,247 | 46,568 | — | (321 | ) | ||||||||||||||||
Canadian Dollar, | ||||||||||||||||||||||||
Expiring 01/22/20 | Barclays Bank PLC | CAD | 575 | 438,228 | 437,002 | 1,226 | — | |||||||||||||||||
Chilean Peso, | ||||||||||||||||||||||||
Expiring 12/18/19 | JPMorgan Chase Bank, N.A. | CLP | 254,865 | 353,489 | 344,085 | 9,404 | — | |||||||||||||||||
Expiring 12/18/19 | Morgan Stanley & Co. International PLC | CLP | 127,433 | 179,167 | 172,042 | 7,125 | — | |||||||||||||||||
Expiring 12/18/19 | Morgan Stanley & Co. International PLC | CLP | 127,433 | 176,744 | 172,042 | 4,702 | — | |||||||||||||||||
Chinese Renminbi, | ||||||||||||||||||||||||
Expiring 02/14/20 | BNP Paribas S.A. | CNH | 2,111 | 297,523 | 298,618 | — | (1,095 | ) | ||||||||||||||||
Expiring 05/14/21 | JPMorgan Chase Bank, N.A. | CNH | 854 | 122,556 | 119,248 | 3,308 | — | |||||||||||||||||
Colombian Peso, | ||||||||||||||||||||||||
Expiring 12/18/19 | BNP Paribas S.A. | COP | 176,103 | 51,000 | 52,007 | — | (1,007 | ) | ||||||||||||||||
Expiring 12/18/19 | Goldman Sachs International | COP | 158,151 | 46,556 | 46,706 | — | (150 | ) | ||||||||||||||||
Expiring 12/18/19 | JPMorgan Chase Bank, N.A. | COP | 248,716 | 72,544 | 73,452 | — | (908 | ) | ||||||||||||||||
Expiring 12/18/19 | JPMorgan Chase Bank, N.A. | COP | 149,484 | 44,200 | 44,146 | 54 | — | |||||||||||||||||
See Notes to Financial Statements.
| PGIM Global Total Return (USD Hedged) Fund | 39 |
Schedule of Investments (continued)
as of October 31, 2019
Forward foreign currency exchange contracts outstanding at October 31, 2019 (continued):
Sale Contracts | Counterparty | Notional Amount (000) | Value at Settlement Date | Current Value | Unrealized Appreciation | Unrealized Depreciation | ||||||||||||||||||
OTC Forward Foreign Currency Exchange Contracts (cont’d.): |
| |||||||||||||||||||||||
Colombian Peso (cont’d.), | ||||||||||||||||||||||||
Expiring 12/18/19 | JPMorgan Chase Bank, N.A. | COP | 132,092 | $ | 38,878 | $ | 39,010 | $ | — | $ | (132 | ) | ||||||||||||
Expiring 12/18/19 | UBS AG | COP | 162,720 | 48,000 | 48,055 | — | (55 | ) | ||||||||||||||||
Czech Koruna, | ||||||||||||||||||||||||
Expiring 01/17/20 | Barclays Bank PLC | CZK | 2,598 | 111,176 | 113,680 | — | (2,504 | ) | ||||||||||||||||
Egyptian Pound, | ||||||||||||||||||||||||
Expiring 12/23/19 | Citibank, N.A. | EGP | 490 | 29,447 | 29,927 | — | (480 | ) | ||||||||||||||||
Expiring 12/23/19 | Citibank, N.A. | EGP | 125 | 7,507 | 7,612 | — | (105 | ) | ||||||||||||||||
Euro, | ||||||||||||||||||||||||
Expiring 11/04/19 | Citibank, N.A. | EUR | 4,113 | 4,531,224 | 4,588,190 | — | (56,966 | ) | ||||||||||||||||
Expiring 11/04/19 | JPMorgan Chase Bank, N.A. | EUR | 4,113 | 4,537,438 | 4,588,189 | — | (50,751 | ) | ||||||||||||||||
Expiring 11/04/19 | Morgan Stanley & Co. International PLC | EUR | 98 | 107,703 | 109,673 | — | (1,970 | ) | ||||||||||||||||
Expiring 12/03/19 | Citibank, N.A. | EUR | 4,162 | 4,620,984 | 4,651,818 | — | (30,834 | ) | ||||||||||||||||
Expiring 12/03/19 | JPMorgan Chase Bank, N.A. | EUR | 4,162 | 4,630,415 | 4,651,818 | — | (21,403 | ) | ||||||||||||||||
Expiring 01/17/20 | HSBC Bank USA, N.A. | EUR | 968 | 1,074,052 | 1,085,073 | — | (11,021 | ) | ||||||||||||||||
Expiring 01/17/20 | JPMorgan Chase Bank, N.A. | EUR | 1,038 | 1,152,834 | 1,163,904 | — | (11,070 | ) | ||||||||||||||||
Expiring 01/17/20 | Morgan Stanley & Co. International PLC | EUR | 91 | 101,330 | 101,861 | — | (531 | ) | ||||||||||||||||
Expiring 01/17/20 | Morgan Stanley & Co. International PLC | EUR | 90 | 100,559 | 100,731 | — | (172 | ) | ||||||||||||||||
Expiring 01/17/20 | Morgan Stanley & Co. International PLC | EUR | 76 | 85,000 | 85,241 | — | (241 | ) | ||||||||||||||||
Expiring 01/17/20 | UBS AG | EUR | 1,127 | 1,248,812 | 1,264,166 | — | (15,354 | ) | ||||||||||||||||
Expiring 01/17/20 | UBS AG | EUR | 715 | 797,839 | 801,692 | — | (3,853 | ) | ||||||||||||||||
Hungarian Forint, | ||||||||||||||||||||||||
Expiring 01/17/20 | The Toronto-Dominion Bank | HUF | 67,447 | 225,972 | 229,956 | — | (3,984 | ) | ||||||||||||||||
See Notes to Financial Statements.
| 40 |
Forward foreign currency exchange contracts outstanding at October 31, 2019 (continued):
Sale Contracts | Counterparty | Notional Amount (000) | Value at Settlement Date | Current Value | Unrealized Appreciation | Unrealized Depreciation | ||||||||||||||||||
OTC Forward Foreign Currency Exchange Contracts (cont’d.): |
| |||||||||||||||||||||||
Indian Rupee, | ||||||||||||||||||||||||
Expiring 12/18/19 | HSBC Bank USA, N.A. | INR | 6,875 | $ | 96,000 | $ | 96,177 | $ | — | $ | (177 | ) | ||||||||||||
Expiring 12/18/19 | HSBC Bank USA, N.A. | INR | 2,626 | 36,505 | 36,743 | — | (238 | ) | ||||||||||||||||
Expiring 12/18/19 | HSBC Bank USA, N.A. | INR | 2,588 | 36,038 | 36,203 | — | (165 | ) | ||||||||||||||||
Indonesian Rupiah, | ||||||||||||||||||||||||
Expiring 12/18/19 | HSBC Bank USA, N.A. | IDR | 5,437,102 | 377,997 | 384,053 | — | (6,056 | ) | ||||||||||||||||
Expiring 12/18/19 | HSBC Bank USA, N.A. | IDR | 1,118,008 | 79,000 | 78,971 | 29 | — | |||||||||||||||||
Expiring 12/18/19 | HSBC Bank USA, N.A. | IDR | 1,015,454 | 71,000 | 71,727 | — | (727 | ) | ||||||||||||||||
Expiring 12/18/19 | HSBC Bank USA, N.A. | IDR | 1,000,177 | 71,000 | 70,648 | 352 | — | |||||||||||||||||
Israeli Shekel, | ||||||||||||||||||||||||
Expiring 11/29/19 | Goldman Sachs International | ILS | 2,284 | 630,000 | 648,900 | — | (18,900 | ) | ||||||||||||||||
Expiring 12/18/19 | Barclays Bank PLC | ILS | 519 | 148,048 | 147,651 | 397 | — | |||||||||||||||||
Japanese Yen, | ||||||||||||||||||||||||
Expiring 01/17/20 | Morgan Stanley & Co. International PLC | JPY | 46,193 | 429,117 | 430,062 | — | (945 | ) | ||||||||||||||||
Malaysian Ringgit, | ||||||||||||||||||||||||
Expiring 12/18/19 | Goldman Sachs International | MYR | 466 | 111,270 | 111,810 | — | (540 | ) | ||||||||||||||||
Mexican Peso, | ||||||||||||||||||||||||
Expiring 12/18/19 | Citibank, N.A. | MXN | 790 | 41,000 | 40,750 | 250 | — | |||||||||||||||||
Expiring 12/18/19 | JPMorgan Chase Bank, N.A. | MXN | 765 | 38,841 | 39,450 | — | (609 | ) | ||||||||||||||||
New Taiwanese Dollar, | ||||||||||||||||||||||||
Expiring 12/18/19 | Barclays Bank PLC | TWD | 1,214 | 39,945 | 40,080 | — | (135 | ) | ||||||||||||||||
Expiring 12/18/19 | Credit Suisse International | TWD | 14,114 | 454,521 | 465,986 | — | (11,465 | ) | ||||||||||||||||
Expiring 12/18/19 | HSBC Bank USA, N.A. | TWD | 4,499 | 147,000 | 148,531 | — | (1,531 | ) | ||||||||||||||||
Expiring 12/18/19 | HSBC Bank USA, N.A. | TWD | 2,508 | 81,000 | 82,794 | — | (1,794 | ) | ||||||||||||||||
See Notes to Financial Statements.
| PGIM Global Total Return (USD Hedged) Fund | 41 |
Schedule of Investments (continued)
as of October 31, 2019
Forward foreign currency exchange contracts outstanding at October 31, 2019 (continued):
Sale Contracts | Counterparty | Notional Amount (000) | Value at Settlement Date | Current Value | Unrealized Appreciation | Unrealized Depreciation | ||||||||||||||||||
OTC Forward Foreign Currency Exchange Contracts (cont’d.): |
| |||||||||||||||||||||||
New Zealand Dollar, | ||||||||||||||||||||||||
Expiring 01/22/20 | Morgan Stanley & Co. International PLC | NZD | 656 | $ | 416,060 | $ | 420,988 | $ | — | $ | (4,928 | ) | ||||||||||||
Expiring 01/22/20 | Morgan Stanley & Co. International PLC | NZD | 36 | 22,891 | 23,130 | — | (239 | ) | ||||||||||||||||
Peruvian Nuevo Sol, | ||||||||||||||||||||||||
Expiring 12/18/19 | Bank of America, N.A. | PEN | 386 | 115,000 | 115,219 | — | (219 | ) | ||||||||||||||||
Expiring 12/18/19 | Bank of America, N.A. | PEN | 152 | 45,000 | 45,246 | — | (246 | ) | ||||||||||||||||
Philippine Peso, | ||||||||||||||||||||||||
Expiring 12/18/19 | BNP Paribas S.A. | PHP | 5,397 | 103,000 | 106,105 | — | (3,105 | )�� | ||||||||||||||||
Expiring 12/18/19 | HSBC Bank USA, N.A. | PHP | 5,162 | 99,000 | 101,478 | — | (2,478 | ) | ||||||||||||||||
Polish Zloty, | ||||||||||||||||||||||||
Expiring 01/17/20 | Barclays Bank PLC | PLN | 98 | 25,142 | 25,602 | — | (460 | ) | ||||||||||||||||
Russian Ruble, | ||||||||||||||||||||||||
Expiring 12/18/19 | JPMorgan Chase Bank, N.A. | RUB | 2,967 | 46,000 | 45,947 | 53 | — | |||||||||||||||||
Singapore Dollar, | ||||||||||||||||||||||||
Expiring 12/18/19 | Goldman Sachs International | SGD | 255 | 183,477 | 187,783 | — | (4,306 | ) | ||||||||||||||||
South African Rand, | ||||||||||||||||||||||||
Expiring 12/18/19 | Barclays Bank PLC | ZAR | 1,650 | 107,589 | 108,459 | — | (870 | ) | ||||||||||||||||
Expiring 12/18/19 | Barclays Bank PLC | ZAR | 1,106 | 73,800 | 72,744 | 1,056 | — | |||||||||||||||||
Expiring 12/18/19 | Barclays Bank PLC | ZAR | 547 | 36,187 | 35,956 | 231 | — | |||||||||||||||||
Expiring 12/18/19 | Barclays Bank PLC | ZAR | 538 | 36,038 | 35,365 | 673 | — | |||||||||||||||||
Expiring 12/18/19 | Citibank, N.A. | ZAR | 560 | 36,606 | 36,790 | — | (184 | ) | ||||||||||||||||
Expiring 12/18/19 | JPMorgan Chase Bank, N.A. | ZAR | 650 | 43,716 | 42,738 | 978 | — | |||||||||||||||||
South Korean Won, | ||||||||||||||||||||||||
Expiring 12/18/19 | Citibank, N.A. | KRW | 169,705 | 141,192 | 145,152 | — | (3,960 | ) | ||||||||||||||||
Swedish Krona, | ||||||||||||||||||||||||
Expiring 01/17/20 | Morgan Stanley & Co. International PLC | SEK | 1,703 | 174,873 | 177,241 | — | (2,368 | ) | ||||||||||||||||
See Notes to Financial Statements.
| 42 |
Forward foreign currency exchange contracts outstanding at October 31, 2019 (continued):
Sale Contracts | Counterparty | Notional Amount (000) | Value at Settlement Date | Current Value | Unrealized Appreciation | Unrealized Depreciation | ||||||||||||||||||||||
OTC Forward Foreign Currency Exchange Contracts (cont’d.): |
| |||||||||||||||||||||||||||
Swiss Franc, | ||||||||||||||||||||||||||||
Expiring 01/17/20 | | Morgan Stanley & Co. International PLC | | CHF | 21 | $ | 21,393 | $ | 21,596 | $ | — | $ | (203 | ) | ||||||||||||||
Expiring 01/17/20 | UBS AG | CHF | 480 | 483,882 | 489,352 | ��� | (5,470 | ) | ||||||||||||||||||||
Thai Baht, | ||||||||||||||||||||||||||||
Expiring 12/18/19 | Barclays Bank PLC | THB | 2,310 | 75,000 | 76,531 | — | (1,531 | ) | ||||||||||||||||||||
Expiring 12/18/19 | | JPMorgan Chase Bank, N.A. | | THB | 125 | 4,089 | 4,158 | — | (69 | ) | ||||||||||||||||||
Turkish Lira, | ||||||||||||||||||||||||||||
Expiring 12/18/19 | Barclays Bank PLC | TRY | 218 | 36,000 | 37,665 | — | (1,665 | ) | ||||||||||||||||||||
Expiring 12/18/19 | Barclays Bank PLC | TRY | 36 | 6,000 | 6,236 | — | (236 | ) | ||||||||||||||||||||
Expiring 12/18/19 | | JPMorgan Chase Bank, N.A. | | TRY | 765 | 126,585 | 132,166 | — | (5,581 | ) | ||||||||||||||||||
Expiring 12/18/19 | | JPMorgan Chase Bank, N.A. | | TRY | 175 | 28,775 | 30,136 | — | (1,361 | ) | ||||||||||||||||||
|
|
|
|
|
|
|
| |||||||||||||||||||||
| $ | 32,719,182 | $ | 33,028,733 | 30,812 | (340,363 | ) | ||||||||||||||||||||||
|
|
|
|
|
|
|
| |||||||||||||||||||||
| $ | 171,600 | $ | (360,072 | ) | ||||||||||||||||||||||||
|
|
|
| |||||||||||||||||||||||||
Credit default swap agreements outstanding at October 31, 2019:
Reference | Termination Date | Fixed Rate | Notional Amount (000)#(3) | Implied Credit Spread at October 31, 2019(4) | Fair Value | Upfront Premiums Paid (Received) | Unrealized Appreciation (Depreciation) | Counterparty | ||||||||||||||||||||||
OTC Packaged Credit Default Swap Agreements on corporate and/or sovereign issues—Sell Protection(2)*: | ||||||||||||||||||||||||||||||
Government of Malaysia | 12/20/22 | 1.000%(Q) | 120 | 0.280 | % | $ | 3,012 | $ | (130 | ) | $ | 3,142 | Citibank, N.A. | |||||||||||||||||
People’s Republic of China | 12/20/22 | 1.000%(Q) | 400 | 0.223 | % | 10,619 | (432 | ) | 11,051 | Citibank, N.A. | ||||||||||||||||||||
Republic of Argentina | 12/20/22 | 1.000%(Q) | 120 | 117.935 | % | (75,460 | ) | (130 | ) | (75,330 | ) | Citibank, N.A. | ||||||||||||||||||
Republic of Brazil | 12/20/22 | 1.000%(Q) | 600 | 0.731 | % | 5,637 | (648 | ) | 6,285 | Citibank, N.A. | ||||||||||||||||||||
Republic of Chile | 12/20/22 | 1.000%(Q) | 120 | 0.245 | % | 2,938 | (130 | ) | 3,068 | Citibank, N.A. | ||||||||||||||||||||
Republic of Colombia | 12/20/22 | 1.000%(Q) | 160 | 0.444 | % | 2,924 | (173 | ) | 3,097 | Citibank, N.A. | ||||||||||||||||||||
See Notes to Financial Statements.
| PGIM Global Total Return (USD Hedged) Fund | 43 |
Schedule of Investments(continued)
as of October 31, 2019
Credit default swap agreements outstanding at October 31, 2019 (continued):
Reference | Termination Date | Fixed Rate | Notional Amount (000)#(3) | Implied Credit Spread at October 31, 2019(4) | Fair Value | Upfront Premiums Paid (Received) | Unrealized Appreciation (Depreciation) | Counterparty | ||||||||||||||||||||||
OTC Packaged Credit Default Swap Agreements on corporate and/or sovereign issues—Sell Protection(2)*(cont’d.): | ||||||||||||||||||||||||||||||
Republic of Indonesia | 12/20/22 | 1.000%(Q) | 160 | 0.517 | % | $ | 3,071 | $ | (173 | ) | $ | 3,244 | Citibank, N.A. | |||||||||||||||||
Republic of Panama | 12/20/22 | 1.000%(Q) | 120 | 0.245 | % | 2,938 | (130 | ) | 3,068 | Citibank, N.A. | ||||||||||||||||||||
Republic of Peru | 12/20/22 | 1.000%(Q) | 120 | 0.251 | % | 2,915 | (130 | ) | 3,045 | Citibank, N.A. | ||||||||||||||||||||
Republic of Philippines | 12/20/22 | 1.000%(Q) | 120 | 0.267 | % | 3,052 | (130 | ) | 3,182 | Citibank, N.A. | ||||||||||||||||||||
Republic of South Africa | 12/20/22 | 1.000%(Q) | 360 | 1.322 | % | (3,289 | ) | (389 | ) | (2,900 | ) | Citibank, N.A. | ||||||||||||||||||
Republic of Turkey | 12/20/22 | 1.000%(Q) | 600 | 2.780 | % | (30,858 | ) | (648 | ) | (30,210 | ) | Citibank, N.A. | ||||||||||||||||||
Russian Federation | 12/20/22 | 1.000%(Q) | 360 | 0.430 | % | 6,689 | (389 | ) | 7,078 | Citibank, N.A. | ||||||||||||||||||||
United Mexican States | 12/20/22 | 1.000%(Q) | 520 | 0.525 | % | 8,196 | (562 | ) | 8,758 | Citibank, N.A. | ||||||||||||||||||||
|
|
|
|
|
| |||||||||||||||||||||||||
| $ | (57,616 | ) | $ | (4,194 | ) | $ | (53,422 | ) | ||||||||||||||||||||||
|
|
|
|
|
| |||||||||||||||||||||||||
Reference Entity/ | Termination Date | Fixed Rate | Notional Amount (000)#(3) | Fair Value | Upfront Premiums Paid (Received) | Unrealized Appreciation (Depreciation) | Counterparty | |||||||||||||||||||
OTC Packaged Credit Default Swap Agreement on credit indices—Buy Protection(1)*: | ||||||||||||||||||||||||||
CDX.EM.28.V2 | 12/20/22 | 1.000%(Q) | 3,880 | $ | 55,034 | $ | (1,153 | ) | $ | 56,187 | Citibank, N.A. | |||||||||||||||
|
|
|
|
|
| |||||||||||||||||||||
| * | The Fund entered into multiple credit default swap agreements in a packaged trade consisting of two parts. The Fund bought/sold protection on an Emerging Market CDX Index and bought/sold protection on the countries which comprise the index. Theup-front premium is attached to the index of the trade. Each swap is priced individually. If any of the component swaps are closed out early, the Index exposure will be reduced by an amount proportionate to the terminated swap(s). |
Reference | Termination Date | Fixed Rate | Notional Amount (000)#(3) | Implied Credit Spread at October 31, 2019(4) | Fair Value | Upfront Premiums Paid (Received) | Unrealized Appreciation (Depreciation) | Counterparty | ||||||||||||||||||||||
OTC Credit Default Swap Agreements on asset-backed securities—Sell Protection(2)^: | ||||||||||||||||||||||||||||||
American Money Management Corporation | 11/26/19 | 1.000%(M) | 6 | * | $ | 5 | $ | — | $ | 5 | Goldman Sachs International | |||||||||||||||||||
See Notes to Financial Statements.
| 44 |
Credit default swap agreements outstanding at October 31, 2019 (continued):
Reference | Termination Date | Fixed Rate | Notional Amount (000)#(3) | Implied Credit Spread at October 31, 2019(4) | Fair Value | Upfront Premiums Paid (Received) | Unrealized Appreciation (Depreciation) | Counterparty | ||||||||||||||||||||||||
OTC Credit Default Swap Agreements on asset-backed securities—Sell Protection(2)^ (cont’d.): |
| |||||||||||||||||||||||||||||||
Anchorage Capital CLO | 11/26/19 | 0.500%(M) | EUR | 15 | * | $ | 7 | $ | — | $ | 7 | Goldman Sachs International | ||||||||||||||||||||
Anchorage Capital CLO | 11/26/19 | 1.000%(M) | EUR | 14 | * | 13 | — | 13 | Goldman Sachs International | |||||||||||||||||||||||
AXA CLO | 11/26/19 | 0.500%(M) | EUR | 8 | * | 3 | — | 3 | Goldman Sachs International | |||||||||||||||||||||||
Bardin Hill Loan Advisors European Funding | 11/26/19 | 1.000%(M) | EUR | 9 | * | 8 | — | 8 | Goldman Sachs International | |||||||||||||||||||||||
Barings CLO | 11/26/19 | 1.000%(M) | 1 | * | — | — | — | Goldman Sachs International | ||||||||||||||||||||||||
Bear Stearns Asset-Backed Securities Trust | 11/27/19 | 1.250%(M) | 27 | * | 26 | — | 26 | Goldman Sachs International | ||||||||||||||||||||||||
Bear Stearns Asset-Backed Securities Trust | 11/27/19 | 1.250%(M) | 15 | * | 15 | — | 15 | Goldman Sachs International | ||||||||||||||||||||||||
BlueMountain CLO | 11/26/19 | 1.000%(M) | 3 | * | 2 | — | 2 | Goldman Sachs International | ||||||||||||||||||||||||
Cairn CLO B.V. | 11/26/19 | 1.000%(M) | EUR | 7 | * | 7 | — | 7 | Goldman Sachs International | |||||||||||||||||||||||
Canyon CLO | 11/26/19 | 0.500%(M) | 2 | * | — | — | — | Goldman Sachs International | ||||||||||||||||||||||||
CIFC CLO | 11/26/19 | 1.000%(M) | 2 | * | 2 | — | 2 | Goldman Sachs International | ||||||||||||||||||||||||
Citigroup Commercial Mortgage Trust | 11/26/19 | 1.250%(M) | 12 | * | 12 | — | 12 | Goldman Sachs International | ||||||||||||||||||||||||
Citigroup Commercial Mortgage Trust | 11/26/19 | 1.250%(M) | 8 | 6.940 | % | 8 | — | 8 | Goldman Sachs International | |||||||||||||||||||||||
See Notes to Financial Statements.
| PGIM Global Total Return (USD Hedged) Fund | 45 |
Schedule of Investments(continued)
as of October 31, 2019
Credit default swap agreements outstanding at October 31, 2019 (continued):
Reference | Termination Date | Fixed Rate | Notional Amount (000)#(3) | Implied Credit Spread at October 31, 2019(4) | Fair Value | Upfront Premiums Paid (Received) | Unrealized Appreciation (Depreciation) | Counterparty | ||||||||||||||||||||||
OTC Credit Default Swap Agreements on asset-backed securities—Sell Protection(2)^ (cont’d.): | ||||||||||||||||||||||||||||||
Citigroup Commercial Mortgage Trust | 11/26/19 | 1.250%(M) | 7 | * | $ | 7 | $ | — | $ | 7 | Goldman Sachs International | |||||||||||||||||||
Citigroup Commercial Mortgage Trust | 11/26/19 | 1.250%(M) | 4 | 4.670 | % | 4 | — | 4 | Goldman Sachs International | |||||||||||||||||||||
COMM Mortgage Trust | 11/26/19 | 1.250%(M) | 14 | * | 14 | — | 14 | Goldman Sachs International | ||||||||||||||||||||||
COMM Mortgage Trust | 11/26/19 | 1.250%(M) | 11 | 19.740 | % | 11 | — | 11 | Goldman Sachs International | |||||||||||||||||||||
COMM Mortgage Trust | 11/26/19 | 1.250%(M) | 10 | * | 10 | — | 10 | Goldman Sachs International | ||||||||||||||||||||||
COMM Mortgage Trust | 11/26/19 | 1.250%(M) | 8 | * | 8 | — | 8 | Goldman Sachs International | ||||||||||||||||||||||
COMM Mortgage Trust | 11/26/19 | 1.250%(M) | 7 | 6.940 | % | 7 | — | 7 | Goldman Sachs International | |||||||||||||||||||||
COMM Mortgage Trust | 11/26/19 | 1.250%(M) | 5 | 7.460 | % | 5 | — | 5 | Goldman Sachs International | |||||||||||||||||||||
Commerzebank CLO | 11/26/19 | 1.000%(M) | EUR | 7 | * | 7 | — | 7 | Goldman Sachs International | |||||||||||||||||||||
CSAM CLO | 11/26/19 | 1.000%(M) | 2 | * | 2 | — | 2 | Goldman Sachs International | ||||||||||||||||||||||
DFG CLO | 11/26/19 | 1.000%(M) | 2 | * | — | — | — | Goldman Sachs International | ||||||||||||||||||||||
Ellington CLO | 11/26/19 | 1.000%(M) | 36 | * | 27 | — | 27 | Goldman Sachs International | ||||||||||||||||||||||
Equity One Home Equity | 11/27/19 | 1.250%(M) | 10 | * | 10 | — | 10 | Goldman Sachs International | ||||||||||||||||||||||
See Notes to Financial Statements.
| 46 |
Credit default swap agreements outstanding at October 31, 2019 (continued):
Reference | Termination Date | Fixed Rate | Notional Amount (000)#(3) | Implied Credit Spread at October 31, 2019(4) | Fair Value | Upfront Premiums Paid (Received) | Unrealized Appreciation (Depreciation) | Counterparty | ||||||||||||||||||||||
OTC Credit Default Swap Agreements on asset-backed securities—Sell Protection(2)^ (cont’d.): |
| |||||||||||||||||||||||||||||
Fannie Mae Connecticut Avenue Securities | 11/27/19 | 1.250%(M) | 57 | * | $ | 56 | $ | — | $ | 56 | Goldman Sachs International | |||||||||||||||||||
Fannie Mae Connecticut Avenue Securities | 11/27/19 | 1.250%(M) | 38 | * | 37 | — | 37 | Goldman Sachs International | ||||||||||||||||||||||
Fannie Mae Connecticut Avenue Securities | 11/27/19 | 1.250%(M) | 35 | * | 34 | — | 34 | Goldman Sachs International | ||||||||||||||||||||||
Fannie Mae Connecticut Avenue Securities | 11/27/19 | 1.250%(M) | 20 | * | 20 | — | 20 | Goldman Sachs International | ||||||||||||||||||||||
Fannie Mae Connecticut Avenue Securities | 11/27/19 | 1.250%(M) | 14 | * | 14 | — | 14 | Goldman Sachs International | ||||||||||||||||||||||
Fannie Mae Connecticut Avenue Securities | 11/27/19 | 1.250%(M) | 9 | * | 8 | — | 8 | Goldman Sachs International | ||||||||||||||||||||||
GMAC Home Equity | 11/27/19 | 1.250%(M) | 6 | * | 6 | — | 6 | Goldman Sachs International | ||||||||||||||||||||||
GMAC Home Equity | 11/27/19 | 1.250%(M) | 6 | * | 6 | — | 6 | Goldman Sachs International | ||||||||||||||||||||||
GS Mortgage Securities Trust | 11/26/19 | 1.250%(M) | 7 | 7.460 | % | 7 | — | 7 | Goldman Sachs International | |||||||||||||||||||||
GS Mortgage Securities Trust | 11/26/19 | 1.250%(M) | 6 | * | 6 | — | 6 | Goldman Sachs International | ||||||||||||||||||||||
GSO CLO | 11/26/19 | 1.000%(M) | 3 | * | 2 | — | 2 | Goldman Sachs International | ||||||||||||||||||||||
GSR Mortgage Loan Trust | 11/27/19 | 1.250%(M) | 11 | * | 11 | — | 11 | Goldman Sachs International | ||||||||||||||||||||||
ICG CLO | 11/26/19 | 0.500%(M) | 5 | * | — | — | — | Goldman Sachs International | ||||||||||||||||||||||
See Notes to Financial Statements.
| PGIM Global Total Return (USD Hedged) Fund | 47 |
Schedule of Investments(continued)
as of October 31, 2019
Credit default swap agreements outstanding at October 31, 2019 (continued):
Reference | Termination Date | Fixed Rate | Notional Amount (000)#(3) | Implied Credit Spread at October 31, 2019(4) | Fair Value | Upfront Premiums Paid (Received) | Unrealized Appreciation (Depreciation) | Counterparty | ||||||||||||||||||||||
OTC Credit Default Swap Agreements on asset-backed securities—Sell Protection(2)^ (cont’d.): |
| |||||||||||||||||||||||||||||
Invesco CLO | 11/26/19 | 0.500%(M) | 2 | * | $ | — | $ | — | $ | — | Goldman Sachs International | |||||||||||||||||||
JPMBB Commercial Mortgage Securities Trust | 11/26/19 | 1.250%(M) | 18 | 8.827 | % | 18 | — | 18 | Goldman Sachs International | |||||||||||||||||||||
JPMBB Commercial Mortgage Securities Trust | 11/26/19 | 1.250%(M) | 11 | * | 11 | — | 11 | Goldman Sachs International | ||||||||||||||||||||||
JPMorgan Chase Commercial Mortgage Securities | 11/26/19 | 1.250%(M) | 7 | * | 7 | — | 7 | Goldman Sachs International | ||||||||||||||||||||||
JPMorgan Chase Commercial Mortgage Securities | 11/26/19 | 1.250%(M) | 2 | * | 2 | — | 2 | Goldman Sachs International | ||||||||||||||||||||||
LCM CLO | 11/26/19 | 1.000%(M) | 2 | * | 2 | — | 2 | Goldman Sachs International | ||||||||||||||||||||||
Lehman Home Equity | 11/27/19 | 1.250%(M) | 5 | * | 5 | — | 5 | Goldman Sachs International | ||||||||||||||||||||||
MJX CLO | 11/26/19 | 0.500%(M) | 2 | * | — | — | — | Goldman Sachs International | ||||||||||||||||||||||
Morgan Stanley Home Equity | 11/27/19 | 1.250%(M) | 6 | * | 6 | — | 6 | Goldman Sachs International | ||||||||||||||||||||||
Oak Hill CLO | 11/26/19 | 1.000%(M) | EUR | 8 | * | 8 | — | 8 | Goldman Sachs International | |||||||||||||||||||||
OCH-ZIFF CLO | 11/26/19 | 0.500%(M) | 7 | * | 2 | — | 2 | Goldman Sachs International | ||||||||||||||||||||||
Octagon CLO | 11/26/19 | 1.000%(M) | 1 | * | — | — | — | Goldman Sachs International | ||||||||||||||||||||||
Octagon Investment Partners XV Ltd. | 11/26/19 | 1.000%(M) | 4 | * | 3 | — | 3 | Goldman Sachs International | ||||||||||||||||||||||
See Notes to Financial Statements.
| 48 |
Credit default swap agreements outstanding at October 31, 2019 (continued):
Reference | Termination Date | Fixed Rate | Notional Amount (000)#(3) | Implied Credit Spread at October 31, 2019(4) | Fair Value | Upfront Premiums Paid (Received) | Unrealized Appreciation (Depreciation) | Counterparty | ||||||||||||||||||||||
OTC Credit Default Swap Agreements on asset-backed securities—Sell Protection(2)^ (cont’d.): |
| |||||||||||||||||||||||||||||
Palmer Square CLO | 11/26/19 | 0.500%(M) | 3 | * | $ | — | $ | — | $ | — | Goldman Sachs International | |||||||||||||||||||
PineBridge CLO | 11/26/19 | 0.500%(M) | 2 | * | — | — | — | Goldman Sachs International | ||||||||||||||||||||||
Shenkman Capital | 11/26/19 | 1.000%(M) | 1 | * | — | — | — | Goldman Sachs International | ||||||||||||||||||||||
Sound Point CLO Ltd. | 11/26/19 | 0.500%(M) | 15 | * | 6 | — | 6 | Goldman Sachs International | ||||||||||||||||||||||
Sound Point CLO Ltd. | 11/26/19 | 1.000%(M) | 7 | * | 5 | — | 5 | Goldman Sachs International | ||||||||||||||||||||||
Sound Point CLO Ltd. | 11/26/19 | 0.500%(M) | 7 | * | 3 | — | 3 | Goldman Sachs International | ||||||||||||||||||||||
Sound Point CLO Ltd. | 11/26/19 | 1.000%(M) | 1 | * | — | — | — | Goldman Sachs International | ||||||||||||||||||||||
Steele Creek | 11/26/19 | 1.000%(M) | 5 | * | 4 | — | 4 | Goldman Sachs International | ||||||||||||||||||||||
Structured Agency Credit Risk | 11/27/19 | 1.250%(M) | 37 | * | 36 | — | 36 | Goldman Sachs International | ||||||||||||||||||||||
Structured Agency Credit Risk | 11/27/19 | 1.250%(M) | 18 | * | 18 | — | 18 | Goldman Sachs International | ||||||||||||||||||||||
Structured Agency Credit Risk | 11/27/19 | 1.250%(M) | 17 | * | 17 | — | 17 | Goldman Sachs International | ||||||||||||||||||||||
Structured Agency Credit Risk | 11/27/19 | 1.250%(M) | 15 | * | 15 | — | 15 | Goldman Sachs International | ||||||||||||||||||||||
THL CLO | 11/26/19 | 0.500%(M) | 3 | * | — | — | — | Goldman Sachs International | ||||||||||||||||||||||
See Notes to Financial Statements.
| PGIM Global Total Return (USD Hedged) Fund | 49 |
Schedule of Investments(continued)
as of October 31, 2019
Credit default swap agreements outstanding at October 31, 2019 (continued):
Reference | Termination Date | Fixed Rate | Notional Amount (000)#(3) | Implied Credit Spread at October 31, 2019(4) | Fair Value | Upfront Premiums Paid (Received) | Unrealized Appreciation (Depreciation) | Counterparty | ||||||||||||||||||||||
OTC Credit Default Swap Agreements on asset-backed securities—Sell Protection(2)^ (cont’d.): | ||||||||||||||||||||||||||||||
Voya CLO | 11/26/19 | 1.000%(M) | 5 | * | $ | 4 | $ | — | $ | 4 | Goldman Sachs International | |||||||||||||||||||
Wellfleet CLO | 11/26/19 | 0.500%(M) | 5 | * | 2 | — | 2 | Goldman Sachs International | ||||||||||||||||||||||
Wells Fargo Commercial Mortgage Trust | 11/26/19 | 1.250%(M) | 22 | * | 22 | — | 22 | Goldman Sachs International | ||||||||||||||||||||||
Wells Fargo Commercial Mortgage Trust | 11/26/19 | 1.250%(M) | 4 | * | 4 | — | 4 | Goldman Sachs International | ||||||||||||||||||||||
|
|
|
|
|
| |||||||||||||||||||||||||
| $ | 627 | $ | — | $ | 627 | |||||||||||||||||||||||||
|
|
|
|
|
| |||||||||||||||||||||||||
Reference | Termination Date | Fixed Rate | Notional Amount (000)#(3) | Fair Value | Upfront Premiums Paid (Received) | Unrealized Appreciation (Depreciation) | Counterparty | |||||||||||||||||||
OTC Credit Default Swap Agreements on corporate and/or sovereign issues—Buy Protection(1): |
| |||||||||||||||||||||||||
Assicurazioni Generali SpA | 06/20/23 | 1.000%(Q)EUR | 100 | $ | (777 | ) | $ | 4,854 | $ | (5,631 | ) | Barclays Bank PLC | ||||||||||||||
Kingdom of Spain | 06/20/23 | 1.000%(Q) | 100 | (3,080 | ) | (1,850 | ) | (1,230 | ) | Bank of America, N.A. | ||||||||||||||||
Petroleos Mexicanos | 06/20/20 | 1.000%(Q) | 45 | (236 | ) | 181 | (417 | ) | Citibank, N.A. | |||||||||||||||||
Petroleos Mexicanos | 06/20/20 | 1.000%(Q) | 45 | (236 | ) | 87 | (323 | ) | Citibank, N.A. | |||||||||||||||||
Republic of Argentina | 06/20/24 | 5.000%(Q) | 105 | 63,826 | 63,451 | 375 | Citibank, N.A. | |||||||||||||||||||
Republic of Italy | 06/20/23 | 1.000%(Q) | 205 | (3,171 | ) | 2,152 | (5,323 | ) | Citibank, N.A. | |||||||||||||||||
Republic of Italy | 06/20/23 | 1.000%(Q)EUR | 90 | (1,301 | ) | 943 | (2,244 | ) | Barclays Bank PLC | |||||||||||||||||
Republic of Italy | 06/20/28 | 1.000%(Q)EUR | 45 | 644 | 2,413 | (1,769 | ) | Barclays Bank PLC | ||||||||||||||||||
|
|
|
|
|
| |||||||||||||||||||||
| $ | 55,669 | $ | 72,231 | $ | (16,562 | ) | ||||||||||||||||||||
|
|
|
|
|
| |||||||||||||||||||||
Reference | Termination Date | Fixed Rate | Notional Amount (000)#(3) | Implied Credit Spread at October 31, 2019(4) | Fair Value | Upfront Premiums Paid (Received) | Unrealized Appreciation (Depreciation) | Counterparty | ||||||||||||||||||||||
OTC Credit Default Swap Agreements on corporate and/or sovereign issues—Sell Protection(2): | ||||||||||||||||||||||||||||||
Kingdom of Spain | 06/20/23 | 1.000%(Q) | 375 | 0.256 | % | $ | 10,368 | $ | 2,846 | $ | 7,522 | Bank of America, N.A. | ||||||||||||||||||
See Notes to Financial Statements.
| 50 |
Credit default swap agreements outstanding at October 31, 2019 (continued):
Reference Obligation | Termination Date | Fixed Rate | Notional Amount (000)#(3) | Implied Credit Spread at October 31, 2019(4) | Fair Value | Upfront Premiums Paid (Received) | Unrealized Appreciation (Depreciation) | Counterparty | ||||||||||||||||||||||
OTC Credit Default Swap Agreements on corporate and/or sovereign issues—Sell Protection(2)(cont’d.): | ||||||||||||||||||||||||||||||
Kingdom of Spain | 06/20/23 | 1.000%(Q) | 100 | 0.256 | % | $ | 2,765 | $ | 1,133 | $ | 1,632 | Bank of America, N.A. | ||||||||||||||||||
Republic of Argentina | 06/20/29 | 5.000%(Q) | 105 | 80.552 | % | (64,368 | ) | (64,819 | ) | 451 | Citibank, N.A. | |||||||||||||||||||
Republic of France | 12/20/23 | 0.250%(Q) | 100 | 0.143 | % | 461 | (271 | ) | 732 | Barclays Bank PLC | ||||||||||||||||||||
Republic of Indonesia | 06/20/23 | 1.000%(Q) | 475 | 0.509 | % | 8,819 | (2,222 | ) | 11,041 | Citibank, N.A. | ||||||||||||||||||||
Republic of Italy | 06/20/23 | 1.000%(Q) | 205 | 0.888 | % | 1,046 | (7,808 | ) | 8,854 | Citibank, N.A. | ||||||||||||||||||||
Republic of Kazakhstan | 06/20/23 | 1.000%(Q) | 85 | 0.411 | % | 1,878 | — | 1,878 | Citibank, N.A. | |||||||||||||||||||||
Republic of Korea | 12/20/19 | 1.000%(Q) | 30 | 0.118 | % | 72 | 35 | 37 | Citibank, N.A. | |||||||||||||||||||||
Republic of Portugal | 12/20/23 | 1.000%(Q) | 50 | 0.287 | % | 1,495 | (23 | ) | 1,518 | Morgan Stanley & Co. International PLC | ||||||||||||||||||||
Republic of South Africa | 12/20/23 | 1.000%(Q) | 300 | 1.611 | % | (6,835 | ) | (13,365 | ) | 6,530 | Bank of America, N.A. | |||||||||||||||||||
Republic of Turkey | 12/20/19 | 1.000%(Q) | 50 | 0.576 | % | 88 | (14 | ) | 102 | Credit Suisse International | ||||||||||||||||||||
Republic of Turkey | 06/20/23 | 1.000%(Q) | 80 | 2.961 | % | (5,199 | ) | (8,395 | ) | 3,196 | BNP Paribas S.A. | |||||||||||||||||||
Republic of Turkey | 06/20/23 | 1.000%(Q) | 40 | 2.961 | % | (2,600 | ) | (4,077 | ) | 1,477 | BNP Paribas S.A. | |||||||||||||||||||
Russian Federation | 12/20/22 | 1.000%(Q) | 50 | 0.434 | % | 929 | (83 | ) | 1,012 | Citibank, N.A. | ||||||||||||||||||||
Russian Federation | 06/20/23 | 1.000%(Q) | 150 | 0.518 | % | 2,742 | (2,098 | ) | 4,840 | Morgan Stanley & Co. International PLC | ||||||||||||||||||||
Russian Federation | 06/20/23 | 1.000%(Q) | 100 | 0.518 | % | 1,828 | (1,173 | ) | 3,001 | Morgan Stanley & Co. International PLC | ||||||||||||||||||||
Russian Federation | 06/20/23 | 1.000%(Q) | 50 | 0.518 | % | 914 | (689 | ) | 1,603 | BNP Paribas S.A. | ||||||||||||||||||||
T-Mobile USA, Inc. | 12/20/19 | 5.000%(Q) | 60 | 0.144 | % | 753 | 395 | 358 | Credit Suisse International | |||||||||||||||||||||
|
|
|
|
|
| |||||||||||||||||||||||||
| $ | (44,844 | ) | $ | (100,628 | ) | $ | 55,784 | |||||||||||||||||||||||
|
|
|
|
|
| |||||||||||||||||||||||||
See Notes to Financial Statements.
| PGIM Global Total Return (USD Hedged) Fund | 51 |
Schedule of Investments(continued)
as of October 31, 2019
Credit default swap agreements outstanding at October 31, 2019 (continued):
Reference Obligation | Termination Date | Fixed Rate | Notional Amount (000)#(3) | Implied Credit Spread at October 31, 2019(4) | Value at Trade Date | Value at October 31, 2019 | Unrealized Appreciation (Depreciation) | |||||||||||||||||||||
Centrally Cleared Credit Default Swap Agreements on credit indices—Sell Protection(2): |
| |||||||||||||||||||||||||||
CDX.NA.HY.25.V8 | 12/20/20 | 5.000%(Q) | 279 | 2.678 | % | $ | 7,673 | $ | 8,854 | $ | 1,181 | |||||||||||||||||
CDX.NA.HY.33.V1 | 12/20/24 | 5.000%(Q) | 1,300 | 3.391 | % | 87,389 | 100,268 | 12,879 | ||||||||||||||||||||
|
|
|
|
|
| |||||||||||||||||||||||
| $ | 95,062 | $ | 109,122 | $ | 14,060 | |||||||||||||||||||||||
|
|
|
|
|
| |||||||||||||||||||||||
Reference | Termination Date | Fixed Rate | Notional Amount (000)#(3) | Implied Credit Spread at October 31, 2019(4) | Fair Value | Upfront Premiums Paid (Received) | Unrealized Appreciation (Depreciation) | Counterparty | ||||||||||||||||||||||
OTC Credit Default Swap Agreement on credit indices—Sell Protection(2): | ||||||||||||||||||||||||||||||
CMBX.NA.6.AA | 05/11/63 | 1.500%(M) | 200 | * | $ | 4,147 | $ | (1,093 | ) | $ | 5,240 | J.P. Morgan Securities LLC | ||||||||||||||||||
|
|
|
|
|
| |||||||||||||||||||||||||
The Fund entered into credit default swaps (“CDS”) to provide a measure of protection against defaults or to take an active long or short position with respect to the likelihood of a particular issuer’s default or the reference entity’s credit soundness. CDS contracts generally trade based on a spread which represents the cost a protection buyer has to pay the protection seller. The protection buyer is said to be short the credit as the value of the contract rises the more the credit deteriorates. The value of the CDS contract increases for the protection buyer if the spread increases.
| (1) | If the Fund is a buyer of protection, it pays the fixed rate. When a credit event occurs, as defined under the terms of that particular swap agreement, the Fund will either (i) receive from the seller of protection an amount equal to the notional amount of the swap and make delivery of the referenced obligation or underlying securities comprising the referenced index or (ii) receive a net settlement amount in the form of cash or securities equal to the notional amount of the swap less the recovery value of the referenced obligation or underlying securities comprising the referenced index. |
| (2) | If the Fund is a seller of protection, it receives the fixed rate. When a credit event occurs, as defined under the terms of that particular swap agreement, the Fund will either (i) pay to the buyer of protection an amount equal to the notional amount of the swap and take delivery of the referenced obligation or underlying securities comprising the referenced index or (ii) pay a net settlement amount in the form of cash or securities equal to the notional amount of the swap less the recovery value of the referenced obligation or underlying securities comprising the referenced index. |
| (3) | Notional amount represents the maximum potential amount the Fund could be required to pay as a seller of credit protection or receive as a buyer of credit protection if a credit event occurs as defined under the terms of that particular swap agreement. |
| (4) | Implied credit spreads, represented in absolute terms, utilized in determining the fair value of credit default swap agreements where the Fund is the seller of protection as of the reporting date serve as an indicator of the current status of the payment/ performance risk and represent the likelihood of risk of default for the credit derivative. The implied |
See Notes to Financial Statements.
| 52 |
| credit spread of a particular referenced entity reflects the cost of buying/selling protection and may includeup-front payments required to be made to enter into the agreement. Wider credit spreads represent a deterioration of the referenced entity’s credit soundness and a greater likelihood of risk of default or other credit event occurring as defined under the terms of the agreement. |
| * | When an implied credit spread is not available, reference the fair value of credit default swap agreements on credit indices and asset-backed securities. Where the Fund is the seller of protection, it serves as an indicator of the current status of the payment/performance risk and represents the likelihood of an expected liability (or profit) for the credit derivative should the notional amount of the swap agreement be closed/sold as of the reporting date. Increasing fair value in absolute terms, when compared to the notional amount of the swap, represents a deterioration of the referenced entity’s credit soundness and a greater likelihood of risk of default or other credit event occurring as defined under the terms of the agreement. |
Currency swap agreements outstanding at October 31, 2019:
Notional Amount | Fund | Notional Amount (000)# | Fund | Counterparty | Termination Date | Fair Value | Upfront Premiums Paid (Received) | Unrealized Appreciation (Depreciation) | ||||||||||||||||||
OTC Currency Swap Agreement: | ||||||||||||||||||||||||||
| IDR 1,400,000 | 8.22%(S) | 97 | 6 Month LIBOR(S) | Citibank, N.A. | 11/29/23 | $ | 15,070 | $ | — | $ | 15,070 | |||||||||||||||
|
|
|
|
|
| |||||||||||||||||||||
Inflation swap agreements outstanding at October 31, 2019:
Notional | Termination Date | Fixed Rate | Floating Rate | Value at Trade Date | Value at October 31, 2019 | Unrealized Appreciaton (Depreciation) | ||||||||||||||||||
Centrally Cleared Inflation Swap Agreements: |
| |||||||||||||||||||||||
| EUR | 200 | 05/15/23 | 1.485%(T) | France CPI ex Tobacco Household(1)(T) | $ | — | $ | (5,781 | ) | $ | (5,781 | ) | ||||||||||||
| EUR | 200 | 05/15/23 | 1.510%(T) | Eurostat Eurozone HICP ex Tobacco(2)(T) | — | 5,523 | 5,523 | |||||||||||||||||
|
|
|
|
|
| |||||||||||||||||||
| $ | — | $ | (258 | ) | $ | (258 | ) | |||||||||||||||||
|
|
|
|
|
| |||||||||||||||||||
| (1) | The Fund pays the fixed rate and receives the floating rate. |
| (2) | The Fund pays the floating rate and receives the fixed rate. |
Interest rate swap agreements outstanding at October 31, 2019:
Notional | Termination Date | Fixed | Floating Rate | Value at Trade Date | Value at October 31, 2019 | Unrealized Appreciaton (Depreciation) | ||||||||||||||||||||
Centrally Cleared Interest Rate Swap Agreements: | ||||||||||||||||||||||||||
| AUD | 400 | 12/18/27 | 2.696%(S) | 6 Month BBSW(2)(S) | $ | — | $ | 33,854 | $ | 33,854 | ||||||||||||||||
| AUD | 100 | 11/27/28 | 2.847%(S) | 6 Month BBSW(2)(S) | — | 10,005 | 10,005 | |||||||||||||||||||
| AUD | 230 | 12/03/29 | 2.700%(S) | 6 Month BBSW(2)(S) | 23,341 | 22,166 | (1,175 | ) | ||||||||||||||||||
| BRL | 287 | 01/02/25 | 6.540%(T) | 1 Day BROIS(2)(T) | — | 2,570 | 2,570 | |||||||||||||||||||
| BRL | 1,638 | 01/02/25 | 6.670%(T) | 1 Day BROIS(2)(T) | — | 17,695 | 17,695 | |||||||||||||||||||
| BRL | 306 | 01/02/25 | 8.690%(T) | 1 Day BROIS(2)(T) | — | 13,961 | 13,961 | |||||||||||||||||||
See Notes to Financial Statements.
| PGIM Global Total Return (USD Hedged) Fund | 53 |
Schedule of Investments (continued)
as of October 31, 2019
Interest rate swap agreements outstanding at October 31, 2019 (continued):
Notional | Termination Date | Fixed Rate | Floating Rate | Value at Trade Date | Value at October 31, 2019 | Unrealized Appreciaton (Depreciation) | ||||||||||||||||||
Centrally Cleared Interest Rate Swap Agreements (cont’d.): | ||||||||||||||||||||||||
| BRL | 569 | 01/02/25 | 9.943%(T) | 1 Day BROIS(2)(T) | $ | — | $ | 48,801 | $ | 48,801 | ||||||||||||||
| BRL | 609 | 01/02/25 | 11.080%(T) | 1 Day BROIS(2)(T) | — | 62,257 | 62,257 | |||||||||||||||||
| BRL | 98 | 01/02/25 | 12.090%(T) | 1 Day BROIS(2)(T) | — | 11,793 | 11,793 | |||||||||||||||||
| CAD | 2,000 | 01/09/20 | 1.716%(S) | 3 Month Canadian Banker’s Acceptance(2)(S) | (5,474 | ) | (1,997 | ) | 3,477 | |||||||||||||||
| CAD | 255 | 05/08/22 | 1.367%(S) | 3 Month Canadian Banker’s Acceptance(2)(S) | (8,229 | ) | (2,629 | ) | 5,600 | |||||||||||||||
| CAD | 80 | 12/03/28 | 2.600%(S) | 3 Month Canadian Banker’s Acceptance(2)(S) | 762 | 4,199 | 3,437 | |||||||||||||||||
| CAD | 50 | 01/09/38 | 2.720%(S) | 3 Month Canadian Banker’s Acceptance(2)(S) | — | 4,280 | 4,280 | |||||||||||||||||
| CAD | 50 | 05/30/47 | 2.240%(S) | 3 Month Canadian Banker’s Acceptance(2)(S) | (1,614 | ) | 1,989 | 3,603 | ||||||||||||||||
| CHF | 70 | 04/03/28 | 0.410%(A) | 6 Month CHF LIBOR(2)(S) | 195 | 4,826 | 4,631 | |||||||||||||||||
| CHF | 130 | 01/31/29 | 0.260%(A) | 6 Month CHF LIBOR(2)(S) | — | 7,375 | 7,375 | |||||||||||||||||
| CHF | 40 | 04/03/33 | 0.687%(A) | 6 Month CHF LIBOR(2)(S) | 1,708 | 4,448 | 2,740 | |||||||||||||||||
| CLP | 30,200 | 07/12/29 | 3.135%(S) | 1 Day CLOIS(2)(S) | — | 1,094 | 1,094 | |||||||||||||||||
| CNH | 700 | 03/13/24 | 2.945%(Q) | 7 Day China Fixing Repo Rates(2)(Q) | — | (551 | ) | (551 | ) | |||||||||||||||
| CNH | 1,400 | 04/01/24 | 2.923%(Q) | 7 Day China Fixing Repo Rates(2)(Q) | — | (1,319 | ) | (1,319 | ) | |||||||||||||||
| CNH | 1,440 | 06/03/24 | 2.975%(Q) | 7 Day China Fixing Repo Rates(2)(Q) | — | (984 | ) | (984 | ) | |||||||||||||||
| CNH | 2,220 | 06/20/24 | 2.900%(Q) | 7 Day China Fixing Repo Rates(2)(Q) | (4 | ) | (2,685 | ) | (2,681 | ) | ||||||||||||||
| CNH | 1,500 | 09/03/24 | 2.860%(Q) | 7 Day China Fixing Repo Rates(2)(Q) | — | (2,366 | ) | (2,366 | ) | |||||||||||||||
| CNH | 1,500 | 10/10/24 | 2.860%(Q) | 7 Day China Fixing Repo Rates(2)(Q) | — | (2,493 | ) | (2,493 | ) | |||||||||||||||
| CNH | 1,680 | 11/01/24 | 3.120%(Q) | 7 Day China Fixing Repo Rates(2)(Q) | (6 | ) | 5 | 11 | ||||||||||||||||
| CZK | 19,520 | 05/31/20 | 2.138%(A) | 3 Month PRIBOR(1)(Q) | — | (4,298 | ) | (4,298 | ) | |||||||||||||||
| CZK | 6,100 | 01/31/24 | 1.930%(A) | 6 Month PRIBOR(1)(S) | — | (3,778 | ) | (3,778 | ) | |||||||||||||||
See Notes to Financial Statements.
| 54 |
Interest rate swap agreements outstanding at October 31, 2019 (continued):
Notional | Termination Date | Fixed | Floating Rate | Value at Trade Date | Value at October 31, 2019 | Unrealized Appreciaton (Depreciation) | ||||||||||||||||||
Centrally Cleared Interest Rate Swap Agreements (cont’d.): | ||||||||||||||||||||||||
| CZK | 6,800 | 06/20/24 | 1.623%(A) | 6 Month PRIBOR(1)(S) | $ | — | $ | 2,675 | $ | 2,675 | ||||||||||||||
| EUR | 235 | 10/30/32 | 1.302%(A) | 6 Month EURIBOR(2)(S) | 5,922 | 38,730 | 32,808 | |||||||||||||||||
| EUR | 430 | 05/11/33 | 1.000%(A) | 6 Month EURIBOR(2)(S) | (10,466 | ) | 54,904 | 65,370 | ||||||||||||||||
| EUR | 120 | 05/11/49 | 1.450%(A) | 6 Month EURIBOR(2)(S) | 6,276 | 40,396 | 34,120 | |||||||||||||||||
| GBP | 110 | 12/07/27 | 1.110%(A) | 1 Day SONIA(1)(A) | — | (6,836 | ) | (6,836 | ) | |||||||||||||||
| GBP | 475 | 12/21/31 | 1.534%(S) | 6 Month GBP LIBOR(2)(S) | 15,273 | 50,684 | 35,411 | |||||||||||||||||
| GBP | 180 | 03/09/46 | 1.648%(S) | 6 Month GBP LIBOR(2)(S) | (6,048 | ) | 41,671 | 47,719 | ||||||||||||||||
| HKD | 2,090 | 03/13/21 | 2.138%(Q) | 3 Month HIBOR(2)(Q) | (3 | ) | 636 | 639 | ||||||||||||||||
| HKD | 2,350 | 03/13/21 | 2.145%(Q) | 3 Month HIBOR(2)(Q) | (4 | ) | 749 | 753 | ||||||||||||||||
| HKD | 1,295 | 09/03/26 | 1.538%(Q) | 3 Month HIBOR(1)(Q) | (7 | ) | 2,887 | 2,894 | ||||||||||||||||
| HUF | 197,600 | 07/02/20 | 1.065%(A) | 6 Month BUBOR(2)(S) | (327 | ) | 5,218 | 5,545 | ||||||||||||||||
| HUF | 43,000 | 03/18/26 | 2.140%(A) | 6 Month BUBOR(2)(S) | 9,737 | 13,714 | 3,977 | |||||||||||||||||
| HUF | 90,865 | 06/12/28 | 3.750%(A) | 6 Month BUBOR(2)(S) | — | 32,969 | 32,969 | |||||||||||||||||
| HUF | 23,000 | 07/15/29 | 1.650%(A) | 6 Month BUBOR(2)(S) | — | 3,361 | 3,361 | |||||||||||||||||
| JPY | 282,370 | 12/17/20 | 0.015%(S) | 6 Month JPY LIBOR(1)(S) | — | (2,822 | ) | (2,822 | ) | |||||||||||||||
| JPY | 69,940 | 01/29/21 | (0.014)%(S) | 6 Month JPY LIBOR(1)(S) | — | (639 | ) | (639 | ) | |||||||||||||||
| JPY | 71,505 | 12/03/23 | 0.050%(S) | 6 Month JPY LIBOR(1)(S) | (638 | ) | (4,750 | ) | (4,112 | ) | ||||||||||||||
| JPY | 59,000 | 12/18/27 | 0.290%(S) | 6 Month JPY LIBOR(2)(S) | — | 15,670 | 15,670 | |||||||||||||||||
| JPY | 53,000 | 12/18/32 | 0.516%(S) | 6 Month JPY LIBOR(2)(S) | — | 28,731 | 28,731 | |||||||||||||||||
| JPY | 176,500 | 12/18/37 | 0.715%(S) | 6 Month JPY LIBOR(2)(S) | — | 161,455 | 161,455 | |||||||||||||||||
| JPY | 10,055 | 01/04/38 | 0.757%(S) | 6 Month JPY LIBOR(2)(S) | 2,747 | 9,946 | 7,199 | |||||||||||||||||
| JPY | 11,780 | 12/03/38 | 0.600%(S) | 6 Month JPY LIBOR(2)(S) | 2,659 | 8,591 | 5,932 | |||||||||||||||||
See Notes to Financial Statements.
| PGIM Global Total Return (USD Hedged) Fund | 55 |
Schedule of Investments (continued)
as of October 31, 2019
Interest rate swap agreements outstanding at October 31, 2019 (continued):
Notional | Termination Date | Fixed | Floating Rate | Value at Trade Date | Value at October 31, 2019 | Unrealized Appreciaton (Depreciation) | ||||||||||||||||||
Centrally Cleared Interest Rate Swap Agreements (cont’d.): | ||||||||||||||||||||||||
| JPY | 10,000 | 10/04/39 | 0.203%(S) | 6 Month JPY LIBOR(2)(S) | $ | — | $ | (148 | ) | $ | (148 | ) | ||||||||||||
| JPY | 21,500 | 12/03/39 | 0.650%(S) | 6 Month JPY LIBOR(2)(S) | 14,585 | 17,921 | 3,336 | |||||||||||||||||
| JPY | 5,000 | 07/04/43 | 0.763%(S) | 6 Month JPY LIBOR(2)(S) | — | 5,599 | 5,599 | |||||||||||||||||
| JPY | 16,700 | 12/18/47 | 0.918%(S) | 6 Month JPY LIBOR(2)(S) | — | 27,130 | 27,130 | |||||||||||||||||
| KRW | 700,000 | 01/07/21 | 1.733%(Q) | 3 Month KWCDC(2)(Q) | — | 2,477 | 2,477 | |||||||||||||||||
| KRW | 209,000 | 09/10/28 | 2.043%(Q) | 3 Month KWCDC(2)(Q) | 10,281 | 10,288 | 7 | |||||||||||||||||
| KRW | 118,000 | 02/13/29 | 1.780%(Q) | 3 Month KWCDC(2)(Q) | — | 3,700 | 3,700 | |||||||||||||||||
| KRW | 33,500 | 04/17/29 | 1.740%(Q) | 3 Month KWCDC(2)(Q) | — | 951 | 951 | |||||||||||||||||
| MXN | 1,150 | 12/23/27 | 7.845%(M) | 28 Day Mexican Interbank Rate(2)(M) | — | 5,139 | 5,139 | |||||||||||||||||
MXN |
| 4,080 |
|
| 02/27/29 |
| 8.260%(M) | 28 Day Mexican Interbank Rate(2)(M) |
| 1,178 |
|
| 25,504 |
|
| 24,326 |
| |||||||
| NOK | 1,680 | 03/15/27 | 2.103%(A) | 6 Month NIBOR(2)(S) | 5,750 | 5,571 | (179 | ) | ||||||||||||||||
| NZD | 210 | 11/28/28 | 2.950%(S) | 3 Month BBR(2)(Q) | — | 19,954 | 19,954 | |||||||||||||||||
| NZD | 100 | 07/22/29 | 1.768%(S) | 3 Month BBR(2)(Q) | — | 2,459 | 2,459 | |||||||||||||||||
| PLN | 1,030 | 08/24/23 | 2.390%(A) | 6 Month WIBOR(2)(S) | — | 6,833 | 6,833 | |||||||||||||||||
| PLN | 2,100 | 09/09/23 | 1.900%(A) | 6 Month WIBOR(2)(S) | (19,526 | ) | 3,522 | 23,048 | ||||||||||||||||
| PLN | 850 | 11/13/23 | 2.570%(A) | 6 Month WIBOR(2)(S) | — | 10,925 | 10,925 | |||||||||||||||||
| PLN | 1,120 | 06/21/24 | 1.750%(A) | 6 Month WIBOR(2)(S) | — | 153 | 153 | |||||||||||||||||
| PLN | 570 | 06/12/28 | 3.070%(A) | 6 Month WIBOR(1)(S) | — | (16,263 | ) | (16,263 | ) | |||||||||||||||
| PLN | 45 | 07/11/28 | 2.935%(A) | 6 Month WIBOR(2)(S) | — | 1,147 | 1,147 | |||||||||||||||||
| PLN | 462 | 11/13/28 | 2.998%(A) | 6 Month WIBOR(1)(S) | — | (14,870 | ) | (14,870 | ) | |||||||||||||||
| SEK | 2,000 | 04/25/23 | 0.750%(A) | 3 Month STIBOR(2)(Q) | 4,078 | 5,178 | 1,100 | |||||||||||||||||
See Notes to Financial Statements.
| 56 |
Interest rate swap agreements outstanding at October 31, 2019 (continued):
Notional | Termination Date | Fixed | Floating Rate | Value at Trade Date | Value at October 31, 2019 | Unrealized Appreciaton (Depreciation) | ||||||||||||||||||||
Centrally Cleared Interest Rate Swap Agreements (cont’d.): | ||||||||||||||||||||||||||
| SEK | 2,325 | 06/22/27 | 1.031%(A) | 3 Month STIBOR(2)(Q) | $ | (351 | ) | $ | 14,017 | $ | 14,368 | |||||||||||||||
| SEK | 410 | 07/12/29 | 0.585%(A) | 3 Month STIBOR(2)(Q) | — | 757 | 757 | |||||||||||||||||||
| SGD | 135 | 03/19/24 | 2.025%(S) | 6 Month SIBOR(2)(S) | — | 2,187 | 2,187 | |||||||||||||||||||
| SGD | 90 | 02/14/29 | 2.285%(S) | 6 Month SIBOR(2)(S) | — | 3,587 | 3,587 | |||||||||||||||||||
| 3,560 | 03/12/20 | 2.405%(T) | 1 Day USOIS(2)(T) | — | 14,370 | 14,370 | ||||||||||||||||||||
| 1,540 | 04/25/20 | 2.328%(T) | 1 Day USOIS(2)(T) | (25 | ) | 7,112 | 7,137 | |||||||||||||||||||
| 434 | 03/31/21 | 2.173%(A) | 1 Day USOIS(2)(A) | — | 5,156 | 5,156 | ||||||||||||||||||||
| 1,290 | 09/15/21 | 1.381%(S) | 3 Month LIBOR(2)(Q) | (278 | ) | (2,845 | ) | (2,567 | ) | |||||||||||||||||
| 3,905 | 09/15/21 | 1.480%(S) | 3 Month LIBOR(2)(Q) | 1,272 | (2,227 | ) | (3,499 | ) | ||||||||||||||||||
| 860 | 09/15/21 | 1.604%(S) | 3 Month LIBOR(2)(Q) | 4,024 | 1,293 | (2,731 | ) | |||||||||||||||||||
| 915 | 05/31/22 | 2.353%(A) | 1 Day USOIS(1)(A) | — | (25,686 | ) | (25,686 | ) | ||||||||||||||||||
| 5,715 | 08/31/22 | 2.550%(A) | 1 Day USOIS(1)(A) | — | (214,861 | ) | (214,861 | ) | ||||||||||||||||||
| 350 | 02/29/24 | 1.520%(S) | 3 Month LIBOR(2)(Q) | — | 951 | 951 | ||||||||||||||||||||
| 1,595 | 11/15/24 | 2.334%(S) | 3 Month LIBOR(1)(Q) | 11,002 | (75,695 | ) | (86,697 | ) | ||||||||||||||||||
| 590 | 02/28/25 | 2.454%(A) | 1 Day USOIS(1)(A) | — | (38,192 | ) | (38,192 | ) | ||||||||||||||||||
| 600 | 02/28/25 | 3.019%(S) | 3 Month LIBOR(1)(Q) | — | (48,014 | ) | (48,014 | ) | ||||||||||||||||||
| 360 | 05/31/25 | 2.998%(S) | 3 Month LIBOR(1)(Q) | (215 | ) | (32,413 | ) | (32,198 | ) | |||||||||||||||||
| 595 | 07/31/25 | 2.802%(A) | 1 Day USOIS(1)(A) | — | (53,254 | ) | (53,254 | ) | ||||||||||||||||||
| 475 | 07/31/25 | 3.105%(S) | 3 Month LIBOR(1)(Q) | 375 | (46,127 | ) | (46,502 | ) | ||||||||||||||||||
| 592 | 07/31/25 | 3.109%(S) | 3 Month LIBOR(1)(Q) | 93 | (57,641 | ) | (57,734 | ) | ||||||||||||||||||
| 125 | 01/31/26 | 2.236%(S) | 3 Month LIBOR(1)(Q) | — | (6,224 | ) | (6,224 | ) | ||||||||||||||||||
| 727 | 01/31/26 | 2.269%(A) | 1 Day USOIS(1)(A) | (8,176 | ) | (45,547 | ) | (37,371 | ) | |||||||||||||||||
| 1,230 | 01/31/26 | 2.406%(S) | 3 Month LIBOR(1)(Q) | (2,194 | ) | (74,299 | ) | (72,105 | ) | |||||||||||||||||
| 555 | 03/12/26 | 2.290%(A) | 1 Day USOIS(1)(A) | 24 | (35,803 | ) | (35,827 | ) | ||||||||||||||||||
| 1,127 | 04/30/26 | 1.876%(S) | 3 Month LIBOR(1)(Q) | (3,555 | ) | (26,173 | ) | (22,618 | ) | |||||||||||||||||
| 145 | 11/15/43 | 2.659%(S) | 3 Month LIBOR(1)(Q) | — | (26,873 | ) | (26,873 | ) | ||||||||||||||||||
See Notes to Financial Statements.
| PGIM Global Total Return (USD Hedged) Fund | 57 |
Schedule of Investments(continued)
as of October 31, 2019
Interest rate swap agreements outstanding at October 31, 2019 (continued):
Notional Amount (000)# | Termination Date | Fixed Rate | Floating Rate | Value at Trade Date | Value at October 31, 2019 | Unrealized Appreciaton (Depreciation) | ||||||||||||||||||
Centrally Cleared Interest Rate Swap Agreements (cont’d.): | ||||||||||||||||||||||||
| 150 | 08/15/44 | 2.392%(A) | 1 Day USOIS(1)(A) | $ | — | $ | (27,288 | ) | $ | (27,288 | ) | |||||||||||||
| ZAR | 9,210 | 03/13/21 | 7.180%(Q) | 3 Month JIBAR(2)(Q) | — | 4,130 | 4,130 | |||||||||||||||||
| ZAR | 8,270 | 03/13/24 | 7.500%(Q) | 3 Month JIBAR(1)(Q) | 10 | (10,386 | ) | (10,396 | ) | |||||||||||||||
| ZAR | 3,700 | 11/07/27 | 8.360%(Q) | 3 Month JIBAR(2)(Q) | 3,468 | 12,933 | 9,465 | |||||||||||||||||
| ZAR | 3,200 | 07/16/28 | 8.170%(Q) | 3 Month JIBAR(2)(Q) | (45 | ) | 7,360 | 7,405 | ||||||||||||||||
| ZAR | 2,460 | 03/13/29 | 8.055%(Q) | 3 Month JIBAR(2)(Q) | (8 | ) | 3,919 | 3,927 | ||||||||||||||||
|
|
|
|
|
| |||||||||||||||||||
| $ | 57,567 | $ | 77,552 | $ | 19,985 | |||||||||||||||||||
|
|
|
|
|
| |||||||||||||||||||
Notional Amount (000)# | Termination Date | Fixed Rate | Floating Rate | Fair Value | Upfront Premiums Paid (Received) | Unrealized Appreciaton (Depreciation) | Counterparty | |||||||||||||||||||
OTC Interest Rate Swap Agreements: | ||||||||||||||||||||||||||
| AED | 505 | 02/25/29 | 3.750%(A) | 3 Month EIBOR(2)(Q) | $ | 15,751 | $ | — | $ | 15,751 | HSBC Bank USA, N.A. | |||||||||||||||
| CLP | 95,000 | 12/20/27 | 4.260%(S) | 1 Day CLOIS(2)(S) | 16,085 | — | 16,085 | JPMorgan Chase Bank, N.A. | ||||||||||||||||||
| CLP | 100,000 | 05/17/28 | 4.270%(S) | 1 Day CLOIS(2)(S) | 17,330 | — | 17,330 | Citibank, N.A. | ||||||||||||||||||
| CNH | 700 | 08/15/23 | 3.115%(Q) | 7 Day China Fixing Repo Rates(2)(Q) | 299 | — | 299 | UBS AG | ||||||||||||||||||
| COP | 500,000 | 05/17/28 | 5.990%(Q) | 1 Day COOIS(2)(Q) | 8,396 | — | 8,396 | Citibank, N.A. | ||||||||||||||||||
| COP | 503,000 | 08/03/28 | 6.160%(Q) | 1 Day COOIS(2)(Q) | 10,269 | — | 10,269 | JPMorgan Chase Bank, N.A. | ||||||||||||||||||
| COP | 453,700 | 07/12/29 | 5.165%(Q) | 1 Day COOIS(2)(Q) | (2,019 | ) | — | (2,019 | ) | Morgan Stanley & Co. International PLC | ||||||||||||||||
| ILS | 550 | 04/26/28 | 1.915%(A) | 3 Month TELBOR(2)(Q) | 16,602 | — | 16,602 | BNP Paribas S.A. | ||||||||||||||||||
| ILS | 510 | 07/16/28 | 2.045%(A) | 3 Month TELBOR(2)(Q) | 16,486 | — | 16,486 | JPMorgan Chase Bank, N.A. | ||||||||||||||||||
| ILS | 270 | 07/12/29 | 1.411%(A) | 3 Month TELBOR(2)(Q) | 4,267 | — | 4,267 | Citibank, N.A. | ||||||||||||||||||
| MYR | 200 | 07/11/29 | 3.528%(Q) | 3 Month KLIBOR(2)(Q) | 688 | — | 688 | Morgan Stanley & Co. International PLC | ||||||||||||||||||
| RUB | 11,470 | 05/17/24 | 8.660%(A) | 3 Month MOSPRIME(2)(Q) | 8,493 | — | 8,493 | Goldman Sachs International | ||||||||||||||||||
| RUB | 11,470 | 05/20/24 | 8.700%(A) | 3 Month MOSPRIME(2)(Q) | 8,660 | — | 8,660 | Goldman Sachs International | ||||||||||||||||||
| RUB | 10,000 | 06/20/29 | 9.580%(A) | 3 Month MOSPRIME(2)(Q) | 12,152 | — | 12,152 | Goldman Sachs International | ||||||||||||||||||
See Notes to Financial Statements.
| 58 |
Interest rate swap agreements outstanding at October 31, 2019 (continued):
Notional Amount (000)# | Termination Date | Fixed Rate | Floating Rate | Fair Value | Upfront Premiums Paid (Received) | Unrealized Appreciaton (Depreciation) | Counterparty | |||||||||||||||||||
OTC Interest Rate Swap Agreements (cont’d.): | ||||||||||||||||||||||||||
| THB | 10,000 | 08/08/20 | 1.840%(S) | 6 Month BIBOR(2)(S) | $ | 1,236 | $ | — | $ | 1,236 | Citibank, N.A. | |||||||||||||||
| THB | 6,000 | 07/04/24 | 1.590%(S) | 6 Month BIBOR(2)(S) | 1,474 | — | 1,474 | Morgan Stanley & Co. International PLC | ||||||||||||||||||
|
|
|
|
|
| |||||||||||||||||||||
| $ | 136,169 | $ | — | $ | 136,169 | |||||||||||||||||||||
|
|
|
|
|
| |||||||||||||||||||||
| (1) | The Fund pays the fixed rate and receives the floating rate. |
| (2) | The Fund pays the floating rate and receives the fixed rate. |
Balances Reported in the Statement of Assets and Liabilities for OTC Swap Agreements:
| Premiums Paid | Premiums Received | Unrealized Appreciation | Unrealized Depreciation | |||||||||||||
| OTC Swap Agreements | $ | 78,490 | $ | (113,327 | ) | $ | 326,489 | $ | (127,396 | ) | ||||||
Summary of Collateral for Centrally Cleared/Exchange-traded Derivatives:
Cash and securities segregated as collateral, including pending settlement for closed positions, to cover requirements for centrally cleared/exchange-traded derivatives are listed by broker as follows:
Broker | Cash and/or Foreign Currency | Securities Market Value | ||||||
J.P. Morgan Securities LLC | $ | 300,000 | $ | 743,216 | ||||
|
|
|
| |||||
Fair Value Measurements:
Various inputs are used in determining the value of the Fund’s investments. These inputs are summarized in the three broad levels listed below.
Level 1—unadjusted quoted prices generally in active markets for identical securities.
Level 2—quoted prices for similar securities, interest rates and yield curves, prepayment speeds, foreign currency exchange rates and other observable inputs.
Level 3—unobservable inputs for securities valued in accordance with Board approved fair valuation procedures.
See Notes to Financial Statements.
| PGIM Global Total Return (USD Hedged) Fund | 59 |
Schedule of Investments(continued)
as of October 31, 2019
The following is a summary of the inputs used as of October 31, 2019 in valuing such portfolio securities:
| Level 1 | Level 2 | Level 3 | ||||||||||
Investments in Securities | ||||||||||||
Assets | ||||||||||||
Asset-Backed Securities | ||||||||||||
Cayman Islands | $ | — | $ | 3,952,587 | $ | — | ||||||
Ireland | — | 557,546 | — | |||||||||
Spain | — | 142,543 | — | |||||||||
United States | — | 1,338,411 | — | |||||||||
Commercial Mortgage-Backed Securities | ||||||||||||
United States | — | 2,879,758 | — | |||||||||
Corporate Bonds | ||||||||||||
Canada | — | 328,433 | — | |||||||||
China | — | 435,494 | — | |||||||||
France | — | 485,334 | — | |||||||||
Germany | — | 499,707 | — | |||||||||
Indonesia | — | 110,747 | — | |||||||||
Italy | — | 459,862 | — | |||||||||
Kazakhstan | — | 109,297 | — | |||||||||
Mexico | — | 340,670 | — | |||||||||
Netherlands | — | 151,968 | — | |||||||||
Peru | — | 190,715 | — | |||||||||
Russia | — | 140,114 | — | |||||||||
Spain | — | 121,713 | — | |||||||||
Supranational Bank | — | 125,656 | — | |||||||||
Switzerland | — | 467,237 | — | |||||||||
United Arab Emirates | — | 144,150 | — | |||||||||
United Kingdom | — | 1,109,089 | — | |||||||||
United States | — | 5,485,246 | — | |||||||||
Residential Mortgage-Backed Securities | ||||||||||||
Bermuda | — | 148,329 | — | |||||||||
United States | — | 226,795 | — | |||||||||
Sovereign Bonds | ||||||||||||
Argentina | — | 198,684 | — | |||||||||
Austria | — | 164,365 | — | |||||||||
Brazil | — | 690,379 | — | |||||||||
Bulgaria | — | 146,816 | — | |||||||||
Canada | — | 117,623 | — | |||||||||
Chile | — | 139,100 | — | |||||||||
China | — | 147,819 | — | |||||||||
Colombia | — | 662,209 | — | |||||||||
Croatia | — | 229,864 | — | |||||||||
Cyprus | — | 627,745 | — | |||||||||
Dominican Republic | — | 109,751 | — | |||||||||
Germany | — | 136,660 | — | |||||||||
Greece | — | 750,429 | — | |||||||||
Hungary | — | 168,396 | — | |||||||||
Indonesia | — | 573,585 | — | |||||||||
Israel | — | 121,902 | — | |||||||||
Italy | — | 1,470,107 | — | |||||||||
See Notes to Financial Statements.
| 60 |
| Level 1 | Level 2 | Level 3 | ||||||||||
Investments in Securities (continued) | ||||||||||||
Assets (continued) | ||||||||||||
Sovereign Bonds (continued) | ||||||||||||
Japan | $ | — | $ | 236,034 | $ | — | ||||||
Kazakhstan | — | 144,356 | — | |||||||||
Malaysia | — | 111,250 | — | |||||||||
Mexico | — | 477,147 | — | |||||||||
New Zealand | — | 152,508 | — | |||||||||
Panama | — | 217,502 | — | |||||||||
Peru | — | 256,519 | — | |||||||||
Poland | — | 214,132 | — | |||||||||
Portugal | — | 1,086,840 | — | |||||||||
Romania | — | 190,523 | — | |||||||||
Russia | — | 251,480 | — | |||||||||
Saudi Arabia | — | 351,216 | — | |||||||||
Senegal | — | 115,316 | — | |||||||||
Serbia | — | 229,484 | — | |||||||||
Spain | — | 1,407,118 | — | |||||||||
Sweden | — | 111,491 | — | |||||||||
Turkey | — | 225,090 | — | |||||||||
Ukraine | — | 246,365 | — | |||||||||
United Arab Emirates | — | 202,060 | — | |||||||||
United Kingdom | — | 52,304 | — | |||||||||
Uruguay | — | 113,116 | — | |||||||||
U.S. Government Agency Obligation | — | — | 66,397 | |||||||||
U.S. Treasury Obligation | — | 754,392 | — | |||||||||
Affiliated Mutual Funds | 752,879 | — | — | |||||||||
Options Purchased | — | 10,122 | — | |||||||||
|
|
|
|
|
| |||||||
Total | $ | 752,879 | $ | 33,563,200 | $ | 66,397 | ||||||
|
|
|
|
|
| |||||||
Other Financial Instruments* | ||||||||||||
Assets | ||||||||||||
Futures Contracts | $ | 140,242 | $ | — | $ | — | ||||||
OTC Forward Foreign Currency Exchange Contracts | — | 171,600 | — | |||||||||
OTC Packaged Credit Default Swap Agreements | — | 107,025 | — | |||||||||
Centrally Cleared Credit Default Swap Agreements | — | 14,060 | — | |||||||||
OTC Credit Default Swap Agreements | — | 102,775 | 627 | |||||||||
OTC Currency Swap Agreement | — | 15,070 | — | |||||||||
Centrally Cleared Inflation Swap Agreement | — | 5,523 | — | |||||||||
Centrally Cleared Interest Rate Swap Agreements | — | 936,136 | — | |||||||||
OTC Interest Rate Swap Agreements | — | 138,188 | — | |||||||||
|
|
|
|
|
| |||||||
Total | $ | 140,242 | $ | 1,490,377 | $ | 627 | ||||||
|
|
|
|
|
| |||||||
Liabilities | ||||||||||||
Futures Contracts | $ | (100,035 | ) | $ | — | $ | — | |||||
OTC Forward Foreign Currency Exchange Contracts | — | (360,072 | ) | — | ||||||||
OTC Packaged Credit Default Swap Agreements | — | (109,607 | ) | — | ||||||||
See Notes to Financial Statements.
| PGIM Global Total Return (USD Hedged) Fund | 61 |
Schedule of Investments(continued)
as of October 31, 2019
| Level 1 | Level 2 | Level 3 | ||||||||||
Other Financial Instruments* (continued) | ||||||||||||
Liabilities (continued) | ||||||||||||
OTC Credit Default Swap Agreements | $ | — | $ | (87,803 | ) | $ | — | |||||
Centrally Cleared Inflation Swap Agreement | — | (5,781 | ) | — | ||||||||
Centrally Cleared Interest Rate Swap Agreements | — | (916,151 | ) | — | ||||||||
OTC Interest Rate Swap Agreement | — | (2,019 | ) | — | ||||||||
|
|
|
|
|
| |||||||
Total | $ | (100,035 | ) | $ | (1,481,433 | ) | $ | — | ||||
|
|
|
|
|
| |||||||
| * | Other financial instruments are derivative instruments not reflected in the Schedule of Investments, such as futures, forwards and centrally cleared swap contracts, which are recorded at the unrealized appreciation (depreciation) on the instrument, and OTC swap contracts which are recorded at fair value. |
Industry Classification:
The industry classification of investments and other assets in excess of liabilities shown as a percentage of net assets as of October 31, 2019 were as follows (unaudited):
Sovereign Bonds | 37.2 | % | ||
Collateralized Loan Obligations | 13.8 | |||
Commercial Mortgage-Backed Securities | 8.4 | |||
Banks | 7.5 | |||
Healthcare-Products | 2.2 | |||
Consumer Loans | 2.2 | |||
U.S. Treasury Obligation | 2.2 | |||
Affiliated Mutual Funds | 2.2 | |||
Oil & Gas | 1.9 | |||
Insurance | 1.8 | |||
Residential Mortgage-Backed Securities | 1.5 | |||
Pipelines | 1.5 | |||
Electric | 1.5 | |||
Media | 1.4 | |||
Diversified Financial Services | 1.2 | |||
Telecommunications | 1.2 | |||
Retail | 0.9 | |||
Healthcare-Services | 0.9 | |||
Transportation | 0.8 | |||
Pharmaceuticals | 0.7 | |||
Commercial Services | 0.7 | |||
Entertainment | 0.7 | |||
Home Builders | 0.7 | |||
Agriculture | 0.6 | |||
Foods | 0.5 | |||
Real Estate Investment Trusts (REITs) | 0.4 | |||
Multi-National | 0.4 |
Other | 0.4 | % | ||
Chemicals | 0.4 | |||
Software | 0.3 | |||
Electrical Components & Equipment | 0.3 | |||
Packaging & Containers | 0.3 | |||
Auto Manufacturers | 0.3 | |||
Credit Cards | 0.3 | |||
Biotechnology | 0.3 | |||
Housewares | 0.3 | |||
Automobiles | 0.3 | |||
Apparel | 0.3 | |||
Semiconductors | 0.3 | |||
Auto Parts & Equipment | 0.3 | |||
Aerospace & Defense | 0.2 | |||
U.S. Government Agency Obligation | 0.2 | |||
Computers | 0.1 | |||
Airlines | 0.1 | |||
Options Purchased | 0.0 | * | ||
|
| |||
| 99.7 | ||||
Other assets in excess of liabilities | 0.3 | |||
|
| |||
| 100.0 | % | |||
|
|
| * | Less than +/- 0.05% |
See Notes to Financial Statements.
| 62 |
Effects of Derivative Instruments on the Financial Statements and Primary Underlying Risk Exposure:
The Fund invested in derivative instruments during the reporting period. The primary types of risk associated with these derivative instruments are credit contracts risk, foreign exchange contracts risk and interest rate contracts risk. See the Notes to Financial Statements for additional detail regarding these derivative instruments and their risks. The effect of such derivative instruments on the Fund’s financial position and financial performance as reflected in the Statement of Assets and Liabilities and Statement of Operations is presented in the summary below.
Fair values of derivative instruments as of October 31, 2019 as presented in the Statement of Assets and Liabilities:
Asset Derivatives | Liability Derivatives | |||||||||||
Derivatives not accounted carried at fair value | Statement of | Fair Value | Statement of | Fair Value | ||||||||
| Credit contracts | Due from/to broker—variation margin swaps | $ | 14,060 | * | — | $ | — | |||||
| Credit contracts | Premiums paid for OTC swap agreements | 78,490 | Premiums received for OTC swap agreements | 113,327 | ||||||||
| Credit contracts | Unrealized appreciation on OTC swap agreements | 173,231 | Unrealized depreciation on OTC swap agreements | 125,377 | ||||||||
| Foreign exchange contracts | Unrealized appreciation on OTC forward foreign currency exchange contracts | 171,600 | Unrealized depreciation on OTC forward foreign currency exchange contracts | 360,072 | ||||||||
| Interest rate contracts | Due from/to broker—variation margin futures | 140,242 | * | Due from/to broker—variation margin futures | 100,035 | * | ||||||
| Interest rate contracts | Due from/to broker—variation margin swaps | 941,659 | * | Due from/to broker—variation margin swaps | 921,932 | * | ||||||
| Interest rate contracts | Unaffiliated investments | 10,122 | — | — | ||||||||
| Interest rate contracts | Unrealized appreciation on OTC swap agreements | 153,258 | Unrealized depreciation on OTC swap agreements | 2,019 | ||||||||
|
|
|
| |||||||||
| $ | 1,682,662 | $ | 1,622,762 | |||||||||
|
|
|
| |||||||||
| * | Includes cumulative appreciation (depreciation) as reported in the schedule of open futures and centrally cleared swap contracts. Only unsettled variation margin receivable (payable) is reported within the Statement of Assets and Liabilities. |
See Notes to Financial Statements.
| PGIM Global Total Return (USD Hedged) Fund | 63 |
Schedule of Investments(continued)
as of October 31, 2019
The effects of derivative instruments on the Statement of Operations for the year ended October 31, 2019 are as follows:
Amount of Realized Gain (Loss) on Derivatives Recognized in Income | ||||||||||||||||||||
Derivatives not accounted carried at fair value | Options Purchased(1) | Options Written | Futures | Forward & Cross Currency Exchange Contracts | Swaps | |||||||||||||||
Credit contracts | $ | (19,115 | ) | $ | 25,736 | $ | — | $ | — | $ | 94,081 | |||||||||
Foreign exchange contracts | — | — | — | 789,352 | — | |||||||||||||||
Interest rate contracts | (11,671 | ) | 5,147 | 745,228 | — | 104,266 | ||||||||||||||
|
|
|
|
|
|
|
|
|
| |||||||||||
Total | $ | (30,786 | ) | $ | 30,883 | $ | 745,228 | $ | 789,352 | $ | 198,347 | |||||||||
|
|
|
|
|
|
|
|
|
| |||||||||||
| (1) | Included in net realized gain (loss) on investment transactions in the Statement of Operations. |
Change in Unrealized Appreciation (Depreciation) on Derivatives Recognized in Income | ||||||||||||||||||||||||
Derivatives not accounted carried at fair value | Options Purchased(2) | Options Written | Futures | Forward & Cross Currency Exchange Contracts | Forward Rate Agreements | Swaps | ||||||||||||||||||
Credit contracts | $ | 611 | $ | (3,018 | ) | $ | — | $ | — | $ | — | $ | 49,628 | |||||||||||
Foreign exchange contracts | — | — | — | (319,861 | ) | — | — | |||||||||||||||||
Interest rate contracts | 6,376 | (289 | ) | 260,333 | — | 1,329 | 585 | |||||||||||||||||
|
|
|
|
|
|
|
|
|
|
|
| |||||||||||||
Total | $ | 6,987 | $ | (3,307 | ) | $ | 260,333 | $ | (319,861 | ) | $ | 1,329 | $ | 50,213 | ||||||||||
|
|
|
|
|
|
|
|
|
|
|
| |||||||||||||
| (2) | Included in net change in unrealized appreciation (depreciation) on investments in the Statement of Operations. |
For the year ended October 31, 2019, the Fund’s average volume of derivative activities is as follows:
Options | Options Written(2) | Futures Contracts— Long Positions(2) | Futures Contracts— Short Positions(2) | Forward Foreign Currency Exchange Contracts— Purchased(3) | ||||||||||||||
| $ | 8,789 | $ | 2,112,327 | $ | 19,409,272 | $ | 18,255,028 | $ | 12,598,666 | |||||||||
Forward | Cross Currency Exchange Contracts(4) | Forward Rate Agreements(2) | Interest Rate Swap Agreements(2) | Credit Default Swap Agreements— Buy Protection(2) | ||||||||||||||
| $ | 26,487,456 | $ | 147,249 | $ | 220,000 | $ | 54,213,102 | $ | 3,384,224 | |||||||||
| Credit Default Swap Agreements— Sell Protection(2) | Currency Swap Agreements(2) | Inflation Swap Agreements(2) | ||||||||
| $ | 6,377,445 | $ | 77,600 | $ | 517,692 | |||||
See Notes to Financial Statements.
| 64 |
| (1) | Cost. |
| (2) | Notional Amount in USD. |
| (3) | Value at Settlement Date. |
| (4) | Value at Trade Date. |
Financial Instruments/Transactions—Summary of Offsetting and Netting Arrangements:
The Fund invested in OTC derivatives during the reporting period that are either offset in accordance with current requirements or are subject to enforceable master netting arrangements or similar agreements that permit offsetting. The information about offsetting and related netting arrangements for OTC derivatives where the legal right toset-off exists is presented in the summary below.
Offsetting of OTC derivative assets and liabilities:
Counterparty | Gross Amounts of Recognized Assets(1) | Gross Amounts of Recognized Liabilities(1) | Net Amounts of Recognized Assets/(Liabilities) | Collateral Pledged/ (Received)(2) | Net Amount | |||||||||||||||
Bank of America, N.A. | $ | 28,334 | $ | (18,783 | ) | $ | 9,551 | $ | — | $ | 9,551 | |||||||||
Barclays Bank PLC | 16,281 | (20,879 | ) | (4,598 | ) | — | (4,598 | ) | ||||||||||||
BNP Paribas S.A. | 25,626 | (21,278 | ) | 4,348 | — | 4,348 | ||||||||||||||
Citibank, N.A. | 313,304 | (304,859 | ) | 8,445 | — | 8,445 | ||||||||||||||
Credit Suisse International | 855 | (11,520 | ) | (10,665 | ) | — | (10,665 | ) | ||||||||||||
Deutsche Bank AG | — | (11,412 | ) | (11,412 | ) | — | (11,412 | ) | ||||||||||||
Goldman Sachs International | 31,895 | (26,628 | ) | 5,267 | — | 5,267 | ||||||||||||||
HSBC Bank USA, N.A. | 24,843 | (28,544 | ) | (3,701 | ) | — | (3,701 | ) | ||||||||||||
J.P. Morgan Securities LLC | 5,240 | (1,093 | ) | 4,147 | — | 4,147 | ||||||||||||||
JPMorgan Chase Bank, N.A. | 94,199 | (94,825 | ) | (626 | ) | — | (626 | ) | ||||||||||||
Morgan Stanley & Co. International PLC | 44,437 | (17,182 | ) | 27,255 | — | 27,255 | ||||||||||||||
The Toronto-Dominion Bank | — | (16,882 | ) | (16,882 | ) | — | (16,882 | ) | ||||||||||||
UBS AG | 1,687 | (26,910 | ) | (25,223 | ) | — | (25,223 | ) | ||||||||||||
|
|
|
|
|
|
|
|
|
| |||||||||||
| $ | 586,701 | $ | (600,795 | ) | $ | (14,094 | ) | $ | — | $ | (14,094 | ) | ||||||||
|
|
|
|
|
|
|
|
|
| |||||||||||
| (1) | Includes unrealized appreciation/(depreciation) on swaps and forwards, premiums paid/(received) on swap agreements and market value of purchased and written options, as represented on the Statement of Assets and Liabilities. |
| (2) | Collateral amount disclosed by the Fund is limited to the market value of financial instruments/transactions and the Fund’s OTC derivative exposure by counterparty. |
See Notes to Financial Statements.
| PGIM Global Total Return (USD Hedged) Fund | 65 |
Statement of Assets and Liabilities
as of October 31, 2019
Assets | ||||
Investments at value: | ||||
Unaffiliated investments (cost $33,009,673) | $ | 33,629,597 | ||
Affiliated investments (cost $752,879) | 752,879 | |||
Cash | 40,815 | |||
Foreign currency, at value (cost $141,066) | 141,173 | |||
Unrealized appreciation on OTC swap agreements | 326,489 | |||
Deposit with broker for centrally cleared/exchange-traded derivatives | 300,000 | |||
Dividends and interest receivable | 296,795 | |||
Unrealized appreciation on OTC forward foreign currency exchange contracts | 171,600 | |||
Due from broker—variation margin futures | 99,835 | |||
Premiums paid for OTC swap agreements | 78,490 | |||
Due from Manager | 25,943 | |||
Receivable for Fund shares sold | 13,082 | |||
Prepaid expenses and other assets | 2,030 | |||
|
| |||
Total Assets | 35,878,728 | |||
|
| |||
Liabilities | ||||
Payable for investments purchased | 637,630 | |||
Unrealized depreciation on OTC forward foreign currency exchange contracts | 360,072 | |||
Unrealized depreciation on OTC swap agreements | 127,396 | |||
Premiums received for OTC swap agreements | 113,327 | |||
Accrued expenses and other liabilities | 111,306 | |||
Due to broker—variation margin swaps | 23,531 | |||
Payable for Fund shares reacquired | 11,456 | |||
Distribution fee payable | 187 | |||
Affiliated transfer agent fee payable | 97 | |||
|
| |||
Total Liabilities | 1,385,002 | |||
|
| |||
Net Assets | $ | 34,493,726 | ||
|
| |||
Net assets were comprised of: | ||||
Common stock, at par | $ | 33,058 | ||
Paid-in capital in excess of par | 33,085,265 | |||
Total distributable earnings (loss) | 1,375,403 | |||
|
| |||
Net assets, October 31, 2019 | $ | 34,493,726 | ||
|
| |||
See Notes to Financial Statements.
| 66 |
Class A | ||||
Net asset value, offering price and redemption price per share, | $ | 10.43 | ||
Maximum sales charge (3.25% of offering price) | 0.35 | |||
|
| |||
Maximum offering price to public | $ | 10.78 | ||
|
| |||
Class C | ||||
Net asset value, offering price and redemption price per share, | $ | 10.43 | ||
|
| |||
Class Z | ||||
Net asset value, offering price and redemption price per share, | $ | 10.43 | ||
|
| |||
Class R6 | ||||
Net asset value, offering price and redemption price per share, | $ | 10.43 | ||
|
| |||
See Notes to Financial Statements.
| PGIM Global Total Return (USD Hedged) Fund | 67 |
Statement of Operations
Year Ended October 31, 2019
Net Investment Income (Loss) | ||||
Income | ||||
Interest income (net of $8,461 foreign withholding tax) | $ | 874,652 | ||
Affiliated dividend income | 17,602 | |||
|
| |||
Total income | 892,254 | |||
|
| |||
Expenses | ||||
Management fee | 139,728 | |||
Distribution fee(a) | 743 | |||
Custodian and accounting fees | 119,803 | |||
Registration fees(a) | 63,354 | |||
Shareholders’ reports | 46,126 | |||
Audit fee | 38,000 | |||
Legal fees and expenses | 19,936 | |||
Directors’ fees | 11,219 | |||
SEC registration fees | 3,148 | |||
Transfer agent’s fees and expenses (including affiliated expense of $511)(a) | 2,093 | |||
Miscellaneous | 22,265 | |||
|
| |||
Total expenses | 466,415 | |||
Less: Fee waiver and/or expense reimbursement(a) | (302,858 | ) | ||
|
| |||
Net expenses | 163,557 | |||
|
| |||
Net investment income (loss) | 728,697 | |||
|
| |||
Realized And Unrealized Gain (Loss) On Investment And Foreign Currency Transactions | ||||
Net realized gain (loss) on: | ||||
Investment transactions (including affiliated of $6) | (25,584 | ) | ||
Futures transactions | 745,228 | |||
Forward currency contract transactions | 789,352 | |||
Options written transactions | 30,883 | |||
Swap agreement transactions | 198,347 | |||
Foreign currency transactions | (160,387 | ) | ||
|
| |||
| 1,577,839 | ||||
|
| |||
Net change in unrealized appreciation (depreciation) on: | ||||
Investments | 2,009,321 | |||
Futures | 260,333 | |||
Forward rate agreements | 1,329 | |||
Forward and cross currency contracts | (319,861 | ) | ||
Options written | (3,307 | ) | ||
Swap agreements | 50,213 | |||
Foreign currencies | 6,101 | |||
|
| |||
| 2,004,129 | ||||
|
| |||
Net gain (loss) on investment and foreign currency transactions | 3,581,968 | |||
|
| |||
Net Increase (Decrease) In Net Assets Resulting From Operations | $ | 4,310,665 | ||
|
| |||
See Notes to Financial Statements.
| 68 |
| (a) | Class specific expenses and waivers were as follows: |
| Class A | Class C | Class Z | Class R6 | |||||||||||||
Distribution fee | 584 | 159 | — | — | ||||||||||||
Registration fees | 14,978 | 14,978 | 18,819 | 14,579 | ||||||||||||
Transfer agent’s fees and expenses | 420 | 120 | 1,448 | 105 | ||||||||||||
Fee waiver and/or expense reimbursement | (17,268 | ) | (15,223 | ) | (30,066 | ) | (240,301 | ) | ||||||||
See Notes to Financial Statements.
| PGIM Global Total Return (USD Hedged) Fund | 69 |
Statements of Changes in Net Assets
| Year Ended October 31, 2019 | December 12, 2017* through October 31, 2018 | |||||||
Increase (Decrease) in Net Assets | ||||||||
Operations | ||||||||
Net investment income (loss) | $ | 728,697 | $ | 469,585 | ||||
Net realized gain (loss) on investment and foreign currency transactions | 1,577,839 | 236,763 | ||||||
Net change in unrealized appreciation (depreciation) on investments and foreign currencies | 2,004,129 | (1,300,626 | ) | |||||
|
|
|
| |||||
Net increase (decrease) in net assets resulting from operations | 4,310,665 | (594,278 | ) | |||||
|
|
|
| |||||
Dividends and Distributions | ||||||||
Distributions from distributable earnings | ||||||||
Class A | (8,727 | ) | (1,243 | ) | ||||
Class C | (847 | ) | (258 | ) | ||||
Class Z | (45,240 | ) | (4,661 | ) | ||||
Class R6 | (1,566,074 | ) | (717,845 | ) | ||||
|
|
|
| |||||
| (1,620,888 | ) | (724,007 | ) | |||||
|
|
|
| |||||
Fund share transactions | ||||||||
Net proceeds from shares sold | 5,835,407 | 25,246,480 | ||||||
Net asset value of shares issued in reinvestment of dividends and distributions | 1,620,828 | 724,012 | ||||||
Cost of shares reacquired | (304,493 | ) | — | |||||
|
|
|
| |||||
Net increase (decrease) in net assets from Fund share transactions | 7,151,742 | 25,970,492 | ||||||
|
|
|
| |||||
Total increase (decrease) | 9,841,519 | 24,652,207 | ||||||
Net Assets: | ||||||||
Beginning of period | 24,652,207 | — | ||||||
|
|
|
| |||||
End of period | $ | 34,493,726 | $ | 24,652,207 | ||||
|
|
|
| |||||
| * | Commencement of operations. |
See Notes to Financial Statements.
| 70 |
Notes to Financial Statements
Prudential Global Total Return Fund, Inc. (the “Company”) is registered under the Investment Company Act of 1940, as amended (“1940 Act”), as anopen-end management investment company and currently consists of two funds: PGIM Global Total Return (USD Hedged) Fund and PGIM Global Total Return Fund, each of which arenon-diversified funds for purposes of the 1940 Act. These financial statements relate only to the PGIM Global Total Return (USD Hedged) Fund (the “Fund”).
The investment objective of the Fund is total return, through a combination of current income and capital appreciation.
1. Accounting Policies
The Fund follows the investment company accounting and reporting guidance of the Financial Accounting Standards Board (“FASB”) Accounting Standard Codification (“ASC”) Topic 946 Financial Services—Investment Companies. The following accounting policies conform to U.S. generally accepted accounting principles. The Fund consistently follows such policies in the preparation of its financial statements.
Securities Valuation:The Fund holds securities and other assets and liabilities that are fair valued at the close of each day (generally, 4:00 PM Eastern time) the New York Stock Exchange (“NYSE”) is open for trading. Fair value is the price that would be received to sell an asset or paid to transfer a liability in an orderly transaction between market participants on the measurement date. The Company’s Board of Directors (the “Board”) has adopted valuation procedures for security valuation under which fair valuation responsibilities have been delegated to PGIM Investments LLC (“PGIM Investments” or the “Manager”). Pursuant to the Board’s delegation, the Manager has established a Valuation Committee responsible for supervising the fair valuation of portfolio securities and other assets and liabilities. The valuation procedures permit the Fund to utilize independent pricing vendor services, quotations from market makers, and alternative valuation methods when market quotations are either not readily available or not deemed representative of fair value. A record of the Valuation Committee’s actions is subject to the Board’s review, approval, and ratification at its next regularly scheduled quarterly meeting.
For the fiscal reportingyear-end, securities and other assets and liabilities were fair valued at the close of the last U.S. business day. Trading in certain foreign securities may occur when the NYSE is closed (including weekends and holidays). Because such foreign securities trade in markets that are open on weekends and U.S. holidays, the values of some of the Fund’s foreign investments may change on days when investors cannot purchase or redeem Fund shares.
| PGIM Global Total Return (USD Hedged) Fund | 71 |
Notes to Financial Statements(continued)
Various inputs determine how the Fund’s investments are valued, all of which are categorized according to the three broad levels (Level 1, 2, or 3) detailed in the Schedule of Investments and referred to herein as the “fair value hierarchy” in accordance with FASB ASC Topic 820—Fair Value Measurements and Disclosures.
Derivative instruments, such as futures or options, that are traded on a national securities exchange are valued at the last sale price as of the close of trading on the applicable exchange where the security principally trades. Securities traded via NASDAQ are valued at the NASDAQ official closing price. To the extent these securities are valued at the last sale price or NASDAQ official closing price, they are classified as Level 1 in the fair value hierarchy. In the event that no sale or official closing price on valuation date exists, these securities are generally valued at the mean between the last reported bid and ask prices, or at the last bid price in the absence of an ask price. These securities are classified as Level 2 in the fair value hierarchy.
Investments inopen-end,non-exchange-traded mutual funds are valued at their net asset values as of the close of the NYSE on the date of valuation. These securities are classified as Level 1 in the fair value hierarchy since they may be purchased or sold at their net asset values on the date of valuation.
Fixed income securities traded in the OTC market are generally classified as Level 2 in the fair value hierarchy. Such fixed income securities are typically valued using the market approach which generally involves obtaining data from an approved independent third-party vendor source. The Fund utilizes the market approach as the primary method to value securities when market prices of identical or comparable instruments are available. The third-party vendors’ valuation techniques used to derive the evaluated bid price are based on evaluating observable inputs, including but not limited to, yield curves, yield spreads, credit ratings, deal terms, tranche level attributes, default rates, cash flows, prepayment speeds, broker/dealer quotations and reported trades. Certain Level 3 securities are also valued using the market approach when obtaining a single broker quote or when utilizing transaction prices for identical securities that have been used in excess of five business days. During the reporting period, there were no changes to report with respect to the valuation approach and/or valuation techniques discussed above.
OTC and centrally cleared derivative instruments are generally classified as Level 2 in the fair value hierarchy. Such derivative instruments are typically valued using the market approach and/or income approach which generally involves obtaining data from an approved independent third-party vendor source. The Fund utilizes the market approach when quoted prices in broker-dealer markets are available but also includes consideration of alternative valuation approaches, including the income approach. In the absence of reliable market quotations, the income approach is typically utilized for purposes of valuing
| 72 |
derivatives such as interest rate swaps based on a discounted cash flow analysis whereby the value of the instrument is equal to the present value of its future cash inflows or outflows. Such analysis includes projecting future cash flows and determining the discount rate (including the present value factors that affect the discount rate) used to discount the future cash flows. In addition, the third-party vendors’ valuation techniques used to derive the evaluated derivative price is based on evaluating observable inputs, including but not limited to, underlying asset prices, indices, spreads, interest rates and exchange rates. Certain derivatives may be classified as Level 3 when valued using the market approach by obtaining a single broker quote or when utilizing unobservable inputs in the income approach. During the reporting period, there were no changes to report with respect to the valuation approach and/or valuation techniques discussed above.
Securities and other assets that cannot be priced according to the methods described above are valued based on pricing methodologies approved by the Board. In the event that unobservable inputs are used when determining such valuations, the securities will be classified as Level 3 in the fair value hierarchy.
When determining the fair value of securities, some of the factors influencing the valuation include: the nature of any restrictions on disposition of the securities; assessment of the general liquidity of the securities; the issuer’s financial condition and the markets in which it does business; the cost of the investment; the size of the holding and the capitalization of the issuer; the prices of any recent transactions or bids/offers for such securities or any comparable securities; any available analyst media or other reports or information deemed reliable by the Manager regarding the issuer or the markets or industry in which it operates. Using fair value to price securities may result in a value that is different from a security’s most recent closing price and from the price used by other unaffiliated mutual funds to calculate their net asset values.
Illiquid Securities:Pursuant to Rule22e-4 under the 1940 Act, the Fund has adopted a Board approved Liquidity Risk Management Program (“LRMP”) that requires, among other things, that the Fund limit its illiquid investments that are assets to no more than 15% of net assets. Illiquid securities are those that, because of the absence of a readily available market or due to legal or contractual restrictions on resale, may not reasonably be expected to be sold or disposed of in current market conditions in seven calendar days or less without the sale or disposition significantly changing the market value of the investment. The Fund may find it difficult to sell illiquid securities at the time considered most advantageous by its subadviser and may incur transaction costs that would not be incurred in the sale of securities that were freely marketable.
Restricted Securities:Securities acquired in unregistered, private sales from the issuing company or from an affiliate of the issuer are considered restricted as to disposition under federal securities law (“restricted securities”). Such restricted securities are valued pursuant to the valuation procedures noted above. Restricted securities that would otherwise be considered illiquid investments pursuant to the Fund’s LRMP because of legal restrictions on resale to the general public may be traded among qualified institutional buyers under
| PGIM Global Total Return (USD Hedged) Fund | 73 |
Notes to Financial Statements(continued)
Rule 144A of the Securities Act of 1933. Therefore, these Rule 144A securities, as well as commercial paper that is sold in private placements under Section 4(2) of the Securities Act of 1933, may be classified higher than “illiquid” under the LRMP (i.e. “moderately liquid” or “less liquid” investments). However, the liquidity of the Fund’s investments in restricted securities could be impaired if trading does not develop or declines.
Foreign Currency Translation:The books and records of the Fund are maintained in U.S. dollars. Foreign currency amounts are translated into U.S. dollars on the following basis:
(i) market value of investment securities, other assets and liabilities—at the current rates of exchange;
(ii) purchases and sales of investment securities, income and expenses—at the rates of exchange prevailing on the respective dates of such transactions.
Although the net assets of the Fund are presented at the foreign exchange rates and market values at the close of the period, the Fund does not generally isolate that portion of the results of operations arising as a result of changes in the foreign exchange rates from the fluctuations arising from changes in the market prices of long-term portfolio securities held at the end of the period. Similarly, the Fund does not isolate the effect of changes in foreign exchange rates from the fluctuations arising from changes in the market prices of long-term portfolio securities sold during the period. Accordingly, holding period realized foreign currency gains (losses) are included in the reported net realized gains (losses) on investment transactions.
Additionally, net realized gains (losses) on foreign currency transactions represent net foreign exchange gains (losses) from the disposition of holdings of foreign currencies, currency gains (losses) realized between the trade and settlement dates on forward currency transactions, and the difference between the amounts of interest, dividends and foreign withholding taxes recorded on the Fund’s books and the U.S. dollar equivalent amounts actually received or paid. Net unrealized currency gains (losses) arise from valuing foreign currency denominated assets and liabilities (other than investments) at period end exchange rates.
Forward and Cross Currency Contracts:A forward currency contract is a commitment to purchase or sell a foreign currency at a future date at a negotiated forward rate. The Fund enters into forward currency contracts, as defined in the prospectus, in order to hedge its exposure to changes in foreign currency exchange rates on its foreign portfolio holdings or on specific receivables and payables denominated in a foreign currency and to gain exposure to certain currencies. The contracts are valued daily at current forward exchange rates and any unrealized gain (loss) is included in net unrealized appreciation (depreciation)
| 74 |
on forward and cross currency contracts. Gain (loss) is realized on the settlement date of the contract equal to the difference between the settlement value of the original and negotiated forward contracts. This gain (loss), if any, is included in net realized gain (loss) on forward and cross currency contract transactions. Risks may arise upon entering into these contracts from the potential inability of the counterparties to meet the terms of their contracts. Forward currency contracts involve risks from currency exchange rate and credit risk in excess of the amounts reflected on the Statement of Assets and Liabilities. The Fund’s maximum risk of loss from counterparty credit risk is the net value of the cash flows to be received from the counterparty at the end of the contract’s life. A cross currency contract is a forward contract where a specified amount of one foreign currency will be exchanged for a specified amount of another foreign currency.
Options:The Fund purchased or wrote options in order to hedge against adverse market movements or fluctuations in value caused by changes in prevailing interest rates, value of equities or foreign currency exchange rates with respect to securities or financial instruments which the Fund currently owns or intends to purchase. The Fund may also use options to gain additional market exposure. The Fund’s principal reason for writing options is to realize, through receipt of premiums, a greater current return than would be realized on the underlying security alone. When the Fund purchases an option, it pays a premium and an amount equal to that premium is recorded as an asset. When the Fund writes an option, it receives a premium and an amount equal to that premium is recorded as a liability. The asset or liability is adjusted daily to reflect the current market value of the option. If an option expires unexercised, the Fund realizes a gain (loss) to the extent of the premium received or paid. If an option is exercised, the premium received or paid is recorded as an adjustment to the proceeds from the sale or the cost of the purchase in determining whether the Fund has realized a gain (loss). The difference between the premium and the amount received or paid at the closing of a purchase or sale transaction is also treated as a realized gain (loss). Gain (loss) on purchased options is included in net realized gain (loss) on investment transactions. Gain (loss) on written options is presented separately as net realized gain (loss) on options written transactions.
The Fund, as writer of an option, may have no control over whether the underlying securities or financial instruments may be sold (called) or purchased (put). As a result, the Fund bears the market risk of an unfavorable change in the price of the security or financial instrument underlying the written option. The Fund, as purchaser of an OTC option, bears the risk of the potential inability of the counterparties to meet the terms of their contracts. With exchange-traded options contracts, there is minimal counterparty credit risk to the Fund since the exchanges’ clearinghouse acts as counterparty to all exchange-traded options and guarantees the options contracts against default.
When the Fund writes an option on a swap, an amount equal to any premium received by the Fund is recorded as a liability and is subsequently adjusted to the current market value of the written option on the swap. If a call option on a swap is exercised, the Fund becomes obligated to pay a fixed interest rate (noted as the strike price) and receive a variable interest rate on a notional amount. If a put option on a swap is exercised, the Fund becomes
| PGIM Global Total Return (USD Hedged) Fund | 75 |
Notes to Financial Statements(continued)
obligated to pay a variable interest rate and receive a fixed interest rate (noted as the strike price) on a notional amount. Premiums received from writing options on swaps that expire or are exercised are treated as realized gains upon the expiration or exercise of such options on swaps. The risk associated with writing put and call options on swaps is that the Fund will be obligated to be party to a swap agreement if an option on a swap is exercised.
Financial Futures Contracts:A financial futures contract is an agreement to purchase (long) or sell (short) an agreed amount of securities at a set price for delivery on a future date. Upon entering into a financial futures contract, the Fund is required to pledge to the broker an amount of cash and/or other assets equal to a certain percentage of the contract amount. This amount is known as the “initial margin.” Subsequent payments, known as “variation margin,” are made or received by the Fund each day, depending on the daily fluctuations in the value of the underlying security. Such variation margin is recorded for financial statement purposes on a daily basis as unrealized gain (loss). When the contract expires or is closed, the gain (loss) is realized and is presented in the Statement of Operations as net realized gain (loss) on futures transactions.
The Fund invested in financial futures contracts in order to hedge its existing portfolio securities, or securities the Fund intends to purchase, against fluctuations in value caused by changes in prevailing interest rates. Should interest rates move unexpectedly, the Fund may not achieve the anticipated benefits of the financial futures contracts and may realize a loss. The use of futures transactions involves the risk of imperfect correlation in movements in the price of futures contracts, interest rates and the underlying hedged assets. Since futures contracts are exchange-traded, there is minimal counterparty credit risk to the Fund since the exchanges’ clearinghouse acts as counterparty to all exchange-traded futures and guarantees the futures contracts against default.
Forward Rate Agreements:Forward rate agreements represent an agreement between counterparties to exchange cash flows based on the difference between two interest rates, applied to a notional principal amount on a fixed future date. The Fund entered into forward rate agreements to gain yield exposure based on anticipated market conditions at the specified termination date of the agreement.
Swap Agreements:The Fund entered into certain types of swap agreements detailed in the disclosures below. A swap agreement is an agreement to exchange the return generated by one instrument for the return generated by another instrument. Swap agreements are negotiated in the OTC market and may be executed either directly with a counterparty(“OTC-traded”) or through a central clearing facility, such as a registered exchange. Swap agreements are valued daily at current market value and any change in value is included in the net unrealized appreciation (depreciation) on swap agreements. Centrally cleared swaps pay or receive an amount known as “variation margin”, based on daily changes in the
| 76 |
valuation of the swap contract. Any upfront premiums paid and received are shown as swap premiums paid and swap premiums received in the Statement of Assets and Liabilities. Risk of loss may exceed amounts recognized on the Statement of Assets and Liabilities. Swap agreements outstanding at period end, if any, are listed on the Schedule of Investments.
Interest Rate Swaps:Interest rate swaps represent an agreement between counterparties to exchange cash flows based on the difference between two interest rates, applied to a notional principal amount for a specified period. The Fund is subject to interest rate risk exposure in the normal course of pursuing its investment objective. The Fund used interest rate swaps to maintain its ability to generate steady cash flow by receiving a stream of fixed rate payments or to increase exposure to prevailing market rates by receiving floating rate payments. The Fund’s maximum risk of loss from counterparty credit risk is the discounted net present value of the cash flows to be received from the counterparty over the contract’s remaining life.
Inflation Swaps:The Fund entered into inflation swap agreements to protect against fluctuations in inflation rates. Inflation swaps are characterized by one party paying a fixed rate in exchange for a floating rate that is derived from an inflation index, such as the Consumer Price Index or UK Retail Price Index. Inflation swaps subject the Fund to interest rate risk.
Credit Default Swaps (“CDS”):CDS involve one party (the protection buyer) making a stream of payments to another party (the protection seller) in exchange for the right to receive a specified payment in the event of a default or as a result of a default (collectively a “credit event”) for the referenced entity (typically corporate issues or sovereign issues of an emerging country) on its obligation; or in the event of a write-down, principal shortfall, interest shortfall or default of all or part of the referenced entities comprising a credit index.
The Fund is subject to credit risk in the normal course of pursuing its investment objectives, and as such, has entered into CDS contracts to provide a measure of protection against defaults or to take an active long or short position with respect to the likelihood of a particular issuer’s default or the reference entity’s credit soundness. CDS contracts generally trade based on a spread which represents the cost a protection buyer has to pay the protection seller. The protection buyer is said to be short the credit as the value of the contract rises the more the credit deteriorates. The value of the CDS contract increases for the protection buyer if the spread increases. The Fund’s maximum risk of loss from counterparty credit risk for purchased CDS is the inability of the counterparty to honor the contract up to the notional value due to a credit event.
As a seller of protection on credit default swap agreements, the Fund generally receives an agreed upon payment from the buyer of protection throughout the term of the swap, provided no credit event occurs. As the seller, the Fund effectively increases its investment risk because, in addition to its total net assets, the Fund may be subject to investment exposure on the notional amount of the swap.
| PGIM Global Total Return (USD Hedged) Fund | 77 |
Notes to Financial Statements(continued)
The maximum amount of the payment that the Fund, as a seller of protection, could be required to make under a credit default swap agreement would be equal to the notional amount of the underlying security or index contract as a result of a credit event. This potential amount will be partially offset by any recovery values of the respective referenced obligations, or net amounts received from the settlement of buy protection credit default swap agreements which the Fund entered into for the same referenced entity or index. As a buyer of protection, the Fund generally receives an amount up to the notional value of the swap if a credit event occurs.
Implied credit spreads, represented in absolute terms, utilized in determining the market value of credit default swap agreements where the Fund is the seller of protection as of period end are disclosed in the footnotes to the Schedule of Investments, if applicable. These spreads serve as indicators of the current status of the payment/performance risk and represent the likelihood of default risk for the credit derivative. The implied credit spread of a particular referenced entity reflects the cost of buying/selling protection and may include upfront payments required to enter into the agreement. Wider credit spreads and increased market value in absolute terms, when compared to the notional amount of the swap, represent a deterioration of the referenced entity’s credit soundness and a greater likelihood of risk of default or other credit event occurring as defined under the terms of the agreement.
Currency Swaps:The Fund entered into currency swap agreements primarily to gain yield exposure on foreign bonds. Currency swap agreements involve two parties exchanging two different currencies with an agreement to reverse the exchange at a later date at specified exchange rates.
Master Netting Arrangements:The Fund is subject to various Master Agreements, or netting arrangements, with select counterparties. These are agreements which a subadviser may have negotiated and entered into on behalf of all or a portion of the Fund. A master netting arrangement between the Fund and the counterparty permits the Fund to offset amounts payable by the Fund to the same counterparty against amounts to be received; and by the receipt of collateral from the counterparty by the Fund to cover the Fund’s exposure to the counterparty. However, there is no assurance that such mitigating factors are easily enforceable. In addition to master netting arrangements, the right toset-off exists when all the conditions are met such that each of the parties owes the other determinable amounts, the reporting party has the right toset-off the amount owed with the amount owed by the other party, the reporting party intends toset-off and the right ofset-off is enforceable by law. During the reporting period, there was no intention to settle on a net basis and all amounts are presented on a gross basis on the Statement of Assets and Liabilities.
| 78 |
The Company, on behalf of the Fund, is a party to International Swaps and Derivatives Association, Inc. (“ISDA”) Master Agreements with certain counterparties that govern OTC derivative and foreign exchange contracts entered into from time to time. The Master Agreements may contain provisions regarding, among other things, the parties’ general obligations, representations, agreements, collateral requirements, events of default and early termination. With respect to certain counterparties, in accordance with the terms of the Master Agreements, collateral posted to the Fund is held in a segregated account by the Fund’s custodian and with respect to those amounts which can be sold orre-pledged, is presented in the Schedule of Investments. Collateral pledged by the Fund is segregated by the Fund’s custodian and identified in the Schedule of Investments. Collateral can be in the form of cash or debt securities issued by the U.S. Government or related agencies or other securities as agreed to by the Fund and the applicable counterparty. Collateral requirements are determined based on the Fund’s net position with each counterparty. Termination events applicable to the Fund may occur upon a decline in the Fund’s net assets below a specified threshold over a certain period of time. Termination events applicable to counterparties may occur upon a decline in the counterparty’s long-term and short-term credit ratings below a specified level. In each case, upon occurrence, the other party may elect to terminate early and cause settlement of all derivative and foreign exchange contracts outstanding, including the payment of any losses and costs resulting from such early termination, as reasonably determined by the terminating party. Any decision by one or more of the Fund’s counterparties to elect early termination could impact the Fund’s future derivative activity.
In addition to each instrument’s primary underlying risk exposure (e.g. interest rate, credit, equity or foreign exchange, etc.), swap agreements involve, to varying degrees, elements of credit, market and documentation risk. Such risks involve the possibility that no liquid market for these agreements will exist, the counterparty to the agreement may default on its obligation to perform or disagree on the contractual terms of the agreement, and changes in net interest rates will be unfavorable. In connection with these agreements, securities in the portfolio may be identified or received as collateral from the counterparty in accordance with the terms of the respective swap agreements to provide or receive assets of value and to serve as recourse in the event of default or bankruptcy/insolvency of either party. Such OTC derivative agreements include conditions which, when materialized, give the counterparty the right to cause an early termination of the transactions under those agreements. Any election by the counterparty for early termination of the contract(s) may impact the amounts reported on financial statements.
As of October 31, 2019, the Fund has not met conditions under such agreements which give the counterparty the right to call for an early termination.
Forward currency contracts, forward rate agreements, written options, short sales, swaps and financial futures contracts involve elements of both market and credit risk in excess of the amounts reflected on the Statement of Assets and Liabilities. Such risks may be mitigated by engaging in master netting arrangements.
| PGIM Global Total Return (USD Hedged) Fund | 79 |
Notes to Financial Statements(continued)
Securities Transactions and Net Investment Income:Securities transactions are recorded on the trade date. Realized gains (losses) from investment and currency transactions are calculated on the specific identification method. Dividend income is recorded on theex-date, or for certain foreign securities, when the Fund becomes aware of such dividends. Expenses are recorded on an accrual basis, which may require the use of certain estimates by management that may differ from actual. Net investment income or loss (other than class specific expenses and waivers, which are allocated as noted below) and unrealized and realized gains (losses) are allocated daily to each class of shares based upon the relative proportion of adjusted net assets of each class at the beginning of the day. Class specific expenses and waivers, where applicable, are charged to the respective share classes. Class specific expenses include distribution fees and distribution fee waivers, shareholder servicing fees, transfer agent’s fees and expenses, registration fees and fee waivers and/or expense reimbursements, as applicable.
Taxes:It is the Fund’s policy to continue to meet the requirements of the Internal Revenue Code applicable to regulated investment companies and to distribute all of its taxable net investment income and capital gains, if any, to its shareholders. Therefore, no federal income tax provision is required. Withholding taxes on foreign dividends, interest and capital gains, if any, are recorded, net of reclaimable amounts, at the time the related income is earned.
Dividends and Distributions:The Fund expects to declare dividends of its net investment income daily and pay such dividends monthly. Distributions of net realized capital and currency gains, if any, are declared and paid at least annually. Dividends and distributions to shareholders, which are determined in accordance with federal income tax regulations and which may differ from generally accepted accounting principles, are recorded on theex-date. Permanent book/tax differences relating to income and gain (loss) are reclassified between total distributable earnings (loss) andpaid-in capital in excess of par, as appropriate.
Estimates:The preparation of financial statements requires management to make estimates and assumptions that affect the reported amounts and disclosures in the financial statements. Actual results could differ from those estimates.
2. Agreements
The Fund has a management agreement with the Manager. Pursuant to this agreement, the Manager has responsibility for all investment advisory services and supervises the subadviser’s performance of such services. In addition, under the management agreement, the Manager provides all of the administrative functions necessary for the organization, operation and management of the Fund. The Manager administers the corporate affairs of
| 80 |
the Fund and, in connection therewith, furnishes the Fund with office facilities, together with those ordinary clerical and bookkeeping services which are not being furnished by the Fund’s custodian and the Fund’s transfer agent. The Manager is also responsible for the staffing and management of dedicated groups of legal, marketing, compliance and related personnel necessary for the operation of the Fund. The legal, marketing, compliance and related personnel are also responsible for the management and oversight of the various service providers to the Fund, including, but not limited to, the custodian, transfer agent, and accounting agent.
The Manager has entered into a subadvisory agreement with PGIM, Inc., which provides subadvisory services to the Fund through its PGIM Fixed Income unit. The subadvisory agreement provides that furnish investment advisory services in connection with the management of the Fund. In connection therewith, is obligated to keep certain books and records of the Fund. The Manager pays the cost of compensation of officers of the Fund, occupancy and certain clerical and bookkeeping costs of the Fund. The Fund bears all other costs and expenses.
The management fee paid to the Manager is accrued daily and payable monthly at an annual rate of 0.50% of the Fund’s average daily net assets up to $2 billion and 0.485% of such assets in excess of $2 billion. The effective management fee rate before any waivers and/or expense reimbursements was 0.50% for the year ended October 31, 2019.
The Manager has contractually agreed, through February 28, 2021, to limit total annual operating expenses after fee waivers and/or expense reimbursements to 0.88% of average daily net assets for Class A shares, 1.63% of average daily net assets for Class C shares, 0.63% of average daily net assets for Class Z shares and 0.58% of average daily net assets for Class R6 shares. This contractual waiver excludes interest, brokerage, taxes (such as income and foreign withholding taxes, stamp duty and deferred tax expenses), acquired fund fees and expenses, extraordinary expenses, and certain other Fund expenses such as dividend and interest expense and broker charges on short sales. Where applicable, the Manager agrees to waive management fees or shared operating expenses on any share class to the same extent that it waives similar expenses on any other share class. In addition, total annual operating expenses for Class R6 shares will not exceed total annual operating expenses for Class Z shares. Fees and/or expenses waived and/or reimbursed by the Manager may be recouped by the Manager within the same fiscal year during which such waiver and/or reimbursement is made if such recoupment can be realized without exceeding the expense limit in effect at the time of the recoupment for that fiscal year.
The Company, on behalf of the Fund, has a distribution agreement with Prudential Investment Management Services LLC (“PIMS”), which acts as the distributor of the Class A, Class C, Class Z and Class R6 shares of the Fund. The Fund compensates PIMS for distributing and servicing the Fund’s Class A and Class C shares, pursuant to the plans of distribution (the “Distribution Plans”), regardless of expenses actually incurred by PIMS. The distribution fees are accrued daily and payable monthly. No distribution or service fees are paid to PIMS as distributor of the Class Z or Class R6 shares of the Fund.
| PGIM Global Total Return (USD Hedged) Fund | 81 |
Notes to Financial Statements(continued)
Pursuant to the Distribution Plans, the Fund compensates PIMS for distribution related activities at an annual rate of up to 0.25% and 1% of the average daily net assets of the Class A and Class C shares, respectively.
For the year ended October 31, 2019, PIMS received $71 infront-end sales charges resulting from sales of Class A shares. Additionally, for the year ended October 31, 2019, PIMS did not receive any contingent deferred sales charges imposed upon redemptions by certain Class A and Class C shareholders, respectively. From these fees, PIMS paid such sales charges to broker-dealers, who in turn paid commissions to salespersons and incurred other distribution costs.
PGIM Investments, PGIM, Inc. and PIMS are indirect, wholly-owned subsidiaries of Prudential Financial, Inc. (“Prudential”).
3. Other Transactions with Affiliates
Prudential Mutual Fund Services LLC (“PMFS”), an affiliate of PGIM Investments and an indirect, wholly-owned subsidiary of Prudential, serves as the Funds’ transfer agent. Transfer agent’s fees and expenses in the Statement of Operations include certainout-of-pocket expenses paid tonon-affiliates, where applicable.
The Fund may invest its overnight sweep cash in the PGIM Core Ultra Short Bond Fund (the “Core Fund”), and its securities lending cash collateral in the PGIM Institutional Money Market Fund (the “Money Market Fund”), each a series of Prudential Investment Portfolios 2, registered under the 1940 Act and managed by PGIM Investments. Through the Fund’s investments in the mentioned underlying funds, PGIM Investments and/or its affiliates are paid fees or reimbursed for providing their services. In addition to the realized and unrealized gains on investments in the Core Fund and Money Market Fund, earnings from such investments are disclosed on the Statement of Operations as “Affiliated dividend income” and “Income from securities lending, net”, respectively.
The Fund may enter into certain securities purchase or sale transactions under Board approved Rule17a-7 procedures. Rule17a-7 is an exemptive rule under the 1940 Act, that subject to certain conditions, permits purchase and sale transactions among affiliated investment companies, or between an investment company and a person that is affiliated solely by reason of having a common (or affiliated) investment adviser, common directors, and/or common officers. Pursuant to the Rule17a-7 procedures and consistent with guidance issued by the SEC, the Company’s Chief Compliance Officer (“CCO”) prepares a quarterly summary of all such transactions for submission to the Board, together with the CCO’s written representation that all such17a-7 transactions were effected in accordance with the Fund’s Rule17a-7 procedures. For the year ended October 31, 2019, no17a-7
| 82 |
transactions were entered into by the Fund.
4. Portfolio Securities
The aggregate cost of purchases and proceeds from sales of portfolio securities (excluding short-term investments and U.S. Government securities) for the year ended October 31, 2019, were $14,668,889 and $5,693,031, respectively.
A summary of the cost of purchases and proceeds from sales of shares of an affiliated investment for the year ended October 31, 2019, is presented as follows:
Value, | Cost of Purchases | Proceeds from Sales | Change in Unrealized Gain (Loss) | Realized Gain (Loss) | Value, End of Year | Shares, End of Year | Income | |||||||||||||||||||||||
PGIM Core Ultra Short Bond Fund* | ||||||||||||||||||||||||||||||
| $ | 527,951 | $ | 9,568,714 | $ | 9,343,792 | $ | — | $ | — | $ | 752,873 | 752,873 | $ | 17,602 | ||||||||||||||||
PGIM Institutional Money Market Fund* | ||||||||||||||||||||||||||||||
| — | 63,818 | 63,818 | — | 6 | 6 | 6 | — | |||||||||||||||||||||||
|
|
|
|
|
|
|
|
|
|
|
| |||||||||||||||||||
| $ | 527,951 | $ | 9,632,532 | $ | 9,407,610 | $ | — | $ | 6 | $ | 752,879 | $ | 17,602 | |||||||||||||||||
|
|
|
|
|
|
|
|
|
|
|
| |||||||||||||||||||
| * | The Fund did not have any capital gain distributions during the reporting period. |
5. Distributions and Tax Information
Distributions to shareholders, which are determined in accordance with federal income tax regulations and which may differ from generally accepted accounting principles, are recorded on theex-date.
For the year ended October 31, 2019, the tax character of dividends paid by the Fund was $1,620,888 of ordinary income. For the period ended October 31, 2018, the tax character of dividends paid by the Fund was $724,007 of ordinary income.
As of October 31, 2019, the accumulated undistributed earnings on a tax basis were $374,035 of ordinary income and $368,491 of long-term capital gains.
The United States federal income tax basis of the Fund’s investments and the net unrealized appreciation as of October 31, 2019 were as follows:
Tax Basis | Gross | Gross | Net | |||
| $33,799,377 | $2,892,095 | $(2,259,218) | $632,877 |
The differences between book basis and tax basis is primarily attributable to bond premium amortization, futures and forward contracts and other cost basis differences between financial and tax accounting.
| PGIM Global Total Return (USD Hedged) Fund | 83 |
Notes to Financial Statements(continued)
The Fund utilized approximately $534,000 of its capital loss carryforward to offset net taxable gains realized in the fiscal year ended October 31, 2019.
The Manager has analyzed the Fund’s tax positions taken on federal, state and local income tax returns for all open tax years and has concluded that no provision for income tax is required in the Fund’s financial statements for the current reporting period. Since tax authorities can examine previously filed tax returns, the Fund’s U.S. federal and state tax returns for each of the two fiscal years up to the most recent fiscal year ended October 31, 2019 are subject to such review.
6. Capital and Ownership
The Fund offers Class A, Class C, Class Z and Class R6 shares. Class A shares are sold with a maximumfront-end sales charge of 3.25%. Investors who purchase $1 million or more (prior to July 15, 2019, $500,000 or more on or after July 15, 2019) of Class A shares and sell those shares within 12 months of purchase are subject to a contingent deferred sales charge (“CDSC”) of 1.00% on sales although these purchases are not subject to afront-end sales charge. The Class A CDSC is waived for certain retirement and/or benefit plans. A special exchange privilege is also available for shareholders who qualified to purchase Class A shares at net asset value. Class C shares are sold with a CDSC of 1% on sales made within 12 months of purchase. Class C shares will automatically convert to Class A shares on a monthly basis approximately 10 years after purchase. Class Z and Class R6 shares are not subject to any sales or redemption charge and are available exclusively for sale to a limited group of investors.
Under certain circumstances, an exchange may be made from specified share classes of the Fund to one or more other share classes of the Fund as presented in the table of transactions in shares of common stock.
There are 1.5 billion shares of common stock, at $0.01 par value per share, authorized and divided into four classes, designated Class A, Class C, Class Z and Class R6, each of which consists of 200 million, 300 million, 600 million and 400 million authorized shares, respectively.
As of October 31, 2019, Prudential, through its affiliated entities, including affiliated funds (if applicable), owned 1,088 Class A shares, 1,073 Class C shares, 1,093 Class Z shares, and 2,736,160 Class R6 shares of the Fund. At reporting period end, three shareholders of record, each holding greater than 5% of the Fund, held 93% of the Fund’s outstanding shares.
| 84 |
Transactions in shares of common stock were as follows:
Class A | Shares | Amount | ||||||
Year ended October 31, 2019: | ||||||||
Shares sold | 198,368 | $ | 2,050,700 | |||||
Shares issued in reinvestment of dividends and distributions | 861 | 8,667 | ||||||
Shares reacquired | (9,234 | ) | (95,566 | ) | ||||
|
|
|
| |||||
Net increase (decrease) in shares outstanding | 189,995 | $ | 1,963,801 | |||||
|
|
|
| |||||
Period ended October 31, 2018*: | ||||||||
Shares sold | 5,077 | $ | 50,519 | |||||
Shares issued in reinvestment of dividends and distributions | 129 | 1,248 | ||||||
|
|
|
| |||||
Net increase (decrease) in shares outstanding | 5,206 | $ | 51,767 | |||||
|
|
|
| |||||
Class C | ||||||||
Year ended October 31, 2019: | ||||||||
Shares sold | 2,406 | $ | 25,000 | |||||
Shares issued in reinvestment of dividends and distributions | 88 | 847 | ||||||
Shares reacquired | (545 | ) | (5,330 | ) | ||||
|
|
|
| |||||
Net increase (decrease) in shares outstanding | 1,949 | $ | 20,517 | |||||
|
|
|
| |||||
Period ended October 31, 2018*: | ||||||||
Shares sold | 1,782 | $ | 17,520 | |||||
Shares issued in reinvestment of dividends and distributions | 27 | 258 | ||||||
|
|
|
| |||||
Net increase (decrease) in shares outstanding | 1,809 | $ | 17,778 | |||||
|
|
|
| |||||
Class Z | ||||||||
Year ended October 31, 2019: | ||||||||
Shares sold | 367,191 | $ | 3,745,707 | |||||
Shares issued in reinvestment of dividends and distributions | 4,430 | 45,240 | ||||||
Shares reacquired | (19,561 | ) | (203,597 | ) | ||||
|
|
|
| |||||
Net increase (decrease) in shares outstanding | 352,060 | $ | 3,587,350 | |||||
|
|
|
| |||||
Period ended October 31, 2018*: | ||||||||
Shares sold | 16,841 | $ | 168,445 | |||||
Shares issued in reinvestment of dividends and distributions | 481 | 4,661 | ||||||
|
|
|
| |||||
Net increase (decrease) in shares outstanding | 17,322 | $ | 173,106 | |||||
|
|
|
| |||||
Class R6 | ||||||||
Year ended October 31, 2019: | ||||||||
Shares sold | 1,336 | $ | 14,000 | |||||
Shares issued in reinvestment of dividends and distributions | 161,224 | 1,566,074 | ||||||
|
|
|
| |||||
Net increase (decrease) in shares outstanding | 162,560 | $ | 1,580,074 | |||||
|
|
|
| |||||
Period ended October 31, 2018*: | ||||||||
Shares sold | 2,501,000 | $ | 25,009,996 | |||||
Shares issued in reinvestment of dividends and distributions | 73,939 | 717,845 | ||||||
|
|
|
| |||||
Net increase (decrease) in shares outstanding | 2,574,939 | $ | 25,727,841 | |||||
|
|
|
| |||||
| * | Commencement of operations was December 12, 2017. |
7. Borrowings
The Company, on behalf of the Fund, along with other affiliated registered investment companies (the “Funds”), is a party to a Syndicated Credit Agreement (“SCA”) with a group of banks. The purpose of the SCA is to provide an alternative source of temporary funding
| PGIM Global Total Return (USD Hedged) Fund | 85 |
Notes to Financial Statements(continued)
for capital share redemptions. The table below provides details of the current SCA in effect at the reportingperiod-end as well as the prior SCA.
| Current SCA | Prior SCA | |||
Term of Commitment | 10/3/2019 – 10/1/2020 | 10/4/2018 – 10/2/2019 | ||
Total Commitment | $ 900 million | $ 900 million | ||
Annualized Commitment Fee on the Unused Portion of the SCA | 0.15% | 0.15% | ||
Annualized Interest Rate on Borrowings | 1.20% plus the higher of (1) the effective federal funds rate, (2) theone-month LIBOR rate or (3) zero percent | 1.25% plus the higher of (1) the effective federal funds rate, (2) theone-month LIBOR rate or (3) zero percent |
Certain affiliated registered investment companies that are parties to the SCA include portfolios that are subject to a predetermined mathematical formula used to manage certain benefit guarantees offered under variable annuity contracts. The formula may result in large scale asset flows into and out of these portfolios. Consequently, these portfolios may be more likely to utilize the SCA for purposes of funding redemptions. It may be possible for those portfolios to fully exhaust the committed amount of the SCA, thereby requiring the Manager to allocate available funding per a Board-approved methodology designed to treat the Funds in the SCA equitably.
The Fund did not utilize the SCA during the year ended October 31, 2019.
8. Risks of Investing in the Fund
The Fund’s risks include, but are not limited to, some or all of the risks discussed below:
Bond Obligations Risk:The Fund’s holdings, share price, yield and total return may fluctuate in response to bond market movements. The value of bonds may decline for issuer-related reasons, including management performance, financial leverage and reduced demand for the issuer’s goods and services. Certain types of fixed-income obligations also may be subject to “call and redemption risk,” which is the risk that the issuer may call a bond held by the Fund for redemption before it matures and the Fund may not be able to reinvest at the same level and therefore would earn less income.
Derivatives Risk:Derivatives involve special risks and costs and may result in losses to the Fund. The successful use of derivatives requires sophisticated management, and, to the extent that derivatives are used, the Fund will depend on the subadviser’s ability to analyze and manage derivative transactions. The prices of derivatives may move in unexpected ways, especially in abnormal market conditions. Some derivatives are “leveraged” and therefore may magnify or otherwise increase investment losses to the Fund. Other risks arise from the potential inability to terminate or sell derivatives positions. A liquid secondary
| 86 |
market may not always exist for the Fund’s derivatives positions. In fact, many OTC derivative instruments will not have liquidity beyond the counterparty to the instrument. OTC derivative instruments also involve the risk that the other party will not meet its obligations to the Fund.
Emerging Markets Risk:The risks of foreign investments are greater for investments in or exposed to emerging markets. Emerging market countries typically have economic and political systems that are less fully developed, and can be expected to be less stable, than those of more developed countries. For example, the economies of such countries can be subject to rapid and unpredictable rates of inflation or deflation. Low trading volumes may result in a lack of liquidity and price volatility.
Foreign Securities Risk:The Fund’s investments in securities of foreign issuers or issuers with significant exposure to foreign markets involve additional risk. Foreign countries in which the Fund may invest may have markets that are less liquid, less regulated and more volatile than US markets. The value of the Fund’s investments may decline because of factors affecting the particular issuer as well as foreign markets and issuers generally, such as unfavorable government actions, and political or financial instability.
Interest Rate Risk:The value of an investment may go down when interest rates rise. A rise in rates tends to have a greater impact on the prices of longer term or duration securities. When interest rates fall, the issuers of debt obligations may prepay principal more quickly than expected, and the Fund may be required to reinvest the proceeds at a lower interest rate. This is referred to as “prepayment risk.” When interest rates rise, debt obligations may be repaid more slowly than expected, and the value of the Fund’s holdings may fall sharply. This is referred to as “extension risk. The Fund may face a heightened level of interest rate risk as a result of the U.S. Federal Reserve Board’s policies. The Fund’s investments may lose value if short-term or long-term interest rates rise sharply or in a manner not anticipated by the subadviser.
Liquidity Risk:The Fund may invest in instruments that trade in lower volumes and are less liquid than other investments. Liquidity risk exists when particular investments made by the Fund are difficult to purchase or sell. Liquidity risk includes the risk that the Fund may make investments that may become less liquid in response to market developments or adverse investor perceptions. Investments that are illiquid or that trade in lower volumes may be more difficult to value. If the Fund is forced to sell these investments to pay redemption proceeds or for other reasons, the Fund may lose money. In addition, when there is no willing buyer and investments may not reasonably be expected to be sold or disposed of in current market conditions in seven calendar days or less without the sale or disposition significantly changing the market value of the investment, the Fund may incur higher transaction costs when executing trade orders of a given size. The reduction in dealer market-making capacity in the fixed-income markets that has occurred in recent years also has the potential to reduce liquidity. An inability to sell a portfolio position can adversely affect the Fund’s value or prevent the Fund from being able to take advantage of other investment opportunities.
| PGIM Global Total Return (USD Hedged) Fund | 87 |
Notes to Financial Statements(continued)
Market and Credit Risk:Securities markets may be volatile and the market prices of the Fund’s securities may decline. Securities fluctuate in price based on changes in an issuer’s financial condition and overall market and economic conditions. If the market prices of the securities owned by the Fund fall, the value of an investment in the Fund will decline. Additionally, the Fund may also be exposed to credit risk in the event that an issuer or guarantor fails to perform or that an institution or entity with which the Fund has unsettled or open transactions defaults.
Non-diversification Risk:Anon-diversified Fund may invest a greater percentage of its assets in the securities of a single company or industry than a diversified fund. Investing in anon-diversified fund involves greater risk than investing in a diversified fund because a loss resulting from the decline in value of any one security may represent a greater portion of the total assets of anon-diversified fund.
9. Recent Accounting Pronouncements and Reporting Updates
In August 2018, the FASB issued Accounting Standards Update (“ASU”)No. 2018-13, which changes certain fair value measurement disclosure requirements. The new ASU, in addition to other modifications and additions, removes the requirement to disclose the amount and reasons for transfers between Level 1 and Level 2 of the fair value hierarchy, and the Fund’s policy for the timing of transfers between levels. The amendments are effective for financial statements issued for fiscal years beginning after December 15, 2019, and interim periods within those fiscal years. The Manager has evaluated the implications of certain provisions of the ASU and has determined to early adopt aspects related to the removal and modification of certain fair value measurement disclosures under the ASU effective immediately. The Manager continues to evaluate certain other provisions of the ASU and does not expect a material impact to financial statement disclosures.
| 88 |
Financial Highlights
| Class A Shares | ||||||||||||
| Year Ended October 31, 2019 | December 12, 2017(a) through October 31, 2018 | |||||||||||
| Per Share Operating Performance(b): | ||||||||||||
| Net Asset Value, Beginning of Period | $9.48 | $10.00 | ||||||||||
| Income (loss) from investment operations: | ||||||||||||
| Net investment income (loss) | 0.18 | 0.16 | ||||||||||
| Net realized and unrealized gain (loss) on investment and foreign currency transactions | 1.33 | (0.42 | ) | |||||||||
| Total from investment operations | 1.51 | (0.26 | ) | |||||||||
| Less Dividends and Distributions: | ||||||||||||
| Dividends from net investment income | (0.56 | ) | (0.26 | ) | ||||||||
| Net asset value, end of period | $10.43 | $9.48 | ||||||||||
| Total Return(c): | 16.40% | (2.65)% | ||||||||||
| Ratios/Supplemental Data: | ||||||||||||
| Net assets, end of period (000) | $2,036 | $49 | ||||||||||
| Average net assets (000) | $234 | $46 | ||||||||||
| Ratios to average net assets(d): | ||||||||||||
| Expenses after waivers and/or expense reimbursement | 0.88% | 0.88% | (e) | |||||||||
| Expenses before waivers and/or expense reimbursement | 8.27% | 80.88% | (e) | |||||||||
| Net investment income (loss) | 1.69% | 1.86% | (e) | |||||||||
| Portfolio turnover rate(f) | 31% | 67% | ||||||||||
| (a) | Commencement of operations. |
| (b) | Calculated based on average shares outstanding during the period. |
| (c) | Total return does not consider the effects of sales loads. Total return is calculated assuming a purchase of a share on the first day and a sale on the last day of each period reported and includes reinvestment of dividends and distributions, if any. Total returns may reflect adjustments to conform to generally accepted accounting principles. Total returns for periods less than one full year are not annualized. |
| (d) | Does not include expenses of the underlying funds in which the Fund invests. |
| (e) | Annualized. |
| (f) | The Fund’s portfolio turnover rate is calculated in accordance with regulatory requirements, without regard to transactions involving short-term investments and certain derivatives. If such transactions were included, the Fund’s portfolio turnover rate may be higher. |
See Notes to Financial Statements.
| PGIM Global Total Return (USD Hedged) Fund | 89 |
Financial Highlights(continued)
| Class C Shares | ||||||||||||
| Year Ended October 31, 2019 | December 12, 2017(a) through October 31, 2018 | |||||||||||
| Per Share Operating Performance(b): | ||||||||||||
| Net Asset Value, Beginning of Period | $9.48 | $10.00 | ||||||||||
| Income (loss) from investment operations: | ||||||||||||
| Net investment income (loss) | 0.17 | 0.10 | ||||||||||
| Net realized and unrealized gain (loss) on investment and foreign currency transactions | 1.27 | (0.43 | ) | |||||||||
| Total from investment operations | 1.44 | (0.33 | ) | |||||||||
| Less Dividends and Distributions: | ||||||||||||
| Dividends from net investment income | (0.49 | ) | (0.19 | ) | ||||||||
| Net asset value, end of period | $10.43 | $9.48 | ||||||||||
| Total Return(c): | 15.59% | (3.29)% | ||||||||||
| Ratios/Supplemental Data: | ||||||||||||
| Net assets, end of period (000) | $39 | $17 | ||||||||||
| Average net assets (000) | $16 | $13 | ||||||||||
| Ratios to average net assets(d): | ||||||||||||
| Expenses after waivers and/or expense reimbursement | 1.63% | 1.63% | (e) | |||||||||
| Expenses before waivers and/or expense reimbursement | 97.66% | 290.47% | (e) | |||||||||
| Net investment income (loss) | 1.70% | 1.13% | (e) | |||||||||
| Portfolio turnover rate(f) | 31% | 67% | ||||||||||
| (a) | Commencement of operations. |
| (b) | Calculated based on average shares outstanding during the period. |
| (c) | Total return does not consider the effects of sales loads. Total return is calculated assuming a purchase of a share on the first day and a sale on the last day of each period reported and includes reinvestment of dividends and distributions, if any. Total returns may reflect adjustments to conform to generally accepted accounting principles. Total returns for periods less than one full year are not annualized. |
| (d) | Does not include expenses of the underlying funds in which the Fund invests. |
| (e) | Annualized. |
| (f) | The Fund’s portfolio turnover rate is calculated in accordance with regulatory requirements, without regard to transactions involving short-term investments and certain derivatives. If such transactions were included, the Fund’s portfolio turnover rate may be higher. |
See Notes to Financial Statements.
| 90 |
| Class Z Shares | ||||||||||||
| Year Ended October 31, 2019 | December 12, 2017(a) through October 31, 2018 | |||||||||||
| Per Share Operating Performance(b): | ||||||||||||
| Net Asset Value, Beginning of Period | $9.48 | $10.00 | ||||||||||
| Income (loss) from investment operations: | ||||||||||||
| Net investment income (loss) | 0.18 | 0.18 | ||||||||||
| Net realized and unrealized gain (loss) on investment and foreign currency transactions | 1.36 | (0.42 | ) | |||||||||
| Total from investment operations | 1.54 | (0.24 | ) | |||||||||
| Less Dividends and Distributions: | ||||||||||||
| Dividends from net investment income | (0.59 | ) | (0.28 | ) | ||||||||
| Net asset value, end of period | $10.43 | $9.48 | ||||||||||
| Total Return(c): | 16.71% | (2.44)% | ||||||||||
| Ratios/Supplemental Data: | ||||||||||||
| Net assets, end of period (000) | $3,854 | $164 | ||||||||||
| Average net assets (000) | $1,214 | $160 | ||||||||||
| Ratios to average net assets(d): | ||||||||||||
| Expenses after waivers and/or expense reimbursement | 0.63% | 0.63% | (e) | |||||||||
| Expenses before waivers and/or expense reimbursement | 3.11% | 24.70% | (e) | |||||||||
| Net investment income (loss) | 1.72% | 2.11% | (e) | |||||||||
| Portfolio turnover rate(f) | 31% | 67% | ||||||||||
| (a) | Commencement of operations. |
| (b) | Calculated based on average shares outstanding during the period. |
| (c) | Total return is calculated assuming a purchase of a share on the first day and a sale on the last day of each period reported and includes reinvestment of dividends and distributions, if any. Total returns may reflect adjustments to conform to generally accepted accounting principles. Total returns for periods less than one full year are not annualized. |
| (d) | Does not include expenses of the underlying funds in which the Fund invests. |
| (e) | Annualized. |
| (f) | The Fund’s portfolio turnover rate is calculated in accordance with regulatory requirements, without regard to transactions involving short-term investments and certain derivatives. If such transactions were included, the Fund’s portfolio turnover rate may be higher. |
See Notes to Financial Statements.
| PGIM Global Total Return (USD Hedged) Fund | 91 |
Financial Highlights(continued)
| Class R6 Shares | ||||||||||||
| Year Ended October 31, 2019 | December 12, 2017(a) through October 31, 2018 | |||||||||||
| Per Share Operating Performance(b): | ||||||||||||
| Net Asset Value, Beginning of Period | $9.48 | $10.00 | ||||||||||
| Income (loss) from investment operations: | ||||||||||||
| Net investment income (loss) | 0.26 | 0.18 | ||||||||||
| Net realized and unrealized gain (loss) on investment and foreign currency transactions | 1.28 | (0.42 | ) | |||||||||
| Total from investment operations | 1.54 | (0.24 | ) | |||||||||
| Less Dividends and Distributions: | ||||||||||||
| Dividends from net investment income | (0.59 | ) | (0.28 | ) | ||||||||
| Net asset value, end of period | $10.43 | $9.48 | ||||||||||
| Total Return(c): | 16.79% | (2.40)% | ||||||||||
| Ratios/Supplemental Data: | ||||||||||||
| Net assets, end of period (000) | $28,565 | $24,421 | ||||||||||
| Average net assets (000) | $26,482 | $24,571 | ||||||||||
| Ratios to average net assets(d): | ||||||||||||
| Expenses after waivers and/or expense reimbursement | 0.58% | 0.58% | (e) | |||||||||
| Expenses before waivers and/or expense reimbursement | 1.49% | 1.67% | (e) | |||||||||
| Net investment income (loss) | 2.66% | 2.14% | (e) | |||||||||
| Portfolio turnover rate(f) | 31% | 67% | ||||||||||
| (a) | Commencement of operations. |
| (b) | Calculated based on average shares outstanding during the period. |
| (c) | Total return is calculated assuming a purchase of a share on the first day and a sale on the last day of each period reported and includes reinvestment of dividends and distributions, if any. Total returns may reflect adjustments to conform to generally accepted accounting principles. Total returns for periods less than one full year are not annualized. |
| (d) | Does not include expenses of the underlying funds in which the Fund invests. |
| (e) | Annualized. |
| (f) | The Fund’s portfolio turnover rate is calculated in accordance with regulatory requirements, without regard to transactions involving short-term investments and certain derivatives. If such transactions were included, the Fund’s portfolio turnover rate may be higher. |
See Notes to Financial Statements.
| 92 |
Report of Independent Registered Public
Accounting Firm
To the Shareholders of PGIM Global Total Return (USD Hedged) Fund and Board of Directors Prudential Global Total Return Fund, Inc.:
Opinion on the Financial Statements
We have audited the accompanying statement of assets and liabilities of PGIM Global Total Return (USD Hedged) Fund, a series of Prudential Global Total Return Fund, Inc., (the Fund), including the schedule of investments, as of October 31, 2019, the related statement of operations for the year then ended, the statements of changes in net assets for the year ended October 31, 2019 and the period from December 12, 2017 (commencement of operations) to October 31, 2018, and the related notes (collectively, the financial statements) and the financial highlights for the year or period indicated therein. In our opinion, the financial statements and financial highlights present fairly, in all material respects, the financial position of the Fund as of October 31, 2019, the results of its operations for the year then ended, the changes in its net assets for the year ended October 31, 2019 and the period from December 12, 2017 (commencement of operations) to October 31, 2018, and the financial highlights for the year or period indicated therein, in conformity with U.S. generally accepted accounting principles.
Basis for Opinion
These financial statements and financial highlights are the responsibility of the Fund’s management. Our responsibility is to express an opinion on these financial statements and financial highlights based on our audits. We are a public accounting firm registered with the Public Company Accounting Oversight Board (United States) (PCAOB) and are required to be independent with respect to the Fund in accordance with the U.S. federal securities laws and the applicable rules and regulations of the Securities and Exchange Commission and the PCAOB.
We conducted our audits in accordance with the standards of the PCAOB. Those standards require that we plan and perform the audit to obtain reasonable assurance about whether the financial statements and financial highlights are free of material misstatement, whether due to error or fraud. Our audits included performing procedures to assess the risks of material misstatement of the financial statements and financial highlights, whether due to error or fraud, and performing procedures that respond to those risks. Such procedures included examining, on a test basis, evidence regarding the amounts and disclosures in the financial statements and financial highlights. Such procedures also included confirmation of securities owned as of October 31, 2019, by correspondence with the custodian, transfer agent, and brokers, or by other appropriate auditing procedures when replies were not received. Our audits also included evaluating the accounting principles used and significant estimates made by management, as well as evaluating the overall presentation of the financial statements and financial highlights. We believe that our audits provide a reasonable basis for our opinion.

We have served as the auditor of one or more PGIM and/or Prudential Retail investment companies since 2003.
New York, New York
December 19, 2019
| PGIM Global Total Return (USD Hedged) Fund | 93 |
Federal Income Tax Information(unaudited)
For the year ended October 31, 2019, the Fund reports the maximum amount allowable but not less than 21.43% as interest related dividends in accordance with Sections 871(k)(1) and 881(e)(1) of the Internal Revenue Code.
In January 2020, you will be advised on IRS Form1099-DIV or substitute1099-DIV as to the federal tax status of distributions received by you in calendar year 2019.
| 94 |
INFORMATION ABOUT BOARD MEMBERS AND OFFICERS(unaudited)
Information about Board Members and Officers of the Fund is set forth below. Board Members who are not deemed to be “interested persons” of the Fund, as defined in the 1940 Act, are referred to as “Independent Board Members.” Board Members who are deemed to be “interested persons” of the Fund are referred to as “Interested Board Members.” The Board Members are responsible for the overall supervision of the operations of the Fund and perform the various duties imposed on the directors of investment companies by the 1940 Act. The Board in turn elects the Officers, who are responsible for administering theday-to-day operations of the Fund.
| Independent Board Members | ||||||
Name Date of Birth Position(s) Portfolios Overseen | Principal Occupation(s) During Past Five Years | Other Directorships Held During Past Five Years | Length of Board Service | |||
Ellen S. Alberding 3/11/58 Board Member Portfolios Overseen: 96 | President and Board Member, The Joyce Foundation (charitable foundation) (since 2002); Vice Chair, City Colleges of Chicago (community college system) (2011-2015); Trustee, National Park Foundation (charitable foundation for national park system) (2009-2018); Trustee, Economic Club of Chicago (since 2009); Trustee, Loyola University (since 2018). | None. | Since September 2013 | |||
Kevin J. Bannon 7/13/52 Board Member Portfolios Overseen: 96 | Retired; Managing Director (April2008-May 2015) and Chief Investment Officer (October 2008-November 2013) of Highmount Capital LLC (registered investment adviser); formerly Executive Vice President and Chief Investment Officer (April 1993-August 2007) of Bank of New York Company; President (May2003-May 2007) of BNY Hamilton Family of Mutual Funds. | Director of Urstadt Biddle Properties (equity real estate investment trust) (since September 2008). | Since July 2008 | |||
PGIM Global Total Return (USD Hedged) Fund
| Independent Board Members | ||||||
Name Date of Birth Position(s) Portfolios Overseen | Principal Occupation(s) During Past Five Years | Other Directorships Held During Past Five Years | Length of Board Service | |||
Linda W. Bynoe 7/9/52 Board Member Portfolios Overseen: 96 | President and Chief Executive Officer (since March 1995) and formerly Chief Operating Officer (December 1989-February 1995) of Telemat Ltd. (management consulting); formerly Vice President (January 1985-June 1989) at Morgan Stanley & Co. (broker-dealer). | Director of Anixter International, Inc. (communication products distributor) (since January 2006); Director of Northern Trust Corporation (financial services) (since April 2006); Trustee of Equity Residential (residential real estate) (since December 2009). | Since March 2005 | |||
Barry H. Evans 11/2/60 Board Member Portfolios Overseen: 95 | Retired; formerly President (2005 – 2016), Global Chief Operating Officer (2014– 2016), Chief Investment Officer – Global Head of Fixed Income (1998-2014), and various portfolio manager roles (1986-2006), Manulife Asset Management U.S. | Formerly Director, Manulife Trust Company (2011-2018); formerly Director, Manulife Asset Management Limited (2015-2017); formerly Chairman of the Board of Directors of Manulife Asset Management U.S. (2005-2016); formerly Chairman of the Board, Declaration Investment Management and Research (2008-2016). | Since September 2017 | |||
Keith F. Hartstein 10/13/56 Board Member & Independent Chair Portfolios Overseen: 96 | Retired; Member (since November 2014) of the Governing Council of the Independent Directors Council (organization of independent mutual fund directors); formerly President and Chief Executive Officer (2005-2012), Senior Vice President (2004-2005), Senior Vice President of Sales and Marketing (1997-2004), and various executive management positions (1990-1997), John Hancock Funds, LLC (asset management); Chairman, Investment Company Institute’s Sales Force Marketing Committee (2003-2008). | None. | Since September 2013 | |||
Visit our website at pgiminvestments.com
| Independent Board Members | ||||||
Name Date of Birth Position(s) Portfolios Overseen | Principal Occupation(s) During Past Five Years | Other Directorships Held During Past Five Years | Length of Board Service | |||
Laurie Simon Hodrick 9/29/62 Board Member Portfolios Overseen: 95 | A. Barton Hepburn Professor Emerita of Economics in the Faculty of Business, Columbia Business School (since 2018); Visiting Professor of Law, Stanford Law School (since 2015); Visiting Fellow at the Hoover Institution, Stanford University (since 2015); Sole Member, ReidCourt LLC (since 2008) (a consulting firm); formerly A. Barton Hepburn Professor of Economics in the Faculty of Business, Columbia Business School (1996-2017); formerly Managing Director, Global Head of Alternative Investment Strategies, Deutsche Bank (2006-2008). | Independent Director, Synnex Corporation (since April 2019) (information technology); Independent Director, Kabbage, Inc. (since July 2018) (financial services); Independent Director, Corporate Capital Trust (2017-2018) (a business development company). | Since September 2017 | |||
Michael S. Hyland, CFA 10/4/45 Board Member Portfolios Overseen: 96 | Retired (since February 2005); formerly Senior Managing Director (July 2001-February 2005) of Bear Stearns & Co, Inc.; Global Partner, INVESCO (1999-2001); Managing Director and President of Salomon Brothers Asset Management (1989-1999). | None. | Since July 2008 | |||
Brian K. Reid 9/22/61 Board Member Portfolios Overseen: 95 | Retired; formerly Chief Economist for the Investment Company Institute (ICI) (2005-2017); formerly Senior Economist and Director of Industry and Financial Analysis at the ICI (1998-2004); formerly Senior Economist, Industry and Financial Analysis at the ICI (1996-1998); formerly Staff Economist at the Federal Reserve Board (1989-1996); Director, ICI Mutual Insurance Company (2012-2017). | None. | Since March 2018 | |||
PGIM Global Total Return (USD Hedged) Fund
| Independent Board Members | ||||||
Name Date of Birth Position(s) Portfolios Overseen | Principal Occupation(s) During Past Five Years | Other Directorships Held During Past Five Years | Length of Board Service | |||
Grace C. Torres 6/28/59 Board Member Portfolios Overseen: 95 | Retired; formerly Treasurer and Principal Financial and Accounting Officer of the PGIM Funds, Target Funds, Advanced Series Trust, Prudential Variable Contract Accounts and The Prudential Series Fund (1998-June 2014); Assistant Treasurer (March 1999-June 2014) and Senior Vice President (September 1999-June 2014) of PGIM Investments LLC; Assistant Treasurer (May 2003-June 2014) and Vice President (June 2005-June 2014) of AST Investment Services, Inc.; Senior Vice President and Assistant Treasurer (May 2003-June 2014) of Prudential Annuities Advisory Services, Inc. | Formerly Director (July 2015-January 2018) of Sun Bancorp, Inc. N.A. and Sun National Bank; Director (since January 2018) of OceanFirst Financial Corp. and OceanFirst Bank. | Since November 2014 | |||
Interested Board Members | ||||||
Name Date of Birth Position(s) Portfolios Overseen | Principal Occupation(s) During Past Five Years | Other Directorships Held During Past Five Years | Length of Board Service | |||
Stuart S. Parker 10/5/62 Board Member & President Portfolios Overseen: 96 | President of PGIM Investments LLC (formerly known as Prudential Investments LLC) (since January 2012); Executive Vice President of Prudential Investment Management Services LLC (since December 2012); formerly Executive Vice President of Jennison Associates LLC and Head of Retail Distribution of PGIM Investments LLC (June 2005-December 2011). | None. | Since January 2012 | |||
Visit our website at pgiminvestments.com
Interested Board Members | ||||||
Name Date of Birth Position(s) Portfolios Overseen | Principal Occupation(s) During Past Five Years | Other Directorships Held During Past Five Years | Length of Board Service | |||
Scott E. Benjamin 5/21/73 Board Member & Vice President Portfolios Overseen:96 | Executive Vice President (since June 2009) of PGIM Investments LLC; Executive Vice President (June 2009-June 2012) and Vice President (since June 2012) of Prudential Investment Management Services LLC; Executive Vice President (since September 2009) of AST Investment Services, Inc.; Senior Vice President of Product Development and Marketing, PGIM Investments (since February 2006); formerly Vice President of Product Development and Product Management, PGIM Investments LLC (2003-2006). | None. | Since March 2010 | |||
| Fund Officers(a) | ||||
Name Date of Birth Fund Position | Principal Occupation(s) During Past Five Years | Length of Service as Fund Officer | ||
Raymond A. O’Hara 9/11/55 Chief Legal Officer | Vice President and Corporate Counsel (since July 2010) of Prudential Insurance Company of America (Prudential); Vice President (March 2011-Present) of Pruco Life Insurance Company and Pruco Life Insurance Company of New Jersey; Vice President and Corporate Counsel (March 2011-Present) of Prudential Annuities Life Assurance Corporation; Chief Legal Officer of PGIM Investments LLC (since June 2012); Chief Legal Officer of Prudential Mutual Fund Services LLC (since June 2012) and Corporate Counsel of AST Investment Services, Inc. (since June 2012); formerly Assistant Vice President and Corporate Counsel (September 2008-July 2010) of The Hartford Financial Services Group, Inc.; formerly Associate (September 1980-December 1987) and Partner (January 1988–August 2008) of Blazzard & Hasenauer, P.C. (formerly, Blazzard, Grodd & Hasenauer, P.C.). | Since June 2012 | ||
PGIM Global Total Return (USD Hedged) Fund
| Fund Officers(a) | ||||
Name Date of Birth Fund Position | Principal Occupation(s) During Past Five Years | Length of Service as Fund Officer | ||
Dino Capasso 8/19/74 Chief Compliance Officer | Chief Compliance Officer (July 2019-Present) of PGIM Investments LLC; Chief Compliance Officer (July 2019-Present) of the PGIM Funds, Target Funds, Advanced Series Trust, The Prudential Series Fund, Prudential’s Gibraltar Fund, Inc., PGIM Global High Yield Fund, Inc., and PGIM High Yield Bond Fund, Inc.; Vice President and Deputy Chief Compliance Officer (June 2017-2019) of PGIM Investments LLC; formerly, Senior Vice President and Senior Counsel (January 2016-June 2017), and Vice President and Counsel (February 2012-December 2015) of Pacific Investment Management Company LLC. | Since March 2018 | ||
Andrew R. French 12/22/62 Secretary | Vice President of PGIM Investments LLC (December 2018-Present); formerly Vice President and Corporate Counsel (February 2010-December 2018) of Prudential; formerly Director and Corporate Counsel (2006-2010) of Prudential; Vice President and Assistant Secretary (since January 2007) of PGIM Investments LLC; Vice President and Assistant Secretary (since January 2007) of Prudential Mutual Fund Services LLC. | Since October 2006 | ||
Jonathan D. Shain 8/9/58 Assistant Secretary | Vice President and Corporate Counsel (since August 1998) of Prudential; Vice President and Assistant Secretary (since May 2001) of PGIM Investments LLC; Vice President and Assistant Secretary (since February 2001) of Prudential Mutual Fund Services LLC; formerly Vice President and Assistant Secretary (May 2003-June 2005) of AST Investment Services, Inc. | Since May 2005 | ||
Claudia DiGiacomo 10/14/74 Assistant Secretary | Vice President and Corporate Counsel (since January 2005) of Prudential; Vice President and Assistant Secretary of PGIM Investments LLC (since December 2005); formerly Associate at Sidley Austin Brown & Wood LLP (1999-2004). | Since December 2005 | ||
Diana N. Huffman 4/14/82 Assistant Secretary | Vice President and Corporate Counsel (since September 2015) of Prudential; formerly Associate at Willkie Farr & Gallagher LLP (2009-2015). | Since March 2019 | ||
Kelly A. Coyne 8/8/68 Assistant Secretary | Director, Investment Operations of Prudential Mutual Fund Services LLC (since 2010). | Since March 2015 | ||
Christian J. Kelly 5/5/75 Treasurer and Principal Financial and Accounting Officer | Vice President, Head of Fund Administration of PGIM Investments LLC (since November 2018); formerly, Director of Fund Administration of Lord Abbett & Co. LLC (2009-2018), Treasurer and Principal Accounting Officer of the Lord Abbett Family of Funds (2017-2018); Director of Accounting, Avenue Capital Group (2008-2009); Senior Manager, Investment Management Practice of Deloitte & Touche LLP (1998-2007). | Since January 2019 | ||
Visit our website at pgiminvestments.com
| Fund Officers(a) | ||||
Name Date of Birth Fund Position | Principal Occupation(s) During Past Five Years | Length of Service as Fund Officer | ||
Lana Lomuti 6/7/67 Assistant Treasurer | Vice President (since 2007) and Director (2005-2007), within PGIM Investments Fund Administration; formerly Assistant Treasurer (December 2007-February 2014) of The Greater China Fund, Inc. | Since April 2014 | ||
Russ Shupak 10/08/73 Assistant Treasurer | Vice President (since 2017) and Director (2013-2017), within PGIM Investments Fund Administration. | Since October 2019 | ||
Deborah Conway 3/26/69 Assistant Treasurer | Vice President (since 2017) and Director (2007-2017), within PGIM Investments Fund Administration. | Since October 2019 | ||
Elyse M. McLaughlin 1/20/74 Assistant Treasurer | Vice President (since 2017) and Director (2011-2017), within PGIM Investments Fund Administration. | Since October 2019 | ||
Charles H. Smith 1/11/73 Anti-Money Laundering Compliance Officer | Vice President, Corporate Compliance, Anti-Money Laundering Unit (since January 2015) of Prudential; committee member of the American Council of Life Insurers Anti-Money Laundering and Critical Infrastructure Committee (since January 2016); formerly Global Head of Economic Sanctions Compliance at AIG Property Casualty (February 2007-December 2014); Assistant Attorney General at the New York State Attorney General’s Office, Division of Public Advocacy. (August 1998-January 2007). | Since January 2017 | ||
(a) Excludes Mr. Parker and Mr. Benjamin, interested Board Members who also serve as President and Vice President, respectively.
Explanatory Notes to Tables:
| ∎ | Board Members are deemed to be “Interested,” as defined in the 1940 Act, by reason of their affiliation with PGIM Investments LLC and/or an affiliate of PGIM Investments LLC. |
| ∎ | Unless otherwise noted, the address of all Board Members and Officers is c/o PGIM Investments LLC, 655 Broad Street, Newark, New Jersey 07102-4410. |
| ∎ | There is no set term of office for Board Members or Officers. The Board Members have adopted a retirement policy, which calls for the retirement of Board Members on December 31 of the year in which they reach the age of 75. |
| ∎ | “Other Directorships Held” includes only directorships of companies required to register or file reports with the SEC under the 1934 Act (that is, “public companies”) or other investment companies registered under the 1940 Act. |
| ∎ | “Portfolios Overseen” includes all investment companies managed by PGIM Investments LLC. The investment companies for which PGIM Investments LLC serves as manager include the PGIM Funds, The Prudential Variable Contract Accounts, PGIM ETF Trust, PGIM High Yield Bond Fund, Inc., PGIM Global High Yield Fund, Inc., The Prudential Series Fund, Prudential’s Gibraltar Fund, Inc. and the Advanced Series Trust. |
PGIM Global Total Return (USD Hedged) Fund
Approval of Advisory Agreements(unaudited)
The Fund’s Board of Directors
The Board of Directors (the “Board”) of PGIM Global Total Return (USD Hedged) Fund (the “Fund”)1 consists of eleven individuals, nine of whom are not “interested persons” of the Fund, as defined in the Investment Company Act of 1940, as amended (the “1940 Act”) (the “Independent Directors”).2 The Board is responsible for the oversight of the Fund and its operations, and performs the various duties imposed on the directors of investment companies by the 1940 Act. The Independent Directors have retained independent legal counsel to assist them in connection with their duties. The Chair of the Board is an Independent Trustee. The Board has established four standing committees: the Audit Committee, the Nominating and Governance Committee, and two Investment Committees. Each committee is chaired by, and composed of, Independent Directors.
Annual Approval of the Fund’s Advisory Agreements
As required under the 1940 Act, the Board determines annually whether to renew the Fund’s management agreement with PGIM Investments LLC (“PGIM Investments”) and the Fund’s subadvisory agreements with each of PGIM, Inc. (“PGIM”) on behalf of its PGIM Fixed Income unit and PGIM Limited (“PGIML”). In considering the renewal of the agreements, the Board, including all of the Independent Directors, met on May 30, 2019 and on June11-13, 2019 and approved the renewal of the agreements through July 31, 2020, after concluding that the renewal of the agreements was in the best interests of the Fund and its shareholders.
In advance of the meetings, the Board requested and received materials relating to the agreements, and had the opportunity to ask questions and request further information in connection with its consideration. Among other things, the Board considered comparative fee information from PGIM Investments, PGIM and PGIML. Also, the Board considered comparisons with other mutual funds in relevant Peer Universes and Peer Groups, as is further discussed below.
In approving the agreements, the Board, including the Independent Directors advised by independent legal counsel, considered the factors it deemed relevant, including the nature, quality and extent of services provided by PGIM Investments and the subadvisers, the performance of the Fund, the profitability of PGIM Investments and its affiliates, expenses and fees, and the potential for economies of scale that may be shared with the Fund and its shareholders as the Fund’s assets grow. In their deliberations, the Directors did not identify any single factor which alone was responsible for the Board’s decision to approve the
| 1 | PGIM Global Total Return (USD Hedged) Fund is a series of Prudential Global Total Return Fund, Inc. |
| 2 | Grace C. Torres was an Interested Director of the Fund at the time the Board considered and approved the renewal of the Fund’s advisory agreements, but has since become an Independent Director of the Fund. |
| PGIM Global Total Return (USD Hedged) Fund | ||
Approval of Advisory Agreements(continued)
agreements with respect to the Fund. In connection with its deliberations, the Board considered information provided by PGIM Investments throughout the year at regular Board meetings, presentations from portfolio managers and other information, as well as information furnished at or in advance of the meetings on May 30, 2019 and onJune 11-13, 2019.
The Directors determined that the overall arrangements between the Fund and PGIM Investments, which serves as the Fund’s investment manager pursuant to a management agreement, and between each of PGIM Investments and PGIM, which, through its PGIM Fixed Income unit, and PGIML, which serve as the Fund’s subadvisers pursuant to the terms of subadvisory agreements with PGIM Investments, are in the best interests of the Fund and its shareholders in light of the services performed, fees charged and such other matters as the Directors considered relevant in the exercise of their business judgment.
The material factors and conclusions that formed the basis for the Directors’ reaching their determinations to approve the continuance of the agreements are separately discussed below.
Nature, Quality and Extent of Services
The Board received and considered information regarding the nature, quality and extent of services provided to the Fund by PGIM Investments, PGIM Fixed Income, and PGIML. The Board noted that PGIM Fixed Income and PGIML are affiliated with PGIM Investments. The Board considered the services provided by PGIM Investments, including but not limited to the oversight of the subadvisers for the Fund, as well as the provision of fund recordkeeping, compliance and other services to the Fund, and PGIM Investments’ role as administrator for the Fund’s liquidity risk management program. With respect to PGIM Investments’ oversight of the subadvisers, the Board noted that PGIM Investments’ Strategic Investment Research Group (“SIRG”), which is a business unit of PGIM Investments, is responsible for monitoring and reporting to PGIM Investments senior management on the performance and operations of the subadvisers. The Board also considered that PGIM Investments pays the salaries of all of the officers and interested Directors of the Fund who are part of Fund management. The Board also considered the investment subadvisory services provided by PGIM Fixed Income and PGIML, including investment research and security selection, as well as adherence to the Fund’s investment restrictions and compliance with applicable Fund policies and procedures. The Board considered PGIM Investments’ evaluation of the subadvisers, as well as PGIM Investments’ recommendation, based on its review of the subadvisers, to renew the subadvisory agreements.
| Visit our website at pgiminvestments.com |
The Board considered the qualifications, backgrounds and responsibilities of PGIM Investments’ senior management responsible for the oversight of the Fund, PGIM Fixed Income, and PGIML, and also considered the qualifications, backgrounds and responsibilities of PGIM Fixed Income’s portfolio managers who are responsible for theday-to-day management of the Fund’s portfolio. The Board was provided with information pertaining to PGIM Investments’, PGIM Fixed Income’s, and PGIML’s organizational structure, senior management, investment operations, and other relevant information pertaining to PGIM Investments, PGIM Fixed Income, and PGIML. The Board also noted that it received favorable compliance reports from the Fund’s Chief Compliance Officer (“CCO”) as to PGIM Investments, PGIM Fixed Income, and PGIML.
The Board concluded that it was satisfied with the nature, extent and quality of the investment management services provided by PGIM Investments, the subadvisory services provided to the Fund by PGIM Fixed Income and PGIML, and that there was a reasonable basis on which to conclude that the Fund benefits from the services provided by PGIM Investments, PGIM Fixed Income, and PGIML under the management and subadvisory agreements.
Costs of Services and Profits Realized by PGIM Investments
The Board was provided with information on the profitability of PGIM Investments and its affiliates in serving as the Fund’s investment manager. The Board discussed with PGIM Investments the methodology utilized in assembling the information regarding profitability and considered its reasonableness. The Board recognized that it is difficult to make comparisons of profitability from fund management contracts because comparative information is not generally publicly available and is affected by numerous factors, including the structure of the particular adviser, the types of funds it manages, its business mix, numerous assumptions regarding allocations and the adviser’s capital structure and cost of capital. Taking these factors into account, the Board concluded that the profitability of PGIM Investments and its affiliates in relation to the services rendered was not unreasonable.
Economies of Scale
The Board received and discussed information concerning economies of scale that PGIM Investments may realize as the Fund’s assets grow beyond current levels. The Board noted that the management fee schedule for the Fund includes breakpoints, which have the effect of decreasing the fee rate as assets increase. During the course of time, the Board has considered information regarding the launch date of the Fund, the management fees of the Fund compared to those of similarly managed funds and PGIM Investments’ investment in the Fund over time. The Board noted that economies of scale can be shared with the Fund in other ways, including low management fees from inception, additional technological and personnel investments to enhance shareholder services, and maintaining
| PGIM Global Total Return (USD Hedged) Fund | ||
Approval of Advisory Agreements(continued)
existing expense structures in the face of a rising cost environment. The Board also considered PGIM Investments’ assertion that it continually evaluates the management fee schedule of the Fund and the potential to share economies of scale through breakpoints or fee waivers as asset levels increase.
The Board recognized the inherent limitations of any analysis of economies of scale, stemming largely from the Board’s understanding that most of PGIM Investments’ costs are not specific to individual funds, but rather are incurred across a variety of products and services.
Other Benefits to PGIM Investments, PGIM Fixed Income, and PGIML
The Board considered potential ancillary benefits that might be received by PGIM Investments, PGIM Fixed Income, PGIML and their affiliates as a result of their relationship with the Fund. The Board concluded that potential benefits to be derived by PGIM Investments included transfer agency fees received by the Fund’s transfer agent (which is affiliated with PGIM Investments), as well as benefits to its reputation or other intangible benefits resulting from PGIM Investments’ association with the Fund. The Board concluded that the potential benefits to be derived by PGIM Fixed Income and PGIML included the ability to use soft dollar credits, as well as the potential benefits consistent with those generally resulting from an increase in assets under management, specifically, potential access to additional research resources and benefits to their reputations. The Board concluded that the benefits derived by PGIM Investments, PGIM Fixed Income, and PGIML were consistent with the types of benefits generally derived by investment managers and subadvisers to mutual funds.
Performance of the Fund / Fees and Expenses
The Board considered certain additional factors and made related conclusions relating to the historical performance of the Fund for theone-year period ended December 31, 2018. The Board considered that the Fund commenced operations on December 12, 2017 and that longer-term performance was not yet available.
The Board also considered the Fund’s actual management fee, as well as the Fund’s net total expense ratio, for the fiscal period ended October 31, 2018. The Board considered the management fee for the Fund as compared to the management fee charged by PGIM Investments to other funds and the fee charged by other advisers to comparable mutual funds in a Peer Group. The actual management fee represents the fee rate actually paid by Fund shareholders and includes any fee waivers or reimbursements. The net total expense ratio for the Fund represents the actual expense ratio incurred by Fund shareholders.
The mutual funds included in the Peer Universe, which was used to consider performance, and the Peer Group, which was used to consider expenses and fees, were objectively determined by Broadridge, an independent provider of mutual fund data. In certain
| Visit our website at pgiminvestments.com |
circumstances, PGIM Investments also provided supplemental Peer Universe or Peer Group information, for reasons addressed with the Board. The comparisons placed the Fund in various quartiles over various periods, with the first quartile being the best 25% of the mutual funds (for performance, the best performing mutual funds and, for expenses, the lowest cost mutual funds).
The section below summarizes key factors considered by the Board and the Board’s conclusions regarding the Fund’s performance, fees and overall expenses. The table sets forth net performance comparisons (which reflect the impact on performance of fund expenses, or any subsidies, expense caps or waivers that may be applicable) with the Peer Universe, actual management fees with the Peer Group (which reflect the impact of any subsidies or fee waivers), and net total expenses with the Peer Group, each of which were key factors considered by the Board.
| Net Performance | 1 Year | 3 Years | 5 Years | 10 Years | ||||
1st Quartile | N/A | N/A | N/A | |||||
| Actual Management Fees:1st Quartile | ||||||||
| Net Total Expenses: 1st Quartile | ||||||||
| • | The Board noted that the Fund underperformed its benchmark index over theone-year period. |
| • | The Board noted that the Fund does not yet have a three-year performance record and that, therefore, the subadviser should have more time to develop that record. |
| • | The Board and PGIM Investments agreed to retain the existing contractual expense cap which (exclusive of certain fees and expenses) caps total annual operating expenses at 0.88% for Class A shares, 1.63% for Class C shares, 0.63% for Class Z shares and 0.58% for Class R6 shares through February 29, 2020. |
| • | In addition, PGIM Investments will waive management fees or shared operating expenses on any share class to the same extent that it waives such expenses on any other share class, and has agreed that total annual fund operating expenses for Class R6 shares will not exceed total annual fund operating expenses for Class Z shares. |
| • | The Board concluded that in light of the above, it would be in the best interests of the Fund and its shareholders to continue to allow the Fund to create a longer-term performance record, and to renew the agreements. |
| • | The Board concluded that the management fees (including subadvisory fees) and total expenses were reasonable in light of the services provided. |
* * *
After full consideration of these factors, the Board concluded that the approval of the agreements was in the best interests of the Fund and its shareholders.
| PGIM Global Total Return (USD Hedged) Fund | ||
| ∎ TELEPHONE | ∎ WEBSITE | |||
655 Broad Street Newark, NJ 07102 | (800) 225-1852 | pgiminvestments.com | ||
| PROXY VOTING |
| The Board of Directors of the Fund has delegated to the Fund’s subadviser the responsibility for voting any proxies and maintaining proxy recordkeeping with respect to the Fund. A description of these proxy voting policies and procedures is available without charge, upon request, by calling(800) 225-1852. Information regarding how the Fund voted proxies relating to portfolio securities during the most recent 12-month period ended June 30 is available on the Fund’s website and on the Securities and Exchange Commission’s website. |
| DIRECTORS |
| Ellen S. Alberding • Kevin J. Bannon• Scott E. Benjamin• Linda W. Bynoe• Barry H. Evans • Keith F. Hartstein• Laurie Simon Hodrick• Michael S. Hyland• Stuart S. Parker• Brian K. Reid • Grace C. Torres |
| OFFICERS |
Stuart S. Parker,President• Scott E. Benjamin,Vice President• Christian J. Kelly,Treasurer and Principal Financial and Accounting Officer• Raymond A. O’Hara,Chief Legal Officer• Dino Capasso,Chief Compliance Officer• Charles H. Smith,Anti-Money Laundering Compliance Officer• Andrew R. French,Secretary• Jonathan D. Shain,Assistant Secretary• Claudia DiGiacomo,Assistant Secretary• Diana N. Huffman,Assistant Secretary• Kelly A. Coyne,Assistant Secretary• Lana Lomuti,Assistant Treasurer• Russ Shupak,Assistant Treasurer• Elyse McLaughlin,Assistant Treasurer• Deborah Conway,Assistant Treasurer |
| MANAGER | PGIM Investments LLC | 655 Broad Street Newark, NJ 07102 | ||
| ||||
| SUBADVISER | PGIM Fixed Income | 655 Broad Street Newark, NJ 07102 | ||
| ||||
| DISTRIBUTOR | Prudential Investment Management Services LLC | 655 Broad Street Newark, NJ 07102 | ||
| ||||
| CUSTODIAN | The Bank of New York Mellon | 240 Greenwich Street New York, NY 10286 | ||
| ||||
| TRANSFER AGENT | Prudential Mutual Fund Services LLC | PO Box 9658 Providence, RI 02940 | ||
| ||||
| INDEPENDENT REGISTERED PUBLIC ACCOUNTING FIRM | KPMG LLP | 345 Park Avenue New York, NY 10154 | ||
| ||||
| FUND COUNSEL | Willkie Farr & Gallagher LLP | 787 Seventh Avenue New York, NY 10019 | ||
| ||||
| An investor should consider the investment objectives, risks, charges, and expenses of the Fund carefully before investing. The prospectus and summary prospectus contain this and other information about the Fund. An investor may obtain the prospectus and summary prospectus by visiting our website atpgiminvestments.com or by calling(800) 225-1852. The prospectus and summary prospectus should be read carefully before investing. |
| E-DELIVERY |
| To receive your mutual fund documents online, go topgiminvestments.com/edelivery and enroll. Instead of receiving printed documents by mail, you will receive notification via email when new materials are available. You can cancel your enrollment or change your email address at any time by visiting the website address above. |
| SHAREHOLDER COMMUNICATIONS WITH DIRECTORS |
| Shareholders can communicate directly with the Board of Directors by writing to the Chair of the Board, PGIM Global Total Return (USD Hedged) Fund, PGIM Investments, Attn: Board of Directors, 655 Broad Street, Newark, NJ 07102. Shareholders can communicate directly with an individual Director by writing to the same address. Communications are not screened before being delivered to the addressee. |
| AVAILABILITY OF PORTFOLIO HOLDINGS |
The Fund files its complete schedule of portfolio holdings with the Securities and Exchange Commission on Form N-PORT. The Fund’s Form N-PORT filings are available on the Commission’s website at sec.gov. Form N-PORT is filed with the Commission quarterly, and each Fund’s full portfolio holdings as of the first and third fiscal quarter-ends (as of the third month of the Fund’s fiscal quarter for reporting periods on or after September 30, 2019) will be made publicly available 60 days after the end of each quarter at sec.gov. |
| The Fund’s Statement of Additional Information contains additional information about the Fund’s Directors and is available without charge, upon request, by calling (800) 225-1852. |
Mutual Funds:
| ARE NOT INSURED BY THE FDIC OR ANY FEDERAL GOVERNMENT AGENCY | MAY LOSE VALUE | ARE NOT A DEPOSIT OF OR GUARANTEED BY ANY BANK OR ANY BANK AFFILIATE |
PGIM GLOBAL TOTAL RETURN (USD HEDGED) FUND
| SHARE CLASS | A | C | Z | R6 | ||||
| NASDAQ | PHEAX | PHECX | PHEZX | PHEQX | ||||
| CUSIP | 74439A707 | 74439A806 | 74439A871 | 74439A889 |
MF238E
Item 2 – Code of Ethics — See Exhibit (a)
As of the end of the period covered by this report, the registrant has adopted a code of ethics (the “Section 406 Standards for Investment Companies – Ethical Standards for Principal Executive and Financial Officers”) that applies to the registrant’s Principal Executive Officer and Principal Financial Officer; the registrant’s Principal Financial Officer also serves as the Principal Accounting Officer.
The registrant hereby undertakes to provide any person, without charge, upon request, a copy of the code of ethics. To request a copy of the code of ethics, contact the registrant800-225-1852, and ask for a copy of the Section 406 Standards for Investment Companies - Ethical Standards for Principal Executive and Financial Officers.
Item 3 – Audit Committee Financial Expert –
The registrant’s Board has determined that Mr. Kevin J. Bannon, member of the Board’s Audit Committee is an “audit committee financial expert,” and that he is “independent,” for purposes of this Item.
Item 4 – Principal Accountant Fees and Services – (a) Audit Fees
For the fiscal years ended October 31, 2019 and October 31, 2018, KPMG LLP (“KPMG”), the Registrant’s principal accountant, billed the Registrant $105,991 and $105,318 respectively, for professional services rendered for the audit of the Registrant’s annual financial statements or services that are normally provided in connection with statutory and regulatory filings.
(b) Audit-Related Fees
For the fiscal year ended October 31, 2019, fees of $2,836 were billed to the Registrant for services rendered by KPMG in connection with an accounting system conversion and were paid by The Bank of New York Mellon. For the fiscal year ended October 31, 2018, there are no fees to report.
(c) Tax Fees
For the fiscal years ended October 31, 2019 and October 31, 2018: none.
(d)All Other Fees
For the fiscal years ended October 31, 2019 and October 31, 2018: none.
(e) (1)Audit CommitteePre-Approval Policies and Procedures
THE PGIM MUTUAL FUNDS
AUDIT COMMITTEE POLICY
on
Pre-Approval of Services Provided by the Independent
Accountants
The Audit Committee of each PGIM Mutual Fund is charged with the responsibility to monitor the independence of the
Fund’s independent accountants. As part of this responsibility, the Audit Committee mustpre-approve the independent accounting firm’s engagement to render audit and/or permissiblenon-audit services, as required by law. In evaluating a proposed engagement of the independent accountants, the Audit Committee will assess the effect that the engagement might reasonably be expected to have on the accountant’s independence. The Committee’s evaluation will be based on:
| • | a review of the nature of the professional services expected to be provided, |
| • | a review of the safeguards put into place by the accounting firm to safeguard independence, and |
| • | periodic meetings with the accounting firm. |
Policy for Audit andNon-Audit Services Provided to the Funds
On an annual basis, the scope of audits for each Fund, audit fees and expenses, and audit-related andnon-audit services (and fees proposed in respect thereof) proposed to be performed by the Fund’s independent accountants will be presented by the Treasurer and the independent accountants to the Audit Committee for review and, as appropriate, approval prior to the initiation of such services.
Such presentation shall be accompanied by confirmation by both the Treasurer and the independent accountants that the proposed
non-audit services will not adversely affect the independence of the independent accountants. Such proposednon-audit services shall be described in sufficient detail to enable the Audit Committee to assess the appropriateness of such services and fees, and the compatibility of the provision of such services with the auditor’s independence. The Committee shall receive periodic reports on the progress of the audit and other services which are approved by the Committee or by the Committee Chair pursuant to authority delegated in this Policy.
The categories of services enumerated under “Audit Services”, “Audit-related Services”, and “Tax Services” are intended to provide guidance to the Treasurer and the independent accountants as to those categories of services which the Committee believes are generally consistent with the independence of the independent accountants and which the Committee (or the Committee Chair) would expect upon the presentation of specific proposals topre-approve. The enumerated categories are not intended as an exclusive list of audit, audit-related or tax services, which the Committee (or the Committee Chair) would consider forpre-approval.
Audit Services
The following categories of audit services are considered to be consistent with the role of the Fund’s independent accountants:
| • | Annual Fund financial statement audits |
| • | Seed audits (related to new product filings, as required) |
| • | SEC and regulatory filings and consents |
Audit-related Services
The following categories of audit-related services are considered to be consistent with the role of the Fund’s independent accountants:
| • | Accounting consultations |
| • | Fund merger support services |
| • | Agreed Upon Procedure Reports |
| • | Attestation Reports |
| • | Other Internal Control Reports |
Individual audit-related services that fall within one of these categories (except for fund merger support services) and are not presented to the Audit Committee as part of the annualpre-approval process are subject to an authorizedpre-approval by the Audit Committee so long as the estimated fee for those services does not exceed $30,000. Any services provided under suchpre-approval will be reported to the Audit Committee at its next regular meeting. Should the amount of such services exceed $30,000 any additional fees will be subject topre-approval by the Committee Chair (or any other Committee member on whom this responsibility has been delegated). Fees related to fund merger support services are subject to a separate authorizedpre-approval by the Audit Committee with fees determined on a per occurrence and merger complexity basis.
Tax Services
The following categories of tax services are considered to be consistent with the role of the Fund’s independent accountants:
| • | Tax compliance services related to the filing or amendment of the following: |
| • | Federal, state and local income tax compliance; and, |
| • | Sales and use tax compliance |
| • | Timely RIC qualification reviews |
| • | Tax distribution analysis and planning |
| • | Tax authority examination services |
| • | Tax appeals support services |
| • | Accounting methods studies |
| • | Fund merger support services |
| • | Tax consulting services and related projects |
Individual tax services that fall within one of these categories and are not presented to the Audit Committee as part of the annualpre-approval process are subject to an authorizedpre-approval by the Audit Committee so long as the estimated fee for those services does not exceed $30,000. Any services provided under suchpre-approval will be reported to the Audit Committee at its next regular meeting. Should the amount of such services exceed $30,000 any additional fees will be subject topre-approval by the Committee Chair (or any other Committee member on whom this responsibility has been delegated).
OtherNon-Audit Services
Certainnon-audit services that the independent accountants are legally permitted to render will be subject topre-approval by the Committee or by one or more Committee members to whom the Committee has delegated this authority and who will report to the full Committee anypre-approval decisions made pursuant to this Policy.Non-audit services presented forpre-approval pursuant to this paragraph will be accompanied by a confirmation from both the Treasurer and the independent accountants that the proposed services will not adversely affect the independence of the independent accountants.
Proscribed Services
The Fund’s independent accountants will not render services in the following categories ofnon-audit services:
| • | Bookkeeping or other services related to the accounting records or financial statements of the Fund |
| • | Financial information systems design and implementation |
| • | Appraisal or valuation services, fairness opinions, orcontribution-in-kind reports |
| • | Actuarial services |
| • | Internal audit outsourcing services |
| • | Management functions or human resources |
| • | Broker or dealer, investment adviser, or investment banking services |
| • | Legal services and expert services unrelated to the audit |
| • | Any other service that the Public Company Accounting Oversight Board determines, by regulation, is impermissible. |
Pre-approval ofNon-Audit Services Provided to Other Entities Within the PGIM Fund Complex
Certainnon-audit services provided to PGIM Investments LLC or any of its affiliates that also provide ongoing services to the PGIM Mutual Funds will be subject topre-approval by the Audit Committee. The onlynon-audit services provided to these entities that will requirepre-approval are thoserelated directly to the operations and financial reporting of the Funds. Individual projects that are not presented to the Audit Committee as part of the annualpre-approval process will be subject topre-approval by the Committee Chair (or any other Committee member on whom this responsibility has been delegated) so long as the estimated fee for those services does not exceed $30,000. Services presented forpre-approval pursuant to this
paragraph will be accompanied by a confirmation from both the Treasurer and the independent accountants that the proposed services will not adversely affect the independence of the independent accountants.
Although the Audit Committee will notpre-approve all services provided to PGIM Investments LLC and its affiliates, the Committee will receive an annual report from the Fund’s independent accounting firm showing the aggregate fees for all services provided to PGIM Investments and its affiliates.
(e) (2) Percentage of services referred to in 4(b) – 4(d) that were approved by the audit committee–
For the fiscal year ended October 31, 2019, 100% of the services referred to in Item 4(b) was approved by the audit committee. For the fiscal year ended October 31, 2018: none.
(f)Percentage of hours expended attributable to work performed by other than full time employees of principal accountant if greater than 50%.
The percentage of hours expended on the principal accountant’s engagement to audit the registrant’s financial statements for the most recent fiscal year that were attributed to work performed by persons other than the principal accountant’s full-time, permanent employees was 0%.
(g)Non-Audit Fees
The aggregatenon-audit fees billed by KPMG for services rendered to the registrant’s investment adviser and any entity controlling, controlled by, or under common control with the investment adviser that provides ongoing services to the registrant for the fiscal years ended October 31, 2019 and October 31, 2018 was $0 and $0, respectively.
(h)Principal Accountant’s Independence
Not applicable as KPMG has not providednon-audit services to the registrant’s investment adviser and any entity controlling, controlled by, or under common control with the investment adviser that provides ongoing services to the registrant that were notpre-approved pursuant to Rule2-01(c)(7)(ii) of RegulationS-X.
Item 5 – Audit Committee of Listed Registrants –
The registrant has a separately designated standing audit committee (the “Audit Committee”) established in accordance with Section 3(a)(58)(A) of the Securities Exchange Act of 1934. The members of the Audit Committee are Kevin J. Bannon (chair), Laurie Simon Hodrick, Michael S. Hyland, CFA, Brian K. Reid, and Keith F. Hartstein(ex-officio).
Item 6 – Schedule of Investments – The schedule is included as part of the report to shareholders filed under Item 1 of this Form.
Item 7 – Disclosure of Proxy Voting Policies and Procedures forClosed-End Management Investment Companies – Not applicable.
Item 8 – Portfolio Managers ofClosed-End Management Investment Companies – Not applicable.
Item 9 – Purchases of Equity Securities byClosed-End Management Investment Company and Affiliated Purchasers –
Not applicable.
Item 10 – Submission of Matters to a Vote of Security Holders – There have been no material changes to these procedures.
Item 11 – Controls and Procedures
| (a) | It is the conclusion of the registrant’s principal executive officer and principal financial officer that the effectiveness of the registrant’s current disclosure controls and procedures (such disclosure controls and procedures having been evaluated within 90 days of the date of this filing) provide reasonable assurance that the information required to be disclosed by the registrant has been recorded, processed, summarized and reported within the time period specified in the Commission’s rules and forms and that the information required to be disclosed by the registrant has been accumulated and communicated to the registrant’s principal |
| executive officer and principal financial officer in order to allow timely decisions regarding required disclosure. |
| (b) | There has been no significant change in the registrant’s internal control over financial reporting that occurred during the registrant’s most recent fiscal quarter of the period covered by this report that has materially affected, or is likely to materially affect, the registrant’s internal control over financial reporting. |
Item 12 – Controls and Procedures - Disclosure of Securities Lending Activities forClosed-End Management Investment Companies – Not applicable.
Item 13 – Exhibits
| (a) | (1) Code of Ethics – Attached hereto as ExhibitEX-99.CODE-ETH |
(2) Certifications pursuant to Section 302 of the Sarbanes-Oxley Act – Attached hereto as ExhibitEX-99.CERT.
(3) Any written solicitation to purchase securities under Rule23c-1. – Not applicable.
| (b) | Certifications pursuant to Section 906 of the Sarbanes-Oxley Act – Attached hereto as ExhibitEX-99.906CERT. |
SIGNATURES
Pursuant to the requirements of the Securities Exchange Act of 1934 and the Investment Company Act of 1940, the registrant has duly caused this report to be signed on its behalf by the undersigned, thereunto duly authorized.
| Registrant: | Prudential Global Total Return Fund, Inc. | |
| By: | /s/ Andrew R. French | |
| Andrew R. French | ||
| Secretary | ||
| Date: | December 19, 2019 | |
Pursuant to the requirements of the Securities Exchange Act of 1934 and the Investment Company Act of 1940, this report has been signed below by the following persons on behalf of the registrant and in the capacities and on the dates indicated.
| By: | /s/ Stuart S. Parker | |
| Stuart S. Parker | ||
| President and Principal Executive Officer | ||
| Date: | December 19, 2019 | |
| By: | /s/ Christian J. Kelly | |
| Christian J. Kelly | ||
| Treasurer and Principal Financial and Accounting Officer | ||
| Date: | December 19, 2019 | |