Our relationship with Genesis and its affiliates is currently governed by two agreements, as follows:
Pursuant to a Letter Agreement Regarding Subordination of GEL Transaction Documents dated June 4, 2015, we, among other things, collaterally assigned our rights to payments under the Joint Marketing Agreement and Crude Supply Agreement in favor of Sovereign as lender and lienholder pursuant to the Term Loan Due 2034. See “Note (14) Long-Term Debt” of this report for further discussion related to the Term Loan Due 2034.
Pursuant to a Master Easement Agreement dated December 11, 2013, we provide FLNG Land II, Inc., a Delaware corporation (“FLNG”) with: (i) uninterrupted pedestrian and vehicular ingress and egress to and from State Highway 332, across certain of our property to certain property of FLNG (the “Access Easement”) and (ii) a pipeline easement and right of way across certain our property to certain property owned by FLNG (the “Pipeline Easement” and together with the Access Easement, the “Easements”). Under the agreement, FLNG will make payments to us in the amount of $500,000 in October of each year through 2019. Thereafter, FLNG will make payments to us in the amount of $10,000 in October of each year for so long as FLNG desires to use the Access Easement.
In December 2014, we completed plugging and abandonment work for Right-of-Way Number OCS-G 08606. As a result, we anticipate release of the cash-backed collateral for this supplemental pipeline bond by BOEM in the second half of 2015. There can be no assurance that BOEM will not require additional supplemental pipeline bonds related to our other pipeline right-of-ways.
We entered into separate Guaranty Fee Agreements with Jonathan P. Carroll on June 22, 2015, for the execution and delivery of guaranties related to the Bridge Loan Due 2015, Term Loan Due 2034, and Term Loan Due 2017. Pursuant to the Guaranty Fee Agreements, Jonathan P. Carroll is entitled to receive a fee in an amount equal to 2.00% per annum, paid monthly, of the outstanding principal balance owed under the Bridge Loan Due 2015, Term Loan Due 2034, and Term Loan Due 2017. Jonathan P. Carroll is Chairman of the Board, Chief Executive Officer and President of Blue Dolphin, as well as a majority owner of LEH. LEH owns approximately 81% of our Common Stock and is an affiliated entity.
From time to time we are subject to various lawsuits, claims, mechanics liens, and administrative proceedings that arise out of the normal course of business. Management does not believe that liens, if any, will have a material adverse effect on our results of operations.
All of our operations and properties are subject to extensive federal, state, and local environmental, health, and safety regulations governing, among other things, the generation, storage, handling, use and transportation of petroleum and hazardous substances; the emission and discharge of materials into the environment; waste management; characteristics and composition of jet fuel and other products; and the monitoring, reporting and control of greenhouse gas emissions. Our operations also require numerous permits and authorizations under various environmental, health, and safety laws and regulations. Failure to obtain and comply with these permits or environmental, health, or safety laws generally could result in fines, penalties or other sanctions, or a revocation of our permits.
LEH manages and operates all of our properties pursuant to the Operating Agreement. For services rendered, LEH receives reimbursements and fees. On July 15, 2015, the Operating Agreement was further amended to: (i) clarify excluded costs with respect to payments as defined under the Joint Marketing Agreement, and (ii) extend the term from August 12, 2015 to August 12, 2018. The effective date of Amendment No. 2 to the Operating Agreement is June 1, 2015. See “Note (10) Accounts Payable, Related Party” of this report for additional disclosures related to the Operating Agreement.
| ITEM 2. | MANAGEMENT'S DISCUSSION AND ANALYSIS OF FINANCIAL CONDITION AND RESULTS OF OPERATIONS |
The following discussion of our financial condition and results of operations should be read in conjunction with the risk factors, unaudited consolidated financial statements and accompanying notes included hereto, as well as the audited consolidated financial statements and accompanying notes thereto included in our previously filed Annual Report on Form 10-K for the year ended December 31, 2014 and our Quarterly Report on Form 10-Q for the three months ended March 31, 2015. In this report, the words “Blue Dolphin,” “we,” “us” and “our” refer to Blue Dolphin Energy Company and its subsidiaries.
Forward Looking Statements
As provided by the safe harbor provisions of the Private Securities Litigation Reform Act of 1995, certain statements included throughout this Quarterly Report on Form 10-Q for the three and six months ended June 30, 2015, and in particular under the sections entitled “Part I, Item 2. Management’s Discussion and Analysis of Financial Condition and Results of Operations” and “Part II, Item 1A. Risk Factors” are forward-looking statements that represent management’s beliefs and assumptions based on currently available information. Forward-looking statements relate to matters such as our industry, business strategy, goals and expectations concerning our market position, future operations, margins, profitability, capital expenditures, liquidity and capital resources and other financial and operating information. We have used the words “anticipate,” “assume,” “believe,” “budget,” “continue,” “could,” “estimate,” “expect,” “intend,” “may,” “plan,” “potential,” “predict,” “project,” “will,” “future” and similar terms and phrases to identify forward-looking statements.
Forward-looking statements reflect our current expectations regarding future events, results or outcomes. These expectations may or may not be realized. Some of these expectations may be based upon assumptions or judgments that prove to be incorrect. In addition, our business and operations involve numerous risks and uncertainties, many of which are beyond our control, which could result in our expectations not being realized, or materially affect our financial condition, results of operations and cash flows.
Actual events, results and outcomes may differ materially from our expectations due to a variety of factors. Although it is not possible to identify all of these factors, they include, among others, the following:
Risks Related to Our Business and Industry
| ● | dangers inherent in oil and gas operations that could cause disruptions and expose us to potentially significant losses, costs or liabilities and reduce our liquidity; |
| ● | geographic concentration of our assets, which creates a significant exposure to the risks of the regional economy; |
| ● | competition from companies having greater financial and other resources; |
| ● | laws and regulations regarding personnel and process safety, as well as environmental, health, and safety, for which failure to comply may result in substantial fines, criminal sanctions, permit revocations, injunctions, facility shutdowns, and/or significant capital expenditures; |
| ● | insurance coverage that may be inadequate or expensive; |
| ● | related party transactions with LEH and its affiliates, which may cause conflicts of interest; |
| ● | loss of executive officers or key employees, as well as a shortage of skilled labor or disruptions in our labor force, which may make it difficult to maintain productivity; |
| ● | our dependence on Lazarus Energy Holdings, LLC (“LEH”) for financing and management of our properties; |
| ● | capital needs for which our internally generated cash flows and other sources of liquidity may not be adequate; and |
| ● | our ability to use net operating loss (“NOL”) carryforwards to offset future taxable income for U.S. federal income tax purposes, which are subject to limitation. |
Risks Related to Our Refinery Operations Business Segment
| ● | volatility of refining margins; |
| ● | volatility of crude oil, other feedstocks, refined petroleum products, and fuel and utility services; |
| ● | potential downtime at the Nixon Facility, which could result in lost margin opportunity, increased maintenance expense, increased inventory, and a reduction in cash available for payment of our obligations; |
| ● | loss of market share by a key customer or consolidation among our customer base; |
| ● | failure to grow or maintain the market share for our refined petroleum products; |
| ● | our reliance on third-parties for the transportation of crude oil and condensate into and refined petroleum products out of the Nixon Facility; |
| ● | interruptions in the supply of crude oil and condensate sourced in the Eagle Ford Shale; |
| ● | changes in the supply/demand balance in the Eagle Ford Shale that could result in lower refining margins; |
| ● | hedging of our refined petroleum products and crude oil and condensate inventory, which may limit our gains and expose us to other risks; |
| ● | our dependence on Genesis Energy, LLC (“Genesis”) and its affiliates for crude oil and condensate sourcing, inventory risk management, hedging, and refined petroleum product marketing; and |
| ● | regulation of greenhouse gas emissions, which could increase our operational costs and reduce demand for our products. |
Risks Related to Our Pipelines and Oil and Gas Properties
| ● | asset retirement obligations (“AROs”) for our pipelines and facilities assets and oil and gas properties. |
Any one of these factors or a combination of these factors could materially affect our future results of operations and could influence whether any forward-looking statements ultimately prove to be accurate. Our forward-looking statements are not guarantees of future performance, and actual results and future performance may differ materially from those suggested in any forward-looking statements. We do not intend to update these statements unless we are required to do so.
Overview
Blue Dolphin Energy Company (http://www.blue-dolphin-energy.com) is primarily an independent refiner and marketer of petroleum products. Our primary asset is a 15,000 barrels per day (“bpd”) crude oil and condensate processing facility that is located in Nixon, Texas (the “Nixon Facility”). As part of our refinery operations business segment, we conduct petroleum storage and terminaling operations under third-party lease agreements at the Nixon Facility. We also own and operate pipeline assets and have leasehold interests in oil and gas properties.
Structure and Management
We were formed as a Delaware corporation in 1986. We are currently controlled by LEH, which owns approximately 81% of our common stock, par value $0.01 per share (the “Common Stock). Jonathan P. Carroll is Chairman of the Board of Directors (the “Board”), Chief Executive Officer, and President of Blue Dolphin, as well as a majority owner of LEH. LEH manages and operates all of our properties pursuant to an Operating Agreement (the “Operating Agreement”). See “Part I, Item 1. Financial Statements – Note (10) Accounts Payable, Related Party, Note (22) Commitments and Contingencies – “Guaranty Fee Agreements, and Note (23) Subsequent Events” of this report for additional disclosures related to the Operating Agreement, Jonathan P. Carroll, and LEH.
Our operations are conducted through the following operating subsidiaries:
| ● | Lazarus Energy, LLC, a Delaware limited liability company; |
| ● | Lazarus Refining & Marketing, LLC, a Delaware limited liability company; |
| ● | Blue Dolphin Pipe Line Company, a Delaware corporation; |
| ● | Blue Dolphin Petroleum Company, a Delaware corporation; and |
| ● | Blue Dolphin Services Co., a Texas corporation. |
See "Part I, Item 2. Management’s Discussion and Analysis of Financial Condition and Results of Operations – Owned and Leased Assets” of this report for additional information regarding our operating subsidiaries.
Refinery Operations
The Nixon Facility occupies approximately 56 acres in Nixon, Texas and currently consists of a distillation unit, naphtha stabilizer unit, depropanizer unit, approximately 120,000 barrels (“bbls”) of crude oil and condensate storage capacity, approximately 178,000 bbls of refined petroleum product storage capacity, and related loading and unloading facilities and utilities. In June 2015, we announced plans to expand the Nixon Facility by constructing an additional 800,000 bbls of petroleum storage tanks. (See discussion within this section of the report related to our business strategy.)
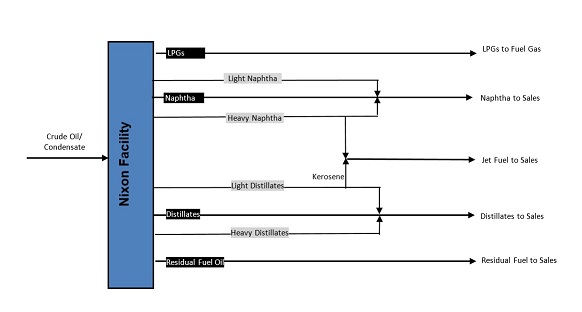
With a capacity of 15,000 bpd, the Nixon Facility is considered a “topping unit” because it is primarily comprised of a crude distillation unit, the first stage of the crude oil refining process. The Nixon Facility’s level of complexity allows us to refine crude oil and condensate into finished and intermediate petroleum products. Our jet fuel is sold in nearby markets, and our intermediate products, including naphtha, liquefied petroleum gas (“LPG”), atmospheric gas oil (“AGO”), and heavy oil-based mud blendstock (“HOBM”), are sold to wholesalers and nearby refineries for further blending and processing. The Nixon Facility uses light crude oil and condensate sourced in the Eagle Ford Shale as feedstock.
We continue to refurbish key components of the Nixon Facility, including the naphtha stabilizer and depropanizer units. Once operational, the naphtha stabilizer and depropanizer units will improve the overall quality of the naphtha that we produce, allow higher recovery of lighter products that can be sold as LPG mix, and increase the amount of throughput that can be processed by the Nixon Facility.
In June 2015, we announced plans to expand the Nixon Facility in three phases that include: (i) constructing more than 500,000 bbls of petroleum storage tanks, (ii) purchasing and redeploying idle refinery equipment, and (iii) obtaining an additional long-term loan, which would be used to refinance the $3.0 million short-term note with Sovereign Bank, a Texas state bank (“Sovereign”) and construct an additional 300,000 bbls of petroleum storage tanks. Potential benefits of the Nixon Facility expansion plan include:
● | generation of additional revenue from leasing product and crude storage to third parties; |
● | crude and product storage capable of supporting refinery throughput of up to 30,000 bbls per day; |
● | production of a higher octane gasoline blendstock (reformate) by refurbishing the naphtha reformer; |
● | production of ultra low sulfur diesel by refurbishing a light duty hydrotreater; and |
● | an increase in the processing capacity and complexity of the Nixon Facility by deploying refurbished refinery equipment to the Nixon Facility, including, among others, a Merox unit, vacuum tower, prefrac tower unit, and LPG fractionator. |
The below diagram represents a high level overview of the current crude oil and condensate refining process at the Nixon Facility.
Pipeline Transportation
Our pipeline transportation operations are conducted in the Gulf of Mexico and involve the gathering and transportation of oil and natural gas for producers/shippers operating in the vicinity of our pipelines, as well as the ownership of leasehold interests in oil and natural gas properties.
Owned and Leased Assets
We own, lease, and have leasehold interests in the following properties:
| Property | | Operating Subsidiary | | Description | | Business Segment | | Owned / Leased | | Location |
| | | | | | | | | | | |
| Nixon Facility (56 acres) | | Lazarus Energy, LLC Lazarus Refining & Marketing, LLC | | Petroleum Processing Petroleum Storage and Terminaling | | Refinery Operations | | Owned | | Nixon, Texas |
| Freeport Facility (193 acres) | | Blue Dolphin Pipe Line Company | | Pipeline Operations | | Pipeline Transportation | | Owned | | Freeport, Texas |
| Pipelines and Oil and Gas Properties | | Blue Dolphin Pipe Line Company Blue Dolphin Petroleum Company | | Exploration and Production | | Pipeline Transportation | | Owned/ Leasehold Interests | | Gulf of Mexico |
| Corporate Headquarters | | Blue Dolphin Services Co. | | Administrative Services | | Corporate and Other | | Leased | | Houston, Texas |
Major Influences on Results of Operations
Our earnings and cash flows from our refinery operations business segment are primarily affected by the relationship between refined petroleum product prices and the prices for crude oil and other feedstocks. Crude oil refining is primarily a margin-based business, and in order to increase profitability, it is important for the refinery to maximize the yields of higher value finished and intermediate products and to minimize the costs of feedstock and operating expenses. Our cost to acquire crude oil and condensate and the price for which our refined petroleum products are ultimately sold depend on several factors, many of which are beyond our control, including the supply of, and demand for, crude oil and refined petroleum products, which depend on changes in domestic and foreign economies, weather conditions, domestic and foreign political affairs, production levels, availability of and access to transportation infrastructure, the availability of imports, the marketing of competitive fuel, and governmental regulations, among other factors.
Crude oil and refined petroleum product prices are also affected by other factors, such as local and general market conditions and the operating levels of competing refineries. Crude oil costs and the prices of refined petroleum products have historically been subject to wide fluctuations. An expansion or upgrade of our competitors’ facilities, price volatility, international political and economic developments, and other factors beyond our control are likely to continue to play an important role in crude oil refining industry economics. Moreover, the refining industry typically experiences seasonal fluctuations in demand for refined petroleum products, such as increases in the demand for gasoline during the summer driving season and for home heating oil during the winter. These factors can impact, among other things, the level of inventories in the market, resulting in price volatility and a negative impact on product margins. In addition to current market conditions, there are long-term factors that may impact the demand for refined petroleum products. These factors include mandated renewable fuels standards, proposed climate change laws and regulations, and increased mileage standards for vehicles.
Relationship with LEH
LEH manages and operates all of our properties pursuant to the Operating Agreement. For services rendered, LEH receives reimbursements and fees. We currently rely on our profit share and LEH to fund our working capital requirements. During months in which we receive no profit share distribution, LEH may, but is not required to, fund our operating losses. See “Part I, Item 1. Financial Statements – Note (10) Accounts Payable, Related Party, Note (22) Commitments and Contingencies – Guaranty Fee Agreements, and Note (23) Subsequent Events” for additional disclosures related to the Operating Agreement, Jonathan P. Carroll, and LEH.
Relationship with Genesis
We were previously subject to three agreements with Genesis and its affiliates. Under the Construction and Funding Agreement, Milam Services, Inc. (“Milam”) committed funding for the completion of the Nixon Facility’s refurbishment and start-up operations. Payments under the Construction and Funding Agreement began in the first quarter of 2012, when the Nixon Facility was placed in service. As a result of our repayment of the full amount due to Milam under the Construction and Funding Agreement in May 2014, we now receive up to 80% of the Gross Profits as our Profit Share under the Joint Marketing Agreement. In addition, Milam is obligated to release all liens on the Nixon Facility.
Our relationship with Genesis and its affiliates is currently governed by two agreements, as follows:
| ● | Joint Marketing Agreement – Under the Joint Marketing Agreement, we, together with GEL, jointly market and sell the output produced at the Nixon Facility and share the Gross Profits (as defined below) from such sales. GEL is responsible for all product transportation scheduling; we are responsible for entering into contracts with customers for the purchase and sale of output produced at the Nixon Facility and handling all billing and invoicing relating to the same. All payments for the sale of output produced at the Nixon Facility are made directly to GEL as collection agent and all customers must satisfy GEL’s customer credit approval process. Subject to certain amendments and clarifications (as described below), the Joint Marketing Agreement also provides for the sharing of “Gross Profits” (defined as the total revenue from the sale of output from the Nixon Facility minus the cost of crude oil and condensate pursuant to the Crude Supply Agreement). As a result of our repayment of the full amount due and owing to Milam under the Construction and Funding Agreement, certain aspects related to the distribution of Gross Profits under the Joint Marketing Agreement no longer apply. Key applicable provisions are as follows: |
| | - | We are entitled to receive weekly payments to cover direct expenses in operating the Nixon Facility (the “Operations Payments”) in an amount not to exceed $750,000 per month plus the amount of any accounting fees, if incurred, not to exceed $50,000 per month. We assigned our rights to weekly payments and reimbusement of accounting fees under the Joint Marketing Agreement to LEH pursuant to the Operating Agreement. If Gross Profits are insufficient to cover Operations Payments, then GEL may: (i) reduce Operations Payments by an amount representing the difference between the Operations Payments and the Gross Profits for such monthly period, or (ii) provide the Operations Payments with such Operations Payments being considered deficit amounts owing to GEL. If Gross Profits are negative, then we are not entitled to receive Operations Payments and GEL may recoup any losses sustained by a special allocation of 80% of Gross Profits until such losses are covered in full, after which the prevailing Gross Profits allocation shall be reinstated; and |
| | - | GEL is entitled to receive an administrative fee in the amount of $150,000 per month relating to the performance of its obligations under the Joint Marketing Agreement (the “Performance Fee”). GEL shall be paid 30% of the remaining Gross Profit up to $600,000 (the “Threshold Amount”) as the GEL Profit Share and we shall be paid 70% of the remaining Gross Profit as our Profit Share. Any amount of remaining Gross Profit that exceeds the Threshold Amount for such calendar month shall be paid to GEL and us in the following manner: (i) GEL shall be paid 20% of the remaining Gross Profits over the Threshold Amount as the GEL Profit Share and (ii) we shall be paid 80% of the remaining Gross Profits over the Threshold Amount as the our Profit Share. |
| | The Joint Marketing Agreement contains negative covenants that restrict our actions under certain circumstances. For example, we are prohibited from making any modifications to the Nixon Facility or entering into any contracts with third-parties that would materially affect or impair GEL’s or its affiliates’ rights under the agreements set forth above. The Joint Marketing Agreement had an initial term of three years expiring on August 12, 2014. In accordance with the terms of the October 2013 Letter Agreement, we agreed not to terminate the Joint Marketing Agreement and GEL agreed to automatically renew the Joint Marketing Agreement at the end of the initial term for successive one year periods until August 12, 2019, unless sooner terminated by GEL with 180 days prior written notice; and |
| ● | Crude Supply Agreement – Under the Crude Supply Agreement, GEL is our exclusive supplier of crude oil and condensate. We have the ability to purchase crude oil and condensate from other suppliers with the prior consent of GEL. GEL supplies crude oil and condensate to us at cost plus freight expense and any costs associated with GEL’s hedging. All crude oil and condensate supplied to us pursuant to the Crude Supply Agreement is paid for pursuant to the terms of the Joint Marketing Agreement as described above. In addition, GEL has a first right of refusal to use three petroleum storage tanks at the Nixon Facility during the term of the Crude Supply Agreement. Subject to certain termination rights, the Crude Supply Agreement had an initial term of three years expiring on August 12, 2014. In accordance with the terms of the October 2013 Letter Agreement, we agreed not to terminate the Crude Supply Agreement and GEL agreed to automatically renew the Crude Supply Agreement at the end of the initial term for successive one year periods until August 12, 2019, unless sooner terminated by GEL with 180 days prior written notice. |
Pursuant to a Letter Agreement Regarding Subordination of GEL Transaction Documents dated June 4, 2015, we, among other things, collaterally assigned our rights to payments under the Joint Marketing Agreement and Crude Supply Agreement in favor of Sovereign Bank, a Texas state bank (“Sovereign”), as lender and lienholder pursuant to that certain Loan and Security Agreement between us and Sovereign dated June 22, 2015 in the principal amount of $25.0 million (the “Term Loan Due 2034”). See “Part I, Item 1. Financial Statements - Note (14) Long-Term Debt” of this report for further discussion related to the Term Loan Due 2034.
Results of Operations
We have two reportable business segments: (i) “Refinery Operations” and (ii) “Pipeline Transportation.” Business activities related to our “Refinery Operations” business segment are conducted at the Nixon Facility and represent approximately 99% of our operations. Business activities related to our “Pipeline Transportation” business segment are primarily conducted in the Gulf of Mexico through our pipeline assets and leasehold interests in oil and gas properties. Our “Pipeline Transportation” operations represent less than 1% of our operations. In this “Results of Operations” section, we first review our business on a consolidated basis, and then separately review our business using certain non-GAAP performance measures used by management to assess our operating results.
Consolidated Results
Definitions
For our consolidated results, we refer to our consolidated statements of income in the explanation of our period over period changes in results of operations. We have reclassified certain prior period amounts to conform to our 2015 presentation. Below are general definitions of what those line items include and represent:
● | Revenue from Operations – Primarily consists of refined petroleum product sales, but also includes tank rental and pipeline transportation revenue. Excise and other taxes that are collected from customers and remitted to governmental authorities are not included in revenue. |
| ● | Cost of Refined Products Sold – Primarily includes purchased crude oil and condensate costs, as well as transportation, freight and storage costs. |
| ● | Refinery Operating Expenses – Reflects the direct operating expenses of the Nixon Facility, including direct costs of labor, maintenance materials and services, chemicals and catalysts and utilities. Represent fees received by LEH to manage and operate the Nixon Facility pursuant to the Operating Agreement. |
● | Joint Marketing Agreement Profit Share (the “JMA Profit Share) – Represents the GEL Profit Share plus the Performance Fee for the period pursuant to the Joint Marketing Agreement. |
| ● | General and Administrative Expenses – Primarily include corporate costs, such as accounting and legal fees, office lease expenses, and administrative expenses. |
| ● | Depletion, Depreciation and Amortization – Represent an allocation to expense within the consolidated statements of income of the carrying value of capital and intangible assets. The value is allocated based on the straight-line method over the estimated useful life of the related asset. |
| ● | Income Tax Expense – Includes federal and state taxes currently payable and deferred taxes arising from temporary differences between income for financial reporting and income tax purposes. |
● | Net Income – Represents total revenue from operations less total cost of operations, total other expense, and income tax expense. |
Three Months Ended June 30, 2015 Compared to Three Months Ended June 30, 2014
Total Revenue from Operations. For the three months ended June 30, 2015 (the “Current Quarter”), we had total revenue from operations of $59,161,614 compared to total revenue from operations of $103,066,451 for the three months ended June 30, 2014 (the “Prior Quarter”). The approximate 43% decrease in total revenue from operations was primarily the result of a significant decrease in refined petroleum product prices due to market conditions in the Current Quarter compared to the Prior Quarter. The majority of our revenue in the Current Quarter came from refined petroleum product sales, which generated revenue of $58,839,160, or more than 99% of total revenue from operations, compared to $102,716,073, or more than 99% of total revenue from operations, in the Prior Quarter. We recognized $286,892 in tank rental revenue in the Current Quarter compared to $282,516 in the Prior Quarter. Tank rental revenue was relatively flat between the Current Quarter and Prior Quarter.
Cost of Refined Products Sold. Cost of refined products sold was $53,801,698 for the Current Quarter compared to $96,622,257 for the Prior Quarter. The approximate 44% decrease in cost of refined products sold was primarily the result of a significant decrease in the average price of crude oil and condensate in the Current Quarter compared to the Prior Quarter.
Refinery Operating Expenses. We recorded refinery operating expenses of $2,586,151 in the Current Quarter compared to $2,641,205 in the Prior Quarter, a decrease of approximately 2%. Refinery operating expenses per barrel of throughput were $2.83 in the Current Quarter compared to $2.73 in the Prior Quarter. The increase in refinery operating expenses per barrel of throughput was a result of an approximate 6% decrease in total refinery throughput between the periods. See “Part I, Item 1. Financial Statements – Note (10) Accounts Payable, Related Party and Note (23) Subsequent Events” of this report for additional disclosures related to the Operating Agreement.
JMA Profit Share. GEL was entitled to receive $938,661, or 38% of refined petroleum product sales less cost of refined products sold and refinery operating expenses as the JMA Profit Share for the Current Quarter. GEL was entitled to receive $1,240,104, or 36% of refined petroleum product sales less cost of refined products sold and refinery operating expenses as the JMA Profit Share for the Prior Quarter. The approximate 24% decrease in JMA Profit Share between the periods was a result of lower refining margins due to market conditions.
General and Administrative Expenses. We incurred general and administrative expenses of $400,018 in the Current Quarter compared to $427,060 in the Prior Quarter. The approximate 6% decrease in general and administrative expenses in the Current Quarter compared to the Prior Quarter was primarily related to a reduction in expenses.
Depletion, Depreciation and Amortization. We recorded depletion, depreciation and amortization expenses of $402,937 in the Current Quarter compared to $391,167 in the Prior Quarter. The approximate 3% increase in depletion, depreciation and amortization expenses for the Current Quarter compared to the Prior Quarter primarily related to additional depreciable refinery assets that were placed in service.
Income Tax Expense. We recognized an income tax expense of $100,729 in the Current Quarter, which primarily related to deferred federal income taxes, compared to an income tax expense of $74,170 in the Prior Quarter. See “Part I, Item 1. Financial Statements – Note (18) Income Taxes” for additional disclosures related to income taxes.
Net Income. For the Current Quarter, we reported net income of $137,879, or income of $0.01 per share, compared to net income of $1,438,557, or income of $0.14 per share, for the Prior Quarter. The $0.13 per share decrease in net income was related to lower refining margins due to market conditions between the periods and amortization expense of $456,287 in the Current Quarter related to the write-off of debt issue costs as a result of refinancing debt owed to American First National Bank.
Six Months Ended June 30, 2015 Compared to Six Months Ended June 30, 2014
Total Revenue from Operations. For the six months ended June 30, 2015 (the “Current Six Months”), we had total revenue from operations of $120,553,963 compared to total revenue from operations of $223,779,149 for the six months ended June 30, 2014 (the “Prior Six Months”). The approximate 46% decrease in total revenue from operations was primarily the result of a significant decrease in refined petroleum product prices due to market conditions in the Current Six Months compared to the Prior Six Months. The majority of our revenue in the Current Six Months came from refined petroleum product sales, which generated revenue of $119,906,222, or more than 99% of total revenue from operations, compared to $223,092,224, or more than 99% of total revenue from operations, in the Prior Six Months. We recognized $573,784 in tank rental revenue in the Current Six Months compared to $565,032 in the Prior Six Months. Tank rental revenue was relatively flat between the Current Six Months and Prior Six Months.
Cost of Refined Products Sold. Cost of refined products sold was $103,189,147 for the Current Six Months compared to $207,037,864 for the Prior Six Months. The approximate 50% decrease in cost of refined products sold was primarily the result of a significant decrease in the average price of crude oil and condensate in the Current Six Months compared to the Prior Six Months.
Refinery Operating Expenses. We recorded refinery operating expenses of $5,467,122 in the Current Six Months compared to $5,596,224 in the Prior Six Months, a decrease of approximately 2%. Refinery operating expenses per barrel of throughput were $2.76 in the Current Six Months compared to $2.72 in the Prior Six Months. The increase in refinery operating expenses per barrel of throughput was a result of an approximate 4% decrease in total refinery throughput between the periods. See “Part I, Item 1. Financial Statements – Note (10) Accounts Payable, Related Party and Note (23) Subsequent Events” of this report for additional disclosures related to the Operating Agreement.
JMA Profit Share. GEL was entitled to receive $3,377,298, or 30% of refined petroleum product sales less cost of refined products sold and refinery operating expenses as the JMA Profit Share for the Current Six Months. GEL was entitled to receive $1,240,104, or 12% of refined petroleum product sales less cost of refined products sold and refinery operating expenses as the JMA Profit Share for the Prior Six Months. The significant increase in JMA Profit Share for the Current Six Months compared to the Prior Six Months was a result of repayment of the Construction and Funding Agreement and the resultant entitlement of GEL to receive the JMA Profit Share during the Prior Six Months.
General and Administrative Expenses. We incurred general and administrative expenses of $745,902 in the Current Six Months compared to $796,544 in the Prior Six Months. The approximate 6% decrease in general and administrative expenses in the Current Six Months compared to the Prior Six Months was primarily related to a reduction in expenses.
Depletion, Depreciation and Amortization. We recorded depletion, depreciation and amortization expenses of $802,168 in the Current Six Months compared to $781,772 in the Prior Six Months. The nearly 3% increase in depletion, depreciation and amortization expenses for the Current Six Months compared to the Prior Six Months primarily related to additional depreciable refinery assets that were placed in service.
Income Tax Expense. We recognized an income tax expense of $2,090,347 in the Current Six Months compared to an income tax expense of $276,593 in the Prior Six Months. The increase in income tax expense between the periods was the result of deferred income taxes in 2015. In 2014, our deferred tax assets were fully reserved due to the uncertainty of their use. As a result, there was no comparable deferred tax expense for the Prio Six Months. See “Part I, Item 1. Financial Statements – Note (18) Income Taxes” for additional disclosures related to income taxes.
Net Income. For the Current Six Months we reported net income of $3,839,243, or income of $0.37 per share, compared to net income of $7,632,830, or income of $0.73 per share, for the Prior Six Months. The $0.36 per share decrease in net income was related to lower refining margins due to market conditions between the periods, amortization expense of $456,287 in the Current Six Months related to the write-off of debt issue costs as a result of refinancing debt owed to American First National Bank, a significant increase in the JMA Profit Share between the periods, and a significant increase in income tax expense between the periods.
Non-GAAP Performance Measures
Definitions
Certain performance measures used by management to assess our operating results and the effectiveness of our business segments are considered non-GAAP performance measures. These performance measures may differ from similar calculations used by other companies within the oil and gas industry, thereby limiting their usefulness as a comparative measure. Below are definitions of non-GAAP performance measures used by management:
| ● | Adjusted Earnings Before Interest, Income Taxes and Depreciation (“EBITDA”) – Reflects EBITDA less the JMA Profit Share. The JMA Profit Share represents the GEL Profit Share plus the Performance Fee for the period pursuant to the Joint Marketing Agreement. |
| - | Refinery Operations Adjusted EBITDA – Reflects adjusted EBITDA for our refinery operations business segment. |
| - | Total Adjusted EBITDA – Reflects adjusted EBITDA for our refinery operations and pipeline transportation business segments, as well as corporate and other. |
| ● | EBITDA – Earnings are adjusted for: (i) interest income (expense), (ii) income taxes, and (iii) depreciation and amortization. |
| - | Refinery Operations EBITDA – Reflects EBITDA for our refinery operations business segment. |
| - | Total EBITDA – Reflects EBITDA for our refinery operations and pipeline transportation business segments, as well as corporate and other. |
| ● | Refinery Operating Income – Reflects refined petroleum product sales less direct operating costs (including cost of refined products sold and refinery operating expenses) and the JMA profit share, which is an indirect operating expense. |
Three Months Ended June 30, 2015 Compared to Three Months Ended June 30, 2014
Refinery Operations Adjusted EBITDA. For the Current Quarter, refinery operations adjusted EBITDA was $2,621,651 compared to refinery operations adjusted EBITDA of $3,671,818 for the Prior Quarter. This represented a decrease in refinery operations adjusted EBITDA of $1,050,167 for the Current Quarter compared to the Prior Quarter. The decrease in refinery operations adjusted EBITDA between the periods was the result of lower refining margins due to market conditions.
Total Adjusted EBITDA. For the Current Quarter, we had total adjusted EBITDA of $2,308,542 compared to total adjusted EBITDA of $3,336,999 for the Prior Quarter. This represented a decrease in total adjusted EBITDA of $1,028,457 for the Current Quarter compared to the Prior Quarter. The decrease in total adjusted EBITDA between the periods was the result of lower refining margins due to market conditions.
Refinery Operations EBITDA. For the Current Quarter, refinery operations EBITDA was $1,682,990 compared to refinery operations EBITDA of $2,431,714 for the Prior Quarter. This represented a decrease in refinery operations EBITDA of $748,724 for the Current Quarter compared to the Prior Quarter. The decrease in refinery operations EBITDA between the periods was the result of lower refining margins due to market conditions.
Total EBITDA. For the Current Quarter, we had total EBITDA of $1,369,881 compared to total EBITDA of $2,096,895 for the Prior Quarter. This represented a decrease in total EBITDA of $727,014 for the Current Quarter compared to the Prior Quarter. The decrease in total EBITDA between the periods was the result of lower refining margins due to market conditions.
Refinery Operating Income. Refinery operating income before the JMA Profit Share was $2,451,311 for the Current Quarter compared to $3,452,611 in the Prior Quarter. The JMA Profit Share totaled $938,611, or 38% of refinery operating income, for the Current Quarter compared to $1,240,104, or 36% of refinery operating income, for the Prior Quarter. For the Current Quarter, we had a refinery operating income of $1,512,650 compared to $2,212,507 for the Prior Quarter.
Six Months Ended June 30, 2015 Compared to Six Months Ended June 30, 2014
Refinery Operations Adjusted EBITDA. For the Current Six Months, refinery operations adjusted EBITDA was $11,716,135 compared to refinery operations adjusted EBITDA of $10,961,907 for the Prior Six Months. This represented an increase in refinery operations adjusted EBITDA of $754,228 for the Current Six Months compared to the Prior Six Months. The increase in refinery operations adjusted EBITDA between the periods was the result of improved refining margins during the first quarter of the Current Six Months.
Total Adjusted EBITDA. For the Current Six Months, we had total adjusted EBITDA of $11,041,961 compared to total adjusted EBITDA of $10,348,880 for the Prior Six Months. This represented an increase in total adjusted EBITDA of $693,081 for the Current Six Months compared to the Prior Six Months. The increase in total adjusted EBITDA between the periods was the result of improved refining margins during the first quarter of the Current Six Months.
Refinery Operations EBITDA. For the Current Six Months, refinery operations EBITDA was $8,338,837 compared to refinery operations EBITDA of $9,721,803 for the Prior Six Months. This represented a decrease in refinery operations EBITDA of $1,382,966 for the Current Six Months compared to the Prior Six Months. The decrease in refinery operations EBITDA between the periods was the result of the cost of the JMA Profit Share, which began in May 2014 as a result of repayment of the Construction and Funding Agreement.
Total EBITDA. For the Current Six Months, we had total EBITDA of $7,664,663 compared to total EBITDA of $9,108,776 for the Prior Six Months. This represented a decrease in total EBITDA of $1,444,113 for the Current Six Months compared to the Prior Six Months. The decrease in total EBITDA between the periods was the result of the cost of the JMA Profit Share, which was partially offset by improved profitability as a result of higher refining margins.
Refinery Operating Income. Refinery operating income before the JMA Profit Share was $11,249,953 for the Current Six Months compared to $10,458,136 in the Prior Six Months. The JMA Profit Share totaled $3,377,298, or 30% of refinery operating income, for the Current Six Months compared to $1,240,104, or 12%, for the Prior Six Months as a result of decreased total refinery throughput and total refinery production. For the Current Six Months, we had a refinery operating income of $7,872,655 compared to $9,218,032 for the Prior Six Months.
Non-GAAP Reconciliations
Adjusted EBITDA and EBITDA. EBITDA should be considered in conjunction with net income and other performance measures such as operating cash flows. Following is a reconciliation of adjusted EBITDA and EBITDA by business segment for the three and six months ended June 30, 2015 and 2014:
| | | Three Months Ended June 30, 2015 | | | Three Months Ended June 30, 2014 | |
| | | Segment | | | | | | | | | Segment | | | | | | | |
| | | Refinery | | | Pipeline | | | Corporate & | | | | | | Refinery | | | Pipeline | | | Corporate & | | | | |
| | | Operations | | | Transportation | | | Other | | | Total | | | Operations | | | Transportation | | | Other | | | Total | |
| Revenue from operations | | $ | 59,126,052 | | | $ | 35,562 | | | $ | - | | | $ | 59,161,614 | | | $ | 102,998,589 | | | $ | 67,862 | | | $ | - | | | $ | 103,066,451 | |
Less: cost of operations(1) | | | (56,504,401 | ) | | | (127,704 | ) | | | (283,467 | ) | | | (56,915,572 | ) | | | (99,326,771 | ) | | | (122,263 | ) | | | (363,751 | ) | | | (99,812,785 | ) |
| Other non-interest income | | | - | | | | 62,500 | | | | - | | | | 62,500 | | | | - | | | | 83,333 | | | | - | | | | 83,333 | |
| Adjusted EBITDA | | | 2,621,651 | | | | (29,642 | ) | | | (283,467 | ) | | | 2,308,542 | | | | 3,671,818 | | | | 28,932 | | | | (363,751 | ) | | | 3,336,999 | |
Less: JMA Profit Share(2) | | | (938,661 | ) | | | - | | | | - | | | | (938,661 | ) | | | (1,240,104 | ) | | | - | | | | - | | | | (1,240,104 | ) |
| EBITDA | | $ | 1,682,990 | | | $ | (29,642 | ) | | $ | (283,467 | ) | | $ | 1,369,881 | | | $ | 2,431,714 | | | $ | 28,932 | | | $ | (363,751 | ) | | $ | 2,096,895 | |
| | | | | | | | | | | | | | | | | | | | | | | | | | | | | | | | | |
| Depletion, depreciation and amortization | | | | | | | | | | | | | | | (402,937 | ) | | | | | | | | | | | | | | | (391,167 | ) |
| Interest expense, net | | | | | | | | | | | | | | | (728,336 | ) | | | | | | | | | | | | | | | (193,001 | ) |
| | | | | | | | | | | | | | | | | | | | | | | | | | | | | | | | | |
| Income before income taxes | | | | | | | | | | | | | | $ | 238,608 | | | | | | | | | | | | | | | $ | 1,512,727 | |
| | | | | | | | | | | | | | | | | | | | | | | | | | | | | | | | | |
| | | Six Months Ended June 30, 2015 | | | Six Months Ended June 30, 2014 | |
| | | Segment | | | | | | | | | Segment | | | | | | | |
| | | Refinery | | | Pipeline | | | Corporate & | | | | | | Refinery | | | Pipeline | | | Corporate & | | | | |
| | | Operations | | | Transportation | | | Other | | | Total | | | Operations | | | Transportation | | | Other | | | Total | |
| Revenue from operations | | $ | 120,480,006 | | | $ | 73,957 | | | $ | - | | | $ | 120,553,963 | | | $ | 223,657,256 | | | $ | 121,893 | | | $ | - | | | $ | 223,779,149 | |
Less: cost of operations(1) | | | (108,763,871 | ) | | | (181,616 | ) | | | (691,515 | ) | | | (109,637,002 | ) | | | (212,695,349 | ) | | | (244,773 | ) | | | (698,480 | ) | | | (213,638,602 | ) |
Other non-interest income(2) | | | - | | | | 125,000 | | | | - | | | | 125,000 | | | | - | | | | 208,333 | | | | - | | | | 208,333 | |
| Adjusted EBITDA | | | 11,716,135 | | | | 17,341 | | | | (691,515 | ) | | | 11,041,961 | | | | 10,961,907 | | | | 85,453 | | | | (698,480 | ) | | | 10,348,880 | |
Less: JMA Profit Share(3) | | | (3,377,298 | ) | | | - | | | | - | | | | (3,377,298 | ) | | | (1,240,104 | ) | | | - | | | | - | | | | (1,240,104 | ) |
| EBITDA | | $ | 8,338,837 | | | $ | 17,341 | | | $ | (691,515 | ) | | $ | 7,664,663 | | | $ | 9,721,803 | | | $ | 85,453 | | | $ | (698,480 | ) | | $ | 9,108,776 | |
| | | | | | | | | | | | | | | | | | | | | | | | | | | | | | | | | |
| Depletion, depreciation and amortization | | | | | | | | | | | | | | | (802,168 | ) | | | | | | | | | | | | | | | (781,772 | ) |
| Interest expense, net | | | | | | | | | | | | | | | (932,905 | ) | | | | | | | | | | | | | | | (417,581 | ) |
| | | | | | | | | | | | | | | | | | | | | | | | | | | | | | | | | |
| Income before income taxes | | | | | | | | | | | | | | $ | 5,929,590 | | | | | | | | | | | | | | | $ | 7,909,423 | |
| | | | | | | | | | | | | | | | | | | | | | | | | | | | | | | | | |
| (1) | Operation cost within the “Refinery Operations” and “Pipeline Transportation” segments includes related general, administrative, and accretion expenses. Operation cost within “Corporate and Other” includes general and administrative expenses associated with corporate maintenance costs, such as accounting fees, director fees, and legal expense. |
| (2) | Other non-interest income primarily represents easement income from FLNG Land II, Inc. See “Part 1, Item 1. Financial Statements - Note (22) Commitments and Contingencies – FLNG Master Easement Agreement” of this report for further discussion related to easement income. |
| (3) | The JMA Profit Share represents the GEL Profit Share plus the Performance Fee for the period pursuant to the Joint Marketing Agreement. See “Part 1, Item 1. Financial Statements - Note (22) Commitments and Contingencies” and “Part 1, Item 2. Management’s Discussion and Analysis of Financial Condition and Results of Operations – Relationship with Genesis” of this report for further discussion of the Joint Marketing Agreement. |
Refinery Operating Income. The following table provides a reconciliation of refinery operating income to refined product sales, cost of refined products sold, refinery operating expenses, and JMA Profit Share for the periods indicated. For a reconciliation of refined petroleum product sales to total revenue from operations for our consolidated operations, see “Part I, Item 1. Financial Statements – Consolidated Statements of Income” of this report.
| | | Three Months Ended June 30, | | | Six Months Ended June 30, | |
| | | 2015 | | | 2014 | | | 2015 | | | 2014 | |
| | | | | | | | | | | | | |
| Total refined petroleum product sales | | $ | 58,839,160 | | | $ | 102,716,073 | | | $ | 119,906,222 | | | $ | 223,092,224 | |
| Less: Cost of refined petroleum products sold | | | (53,801,698 | ) | | | (96,622,257 | ) | | | (103,189,147 | ) | | | (207,037,864 | ) |
| Less: Refinery operating expenses | | | (2,586,151 | ) | | | (2,641,205 | ) | | | (5,467,122 | ) | | | (5,596,224 | ) |
| Refinery operating income before JMA Profit Share | | | 2,451,311 | | | | 3,452,611 | | | | 11,249,953 | | | | 10,458,136 | |
| Less: JMA Profit Share | | | (938,661 | ) | | | (1,240,104 | ) | | | (3,377,298 | ) | | | (1,240,104 | ) |
| | | | | | | | | | | | | | | | | |
| Refinery operating income | | $ | 1,512,650 | | | $ | 2,212,507 | | | $ | 7,872,655 | | | $ | 9,218,032 | |
| | | | | | | | | | | | | | | | | |
| Total refined petroleum product sales (bbls) | | | 896,706 | | | | 918,108 | | | | 1,923,590 | | | | 1,994,872 | |
Refinery Operations Business Segment Results
Definitions
For our refinery operations business segment results, we refer to certain refinery throughput and production data in the explanation of our period over period changes in results of operations. Below are general definitions of what those items include and represent:
| ● | Operating Days – The number of days in a calendar period in which the Nixon Facility operated. Downtime is excluded from operating days. |
| ● | Downtime – Scheduled or unscheduled periods in which the Nixon Facility is not operable. Downtime may be required for a variety of reasons, including maintenance, inspection and equipment repair, voluntary regulatory compliance measures, and cessation or suspension by regulatory authorities. The safe and reliable operation of the Nixon Facility is key to our financial performance and results of operations. Downtime may result in lost margin opportunity, increased maintenance expense, and a reduction in cash available for payment of our obligations. |
| ● | Total Refinery Throughput – Refers to the volume processed as input through the Nixon Facility. Refinery throughput includes crude oil and condensate and other feedstocks. |
| ● | Total Refinery Production – Refers to the volume processed as output through the Nixon Facility. Refinery production includes finished petroleum products, such as jet fuel, and intermediate petroleum products, such as naphtha, LPG and AGO. |
| ● | Capacity Utilization Rate –A percentage measure that indicates the amount of available capacity that is being used at the Nixon Facility. The rate is calculated by dividing total refinery throughput on a bpd basis or total refinery production on a bpd basis by the total capacity of the Nixon Facility, which is currently 15,000 bpd. |
Refinery Throughput and Production Data
Following are refinery operational metrics for the Nixon Facility:
| | | Three Months Ended June 30, | | | Six Months Ended June 30, | |
| | | 2015 | | | 2014 | | | 2015 | | | 2014 | |
| | | | | | | | | | | | | |
| Operating Days | | | 80 | | | | 84 | | | | 170 | | | | 174 | |
| Downtime | | | 11 | | | | 7 | | | | 11 | | | | 7 | |
| | | | | | | | | | | | | | | | | |
| Total refinery throughput | | | | | | | | | | | | | | | | |
| bbls | | | 914,950 | | | | 968,259 | | | | 1,977,338 | | | | 2,060,267 | |
| bpd | | | 11,437 | | | | 11,527 | | | | 11,631 | | | | 11,841 | |
| | | | | | | | | | | | | | | | | |
| Total refinery production | | | | | | | | | | | | | | | | |
| bbls | | | 896,123 | | | | 949,645 | | | | 1,940,333 | | | | 2,023,283 | |
| bpd | | | 11,202 | | | | 11,305 | | | | 11,414 | | | | 11,628 | |
| | | | | | | | | | | | | | | | | |
| Capacity utilization rate | | | | | | | | | | | | | | | | |
| refinery throughput | | | 76.2 | % | | | 76.8 | % | | | 77.5 | % | | | 78.9 | % |
| refinery production | | | 74.7 | % | | | 75.4 | % | | | 76.1 | % | | | 77.5 | % |
| Note: | The difference between total refinery throughput (volume processed as input) and total refinery production (volume processed as output) represents refinery fuel and energy loss. |
Three Months Ended June 30, 2015 Compared to Three Months Ended June 30, 2014
Operating Days. The Nixon Facility operated for a total of 80 days in the Current Quarter compared to operating for a total of 84 days in the Prior Quarter.
Downtime. The Nixon Facility experienced 11 days of downtime in the Current Quarter compared to 7 days of downtime in the Prior Quarter. Downtime in the Current Quarter related to unscheduled maintenance and a maintenance turnaround. Downtime in the Prior Quarter related to a maintenance turnaround.
Total Refinery Throughput. For the Current Quarter, the Nixon Facility processed 914,950 bbls, or 11,437 bpd, of crude oil and condensate compared to 968,259 bbls, or 11,527 bpd, of crude oil and condensate for the Prior Quarter. As a result of downtime, total refinery throughput decreased 53,309 bbls, or approximately 6%, for the Current Quarter compared to the Prior Quarter, which represented a decrease of 90 bpd.
Total Refinery Production. For the Current Quarter, the Nixon Facility produced 896,123 bbls, or 11,202 bpd, of refined petroleum products compared to 949,645 bbls, or 11,305 bpd, of refined petroleum products for the Prior Quarter. As a result of downtime, total refinery production decreased 53,522 bbls, or approximately 6%, for the Current Quarter compared to the Prior Quarter, which represented a decrease of 103 bpd.
Capacity Utilization Rate. The capacity utilization rate for refinery throughput for the Current Quarter was 76.2% compared to 76.8% for the Prior Quarter, reflecting a nominal decrease of less than 1%. The capacity utilization rate for refinery production for the Current Quarter was 74.7% compared to 75.4% for the Prior Quarter, reflecting a nominal decrease of less than 1%.
Six Months Ended June 30, 2015 Compared to Six Months Ended June 30, 2014
Operating Days. The Nixon Facility operated for a total of 170 days in the Current Six Months and for a total of 174 days in the Prior Six Months.
Downtime. The Nixon Facility experienced 11 days of downtime in the Current Six Months compared to 7 days of downtime in the Prior Six Months. Downtime in the Current Six Months related to unscheduled maintenance and a maintenance turnaround. Downtime in the Prior Six Months related to a maintenance turnaround.
Total Refinery Throughput. For the Current Six Months, the Nixon Facility processed 1,977,338 bbls, or 11,631 bpd, of crude oil and condensate compared to 2,060,267 bbls, or 11,841 bpd, of crude oil and condensate for the Prior Six Months. As a result of downtime, total refinery throughput decreased 82,929 bbls, or approximately 4%, for the Current Six Months, which represented a decrease of 210 bpd.
Total Refinery Production. For the Current Six Months, the Nixon Facility produced 1,940,333 bbls, or 11,414 bpd, of refined petroleum products compared to 2,023,283 bbls, or 11,628 bpd, of refined petroleum products for the Prior Six Months. As a result of downtime, total refinery production decreased 82,950 bbls, or approximately 4%, for the Current Six Months compared to the Prior Six Months, which represented a decrease of 214 bpd.
Capacity Utilization Rate. The capacity utilization rate for refinery throughput for the Current Six Months was 77.5% compared to 78.9% for the Prior Six Months, reflecting a nominal decrease of 1.4%. The capacity utilization rate for refinery production for the Current Six Months was 76.1% compared to 77.5% for the Prior Six Months, reflecting a nominal decrease of 1.4%.
Refined Petroleum Product Sales Summary
All of our refined petroleum products are currently sold in the United States. The following tables summarize total refined petroleum product sales by distillation (from light to heavy):
| | | Three Months Ended June 30, | | | Six Months Ended June 30, | |
| | | 2015 | | | 2014 | | | 2015 | | | 2014 | |
| | | | | | | | | | | | | | | | | | | | | | | | | |
| LPG mix | | $ | 234,184 | | | | 0.4 | % | | $ | 367,497 | | | | 0.4 | % | | $ | 291,492 | | | | 0.2 | % | | $ | 524,022 | | | | 0.2 | % |
| Naphtha | | | 13,413,484 | | | | 22.7 | % | | | 25,094,263 | | | | 24.4 | % | | | 26,829,683 | | | | 22.4 | % | | | 53,865,261 | | | | 24.2 | % |
| Jet fuel | | | 17,411,470 | | | | 29.6 | % | | | 19,602,651 | | | | 19.1 | % | | | 33,930,973 | | | | 28.3 | % | | | 39,637,642 | | | | 17.8 | % |
| NRLM | | | - | | | | 0.0 | % | | | 23,962,082 | | | | 23.3 | % | | | - | | | | 0.0 | % | | | 62,729,475 | | | | 28.1 | % |
| HOBM | | | 13,622,360 | | | | 23.2 | % | | | 7,227,076 | | | | 7.0 | % | | | 31,031,439 | | | | 25.9 | % | | | 7,227,076 | | | | 3.2 | % |
| AGO | | | 14,157,662 | | | | 24.1 | % | | | 26,462,504 | | | | 25.8 | % | | | 27,822,635 | | | | 23.2 | % | | | 59,108,748 | | | | 26.5 | % |
| | | | | | | | | | | | | | | | | | | | | | | | | | | | | | | | | |
| | | $ | 58,839,160 | | | | 100.0 | % | | $ | 102,716,073 | | | | 100.0 | % | | $ | 119,906,222 | | | | 100.0 | % | | $ | 223,092,224 | | | | 100.0 | % |
On May 31, 2014, we ceased production of Non-Road, Locomotive and Marine (“NRLM”), a transportation-related diesel fuel product. On June 1, 2014, we began producing heavy oil-based mud blendstock (“HOBM”), a non-transportation lubricant blend product. The shift in product slate from NRLM to HOBM was the result of the Environmental Protection Agency’s (the “EPA’s”) phased-in requirements for small refineries to reduce the sulfur content in transportation-related diesel fuel, such as NRLM, to a maximum of 15 parts per million (“ppm”) sulfur by June 1, 2014. “Topping units,” like the Nixon Facility, typically lack a desulfurization process unit to lower sulfur content levels within the range required by the EPA’s revised fuel quality standards, and integration of such a unit generally requires additional permitting and significant capital expenditures. We can produce and sell a low sulfur diesel as a feedstock to other refineries and blenders in the United States and as a finished petroleum product to other countries.
Refined Petroleum Product Economic Hedges
Operation cost within our refinery operations business segment includes the effect of economic hedges on our refined petroleum product inventories. For the Current Quarter, our refinery operations business segment recognized a realized loss of $1,451,483 and an unrealized gain of $81,190. For the Prior Quarter, our refinery operations business segment recognized a realized loss of $398,639 and an unrealized gain of $171,500. For the Current Six Months, our refinery operations business segment recognized a realized gain of $24,291 and an unrealized loss of $467,000. For the Prior Six Months, our refinery operations business segment recognized a realized loss of $453,109 and an unrealized gain of $44,400.
Critical Accounting Policies
Long-Lived Assets
Refinery and Facilities. Additions to refinery and facilities are capitalized. Expenditures for repairs and maintenance are included as operating expenses under the Operating Agreement and covered by LEH (see “Part I, Item 1. Financial Statements – Note (10) Accounts Payable, Related Party and Note (23) Subsequent Events” in this report for additional disclosures related to the Operating Agreement). Management expects to continue making improvements to the Nixon Facility based on technological advances.
Refinery and facilities are carried at cost. Adjustment of the asset and the related accumulated depreciation accounts are made for refinery and facilities’ retirements and disposals, with the resulting gain or loss included in the consolidated statements of income. For financial reporting purposes, depreciation of refinery and facilities is computed using the straight-line method using an estimated useful life of 25 years beginning when the refinery and facilities are placed in service. We did not record any impairment of our refinery and facilities for the three and six months ended June 30, 2015 and 2014.
Pipelines and Facilities Assets. We record pipelines and facilities at the lower of cost or net realizable value. Depreciation is computed using the straight-line method over estimated useful lives ranging from 10 to 22 years. In accordance with FASB ASC guidance on accounting for the impairment or disposal of long-lived assets, assets are grouped and evaluated for impairment based on the ability to identify separate cash flows generated therefrom.
Construction in Progress. Construction in progress expenditures, which related to refurbishment activities at the Nixon Facility, are capitalized as incurred. Depreciation begins once the asset is placed in service.
Revenue Recognition
We sell various refined petroleum products including jet fuel, naphtha, distillates, and AGO. Revenue from refined petroleum product sales is recognized when title passes. Title passage occurs when refined petroleum products are sold or delivered in accordance with the terms of the respective sales agreements. Revenue is recognized when sales prices are fixed or determinable and collectability is reasonably assured.
Customers assume the risk of loss when title is transferred. Transportation, shipping and handling costs incurred are included in cost of refined products sold. Excise and other taxes that are collected from customers and remitted to governmental authorities are not included in revenue.
Tank rental fees are invoiced monthly in accordance with the terms of the related lease agreement and recognized in revenue as earned. Land easement revenue is recognized monthly as earned and included in other income.
Revenue from our pipeline operations is derived from fee-based contracts and is typically based on transportation fees per unit of volume transported multiplied by the volume delivered. Revenue is recognized when volumes have been physically delivered for the customer through the pipeline.
Asset Retirement Obligations
FASB ASC guidance related to AROs requires that a liability for the discounted fair value of an ARO be recorded in the period in which it is incurred and the corresponding cost capitalized by increasing the carrying amount of the related long-lived asset. The liability is accreted towards its future value each period, and the capitalized cost is depreciated over the useful life of the related asset. If the liability is settled for an amount other than the recorded amount, a gain or loss is recognized.
Management has concluded that there is no legal or contractual obligation to dismantle or remove the refinery and facilities. Further, management believes that these assets have indeterminate lives under FASB ASC guidance for estimating AROs because dates or ranges of dates upon which we would retire these assets cannot reasonably be estimated at this time. When a date or range of dates can reasonably be estimated for the retirement of these assets, we will estimate the cost of performing the retirement activities and record a liability for the fair value of that cost using present value techniques.
We recorded an ARO liability related to future asset retirement costs associated with dismantling, relocating or disposing of our offshore platform, pipeline systems and related onshore facilities, as well as plugging and abandoning wells and restoring land and sea beds. We developed these cost estimates for each of our assets based upon regulatory requirements, structural makeup, water depth, reservoir characteristics, reservoir depth, equipment demand, current retirement procedures, and construction and engineering consultations. Because these costs typically extend many years into the future, estimating future costs are difficult and require management to make judgments that are subject to future revisions based upon numerous factors, including changing technology, political, and regulatory environments. We review our assumptions and estimates of future abandonment costs on an annual basis.
Income Taxes
We account for income taxes under FASB ASC guidance related to income taxes, which requires recognition of income taxes based on amounts payable with respect to the current year and the effects of deferred taxes for the expected future tax consequences of events that have been included in our financial statements or tax returns. Under this method, deferred tax assets and liabilities are determined based on the differences between the financial accounting and tax basis of assets and liabilities, as well as for operating losses and tax credit carryforwards using enacted tax rates in effect for the year in which the differences are expected to reverse.
As of each reporting date, management considers new evidence, both positive and negative, to determine the realizability of deferred tax assets. Management considers whether it is more likely than not that some portion or all of the deferred tax assets will be realized, which is dependent upon the generation of future taxable income prior to the expiration of any NOL carryforwards. When management determines that it is more likely than not that a tax benefit will not be realized, a valuation allowance is recorded to reduce deferred tax assets.
In assessing the realizability of deferred tax assets, management considers whether it is more likely than not that some portion or all of the deferred tax assets will be realized. The ultimate realization of deferred tax assets is dependent upon the generation of future taxable income prior to the expiration of any NOL carryforwards.
The guidance also prescribes a recognition threshold and measurement attribute for the financial statement recognition and measurement of a tax position taken or expected to be taken in a tax return, as well as guidance on derecognition, classification, interest and penalties, accounting in interim periods, disclosures, and transition.
See “Part I, Item 1. Financial Statements - Note (18) Income Taxes” of this report for further information related to income taxes.
Recently Adopted Accounting Guidance
The guidance issued by the FASB during the three and six months ended June 30, 2015 is not expected to have a material effect on our consolidated financial statements.
Liquidity and Capital Resources
Sources and Uses of Cash
LEH manages and operates all of our properties pursuant to the Operating Agreement. For services rendered, LEH receives reimbursements and fees. We rely on our profit share distribution under the Joint Marketing Agreement and LEH to fund our working capital requirements. During months in which we receive no profit share distribution under the Joint Marketing Agreement, LEH may, but is not required to, fund our operating losses. Amounts funded by LEH are reflected in accounts payable, related party in our consolidated balance sheets. At June 30, 2015 and December 31, 2014, we had cash and cash equivalents of $2,508,514 and $1,293,233, respectively.
In the normal course of business, we make estimates and assumptions related to amounts expensed for fees under the Operating Agreement since actual amounts can vary depending upon production volumes. We then use the cumulative catch-up method to account for revisions in estimates, which may result in prepaid expenses or accounts payable, related party on our consolidated balance sheets. At June 30, 2015, we were in a prepaid position with respect to fees and reimbursements under the Operating Agreement. Prepaid related party operating expenses totaled $168,074 and $0 at June 30, 2015 and December 31, 2014, respectively. Accounts payable, related party totaled $0 and $1,174,168 at June 30, 2015 and December 31, 2014, respectively. See “Part I, Item 1. Financial Statements – Note (10) Accounts Payable, Related Party and Note (23) Subsequent Events” of this report for additional disclosures related to the Operating Agreement and related party operating expenses.
We believe that our business strategy will be sufficient to support our operations for the next 12 months. We continue to refurbish key components of the Nixon Facility, including the naphtha stabilizer and depropanizer units. Once operational, the naphtha stabilizer and depropanizer units will improve the overall quality of the naphtha that we produce, allow higher recovery of lighter products that can be sold as LPG mix, and increase the amount of throughput that can be processed by the Nixon Facility.
In June 2015, we announced plans to expand the Nixon Facility in three phases that include: (i) constructing more than 500,000 bbls of petroleum storage tanks, (ii) purchasing and redeploying idle refinery equipment, and (iii) obtaining an additional long-term loan, which would be used to refinance the $3.0 million short-term note with Sovereign and construct an additional 300,000 bbls of petroleum storage tanks. Potential benefits of the Nixon Facility expansion plan include:
| ● | generation of additional revenue from leasing product and crude storage to third parties; |
| ● | crude and product storage capable of supporting refinery throughput of up to 30,000 bbls per day; |
| ● | production of a higher octane gasoline blendstock (reformate) by refurbishing the naphtha reformer; |
| ● | production of ultra low sulfur diesel by refurbishing a light duty hydrotreater; and |
| ● | an increase in the processing capacity and complexity of the Nixon Facility by deploying refurbished refinery equipment to the Nixon Facility, including, among others, a Merox unit, vacuum tower, prefrac tower unit, and LPG fractionator. |
Execution of our business strategy depends on several factors, including our future performance, levels of accounts receivable, inventories, accounts payable, capital expenditures, adequate access to credit, and the financial flexibility to attract long-term capital on satisfactory terms. These factors may be impacted by general economic, political, financial, competitive, and other factors beyond our control. There can be no assurance that our business strategy will achieve the anticipated outcomes, or that LEH will continue to fund our working capital requirements during months in which we have operational losses. In the event our business strategy is unsuccessful, or our working capital requirements are not funded by our profit share distribution or LEH, we may experience a significant and material adverse effect on our operations, liquidity, and financial condition.�� See “Part I, Item 1A. Risk Factors” of our annual report on Form 10-K for the year ended December 31, 2014 for risk factors related to working capital, liquidity and Nixon Facility downtime.
Remainder of Page Intentionally Left Blank
Cash Flow
Our cash flow from operations for the periods indicated was as follows:
| | | Three Months Ended June 30, | | | Six Months Ended June 30, | |
| | | 2015 | | | 2014 | | | 2015 | | | 2014 | |
| | | | | | | | | | | | | |
| Cash flow from operations | | | | | | | | | | | | |
| Adjusted income from continuing operations | | $ | 1,109,528 | | | $ | 1,795,406 | | | $ | 7,627,462 | | | $ | 8,566,636 | |
| Change in assets and current liabilities | | | (1,641,588 | ) | | | (1,649,007 | ) | | | (5,581,528 | ) | | | (3,220,899 | ) |
| | | | | | | | | | | | | | | | | |
| Total cash flow from (used in) operations | | | (532,060 | ) | | | 146,399 | | | | 2,045,934 | | | | 5,345,737 | |
| | | | | | | | | | | | | | | | | |
| Cash inflows (outflows) | | | | | | | | | | | | | | | | |
| Proceeds from issuance of long-term debt | | | 25,000,000 | | | | - | | | | 25,000,000 | | | | - | |
| Payments on long term debt | | | (8,771,053 | ) | | | (679,785 | ) | | | (9,071,159 | ) | | | (5,946,901 | ) |
| Capital expenditures | | | (4,967,579 | ) | | | (270,693 | ) | | | (6,259,494 | ) | | | (329,871 | ) |
| Proceeds from notes payable | | | 3,000,000 | | | | 2,000,000 | | | | 3,000,000 | | | | 2,000,000 | |
| Payments on notes payble | | | - | | | | (50,599 | ) | | | - | | | | (62,483 | ) |
| | | | | | | | | | | | | | | | | |
| Total cash outflows | | | 761,368 | | | | 998,923 | | | | (830,653 | ) | | | (4,339,255 | ) |
| | | | | | | | | | | | | | | | | |
| Total change in cash flows | | $ | 229,308 | | | $ | 1,145,322 | | | $ | 1,215,281 | | | $ | 1,006,482 | |
| | | | | | | | | | | | | | | | | |
For the Current Quarter, we experienced negative cash flow from operations of $532,060 compared to positive cash flow from operations of $146,399 for the Prior Quarter, which represented a decrease in cash flow from operations of $678,459 for the Current Quarter compared to the Prior Quarter. The significant decrease in cash flow from operations between the periods was related to an increase in restricted cash, which primarily represented: (i) a construction contingency account under which Sovereign will fund contingencies, (ii) a payment reserve account held by Sovereign as security for payments under a loan agreement, and (iii) a certificate of deposit held by Sovereign as security under a loan agreement.
For the Current Six Months, we experienced positive cash flow from operations of $2,045,934 compared to positive cash flow from operations of $5,345,737 for the Prior Six Months, which represented a decrease in cash flow from operations of $3,299,803 for the Current Six Months compared to the Prior Six Months. The decrease in cash flow from operations between the periods was primarily related to an increase in restricted cash as noted above. During the Prior Six Months, a significant portion of our cash flow from operations was used to pay off the Construction and Funding Agreement. As a result, GEL became entitled to receive the JMA Profit Share during the Prior Six Months, the net effect of which increased our expenses and reduced our cash flow from operations for the Current Six Months.
Working Capital
We had working capital of $1,568,383 consisting of $21,299,688 in total current assets and $19,731,305 in total current liabilities, at June 30, 2015. Comparatively, we had a working capital deficit of $3,200,991, consisting of $14,682,657 in total current assets and $17,883,648 in total current liabilities, at December 31, 2014. As of June 30, 2015, we recognized approximately $3.0 million of deferred tax assets that we expect to use over the next twelve months as current rather than long-term. For the six month period, the $4,769,374 improvement in working capital between the periods related to the change in our deferred tax assets, an increase in cash and restricted cash, and a reduction in accrued expenses and other current liabilities. (See the cash flow discussion above related to restricted cash.)
Capital Spending
Capital expenditures in the Current Quarter totaled $4,967,579 compared to $270,693 in the Prior Quarter. Capital expenditures in the Current Six Months totaled $6,259,494 compared to $329,871 in the Prior Six Months. Capital spending primarily related to investments in the Nixon Facility. During the Current Quarter, we completed automation of additional meters, refurbished petroleum storage tanks, acquired idle refinery equipment (in a non-cash transaction), began construction of new petroleum storage tanks, and continued with refurbishment of key components of the naphtha stabilizer and depropanizer units. We are funding capital expenditures at the Nixon Facility primarily through borrowings.
In June 2015, proceeds of the Term Loan Due 2034 were used to refinance approximately $8.5 million of debt owed to American First National Bank. Remaining proceeds will primarily be used to construct new petroleum storage tanks and expand the Nixon Facility. Also in June 2015, we entered into a Loan and Security Agreement with Sovereign as lender for a short term note in the principal amount of $3.0 million (the “Bridge Loan Due 2015”). Proceeds of the Bridge Loan Due 2015 were used to purchase idle refinery equipment for the Nixon Facility.
We entered into a 36 month “build-to-suit” capital lease in August 2014, for the purchase of new boiler equipment for the Nixon Facility. The boiler equipment was delivered in December 2014.
In May 2014, we entered into a Loan and Security Agreement with Sovereign for a short term note in the principal amount of $2.0 million (the “Term Loan Due 2017”). Proceeds of the Term Loan Due 2017 are being used primarily to finance costs associated with refurbishment of the Nixon Facility’s naphtha stabilizer and depropanizer units.
Indebtedness
The principal balance outstanding on our short and long-term debt obligations was as follows:
| | | June 30, | | | December 31, | |
| | | 2015 | | | 2014 | |
| | | | | | | |
| Notes payable | | | | | | |
| Bridge Loan Due 2015 | | $ | 3,000,000 | | | $ | - | |
| Long-term debt | | | | | | | | |
| Term Loan Due 2034 | | | 25,000,000 | | | | - | |
| Notre Dame Debt | | | 1,300,000 | | | | 1,300,000 | |
| Term Loan Due 2017 | | | 1,294,955 | | | | 1,638,898 | |
| Capital Leases | | | 388,166 | | | | 466,401 | |
| Refinery Note | | | - | | | | 8,648,980 | |
| | | | | | | | | |
| | | $ | 30,983,121 | | | $ | 12,054,279 | |
| | | | | | | | | |
See “Part I, Item 1. Financial Statements – Note (11) Notes Payable and Note (14) Long-Term Debt” of this report for additional disclosures related to our short and long-term debt obligations.
ITEM 3. QUANTITATIVE AND QUALITATIVE DISCLOSURES ABOUT MARKET RISK
ITEM 4. CONTROLS AND PROCEDURES
Disclosure Controls and Procedures
Our disclosure controls and procedures, as defined in Exchange Act Rules 13a-15(e) and 15d-15(e), require us to provide reasonable assurance that information required to be disclosed by us in the reports we file or submit under the Exchange Act is recorded, processed, summarized and reported within the time periods specified in the Securities and Exchange Commission’s rules and forms, and information required to be disclosed in the reports we file or submit under the Exchange Act is accumulated and communicated to our management, including our Chief Executive Officer and interim Chief Financial Officer, as appropriate to allow timely decisions regarding required disclosures.
As of the end of the period covered by this report, we carried out an evaluation under the supervision and with the participation of our management, including our Principal Executive Officer and Principal Financial Officer, of the effectiveness of the design and operation of our disclosure controls and procedures as defined in Rules 13a-15(e) and 15d-15(e) under the Securities Exchange Act of 1934 (the “Exchange Act”). Although we have made improvements, our disclosure controls and procedures were ineffective as of June 30, 2015, reflecting the following material weaknesses:
| ● | Inadequate personnel resources to handle complex accounting transactions, which can result in errors related to the recording, disclosure and presentation of consolidated financial information in quarterly, annual and other filings; |
| ● | Lack of formally documented accounting policies and procedures; and |
| ● | Inadequate personnel resources to ensure a complete segregation of duties within the accounting function. |
The effectiveness of any system of controls and procedures is subject to certain limitations, and, as a result, there can be no assurance that our controls and procedures will detect all errors or fraud. A control system, no matter how well conceived and operated, can provide only reasonable, not absolute, assurance that the objectives of the control system will be attained.
Changes in Internal Control over Financial Reporting
During the three months ended June 30, 2015, we took the following steps toward remediating the noted material weakness related to the lack of formally documented accounting policies and procedures:
| ● | developed and implemented a monthly accounting close checklist; |
| ● | instituted a formal process to ensure manual journal entries are reviewed and approved by someone other than the preparer; |
| ● | developed a written capitalization policy for fixed assets and reviewed the policy with our external tax consultant; |
| ● | created a framework to document our internal controls, developed a plan for current year testing, and completed phase one testing of our internal controls framework; and |
| ● | reported internal control testing results with the Audit Committee of the Board. |
We believe that, to date, we have made significant progress towards remediating identified significant deficiencies and material weaknesses in our internal controls over financial reporting. Although we plan to continue with our efforts to fully remediate the identified material weaknesses during the second half of 2015, there can be no assurance that our corrective actions will be sufficient or fully effective, or that we will not discover additional material weaknesses in our internal controls over financial reporting in the future.
PART II OTHER INFORMATION
ITEM 1. LEGAL PROCEEDINGS
From time to time we are subject to various lawsuits, claims, liens and administrative proceedings that arise out of the normal course of business. Vendors have placed mechanic’s liens on certain of our assets primarily as protection during construction activities. Management does not believe that such liens have a material adverse effect on our results of operations.
In addition to the other information set forth in this report, careful consideration should be given to the risk factors discussed under “Part I, Item 1A. Risk Factors” and elsewhere in our previously filed annual report on Form 10-K for the year ended December 31, 2014. These risks and uncertainties could materially and adversely affect our business, financial condition and results of operations. Our operations could also be affected by additional factors that are not presently known to us or by factors that we currently consider immaterial to our business. There have been no material changes in our assessment of our risk factors from those set forth in our previously filed annual report on Form 10-K for the year ended December 31, 2014.
| ITEM 2. UNREGISTERED SALES OF EQUITY SECURITIES AND USE OF PROCEEDS |
None.
ITEM 3. DEFAULTS UPON SENIOR SECURITIES
See “Part I, Item. 1. Financial Statements – Note (11) Notes Payable and Note (14) Long-Term Debt” of this report for disclosures related to potential defaults on debt.
ITEM 4. MINE SAFETY DISCLOSURES
Not applicable.
ITEM 5. OTHER INFORMATION
LEH manages and operates all of our properties pursuant to the Operating Agreement. For services rendered, LEH receives reimbursements and fees. On July 15, 2015, the Operating Agreement was further amended to: (i) clarify excluded costs with respect to payments as defined under the Joint Marketing Agreement by and between GEL Tex Marketing, LLC dated as of August 12, 2011 (as amended, restated, supplemented or otherwise modified from time to time), and (ii) extend the term from August 12, 2015 to August 12, 2018. The effective date of Amendment No. 2 to the Operating Agreement is June 1, 2015. See “Part I, Item 1. Financial Statements – Note (10) Accounts Payable, Related Party and Note (23) Subsequent Events” of this report for additional disclosures related to the Operating Agreement.
(a) Exhibits:
The following exhibits are filed herewith:
| No. | | Description |
| | Amendment No. 2. to Operating Agreement by and between Lazarus Energy Holdings, LLC, Blue Dolphin Energy Company, and Lazarus Energy, LLC effective as of June 1, 2015. |
| | Jonathan P. Carroll Certification Pursuant to 18 U.S.C. Section 1350, as adopted pursuant to section 302 of the Sarbanes-Oxley Act of 2002. |
| | Tommy L. Byrd Certification Pursuant to 18 U.S.C. Section 1350, as adopted pursuant to section 302 of the Sarbanes-Oxley Act of 2002. |
| | Jonathan P. Carroll Certification Pursuant to 18 U.S.C. Section 1350, as adopted pursuant to section 906 of the Sarbanes-Oxley Act of 2002. |
| | Tommy L. Byrd Certification Pursuant to 18 U.S.C. Section 1350, as adopted pursuant to section 906 of the Sarbanes-Oxley Act of 2002. |
| 101.INS | | XBRL Instance Document. |
| 101.SCH | | XBRL Taxonomy Schema Document. |
| 101.CAL | | XBRL Calculation Linkbase Document. |
| 101.LAB | | XBRL Label Linkbase Document. |
| 101.PRE | | XBRL Presentation Linkbase Document. |
| 101.DEF | | XBRL Definition Linkbase Document. |
Pursuant to the requirements of the Securities Exchange Act of 1934, the registrant has duly caused this report to be signed on its behalf by the undersigned, thereunto duly authorized.
| | BLUE DOLPHIN ENERGY COMPANY (Registrant) | |
| | | | |
| | | | |
| | | | |
| | | | |
| Date: August 14, 2015 | By: | /s/ JONATHAN P. CARROLL | |
| | | Jonathan P. Carroll | |
| | | Chairman of the Board, Chief Executive Officer, President, Assistant Treasurer and Secretary (Principal Executive Officer) | |
| | | |
| | | |
| | | |
| | | | |
| Date: August 14, 2015 | By: | /s/ TOMMY L. BYRD | |
| | | Tommy L. Byrd | |
| | | Interim Chief Financial Officer, Treasurer and Assistant Secretary (Principal Financial Officer) | |