Item 1: Report to Shareholders| Capital Appreciation Fund | June 30, 2005 |
The views and opinions in this report were current as of June 30, 2005. They are not guarantees of performance or investment results and should not be taken as investment advice. Investment decisions reflect a variety of factors, and the managers reserve the right to change their views about individual stocks, sectors, and the markets at any time. As a result, the views expressed should not be relied upon as a forecast of the fund’s future investment intent. The report is certified under the Sarbanes-Oxley Act of 2002, which requires mutual funds and other public companies to affirm that, to the best of their knowledge, the information in their financial reports is fairly and accurately stated in all material respects.
REPORTS ON THE WEB
Sign up for our E-mail Program, and you can begin to receive updated fund reports and prospectuses online rather than through the mail. Log in to your account at troweprice.com for more information.
Fellow Shareholders
The stock market struggled in the first half of the year, and the market indices were generally unable to achieve any forward progress. Although there were encouraging signs of improvement during the second quarter, the Standard and Poor’s 500 Stock Index recorded a negative return of 0.81% for the period. The mix of primary investment fundamentals (economic growth, corporate profits, inflation, and long-term interest rates) would normally have been thought of as very supportive to the equity markets. However, investors seemed preoccupied with the stubbornly high price of crude oil and refined products, as well as concerns that further monetary restraint in the form of rising short-term interest rates would cause the economy to slow to a worrisome level.
| PERFORMANCE COMPARISON |
| Periods Ended 6/30/05 | 6 Months | 12 Months |
| Capital Appreciation Fund | 0.97% | 10.72% |
| Capital Appreciation Fund– | | |
| Advisor Class | 0.87 | – |
| S&P 500 Stock Index | -0.81 | 6.32 |
| Lipper Multi-Cap | | |
| Value Funds Index | 0.99 | 10.95 |
Your fund was able to generate a modest return in the first half, and a respectable return of 10.72% for the 12 months ended June 30. These results compared quite favorably with the market index and were in line with the peer group index. As indicated by the performance data on page 10, your fund’s defensive, lower-volatility approach has generated favorable comparative results through the ups and downs of the longer stock market cycle. Returns for the fund’s new Advisor Class shares were slightly lower due to their different fee structure.
PORTFOLIO REVIEW
In our portfolio management, we focus on the longer-term investment objective of providing competitive returns with substantially reduced volatility when compared with the stock market or peer group of funds. Normally, this will result in your fund declining less than the market in an adverse market trend, while not keeping pace in a strongly rising market. Although recent results have been quite favorable in this context, we take a longer-term view and likewise encourage shareholders to evaluate comparative investment returns over a three- to five-year period or a complete market cycle. This perspective allows investors (and the portfolio management team) to tune out distractions from shorter-term market volatility and stay focused on the long-term objective.
The foundation of our investment approach consists of flexible portfolio diversification, rigorous fundamental research, and a disciplined valuation framework. The chart below indicates the diversified nature of the asset mix. At mid-year, stocks represented about 61% of portfolio assets and were primarily responsible for the favorable investment returns over the past 12 months. Convertible securities represented about 16% of assets and contributed modestly to the 12-month return. However, in 2005 the convertible market has been under pressure and has experienced negative returns. Although we reduced our investments in these securities substantially, this exposure was still a drag on results in these recent periods. Over longer periods, we find these hybrid securities appealing in their dual equity and fixed-income features. Our longer-term objective in this segment of the portfolio is to earn a higher return than the broader fixed-income market with significantly less volati lity than the equity markets.
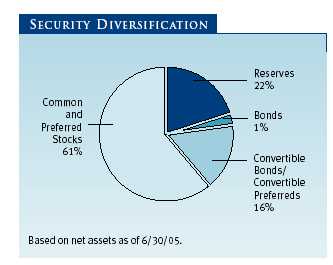
The combined reserves and bond position of 23% is almost completely held in money market investments. Although we know these assets will not contribute materially to our longer-term return objective, they do provide a rising income level to the portfolio while also offering substantial stability during an adverse market period. Advantageously reinvesting these assets into higher-return securities will be one of our most important opportunities in the period ahead. Our priorities for reinvesting these defensive assets are roughly in this order: higher-quality convertible securities, higher-yielding bonds, and larger-capitalization common stocks. Most likely, these opportunities will present themselves in a phase of rising interest rates or a more volatile market environment.
The Sector Diversification table indicates that our equity investments are dispersed across a variety of sectors. Energy and utilities were the standout performers in the first half, with some additional support from consumer staples and health care. The more economically sensitive sectors of materials, industrials, and consumer discretionary exerted the most negative drag in portfolio returns.
| SECTOR DIVERSIFICATION |
| Percent of | Percent of |
| Net Assets | Net Assets |
| 12/31/04 | 6/30/05 |
| Consumer Discretionary | 10.3% | 13.9% |
| Financials | 14.7 | 13.2 |
| Health Care | 8.9 | 9.1 |
| Materials | 11.3 | 8.2 |
| Information Technology | 6.5 | 8.0 |
| Energy | 6.1 | 6.1 |
| Industrials and Business Services | 7.9 | 5.9 |
| Consumer Staples | 4.2 | 5.1 |
| Utilities | 5.1 | 4.5 |
| Telecommunication Services | 3.5 | 3.0 |
| Other and Reserves | 21.5 | 23.0 |
| Total | 100.0% | 100.0% |
| Historical weightings reflect current industry/sector classifications. |
Major changes in the portfolio since the year-end report are detailed in the table following this letter. Purchases are always motivated by our attempts to identify opportunities for future gain. Sometimes this leads us to add to existing holdings, as we did with Time Warner, International Paper, and Microsoft, which have experienced stock price declines and seem to offer more compelling valuations. Usually new portfolio additions are companies that have encountered some business challenge or controversy that caused the stock price to decline. As these shorter-term issues are resolved over time, stocks such as American International Group, First Data, and Boston Scientific are expected to provide rewarding investment opportunity. The situation with General Motors is somewhat different in that its problems of lost market share, excess capacity, and burdensome labor and health care costs are well known and seemingly intractable. Yet we are attracted to the company’s fixed-income securities, which we believe offer equity-like returns with a relatively comfortable probability of success. The combined holding consists of two convertible securities with higher yields and other attractive features, and a bond obligation of the GMAC finance operation. (Please refer to our portfolio of investments for a complete listing of our holdings and the amount each represents of the portfolio.)
Sales are prompted for a variety of reasons. In most cases they reflect situations in which your fund has achieved a substantial gain and is booking the profit. Dow Chemical, Phelps Dodge, UnumProvident, and PPL are such examples. Sometimes merger and acquisition activity prompts a sale, as was the case with Unocal and R.R. Donnelley.
Sometimes certain holdings, such as Nucor and TXU have experienced large price gains, and we are reducing the portfolio positions to a more modest level. This recycling process of reducing exposure to stocks that have done well and reinvesting into stocks that have experienced market difficulty is an important ongoing element of our investment approach.
OUTLOOK
We believe the investment fundamentals should remain supportive of further gains in the equity market in the period ahead. We do believe it is appropriate to maintain a more modest set of expectations, recognizing that the economic expansion that began in 2001 will pass the four-year mark this fall, and this rising phase of the stock market cycle will cross its three-year anniversary as well. In an environment of 6% nominal (including inflation) GDP growth, corporate profits typically advance at a 6% to 8% rate. Equity returns of a similar rate would be considered reasonable in the context of current inflation and interest rate levels. We believe there will be reasonably good investment opportunities for the patient investor in this type of environment.
IN CLOSING
I believe it is appropriate when reflecting upon my 32 years at T. Rowe Price Associates to plan for a transition of the primary portfolio management responsibility for your fund. This will be a gradual process that we anticipate will be in place before the end of 2006. The Investment Advisory Committee that oversees your fund is a talented and experienced group of investment professionals comprising research analysts, fixed-income specialists, and senior portfolio managers. I expect this team to remain largely intact after the transition, and you can be confident that we will give the same attention and commitment to this process that we bring to the investment management of your fund.
As always, we respect and appreciate the confidence and trust you have placed in us.
Respectfully submitted,

Stephen W. Boesel
President of the fund and chairman of its Investment Advisory Committee
July 20, 2005
The committee chairman has day-to-day responsibility for managing the portfolio and works with committee members in developing and executing the fund’s investment program.
RISKS OF INVESTING
As with all stock and bond mutual funds, the fund’s share price can fall because of weakness in the stock or bond markets, a particular industry, or specific holdings. Stock markets can decline for many reasons, including adverse political or economic developments, changes in investor psychology, or heavy institutional selling. The prospects for an industry or company may deteriorate because of a variety of factors, including disappointing earnings or changes in the competitive environment. In addition, the investment manager’s assessment of companies held in a fund may prove incorrect, resulting in losses or poor performance even in rising markets. A sizable cash or fixed-income position may hinder the fund from participating fully in a strong, rapidly rising bull market. In addition, significant exposure to bonds increases the risk that the fund’s share value could be hurt by rising interest rates or credit downgrades or defaults. Convertible securities are also exposed to price fluctuations of the company’s stock.
GLOSSARY
Lipper indexes: Fund benchmarks that consist of a small number of the largest mutual funds in a particular category as tracked by Lipper Inc.
S&P 500 Stock Index: An unmanaged index that tracks the stocks of 500 primarily large-cap U.S. companies.
| PORTFOLIO HIGHLIGHTS |
| |
| TWENTY-FIVE LARGEST HOLDINGS | |
| | Percent of |
| | Net Assets |
| | 6/30/05 |
| |
| Microsoft | 2.4% |
| General Mills | 1.9 |
| Newell Rubbermaid | 1.9 |
| Amerada Hess | 1.8 |
| Marsh & McLennan | 1.6 |
| International Paper | 1.5 |
| American International Group | 1.5 |
| Liberty Media | 1.5 |
| Time Warner | 1.5 |
| Wyeth | 1.4 |
| Newmont Mining | 1.4 |
| AmerisourceBergen | 1.3 |
| Potash Corp./Saskatchewan | 1.3 |
| GM | 1.3 |
| First Data | 1.2 |
| Genworth Financial | 1.1 |
| Coca-Cola | 1.1 |
| Tyco International | 1.1 |
| Loews | 1.1 |
| FirstEnergy | 1.0 |
| Duke Energy | 1.0 |
| Altria Group | 1.0 |
| Comcast | 1.0 |
| Murphy Oil | 1.0 |
| Sprint | 1.0 |
| Total | 33.9% |
| |
| Note: Table excludes investments in the T. Rowe Price Reserve Investment Fund. | |
| PORTFOLIO HIGHLIGHTS |
| |
| MAJOR PORTFOLIO CHANGES | |
| Listed in descending order of size | |
| |
| 6 Months Ended 6/30/05 | |
| |
| Largest Purchases | Largest Sales |
| |
| American International Group * | Nucor |
| First Data * | Phelps Dodge ** |
| Coca-Cola * | TXU |
| Boston Scientific * | XL Capital ** |
| General Motors Corp. * | PPL ** |
| Time Warner | Dow Chemical ** |
| Microsoft | Unocal ** |
| International Paper | UnumProvident ** |
| General Motors Acceptance Corp. * | Unocal Capital Trust ** |
| RadioShack * | R.R. Donnelley ** |
| * | Position added |
| ** | Position eliminated |
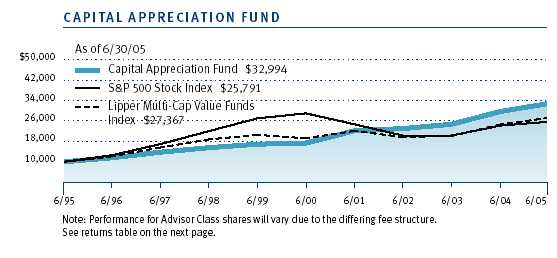
This chart shows the value of a hypothetical $10,000 investment in the fund over the past 10 fiscal year periods or since inception (for funds lacking 10-year records). The result is compared with benchmarks, which may include a broad-based market index and a peer group average or index. Market indexes do not include expenses, which are deducted from fund returns as well as mutual fund averages and indexes.
| AVERAGE ANNUAL COMPOUND TOTAL RETURN |
| |
| This table shows how the fund and its benchmarks would have performed if their actual (or |
| cumulative) returns for the periods shown had been earned at a constant rate. |
| |
| | | | | Since | Inception |
| Periods Ended 6/30/05 | 1 Year | 5 Years | 10 Years | Inception | Date |
| Capital Appreciation Fund | 10.72% | 13.64% | 12.68% | – | – |
| S&P 500 Stock Index | 6.32 | -2.37 | 9.94 | – | – |
| Lipper Multi-Cap Value | | | | | |
| Funds Index | 10.95 | 7.28 | 10.59 | – | – |
| Capital Appreciation Fund– | | | | | |
| Advisor Class | – | – | – | 0.87% | 12/31/04 |
| S&P 500 Stock Index | – | – | – | -0.81 | – |
| Lipper Multi-Cap Value | | | | | |
| Funds Index | – | – | – | 0.99 | – |
| |
| Current performance may be higher or lower than the quoted past performance, which can- |
| not guarantee future results. Share price, principal value, and return will vary, and you may |
| have a gain or loss when you sell your shares. For the most recent month-end performance |
| information, please visit our Web site (troweprice.com) or contact a T. Rowe Price represen- |
| tative at 1-800-225-5132. | | | | | |
| | | | | | |
| Average annual total return figures include changes in principal value, reinvested dividends, and capital |
| gain distributions. Returns do not reflect taxes that the shareholder may pay on fund distributions or the |
| redemption of fund shares. When assessing performance, investors should consider both short- and long- |
| term returns. | | | | | |
As a mutual fund shareholder, you may incur two types of costs: (1) transaction costs such as redemption fees or sales loads and (2) ongoing costs, including management fees, distribution and service (12b-1) fees, and other fund expenses. The following example is intended to help you understand your ongoing costs (in dollars) of investing in the fund and to compare these costs with the ongoing costs of investing in other mutual funds. The example is based on an investment of $1,000 invested at the beginning of the most recent six-month period and held for the entire period.
Please note that the fund has two share classes: The original share class (“investor class”) charges no distribution and service (12b-1) fee. Advisor Class shares are offered only through unaffiliated brokers and other financial intermediaries and charge a 0.25% 12b-1 fee. Each share class is presented separately in the table.
Actual Expenses
The first line of the following table (“Actual”) provides information about actual account values and expenses based on the fund’s actual returns. You may use the information in this line, together with your account balance, to estimate the expenses that you paid over the period. Simply divide your account value by $1,000 (for example, an $8,600 account value divided by $1,000 = 8.6), then multiply the result by the number in the first line under the heading “Expenses Paid During Period” to estimate the expenses you paid on your account during this period.
Hypothetical Example for Comparison Purposes
The information on the second line of the table (“Hypothetical”) is based on hypothetical account values and expenses derived from the fund’s actual expense ratio and an assumed 5% per year rate of return before expenses (not the fund’s actual return). You may compare the ongoing costs of investing in the fund with other funds by contrasting this 5% hypothetical example and the 5% hypothetical examples that appear in the shareholder reports of the other funds. The hypothetical account values and expenses may not be used to estimate the actual ending account balance or expenses you paid for the period.
Note: T. Rowe Price charges an annual small-account maintenance fee of $10, generally for accounts with less than $2,000 ($500 for UGMA/UTMA). The fee is waived for any investor whose T. Rowe Price mutual fund accounts total $25,000 or more, accounts employing automatic investing, and IRAs and other retirement plan accounts that utilize a prototype plan sponsored by T. Rowe Price (although a separate custodial or administrative fee may apply to such accounts). This fee is not included in the accompanying table. If you are subject to the fee, keep it in mind when you are estimating the ongoing expenses of investing in the fund and when comparing the expenses of this fund with other funds.
You should also be aware that the expenses shown in the table highlight only your ongoing costs and do not reflect any transaction costs, such as redemption fees or sales loads. Therefore, the second line of the table is useful in comparing ongoing costs only and will not help you determine the relative total costs of owning different funds. To the extent a fund charges transaction costs, however, the total cost of owning that fund is higher.
| T. ROWE PRICE CAPITAL APPRECIATION FUND |
| |
| | Beginning | Ending | Expenses Paid |
| | Account Value | Account Value | During Period* |
| | 1/1/05 | 6/30/05 | 1/1/05 to 6/30/05 |
| Investor Class | | | |
| Actual | $1,000.00 | $1,009.70 | $3.84 |
| Hypothetical (assumes 5% | | | |
| return before expenses) | 1,000.00 | 1,020.98 | 3.86 |
| Advisor Class | | | |
| Actual | 1,000.00 | 1,008.70 | 5.48 |
| Hypothetical (assumes 5% | | | |
| return before expenses) | 1,000.00 | 1,019.34 | 5.51 |
| * Expenses are equal to the fund’s annualized expense ratio for the six-month period, multiplied by the |
| average account value over the period, multiplied by the number of days in the most recent fiscal half |
| year (181) divided by the days in the year (365) to reflect the half-year period. The annualized expense |
| ratio of the Investor Class was 0.77%, the Advisor Class was 1.10%. |
Unaudited
| FINANCIAL HIGHLIGHTS | For a share outstanding throughout each period |
| |
| Investor Class | | | | | | | | | | | | |
| | | 6 Months | | Year | | | | | | | | |
| | | Ended | | Ended | | | | | | | | |
| | | 6/30/05** | | 12/31/04 | | 12/31/03 | | 12/31/02 | | 12/31/01 | | 12/31/00 |
| NET ASSET VALUE | | | | | | | | | | | | |
| Beginning of period | $ | 19.49 | $ | 17.50 | $ | 14.21 | $ | 14.64 | $ | 13.95 | $ | 12.51 |
|
|
| |
| Investment activities | | | | | | | | | | | | |
| Net investment | | | | | | | | | | | | |
| income (loss) | | 0.15 | | 0.29 | | 0.25 | | 0.33 | | 0.39 | | 0.44 |
| Net realized and | | | | | | | | | | | | |
| unrealized gain (loss) | | 0.04 | | 2.38 | | 3.36 | | (0.25) | | 1.03 | | 2.27 |
|
|
| Total from | | | | | | | | | | | | |
| investment activities | | 0.19 | | 2.67 | | 3.61 | | 0.08 | | 1.42 | | 2.71 |
|
|
| |
| Distributions | | | | | | | | | | | | |
| Net investment income | | – | | (0.29) | | (0.26) | | (0.28) | | (0.38) | | (0.45) |
| Net realized gain | | – | | (0.39) | | (0.06) | | (0.23) | | (0.35) | | (0.82) |
|
|
| Total distributions | | – | | (0.68) | | (0.32) | | (0.51) | | (0.73) | | (1.27) |
|
|
| |
| NET ASSET VALUE | | | | | | | | | | | | |
| End of period | $ | 19.68 | $ | 19.49 | $ | 17.50 | $ | 14.21 | $ | 14.64 | $ | 13.95 |
|
|
| |
| |
| Ratios/Supplemental Data | | | | | | | | | | |
| Total return^ | | 0.97% | | 15.29% | | 25.47% | | 0.54%* | | 10.26% | | 22.17% |
| Ratio of total expenses to | | | | | | | | | | | | |
| average net assets | | 0.77%† | | 0.78% | | 0.83% | | 0.85% | | 0.86% | | 0.87% |
| Ratio of net investment | | | | | | | | | | | | |
| income (loss) to average | | | | | | | | | | | | |
| net assets | | 1.56%† | | 1.84%+ | | 1.85% | | 2.39% | | 2.85% | | 3.22% |
| Portfolio turnover rate | | 13.4%† | | 17.6% | | 17.9% | | 17.6% | | 25.1% | | 32.4% |
| Net assets, end of period | | | | | | | | | | | | |
| (in millions) | $ | 6,353 | $ | 4,962 | $ | 2,942 | $ | 1,853 | $ | 1,405 | $ | 914 |
| * | Includes 0.07% effect of payment from the manager – See Note 4. |
| ^ | Total return reflects the rate that an investor would have earned on an investment in the fund during each period, |
| | assuming reinvestment of all distributions. |
| † | Annualized |
| + | Includes the effect of a one-time special dividend (0.29% of average net assets) that is not expected to recur. |
| ** Per share amounts calculated using average shares outstanding method. |
The accompanying notes are an integral part of these financial statements.
Unaudited
| FINANCIAL HIGHLIGHTS | For a share outstanding throughout the period |
| Advisor Class | | |
| | | 6 Months |
| | | Ended |
| | | 6/30/05** |
| NET ASSET VALUE | | |
| Beginning of period | $ | 19.49 |
|
|
| |
| Investment activities | | |
| Net investment income (loss) | | 0.09* |
| Net realized and unrealized gain (loss) | | 0.08 |
|
|
| Total from investment activities | | 0.17 |
|
|
| |
| NET ASSET VALUE | | |
| End of period | $ | 19.66 |
|
|
| |
| |
| Ratios | | |
| Total return^ | | 0.87%* |
| Ratio of total expenses to | | |
| average net assets | | 1.10%*† |
| Ratio of net investment | | |
| income (loss) to average | | |
| net assets | | 1.34%*† |
| Portfolio turnover rate | | 13.4%† |
| Net assets, end of period | | |
| (in thousands) | $ | 7,247 |
| ^ | Total return reflects the rate that an investor would have earned on an investment in the fund during the period, |
| | assuming reinvestment of all distributions. |
| † | Annualized |
| ** Per share amounts calculated using average shares outstanding method. |
| * | Excludes expenses in excess of a 1.10% contractual expense limitation in effect through 4/30/06. |
The accompanying notes are an integral part of these financial statements.
Unaudited
| PORTFOLIO OF INVESTMENTS (1) | Shares/$ Par | Value |
| (Cost and value in $ 000s) | | |
| | | |
| COMMON STOCKS 61.0% | | |
| |
| CONSUMER DISCRETIONARY 9.1% | | |
| Diversified Consumer Services 0.5% | | |
| ServiceMaster | 2,485,000 | 33,299 |
| | | 33,299 |
| Hotels, Restaurants & Leisure 0.3% | | |
| Marriott, Class A | 260,000 | 17,737 |
| | | 17,737 |
| Household Durables 1.7% | | |
| Fortune Brands | 420,000 | 37,296 |
| Newell Rubbermaid | 2,895,000 | 69,017 |
| | | 106,313 |
| Leisure Equipment & Products 0.5% | | |
| Hasbro | 1,600,000 | 33,264 |
| | | 33,264 |
| Media 4.6% | | |
| Comcast, Class A * | 2,088,000 | 64,102 |
| Disney | 587,000 | 14,781 |
| Meredith | 685,000 | 33,606 |
| New York Times, Class A | 1,550,000 | 48,282 |
| Time Warner * | 5,565,000 | 92,991 |
| Washington Post, Class B | 48,000 | 40,081 |
| | | 293,843 |
| Specialty Retail 1.5% | | |
| Home Depot | 1,355,000 | 52,710 |
| Petrie Stores Liquidation Trust * | 2,585,000 | 1,099 |
| RadioShack | 1,655,000 | 38,346 |
| | | 92,155 |
| Total Consumer Discretionary | | 576,611 |
| |
| CONSUMER STAPLES 4.2% | | |
| Beverages 1.1% | | |
| Coca-Cola | 1,675,000 | 69,931 |
| | | 69,931 |
| Food & Staples Retailing 0.7% | | |
| CVS | 1,622,000 | 47,151 |
| | | 47,151 |
| Food Products 1.1% | | |
| General Mills | 1,425,000 | 66,676 |
| | | 66,676 |
| Tobacco 1.3% | | |
| Altria Group | 992,000 | 64,143 |
| Carolina Group | 589,500 | 19,642 |
| | | 83,785 |
| Total Consumer Staples | | 267,543 |
| |
| ENERGY 5.0% | | |
| Energy Equipment & Services 0.7% | | |
| Baker Hughes | 920,000 | 47,067 |
| | | 47,067 |
| Oil, Gas & Consumable Fuels 4.3% | | |
| Amerada Hess | 820,000 | 87,338 |
| Chevron | 492,600 | 27,546 |
| Devon Energy | 406,300 | 20,591 |
| Imperial Oil | 384,000 | 31,991 |
| Murphy Oil | 1,220,000 | 63,721 |
| Royal Dutch Petroleum ADS | 665,000 | 43,159 |
| | | 274,346 |
| Total Energy | | 321,413 |
| |
| FINANCIALS 10.6% | | |
| Capital Markets 1.6% | | |
| Charles Schwab | 5,280,000 | 59,558 |
| Lehman Brothers | 395,000 | 39,216 |
| | | 98,774 |
| Commercial Banks 0.2% | | |
| Royal Bank of Scotland (GBP) | 495,000 | 14,915 |
| | | 14,915 |
| Insurance 8.8% | | |
| American International Group | 1,565,000 | 90,926 |
| Assurant | 1,309,000 | 47,255 |
| Genworth Financial, Class A | 1,560,000 | 47,159 |
| Hartford Financial Services | 692,700 | 51,800 |
| Loews | 611,000 | 47,353 |
| Marsh & McLennan | 3,650,000 | 101,105 |
| Prudential | 661,000 | 43,401 |
| SAFECO | 1,018,000 | 55,318 |
| St. Paul Companies | 1,031,000 | 40,755 |
| White Mountains Insurance Group | 51,700 | 32,618 |
| | | 557,690 |
| Total Financials | | 671,379 |
| |
| HEALTH CARE 7.3% | | |
| Health Care Equipment & Supplies 1.7% | | |
| Baxter International | 1,217,000 | 45,151 |
| Boston Scientific * | 2,245,000 | 60,615 |
| | | 105,766 |
| Health Care Providers & Services 2.3% | | |
| AmerisourceBergen | 1,227,581 | 84,887 |
| Cardinal Health | 1,080,000 | 62,187 |
| | | 147,074 |
| Pharmaceuticals 3.3% | | |
| Bristol Myers Squibb | 1,532,000 | 38,269 |
| Merck | 1,771,000 | 54,547 |
| Schering-Plough | 1,512,000 | 28,819 |
| Wyeth | 2,033,000 | 90,468 |
| | | 212,103 |
| Total Health Care | | 464,943 |
| |
| INDUSTRIALS & BUSINESS SERVICES 5.3% | | |
| Aerospace & Defense 1.4% | | |
| Honeywell International | 761,000 | 27,875 |
| Lockheed Martin | 930,000 | 60,329 |
| | | 88,204 |
| Air Freight & Logistics 0.8% | | |
| Ryder System | 1,310,000 | 47,946 |
| | | 47,946 |
| Commercial Services & Supplies 0.4% | | |
| Waste Management | 950,000 | 26,923 |
| | | 26,923 |
| Industrial Conglomerates 0.8% | | |
| Tyco International | 1,763,000 | 51,480 |
| | | 51,480 |
| Machinery 0.8% | | |
| Deere | 790,000 | 51,737 |
| | | 51,737 |
| Road & Rail 1.1% | | |
| Burlington Northern Santa Fe | 638,000 | 30,037 |
| CSX | 925,000 | 39,461 |
| | | 69,498 |
| Total Industrials & Business Services | | 335,788 |
| |
| INFORMATION TECHNOLOGY 6.3% | | |
| Computers & Peripherals 0.4% | | |
| Hewlett-Packard | 1,221,000 | 28,706 |
| | | 28,706 |
| IT Services 1.2% | | |
| First Data | 1,885,000 | 75,664 |
| | | 75,664 |
| Semiconductor & Semiconductor Equipment 2.3% | | |
| Intel | 2,330,000 | 60,720 |
| KLA-Tencor | 555,000 | 24,253 |
| Texas Instruments | 2,215,000 | 62,175 |
| | | 147,148 |
| Software 2.4% | | |
| Microsoft | 6,025,000 | 149,661 |
| | | 149,661 |
| Total Information Technology | | 401,179 |
| MATERIALS 6.7% | | |
| Chemicals 2.7% | | |
| DuPont | 950,000 | 40,860 |
| Great Lakes Chemical | 830,000 | 26,120 |
| Octel † | 990,000 | 17,820 |
| Potash Corp./Saskatchewan | 880,000 | 84,110 |
| | | 168,910 |
| Metals & Mining 2.4% | | |
| Alcoa | 430,000 | 11,236 |
| Newmont Mining | 2,295,000 | 89,574 |
| Nucor | 543,000 | 24,771 |
| Teck Cominco, Class B (CAD) | 865,848 | 29,203 |
| | | 154,784 |
| Paper & Forest Products 1.6% | | |
| Bowater | 1,070,000 | 34,636 |
| International Paper | 940,000 | 28,398 |
| Potlatch | 710,000 | 37,154 |
| | | 100,188 |
| Total Materials | | 423,882 |
| |
| TELECOMMUNICATION SERVICES 2.6% | | |
| Diversified Telecommunication Services 2.6% | | |
| Qwest Communications International * | 8,011,400 | 29,722 |
| Sprint | 2,535,000 | 63,603 |
| Telus (CAD) | 385,000 | 13,525 |
| Telus (Non-voting shares) | 102,200 | 3,476 |
| Verizon Communications | 1,640,000 | 56,662 |
| Total Telecommunication Services | | 166,988 |
| |
| UTILITIES 3.9% | | |
| Electric Utilities 1.8% | | |
| Exelon | 370,000 | 18,992 |
| FirstEnergy | 1,376,946 | 66,245 |
| Pinnacle West Capital | 296,000 | 13,157 |
| Unisource Energy | 670,300 | 20,612 |
| | | 119,006 |
| Gas Utilities 0.5% | | |
| NiSource | 1,247,000 | 30,838 |
| | | 30,838 |
| Independent Power Producers & Energy Traders 1.6% | | |
| Duke Energy | 2,195,000 | 65,258 |
| TXU | 425,000 | 35,313 |
| | | 100,571 |
| Total Utilities | | 250,415 |
| Total Common Stocks (Cost $3,026,023) | | 3,880,141 |
| |
| CONVERTIBLE PREFERRED STOCKS 5.1% | | |
| Allied Waste Industries | 26,800 | 6,671 |
| Amerada Hess | 270,000 | 24,740 |
| Baxter International | 55,000 | 3,041 |
| Ford Motor Capital Trust II | 435,000 | 17,544 |
| General Motors, Series A | 2,665,900 | 64,835 |
| General Motors Corp., Series B | 900,000 | 16,704 |
| Genworth Financial | 718,000 | 24,663 |
| Newell Financial Trust | 1,130,400 | 50,100 |
| NRG Energy, 144A | 33,600 | 36,639 |
| Owens-Illinois | 325,000 | 13,169 |
| Schering-Plough | 375,000 | 19,117 |
| Scottish RE Group | 560,000 | 15,882 |
| Travelers Property | 1,255,000 | 28,087 |
| Total Convertible Preferred Stocks (Cost $292,475) | | 321,192 |
| |
| PREFERRED STOCKS 0.0% | | |
| Entergy-GSU, VR | 9,250 | 484 |
| Total Preferred Stocks (Cost $419) | | 484 |
| |
| CONVERTIBLE BONDS 10.9% | | |
| Agilent Technologies, 3.00%, 12/1/21 | 31,315,000 | 30,845 |
| American International, Zero Coupon, 11/9/31 | 10,156,000 | 6,808 |
| Atherogenics, 144A, 1.50%, 2/1/12 | 2,045,000 | 1,620 |
| Capitalsource, 144A, 3.50%, 7/15/34 | 15,000,000 | 13,541 |
| Corning, Zero Coupon, 11/8/15 | 38,500,000 | 30,690 |
| Crown Castle International, 4.00%, 7/15/10 | 11,200,000 | 23,108 |
| Delta Air Lines | | |
| 144A, 2.875%, 2/18/24 | 35,500,000 | 12,277 |
| 8.00%, 6/3/23 | 5,000,000 | 1,801 |
| Fortis Insurance, 144A, 7.75%, 1/26/08 | 8,900,000 | 9,762 |
| General Mills, Zero Coupon, 10/28/22 | 78,300,000 | 55,468 |
| Hercules, 6.50%, 6/30/29 | 14,750,000 | 11,358 |
| Host Marriott, 144A, 3.25%, 4/15/24 | 30,700,000 | 33,937 |
| Human Genome Sciences, 144A, 2.25%, 10/15/11 | 18,340,000 | 17,395 |
| International Paper, Zero Coupon, 6/20/21 | 127,100,000 | 70,036 |
| King Pharmaceutical, 2.75%, 11/15/21 | 16,700,000 | 15,841 |
| Liberty Media | | |
| 0.75%, 3/30/23 | 90,500,000 | 96,274 |
| Class B, 3.25%, 3/15/31 | 78,850,000 | 60,222 |
| Lowe's, LYONs, Zero Coupon, 2/16/21 | 3,500,000 | 3,363 |
| Lucent Technologies, 8.00%, 8/1/31 | 27,700,000 | 28,669 |
| Oak Industries, 4.875%, 3/1/08 | 2,800,000 | 3,012 |
| Radian Group, 2.25%, 1/1/22 | 7,500,000 | 7,468 |
| Red Hat, 144A, 0.50%, 1/15/24 | 18,978,000 | 16,205 |
| Roche Holdings, LYONs, Zero Coupon, 144A, 7/23/21 | 86,000,000 | 59,712 |
| Schlumberger | | |
| Series A, 1.50%, 6/1/23 | 11,452,000 | 13,132 |
| Series B, 2.125%, 6/1/23 | 27,720,000 | 31,428 |
| Scottish RE Group, 4.50%, 12/1/22 | 1,453,000 | 1,795 |
| Selective Insurance, VR, 1.616%, 9/24/09 | 15,400,000 | 10,129 |
| Tyco International | | |
| Class A, 144A, 2.75%, 1/15/18 | 8,250,000 | 10,732 |
| Class B, 144A, 3.125%, 1/15/23 | 4,125,000 | 5,749 |
| USF&G, Zero Coupon, VR, 3/3/09 | 15,550,000 | 12,919 |
| Total Convertible Bonds (Cost $698,834) | | 695,296 |
| CORPORATE BONDS 1.1% | | | |
| General Motors Acceptance Corp., 6.75%, 12/1/14 | 55,000,000 | | 49,367 |
| Mirant, 144A, 7.90%, 7/15/09 | 16,000,000 | | 12,920 |
| XM Satellite Radio | | | |
| 12.00%, 6/15/10 | 3,341,000 | | 3,759 |
| STEP, 0%, 12/31/09 | 5,660,442 | | 5,844 |
| Total Corporate Bonds (Cost $69,907) | | | 71,890 |
| |
| SHORT-TERM INVESTMENTS 21.6% | | | |
| Money Market Fund 21.6% | | | |
| T. Rowe Price Reserve Investment Fund, 3.14% #† | 1,373,658,465 | | 1,373,658 |
| Total Short-Term Investments (Cost $1,373,658) | | | 1,373,658 |
| |
| Total Investments in Securities | | | |
| 99.7% of Net Assets (Cost $5,461,316) | | $ | 6,342,661 |
| (1) | Denominated in U.S. dollars unless other- |
| | wise noted |
| # | Seven-day yield |
| * | Non-income producing |
| 144A | Security was purchased pursuant to Rule |
| | 144A under the Securities Act of 1933 and |
| | may be resold in transactions exempt from |
| | registration only to qualified institutional |
| | buyers – total value of such securities at |
| | period-end amounts to $230,489 and rep- |
| | resents 3.6% of net assets |
| ADS | American Depository Shares |
| CAD | Canadian dollar |
| GBP | British pound |
| LYONs | Liquid Yield Option Notes |
| STEP | Stepped coupon bond for which the coupon |
| | rate of interest will adjust on specified future |
| | date(s) |
| VR | Variable Rate; rate shown is effective rate |
| | at period-end |
| †Affiliated Companies |
| ($ 000s) |
| |
| The fund may invest in certain securities that are considered affiliated companies. As defined |
| by the 1940 Act, an affiliated company is one in which the fund owns 5% or more of the |
| outstanding voting securities, or a company which is under common ownership or control. |
| |
| | | Purchase | | Sales | | Investment | | Value |
| Affiliate | | Cost | | Cost | | Income | | 6/30/05 | | 12/31/04 |
| Crown Castle | | | | | | | | | | |
| International | $ | - | $ | - | $ | - | $ | * | $ | 19,824 |
| Octel | | - | | - | | 69 | | 17,820 | | 20,602 |
| T. Rowe Price Reserve | | | | | | | | | | |
| Investment Fund, | | | | | | | | | | |
| 3.14% | | ¤ | | ¤ | | 17,181 | | 1,373,658 | | 1,113,753 |
| Totals | | | | | $ | 17,250 | $ | 1,391,478 | $ | 1,154,179 |
| |
| ¤ Purchase and sale information not shown for cash management funds. |
| * The issuer was not considered an affiliated company at June 30, 2005. |
The accompanying notes are an integral part of these financial statements.
Unaudited
| STATEMENT OF ASSETS AND LIABILITIES |
| (In thousands except shares and per share amounts) | | |
| | | |
| Assets | | |
| Investments in securities, at value | | |
| Affiliated companies (cost $1,388,639) | $ | 1,391,478 |
| Non-affiliated companies (cost $4,072,677) | | 4,951,183 |
|
|
| Total investments in securities | | 6,342,661 |
| Dividends and interest receivable | | 12,910 |
| Receivable for investment securities sold | | 692 |
| Receivable for shares sold | | 16,416 |
|
|
| Total assets | | 6,372,679 |
|
|
| |
| Liabilities | | |
| Investment management fees payable | | 3,148 |
| Payable for investment securities purchased | | 5,562 |
| Payable for shares redeemed | | 2,482 |
| Due to affiliates | | 474 |
| Other liabilities | | 743 |
|
|
| Total liabilities | | 12,409 |
|
|
| |
| NET ASSETS | $ | 6,360,270 |
|
|
| Net Assets Consist of: | | |
| Undistributed net investment income (loss) | $ | 43,703 |
| Undistributed net realized gain (loss) | | 125,930 |
| Net unrealized gain (loss) | | 881,353 |
| Paid-in-capital applicable to 323,119,956 no par | | |
| value shares of beneficial interest outstanding; | | |
| unlimited number of shares authorized | | 5,309,284 |
|
|
| |
| NET ASSETS | $ | 6,360,270 |
|
|
| |
| NET ASSET VALUE PER SHARE | | |
| Investor Class | | |
| ($6,353,023,764/322,751,438 shares outstanding) | $ | 19.68 |
|
|
| Advisor Class | | |
| ($7,246,617/368,518 shares outstanding) | $ | 19.66 |
|
|
The accompanying notes are an integral part of these financial statements.
Unaudited
| STATEMENT OF OPERATIONS |
| ($ 000s) | | |
| | | |
| | | 6 Months |
| | | Ended |
| | | 6/30/05 |
| Investment Income (Loss) | | |
| Income | | |
| Dividend | $ | 54,280 |
| Interest | | 11,012 |
|
|
| Total income | | 65,292 |
|
|
| Expenses | | |
| Investment management | | 17,167 |
| Shareholder servicing | | |
| Investor Class | | 3,675 |
| Advisor Class | | 1 |
| Prospectus and shareholder reports | | |
| Investor Class | | 288 |
| Advisor Class | | 2 |
| Registration | | 261 |
| Custody and accounting | | 145 |
| Proxy and annual meeting | | 42 |
| Legal and audit | | 12 |
| Trustees | | 9 |
| Rule 12-b1 fees – Advisor Class | | 3 |
| Miscellaneous | | 4 |
|
|
| Total expenses | | 21,609 |
| Expenses paid indirectly | | (20) |
|
|
| Net expenses | | 21,589 |
|
|
| Net investment income (loss) | | 43,703 |
|
|
| |
| Realized and Unrealized Gain (Loss) | | |
| Net realized gain (loss) | | |
| Securities | | 93,734 |
| Foreign currency transactions | | (17) |
|
|
| Net realized gain (loss) | | 93,717 |
|
|
| Change in net unrealized gain (loss) | | |
| Securities | | (71,174) |
| Other assets and liabilities | | |
| denominated in foreign currencies | | 5 |
|
|
| Change in net unrealized gain (loss) | | (71,169) |
|
|
| Net realized and unrealized gain (loss) | | 22,548 |
|
|
| |
| INCREASE (DECREASE) IN NET | | |
| ASSETS FROM OPERATIONS | $ | 66,251 |
|
|
The accompanying notes are an integral part of these financial statements.
Unaudited
| STATEMENT OF CHANGES IN NET ASSETS |
| ($ 000s) | | | | |
| | | | | |
| | | 6 Months | | Year |
| | | Ended | | Ended |
| | | 6/30/05 | | 12/31/04 |
| |
| Increase (Decrease) in Net Assets | | | | |
| Operations | | | | |
| Net investment income (loss) | $ | 43,703 | $ | 69,074 |
| Net realized gain (loss) | | 93,717 | | 120,831 |
| Change in net unrealized gain (loss) | | (71,169) | | 389,640 |
|
|
| Increase (decrease) in net assets from operations | | 66,251 | | 579,545 |
|
|
| |
| Distributions to shareholders | | | | |
| Net investment income | | – | | (69,698) |
| Net realized gain | | – | | (93,732) |
|
|
| Decrease in net assets from distributions | | – | | (163,430) |
|
|
| |
| Capital share transactions * | | | | |
| Shares sold | | | | |
| Investor Class | | 1,695,171 | | 1,989,542 |
| Advisor Class | | 7,261 | | 250 |
| Distributions reinvested | | | | |
| Investor Class | | – | | 155,707 |
| Shares redeemed | | | | |
| Investor Class | | (370,102) | | (541,388) |
| Advisor Class | | (372) | | – |
|
|
| Increase (decrease) in net assets from | | | | |
| capital share transactions | | 1,331,958 | | 1,604,111 |
|
|
| |
| Net Assets | | | | |
| Increase (decrease) during period | | 1,398,209 | | 2,020,226 |
| Beginning of period | | 4,962,061 | | 2,941,835 |
|
|
| |
| End of period | $ | 6,360,270 | $ | 4,962,061 |
|
|
| (Including undistributed net investment income of | | | | |
| $43,703 at 6/30/05 and $0 at 12/31/04) | | | | |
Unaudited
| STATEMENT OF CHANGES IN NET ASSETS |
| ($ 000s) | | |
| | | |
| | 6 Months | Year |
| | Ended | Ended |
| | 6/30/05 | 12/31/04 |
| |
| *Share information | | |
| Shares sold | | |
| Investor Class | 87,318 | 108,062 |
| Advisor Class | 375 | 13 |
| Distributions reinvested | | |
| Investor Class | – | 8,064 |
| Shares redeemed | | |
| Investor Class | (19,111) | (29,651) |
| Advisor Class | (19) | – |
|
|
| Increase (decrease) in shares outstanding | 68,563 | 86,488 |
The accompanying notes are an integral part of these financial statements.
Unaudited
| NOTES TO FINANCIAL STATEMENTS |
NOTE 1 - SIGNIFICANT ACCOUNTING POLICIES
T. Rowe Price Capital Appreciation Fund (the fund) is registered under the Investment Company Act of 1940 (the 1940 Act) as a diversified, open-end management investment company. The fund seeks maximum long-term capital appreciation by investing primarily in common stocks, and it may also hold fixed-income and other securities to help preserve principal value in uncertain or declining markets. The fund has two classes of shares: the Capital Appreciation Fund original share class, referred to in this report as the Investor Class, offered since June 30, 1986, and Capital Appreciation Fund—Advisor Class (Advisor Class), offered since December 31, 2004. Advisor Class shares are sold only through unaffiliated brokers and other unaffiliated financial intermediaries that are compensated by the class for distribution, shareholder servicing, and/or certain administrative services under a Board-approved Rule 12b-1 plan. Each class has exclusive voting rights on matters related solely to that class, separate voting rights on matters that relate to both classes, and, in all other respects, the same rights and obligations as the other class.
The accompanying financial statements were prepared in accordance with accounting principles generally accepted in the United States of America, which require the use of estimates made by fund management. Fund management believes that estimates and security valuations are appropriate; however actual results may differ from those estimates, and the security valuations reflected in the financial statements may differ from the value the fund receives upon sale of the securities.
Valuation The fund values its investments and computes its net asset value per share at the close of the New York Stock Exchange (NYSE), normally 4 p.m. ET, each day that the NYSE is open for business. Equity securities listed or regularly traded on a securities exchange or in the over-the-counter market are valued at the last quoted sale price or, for certain markets, the official closing price at the time the valuations are made, except for OTC Bulletin Board securities, which are valued at the mean of the latest bid and asked prices. A security that is listed or traded on more than one exchange is valued at the quotation on the exchange determined to be the primary market for such security. Listed securities not traded on a particular day are valued at the mean of the latest bid and asked prices for domestic securities and the last quoted sale price for international securities.
Debt securities are generally traded in the over-the-counter market. Securities with original maturities of one year or more are valued at prices furnished by dealers who make markets in such securities or by an independent pricing service, which considers yield or price of bonds of comparable quality, coupon, maturity, and type, as well as prices quoted by dealers who make markets in such securities. Securities with original maturities of less than one year are valued at amortized cost in local currency, which approximates fair value when combined with accrued interest.
Investments in mutual funds are valued at the mutual fund’s closing net asset value per share on the day of valuation.
Other investments, including restricted securities, and those for which the above valuation procedures are inappropriate or are deemed not to reflect fair value are stated at fair value as determined in good faith by the T. Rowe Price Valuation Committee, established by the fund’s Board of Trustees.
Most foreign markets close before the close of trading on the NYSE. If the fund determines that developments between the close of a foreign market and the close of the NYSE will, in its judgment, materially affect the value of some or all of its portfolio securities, which in turn will affect the fund’s share price, the fund will adjust the previous closing prices to reflect the fair value of the securities as of the close of the NYSE, as determined in good faith by the T. Rowe Price Valuation Committee, established by the fund’s Board of Trustees. A fund may also fair value securities in other situations, such as when a particular foreign market is closed but the fund is open. In deciding whether to make fair value adjustments, the fund reviews a variety of factors, including developments in foreign markets, the performance of U.S. securities markets, and the performance of instruments trading in U. S. markets that represent foreign securities and baskets of foreign securities. The fund uses outside pricing services to provide it with closing market prices and information used for adjusting those prices. The fund cannot predict when and how often it will use closing prices and when it will adjust those prices to reflect fair value. As a means of evaluating its fair value process, the fund routinely compares closing market prices, the next day’s opening prices in the same markets, and adjusted prices.
Currency Translation Assets, including investments, and liabilities denominated in foreign currencies are translated into U.S. dollar values each day at the prevailing exchange rate, using the mean of the bid and asked prices of such currencies against U.S. dollars as quoted by a major bank. Purchases and sales of securities, income, and expenses are translated into U.S. dollars at the prevailing exchange rate on the date of the transaction. The effect of changes in foreign currency exchange rates on realized and unrealized security gains and losses is reflected as a component of security gains and losses.
Class Accounting The Advisor Class pays distribution, shareholder servicing, and/or certain administrative expenses in the form of Rule 12b-1 fees, in an amount not exceeding 0.25% of the class’s average daily net assets. Shareholder servicing, prospectus, and shareholder report expenses incurred by each class are charged directly to the class to which they relate. Expenses common to both classes, investment income, and realized and unrealized gains and losses are allocated to the classes based upon the relative daily net assets of each class.
Rebates and Credits Subject to best execution, the fund may direct certain security trades to brokers who have agreed to rebate a portion of the related brokerage commission to the fund in cash. Commission rebates are included in realized gain on securities in the accompanying financial statements and totaled $76,000 for the six months ended June 30, 2005. Additionally, the fund earns credits on temporarily uninvested cash balances at the custodian that reduce the fund’s custody charges. Custody expense in the accompanying financial statements is presented before reduction for credits, which are reflected as expenses paid indirectly.
Investment Transactions, Investment Income, and Distributions Income and expenses are recorded on the accrual basis. Premiums and discounts on debt securities are amortized for financial reporting purposes. Dividends received from mutual fund investments are reflected as dividend income; capital gain distributions are reflected as realized gain/loss. Dividend income and capital gain distributions are recorded on the ex-dividend date. Investment transactions are accounted for on the trade date. Realized gains and losses are reported on the identified cost basis. Distributions to shareholders are recorded on the ex-dividend date. Income distributions are declared and paid by each class on an annual basis. Capital gain distributions, if any, are declared and paid by the fund, typically on an annual basis.
NOTE 2 - INVESTMENT TRANSACTIONS
Consistent with its investment objective, the fund engages in the following practices to manage exposure to certain risks or enhance performance. The investment objective, policies, program, and risk factors of the fund are described more fully in the fund’s prospectus and Statement of Additional Information.
Restricted Securities The fund may invest in securities that are subject to legal or contractual restrictions on resale. Although certain of these securities may be readily sold, for example, under Rule 144A, others may be illiquid, their sale may involve substantial delays and additional costs, and prompt sale at an acceptable price may be difficult.
Other Purchases and sales of portfolio securities, other than short-term securities, aggregated $1,337,797,000 and $296,392,000, respectively, for the six months ended June 30, 2005.
NOTE 3 - FEDERAL INCOME TAXES
No provision for federal income taxes is required since the fund intends to continue to qualify as a regulated investment company under Subchapter M of the Internal Revenue Code and distribute to shareholders all of its taxable income and gains. Federal income tax regulations differ from generally accepted accounting principles; therefore, distributions determined in accordance with tax regulations may differ in amount or character from net investment income and realized gains for financial reporting purposes. Financial reporting records are adjusted for permanent book/tax differences to reflect tax character. Financial records are not adjusted for temporary differences. The amount and character of tax-basis distributions and composition of net assets are finalized at fiscal year-end; accordingly, tax-basis balances have not been determined as of June 30, 2005.
At June 30, 2005, the cost of investments for federal income tax purposes was $5,461,316,000. Net unrealized gain aggregated $881,353,000 at period-end, of which $1,061,509,000 related to appreciated investments and $180,156,000 related to depreciated investments.
NOTE 4 - RELATED PARTY TRANSACTIONS
The fund is managed by T. Rowe Price Associates, Inc. (the manager or Price Associates), a wholly owned subsidiary of T. Rowe Price Group, Inc. The investment management agreement between the fund and the manager provides for an annual investment management fee, which is computed daily and paid monthly. The fee consists of an individual fund fee, equal to 0.30% of the fund’s average daily net assets, and a group fee. The group fee rate is calculated based on the combined net assets of certain mutual funds sponsored by Price Associates (the group) applied to a graduated fee schedule, with rates ranging from 0.48% for the first $1 billion of assets to 0.29% for assets in excess of $160 billion. Prior to May 1, 2005, the maximum group fee rate in the graduated fee schedule had been 0.295% for assets in excess of $120 billion. The fund’s group fee is determined by applying the group fee rate to the fund’s average daily net assets. At June 30, 2005, the effective annual group fee rate was 0.31%.
The Advisor Class is also subject to a contractual expense limitation through April 30, 2006. During the limitation period, the manager is required to waive its management fee and reimburse the class for any expenses, excluding interest, taxes, brokerage commissions, and extraordinary expenses, that would otherwise cause the class’s ratio of total expenses to average net assets (expense ratio) to exceed its expense limitation of 1.10%. For a period of three years after the date of any reimbursement or waiver, each class is required to repay the manager for expenses previously reimbursed and management fees waived to the extent the class’s net assets have grown or expenses have declined sufficiently to allow repayment without causing the class’s expense ratio to exceed its expense limitation. Pursuant to this agreement, at June 30, 2005, expenses previously reimbursed by the manager were less than $1,000.
In addition, the fund has entered into service agreements with Price Associates and two wholly owned subsidiaries of Price Associates (collectively, Price). Price Associates computes the daily share prices and maintains the financial records of the fund. T. Rowe Price Services, Inc., provides shareholder and administrative services in its capacity as the fund’s transfer and dividend disbursing agent. T. Rowe Price Retirement Plan Services, Inc., provides subaccounting and record-keeping services for certain retirement accounts invested in the Investor Class. For the six months ended June 30, 2005, expenses incurred pursuant to these service agreements were $46,000 for Price Associates, $1,727,000 for T. Rowe Price Services, Inc., and $926,000 for T. Rowe Price Retirement Plan Services, Inc. The total amount payable at period end pursuant to these service agreements is reflected as due to affiliates in the accompanying financial statements.
The fund may invest in the T. Rowe Price Reserve Investment Fund and the T. Rowe Price Government Reserve Investment Fund (collectively, the T. Rowe Price Reserve Funds), open-end management investment companies managed by Price Associates and affiliates of the fund. The T. Rowe Price Reserve Funds are offered as cash management options to mutual funds, trusts, and other accounts managed by Price Associates and/or its affiliates, and are not available for direct purchase by members of the public. The T. Rowe Price Reserve Funds pay no investment management fees.
On October 31, 2002, Price Associates paid the fund $1.3 million to fully reimburse the effect of not exercising a put option on a convertible bond. The payment increased total return for the year ended December 31, 2002 by 0.07%.
| INFORMATION ON PROXY VOTING POLICIES, PROCEDURES, AND RECORDS |
A description of the policies and procedures used by T. Rowe Price funds and portfolios to determine how to vote proxies relating to portfolio securities is available in each fund’s Statement of Additional Information, which you may request by calling 1-800-225-5132 or by accessing the SEC’s Web site, www.sec.gov. The description of our proxy voting policies and procedures is also available on our Web site, www.troweprice.com. To access it, click on the words “Company Info” at the top of our homepage for individual investors. Then, in the window that appears, click on the “Proxy Voting Policy” navigation button in the top left corner.
Each fund’s most recent annual proxy voting record is available on our Web site and through the SEC’s Web site. To access it through our Web site, follow the directions above, then click on the words “Proxy Voting Record” at the bottom of the Proxy Voting Policy page.
| HOW TO OBTAIN QUARTERLY PORTFOLIO HOLDINGS |
The fund files a complete schedule of portfolio holdings with the Securities and Exchange Commission for the first and third quarters of each fiscal year on Form N-Q. The fund’s Form N-Q is available electronically on the SEC’s Web site (www.sec.gov); hard copies may be reviewed and copied at the SEC’s Public Reference Room, 450 Fifth St. N.W., Washington, DC 20549. For more information on the Public Reference Room, call 1-800-SEC-0330.
| APPROVAL OF INVESTMENT MANAGEMENT AGREEMENT |
On March 2, 2005, the fund’s Board of Directors unanimously approved the investment advisory contract (“Contract”) between the fund and its investment manager, T. Rowe Price Associates, Inc. (“Manager”). The Board considered a variety of factors in connection with its review of the Contract, also taking into account information provided by the Manager during the course of the year, as discussed below:
Services Provided by the Manager
The Board considered the nature, quality, and extent of the services provided to the fund by the Manager. These services included, but were not limited to, management of the fund’s portfolio and a variety of activities related to portfolio management. The Board also reviewed the background and experience of the Manager’s senior management team and investment personnel involved in the management of the fund. The Board concluded that it was satisfied with the nature, quality, and extent of the services provided by the Manager.
Investment Performance of the Fund
The Board reviewed the fund’s average annual total return over the 1-, 3-, 5-, and 10-year periods as well as the fund’s year-by-year returns and compared these returns to previously agreed upon comparable performance measures and market data, including those supplied by Lipper and Morningstar, which are independent providers of mutual fund data. On the basis of this evaluation and the Board’s ongoing review of investment results, the Board concluded that the fund’s performance was satisfactory.
Costs, Benefits, Profits, and Economies of Scale
The Board reviewed detailed information regarding the revenues received by the Manager under the Contract and other benefits that the Manager (and its affiliates) may have realized from its relationship with the fund, including research received under “soft dollar” agreements. The Board also received information on the estimated costs incurred and profits realized by the Manager and its affiliates from advising T. Rowe Price mutual funds, as well as estimates of the gross profits realized from managing the fund in particular. The Board concluded that the Manager’s profits were reasonable in light of the services provided to the fund. The Board also considered whether the fund or other funds benefit under the fee levels set forth in the Contract from any economies of scale realized by the Manager. Under the Contract, the fund pays a fee to the Manager composed of two components—a group fee rate based on the aggregate assets of certain T. Rowe Price mutual funds (including the fund) that declines at certain asset levels, and an individual fund fee rate that is assessed on the assets of the fund. The Board concluded that an additional breakpoint should be added to the group fee component of the fees paid by the fund under the Contract at a level of $160 billion. The Board further concluded that, with this change, the advisory fee structure for the fund continued to provide for a reasonable sharing of benefits from any economies of scale with the fund’s investors.
Fees
The Board reviewed the fund’s management fee rate, operating expenses, and total expense ratio (for the Investor Class and Advisor Class) and compared them to fees and expenses of other comparable funds based on information and data supplied by Lipper. The information provided to the Board indicated that the fund’s management fee rate and expense ratio (for both classes) were at or below the median for other groups of comparable funds. The information also indicated that the fund’s expense ratio was below the median for comparable funds. The Board also reviewed the fee schedules for comparable privately managed accounts of the Manager and its affiliates. Management informed the Board that the Manager’s responsibilities for privately managed accounts are more limited than its responsibilities for the fund and other T. Rowe Price mutual funds that it or its affiliates advise. On the basis of the information provided, the Board concluded that the fees paid by the fund under the Contract were reasonable.
Approval of the Contract
As noted, the Board approved the continuation of the Contract as amended to add an additional breakpoint to the group fee rate. No single factor was considered in isolation or to be determinative to the decision. Rather, the Board concluded, in light of a weighting and balancing of all factors considered, that it was in the best interests of the fund to approve the continuation of the Contract, including the fees to be charged for services thereunder.
Item 2. Code of Ethics.
A code of ethics, as defined in Item 2 of Form N-CSR, applicable to its principal executive officer, principal financial officer, principal accounting officer or controller, or persons performing similar functions is filed as an exhibit to the registrant’s annual Form N-CSR. No substantive amendments were approved or waivers were granted to this code of ethics during the registrant’s most recent fiscal half-year.
Item 3. Audit Committee Financial Expert.
Disclosure required in registrant’s annual Form N-CSR.
Item 4. Principal Accountant Fees and Services.
Disclosure required in registrant’s annual Form N-CSR.
Item 5. Audit Committee of Listed Registrants.
Not applicable.
Item 6. Schedule of Investments.
Not applicable. The complete schedule of investments is included in Item 1 of this Form N-CSR.
Item 7. Disclosure of Proxy Voting Policies and Procedures for Closed-End Management Investment Companies.
Not applicable.
Item 8. Portfolio Managers of Closed-End Management Investment Companies.
Not applicable.
Item 9. Purchases of Equity Securities by Closed-End Management Investment Company and Affiliated Purchasers.
Not applicable.
Item 10. Submission of Matters to a Vote of Security Holders.
Not applicable.
Item 11. Controls and Procedures.
(a) The registrant’s principal executive officer and principal financial officer have evaluated the registrant’s disclosure controls and procedures within 90 days of this filing and have concluded that the registrant’s disclosure controls and procedures were effective, as of that date, in ensuring that information required to be disclosed by the registrant in this Form N-CSR was recorded, processed, summarized, and reported timely.
(b) The registrant’s principal executive officer and principal financial officer are aware of no change in the registrant’s internal control over financial reporting that occurred during the registrant’s second fiscal quarter covered by this report that has materially affected, or is reasonably likely to materially affect, the registrant’s internal control over financial reporting.
Item 12. Exhibits.
(a)(1) The registrant’s code of ethics pursuant to Item 2 of Form N-CSR is filed with the registrant’s annual Form N-CSR.
(2) Separate certifications by the registrant's principal executive officer and principal financial officer, pursuant to Section 302 of the Sarbanes-Oxley Act of 2002 and required by Rule 30a-2(a) under the Investment Company Act of 1940, are attached.
(3) Written solicitation to repurchase securities issued by closed-end companies: not applicable.
(b) A certification by the registrant's principal executive officer and principal financial officer, pursuant to Section 906 of the Sarbanes-Oxley Act of 2002 and required by Rule 30a-2(b) under the Investment Company Act of 1940, is attached.
| | |
SIGNATURES |
| |
| | Pursuant to the requirements of the Securities Exchange Act of 1934 and the Investment |
| Company Act of 1940, the registrant has duly caused this report to be signed on its behalf by the |
| undersigned, thereunto duly authorized. |
| |
| T. Rowe Price Capital Appreciation Fund |
| |
| By | /s/ James S. Riepe |
| | James S. Riepe |
| | Principal Executive Officer |
| |
| Date | August 18, 2005 |
| |
| |
| | Pursuant to the requirements of the Securities Exchange Act of 1934 and the Investment |
| Company Act of 1940, this report has been signed below by the following persons on behalf of |
| the registrant and in the capacities and on the dates indicated. |
| |
| |
| By | /s/ James S. Riepe |
| | James S. Riepe |
| | Principal Executive Officer |
| |
| Date | August 18, 2005 |
| |
| |
| |
| By | /s/ Joseph A. Carrier |
| | Joseph A. Carrier |
| | Principal Financial Officer |
| |
| Date | August 18, 2005 |