UNITED STATES
SECURITIES AND EXCHANGE COMMISSION
Washington, D.C. 20549
FORM N-CSR
CERTIFIED SHAREHOLDER REPORT OF REGISTERED
MANAGEMENT INVESTMENT COMPANIES
Investment Company Act File Number: 811-04519
| T. Rowe Price Capital Appreciation Fund |
|
| (Exact name of registrant as specified in charter) |
| |
| 100 East Pratt Street, Baltimore, MD 21202 |
|
| (Address of principal executive offices) |
| |
| David Oestreicher |
| 100 East Pratt Street, Baltimore, MD 21202 |
|
| (Name and address of agent for service) |
Registrant’s telephone number, including area code: (410) 345-2000
Date of fiscal year end: December 31
Date of reporting period: December 31, 2014
Item 1. Report to Shareholders
| Capital Appreciation Fund | December 31, 2014 |

The views and opinions in this report were current as of December 31, 2014. They are not guarantees of performance or investment results and should not be taken as investment advice. Investment decisions reflect a variety of factors, and the managers reserve the right to change their views about individual stocks, sectors, and the markets at any time. As a result, the views expressed should not be relied upon as a forecast of the fund’s future investment intent. The report is certified under the Sarbanes-Oxley Act, which requires mutual funds and other public companies to affirm that, to the best of their knowledge, the information in their financial reports is fairly and accurately stated in all material respects.
REPORTS ON THE WEB
Sign up for our E-mail Program, and you can begin to receive updated fund reports and prospectuses online rather than through the mail. Log in to your account at troweprice.com for more information.
Manager’s Letter
Fellow Shareholders
In 2014, the U.S. equity market generated a total return in excess of 13%. For the third consecutive year, the market’s total return was well above the underlying earnings growth rate for the S&P 500 Index, which is likely to be around 6% to 7% for the year. As we have discussed in previous letters, over long periods of time, the sum of earnings growth plus dividends will generally track the total returns of the market. We have only found three periods in the last 53 years of data in which the market appreciated more than earnings growth for at least three consecutive years (1988–1991, 1994–1999, and now 2011–2014). This trend is something that clearly concerns us, especially as S&P 500 valuation multiples are now 15% to 25% higher than historical averages despite earnings growth being well below historical averages with limited prospects of a pending acceleration.
So why are valuations rising during a period of decelerating earnings growth and slowing global GDP growth? The answer to this important question comes down to the market’s perception of the relative attractiveness of U.S. equities versus non-U.S. global equities as well as the attractiveness of U.S. equities versus fixed income investments. While U.S. equities did quite well in 2014, European equities and many emerging market equities performed poorly. There were a number of causes of their relative weakness: decelerating economic growth, declining currencies, political instability in certain regions and countries, commodity weakness led by the decline in oil and agricultural prices, and poor earnings growth. While neither the U.S. economy nor S&P 500 earnings growth accelerated meaningfully over the course of 2014, the stability of underlying trends in the U.S. relative to the rest of the world helped attract incremental investor dollars into the U.S. and drove valuations up. In addition, with interest rates on longer-duration government bonds falling across most of the developed world, including the U.S. and Europe, the attractiveness of equities relative to many fixed income alternatives helped to support valuation expansion in the U.S. equity market.
As we will discuss in more detail in the Portfolio Strategy and Outlook section, we do not pretend to have a crystal ball about the near-term direction of the equity market, the U.S. or global economy, or the direction of interest rates. We focus our time and effort on trying to find very attractive risk/reward investments across multiple asset classes. This often involves us positioning your fund in a contrarian fashion to what the conventional wisdom of the market is at any given time in terms of the sectors where we are overweight, the stocks we are invested in, and the asset classes we are adding to and subtracting from.
Nevertheless, it is fair to say that we are more concerned today than we have been in past years about the U.S. equity market given elevated valuations, very positive investor sentiment, and at least the prospect of decelerating earnings growth in the U.S. given the trifecta of headwinds coming from pension, currency, and oil price declines. While the latter is likely a net positive for U.S. economic growth, based on the composition of earnings for the S&P 500, it is a clear negative for S&P 500 earnings growth. Most importantly, from a bottom-up perspective, we are finding fewer attractive risk/reward ideas within the U.S. equity market than we have at any time since 2007. This is leading us to reduce our U.S. equity exposure, invest in lower risk U.S. equities with a lower earnings volatility (especially within the health care sector), increase our weighting to equities outside the U.S., and increase our weighting within the highest credit quality tier of high yield bonds where credit spreads are at relatively attractive levels.
Before we discuss fund performance, I would like to review the three goals of the Capital Appreciation Fund:
| (1) | Generate strong risk-adjusted returns annually. |
| |
| (2) | Preserve shareholder capital over the intermediate-term (i.e., three years). |
| |
| (3) | Generate equity-like returns with less risk than that of the overall market over a full market cycle (i.e., normally around five years). |
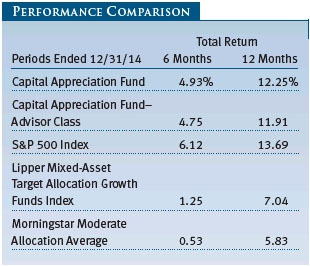
Despite a more conservative positioning in 2014 versus prior years, we are pleased to report that the Capital Appreciation Fund generated solid investment performance. For 2014, your fund generated a 12.25% return relative to the S&P 500’s 13.69% return. (The performance of the Advisor Class was slightly lower, reflecting a different fee structure.) Your fund outperformed the market on a risk-adjusted basis over this period, generating 89% of the market’s return while only taking on 63% of the market’s risk. We arrived at this number by comparing the standard deviation of the S&P 500 (11.35) with that of the fund (7.17) for the 12-month period. Standard deviation indicates the volatility of a portfolio’s total returns as measured against its mean performance. In general, the higher the standard deviation, the greater the volatility or risk. (The S&P 500 Index is an unmanaged equity benchmark that tracks the performance of 500 mostly large-cap U.S. stocks.)
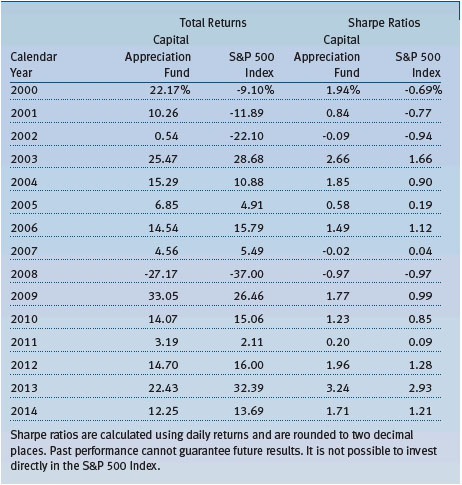
Using a more academic measure of the fund’s risk-adjusted return, your fund produced a Sharpe ratio of 1.71% versus 1.21% for the S&P 500. This is the 14th year out of the last 15 in which we have outperformed the market on a risk-adjusted basis. (See table on page 17.) The Sharpe ratio is a measure of the risk-adjusted return of a portfolio. It measures how much a portfolio’s return is above or below the risk-free Treasury rate (excess return) per unit risk (measured by standard deviation). In general, the larger the number, the better the portfolio’s historical risk-adjusted return.
Our stocks materially outperformed the market by 559 basis points during a year in which 87% of active large-cap equity managers underperformed their benchmark. Over the last eight and a half years, our equities have outperformed the S&P 500 by an average of 486 basis points per year.
However, our fixed income investments did trail their internal benchmark in 2014 by 110 basis points as long-duration government bonds were exceptionally strong in 2014 as rates fell. While we did purchase 10-year Treasuries at the end of 2013 when rates were around 3%, in retrospect, we did not purchase enough. In addition, many of our high yield bonds came under some pressure in the second half of the year as the decline in oil prices put pressure on not only energy-exposed high yield bonds, but also the whole high yield market. This indiscriminate selling pressure created some great buying opportunities in higher-quality high yield bonds. As we have discussed in previous letters, we tend to invest in the highest-quality high yield bonds that have limited bankruptcy risk, and we did not experience an unplanned default within our high yield bonds over the last eight and a half years. While our fixed income holdings did underperform in 2014, they have outperformed our internal fixed income benchmark by 239 basis points per year on average since mid-2006.
As for our second goal—capital preservation over the intermediate-term—your fund generated a 57.64% cumulative return over the last three years. Preserving shareholder capital over the last three years has been relatively simple given the strength in most asset classes. However, we are mindful that the investment backdrop will not always be as favorable and continue to focus on downside risk potential with all our investments across all asset classes.
As for our final goal—equity-like returns with less risk than that of the market over a full market cycle—your fund generated an 85.55% cumulative total return, or roughly 85% of the market’s return over the last five years while taking on 65% of the market’s risk. While history tends to suggest that market cycles last around five years on average, we tend to think of a full market cycle encompassing at least one negative year. Since we have now lapped the last down year (2008) in our five-year numbers and since we are not purely an equity fund, it will be hard to produce equity market returns or better in a five-year period without at least one down year in the equity market. However, if we were to extend this cycle to include the down year of 2008, your fund would have achieved this last goal as we generated 120% of the market’s return while only taking on 71% of the market’s risk over the last seven years.
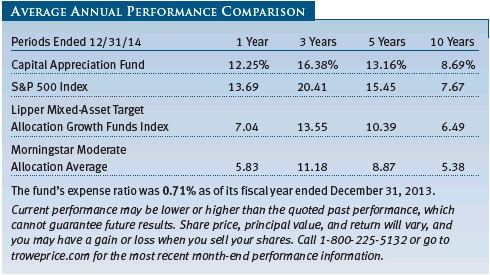
For the 6-month, 1-year, 3-year, 5-year, and 10-year periods ended December 31, 2014, we outperformed our Lipper and Morningstar peer groups during every period. However, let me reiterate that we do not manage your fund to beat these benchmarks. The Capital Appreciation Fund has very different objectives than most of its benchmark peers. It is a unique fund with a focus on strong risk-adjusted returns, intermediate-term capital preservation, and long-term capital appreciation that does not fit neatly into any current benchmark. (Based on cumulative total return, Lipper ranked the Capital Appreciation Fund 8 of 561, 10 of 511, 9 of 470, and 3 of 319 mixed-asset target allocation growth funds for the 1-, 3-, 5-, and 10-year periods ended December 31, 2014, respectively. Results may vary for other periods. Past performance cannot guarantee future results.)
PORTFOLIO REVIEW
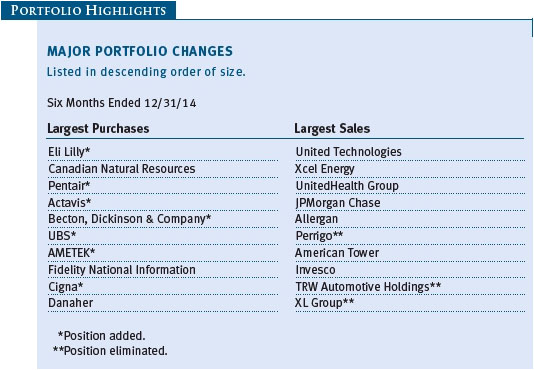
Within the equity portion of the portfolio, our health care holdings were the strongest contributors to both absolute and relative returns in 2014. Allergan, UnitedHealth Group, Zoetis, and Actavis were all important contributors to our strong results. Allergan was the subject of a hostile bid from Valeant Pharmaceuticals International earlier in the year. Valeant increased its bid for Allergan multiple times during the year and publicly indicated a willingness to pay a higher price—only to be rebuffed by the Allergan board and management team. Allergan responded by moving to aggressively cut costs to increase the company’s intermediate-term earnings power, but this was too little and too late. Allergan ended up selling itself to Actavis for an attractive price that should benefit shareholders of both companies. Allergan shares appreciated 91% in 2014. (Please refer to the fund’s portfolio of investments for a complete list of holdings and the amount each represents in the portfolio.)
UnitedHealth Group generated a 36% return in 2014 as the market became more comfortable that earnings growth would accelerate in 2015 and then again in 2016 as many of the headwinds from the Affordable Care Act and Medicare Advantage reimbursement challenges diminish.
Zoetis was a disappointing stock for much of 2012 and 2013 after being spun out of Pfizer. The stock rebounded strongly in 2014 due to some important senior management changes, the presence of an activist investor buying a large position in the shares, and the market recognizing the possibility of Zoetis being acquired as the two-year anniversary of Zoetis’s separation from Pfizer makes such a transaction much easier to complete in mid-2015.

Our investments within the utility sector were positive contributors to absolute and relative returns in 2014 as well. Like the health care sector, the utility sector outperformed the market, and we were overweight the sector (although we trimmed back the utility bet as the year progressed). Our largest overweight within the utility sector was PG&E, the large Northern California utility. PG&E generated a return of 37% in 2014 as its discounted valuation relative to the utility group began to close as the market finally became more comfortable with the potentially large fine for the San Bruno accident which occurred a few years ago. More importantly, investors have begun to focus on PG&E’s above-average growth rate, potential for dividend growth, and best-in-class regulatory setup in California that should set PG&E apart from most of its utility peers in future years. While we have materially lowered our overweight to utilities this year by selling Entergy and reducing our exposure to Xcel Energy, we have only modestly reduced our position in PG&E as it still trades at a discount to the utility group despite having a much better long-term fundamental outlook.
Despite being underweight the energy sector, poor stock selection within energy equities caused us to underperform here in 2014. While we owned a number of low-cost producers, such as Pioneer Natural Resources, Range Resources, and Concho Energy, that we thought were poised to grow production materially faster than their peers for a long period of time, these companies also had higher valuations as well. When oil prices collapsed, we felt the double whammy of lower cash flows and lower multiples as lower cash flows also meant lower production growth going forward. In general, we tend to avoid higher multiple stocks for this reason and tend to invest in companies with lower earnings and cash flow volatility. We protect our downside in stocks by essentially investing in companies that don’t have a lot of earnings downside risk or multiple compression risk. In energy, we made the mistake of investing in companies that experienced declines in cash flows and multiples. Many of our energy names were down 25% to 35% for the year. We were disappointed in our energy results in 2014, and we aim to do better in 2015.

PORTFOLIO STRATEGY AND OUTLOOK
We are now more cautious than we have been in prior years, especially as it relates to the U.S. equity market, due to valuation and positive sentiment, and long-duration fixed income assets given the significant decline in yields. However, we have been adding to high-quality high yield bonds in recent months and see good relative value here. In addition, we have added to non-U.S. equities in the recent past, taking advantage of poor sentiment and weak stock prices to scoop up some bargains.
| ● | U.S. Equities—The median company in the S&P 500 is now trading at 17-18 times consensus 2015 earnings estimates. Moreover, we think estimates for many companies (especially energy names and companies with significant currency exposure) are materially too high. These valuations are at levels we have not seen in the last decade and are much higher than the 20-year average. All of the various cyclically adjusted market multiples would suggest that the market is overvalued. We have been lowering our exposure to U.S. equities given heightened valuations, positive investor sentiment, and positioning toward U.S. equities and with earnings growth poised to potentially decelerate from the already tepid pace of 2012–2014. |
| |
| ● | Long-Duration U.S. Bonds—What a difference a year makes. Last year, the consensus was that 10-year U.S. Treasury rates were going straight to 4% over the course of 2014. Not only did they not go up, in fact they went down 87 basis points over the course of the year. We made the case at the end of 2013 that the risk/reward trade-off and the inherent downside protection offered by the 10-year Treasury made adding these bonds attractive with limited downside. We can no longer make a similar case with the 10-year yield currently below 2%. As a result, we have sold all our Treasuries and many of our longer-duration investment-grade corporate bonds. |
| |
| ● | High Yield Bonds—High yield bonds underperformed as an asset class in 2014 as the massive decline in oil prices impacted not only energy bonds, but also the entire high yield space including names without any direct or indirect energy exposure. While valuation levels (whether P/E multiples or credit spreads or real interest rates) in most asset classes are well above normal, high yield bonds are closer to their long-term median with and without energy bonds included. As a result, we have been adding to high yield bonds in recent months. |
| |
| ● | Non-U.S. Equities—We have historically not invested much in non-U.S. equities for a variety of reasons. First, it is an “away game” for us and we don’t have the same dialogue with or access to corporate managements as we do in the U.S. Second, historically, the risk-adjusted returns of non-U.S. equities have been poor, especially for a U.S. investor, given that the U.S. dollar tends to appreciate during periods of market stress. Third, we have found companies and management teams outside the U.S. are less shareholder friendly in their capital allocation policies. We have recently bought two Swiss companies: UBS and Julius Baer. Both have underperformed their U.S. peers in recent years from a stock perspective, both have near-term regulatory headwinds, which should be resolved in the next 12 to 18 months, and both are very shareholder friendly from a capital allocation perspective. In addition, we have initiated futures positions in two European indexes that give us exposure to the European equity market, but we have effectively hedged much of the currency risk associated with these investments so that we have generated local currency market returns (and thus have a better risk-adjusted return for U.S. investors). The combination of these investments is still relatively modest at only about 3% of your fund’s assets and is unlikely to become greater than 5% under most circumstances. |
In addition, we continue to focus our time and effort on finding equities with the following characteristics:
| ● | Companies that have free optionality (e.g., takeover targets, spinoff opportunities, management change, and activist targets). |
| |
| ● | Companies with near-term weak fundamentals or near-term uncertainty and depressed valuations but attractive intermediate-term and long-term fundamentals. |
| |
| ● | Companies that are buying back stock aggressively or creating value through acquisitions. |
| |
| ● | Companies that have relatively stable earnings growth even during periods of economic stress. |
IN CLOSING
We would like to thank the members of the fund’s Investment Advisory Committee for their valuable input in 2014. This team—which comprises sector portfolio managers, quantitative analysts, fixed income portfolio managers, and equity analysts with many decades of combined investment experience—is responsible for the oversight of your fund and is supported by a growing global equity and fixed income platform of more than 200 analysts.
Respectfully submitted,

David R. Giroux
Chairman of the fund’s Investment Advisory Committee

Steven D. Krichbaum
Associate portfolio manager
January 22, 2015
The committee chairman has day-to-day responsibility for managing the portfolio and works with committee members in developing and executing the fund’s investment program.
RISKS OF INVESTING
As with all stock and bond mutual funds, the fund’s share price can fall because of weakness in the stock or bond markets, a particular industry, or specific holdings. Stock markets can decline for many reasons, including adverse political or economic developments, changes in investor psychology, or heavy institutional selling. The prospects for an industry or company may deteriorate because of a variety of factors, including disappointing earnings or changes in the competitive environment. In addition, the investment manager’s assessment of companies held in a fund may prove incorrect, resulting in losses or poor performance even in rising markets. A sizable cash or fixed income position may hinder the fund from participating fully in a strong, rapidly rising bull market. In addition, significant exposure to bonds increases the risk that the fund’s share value could be hurt by rising interest rates or credit downgrades or defaults. Convertible securities are also exposed to price fluctuations of the company’s stock.
GLOSSARY
Lipper indexes: Fund benchmarks that consist of a small number of the largest mutual funds in a particular category as tracked by Lipper Inc.
Morningstar Moderate Allocation Average: Tracks the performance of funds that seek both moderate capital appreciation and income by investing in stocks, bonds, and cash.
Sharpe ratio: A measure of the risk-adjusted return of a portfolio. The Sharpe ratio measures how much a portfolio’s return is above or below the risk-free Treasury rate (excess return) per unit risk (measured by standard deviation). In general, the larger the number, the better the portfolio’s historical risk-adjusted return.
S&P 500 Index: An unmanaged index that tracks the stocks of 500 primarily large-cap U.S. companies.
Standard deviation: A measure of risk that indicates the volatility of a portfolio’s total returns as measured against its mean performance. In general, the higher the standard deviation, the greater the volatility or risk.

Performance and Expenses
This chart shows the value of a hypothetical $10,000 investment in the fund over the past 10 fiscal year periods or since inception (for funds lacking 10-year records). The result is compared with benchmarks, which may include a broad-based market index and a peer group average or index. Market indexes do not include expenses, which are deducted from fund returns as well as mutual fund averages and indexes.


As a mutual fund shareholder, you may incur two types of costs: (1) transaction costs, such as redemption fees or sales loads, and (2) ongoing costs, including management fees, distribution and service (12b-1) fees, and other fund expenses. The following example is intended to help you understand your ongoing costs (in dollars) of investing in the fund and to compare these costs with the ongoing costs of investing in other mutual funds. The example is based on an investment of $1,000 invested at the beginning of the most recent six-month period and held for the entire period.
Please note that the fund has two share classes: The original share class (Investor Class) charges no distribution and service (12b-1) fee, and the Advisor Class shares are offered only through unaffiliated brokers and other financial intermediaries and charge a 0.25% 12b-1 fee. Each share class is presented separately in the table.
Actual Expenses
The first line of the following table (Actual) provides information about actual account values and expenses based on the fund’s actual returns. You may use the information on this line, together with your account balance, to estimate the expenses that you paid over the period. Simply divide your account value by $1,000 (for example, an $8,600 account value divided by $1,000 = 8.6), then multiply the result by the number on the first line under the heading “Expenses Paid During Period” to estimate the expenses you paid on your account during this period.
Hypothetical Example for Comparison Purposes
The information on the second line of the table (Hypothetical) is based on hypothetical account values and expenses derived from the fund’s actual expense ratio and an assumed 5% per year rate of return before expenses (not the fund’s actual return). You may compare the ongoing costs of investing in the fund with other funds by contrasting this 5% hypothetical example and the 5% hypothetical examples that appear in the shareholder reports of the other funds. The hypothetical account values and expenses may not be used to estimate the actual ending account balance or expenses you paid for the period.
Note: T. Rowe Price charges an annual account service fee of $20, generally for accounts with less than $10,000. The fee is waived for any investor whose T. Rowe Price mutual fund accounts total $50,000 or more; accounts electing to receive electronic delivery of account statements, transaction confirmations, prospectuses, and shareholder reports; or accounts of an investor who is a T. Rowe Price Preferred Services, Personal Services, or Enhanced Personal Services client (enrollment in these programs generally requires T. Rowe Price assets of at least $100,000). This fee is not included in the accompanying table. If you are subject to the fee, keep it in mind when you are estimating the ongoing expenses of investing in the fund and when comparing the expenses of this fund with other funds.
You should also be aware that the expenses shown in the table highlight only your ongoing costs and do not reflect any transaction costs, such as redemption fees or sales loads. Therefore, the second line of the table is useful in comparing ongoing costs only and will not help you determine the relative total costs of owning different funds. To the extent a fund charges transaction costs, however, the total cost of owning that fund is higher.


The accompanying notes are an integral part of these financial statements.

The accompanying notes are an integral part of these financial statements.


The accompanying notes are an integral part of these financial statements.


The accompanying notes are an integral part of these financial statements.

The accompanying notes are an integral part of these financial statements.

The accompanying notes are an integral part of these financial statements.
| Notes to Financial Statements |
T. Rowe Price Capital Appreciation Fund (the fund), is registered under the Investment Company Act of 1940 (the 1940 Act) as a diversified, open-end management investment company. The fund seeks long-term capital appreciation by investing primarily in common stocks. It may also hold fixed-income and other securities to help preserve principal value. The fund has two classes of shares: the Capital Appreciation Fund original share class, referred to in this report as the Investor Class, offered since June 30, 1986, and the Capital Appreciation Fund–Advisor Class (Advisor Class), offered since December 31, 2004. Advisor Class shares are sold only through unaffiliated brokers and other unaffiliated financial intermediaries that are compensated by the class for distribution, shareholder servicing, and/or certain administrative services under a Board-approved Rule 12b-1 plan. Each class has exclusive voting rights on matters related solely to that class; separate voting rights on matters that relate to both classes; and, in all other respects, the same rights and obligations as the other class.
NOTE 1 - SIGNIFICANT ACCOUNTING POLICIES
Basis of Preparation The fund is an investment company and follows accounting and reporting guidance in the Financial Accounting Standards Board (FASB) Accounting Standards Codification Topic 946 (ASC 946). The accompanying financial statements were prepared in accordance with accounting principles generally accepted in the United States of America (GAAP), including but not limited to ASC 946. GAAP requires the use of estimates made by management. Management believes that estimates and valuations are appropriate; however, actual results may differ from those estimates, and the valuations reflected in the accompanying financial statements may differ from the value ultimately realized upon sale or maturity.
Investment Transactions, Investment Income, and Distributions Income and expenses are recorded on the accrual basis. Premiums and discounts on debt securities are amortized for financial reporting purposes. Paydown gains and losses are recorded as an adjustment to interest income. Dividends received from mutual fund investments are reflected as dividend income; capital gain distributions are reflected as realized gain/loss. Dividend income and capital gain distributions are recorded on the ex-dividend date. Income tax-related interest and penalties, if incurred, would be recorded as income tax expense. Investment transactions are accounted for on the trade date. Realized gains and losses are reported on the identified cost basis. Distributions to shareholders are recorded on the ex-dividend date. Distributions from REITs are initially recorded as dividend income and, to the extent such represent a return of capital or capital gain for tax purposes, are reclassified when such information becomes available. Income distributions are declared and paid by each class annually. Capital gain distributions, if any, are generally declared and paid by the fund annually.
Currency Translation Assets, including investments, and liabilities denominated in foreign currencies are translated into U.S. dollar values each day at the prevailing exchange rate, using the mean of the bid and asked prices of such currencies against U.S. dollars as quoted by a major bank. Purchases and sales of securities, income, and expenses are translated into U.S. dollars at the prevailing exchange rate on the date of the transaction. The effect of changes in foreign currency exchange rates on realized and unrealized security gains and losses is reflected as a component of security gains and losses.
Class Accounting The Advisor Class pays distribution, shareholder servicing, and/or certain administrative expenses in the form of Rule 12b-1 fees, in an amount not exceeding 0.25% of the class’s average daily net. Shareholder servicing, prospectus, and shareholder report expenses incurred by each class are charged directly to the class to which they relate. Expenses common to both classes, investment income, and realized and unrealized gains and losses are allocated to the classes based upon the relative daily net assets of each class.
Rebates Subject to best execution, the fund may direct certain security trades to brokers who have agreed to rebate a portion of the related brokerage commission to the fund in cash. Commission rebates are reflected as realized gain on securities in the accompanying financial statements and totaled $153,000 for the year ended December 31, 2014.
New Accounting Guidance In June 2014, FASB issued Accounting Standards Update (ASU) No. 2014-11, Transfers and Servicing (Topic 860), Repurchase-to-Maturity Transactions, Repurchase Financings, and Disclosures. The ASU changes the accounting for certain repurchase agreements and expands disclosure requirements related to repurchase agreements, securities lending, repurchase-to-maturity and similar transactions. The ASU is effective for interim and annual reporting periods beginning after December 15, 2014. Adoption will have no effect on the fund’s net assets or results of operations.
NOTE 2 - VALUATION
The fund’s financial instruments are valued and each class’s net asset value (NAV) per share is computed at the close of the New York Stock Exchange (NYSE), normally 4 p.m. ET, each day the NYSE is open for business.
Fair Value The fund’s financial instruments are reported at fair value, which GAAP defines as the price that would be received to sell an asset or paid to transfer a liability in an orderly transaction between market participants at the measurement date. The T. Rowe Price Valuation Committee (the Valuation Committee) has been established by the fund’s Board of Trustees (the Board) to ensure that financial instruments are appropriately priced at fair value in accordance with GAAP and the 1940 Act. Subject to oversight by the Board, the Valuation Committee develops and oversees pricing-related policies and procedures and approves all fair value determinations. Specifically, the Valuation Committee establishes procedures to value securities; determines pricing techniques, sources, and persons eligible to effect fair value pricing actions; oversees the selection, services, and performance of pricing vendors; oversees valuation-related business continuity practices; and provides guidance on internal controls and valuation-related matters. The Valuation Committee reports to the Board; is chaired by the fund’s treasurer; and has representation from legal, portfolio management and trading, operations, and risk management.
Various valuation techniques and inputs are used to determine the fair value of financial instruments. GAAP establishes the following fair value hierarchy that categorizes the inputs used to measure fair value:
Level 1 – quoted prices (unadjusted) in active markets for identical financial instruments that the fund can access at the reporting date
Level 2 – inputs other than Level 1 quoted prices that are observable, either directly or indirectly (including, but not limited to, quoted prices for similar financial instruments in active markets, quoted prices for identical or similar financial instruments in inactive markets, interest rates and yield curves, implied volatilities, and credit spreads)
Level 3 – unobservable inputs
Observable inputs are developed using market data, such as publicly available information about actual events or transactions, and reflect the assumptions that market participants would use to price the financial instrument. Unobservable inputs are those for which market data are not available and are developed using the best information available about the assumptions that market participants would use to price the financial instrument. GAAP requires valuation techniques to maximize the use of relevant observable inputs and minimize the use of unobservable inputs. When multiple inputs are used to derive fair value, the financial instrument is assigned to the level within the fair value hierarchy based on the lowest-level input that is significant to the fair value of the financial instrument. Input levels are not necessarily an indication of the risk or liquidity associated with financial instruments at that level but rather the degree of judgment used in determining those values.
Valuation Techniques Equity securities listed or regularly traded on a securities exchange or in the over-the-counter (OTC) market are valued at the last quoted sale price or, for certain markets, the official closing price at the time the valuations are made. OTC Bulletin Board securities are valued at the mean of the closing bid and asked prices. A security that is listed or traded on more than one exchange is valued at the quotation on the exchange determined to be the primary market for such security. Listed securities not traded on a particular day are valued at the mean of the closing bid and asked prices for domestic securities and the last quoted sale or closing price for international securities.
For valuation purposes, the last quoted prices of non-U.S. equity securities may be adjusted to reflect the fair value of such securities at the close of the NYSE. If the fund determines that developments between the close of a foreign market and the close of the NYSE will, in its judgment, materially affect the value of some or all of its portfolio securities, the fund will adjust the previous quoted prices to reflect what it believes to be the fair value of the securities as of the close of the NYSE. In deciding whether it is necessary to adjust quoted prices to reflect fair value, the fund reviews a variety of factors, including developments in foreign markets, the performance of U.S. securities markets, and the performance of instruments trading in U.S. markets that represent foreign securities and baskets of foreign securities. The fund may also fair value securities in other situations, such as when a particular foreign market is closed but the fund is open. The fund uses outside pricing services to provide it with quoted prices and information to evaluate or adjust those prices. The fund cannot predict how often it will use quoted prices and how often it will determine it necessary to adjust those prices to reflect fair value. As a means of evaluating its security valuation process, the fund routinely compares quoted prices, the next day’s opening prices in the same markets, and adjusted prices.
Actively traded domestic equity securities generally are categorized in Level 1 of the fair value hierarchy. Non-U.S. equity securities generally are categorized in Level 2 of the fair value hierarchy despite the availability of quoted prices because, as described above, the fund evaluates and determines whether those quoted prices reflect fair value at the close of the NYSE or require adjustment. OTC Bulletin Board securities, certain preferred securities, and equity securities traded in inactive markets generally are categorized in Level 2 of the fair value hierarchy.
Debt securities generally are traded in the OTC market. Securities with remaining maturities of one year or more at the time of acquisition are valued at prices furnished by dealers who make markets in such securities or by an independent pricing service, which considers the yield or price of bonds of comparable quality, coupon, maturity, and type, as well as prices quoted by dealers who make markets in such securities. Generally, debt securities are categorized in Level 2 of the fair value hierarchy; however, to the extent the valuations include significant unobservable inputs, the securities would be categorized in Level 3.
Investments in mutual funds are valued at the mutual fund’s closing NAV per share on the day of valuation and are categorized in Level 1 of the fair value hierarchy. Listed options, and OTC options with a listed equivalent, are valued at the mean of the closing bid and asked prices and generally are categorized in Level 2 of the fair value hierarchy. Financial futures contracts are valued at closing settlement prices and are categorized in Level 1 of the fair value hierarchy. Forward currency exchange contracts are valued using the prevailing forward exchange rate and are categorized in Level 2 of the fair value hierarchy. Assets and liabilities other than financial instruments, including short-term receivables and payables, are carried at cost, or estimated realizable value, if less, which approximates fair value.
Thinly traded financial instruments and those for which the above valuation procedures are inappropriate or are deemed not to reflect fair value are stated at fair value as determined in good faith by the Valuation Committee. The objective of any fair value pricing determination is to arrive at a price that could reasonably be expected from a current sale. Financial instruments fair valued by the Valuation Committee are primarily private placements, restricted securities, warrants, rights, and other securities that are not publicly traded.
Subject to oversight by the Board, the Valuation Committee regularly makes good faith judgments to establish and adjust the fair valuations of certain securities as events occur and circumstances warrant. For instance, in determining the fair value of an equity investment with limited market activity, such as a private placement or a thinly traded public company stock, the Valuation Committee considers a variety of factors, which may include, but are not limited to, the issuer’s business prospects, its financial standing and performance, recent investment transactions in the issuer, new rounds of financing, negotiated transactions of significant size between other investors in the company, relevant market valuations of peer companies, strategic events affecting the company, market liquidity for the issuer, and general economic conditions and events. In consultation with the investment and pricing teams, the Valuation Committee will determine an appropriate valuation technique based on available information, which may include both observable and unobservable inputs. The Valuation Committee typically will afford greatest weight to actual prices in arm’s length transactions, to the extent they represent orderly transactions between market participants; transaction information can be reliably obtained; and prices are deemed representative of fair value. However, the Valuation Committee may also consider other valuation methods such as market-based valuation multiples; a discount or premium from market value of a similar, freely traded security of the same issuer; or some combination. Fair value determinations are reviewed on a regular basis and updated as information becomes available, including actual purchase and sale transactions of the issue. Because any fair value determination involves a significant amount of judgment, there is a degree of subjectivity inherent in such pricing decisions, and fair value prices determined by the Valuation Committee could differ from those of other market participants. Depending on the relative significance of unobservable inputs, including the valuation technique(s) used, fair valued securities may be categorized in Level 2 or 3 of the fair value hierarchy.
Valuation Inputs The following table summarizes the fund’s financial instruments, based on the inputs used to determine their fair values on December 31, 2014:

There were no material transfers between Levels 1 and 2 during the year ended December 31, 2014.
Following is a reconciliation of the fund’s Level 3 holdings for the year ended December 31, 2014. Gain (loss) reflects both realized and change in unrealized gain/loss on Level 3 holdings during the period, if any, and is included on the accompanying Statement of Operations. The change in unrealized gain/loss on Level 3 instruments held at December 31, 2014, totaled less than $1,000 for the year ended December 31, 2014.
NOTE 3 - DERIVATIVE INSTRUMENTS
During the year ended December 31, 2014, the fund invested in derivative instruments. As defined by GAAP, a derivative is a financial instrument whose value is derived from an underlying security price, foreign exchange rate, interest rate, index of prices or rates, or other variable; it requires little or no initial investment and permits or requires net settlement. The fund invests in derivatives only if the expected risks and rewards are consistent with its investment objectives, policies, and overall risk profile, as described in its prospectus and Statement of Additional Information. The fund may use derivatives for a variety of purposes, such as seeking to hedge against declines in principal value, increase yield, invest in an asset with greater efficiency and at a lower cost than is possible through direct investment, or to adjust credit exposure. The risks associated with the use of derivatives are different from, and potentially much greater than, the risks associated with investing directly in the instruments on which the derivatives are based. The fund at all times maintains sufficient cash reserves, liquid assets, or other SEC-permitted asset types to cover its settlement obligations under open derivative contracts.
The fund values its derivatives at fair value, as described in Note 2, and recognizes changes in fair value currently in its results of operations. Accordingly, the fund does not follow hedge accounting, even for derivatives employed as economic hedges. Generally, the fund accounts for its derivatives on a gross basis. It does not offset the fair value of derivative liabilities against the fair value of derivative assets on its financial statements, nor does it offset the fair value of derivative instruments against the right to reclaim or obligation to return collateral.

Additionally, the amount of gains and losses on derivative instruments recognized in fund earnings during the year ended December 31, 2014, and the related location on the accompanying Statement of Operations is summarized in the following table by primary underlying risk exposure:
Counterparty Risk and Collateral The fund invests in derivatives in various markets, which expose it to differing levels of counterparty risk. Counterparty risk on exchange-traded and centrally cleared derivative contracts, such as futures, exchange-traded options, and centrally cleared swaps, is minimal because the clearinghouse provides protection against counterparty defaults. For futures and centrally cleared swaps, the fund is required to deposit collateral in an amount equal to a certain percentage of the contract value (margin requirement) and the margin requirement must be maintained over the life of the contract. Each clearing broker, in its sole discretion, may adjust the margin requirements applicable to the fund.
Derivatives, such as bilateral swaps, forward currency exchange contracts, and OTC options, that are transacted and settle directly with a counterparty (bilateral derivatives) expose the fund to greater counterparty risk. To mitigate this risk, the fund has entered into master netting arrangements (MNAs) with certain counterparties that permit net settlement under specified conditions and, for certain counterparties, also provide collateral agreements. MNAs may be in the form of International Swaps and Derivatives Association master agreements (ISDAs) or foreign exchange letter agreements (FX letters).
MNAs govern the ability to offset amounts the fund owes a counterparty against amounts the counterparty owes the fund (net settlement). Both ISDAs and FX letters generally allow net settlement in the event of contract termination and permit termination by either party prior to maturity upon the occurrence of certain stated events, such as failure to pay or bankruptcy. In addition, ISDAs specify other events, the occurrence of which would allow one of the parties to terminate. For example, a downgrade in credit rating of a counterparty would allow the fund to terminate while a decline in the fund’s net assets of more than a certain percentage would allow the counterparty to terminate. Upon termination, all bilateral derivatives with that counterparty would be liquidated and a net amount settled. ISDAs typically include collateral agreements whereas FX letters do not. Collateral requirements are determined based on the net aggregate unrealized gain or loss on all bilateral derivatives with each counterparty, subject to minimum transfer amounts that typically range from $100,000 to $250,000. Any additional collateral required due to changes in security values is transferred the next business day.
Collateral may be in the form of cash or debt securities issued by the U.S. government or related agencies. Cash and currencies posted by the fund are reflected as cash deposits in the accompanying financial statements and generally are restricted from withdrawal by the fund; securities posted by the fund are so noted in the accompanying Portfolio of Investments; both remain in the fund’s assets. Collateral pledged by counterparties is not included in the fund’s assets because the fund does not obtain effective control over those assets. For bilateral derivatives, collateral posted or received by the fund is held in a segregated account by the fund’s custodian. As of December 31, 2014, no collateral was pledged by either the fund or counterparties for bilateral derivatives. As of December 31, 2014, cash of $37,235,000 had been posted by the fund for exchange-traded and/or centrally cleared derivatives.
Forward Currency Exchange Contracts The fund is subject to foreign currency exchange rate risk in the normal course of pursuing its investment objectives. It uses forward currency exchange contracts (forwards) primarily to protect its non-U.S. dollar-denominated securities from adverse currency movements relative to the U.S. dollar. A forward involves an obligation to purchase or sell a fixed amount of a specific currency on a future date at a price set at the time of the contract. Although certain forwards may be settled by exchanging only the net gain or loss on the contract, most forwards are settled with the exchange of the underlying currencies in accordance with the specified terms. Forwards are valued at the unrealized gain or loss on the contract, which reflects the net amount the fund either is entitled to receive or obligated to deliver, as measured by the difference between the forward exchange rates at the date of entry into the contract and the forward rates at the reporting date. Appreciated forwards are reflected as assets, and depreciated forwards are reflected as liabilities on the accompanying Statement of Assets and Liabilities. Risks related to the use of forwards include the possible failure of counterparties to meet the terms of the agreements; that anticipated currency movements will not occur, thereby reducing the fund’s total return; and the potential for losses in excess of the fund’s initial investment. During the year ended December 31, 2014, the volume of the fund’s activity in forwards, based on underlying notional amounts, was generally less than 1% of net assets.
Futures Contracts The fund is subject to equity price risk in the normal course of pursuing its investment objectives and uses futures contracts to help manage such risk. The fund may enter into futures contracts to manage exposure to interest rates, security prices, foreign currencies, and credit quality; as an efficient means of adjusting exposure to all or part of a target market; to enhance income; as a cash management tool; or to adjust credit exposure. A futures contract provides for the future sale by one party and purchase by another of a specified amount of a specific underlying financial instrument at an agreed-upon price, date, time, and place. The fund currently invests only in exchange-traded futures, which generally are standardized as to maturity date, underlying financial instrument, and other contract terms. Payments are made or received by the fund each day to settle daily fluctuations in the value of the contract (variation margin), which reflect changes in the value of the underlying financial instrument. Variation margin is recorded as unrealized gain or loss until the contract is closed. The value of a futures contract included in net assets is the amount of unsettled variation margin; net variation margin receivable is reflected as an asset and net variation margin payable is reflected as a liability on the accompanying Statement of Assets and Liabilities. Risks related to the use of futures contracts include possible illiquidity of the futures markets, contract prices that can be highly volatile and imperfectly correlated to movements in hedged security values, and potential losses in excess of the fund’s initial investment. During the year ended December 31, 2014, the volume of the fund’s activity in futures, based on underlying notional amounts, was generally between 0% and 2% of net assets.
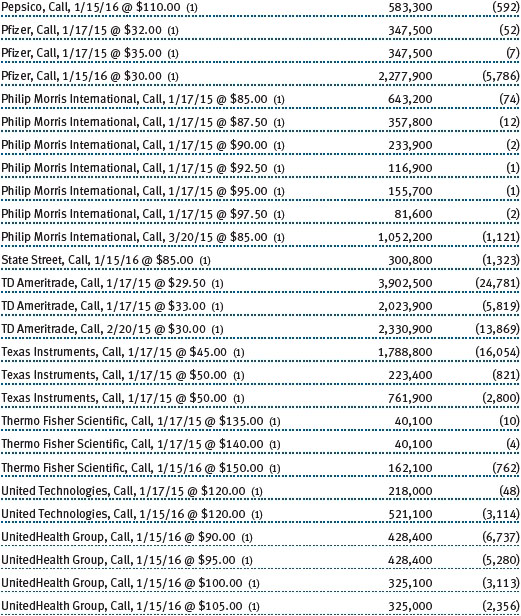
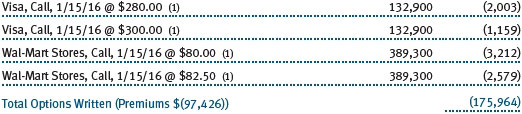
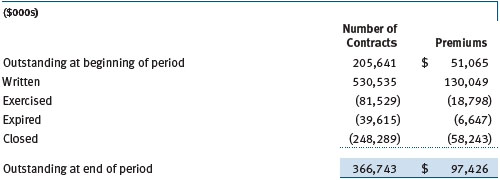
Options The fund is subject to equity price risk in the normal course of pursuing its investment objectives and uses options to help manage such risk. The fund may use options to manage exposure to security prices, interest rates, foreign currencies, and credit quality; as an efficient means of adjusting exposure to all or a part of a target market; to enhance income; as a cash management tool; or to adjust credit exposure. Options are included in net assets at fair value; purchased options are included in Investments in Securities; and written options are separately reflected as a liability on the accompanying Statement of Assets and Liabilities. Premiums on unexercised, expired options are recorded as realized gains or losses; premiums on exercised options are recorded as an adjustment to the proceeds from the sale or cost of the purchase. The difference between the premium and the amount received or paid in a closing transaction is also treated as realized gain or loss. In return for a premium paid, call and put options give the holder the right, but not the obligation, to purchase or sell, respectively, a security at a specified exercise price. Risks related to the use of options include possible illiquidity of the options markets; trading restrictions imposed by an exchange or counterparty; movements in the underlying security values; and, for written options, potential losses in excess of the fund’s initial investment. During the year ended December 31, 2014, the volume of the fund’s activity in options, based on underlying notional amounts, was generally between 7% and 14% of net assets. Transactions in written options and related premiums received during the year ended December 31, 2014, were as follows:
NOTE 4 - OTHER INVESTMENT TRANSACTIONS
Consistent with its investment objective, the fund engages in the following practices to manage exposure to certain risks and/or to enhance performance. The investment objective, policies, program, and risk factors of the fund are described more fully in the fund’s prospectus and Statement of Additional Information.
Noninvestment-Grade Debt Securities At December 31, 2014, approximately 21% of the fund’s net assets were invested, either directly or through its investment in T. Rowe Price institutional funds, in noninvestment-grade debt securities, commonly referred to as “high yield” or “junk” bonds. The noninvestment-grade bond market may experience sudden and sharp price swings due to a variety of factors, including changes in economic forecasts, stock market activity, large sustained sales by major investors, a high-profile default, or a change in market sentiment. These events may decrease the ability of issuers to make principal and interest payments and adversely affect the liquidity or value, or both, of such securities.
Restricted Securities The fund may invest in securities that are subject to legal or contractual restrictions on resale. Prompt sale of such securities at an acceptable price may be difficult and may involve substantial delays and additional costs.
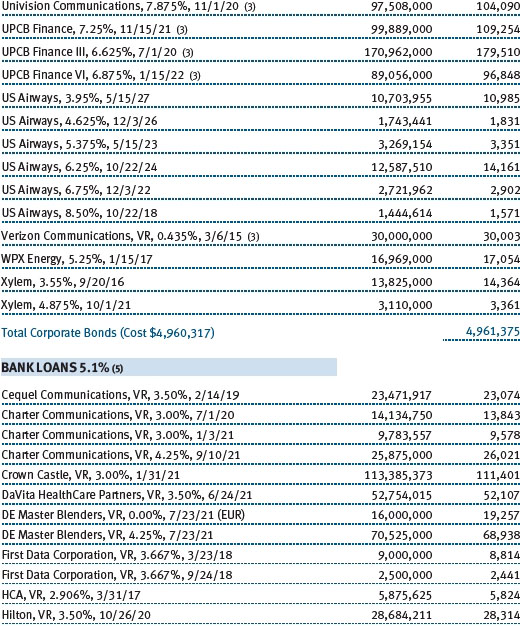
Bank Loans The fund may invest in bank loans, which represent an interest in amounts owed by a borrower to a syndication of lenders. Bank loans are generally noninvestment grade and often involve borrowers whose financial condition is troubled or highly leveraged. Bank loans may be in the form of either assignments or participations. A loan assignment transfers all legal, beneficial, and economic rights to the buyer, and transfer typically requires consent of both the borrower and agent. In contrast, a loan participation generally entitles the buyer to receive the cash flows from principal, interest, and any fee payments; however, the seller continues to hold legal title to the loan. As a result, the buyer of a loan participation generally has no direct rights against the borrower and is exposed to credit risk of both the borrower and seller of the participation.-Bank loans often have extended settlement periods, usually may be repaid at any time at the option of the borrower, and may require additional principal to be funded at the borrowers’ discretion at a later date (unfunded commitments). Until settlement, the fund maintains liquid assets sufficient to settle its unfunded loan commitments. The fund reflects both the funded portion of a bank loan as well as its unfunded commitment in the Portfolio of Investments. However, to the extent a credit agreement provides no initial funding of a tranche and funding of the full commitment at a future date(s) is at the borrower’s discretion and considered uncertain, no loan is reflected in the Portfolio of Investments until paid.
Other Purchases and sales of portfolio securities other than short-term securities aggregated $14,453,137,000 and $14,077,219,000, respectively, for the year ended December 31, 2014.
NOTE 5 - FEDERAL INCOME TAXES
No provision for federal income taxes is required since the fund intends to continue to qualify as a regulated investment company under Subchapter M of the Internal Revenue Code and distribute to shareholders all of its taxable income and gains. Distributions determined in accordance with federal income tax regulations may differ in amount or character from net investment income and realized gains for financial reporting purposes. Financial reporting records are adjusted for permanent book/tax differences to reflect tax character but are not adjusted for temporary differences.
The fund files U.S. federal, state, and local tax returns as required. The fund’s tax returns are subject to examination by the relevant tax authorities until expiration of the applicable statute of limitations, which is generally three years after the filing of the tax return but which can be extended to six years in certain circumstances. Tax returns for open years have incorporated no uncertain tax positions that require a provision for income taxes.
Reclassifications to paid-in capital relate primarily to a tax practice that treats a portion of the proceeds from each redemption of capital shares as a distribution of taxable net investment income or realized capital gain. For the year ended December 31, 2014, the following reclassifications were recorded to reflect tax character (there was no impact on results of operations or net assets):

Distributions during the years ended December 31, 2014 and December 31, 2013, were characterized for tax purposes as follows:

At December 31, 2014, the tax-basis cost of investments and components of net assets were as follows:

The difference between book-basis and tax-basis net unrealized appreciation (depreciation) is attributable to the deferral of losses from wash sales and certain derivative contracts for tax purposes.
NOTE 6 - RELATED PARTY TRANSACTIONS
The fund is managed by T. Rowe Price Associates, Inc. (Price Associates), a wholly owned subsidiary of T. Rowe Price Group, Inc. (Price Group). The investment management agreement between the fund and Price Associates provides for an annual investment management fee, which is computed daily and paid monthly. The fee consists of an individual fund fee, equal to 0.30% of the fund’s average daily net assets, and a group fee. The group fee rate is calculated based on the combined net assets of certain mutual funds sponsored by Price Associates (the group) applied to a graduated fee schedule, with rates ranging from 0.48% for the first $1 billion of assets to 0.275% for assets in excess of $400 billion. The fund’s group fee is determined by applying the group fee rate to the fund’s average daily net assets. At December 31, 2014, the effective annual group fee rate was 0.29%.
In addition, the fund has entered into service agreements with Price Associates and two wholly owned subsidiaries of Price Associates (collectively, Price). Price Associates computes the daily share prices and provides certain other administrative services to the fund. T. Rowe Price Services, Inc., provides shareholder and administrative services in its capacity as the fund’s transfer and dividend-disbursing agent. T. Rowe Price Retirement Plan Services, Inc., provides subaccounting and recordkeeping services for certain retirement accounts invested in the Investor Class and the Advisor Class. For the year ended December 31, 2014, expenses incurred pursuant to these service agreements were $210,000 for Price Associates; $5,889,000 for T. Rowe Price Services, Inc.; and $2,053,000 for T. Rowe Price Retirement Plan Services, Inc. The total amount payable at period-end pursuant to these service agreements is reflected as Due to Affiliates in the accompanying financial statements.
The fund may invest in the T. Rowe Price Reserve Investment Fund, the T. Rowe Price Government Reserve Investment Fund, or the T. Rowe Price Short-Term Reserve Fund (collectively, the Price Reserve Investment Funds), open-end management investment companies managed by Price Associates and considered affiliates of the fund. The Price Reserve Investment Funds are offered as short-term investment options to mutual funds, trusts, and other accounts managed by Price Associates or its affiliates and are not available for direct purchase by members of the public. The Price Reserve Investment Funds pay no investment management fees.
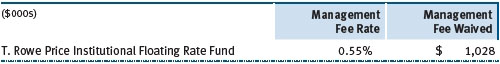
The fund may also invest in certain other T. Rowe Price funds as a means of gaining efficient and cost-effective exposure to certain markets. The fund does not invest for the purpose of exercising management or control; however, investments by the fund may represent a significant portion of an underlying T. Rowe Price fund’s net assets. Each underlying T. Rowe Price fund is an open-end management investment company managed by Price Associates and is considered an affiliate of the fund. To ensure that the fund does not incur duplicate management fees (paid by the underlying T. Rowe Price fund(s) and the fund), Price Associates has agreed to permanently waive a portion of its management fee charged to the fund in an amount sufficient to fully offset that portion of management fees paid by each underlying T. Rowe Price fund related to the fund’s investment therein. The accompanying Statement of Operations reflects management fees permanently waived pursuant to this agreement. Annual fee rates and management fees waived related to investments in the underlying T. Rowe Price fund(s) for the year ended December 31, 2014, are as follows:
| Report of Independent Registered Public Accounting Firm |
To the Board of Trustees and Shareholders of
T. Rowe Price Capital Appreciation Fund
In our opinion, the accompanying statement of assets and liabilities, including the portfolio of investments, and the related statements of operations and of changes in net assets and the financial highlights present fairly, in all material respects, the financial position of T. Rowe Price Capital Appreciation Fund (the “Fund”) at December 31, 2014, the results of its operations, the changes in its net assets and the financial highlights for each of the periods indicated therein, in conformity with accounting principles generally accepted in the United States of America. These financial statements and financial highlights (hereafter referred to as “financial statements”) are the responsibility of the Fund’s management. Our responsibility is to express an opinion on these financial statements based on our audits. We conducted our audits of these financial statements in accordance with the standards of the Public Company Accounting Oversight Board (United States). Those standards require that we plan and perform the audit to obtain reasonable assurance about whether the financial statements are free of material misstatement. An audit includes examining, on a test basis, evidence supporting the amounts and disclosures in the financial statements, assessing the accounting principles used and significant estimates made by management, and evaluating the overall financial statement presentation. We believe that our audits, which included confirmation of securities at December 31, 2014 by correspondence with the custodian and brokers, and confirmation of the underlying funds by correspondence with the transfer agent, provide a reasonable basis for our opinion.
PricewaterhouseCoopers LLP
Baltimore, Maryland
February 13, 2015
| Tax Information (Unaudited) for the Tax Year Ended 12/31/14 |
We are providing this information as required by the Internal Revenue Code. The amounts shown may differ from those elsewhere in this report because of differences between tax and financial reporting requirements.
The fund’s distributions to shareholders included:
| ● | $543,118,000 from short-term capital gains |
| |
| ● | $1,446,138,000 from long-term capital gains, subject to a long-term capital gains tax rate of not greater than 20%. |
For taxable non-corporate shareholders, $205,685,000 of the fund’s income represents qualified dividend income subject to a long-term capital gains tax rate of not greater than 20%.
For corporate shareholders, $182,425,000 of the fund’s income qualifies for the dividends-received deduction.
| Information on Proxy Voting Policies, Procedures, and Records |
A description of the policies and procedures used by T. Rowe Price funds and portfolios to determine how to vote proxies relating to portfolio securities is available in each fund’s Statement of Additional Information. You may request this document by calling 1-800-225-5132 or by accessing the SEC’s website, sec.gov.
The description of our proxy voting policies and procedures is also available on our website, troweprice.com. To access it, click on the words “Social Responsibility” at the top of our corporate homepage. Next, click on the words “Conducting Business Responsibly” on the left side of the page that appears. Finally, click on the words “Proxy Voting Policies” on the left side of the page that appears.
Each fund’s most recent annual proxy voting record is available on our website and through the SEC’s website. To access it through our website, follow the above directions to reach the “Conducting Business Responsibly” page. Click on the words “Proxy Voting Records” on the left side of that page, and then click on the “View Proxy Voting Records” link at the bottom of the page that appears.
| How to Obtain Quarterly Portfolio Holdings |
The fund files a complete schedule of portfolio holdings with the Securities and Exchange Commission for the first and third quarters of each fiscal year on Form N-Q. The fund’s Form N-Q is available electronically on the SEC’s website (sec.gov); hard copies may be reviewed and copied at the SEC’s Public Reference Room, 100 F St. N.E., Washington, DC 20549. For more information on the Public Reference Room, call 1-800-SEC-0330.
| About the Fund’s Trustees and Officers |
Your fund is overseen by a Board of Trustees (Board) that meets regularly to review a wide variety of matters affecting or potentially affecting the fund, including performance, investment programs, compliance matters, advisory fees and expenses, service providers, and business and regulatory affairs. The Board elects the fund’s officers, who are listed in the final table. At least 75% of the Board’s members are independent of T. Rowe Price Associates, Inc. (T. Rowe Price), and its affiliates; “inside” or “interested” trustees are employees or officers of T. Rowe Price. The business address of each trustee and officer is 100 East Pratt Street, Baltimore, Maryland 21202. The Statement of Additional Information includes additional information about the fund trustees and is available without charge by calling a T. Rowe Price representative at 1-800-638-5660.
| Independent Trustees |
| |
| Name | | |
| (Year of Birth) | | |
| Year Elected* | | |
| [Number of T. Rowe Price | | Principal Occupation(s) and Directorships of Public Companies and |
| Portfolios Overseen] | | Other Investment Companies During the Past Five Years |
| | | |
| William R. Brody, M.D., Ph.D. | | President and Trustee, Salk Institute for Biological Studies (2009 to |
| (1944) | | present); Director, BioMed Realty Trust (2013 to present); Director, |
| 2009 | | Novartis, Inc. (2009 to present); Director, IBM (2007 to present) |
| [165] | | |
| | | |
| Anthony W. Deering | | Chairman, Exeter Capital, LLC, a private investment firm (2004 to |
| (1945) | | present); Director, Brixmor Real Estate Investment Trust (2012 to |
| 2001 | | present); Director and Member of the Advisory Board, Deutsche |
| [165] | | Bank North America (2004 to present); Director, Under Armour |
| | (2008 to present); Director, Vornado Real Estate Investment Trust |
| | (2004 to 2012) |
| | | |
| Donald W. Dick, Jr. | | Principal, EuroCapital Partners, LLC, an acquisition and management |
| (1943) | | advisory firm (1995 to present) |
| 1986 | | |
| [165] | | |
| | | |
| Bruce W. Duncan | | President, Chief Executive Officer, and Director, First Industrial Realty |
| (1951) | | Trust, owner and operator of industrial properties (2009 to present); |
| 2013 | | Chairman of the Board (2005 to present), Interim Chief Executive |
| [165] | | Officer (2007), and Director, Starwood Hotels & Resorts, a hotel and |
| | leisure company (1999 to present) |
| | | |
| Robert J. Gerrard, Jr. | | Advisory Board Member, Pipeline Crisis/Winning Strategies, a |
| (1952) | | collaborative working to improve opportunities for young African |
| 2012 | | Americans (1997 to present); Chairman of Compensation Committee |
| [165] | | and Director, Syniverse Holdings, Inc., a provider of wireless voice |
| | and data services for telecommunications companies (2008 to 2011) |
| | | |
| Karen N. Horn | | Limited Partner and Senior Managing Director, Brock Capital Group, |
| (1943) | | an advisory and investment banking firm (2004 to present); Director, |
| 2003 | | Eli Lilly and Company (1987 to present); Director, Simon Property |
| [165] | | Group (2004 to present); Director, Norfolk Southern (2008 to present) |
| | | |
| Paul F. McBride | | Former Company Officer and Senior Vice President, Human |
| (1956) | | Resources and Corporate Initiatives, Black & Decker Corporation |
| 2013 | | (2004 to 2010) |
| [165] | | |
| | | |
| Cecilia E. Rouse, Ph.D. | | Dean, Woodrow Wilson School (2012 to present); Professor and |
| (1963) | | Researcher, Princeton University (1992 to present); Director, MDRC, a |
| 2012 | | nonprofit education and social policy research organization (2011 to |
| [165] | | present); Member, National Academy of Education (2010 to present); |
| | Research Associate, National Bureau of Economic Research’s Labor |
| | Studies Program (2011 to present); Member, President’s Council of |
| | Economic Advisors (2009 to 2011); Chair of Committee on the Status |
| | of Minority Groups in the Economic Profession, American Economic |
| | Association (2012 to present) |
| | | |
| John G. Schreiber | | Owner/President, Centaur Capital Partners, Inc., a real estate |
| (1946) | | investment company (1991 to present); Cofounder and Partner, |
| 2001 | | Blackstone Real Estate Advisors, L.P. (1992 to present); Director, |
| [165] | | General Growth Properties, Inc. (2010 to 2013); Director, BXMT |
| | (formerly Capital Trust, Inc.), a real estate investment company |
| | (2012 to present); Director and Chairman of the Board, Brixmor |
| | Property Group, Inc. (2013 to present); Director, Hilton Worldwide |
| | (2013 to present) |
| | | |
| Mark R. Tercek | | President and Chief Executive Officer, The Nature Conservancy (2008 |
| (1957) | | to present); Managing Director, The Goldman Sachs Group, Inc. |
| 2009 | | (1984 to 2008) |
| [165] | | |
| |
| *Each independent trustee serves until retirement, resignation, or election of a successor. |
| Inside Trustees |
| |
| Name | | |
| (Year of Birth) | | |
| Year Elected* | | |
| [Number of T. Rowe Price | | Principal Occupation(s) and Directorships of Public Companies and |
| Portfolios Overseen] | | Other Investment Companies During the Past Five Years |
| | | |
| Edward C. Bernard | | Director and Vice President, T. Rowe Price; Vice Chairman of the |
| (1956) | | Board, Director, and Vice President, T. Rowe Price Group, Inc.; |
| 2006 | | Chairman of the Board, Director, and President, T. Rowe Price |
| [165] | | Investment Services, Inc.; Chairman of the Board and Director, |
| | T. Rowe Price Retirement Plan Services, Inc., and T. Rowe Price |
| | Services, Inc.; Chairman of the Board, Chief Executive Officer, |
| | and Director, T. Rowe Price International; Chairman of the Board, |
| | Chief Executive Officer, Director, and President, T. Rowe Price Trust |
| | Company; Chairman of the Board, all funds |
| | | |
| Brian C. Rogers, CFA, CIC | | Chief Investment Officer, Director, and Vice President, T. Rowe Price; |
| (1955) | | Chairman of the Board, Chief Investment Officer, Director, and Vice |
| 2006 | | President, T. Rowe Price Group, Inc.; Vice President, T. Rowe Price |
| [111] | | Trust Company |
| |
| *Each inside trustee serves until retirement, resignation, or election of a successor. |
| Officers |
| |
| Name (Year of Birth) | | |
| Position Held With Capital Appreciation Fund | | Principal Occupation(s)
|
| Darrell N. Braman (1963) | | Vice President, Price Hong Kong, Price |
| Vice President | | Singapore, T. Rowe Price, T. Rowe Price Group, |
| | Inc., T. Rowe Price International, T. Rowe Price |
| | Investment Services, Inc., and T. Rowe Price |
| | Services, Inc.
|
| Ryan N. Burgess, CFA (1974) | | Vice President, T. Rowe Price and T. Rowe Price |
Vice President
| | Group, Inc. |
| Roger L. Fiery III, CPA (1959) | | Vice President, Price Hong Kong, Price |
| Vice President | | Singapore, T. Rowe Price, T. Rowe Price Group, |
| | Inc., T. Rowe Price International, and T. Rowe |
| | Price Trust Company |
| | | |
| John R. Gilner (1961) | | Chief Compliance Officer and Vice President, |
| Chief Compliance Officer | | T. Rowe Price; Vice President, T. Rowe Price |
| | Group, Inc., and T. Rowe Price Investment |
| | Services, Inc. |
| David R. Giroux, CFA (1975) | | Vice President, T. Rowe Price, T. Rowe Price |
President
| | Group, Inc., and T. Rowe Price Trust Company |
| Gregory S. Golczewski (1966) | | Vice President, T. Rowe Price and T. Rowe Price |
Vice President
| | Trust Company |
| Paul D. Greene II (1978) | | Vice President, T. Rowe Price and T. Rowe Price |
Vice President
| | Group, Inc. |
| Gregory K. Hinkle, CPA (1958) | | Vice President, T. Rowe Price, T. Rowe Price |
Treasurer
| | Group, Inc., and T. Rowe Price Trust Company |
| Nina P. Jones, CPA (1980) | | Vice President, T. Rowe Price and T. Rowe Price |
Vice President
| | Group, Inc. |
| Vidya Kadiyam (1980) | | Vice President, T. Rowe Price |
Vice President
| | |
| Steven D. Krichbaum (1977) | | Vice President, T. Rowe Price and T. Rowe Price |
Vice President
| | Group, Inc. |
| John D. Linehan, CFA (1965) | | Vice President, T. Rowe Price, T. Rowe Price |
Vice President
| | Group, Inc., and T. Rowe Price Trust Company |
| Patricia B. Lippert (1953) | | Assistant Vice President, T. Rowe Price and |
Secretary
| | T. Rowe Price Investment Services, Inc. |
| Paul M. Massaro, CFA (1975) | | Vice President, T. Rowe Price, T. Rowe Price |
Vice President
| | Group, Inc., and T. Rowe Price Trust Company |
| Sudhir Nanda, Ph.D., CFA (1959) | | Vice President, T. Rowe Price and T. Rowe Price |
Vice President
| | Group, Inc. |
| David Oestreicher (1967) | | Director, Vice President, and Secretary, T. Rowe |
| Vice President | | Price Investment Services, Inc., T. Rowe |
| | Price Retirement Plan Services, Inc., T. Rowe |
| | Price Services, Inc., and T. Rowe Price Trust |
| | Company; Chief Legal Officer, Vice President, |
| | and Secretary, T. Rowe Price Group, Inc.; Vice |
| | President and Secretary, T. Rowe Price and |
| | T. Rowe Price International; Vice President, |
| | Price Hong Kong and Price Singapore
|
| Robert T. Quinn, Jr. (1972) | | Vice President, T. Rowe Price and T. Rowe Price |
Vice President
| | Group, Inc. |
| Deborah D. Seidel (1962) | | Vice President, T. Rowe Price, T. Rowe Price |
| Vice President | | Group, Inc., T. Rowe Price Investment Services, |
| | Inc., and T. Rowe Price Services, Inc.
|
| Farris G. Shuggi (1984) | | Vice President, T. Rowe Price and T. Rowe Price |
Vice President
| | Group, Inc. |
| Gabriel Solomon (1977) | | Vice President, T. Rowe Price and T. Rowe Price |
Vice President
| | Group, Inc. |
| William J. Stromberg, CFA (1960) | | Director and Vice President, T. Rowe Price; Vice |
| Vice President | | President, Price Hong Kong, Price Singapore, |
| | T. Rowe Price Group, Inc., T. Rowe Price |
| | International, and T. Rowe Price Trust Company
|
| Taymour R. Tamaddon, CFA (1976) | | Vice President, T. Rowe Price and T. Rowe Price |
Vice President
| | Group, Inc. |
| Susan G. Troll, CPA (1966) | | Vice President, T. Rowe Price and T. Rowe Price |
Vice President
| | Group, Inc. |
| Julie L. Waples (1970) | | Vice President, T. Rowe Price |
Vice President
| | |
| Tamara P. Wiggs (1979) | | Vice President, T. Rowe Price and T. Rowe Price |
| Vice President | | Group, Inc. |
| |
| Unless otherwise noted, officers have been employees of T. Rowe Price or T. Rowe Price International for at least 5 years. |
Item 2. Code of Ethics.
The registrant has adopted a code of ethics, as defined in Item 2 of Form N-CSR, applicable to its principal executive officer, principal financial officer, principal accounting officer or controller, or persons performing similar functions. A copy of this code of ethics is filed as an exhibit to this Form N-CSR. No substantive amendments were approved or waivers were granted to this code of ethics during the period covered by this report.
Item 3. Audit Committee Financial Expert.
The registrant’s Board of Directors/Trustees has determined that Mr. Anthony W. Deering qualifies as an audit committee financial expert, as defined in Item 3 of Form N-CSR. Mr. Deering is considered independent for purposes of Item 3 of Form N-CSR.
Item 4. Principal Accountant Fees and Services.
(a) – (d) Aggregate fees billed for the last two fiscal years for professional services rendered to, or on behalf of, the registrant by the registrant’s principal accountant were as follows:

Audit fees include amounts related to the audit of the registrant’s annual financial statements and services normally provided by the accountant in connection with statutory and regulatory filings. Audit-related fees include amounts reasonably related to the performance of the audit of the registrant’s financial statements and specifically include the issuance of a report on internal controls and, if applicable, agreed-upon procedures related to fund acquisitions. Tax fees include amounts related to services for tax compliance, tax planning, and tax advice. The nature of these services specifically includes the review of distribution calculations and the preparation of Federal, state, and excise tax returns. All other fees include the registrant’s pro-rata share of amounts for agreed-upon procedures in conjunction with service contract approvals by the registrant’s Board of Directors/Trustees.
(e)(1) The registrant’s audit committee has adopted a policy whereby audit and non-audit services performed by the registrant’s principal accountant for the registrant, its investment adviser, and any entity controlling, controlled by, or under common control with the investment adviser that provides ongoing services to the registrant require pre-approval in advance at regularly scheduled audit committee meetings. If such a service is required between regularly scheduled audit committee meetings, pre-approval may be authorized by one audit committee member with ratification at the next scheduled audit committee meeting. Waiver of pre-approval for audit or non-audit services requiring fees of a de minimis amount is not permitted.
(2) No services included in (b) – (d) above were approved pursuant to paragraph (c)(7)(i)(C) of Rule 2-01 of Regulation S-X.
(f) Less than 50 percent of the hours expended on the principal accountant’s engagement to audit the registrant’s financial statements for the most recent fiscal year were attributed to work performed by persons other than the principal accountant’s full-time, permanent employees.
(g) The aggregate fees billed for the most recent fiscal year and the preceding fiscal year by the registrant’s principal accountant for non-audit services rendered to the registrant, its investment adviser, and any entity controlling, controlled by, or under common control with the investment adviser that provides ongoing services to the registrant were $2,283,000 and $1,691,000, respectively.
(h) All non-audit services rendered in (g) above were pre-approved by the registrant’s audit committee. Accordingly, these services were considered by the registrant’s audit committee in maintaining the principal accountant’s independence.
Item 5. Audit Committee of Listed Registrants.
Not applicable.
Item 6. Investments.
(a) Not applicable. The complete schedule of investments is included in Item 1 of this Form N-CSR.
(b) Not applicable.
Item 7. Disclosure of Proxy Voting Policies and Procedures for Closed-End Management Investment Companies.
Not applicable.
Item 8. Portfolio Managers of Closed-End Management Investment Companies.
Not applicable.
Item 9. Purchases of Equity Securities by Closed-End Management Investment Company and Affiliated Purchasers.
Not applicable.
Item 10. Submission of Matters to a Vote of Security Holders.
Not applicable.
Item 11. Controls and Procedures.
(a) The registrant’s principal executive officer and principal financial officer have evaluated the registrant’s disclosure controls and procedures within 90 days of this filing and have concluded that the registrant’s disclosure controls and procedures were effective, as of that date, in ensuring that information required to be disclosed by the registrant in this Form N-CSR was recorded, processed, summarized, and reported timely.
(b) The registrant’s principal executive officer and principal financial officer are aware of no change in the registrant’s internal control over financial reporting that occurred during the registrant’s second fiscal quarter covered by this report that has materially affected, or is reasonably likely to materially affect, the registrant’s internal control over financial reporting.
Item 12. Exhibits.
(a)(1) The registrant’s code of ethics pursuant to Item 2 of Form N-CSR is attached.
(2) Separate certifications by the registrant's principal executive officer and principal financial officer, pursuant to Section 302 of the Sarbanes-Oxley Act of 2002 and required by Rule 30a-2(a) under the Investment Company Act of 1940, are attached.
(3) Written solicitation to repurchase securities issued by closed-end companies: not applicable.
(b) A certification by the registrant's principal executive officer and principal financial officer, pursuant to Section 906 of the Sarbanes-Oxley Act of 2002 and required by Rule 30a-2(b) under the Investment Company Act of 1940, is attached.
SIGNATURES
Pursuant to the requirements of the Securities Exchange Act of 1934 and the Investment Company Act of 1940, the registrant has duly caused this report to be signed on its behalf by the undersigned, thereunto duly authorized.
T. Rowe Price Capital Appreciation Fund
| | By | /s/ Edward C. Bernard |
| | Edward C. Bernard |
| | Principal Executive Officer |
| |
| Date February 13, 2015 | | |
Pursuant to the requirements of the Securities Exchange Act of 1934 and the Investment Company Act of 1940, this report has been signed below by the following persons on behalf of the registrant and in the capacities and on the dates indicated.
| | By | /s/ Edward C. Bernard |
| | Edward C. Bernard |
| | Principal Executive Officer |
| |
| Date February 13, 2015 | | |
| |
| |
| By | /s/ Gregory K. Hinkle |
| | Gregory K. Hinkle |
| | Principal Financial Officer |
| |
| Date February 13, 2015 | | |