UNITED STATES
SECURITIES AND EXCHANGE COMMISSION
Washington, D.C. 20549
FORM N-CSR
CERTIFIED SHAREHOLDER REPORT OF REGISTERED
MANAGEMENT INVESTMENT COMPANIES
Investment Company Act File Number: 811-04519
| T. Rowe Price Capital Appreciation Fund, Inc. |
|
| (Exact name of registrant as specified in charter) |
| |
| 100 East Pratt Street, Baltimore, MD 21202 |
|
| (Address of principal executive offices) |
| |
| David Oestreicher |
| 100 East Pratt Street, Baltimore, MD 21202 |
|
| (Name and address of agent for service) |
Registrant’s telephone number, including area code: (410) 345-2000
Date of fiscal year end: December 31
Date of reporting period: December 31, 2017
Item 1. Report to Shareholders
| Capital Appreciation Fund | December 31, 2017 |

The views and opinions in this report were current as of December 31, 2017. They are not guarantees of performance or investment results and should not be taken as investment advice. Investment decisions reflect a variety of factors, and the managers reserve the right to change their views about individual stocks, sectors, and the markets at any time. As a result, the views expressed should not be relied upon as a forecast of the fund’s future investment intent. The report is certified under the Sarbanes-Oxley Act, which requires mutual funds and other public companies to affirm that, to the best of their knowledge, the information in their financial reports is fairly and accurately stated in all material respects.
REPORTS ON THE WEB
Sign up for our Email Program, and you can begin to receive updated fund reports and prospectuses online rather than through the mail. Log in to your account at troweprice.com for more information.
Manager’s Letter
Fellow Shareholders
In looking back at 2017, it was a year of acceleration in terms of global economic growth as well as earnings growth. After two years of almost no earnings growth in the U.S., earnings growth accelerated to the high single digits, driven principally by a recovery in energy profits as oil prices rose, a noncash accounting change that positively impacted earnings, and a continuation of the modest mid-single-digit growth in non-energy earnings. European earnings growth, which had been nonexistent for almost four years, was stronger than in the U.S.
Economic growth accelerated in the U.S. due to higher capital spending tied to energy, a more pro-business administration coming into power, and easier comparisons. European and emerging markets economic growth also improved, driven by a more pro-business government in France, a stabilization in key emerging markets such as Brazil, as well as stable growth in China.
At the end of 2017, the Republican-controlled Congress passed tax reform legislation that President Trump signed. While there very well may be long-term consequences from this legislation given that it is expected to add well over $1 trillion to the U.S. national debt over the next decade, the short-term consequences of this legislation are decidedly positive for the market. We expect to see a modest improvement in GDP growth, higher capital spending, and a modest uptick in consumer spending as a result of this legislation. However, the most positive impact for the stock market is the reduction in the corporate tax rate from 35% to 21%. We estimate that this alone will drive 6%–7% earnings growth (net of offsets) in 2018. The combination of further upside in energy earnings, a continuation of mid-single-digit core non-energy earnings growth, and a weaker dollar is likely to push earnings growth in 2018 to the low-to mid-teens range. This would represent the first year of double-digit earnings growth since 2010.
Despite these positive developments, your fund management team has concerns about the outlook for the intermediate term. While the recovery in energy was a large contributor to earnings growth and economic expansion in 2017, we believe energy prices are likely to turn lower in 2018 and beyond as oil prices are well above the levels needed to incentivize new production. While the corporate tax rate reduction is a positive in 2018, it will likely be a negative in 2019 and beyond, as some of the benefit is competed away in many, but not all, industries. In addition, the combination of a very long stock market upcycle, an elongated economic expansion, and very high valuation levels is likely to cause future returns to be below average at best, and the odds of a material downdraft in the market over the next three years are not insignificant.
We would emphasize that we are not macro investors and we don’t invest in markets and indexes. We are bottom-up investors looking across asset classes to find the best risk-adjusted return opportunities, with a particular emphasis on protecting the downside and aiming to generate positive absolute returns over a three-year period regardless of how poor the market performs. The challenge we face today is that we are finding fewer attractive risk-adjusted investments across asset classes, as valuations have expanded and credit spreads have compressed. These challenges have led us to reduce our equity and high yield exposures and, more recently in 2018, to add to lower-risk assets, such as Treasuries and investment-grade bonds. Your portfolio management team takes a long-term approach to our investments, as we are very willing to reduce risk when markets are expensive and optimism is high. Likewise, as we have demonstrated in past downturns and corrections, we are very willing to add to risk assets when valuations are low and uncertainty is high.
Before we discuss fund performance, I would like to review the three goals of the Capital Appreciation Fund:
(1) Generate strong risk-adjusted returns annually
(2) Preserve shareholder capital over the intermediate term (i.e., three years)
(3) Generate equity-like returns with less risk than that of the overall market over a full market cycle (i.e., normally five years)
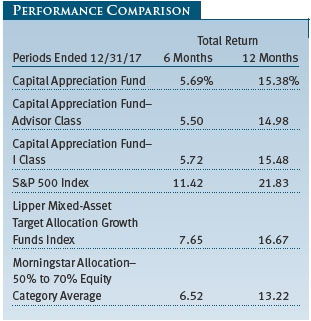
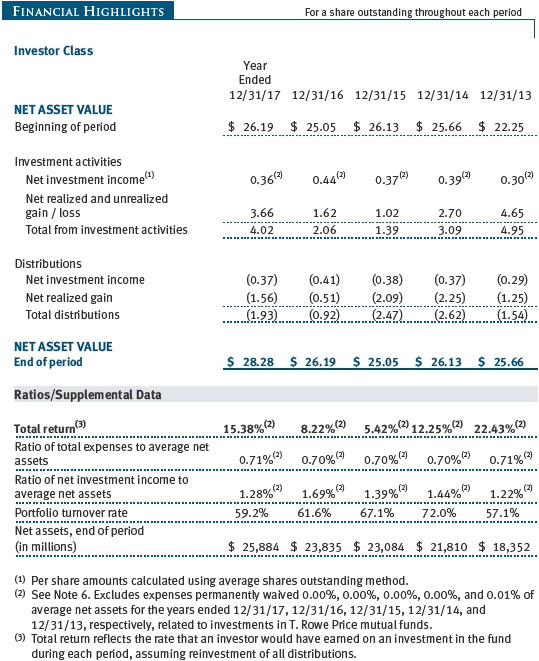
We are pleased to report that the Capital Appreciation Fund generated solid absolute and risk-adjusted returns in 2017. Your fund generated a 15.38% return relative to the S&P 500’s 21.83% return. (The performance of the Advisor and I Class shares will vary due to different fee structures.)
Your fund outperformed the market on a risk-adjusted basis over this period, generating 70% of the market’s return while taking on only 59% of the market’s risk. We arrived at this risk number by comparing the standard deviation of the S&P 500 (6.65) with that of the fund (3.93) for the 12-month period. Standard deviation indicates the volatility of a portfolio’s total return as measured against its mean performance. In general, the higher the standard deviation, the greater the volatility or risk.
Using a more academic measure of the fund’s risk-adjusted return, your fund produced a Sharpe ratio of 3.70 versus 3.16 for the S&P 500. The Sharpe ratio measures how much a portfolio’s return is above or below the risk-free Treasury rate (excess return) per unit of risk (measured by standard deviation). In general, the larger the number, the better the portfolio’s historical risk-adjusted return.
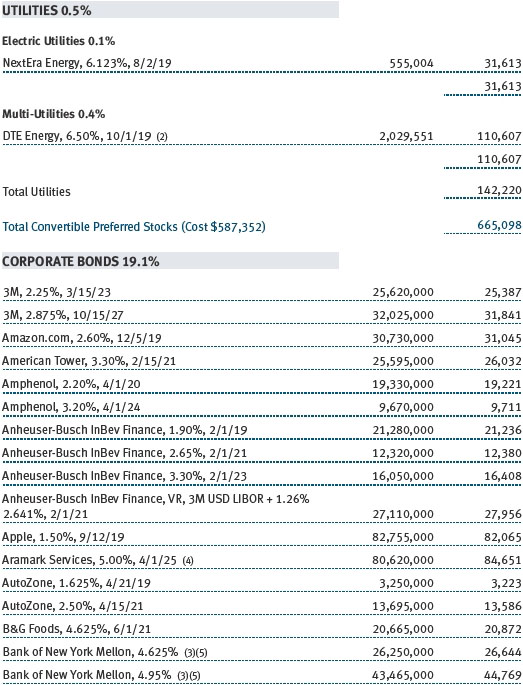
As for our second goal—capital preservation over the intermediate term—your fund generated a 31.63% cumulative return over the last three years. This goal has been a relatively simple one to achieve given how strong equity market returns have been over this time period.
As for our final goal—equity-like returns with less risk than the market over a full market cycle—your fund generated an 80.89% cumulative return over the last five years versus 108.14% for the S&P 500. Based on annualized returns of 12.59% for your fund versus 15.79% for the S&P 500, your fund generated 80% of the market’s return over the last five years while taking on 62% of the market’s risk. While market and economic cycles have historically lasted around five years, on average, we also tend to think about a full market cycle encompassing at least one ugly return year. As your fund is not a pure equity fund, it would be very difficult to match the equity market’s return over any period in which we did not have at least one equity market correction. Hence, if we extend the analysis to encompass 2008 and measure the last 10 years of fund performance, we would have accomplished this last goal by delivering 106% of the market’s return while taking only 70% of the market’s risk.
In addition, our equities outperformed the S&P 500 by 247 basis points (24.30% versus 21.83%), and our fixed income investments outperformed the Bloomberg Barclays U.S. Aggregate Bond Index by 118 basis points (4.72% versus 3.54%) in 2017. Over the last 3-, 5-, and 10-year periods, our equities have outperformed the S&P 500 by an average of 379, 445, and 527 basis points, respectively.
For the 1-, 3-, 5-, and 10-year periods ended December 31, 2017, we outperformed our Lipper and Morningstar peers over every period with one exception. We did modestly trail the Lipper index over the last year, as this peer group has a structurally higher equity allocation than Capital Appreciation has. Nevertheless, over the 3-, 5-, and 10-year periods, we were still in the first or second percentile of this peer grouping. (Based on cumulative total return, the Capital Appreciation Fund ranked 268 of 495, 6 of 445, 5 of 421, and 1 of 311 funds in the Lipper mixed-asset target allocation growth funds universe for the 1-, 3-, 5-, and 10-year periods ended December 31, 2017, respectively. Results may vary for other periods. Past performance cannot guarantee future results.)

However, let us reiterate that we do not manage your fund to beat these benchmarks. The Capital Appreciation Fund has very different objectives than most of its benchmark peers. It is a unique fund with a clear focus on strong risk-adjusted returns, intermediate-term capital preservation, and long-term capital appreciation that does not neatly fit into any current benchmark.
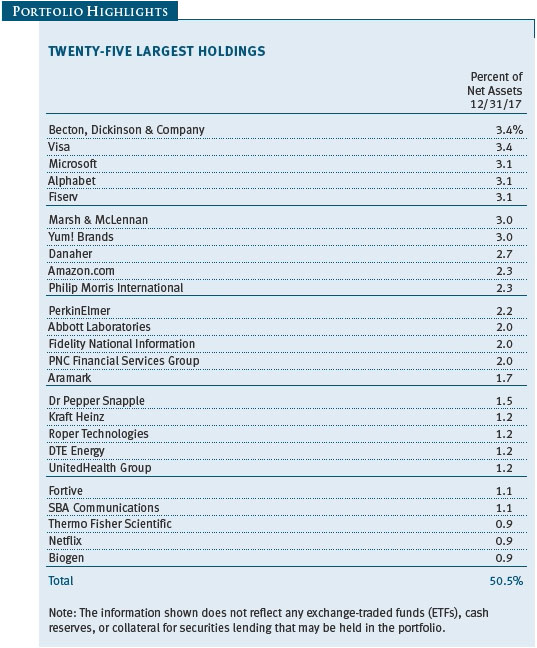
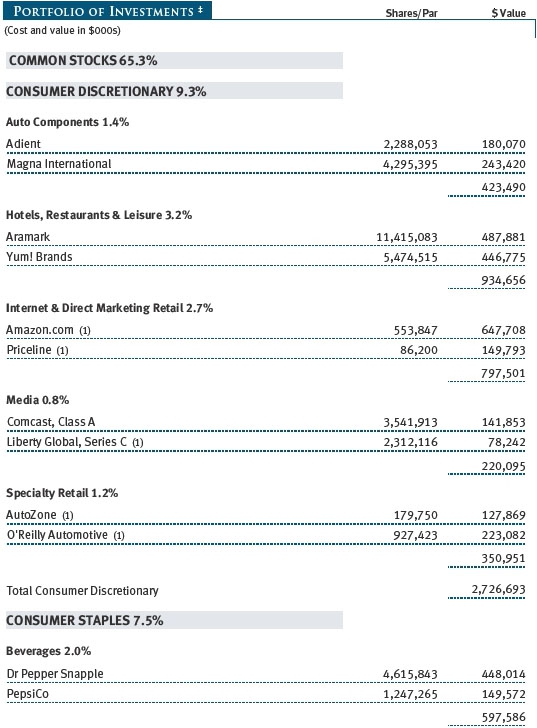
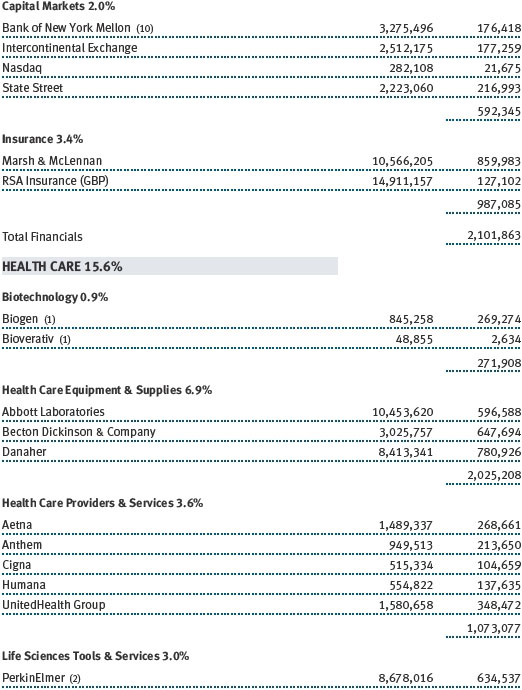
Within the equity portion of the portfolio, our health care holdings generated very strong absolute and relative returns. While the sector performed broadly in line with the market in 2017, our health care securities outperformed. Abbott Laboratories was one of the biggest winners in 2017, rising 52%. Abbott came under pressure in mid-2016 after it announced the acquisition of St. Jude Medical. At the time, St. Jude was struggling to grow organically due to a series of manufacturing, regulatory, and product-specific issues in part of its business. Abbott’s management team was very successful in addressing these issues, as well as generating strong synergies from the transaction, and as a result, Abbott is in a position to show accelerating revenue and earnings growth in 2018. Abbott is a classic example of the type of situations in which we love to invest: a good company with a strong management team where there is a short-term challenge or uncertainty that is causing the company to trade at a discount to its intrinsic value. This uncertainty creates an opportunity for us to add to an existing position or initiate a new position at well below the firm’s intrinsic value. As Abbott Laboratories has rerated materially higher, we have moderated our bet but still maintain a large position. (Please refer to the fund’s portfolio of investments for a complete list of holdings and the amount each represents in the portfolio.)
PerkinElmer was also a strong performer last year, rising 41%. The company is in transition, as its high-growth franchises, which now make up half of its revenues, continue to become a larger part of its base. PerkinElmer management accelerated this transition last year by selling a no-growth business and buying a fast-growing diagnostics business that should generate very attractive returns on capital over the next five years. Over time, PerkinElmer’s business mix is improving to become more predictable, with faster growth and higher margins. We continue to believe that PerkinElmer should compound earnings at a low-double-digit rate and that its valuation discount to its life sciences peers should continue to shrink. In addition, our investments in managed care stocks such as UnitedHealth Group, Cigna, Humana, and Aetna were large contributors, as fundamentals remained strong and valuations rose.
A large underweight to the energy sector contributed to your fund’s relative performance. Energy was one of the worst-performing sectors in 2017 despite higher oil prices and higher oil company profits. The energy sector actually declined 1% versus the 22% rise in the S&P 500. We had only about 1%–2% of our equity assets in this sector throughout the year relative to the 6% energy weight in the S&P 500. In addition, our three energy holdings, Canadian Natural Resources, Total SA, and Enterprise Products Partners, all outperformed the energy sector, and Canadian Natural Resources actually outperformed the S&P 500. We continue to be secular bears on the energy sector. The discovery of highly productive on-shore U.S. shale oil is a game changer for global oil supply, and over the long term, it threatens to break the power of the OPEC cartel. In addition, over the next 20+ years, the proliferation of electric and hybrid cars will slow the growth in demand for oil.
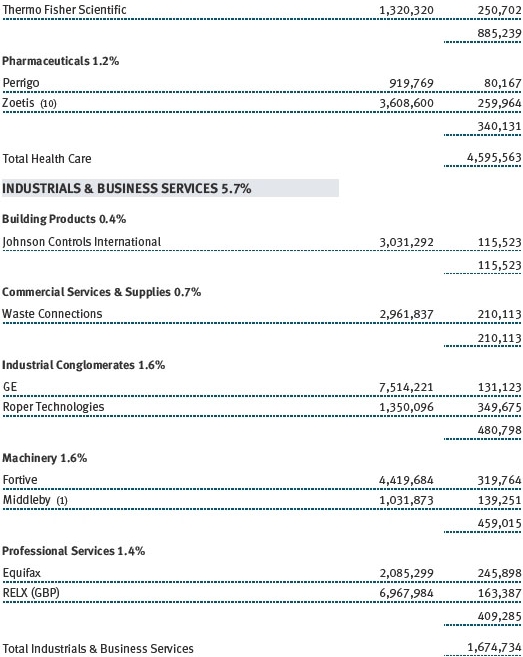
In addition, last year, your fund was hurt by two black swan events that involved Equifax and PG&E. Equifax was the victim of a data breach through which hackers were able to steal millions of Social Security numbers and personal data. While multiple companies have been hacked in recent years, it does appear that there were internal mistakes that made this breach possible. The CEO was forced to resign, and the stock came under material pressure. The only good news here is that Equifax’s most valuable proprietary databases were not breached and none of its international operations were impacted. We added to Equifax during the period of uncertainty, and while we are likely to see lower growth or even a decline in earnings in 2018, we fully expect Equifax to slowly but surely get back to its old earnings-per-share algorithm over time and return to a premium valuation. We hope that Equifax performs in 2018 like Abbott Laboratories did in 2017, as this cloud of uncertainty is lifted and investors feel better about the company going into 2019 than they did coming into 2018.

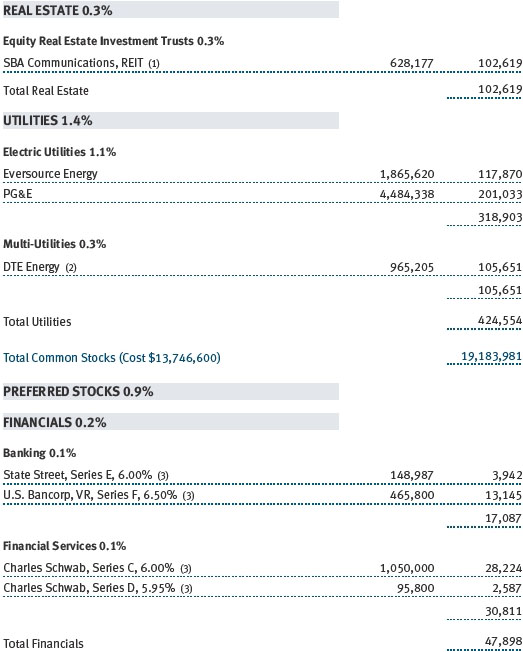
Our worst-performing name in 2017 was Pacific Gas & Electric. PG&E was a top holding of your fund for most of last year. As you may know, California was devastated by wildfires in 2017. The combination of dry conditions, high winds, and dying vegetation created an environment that was very conducive to fire creation. It has been speculated that some of the fires were started by downed power lines and damaged electrical equipment. The question remains whether PG&E was at fault and thus responsible for the damages. We are unlikely to know PG&E’s ultimate liability for at least six to 18 months. PG&E decided to suspend its dividend to preserve capital in the event the company is ultimately held liable for some or all of these damages. In most states and at the federal level, fire damages are a cost that can be passed on to rate payers unless there is gross negligence. Based on our exhaustive research and analysis, we don’t believe there was gross negligence. Nevertheless, California has historically held utilities to a materially higher standard, and it remains to be seen whether the state will hold PG&E financially responsible for damages that were not its fault. While we cut back our position early on as we thought the market was underestimating this potential liability, we have been adding back to the position on weakness following the dividend cut.
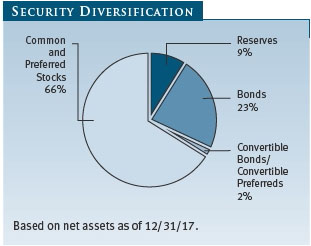
Our fixed income investments outperformed the Bloomberg Barclays U.S. Aggregate Bond Index. Our fixed income securities were up 4.72% versus 3.54% for the index. Our higher-quality, noninvestment-grade bonds performed well as spreads compressed over the year. For the first time in four years, we have started adding to longer-duration Treasuries at the beginning of 2018, as we finally see an attractive risk/reward situation materializing in U.S. government bonds. We have funded these positions through a reduction in our cash reserves.
Your fund has employed a covered call overwriting strategy consistently since 2008. This involves buying an equity security and writing a call that becomes exercisable at a higher price in return for an upfront premium. Since your fund began to employ this strategy, the covered call overwriting program has generated 108% of the equity market’s return while only taking on 63% of the market’s risk. In calendar year 2017, our covered call program generated 107% of the market’s return while only taking on 67% of the market’s risk. While the underlying derivatives negatively contributed to performance in 2017, the underlying equities were material positive contributors to performance and the combined portfolio of equities and the calls written against them produced excellent absolute and risk-adjusted returns. In addition, the call buying that we executed in late 2017 to take advantage of our views on the likelihood of tax reform produced positive returns for our shareholders.
PORTFOLIO STRATEGY AND OUTLOOK
Over a long period of time, stock markets should appreciate in line with the level of economic wealth creation by the underlying companies in the market. While clearly not perfect, earnings are a reasonable proxy for economic wealth creation. Over the last five years, we have witnessed very strong stock market appreciation—the S&P 500’s five-year average annual return through the end of 2017 was 15.79% (excluding dividends, the index’s five-year annualized return was 13.39%)—but very timid mid-single-digit growth in earnings. In essence, the stock market has appreciated at a materially faster pace than the rate of economic wealth creation.
Why has this happened? Five years ago, the stock market was trading very much in line with its long-term averages, so it was not that the market was excessively cheap at that time. Interest rates are not materially different. Today the Federal Reserve is raising short-term interest rates and selling off some of its bond holdings, whereas five years ago it was engaging in aggressive quantitative easing and short-term rates were close to zero. Based on almost all economic variables, the U.S. economy is in the later stages of its economic expansion, whereas five years ago it was still in the early to mid-stage of its recovery. Historically, valuations tend to decline, as opposed to expand, as the economic cycle ages. That is what happened in the 2002–2007 cycle, where the S&P 500 market troughed at 20x earnings in 2002–2003 and peaked at 15.5x in 2007. In the current cycle, the market troughed at 13x and now trades at 19x 2018 estimated earnings.
So how can this be? The truth of the matter is everything feels good right now. The global economy was stronger than expected in 2017 and feels like it has momentum coming into 2018. Higher energy prices, the benefits from the Trump tax cuts, and the weak dollar are creating a very positive short-term backdrop that is driving strong earnings growth and investor euphoria.
The problem here is that things felt really good in 1999, 2006, the first half of 2011, and late 2015, and within three to 12 months, markets were materially lower in all cases. We believe one of the great market inefficiencies that we try to take advantage of is the market’s extrapolating tendency both to the upside and the downside. When things feel good, no one cares about heightened valuations, and when there is uncertainty in the market, no one cares about low valuations. The market systematically gets it wrong during extremes to the upside and downside, and we take advantage of both euphoria and panic to create long-term value for our clients.
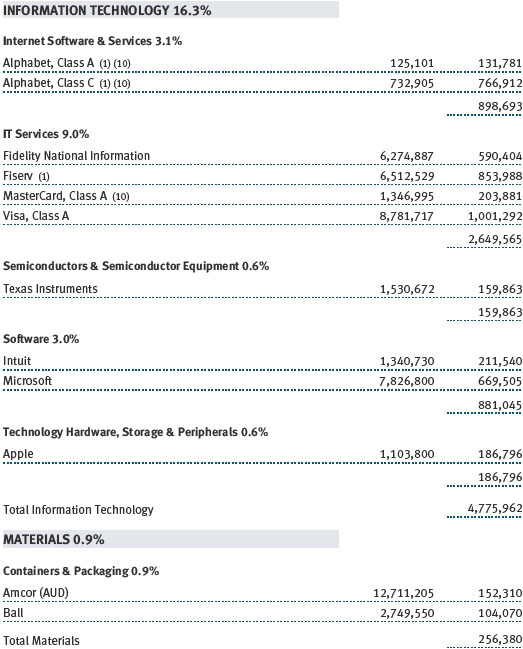
What could cause this cycle to end? A military conflict in North Korea, higher-than-expected inflation causing the Fed to raise rates more quickly to slow the economy, a recession, a trade war, a spike in energy prices, weakness in the so-called FANG stocks (Facebook, Amazon.com, Netflix, and Google, whose parent company is Alphabet), and many other unexpected unknowns could all cause an end to the cycle and pressure risk assets, including stocks. The point is not that we are calling for any of these events to occur, but if any of these events were to occur, given how high valuations are today, the downside in the market from these elevated levels could be material.
Put simply, there is very little, if any, margin of safety in the stock market and in risk assets today. Given that we are tasked with protecting our clients’ assets from a risk of loss over a three-year period, this drives us to be more cautious.
FIXED INCOME COMMENTS
While we are long-term fans of the high yield bond market, credit spreads in this market are tight today relative to history, and spreads tend to be mean reverting over time. We decreased our high yield exposure from 15% of assets at the end of 2016 to 11% at the end of 2017, and we expect this exposure to decrease further in 2018 unless spreads widen and become more attractive.
We have started to buy Treasury bonds in early 2018, as mentioned earlier. This is the third time we have bought Treasury bonds in size in the last 11 years. While the absolute yield on Treasuries is not compelling, the risk of absolute loss is low and their upside appreciation potential in a downturn can help cushion the impact from a likely decline in our risk assets. In addition to Treasuries, we own, and continue to expect to add, high-quality investment-grade corporate bonds. These bonds have higher yields and, while not as defensive as Treasuries, will likely appreciate modestly in a market downturn.
IN CLOSING
We would like to thank all the analysts, associate analysts, quantitative analysts, and members of our team (Mike Signore, Chen Tian, Steven Krichbaum) for their assistance in 2017. The long-term success and exceptional risk-adjusted returns of the strategy are truly a team effort.
In addition, Steven Krichbaum, who has been an associate portfolio manager for the last five and a half years, has decided to accept a new, challenging product role at T. Rowe Price and will be moving on to this role in April of 2018. During Steven’s tenure on the team, your fund has outperformed almost all of its peers and generated very attractive risk-adjusted returns. We all would like to thank Steven for his many contributions to your fund and wish him well in his new role. We look forward to announcing Steven’s replacement in the near future.
Respectfully submitted,

David R. Giroux
Chairman of the fund’s Investment Advisory Committee

Steven D. Krichbaum
Associate portfolio manager
January 29, 2018
The committee chairman has day-to-day responsibility for managing the portfolio and works with committee members in developing and executing the fund’s investment program.
RISKS OF INVESTING
As with all stock and bond mutual funds, the fund’s share price can fall because of weakness in the stock or bond markets, a particular industry, or specific holdings. Stock markets can decline for many reasons, including adverse political or economic developments, changes in investor psychology, or heavy institutional selling. The prospects for an industry or company may deteriorate because of a variety of factors, including disappointing earnings or changes in the competitive environment. In addition, the investment manager’s assessment of companies held in a fund may prove incorrect, resulting in losses or poor performance even in rising markets. A sizable cash or fixed income position may hinder the fund from participating fully in a strong, rapidly rising bull market. In addition, significant exposure to bonds increases the risk that the fund’s share value could be hurt by rising interest rates or credit downgrades or defaults. Convertible securities are also exposed to price fluctuations of the company’s stock.
GLOSSARY
Bloomberg Barclays U.S. Aggregate Bond Index: An unmanaged index that tracks domestic investment-grade bonds, including corporate, government, and mortgage-backed securities.
Credit spreads: The amount of additional yield demanded by bond investors in exchange for buying riskier assets.
Duration: A measure of a bond fund’s sensitivity to changes in interest rates. For example, a fund with a duration of five years would fall about 5% in price in response to a one-percentage-point rise in interest rates, and vice versa.
Gross domestic product (GDP): The total market value of all goods and services produced in a country in a given year.
Lipper indexes: Fund benchmarks that consist of a small number of the largest mutual funds in a particular category as tracked by Lipper Inc.
Morningstar Allocation–50% to 70% Equity Category Average: Tracks the performance of funds that seek capital appreciation and income by investing in multiple asset classes, including stocks, bonds, and cash. Equity exposures range from 50% to 70%.
Sharpe ratio: A measure of the risk-adjusted return of a portfolio. The Sharpe ratio measures how much a portfolio’s return is above or below the risk-free Treasury rate (excess return) per unit risk (measured by standard deviation). In general, the larger the number, the better the portfolio’s historical risk-adjusted return.
S&P 500 Index: An unmanaged index that tracks the stocks of 500 primarily large-cap U.S. companies.
Standard deviation: A measure of risk that indicates the volatility of a portfolio’s total returns as measured against its mean performance. In general, the higher the standard deviation, the greater the volatility or risk.
Note: Bloomberg Index Services Ltd. Copyright 2018, Bloomberg Index Services Ltd. Used with permission.

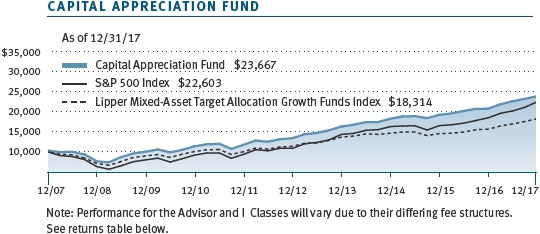
Performance and Expenses
This chart shows the value of a hypothetical $10,000 investment in the fund over the past 10 fiscal year periods or since inception (for funds lacking 10-year records). The result is compared with benchmarks, which may include a broad-based market index and a peer group average or index. Market indexes do not include expenses, which are deducted from fund returns as well as mutual fund averages and indexes.


As a mutual fund shareholder, you may incur two types of costs: (1) transaction costs, such as redemption fees or sales loads, and (2) ongoing costs, including management fees, distribution and service (12b-1) fees, and other fund expenses. The following example is intended to help you understand your ongoing costs (in dollars) of investing in the fund and to compare these costs with the ongoing costs of investing in other mutual funds. The example is based on an investment of $1,000 invested at the beginning of the most recent six-month period and held for the entire period.
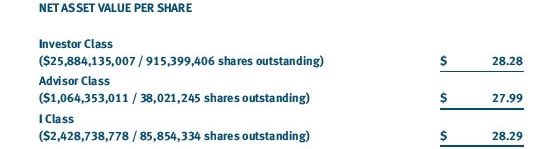
Please note that the fund has three share classes: The original share class (Investor Class) charges no distribution and service (12b-1) fee, the Advisor Class shares are offered only through unaffiliated brokers and other financial intermediaries and charge a 0.25% 12b-1 fee, and I Class shares are available to institutionally oriented clients and impose no 12b-1 or administrative fee payment. Each share class is presented separately in the table.
Actual Expenses
The first line of the following table (Actual) provides information about actual account values and expenses based on the fund’s actual returns. You may use the information on this line, together with your account balance, to estimate the expenses that you paid over the period. Simply divide your account value by $1,000 (for example, an $8,600 account value divided by $1,000 = 8.6), then multiply the result by the number on the first line under the heading “Expenses Paid During Period” to estimate the expenses you paid on your account during this period.
Hypothetical Example for Comparison Purposes
The information on the second line of the table (Hypothetical) is based on hypothetical account values and expenses derived from the fund’s actual expense ratio and an assumed 5% per year rate of return before expenses (not the fund’s actual return). You may compare the ongoing costs of investing in the fund with other funds by contrasting this 5% hypothetical example and the 5% hypothetical examples that appear in the shareholder reports of the other funds. The hypothetical account values and expenses may not be used to estimate the actual ending account balance or expenses you paid for the period.
Note: T. Rowe Price charges an annual account service fee of $20, generally for accounts with less than $10,000. The fee is waived for any investor whose T. Rowe Price mutual fund accounts total $50,000 or more; accounts electing to receive electronic delivery of account statements, transaction confirmations, prospectuses, and shareholder reports; or accounts of an investor who is a T. Rowe Price Personal Services or Enhanced Personal Services client (enrollment in these programs generally requires T. Rowe Price assets of at least $250,000). This fee is not included in the accompanying table. If you are subject to the fee, keep it in mind when you are estimating the ongoing expenses of investing in the fund and when comparing the expenses of this fund with other funds.
You should also be aware that the expenses shown in the table highlight only your ongoing costs and do not reflect any transaction costs, such as redemption fees or sales loads. Therefore, the second line of the table is useful in comparing ongoing costs only and will not help you determine the relative total costs of owning different funds. To the extent a fund charges transaction costs, however, the total cost of owning that fund is higher.

The accompanying notes are an integral part of these financial statements.

The accompanying notes are an integral part of these financial statements.

The accompanying notes are an integral part of these financial statements.


The accompanying notes are an integral part of these financial statements.
The accompanying notes are an integral part of these financial statements.

The accompanying notes are an integral part of these financial statements.

The accompanying notes are an integral part of these financial statements.
| Notes to Financial Statements |
T. Rowe Price Capital Appreciation Fund, Inc. (the fund) is registered under the Investment Company Act of 1940 (the 1940 Act) as a diversified, open-end management investment company. The fund, organized as a Maryland corporation, is the successor to the T. Rowe Price Capital Appreciation Fund pursuant to an agreement and plan of reorganization for a change in domicile, effective October 30, 2017. The reorganization and redomiciliation had no effect on the fund’s investment objective and strategies or on the fund’s net assets. The fund seeks long-term capital appreciation by investing primarily in common stocks. It may also hold fixed-income and other securities to help preserve principle value. The fund has three classes of shares: the Capital Appreciation Fund (Investor Class), the Capital Appreciation Fund–Advisor Class (Advisor Class), and the Capital Appreciation Fund–I Class (I Class). Advisor Class shares are sold only through unaffiliated brokers and other unaffiliated financial intermediaries. I Class shares generally are available only to investors meeting a $1,000,000 minimum investment or certain other criteria. The Advisor Class operates under a Board-approved Rule 12b-1 plan pursuant to which the class compensates financial intermediaries for distribution, shareholder servicing, and/or certain administrative services; the Investor and I Classes do not pay Rule 12b-1 fees. Each class has exclusive voting rights on matters related solely to that class; separate voting rights on matters that relate to all classes; and, in all other respects, the same rights and obligations as the other classes.
NOTE 1 - SIGNIFICANT ACCOUNTING POLICIES
Basis of Preparation The fund is an investment company and follows accounting and reporting guidance in the Financial Accounting Standards Board (FASB) Accounting Standards Codification Topic 946 (ASC 946). The accompanying financial statements were prepared in accordance with accounting principles generally accepted in the United States of America (GAAP), including, but not limited to, ASC 946. GAAP requires the use of estimates made by management. Management believes that estimates and valuations are appropriate; however, actual results may differ from those estimates, and the valuations reflected in the accompanying financial statements may differ from the value ultimately realized upon sale or maturity.
Investment Transactions, Investment Income, and Distributions Investment transactions are accounted for on the trade date basis. Income and expenses are recorded on the accrual basis. Realized gains and losses are reported on the identified cost basis. Premiums and discounts on debt securities are amortized for financial reporting purposes. Paydown gains and losses are recorded as an adjustment to interest income. Dividends received from mutual fund investments are reflected as dividend income; capital gain distributions are reflected as realized gain/loss. Dividend income and capital gain distributions are recorded on the ex-dividend date. Income tax-related interest and penalties, if incurred, are recorded as income tax expense. Distributions from REITs are initially recorded as dividend income and, to the extent such represent a return of capital or capital gain for tax purposes, are reclassified when such information becomes available. Income distributions are declared and paid by each class annually. Distributions to shareholders are recorded on the ex-dividend date. A capital gain distribution may also be declared and paid by the fund annually.
Currency Translation Assets, including investments, and liabilities denominated in foreign currencies are translated into U.S. dollar values each day at the prevailing exchange rate, using the mean of the bid and asked prices of such currencies against U.S. dollars as quoted by a major bank. Purchases and sales of securities, income, and expenses are translated into U.S. dollars at the prevailing exchange rate on the respective date of such transaction. The portion of the results of operations attributable to changes in foreign exchange rates on investments is not bifurcated from the portion attributable to changes in market prices. The effect of changes in foreign currency exchange rates on realized and unrealized security gains and losses is reflected as a component of security gains and losses.
Class Accounting Shareholder servicing, prospectus, and shareholder report expenses incurred by each class are charged directly to the class to which they relate. Expenses common to all classes, investment income, and realized and unrealized gains and losses are allocated to the classes based upon the relative daily net assets of each class. To the extent any expenses are waived or reimbursed in accordance with an expense limitation (see Note 6), the waiver or reimbursement is charged to the applicable class or allocated across the classes in the same manner as the related expense. The Advisor Class pays Rule 12b-1 fees, in an amount not exceeding 0.25% of the class’s average daily net assets.
Rebates Subject to best execution, the fund may direct certain security trades to brokers who have agreed to rebate a portion of the related brokerage commission to the fund in cash. Commission rebates are reflected as realized gain on securities in the accompanying financial statements and totaled $189,000 for the year ended December 31, 2017.
New Accounting Guidance In March 2017, the FASB issued amended guidance to shorten the amortization period for certain callable debt securities, held at a premium. The guidance is effective for fiscal years and interim periods beginning after December 15, 2018. Adoption will have no effect on the fund’s net assets or results of operations.
On August 1, 2017, the fund implemented amendments to Regulation S-X, issued by the Securities and Exchange Commission, which require standardized, enhanced disclosures, particularly related to derivatives, in investment company financial statements. Adoption had no effect on the fund’s net assets or results of operations.
Indemnification In the normal course of business, the fund may provide indemnification in connection with its officers and directors, service providers, and/or private company investments. The fund’s maximum exposure under these arrangements is unknown; however, the risk of material loss is currently considered to be remote.
NOTE 2 - VALUATION
The fund’s financial instruments are valued and each class’s net asset value (NAV) per share is computed at the close of the New York Stock Exchange (NYSE), normally 4 p.m. ET, each day the NYSE is open for business. However, the NAV per share may be calculated at a time other than the normal close of the NYSE if trading on the NYSE is restricted, if the NYSE closes earlier, or as may be permitted by the SEC.
Fair Value The fund’s financial instruments are reported at fair value, which GAAP defines as the price that would be received to sell an asset or paid to transfer a liability in an orderly transaction between market participants at the measurement date. The T. Rowe Price Valuation Committee (the Valuation Committee) is an internal committee that has been delegated certain responsibilities by the fund’s Board of Directors (the Board) to ensure that financial instruments are appropriately priced at fair value in accordance with GAAP and the 1940 Act. Subject to oversight by the Board, the Valuation Committee develops and oversees pricing-related policies and procedures and approves all fair value determinations. Specifically, the Valuation Committee establishes procedures to value securities; determines pricing techniques, sources, and persons eligible to effect fair value pricing actions; oversees the selection, services, and performance of pricing vendors; oversees valuation-related business continuity practices; and provides guidance on internal controls and valuation-related matters. The Valuation Committee reports to the Board and has representation from legal, portfolio management and trading, operations, risk management, and the fund’s treasurer.
Various valuation techniques and inputs are used to determine the fair value of financial instruments. GAAP establishes the following fair value hierarchy that categorizes the inputs used to measure fair value:
Level 1 – quoted prices (unadjusted) in active markets for identical financial instruments that the fund can access at the reporting date
Level 2 – inputs other than Level 1 quoted prices that are observable, either directly or indirectly (including, but not limited to, quoted prices for similar financial instruments in active markets, quoted prices for identical or similar financial instruments in inactive markets, interest rates and yield curves, implied volatilities, and credit spreads)
Level 3 – unobservable inputs
Observable inputs are developed using market data, such as publicly available information about actual events or transactions, and reflect the assumptions that market participants would use to price the financial instrument. Unobservable inputs are those for which market data are not available and are developed using the best information available about the assumptions that market participants would use to price the financial instrument. GAAP requires valuation techniques to maximize the use of relevant observable inputs and minimize the use of unobservable inputs. When multiple inputs are used to derive fair value, the financial instrument is assigned to the level within the fair value hierarchy based on the lowest-level input that is significant to the fair value of the financial instrument. Input levels are not necessarily an indication of the risk or liquidity associated with financial instruments at that level but rather the degree of judgment used in determining those values.
Valuation Techniques Equity securities listed or regularly traded on a securities exchange or in the over-the-counter (OTC) market are valued at the last quoted sale price or, for certain markets, the official closing price at the time the valuations are made. OTC Bulletin Board securities are valued at the mean of the closing bid and asked prices. A security that is listed or traded on more than one exchange is valued at the quotation on the exchange determined to be the primary market for such security. Listed securities not traded on a particular day are valued at the mean of the closing bid and asked prices for domestic securities and the last quoted sale or closing price for international securities.
For valuation purposes, the last quoted prices of non-U.S. equity securities may be adjusted to reflect the fair value of such securities at the close of the NYSE. If the fund determines that developments between the close of a foreign market and the close of the NYSE will affect the value of some or all of its portfolio securities, the fund will adjust the previous quoted prices to reflect what it believes to be the fair value of the securities as of the close of the NYSE. In deciding whether it is necessary to adjust quoted prices to reflect fair value, the fund reviews a variety of factors, including developments in foreign markets, the performance of U.S. securities markets, and the performance of instruments trading in U.S. markets that represent foreign securities and baskets of foreign securities. The fund may also fair value securities in other situations, such as when a particular foreign market is closed but the fund is open. The fund uses outside pricing services to provide it with quoted prices and information to evaluate or adjust those prices. The fund cannot predict how often it will use quoted prices and how often it will determine it necessary to adjust those prices to reflect fair value. As a means of evaluating its security valuation process, the fund routinely compares quoted prices, the next day’s opening prices in the same markets, and adjusted prices.
Actively traded equity securities listed on a domestic exchange generally are categorized in Level 1 of the fair value hierarchy. Non-U.S. equity securities generally are categorized in Level 2 of the fair value hierarchy despite the availability of quoted prices because, as described above, the fund evaluates and determines whether those quoted prices reflect fair value at the close of the NYSE or require adjustment. OTC Bulletin Board securities, certain preferred securities, and equity securities traded in inactive markets generally are categorized in Level 2 of the fair value hierarchy.
Debt securities generally are traded in the OTC market. Securities with remaining maturities of one year or more at the time of acquisition are valued at prices furnished by dealers who make markets in such securities or by an independent pricing service, which considers the yield or price of bonds of comparable quality, coupon, maturity, and type, as well as prices quoted by dealers who make markets in such securities. Generally, debt securities are categorized in Level 2 of the fair value hierarchy; however, to the extent the valuations include significant unobservable inputs, the securities would be categorized in Level 3.
Investments in mutual funds are valued at the mutual fund’s closing NAV per share on the day of valuation and are categorized in Level 1 of the fair value hierarchy. Listed options, and OTC options with a listed equivalent, are valued at the mean of the closing bid and asked prices and generally are categorized in Level 2 of the fair value hierarchy. Assets and liabilities other than financial instruments, including short-term receivables and payables, are carried at cost, or estimated realizable value, if less, which approximates fair value.
Thinly traded financial instruments and those for which the above valuation procedures are inappropriate or are deemed not to reflect fair value are stated at fair value as determined in good faith by the Valuation Committee. The objective of any fair value pricing determination is to arrive at a price that could reasonably be expected from a current sale. Financial instruments fair valued by the Valuation Committee are primarily private placements, restricted securities, warrants, rights, and other securities that are not publicly traded.
Subject to oversight by the Board, the Valuation Committee regularly makes good faith judgments to establish and adjust the fair valuations of certain securities as events occur and circumstances warrant. For instance, in determining the fair value of an equity investment with limited market activity, such as a private placement or a thinly traded public company stock, the Valuation Committee considers a variety of factors, which may include, but are not limited to, the issuer’s business prospects, its financial standing and performance, recent investment transactions in the issuer, new rounds of financing, negotiated transactions of significant size between other investors in the company, relevant market valuations of peer companies, strategic events affecting the company, market liquidity for the issuer, and general economic conditions and events. In consultation with the investment and pricing teams, the Valuation Committee will determine an appropriate valuation technique based on available information, which may include both observable and unobservable inputs. The Valuation Committee typically will afford greatest weight to actual prices in arm’s length transactions, to the extent they represent orderly transactions between market participants, transaction information can be reliably obtained, and prices are deemed representative of fair value. However, the Valuation Committee may also consider other valuation methods such as market-based valuation multiples; a discount or premium from market value of a similar, freely traded security of the same issuer; or some combination. Fair value determinations are reviewed on a regular basis and updated as information becomes available, including actual purchase and sale transactions of the issue. Because any fair value determination involves a significant amount of judgment, there is a degree of subjectivity inherent in such pricing decisions, and fair value prices determined by the Valuation Committee could differ from those of other market participants. Depending on the relative significance of unobservable inputs, including the valuation technique(s) used, fair valued securities may be categorized in Level 2 or 3 of the fair value hierarchy.
Valuation Inputs The following table summarizes the fund’s financial instruments, based on the inputs used to determine their fair values on December 31, 2017:
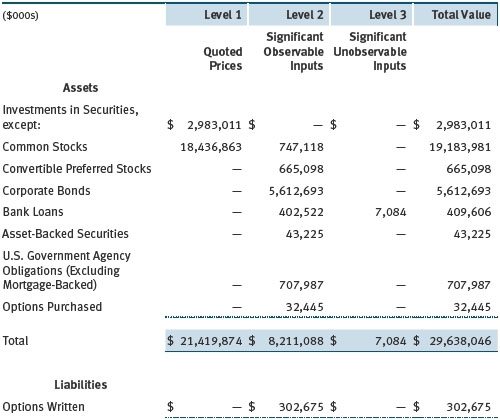
There were no material transfers between Levels 1 and 2 during the year ended December 31, 2017.
Following is a reconciliation of the fund’s Level 3 holdings for the year ended December 31, 2017. Gain (loss) reflects both realized and change in unrealized gain/loss on Level 3 holdings during the period, if any, and is included on the accompanying Statement of Operations. The change in unrealized gain/loss on Level 3 instruments held at December 31, 2017, totaled $(26,000) for the year ended December 31, 2017. Transfers into and out of Level 3 are reflected at the value of the financial instrument at the beginning of the period. During the year, transfers into Level 3 resulted from a lack of observable market data for the security.

NOTE 3 - DERIVATIVE INSTRUMENTS
During the year ended December 31, 2017, the fund invested in derivative instruments. As defined by GAAP, a derivative is a financial instrument whose value is derived from an underlying security price, foreign exchange rate, interest rate, index of prices or rates, or other variable; it requires little or no initial investment and permits or requires net settlement. The fund invests in derivatives only if the expected risks and rewards are consistent with its investment objectives, policies, and overall risk profile, as described in its prospectus and Statement of Additional Information. The fund may use derivatives for a variety of purposes, such as seeking to hedge against declines in principal value, increase yield, invest in an asset with greater efficiency and at a lower cost than is possible through direct investment, or to adjust credit exposure. The risks associated with the use of derivatives are different from, and potentially much greater than, the risks associated with investing directly in the instruments on which the derivatives are based. The fund at all times maintains sufficient cash reserves, liquid assets, or other SEC-permitted asset types to cover its settlement obligations under open derivative contracts.
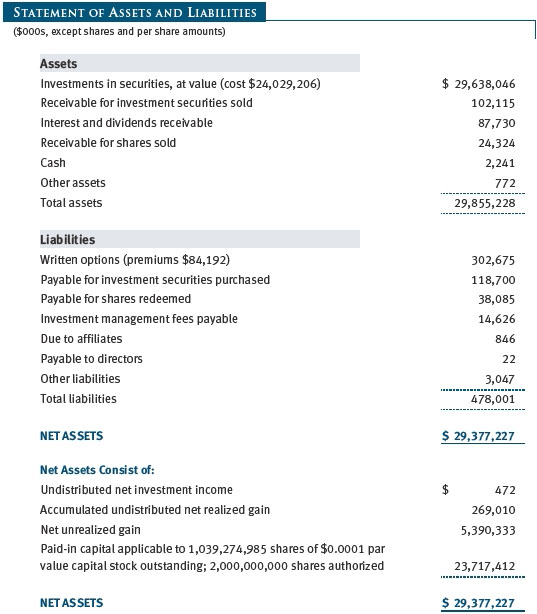
The fund values its derivatives at fair value and recognizes changes in fair value currently in its results of operations. Accordingly, the fund does not follow hedge accounting, even for derivatives employed as economic hedges. Generally, the fund accounts for its derivatives on a gross basis. It does not offset the fair value of derivative liabilities against the fair value of derivative assets on its financial statements, nor does it offset the fair value of derivative instruments against the right to reclaim or obligation to return collateral. As of December 31, 2017, the fund held equity derivatives with a fair value of $32,445,000, included in Securities, and $302,675,000, included in Written Options, on the accompanying Statement of Assets and Liabilities.
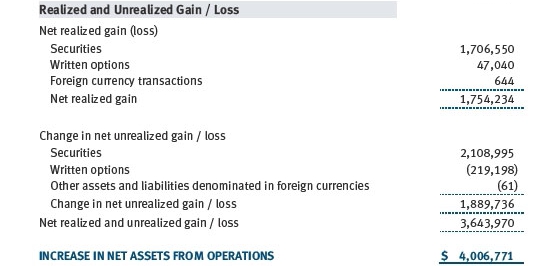
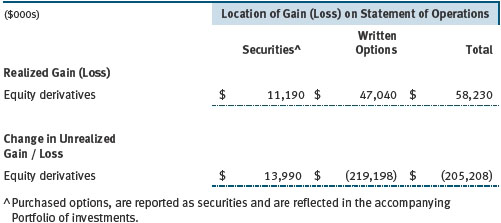
Additionally, the amount of gains and losses on derivative instruments recognized in fund earnings during the year ended December 31, 2017, and the related location on the accompanying Statement of Operations is summarized in the following table by primary underlying risk exposure:
Counterparty Risk and Collateral The fund invests in derivatives, such as bilateral swaps, forward currency exchange contracts, or OTC options, that are transacted and settle directly with a counterparty (bilateral derivatives), and thereby expose the fund to counterparty risk. To mitigate this risk, the fund has entered into master netting arrangements (MNAs) with certain counterparties that permit net settlement under specified conditions and, for certain counterparties, also require the exchange of collateral to cover mark-to-market exposure. MNAs may be in the form of International Swaps and Derivatives Association master agreements (ISDAs) or foreign exchange letter agreements (FX letters).
MNAs govern the ability to offset amounts the fund owes a counterparty against amounts the counterparty owes the fund (net settlement). Both ISDAs and FX letters generally allow termination of transactions and net settlement upon the occurrence of contractually specified events, such as failure to pay or bankruptcy. In addition, ISDAs specify other events, the occurrence of which would allow one of the parties to terminate. For example, a downgrade in credit rating of a counterparty would allow the fund to terminate, while a decline in the fund’s net assets of more than a specified percentage would allow the counterparty to terminate. Upon termination, all transactions with that counterparty would be liquidated and a net termination amount determined. ISDAs include collateral agreements whereas FX letters do not. Collateral requirements are determined daily based on the net aggregate unrealized gain or loss on all bilateral derivatives with each counterparty, subject to minimum transfer amounts that typically range from $100,000 to $250,000. Any additional collateral required due to changes in security values is typically transferred the same business day.
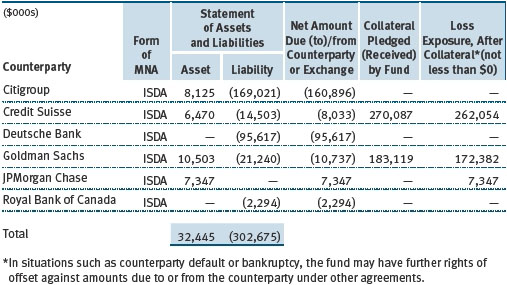
The following table summarizes the fund’s derivatives at the reporting date by loss exposure to each counterparty, clearinghouse or clearing firm after consideration of collateral, if any. Exchange-traded and centrally cleared derivatives that settle variation margin daily are presented at the variation margin receivable or payable on the reporting date, and exchange-traded options are presented at value.
Collateral may be in the form of cash or debt securities issued by the U.S. government or related agencies. Cash posted by the fund is reflected as cash deposits in the accompanying financial statements and generally is restricted from withdrawal by the fund; securities posted by the fund are so noted in the accompanying Portfolio of Investments; both remain in the fund’s assets. Collateral pledged by counterparties is not included in the fund’s assets because the fund does not obtain effective control over those assets. For bilateral derivatives, collateral posted by the fund is held in a segregated account at the fund’s custodian.
While typically not sold in the same manner as equity or fixed income securities, exchange-traded or centrally cleared derivatives may be closed out only on the exchange or clearinghouse where the contracts were traded, and OTC and bilateral derivatives may be unwound with counterparties or transactions assigned to other counterparties to allow the fund to exit the transaction. This ability is subject to the liquidity of underlying positions.
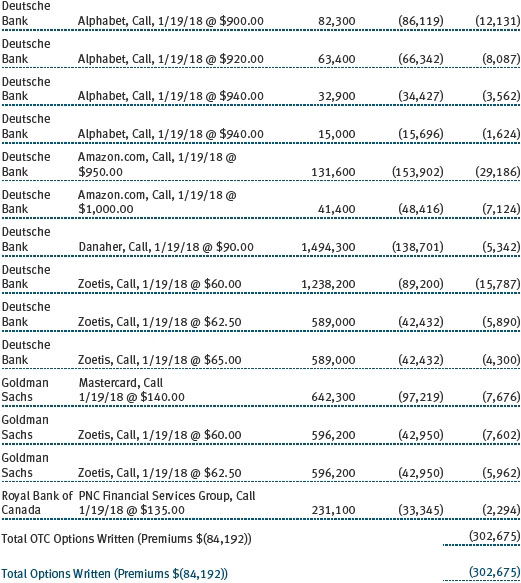
Options The fund is subject to equity price risk in the normal course of pursuing its investment objectives and uses options to help manage such risk. The fund may use options to manage exposure to security prices, interest rates, foreign currencies, and credit quality; as an efficient means of adjusting exposure to all or a part of a target market; to enhance income; as a cash management tool; or to adjust credit exposure. Options are included in net assets at fair value, purchased options are included in Investments in Securities, and written options are separately reflected as a liability on the accompanying Statement of Assets and Liabilities. Premiums on unexercised, expired options are recorded as realized gains or losses; premiums on exercised options are recorded as an adjustment to the proceeds from the sale or cost of the purchase. The difference between the premium and the amount received or paid in a closing transaction is also treated as realized gain or loss. In return for a premium paid, call and put options give the holder the right, but not the obligation, to purchase or sell, respectively, a security at a specified exercise price. Risks related to the use of options include possible illiquidity of the options markets; trading restrictions imposed by an exchange or counterparty; movements in the underlying asset values and, for written options, potential losses in excess of the fund’s initial investment. During the year ended December 31, 2017, the volume of the fund’s activity in options, based on underlying notional amounts, was generally between 5% and 15% of net assets.
NOTE 4 - OTHER INVESTMENT TRANSACTIONS
Consistent with its investment objective, the fund engages in the following practices to manage exposure to certain risks and/or to enhance performance. The investment objective, policies, program, and risk factors of the fund are described more fully in the fund’s prospectus and Statement of Additional Information.
Noninvestment-Grade Debt At December 31, 2017, approximately 14% of the fund’s net assets were invested, either directly or through its investment in T. Rowe Price institutional funds, in noninvestment-grade debt, including “high yield” or “junk” bonds or leveraged loans. The noninvestment-grade debt market may experience sudden and sharp price swings due to a variety of factors, including changes in economic forecasts, stock market activity, large sustained sales by major investors, a high-profile default, or a change in market sentiment. These events may decrease the ability of issuers to make principal and interest payments and adversely affect the liquidity or value, or both, of such securities. Investments in noninvestment-grade holdings may be considered speculative.
Restricted Securities The fund may invest in securities that are subject to legal or contractual restrictions on resale. Prompt sale of such securities at an acceptable price may be difficult and may involve substantial delays and additional costs.
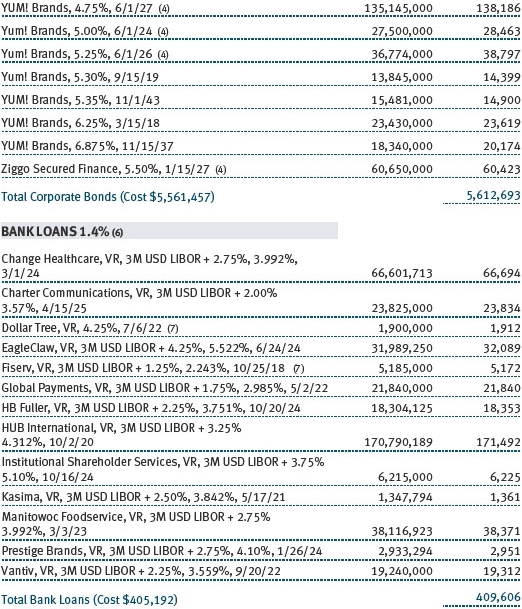
Bank Loans The fund may invest in bank loans, which represent an interest in amounts owed by a borrower to a syndicate of lenders. Bank loans are generally noninvestment grade and often involve borrowers whose financial condition is highly leveraged. Bank loans may be in the form of either assignments or participations. A loan assignment transfers all legal, beneficial, and economic rights to the buyer, and transfer typically requires consent of both the borrower and agent. In contrast, a loan participation generally entitles the buyer to receive the cash flows from principal, interest, and any fee payments on a portion of a loan; however, the seller continues to hold legal title to that portion of the loan. As a result, the buyer of a loan participation generally has no direct recourse against the borrower and is exposed to credit risk of both the borrower and seller of the participation. Bank loans often have extended settlement periods, generally may be repaid at any time at the option of the borrower, and may require additional principal to be funded at the borrowers’ discretion at a later date (e.g., unfunded commitments and revolving debt instruments). Until settlement, the fund maintains liquid assets sufficient to settle its unfunded loan commitments. The fund reflects both the funded portion of a bank loan as well as its unfunded commitment in the Portfolio of Investments. However, if a credit agreement provides no initial funding of a tranche, and funding of the full commitment at a future date(s) is at the borrower’s discretion and considered uncertain, a loan is reflected in the Portfolio of Investments only if, and only to the extent that, the fund has actually settled a funding commitment.
Other Purchases and sales of portfolio securities other than short-term and U.S. government securities aggregated $14,680,295,000 and $15,597,202,000, respectively, for the year ended December 31, 2017.
NOTE 5 - FEDERAL INCOME TAXES
No provision for federal income taxes is required since the fund intends to continue to qualify as a regulated investment company under Subchapter M of the Internal Revenue Code and distribute to shareholders all of its taxable income and gains. Distributions determined in accordance with federal income tax regulations may differ in amount or character from net investment income and realized gains for financial reporting purposes. Financial reporting records are adjusted for permanent book/tax differences to reflect tax character but are not adjusted for temporary differences.
The fund files U.S. federal, state, and local tax returns as required. The fund’s tax returns are subject to examination by the relevant tax authorities until expiration of the applicable statute of limitations, which is generally three years after the filing of the tax return but which can be extended to six years in certain circumstances. Tax returns for open years have incorporated no uncertain tax positions that require a provision for income taxes.
Reclassifications to paid-in capital relate primarily to a tax practice that treats a portion of the proceeds from each redemption of capital shares as a distribution of taxable net investment income or realized capital gain. For the year ended December 31, 2017, the following reclassifications were recorded to reflect tax character (there was no impact on results of operations or net assets):

Distributions during the years ended December 31, 2017 and December 31, 2016, were characterized for tax purposes as follows:

At December 31, 2017, the tax-basis cost of investments, including derivatives, and components of net assets were as follows:
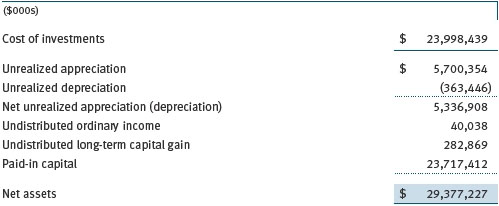
The difference between book-basis and tax-basis net unrealized appreciation (depreciation) is attributable to the deferral of losses from wash sales for tax purposes.
NOTE 6 - RELATED PARTY TRANSACTIONS
The fund is managed by T. Rowe Price Associates, Inc. (Price Associates), a wholly owned subsidiary of T. Rowe Price Group, Inc. (Price Group). The investment management agreement between the fund and Price Associates provides for an annual investment management fee that consists of an individual fund fee and a group fee; management fees are computed daily and paid monthly. The investment management agreement provides for an individual fund fee equal to 0.30% of the fund’s average daily net assets. Effective May 1, 2017, through April 30, 2019, Price Associates agreed to reduce the fund’s individual fee to 0.27% for the portion of average daily net assets equal to or in excess of $27.5 billion. This contractual arrangement will renew automatically for one-year terms thereafter and may be revised, revoked, or terminated only with approval of the fund’s Board. Further, the fund has no obligation to repay fees reduced under this arrangement. The group fee rate is calculated based on the combined net assets of certain mutual funds sponsored by Price Associates (the group) applied to a graduated fee schedule, with rates ranging from 0.48% for the first $1 billion of assets to 0.265% for assets in excess of $650 billion. The fund’s group fee is determined by applying the group fee rate to the fund’s average daily net assets. At December 31, 2017, the effective annual group fee rate was 0.29%.
The I Class is subject to an operating expense limitation (I Class limit) pursuant to which Price Associates is contractually required to pay all operating expenses of the I Class, excluding management fees, interest, expenses related to borrowings, taxes, brokerage, and other non-recurring expenses permitted by the investment management agreement, to the extent such operating expenses, on an annualized basis, exceed 0.05% of average net assets. This agreement will continue until April 30, 2018, and may be renewed, revised, or revoked only with approval of the fund’s Board. The I Class is required to repay Price Associates for expenses previously paid to the extent the class’s net assets grow or expenses decline sufficiently to allow repayment without causing the class’s operating expenses (after the repayment is taken into account) to exceed both: (1) the expense limitation in place at the time such amounts were paid; and (2) the class’s current expense limitation. However, no repayment will be made more than three years after the date of a payment or waiver. For the year ended December 31, 2017, the I Class operated below its expense limitation.
In addition, the fund has entered into service agreements with Price Associates and two wholly owned subsidiaries of Price Associates (collectively, Price). Price Associates provides certain accounting and administrative services to the fund. T. Rowe Price Services, Inc. provides shareholder and administrative services in its capacity as the fund’s transfer and dividend-disbursing agent. T. Rowe Price Retirement Plan Services, Inc. provides subaccounting and recordkeeping services for certain retirement accounts invested in the Investor Class and I Class. For the year ended December 31, 2017, expenses incurred pursuant to these service agreements were $86,000 for Price Associates; $5,787,000 for T. Rowe Price Services, Inc.; and $1,583,000 for T. Rowe Price Retirement Plan Services, Inc. The total amount payable at period-end pursuant to these service agreements is reflected as Due to Affiliates in the accompanying financial statements.
The fund may invest its cash reserves in certain open-end management investment companies managed by Price Associates and considered affiliates of the fund: the T. Rowe Price Government Reserve Fund or the T. Rowe Price Treasury Reserve Fund, organized as money market funds, or the T. Rowe Price Short-Term Fund, a short-term bond fund (collectively, the Price Reserve Funds). The Price Reserve Funds are offered as short-term investment options to mutual funds, trusts, and other accounts managed by Price Associates or its affiliates and are not available for direct purchase by members of the public. Cash collateral from securities lending is invested in the T. Rowe Price Short-Term Fund. The Price Reserve Funds pay no investment management fees.
The fund may also invest in certain other T. Rowe Price funds (Price Funds) as a means of gaining efficient and cost-effective exposure to certain markets. The fund does not invest for the purpose of exercising management or control; however, investments by the fund may represent a significant portion of an underlying Price Fund’s net assets. Each underlying Price Fund is an open-end management investment company managed by Price Associates and is considered an affiliate of the fund. To ensure that the fund does not incur duplicate management fees (paid by the underlying Price Fund(s) and the fund), Price Associates has agreed to permanently waive a portion of its management fee charged to the fund in an amount sufficient to fully offset that portion of management fees paid by each underlying Price Fund related to the fund’s investment therein. Annual management fee rates and amounts waived related to investments in the underlying Price Fund(s) for the year ended December 31, 2017, are as follows:

The fund may participate in securities purchase and sale transactions with other funds or accounts advised by Price Associates (cross trades), in accordance with procedures adopted by the fund’s Board and Securities and Exchange Commission rules, which require, among other things, that such purchase and sale cross trades be effected at the independent current market price of the security. During the year ended December 31, 2017, the aggregate value of purchases and sales cross trades with other funds or accounts advised by Price Associates was less than 1% of the fund’s net assets as of December 31, 2017.
| Report of Independent Registered Public Accounting Firm |
To the Board of Directors and Shareholders of
T. Rowe Price Capital Appreciation Fund, Inc.
Opinion on the Financial Statements
We have audited the accompanying statement of assets and liabilities, including the portfolio of investments, of T. Rowe Price Capital Appreciation Fund, Inc. (the “Fund”) as of December 31, 2017, the related statement of operations for the year ended December 31, 2017, the statement of changes in net assets for each of the two years in the period ended December 31, 2017, including the related notes, and the financial highlights for each of the periods indicated therein (collectively referred to as the “financial statements”). In our opinion, the financial statements present fairly, in all material respects, the financial position of the Fund as of December 31, 2017, the results of its operations for the year then ended, the changes in its net assets for each of the two years in the period ended December 31, 2017 and the financial highlights for each of the periods indicated therein, in conformity with accounting principles generally accepted in the United States of America.
Basis for Opinion
These financial statements are the responsibility of the Fund’s management. Our responsibility is to express an opinion on the Fund’s financial statements based on our audits. We are a public accounting firm registered with the Public Company Accounting Oversight Board (United States) (“PCAOB”) and are required to be independent with respect to the Fund in accordance with the U.S. federal securities laws and the applicable rules and regulations of the Securities and Exchange Commission and the PCAOB.
We conducted our audits of these financial statements in accordance with the standards of the PCAOB. Those standards require that we plan and perform the audit to obtain reasonable assurance about whether the financial statements are free of material misstatement, whether due to error or fraud.
Our audits included performing procedures to assess the risks of material misstatement of the financial statements, whether due to error or fraud, and performing procedures that respond to those risks. Such procedures included examining, on a test basis, evidence regarding the amounts and disclosures in the financial statements. Our audits also included evaluating the accounting principles used and significant estimates made by management, as well as evaluating the overall presentation of the financial statements. Our procedures included confirmation of securities owned as of December 31, 2017 by correspondence with the custodians, transfer agent and brokers; when replies were not received from brokers, we performed other auditing procedures. We believe that our audits provide a reasonable basis for our opinion.
PricewaterhouseCoopers LLP
Baltimore, Maryland
February 15, 2018
We have served as the auditor of one or more investment companies in the T. Rowe Price group of investment companies since 1973.
| Tax Information (Unaudited) for the Tax Year Ended 12/31/17 |
We are providing this information as required by the Internal Revenue Code. The amounts shown may differ from those elsewhere in this report because of differences between tax and financial reporting requirements.
The fund’s distributions to shareholders included:
| ● | $493,198,000 from short-term capital gains,
|
| ● | $1,219,570,000 from long-term capital gains, subject to the a long-term capital gains tax rate of not greater than 20%. |
For taxable non-corporate shareholders, $275,064,000 of the fund’s income represents qualified dividend income subject to a long-term capital gains tax rate of not greater than 20%.
For corporate shareholders, $231,277,000 of the fund’s income qualifies for the dividends-received deduction.
| Information on Proxy Voting Policies, Procedures, and Records |
A description of the policies and procedures used by T. Rowe Price funds and portfolios to determine how to vote proxies relating to portfolio securities is available in each fund’s Statement of Additional Information. You may request this document by calling 1-800-225-5132 or by accessing the SEC’s website, sec.gov.
The description of our proxy voting policies and procedures is also available on our corporate website. To access it, please visit the following Web page:
https://www3.troweprice.com/usis/corporate/en/utility/policies.html
Scroll down to the section near the bottom of the page that says, “Proxy Voting Policies.” Click on the Proxy Voting Policies link in the shaded box.
Each fund’s most recent annual proxy voting record is available on our website and through the SEC’s website. To access it through T. Rowe Price, visit the website location shown above, and scroll down to the section near the bottom of the page that says, “Proxy Voting Records.” Click on the Proxy Voting Records link in the shaded box.
| How to Obtain Quarterly Portfolio Holdings |
The fund files a complete schedule of portfolio holdings with the Securities and Exchange Commission for the first and third quarters of each fiscal year on Form N-Q. The fund’s Form N-Q is available electronically on the SEC’s website (sec.gov); hard copies may be reviewed and copied at the SEC’s Public Reference Room, 100 F St. N.E., Washington, DC 20549. For more information on the Public Reference Room, call 1-800-SEC-0330.
| About The Fund’s Directors and Officers |
Your fund is overseen by a Board of Directors (Board) that meets regularly to review a wide variety of matters affecting or potentially affecting the fund, including performance, investment programs, compliance matters, advisory fees and expenses, service providers, and business and regulatory affairs. The Board elects the fund’s officers, who are listed in the final table. At least 75% of the Board’s members are independent of T. Rowe Price Associates, Inc. (T. Rowe Price), and its affiliates; “inside” or “interested” directors are employees or officers of T. Rowe Price. The business address of each director and officer is 100 East Pratt Street, Baltimore, Maryland 21202. The Statement of Additional Information includes additional information about the fund directors and is available without charge by calling a T. Rowe Price representative at 1-800-638-5660.
| Independent Directors | | |
| |
| Name | | |
| (Year of Birth) | | |
| Year Elected* | | |
| [Number of T. Rowe Price | | Principal Occupation(s) and Directorships of Public Companies and |
| Portfolios Overseen] | | Other Investment Companies During the Past Five Years |
| | |
| Bruce W. Duncan | | Chief Executive Officer and Director (2009 to December 2016), |
| (1951) | | Chairman of the Board (January 2016 to present), and President |
| 2013 | | (2009 to September 2016), First Industrial Realty Trust, an owner |
| [191] | | and operator of industrial properties; Chairman of the Board |
| | (2005 to September 2016) and Director (1999 to September |
| | 2016), Starwood Hotels & Resorts, a hotel and leisure company; |
| | Director, Boston Properties (May 2016 to present); Director, Marriott |
| | International, Inc. (September 2016 to present) |
| | | |
| Robert J. Gerrard, Jr. | | Advisory Board Member, Pipeline Crisis/Winning Strategies, a |
| (1952) | | collaborative working to improve opportunities for young African |
| 2012 | | Americans (1997 to present) |
| [191] | | |
| | | |
| Paul F. McBride | | Advisory Board Member, Vizzia Technologies (2015 to present) |
| (1956) | | |
| 2013 | | |
| [191] | | |
| | | |
| Cecilia E. Rouse, Ph.D. | | Dean, Woodrow Wilson School (2012 to present); Professor and |
| (1963) | | Researcher, Princeton University (1992 to present); Member of |
| 2012 | | National Academy of Education (2010 to present); Director, MDRC, |
| [191] | | a nonprofit education and social policy research organization |
| | (2011 to present); Research Associate of Labor Studies Program |
| | (2011 to 2015) and Board Member (2015 to present), National |
| | Bureau of Economic Research (2011 to present); Chair of Committee |
| | on the Status of Minority Groups in the Economic Profession |
| | (2012 to present); Vice President (2015 to present), American |
| | Economic Association |
| | | |
| John G. Schreiber | | Owner/President, Centaur Capital Partners, Inc., a real estate |
| (1946) | | investment company (1991 to present); Cofounder, Partner, and |
| 2001 | | Cochairman of the Investment Committee, Blackstone Real Estate |
| [191] | | Advisors, L.P. (1992 to 2015); Director, General Growth Properties, |
| | Inc. (2010 to 2013); Director, Blackstone Mortgage Trust, a real |
| | estate finance company (2012 to 2016); Director and Chairman of |
| | the Board, Brixmor Property Group, Inc. (2013 to present); Director, |
| | Hilton Worldwide (2013 to present); Director, Hudson Pacific |
| | Properties (2014 to 2016) |
| | | |
| Mark R. Tercek | | President and Chief Executive Officer, The Nature Conservancy (2008 |
| (1957) | | to present) |
| 2009 | | |
| [191] | | |
| |
| *Each independent director serves until retirement, resignation, or election of a successor. |
| |
| Inside Directors | | |
| |
| Name | | |
| (Year of Birth) | | |
| Year Elected* | | |
| [Number of T. Rowe Price | | Principal Occupation(s) and Directorships of Public Companies and |
| Portfolios Overseen] | | Other Investment Companies During the Past Five Years |
| | | |
| Edward C. Bernard | | Director and Vice President, T. Rowe Price; Vice Chairman of the |
| (1956) | | Board, Director, and Vice President, T. Rowe Price Group, Inc.; |
| 2006 | | Chairman of the Board, Director, and Vice President, T. Rowe Price |
| [191] | | Investment Services, Inc., and T. Rowe Price Services, Inc.; Chairman |
| | of the Board and Director, T. Rowe Price Retirement Plan Services, |
| | Inc.; Chairman of the Board, Chief Executive Officer, Director, and |
| | President, T. Rowe Price International and T. Rowe Price Trust |
| | Company; Chairman of the Board, all funds |
| |
| Robert W. Sharps, CFA, CPA** | | Vice President, T. Rowe Price, T. Rowe Price Group, Inc., and T. Rowe |
| (1971) | | Price Trust Company |
| 2017 | | |
| [135] | | |
| |
| *Each inside director serves until retirement, resignation, or election of a successor. |
| ** Effective April 1, 2017, Brian C. Rogers was replaced by Robert W. Sharps as an inside director of certain Price Funds. |
| Officers | | |
| |
| Name (Year of Birth) | | |
| Position Held With Capital Appreciation Fund | | Principal Occupation(s) |
| | | |
| Darrell N. Braman (1963) | | Vice President, Price Hong Kong, Price |
| Vice President and Secretary | | Singapore, T. Rowe Price, T. Rowe Price Group, |
| | Inc., T. Rowe Price International, T. Rowe Price |
| | Investment Services, Inc., and T. Rowe Price |
| | Services, Inc. |
| | | |
| Shawn T. Driscoll (1975) | | Vice President, T. Rowe Price, T. Rowe Price |
| Vice President | | Group, Inc., and T. Rowe Price Trust Company |
| | | |
| Jon M. Friar (1982) | | Vice President, T. Rowe Price and T. Rowe Price |
| Vice President | | Group, Inc. |
| | | |
| John R. Gilner (1961) | | Chief Compliance Officer and Vice President, |
| Chief Compliance Officer | | T. Rowe Price; Vice President, T. Rowe Price |
| | Group, Inc., and T. Rowe Price Investment |
| | Services, Inc. |
| | | |
| David R. Giroux, CFA (1975) | | Vice President, T. Rowe Price, T. Rowe Price |
| President | | Group, Inc., and T. Rowe Price Trust Company |
| | | |
| Paul D. Greene II (1978) | | Vice President, T. Rowe Price and T. Rowe Price |
| Vice President | | Group, Inc. |
| | | |
| Nina P. Jones, CPA (1980) | | Vice President, T. Rowe Price and T. Rowe Price |
| Vice President | | Group, Inc. |
| | | |
| Vidya Kadiyam (1980) | | Vice President, T. Rowe Price and T. Rowe Price |
| Vice President | | Group, Inc. |
| | | |
| Steven D. Krichbaum (1977) | | Vice President, T. Rowe Price and T. Rowe Price |
| Vice President | | Group, Inc. |
| | | |
| Paul J. Krug, CPA (1964) | | Vice President, T. Rowe Price, T. Rowe Price |
| Vice President | | Group, Inc., and T. Rowe Price Trust Company |
| | | |
| Paul M. Massaro, CFA (1975) | | Vice President, T. Rowe Price, T. Rowe Price |
| Vice President | | Group, Inc., and T. Rowe Price Trust Company |
| | | |
| Catherine D. Mathews (1963) | | Vice President, T. Rowe Price, T. Rowe Price |
| Treasurer and Vice President | | Group, Inc., and T. Rowe Price Trust Company |
| | | |
| Sudhir Nanda, Ph.D., CFA (1959) | | Vice President, T. Rowe Price and T. Rowe Price |
| Vice President | | Group, Inc. |
| | | |
| David Oestreicher (1967) | | Director, Vice President, and Secretary, T. Rowe |
| Vice President | | Price Investment Services, Inc., T. Rowe |
| | Price Retirement Plan Services, Inc., T. Rowe |
| | Price Services, Inc., and T. Rowe Price Trust |
| | Company; Chief Legal Officer, Vice President, |
| | and Secretary, T. Rowe Price Group, Inc.; Vice |
| | President and Secretary, T. Rowe Price and |
| | T. Rowe Price International; Vice President, |
| | Price Hong Kong and Price Singapore |
| | | |
| John W. Ratzesberger (1975) | | Vice President, T. Rowe Price, T. Rowe Price |
| Vice President | | Group, Inc., and T. Rowe Price Trust Company; |
| | formerly, North American Head of Listed |
| | Derivatives Operation, Morgan Stanley |
| | (to 2013) |
| | | |
| Shannon H. Rauser (1987) | | Employee, T. Rowe Price |
| Assistant Secretary | | |
| | | |
| Farris G. Shuggi (1984) | | Vice President, T. Rowe Price and T. Rowe Price |
| Vice President | | Group, Inc. |
| | | |
| Gabriel Solomon (1977) | | Vice President, T. Rowe Price and T. Rowe Price |
| Vice President | | Group, Inc. |
| | | |
| Taymour R. Tamaddon, CFA (1976) | | Vice President, T. Rowe Price and T. Rowe Price |
| Vice President | | Group, Inc. |
| | | |
| Megan Warren (1968) | | Vice President, T. Rowe Price, T. Rowe Price |
| Vice President | | Group, Inc., T. Rowe Price Retirement Plan |
| | Services, Inc., T. Rowe Price Services, Inc., |
| | and T. Rowe Price Trust Company; formerly, |
| | Executive Director, JPMorgan Chase (to 2017) |
| | | |
| Tamara P. Wiggs (1979) | | Vice President, T. Rowe Price and T. Rowe Price |
| Vice President | | Group, Inc. |
| | | |
| John M. Williams (1982) | | Vice President, T. Rowe Price and T. Rowe Price |
| Vice President | | Group, Inc. |
| |
| Unless otherwise noted, officers have been employees of T. Rowe Price or T. Rowe Price International for at least 5 years. |
Item 2. Code of Ethics.
The registrant has adopted a code of ethics, as defined in Item 2 of Form N-CSR, applicable to its principal executive officer, principal financial officer, principal accounting officer or controller, or persons performing similar functions. A copy of this code of ethics is filed as an exhibit to this Form N-CSR. No substantive amendments were approved or waivers were granted to this code of ethics during the period covered by this report.
Item 3. Audit Committee Financial Expert.
The registrant’s Board of Directors/Trustees has determined that Mr. Bruce W. Duncan qualifies as an audit committee financial expert, as defined in Item 3 of Form N-CSR. Mr. Duncan is considered independent for purposes of Item 3 of Form N-CSR.
Item 4. Principal Accountant Fees and Services.
(a) – (d) Aggregate fees billed for the last two fiscal years for professional services rendered to, or on behalf of, the registrant by the registrant’s principal accountant were as follows:

Audit fees include amounts related to the audit of the registrant’s annual financial statements and services normally provided by the accountant in connection with statutory and regulatory filings. Audit-related fees include amounts reasonably related to the performance of the audit of the registrant’s financial statements and specifically include the issuance of a report on internal controls and, if applicable, agreed-upon procedures related to fund acquisitions. Tax fees include amounts related to services for tax compliance, tax planning, and tax advice. The nature of these services specifically includes the review of distribution calculations and the preparation of Federal, state, and excise tax returns. All other fees include the registrant’s pro-rata share of amounts for agreed-upon procedures in conjunction with service contract approvals by the registrant’s Board of Directors/Trustees.
(e)(1) The registrant’s audit committee has adopted a policy whereby audit and non-audit services performed by the registrant’s principal accountant for the registrant, its investment adviser, and any entity controlling, controlled by, or under common control with the investment adviser that provides ongoing services to the registrant require pre-approval in advance at regularly scheduled audit committee meetings. If such a service is required between regularly scheduled audit committee meetings, pre-approval may be authorized by one audit committee member with ratification at the next scheduled audit committee meeting. Waiver of pre-approval for audit or non-audit services requiring fees of a de minimis amount is not permitted.
(2) No services included in (b) – (d) above were approved pursuant to paragraph (c)(7)(i)(C) of Rule 2-01 of Regulation S-X.
(f) Less than 50 percent of the hours expended on the principal accountant’s engagement to audit the registrant’s financial statements for the most recent fiscal year were attributed to work performed by persons other than the principal accountant’s full-time, permanent employees.
(g) The aggregate fees billed for the most recent fiscal year and the preceding fiscal year by the registrant’s principal accountant for non-audit services rendered to the registrant, its investment adviser, and any entity controlling, controlled by, or under common control with the investment adviser that provides ongoing services to the registrant were $2,169,000 and $2,146,000, respectively.
(h) All non-audit services rendered in (g) above were pre-approved by the registrant’s audit committee. Accordingly, these services were considered by the registrant’s audit committee in maintaining the principal accountant’s independence.
Item 5. Audit Committee of Listed Registrants.
Not applicable.
Item 6. Investments.
(a) Not applicable. The complete schedule of investments is included in Item 1 of this Form N-CSR.
(b) Not applicable.
Item 7. Disclosure of Proxy Voting Policies and Procedures for Closed-End Management Investment Companies.
Not applicable.
Item 8. Portfolio Managers of Closed-End Management Investment Companies.
Not applicable.
Item 9. Purchases of Equity Securities by Closed-End Management Investment Company and Affiliated Purchasers.
Not applicable.
Item 10. Submission of Matters to a Vote of Security Holders.
Not applicable.
Item 11. Controls and Procedures.
(a) The registrant’s principal executive officer and principal financial officer have evaluated the registrant’s disclosure controls and procedures within 90 days of this filing and have concluded that the registrant’s disclosure controls and procedures were effective, as of that date, in ensuring that information required to be disclosed by the registrant in this Form N-CSR was recorded, processed, summarized, and reported timely.
(b) The registrant’s principal executive officer and principal financial officer are aware of no change in the registrant’s internal control over financial reporting that occurred during the registrant’s second fiscal quarter covered by this report that has materially affected, or is reasonably likely to materially affect, the registrant’s internal control over financial reporting.
Item 12. Exhibits.
(a)(1) The registrant’s code of ethics pursuant to Item 2 of Form N-CSR is attached.
(2) Separate certifications by the registrant's principal executive officer and principal financial officer, pursuant to Section 302 of the Sarbanes-Oxley Act of 2002 and required by Rule 30a-2(a) under the Investment Company Act of 1940, are attached.
(3) Written solicitation to repurchase securities issued by closed-end companies: not applicable.
(b) A certification by the registrant's principal executive officer and principal financial officer, pursuant to Section 906 of the Sarbanes-Oxley Act of 2002 and required by Rule 30a-2(b) under the Investment Company Act of 1940, is attached.
SIGNATURES
Pursuant to the requirements of the Securities Exchange Act of 1934 and the Investment Company Act of 1940, the registrant has duly caused this report to be signed on its behalf by the undersigned, thereunto duly authorized.
T. Rowe Price Capital Appreciation Fund, Inc.
| By | | /s/ Edward C. Bernard |
| | | Edward C. Bernard |
| | | Principal Executive Officer |
| |
| Date | | February 15, 2018 | | | | |
Pursuant to the requirements of the Securities Exchange Act of 1934 and the Investment Company Act of 1940, this report has been signed below by the following persons on behalf of the registrant and in the capacities and on the dates indicated.
| By | | /s/ Edward C. Bernard |
| | | Edward C. Bernard |
| | | Principal Executive Officer |
| |
| Date | | February 15, 2018 | | | | |
| |
| |
| By | | /s/ Catherine D. Mathews |
| | | Catherine D. Mathews |
| | | Principal Financial Officer |
| |
| Date | | February 15, 2018 | | | | |