UNITED STATES
SECURITIES AND EXCHANGE COMMISSION
Washington, D.C. 20549
FORM N-CSR
CERTIFIED SHAREHOLDER REPORT OF REGISTERED
MANAGEMENT INVESTMENT COMPANIES
Investment Company Act File Number: 811-04519
| T. Rowe Price Capital Appreciation Fund, Inc. |
|
| (Exact name of registrant as specified in charter) |
| |
| 100 East Pratt Street, Baltimore, MD 21202 |
|
| (Address of principal executive offices) |
| |
| David Oestreicher |
| 100 East Pratt Street, Baltimore, MD 21202 |
|
| (Name and address of agent for service) |
Registrant’s telephone number, including area code: (410) 345-2000
Date of fiscal year end: December 31
Date of reporting period: December 31, 2020
Item 1. Reports to Shareholders
(a) Report pursuant to Rule 30e-1.
| Capital Appreciation Fund | December 31, 2020 |
| PRWCX | Investor Class |
| PACLX | Advisor Class |
| TRAIX | I Class |
| T. ROWE PRICE CAPITAL APPRECIATION FUND |
|
HIGHLIGHTS
| ■ | The COVID-19 pandemic drove a pronounced shift away from experiences and toward goods, which created short-term winners and losers in the economy and in the stock market. |
| |
| ■ | Your fund generated an 18.16% absolute return versus the S&P 500 Index’s 18.40% increase. The fund outperformed the market on a risk-adjusted basis. We captured 99% of the S&P 500’s return while taking only 70% of the market’s risk. |
| |
| ■ | Unlike in the end of 2019, we do see pockets of value in an overall stretched market. We have continued to identify attractive opportunities in areas like utilities, financials, and leveraged loans. |
| |
| ■ | Signs of speculative excess in parts of the market concern us. Over time, we have found it advantageous to take the other side of the market’s macroeconomic consensus when it reaches an extreme that is either too positive or too negative and ignores valuation. |

Log in to your account at troweprice.com for more information.
*Certain mutual fund accounts that are assessed an annual account service fee can also save money by switching to e-delivery.
Management’s Discussion of Fund Performance
Fellow Shareholders
The year 2020 was defined by the horrific hardship and death caused by the COVID-19 global pandemic. Tens of millions have been sickened by COVID-19 globally and more than 2 million have died. Most white-collar workers were sent home in March and have been working from home ever since. The combination of the pandemic and white-collar workers working from home created a massive reallocation of consumer spending unlike anything the world has seen since at least the last World War. Prior to this, experiences (travel, eating out, gaming) had been taking share from goods in terms of consumer spending. This all changed on a dime in March. Travel, gaming, eating out, and even going to the doctor or dentist just stopped. While these activities and spending on them did recover throughout the remainder of 2020, they were all down materially for the full year. In addition, due to an unprecedented level of fiscal stimulus in the form of enhanced unemployment benefits and multiple stimulus checks, consumer spending was more supported than in prior recessions. As a result, consumer spending was much more resilient than in the past, and all of those funds that would have been spent on experiences were essentially reallocated to goods. Looking at Bank of America customer credit and debit spending for the week ended January 16, total spending was up 6%. However, experience categories such as airlines, lodging, entertainment, and restaurants were down 68%, 40%, 75%, and 10%, respectively. Even transit spending was down 24%. By contrast, goods categories such as home improvement, furniture, clothing, and groceries were up 37%, 33%, 13%, and 14%, respectively. The spread between experiences and goods was even more pronounced immediately after the outbreak in the U.S. This created short-term winners and losers in the economy and in the stock market.
In terms of the stock market, the market began the year trading at an expensive 20x multiple, which was the highest multiple since 2002. Then, from the peak of the market in February to its trough in March, the market fell 35% in less than a month and created some amazing investment opportunities for long-term investors. Your fund used almost all of its large cash position to increase our equity weight on a beta-adjusted basis by 1,700 basis points (from 55% to 72%). An end to the panic selling was brought about by a combination of valuations going too low, Federal Reserve monetary action, and massive fiscal stimulus. Over the course of the rest of the year, case counts ebbed and flowed until they began to get materially worse as temperatures dropped and Americans facing pandemic fatigue ventured out of their homes. However, most parts of the economy quickly recovered and unemployment levels quickly improved. The stock market rallied off its lows and then spiked in November when news that Pfizer’s and Moderna’s phase three vaccine trials demonstrated 95% efficacy against COVID. This news sent shares of some of the market’s biggest COVID losers up materially and pared some of the earlier gains from the COVID winners.
As a result, the S&P 500 somehow found a way to rally 18.4% in 2020 even though earnings likely compressed 15% to 20% this year. As we enter 2021, most market participants are betting on a very strong economic recovery aided by additional government stimulus under the new Biden administration, as well as a return to normalcy post widespread vaccinations in 2021. While this may be the most likely economic outcome, it is not the only possible outcome. The market puts far too much faith in the consensus forward economic outlook time and time again. In reality, the future is far more uncertain than most market participants understand. And even if the optimistic scenario plays out, many of the more cyclically exposed companies poised to benefit from this trend are already priced for perfection with valuations on 2022 estimates already embedding a very optimistic economic backdrop. As a former industrials and auto analyst, I know the time to buy cyclicals is not when the outlook looks promising and valuations are high, but when the outlook is cloudy or negative, as it was in March, and valuations are compelling. As we will talk about in more detail in the portfolio outlook section, we see compelling risk/reward for utilities and GARP stocks that are temporarily out of favor as the market has recovery fever. While the market is expensive, even on normalized earnings in 2022, this extended valuation is really attributable to names and sectors such as Apple; Tesla; cyclicals ex-financials; SAAS software; and, more recently, small-caps and lower-quality, secularly challenged stocks.
We will see if this euphoria continues, but we won’t change our time-tested strategy and process to chase names or sectors or classes of stocks that don’t offer attractive long-term, risk-adjusted returns.
Before we discuss fund performance, I would like to review the three goals of the Capital Appreciation Fund:
(1) Generate strong risk-adjusted returns annually.
(2) Preserve shareholder capital over the intermediate term (i.e., three years).
(3) Generate equity-like returns with less risk than that of the overall market over a full market cycle (i.e., normally five years).
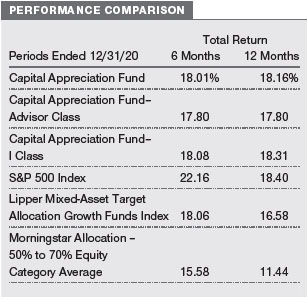
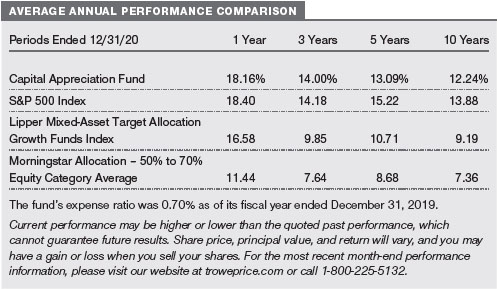
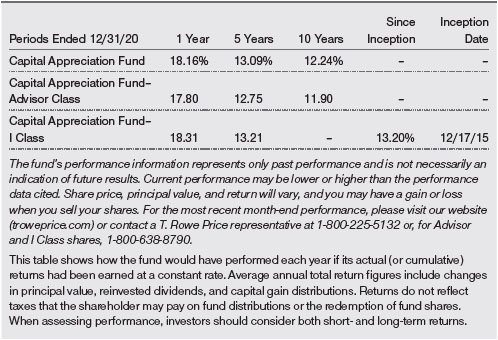
We are pleased to report that the Capital Appreciation Fund generated solid absolute and risk-adjusted returns in 2020 and came within an inch of matching the S&P 500’s return. Your fund generated an 18.16% absolute return relative to the S&P 500’s 18.40% increase. (The performance of the Advisor and I Class shares will vary due to different fee structures.)
Your fund materially outperformed the market on a risk-adjusted basis over this period. We captured 99% of the S&P 500’s return while taking on only 70% of the market’s risk. We arrive at this risk number by comparing the standard deviation of the S&P 500 (34.43) with that of the fund (24.06) for the 12-month period. Standard deviation indicates the volatility of a portfolio’s total return as measured against its mean performance. In general, the higher the standard deviation, the greater the risk.
Using a more academic measure of the fund’s risk-adjusted return, your fund produced a Sharpe ratio of 0.73 versus 0.52 for the S&P 500. The Sharpe ratio measures a portfolio’s return above the risk-free Treasury rate (excess return), divided by the amount of risk taken (measured by standard deviation). The larger the Sharpe ratio, the better the portfolio’s risk-adjusted return.
As for our second goal—capital preservation over the intermediate term—your fund generated a 48.14% cumulative return over the last three years.
As for our final goal—equity-like returns with less risk than the market over a full market cycle—your fund generated an 84.97% cumulative return over the last five years versus 103.04% for the S&P 500. Based on annualized returns of 13.09% for your fund versus 15.22% for the S&P 500, your fund generated 86% of the market’s return over the last five years while taking on 67% of the market’s risk. While market and economic cycles have historically lasted around five years on average, we also tend to think about a full market cycle encompassing at least one ugly return year. While 2018 S&P 500 returns were negative, we would not describe 2018 as an ugly year within a historical construct. As your fund is not a pure equity fund, it would be very difficult to match the equity market’s return over any period in which we did not have at least one major equity market correction. However, if we extend the analysis to encompass 2008 and measure the last 12 years of fund performance, we would have accomplished this last goal by delivering 104% of the market’s return while taking only 69% of the market’s risk.
In addition, our equities outperformed the S&P 500 by 702 basis points (25.42% versus 18.40%) in 2020. Over the last 3-, 5-, and 10-year periods, our equities outperformed the S&P 500 by an average of 582, 403, and 478 basis points, annualized, respectively. While our equities have substantially outperformed the market, our equities have also been less risky (from a beta perspective) than the market. Our fixed income investments outperformed the Bloomberg Barclays U.S. Aggregate Bond Index by 15 basis points (7.66% versus 7.51%) in 2020.
For the 1-, 3-, 5-, and 10-year periods ended December 31, 2020, we outperformed our Lipper and Morningstar peers over every period, and in 2020 we were ranked in the top decile in both Lipper and Morningstar. Over the 5- and 10-year periods, we were in the third percentile or better for both peer groupings. (Based on cumulative total return, the Capital Appreciation Fund ranked 29 of 460, 8 of 442, 10 of 411, and 1 of 296 funds in the Lipper mixed-asset target allocation growth funds universe for the 1-, 3-, 5-, and 10-year periods ended December 31, 2020, respectively. Results may vary for other periods. Past performance cannot guarantee future results.)
However, let us reiterate that we do not manage your fund to beat these benchmarks. The Capital Appreciation Fund has very different objectives than most of its benchmark peers. It is a unique fund with a clear focus on strong risk-adjusted returns, intermediate-term capital preservation, and long-term capital appreciation that does not neatly fit into any current benchmark.
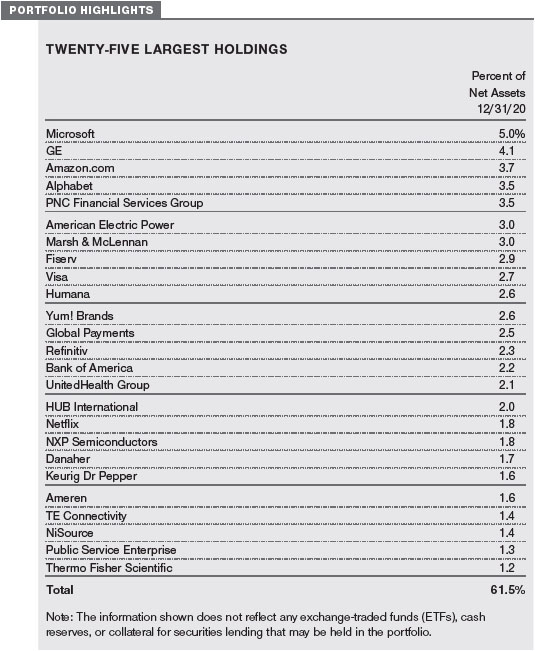
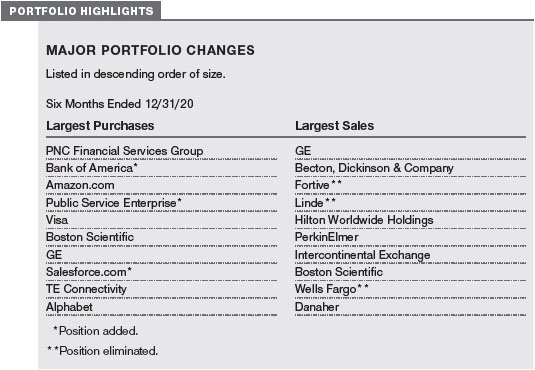
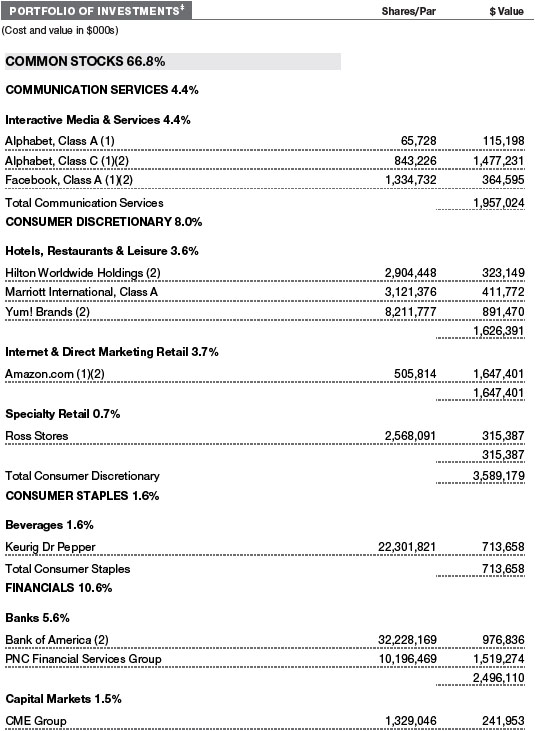
Within the equity sleeve, financials were the largest contributor to our outperformance for the second year in a row. Coming into 2020, we did not own any bank stocks as we thought they were modestly expensive on normalized earnings and did not fit within a portfolio that was very conservatively positioned. This underweight to financials, especially banks, was a meaningful contributor to performance as financials were down 1.69% for the year, with banks doing considerably worse. However, we did take advantage of this weakness later in the year and established large positions in PNC Financial Services (PNC) and Bank of America (BAC) on weakness. For the first time since the Great Financial Crisis we went overweight banks, prior to the massive cyclical rally that was unleashed post the positive Pfizer vaccine news. As a result, PNC was a material positive contributor to your fund’s performance in 2020. Like all other banks, PNC was negatively impacted by the decline in short-term interest rates, and, in addition, it announced a temporarily dilutive sale of its interest in BlackRock that lowered earnings by an additional $2 per share. This presented a great opportunity to buy a cyclically depressed, extremely well-run bank with free optionality on the deployment of excess capital. In addition, the sale proceeds of BlackRock further cemented what was already a very strong balance sheet. When the favorable vaccine news was released, PNC rallied, and it rallied further when it announced the acquisition of BBVA’s U.S. banking operations, which would effectively replace the lost earnings from its BlackRock stake. The PNC investment really encapsulates how we try to create long-term shareholder value. Find a stock that has underperformed and has short-term uncertainty, but also has substantial upside over a five-year view, a great management team, superb capital allocation, and free optionality—and then make a big bet. (Please refer to the portfolio of investments for a complete list of holdings and the amount each represents in the portfolio.)
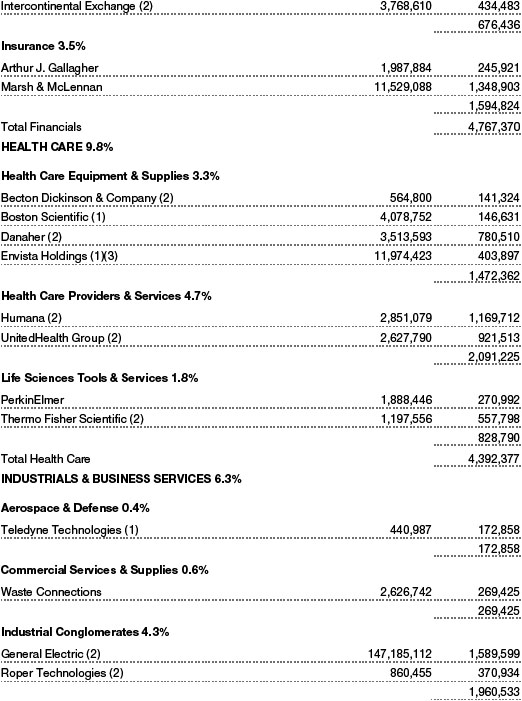
Within equities, our health care stocks were our second-largest contributor to fund performance for the second year in a row as well. Danaher and Thermo Fisher Scientific were two of the largest contributors to your fund’s equity performance as they rose 45% and 44%, respectively. Danaher and Thermo Fisher Scientific both benefited from the pandemic as they developed tests for COVID-19 in record times. In addition, both companies are working with pharmaceutical manufacturers to supply critical components for a host of vaccines and therapeutics that should meaningfully reduce the prevalence and severity of this horrific pandemic. While we continue to like Danaher and Thermo Fisher Scientific for the very long term, we have reduced our exposure to these names and many other COVID beneficiaries to fund purchases of so-called COVID losers like the aforementioned PNC. Humana was also a meaningful positive contributor to performance as we took advantage of the stock’s weakness in March to make Humana a very large bet in the portfolio. As we discussed in the last shareholder letter, the market made an error in driving Humana shares down to $200 in the depths of the pandemic on the misplaced belief that COVID costs would cause Humana’s medical costs to balloon and cause the company to miss its earnings projections. Our analysis at the time, which turned out to be correct, was that while COVID costs were large for Humana, these new costs were more than offset by the company’s customers putting off deferrable procedures and visiting doctors much less frequently.
Our large bet on utilities was a meaningful detractor from relative performance in 2020. In addition, this was the most surprising outcome of 2020 by far. Historically speaking, utilities’ valuations have tended to be extremely inversely correlated to investment-grade bond yields and Treasury yields. When rates rise utilities’ valuations tend to decline, as they did in the first half of 2018 when the 10-year Treasury yield rose above 3% and everyone was convinced it was going to 4%. In 2020, 10-year Treasury yields fell around 100 basis points, but utility valuations declined on both an absolute and, especially, on a relative basis. In looking at over 40 years of data, the inverse relationship has been especially strong, but for some reason it broke down in 2020 and we find utility valuations at 10-year lows relative to the market (even on 2022 normalized earnings) and utility dividend yields at a 2-standard-deviation level of cheapness relative to investment-grade bonds. While the market is concerned that rates will rise, rates would have to rise dramatically for utilities to no longer be inexpensive. Moreover, while utilities are near all-time low valuations relative to investment-grade bonds, their fundamentals have never been stronger. The vast majority of utilities are positioned to grow their earnings at a 5% to 7% clip and, inclusive of their dividends, accrete shareholder value in the very high single digits for the foreseeable future. This earnings growth rate is more than a 50% premium to the growth rate that utilities achieved over the last decade. This trend is being driven by a desire to move to more renewable forms of energy and, most importantly, by the inflection we have reached that allows this transition away from coal and high-cost natural gas to wind and solar to be done in an economic way that benefits the environment, rate payers, and utilities. This transition will require utilities to invest a tremendous amount of capital for utilities to close down coal and high-cost natural gas plants and replace these with wind and solar farms and to build new transmission to connect all of this to the grid. This positive backdrop for utilities is not just a one- or two-year phenomenon but a trend that I believe will last for much of the next 15 to 20 years, allowing utilities to compound wealth at a materially faster rate than they have ever done in the past while making a meaningfully positive contribution to the fight against global warming. There is no better ESG story than utilities, and, over time, the market will begin to recognize this and reward utilities with a much higher multiple. But even if that does not happen and multiples stay depressed, the combination of earnings growth of 6%, dividend yield of 3%+, and an historical beta of less than 0.5 should still produce excellent risk-adjusted returns over the next five years.
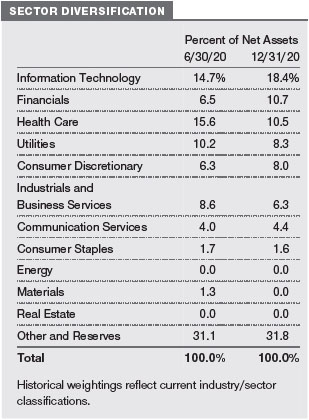
Our biggest miss in 2019 was Apple and it was once again in 2020, as the stock rose 82% during the year. In the last couple of years, Apple’s forward multiple has expanded from 13x to more than 30x earnings. However, the company’s structural earnings growth rate has actually come down as the benefit from buying back stock is much less at 30x earnings than at 13x. Almost all of Apple’s outperformance is due to multiple expansion as opposed to earnings surprising to the positive. As the market has already more than discounted, Apple will have a strong 2020 with the launch of a 5G phone. However, in past strong cycles, iPhone sales have typically declined for a year or two after the initial launch and the stock has underperformed. In addition, two of Apple’s largest, fastest-growing, and highest-margin service revenue streams are likely to come under increasing scrutiny over time (30% App Store monopoly rate and its Google exclusive on iPhone, which generates billions in profits for Apple). The outperformance of Apple for the last two years has been a big detractor from our relative performance and a big disappointment for me personally. We continue to spend considerable time on Apple and have had multiple team members look at the stock, and yet we all come to the same conclusion: There is no reason a company with a long-term 6% EPS growth rate should trade for 30x earnings with two of its fastest-growing and most profitable revenue streams facing increasing regulatory scrutiny.
While I said that the performance of utilities in 2020 was the biggest surprise of the year, a close second has to be the performance of Fiserv. We have owned Fiserv for most of the last decade, and it has been a material contributor to the long-term performance of your fund. However, in 2020, despite growing earnings at a double-digit clip in the middle of a pandemic (when the market’s earnings will likely be down 15% to 20%), Fiserv was down 2% in 2020 and was a meaningful detractor from performance. Fiserv closed its acquisition of First Data in 2019 and, based on every fundamental data point, the acquisition has been a home run. First Data’s core merchant-acquiring business, which many years earlier was losing share and struggling to grow mid-single digits, was growing double digits in 2020 prior to the pandemic. Cost synergies have come in better than expected, and free cash flow has continued to be very strong. In reality, the stock’s underperformance was due to four transitory factors. First, during the pandemic the market became enamored of payment companies that are focused exclusively on e-commerce—at the expense of Fiserv and other payment companies that operate in both physical stores and e-commerce. Second, Fiserv’s long-serving CEO Jeff Yabuki stepped down and was replaced with former First Data CEO Frank Bisignano. Despite Frank’s impressive track record of turning around First Data from a share donor to a share gainer, this CEO change put downward pressure on Fiserv’s multiple. Third, private equity firm KKR & Co. still owns a low- to mid-teens percentage of the company and is likely to sell its shares over the next couple of years. Fourth, Fiserv is a GARP stock, and at this moment in which investors are enamored of heavy cyclicals and high-growth names, Fiserv has fallen through the cracks. We believe that Fiserv, much like utilities, can generate strong double-digit earnings growth for the foreseeable future. And even if the stock does not rerate back to its historical level, it can still be a very strong investment—with more upside if its relative valuation does revert back to normal.
Portfolio Outlook
At the end of 2019, we found ourselves in a rather unique situation in which there was no asset class or sector that appeared attractive to us. The result was a large underweight position in equities, a rather conservatively positioned portfolio, and a large cash exposure. A year later, the S&P 500 is 18% higher, valuation multiples are even higher, and risk-free rates are around 100 basis points lower. However, unlike in the end of 2019, we do see pockets of value in an overall stretched market. Now, there are clearly areas of excess in the market, such as SAAS software companies that trade at ever-increasing multiples of revenues. While we are big believers in electric cars long term, the valuations placed on both established electric vehicle companies and recent start-ups assume massive share gains just as global OEMs are about to unleash a wave of high-quality electric vehicles. As a former automotive analyst, I can tell you that the automotive OEM business is a very bad business. And it is actually getting worse as the barriers to entry for new participants decline because electric vehicles are easier to produce than traditional cars. We have already spoken about the very high valuation placed on Apple and all the reasons we do not believe it is justified. In addition, the market has become enamored of cyclical recovery stories that have already recovered 50% to 150%+ off their March lows. While these companies will most likely have strong growth in 2021 and into 2022, the valuation multiples on 2022 earnings already fully account for this fact. To justify continued outperformance from here one needs to assume that these stocks will trade for a permanently higher multiple than they have historically, even as earnings growth slows to more normalized levels in the second half of 2022 and into 2023. We bought these stocks aggressively in March and slowly reduced our exposure during the course of the year as they went from exceedingly cheap on normalized earnings to exceedingly expensive.
The good news for you is that we don’t have to own the entire market; we just need to find 40+ really attractive names with superior risk-adjusted return potential. And unlike in the end of 2019, we don’t feel the need to be underweight equities because we actually believe this portfolio can generate very attractive absolute returns from here. We have already spoken about how attractive utilities are and continue to have a large overweight to this attractive, low-risk sector. We are also finding that a large number of GARP stocks have increasingly been left behind in the recent market’s rally and increasingly trade for very attractive absolute and relative multiples. We have already spoken about Fiserv, but Global Payments, Marsh & McLennan, Humana, and Yum! Brands are also examples of extremely well-run companies with strong business models and great capital allocation that should be able to grow earnings at a double-digit clip or more long term and that are trading at a material relative discount to where they have traded in the past. We see good value here and continue to add to these names with a long-term horizon.
While I believe most cyclicals are priced for perfection, the one area where that is not true is financials and, in particular, banks. While banks are clearly not as attractive as they were prior to the positive vaccine news, relative to every other cyclical sector banks still appear very attractive. Banks built large reserves for credit losses in anticipation of a far greater economic downturn than is likely to play out, and they will likely be releasing these excess reserves over the next couple of years. Those reserves should allow the banks to return more capital to shareholders (lowering their share count), accelerate book value growth, and increase returns on equity. As the economy recovers, loan growth should get back to more of a normalized pace that can be funded with excess cash reserves, which should result in increasing net interest income. Moreover, banks provide a level of free optionality that could potentially boost their earnings power if the Federal Reserve starts to raise rates in 2023 or 2024. Bank of America, in its last earnings release, highlighted that a 100 basis points increase in rates would likely increase its earnings by 36%. We think banks can be good stocks from here, especially relative to other cyclicals, and can be great stocks if rates move up just a little bit.
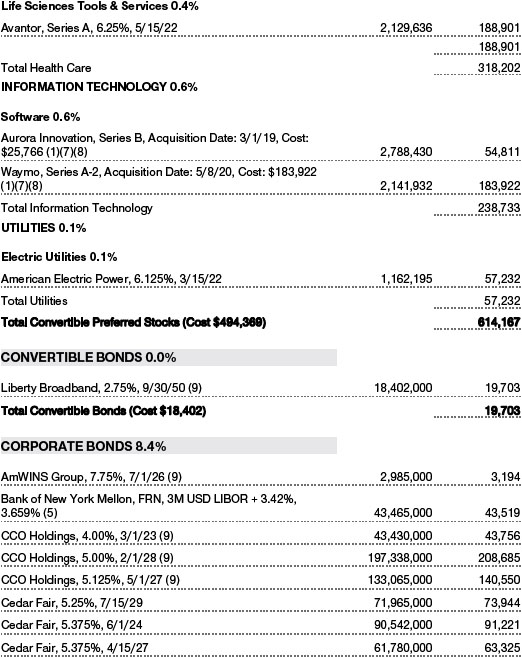
While we have been reducing our exposure to investment-grade bonds due to low absolute yields, and while we believe the risk-adjusted returns of Treasury bonds are very unattractive here, we do see value in leveraged loans. We have taken leveraged loans from a low-single-digit portion of our portfolio to the low-double digits in the last couple of years and have aggressively added to them in 2020. Leveraged loans offer yields twice those of investment-grade bonds and 3.5x those of Treasuries without any interest risk as leveraged loans are floating rate in nature. Almost all of our leveraged loan holdings within your fund have very stable business models, strong free cash flow, and plenty of cushion between their debt level and enterprise value (think of this as our margin of safety). If short-term interest rates were to rise, we would achieve higher yields at the same time that yields in most other asset classes in fixed income would be declining. With the leveraged loan market having recovered and most loans now trading back close to par, they are no longer compelling on an absolute basis. However, they remain compelling versus everything else within fixed income, from our perspective.
We will see what 2021 has in store for us. There are signs of speculative excess in parts of the market, which concerns us, and expectations have gone from the world is ending in March to we are going to have a once-in-a-generation, long-lasting economic expansion. Over time, we have found it advantageous to take the other side of the market’s macroeconomic consensus when it reaches an extreme that is either too positive (early 2020 or now) or too negative (March 2020 or late 2018) and ignores valuation. We will see if this strategy works out as well as it has in the past. What I feel very confident in saying is that you own a really high-quality collection of companies, which should be able to continue to accrete value at a high-single-digit to low-double-digit rate with less risk than the overall market. These companies are trading at very reasonable absolute valuations and increasingly compelling relative valuations.
IN CLOSING
We would like to thank all the analysts, associate analysts, quantitative analysts, and members of our team (Mike Signore, Chen Tian, Nikhil Shah, Vivek Rajeswaran, and Brian Solomon) for their assistance in 2020. As you can see, we added two additional team members to the CAF team in 2020. Vivek Rajeswaran has been with TROW for more than seven years, covering industrials, waste, industrial gases, and oil field services. Brian Solomon has been with TROW for five years, covering hotels, gaming, and cruise lines. I have worked with both of them for multiple years. Both have been important contributors to CAF’s performance over time, have investment styles that are consistent with CAF’s value-creation framework, and have made meaningful contributions to CAF’s strong results in 2020 as new team analysts. Last, Associate Portfolio Manager Adam Poussard has assumed a different investment role at TROW and is no longer on the Capital Appreciation team. We thank Adam for his assistance over the last two years.
Respectfully submitted,

David R. Giroux
Chairman of the fund’s Investment Advisory Committee
January 22, 2021
The committee chairman has day-to-day responsibility for managing the portfolio and works with committee members in developing and executing the fund’s investment program.
The views expressed reflect the opinions of T. Rowe Price as of the date of this report and are subject to change based on changes in market, economic, or other conditions. These views are not intended to be a forecast of future events and are no guarantee of future results.
RISKS OF INVESTING
As with all stock and bond mutual funds, the fund’s share price can fall because of weakness in the stock or bond markets, a particular industry, or specific holdings. Stock markets can decline for many reasons, including adverse political or economic developments, changes in investor psychology, or heavy institutional selling. The prospects for an industry or company may deteriorate because of a variety of factors, including disappointing earnings or changes in the competitive environment. In addition, the investment manager’s assessment of companies held in a fund may prove incorrect, resulting in losses or poor performance, even in rising markets. A sizable cash or fixed income position may hinder the fund from participating fully in a strong, rapidly rising bull market. In addition, significant exposure to bonds increases the risk that the fund’s share value could be hurt by rising interest rates or credit downgrades or defaults. Convertible securities are also exposed to price fluctuations of the company’s stock.
GLOSSARY
Beta: A measure of the market risk of a stock showing how responsive it is to a given market index, such as the S&P 500 Stock Index. By definition, the beta of the benchmark index is 1.00. A fund with a 1.10 beta is expected to perform 10% better than the index in up markets and 10% worse in down markets. Usually, higher betas represent riskier investments.
Lipper indexes: Fund benchmarks that consist of a small number of the largest mutual funds in a particular category as tracked by Lipper Inc.
Morningstar Allocation – 50% to 70% Equity Category Average: Tracks the performance of funds that seek capital appreciation and income by investing in multiple asset classes, including stocks, bonds, and cash. Equity exposures range from 50% to 70%.
Sharpe ratio: A measure of the risk-adjusted return of a portfolio. The Sharpe ratio measures how much a portfolio’s return is above or below the risk-free Treasury rate (excess return) per unit risk (measured by standard deviation). In general, the larger the number, the better the portfolio’s historical risk-adjusted return.
BENCHMARK INFORMATION
Note: Bloomberg Index Services Ltd. Copyright © 2021, Bloomberg Index Services Ltd. Used with permission.
Note: Information has been obtained from sources believed to be reliable but J.P. Morgan does not warrant its completeness or accuracy. The index is used with permission. The index may not be copied, used, or distributed without J.P. Morgan’s prior written approval. Copyright 2021, J.P. Morgan Chase & Co. All rights reserved.
Note: Lipper, a Thomson Reuters Company, is the source for all Lipper content reflected in these materials. Copyright 2020 © Refinitiv. All rights reserved. Any copying, republication or redistribution of Lipper content is expressly prohibited without the prior written consent of Lipper. Lipper shall not be liable for any errors or delays in the content, or for any actions taken in reliance thereon.
Note: ©2020 Morningstar, Inc. All rights reserved. The information contained herein: (1) is proprietary to Morningstar and/or its content providers; (2) may not be copied or distributed; and (3) is not warranted to be accurate, complete, or timely. Neither Morningstar nor its content providers are responsible for any damages or losses arising from any use of this information. Past performance is no guarantee of future results.
Note: ©2020, S&P Global Market Intelligence. Reproduction of any information, data or material, including ratings (Content) in any form is prohibited except with the prior written permission of the relevant party. Such party, its affiliates and suppliers (Content Providers) do not guarantee the accuracy, adequacy, completeness, timeliness or availability of any Content and are not responsible for any errors or omissions (negligent or otherwise), regardless of the cause, or for the results obtained from the use of such Content. In no event shall Content Providers be liable for any damages, costs, expenses, legal fees, or losses (including lost income or lost profit and opportunity costs) in connection with any use of the Content.
GROWTH OF $10,000
This chart shows the value of a hypothetical $10,000 investment in the fund over the past 10 fiscal year periods or since inception (for funds lacking 10-year records). The result is compared with benchmarks, which include a broad-based market index and may also include a peer group average or index. Market indexes do not include expenses, which are deducted from fund returns as well as mutual fund averages and indexes.

AVERAGE ANNUAL COMPOUND TOTAL RETURN
EXPENSE RATIO
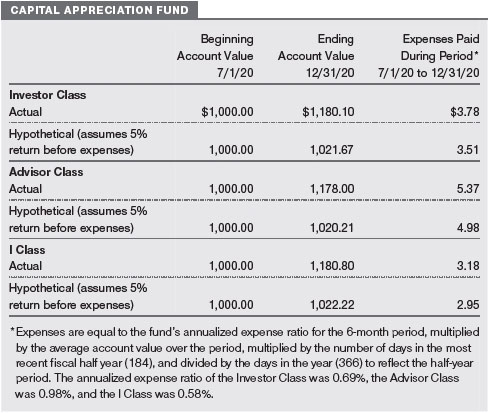
FUND EXPENSE EXAMPLE
As a mutual fund shareholder, you may incur two types of costs: (1) transaction costs, such as redemption fees or sales loads, and (2) ongoing costs, including management fees, distribution and service (12b-1) fees, and other fund expenses. The following example is intended to help you understand your ongoing costs (in dollars) of investing in the fund and to compare these costs with the ongoing costs of investing in other mutual funds. The example is based on an investment of $1,000 invested at the beginning of the most recent six-month period and held for the entire period.
Please note that the fund has three share classes: The original share class (Investor Class) charges no distribution and service (12b-1) fee, the Advisor Class shares are offered only through unaffiliated brokers and other financial intermediaries and charge a 0.25% 12b-1 fee, and I Class shares are available to institutionally oriented clients and impose no 12b-1 or administrative fee payment. Each share class is presented separately in the table.
Actual Expenses
The first line of the following table (Actual) provides information about actual account values and expenses based on the fund’s actual returns. You may use the information on this line, together with your account balance, to estimate the expenses that you paid over the period. Simply divide your account value by $1,000 (for example, an $8,600 account value divided by $1,000 = 8.6), then multiply the result by the number on the first line under the heading “Expenses Paid During Period” to estimate the expenses you paid on your account during this period.
Hypothetical Example for Comparison Purposes
The information on the second line of the table (Hypothetical) is based on hypothetical account values and expenses derived from the fund’s actual expense ratio and an assumed 5% per year rate of return before expenses (not the fund’s actual return). You may compare the ongoing costs of investing in the fund with other funds by contrasting this 5% hypothetical example and the 5% hypothetical examples that appear in the shareholder reports of the other funds. The hypothetical account values and expenses may not be used to estimate the actual ending account balance or expenses you paid for the period.
Note: T. Rowe Price charges an annual account service fee of $20, generally for accounts with less than $10,000. The fee is waived for any investor whose T. Rowe Price mutual fund accounts total $50,000 or more; accounts electing to receive electronic delivery of account statements, transaction confirmations, prospectuses, and shareholder reports; or accounts of an investor who is a T. Rowe Price Personal Services or Enhanced Personal Services client (enrollment in these programs generally requires T. Rowe Price assets of at least $250,000). This fee is not included in the accompanying table. If you are subject to the fee, keep it in mind when you are estimating the ongoing expenses of investing in the fund and when comparing the expenses of this fund with other funds.
You should also be aware that the expenses shown in the table highlight only your ongoing costs and do not reflect any transaction costs, such as redemption fees or sales loads. Therefore, the second line of the table is useful in comparing ongoing costs only and will not help you determine the relative total costs of owning different funds. To the extent a fund charges transaction costs, however, the total cost of owning that fund is higher.
The accompanying notes are an integral part of these financial statements.
The accompanying notes are an integral part of these financial statements.
The accompanying notes are an integral part of these financial statements.
December 31, 2020
The accompanying notes are an integral part of these financial statements.
December 31, 2020
The accompanying notes are an integral part of these financial statements.
The accompanying notes are an integral part of these financial statements.
The accompanying notes are an integral part of these financial statements.
| NOTES TO FINANCIAL STATEMENTS |
T. Rowe Price Capital Appreciation Fund, Inc. (the fund) is registered under the Investment Company Act of 1940 (the 1940 Act) as a diversified, open-end management investment company. The fund seeks long-term capital appreciation by investing primarily in common stocks. It may also hold fixed-income and other securities to help preserve principal value. The fund has three classes of shares: the Capital Appreciation Fund (Investor Class), the Capital Appreciation Fund–Advisor Class (Advisor Class), and the Capital Appreciation Fund–I Class (I Class). Advisor Class shares are sold only through various brokers and other financial intermediaries. I Class shares require a $1 million initial investment minimum, although the minimum generally is waived for retirement plans, financial intermediaries, and certain other accounts. The Advisor Class operates under a Board-approved Rule 12b-1 plan pursuant to which the class compensates financial intermediaries for distribution, shareholder servicing, and/or certain administrative services; the Investor and I Classes do not pay Rule 12b-1 fees. Each class has exclusive voting rights on matters related solely to that class; separate voting rights on matters that relate to all classes; and, in all other respects, the same rights and obligations as the other classes.
NOTE 1 - SIGNIFICANT ACCOUNTING POLICIES
Basis of Preparation The fund is an investment company and follows accounting and reporting guidance in the Financial Accounting Standards Board (FASB) Accounting Standards Codification Topic 946 (ASC 946). The accompanying financial statements were prepared in accordance with accounting principles generally accepted in the United States of America (GAAP), including, but not limited to, ASC 946. GAAP requires the use of estimates made by management. Management believes that estimates and valuations are appropriate; however, actual results may differ from those estimates, and the valuations reflected in the accompanying financial statements may differ from the value ultimately realized upon sale or maturity.
Investment Transactions, Investment Income, and Distributions Investment transactions are accounted for on the trade date basis. Income and expenses are recorded on the accrual basis. Realized gains and losses are reported on the identified cost basis. Premiums and discounts on debt securities are amortized for financial reporting purposes. Paydown gains and losses are recorded as an adjustment to interest income. Income tax-related interest and penalties, if incurred, are recorded as income tax expense. Dividends received from mutual fund investments are reflected as dividend income; capital gain distributions are reflected as realized gain/loss. Dividend income and capital gain distributions are recorded on the ex-dividend date. Distributions from REITs are initially recorded as dividend income and, to the extent such represent a return of capital or capital gain for tax purposes, are reclassified when such information becomes available. Non-cash dividends, if any, are recorded at the fair market value of the asset received. Distributions to shareholders are recorded on the ex-dividend date. Income distributions, if any, are declared and paid by each class annually. A capital gain distribution may also be declared and paid by the fund annually.
Currency Translation Assets, including investments, and liabilities denominated in foreign currencies are translated into U.S. dollar values each day at the prevailing exchange rate, using the mean of the bid and asked prices of such currencies against U.S. dollars as quoted by a major bank. Purchases and sales of securities, income, and expenses are translated into U.S. dollars at the prevailing exchange rate on the respective date of such transaction. The effect of changes in foreign currency exchange rates on realized and unrealized security gains and losses is not bifurcated from the portion attributable to changes in market prices.
Class Accounting Shareholder servicing, prospectus, and shareholder report expenses incurred by each class are charged directly to the class to which they relate. Expenses common to all classes, investment income, and realized and unrealized gains and losses are allocated to the classes based upon the relative daily net assets of each class. The Advisor Class pays Rule 12b-1 fees, in an amount not exceeding 0.25% of the class’s average daily net assets.
Capital Transactions Each investor’s interest in the net assets of the fund is represented by fund shares. The fund’s net asset value (NAV) per share is computed at the close of the New York Stock Exchange (NYSE), normally 4 p.m. ET, each day the NYSE is open for business. However, the NAV per share may be calculated at a time other than the normal close of the NYSE if trading on the NYSE is restricted, if the NYSE closes earlier, or as may be permitted by the SEC. Purchases and redemptions of fund shares are transacted at the next-computed NAV per share, after receipt of the transaction order by T. Rowe Price Associates, Inc., or its agents.
New Accounting Guidance In March 2020, the FASB issued Accounting Standards Update (ASU), ASU 2020-04, Reference Rate Reform (Topic 848) – Facilitation of the Effects of Reference Rate Reform on Financial Reporting, which provides optional, temporary relief with respect to the financial reporting of contracts subject to certain types of modifications due to the planned discontinuation of the London Interbank Offered Rate (LIBOR) and other interbank-offered based reference rates as of the end of 2021. The guidance is effective for certain reference rate-related contract modifications that occur during the period March 12, 2020 through December 31, 2022. Management expects that the adoption of the guidance will not have a material impact on the fund’s financial statements.
Indemnification In the normal course of business, the fund may provide indemnification in connection with its officers and directors, service providers, and/or private company investments. The fund’s maximum exposure under these arrangements is unknown; however, the risk of material loss is currently considered to be remote.
NOTE 2 - VALUATION
Fair Value The fund’s financial instruments are valued at the close of the NYSE and are reported at fair value, which GAAP defines as the price that would be received to sell an asset or paid to transfer a liability in an orderly transaction between market participants at the measurement date. The T. Rowe Price Valuation Committee (the Valuation Committee) is an internal committee that has been delegated certain responsibilities by the fund’s Board of Directors (the Board) to ensure that financial instruments are appropriately priced at fair value in accordance with GAAP and the 1940 Act. Subject to oversight by the Board, the Valuation Committee develops and oversees pricing-related policies and procedures and approves all fair value determinations. Specifically, the Valuation Committee establishes policies and procedures used in valuing financial instruments, including those which cannot be valued in accordance with normal procedures or using pricing vendors; determines pricing techniques, sources, and persons eligible to effect fair value pricing actions; evaluates the services and performance of the pricing vendors; oversees the pricing process to ensure policies and procedures are being followed; and provides guidance on internal controls and valuation-related matters. The Valuation Committee provides periodic reporting to the Board on valuation matters.
Various valuation techniques and inputs are used to determine the fair value of financial instruments. GAAP establishes the following fair value hierarchy that categorizes the inputs used to measure fair value:
Level 1 – quoted prices (unadjusted) in active markets for identical financial instruments that the fund can access at the reporting date
Level 2 – inputs other than Level 1 quoted prices that are observable, either directly or indirectly (including, but not limited to, quoted prices for similar financial instruments in active markets, quoted prices for identical or similar financial instruments in inactive markets, interest rates and yield curves, implied volatilities, and credit spreads)
Level 3 – unobservable inputs (including the fund’s own assumptions in determining fair value)
Observable inputs are developed using market data, such as publicly available information about actual events or transactions, and reflect the assumptions that market participants would use to price the financial instrument. Unobservable inputs are those for which market data are not available and are developed using the best information available about the assumptions that market participants would use to price the financial instrument. GAAP requires valuation techniques to maximize the use of relevant observable inputs and minimize the use of unobservable inputs. When multiple inputs are used to derive fair value, the financial instrument is assigned to the level within the fair value hierarchy based on the lowest-level input that is significant to the fair value of the financial instrument. Input levels are not necessarily an indication of the risk or liquidity associated with financial instruments at that level but rather the degree of judgment used in determining those values.
Valuation Techniques Equity securities, including exchange-traded funds, listed or regularly traded on a securities exchange or in the over-the-counter (OTC) market are valued at the last quoted sale price or, for certain markets, the official closing price at the time the valuations are made. OTC Bulletin Board securities are valued at the mean of the closing bid and asked prices. A security that is listed or traded on more than one exchange is valued at the quotation on the exchange determined to be the primary market for such security. Listed securities not traded on a particular day are valued at the mean of the closing bid and asked prices for domestic securities.
Debt securities generally are traded in the OTC market and are valued at prices furnished by independent pricing services or by broker dealers who make markets in such securities. When valuing securities, the independent pricing services consider the yield or price of bonds of comparable quality, coupon, maturity, and type, as well as prices quoted by dealers who make markets in such securities.
Investments in mutual funds are valued at the mutual fund’s closing NAV per share on the day of valuation. Listed options, and OTC options with a listed equivalent, are valued at the mean of the closing bid and asked prices and Exchange-traded options on futures contracts are valued at closing settlement prices. Assets and liabilities other than financial instruments, including short-term receivables and payables, are carried at cost, or estimated realizable value, if less, which approximates fair value.
Investments for which market quotations or market-based valuations are not readily available or deemed unreliable are valued at fair value as determined in good faith by the Valuation Committee, in accordance with fair valuation policies and procedures. The objective of any fair value pricing determination is to arrive at a price that could reasonably be expected from a current sale. Financial instruments fair valued by the Valuation Committee are primarily private placements, restricted securities, warrants, rights, and other securities that are not publicly traded. Factors used in determining fair value vary by type of investment and may include market or investment specific considerations. The Valuation Committee typically will afford greatest weight to actual prices in arm’s length transactions, to the extent they represent orderly transactions between market participants, transaction information can be reliably obtained, and prices are deemed representative of fair value. However, the Valuation Committee may also consider other valuation methods such as market-based valuation multiples; a discount or premium from market value of a similar, freely traded security of the same issuer; discounted cash flows; yield to maturity; or some combination. Fair value determinations are reviewed on a regular basis and updated as information becomes available, including actual purchase and sale transactions of the investment. Because any fair value determination involves a significant amount of judgment, there is a degree of subjectivity inherent in such pricing decisions, and fair value prices determined by the Valuation Committee could differ from those of other market participants.
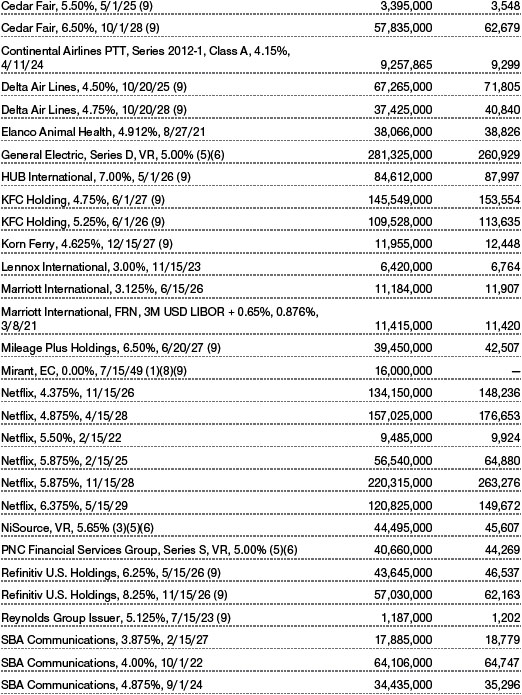
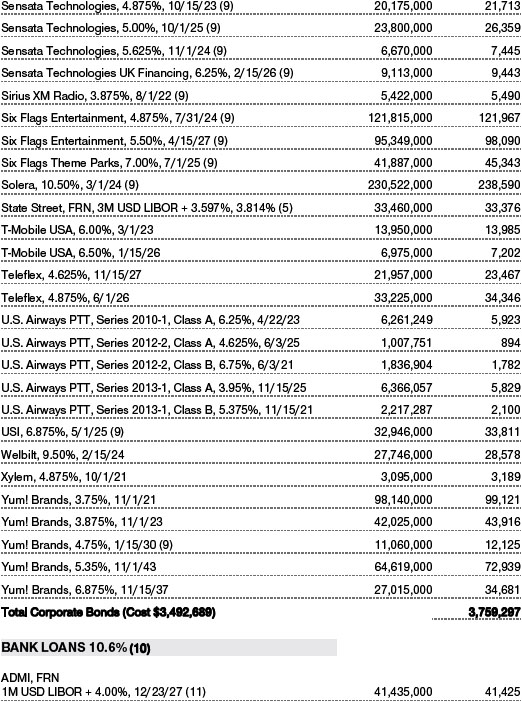
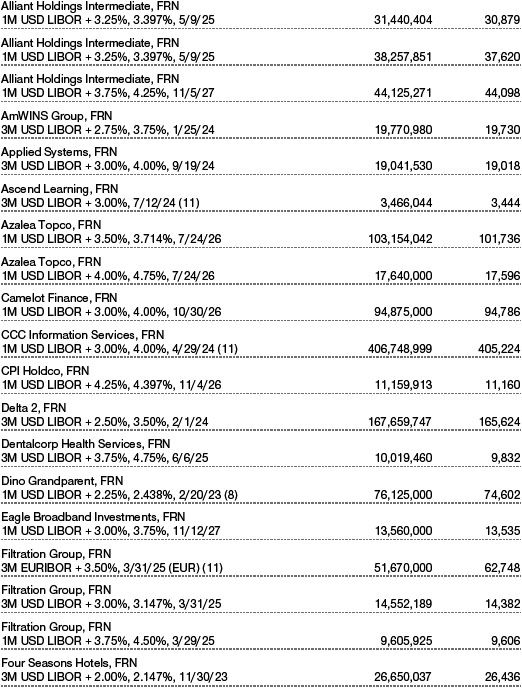
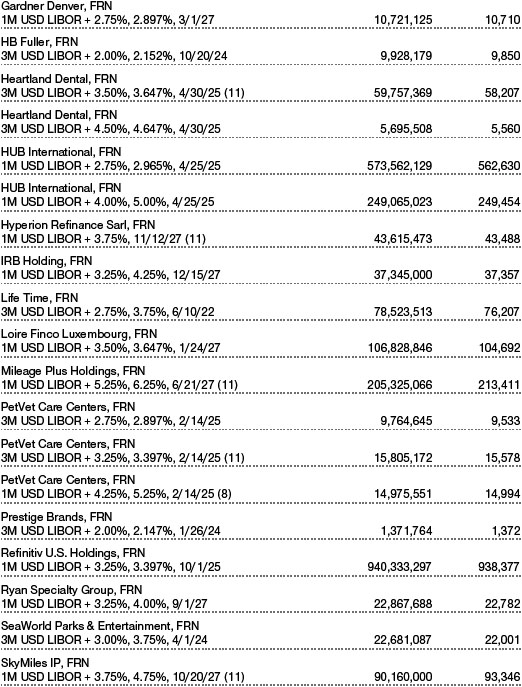
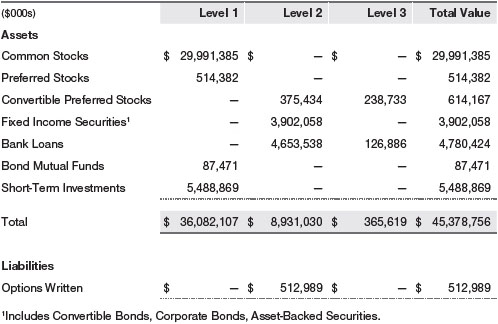
Valuation Inputs The following table summarizes the fund’s financial instruments, based on the inputs used to determine their fair values on December 31, 2020 (for further detail by category, please refer to the accompanying Portfolio of Investments):
NOTE 3 - DERIVATIVE INSTRUMENTS
During the year ended December 31, 2020, the fund invested in derivative instruments. As defined by GAAP, a derivative is a financial instrument whose value is derived from an underlying security price, foreign exchange rate, interest rate, index of prices or rates, or other variable; it requires little or no initial investment and permits or requires net settlement. The fund invests in derivatives only if the expected risks and rewards are consistent with its investment objectives, policies, and overall risk profile, as described in its prospectus and Statement of Additional Information. The fund may use derivatives for a variety of purposes, such as seeking to hedge against declines in principal value, increase yield, invest in an asset with greater efficiency and at a lower cost than is possible through direct investment, to enhance return, or to adjust credit exposure. The risks associated with the use of derivatives are different from, and potentially much greater than, the risks associated with investing directly in the instruments on which the derivatives are based. The fund at all times maintains sufficient cash reserves, liquid assets, or other SEC-permitted asset types to cover its settlement obligations under open derivative contracts.
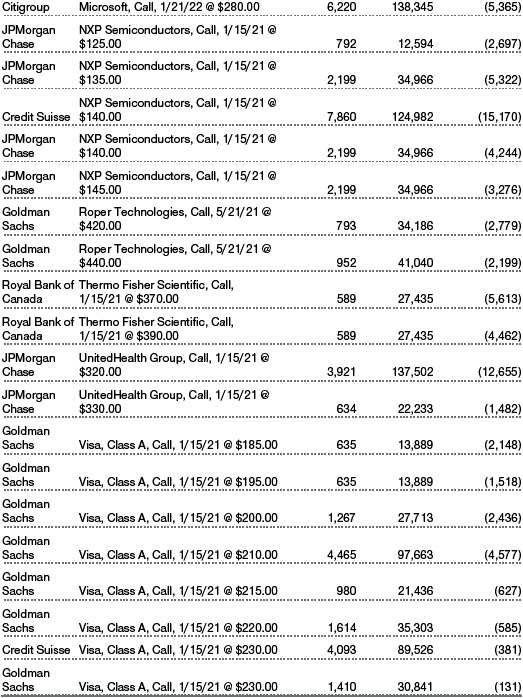
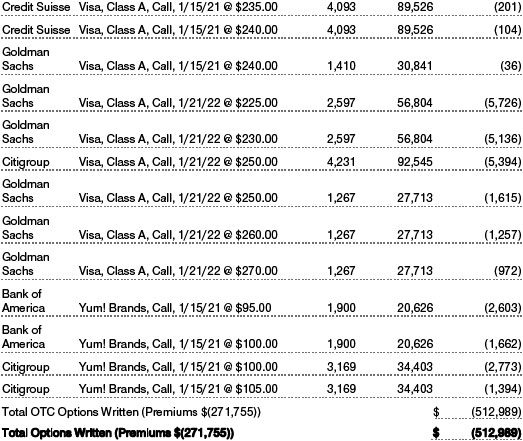
The fund values its derivatives at fair value and recognizes changes in fair value currently in its results of operations. Accordingly, the fund does not follow hedge accounting, even for derivatives employed as economic hedges. Generally, the fund accounts for its derivatives on a gross basis. It does not offset the fair value of derivative liabilities against the fair value of derivative assets on its financial statements, nor does it offset the fair value of derivative instruments against the right to reclaim or obligation to return collateral. As of December 31, 2020, the fund held equity derivatives with a fair value of $512,989,000, included in Options written, on the accompanying Statement of Assets and Liabilities.
Additionally, during the year ended December 31, 2020, the fund recognized $15,439,000 of realized loss on Options written and a $(50,628,000) change in unrealized gain/loss on Options written related to its investments in equity derivatives; such amounts are included on the accompanying Statement of Operations.
Counterparty Risk and Collateral The fund invests in derivatives, such as bilateral swaps, forward currency exchange contracts, or OTC options, that are transacted and settle directly with a counterparty (bilateral derivatives), and thereby may expose the fund to counterparty risk. To mitigate this risk, the fund has entered into master netting arrangements (MNAs) with certain counterparties that permit net settlement under specified conditions and, for certain counterparties, also require the exchange of collateral to cover mark-to-market exposure. MNAs may be in the form of International Swaps and Derivatives Association master agreements (ISDAs) or foreign exchange letter agreements (FX letters).
MNAs govern the ability to offset amounts the fund owes a counterparty against amounts the counterparty owes the fund (net settlement). Both ISDAs and FX letters generally allow termination of transactions and net settlement upon the occurrence of contractually specified events, such as failure to pay or bankruptcy. In addition, ISDAs specify other events, the occurrence of which would allow one of the parties to terminate. For example, a downgrade in credit rating of a counterparty below a specified rating would allow the fund to terminate, while a decline in the fund’s net assets of more than a specified percentage would allow the counterparty to terminate. Upon termination, all transactions with that counterparty would be liquidated and a net termination amount determined. ISDAs include collateral agreements whereas FX letters do not. Collateral requirements are determined daily based on the net aggregate unrealized gain or loss on all bilateral derivatives with each counterparty, subject to minimum transfer amounts that typically range from $100,000 to $250,000. Any additional collateral required due to changes in security values is typically transferred the next business day.
Collateral may be in the form of cash or debt securities issued by the U.S. government or related agencies. Cash posted by the fund is reflected as cash deposits in the accompanying financial statements and generally is restricted from withdrawal by the fund; securities posted by the fund are so noted in the accompanying Portfolio of Investments; both remain in the fund’s assets. Collateral pledged by counterparties is not included in the fund’s assets because the fund does not obtain effective control over those assets. For bilateral derivatives, collateral posted or received by the fund is held in a segregated account at the fund’s custodian.
While typically not sold in the same manner as equity or fixed income securities, OTC and bilateral derivatives may be unwound with counterparties or transactions assigned to other counterparties to allow the fund to exit the transaction. This ability is subject to the liquidity of underlying positions. The following table summarizes the fund’s derivatives at the reporting date by loss exposure to each counterparty after consideration of collateral, if any.
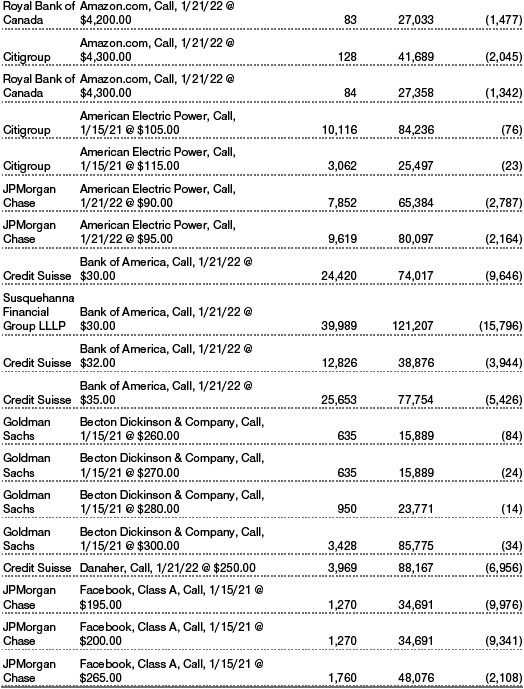
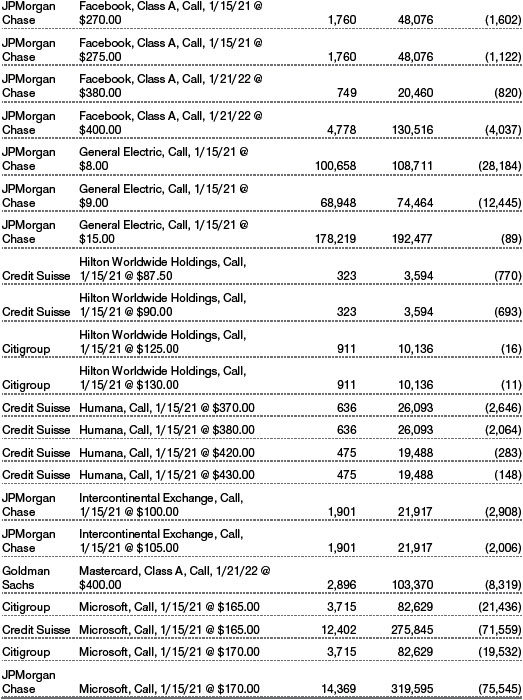
Options The fund is subject to equity price risk in the normal course of pursuing its investment objectives and uses options to help manage such risk. The fund may use options to manage exposure to security prices, interest rates, foreign currencies, and credit quality; as an efficient means of adjusting exposure to all or a part of a target market; to enhance income; as a cash management tool; or to adjust credit exposure. Options are included in net assets at fair value, options purchased are included in Investments in Securities, and Options written are separately reflected as a liability on the accompanying Statement of Assets and Liabilities. Premiums on unexercised, expired options are recorded as realized gains or losses; premiums on exercised options are recorded as an adjustment to the proceeds from the sale or cost of the purchase. The difference between the premium and the amount received or paid in a closing transaction is also treated as realized gain or loss. In return for a premium paid, call and put options give the holder the right, but not the obligation, to purchase or sell, respectively, a security at a specified exercise price. Risks related to the use of options include possible illiquidity of the options markets; trading restrictions imposed by an exchange or counterparty; movements in the underlying asset values and, for options written, potential losses in excess of the fund’s initial investment. During the year ended December 31, 2020, the volume of the fund’s activity in options, based on underlying notional amounts, was generally between 6% and 12% of net assets.
NOTE 4 - OTHER INVESTMENT TRANSACTIONS
Consistent with its investment objective, the fund engages in the following practices to manage exposure to certain risks and/or to enhance performance. The investment objective, policies, program, and risk factors of the fund are described more fully in the fund’s prospectus and Statement of Additional Information.
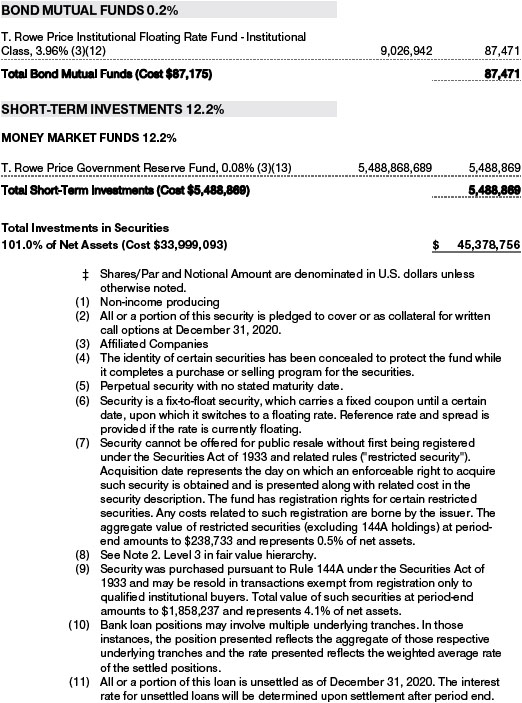
Noninvestment-Grade Debt The fund invests, either directly or through its investment in other T. Rowe Price funds, in noninvestment-grade debt, including “high yield” or “junk” bonds or leveraged loans. Noninvestment-grade debt issuers are more likely to suffer an adverse change in financial condition that would result in the inability to meet a financial obligation. The noninvestment-grade debt market may experience sudden and sharp price swings due to a variety of factors that may decrease the ability of issuers to make principal and interest payments and adversely affect the liquidity or value, or both, of such securities. Accordingly, securities issued by such companies carry a higher risk of default and should be considered speculative.
Restricted Securities The fund invests in securities that are subject to legal or contractual restrictions on resale. Prompt sale of such securities at an acceptable price may be difficult and may involve substantial delays and additional costs.
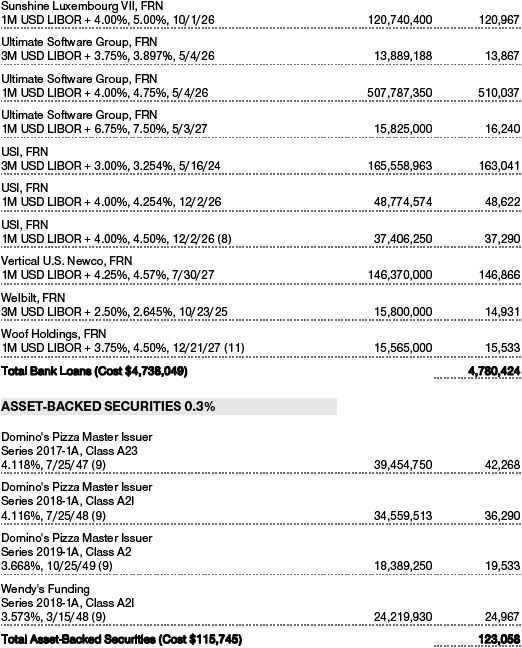
Bank Loans The fund invests in bank loans, which represent an interest in amounts owed by a borrower to a syndicate of lenders. Bank loans are generally noninvestment grade and often involve borrowers whose financial condition is highly leveraged. Bank loans may be in the form of either assignments or participations. A loan assignment transfers all legal, beneficial, and economic rights to the buyer, and transfer typically requires consent of both the borrower and agent. In contrast, a loan participation generally entitles the buyer to receive the cash flows from principal, interest, and any fee payments on a portion of a loan; however, the seller continues to hold legal title to that portion of the loan. As a result, the buyer of a loan participation generally has no direct recourse against the borrower and is exposed to credit risk of both the borrower and seller of the participation. Bank loans often have extended settlement periods, generally may be repaid at any time at the option of the borrower, and may require additional principal to be funded at the borrowers’ discretion at a later date (e.g. unfunded commitments and revolving debt instruments). Until settlement, the fund maintains liquid assets sufficient to settle its unfunded loan commitments. The fund reflects both the funded portion of a bank loan as well as its unfunded commitment in the Portfolio of Investments. However, if a credit agreement provides no initial funding of a tranche and funding of the full commitment at a future date(s) is at the borrower’s discretion and considered uncertain, a loan is reflected in the Portfolio of Investments only if, and only to the extent that, the fund has actually settled a funding commitment.
LIBOR The fund may invest in instruments that are tied to reference rates, including LIBOR. On July 27, 2017, the United Kingdom’s Financial Conduct Authority announced a decision to transition away from LIBOR by the end of 2021. There remains uncertainty regarding the future utilization of LIBOR and the nature of any replacement rate. Any potential effects of the transition away from LIBOR on the fund, or on certain instruments in which the fund invests, are not known. The transition process may result in, among other things, an increase in volatility or illiquidity of markets for instruments that currently rely on LIBOR, a reduction in the value of certain instruments held by the fund, or a reduction in the effectiveness of related fund transactions such as hedges. Any such effects could have an adverse impact on the fund’s performance.
Other Purchases and sales of portfolio securities other than short-term securities aggregated $30,449,752,000 and $30,386,710,000, respectively, for the year ended December 31, 2020.
NOTE 5 - FEDERAL INCOME TAXES
Generally, no provision for federal income taxes is required since the fund intends to continue to qualify as a regulated investment company under Subchapter M of the Internal Revenue Code and distribute to shareholders all of its taxable income and gains. Distributions determined in accordance with federal income tax regulations may differ in amount or character from net investment income and realized gains for financial reporting purposes.
The fund files U.S. federal, state, and local tax returns as required. The fund’s tax returns are subject to examination by the relevant tax authorities until expiration of the applicable statute of limitations, which is generally three years after the filing of the tax return but which can be extended to six years in certain circumstances. Tax returns for open years have incorporated no uncertain tax positions that require a provision for income taxes.
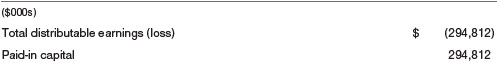
Financial reporting records are adjusted for permanent book/tax differences to reflect tax character but are not adjusted for temporary differences. The permanent book/tax adjustments have no impact on results of operations or net assets and relate primarily to a tax practice that treats a portion of the proceeds from each redemption of capital shares as a distribution of taxable net investment income or realized capital gain. For the year ended December 31, 2020, the following reclassification was recorded:
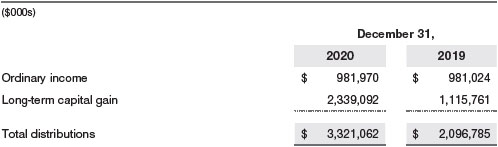
Distributions during the years ended December 31, 2020 and December 31, 2019, were characterized for tax purposes as follows:
At December 31, 2020, the tax-basis cost of investments, including derivatives, and components of net assets were as follows:

The difference between book-basis and tax-basis net unrealized appreciation (depreciation) is attributable to the deferral of losses from wash sales for tax purposes.
NOTE 6 - RELATED PARTY TRANSACTIONS
The fund is managed by T. Rowe Price Associates, Inc. (Price Associates), a wholly owned subsidiary of T. Rowe Price Group, Inc. (Price Group). The investment management agreement between the fund and Price Associates provides for an annual investment management fee that consists of an individual fund fee and a group fee; management fees are computed daily and paid monthly. The investment management agreement provides for an individual fund fee equal to 0.30% of the fund’s average daily net assets. The group fee rate is calculated based on the combined net assets of certain mutual funds sponsored by Price Associates (the group) applied to a graduated fee schedule, with rates ranging from 0.48% for the first $1 billion of assets to 0.260% for assets in excess of $845 billion. The fund’s group fee is determined by applying the group fee rate to the fund’s average daily net assets. At December 31, 2020, the effective annual group fee rate was 0.28%. Effective April 30, 2019, Price Associates has contractually agreed, at least through April 30, 2021, to waive a portion of its management fee so that an individual fund fee of 0.27% is applied to the fund’s average daily net assets that are equal to or greater than $27.5 billion. Thereafter, this agreement will automatically renew for one-year terms unless terminated by the fund’s Board. Any fees waived under this agreement are not subject to reimbursement to Price Associates by the fund. The total management fees waived were $3,423,000 and allocated ratably in the amounts of $2,733,000 for the Investor Class, $64,000 for the Advisor Class, $626,000 for the I Class, for the year ended December 31, 2020.
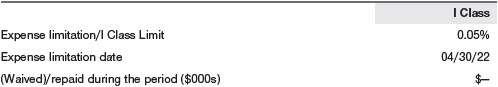
The I Class is subject to an operating expense limitation (I Class Limit) pursuant to which Price Associates is contractually required to pay all operating expenses of the I Class, excluding management fees; interest; expenses related to borrowings, taxes, and brokerage; and other non-recurring expenses permitted by the investment management agreement, to the extent such operating expenses, on an annualized basis, exceed the I Class Limit. This agreement will continue through the expense limitation date indicated in the table below, and may be renewed, revised, or revoked only with approval of the fund’s Board. The I Class is required to repay Price Associates for expenses previously paid to the extent the class’s net assets grow or expenses decline sufficiently to allow repayment without causing the class’s operating expenses (after the repayment is taken into account) to exceed the lesser of: (1) the I Class Limit in place at the time such amounts were paid; or (2) the current I Class Limit. However, no repayment will be made more than three years after the date of a payment or waiver.
In addition, the fund has entered into service agreements with Price Associates and two wholly owned subsidiaries of Price Associates, each an affiliate of the fund (collectively, Price). Price Associates provides certain accounting and administrative services to the fund. T. Rowe Price Services, Inc. provides shareholder and administrative services in its capacity as the fund’s transfer and dividend-disbursing agent. T. Rowe Price Retirement Plan Services, Inc. provides subaccounting and recordkeeping services for certain retirement accounts invested in the Investor Class and Advisor Class. For the year ended December 31, 2020, expenses incurred pursuant to these service agreements were $68,000 for Price Associates; $5,381,000 for T. Rowe Price Services, Inc.; and $1,323,000 for T. Rowe Price Retirement Plan Services, Inc. All amounts due to and due from Price, exclusive of investment management fees payable, are presented net on the accompanying Statement of Assets and Liabilities.
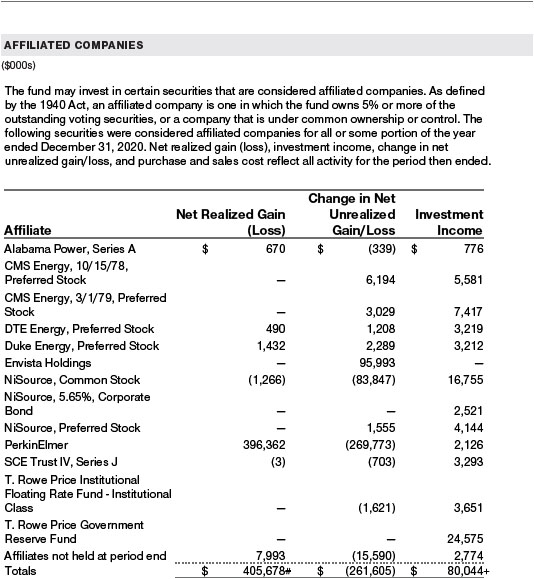
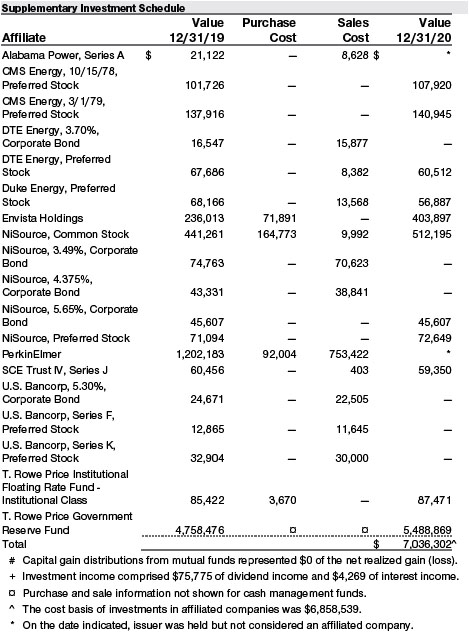
The fund may invest its cash reserves in certain open-end management investment companies managed by Price Associates and considered affiliates of the fund: the T. Rowe Price Government Reserve Fund or the T. Rowe Price Treasury Reserve Fund, organized as money market funds, or the T. Rowe Price Short-Term Fund, a short-term bond fund (collectively, the Price Reserve Funds). The Price Reserve Funds are offered as short-term investment options to mutual funds, trusts, and other accounts managed by Price Associates or its affiliates and are not available for direct purchase by members of the public. Cash collateral from securities lending is invested in the T. Rowe Price Short-Term Fund. The Price Reserve Funds pay no investment management fees.
The fund may also invest in certain other T. Rowe Price funds (Price Funds) as a means of gaining efficient and cost-effective exposure to certain markets. The fund does not invest for the purpose of exercising management or control; however, investments by the fund may represent a significant portion of an underlying Price Fund’s net assets. Each underlying Price Fund is an open-end management investment company managed by Price Associates and is considered an affiliate of the fund. To ensure that the fund does not incur duplicate management fees (paid by the underlying Price Fund(s) and the fund), Price Associates has agreed to permanently waive a portion of its management fee charged to the fund in an amount sufficient to fully offset that portion of management fees paid by each underlying Price Fund related to the fund’s investment therein. Annual management fee rates and amounts waived related to investments in the underlying Price Fund(s) for the year ended December 31, 2020, are as follows:
Total management fee waived was allocated ratably in the amounts of $365,000, $9,000 and $83,000 for the Investor Class, Advisor Class, and I Class, respectively, for the year ended December 31, 2020.
As of December 31, 2020, T. Rowe Price Group, Inc., or its wholly owned subsidiaries owned 2,755,673 shares of the Investor Class, representing less than 1% of the Investor Class’s net assets and 2,454,834 shares of the I Class, representing less than 1% of the I Class’s net assets.
The fund may participate in securities purchase and sale transactions with other funds or accounts advised by Price Associates (cross trades), in accordance with procedures adopted by the fund’s Board and Securities and Exchange Commission rules, which require, among other things, that such purchase and sale cross trades be effected at the independent current market price of the security. During the year ended December 31, 2020, the aggregate value of purchases and sales cross trades with other funds or accounts advised by Price Associates was less than 1% of the fund’s net assets as of December 31, 2020.
Effective January 1, 2020, Price Associates has voluntarily agreed to reimburse the fund from its own resources on a monthly basis for the cost of investment research embedded in the cost of the fund’s securities trades. This agreement may be rescinded at any time. For the year ended December 31, 2020, this reimbursement amounted to $1,380,000, which is included in Net realized gain (loss) on Securities in the Statement of Operations.
NOTE 7 - OTHER MATTERS
Unpredictable events such as environmental or natural disasters, war, terrorism, pandemics, outbreaks of infectious diseases, and similar public health threats may significantly affect the economy and the markets and issuers in which a fund invests. Certain events may cause instability across global markets, including reduced liquidity and disruptions in trading markets, while some events may affect certain geographic regions, countries, sectors, and industries more significantly than others, and exacerbate other pre-existing political, social, and economic risks. During 2020, a novel strain of coronavirus (COVID-19) resulted in disruptions to global business activity and caused significant volatility and declines in global financial markets.
These types of events, such as the global pandemic caused by COVID-19, may also cause widespread fear and uncertainty, and result in, among other things: enhanced health screenings, quarantines, cancellations, and travel restrictions, including border closings; disruptions to business operations, supply chains and customer activity; exchange trading suspensions and closures, and overall reduced liquidity of securities, derivatives, and commodities trading markets; reductions in consumer demand and economic output; and significant challenges in healthcare service preparation and delivery. The fund could be negatively impacted if the value of a portfolio holding were harmed by such political or economic conditions or events. In addition, the operations of the fund, its investment advisers, and the fund’s service providers may be significantly impacted, or even temporarily halted, as a result of any impairment to their information technology and other operational systems, extensive employee illnesses or unavailability, government quarantine measures, and restrictions on travel or meetings and other factors related to public emergencies.
Governmental and quasi-governmental authorities and regulators have in the past responded to major economic disruptions with a variety of significant fiscal and monetary policy changes, including but not limited to, direct capital infusions into companies, new monetary programs, and dramatically lower interest rates. An unexpected or quick reversal of these policies, or the ineffectiveness of these policies, could negatively impact overall investor sentiment and further increase volatility in securities markets. The impact of this outbreak has adversely affected the economies of many nations and the entire global economy and may impact individual issuers and capital markets in ways that cannot be foreseen. Other infectious illness outbreaks that may arise in the future could have similar or other unforeseen effects. The duration of this outbreak or others and their effects cannot be determined with certainty.
REPORT OF INDEPENDENT REGISTERED PUBLIC ACCOUNTING FIRM
To the Board of Directors and Shareholders of T. Rowe Price Capital
Appreciation Fund, Inc.
Opinion on the Financial Statements
We have audited the accompanying statement of assets and liabilities, including the portfolio of investments, of T. Rowe Price Capital Appreciation Fund, Inc. (the “Fund”) as of December 31, 2020, the related statement of operations for the year ended December 31, 2020, the statement of changes in net assets for each of the two years in the period ended December 31, 2020, including the related notes, and the financial highlights for each of the five years in the period ended December 31, 2020 (collectively referred to as the “financial statements”). In our opinion, the financial statements present fairly, in all material respects, the financial position of the Fund as of December 31, 2020, the results of its operations for the year then ended, the changes in its net assets for each of the two years in the period ended December 31, 2020 and the financial highlights for each of the five years in the period ended December 31, 2020 in conformity with accounting principles generally accepted in the United States of America.
Basis for Opinion
These financial statements are the responsibility of the Fund’s management. Our responsibility is to express an opinion on the Fund’s financial statements based on our audits. We are a public accounting firm registered with the Public Company Accounting Oversight Board (United States) (PCAOB) and are required to be independent with respect to the Fund in accordance with the U.S. federal securities laws and the applicable rules and regulations of the Securities and Exchange Commission and the PCAOB.
We conducted our audits of these financial statements in accordance with the standards of the PCAOB. Those standards require that we plan and perform the audit to obtain reasonable assurance about whether the financial statements are free of material misstatement, whether due to error or fraud.
Our audits included performing procedures to assess the risks of material misstatement of the financial statements, whether due to error or fraud, and performing procedures that respond to those risks. Such procedures included examining, on a test basis, evidence regarding the amounts and disclosures in the financial statements. Our audits also included evaluating the accounting principles used and significant estimates made by management, as well as evaluating the overall presentation of the financial statements. Our procedures included confirmation of securities owned as of December 31, 2020 by correspondence with the custodian, transfer agent and brokers; when replies were not received from brokers, we performed other auditing procedures. We believe that our audits provide a reasonable basis for our opinion.
PricewaterhouseCoopers LLP
Baltimore, Maryland
February 17, 2021
We have served as the auditor of one or more investment companies in the T. Rowe Price group of investment companies since 1973.
TAX INFORMATION (UNAUDITED) FOR THE TAX YEAR ENDED 12/31/20
We are providing this information as required by the Internal Revenue Code. The amounts shown may differ from those elsewhere in this report because of differences between tax and financial reporting requirements.
The fund’s distributions to shareholders included:
| ■ | $570,606,000 from short-term capital gains, |
| | |
| ■ | $2,550,607,000 from long-term capital gains, subject to a long-term capital gains tax rate of not greater than 20%. |
For taxable non-corporate shareholders, $301,714,000 of the fund’s income represents qualified dividend income subject to a long-term capital gains tax rate of not greater than 20%.
For corporate shareholders, $281,008,000 of the fund’s income qualifies for the dividends received deduction.
For individuals and certain trusts and estates which are entitled to claim a deduction of up to 20% of their combined qualified real estate investment trust (REIT) dividends, $2,369,000 of the fund’s income qualifies as qualified real estate investment trust (REIT) dividends.
INFORMATION ON PROXY VOTING POLICIES, PROCEDURES, AND RECORDS
A description of the policies and procedures used by T. Rowe Price funds and portfolios to determine how to vote proxies relating to portfolio securities is available in each fund’s Statement of Additional Information. You may request this document by calling 1-800-225-5132 or by accessing the SEC’s website, sec.gov.
The description of our proxy voting policies and procedures is also available on our corporate website. To access it, please visit the following Web page:
https://www.troweprice.com/corporate/en/utility/policies.html
Scroll down to the section near the bottom of the page that says, “Proxy Voting Policies.” Click on the Proxy Voting Policies link in the shaded box.
Each fund’s most recent annual proxy voting record is available on our website and through the SEC’s website. To access it through T. Rowe Price, visit the website location shown above, and scroll down to the section near the bottom of the page that says, “Proxy Voting Records.” Click on the Proxy Voting Records link in the shaded box.
HOW TO OBTAIN QUARTERLY PORTFOLIO HOLDINGS
Effective for reporting periods on or after March 1, 2019, a fund, except a money market fund, files a complete schedule of portfolio holdings with the Securities and Exchange Commission (SEC) for the first and third quarters of each fiscal year as an exhibit to its reports on Form N-PORT. Prior to March 1, 2019, a fund, including a money market fund, filed a complete schedule of portfolio holdings with the SEC for the first and third quarters of each fiscal year on Form N-Q. A money market fund files detailed month-end portfolio holdings information on Form N-MFP with the SEC each month and posts a complete schedule of portfolio holdings on its website (troweprice.com) as of each month-end for the previous six months. A fund’s Forms N-PORT, N-MFP, and N-Q are available electronically on the SEC’s website (sec.gov).
ABOUT THE FUND’S DIRECTORS AND OFFICERS
Your fund is overseen by a Board of Directors (Board) that meets regularly to review a wide variety of matters affecting or potentially affecting the fund, including performance, investment programs, compliance matters, advisory fees and expenses, service providers, and business and regulatory affairs. The Board elects the fund’s officers, who are listed in the final table. At least 75% of the Board’s members are considered to be independent, i.e., not “interested persons” as defined in Section 2(a)(19) of the 1940 Act, of the Boards of T. Rowe Price Associates, Inc. (T. Rowe Price), and its affiliates; “interested” directors and officers are employees of T. Rowe Price. The business address of each director and officer is 100 East Pratt Street, Baltimore, Maryland 21202. The Statement of Additional Information includes additional information about the fund directors and is available without charge by calling a T. Rowe Price representative at 1-800-638-5660.
| INDEPENDENT DIRECTORS(a) |
| |
Name
(Year of Birth)
Year Elected
[Number of T. Rowe Price
Portfolios Overseen] | | Principal Occupation(s) and Directorships of Public Companies and Other Investment Companies During the Past Five Years |
| | | |
Teresa Bryce Bazemore
(1959)
2018
[190] | | President, Radian Guaranty (2008 to 2017); Chief Executive Officer, Bazemore Consulting LLC (2018 to present); Director, Chimera Investment Corporation (2017 to present); Director, First Industrial Realty Trust (2020 to present); Director, Federal Home Loan Bank of Pittsburgh (2017 to 2019) |
| | | |
Ronald J. Daniels
(1959)
2018
[190] | | President, The Johns Hopkins University(b) and Professor, Political Science Department, The Johns Hopkins University (2009 to present); Director, Lyndhurst Holdings (2015 to present); Director, BridgeBio Pharma, Inc. (2020 to present) |
| | | |
Bruce W. Duncan
(1951)
2013
[190] | | President, Chief Executive Officer, and Director, CyrusOne, Inc. (2020 to present); Chief Executive Officer and Director (2009 to 2016), Chairman of the Board (2016 to 2020), and President (2009 to 2016), First Industrial Realty Trust, owner and operator of industrial properties; Chairman of the Board (2005 to 2016) and Director (1999 to 2016), Starwood Hotels & Resorts, a hotel and leisure company; Member, Investment Company Institute Board of Governors (2017 to 2019); Member, Independent Directors Council Governing Board (2017 to 2019); Senior Advisor, KKR (2018 to present); Director, Boston Properties (2016 to present); Director, Marriott International, Inc. (2016 to 2020) |
| | | |
Robert J. Gerrard, Jr.
(1952)
2012
[190] | | Advisory Board Member, Pipeline Crisis/Winning Strategies, a collaborative working to improve opportunities for young African Americans (1997 to 2016); Chairman of the Board, all funds (since July 2018) |
| | | |
Paul F. McBride
(1956)
2013
[190] | | Advisory Board Member, Vizzia Technologies (2015 to present); Board Member, Dunbar Armored (2012 to 2018) |
| | | |
Cecilia E. Rouse, Ph.D.
(1963)
2012
[190] | | Dean, Princeton School of Public and International Affairs (2012 to present); Professor and Researcher, Princeton University (1992 to present); Director of Education Studies Committee, MDRC, a nonprofit education and social policy research organization (2011 to 2020); Member, National Academy of Education (2010 to present); Board Member, National Bureau of Economic Research (2011 to present); Board Member of the Council on Foreign Relations (2018 to present); Board Member, The Pennington School (2017 to present); Board Member, the University of Rhode Island (2020 to present); Chair of Committee on the Status of Minority Groups in the Economic Profession of the American Economic Association (2012 to 2018); Vice President (2015 to 2016) and Board Member (2018 to present), American Economic Association |
| | | |
John G. Schreiber
(1946)
2001
[190] | | Owner/President, Centaur Capital Partners, Inc., a real estate investment company (1991 to present); Cofounder, Partner, and Cochairman of the Investment Committee, Blackstone Real Estate Advisors, L.P. (1992 to 2015); Director, Blackstone Mortgage Trust, a real estate finance company (2012 to 2016); Director and Chairman of the Board, Brixmor Property Group, Inc. (2013 to present); Director, Hilton Worldwide (2007 to present); Director, Hudson Pacific Properties (2014 to 2016); Director, Invitation Homes (2014 to 2017); Director, JMB Realty Corporation (1980 to present) |
| | | |
| (a)All information about the independent directors was current as of December 31, 2019, unless otherwise indicated, except for the number of portfolios overseen, which is current as of the date of this report. |
| (b)William J. Stromberg, president and chief executive officer of T. Rowe Price Group, Inc., the parent company of the Price Funds’ investment advisor, has served on the Board of Trustees of Johns Hopkins University since 2014. |
| INTERESTED DIRECTORS(a) |
| |
Name
(Year of Birth)
Year Elected
[Number of T. Rowe Price
Portfolios Overseen] | | Principal Occupation(s) and Directorships of Public Companies and Other Investment Companies During the Past Five Years |
| | | |
David Oestreicher
(1967)
2018
[190] | | General Counsel, Vice President, and Secretary, T. Rowe Price Group, Inc.; Chairman of the Board, Chief Executive Officer, President, and Secretary, T. Rowe Price Trust Company; Director, Vice President, and Secretary, T. Rowe Price, T. Rowe Price Investment Services, Inc., T. Rowe Price Retirement Plan Services, Inc., and T. Rowe Price Services, Inc.; Vice President and Secretary, T. Rowe Price International; Vice President, T. Rowe Price Hong Kong (Price Hong Kong), T. Rowe Price Japan (Price Japan), and T. Rowe Price Singapore (Price Singapore); Principal Executive Officer and Executive Vice President, all funds |
| | | |
Robert W. Sharps, CFA, CPA
(1971)
2017
[190] | | Director and Vice President, T. Rowe Price; Vice President, T. Rowe Price Group, Inc., and T. Rowe Price Trust Company |
| | | |
| (a)All information about the interested directors was current as of December 31, 2019, unless otherwise indicated, except for the number of portfolios overseen, which is current as of the date of this report. |
| OFFICERS |
| |
Name (Year of Birth)
Position Held With Capital
Appreciation Fund | | Principal Occupation(s) |
| | | |
Darrell N. Braman (1963)
Vice President | | Vice President, Price Hong Kong, Price Singapore, T. Rowe Price, T. Rowe Price Group, Inc., T. Rowe Price International, T. Rowe Price Investment Services, Inc., and T. Rowe Price Services, Inc. |
| | | |
Paul Y. Cho (1986)
Vice President | | Vice President, T. Rowe Price and T. Rowe Price Group, Inc. |
| | | |
Shawn T. Driscoll (1975)
Vice President | | Vice President, T. Rowe Price, T. Rowe Price Group, Inc., and T. Rowe Price Trust Company |
| | | |
Alan S. Dupski, CPA (1982)
Principal Financial Officer, Vice President,
and Treasurer | | Vice President, T. Rowe Price, T. Rowe Price Group, Inc., and T. Rowe Price Trust Company |
| | | |
Jon M. Friar (1982)
Vice President | | Vice President, T. Rowe Price and T. Rowe Price Group, Inc. |
| | | |
John R. Gilner (1961)
Chief Compliance Officer | | Chief Compliance Officer and Vice President, T. Rowe Price; Vice President, T. Rowe Price Group, Inc., and T. Rowe Price Investment Services, Inc. |
| | | |
David R. Giroux, CFA (1975)
President | | Vice President, T. Rowe Price, T. Rowe Price Group, Inc., and T. Rowe Price Trust Company |
| | | |
Gary J. Greb (1961)
Vice President | | Vice President, T. Rowe Price, T. Rowe Price International, and T. Rowe Price Trust Company |
| | | |
Paul D. Greene II (1978)
Vice President | | Vice President, T. Rowe Price and T. Rowe Price Group, Inc. |
| | | |
Vidya Kadiyam (1980)
Vice President | | Vice President, T. Rowe Price and T. Rowe Price Group, Inc. |
| | | |
Steven D. Krichbaum (1977)
Vice President | | Vice President, T. Rowe Price and T. Rowe Price Group, Inc. |
| | | |
Paul J. Krug, CPA (1964)
Vice President | | Vice President, T. Rowe Price, T. Rowe Price Group, Inc., and T. Rowe Price Trust Company |
| | | |
Paul M. Massaro, CFA (1975)
Vice President | | Vice President, T. Rowe Price, T. Rowe Price Group, Inc., and T. Rowe Price Trust Company |
| | | |
Fran M. Pollack-Matz (1961)
Vice President and Secretary | | Vice President, T. Rowe Price and T. Rowe Price Group, Inc. |
| | | |
Adam Poussard (1984)
Vice President | | Vice President, T. Rowe Price and T. Rowe Price Group, Inc. |
| | | |
Vivek Rajeswaran (1985)
Vice President | | Vice President, T. Rowe Price and T. Rowe Price Group, Inc. |
| | | |
Shannon H. Rauser (1987)
Assistant Secretary | | Assistant Vice President, T. Rowe Price |
| | | |
Farris G. Shuggi (1984)
Vice President | | Vice President, T. Rowe Price and T. Rowe Price Group, Inc. |
| | | |
Brian Solomon, CFA (1986)
Vice President | | Vice President, T. Rowe Price and T. Rowe Price Group, Inc. |
| | | |
Gabriel Solomon (1977)
Vice President | | Vice President, T. Rowe Price and T. Rowe Price Group, Inc. |
| | | |
Chen Tian (1993)
Vice President | | Employee, T. Rowe Price |
| | | |
Megan Warren (1968)
Vice President | | Vice President, T. Rowe Price, T. Rowe Price Group, Inc., T. Rowe Price Retirement Plan Services, Inc., T. Rowe Price Services, Inc., and T. Rowe Price Trust Company; formerly, Executive Director, JPMorgan Chase (to 2017) |
| | | |
Tamara P. Wiggs (1979)
Vice President | | Vice President, T. Rowe Price and T. Rowe Price Group, Inc. |
| | | |
Ashley R. Woodruff, CFA (1979)
Vice President | | Vice President, T. Rowe Price and T. Rowe Price Group, Inc. |
Unless otherwise noted, officers have been employees of T. Rowe Price or T. Rowe Price International for at least 5 years.
Item 1. (b) Notice pursuant to Rule 30e-3.
Not applicable.
Item 2. Code of Ethics.
The registrant has adopted a code of ethics, as defined in Item 2 of Form N-CSR, applicable to its principal executive officer, principal financial officer, principal accounting officer or controller, or persons performing similar functions. A copy of this code of ethics is filed as an exhibit to this Form N-CSR. No substantive amendments were approved or waivers were granted to this code of ethics during the period covered by this report.
Item 3. Audit Committee Financial Expert.
The registrant’s Board of Directors/Trustees has determined that Mr. Bruce W. Duncan qualifies as an audit committee financial expert, as defined in Item 3 of Form N-CSR. Mr. Duncan is considered independent for purposes of Item 3 of Form N-CSR.
Item 4. Principal Accountant Fees and Services.
(a) – (d) Aggregate fees billed for the last two fiscal years for professional services rendered to, or on behalf of, the registrant by the registrant’s principal accountant were as follows:
Audit fees include amounts related to the audit of the registrant’s annual financial statements and services normally provided by the accountant in connection with statutory and regulatory filings. Audit-related fees include amounts reasonably related to the performance of the audit of the registrant’s financial statements and specifically include the issuance of a report on internal controls and, if applicable, agreed-upon procedures related to fund acquisitions. Tax fees include amounts related to services for tax compliance, tax planning, and tax advice. The nature of these services specifically includes the review of distribution calculations and the preparation of Federal, state, and excise tax returns. All other fees include the registrant’s pro-rata share of amounts for agreed-upon procedures in conjunction with service contract approvals by the registrant’s Board of Directors/Trustees.
(e)(1) The registrant’s audit committee has adopted a policy whereby audit and non-audit services performed by the registrant’s principal accountant for the registrant, its investment adviser, and any entity controlling, controlled by, or under common control with the investment adviser that provides ongoing services to the registrant require pre-approval in advance at regularly scheduled audit committee meetings. If such a service is required between regularly scheduled audit committee meetings, pre-approval may be authorized by one audit committee member with ratification at the next scheduled audit committee meeting. Waiver of pre-approval for audit or non-audit services requiring fees of a de minimis amount is not permitted.
(2) No services included in (b) – (d) above were approved pursuant to paragraph (c)(7)(i)(C) of Rule 2-01 of Regulation S-X.
(f) Less than 50 percent of the hours expended on the principal accountant’s engagement to audit the registrant’s financial statements for the most recent fiscal year were attributed to work performed by persons other than the principal accountant’s full-time, permanent employees.
(g) The aggregate fees billed for the most recent fiscal year and the preceding fiscal year by the registrant’s principal accountant for non-audit services rendered to the registrant, its investment adviser, and any entity controlling, controlled by, or under common control with the investment adviser that provides ongoing services to the registrant were $3,781,000 and $3,227,000, respectively.
(h) All non-audit services rendered in (g) above were pre-approved by the registrant’s audit committee. Accordingly, these services were considered by the registrant’s audit committee in maintaining the principal accountant’s independence.
Item 5. Audit Committee of Listed Registrants.
Not applicable.
Item 6. Investments.
(a) Not applicable. The complete schedule of investments is included in Item 1 of this Form N-CSR.
(b) Not applicable.
Item 7. Disclosure of Proxy Voting Policies and Procedures for Closed-End Management Investment Companies.
Not applicable.
Item 8. Portfolio Managers of Closed-End Management Investment Companies.
Not applicable.
Item 9. Purchases of Equity Securities by Closed-End Management Investment Company and Affiliated Purchasers.
Not applicable.
Item 10. Submission of Matters to a Vote of Security Holders.
There has been no change to the procedures by which shareholders may recommend nominees to the registrant’s board of directors.
Item 11. Controls and Procedures.
(a) The registrant’s principal executive officer and principal financial officer have evaluated the registrant’s disclosure controls and procedures within 90 days of this filing and have concluded that the registrant’s disclosure controls and procedures were effective, as of that date, in ensuring that information required to be disclosed by the registrant in this Form N-CSR was recorded, processed, summarized, and reported timely.
(b) The registrant’s principal executive officer and principal financial officer are aware of no change in the registrant’s internal control over financial reporting that occurred during the period covered by this report that has materially affected, or is reasonably likely to materially affect, the registrant’s internal control over financial reporting.
Item 12. Disclosure of Securities Lending Activities for Closed-End Management Investment Companies.
Not applicable.
Item 13. Exhibits.
(a)(1) The registrant’s code of ethics pursuant to Item 2 of Form N-CSR is attached.
(2) Separate certifications by the registrant's principal executive officer and principal financial officer, pursuant to Section 302 of the Sarbanes-Oxley Act of 2002 and required by Rule 30a-2(a) under the Investment Company Act of 1940, are attached.
(3) Written solicitation to repurchase securities issued by closed-end companies: not applicable.
(b) A certification by the registrant's principal executive officer and principal financial officer, pursuant to Section 906 of the Sarbanes-Oxley Act of 2002 and required by Rule 30a-2(b) under the Investment Company Act of 1940, is attached.
SIGNATURES
Pursuant to the requirements of the Securities Exchange Act of 1934 and the Investment Company Act of 1940, the registrant has duly caused this report to be signed on its behalf by the undersigned, thereunto duly authorized.
T. Rowe Price Capital Appreciation Fund, Inc.
| By | | /s/ David Oestreicher |
| | | David Oestreicher |
| | | Principal Executive Officer |
| |
| Date | | February 17, 2021 | | | | |
Pursuant to the requirements of the Securities Exchange Act of 1934 and the Investment Company Act of 1940, this report has been signed below by the following persons on behalf of the registrant and in the capacities and on the dates indicated.
| By | | /s/ David Oestreicher |
| | | David Oestreicher |
| | | Principal Executive Officer |
| |
| Date | | February 17, 2021 | | | | |
| |
| |
| By | | /s/ Alan S. Dupski |
| | | Alan S. Dupski |
| | | Principal Financial Officer |
| |
| Date | | February 17, 2021 | | | | |