UNITED STATES
SECURITIES AND EXCHANGE COMMISSION
Washington, D.C. 20549
FORM N-CSR
CERTIFIED SHAREHOLDER REPORT OF REGISTERED
MANAGEMENT INVESTMENT COMPANIES
Investment Company Act File Number: 811-04519
T. Rowe Price Capital Appreciation Fund, Inc.
(Exact name of registrant as specified in charter)
100 East Pratt Street, Baltimore, MD 21202
(Address of principal executive offices)
David Oestreicher
100 East Pratt Street, Baltimore, MD 21202
(Name and address of agent for service)
Registrant’s telephone number, including area code: (410) 345-2000
Date of fiscal year end: December 31
Date of reporting period: December 31, 2021
Item 1. Reports to Shareholders
(a) Report pursuant to Rule 30e-1.
| Capital Appreciation Fund | December 31, 2021 |
| PRWCX | Investor Class |
| PACLX | Advisor Class |
| TRAIX | I Class |
| T. ROWE PRICE CAPITAL APPRECIATION FUND |
|
HIGHLIGHTS
| ■ | Earnings growth propelled stock market returns in 2021 but, in our view, the factors that have driven strength in earnings are unsustainable. |
| ■ | Your fund generated strong absolute returns but lagged the all-equity S&P 500 Index. The fund continued to deliver strong risk-adjusted returns, generating 65% of the S&P 500’s return while taking on just 58% of the index’s risk. |
| ■ | Investments in health care were the largest contributor to absolute and relative returns. On the other hand, our investments in information technology, particularly in payment processing companies, were a headwind to performance. |
| ■ | The last two years have been a difficult environment for our investment style with the market led at times by one of two extremes: the most speculative parts of growth or the lowest-quality, most secularly challenged names. We think the investment environment is poised to change rather dramatically and that our focus on undervalued and out-of-favor market segments will prove beneficial. |

Log in to your account at troweprice.com for more information.
* Certain mutual fund accounts that are assessed an annual account service fee can also save money by switching to e-delivery.
Management’s Discussion of Fund Performance
Fellow Shareholders
The year 2021 marked the third consecutive year of above-average stock market returns. The S&P 500 is now up around 100% over the last three years. The principal driver of the strong returns in 2021 comes down to earnings growth. Coming out of the last three recessions, it took three to five years for S&P 500 earnings to surpass their prior peak. Coming out of the pandemic-induced recession of 2020, it took only one year. Earnings in 2021 were so strong that they not only surpassed the prior peak of $164 but, when the dust settles, we believe they will likely be 25%+ higher than the prior peak. Why have earnings been so strong?
(1) Stimulus spending: The U.S. pumped $5.3 trillion and counting of fiscal stimulus into the economy, of which the majority was direct payments to individuals. These payments have facilitated an unprecedented demand for consumer durable goods such as computers, exercise equipment, housing, appliances, air conditioning equipment, used cars, and home improvement goods. Consumer durable goods consumption rose at one point to 30% above normal and remains 20% greater than pre-pandemic levels. While the U.S. economy is driven more by services than goods, the opposite is true of the S&P 500, and this massive increase in demand for goods has driven strong topline results for companies and even stronger profit growth.
(2) Lower pandemic expenses: Many companies’ travel, entertainment, and advertising costs dropped during the pandemic, and this has aided margins.
(3) No need to discount: In an environment of significant excess demand and supply chain-induced shortages, many firms don’t have to discount as much as they normally do. Lower discounting drives higher profit margins and higher absolute profits. When you go to a car dealership and there are 20 cars on the lot instead of 100, your ability to get a good deal is very limited.
(4) Commodity boom: Higher oil, materials, natural gas, and chemical prices have massively increased profits in some of the most cyclical industries.
(5) Reserve releases: In 2020, banks took massive reserve additions, which negatively impacted their profits as they anticipated a long, painful economic downturn. In 2021, when the downturn proved shorter and less painful than expected, banks reversed these reserves and this aided profits in 2021.
As we will discuss in the outlook section, the question here comes down to sustainability. While much of the stimulus was paid out in 2020 and 2021, excess savings should continue to support elevated consumer spending at least through 2022. The challenge is what happens in 2023 and 2024 as this excess stimulus is completely washed out of the economy. Moreover, as travel, entertainment, and advertising expenses come back into firms’ income statements, as COVID-impacted supply chains improve (which will drive discounting back to normal), as energy production increases (which should lower oil prices), and as bank reserve releases dissipate, the outlook for S&P 500 profit growth in 2022–2024 does not appear positive. At a minimum, we expect S&P 500 profit growth to be well below the normal 7-8%, and a flat or even down year is a reasonable possibility, especially in 2023.
The other major macro event of 2021 was the rise of inflation. Inflation reached 40-year highs in the last couple of months of 2021. For most of the last decade prior to the pandemic, developed market central banks pursued a strategy of easy money that drove short-term rates to near zero or, in some countries, negative. They pursued quantitative easing that effectively meant printing money to buy government bonds to keep yields artificially low. These strategies failed across the board to achieve the objective of driving inflation sustainably at or slightly above 2%. While they did create inflation in financial assets, this inflation failed to bleed into the real economy as its benefits accrued primarily to the highest-income investors who tend to spend only a small amount of their wealth gains.
However, when $5.3 billion of government stimulus spending was plowed into the real economy, this could and, in fact, did drive higher inflation. However, it is not as simple as that. Inflation was always going to be higher in 2021 due to easy comparisons with 2020 and the massive stimulus payments from 2020–2021, but there were also other factors that helped drive inflation to the excessive levels we are currently experiencing. First, the global supply chain was challenged by COVID and excess demand. COVID-induced supply chain difficulties in Asia reduced the supply of critical components for goods as factories were shut down or their output was curtailed during COVID spikes. While this was important, it should be pointed out that the supply chain issues would have been much more manageable if demand had not also spiked to 20% above normal levels. Second, there are 3.5 million people in the U.S. who were working pre-COVID who have yet to return to the labor force. There are multiple reasons these people have not returned: COVID, difficulties finding child care, higher government benefits (including expanded child tax credits), and decisions to retire. Regardless of the reasons, the decline in workers has driven a supply/demand imbalance in the labor force, especially for traditionally lower-paid positions in the service industry. As a result, employers are consistently raising wages to find employees and they are passing these higher wages to the end consumer by raising prices for goods and services.
We believe that most of the inflationary pressures are indeed transitory and that inflation should decline materially as we exit 2022, especially as the economy slows, as the impact of COVID on supply chains wanes, and as the excess stimulus is either consumed or invested. However, we do not expect inflation to return to pre-pandemic levels as the shift in low-end supply/demand for labor seems more structural. As a result, we expect inflation to be modestly higher going forward, but again, nowhere near what we are experiencing currently.
The last macro variable to touch on is COVID. Here we are more optimistic. Global vaccination rates are rising, and while this will not necessarily stop transmission, it should materially impact the most important variables: hospitalization, ICU utilization, and death rates. In addition, new anti-viral medications from Pfizer and Merck should significantly reduce the risk of hospitalization and death, especially in the second half of 2022. Last, we are hopeful that the omicron variant, which is much more transmissible but also materially less severe, should provide a strong wave of immunity against future severe disease. While no one can predict what future variants may emerge, history demonstrates that viruses tend to mutate to become more transmissible and less severe over time. This is also consistent with the history of pandemics in the 20th century, which have tended to last 18 to 24 months. While COVID is unlikely to ever be behind us, we expect death rates and hospitalization rates will decline dramatically in the years ahead.
Before we discuss fund performance, I would like to review the three goals of the Capital Appreciation Fund:
(1) Generate strong risk-adjusted returns annually
(2) Preserve shareholder capital over the intermediate term (i.e., three years)
(3) Generate equity-like returns with less risk than that of the overall market over a full market cycle (i.e., normally five years)
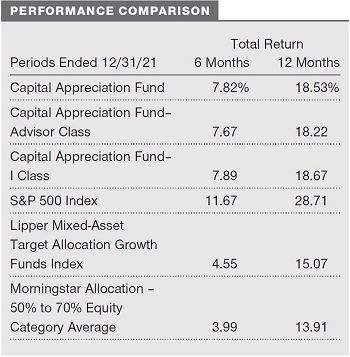
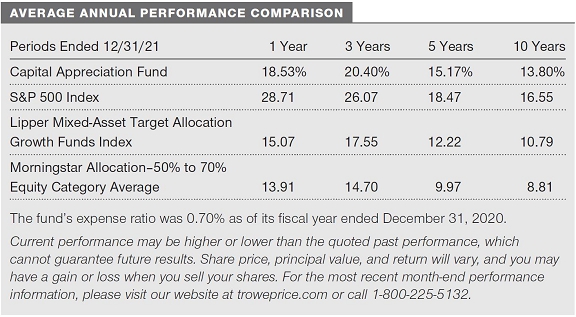
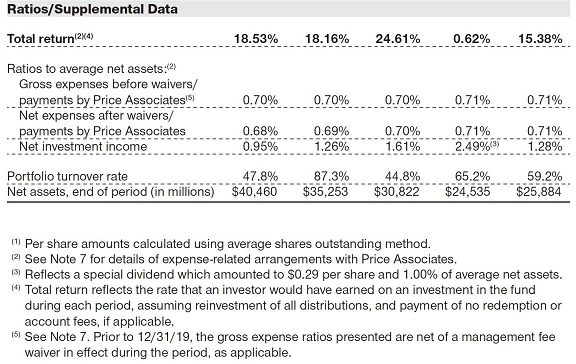
We are pleased to report that the Capital Appreciation Fund generated solid absolute and risk-adjusted returns in 2021. Your fund generated an 18.5% absolute return relative to the S&P 500’s 28.7% increase. (The performance of the Advisor and I Class shares will vary due to different fee structures.)
Your fund outperformed the market on a risk-adjusted basis over this period. We captured 65% of the S&P 500’s return while taking on only 58% of the market’s risk. We arrive at this risk number by comparing the standard deviation of the S&P 500 (13.07) with that of the fund (7.53) for the 12-month period. Standard deviation indicates the volatility of a portfolio’s total return as measured against its mean performance. In general, the higher the standard deviation, the greater the risk.
Using a more academic measure of the fund’s risk-adjusted return, your fund produced a Sharpe ratio of 2.45 versus 2.19 for the S&P 500. The Sharpe ratio measures a portfolio’s return above the risk-free Treasury rate (excess return), divided by the amount of risk taken (measured by standard deviation). The larger the Sharpe ratio, the better the portfolio’s risk-adjusted return.
As for our second goal—capital preservation over the intermediate term—your fund generated a 74.52% cumulative return over the last three years.
As for our final goal—equity-like returns with less risk than the market over a full market cycle—your fund generated a 102.6% cumulative return over the last five years versus 133.4% for the S&P 500. Based on annualized returns of 15.17% for your fund versus 18.47% for the S&P 500, your fund generated 82% of the market’s return over the last five years while taking on 66% of the market’s risk. While market and economic cycles have historically lasted around five years on average, we also tend to think about a full market cycle encompassing at least one ugly return year. While 2018 S&P 500 returns were negative, we would not describe 2018 as an ugly year within a historical construct. As your fund is not a pure equity fund, it would be very difficult to match the equity market’s return over any period in which we did not have at least one major equity market correction. However, if we extend the analysis to encompass 2008 and measure the last 13 years of fund performance, we come very close to accomplishing this very difficult last goal by delivering 97% of the market’s return while taking only 69% of the market’s risk.
In addition, our equities modestly underperformed the S&P 500 by 57 basis points (28.14% versus 28.71%) in 2021. Equity market returns in 2021 were driven by a combination of the most speculative, lowest-quality, and expensive stocks. However, over the last 3-, 5-, and 10-year periods, our equities outperformed the S&P 500 by an average of 350, 396, and 451 basis points, annualized, respectively. While our equities have substantially outperformed the market, our equities have also been less risky (from a beta perspective) than the market. Our fixed income investments outperformed the Bloomberg U.S. Aggregate Bond Index by 576 basis points (4.22% versus -1.54%) in 2021 as we maintained a very low duration fixed income portfolio in an environment of rising interest rates.
For the 1-, 3-, 5-, and 10-year periods ended December 31, 2021, we outperformed our Lipper and Morningstar peers over every period, and in 2021 we were ranked in the top decile in both Lipper and Morningstar. Over the 3-, 5- and 10-year periods, we were in the 3rd percentile or better for both peer groupings. (Based on cumulative total return, the Capital Appreciation Fund ranked 34 of 461, 10 of 433, 5 of 404, and 2 of 298 funds in the Lipper mixed-asset target allocation growth funds universe for the 1-, 3-, 5-, and 10-year periods ended December 31, 2021, respectively. Results may vary for other periods. Past performance cannot guarantee future results.)
However, let us reiterate that we do not manage your fund to beat these benchmarks. The Capital Appreciation Fund has very different objectives than most of its benchmark peers. It is a unique fund with a clear focus on strong risk-adjusted returns, intermediate-term capital preservation, and long-term capital appreciation that does not fit neatly into any current benchmark.
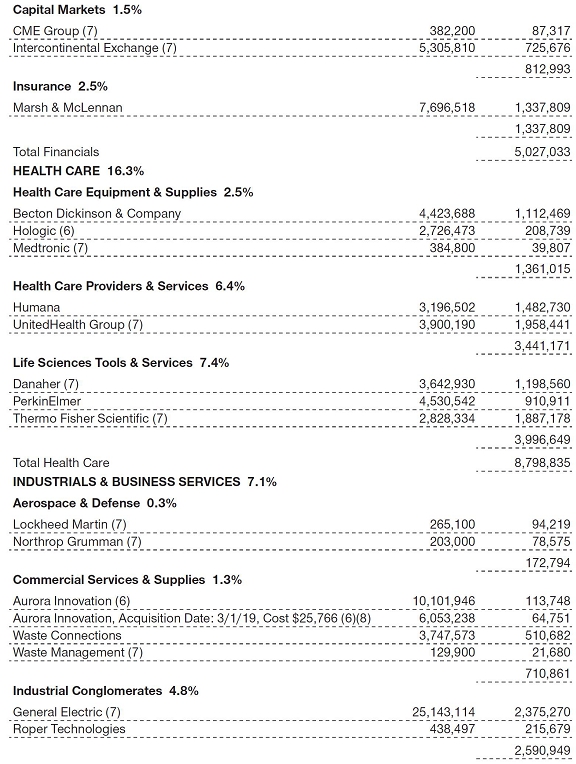
Within our equity sleeve, our health care investments were the largest contributor to absolute and relative returns. While the health care sector trailed the S&P 500 in 2021, our health care investments were up 42.6%. Danaher was up 48.6% as its core business accelerated organically into the high single digits to low double digits. We believe Danaher is now a sustainable high-single-digit organic growth company, up from the low- to mid-single digits three to four years ago. In addition, Danaher benefited from strong demand for its Cepheid COVID tests and its highly engineered bioproduction components that help make COVID vaccines possible. While we expect COVID-related revenues to decline from 2022 to 2024, the strength of Danaher’s core business, we believe its strong balance sheet, and its excellent capital allocation position the company for continued success over the next five-plus years. Thermo Fisher Scientific was up 43.5% as it benefited from many of the same trends that benefited Danaher. However, Thermo Fisher Scientific also announced a large, highly accretive, and very reasonably priced acquisition of PPD, a leading clinical research organization. Thermo Fisher Scientific’s capital allocation prowess over the last decade is arguably better than that of any other large-cap company. This consistent capital allocation positions Thermo Fisher Scientific to likely continue to outperform in the years ahead. UnitedHealth Group shares rose 45.2% in 2021 as the company successfully navigated a difficult environment in which many of its peers struggled operationally. UnitedHealth Group’s business continues to mix toward higher growth, less cyclical, and less risky businesses such as Optum and Medicare Advantage.
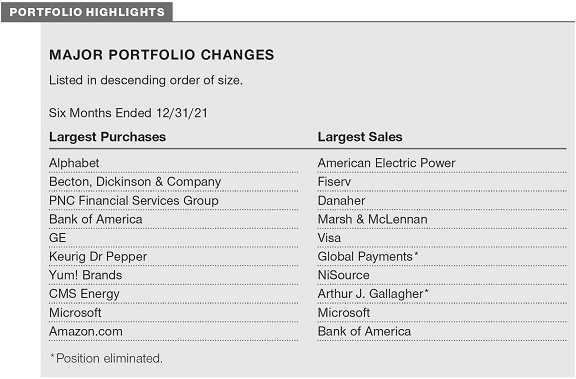
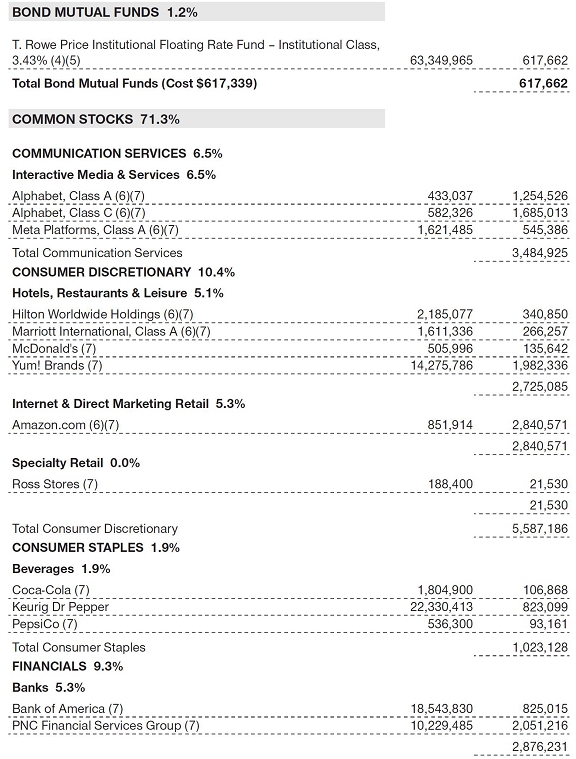
The second largest contributor to absolute and relative returns was the communication services sector. Alphabet, the parent company of Google, was up 65.3% in 2021 but still appears reasonably valued. Alphabet benefited from a strong recovery in advertising at core Google and at YouTube. Margins improved. Capital allocation also continues to improve with increased share repurchase. In addition, increased disclosure about Google’s cloud business losses helped to facilitate a stronger sum-of-the-parts argument. Alphabet continues to be a large holding and even though we expect the topline to decelerate and margins to decline in 2022, the valuation remains compelling and the sum-of-the-parts discount is simply too high.
The third largest contributor to absolute and relative returns was the financials sector. Marsh & McLennan shares were up 50.8% in 2021 as organic growth accelerated, margins expanded, and EPS surpassed expectations. Marsh benefited from a strong property and casualty pricing environment, disruptions at two of its peers as they tried unsuccessfully to merge, and a recovery in the Mercer and Oliver Wyman subsidiaries. Maybe most importantly, Marsh took advantage of the disruption at its peers to materially increase hiring in 2021, which should benefit organic growth in 2022 and 2023. While we love Marsh & McLennan long term, we have pulled back our exposure as the valuation multiple has expanded. Our large investment in banks in the second half of 2020 also continued to pay dividends in 2021, with PNC and Bank of America generating strong returns as the market flocked to stocks that benefit from rising interest rates. When we bought PNC and Bank of America, no one was concerned about inflation or the possibility that the Fed would raise rates. When we built our models we thought we could generate very strong returns even if the Fed did not raise rates through 2025. Now with both stocks having doubled from their fall 2020 lows and the market becoming extremely focused on inflation, the relative attractiveness of banks has diminished and we have brought our exposures down here.

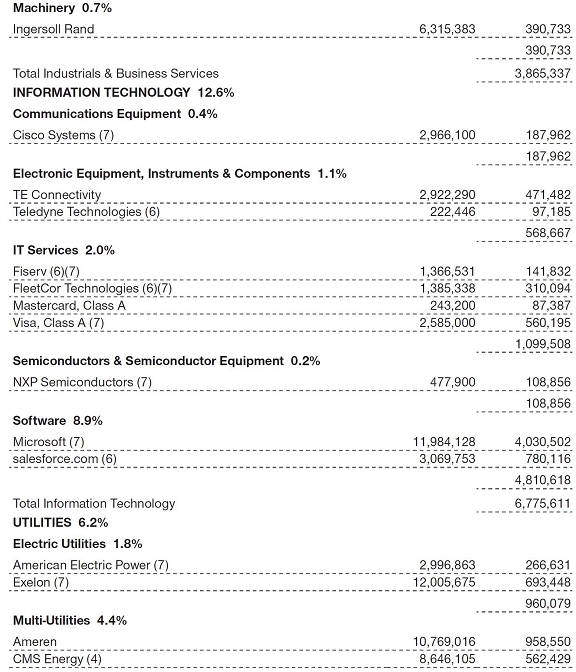
The one sector where we really struggled on a relative basis in 2021 was in information technology. Our payments companies—Fiserv, Fleetcor Technologies, Global Payments, and Visa—saw their valuation multiples compress due to perceived secular pressure from fast-growing competitors. In addition, Apple’s stock outperformed the market despite what should be a more difficult FY22 outlook, as the market became increasingly excited about its metaverse and Apple car optionality. In addition, high-multiple growth stocks such as NVIDIA and Intuit generated very strong returns. This sector has been a major disappointment for our team and we are not standing still. We have pared our exposure to the payments companies and done extensive deep dives on many of the largest names we don’t own in this sector. We expect to do better here going forward.
Portfolio Outlook
The market backdrop is not great. Valuations, even adjusting for an improving market mix, are high with the S&P 500 trading at more than 21x 2022 earnings. However, as discussed earlier, the more concerning multiyear risk is really around earnings. Earnings are probably 10%+ above where they would have been if we had never experienced a pandemic, and some of the most cyclical parts of the market are closer to peak earnings than trough earnings. In addition, we have a Federal Reserve that has been too accommodating on monetary policy and needs to raise rates aggressively in 2022. The combination of below-trend earnings growth, slowing economic growth, and high valuations presents a challenging setup for the market.
While inflation is high, we think many of the underlying drivers of this elevated inflation are not sustainable. Consumer durable goods are normally deflationary but have recently been rising into the high single digits to the low double digits, fueled by 60% price increases in used cars, 10-15% increases in new cars, and 30% increases in appliances. In these supply-constrained sectors that are facing excessive demand, we expect supply to improve as COVID becomes more endemic and demand to fall from record levels as stimulus spending dries up. The combination of these factors should put downward pressure on consumer durable prices in the second half of 2022 and into 2023. High oil prices should prove largely transitory as rig counts in North America continue to rise, which should increase supply at the same time that demand is likely to slow in the second half of 2022 and into 2023.

As you know, we are not economists and don’t invest on the basis of our macroeconomic forecasts. However, when the market becomes absolutely convinced a certain macroeconomic scenario will play out, we often take the other side of the bet as the risk/reward can become heavily skewed in our favor. We took advantage of these situations in 2013 and 2018 to buy bonds when the market was convinced that rates were going to go up. We bought equities in the middle of the pandemic as we thought vaccines would work and valuations were attractive. We bought banks in the second half of 2020 when no one was talking about inflation. We believe the key to creating value in investing is not to focus on what the market is focused on today, but to look forward to what the market will be focused on six to 12 months from now. We think the investment environment is poised to change rather dramatically from one of above-trend GDP growth, high inflation, and strong earnings growth to one in which GDP growth is more muted, earnings growth slows to below long-term trend, and inflation rates come down. That latter environment is one in which we expect our stocks to do exceedingly well. The last two years have been a difficult environment for our investment style, with the market led by one of two extremes: the most speculative parts of growth or the lowest-quality, most secularly challenged names. Capital Appreciation thrives in the middle of those two extremes, where the best risk-adjusted returns in the market continue to be. We continue to tilt the portfolio toward out-of-favor GARP stocks and select out-of-favor growth stocks, while at the same time increasing our focus on protecting against a market pullback given elevated valuations, elevated earnings, and elevated sentiment.
With regard to fixed income, we have yet to purchase any Treasuries and have yet to add to duration in the portfolio. However, if rates continue to rise, we may start adding duration to the fixed income portfolio. Treasuries are the one asset class that has consistently appreciated in value during market downturns and we believe that owning Treasuries can help to protect against a decline in the equity sleeve of the portfolio. We continue to see good value in leveraged loans, which are floating rate and top of the capital structure. We seek generally good businesses that are run with higher levels of leverage but in which the enterprise value is so high that the risk of default or a loss is quite low.
IN CLOSING
We would like to thank all the analysts, associate analysts, quantitative analysts, and members of our team (Mike Signore, Chen Tian, Nikhil Shah, Vivek Rajeswaran, Jared Duda, and Brian Solomon) for their assistance in 2021. As you can see, we added one additional member to the CAF team in 2021. Jared Duda joined us in mid-2021 as an associate analyst and he is providing valuable support and assistance to all members of the CAF team. In addition, we are proud to announce that Chen Tian has been named Senior Leader of Capital Appreciation Analytics & Quantitative Insights in recognition of her substantial quantitative contributions to our analytics and decision-making infrastructure over the last six years.
Respectfully submitted,

David R. Giroux
Chairman of the fund’s Investment Advisory Committee
January 22, 2022
The committee chairman has day-to-day responsibility for managing the portfolio and works with committee members in developing and executing the fund’s investment program.
The views expressed reflect the opinions of T. Rowe Price as of the date of this report and are subject to change based on changes in market, economic, or other conditions. These views are not intended to be a forecast of future events and are no guarantee of future results.
RISKS OF INVESTING
As with all stock and bond mutual funds, the fund’s share price can fall because of weakness in the stock or bond markets, a particular industry, or specific holdings. Stock markets can decline for many reasons, including adverse political or economic developments, changes in investor psychology, or heavy institutional selling. The prospects for an industry or company may deteriorate because of a variety of factors, including disappointing earnings or changes in the competitive environment. In addition, the investment manager’s assessment of companies held in a fund may prove incorrect, resulting in losses or poor performance even in rising markets. A sizable cash or fixed income position may hinder the fund from participating fully in a strong, rapidly rising bull market. In addition, significant exposure to bonds increases the risk that the fund’s share value could be hurt by rising interest rates or credit downgrades or defaults. Convertible securities are also exposed to price fluctuations of the company’s stock.
GLOSSARY
Beta: A measure of the market risk of a stock showing how responsive it is to a given market index, such as the S&P 500 Stock Index. By definition, the beta of the benchmark index is 1.00. A fund with a 1.10 beta is expected to perform 10% better than the index in up markets and 10% worse in down markets. Usually, higher betas represent riskier investments.
Gross domestic product (GDP): The total market value of all goods and services produced in a country in a given year.
Lipper indexes: Fund benchmarks that consist of a small number of the largest mutual funds in a particular category as tracked by Lipper Inc.
Morningstar Allocation–50% to 70% Equity Category Average: Tracks the performance of funds that seek capital appreciation and income by investing in multiple asset classes, including stocks, bonds, and cash. Equity exposures range from 50% to 70%.
Sharpe ratio: A measure of the risk-adjusted return of a portfolio. The Sharpe ratio measures how much a portfolio’s return is above or below the risk-free Treasury rate (excess return) per unit risk (measured by standard deviation). In general, the larger the number, the better the portfolio’s historical risk-adjusted return.
BENCHMARK INFORMATION
Note: Bloomberg® and Bloomberg U.S. Aggregate Bond Index are service marks of Bloomberg Finance L.P. and its affiliates, including Bloomberg Index Services Limited (“BISL”), the administrator of the index (collectively, “Bloomberg”) and have been licensed for use for certain purposes by T. Rowe Price. Bloomberg is not affiliated with T. Rowe Price, and Bloomberg does not approve, endorse, review, or recommend its products. Bloomberg does not guarantee the timeliness, accurateness, or completeness of any data or information relating to its products.
Note: Lipper, a Thomson Reuters Company, is the source for all Lipper content reflected in these materials. Copyright 2022 © Refinitiv. All rights reserved. Any copying, republication or redistribution of Lipper content is expressly prohibited without the prior written consent of Lipper. Lipper shall not be liable for any errors or delays in the content, or for any actions taken in reliance thereon.
Note: ©2022 Morningstar, Inc. All rights reserved. The information contained therein: (1) is proprietary to Morningstar and/or its content providers; (2) may not be copied or distributed; and (3) is not warranted to be accurate, complete, or timely. Neither Morningstar nor its content providers are responsible for any damages or losses arising from any use of this information. Past performance is no guarantee of future results.
Note: ©2022, S&P Global Market Intelligence. Reproduction of any information, data or material, including ratings (Content) in any form is prohibited except with the prior written permission of the relevant party. Such party, its affiliates and suppliers (Content Providers) do not guarantee the accuracy, adequacy, completeness, timeliness or availability of any Content and are not responsible for any errors or omissions (negligent or otherwise), regardless of the cause, or for the results obtained from the use of such Content. In no event shall Content Providers be liable for any damages, costs, expenses, legal fees, or losses (including lost income or lost profit and opportunity costs) in connection with any use of the Content.

GROWTH OF $10,000
This chart shows the value of a hypothetical $10,000 investment in the fund over the past 10 fiscal year periods or since inception (for funds lacking 10-year records). The result is compared with benchmarks, which include a broad-based market index and may also include a peer group average or index. Market indexes do not include expenses, which are deducted from fund returns as well as mutual fund averages and indexes.

AVERAGE ANNUAL COMPOUND TOTAL RETURN
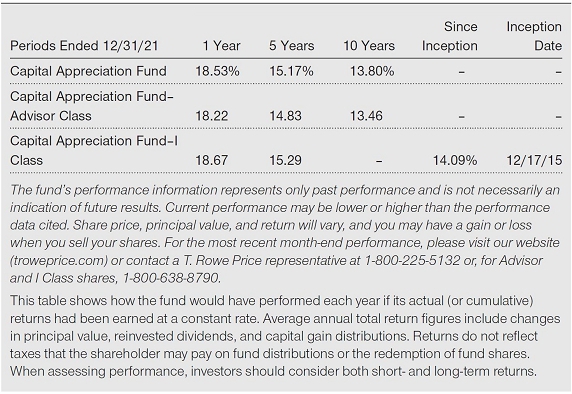
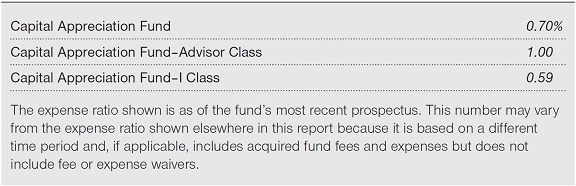
EXPENSE RATIO
FUND EXPENSE EXAMPLE
As a mutual fund shareholder, you may incur two types of costs: (1) transaction costs, such as redemption fees or sales loads, and (2) ongoing costs, including management fees, distribution and service (12b-1) fees, and other fund expenses. The following example is intended to help you understand your ongoing costs (in dollars) of investing in the fund and to compare these costs with the ongoing costs of investing in other mutual funds. The example is based on an investment of $1,000 invested at the beginning of the most recent six-month period and held for the entire period.
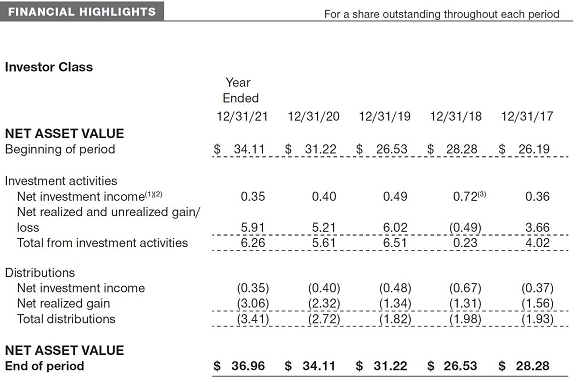
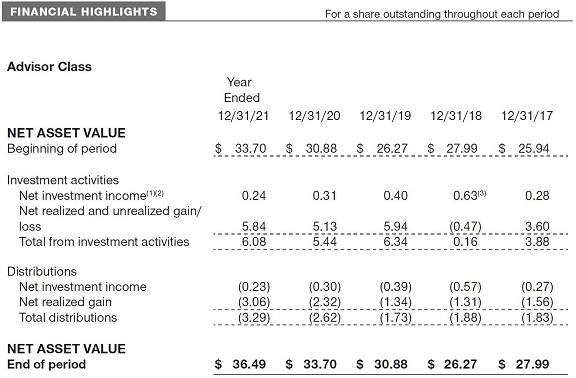
Please note that the fund has three share classes: The original share class (Investor Class) charges no distribution and service (12b-1) fee, the Advisor Class shares are offered only through unaffiliated brokers and other financial intermediaries and charge a 0.25% 12b-1 fee, and I Class shares are available to institutionally oriented clients and impose no 12b-1 or administrative fee payment. Each share class is presented separately in the table.
Actual Expenses
The first line of the following table (Actual) provides information about actual account values and expenses based on the fund’s actual returns. You may use the information on this line, together with your account balance, to estimate the expenses that you paid over the period. Simply divide your account value by $1,000 (for example, an $8,600 account value divided by $1,000 = 8.6), then multiply the result by the number on the first line under the heading “Expenses Paid During Period” to estimate the expenses you paid on your account during this period.
Hypothetical Example for Comparison Purposes
The information on the second line of the table (Hypothetical) is based on hypothetical account values and expenses derived from the fund’s actual expense ratio and an assumed 5% per year rate of return before expenses (not the fund’s actual return). You may compare the ongoing costs of investing in the fund with other funds by contrasting this 5% hypothetical example and the 5% hypothetical examples that appear in the shareholder reports of the other funds. The hypothetical account values and expenses may not be used to estimate the actual ending account balance or expenses you paid for the period.
Note: T. Rowe Price charges an annual account service fee of $20, generally for accounts with less than $10,000. The fee is waived for any investor whose T. Rowe Price mutual fund accounts total $50,000 or more; accounts electing to receive electronic delivery of account statements, transaction confirmations, prospectuses, and shareholder reports; or accounts of an investor who is a T. Rowe Price Personal Services or Enhanced Personal Services client (enrollment in these programs generally requires T. Rowe Price assets of at least $250,000). This fee is not included in the accompanying table. If you are subject to the fee, keep it in mind when you are estimating the ongoing expenses of investing in the fund and when comparing the expenses of this fund with other funds.
You should also be aware that the expenses shown in the table highlight only your ongoing costs and do not reflect any transaction costs, such as redemption fees or sales loads. Therefore, the second line of the table is useful in comparing ongoing costs only and will not help you determine the relative total costs of owning different funds. To the extent a fund charges transaction costs, however, the total cost of owning that fund is higher.

The accompanying notes are an integral part of these financial statements.
The accompanying notes are an integral part of these financial statements.
The accompanying notes are an integral part of these financial statements.
December 31, 2021


The accompanying notes are an integral part of these financial statements.
December 31, 2021

The accompanying notes are an integral part of these financial statements.

The accompanying notes are an integral part of these financial statements.

The accompanying notes are an integral part of these financial statements.
| NOTES TO FINANCIAL STATEMENTS |
T. Rowe Price Capital Appreciation Fund, Inc. (the fund) is registered under the Investment Company Act of 1940 (the 1940 Act) as a diversified, open-end management investment company. The fund seeks long-term capital appreciation by investing primarily in common stocks. It may also hold fixed-income and other securities to help preserve principal value. The fund has three classes of shares: the Capital Appreciation Fund (Investor Class), the Capital Appreciation Fund–Advisor Class (Advisor Class), and the Capital Appreciation Fund–I Class (I Class). Advisor Class shares are sold only through various brokers and other financial intermediaries. I Class shares require a $500,000 initial investment minimum, although the minimum generally is waived or reduced for financial intermediaries, eligible retirement plans, and certain other accounts. Prior to November 15, 2021, the initial investment minimum was $1 million and was generally waived for financial intermediaries, eligible retirement plans, and other certain accounts. The Advisor Class operates under a Board-approved Rule 12b-1 plan pursuant to which the class compensates financial intermediaries for distribution, shareholder servicing, and/or certain administrative services; the Investor and I Classes do not pay Rule 12b-1 fees. Each class has exclusive voting rights on matters related solely to that class; separate voting rights on matters that relate to all classes; and, in all other respects, the same rights and obligations as the other classes.
NOTE 1 - SIGNIFICANT ACCOUNTING POLICIES
Basis of Preparation The fund is an investment company and follows accounting and reporting guidance in the Financial Accounting Standards Board (FASB) Accounting Standards Codification Topic 946 (ASC 946). The accompanying financial statements were prepared in accordance with accounting principles generally accepted in the United States of America (GAAP), including, but not limited to, ASC 946. GAAP requires the use of estimates made by management. Management believes that estimates and valuations are appropriate; however, actual results may differ from those estimates, and the valuations reflected in the accompanying financial statements may differ from the value ultimately realized upon sale or maturity.
Investment Transactions, Investment Income, and Distributions Investment transactions are accounted for on the trade date basis. Income and expenses are recorded on the accrual basis. Realized gains and losses are reported on the identified cost basis. Premiums and discounts on debt securities are amortized for financial reporting purposes. Paydown gains and losses are recorded as an adjustment to interest income. Income tax-related interest and penalties, if incurred, are recorded as income tax expense. Dividends received from mutual fund investments are reflected as dividend income; capital gain distributions are reflected as realized gain/loss. Dividend income and capital gain distributions are recorded on the ex-dividend date. Distributions from REITs are initially recorded as dividend income and, to the extent such represent a return of capital or capital gain for tax purposes, are reclassified when such information becomes available. Non-cash dividends, if any, are recorded at the fair market value of the asset received. Distributions to shareholders are recorded on the ex-dividend date. Income distributions, if any, are declared and paid by each class annually. A capital gain distribution may also be declared and paid by the fund annually.
Currency Translation Assets, including investments, and liabilities denominated in foreign currencies are translated into U.S. dollar values each day at the prevailing exchange rate, using the mean of the bid and asked prices of such currencies against U.S. dollars as provided by an outside pricing service. Purchases and sales of securities, income, and expenses are translated into U.S. dollars at the prevailing exchange rate on the respective date of such transaction. The effect of changes in foreign currency exchange rates on realized and unrealized security gains and losses is not bifurcated from the portion attributable to changes in market prices.
Class Accounting Shareholder servicing, prospectus, and shareholder report expenses incurred by each class are charged directly to the class to which they relate. Expenses common to all classes, investment income, and realized and unrealized gains and losses are allocated to the classes based upon the relative daily net assets of each class. The Advisor Class pays Rule 12b-1 fees, in an amount not exceeding 0.25% of the class’s average daily net assets.
Capital Transactions Each investor’s interest in the net assets of the fund is represented by fund shares. The fund’s net asset value (NAV) per share is computed at the close of the New York Stock Exchange (NYSE), normally 4 p.m. ET, each day the NYSE is open for business. However, the NAV per share may be calculated at a time other than the normal close of the NYSE if trading on the NYSE is restricted, if the NYSE closes earlier, or as may be permitted by the SEC. Purchases and redemptions of fund shares are transacted at the next-computed NAV per share, after receipt of the transaction order by T. Rowe Price Associates, Inc., or its agents.
New Accounting Guidance In March 2020, the FASB issued Accounting Standards Update (ASU), ASU 2020–04, Reference Rate Reform (Topic 848) – Facilitation of the Effects of Reference Rate Reform on Financial Reporting, which provides optional, temporary relief with respect to the financial reporting of contracts subject to certain types of modifications due to the planned discontinuation of the London Interbank Offered Rate (LIBOR) and other interbank-offered based reference rates as of the end of 2021. In March 2021, the administrator for LIBOR announced the extension of the publication of a majority of the USD LIBOR settings to June 30, 2023. Management expects that the adoption of the guidance will not have a material impact on the fund’s financial statements.
Indemnification In the normal course of business, the fund may provide indemnification in connection with its officers and directors, service providers, and/or private company investments. The fund’s maximum exposure under these arrangements is unknown; however, the risk of material loss is currently considered to be remote.
NOTE 2 - VALUATION
Fair Value The fund’s financial instruments are valued at the close of the NYSE and are reported at fair value, which GAAP defines as the price that would be received to sell an asset or paid to transfer a liability in an orderly transaction between market participants at the measurement date. The T. Rowe Price Valuation Committee (the Valuation Committee) is an internal committee that has been delegated certain responsibilities by the fund’s Board of Directors (the Board) to ensure that financial instruments are appropriately priced at fair value in accordance with GAAP and the 1940 Act. Subject to oversight by the Board, the Valuation Committee develops and oversees pricing-related policies and procedures and approves all fair value determinations. Specifically, the Valuation Committee establishes policies and procedures used in valuing financial instruments, including those which cannot be valued in accordance with normal procedures or using pricing vendors; determines pricing techniques, sources, and persons eligible to effect fair value pricing actions; evaluates the services and performance of the pricing vendors; oversees the pricing process to ensure policies and procedures are being followed; and provides guidance on internal controls and valuation-related matters. The Valuation Committee provides periodic reporting to the Board on valuation matters.
Various valuation techniques and inputs are used to determine the fair value of financial instruments. GAAP establishes the following fair value hierarchy that categorizes the inputs used to measure fair value:
Level 1 – quoted prices (unadjusted) in active markets for identical financial instruments that the fund can access at the reporting date
Level 2 – inputs other than Level 1 quoted prices that are observable, either directly or indirectly (including, but not limited to, quoted prices for similar financial instruments in active markets, quoted prices for identical or similar financial instruments in inactive markets, interest rates and yield curves, implied volatilities, and credit spreads)
Level 3 – unobservable inputs (including the fund’s own assumptions in determining fair value)
Observable inputs are developed using market data, such as publicly available information about actual events or transactions, and reflect the assumptions that market participants would use to price the financial instrument. Unobservable inputs are those for which market data are not available and are developed using the best information available about the assumptions that market participants would use to price the financial instrument. GAAP requires valuation techniques to maximize the use of relevant observable inputs and minimize the use of unobservable inputs. When multiple inputs are used to derive fair value, the financial instrument is assigned to the level within the fair value hierarchy based on the lowest-level input that is significant to the fair value of the financial instrument. Input levels are not necessarily an indication of the risk or liquidity associated with financial instruments at that level but rather the degree of judgment used in determining those values.
Valuation Techniques Equity securities, including exchange-traded funds, listed or regularly traded on a securities exchange or in the over-the-counter (OTC) market are valued at the last quoted sale price or, for certain markets, the official closing price at the time the valuations are made. OTC Bulletin Board securities are valued at the mean of the closing bid and asked prices. A security that is listed or traded on more than one exchange is valued at the quotation on the exchange determined to be the primary market for such security. Listed securities not traded on a particular day are valued at the mean of the closing bid and asked prices for domestic securities.
Debt securities generally are traded in the over-the-counter (OTC) market and are valued at prices furnished by independent pricing services or by broker dealers who make markets in such securities. When valuing securities, the independent pricing services consider the yield or price of bonds of comparable quality, coupon, maturity, and type, as well as prices quoted by dealers who make markets in such securities.
Investments in mutual funds are valued at the mutual fund’s closing NAV per share on the day of valuation. Listed options, and OTC options with a listed equivalent, are valued at the mean of the closing bid and asked prices and exchange-traded options on futures contracts are valued at closing settlement prices. Assets and liabilities other than financial instruments, including short-term receivables and payables, are carried at cost, or estimated realizable value, if less, which approximates fair value.
Investments for which market quotations or market-based valuations are not readily available or deemed unreliable are valued at fair value as determined in good faith by the Valuation Committee, in accordance with fair valuation policies and procedures. The objective of any fair value pricing determination is to arrive at a price that could reasonably be expected from a current sale. Financial instruments fair valued by the Valuation Committee are primarily private placements, restricted securities, warrants, rights, and other securities that are not publicly traded. Factors used in determining fair value vary by type of investment and may include market or investment specific considerations. The Valuation Committee typically will afford greatest weight to actual prices in arm’s length transactions, to the extent they represent orderly transactions between market participants, transaction information can be reliably obtained, and prices are deemed representative of fair value. However, the Valuation Committee may also consider other valuation methods such as market-based valuation multiples; a discount or premium from market value of a similar, freely traded security of the same issuer; discounted cash flows; yield to maturity; or some combination. Fair value determinations are reviewed on a regular basis and updated as information becomes available, including actual purchase and sale transactions of the investment. Because any fair value determination involves a significant amount of judgment, there is a degree of subjectivity inherent in such pricing decisions, and fair value prices determined by the Valuation Committee could differ from those of other market participants.
Valuation Inputs The following table summarizes the fund’s financial instruments, based on the inputs used to determine their fair values on December 31, 2021 (for further detail by category, please refer to the accompanying Portfolio of Investments):
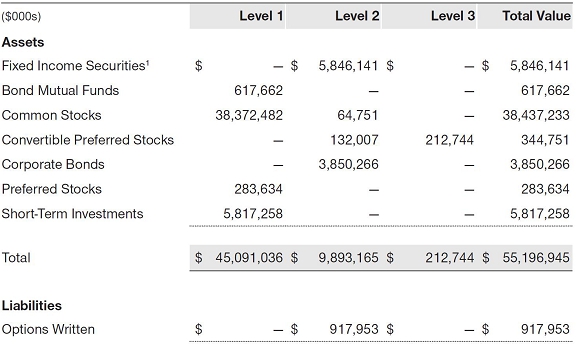
1 Includes Asset-Backed Securities and Bank Loans.
NOTE 3 - DERIVATIVE INSTRUMENTS
During the year ended December 31, 2021, the fund invested in derivative instruments. As defined by GAAP, a derivative is a financial instrument whose value is derived from an underlying security price, foreign exchange rate, interest rate, index of prices or rates, or other variable; it requires little or no initial investment and permits or requires net settlement. The fund invests in derivatives only if the expected risks and rewards are consistent with its investment objectives, policies, and overall risk profile, as described in its prospectus and Statement of Additional Information. The fund may use derivatives for a variety of purposes and may use them to establish both long and short positions within the fund’s portfolio. Potential uses include to hedge against declines in principal value, increase yield, invest in an asset with greater efficiency and at a lower cost than is possible through direct investment, to enhance return, or to adjust credit exposure. The risks associated with the use of derivatives are different from, and potentially much greater than, the risks associated with investing directly in the instruments on which the derivatives are based. The fund at all times maintains sufficient cash reserves, liquid assets, or other SEC-permitted asset types to cover its settlement obligations under open derivative contracts.
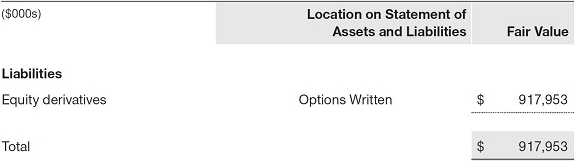
The fund values its derivatives at fair value and recognizes changes in fair value currently in its results of operations. Accordingly, the fund does not follow hedge accounting, even for derivatives employed as economic hedges. Generally, the fund accounts for its derivatives on a gross basis. It does not offset the fair value of derivative liabilities against the fair value of derivative assets on its financial statements, nor does it offset the fair value of derivative instruments against the right to reclaim or obligation to return collateral. The following table summarizes the fair value of the fund’s derivative instruments held as of December 31, 2021, and the related location on the accompanying Statement of Assets and Liabilities, presented by primary underlying risk exposure:
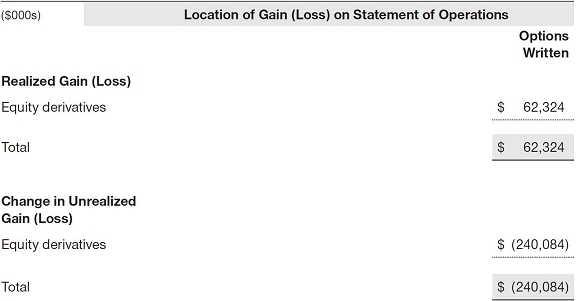
Additionally, the amount of gains and losses on derivative instruments recognized in fund earnings during the year ended December 31, 2021, and the related location on the accompanying Statement of Operations is summarized in the following table by primary underlying risk exposure:
Counterparty Risk and Collateral The fund invests in derivatives, such as bilateral swaps, forward currency exchange contracts, and/or OTC options, that are transacted and settle directly with a counterparty (bilateral derivatives), and thereby may expose the fund to counterparty risk. To mitigate this risk, the fund has entered into master netting arrangements (MNAs) with certain counterparties that permit net settlement under specified conditions and, for certain counterparties, also require the exchange of collateral to cover mark-to-market exposure. MNAs may be in the form of International Swaps and Derivatives Association master agreements (ISDAs) or foreign exchange letter agreements (FX letters).
MNAs govern the ability to offset amounts the fund owes a counterparty against amounts the counterparty owes the fund (net settlement). Both ISDAs and FX letters generally allow termination of transactions and net settlement upon the occurrence of contractually specified events, such as failure to pay or bankruptcy. In addition, ISDAs specify other events, the occurrence of which would allow one of the parties to terminate. For example, a downgrade in credit rating of a counterparty below a specified rating would allow the fund to terminate, while a decline in the fund’s net assets of more than a specified percentage would allow the counterparty to terminate. Upon termination, all transactions with that counterparty would be liquidated and a net termination amount determined. ISDAs typically include collateral agreements whereas FX letters do not. Collateral requirements are determined daily based on the net aggregate unrealized gain or loss on all bilateral derivatives with each counterparty, subject to minimum transfer amounts that typically range from $100,000 to $250,000. Any additional collateral required due to changes in security values is typically transferred the next business day.
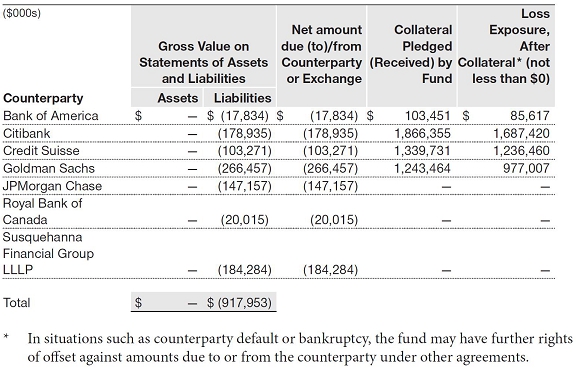
Collateral may be in the form of cash or debt securities issued by the U.S. government or related agencies, although other securities may be used depending on the terms outlined in the applicable MNA. Cash posted by the fund is reflected as cash deposits in the accompanying financial statements and generally is restricted from withdrawal by the fund; securities posted by the fund are so noted in the accompanying Portfolio of Investments; both remain in the fund’s assets. Collateral pledged by counterparties is not included in the fund’s assets because the fund does not obtain effective control over those assets. For bilateral derivatives, collateral posted by the fund is held in a segregated account at the fund’s custodian. While typically not sold in the same manner as equity or fixed income securities, OTC and bilateral derivatives may be unwound with counterparties or transactions assigned to other counterparties to allow the fund to exit the transaction. This ability is subject to the liquidity of underlying positions. The following table summarizes the fund’s derivatives at the reporting date by loss exposure to each counterparty after consideration of collateral, if any.
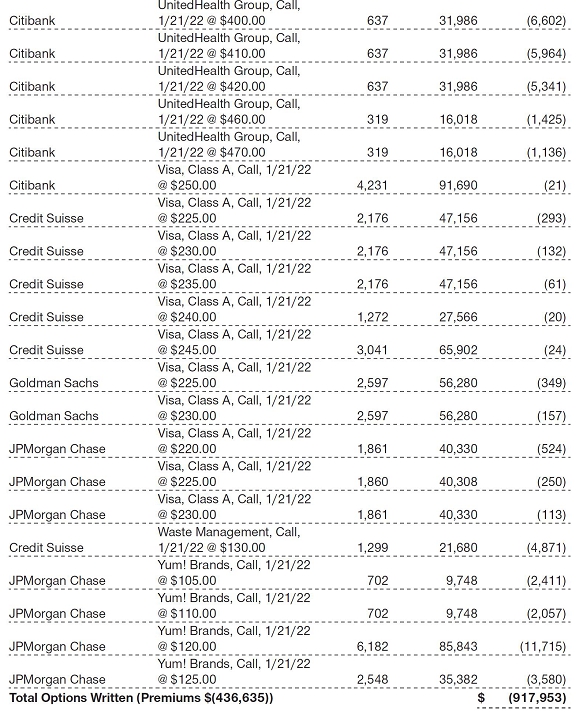
Options The fund is subject to equity price risk in the normal course of pursuing its investment objectives and uses options to help manage such risk. The fund may use options to manage exposure to security prices, interest rates, foreign currencies, and credit quality; as an efficient means of adjusting exposure to all or a part of a target market; to enhance income; as a cash management tool; or to adjust credit exposure. Options are included in net assets at fair value, options purchased are included in Investments in Securities, and Options written are separately reflected as a liability on the accompanying Statement of Assets and Liabilities. Premiums on unexercised, expired options are recorded as realized gains or losses; premiums on exercised options are recorded as an adjustment to the proceeds from the sale or cost of the purchase. The difference between the premium and the amount received or paid in a closing transaction is also treated as realized gain or loss. In return for a premium paid, call and put options give the holder the right, but not the obligation, to purchase or sell, respectively, a security at a specified exercise price. Risks related to the use of options include possible illiquidity of the options markets; trading restrictions imposed by an exchange or counterparty; possible failure of counterparties to meet the terms of the agreements; movements in the underlying asset values and, for options written, the potential for losses to exceed any premium received by the fund. During the year ended December 31, 2021, the volume of the fund’s activity in options, based on underlying notional amounts, was generally between 10% and 16% of net assets.
NOTE 4 - OTHER INVESTMENT TRANSACTIONS
Consistent with its investment objective, the fund engages in the following practices to manage exposure to certain risks and/or to enhance performance. The investment objective, policies, program, and risk factors of the fund are described more fully in the fund’s prospectus and Statement of Additional Information.
Noninvestment-Grade Debt The fund invests, either directly or through its investment in other T. Rowe Price funds, in noninvestment-grade debt, including “high yield” or “junk” bonds or leveraged loans. Noninvestment-grade debt issuers are more likely to suffer an adverse change in financial condition that would result in the inability to meet a financial obligation. The noninvestment-grade debt market may experience sudden and sharp price swings due to a variety of factors that may decrease the ability of issuers to make principal and interest payments and adversely affect the liquidity or value, or both, of such securities. Accordingly, securities issued by such companies carry a higher risk of default and should be considered speculative.
Restricted Securities The fund invests in securities that are subject to legal or contractual restrictions on resale. Prompt sale of such securities at an acceptable price may be difficult and may involve substantial delays and additional costs.
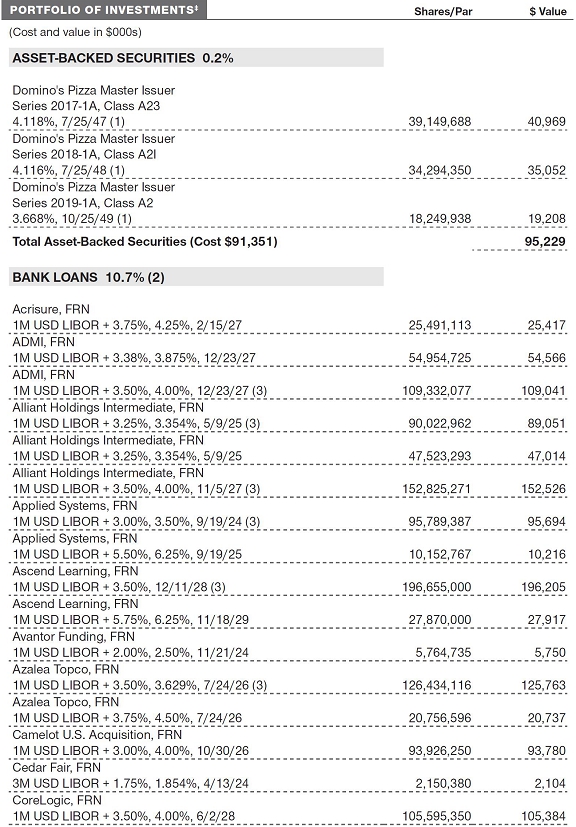
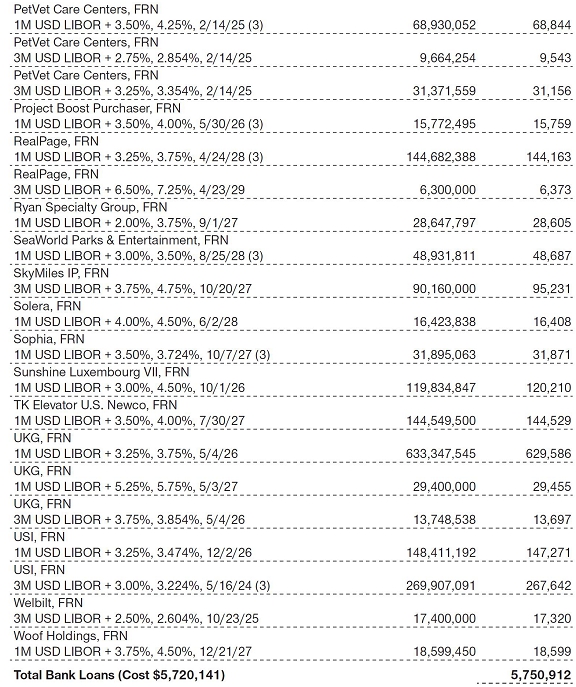
Bank Loans The fund invests in bank loans, which represent an interest in amounts owed by a borrower to a syndicate of lenders. Bank loans are generally noninvestment grade and often involve borrowers whose financial condition is highly leveraged. Bank loans may be in the form of either assignments or participations. A loan assignment transfers all legal, beneficial, and economic rights to the buyer, and transfer typically requires consent of both the borrower and agent. In contrast, a loan participation generally entitles the buyer to receive the cash flows from principal, interest, and any fee payments on a portion of a loan; however, the seller continues to hold legal title to that portion of the loan. As a result, the buyer of a loan participation generally has no direct recourse against the borrower and is exposed to credit risk of both the borrower and seller of the participation. Bank loans often have extended settlement periods, generally may be repaid at any time at the option of the borrower, and may require additional principal to be funded at the borrowers’ discretion at a later date (e.g. unfunded commitments and revolving debt instruments). Until settlement, the fund maintains liquid assets sufficient to settle its unfunded loan commitments. The fund reflects both the funded portion of a bank loan as well as its unfunded commitment in the Portfolio of Investments. However, if a credit agreement provides no initial funding of a tranche, and funding of the full commitment at a future date(s) is at the borrower’s discretion and considered uncertain, a loan is reflected in the Portfolio of Investments only if, and only to the extent that, the fund has actually settled a funding commitment.
Private Investments Issued by Special Purpose Acquisition Companies Special purpose acquisition companies (SPACs) are shell companies that have no operations but are formed to raise capital with the intention of merging with or acquiring a company with the proceeds of the SPAC’s initial public offering (IPO). The fund may enter into a contingent commitment with a SPAC to purchase private investments in public equity (PIPE) if and when the SPAC completes its merger or acquisition. The fund maintains liquid assets sufficient to settle its commitment to purchase the PIPE. However, if the commitment expires, then no shares are purchased. Purchased PIPE shares will be restricted from trading until the registration statement for the shares is declared effective. Upon registration, the shares can be freely sold; however, in certain circumstances, the issuer may have the right to temporarily suspend trading of the shares in the first year after the merger or acquisition. The securities issued by a SPAC may be considered illiquid, more difficult to value, and/or be subject to restrictions on resale.
LIBOR Transition The fund may invest in instruments that are tied to reference rates, including LIBOR. On March 5, 2021, the ICE Benchmark Administration Limited, the administrator of LIBOR, announced its intention to cease publishing a majority of the USD LIBOR settings immediately after publication on June 30, 2023, with the remaining USD LIBOR settings to end immediately after publication on December 31, 2021. There remains uncertainty regarding the future utilization of LIBOR and the nature of any replacement rate. Any potential effects of the transition away from LIBOR on the fund, or on certain instruments in which the fund invests, cannot yet be determined. The transition process may result in, among other things, an increase in volatility or illiquidity of markets for instruments that currently rely on LIBOR, a reduction in the value of certain instruments held by the fund, or a reduction in the effectiveness of related fund transactions such as hedges. Any such effects could have an adverse impact on the fund’s performance.
Other Purchases and sales of portfolio securities other than short-term securities aggregated $22,477,669,000 and $21,101,658,000, respectively, for the year ended December 31, 2021.
NOTE 5 - FEDERAL INCOME TAXES
Generally, no provision for federal income taxes is required since the fund intends to continue to qualify as a regulated investment company under Subchapter M of the Internal Revenue Code and distribute to shareholders all of its taxable income and gains. Distributions determined in accordance with federal income tax regulations may differ in amount or character from net investment income and realized gains for financial reporting purposes.
The fund files U.S. federal, state, and local tax returns as required. The fund’s tax returns are subject to examination by the relevant tax authorities until expiration of the applicable statute of limitations, which is generally three years after the filing of the tax return but which can be extended to six years in certain circumstances. Tax returns for open years have incorporated no uncertain tax positions that require a provision for income taxes.
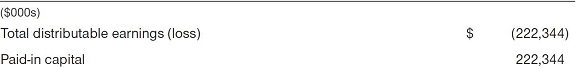
Financial reporting records are adjusted for permanent book/tax differences to reflect tax character but are not adjusted for temporary differences. The permanent book/tax adjustments have no impact on results of operations or net assets and relate primarily to a tax practice that treats a portion of the proceeds from each redemption of capital shares as a distribution of taxable net investment income or realized capital gain. For the year ended December 31, 2021, the following reclassification was recorded:
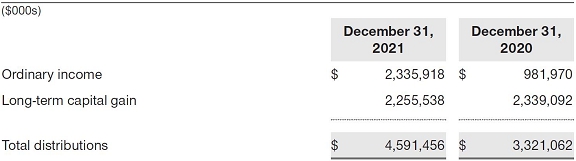
Distributions during the years ended December 31, 2021 and December 31, 2020, were characterized for tax purposes as follows:
At December 31, 2021, the tax-basis cost of investments, including derivatives, and components of net assets were as follows:
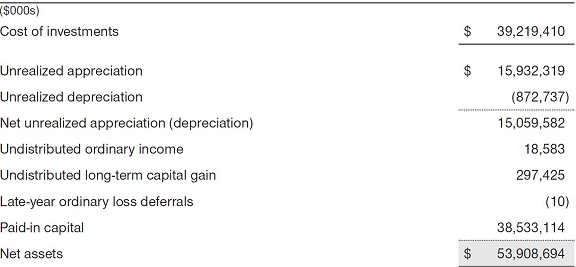
The difference between book-basis and tax-basis net unrealized appreciation (depreciation) is attributable to the deferral of losses from wash sales for tax purposes. In accordance with federal tax laws applicable to investment companies, net specified losses realized between November 1 and December 31 are not recognized for tax purposes until the subsequent year (late-year ordinary loss deferrals); however, such losses are recognized for financial reporting purposes in the year realized.
NOTE 6 - FOREIGN TAXES
The fund is subject to foreign income taxes imposed by certain countries in which it invests. Additionally, capital gains realized upon disposition of securities issued in or by certain foreign countries are subject to capital gains tax imposed by those countries. All taxes are computed in accordance with the applicable foreign tax law, and, to the extent permitted, capital losses are used to offset capital gains. Taxes attributable to income are accrued by the fund as a reduction of income. Current and deferred tax expense attributable to capital gains is reflected as a component of realized or change in unrealized gain/loss on securities in the accompanying financial statements. To the extent that the fund has country specific capital loss carryforwards, such carryforwards are applied against net unrealized gains when determining the deferred tax liability. Any deferred tax liability incurred by the fund is included in either Other liabilities or Deferred tax liability on the accompanying Statement of Assets and Liabilities.
NOTE 7 - RELATED PARTY TRANSACTIONS
The fund is managed by T. Rowe Price Associates, Inc. (Price Associates), a wholly owned subsidiary of T. Rowe Price Group, Inc. (Price Group). The investment management agreement between the fund and Price Associates provides for an annual investment management fee that consists of an individual fund fee and a group fee; management fees are computed daily and paid monthly. The investment management agreement provides for an individual fund fee equal to 0.30% of the fund’s average daily net assets. The group fee rate is calculated based on the combined net assets of certain mutual funds sponsored by Price Associates (the group) applied to a graduated fee schedule, with rates ranging from 0.48% for the first $1 billion of assets to 0.260% for assets in excess of $845 billion. The fund’s group fee is determined by applying the group fee rate to the fund’s average daily net assets. At December 31, 2021, the effective annual group fee rate was 0.28%. Effective April 30, 2019, Price Associates has contractually agreed, at least through April 30, 2022, to waive a portion of its management fee so that an individual fund fee of 0.27% is applied to the fund’s average daily net assets that are equal to or greater than $27.5 billion. Thereafter, this agreement will automatically renew for one-year terms unless terminated by the fund’s Board. Any fees waived under this agreement are not subject to reimbursement to Price Associates by the fund. The total management fees waived were $6,697,000 and allocated ratably in the amounts of $5,116,000 for the Investor Class, $106,000 for the Advisor Class, and $1,475,000 for the I Class, for the year ended December 31, 2021.
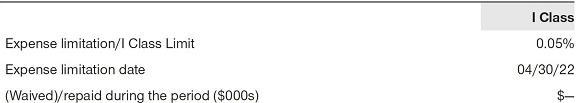
The I Class is subject to an operating expense limitation (I Class Limit) pursuant to which Price Associates is contractually required to pay all operating expenses of the I Class, excluding management fees; interest; expenses related to borrowings, taxes, and brokerage; and other non-recurring expenses permitted by the investment management agreement, to the extent such operating expenses, on an annualized basis, exceed the I Class Limit. This agreement will continue through the expense limitation date indicated in the table below, and may be renewed, revised, or revoked only with approval of the fund’s Board. The I Class is required to repay Price Associates for expenses previously paid to the extent the class’s net assets grow or expenses decline sufficiently to allow repayment without causing the class’s operating expenses (after the repayment is taken into account) to exceed the lesser of: (1) the I Class Limit in place at the time such amounts were paid; or (2) the current I Class Limit. However, no repayment will be made more than three years after the date of a payment or waiver.
In addition, the fund has entered into service agreements with Price Associates and two wholly owned subsidiaries of Price Associates, each an affiliate of the fund (collectively, Price). Price Associates provides certain accounting and administrative services to the fund. T. Rowe Price Services, Inc. provides shareholder and administrative services in its capacity as the fund’s transfer and dividend-disbursing agent. T. Rowe Price Retirement Plan Services, Inc. provides subaccounting and recordkeeping services for certain retirement accounts invested in the Investor Class and Advisor Class. For the year ended December 31, 2021, expenses incurred pursuant to these service agreements were $82,000 for Price Associates; $6,210,000 for T. Rowe Price Services, Inc.; and $1,541,000 for T. Rowe Price Retirement Plan Services, Inc. All amounts due to and due from Price, exclusive of investment management fees payable, are presented net on the accompanying Statement of Assets and Liabilities.
The fund may invest its cash reserves in certain open-end management investment companies managed by Price Associates and considered affiliates of the fund: the T. Rowe Price Government Reserve Fund or the T. Rowe Price Treasury Reserve Fund, organized as money market funds, or the T. Rowe Price Short-Term Fund, a short-term bond fund (collectively, the Price Reserve Funds). The Price Reserve Funds are offered as short-term investment options to mutual funds, trusts, and other accounts managed by Price Associates or its affiliates and are not available for direct purchase by members of the public. Cash collateral from securities lending, if any, is invested in the T. Rowe Price Government Reserve Fund; prior to December 13, 2021, the cash collateral from securities lending was invested in the T. Rowe Price Short-Term Fund. The Price Reserve Funds pay no investment management fees.
The fund may also invest in certain other T. Rowe Price funds (Price Funds) as a means of gaining efficient and cost-effective exposure to certain markets. The fund does not invest for the purpose of exercising management or control; however, investments by the fund may represent a significant portion of an underlying Price Fund’s net assets. Each underlying Price Fund is an open-end management investment company managed by Price Associates and is considered an affiliate of the fund. To ensure that the fund does not incur duplicate management fees (paid by the underlying Price Fund(s) and the fund), Price Associates has agreed to permanently waive a portion of its management fee charged to the fund in an amount sufficient to fully offset that portion of management fees paid by each underlying Price Fund related to the fund’s investment therein. Annual management fee rates and amounts waived related to investments in the underlying Price Fund(s) for the year ended December 31, 2021, are as follows:
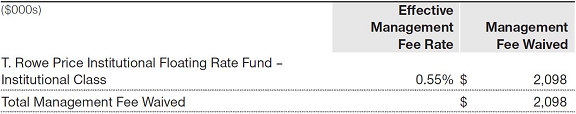
Total management fee waived was allocated ratably in the amounts of $1,597,000, $33,000 and $468,000 for the Investor Class, Advisor Class, and I Class, respectively, for the year ended December 31, 2021.
As of December 31, 2021, T. Rowe Price Group, Inc., or its wholly owned subsidiaries, owned 2,816,392 shares of the Investor Class, representing less than 1% of the Investor Class’s net assets and 2,839,623 shares of the I Class, representing less than 1% of the I Class’s net assets.
The fund may participate in securities purchase and sale transactions with other funds or accounts advised by Price Associates (cross trades), in accordance with procedures adopted by the fund’s Board and Securities and Exchange Commission rules, which require, among other things, that such purchase and sale cross trades be effected at the independent current market price of the security. During the year ended December 31, 2021, the fund had no purchases or sales cross trades with other funds or accounts advised by Price Associates.
Price Associates has voluntarily agreed to reimburse the fund from its own resources on a monthly basis for the cost of investment research embedded in the cost of the fund’s securities trades. This agreement may be rescinded at any time. For the year ended December 31, 2021, this reimbursement amounted to $594,000, which is included in Net realized gain (loss) on Securities in the Statement of Operations.
NOTE 8 - INTERFUND LENDING PROGRAM
Price Associates has developed and manages an interfund lending program that provides temporary liquidity to the T. Rowe Price-sponsored mutual funds. The program permits the borrowing and lending of cash between the fund and other T. Rowe Price-sponsored mutual funds at rates beneficial to both the borrowing and lending funds. Pursuant to program guidelines, the fund may lend up to 15% of its net assets, and no more than 5% of its net assets may be lent to any one borrower. Loans totaling 10% or more of a borrowing fund’s total assets require collateralization at 102% of the value of the loan; loans of less than 10% are unsecured. During the year ended December 31, 2021, the fund earned $2,000 in interest income related to loans made to other funds on one day in the average amount of $47,900,000 and at an average annual rate of 1.64%. At December 31, 2021, there were no loans outstanding.
NOTE 9 - OTHER MATTERS
Unpredictable events such as environmental or natural disasters, war, terrorism, pandemics, outbreaks of infectious diseases, and similar public health threats may significantly affect the economy and the markets and issuers in which a fund invests. Certain events may cause instability across global markets, including reduced liquidity and disruptions in trading markets, while some events may affect certain geographic regions, countries, sectors, and industries more significantly than others, and exacerbate other pre-existing political, social, and economic risks. The fund’s performance could be negatively impacted if the value of a portfolio holding were harmed by such events. Since 2020, a novel strain of coronavirus (COVID-19) has resulted in disruptions to global business activity and caused significant volatility and declines in global financial markets. The duration of this outbreak or others and their effects cannot be determined with certainty.
REPORT OF INDEPENDENT REGISTERED PUBLIC ACCOUNTING FIRM
To the Board of Directors and Shareholders of T. Rowe Price Capital Appreciation Fund, Inc.
Opinion on the Financial Statements
We have audited the accompanying statement of assets and liabilities, including the portfolio of investments, of T. Rowe Price Capital Appreciation Fund, Inc. (the “Fund”) as of December 31, 2021, the related statement of operations for the year ended December 31, 2021, the statement of changes in net assets for each of the two years in the period ended December 31, 2021, including the related notes, and the financial highlights for each of the five years in the period ended December 31, 2021 (collectively referred to as the “financial statements”). In our opinion, the financial statements present fairly, in all material respects, the financial position of the Fund as of December 31, 2021, the results of its operations for the year then ended, the changes in its net assets for each of the two years in the period ended December 31, 2021 and the financial highlights for each of the five years in the period ended December 31, 2021 in conformity with accounting principles generally accepted in the United States of America.
Basis for Opinion
These financial statements are the responsibility of the Fund’s management. Our responsibility is to express an opinion on the Fund’s financial statements based on our audits. We are a public accounting firm registered with the Public Company Accounting Oversight Board (United States) (PCAOB) and are required to be independent with respect to the Fund in accordance with the U.S. federal securities laws and the applicable rules and regulations of the Securities and Exchange Commission and the PCAOB.
We conducted our audits of these financial statements in accordance with the standards of the PCAOB. Those standards require that we plan and perform the audit to obtain reasonable assurance about whether the financial statements are free of material misstatement, whether due to error or fraud.
Our audits included performing procedures to assess the risks of material misstatement of the financial statements, whether due to error or fraud, and performing procedures that respond to those risks. Such procedures included examining, on a test basis, evidence regarding the amounts and disclosures in the financial statements. Our audits also included evaluating the accounting principles used and significant estimates made by management, as well as evaluating the overall presentation of the financial statements. Our procedures included confirmation of securities owned as of December 31, 2021 by correspondence with the custodian, transfer agent and brokers; when replies were not received from brokers, we performed other auditing procedures. We believe that our audits provide a reasonable basis for our opinion.
PricewaterhouseCoopers LLP
Baltimore, Maryland
February 15, 2022
We have served as the auditor of one or more investment companies in the T. Rowe Price group of investment companies since 1973.
TAX INFORMATION (UNAUDITED) FOR THE TAX YEAR ENDED 12/31/21
We are providing this information as required by the Internal Revenue Code. The amounts shown may differ from those elsewhere in this report because of differences between tax and financial reporting requirements.
The fund’s distributions to shareholders included:
| ■ | $1,968,949,000 from short-term capital gains |
| | |
| ■ | $2,361,697,000 from long-term capital gains, subject to a long-term capital gains tax rate of not greater than 20% |
For taxable non-corporate shareholders, $352,907,000 of the fund’s income represents qualified dividend income subject to a long-term capital gains tax rate of not greater than 20%.
For corporate shareholders, $340,935,000 of the fund’s income qualifies for the dividends-received deduction.
INFORMATION ON PROXY VOTING POLICIES, PROCEDURES, AND RECORDS
A description of the policies and procedures used by T. Rowe Price funds to determine how to vote proxies relating to portfolio securities is available in each fund’s Statement of Additional Information. You may request this document by calling 1-800-225-5132 or by accessing the SEC’s website, sec.gov.
The description of our proxy voting policies and procedures is also available on our corporate website. To access it, please visit the following Web page:
https://www.troweprice.com/corporate/en/utility/policies.html
Scroll down to the section near the bottom of the page that says, “Proxy Voting Policies.” Click on the Proxy Voting Policies link in the shaded box.
Each fund’s most recent annual proxy voting record is available on our website and through the SEC’s website. To access it through T. Rowe Price, visit the website location shown above, and scroll down to the section near the bottom of the page that says, “Proxy Voting Records.” Click on the Proxy Voting Records link in the shaded box.
HOW TO OBTAIN QUARTERLY PORTFOLIO HOLDINGS
The fund files a complete schedule of portfolio holdings with the Securities and Exchange Commission (SEC) for the first and third quarters of each fiscal year as an exhibit to its reports on Form N-PORT. The fund’s reports on Form N-PORT are available electronically on the SEC’s website (sec.gov). In addition, most T. Rowe Price funds disclose their first and third fiscal quarter-end holdings on troweprice.com.
APPROVAL OF INVESTMENT SUBADVISORY AGREEMENT
At a meeting held on July 27, 2021 (July Meeting), the fund’s Board of Directors (Board) considered the initial approval of an investment subadvisory agreement (Subadvisory Agreement) between T. Rowe Price Associates, Inc. (Advisor), and T. Rowe Price Investment Management, Inc. (Subadvisor), with respect to the fund. The Subadvisory Agreement, which will become effective on March 7, 2022, authorizes the Subadvisor to have investment discretion with respect to all or a portion of the fund’s portfolio. The Board noted that the Subadvisory Agreement will be substantially similar to other subadvisory agreements that are in place for other T. Rowe Price funds that delegate investment management responsibilities to affiliated investment advisors. The Advisor will retain oversight responsibilities with respect to the fund. However, there will be information barriers between investment personnel of the Advisor and Subadvisor that restrict the sharing of certain information, such as investment research, trading, and proxy voting.
At the July Meeting, the Board reviewed materials relevant to its consideration of the proposed Subadvisory Agreement. Each year, the Board considers the continuation of the investment management agreement (Advisory Agreement) between the fund and the Advisor. The fund’s Advisory Agreement was most recently approved by the Board at a meeting held on March 8–9, 2021 (March Meeting). A discussion of the basis for the Board’s approval of the Advisory Agreement is included in the fund’s semiannual shareholder report for the period ended June 30, 2021. The factors considered by the Board at the July meeting in connection with approval of the proposed Subadvisory Agreement were substantially similar to the factors considered at the March Meeting in connection with the approval to continue the Advisory Agreement. However, at the July Meeting, the Board also considered that the Subadvisor will have its own investment platform and investment management leadership, all of whom will transition from the Advisor to the Subadvisor, and the Advisor and Subadvisor will implement information barriers restricting the sharing of investment information and voting activity. The independent directors were assisted in their evaluation of the Subadvisory Agreement by independent legal counsel from whom they received separate legal advice and with whom they met separately.
Following discussion at the July Meeting, the Board, including all of the fund’s independent directors, approved the Subadvisory Agreement between the Advisor and Subadvisor on behalf of the fund. No single factor was considered in isolation or to be determinative to the decision. Rather, the Board concluded, in light of a weighting and balancing of all factors considered, that it was in the best interests of the fund and its shareholders for the Board to approve the Subadvisory Agreement effective March 7, 2022.
LIQUIDITY RISK MANAGEMENT PROGRAM
In accordance with Rule 22e-4 (Liquidity Rule) under the Investment Company Act of 1940, as amended, the fund has established a liquidity risk management program (Liquidity Program) reasonably designed to assess and manage the fund’s liquidity risk, which generally represents the risk that the fund would not be able to meet redemption requests without significant dilution of remaining investors’ interests in the fund. The fund’s Board of Directors (Board) has appointed the fund’s investment advisor, T. Rowe Price Associates, Inc. (Price Associates), as the administrator of the Liquidity Program. As administrator, Price Associates is responsible for overseeing the day-to-day operations of the Liquidity Program and, among other things, is responsible for assessing, managing, and reviewing with the Board at least annually the liquidity risk of each T. Rowe Price fund. Price Associates has delegated oversight of the Liquidity Program to a Liquidity Risk Committee (LRC), which is a cross-functional committee composed of personnel from multiple departments within Price Associates.
The Liquidity Program’s principal objectives include supporting the T. Rowe Price funds’ compliance with limits on investments in illiquid assets and mitigating the risk that the fund will be unable to timely meet its redemption obligations. The Liquidity Program also includes a number of elements that support the management and assessment of liquidity risk, including an annual assessment of factors that influence the fund’s liquidity and the periodic classification and reclassification of a fund’s investments into categories that reflect the LRC’s assessment of their relative liquidity under current market conditions. Under the Liquidity Program, every investment held by the fund is classified at least monthly into one of four liquidity categories based on estimations of the investment’s ability to be sold during designated time frames in current market conditions without significantly changing the investment’s market value.
As required by the Liquidity Rule, at a meeting held on July 27, 2021, the Board was presented with an annual assessment prepared by the LRC, on behalf of Price Associates, that addressed the operation of the Liquidity Program and assessed its adequacy and effectiveness of implementation, including any material changes to the Liquidity Program and the determination of each fund’s Highly Liquid Investment Minimum (HLIM). The annual assessment included consideration of the following factors, as applicable: the fund’s investment strategy and liquidity of portfolio investments during normal and reasonably foreseeable stressed conditions, including whether the investment strategy is appropriate for an open-end fund, the extent to which the strategy involves a relatively concentrated portfolio or large positions in particular issuers, and the use of borrowings for investment purposes and derivatives; short-term and long-term cash flow projections covering both normal and reasonably foreseeable stressed conditions; and holdings of cash and cash equivalents, as well as available borrowing arrangements.
For the fund and other T. Rowe Price funds, the annual assessment incorporated a report related to a fund’s holdings, shareholder and portfolio concentration, any borrowings during the period, cash flow projections, and other relevant data for the period of April 1, 2020, through March 31, 2021. The report described the methodology for classifying a fund’s investments (including derivative transactions) into one of four liquidity categories, as well as the percentage of a fund’s investments assigned to each category. It also explained the methodology for establishing a fund’s HLIM and noted that the LRC reviews the HLIM assigned to each fund no less frequently than annually.
During the period covered by the annual assessment, the LRC has concluded, and reported to the Board, that the Liquidity Program continues to operate adequately and effectively and is reasonably designed to assess and manage the fund’s liquidity risk.
ABOUT THE FUND’S DIRECTORS AND OFFICERS
Your fund is overseen by a Board of Directors (Board) that meets regularly to review a wide variety of matters affecting or potentially affecting the fund, including performance, investment programs, compliance matters, advisory fees and expenses, service providers, and business and regulatory affairs. The Board elects the fund’s officers, who are listed in the final table. At least 75% of the Board’s members are considered to be independent, i.e., not “interested persons” as defined in Section 2(a)(19) of the 1940 Act, of the Boards of T. Rowe Price Associates, Inc. (T. Rowe Price), and its affiliates; “interested” directors and officers are employees of T. Rowe Price. The business address of each director and officer is 100 East Pratt Street, Baltimore, Maryland 21202. The Statement of Additional Information includes additional information about the fund directors and is available without charge by calling a T. Rowe Price representative at 1-800-638-5660.
INDEPENDENT DIRECTORS(a)
Name
(Year of Birth)
Year Elected
[Number of T. Rowe Price
Portfolios Overseen] | | Principal Occupation(s) and Directorships of Public Companies and
Other Investment Companies During the Past Five Years |
| | | |
Teresa Bryce Bazemore
(1959)
2018
[204] | | President and Chief Executive Officer, Federal Home Loan Bank of San Francisco (2021 to present); President, Radian Guaranty (2008 to 2017); Chief Executive Officer, Bazemore Consulting LLC (2018 to 2021); Director, Chimera Investment Corporation (2017 to 2021); Director, First Industrial Realty Trust (2020 to present); Director, Federal Home Loan Bank of Pittsburgh (2017 to 2019) |
| | | |
Ronald J. Daniels
(1959)
2018
[204] | | President, The Johns Hopkins University(b) and Professor, Political Science Department, The Johns Hopkins University (2009 to present); Director, Lyndhurst Holdings (2015 to present); Director, BridgeBio Pharma, Inc. (2020 to present) |
| | | |
Bruce W. Duncan
(1951)
2013
[204] | | President, Chief Executive Officer, and Director, CyrusOne, Inc. (2020 to 2021); Chief Executive Officer and Director (2009 to 2016), Chair of the Board (2016 to 2020), and President (2009 to 2016), First Industrial Realty Trust, owner and operator of industrial properties; Chair of the Board (2005 to 2016) and Director (1999 to 2016), Starwood Hotels & Resorts, a hotel and leisure company; Member, Investment Company Institute Board of Governors (2017 to 2019); Member, Independent Directors Council Governing Board (2017 to 2019); Senior Advisor, KKR (2018 to present); Director, Boston Properties (2016 to present); Director, Marriott International, Inc. (2016 to 2020) |
| | | |
Robert J. Gerrard, Jr.
(1952)
2012
[204] | | Advisory Board Member, Pipeline Crisis/Winning Strategies, a collaborative working to improve opportunities for young African Americans (1997 to 2016); Chair of the Board, all funds (July 2018 to present) |
| | | |
Paul F. McBride
(1956)
2013
[204] | | Advisory Board Member, Vizzia Technologies (2015 to present); Board Member, Dunbar Armored (2012 to 2018) |
| | | |
Cecilia E. Rouse, Ph.D.(c)
(1963)
2012
[0] | | Dean, Princeton School of Public and International Affairs (2012 to present); Professor and Researcher, Princeton University (1992 to present); Director of Education Studies Committee, MDRC, a nonprofit education and social policy research organization (2011 to 2020); Member, National Academy of Education (2010 to present); Board Member, National Bureau of Economic Research (2011 to present); Board Member of the Council on Foreign Relations (2018 to present); Board Member, The Pennington School (2017 to present); Board Member, the University of Rhode Island (2020 to present); Chair of Committee on the Status of Minority Groups in the Economic Profession of the American Economic Association (2012 to 2018); Vice President (2015 to 2016) and Board Member (2018 to present), American Economic Association |
| | | |
John G. Schreiber(d)
(1946)
2001
[0] | | Owner/President, Centaur Capital Partners, Inc., a real estate investment company (1991 to present); Cofounder, Partner, and Cochair of the Investment Committee, Blackstone Real Estate Advisors, L.P. (1992 to 2015); Director, Blackstone Mortgage Trust, a real estate finance company (2012 to 2016); Director and Chair of the Board, Brixmor Property Group, Inc. (2013 to present); Director, Hilton Worldwide (2007 to present); Director, Hudson Pacific Properties (2014 to 2016); Director, Invitation Homes (2014 to 2017); Director, JMB Realty Corporation (1980 to present) |
| | | |
Kellye Walker(e)
(1966)
2021
[204] | | Executive Vice President and Chief Legal Officer, Eastman Chemical Company (April 2020 to present); Executive Vice President and Chief Legal Officer, Huntington Ingalls Industries, Inc. (NYSE: HIl) (January 2015 to March 2020); Director, Lincoln Electric Company (October 2020 to present) |
(a)All information about the independent directors was current as of December 31, 2020, unless otherwise indicated, except for the number of portfolios overseen, which is current as of the date of this report.
(b)William J. Stromberg, chair of the Board, director, and chief executive officer of T. Rowe Price Group, Inc., the parent company of the Price Funds’ investment advisor, has served on the Board of Trustees of Johns Hopkins University since 2014.
(c)Effective March 4, 2021, Dr. Rouse resigned from her role as independent director of the Price Funds.
(d)Effective December 31, 2021, Mr. Schreiber resigned from his role as independent director of the Price Funds.
(e)Effective November 8, 2021, Ms. Walker was elected as independent director of the Price Funds.
INSIDE DIRECTORS(a)
Name
(Year of Birth)
Year Elected
[Number of T. Rowe Price
Portfolios Overseen] | | Principal Occupation(s) and Directorships of Public Companies and
Other Investment Companies During the Past Five Years |
| | | |
David Oestreicher
(1967)
2018
[204] | | General Counsel, Vice President, and Secretary, T. Rowe Price Group, Inc.; Chair of the Board, Chief Executive Officer, President, and Secretary, T. Rowe Price Trust Company; Director, Vice President, and Secretary, T. Rowe Price, T. Rowe Price Investment Services, Inc., T. Rowe Price Retirement Plan Services, Inc., and T. Rowe Price Services, Inc.; Director and Secretary, T. Rowe Price Investment Management, Inc. (Price Investment Management); Vice President and Secretary, T. Rowe Price International (Price International); Vice President, T. Rowe Price Hong Kong (Price Hong Kong), T. Rowe Price Japan (Price Japan), and T. Rowe Price Singapore (Price Singapore); Principal Executive Officer and Executive Vice President, all funds |
| | | |
Robert W. Sharps, CFA, CPA
(1971)
2017
[204] | | Director and Vice President, T. Rowe Price; President, T. Rowe Price Group, Inc.; Director, Price Investment Management, Inc.; Vice President, T. Rowe Price Trust Company |
(a)All information about the interested directors was current as of December 31, 2020, unless otherwise indicated, except for the number of portfolios overseen, which is current as of the date of this report.
OFFICERS
Name (Year of Birth)
Position Held With Capital
Appreciation Fund | | Principal Occupation(s) |
| | | |
Timothy Francis Bei (1973)
Vice President | | Vice President, T. Rowe Price and T. Rowe Price Group, Inc |
| | | |
Paul Cho (1986)
Vice President | | Vice President, T. Rowe Price and T. Rowe Price Group, Inc. |
| | | |
Alan S. Dupski, CPA (1982)
Principal Financial Officer, Vice President, and Treasurer | | Vice President, T. Rowe Price, T. Rowe Price Group, Inc., and T. Rowe Price Trust Company |
| | | |
Donald J. Easley, CFA, (1971)
Vice President | | Vice President, Price Investment Management, T. Rowe Price, and T. Rowe Price Group, Inc. |
| | | |
Matthew Frustaci (1990)
Vice President | | Employee, T. Rowe Price; formerly student, The Wharton School, University of Pennsylvania (to 2020); summer intern, T. Rowe Price (2019); Finance and Strategy Manager, CircleCI (to 2018); and Investment Associate, Summit Partners, L.P. (to 2017) |
| | | |
John R. Gilner (1961)
Chief Compliance Officer | | Chief Compliance Officer and Vice President, T. Rowe Price; Vice President, T. Rowe Price Group, Inc., and T. Rowe Price Investment Services, Inc. |
| | | |
David R. Giroux, CFA (1975)
President Gary J. | | Vice President, T. Rowe Price, T. Rowe Price Group, Inc., and T. Rowe Price Trust Company |
| | | |
Greb (1961)
Vice President | | Vice President, Price Investment Management, T. Rowe Price, Price International, and T. Rowe Price Trust Company |
| | | |
Steven D. Krichbaum (1977)
Vice President | | Vice President, Price Investment Management, T. Rowe Price, and T. Rowe Price Group, Inc. |
| | | |
Paul J. Krug, CPA (1964)
Vice President | | Vice President, T. Rowe Price, T. Rowe Price Group, Inc., and T. Rowe Price Trust Company |
| | | |
Kevin Patrick Loome, CFA, (1967)
Vice President | | Vice President, Price Investment Management, T. Rowe Price, and T. Rowe Price Group, Inc.; formerly, Head of U.S. Credit, Henderson Global Investors (to 2017 |
| | | |
Brad Moldin (1979)
Vice President | | Vice President, T. Rowe Price and T. Rowe Price Group, Inc.; formerly, Equity Research Analyst, Fidelity Investments (to 2019) |
| | | |
Fran M. Pollack-Matz (1961)
Vice President and Secretary | | Vice President, T. Rowe Price, T. Rowe Price Group, Inc., T. Rowe Price Investment Services, Inc., and T. Rowe Price Services, Inc. |
| | | |
Vivek Rajeswaran (1985)
Vice President | | Vice President, T. Rowe Price and T. Rowe Price Group, Inc. |
| | | |
Shannon H. Rauser (1987)
Assistant Secretary | | Assistant Vice President, T. Rowe Price |
| | | |
Farris G. Shuggi (1984)
Vice President | | Vice President, T. Rowe Price and T. Rowe Price Group, Inc. |
| | | |
Mike Signore (1987)
Vice President | | Employee, T. Rowe Price; formerly, Equity Research Associate, William Blair & Company, L.L.C. (to 2017) |
| | | |
Brian Solomon, CFA (1986)
Vice President | | Vice President, T. Rowe Price and T. Rowe Price Group, Inc. |
| | | |
Matthew Stevenson (1991)
Vice President | | Vice President, T. Rowe Price; formerly, student, Columbia Business School (to 2019); Equity Research Associate, SunTrust Robinson Humphrey (to 2017) |
| | | |
Chen Tian (1993)
Vice President | | Vice President, T. Rowe Price |
| | | |
Megan Warren (1968)
Vice President | | Vice President, T. Rowe Price, T. Rowe Price Group, Inc., T. Rowe Price Retirement Plan Services, Inc., T. Rowe Price Services, Inc., and T. Rowe Price Trust Company; formerly, Executive Director, JPMorgan Chase (to 2017) |
| | | |
Tamara P. Wiggs (1979)
Vice President | | Vice President, T. Rowe Price and T. Rowe Price Group, Inc. |
| | | |
Jon Davis Wood, CFA (1979)
Vice President | | Vice President, T. Rowe Price and T. Rowe Price Group, Inc. |
| | | |
Ashley R. Woodruff, CFA (1979)
Vice President | | Vice President, Price Investment Management, T. Rowe Price, and T. Rowe Price Group, Inc. |
Unless otherwise noted, officers have been employees of T. Rowe Price or Price International for at least 5 years.
Item 1. (b) Notice pursuant to Rule 30e-3.
Not applicable.
Item 2. Code of Ethics.
The registrant has adopted a code of ethics, as defined in Item 2 of Form N-CSR, applicable to its principal executive officer, principal financial officer, principal accounting officer or controller, or persons performing similar functions. A copy of this code of ethics is filed as an exhibit to this Form N-CSR. No substantive amendments were approved or waivers were granted to this code of ethics during the period covered by this report.
Item 3. Audit Committee Financial Expert.
The registrant’s Board of Directors has determined that Ms. Teresa Bryce Bazemore qualifies as an audit committee financial expert, as defined in Item 3 of Form N-CSR. Ms. Bazemore is considered independent for purposes of Item 3 of Form N-CSR.
Item 4. Principal Accountant Fees and Services.
(a) – (d) Aggregate fees billed for the last two fiscal years for professional services rendered to, or on behalf of, the registrant by the registrant’s principal accountant were as follows:
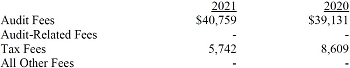
Audit fees include amounts related to the audit of the registrant’s annual financial statements and services normally provided by the accountant in connection with statutory and regulatory filings. Audit-related fees include amounts reasonably related to the performance of the audit of the registrant’s financial statements and specifically include the issuance of a report on internal controls and, if applicable, agreed-upon procedures related to fund acquisitions. Tax fees include amounts related to services for tax compliance, tax planning, and tax advice. The nature of these services specifically includes the review of distribution calculations and the preparation of Federal, state, and excise tax returns. All other fees include the registrant’s pro-rata share of amounts for agreed-upon procedures in conjunction with service contract approvals by the registrant’s Board of Directors/Trustees.
(e)(1) The registrant’s audit committee has adopted a policy whereby audit and non-audit services performed by the registrant’s principal accountant for the registrant, its investment adviser, and any entity controlling, controlled by, or under common control with the investment adviser that provides ongoing services to the registrant require pre-approval in advance at regularly scheduled audit committee meetings. If such a service is required between regularly scheduled audit committee meetings, pre-approval may be authorized by one audit committee member with ratification at the next scheduled audit committee meeting. Waiver of pre-approval for audit or non-audit services requiring fees of a de minimis amount is not permitted.
(2) No services included in (b) – (d) above were approved pursuant to paragraph (c)(7)(i)(C) of Rule 2-01 of Regulation S-X.
(f) Less than 50 percent of the hours expended on the principal accountant’s engagement to audit the registrant’s financial statements for the most recent fiscal year were attributed to work performed by persons other than the principal accountant’s full-time, permanent employees.
(g) The aggregate fees billed for the most recent fiscal year and the preceding fiscal year by the registrant’s principal accountant for non-audit services rendered to the registrant, its investment adviser, and any entity controlling, controlled by, or under common control with the investment adviser that provides ongoing services to the registrant were $3,732,000 and $3,781,000, respectively.
(h) All non-audit services rendered in (g) above were pre-approved by the registrant’s audit committee. Accordingly, these services were considered by the registrant’s audit committee in maintaining the principal accountant’s independence.
Item 5. Audit Committee of Listed Registrants.
Not applicable.
Item 6. Investments.
(a) Not applicable. The complete schedule of investments is included in Item 1 of this Form N-CSR.
(b) Not applicable.
Item 7. Disclosure of Proxy Voting Policies and Procedures for Closed-End Management Investment Companies.
Not applicable.
Item 8. Portfolio Managers of Closed-End Management Investment Companies.
Not applicable.
Item 9. Purchases of Equity Securities by Closed-End Management Investment Company and Affiliated Purchasers.
Not applicable.
Item 10. Submission of Matters to a Vote of Security Holders.
There has been no change to the procedures by which shareholders may recommend nominees to the registrant’s board of directors.
Item 11. Controls and Procedures.
(a) The registrant’s principal executive officer and principal financial officer have evaluated the registrant’s disclosure controls and procedures within 90 days of this filing and have concluded that the registrant’s disclosure controls and procedures were effective, as of that date, in ensuring that information required to be disclosed by the registrant in this Form N-CSR was recorded, processed, summarized, and reported timely.
(b) The registrant’s principal executive officer and principal financial officer are aware of no change in the registrant’s internal control over financial reporting that occurred during the period covered by this report that has materially affected, or is reasonably likely to materially affect, the registrant’s internal control over financial reporting.
Item 12. Disclosure of Securities Lending Activities for Closed-End Management Investment Companies.
Not applicable.
Item 13. Exhibits.
(a)(1) The registrant’s code of ethics pursuant to Item 2 of Form N-CSR is attached.
(2) Separate certifications by the registrant’s principal executive officer and principal financial officer, pursuant to Section 302 of the Sarbanes-Oxley Act of 2002 and required by Rule 30a-2(a) under the Investment Company Act of 1940, are attached.
(3) Written solicitation to repurchase securities issued by closed-end companies: not applicable.
(b) A certification by the registrant’s principal executive officer and principal financial officer, pursuant to Section 906 of the Sarbanes-Oxley Act of 2002 and required by Rule 30a-2(b) under the Investment Company Act of 1940, is attached.
SIGNATURES
Pursuant to the requirements of the Securities Exchange Act of 1934 and the Investment Company Act of 1940, the registrant has duly caused this report to be signed on its behalf by the undersigned, thereunto duly authorized.
T. Rowe Price Capital Appreciation Fund, Inc.
| | | By | /s/ David Oestreicher |
| | | | David Oestreicher |
| | | | Principal Executive Officer |
| | | | |
| Date February 15, 2022 | | | |
Pursuant to the requirements of the Securities Exchange Act of 1934 and the Investment Company Act of 1940, this report has been signed below by the following persons on behalf of the registrant and in the capacities and on the dates indicated.
| | | By | /s/ David Oestreicher |
| | | | David Oestreicher |
| | | | Principal Executive Officer |
| | | | |
| Date February 15, 2022 | | | |
| | | By | /s/ Alan S. Dupski |
| | | | Alan S. Dupski |
| | | | Principal Financial Officer |
| | | | |
| Date February 15, 2022 | | | |