UNITED STATES
SECURITIES AND EXCHANGE COMMISSION
WASHINGTON, D. C. 20549
FORM N-CSRS
Investment Company Act file number: 811-04670
Deutsche Global/International Fund, Inc.
(Exact Name of Registrant as Specified in Charter)
345 Park Avenue
New York, NY 10154-0004
(Address of Principal Executive Offices) (Zip Code)
Registrant’s Telephone Number, including Area Code: (212) 250-3220
Paul Schubert
60 Wall Street
New York, NY 10005
(Name and Address of Agent for Service)
| Date of fiscal year end: | 10/31 |
| | |
| Date of reporting period: | 4/30/2016 |
| ITEM 1. | REPORT TO STOCKHOLDERS |
| | |
April 30, 2016
Semiannual Report
to Shareholders
Deutsche Enhanced Global Bond Fund

Contents
3 Letter to Shareholders 5 Performance Summary 8 Portfolio Management Team 9 Portfolio Summary 15 Investment Portfolio 31 Statement of Assets and Liabilities 33 Statement of Operations 35 Statement of Changes in Net Assets 36 Financial Highlights 39 Notes to Financial Statements 57 Information About Your Fund's Expenses 59 Advisory Agreement Board Considerations and Fee Evaluation 64 Account Management Resources 66 Privacy Statement |
This report must be preceded or accompanied by a prospectus. To obtain a summary prospectus, if available, or prospectus for any of our funds, refer to the Account Management Resources information provided in the back of this booklet. We advise you to consider the fund's objectives, risks, charges and expenses carefully before investing. The summary prospectus and prospectus contain this and other important information about the fund. Please read the prospectus carefully before you invest.
Bond investments are subject to interest-rate, credit, liquidity and market risks to varying degrees. When interest rates rise, bond prices generally fall. Credit risk refers to the ability of an issuer to make timely payments of principal and interest. The fund may use derivatives, including as part of its currency strategy. Investing in derivatives entails special risks relating to liquidity, leverage and credit that may reduce returns and/or increase volatility. The fund’s currency overlay strategy is dependent on the effectiveness and implementation of portfolio management’s proprietary models. As part of its currency strategy, the fund’s exposure to foreign currencies could cause lower returns or even losses because foreign currency rates may fluctuate significantly over short periods of time for a number of reasons. Emerging markets tend to be more volatile and less liquid than the markets of more mature economies, and generally have less diverse and less mature economic structures and less stable political systems than those of developed countries. Investing in foreign securities presents certain risks, such as currency fluctuations, political and economic changes, and market risks. The fund may lend securities to approved institutions. See the prospectus for details.
Deutsche Asset Management represents the asset management activities conducted by Deutsche Bank AG or any of its subsidiaries.
NOT FDIC/NCUA INSURED NO BANK GUARANTEE MAY LOSE VALUE NOT A DEPOSIT NOT INSURED BY ANY FEDERAL GOVERNMENT AGENCY
Letter to Shareholders
Dear Shareholder:
Seven years into our economic recovery, you might be wondering "where’s the proof?" The strong U.S. dollar and sluggish growth have hampered exports and manufacturing. Low oil prices are raising concerns about the energy sector. A steep sell-off in the first quarter, plus a contentious U.S. election campaign and ongoing geopolitical issues, have led many to question what lies ahead.
Our analysts see a case for continued, albeit modest, growth in the U.S. economy. Households have reduced debt and are seeing gains in real income thanks to improving labor markets and lower energy prices. Businesses remain reasonably well positioned financially, with an added boost to purchasing power from lower energy prices. Lastly, while the Federal Reserve Board has initiated the process of raising short-term interest rates, we are confident that "low and slow" will continue to be the watchwords for a while.
The later stages of an economic recovery tend to bring increased volatility and more challenges to achieving positive investment returns. We believe that active management — careful sector allocation and security selection driven by deep research — can make a difference in this environment.
In the end, it is important to remember the core reason for investing: long- term goals and a desire for growth tempered by reasonable risk management. We appreciate your trust and welcome the opportunity to put our resources, experience and expertise to work in helping you meet your goals.
Best regards,

 |
Brian Binder President, Deutsche Funds |
Please note: Deutsche Asset & Wealth Management is now two distinct businesses: Deutsche Asset Management and Deutsche Bank Wealth Management. As a result, our key service providers were renamed Deutsche AM Service Company; Deutsche AM Distributors, Inc. and Deutsche AM Trust Company, effective May 9, 2016.
Assumptions, estimates and opinions contained in this document constitute our judgment as of the date of the document and are subject to change without notice. Any projections are based on a number of assumptions as to market conditions and there can be no guarantee that any projected results will be achieved. Past performance is not a guarantee of future results.
Performance Summary April 30, 2016 (Unaudited)
| Class A | 6-Month‡ | 1-Year | 5-Year | 10-Year |
| Average Annual Total Returns as of 4/30/16 |
| Unadjusted for Sales Charge | 2.25% | 0.66% | –0.22% | 3.27% |
| Adjusted for the Maximum Sales Charge (max 4.50% load) | –2.35% | –3.87% | –1.14% | 2.79% |
| Barclays Global Aggregate Bond Index† | 6.09% | 4.84% | 1.46% | 4.29% |
| Average Annual Total Returns as of 3/31/16 (most recent calendar quarter end) |
| Unadjusted for Sales Charge | | 0.18% | 0.24% | 3.33% |
| Adjusted for the Maximum Sales Charge (max 4.50% load) | | –4.33% | –0.68% | 2.86% |
| Barclays Global Aggregate Bond Index† | | 4.57% | 1.81% | 4.35% |
| Class C | 6-Month‡ | 1-Year | 5-Year | 10-Year |
| Average Annual Total Returns as of 4/30/16 |
| Unadjusted for Sales Charge | 1.87% | –0.10% | –0.97% | 2.50% |
| Adjusted for the Maximum Sales Charge (max 1.00% CDSC) | 0.87% | –0.10% | –0.97% | 2.50% |
| Barclays Global Aggregate Bond Index† | 6.09% | 4.84% | 1.46% | 4.29% |
| Average Annual Total Returns as of 3/31/16 (most recent calendar quarter end) |
| Unadjusted for Sales Charge | | –0.68% | –0.50% | 2.56% |
| Adjusted for the Maximum Sales Charge (max 1.00% CDSC) | | –0.68% | –0.50% | 2.56% |
| Barclays Global Aggregate Bond Index† | | 4.57% | 1.81% | 4.35% |
| Class S | 6-Month‡ | 1-Year | 5-Year | 10-Year |
| Average Annual Total Returns as of 4/30/16 |
| No Sales Charges | 2.26% | 0.80% | 0.02% | 3.53% |
| Barclays Global Aggregate Bond Index† | 6.09% | 4.84% | 1.46% | 4.29% |
| Average Annual Total Returns as of 3/31/16 (most recent calendar quarter end) |
| No Sales Charges | | 0.42% | 0.51% | 3.61% |
| Barclays Global Aggregate Bond Index† | | 4.57% | 1.81% | 4.35% |
Performance in the Average Annual Total Returns table(s) above and the Growth of an Assumed $10,000 Investment line graph that follows is historical and does not guarantee future results. Investment return and principal fluctuate, so your shares may be worth more or less when redeemed. Current performance may differ from performance data shown. Please visit deutschefunds.com for the Fund's most recent month-end performance. Fund performance includes reinvestment of all distributions. Unadjusted returns do not reflect sales charges and would have been lower if they had.
The gross expense ratios of the Fund, as stated in the fee table of the prospectus dated February 1, 2016 are 1.31%, 2.07% and 1.01% for Class A, Class C and Class S shares, respectively, and may differ from the expense ratios disclosed in the Financial Highlights tables in this report.
The Fund may charge a 2% fee for redemptions of shares held less than 15 days.
Index returns do not reflect any fees or expenses and it is not possible to invest directly into an index.
Performance figures do not reflect the deduction of taxes that a shareholder would pay on fund distributions or the redemption of fund shares.
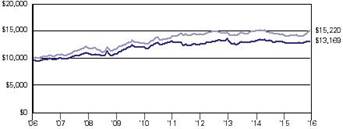
| Growth of an Assumed $10,000 Investment (Adjusted for Maximum Sales Charge) |
■ Deutsche Enhanced Global Bond Fund — Class A ■ Barclays Global Aggregate Bond Index† |
 |
| Yearly periods ended April 30 |
The Fund's growth of an assumed $10,000 investment is adjusted for the maximum sales charge of 4.50%. This results in a net initial investment of $9,550.
The growth of $10,000 is cumulative.
† Barclays Global Aggregate Bond Index is an unmanaged, broad-based, global investment-grade fixed-income measure comprised of three component indices, the U.S. Aggregate Index, the Pan-European Aggregate Index and the Asian-Pacific Aggregate Index.
‡ Total returns shown for periods less than one year are not annualized.
| | Class A | Class C | Class S |
| Net Asset Value |
| 4/30/16 | $ 9.03 | $ 9.03 | $ 9.01 |
| 10/31/15 | $ 8.91 | $ 8.92 | $ 8.90 |
| Distribution Information as of 4/30/16 |
| Income Dividends, Six Months | $ .08 | $ .05 | $ .09 |
| April Income Dividend | $ .0132 | $ .0076 | $ .0150 |
| SEC 30-day Yield†† | 1.51% | .84% | 1.83% |
| Current Annualized Distribution Rate†† | 1.75% | 1.01% | 2.00% |
†† The SEC yield is net investment income per share earned over the month ended April 30, 2016, shown as an annualized percentage of the maximum offering price per share on the last day of the period. The SEC yield is computed in accordance with a standardized method prescribed by the Securities and Exchange Commission. The SEC yield would have been 1.37%, 0.61% and 1.69% for Class A, C and S shares, respectively, had certain expenses not been reduced. Current annualized distribution rate is the latest monthly dividend shown as an annualized percentage of net asset value on April 30, 2016. Distribution rate simply measures the level of dividends and is not a complete measure of performance. The current annualized distribution rate would have been 1.61%, 0.78% and 1.86% for Class A, C and S shares, respectively, had certain expenses not been reduced. Yields and distribution rates are historical, not guaranteed and will fluctuate.
Portfolio Management Team
John D. Ryan, Managing Director
Portfolio Manager of the fund. Began managing the fund in 2012.
— Joined Deutsche Asset Management in 2010 from Northern Trust where he served as a senior portfolio manager. Previously, he served as portfolio manager and head of credit trading for Deutsche Asset Management from 1998–2003.
— Investment industry experience began in 1993.
— BA in Economics, University of Chicago; MBA, University of Chicago.
Darwei Kung, Director
Portfolio Manager of the fund. Began managing the fund in 2012.
— Joined Deutsche Asset Management in 2006; previously has worked as a Director, Engineering and Business Development at Calpoint LLC from 2001–2004.
— Portfolio Manager: New York.
— BS and MS, University of Washington, Seattle; MS and MBA, Carnegie Mellon University.
Gary Russell, CFA, Managing Director
Portfolio Manager of the fund. Began managing the fund in 2012.
— Joined Deutsche Asset Management in 1996. Served as the Head of the High Yield group in Europe and as an Emerging Markets Portfolio Manager.
— Prior to that, he spent four years at Citicorp as a research analyst and structurer of collateralized mortgage obligations. Prior to Citicorp, he served as an officer in the US Army from 1988 to 1991.
— Head of US High Yield Bonds: New York.
— BS, United States Military Academy (West Point); MBA, New York University, Stern School of Business.
Rahmila Nadi, Assistant Vice President
Portfolio Manager of the fund. Began managing the fund in 2013.
— Joined Deutsche Asset Management in 2012. Prior industry experience of six years at J.P. Morgan Chase in credit portfolio trading.
— BA, Columbia University, Columbia College; MBA, S.C. Johnson Graduate School of Management at Cornell University.
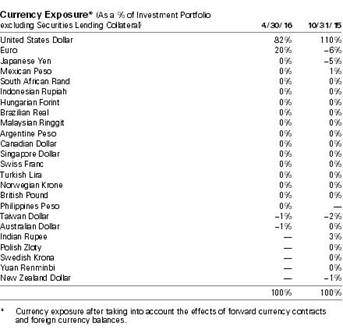
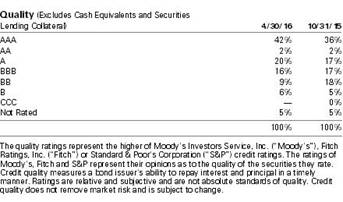
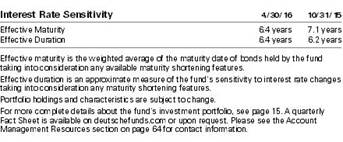
Portfolio Summary (Unaudited)
Investment Portfolio as of April 30, 2016 (Unaudited)
| | Principal Amount ($)(a) | Value ($) |
| | | | | |
| Bonds 95.8% |
| Argentina 1.0% |
| Provincia de Buenos Aires, 144A, 9.125%, 3/16/2024 | | 375,000 | 399,375 |
| Republic of Argentina, 144A, 6.25%, 4/22/2019 | | 400,000 | 414,800 |
| (Cost $770,279) | 814,175 |
| Australia 0.7% |
| Macquarie Group Ltd., 144A, 6.0%, 1/14/2020 | | 200,000 | 221,462 |
| QBE Insurance Group Ltd., 144A, 2.4%, 5/1/2018 | | 200,000 | 201,178 |
| Rio Tinto Finance U.S.A. Ltd., 3.75%, 6/15/2025 | | 50,000 | 51,252 |
| Scentre Group Trust 1, 144A, (REIT), 3.5%, 2/12/2025 | | 80,000 | 80,328 |
| Suncorp-Metway Ltd., 144A, 2.1%, 5/3/2019 (b) | | 30,000 | 30,177 |
| (Cost $576,115) | 584,397 |
| British Virgin Islands 0.6% |
| Gold Fields Orogen Holdings BVI Ltd., 144A, 4.875%, 10/7/2020 (Cost $462,784) | | 500,000 | 467,500 |
| Canada 0.3% |
| Manulife Financial Corp.: |
| | 4.9%, 9/17/2020 | | 40,000 | 43,675 |
| | 5.375%, 3/4/2046 | | 60,000 | 64,088 |
| Yamana Gold, Inc., 4.95%, 7/15/2024 | | 160,000 | 147,166 |
| (Cost $263,261) | 254,929 |
| Cayman Islands 0.1% |
| Noble Holding International Ltd., 5.0%, 3/16/2018 | | 10,000 | 9,800 |
| Seagate HDD Cayman, 5.75%, 12/1/2034 | | 60,000 | 40,195 |
| (Cost $69,802) | 49,995 |
| Chile 0.3% |
| Corp. Nacional del Cobre de Chile, 144A, 4.5%, 9/16/2025 (c) (Cost $196,916) | | 200,000 | 208,917 |
| Costa Rica 0.2% |
| Republic of Costa Rica, 144A, 7.158%, 3/12/2045 (Cost $184,883) | | 200,000 | 186,500 |
| Dominican Republic 0.7% |
| Dominican Republic, 144A, 6.875%, 1/29/2026 (Cost $551,650) | | 550,000 | 591,250 |
| El Salvador 0.3% |
| Republic of El Salvador: |
| | 144A, 6.375%, 1/18/2027 | | 100,000 | 88,000 |
| | 144A, 7.65%, 6/15/2035 | | 200,000 | 179,500 |
| (Cost $312,000) | 267,500 |
| France 0.3% |
| Societe Generale SA, 144A, 2.625%, 9/16/2020 (Cost $210,531) | | 210,000 | 214,496 |
| Germany 7.1% |
| Federal Republic of Germany, Series 172, REG S, 0.25%, 10/16/2020 (Cost $5,760,868) | EUR | 5,000,000 | 5,876,107 |
| Hungary 4.5% |
| Republic of Hungary: |
| | 4.0%, 3/25/2019 | | 200,000 | 207,606 |
| | 6.25%, 1/29/2020 | | 2,500,000 | 2,784,375 |
| | 6.375%, 3/29/2021 | | 600,000 | 683,100 |
| | Series 19/A, 6.5%, 6/24/2019 | HUF | 23,200,000 | 97,861 |
| (Cost $3,777,081) | 3,772,942 |
| India 0.3% |
| Reliance Industries Ltd., 144A, 4.125%, 1/28/2025 (Cost $256,572) | | 250,000 | 255,216 |
| Indonesia 2.9% |
| Government of Indonesia, Series FR56, 8.375%, 9/15/2026 | IDR | 1,340,000,000 | 106,312 |
| Pertamina Persero PT, 144A, 5.25%, 5/23/2021 | | 2,000,000 | 2,102,318 |
| Perusahaan Penerbit SBSN Indonesia III, 144A, 4.325%, 5/28/2025 | | 200,000 | 203,400 |
| (Cost $2,392,207) | 2,412,030 |
| Ireland 0.3% |
| GE Capital International Funding Co., 144A, 4.418%, 11/15/2035 (Cost $215,678) | | 210,000 | 230,597 |
| Israel 0.3% |
| Delek & Avner Tamar Bond Ltd., 144A, 5.082%, 12/30/2023 (Cost $253,750) | | 250,000 | 257,187 |
| Italy 0.3% |
| Intesa Sanpaolo SpA, 2.375%, 1/13/2017 (Cost $210,844) | | 210,000 | 210,947 |
| Japan 6.7% |
| Japan Government Five Year Bond, Series 124, 0.1%, 6/20/2020 | JPY | 571,950,000 | 5,443,846 |
| Sumitomo Mitsui Financial Group, Inc., 3.784%, 3/9/2026 | | 80,000 | 83,606 |
| (Cost $4,689,129) | 5,527,452 |
| Kazakhstan 0.3% |
| KazAgro National Management Holding JSC, 144A, 4.625%, 5/24/2023 (Cost $243,433) | | 250,000 | 208,765 |
| Luxembourg 0.5% |
| Actavis Funding SCS, 4.75%, 3/15/2045 | | 30,000 | 30,346 |
| Millicom International Cellular SA, 144A, 6.0%, 3/15/2025 | | 200,000 | 191,500 |
| Rosneft Finance SA, 144A, 6.625%, 3/20/2017 | | 200,000 | 205,500 |
| (Cost $438,656) | 427,346 |
| Malaysia 2.4% |
| Government of Malaysia, 144A, 3.043%, 4/22/2025 (Cost $2,000,000) | | 2,000,000 | 1,991,000 |
| Mexico 9.2% |
| America Movil SAB de CV, 7.125%, 12/9/2024 | MXN | 10,000,000 | 561,767 |
| Cemex SAB de CV: |
| | 144A, 6.5%, 12/10/2019 | | 500,000 | 526,875 |
| | 144A, 7.75%, 4/16/2026 | | 2,250,000 | 2,396,250 |
| Grupo KUO SAB De CV, 144A, 6.25%, 12/4/2022 | | 400,000 | 399,000 |
| United Mexican States: |
| | 4.6%, 1/23/2046 | | 200,000 | 197,700 |
| | Series M, 4.75%, 6/14/2018 | MXN | 60,400,000 | 3,533,249 |
| (Cost $8,765,395) | 7,614,841 |
| Namibia 0.6% |
| Republic of Namibia, 144A, 5.25%, 10/29/2025 (Cost $495,215) | | 500,000 | 491,430 |
| Netherlands 0.7% |
| Bharti Airtel International Netherlands BV, 144A, 5.35%, 5/20/2024 (Cost $545,110) | | 500,000 | 541,768 |
| Panama 0.5% |
| Republic of Panama, 3.875%, 3/17/2028 (Cost $396,060) | | 400,000 | 410,000 |
| Paraguay 0.2% |
| Banco Continental SAECA, 144A, 8.875%, 10/15/2017 (Cost $218,750) | | 200,000 | 204,250 |
| Peru 1.7% |
| Corp. Financiera de Desarrollo SA, 144A, 4.75%, 2/8/2022 | | 500,000 | 530,000 |
| Republic of Peru, 2.75%, 1/30/2026 | EUR | 750,000 | 891,851 |
| (Cost $1,345,671) | 1,421,851 |
| Philippines 0.5% |
| Republic of Philippine, 3.7%, 3/1/2041 (Cost $400,000) | | 400,000 | 426,854 |
| Portugal 0.6% |
| Portugal Obrigacoes do Tesouro, REG S, 144A, 4.35%, 10/16/2017 (Cost $639,841) | EUR | 440,000 | 532,239 |
| Romania 1.4% |
| Government of Romania, 144A, 2.75%, 10/29/2025 (Cost $1,124,686) | EUR | 1,000,000 | 1,175,108 |
| Russia 0.4% |
| Sberbank of Russia, Series 7, REG S, 5.717%, 6/16/2021 | | 200,000 | 210,998 |
| Vnesheconombank, 144A, 6.902%, 7/9/2020 | | 150,000 | 157,500 |
| (Cost $341,058) | 368,498 |
| Slovenia 0.5% |
| Republic of Slovenia: |
| | 144A, 4.75%, 5/10/2018 | | 200,000 | 211,666 |
| | 144A, 5.5%, 10/26/2022 | | 200,000 | 225,790 |
| (Cost $417,619) | 437,456 |
| South Africa 0.9% |
| Republic of South Africa: |
| | Series R186, 10.5%, 12/21/2026 | ZAR | 5,200,000 | 402,872 |
| | Series R186, 10.5%, 12/21/2026 | ZAR | 4,600,000 | 356,386 |
| (Cost $920,484) | 759,258 |
| Sri Lanka 1.1% |
| National Savings Bank, 144A, 5.15%, 9/10/2019 | | 500,000 | 475,000 |
| Republic of Sri Lanka: |
| | 144A, 5.125%, 4/11/2019 | | 200,000 | 199,501 |
| | 144A, 6.85%, 11/3/2025 | | 280,000 | 275,700 |
| (Cost $981,500) | 950,201 |
| Turkey 0.6% |
| Turk Telekomunikasyon AS, 144A, 3.75%, 6/19/2019 | | 250,000 | 253,000 |
| Turkiye Garanti Bankasi AS, 144A, 4.75%, 10/17/2019 | | 210,000 | 215,611 |
| (Cost $458,966) | 468,611 |
| United Kingdom 0.8% |
| Abbey National Treasury Services PLC, 2.5%, 3/14/2019 | 80,000 | 81,253 |
| Barclays Bank PLC, 144A, 6.05%, 12/4/2017 | | 240,000 | 254,084 |
| BP Capital Markets PLC, 3.119%, 5/4/2026 (b) | | 25,000 | 25,171 |
| Ensco PLC: |
| | 4.7%, 3/15/2021 | | 40,000 | 33,500 |
| | 5.75%, 10/1/2044 | | 20,000 | 13,350 |
| HSBC Holdings PLC, 6.375%, 12/29/2049 (c) | | 210,000 | 202,839 |
| Trinity Acquisition PLC, 3.5%, 9/15/2021 | | 25,000 | 25,510 |
| (Cost $642,812) | 635,707 |
| United States 46.0% |
| 21st Century Fox America, Inc.: |
| | 3.7%, 10/15/2025 (c) | | 30,000 | 32,125 |
| | 4.95%, 10/15/2045 (c) | | 20,000 | 22,182 |
| AbbVie, Inc.: |
| | 3.6%, 5/14/2025 | | 50,000 | 52,391 |
| | 4.7%, 5/14/2045 | | 60,000 | 63,724 |
| Actavis, Inc., 3.25%, 10/1/2022 | | 80,000 | 80,986 |
| Air Lease Corp., 3.375%, 6/1/2021 | | 105,000 | 105,262 |
| Altria Group, Inc., 9.95%, 11/10/2038 | | 100,000 | 180,688 |
| American International Group, Inc., 3.3%, 3/1/2021 | | 40,000 | 41,237 |
| Anadarko Petroleum Corp.: |
| | 4.85%, 3/15/2021 | | 20,000 | 20,862 |
| | 5.55%, 3/15/2026 (c) | | 50,000 | 53,594 |
| | 6.6%, 3/15/2046 | | 21,000 | 23,769 |
| Anheuser-Busch InBev Finance, Inc., 4.9%, 2/1/2046 | | 75,000 | 85,054 |
| Anthem, Inc., 3.3%, 1/15/2023 | | 30,000 | 30,593 |
| Apollo Investment Corp., 5.25%, 3/3/2025 | | 60,000 | 59,759 |
| Apple, Inc.: |
| | 3.25%, 2/23/2026 | | 55,000 | 57,539 |
| | 3.45%, 2/9/2045 | | 30,000 | 27,336 |
| Ares Capital Corp., 3.875%, 1/15/2020 | | 100,000 | 102,256 |
| AT&T, Inc.: |
| | 3.4%, 5/15/2025 | | 170,000 | 172,811 |
| | 3.8%, 3/15/2022 | | 30,000 | 31,776 |
| | 4.125%, 2/17/2026 | | 45,000 | 48,285 |
| | 4.35%, 6/15/2045 | | 40,000 | 37,493 |
| | 5.65%, 2/15/2047 | | 40,000 | 45,062 |
| Berkshire Hathaway, Inc., 2.75%, 3/15/2023 | | 65,000 | 67,043 |
| Blackstone Holdings Finance Co., LLC, 144A, 5.0%, 6/15/2044 | | 30,000 | 30,811 |
| BMW U.S. Capital LLC, 144A, 2.0%, 4/11/2021 | | 40,000 | 40,188 |
| Capital One NA, 2.95%, 7/23/2021 | | 260,000 | 263,784 |
| CBL & Associates LP: |
| | (REIT), 4.6%, 10/15/2024 | | 50,000 | 45,826 |
| | (REIT), 5.25%, 12/1/2023 | | 80,000 | 77,002 |
| CCO Safari II LLC: |
| | 144A, 3.579%, 7/23/2020 | | 50,000 | 51,903 |
| | 144A, 4.908%, 7/23/2025 | | 30,000 | 32,341 |
| Celgene Corp., 3.875%, 8/15/2025 | | 90,000 | 94,817 |
| Churchill Downs, Inc., 144A, 5.375%, 12/15/2021 | | 16,677 | 17,136 |
| Citigroup, Inc., 1.157%*, 5/1/2017 | | 150,000 | 149,733 |
| ConocoPhillips Co.: |
| | 4.2%, 3/15/2021 | | 25,000 | 26,718 |
| | 4.95%, 3/15/2026 (c) | | 35,000 | 38,688 |
| | 5.95%, 3/15/2046 | | 15,000 | 18,166 |
| Crown Castle International Corp.: |
| | 3.4%, 2/15/2021 | | 35,000 | 36,253 |
| | 3.7%, 6/15/2026 (b) | | 20,000 | 20,307 |
| CSAIL Commercial Mortgage Trust, "A4", Series 2015-C4, 3.808%, 11/15/2048 | 290,000 | 312,915 |
| CVS Health Corp., 5.125%, 7/20/2045 | | 60,000 | 70,119 |
| Diamond Offshore Drilling, Inc., 5.7%, 10/15/2039 | | 30,000 | 23,223 |
| Discovery Communications LLC, 4.875%, 4/1/2043 | | 30,000 | 26,908 |
| Everest Reinsurance Holdings, Inc., 4.868%, 6/1/2044 | | 50,000 | 49,977 |
| Exxon Mobil Corp., 4.114%, 3/1/2046 | | 40,000 | 42,615 |
| Fannie Mae Connecticut Avenue Securities: |
| | "1M1", Series 2016-C02, 2.585%*, 9/25/2028 | | 625,990 | 631,883 |
| | "1M2", Series 2015-C01, 4.733%*, 2/25/2025 | | 1,000,000 | 1,005,997 |
| Federal Home Loan Mortgage Corp.: |
| | "IK", Series 4048, Interest Only, 3.0%, 5/15/2027 | | 698,348 | 66,864 |
| | "PI", Series 3940, Interest Only, 4.0%, 2/15/2041 | | 436,795 | 58,408 |
| | 5.5%, 6/1/2035 | | 1,070,572 | 1,208,944 |
| | "SP", Series 4047, Interest Only, 6.217%**, 12/15/2037 | 463,894 | 57,047 |
| | "JS", Series 3572, Interest Only, 6.367%**, 9/15/2039 | 424,832 | 63,334 |
| Federal National Mortgage Association: |
| | 3.5%, 8/1/2043 (b) | | 3,900,000 | 4,087,079 |
| | 3.5%, 3/1/2046 | | 1,935,957 | 1,998,061 |
| | "4", Series 406, Interest Only, 4.0%, 9/25/2040 | | 308,339 | 52,522 |
| | 4.0%, 9/1/2042 (b) | | 4,000,000 | 4,273,046 |
| | 5.5%, 8/1/2037 | | 568,317 | 642,106 |
| FedEx Corp., 4.55%, 4/1/2046 | | 35,000 | 37,276 |
| Fidelity National Information Services, Inc., 3.625%, 10/15/2020 | | 70,000 | 73,237 |
| Forest Laboratories LLC, 144A, 4.875%, 2/15/2021 | | 90,000 | 98,395 |
| Freddie Mac Structured Agency Credit Risk Debt Notes, "M3", Series 2014-DN2, 4.033%*, 4/25/2024 | 500,000 | 488,072 |
| FS Investment Corp., 4.75%, 5/15/2022 | | 80,000 | 79,057 |
| General Motors Co., 6.6%, 4/1/2036 | | 30,000 | 35,104 |
| General Motors Financial Co., Inc.: |
| | 3.2%, 7/13/2020 | | 100,000 | 101,416 |
| | 5.25%, 3/1/2026 | | 50,000 | 54,851 |
| Glencore Funding LLC, 144A, 4.625%, 4/29/2024 (c) | | 20,000 | 18,050 |
| Government National Mortgage Association: |
| | "HX", Series 2012-91, 3.0%, 9/20/2040 | | 332,977 | 343,295 |
| | "GC", Series 2010-101, 4.0%, 8/20/2040 | | 300,000 | 334,463 |
| | "ME", Series 2014-4, 4.0%, 1/16/2044 | | 800,000 | 893,315 |
| | "PI", Series 2015-40, Interest Only, 4.0%, 4/20/2044 | 401,765 | 44,387 |
| | "AI", Series 2011-94, Interest Only, 4.5%, 1/20/2039 | 991,022 | 39,374 |
| | "PI", Series 2014-108, Interest Only, 4.5%, 12/20/2039 | 357,440 | 49,675 |
| | "EI", Series 2011-162, Interest Only, 4.5%, 5/20/2040 | 713,970 | 39,027 |
| | "DI", Series 2011-40, Interest Only, 4.5%, 12/20/2040 | 736,544 | 23,343 |
| | "IN", Series 2009-69, Interest Only, 5.5%, 8/20/2039 | 323,948 | 53,606 |
| | "IV", Series 2009-69, Interest Only, 5.5%, 8/20/2039 | 409,120 | 69,402 |
| | "IJ", Series 2009-75, Interest Only, 6.0%, 8/16/2039 | 282,889 | 45,872 |
| | 7.0%, 1/15/2029 | | 13,013 | 13,191 |
| | 7.0%, 1/15/2029 | | 7,591 | 7,740 |
| | 7.0%, 1/15/2029 | | 5,882 | 6,524 |
| | 7.0%, 2/15/2029 | | 6,175 | 6,873 |
| | 7.0%, 2/15/2029 | | 9,817 | 10,066 |
| Government Properties Income Trust, (REIT), 3.75%, 8/15/2019 | | 60,000 | 61,248 |
| Hewlett Packard Enterprise Co.: |
| | 144A, 3.6%, 10/15/2020 | | 50,000 | 51,864 |
| | 144A, 4.9%, 10/15/2025 (c) | | 70,000 | 72,653 |
| Hilton U.S.A. Trust, "DFL", Series 2013-HLF, 144A, 3.188%*, 11/5/2030 | | 571,230 | 570,863 |
| Hospitality Properties Trust, (REIT), 5.0%, 8/15/2022 | | 90,000 | 95,192 |
| Jefferies Group LLC, 5.125%, 4/13/2018 | | 80,000 | 83,154 |
| JPMBB Commercial Mortgage Securities Trust: |
| | "A4", Series 2015-C28, 3.227%, 10/15/2048 | | 420,000 | 434,230 |
| | "A3", Series 2014-C19, 3.669%, 4/15/2047 | | 125,000 | 131,894 |
| JPMorgan Chase Commercial Mortgage Securities Corp., "A4", Series 2007-C1, 5.716%, 2/15/2051 | 665,121 | 688,519 |
| Kellogg Co., 3.25%, 4/1/2026 | | 35,000 | 35,897 |
| Kentucky, Asset/Liability Commission, General Fund Revenue, 3.165%, 4/1/2018 | | 306,684 | 312,882 |
| Kinder Morgan Energy Partners LP, 6.375%, 3/1/2041 | | 10,000 | 9,662 |
| KKR Group Finance Co. III LLC, 144A, 5.125%, 6/1/2044 | 40,000 | 39,269 |
| KLA-Tencor Corp., 4.65%, 11/1/2024 | | 20,000 | 20,882 |
| LB-UBS Commercial Mortgage Trust, "A4", Series 2007-C6, 5.858%*, 7/15/2040 | 533,478 | 544,982 |
| Legg Mason, Inc., 5.625%, 1/15/2044 | | 50,000 | 49,799 |
| Loews Corp., 4.125%, 5/15/2043 | | 40,000 | 38,664 |
| Massachusetts Mutual Life Insurance Co., 144A, 4.5%, 4/15/2065 | | 20,000 | 18,303 |
| Molex Electronic Technologies LLC, 144A, 3.9%, 4/15/2025 | 30,000 | 29,310 |
| Morgan Stanley: |
| | 2.5%, 4/21/2021 | | 40,000 | 40,076 |
| | Series F, 5.625%, 9/23/2019 | | 240,000 | 267,127 |
| Nationwide Financial Services, Inc., 144A, 5.3%, 11/18/2044 | 50,000 | 52,308 |
| Newell Brands, Inc.: |
| | 4.2%, 4/1/2026 | | 30,000 | 31,695 |
| | 5.5%, 4/1/2046 (c) | | 20,000 | 22,251 |
| Omega Healthcare Investors, Inc., (REIT), 4.95%, 4/1/2024 | 60,000 | 61,333 |
| PennyMac LLC, "A1", Series 2015-NPL1, 144A, 4.0%, 3/25/2055 | | 784,981 | 779,854 |
| PepsiCo, Inc.: |
| | 2.85%, 2/24/2026 | | 15,000 | 15,449 |
| | 4.45%, 4/14/2046 | | 25,000 | 27,903 |
| Realty Income Corp., (REIT), 2.0%, 1/31/2018 | | 60,000 | 60,337 |
| Reynolds American, Inc., 5.85%, 8/15/2045 | | 30,000 | 36,824 |
| Rowan Companies, Inc., 5.85%, 1/15/2044 | | 30,000 | 20,475 |
| Santander Holdings U.S.A., Inc., 4.5%, 7/17/2025 | | 160,000 | 165,101 |
| Select Income REIT, (REIT), 4.15%, 2/1/2022 | | 60,000 | 59,816 |
| Stryker Corp., 3.375%, 11/1/2025 | | 40,000 | 41,623 |
| Sunoco Logistics Partners Operations LP, 5.3%, 4/1/2044 | 40,000 | 35,703 |
| Swiss Re Treasury U.S. Corp., 144A, 4.25%, 12/6/2042 | 30,000 | 29,779 |
| The Gap, Inc., 5.95%, 4/12/2021 (c) | | 170,000 | 181,296 |
| The Goldman Sachs Group, Inc., 1.26%*, 6/4/2017 | | 100,000 | 99,958 |
| Time Warner Cable, Inc., 7.3%, 7/1/2038 | | 50,000 | 61,467 |
| U.S. Treasury Bill, 0.345%***, 8/11/2016 (d) | | 1,243,000 | 1,242,152 |
| U.S. Treasury Bond, 3.125%, 8/15/2044 | | 59,000 | 64,718 |
| U.S. Treasury Inflation-Indexed Note, 0.375%, 7/15/2025 | 51 | 52 |
| U.S. Treasury Notes: |
| | 1.0%, 8/31/2016 (e) | | 6,846,000 | 6,860,219 |
| | 1.0%, 9/30/2016 | | 500,000 | 501,230 |
| | 1.625%, 2/15/2026 | | 273,000 | 268,265 |
| | 2.5%, 5/15/2024 | | 1,470,000 | 1,558,889 |
| UnitedHealth Group, Inc., 3.75%, 7/15/2025 | | 40,000 | 43,375 |
| Verizon Communications, Inc.: |
| | 3.5%, 11/1/2024 (c) | | 60,000 | 62,547 |
| | 4.672%, 3/15/2055 | | 70,000 | 67,696 |
| Walgreens Boots Alliance, Inc., 4.8%, 11/18/2044 (c) | | 50,000 | 51,240 |
| Wells Fargo & Co., 3.0%, 4/22/2026 | | 50,000 | 49,875 |
| Wells Fargo Commercial Mortgage Trust, "A4", Series 2015-SG1, 3.789%, 12/15/2047 | | 1,750,000 | 1,883,528 |
| Williams Partners LP, 4.0%, 11/15/2021 | | 90,000 | 83,319 |
| (Cost $37,912,045) | 38,138,906 |
| Uruguay 0.0% |
| Republic of Uruguay, 5.1%, 6/18/2050 (Cost $40,558) | | 40,000 | 37,500 |
| Total Bonds (Cost $79,482,209) | 79,423,726 |
| |
Contracts | Value ($) |
| | | | | |
| Put Options Purchased 0.1% |
| Options on Exchange-Traded Futures Contracts |
| Euro Currency, Expiration Date 12/9/2016, Strike Price $1.05 (Cost $122,672) | 70 | 66,500 |
| | | | | |
| |
Shares | Value ($) |
| | | | | |
| Securities Lending Collateral 1.1% |
| Daily Assets Fund "Capital Shares", 0.49% (f) (g) (Cost $861,445) | | 861,445 | 861,445 |
| |
| Cash Equivalents 14.6% |
| Central Cash Management Fund, 0.37% (f) (Cost $12,131,130) | | 12,131,130 | 12,131,130 |
| | % of Net Assets | Value ($) |
| | |
| Total Investment Portfolio (Cost $92,597,456)† | 111.6 | 92,482,801 |
| Other Assets and Liabilities, Net | (11.6) | (9,574,026) |
| Net Assets | 100.0 | 82,908,775 |
* Floating rate securities' yields vary with a designated market index or market rate, such as the coupon-equivalent of the U.S. Treasury Bill rate. These securities are shown at their current rate as of April 30, 2016.
** These securities are shown at their current rate as of April 30, 2016.
*** Annualized yield at time of purchase; not a coupon rate.
† The cost for federal income tax purposes was $92,774,845. At April 30, 2016, net unrealized depreciation for all securities based on tax cost was $292,044. This consisted of aggregate gross unrealized appreciation for all securities in which there was an excess of value over tax cost of $1,987,568 and aggregate gross unrealized depreciation for all securities in which there was an excess of tax cost over value of $2,279,612.
(a) Principal amount stated in U.S. dollars unless otherwise noted.
(b) When-issued or delayed delivery security included.
(c) All or a portion of these securities were on loan. In addition, "Other Assets and Liabilities, Net" may include pending sales that are also on loan. The value of securities loaned at April 30, 2016 amounted to $836,815, which is 1.0% of net assets.
(d) At April 30, 2016, this security has been pledged, in whole or in part, to cover initial margin requirements for open futures contracts.
(e) At April 30, 2016, this security has been pledged, in whole or in part, to cover initial margin requirements for open centrally cleared swap contracts.
(f) Affiliated fund managed by Deutsche Investment Management Americas Inc. The rate shown is the annualized seven-day yield at period end.
(g) Represents collateral held in connection with securities lending. Income earned by the Fund is net of borrower rebates.
144A: Security exempt from registration under Rule 144A of the Securities Act of 1933. These securities may be resold in transactions exempt from registration, normally to qualified institutional buyers.
Interest Only: Interest Only (IO) bonds represent the "interest only" portion of payments on a pool of underlying mortgages or mortgage-backed securities. IO securities are subject to prepayment risk of the pool of underlying mortgages.
REG S: Securities sold under Regulation S may not be offered, sold or delivered within the United States or to, or for the account or benefit of, U.S. persons, except pursuant to an exemption from, or in a transaction not subject to, the registration requirements of the Securities Act of 1933.
REIT: Real Estate Investment Trust
SBSN: Surat Berharga Syariah Negara (Islamic Based Government Securities)
At April 30, 2016, open futures contracts purchased were as follows:
| Futures | Currency | Expiration Date | Contracts | Notional Value ($) | Unrealized Depreciation ($) |
| U.S Treasury Long Bond | USD | 6/21/2016 | 6 | 979,875 | (7,512) |
At April 30, 2016, open futures contracts sold were as follows:
| Futures | Currency | Expiration Date | Contracts | Notional Value ($) | Unrealized Appreciation ($) |
| 10 Year U.S Treasury Note | USD | 6/21/2016 | 75 | 9,754,688 | 36,376 |
| Ultra Long U.S. Treasury Bond | USD | 6/21/2016 | 19 | 3,255,531 | 35,589 |
| Total unrealized appreciation | 71,965 |
At April 30, 2016, open written options contracts were as follows:
| Options on Exchange-Traded Futures Contracts |
| | Contracts | Expiration Date | Strike Price ($) | Premiums Received ($) | Value ($) (h) |
Call Options Euro Currency | 70 | 12/9/2016 | 1.22 | 87,328 | (92,750) |
(h) Unrealized depreciation on written options on exchange-traded futures contracts at April 30, 2016 was $5,422.
| Options on Interest Rate Swap Contracts |
| | Swap Effective/
Expiration Date | Contract Amount | Option Expiration Date | Premiums Received ($) | Value ($) (i) |
Call Options Receive Fixed — 4.48% – Pay Floating — 3-Month LIBOR | 5/9/2016
5/11/2026 | 2,900,0001 | 5/5/2016 | 32,552 | 0 |
Put Options Pay Fixed — 2.0% – Receive Floating — 3-Month LIBOR | 8/15/2016
8/15/2046 | 2,600,0001 | 8/11/2016 | 49,920 | (43,903) |
| Pay Fixed — 2.22% – Receive Floating — 3-Month LIBOR | 7/13/2016
7/13/2046 | 2,600,0002 | 7/11/2016 | 48,880 | (73,620) |
| Pay Fixed — 2.48% – Receive Floating — 3-Month LIBOR | 5/9/2016
5/11/2026 | 2,900,0001 | 5/5/2016 | 32,553 | (209,136) |
| Total Put Options | 131,353 | (326,659) |
| Total | 163,905 | (326,659) |
(i) Unrealized depreciation on written options on interest rate swap contracts at April 30, 2016 was $162,754.
At April 30, 2016, open interest rate swap contracts were as follows:
| Centrally Cleared Swaps |
Effective/
Expiration Dates | Notional Amount ($) | Cash Flows Paid by the Fund | Cash Flows Received by the Fund | Value ($) | Unrealized Appreciation/ (Depreciation) ($) |
2/3/2015
2/3/2045 | 2,600,000 | Fixed — 3.035% | Floating — 3-Month LIBOR | (510,634) | (465,679) |
1/28/2015
1/28/2045 | 2,900,000 | Fixed — 3.088% | Floating — 3-Month LIBOR | (610,177) | (582,148) |
12/16/2015
9/18/2017 | 9,300,000 | Fixed — 1.557% | Floating — 3-Month LIBOR | (139,495) | (145,290) |
12/16/2015
9/16/2020 | 19,300,000 | Fixed — 2.214% | Floating — 3-Month LIBOR | (1,003,673) | (1,018,893) |
9/16/2015
9/16/2045 | 3,900,000 | Fixed —2.5% | Floating — 3-Month LIBOR | (278,147) | (618,010) |
9/16/2015
9/16/2022 | 12,000,000 | Floating — 3-Month LIBOR | Fixed — 2.25% | 657,979 | 543,346 |
12/16/2015
9/16/2025 | 2,300,000 | Floating — 3-Month LIBOR | Fixed — 2.64% | 222,713 | 208,642 |
9/16/2015
9/16/2045 | 3,900,000 | Floating — 3-Month LIBOR | Fixed — 2.75% | 503,264 | 646,387 |
12/16/2015
9/17/2035 | 12,700,000 | Floating — 3-Month LIBOR | Fixed — 2.938% | 1,948,100 | 1,675,454 |
12/16/2015
9/18/2045 | 4,300,000 | Floating — 3-Month LIBOR | Fixed — 2.998% | 836,506 | 699,625 |
9/16/2015
9/16/2045 | 7,794,000 | Floating — 3-Month LIBOR | Fixed — 3.0% | 1,461,410 | 958,339 |
| Total net unrealized appreciation | 1,901,773 |
At April 30, 2016, open credit default swap contracts sold were as follows:
| Centrally Cleared Swaps |
| Expiration Date | Notional Amount ($) (j) | Currency | Fixed Cash Flows Paid | Underlying Debt Obligation/
Quality Rating (k) | Value ($) | Upfront Payments Paid/
(Received) ($) | Unrealized Appreciation ($) |
| 6/20/2021 | 4,300,000 | EUR | 5.0% | Markit iTraxx Europe Crossover Index | 439,752 | 431,470 | 8,282 |
(j) The maximum potential amount of future undiscounted payments that the Fund could be required to make under a credit default swap contract would be the notional amount of the contract. These potential amounts would be partially offset by any recovery values of the referenced debt obligation or net amounts received from the settlement of buy protection credit default swap contracts entered into by the Fund for the same referenced debt obligation, if any.
(k) The quality ratings represent the higher of Moody's Investors Service, Inc. ("Moody's") or Standard & Poor's Corporation ("S&P") credit ratings and are unaudited.
Counterparties:
1 Nomura International PLC
2 Citigroup, Inc.
LIBOR: London Interbank Offered Rate; 3-Month LIBOR rate at April 30, 2016 is 0.64%.
At April 30, 2016, the Fund had the following open forward foreign currency exchange contracts:
| Contracts to Deliver | | In Exchange For | | Settlement Date | Unrealized Appreciation ($) | Counterparty |
| USD | 564,137 | | BRL | 2,100,000 | | 6/16/2016 | 37,915 | Nomura International PLC |
| USD | 3,740,774 | | EUR | 3,300,000 | | 6/20/2016 | 43,378 | JPMorgan Chase Securities, Inc. |
| USD | 836,317 | | EUR | 730,000 | | 6/21/2016 | 811 | Morgan Stanley |
| USD | 4,552,120 | | EUR | 4,000,000 | | 6/21/2016 | 34,883 | Nomura International PLC |
| USD | 556,461 | | BRL | 2,100,000 | | 6/29/2016 | 43,241 | Nomura International PLC |
| USD | 552,632 | | BRL | 2,100,000 | | 7/8/2016 | 45,412 | Macquarie Bank Ltd. |
| USD | 2,004,577 | | EUR | 1,760,000 | | 7/20/2016 | 15,565 | Barclays Bank PLC |
| Total unrealized appreciation | | | 221,205 | |
| Contracts to Deliver | | In Exchange For | | Settlement Date | Unrealized Depreciation ($) | Counterparty |
| MXN | 70,833,200 | | USD | 3,854,553 | | 5/3/2016 | (262,543) | BNP Paribas |
| ZAR | 9,500,000 | | USD | 576,530 | | 5/3/2016 | (90,827) | Citigroup, Inc. |
| BRL | 2,100,000 | | USD | 512,195 | | 5/4/2016 | (98,187) | Macquarie Bank Ltd. |
| BRL | 2,100,000 | | USD | 528,967 | | 5/10/2016 | (80,126) | Nomura International PLC |
| PHP | 19,900,000 | | USD | 420,719 | | 6/6/2016 | (2,887) | BNP Paribas |
| TWD | 26,400,000 | | USD | 803,653 | | 6/8/2016 | (15,134) | Nomura International PLC |
| BRL | 2,100,000 | | USD | 569,414 | | 6/16/2016 | (32,638) | Nomura International PLC |
| JPY | 572,000,000 | | USD | 5,134,926 | | 6/20/2016 | (247,546) | Nomura International PLC |
| AUD | 1,100,000 | | USD | 834,460 | | 6/21/2016 | (239) | Macquarie Bank Ltd. |
| EUR | 1,760,000 | | USD | 1,996,808 | | 7/20/2016 | (23,334) | Barclays Bank PLC |
| Total unrealized depreciation | | | (853,461) | |
| Currency Abbreviations |
AUD Australian Dollar BRL Brazilian Dollar EUR Euro HUF Hungarian Forint IDR Indonesian Rupiah JPY Japanese Yen MXN Mexican Peso PHP Philippine Peso TWD Taiwan Dollar USD United States Dollar ZAR South African Rand |
For information on the Fund's policy and additional disclosures regarding options purchased, futures contracts, credit default swap contracts, interest rate swap contracts, forward foreign currency exchange contracts and written options contracts, please refer to Note B in the accompanying Notes to Financial Statements.
Fair Value Measurements
Various inputs are used in determining the value of the Fund's investments. These inputs are summarized in three broad levels. Level 1 includes quoted prices in active markets for identical securities. Level 2 includes other significant observable inputs (including quoted prices for similar securities, interest rates, prepayment speeds and credit risk). Level 3 includes significant unobservable inputs (including the Fund's own assumptions in determining the fair value of investments). The level assigned to the securities valuations may not be an indication of the risk or liquidity associated with investing in those securities.
The following is a summary of the inputs used as of April 30, 2016 in valuing the Fund's investments. For information on the Fund's policy regarding the valuation of investments, please refer to the Security Valuation section of Note A in the accompanying Notes to Financial Statements.
| Assets | Level 1 | Level 2 | Level 3 | Total |
| |
Fixed Income Investments Bonds (l) | $ — | $ 79,423,726 | $ — | $ 79,423,726 |
| Short-Term Investments (l) | 12,992,575 | — | — | 12,992,575 |
| Derivatives (m) | | | | |
| | Purchased Options | 66,500 | — | — | 66,500 |
| | Futures Contracts | 71,965 | — | — | 71,965 |
| | Interest Rate Swap Contracts | — | 4,731,793 | — | 4,731,793 |
| | Credit Default Swap Contracts | — | 8,282 | — | 8,282 |
| | Forward Foreign Currency Exchange Contracts | — | 221,205 | — | 221,205 |
| Total | $ 13,131,040 | $ 84,385,006 | $ — | $ 97,516,046 |
| Liabilities | Level 1 | Level 2 | Level 3 | Total |
| |
| Derivatives (m) | | | | |
| | Futures Contracts | $ (7,512) | $ — | $ — | $ (7,512) |
| | Written Options | (92,750) | (326,659) | — | (419,409) |
| | Interest Rate Swap Contracts | — | (2,830,020) | — | (2,830,020) |
| | Forward Foreign Currency Exchange Contracts | — | (853,461) | — | (853,461) |
| Total | $ (100,262) | $ (4,010,140) | $ — | $ (4,110,402) |
There have been no transfers between fair value measurement levels during the period ended April 30, 2016.
(l) See Investment Portfolio for additional detailed categorizations.
(m) Derivatives include value of options purchased, unrealized appreciation (depreciation) on open futures contracts, credit default swap contracts, interest rate swap contracts, forward foreign currency exchange contracts, and written options, at value.
The accompanying notes are an integral part of the financial statements.
Statement of Assets and Liabilities
| as of April 30, 2016 (Unaudited) |
| Assets |
Investments: Investments in non-affiliated securities, at value (cost $79,604,881) — including $836,815 of securities loaned | $ 79,490,226 |
| Investment in Daily Assets Fund (cost $861,445)* | 861,445 |
| Investment in Central Cash Management Fund (cost $12,131,130) | 12,131,130 |
| Total investments in securities, at value (cost $92,597,456) | 92,482,801 |
| Foreign currency, at value (cost $498,109) | 484,889 |
| Cash held by broker as collateral for forward foreign currency exchange contracts | 40,000 |
| Receivable for investments sold | 39,547 |
| Receivable for investments sold – when-issued securities | 4,327,799 |
| Receivable for Fund shares sold | 9,841 |
| Interest receivable | 578,993 |
| Receivable for variation margin on centrally cleared swaps | 192,833 |
| Unrealized appreciation on forward foreign currency exchange contracts | 221,205 |
| Foreign taxes recoverable | 3,068 |
| Other assets | 32,769 |
| Total assets | 98,413,745 |
| Liabilities |
| Cash overdraft | 256,496 |
| Payable upon return of securities loaned | 861,445 |
| Payable for investments purchased — when-issued securities | 12,540,314 |
| Payable for Fund shares redeemed | 376,225 |
| Payable for variation margin on futures contracts | 22,044 |
| Options written, at value (premiums received $251,233) | 419,409 |
| Unrealized depreciation on forward foreign currency exchange contracts | 853,461 |
| Accrued management fee | 17,916 |
| Accrued Directors fees | 1,564 |
| Other accrued expenses and payables | 156,096 |
| Total liabilities | 15,504,970 |
| Net assets, at value | $ 82,908,775 |
* Represents collateral on securities loaned.
The accompanying notes are an integral part of the financial statements.
| Statement of Assets and Liabilities as of April 30, 2016 (Unaudited) (continued) |
| Net Assets Consist of |
| Distributions in excess of net investment income | (792,403) |
Net unrealized appreciation (depreciation) on: Investments | (114,655) |
| Swap contracts | 1,910,055 |
| Futures | 64,453 |
| Foreign currency | (657,278) |
| Written options | (168,176) |
| Accumulated net realized gain (loss) | (6,280,177) |
| Paid-in capital | 88,946,956 |
| Net assets, at value | $ 82,908,775 |
| Net Asset Value |
Class A Net Asset Value and redemption price(a) per share ($20,992,869 ÷ 2,324,984 shares of capital stock outstanding, $.01 par value, 50,000,000 shares authorized) | $ 9.03 |
| Maximum offering price per share (100 ÷ 95.50 of $9.03) | $ 9.46 |
Class C Net Asset Value, offering and redemption price(a) (subject to contingent deferred sales charge) per share ($1,777,694 ÷ 196,861 shares of capital stock outstanding, $.01 par value, 20,000,000 shares authorized) | $ 9.03 |
Class S Net Asset Value, offering and redemption price(a) per share ($60,138,212 ÷ 6,671,895 shares of capital stock outstanding, $.01 par value, 309,154,575 shares authorized) | $ 9.01 |
(a) Redemption price per share for shares held less than 15 days is equal to net asset value less a 2% redemption fee.
The accompanying notes are an integral part of the financial statements.
Statement of Operations
| for the six months ended April 30, 2016 (Unaudited) |
| Investment Income |
Income: Interest (net of foreign taxes withheld of $423) | $ 1,024,443 |
| Dividends | 56 |
| Income distributions — Central Cash Management Fund | 11,511 |
| Securities lending income, including income from Daily Assets Fund, net of borrower rebates | 5,348 |
| Total income | 1,041,358 |
Expenses: Management fee | 169,009 |
| Administration fee | 41,222 |
| Services to shareholders | 76,897 |
| Distribution and service fees | 30,887 |
| Custodian fee | 30,886 |
| Professional fees | 54,514 |
| Reports to shareholders | 23,410 |
| Registration fees | 27,180 |
| Directors' fees and expenses | 2,798 |
| Other | 7,780 |
| Total expenses before expense reductions | 464,583 |
| Expense reductions | (86,629) |
| Total expenses after expense reductions | 377,954 |
| Net investment income | 663,404 |
| Realized and Unrealized Gain (Loss) |
Net realized gain (loss) from: Investments | (2,243,027) |
| Swap contracts | (227,542) |
| Futures | (639,330) |
| Written options | 126,240 |
| Foreign currency | 673,064 |
| | (2,310,595) |
Change in net unrealized appreciation (depreciation) on: Investments | 2,959,275 |
| Swap contracts | 1,795,231 |
| Futures | 278,628 |
| Written options | (164,749) |
| Foreign currency | (1,447,518) |
| | 3,420,867 |
| Net gain (loss) | 1,110,272 |
| Net increase (decrease) in net assets resulting from operations | $ 1,773,676 |
The accompanying notes are an integral part of the financial statements.
Statement of Changes in Net Assets
| Increase (Decrease) in Net Assets | Six Months Ended April 30, 2016 (Unaudited) | Year Ended October 31, 2015 | |
| |
Operations: Net investment income | $ 663,404 | $ 2,647,796 | |
| Net realized gain (loss) | (2,310,595) | (4,378,868) | |
| Change in net unrealized appreciation (depreciation) | 3,420,867 | (1,440,562) | |
| Net increase (decrease) in net assets resulting from operations | 1,773,676 | (3,171,634) | |
Distributions to shareholders from: Net investment income: Class A | (162,246) | (586,934) | |
| Class B | (247)* | (7,872) | |
| Class C | (9,722) | (60,665) | |
| Class S | (637,982) | (2,399,580) | |
Net realized gains: Class A | — | (201,405) | |
| Class B | — | (3,865) | |
| Class C | — | (27,265) | |
| Class S | — | (785,692) | |
Return of capital: Class A | — | (84,424) | |
| Class B | — | (1,132) | |
| Class C | — | (8,726) | |
| Class S | — | (345,151) | |
| Total distributions | (810,197) | (4,512,711) | |
Fund share transactions: Proceeds from shares sold | 11,638,238 | 3,161,703 | |
| Reinvestment of distributions | 740,537 | 4,100,262 | |
| Payments for shares redeemed | (12,614,017) | (18,686,114) | |
| Redemption fees | 12 | 5 | |
| Net increase (decrease) in net assets from Fund share transactions | (235,230) | (11,424,144) | |
| Increase (decrease) in net assets | 728,249 | (19,108,489) | |
| Net assets at beginning of period | 82,180,526 | 101,289,015 | |
| Net assets at end of period (including distributions in excess of net investment income of $792,403 and $645,610, respectively) | $ 82,908,775 | $ 82,180,526 | |
* For the period from November 1, 2015 to February 10, 2016 (see Note A).
The accompanying notes are an integral part of the financial statements.
Financial Highlights
| Class A | Six Months Ended 4/30/16 (Unaudited) |
Years Ended October 31, |
| 2015 | 2014 | 2013 | 2012 | 2011 |
| Selected Per Share Data |
| Net asset value, beginning of period | $ 8.91 | $ 9.67 | $ 9.95 | $ 10.42 | $ 10.19 | $ 10.86 |
Income (loss) from investment operations: Net investment incomea | .06 | .25 | .29 | .21 | .23 | .30 |
| Net realized and unrealized gain (loss) | .14 | (.57) | (.08) | (.29) | .21 | (.61) |
| Total from investment operations | .20 | (.32) | .21 | (.08) | .44 | (.31) |
Less distributions from: Net investment income | (.08) | (.30) | (.42) | (.23) | (.21) | (.24) |
| Net realized gains | — | (.10) | (.07) | (.16) | — | (.04) |
| Return of capital | — | (.04) | — | — | — | (.08) |
| Total distributions | (.08) | (.44) | (.49) | (.39) | (.21) | (.36) |
| Redemption fees | .00*** | .00*** | .00*** | .00*** | .00*** | .00*** |
| Net asset value, end of period | $ 9.03 | $ 8.91 | $ 9.67 | $ 9.95 | $ 10.42 | $ 10.19 |
| Total Return (%)b | 2.25c** | (3.41)c | 2.15c | (.84)c | 4.41c | (2.97) |
| Ratios to Average Net Assets and Supplemental Data |
| Net assets, end of period ($ millions) | 21 | 16 | 20 | 24 | 29 | 35 |
| Ratio of expenses before expense reductions (%) | 1.32* | 1.31 | 1.23 | 1.17 | 1.14 | 1.12 |
| Ratio of expenses after expense reductions (%) | 1.09* | 1.04 | 1.02 | 1.03 | 1.13 | 1.12 |
| Ratio of net investment income (%) | 1.43* | 2.76 | 2.96 | 2.07 | 2.25 | 2.83 |
| Portfolio turnover rate (%) | 211** | 336 | 326 | 493 | 395 | 197 |
a Based on average shares outstanding during the period. b Total return does not reflect the effect of any sales charges. c Total return would have been lower had certain expenses not been reduced. * Annualized ** Not annualized *** Amount is less than $.005. |
| | | | | | | | |
| Class C | Six Months Ended 4/30/16 (Unaudited) |
Years Ended October 31, |
| 2015 | 2014 | 2013 | 2012 | 2011 |
| Selected Per Share Data |
| Net asset value, beginning of period | $ 8.92 | $ 9.67 | $ 9.95 | $ 10.42 | $ 10.19 | $ 10.86 |
Income (loss) from investment operations: Net investment incomea | .03 | .18 | .22 | .13 | .15 | .22 |
| Net realized and unrealized gain (loss) | .13 | (.56) | (.08) | (.29) | .22 | (.61) |
| Total from investment operations | .16 | (.38) | .14 | (.16) | .37 | (.39) |
Less distributions from: Net investment income | (.05) | (.23) | (.35) | (.15) | (.14) | (.16) |
| Net realized gains | — | (.10) | (.07) | (.16) | — | (.04) |
| Return of capital | — | (.04) | — | — | — | (.08) |
| Total distributions | (.05) | (.37) | (.42) | (.31) | (.14) | (.28) |
| Redemption fees | .00*** | .00*** | .00*** | .00*** | .00*** | .00*** |
| Net asset value, end of period | $ 9.03 | $ 8.92 | $ 9.67 | $ 9.95 | $ 10.42 | $ 10.19 |
| Total Return (%)b | 1.87c** | (4.13)c | 1.39c | (1.66)c | 3.74c | (3.69) |
| Ratios to Average Net Assets and Supplemental Data |
| Net assets, end of period ($ millions) | 2 | 2 | 3 | 3 | 5 | 6 |
| Ratio of expenses before expense reductions (%) | 2.10* | 2.07 | 1.99 | 1.91 | 1.87 | 1.86 |
| Ratio of expenses after expense reductions (%) | 1.84* | 1.79 | 1.77 | 1.78 | 1.87 | 1.86 |
| Ratio of net investment income (%) | .68* | 2.01 | 2.22 | 1.31 | 1.52 | 2.09 |
| Portfolio turnover rate (%) | 211** | 336 | 326 | 493 | 395 | 197 |
a Based on average shares outstanding during the period. b Total return does not reflect the effect of any sales charges. c Total return would have been lower had certain expenses not been reduced. * Annualized ** Not annualized *** Amount is less than $.005. |
| | | | | | | | |
| Class S | Six Months Ended 4/30/16 (Unaudited) |
Years Ended October 31, |
| 2015 | 2014 | 2013 | 2012 | 2011 |
| Selected Per Share Data |
| Net asset value, beginning of period | $ 8.90 | $ 9.66 | $ 9.94 | $ 10.42 | $ 10.18 | $ 10.85 |
Income (loss) from investment operations: Net investment income (loss)a | .07 | .27 | .32 | .23 | .26 | .33 |
| Net realized and unrealized gain (loss) | .13 | (.57) | (.08) | (.29) | .22 | (.62) |
| Total from investment operations | .20 | (.30) | .24 | (.06) | .48 | (.29) |
Less distributions from: Net investment income | (.09) | (.32) | (.45) | (.26) | (.24) | (.26) |
| Net realized gains | — | (.10) | (.07) | (.16) | — | (.04) |
| Return of capital | — | (.04) | — | — | — | (.08) |
| Total distributions | (.09) | (.46) | (.52) | (.42) | (.24) | (.38) |
| Redemption fees | .00*** | .00*** | .00*** | .00*** | .00*** | .00*** |
| Net asset value, end of period | $ 9.01 | $ 8.90 | $ 9.66 | $ 9.94 | $ 10.42 | $ 10.18 |
| Total Return (%) | 2.26b** | (3.17)b | 2.41b | (.66)b | 4.81b | (2.72) |
| Ratios to Average Net Assets and Supplemental Data |
| Net assets, end of period ($ millions) | 60 | 64 | 78 | 84 | 125 | 136 |
| Ratio of expenses before expense reductions (%) | 1.04* | 1.01 | .95 | .87 | .84 | .84 |
| Ratio of expenses after expense reductions (%) | .84* | .79 | .77 | .78 | .84 | .84 |
| Ratio of net investment income (%) | 1.69* | 3.01 | 3.21 | 2.30 | 2.55 | 3.11 |
| Portfolio turnover rate (%) | 211** | 336 | 326 | 493 | 395 | 197 |
a Based on average shares outstanding during the period. b Total return would have been lower had certain expenses not been reduced. * Annualized ** Not annualized *** Amount is less than $.005. |
| | | | | | | | |
Notes to Financial Statements (Unaudited)
A. Organization and Significant Accounting Policies
Deutsche Enhanced Global Bond Fund (the "Fund") is a diversified series of Deutsche Global/International Fund, Inc. (the "Corporation"), which is registered under the Investment Company Act of 1940, as amended (the "1940 Act"), as an open-end management investment company organized as a Maryland corporation.
The Fund offers multiple classes of shares which provide investors with different purchase options. Class A shares subject to an initial sales charge. Class B shares automatically converted to Class A shares on February 10, 2016 and are no longer offered. Class B shares were not subject to an initial sales charge and were subject to higher ongoing expenses than Class A shares and a contingent deferred sales charge payable upon certain redemptions. Class C shares are not subject to an initial sales charge but are subject to higher ongoing expenses than Class A shares and a contingent deferred sales charge payable upon certain redemptions within one year of purchase. Class C shares do not automatically convert into another class. Class S shares are not subject to initial or contingent deferred sales charges and are only available to a limited group of investors.
Investment income, realized and unrealized gains and losses, and certain fund-level expenses and expense reductions, if any, are borne pro rata on the basis of relative net assets by the holders of all classes of shares, except that each class bears certain expenses unique to that class such as services to shareholders, distribution and service fees and certain other class-specific expenses. Differences in class-level expenses may result in payment of different per share dividends by class. All shares of the Fund have equal rights with respect to voting subject to class-specific arrangements.
The Fund's financial statements are prepared in accordance with accounting principles generally accepted in the United States of America which require the use of management estimates. Actual results could differ from those estimates. The policies described below are followed consistently by the Fund in the preparation of its financial statements.
Security Valuation. Investments are stated at value determined as of the close of regular trading on the New York Stock Exchange on each day the exchange is open for trading.
Various inputs are used in determining the value of the Fund's investments. These inputs are summarized in three broad levels. Level 1 includes quoted prices in active markets for identical securities. Level 2 includes other significant observable inputs (including quoted prices for similar securities, interest rates, prepayment speeds and credit risk). Level 3 includes significant unobservable inputs (including the Fund's own assumptions in determining the fair value of investments). The level assigned to the securities valuations may not be an indication of the risk or liquidity associated with investing in those securities.
Debt securities are valued at prices supplied by independent pricing services approved by the Fund's Board. Such services may use various pricing techniques which take into account appropriate factors such as yield, quality, coupon rate, maturity, type of issue, trading characteristics, prepayment speeds and other data, as well as broker quotes. If the pricing services are unable to provide valuations, debt securities are valued at the average of the most recent reliable bid quotations or evaluated prices, as applicable, obtained from broker-dealers. These securities are generally categorized as Level 2.
Investments in open-end investment companies are valued at their net asset value each business day and are categorized as Level 1.
Futures contracts are generally valued at the settlement prices established each day on the exchange on which they are traded and are categorized as Level 1.
Forward currency contracts are valued at the prevailing forward exchange rate of the underlying currencies and are categorized as Level 2.
Swap contracts are valued daily based upon prices supplied by a Board approved pricing vendor, if available, and otherwise are valued at the price provided by the broker-dealer. Swap contracts are generally categorized as Level 2.
Exchange-traded options are valued at the last sale price or, in the absence of a sale, the mean between the closing bid and asked prices or at the most recent asked price (bid for purchased options) if no bid or asked price are available. Exchange-traded options are categorized as Level 1. Over-the-counter written or purchased options are valued at prices supplied by a Board approved pricing vendor, if available, and otherwise are valued at the price provided by the broker-dealer with which the option was traded. Over-the-counter written or purchased options are generally categorized as Level 2.
Securities and other assets for which market quotations are not readily available or for which the above valuation procedures are deemed not to reflect fair value are valued in a manner that is intended to reflect their fair value as determined in accordance with procedures approved by the Board and are generally categorized as Level 3. In accordance with the Fund's valuation procedures, factors considered in determining value may include, but are not limited to, the type of the security; the size of the holding; the initial cost of the security; the existence of any contractual restrictions on the security's disposition; the price and extent of public trading in similar securities of the issuer or of comparable companies; quotations or evaluated prices from broker-dealers and/or pricing services; information obtained from the issuer, analysts, and/or the appropriate stock exchange (for exchange-traded securities); an analysis of the company's or issuer's financial statements; an evaluation of the forces that influence the issuer and the market(s) in which the security is purchased and sold; and with respect to debt securities, the maturity, coupon, creditworthiness, currency denomination and the movement of the market in which the security is normally traded. The value determined under these procedures may differ from published values for the same securities.
Disclosure about the classification of fair value measurements is included in a table following the Fund's Investment Portfolio.
Securities Lending. Deutsche Bank AG, as lending agent, lends securities of the Fund to certain financial institutions under the terms of the Security Lending Agreement. The Fund retains the benefits of owning securities it has loaned and continues to receive interest and dividends generated by the securities and to participate in any changes in their market value. The Fund requires the borrowers of the securities to maintain collateral with the Fund consisting of either cash or liquid, unencumbered assets having a value at least equal to the value of the securities loaned. When the collateral falls below specified amounts, the lending agent will use its best effort to obtain additional collateral on the next business day to meet required amounts under the security lending agreement. As of period end, any securities on loan were collateralized by cash. The Fund may invest the cash collateral into a joint trading account in an affiliated money market fund. During the period ended April 30, 2016, the Fund invested the cash collateral in Daily Assets Fund, an affiliated money market fund managed by Deutsche Investment Management Americas Inc. Deutsche Investment Management Americas Inc. receives a management/administration fee (0.10% annualized effective rate as of April 30, 2016) on the cash collateral invested in Daily Assets Fund. The Fund receives compensation for lending its securities either in the form of fees or by earning interest on invested cash collateral net of borrower rebates and fees paid to a lending agent. Either the Fund or the borrower may terminate the loan at any time, and the borrower, after notice, is required to return borrowed securities within a standard time period. There may be risks of delay and costs in recovery of securities or even loss of rights in the collateral should the borrower of the securities fail financially. If the Fund is not able to recover securities lent, the Fund may sell the collateral and purchase a replacement investment in the market, incurring the risk that the value of the replacement security is greater than the value of the collateral. The Fund is also subject to all investment risks associated with the reinvestment of any cash collateral received, including, but not limited to, interest rate, credit and liquidity risk associated with such investments.
As of April 30, 2016, the Fund had securities on loan, which were classified as bonds in the Investment Portfolio. The value of the related collateral exceeded the value of the securities loaned at period end.
Foreign Currency Translations. The books and records of the Fund are maintained in U.S. dollars. Investment securities and other assets and liabilities denominated in a foreign currency are translated into U.S. dollars at the prevailing exchange rates at period end. Purchases and sales of investment securities, income and expenses are translated into U.S. dollars at the prevailing exchange rates on the respective dates of the transactions.
Net realized and unrealized gains and losses on foreign currency transactions represent net gains and losses between trade and settlement dates on securities transactions, the acquisition and disposition of foreign currencies, and the difference between the amount of net investment income accrued and the U.S. dollar amount actually received. The portion of both realized and unrealized gains and losses on investments that results from fluctuations in foreign currency exchange rates is not separately disclosed but is included with net realized and unrealized gain/appreciation and loss/depreciation on investments.
When-Issued/Delayed Delivery Securities. The Fund may purchase or sell securities with delivery or payment to occur at a later date beyond the normal settlement period. At the time the Fund enters into a commitment to purchase or sell a security, the transaction is recorded and the value of the transaction is reflected in the net asset value. The price of such security and the date when the security will be delivered and paid for are fixed at the time the transaction is negotiated. The value of the security may vary with market fluctuations. At the time the Fund enters into a purchase transaction it is required to segregate cash or other liquid assets at least equal to the amount of the commitment. Additionally, the Fund or the counterparty may be required to post securities and/or cash collateral in accordance with the terms of the commitment.
Certain risks may arise upon entering into when-issued or delayed delivery transactions from the potential inability of counterparties to meet the terms of their contracts or if the issuer does not issue the securities due to political, economic, or other factors. Additionally, losses may arise due to changes in the value of the underlying securities.
Taxes. The Fund's policy is to comply with the requirements of the Internal Revenue Code, as amended, which are applicable to regulated investment companies, and to distribute all of its taxable income to its shareholders.
Additionally, the Fund may be subject to taxes imposed by the governments of countries in which it invests and are generally based on income and/or capital gains earned or repatriated. Estimated tax liabilities on certain foreign securities are recorded on an accrual basis and are reflected as components of interest income or net change in unrealized gain/loss on investments. Tax liabilities realized as a result of security sales are reflected as a component of net realized gain/loss on investments.
At October 31, 2015, the Fund had a net tax basis capital loss carryforward of approximately $3,898,000, which may be applied against realized net taxable capital gains indefinitely, including short-term losses ($2,963,000) and long-term losses ($935,000).
The Fund has reviewed the tax positions for the open tax years as of October 31, 2015 and has determined that no provision for income tax and/or uncertain tax provisions is required in the Fund's financial statements. The Fund's federal tax returns for the prior three fiscal years remain open subject to examination by the Internal Revenue Service.
Distribution of Income and Gains. Distributions from net investment income of the Fund are declared and distributed to shareholders monthly. Net realized gains from investment transactions, in excess of available capital loss carryforwards, would be taxable to the Fund if not distributed, and, therefore, will be distributed to shareholders at least annually. The Fund may also make additional distributions for tax purposes if necessary.
The timing and characterization of certain income and capital gain distributions are determined annually in accordance with federal tax regulations which may differ from accounting principles generally accepted in the United States of America. These differences primarily relate to premium amortization on debt securities, investments in foreign denominated investments, forward currency contracts, futures contracts, swap contracts, recognition of certain foreign currency gains (losses) as ordinary income (loss), and certain securities sold at a loss. As a result, net investment income (loss) and net realized gain (loss) on investment transactions for a reporting period may differ significantly from distributions during such period. Accordingly, the Fund may periodically make reclassifications among certain of its capital accounts without impacting the net asset value of the Fund.
The tax character of current year distributions will be determined at the end of the current fiscal year.
Redemption Fees. The Fund imposes a redemption fee of 2% of the total redemption amount on Fund shares redeemed or exchanged within 15 days of buying them, either by purchase or exchange (subject to certain exceptions). This fee is assessed and retained by the Fund for the benefit of the remaining shareholders. The redemption fee is accounted for as an addition to paid-in capital.
Expenses. Expenses of the Corporation arising in connection with a specific fund are allocated to that fund. Other Corporation expenses which cannot be directly attributed to a fund are apportioned among the funds in the Corporation based upon the relative net assets or other appropriate measures.
Contingencies. In the normal course of business, the Fund may enter into contracts with service providers that contain general indemnification clauses. The Fund's maximum exposure under these arrangements is unknown as this would involve future claims that may be made against the Fund that have not yet been made. However, based on experience, the Fund expects the risk of loss to be remote.
Other. Investment transactions are accounted for on a trade date plus one basis for daily net asset value calculations. However, for financial reporting purposes, investment transactions are reported on trade date. Interest income is recorded on the accrual basis net of foreign withholding taxes. Dividend income is recorded on the ex-dividend date net of foreign withholding taxes. Realized gains and losses from investment transactions are recorded on an identified cost basis. Proceeds from litigation payments, if any, are included in net realized gain (loss) from investments. All premiums and discounts are amortized/accreted for financial reporting purposes, with the exception of securities in default of principal.
B. Derivative Instruments
Swaps. A swap is a contract between two parties to exchange future cash flows at periodic intervals based on the notional amount of the swap. A bilateral swap is a transaction between the fund and a counterparty where cash flows are exchanged between the two parties. A centrally cleared swap is a transaction executed between the fund and a counterparty, then cleared by a clearing member through a central clearinghouse. The central clearinghouse serves as the counterparty, with whom the fund exchanges cash flows.
The value of a swap is adjusted daily, and the change in value, if any, is recorded as unrealized appreciation or depreciation in the Statement of Assets and Liabilities. Gains or losses are realized when the swap expires or is closed. Certain risks may arise when entering into swap transactions including counterparty default; liquidity; or unfavorable changes in interest rates or the value of the underlying reference security, commodity or index. In connection with bilateral swaps, securities and/or cash may be identified as collateral in accordance with the terms of the swap agreement to provide assets of value and recourse in the event of default. The maximum counterparty credit risk is the net present value of the cash flows to be received from or paid to the counterparty over the term of the swap, to the extent that this amount is beneficial to the Fund, in addition to any related collateral posted to the counterparty by the Fund. This risk may be partially reduced by a master netting arrangement between the Fund and the counterparty. Upon entering into a centrally cleared swap, the Fund is required to deposit with a financial intermediary cash or securities ("initial margin") in an amount equal to a certain percentage of the notional amount of the swap. Subsequent payments ("variation margin") are made or received by the Fund dependent upon the daily fluctuations in the value of the swap. In a cleared swap transaction, counterparty risk is minimized as the central clearinghouse acts as the counterparty.
An upfront payment, if any, made by the Fund is recorded as an asset in the Statement of Assets and Liabilities. An upfront payment, if any, received by the Fund is recorded as a liability in the Statement of Assets and Liabilities. Payments received or made at the end of the measurement period are recorded as realized gain or loss in the Statement of Operations.
Interest Rate Swaps. Interest rate swaps are agreements in which the Fund agrees to pay to the counterparty a fixed rate payment in exchange for the counterparty agreeing to pay to the Fund a variable rate payment, or the Fund agrees to receive from the counterparty a fixed rate payment in exchange for the counterparty agreeing to receive from the Fund a variable rate payment. The payment obligations are based on the notional amount of the swap. For the six months ended April 30, 2016, the Fund entered into interest rate swap agreements to gain exposure to different parts of the yield curve while managing overall duration.
A summary of the open interest rate swap contracts as of April 30, 2016 is included in a table following the Fund's Investment Portfolio. For the six months ended April 30, 2016, the investment in interest rate swap contracts had a total contract value generally indicative of a range from approximately $80,994,000 to $102,394,000.
Credit Default Swaps. Credit default swaps are agreements between a buyer and a seller of protection against predefined credit events for the reference entity. The Fund may enter into credit default swaps to gain exposure to an underlying issuer's credit quality characteristics without directly investing in that issuer or to hedge against the risk of a credit event on debt securities. As a seller of a credit default swap, the Fund is required to pay the par (or other agreed-upon) value of the referenced entity to the counterparty with the occurrence of a credit event by a third party, such as a U.S. or foreign corporate issuer, on the reference entity, which would likely result in a loss to the Fund. In return, the Fund receives from the counterparty a periodic stream of payments over the term of the swap provided that no credit event has occurred. If no credit event occurs, the Fund keeps the stream of payments with no payment obligations. The Fund may also buy credit default swaps, in which case the Fund functions as the counterparty referenced above. This involves the risk that the swap may expire worthless. It also involves counterparty risk that the seller may fail to satisfy its payment obligations to the Fund with the occurrence of a credit event. When the Fund sells a credit default swap, it will cover its commitment. This may be achieved by, among other methods, maintaining cash or liquid assets equal to the aggregate notional value of the reference entities for all outstanding credit default swaps sold by the Fund. For the six months ended April 30, 2016, the Fund entered into credit default swap agreements to gain exposure to the underlying issuer's credit quality characteristics, or to hedge the risk of default or other specified credit events on portfolio assets.
Under the terms of a credit default swap, the Fund receives or makes periodic payments based on a specified interest rate on a fixed notional amount. These payments are recorded as a realized gain or loss in the Statement of Operations. Payments received or made as a result of a credit event or termination of the swap are recognized, net of a proportional amount of the upfront payment, as realized gains or losses in the Statement of Operations.
A summary of the credit default swap contracts as of April 30, 2016 is included in a table following the Fund's Investment Portfolio. For the six months ended April 30, 2016, the investment in credit default swap contracts purchased had a total notional value generally indicative of a range from $0 to approximately $13,864,000, and the investment in credit default swap contracts sold had a total notional value generally indicative of a range from approximately $30,000 to $4,300,000.
Futures Contracts. A futures contract is an agreement between a buyer or seller and an established futures exchange or its clearinghouse in which the buyer or seller agrees to take or make a delivery of a specific amount of a financial instrument at a specified price on a specific date (settlement date). For the six months ended April 30, 2016, the Fund entered into futures contracts as a hedge against anticipated interest rate changes. The Fund also entered into futures contracts for non-hedging purposes to seek to enhance potential gains.
Upon entering into a futures contract, the Fund is required to deposit with a financial intermediary cash or securities ("initial margin") in an amount equal to a certain percentage of the face value indicated in the futures contract. Subsequent payments ("variation margin") are made or received by the Fund dependent upon the daily fluctuations in the value and are recorded for financial reporting purposes as unrealized gains or losses by the Fund. Gains or losses are realized when the contract expires or is closed. Since all futures contracts are exchange traded, counterparty risk is minimized as the exchange's clearinghouse acts as the counterparty, and guarantees the futures contracts against default.
Certain risks may arise upon entering into futures contracts, including the risk that an illiquid market will limit the Fund's ability to close out a futures contract prior to the settlement date and the risk that the futures contract is not well correlated with the security, index or currency to which it relates. Risk of loss may exceed amounts disclosed in the Statement of Assets and Liabilities.
A summary of the open futures contracts as of April 30, 2016 is included in a table following the Fund's Investment Portfolio. For the six months ended April 30, 2016, the investment in futures contracts purchased had a total notional value generally indicative of a range from approximately $966,000 to $3,911,000, and the investment in futures contracts sold had a total notional value generally indicative of a range from approximately $12,876,000 to $20,233,000.
Options. An option contract is a contract in which the writer (seller) of the option grants the buyer of the option, upon payment of a premium, the right to purchase from (call option), or sell to (put option), the writer a designated instrument at a specified price within a specified period of time. The Fund may write or purchase interest rate swaption agreements which are options to enter into a pre-defined swap agreement. The interest rate swaption agreement will specify whether the buyer of the swaption will be a fixed-rate receiver or a fixed-rate payer upon exercise. Certain options, including options on indices, will require cash settlement by the Fund if exercised. For the six months ended April 30, 2016, the Fund entered into options on interest rate swaps in order to hedge against potential adverse interest rate movements of portfolio assets and on currency futures in order to hedge against anticipated currency market changes.
If the Fund writes a covered call option, the Fund foregoes, in exchange for the premium, the opportunity to profit during the option period from an increase in the market value of the underlying security above the exercise price. If the Fund writes a put option it accepts the risk of a decline in the value of the underlying security below the exercise price. Over-the-counter options have the risk of the potential inability of counterparties to meet the terms of their contracts. The Fund's maximum exposure to purchased options is limited to the premium initially paid. In addition, certain risks may arise upon entering into option contracts including the risk that an illiquid secondary market will limit the Fund's ability to close out an option contract prior to the expiration date and that a change in the value of the option contract may not correlate exactly with changes in the value of the securities or currencies hedged.
A summary of the open purchased options contracts as of April 30, 2016 is included in the Fund's Investment Portfolio. A summary of open written option contracts is included in the table following the Fund's Investment Portfolio. For the six months ended April 30, 2016, the investment in written options contracts had a total value generally indicative of a range from approximately $326,000 to $419,000, and purchased option contracts had a total value generally indicative of a range from $0 to approximately $67,000.
Forward Foreign Currency Exchange Contracts. A forward foreign currency exchange contract ("forward currency contract") is a commitment to purchase or sell a foreign currency at the settlement date at a negotiated rate. For the six months ended April 30, 2016, the Fund entered into forward currency contracts in order to hedge its exposure to changes in foreign currency exchange rates on its foreign currency denominated portfolio holdings and to facilitate transactions in foreign currency denominated securities. In addition, as part of its currency strategy, the Fund also engaged in forward currency contracts for non-hedging purposes to seek to enhance potential gains.
Forward currency contracts are valued at the prevailing forward exchange rate of the underlying currencies and unrealized gain (loss) is recorded daily. On the settlement date of the forward currency contract, the Fund records a realized gain or loss equal to the difference between the value of the contract at the time it was opened and the value of the contract at the time it was closed. Certain risks may arise upon entering into forward currency contracts from the potential inability of counterparties to meet the terms of their contracts. The maximum counterparty credit risk to the Fund is measured by the unrealized gain on appreciated contracts. Additionally, when utilizing forward currency contracts to hedge, the Fund gives up the opportunity to profit from favorable exchange rate movements during the term of the contract.
A summary of the open forward currency contracts as of April 30, 2016 is included in a table following the Fund's Investment Portfolio. For the six months ended April 30, 2016, the investment in forward currency contracts short vs. U.S. dollars had a total contract value generally indicative of a range from approximately $14,992,000 to $72,933,000, and the investment in forward currency contracts long vs. U.S. dollars had a total contract value generally indicative of a range from approximately $1,631,000 to $38,788,000. The investment in forward currency contracts long vs. other foreign currencies sold had a total contract value generally indicative of a range from $0 to approximately $2,592,000.
The following tables summarize the value of the Fund's derivative instruments held as of April 30, 2016 and the related location in the accompanying Statement of Assets and Liabilities, presented by primary underlying risk exposure:
| Asset Derivatives | Purchased Options | Forward Contracts | Swap Contracts | Futures Contracts | Total |
| Interest Rate Contracts (a) | $ — | $ — | $ 4,731,793 | $ 71,965 | $ 4,803,758 |
| Credit Contracts (b) | — | — | 8,282 | — | 8,282 |
| Foreign Exchange Contracts (a) (c) | 66,500 | 221,205 | — | — | 287,705 |
| | $ 66,500 | $ 221,205 | $ 4,740,075 | $ 71,965 | $ 5,099,745 |
Each of the above derivatives is located in the following Statement of Assets and Liabilities accounts: (a) Investments in security, at value (includes purchased options). Includes cumulative appreciation of futures and centrally cleared swaps contracts as disclosed in the Investment Portfolio. Unsettled variation margin is disclosed separately within the Statement of Assets and Liabilities. (b) Includes cumulative appreciation of centrally cleared swaps contracts as disclosed in the Investment Portfolio. Unsettled variation margin is disclosed separately within the Statement of Assets and Liabilities. (c) Unrealized appreciation on forward foreign currency exchange contracts |
| Liability Derivatives | Written Options | Forward Contracts | Swap Contracts | Futures Contracts | Total |
| Interest Rate Contracts (a) (b) | $ (326,659) | $ — | $(2,830,020) | $ (7,512) | $(3,164,191) |
| Foreign Exchange Contracts (a) (c) | (92,750) | (853,461) | — | — | (946,211) |
| | $ (419,409) | $ (853,461) | $(2,830,020) | $ (7,512) | $(4,110,402) |
Each of the above derivatives is located in the following Statement of Assets and Liabilities accounts: (a) Options written, at value (b) Includes cumulative depreciation of futures and centrally cleared swaps contracts as disclosed in the Investment Portfolio. Unsettled variation margin is disclosed separately within the Statement of Assets and Liabilities. (c) Unrealized depreciation on forward foreign currency exchange contracts |
Additionally, the amount of unrealized and realized gains and losses on derivative instruments recognized in Fund earnings during the six months ended April 30, 2016 and the related location in the accompanying Statement of Operations is summarized in the following tables by primary underlying risk exposure:
| Realized Gain (Loss) | Written Options | Forward Contracts | Swap Contracts | Futures Contracts | Total |
| Interest Rate Contract (a) | $ 126,240 | $ — | $ (68,727) | $ (639,330) | $ (581,817) |
| Credit Contracts (a) | — | — | (158,815) | — | (158,815) |
| Foreign Exchange Contracts (b) | — | 809,954 | — | — | 809,954 |
| | $ 126,240 | $ 809,954 | $ (227,542) | $ (639,330) | $ 69,322 |
Each of the above derivatives is located in the following Statement of Operations accounts: (a) Net realized gain (loss) from written options, swap contracts and futures, respectively (b) Net realized gain (loss) from foreign currency (Statement of Operations includes both forward currency contracts and foreign currency transactions) |
| Change in Net Unrealized Appreciation (Depreciation) | Purchased Options | Written Options | Forward Contracts | Swap Contracts | Futures Contracts | Total |
| Interest Rate Contracts (a) | $ — | $ (159,327) | $ — | $ 1,490,831 | $ 278,628 | $1,610,132 |
| Credit Contracts (a) | — | — | — | 304,400 | — | 304,400 |
| Foreign Exchange Contracts (a) (b) | (56,172) | (5,422) | (1,555,340) | — | — | (1,616,934) |
| | $ (56,172) | $ (164,749) | $ (1,555,340) | $ 1,795,231 | $ 278,628 | $ 297,598 |
Each of the above derivatives is located in the following Statement of Operations accounts: (a) Change in net unrealized appreciation (depreciation) on investments (includes purchased options), written options, swap contracts and futures, respectively (b) Change in net unrealized appreciation (depreciation) on foreign currency (Statement of Operations includes both forward currency contracts and foreign currency transactions) |
As of April 30, 2016, the Fund has transactions subject to enforceable master netting agreements. A reconciliation of the gross amounts on the Statement of Assets and Liabilities to the net amounts by derivative type, including any collateral exposure, is included in the following tables:
| Counterparty | Gross Amounts of Assets Presented in the Consolidated Statement of Assets and Liabilities | Financial Instruments and Derivatives Available for Offset | Collateral Received | Net Amount of Derivative Assets |
| Barclays Bank PLC | $ 15,565 | $ (15,565) | $ — | $ — |
| JPMorgan Chase Securities, Inc. | 43,378 | — | — | 43,378 |
| Macquarie Bank Ltd. | 45,412 | (45,412) | — | — |
| Morgan Stanley | $ 811 | $ — | $ — | $ 811 |
| Nomura International PLC | 116,039 | (116,039) | — | — |
| | $ 221,205 | $ (177,016) | $ — | $ 44,189 |
| Counterparty | Gross Amounts of Liabilities Presented in the Consolidated Statement of Assets and Liabilities | Financial Instruments and Derivatives Available for Offset | Collateral Pledged | Net Amount of Derivative Liabilities |
| Barclays Bank PLC | $ 23,334 | $ (15,565) | $ — | $ 7,769 |
| BNP Paribas | 265,430 | — | — | 265,430 |
| Citigroup, Inc. | 164,447 | — | — | 164,447 |
| Macquarie Bank Ltd. | 98,426 | (45,412) | — | 53,014 |
| Nomura International PLC | 628,483 | (116,039) | — | 512,444 |
| | $ 1,180,120 | $ (177,016) | $ — | $ 1,003,104 |
C. Purchases and Sales of Securities
During the six months ended April 30, 2016, purchases and sales of investment securities (excluding short-term investments and U.S. Treasury obligations) aggregated $157,682,512 and $157,946,847, respectively. Purchases and sales of U.S. Treasury obligations aggregated $2,702,401 and $2,339,655, respectively.
For the six months ended April 30, 2016, transactions for written options on swaps were as follows:
| | Contracts/
Contract Amount | Premium |
| Outstanding, beginning of period | 26,800,000 | $ 335,100 |
| Options written | 70 | 87,328 |
| Options exercised | (2,100,000) | (45,570) |
| Options expired | (13,700,000) | (125,625) |
| Outstanding, end of period | 11,000,070 | $ 251,233 |
D. Related Parties
Management Agreement. Under the Investment Management Agreement with Deutsche Investment Management Americas Inc. ("DIMA" or the "Advisor"), an indirect, wholly owned subsidiary of Deutsche Bank AG, the Advisor directs the investments of the Fund in accordance with its investment objectives, policies and restrictions. The Advisor determines the securities, instruments and other contracts relating to investments to be purchased, sold or entered into by the Fund.
Under the Investment Management Agreement, the Fund pays a monthly management fee equal to an annual rate (exclusive of any applicable waivers/reimbursements) of 0.41% of the Fund's average daily net assets, computed and accrued daily and payable monthly.
For the period from November 1, 2015 through January 31, 2017 (through February 10, 2016 for Class B shares), the Advisor has contractually agreed to waive its fees and/or reimburse certain operating expenses of the Fund to the extent necessary to maintain the total annual operating expenses (excluding certain expenses such as extraordinary expenses, taxes, brokerage and interest) of each class as follows:
| Class A | 1.09% |
| Class B | 1.84% |
| Class C | 1.84% |
| Class S | .84% |
For the six months ended April 30, 2016 (through February 10, 2016 for Class B shares), fees waived and/or expenses reimbursed for each class are as follows:
| Class A | $ 19,713 |
| Class B | 100 |
| Class C | 2,406 |
| Class S | 64,410 |
| | $ 86,629 |
Administration Fee. Pursuant to an Administrative Services Agreement, DIMA provides most administrative services to the Fund. For all services provided under the Administrative Services Agreement, the Fund pays the Advisor an annual fee ("Administration Fee") of 0.10% of the Fund's average daily net assets, computed and accrued daily and payable monthly. For the six months ended April 30, 2016, the Administration Fee was $41,222, of which $6,800 is unpaid.
Service Provider Fees. Deutsche AM Service Company ("DSC"), an affiliate of the Advisor, is the transfer agent, dividend-paying agent and shareholder service agent of the Fund. Pursuant to a sub-transfer agency agreement between DSC and DST Systems, Inc. ("DST"), DSC has delegated certain transfer agent, dividend-paying agent and shareholder service agent functions to DST. DSC compensates DST out of the shareholder servicing fee it receives from the Fund. For the six months ended April 30, 2016 (through February 10, 2016 for Class B shares), the amounts charged to the Fund by DSC were as follows:
| Services to Shareholders | Total Aggregated | Unpaid at April 30, 2016 |
| Class A | $ 8,508 | $ 4,479 |
| Class B | 41 | — |
| Class C | 728 | 382 |
| Class S | 31,242 | 16,210 |
| | $ 40,519 | $ 21,071 |
Distribution and Service Fees. Under the Fund's Class B and Class C 12b-1 Plans, Deutsche AM Distributors, Inc., ("DDI"), an affiliate of the Advisor, receives a fee ("Distribution Fee") of 0.75% of average daily net assets of each of Class B and C shares. In accordance with the Fund's Underwriting and Distribution Services Agreement, DDI enters into related selling group agreements with various firms at various rates for sales of Class B and C shares. For the six months ended April 30, 2016 (through February 10, 2016 for Class B shares), the Distribution Fee was as follows:
| Distribution Fee | Total Aggregated | Unpaid at April 30, 2016 |
| Class B | $ 137 | $ — |
| Class C | 7,069 | 1,119 |
| | $ 7,206 | $ 1,119 |
In addition, DDI provides information and administrative services for a fee ("Service Fee") to Class A, B and C shareholders at an annual rate of up to 0.25% of average daily net assets for each such class. DDI in turn has various agreements with financial services firms that provide these services and pays these fees based upon the assets of shareholder accounts the firms service. For the six months ended April 30, 2016 (through February 10, 2016 for Class B shares), the Service Fee was as follows:
| Service Fee | Total Aggregated | Unpaid at April 30, 2016 | Annualized
Rate |
| Class A | $ 21,281 | $ 11,898 | .24% |
| Class B | 45 | 3 | .25% |
| Class C | 2,355 | 1,140 | .25% |
| | $ 23,681 | $ 13,041 | |
Underwriting Agreement and Contingent Deferred Sales Charge. DDI is the principal underwriter for the Fund. Underwriting commissions paid in connection with the distribution of Class A shares for the six months ended April 30, 2016, aggregated $509.
In addition, DDI receives any contingent deferred sales charge ("CDSC") from Class B share redemptions occurring within six years of purchase and Class C share redemptions occurring within one year of purchase. There is no such charge upon redemption of any share appreciation or reinvested dividends. The CDSC is based on declining rates, ranging from 4% to 1% for Class B and 1% for Class C, of the value of the shares redeemed. For the six months ended April 30, 2016 (through February 10, 2016 for Class B shares), the CDSC for Class B and C shares aggregated $98 and $0, respectively.
Typesetting and Filing Service Fees. Under an agreement with DIMA, DIMA is compensated for providing typesetting and certain regulatory filing services to the Fund. For the six months ended April 30, 2016, the amount charged to the Fund by DIMA included in the Statement of Operations under "Reports to shareholders" aggregated $11,754, of which $8,381 is unpaid.
Directors' Fees and Expenses. The Fund paid retainer fees to each Director not affiliated with the Advisor, plus specified amounts to the Board Chairperson and Vice Chairperson and to each committee Chairperson.
Affiliated Cash Management Vehicles. The Fund may invest uninvested cash balances in Central Cash Management Fund and Deutsche Variable NAV Money Fund, affiliated money market funds which are managed by the Advisor. Each affiliated money market fund seeks to provide a high level of current income consistent with liquidity and the preservation of capital. Each affiliated money market fund is managed in accordance with Rule 2a-7 under the Investment Company Act of 1940, which governs the quality, maturity, diversity and liquidity of instruments in which a money market fund may invest. Central Cash Management Fund seeks to maintain a stable net asset value, and Deutsche Variable NAV Money Fund maintains a floating net asset value. The Fund indirectly bears its proportionate share of the expenses of each affiliated money market fund in which it invests. Central Cash Management Fund does not pay the Advisor an investment management fee. To the extent that Deutsche Variable NAV Money Fund pays an investment management fee to the Advisor, the Advisor will waive an amount of the investment management fee payable to the Advisor by the Fund equal to the amount of the investment management fee payable on the Fund's assets invested in Deutsche Variable NAV Money Fund.
Security Lending Fees. Deutsche Bank AG serves as lending agent for the Fund. For the six months ended April 30, 2016, the Fund incurred lending agent fees to Deutsche Bank AG for the amount of $465.
E. Investing in Emerging Markets
Investing in emerging markets may involve special risks and considerations not typically associated with investing in developed markets. These risks include revaluation of currencies, high rates of inflation or deflation, repatriation restrictions on income and capital, and future adverse political, social and economic developments. Moreover, securities issued in these markets may be less liquid, subject to government ownership controls or delayed settlements, and may have prices that are more volatile or less easily assessed than those of comparable securities of issuers in developed markets.
F. Line of Credit
The Fund and other affiliated funds (the "Participants") share in a $400 million revolving credit facility provided by a syndication of banks. The Fund may borrow for temporary or emergency purposes, including the meeting of redemption requests that otherwise might require the untimely disposition of securities. The Participants are charged an annual commitment fee which is allocated based on net assets, among each of the Participants. Interest is calculated at a rate per annum equal to the sum of the Federal Funds Rate plus 1.25 percent plus if the one-month LIBOR exceeds the Federal Funds Rate, the amount of such excess. The Fund may borrow up to a maximum of 33 percent of its net assets under the agreement. The Fund had no outstanding loans at April 30, 2016.
G. Share Transactions
The following table summarizes share and dollar activity in the Fund:
| | Six Months Ended April 30, 2016 | Year Ended October 31, 2015 |
| | Shares | Dollars | Shares | Dollars |
| Shares sold |
| Class A | 788,587 | $ 7,064,701 | 191,930 | $ 1,730,315 |
| Class B | 13* | 179* | 526 | 4,852 |
| Class C | 15,032 | 133,253 | 14,968 | 137,839 |
| Class S | 499,485 | 4,440,105 | 142,129 | 1,288,697 |
| | | $ 11,638,238 | | $ 3,161,703 |
| Shares issued to shareholders in reinvestment of distributions |
| Class A | 17,198 | $ 153,374 | 88,963 | $ 816,596 |
| Class B | 9* | 77* | 811 | 7,486 |
| Class C | 876 | 7,807 | 8,039 | 73,968 |
| Class S | 65,141 | 579,279 | 349,321 | 3,202,212 |
| | | $ 740,537 | | $ 4,100,262 |
| Shares redeemed |
| Class A | (309,143) | $ (2,749,857) | (534,982) | $ (4,851,859) |
| Class B | (25,994)* | (230,343)* | (14,856) | (135,662) |
| Class C | (51,667) | (460,396) | (71,600) | (653,733) |
| Class S | (1,033,076) | (9,173,421) | (1,432,345) | (13,044,860) |
| | | $ (12,614,017) | | $ (18,686,114) |
| Redemption fees | | $ 12 | | $ 5 |
| Net increase (decrease) |
| Class A | 496,642 | $ 4,468,218 | (254,089) | $ (2,304,943) |
| Class B | (25,972)* | (230,087)* | (13,519) | (123,324) |
| Class C | (35,759) | (319,334) | (48,593) | (441,926) |
| Class S | (468,450) | (4,154,027) | (940,895) | (8,553,951) |
| | | $ (235,230) | | $ (11,424,144) |
* For the period from November 1, 2015 to February 10, 2016. See Note A.
Information About Your Fund's Expenses
As an investor of the Fund, you incur two types of costs: ongoing expenses and transaction costs. Ongoing expenses include management fees, distribution and service (12b-1) fees and other Fund expenses. Examples of transaction costs include sales charges (loads), redemption fees and account maintenance fees, which are not shown in this section. The following tables are intended to help you understand your ongoing expenses (in dollars) of investing in the Fund and to help you compare these expenses with the ongoing expenses of investing in other mutual funds. In the most recent six-month period, the Fund limited these expenses; had it not done so, expenses would have been higher. The example in the table is based on an investment of $1,000 invested at the beginning of the six-month period and held for the entire period (November 1, 2015 to April 30, 2016).
The tables illustrate your Fund's expenses in two ways:
— Actual Fund Return. This helps you estimate the actual dollar amount of ongoing expenses (but not transaction costs) paid on a $1,000 investment in the Fund using the Fund's actual return during the period. To estimate the expenses you paid over the period, simply divide your account value by $1,000 (for example, an $8,600 account value divided by $1,000 = 8.6), then multiply the result by the number in the "Expenses Paid per $1,000" line under the share class you hold.
— Hypothetical 5% Fund Return. This helps you to compare your Fund's ongoing expenses (but not transaction costs) with those of other mutual funds using the Fund's actual expense ratio and a hypothetical rate of return of 5% per year before expenses. Examples using a 5% hypothetical fund return may be found in the shareholder reports of other mutual funds. The hypothetical account values and expenses may not be used to estimate the actual ending account balance or expenses you paid for the period.
Please note that the expenses shown in these tables are meant to highlight your ongoing expenses only and do not reflect any transaction costs. The "Expenses Paid per $1,000" line of the tables is useful in comparing ongoing expenses only and will not help you determine the relative total expense of owning different funds. Subject to certain exceptions, an account maintenance fee of $20.00 assessed once per calendar year for Classes A, C and S shares may apply for accounts with balances less than $10,000. This fee is not included in these tables. If it was, the estimate of expenses paid for Classes A, C and S shares during the period would be higher, and account value during the period would be lower, by this amount.
Expenses and Value of a $1,000 Investment
for the six months ended April 30, 2016 (Unaudited) |
| Actual Fund Return | Class A | Class C | Class S |
| Beginning Account Value 11/1/15 | $ 1,000.00 | $ 1,000.00 | $ 1,000.00 |
| Ending Account Value 4/30/16 | $ 1,022.50 | $ 1,018.70 | $ 1,022.60 |
| Expenses Paid per $1,000* | $ 5.48 | $ 9.24 | $ 4.22 |
| Hypothetical 5% Fund Return | Class A | Class C | Class S |
| Beginning Account Value 11/1/15 | $ 1,000.00 | $ 1,000.00 | $ 1,000.00 |
| Ending Account Value 4/30/16 | $ 1,019.44 | $ 1,015.71 | $ 1,020.69 |
| Expenses Paid per $1,000* | $ 5.47 | $ 9.22 | $ 4.22 |
* Expenses are equal to the Fund's annualized expense ratio for each share class, multiplied by the average account value over the period, multiplied by 182 (the number of days in the most recent six-month period), then divided by 366.
| Annualized Expense Ratios | Class A | Class C | Class S |
| Deutsche Enhanced Global Bond Fund | 1.09% | 1.84% | .84% |
For more information, please refer to the Fund's prospectus.
For an analysis of the fees associated with an investment in the Fund or similar funds, please refer to http://apps.finra.org/fundanalyzer/1/fa.aspx.
Advisory Agreement Board Considerations and Fee Evaluation
The Board of Directors approved the renewal of Deutsche Enhanced Global Bond Fund’s investment management agreement (the "Agreement") with Deutsche Investment Management Americas Inc. ("DIMA") in September 2015.
In terms of the process that the Board followed prior to approving the Agreement, shareholders should know that:
— In September 2015, all of the Fund’s Directors were independent of DIMA and its affiliates.
— The Directors met frequently during the past year to discuss fund matters and dedicated a substantial amount of time to contract review matters. Over the course of several months, the Board’s Contract Committee reviewed comprehensive materials received from DIMA, independent third parties and independent counsel. These materials included an analysis of the Fund’s performance, fees and expenses, and profitability from a fee consultant retained by the Fund’s Independent Directors (the "Fee Consultant"). The Board also received extensive information throughout the year regarding performance of the Fund.
— The Independent Directors regularly meet privately with counsel to discuss contract review and other matters. In addition, the Independent Directors were advised by the Fee Consultant in the course of their review of the Fund’s contractual arrangements and considered a comprehensive report prepared by the Fee Consultant in connection with their deliberations.
— In connection with reviewing the Agreement, the Board also reviewed the terms of the Fund’s Rule 12b-1 plan, distribution agreement, administrative services agreement, transfer agency agreement and other material service agreements.
— Based on its evaluation of the information provided, the Contract Committee presented its findings and recommendations to the Board. The Board then reviewed the Contract Committee’s findings and recommendations.
In connection with the contract review process, the Contract Committee and the Board considered the factors discussed below, among others. The Board also considered that DIMA and its predecessors have managed the Fund since its inception, and the Board believes that a long-term relationship with a capable, conscientious advisor is in the best interests of the Fund. The Board considered, generally, that shareholders chose to invest or remain invested in the Fund knowing that DIMA managed the Fund, and that the Agreement was approved by the Fund’s shareholders. DIMA is part of Deutsche Bank AG’s ("Deutsche Bank") Asset and Wealth Management ("Deutsche AWM") division. Deutsche AWM is a global asset management business that offers a wide range of investing expertise and resources, including research capabilities in many countries throughout the world. Deutsche Bank has advised the Independent Directors that the U.S. asset management business continues to be a critical and integral part of Deutsche Bank, and that Deutsche Bank will continue to make significant investments in Deutsche AWM, including ongoing enhancements to Deutsche AWM’s investment platform. Deutsche Bank also has confirmed its commitment to maintaining strong legal and compliance groups within the Deutsche AWM division.
As part of the contract review process, the Board carefully considered the fees and expenses of each Deutsche fund overseen by the Board in light of the fund’s performance. In many cases, this led to the negotiation and implementation of expense caps. As part of these negotiations, the Board indicated that it would consider relaxing these caps in future years following sustained improvements in performance, among other considerations.
While shareholders may focus primarily on fund performance and fees, the Fund’s Board considers these and many other factors, including the quality and integrity of DIMA’s personnel and such other issues as back-office operations, fund valuations, and compliance policies and procedures.
Nature, Quality and Extent of Services. The Board considered the terms of the Agreement, including the scope of advisory services provided under the Agreement. The Board noted that, under the Agreement, DIMA provides portfolio management services to the Fund and that, pursuant to a separate administrative services agreement, DIMA provides administrative services to the Fund. The Board considered the experience and skills of senior management and investment personnel, the resources made available to such personnel, the ability of DIMA to attract and retain high-quality personnel, and the organizational depth and stability of DIMA. The Board reviewed the Fund’s performance over short-term and long-term periods and compared those returns to various agreed-upon performance measures, including a peer universe compiled using information supplied by Morningstar Direct ("Morningstar"), an independent fund data service. The Board also noted that it has put into place a process of identifying "Focus Funds" (e.g., funds performing poorly relative to a peer universe), and receives additional reporting from DIMA regarding such funds and, where appropriate, DIMA’s plans to address underperformance. The Board believes this process is an effective manner of identifying and addressing underperforming funds. Based on the information provided, the Board noted that for the one-, three- and five-year periods ended December 31, 2014, the Fund’s performance (Class A shares) was in the 3rd quartile, 3rd quartile and 4th quartile, respectively, of the applicable Morningstar universe (the 1st quartile being the best performers and the 4th quartile being the worst performers). The Board also observed that the Fund has outperformed its benchmark in the three-year period and has underperformed its benchmark in the one- and five-year periods ended December 31, 2014.
Fees and Expenses. The Board considered the Fund’s investment management fee schedule, operating expenses and total expense ratios, and comparative information provided by Lipper Inc. ("Lipper") and the Fee Consultant regarding investment management fee rates paid to other investment advisors by similar funds (1st quartile being the most favorable and 4th quartile being the least favorable). With respect to management fees paid to other investment advisors by similar funds, the Board noted that the contractual fee rates paid by the Fund, which include a 0.10% fee paid to DIMA under the Fund’s administrative services agreement, were lower than the median (1st quartile) of the applicable Lipper peer group (based on Lipper data provided as of December 31, 2014). The Board noted that the Fund’s Class A shares total (net) operating expenses (excluding 12b-1 fees) were expected to be higher than the median (3rd quartile) of the applicable Lipper expense universe (based on Lipper data provided as of December 31, 2014, and analyzing Lipper expense universe Class A (net) expenses less any applicable 12b-1 fees) ("Lipper Universe Expenses"). The Board also reviewed data comparing each share class’s total (net) operating expenses to the applicable Lipper Universe Expenses. The Board noted that the expense limitations agreed to by DIMA were expected to help the Fund’s total (net) operating expenses remain competitive. The Board considered the Fund’s management fee rate as compared to fees charged by DIMA to comparable Deutsche U.S. registered funds ("Deutsche Funds"), noting that DIMA indicated that it does not provide services to any other comparable Deutsche Funds. The information requested by the Board as part of its review of fees and expenses also included information about institutional accounts (including any sub-advised funds and accounts) and funds offered primarily to European investors ("Deutsche Europe funds") managed by Deutsche AWM. The Board noted that DIMA indicated that Deutsche AWM does not manage any institutional accounts or Deutsche Europe funds comparable to the Fund. The Board noted that DIMA agreed to reduce the Fund’s contractual management fee effective December 1, 2008.
On the basis of the information provided, the Board concluded that management fees were reasonable and appropriate in light of the nature, quality and extent of services provided by DIMA.
Profitability. The Board reviewed detailed information regarding revenues received by DIMA under the Agreement. The Board considered the estimated costs and pre-tax profits realized by DIMA from advising the Deutsche Funds, as well as estimates of the pre-tax profits attributable to managing the Fund in particular. The Board also received information regarding the estimated enterprise-wide profitability of DIMA and its affiliates with respect to all fund services in totality and by fund. The Board and the Fee Consultant reviewed DIMA’s methodology in allocating its costs to the management of the Fund. Based on the information provided, the Board concluded that the pre-tax profits realized by DIMA in connection with the management of the Fund were not unreasonable. The Board also reviewed certain publicly available information regarding the profitability of certain similar investment management firms. The Board noted that while information regarding the profitability of such firms is limited (and in some cases is not necessarily prepared on a comparable basis), DIMA and its affiliates’ overall profitability with respect to the Deutsche Funds (after taking into account distribution and other services provided to the funds by DIMA and its affiliates) was lower than the overall profitability levels of most comparable firms for which such data was available.
Economies of Scale. The Board considered whether there are economies of scale with respect to the management of the Fund and whether the Fund benefits from any economies of scale. In this regard, the Board observed that while the Fund’s current investment management fee schedule does not include breakpoints, the Fund’s fee schedule represents an appropriate sharing between the Fund and DIMA of such economies of scale as may exist in the management of the Fund at current asset levels.
Other Benefits to DIMA and Its Affiliates. The Board also considered the character and amount of other incidental benefits received by DIMA and its affiliates, including any fees received by DIMA for administrative services provided to the Fund and any fees received by an affiliate of DIMA for distribution services. The Board also considered benefits to DIMA related to brokerage and soft-dollar allocations, including allocating brokerage to pay for research generated by parties other than the executing broker dealers, which pertain primarily to funds investing in equity securities, along with the incidental public relations benefits to DIMA related to Deutsche Funds advertising and cross-selling opportunities among DIMA products and services. The Board considered these benefits in reaching its conclusion that the Fund’s management fees were reasonable.
Compliance. The Board considered the significant attention and resources dedicated by DIMA to documenting and enhancing its compliance processes in recent years. The Board noted in particular (i) the experience and seniority of the individual serving as DIMA’s and the Fund’s chief compliance officer; (ii) the large number of DIMA compliance personnel; and (iii) the substantial commitment of resources by DIMA and its affiliates to compliance matters.
Based on all of the information considered and the conclusions reached, the Board unanimously determined that the continuation of the Agreement is in the best interests of the Fund. In making this determination, the Board did not give particular weight to any single factor identified above. The Board considered these factors over the course of numerous meetings, certain of which were in executive session with only the Independent Directors and counsel present. It is possible that individual Directors may have weighed these factors differently in reaching their individual decisions to approve the continuation of the Agreement.
Account Management Resources
| |
| For More Information | The automated telephone system allows you to access personalized account information and obtain information on other Deutsche funds using either your voice or your telephone keypad. Certain account types within Classes A, C and S also have the ability to purchase, exchange or redeem shares using this system. For more information, contact your financial advisor. You may also access our automated telephone system or speak with a Shareholder Service representative by calling: (800) 728-3337 |
| Web Site | deutschefunds.com View your account transactions and balances, trade shares, monitor your asset allocation, subscribe to fund and account updates by e-mail, and change your address, 24 hours a day. Obtain prospectuses and applications, blank forms, interactive worksheets, news about Deutsche funds, retirement planning information, and more. |
| Written Correspondence | Deutsche Asset Management PO Box 219151
Kansas City, MO 64121-9151 |
| Proxy Voting | The fund's policies and procedures for voting proxies for portfolio securities and information about how the fund voted proxies related to its portfolio securities during the 12-month period ended June 30 are available on our Web site — deutschefunds.com (click on "proxy voting"at the bottom of the page) — or on the SEC's Web site — sec.gov. To obtain a written copy of the fund's policies and procedures without charge, upon request, call us toll free at (800) 728-3337. |
| Portfolio Holdings | Following the fund's fiscal first and third quarter-end, a complete portfolio holdings listing is filed with the SEC on Form N-Q. This form will be available on the SEC's Web site at sec.gov, and it also may be reviewed and copied at the SEC's Public Reference Room in Washington, D.C. Information on the operation of the SEC's Public Reference Room may be obtained by calling (800) SEC-0330. The fund's portfolio holdings are also posted on deutschefunds.com from time to time. Please see the fund's current prospectus for more information. |
| Principal Underwriter | If you have questions, comments or complaints, contact: Deutsche AM Distributors, Inc. 222 South Riverside Plaza
Chicago, IL 60606-5808 (800) 621-1148 |
| Investment Management | Deutsche Investment Management Americas Inc. ("DIMA" or the "Advisor"), which is part of Deutsche Asset Management, is the investment advisor for the fund. DIMA and its predecessors have more than 80 years of experience managing mutual funds and DIMA provides a full range of investment advisory services to both institutional and retail clients. DIMA is an indirect, wholly owned subsidiary of Deutsche Bank AG. Deutsche Bank AG is a major global banking institution engaged in a wide variety of financial services, including investment management, retail, private and commercial banking, investment banking and insurance. Deutsche Asset Management is the retail brand name in the U.S. for the asset management activities of Deutsche Bank AG and DIMA. Deutsche Asset Management is committed to delivering the investing expertise, insight and resources of this global investment platform to American investors. |
| | Class A | Class C | Class S |
| Nasdaq Symbol | SZGAX | SZGCX | SSTGX |
| CUSIP Number | 25156A 734 | 25156A 759 | 25156A 767 |
| Fund Number | 461 | 761 | 2061 |
Privacy Statement
| FACTS | What Does Deutsche Asset Management Do With Your Personal Information? |
| Why? | Financial companies choose how they share your personal information. Federal law gives consumers the right to limit some but not all sharing. Federal law also requires us to tell you how we collect, share and protect your personal information. Please read this notice carefully to understand what we do. |
| What? | The types of personal information we collect and share can include: — Social Security number — Account balances — Purchase and transaction history — Bank account information — Contact information such as mailing address, e-mail address and telephone number |
| How? | All financial companies need to share customers' personal information to run their everyday business. In the section below, we list the reasons financial companies can share their customers' personal information, the reasons Deutsche Asset Management chooses to share and whether you can limit this sharing. |
| Reasons we can share your personal information | Does Deutsche Asset Management share? | Can you limit this sharing? |
| For our everyday business purposes — such as to process your transactions, maintain your account(s), respond to court orders or legal investigations | Yes | No |
| For our marketing purposes — to offer our products and services to you | Yes | No |
| For joint marketing with other financial companies | No | We do not share |
| For our affiliates' everyday business purposes — information about your transactions and experiences | No | We do not share |
| For our affiliates' everyday business purposes — information about your creditworthiness | No | We do not share |
| For non-affiliates to market to you | No | We do not share |
| Questions? | Call (800) 728-3337 or e-mail us at service@db.com |
| | | | |
| |
| Who we are |
| Who is providing this notice? | Deutsche AM Distributors, Inc.; Deutsche Investment Management Americas Inc.; Deutsche AM Trust Company; the Deutsche Funds |
| What we do |
| How does Deutsche Asset Management protect my personal information? | To protect your personal information from unauthorized access and use, we use security measures that comply with federal law. These measures include computer safeguards and secured files and buildings. |
| How does Deutsche Asset Management collect my personal information? | We collect your personal information, for example. When you: — open an account — give us your contact information — provide bank account information for ACH or wire transactions — tell us where to send money — seek advice about your investments |
| Why can't I limit all sharing? | Federal law gives you the right to limit only — sharing for affiliates' everyday business purposes — information about your creditworthiness — affiliates from using your information to market to you — sharing for non-affiliates to market to you State laws and individual companies may give you additional rights to limit sharing. |
| Definitions |
| Affiliates | Companies related by common ownership or control. They can be financial or non-financial companies. Our affiliates include financial companies with the DWS or Deutsche Bank ("DB") name, such as DB AG Frankfurt and DB Alex Brown. |
| Non-affiliates | Companies not related by common ownership or control. They can be financial and non-financial companies. Non-affiliates we share with include account service providers, service quality monitoring services, mailing service providers and verification services to help in the fight against money laundering and fraud. |
| Joint marketing | A formal agreement between non-affiliated financial companies that together market financial products or services to you. Deutsche Asset Management does not jointly market. |
| Rev. 08/2015 |
Notes
Notes
Notes

| | |
| ITEM 2. | CODE OF ETHICS |
| | |
| | Not applicable. |
| | |
| ITEM 3. | AUDIT COMMITTEE FINANCIAL EXPERT |
| | |
| | Not applicable |
| | |
| ITEM 4. | PRINCIPAL ACCOUNTANT FEES AND SERVICES |
| | |
| | Not applicable |
| | |
| ITEM 5. | AUDIT COMMITTEE OF LISTED REGISTRANTS |
| | |
| | Not applicable |
| | |
| ITEM 6. | SCHEDULE OF INVESTMENTS |
| | |
| | Not applicable |
| | |
| ITEM 7. | DISCLOSURE OF PROXY VOTING POLICIES AND PROCEDURES FOR CLOSED-END MANAGEMENT INVESTMENT COMPANIES |
| | |
| | Not applicable |
| | |
| ITEM 8. | PORTFOLIO MANAGERS OF CLOSED-END MANAGEMENT INVESTMENT COMPANIES |
| | |
| | Not applicable |
| | |
| ITEM 9. | PURCHASES OF EQUITY SECURITIES BY CLOSED-END MANAGEMENT INVESTMENT COMPANY AND AFFILIATED PURCHASERS |
| | |
| | Not applicable |
| | |
| ITEM 10. | SUBMISSION OF MATTERS TO A VOTE OF SECURITY HOLDERS |
| | |
| | There were no material changes to the procedures by which shareholders may recommend nominees to the Fund’s Board. The primary function of the Nominating and Governance Committee is to identify and recommend individuals for membership on the Board and oversee the administration of the Board Governance Guidelines. Shareholders may recommend candidates for Board positions by forwarding their correspondence by U.S. mail or courier service to Kenneth C. Froewiss, Independent Chairman, Deutsche Mutual Funds, P.O. Box 390601, Cambridge, MA 02139. |
| | |
| ITEM 11. | CONTROLS AND PROCEDURES |
| | |
| | (a) | The Chief Executive and Financial Officers concluded that the Registrant’s Disclosure Controls and Procedures are effective based on the evaluation of the Disclosure Controls and Procedures as of a date within 90 days of the filing date of this report. |
| | |
| | (b) | There have been no changes in the registrant’s internal control over financial reporting that occurred during the second fiscal quarter of the period covered by this report that has materially affected, or is reasonably likely to materially affect, the registrant’s internal controls over financial reporting. |
| | |
ITEM 12. | EXHIBITS |
| | |
| | (a)(1) | Not applicable |
| | |
| | (a)(2) | Certification pursuant to Rule 30a-2(a) under the Investment Company Act of 1940 (17 CFR 270.30a-2(a)) is filed and attached hereto as Exhibit 99.CERT. |
| | |
| | (b) | Certification pursuant to Rule 30a-2(b) under the Investment Company Act of 1940 (17 CFR 270.30a-2(b)) is furnished and attached hereto as Exhibit 99.906CERT. |
SIGNATURES
Pursuant to the requirements of the Securities Exchange Act of 1934 and the Investment Company Act of 1940, the registrant has duly caused this report to be signed on its behalf by the undersigned, thereunto duly authorized.
| Registrant: | Deutsche Enhanced Global Bond Fund, a series of Deutsche Global/International Fund, Inc. |
| | |
| | |
| By: | /s/Brian E. Binder Brian E. Binder President |
| | |
| Date: | 6/29/2016 |
Pursuant to the requirements of the Securities Exchange Act of 1934 and the Investment Company Act of 1940, this report has been signed below by the following persons on behalf of the registrant and in the capacities and on the dates indicated.
| By: | /s/Brian E. Binder Brian E. Binder President |
| | |
| Date: | 6/29/2016 |
| | |
| | |
| | |
| By: | /s/Paul Schubert Paul Schubert Chief Financial Officer and Treasurer |
| | |
| Date: | 6/29/2016 |