UNITED STATES
SECURITIES AND EXCHANGE COMMISSION
WASHINGTON, D. C. 20549
FORM N-CSRS
Investment Company Act file number: 811-04670
Deutsche DWS Global/International Fund, Inc.
(Exact Name of Registrant as Specified in Charter)
875 Third Avenue
New York, NY 10022-6225
(Address of Principal Executive Offices) (Zip Code)
Registrant’s Telephone Number, including Area Code: (212) 454-4500
Diane Kenneally
One International Place
Boston, MA 02110
(Name and Address of Agent for Service)
| Date of fiscal year end: | 10/31 |
| | |
| Date of reporting period: | 4/30/2020 |
| ITEM 1. | REPORT TO STOCKHOLDERS |
| | |

April 30, 2020
Semiannual Report
to Shareholders
DWS ESG Global Bond Fund
Beginning on January 1, 2021, as permitted by regulations adopted by the Securities and Exchange Commission, paper copies of the Fund’s annual and semiannual shareholder reports will no longer be sent by mail, unless you specifically request paper copies of the reports. Instead, the reports will be made available on the Fund’s Web site (dws.com), and you will be notified by mail each time a report is posted and provided with a Web site link to access the report.
If you already elected to receive shareholder reports electronically, you will not be affected by this change and you need not take any action. You may elect to receive shareholder reports and other communications from the Fund electronically anytime by contacting your financial intermediary (such as a broker-dealer or bank), or if you are a direct investor, by calling (800) 728-3337 or sending an email request to service@dws.com.
You may elect to receive all future reports in paper free of charge. If you invest through a financial intermediary, you can contact your financial intermediary to request that you continue to receive paper copies of your shareholder reports. If you invest directly with the Fund, you can call (800) 728-3337 or send an email request to service@dws.com to continue receiving paper copies of your shareholder reports. Your election to receive reports in paper will apply to all funds held in your account if you invest through your financial intermediary or all funds held with DWS if you invest directly with the Fund.

Contents
This report must be preceded or accompanied by a prospectus. To obtain a summary prospectus, if available, or prospectus for any of our funds, refer to the Account Management Resources information provided in the back of this booklet. We advise you to consider the Fund’s objectives, risks, charges and expenses carefully before investing. The summary prospectus and prospectus contain this and other important information about the Fund. Please read the prospectus carefully before you invest.
Bond investments are subject to interest-rate, credit, liquidity and market risks to varying degrees. When interest rates rise, bond prices generally fall. Credit risk refers to the ability of an issuer to make timely payments of principal and interest. Investing in securities that meet ESG criteria may result in the Fund forgoing otherwise attractive opportunities, which may result in underperformance when compared to funds that do not consider ESG factors. Investing in foreign securities presents certain risks, such as currency fluctuations, political and economic changes, and market risks. Emerging markets tend to be more volatile and less liquid than the markets of more mature economies, and generally have less diverse and less mature economic structures and less stable political systems than those of developed countries. Investing in derivatives entails special risks relating to liquidity, leverage and credit that may reduce returns and/or increase volatility. The Fund may lend securities to approved institutions. Please read the prospectus for details.
War, terrorism, economic uncertainty, trade disputes, public health crises (including the recent pandemic spread of the novel coronavirus) and related geopolitical events could lead to increased market volatility, disruption to U.S. and world economies and markets and may have significant adverse effects on the Fund and its investments.
The brand DWS represents DWS Group GmbH & Co. KGaA and any of its subsidiaries such as DWS Distributors, Inc. which offers investment products or DWS Investment Management Americas, Inc. and RREEF America L.L.C. which offer advisory services.
NOT FDIC/NCUA INSURED NO BANK GUARANTEE MAY LOSE VALUE NOT A DEPOSIT NOT INSURED BY ANY FEDERAL GOVERNMENT AGENCY
| | | | | | |
| 2 | | | | | DWS ESG Global Bond Fund | | |
Letter to Shareholders
Dear Shareholder:
While the economy isn’t expected to shrug off the impacts of the COVID-19 pandemic easily, DWS’s CIO Office is cautiously optimistic. Our CIO Office anticipates the recession in the United States (“U.S.”) to be shallower than in the Eurozone, followed by a more robust U.S. recovery primarily benefiting from the outsized U.S. fiscal stimulus. Our CIO office sees long-lasting disruptions of supply chains and consumer spending, potentially derailing the current outlook.
What is already becoming clear is the current assessment of the situation by financial markets. As of mid-May, U.S. markets have moved from panic mode back to relatively high valuations. However, sentiment can quickly change and March lows may be tested again in the coming months. With respect to the bond markets, we think that accommodative central bank action will continue or even accelerate, with the interest rates set to remain low for the foreseeable future.
What may come next? In the short term, we expect markets to remain volatile. While our strategists forecast peaking uncertainty on stock markets, sharp setbacks could happen at any time. Stocks have become even more appealing for the medium to long term time horizons, due to the very accommodative monetary policy of the leading central banks and growing fiscal deficits.
As the U.S. and global economies forge a path to recovery, close monitoring of developments to assess potential opportunities and risks is critical. We believe the unique structure of our CIO Office — which synthesizes the views of more than 900 DWS economists, analysts and investment professionals around the world — perfectly positions us to make strategic and tactical decisions. Those insights are updated frequently and are always available on the “Insights” section of dws.com.
As always, we appreciate your trust and welcome the opportunity to help you navigate these unusual times. We believe our decades of experience in managing assets through multiple market cycles and events will add value in times such as these.
Best regards,
| | |
 | | 
Hepsen Uzcan President, DWS Funds |
Assumptions, estimates and opinions contained in this document constitute our judgment as of the date of the document and are subject to change without notice. Any projections are based on a number of assumptions as to market conditions and there can be no guarantee that any projected results will be achieved. Past performance is not a guarantee of future results.
| | | | | | | | |
| | DWS ESG Global Bond Fund | | | | | | 3 | |
| | |
| Performance Summary | | April 30, 2020 (Unaudited) |
| | | | | | | | | | | | | | | | |
| Class A | | 6-Month‡ | | | 1-Year | | | 5-Year | | | 10-Year | |
|
| Average Annual Total Returns as of 4/30/20 | |
| Unadjusted for Sales Charge | | | 1.10% | | | | 7.42% | | | | 2.82% | | | | 2.25% | |
Adjusted for the Maximum Sales Charge
(max 4.50% load) | | | –3.45% | | | | 2.58% | | | | 1.88% | | | | 1.78% | |
Bloomberg Barclays Global Aggregate
Currency Hedged Index† | | | 2.76% | | | | 8.25% | | | | 3.93% | | | | 4.17% | |
Bloomberg Barclays Global Aggregate
Bond Index†† | | | 1.45% | | | | 6.56% | | | | 2.82% | | | | 2.67% | |
|
| Average Annual Total Returns as of 3/31/20 (most recent calendar quarter end) | |
| Unadjusted for Sales Charge | | | | | | | 4.58% | | | | 2.37% | | | | 1.99% | |
Adjusted for the Maximum Sales Charge
(max 4.50% load) | | | | | | | –0.12% | | | | 1.43% | | | | 1.52% | |
Bloomberg Barclays Global Aggregate
Currency Hedged Index† | | | | | | | 6.59% | | | | 3.49% | | | | 4.06% | |
Bloomberg Barclays Global Aggregate
Bond Index†† | | | | | | | 4.20% | | | | 2.64% | | | | 2.47% | |
| | | | |
| Class C | | 6-Month‡ | | | 1-Year | | | 5-Year | | | 10-Year | |
|
| Average Annual Total Returns as of 4/30/20 | |
| Unadjusted for Sales Charge | | | 0.73% | | | | 6.61% | | | | 2.06% | | | | 1.49% | |
Adjusted for the Maximum Sales Charge
(max 1.00% CDSC) | | | –0.27% | | | | 6.61% | | | | 2.06% | | | | 1.49% | |
Bloomberg Barclays Global Aggregate
Currency Hedged Index† | | | 2.76% | | | | 8.25% | | | | 3.93% | | | | 4.17% | |
Bloomberg Barclays Global Aggregate
Bond Index†† | | | 1.45% | | | | 6.56% | | | | 2.82% | | | | 2.67% | |
|
| Average Annual Total Returns as of 3/31/20 (most recent calendar quarter end) | |
| Unadjusted for Sales Charge | | | | | | | 3.80% | | | | 1.58% | | | | 1.23% | |
Adjusted for the Maximum Sales Charge
(max 1.00% CDSC) | | | | | | | 3.80% | | | | 1.58% | | | | 1.23% | |
Bloomberg Barclays Global Aggregate
Currency Hedged Index† | | | | | | | 6.59% | | | | 3.49% | | | | 4.06% | |
Bloomberg Barclays Global Aggregate
Bond Index†† | | | | | | | 4.20% | | | | 2.64% | | | | 2.47% | |
| | | | | | |
| 4 | | | | | DWS ESG Global Bond Fund | | |
| | | | | | | | | | | | | | | | |
| | | | |
| Class S | | 6-Month‡ | | | 1-Year | | | 5-Year | | | 10-Year | |
|
| Average Annual Total Returns as of 4/30/20 | |
| No Sales Charges | | | 1.23% | | | | 7.70% | | | | 3.06% | | | | 2.50% | |
Bloomberg Barclays Global Aggregate
Currency Hedged Index† | | | 2.76% | | | | 8.25% | | | | 3.93% | | | | 4.17% | |
Bloomberg Barclays Global Aggregate
Bond Index†† | | | 1.45% | | | | 6.56% | | | | 2.82% | | | | 2.67% | |
|
| Average Annual Total Returns as of 3/31/20 (most recent calendar quarter end) | |
| No Sales Charges | | | | | | | 4.85% | | | | 2.63% | | | | 2.25% | |
Bloomberg Barclays Global Aggregate
Currency Hedged Index† | | | | | | | 6.59% | | | | 3.49% | | | | 4.06% | |
Bloomberg Barclays Global Aggregate
Bond Index†† | | | | | | | 4.20% | | | | 2.64% | | | | 2.47% | |
Performance in the Average Annual Total Returns table(s) above and the Growth of an Assumed $10,000 Investment line graph that follows is historical and does not guarantee future results. Investment return and principal fluctuate, so your shares may be worth more or less when redeemed. Current performance may differ from performance data shown. Please visit dws.com for the Fund’s most recent month-end performance. Fund performance includes reinvestment of all distributions. Unadjusted returns do not reflect sales charges and would have been lower if they had.
The gross expense ratios of the Fund, as stated in the fee table of the prospectus dated February 1, 2020 are 1.32%, 2.12% and 1.03% for Class A, Class C and Class S shares, respectively, and may differ from the expense ratios disclosed in the Financial Highlights tables in this report.
Until April 30, 2019, the Fund was known as DWS High Conviction Global Bond Fund. On May 1, 2019, the Fund’s strategy and name changed. All returns prior to May 1, 2019 were achieved under the prior strategy.
Index returns do not reflect any fees or expenses and it is not possible to invest directly into an index.
Performance figures do not reflect the deduction of taxes that a shareholder would pay on fund distributions or the redemption of fund shares.
Generally accepted accounting principles require adjustments to be made to the net assets of the Fund at period end for financial reporting purposes only, and as such, the total return based on the unadjusted net asset value per share may differ from the total return reported in the financial highlights.
| | | | | | | | |
| | DWS ESG Global Bond Fund | | | | | | 5 | |
|
Growth of an Assumed $10,000 Investment
(Adjusted for Maximum Sales Charge) |
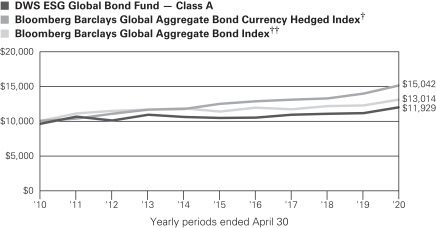
The Fund’s growth of an assumed $10,000 investment is adjusted for the maximum sales charge of 4.50%. This results in a net initial investment of $9,550.
The growth of $10,000 is cumulative.
| † | Bloomberg Barclays Global Aggregate Bond Currency Hedged Index is an unmanaged, currency hedged, broad-based global investment-grade fixed-income measure comprised of three component indices, the U.S. Aggregate Index, the Pan-European Aggregate Index, and the Asian-Pacific Aggregate Index. |
| †† | Bloomberg Barclays Global Aggregate Bond Index is a flagship measure of global investment grade debt from twenty-four local currency markets. This multi-currency benchmark includes treasury, government-related, corporate and securitized fixed-rate bonds from both developed and emerging markets issuers. |
| ‡ | Total returns shown for periods less than one year are not annualized. |
Bloomberg Barclays Global Aggregate Bond Index replaced the Bloomberg Barclays Global Aggregate Bond Currency Hedged Index as the Fund’s principal benchmark index because the Advisor believes the Bloomberg Barclays Global Aggregate Bond Index more closely reflects the Fund’s investment strategies.
| | | | | | |
| 6 | | | | | DWS ESG Global Bond Fund | | |
| | | | | | | | | | | | |
| | | Class A | | | Class C | | | Class S | |
| | | |
| Net Asset Value | | | | | | | | | | | | |
| 4/30/20 | | $ | 9.46 | | | $ | 9.46 | | | $ | 9.44 | |
| 10/31/19 | | $ | 9.43 | | | $ | 9.43 | | | $ | 9.41 | |
| | | |
| Distribution Information as of 4/30/20 | | | | | | | | | | | | |
| Income Dividends, Six Months | | $ | .07 | | | $ | .04 | | | $ | .08 | |
| April Income Dividend | | $ | .0085 | | | $ | .0027 | | | $ | .0104 | |
| SEC 30-day Yield‡‡ | | | 1.15% | | | | .48% | | | | 1.45% | |
| Current Annualized Distribution Rate‡‡ | | | 1.08% | | | | .34% | | | | 1.32% | |
| ‡‡ | The SEC yield is net investment income per share earned over the month ended April 30, 2020, shown as an annualized percentage of the maximum offering price per share on the last day of the period. The SEC yield is computed in accordance with a standardized method prescribed by the Securities and Exchange Commission. The SEC yield would have been 0.85%, 0.16% and 1.17% for Class A, C and S shares, respectively, had certain expenses not been reduced. Current annualized distribution rate is the latest monthly dividend shown as an annualized percentage of net asset value on April 30, 2020. Distribution rate simply measures the level of dividends and is not a complete measure of performance. The current annualized distribution rate would have been 0.78%, 0.02% and 1.04% for Class A, C and S shares, respectively, had certain expenses not been reduced. Yields and distribution rates are historical, not guaranteed and will fluctuate. |
| | | | | | | | |
| | DWS ESG Global Bond Fund | | | | | | 7 | |
Portfolio Management Team
Thomas M. Farina, CFA, Managing Director
Portfolio Manager of the Fund. Began managing the Fund in 2019.
| – | Joined DWS in 2006 with 12 years of industry experience. Head of Investment Grade Corporate Credit since 2013. Prior to joining, he held roles at Merrill Lynch Investment Management, Greenwich NatWest and at DnB Asset Management. He began his career as a Ratings Analyst at Standard & Poor’s. |
| – | Senior Portfolio Manager and Co-Head of US Credit: New York. |
| – | BA and MA in Economics, State University of New York at Albany. |
Joseph Bowen, CFA, Assistant Vice President
Portfolio Manager of the Fund. Began managing the Fund in 2019.
| – | Joined DWS in 2014. Prior to his current role, he worked in Liquidity Management as an Investment Specialist. |
| – | Portfolio Manager for Fixed Income: New York. |
| – | BA in Economics, Franklin & Marshall College. |
| | | | | | |
| 8 | | | | | DWS ESG Global Bond Fund | | |
| | | | | | | | |
| Portfolio Summary | | | (Unaudited) | |
| | |
Asset Allocation (As a % of Investment Portfolio excluding
Cash Equivalents and Securities Lending Collateral) | | 4/30/20 | | | 10/31/19 | |
Corporate Bonds | | | 48% | | | | 48% | |
Financials | | | 18% | | | | 19% | |
Health Care | | | 8% | | | | 7% | |
Information Technology | | | 5% | | | | 4% | |
Communication Services | | | 4% | | | | 3% | |
Consumer Discretionary | | | 4% | | | | 3% | |
Real Estate | | | 3% | | | | 2% | |
Consumer Staples | | | 2% | | | | 1% | |
Materials | | | 2% | | | | 3% | |
Industrials | | | 2% | | | | 2% | |
Energy | | | — | | | | 3% | |
Utilities | | | — | | | | 1% | |
Government & Agency Obligations | | | 43% | | | | 43% | |
Sovereign Bonds | | | 22% | | | | 23% | |
U.S. Treasury Obligations | | | 19% | | | | 16% | |
Other Government Related | | | 2% | | | | 4% | |
Other | | | 9% | | | | 9% | |
Mortgage-Backed Securities Pass-Throughs | | | 3% | | | | 3% | |
Commercial Mortgage-Backed Securities | | | 2% | | | | 2% | |
Collateralized Mortgage Obligations | | | 2% | | | | 2% | |
Commercial paper | | | 1% | | | | 1% | |
Asset-Backed | | | 1% | | | | 1% | |
| | | | 100% | | | | 100% | |
| | |
Geographical Exposure (As a % of Investment Portfolio
excluding Cash Equivalents and Securities Lending Collateral) | | 4/30/20 | | | 10/31/19 | |
United States | | | 56% | | | | 52% | |
United Kingdom | | | 8% | | | | 7% | |
France | | | 5% | | | | 4% | |
Germany | | | 4% | | | | 4% | |
Canada | | | 4% | | | | 3% | |
Australia | | | 3% | | | | 3% | |
Spain | | | 3% | | | | 3% | |
Japan | | | 3% | | | | 3% | |
Sweden | | | 2% | | | | 2% | |
Netherlands | | | 2% | | | | 2% | |
New Zealand | | | 2% | | | | 1% | |
Italy | | | 2% | | | | 2% | |
Chile | | | 2% | | | | 2% | |
Norway | | | 1% | | | | 2% | |
Indonesia | | | 1% | | | | 2% | |
| Others | | | 2% | | | | 8% | |
| | | | 100% | | | | 100% | |
| | | | | | | | |
| | DWS ESG Global Bond Fund | | | | | | 9 | |
| | | | | | | | |
Currency Exposure* (As a % of Investment Portfolio
excluding Securities Lending Collateral) | | 4/30/20 | | | 10/31/19 | |
United States Dollar | | | 60% | | | | 67% | |
Japanese Yen | | | 18% | | | | 14% | |
Euro | | | 16% | | | | 14% | |
British Pound | | | 4% | | | | 1% | |
Australian Dollar | | | 2% | | | | 4% | |
| Canadian Dollar | | | 0% | | | | — | |
| | | | 100% | | | | 100% | |
| * | Currency exposure after taking into account the effects of forward currency contracts and foreign currency balances. |
| | | | | | | | |
Quality (Excludes Cash Equivalents and Securities
Lending Collateral) | | 4/30/20 | | | 10/31/19 | |
AAA | | | 28% | | | | 23% | |
AA | | | 18% | | | | 16% | |
A | | | 27% | | | | 31% | |
BBB | | | 21% | | | | 25% | |
BB | | | 6% | | | | 3% | |
B | | | 0% | | | | 1% | |
| Not Rated | | | 0% | | | | 1% | |
| | | | 100% | | | | 100% | |
The quality ratings represent the higher of Moody’s Investors Service, Inc. (“Moody’s”), Fitch Ratings, Inc. (“Fitch”) or S&P Global Ratings (“S&P”) credit ratings. The ratings of Moody’s, Fitch and S&P represent their opinions as to the quality of the securities they rate. Credit quality measures a bond issuer’s ability to repay interest and principal in a timely manner. Ratings are relative and subjective and are not absolute standards of quality. Credit quality does not remove market risk and is subject to change.
| | | | | | | | |
| Interest Rate Sensitivity | | 4/30/20 | | | 10/31/19 | |
| Effective Maturity | | | 10.0 years | | | | 10.6 years | |
| Effective Duration | | | 7.2 years | | | | 7.2 years | |
Effective maturity is the weighted average of the maturity date of bonds held by the Fund taking into consideration any available maturity shortening features.
Effective duration is an approximate measure of the Fund’s sensitivity to interest rate changes taking into consideration any maturity shortening features.
Portfolio holdings and characteristics are subject to change.
For more complete details about the Fund’s investment portfolio, see page 11. A quarterly Fact Sheet is available on dws.com or upon request. Please see the Account Management Resources section on page 53 for contact information.
| | | | | | |
| 10 | | | | | DWS ESG Global Bond Fund | | |
| | |
| Investment Portfolio | | as of April 30, 2020 (Unaudited) |
| | | | | | | | |
| | | Principal
Amount ($)(a) | | | Value ($) | |
| Bonds 95.2% | |
| Australia 3.0% | |
| | |
Government of Australia, REG S, 2.25%, 5/21/2028 | | AUD | 1,275,000 | | | | 927,542 | |
| | |
Optus Finance Pty Ltd., REG S, 1.0%, 6/20/2029 | | EUR | 325,000 | | | | 356,226 | |
| | |
Suncorp-Metway Ltd., 144A, 2.8%, 5/4/2022 | | | 350,000 | | | | 358,611 | |
| | | | | | | | |
(Cost $1,635,868) | | | | 1,642,379 | |
|
| Canada 3.5% | |
| | |
Bank of Montreal, 2.9%, 3/26/2022 | | | 400,000 | | | | 411,819 | |
| | |
Ford Credit Canada Co., 4.46%, 11/13/2024 | | CAD | 300,000 | | | | 179,662 | |
| | |
Master Credit Card Trust II, “A”, Series 2020-1A, 144A, 1.99%, 9/21/2024 | | | 500,000 | | | | 509,017 | |
| | |
Open Text Corp., 144A, 3.875%, 2/15/2028 | | | 250,000 | | | | 245,000 | |
| | |
Royal Bank of Canada, 2.8%, 4/29/2022 | | | 600,000 | | | | 616,620 | |
| | | | | | | | |
(Cost $1,980,474) | | | | 1,962,118 | |
|
| Chile 1.4% | |
|
Banco del Estado de Chile: | |
| | |
144A, 2.668%, 1/8/2021 | | | 300,000 | | | | 300,000 | |
| | |
144A, 2.704%, 1/9/2025 | | | 200,000 | | | | 199,000 | |
| | |
Chile Government International Bond, 2.55%, 1/27/2032 | | | 300,000 | | | | 299,703 | |
| | | | | | | | |
(Cost $799,352) | | | | 798,703 | |
|
| France 4.4% | |
| | |
BPCE SA, 144A, 4.625%, 9/12/2028 | | | 500,000 | | | | 565,815 | |
| | |
Dassault Systemes SE, REG S, 0.375%, 9/16/2029 | | EUR | 300,000 | | | | 318,883 | |
| | |
Government of France, REG S, 144A, 1.5%, 5/25/2050 | | EUR | 850,000 | | | | 1,163,846 | |
|
Societe Generale SA: | |
| | |
144A, 2.625%, 9/16/2020 | | | 210,000 | | | | 210,916 | |
| | |
144A, 2.625%, 1/22/2025 | | | 200,000 | | | | 199,719 | |
| | | | | | | | |
(Cost $2,412,083) | | | | 2,459,179 | |
|
| Germany 3.9% | |
|
Bundesrepublik Deutschland Bundesanleihe: | |
| | |
REG S, 0.25%, 2/15/2029 | | EUR | 550,000 | | | | 651,424 | |
| | |
REG S, 1.25%, 8/15/2048 | | EUR | 760,000 | | | | 1,183,144 | |
| | |
Merck Financial Services GmbH, REG S, 0.875%, 7/5/2031 | | EUR | 300,000 | | | | 340,982 | |
| | | | | | | | |
(Cost $2,187,941) | | | | 2,175,550 | |
|
| Hungary 0.3% | |
Republic of Hungary, 6.375%, 3/29/2021
(Cost $186,632) | | | 164,000 | | | | 170,297 | |
The accompanying notes are an integral part of the financial statements.
| | | | | | | | |
| | DWS ESG Global Bond Fund | | | | | | 11 | |
| | | | | | | | |
| | | Principal
Amount ($)(a) | | | Value ($) | |
|
| Indonesia 0.5% | |
Perusahaan Penerbit SBSN Indonesia III, 144A, 3.4%, 3/29/2022 (Cost $285,000) | | | 285,000 | | | | 287,306 | |
|
| Ireland 0.5% | |
| | |
Avolon Holdings Funding Ltd., 144A, 3.25%, 2/15/2027 | | | 68,000 | | | | 52,627 | |
| | |
GE Capital International Funding Co., Unlimited Co., 4.418%, 11/15/2035 | | | 200,000 | | | | 208,433 | |
| | | | | | | | |
(Cost $265,180) | | | | 261,060 | |
|
| Italy 1.5% | |
|
Republic of Italy: | |
| | |
2.375%, 10/17/2024 | | | 435,000 | | | | 424,696 | |
| | |
2.875%, 10/17/2029 | | | 435,000 | | | | 408,955 | |
| | | | | | | | |
(Cost $864,815) | | | | 833,651 | |
|
| Japan 2.7% | |
| | |
Japan Government Thirty Year Bond, 0.4%, 6/20/2049 | | JPY | 122,000,000 | | | | 1,129,291 | |
| | |
Takeda Pharmaceutical Co., Ltd., REG S,
3.0%, 11/21/2030 | | EUR | 280,000 | | | | 347,695 | |
| | | | | | | | |
(Cost $1,568,533) | | | | 1,476,986 | |
|
| Luxembourg 0.6% | |
|
DH Europe Finance II Sarl: | |
| | |
0.75%, 9/18/2031 | | EUR | 180,000 | | | | 192,111 | |
| | |
2.6%, 11/15/2029 | | | 40,000 | | | | 42,000 | |
| | |
3.4%, 11/15/2049 | | | 80,000 | | | | 88,776 | |
| | | | | | | | |
(Cost $317,041) | | | | 322,887 | |
|
| Mexico 0.6% | |
America Movil SAB de CV, 3.625%, 4/22/2029 (Cost $291,185) | | | 292,000 | | | | 309,135 | |
|
| Netherlands 2.0% | |
| | |
ING Groep NV, 3-month USD-LIBOR + 1.000%, 2.451%*, 10/2/2023 | | | 400,000 | | | | 386,422 | |
|
NXP BV: | |
| | |
144A, 2.7%, 5/1/2025 (b) | | | 15,000 | | | | 15,166 | |
| | |
144A, 3.875%, 9/1/2022 | | | 200,000 | | | | 207,224 | |
| | |
144A, 3.875%, 6/18/2026 | | | 170,000 | | | | 178,132 | |
| | |
Telefonica Europe BV, REG S, 3.875%, Perpetual (c) | | EUR | 300,000 | | | | 323,088 | |
| | | | | | | | |
(Cost $1,135,011) | | | | 1,110,032 | |
|
| New Zealand 1.5% | |
| | |
ANZ New Zealand International Ltd., 144A,
3.4%, 3/19/2024 | | | 500,000 | | | | 529,855 | |
| | |
Bank of New Zealand, 144A, 3.5%, 2/20/2024 | | | 300,000 | | | | 314,693 | |
| | | | | | | | |
(Cost $803,270) | | | | 844,548 | |
The accompanying notes are an integral part of the financial statements.
| | | | | | |
| 12 | | | | | DWS ESG Global Bond Fund | | |
| | | | | | | | |
| | | Principal
Amount ($)(a) | | | Value ($) | |
|
| Norway 1.3% | |
Norsk Hydro ASA, REG S, 2.0%, 4/11/2029 (Cost $887,162) | | EUR | 750,000 | | | | 698,686 | |
|
| Portugal 0.8% | |
Republic of Portugal, 144A, 5.125%, 10/15/2024 (Cost $404,000) | | | 400,000 | | | | 454,438 | |
|
| Spain 2.7% | |
| | |
Banco Santander SA, 2.706%, 6/27/2024 | | | 400,000 | | | | 410,815 | |
| | |
Government of Spain, REG S, 144A, 0.6%, 10/31/2029 | | EUR | 1,000,000 | | | | 1,086,022 | |
| | | | | | | | |
(Cost $1,548,183) | | | | 1,496,837 | |
|
| Sweden 2.1% | |
| | |
Fastighets AB Balder, REG S, 1.875%, 1/23/2026 | | EUR | 500,000 | | | | 539,395 | |
| | |
Svenska Handelsbanken AB, Series FR56, 3-month USD-LIBOR + 0.470%, 2.153%*, 5/24/2021 | | | 650,000 | | | | 647,794 | |
| | | | | | | | |
(Cost $1,235,685) | | | | 1,187,189 | |
|
| Switzerland 0.7% | |
UBS Group AG, 144A, 3.491%, 5/23/2023 (Cost $402,800) | | | 400,000 | | | | 411,648 | |
|
| United Arab Emirates 0.7% | |
DP World PLC, 144A, 2.375%, 9/25/2026 (Cost $462,508) | | EUR | 400,000 | | | | 399,520 | |
|
| United Kingdom 7.5% | |
| | |
Bank of England Euro Note, 144A, 0.5%, 4/28/2023 | | | 540,000 | | | | 541,296 | |
| | |
Standard Chartered PLC, 144A, 4.247%, 1/20/2023 | | | 300,000 | | | | 307,758 | |
|
United Kingdom Gilt: | |
| | |
REG S, 0.875%, 10/22/2029 | | GBP | 1,370,000 | | | | 1,836,980 | |
| | |
REG S, 1.0%, 4/22/2024 | | GBP | 910,000 | | | | 1,188,737 | |
| | |
Vodafone Group PLC, 3-month USD-LIBOR + 0.990%, 2.166%*, 1/16/2024 | | | 280,000 | | | | 272,870 | |
| | | | | | | | |
(Cost $4,039,816) | | | | 4,147,641 | |
|
| United States 53.0% | |
| | |
3M Co., 3.7%, 4/15/2050 | | | 26,000 | | | | 31,046 | |
|
AbbVie, Inc.: | |
| | |
144A, 3.2%, 11/21/2029 | | | 60,000 | | | | 63,747 | |
| | |
144A, 4.25%, 11/21/2049 | | | 40,000 | | | | 46,118 | |
| | |
4.45%, 5/14/2046 | | | 100,000 | | | | 116,536 | |
| | |
Aircastle Ltd., 4.4%, 9/25/2023 | | | 434,000 | | | | 380,999 | |
| | |
American Express Co., 3.125%, 5/20/2026 | | | 150,000 | | | | 161,176 | |
| | |
Amgen, Inc., 3.375%, 2/21/2050 | | | 50,000 | | | | 53,635 | |
| | |
Anheuser-Busch Companies LLC, 4.9%, 2/1/2046 | | | 150,000 | | | | 173,069 | |
| | |
Anheuser-Busch InBev Worldwide, Inc., 5.45%, 1/23/2039 | | | 90,000 | | | | 108,434 | |
|
Anthem, Inc.: | |
| | |
2.25%, 5/15/2030 (b) | | | 90,000 | | | | 89,662 | |
| | |
2.875%, 9/15/2029 | | | 40,000 | | | | 41,615 | |
The accompanying notes are an integral part of the financial statements.
| | | | | | | | |
| | DWS ESG Global Bond Fund | | | | | | 13 | |
| | | | | | | | |
| | | Principal
Amount ($)(a) | | | Value ($) | |
|
Apple, Inc.: | |
| | |
2.05%, 9/11/2026 | | | 116,000 | | | | 122,307 | |
| | |
3.75%, 9/12/2047 | | | 125,000 | | | | 151,096 | |
| | |
Aramark Services, Inc., 144A, 6.375%, 5/1/2025 | | | 40,000 | | | | 41,600 | |
|
AT&T, Inc.: | |
| | |
3.4%, 5/15/2025 | | | 140,000 | | | | 148,264 | |
| | |
4.1%, 2/15/2028 | | | 95,000 | | | | 104,944 | |
| | |
Atrium Hotel Portfolio Trust, “B”,
Series 2018-ATRM, 144A, 1-month USD-LIBOR + 1.430%, 2.244%*, 6/15/2035 | | | 500,000 | | | | 434,897 | |
| | |
BAMLL Commercial Mortgage Securities Trust, “C”, Series 2018-DSNY, 144A, 1-month USD-LIBOR + 1.350%, 2.164% *, 9/15/2034 | | | 333,000 | | | | 272,370 | |
|
Bank of America Corp.: | |
| | |
2.592%, 4/29/2031 | | | 105,000 | | | | 107,747 | |
| | |
4.3%, Perpetual (c) | | | 224,000 | | | | 201,320 | |
| | |
Barclays Dryrock Issuance Trust, “A”, Series 2019-1, 1.96%, 5/15/2025 | | | 430,000 | | | | 432,440 | |
| | |
Barclays PLC, 2.852%, 5/7/2026 (b) | | | 200,000 | | | | 200,000 | |
| | |
Biogen, Inc., 3.15%, 5/1/2050 | | | 50,000 | | | | 49,027 | |
| | |
Boston Properties LP, 4.5%, 12/1/2028 | | | 250,000 | | | | 281,816 | |
| | |
Boston Scientific Corp., 4.0%, 3/1/2029 | | | 75,000 | | | | 84,188 | |
| | |
Bristol-Myers Squibb Co., 144A, 4.25%, 10/26/2049 | | | 100,000 | | | | 130,641 | |
|
Broadcom, Inc.: | |
| | |
144A, 3.625%, 10/15/2024 | | | 300,000 | | | | 316,174 | |
| | |
144A, 5.0%, 4/15/2030 | | | 75,000 | | | | 84,359 | |
| | |
BX Commercial Mortgage Trust, “C”, Series 2018-IND, 144A, 1-month USD-LIBOR + 1.100%, 1.914%*, 11/15/2035 | | | 165,789 | | | | 158,321 | |
| | |
Cargill, Inc., 144A, 1.375%, 7/23/2023 | | | 110,000 | | | | 110,560 | |
| | |
Carnival PLC, 1.0%, 10/28/2029 | | EUR | 250,000 | | | | 131,411 | |
| | |
Caterpillar, Inc., 3.25%, 9/19/2049 | | | 60,000 | | | | 64,410 | |
|
Cigna Corp.: | |
| | |
2.4%, 3/15/2030 | | | 30,000 | | | | 30,323 | |
| | |
3.2%, 3/15/2040 | | | 15,000 | | | | 15,231 | |
| | |
4.375%, 10/15/2028 | | | 150,000 | | | | 171,732 | |
|
Citigroup, Inc.: | |
| | |
3.98%, 3/20/2030 | | | 156,000 | | | | 171,831 | |
| | |
4.412%, 3/31/2031 | | | 85,000 | | | | 97,857 | |
| | |
Constellation Brands, Inc., 2.875%, 5/1/2030 | | | 45,000 | | | | 45,745 | |
| | |
CSX Corp., 4.5%, 3/15/2049 | | | 29,000 | | | | 36,584 | |
|
CVS Health Corp.: | |
| | |
4.25%, 4/1/2050 | | | 20,000 | | | | 23,417 | |
| | |
5.05%, 3/25/2048 | | | 55,000 | | | | 69,697 | |
| | |
Dell International LLC, 144A, 4.9%, 10/1/2026 | | | 231,000 | | | | 238,826 | |
| | |
DuPont de Nemours, Inc., 2.169%, 5/1/2023 (b) | | | 160,000 | | | | 161,067 | |
The accompanying notes are an integral part of the financial statements.
| | | | | | |
| 14 | | | | | DWS ESG Global Bond Fund | | |
| | | | | | | | |
| | | Principal
Amount ($)(a) | | | Value ($) | |
|
Eli Lilly & Co.: | |
| | |
0.625%, 11/1/2031 | | EUR | 100,000 | | | | 108,982 | |
| | |
1.7%, 11/1/2049 | | EUR | 310,000 | | | | 354,182 | |
|
Equinix, Inc.: | |
| | |
(REIT), 2.625%, 11/18/2024 | | | 103,000 | | | | 105,879 | |
| | |
(REIT), 3.2%, 11/18/2029 | | | 92,000 | | | | 96,097 | |
| | |
ERP Operating LP, (REIT), 4.15%, 12/1/2028 | | | 200,000 | | | | 226,604 | |
|
Estee Lauder Companies, Inc.: | |
| | |
2.375%, 12/1/2029 | | | 29,000 | | | | 29,676 | |
| | |
2.6%, 4/15/2030 | | | 20,000 | | | | 20,848 | |
| | |
Fannie Mae Connecticut Avenue Securities, “1M2”, Series 2018-C05, 1-month USD-LIBOR + 2.350%, 2.837%*, 1/25/2031 | | | 500,000 | | | | 446,323 | |
| | |
Federal Home Loan Mortgage Corp., “PI”, Series 3940, Interest Only, 4.0%, 2/15/2041 | | | 189,827 | | | | 14,336 | |
| | |
Federal National Mortgage Association, “4”, Series 406, Interest Only, 4.0%, 9/25/2040 | | | 149,727 | | | | 15,155 | |
| | |
FedEx Corp., 4.05%, 2/15/2048 | | | 125,000 | | | | 123,215 | |
|
Ford Motor Co.: | |
| | |
8.5%, 4/21/2023 | | | 70,000 | | | | 69,037 | |
| | |
9.0%, 4/22/2025 | | | 120,000 | | | | 116,850 | |
| | |
Freddie Mac Structured Agency Credit Risk Debt Notes, “M2”, Series 2017-DNA3, 1-month USD-LIBOR + 2.500%, 2.987%*, 3/25/2030 | | | 500,000 | | | | 470,189 | |
|
General Electric Co.: | |
| | |
3.45%, 5/1/2027 | | | 50,000 | | | | 50,895 | |
| | |
3.625%, 5/1/2030 | | | 40,000 | | | | 40,148 | |
| | |
General Mills, Inc., 2.875%, 4/15/2030 | | | 75,000 | | | | 80,237 | |
|
Government National Mortgage Association: | |
| | |
3.0%, 11/20/2044 | | | 1,674,263 | | | | 1,795,027 | |
| | |
“PI”, Series 2015-40, Interest Only, 4.0%, 4/20/2044 | | | 123,093 | | | | 6,297 | |
| | |
“IN”, Series 2009-69, Interest Only, 5.5%, 8/20/2039 | | | 132,117 | | | | 20,884 | |
| | |
“IV”, Series 2009-69, Interest Only, 5.5%, 8/20/2039 | | | 164,840 | | | | 26,082 | |
| | |
“IJ”, Series 2009-75, Interest Only, 6.0%, 8/16/2039 | | | 100,676 | | | | 16,768 | |
| | |
7.0% with various maturities from 1/15/2029 until 2/15/2029 | | | 18,116 | | | | 19,395 | |
| | |
Hartford Financial Services Group, Inc., 2.8%, 8/19/2029 | | | 50,000 | | | | 51,397 | |
| | |
Hasbro, Inc., 3.55%, 11/19/2026 | | | 83,000 | | | | 81,248 | |
|
HCA, Inc.: | |
| | |
3.5%, 9/1/2030 | | | 450,000 | | | | 430,134 | |
| | |
5.5%, 6/15/2047 | | | 200,000 | | | | 241,729 | |
| | |
5.625%, 9/1/2028 | | | 150,000 | | | | 166,212 | |
| | |
Hewlett Packard Enterprise Co., 4.45%, 10/2/2023 | | | 100,000 | | | | 105,294 | |
| | |
Hilton Worldwide Finance LLC, 4.625%, 4/1/2025 | | | 600,000 | | | | 588,000 | |
|
Home Depot, Inc.: | |
| | |
3.125%, 12/15/2049 | | | 75,000 | | | | 79,360 | |
| | |
3.35%, 4/15/2050 | | | 50,000 | | | | 55,372 | |
| | |
4.5%, 12/6/2048 | | | 100,000 | | | | 129,144 | |
The accompanying notes are an integral part of the financial statements.
| | | | | | | | |
| | DWS ESG Global Bond Fund | | | | | | 15 | |
| | | | | | | | |
| | | Principal
Amount ($)(a) | | | Value ($) | |
| | |
Host Hotels & Resorts LP, (REIT), 3.875%, 4/1/2024 | | | 95,000 | | | | 93,000 | |
| | |
Intel Corp., 3.25%, 11/15/2049 | | | 85,000 | | | | 94,532 | |
| | |
International Business Machines Corp., 3.5%, 5/15/2029 | | | 250,000 | | | | 282,292 | |
| | |
InTown Hotel Portfolio Trust, “C”, Series 2018-STAY, 144A, 1-month USD-LIBOR + 1.250%, 2.064%*, 1/15/2033 | | | 230,000 | | | | 202,495 | |
|
JPMorgan Chase & Co.: | |
| | |
2.739%, 10/15/2030 | | | 100,000 | | | | 103,583 | |
| | |
3.782%, 2/1/2028 | | | 150,000 | | | | 163,930 | |
|
Keurig Dr Pepper, Inc.: | |
| | |
3.2%, 5/1/2030 | | | 25,000 | | | | 26,634 | |
| | |
3.8%, 5/1/2050 | | | 30,000 | | | | 31,960 | |
| | |
KLA Corp., 3.3%, 3/1/2050 | | | 31,000 | | | | 30,321 | |
| | |
Kroger Co., 4.5%, 1/15/2029 (d) | | | 200,000 | | | | 235,276 | |
|
Lam Research Corp.: | |
| | |
2.875%, 6/15/2050 (b) | | | 24,000 | | | | 23,937 | |
| | |
4.0%, 3/15/2029 | | | 56,000 | | | | 65,362 | |
| | |
Lamar Media Corp., 144A, 3.75%, 2/15/2028 | | | 110,000 | | | | 101,269 | |
|
Lowe’s Companies, Inc.: | |
| | |
5.0%, 4/15/2040 | | | 35,000 | | | | 43,349 | |
| | |
5.125%, 4/15/2050 | | | 25,000 | | | | 32,632 | |
| | |
Marriott International, Inc., 5.75%, 5/1/2025 | | | 60,000 | | | | 62,704 | |
|
McDonald’s Corp.: | |
| | |
2.125%, 3/1/2030 | | | 40,000 | | | | 39,891 | |
| | |
3.625%, 9/1/2049 | | | 125,000 | | | | 136,813 | |
| | |
4.2%, 4/1/2050 | | | 50,000 | | | | 59,549 | |
| | |
Merck & Co., Inc., 4.0%, 3/7/2049 | | | 230,000 | | | | 303,548 | |
| | |
Micron Technology, Inc., 2.497%, 4/24/2023 | | | 70,000 | | | | 71,257 | |
| | |
Microsoft Corp., 3.7%, 8/8/2046 | | | 64,000 | | | | 78,705 | |
|
Morgan Stanley: | |
| | |
3.622%, 4/1/2031 | | | 80,000 | | | | 87,794 | |
| | |
4.431%, 1/23/2030 | | | 140,000 | | | | 161,926 | |
| | |
MSCI, Inc., 144A, 4.0%, 11/15/2029 | | | 80,000 | | | | 83,647 | |
| | |
Nestle Holdings, Inc., 144A, 4.0%, 9/24/2048 | | | 150,000 | | | | 190,659 | |
| | |
Newmont Corp., 2.25%, 10/1/2030 | | | 45,000 | | | | 44,558 | |
| | |
NortonLifeLock, Inc., 3.95%, 6/15/2022 | | | 275,000 | | | | 280,252 | |
|
NVIDIA Corp.: | |
| | |
3.5%, 4/1/2040 | | | 14,000 | | | | 15,736 | |
| | |
3.5%, 4/1/2050 | | | 22,000 | | | | 25,245 | |
|
Oracle Corp.: | |
| | |
3.6%, 4/1/2050 | | | 25,000 | | | | 28,398 | |
| | |
4.0%, 11/15/2047 | | | 45,000 | | | | 53,657 | |
|
PayPal Holdings, Inc.: | |
| | |
2.65%, 10/1/2026 | | | 152,000 | | | | 159,446 | |
| | |
2.85%, 10/1/2029 | | | 150,000 | | | | 159,296 | |
|
PepsiCo, Inc.: | |
| | |
3.375%, 7/29/2049 (d) | | | 55,000 | | | | 62,748 | |
| | |
3.5%, 3/19/2040 | | | 30,000 | | | | 35,174 | |
The accompanying notes are an integral part of the financial statements.
| | | | | | |
| 16 | | | | | DWS ESG Global Bond Fund | | |
| | | | | | | | |
| | | Principal
Amount ($)(a) | | | Value ($) | |
| | |
PNC Financial Services Group, Inc., 3.5%, 1/23/2024 | | | 330,000 | | | | 352,318 | |
| | |
Prudential Financial, Inc., 4.35%, 2/25/2050 | | | 100,000 | | | | 114,407 | |
| | |
Santander Holdings U.S.A., Inc., 3.244%, 10/5/2026 | | | 205,000 | | | | 198,037 | |
| | |
Select Medical Corp., 144A, 6.25%, 8/15/2026 | | | 180,000 | | | | 173,358 | |
| | |
Signature Aviation U.S. Holdings, Inc., 144A, 4.0%, 3/1/2028 | | | 400,000 | | | | 340,000 | |
| | |
Starbucks Corp., 4.5%, 11/15/2048 | | | 200,000 | | | | 234,271 | |
| | |
State Street Corp., 2.4%, 1/24/2030 | | | 288,000 | | | | 298,793 | |
|
T-Mobile U.S.A., Inc.: | |
| | |
144A, 3.875%, 4/15/2030 | | | 85,000 | | | | 93,282 | |
| | |
144A, 4.375%, 4/15/2040 | | | 60,000 | | | | 68,107 | |
| | |
144A, 4.5%, 4/15/2050 | | | 70,000 | | | | 81,928 | |
| | |
Target Corp., 2.65%, 9/15/2030 | | | 30,000 | | | | 32,201 | |
|
The Goldman Sachs Group, Inc.: | |
| | |
3.5%, 4/1/2025 | | | 106,000 | | | | 112,791 | |
| | |
3.625%, 2/20/2024 | | | 160,000 | | | | 169,486 | |
| | |
4.4%, Perpetual (c) | | | 58,000 | | | | 51,471 | |
| | |
Thermo Fisher Scientific, Inc., 2.6%, 10/1/2029 | | | 140,000 | | | | 147,788 | |
|
U.S. Treasury Bills: | |
| | |
-0.021%**, 9/10/2020 | | | 150,000 | | | | 149,941 | |
| | |
0.001%**, 9/10/2020 | | | 200,000 | | | | 199,921 | |
| | |
0.92%**, 9/10/2020 | | | 100,000 | | | | 99,961 | |
| | |
1.131%**, 9/10/2020 | | | 200,000 | | | | 199,921 | |
| | |
1.595%**, 9/10/2020 | | | 105,000 | | | | 104,959 | |
| | |
1.712%**, 7/16/2020 (e) | | | 1,113,000 | | | | 1,112,774 | |
| | |
U.S. Treasury Bond, 2.375%, 11/15/2049 | | | 1,720,000 | | | | 2,185,139 | |
|
U.S. Treasury Notes: | |
| | |
1.5%, 11/30/2024 | | | 768,000 | | | | 808,890 | |
| | |
1.5%, 2/15/2030 (d) | | | 5,013,000 | | | | 5,429,314 | |
|
UnitedHealth Group, Inc.: | |
| | |
2.875%, 8/15/2029 | | | 54,000 | | | | 58,533 | |
| | |
4.45%, 12/15/2048 | | | 120,000 | | | | 154,401 | |
| | |
VF Corp., 2.8%, 4/23/2027 | | | 50,000 | | | | 51,262 | |
| | |
Visa, Inc., 2.05%, 4/15/2030 | | | 105,000 | | | | 108,184 | |
| | |
Walt Disney Co., 4.7%, 3/23/2050 (d) | | | 20,000 | | | | 26,758 | |
| | |
Waste Management, Inc., 3.45%, 6/15/2029 | | | 90,000 | | | | 102,254 | |
| | |
WEA Finance LLC, 144A, (REIT), 3.75%, 9/17/2024 | | | 325,000 | | | | 327,243 | |
| | |
Welltower, Inc., (REIT), 3.1%, 1/15/2030 | | | 80,000 | | | | 75,676 | |
| | | | | | | | |
(Cost $28,903,319) | | | | 29,472,179 | |
Total Bonds (Cost $52,615,858) | | | | 52,921,969 | |
| | |
| Commercial Paper 0.9% | | | | | | | | |
United States | |
Consolidated Edison Co., 4.382%, 5/6/2020 (Cost $499,701) | | | 500,000 | | | | 499,953 | |
The accompanying notes are an integral part of the financial statements.
| | | | | | | | |
| | DWS ESG Global Bond Fund | | | | | | 17 | |
| | | | | | | | |
| | |
| | | Shares | | | Value ($) | |
| Securities Lending Collateral 6.6% | | | | |
DWS Government & Agency Securities Portfolio “DWS Government Cash Institutional Shares”, 0.15% (f) (g) (Cost $3,640,590) | | | 3,640,590 | | | | 3,640,590 | |
| |
| Cash Equivalents 2.5% | | | | |
DWS Central Cash Management Government Fund, 0.16% (f) (Cost $1,388,378) | | | 1,388,378 | | | | 1,388,378 | |
| | |
| | | % of Net
Assets | | | Value ($) | |
| Total Investment Portfolio (Cost $58,144,527) | | | 105.2 | | | | 58,450,890 | |
| Other Assets and Liabilities, Net | | | (5.2 | ) | | | (2,890,318 | ) |
| |
| Net Assets | | | 100.0 | | | | 55,560,572 | |
A summary of the Fund’s transactions with affiliated investments during the period ended April 30, 2020 are as follows:
| | | | | | | | | | | | | | | | | | | | | | | | | | | | | | | | |
Value ($)
at
10/31/2019 | | Pur-
chases
Cost
($) | | | Sales
Proceeds
($) | | | Net
Real-
ized
Gain/
(Loss)
($) | | | Net
Change
in
Unreal-
ized
Appreci-
ation
(Depreci-
ation)
($) | | | Income
($) | | | Capital
Gain
Distri-
butions
($) | | | Number of
Shares at
4/30/2020 | | | Value ($)
at
4/30/2020 | |
| Securities Lending Collateral 6.6% | |
DWS Government & Agency Securities Portfolio “DWS Government Cash Institutional Shares”,
0.15% (f) (g) | |
| 227,700 | | | 3,412,890 (h) | | | | — | | | | — | | | | — | | | | 3,219 | | | | — | | | | 3,640,590 | | | | 3,640,590 | |
| Cash Equivalents 2.5% | |
| DWS Central Cash Management Government Fund, 0.16% (f) | |
| 1,545,699 | | | 12,810,383 | | | | 12,967,704 | | | | — | | | | — | | | | 4,819 | | | | — | | | | 1,388,378 | | | | 1,388,378 | |
| 1,773,399 | | | 16,223,273 | | | | 12,967,704 | | | | — | | | | — | | | | 8,038 | | | | — | | | | 5,028,968 | | | | 5,028,968 | |
| * | Variable or floating rate security. These securities are shown at their current rate as of April 30, 2020. For securities based on a published reference rate and spread, the reference rate and spread are indicated within the description above. Certain variable rate securities are not based on a published reference rate and spread but adjust periodically based on current market conditions, prepayment of underlying positions and/or other variables. |
| ** | Annualized yield at time of purchase; not a coupon rate. |
| (a) | Principal amount stated in U.S. dollars unless otherwise noted. |
| (c) | Perpetual, callable security with no stated maturity date. |
| (d) | All or a portion of these securities were on loan. In addition, “Other Assets and Liabilities, Net” may include pending sales that are also on loan. The value of securities loaned at April 30, 2020 amounted to $3,566,612, which is 6.4% of net assets. |
| (e) | At April 30, 2020, this security has been pledged, in whole or in part, to cover initial margin requirements for open futures contracts. |
The accompanying notes are an integral part of the financial statements.
| | | | | | |
| 18 | | | | | DWS ESG Global Bond Fund | | |
| (f) | Affiliated fund managed by DWS Investment Management Americas, Inc. The rate shown is the annualized seven-day yield at period end. |
| (g) | Represents cash collateral held in connection with securities lending. Income earned by the Fund is net of borrower rebates. |
| (h) | Represents the net increase (purchase cost) or decrease (sales proceeds) in the amount invested in cash collateral for the period ended April 30, 2020. |
144A: Security exempt from registration under Rule 144A of the Securities Act of 1933. These securities may be resold in transactions exempt from registration, normally to qualified institutional buyers.
Interest Only: Interest Only (IO) bonds represent the “interest only” portion of payments on a pool of underlying mortgages or mortgage-backed securities. IO securities are subject to prepayment risk of the pool of underlying mortgages.
LIBOR: London Interbank Offered Rate
REG S: Securities sold under Regulation S may not be offered, sold or delivered within the United States or to, or for the account or benefit of, U.S. persons, except pursuant to an exemption from, or in a transaction not subject to, the registration requirements of the Securities Act of 1933.
REIT: Real Estate Investment Trust
SBSN: Surat Berharga Syariah Negara (Islamic Based Government Securities)
Included in the portfolio are investments in mortgage or asset-backed securities which are interests in separate pools of mortgages or assets. Effective maturities of these investments may be shorter than stated maturities due to prepayments. Some separate investments in the Federal Home Loan Mortgage Corp. and Government National Mortgage Association issues which have similar coupon rates have been aggregated for presentation purposes in this investment portfolio.
At April 30, 2020, open futures contracts sold were as follows:
| | | | | | | | | | | | | | | | | | | | | | | | |
| Futures | | Currency | | | Expiration
Date | | | Contracts | | | Notional
Amount ($) | | | Notional
Value ($) | | | Unrealized
Depreciation ($) | |
| Ultra 10 Year U.S. Treasury Note | | | USD | | | | 6/19/2020 | | | | 16 | | | | 2,397,021 | | | | 2,512,500 | | | | (115,479 | ) |
| Ultra Long U.S. Treasury Bond | | | USD | | | | 6/19/2020 | | | | 6 | | | | 1,207,353 | | | | 1,348,687 | | | | (141,334 | ) |
| Total unrealized depreciation | | | | (256,813 | ) |
As of April 30, 2020, the Fund had the following open forward foreign currency contracts:
| | | | | | | | | | | | | | | | | | | | |
Contracts to
Deliver | | | In Exchange For | | | Settlement
Date | | | Unrealized
Appreciation ($) | | | Counterparty |
| AUD | | | 820,000 | | | USD | | | 543,043 | | | | 5/4/2020 | | | | 8,686 | | | Toronto-Dominion Bank |
| GBP | | | 500,000 | | | USD | | | 653,255 | | | | 5/18/2020 | | | | 23,463 | | | Bank of America |
| USD | | | 8,707,534 | | | JPY | | | 960,000,000 | | | | 5/21/2020 | | | | 240,654 | | | State Street Bank & Trust Co. |
| Total unrealized appreciation | | | | | | | | 272,803 | | | |
| | | | |
Contracts to
Deliver | | | In Exchange For | | | Settlement
Date | | | Unrealized
Depreciation ($) | | | Counterparty |
| USD | | | 553,631 | | | AUD | | | 820,000 | | | | 5/4/2020 | | | | (19,273 | ) | | Toronto-Dominion Bank |
The accompanying notes are an integral part of the financial statements.
| | | | | | | | |
| | DWS ESG Global Bond Fund | | | | | | 19 | |
|
| Currency Abbreviations |
| AUD Australian Dollar |
| CAD Canadian Dollar |
| EUR Euro |
| GBP British Pound |
| JPY Japanese Yen |
| USD United States Dollar |
For information on the Fund’s policy and additional disclosures regarding futures contracts and forward foreign currency contracts, please refer to the Derivatives section of Note B in the accompanying Notes to Financial Statements.
Fair Value Measurements
Various inputs are used in determining the value of the Fund’s investments. These inputs are summarized in three broad levels. Level 1 includes quoted prices in active markets for identical securities. Level 2 includes other significant observable inputs (including quoted prices for similar securities, interest rates, prepayment speeds, and credit risk). Level 3 includes significant unobservable inputs (including the Fund’s own assumptions in determining the fair value of investments). The level assigned to the securities valuations may not be an indication of the risk or liquidity associated with investing in those securities.
The following is a summary of the inputs used as of April 30, 2020 in valuing the Fund’s investments. For information on the Fund’s policy regarding the valuation of investments, please refer to the Security Valuation section of Note A in the accompanying Notes to Financial Statements.
| | | | | | | | | | | | | | | | |
| Assets | | Level 1 | | | Level 2 | | | Level 3 | | | Total | |
| Fixed Income Investments (i) | | | | | | | | | | | | | | | | |
Bonds | | $ | — | | | $ | 52,921,969 | | | $ | — | | | $ | 52,921,969 | |
Commercial paper | | | — | | | | 499,953 | | | | — | | | | 499,953 | |
| Short-Term Investments (i) | | | 5,028,968 | | | | — | | | | — | | | | 5,028,968 | |
| Derivatives (j) | | | | | | | | | | | | | | | | |
Forward Foreign Currency Contracts | | | — | | | | 272,803 | | | | — | | | | 272,803 | |
| Total | | $ | 5,028,968 | | | $ | 53,694,725 | | | $ | — | | | $ | 58,723,693 | |
| | | | |
| Liabilities | | Level 1 | | | Level 2 | | | Level 3 | | | Total | |
| Derivatives (j) | | | | | | | | | | | | | | | | |
Futures Contracts | | $ | (256,813 | ) | | $ | — | | | $ | — | | | $ | (256,813 | ) |
Forward Foreign Currency Contracts | | | — | | | | (19,273 | ) | | | — | | | | (19,273 | ) |
| Total | | $ | (256,813 | ) | | $ | (19,273 | ) | | $ | — | | | $ | (276,086 | ) |
| (i) | See Investment Portfolio for additional detailed categorizations. |
| (j) | Derivatives include unrealized appreciation (depreciation) on open futures contracts, and forward foreign currency contracts. |
The accompanying notes are an integral part of the financial statements.
| | | | | | |
| 20 | | | | | DWS ESG Global Bond Fund | | |
Statement of Assets and Liabilities
| | | | |
| as of April 30, 2020 (Unaudited) | | | | |
| | | | |
| |
| Assets | | | | |
| Investments in non-affiliated securities, at value (cost $53,115,559) — including $3,566,612 of securities loaned | | $ | 53,421,922 | |
| Investment in DWS Government & Agency Securities Portfolio (cost $3,640,590)* | | | 3,640,590 | |
| Investment in DWS Central Cash Management Government Fund (cost $1,388,378) | | | 1,388,378 | |
| Cash | | | 2 | |
| Foreign currency, at value (cost $1,129,305) | | | 1,128,759 | |
| Receivable for investments sold | | | 27,599 | |
| Receivable for Fund shares sold | | | 7,151 | |
| Interest receivable | | | 279,224 | |
| Receivable for variation margin on futures contracts | | | 5,209 | |
| Unrealized appreciation on forward foreign currency contracts | | | 272,803 | |
| Foreign taxes recoverable | | | 228 | |
| Other assets | | | 35,448 | |
| Total assets | | | 60,207,313 | |
| |
| Liabilities | | | | |
| Payable upon return of securities loaned | | | 3,640,590 | |
| Payable for investments purchased | | | 383,165 | |
| Payable for investments purchased — when-issued securities | | | 488,587 | |
| Payable for Fund shares redeemed | | | 3,911 | |
| Unrealized depreciation on forward foreign currency contracts | | | 19,273 | |
| Accrued management fee | | | 590 | |
| Accrued Directors’ fees | | | 1,443 | |
| Other accrued expenses and payables | | | 109,182 | |
| Total liabilities | | | 4,646,741 | |
| Net assets, at value | | $ | 55,560,572 | |
| |
| Net Assets Consist of | | | | |
| | | | |
| Distributed earnings (loss) | | | (2,067,878 | ) |
| Paid-in capital | | | 57,628,450 | |
| Net assets, at value | | $ | 55,560,572 | |
| * | Represents collateral on securities loaned. |
The accompanying notes are an integral part of the financial statements.
| | | | | | | | |
| | DWS ESG Global Bond Fund | | | | | | 21 | |
| | |
| Statement of Assets and Liabilities as of April 30, 2020 (Unaudited) (continued) | | |
| | | | |
| Net Asset Value | | | | |
Class A | | | | |
| |
Net Asset Value and redemption price per share
($10,796,056 ÷ 1,141,324 shares of capital stock outstanding,
$.01 par value, 50,000,000 shares authorized) | | $ | 9.46 | |
| |
| Maximum offering price per share (100 ÷ 95.50 of $9.46) | | $ | 9.91 | |
Class C | | | | |
| |
Net Asset Value, offering and redemption price
(subject to contingent deferred sales charge) per share
($457,924 ÷ 48,412 shares of capital stock outstanding,
$.01 par value, 20,000,000 shares authorized) | | $ | 9.46 | |
Class S | | | | |
| |
Net Asset Value, offering and redemption price per share
($44,306,592 ÷ 4,692,614 shares of capital stock outstanding,
$.01 par value, 309,154,575 shares authorized) | | $ | 9.44 | |
The accompanying notes are an integral part of the financial statements.
| | | | | | |
| 22 | | | | | DWS ESG Global Bond Fund | | |
Statement of Operations
| | | | |
| for the six months ended April 30, 2020 (Unaudited) | | | | |
| | | | |
| |
| Investment Income | | | | |
| Income: | | | | |
| |
| Interest | | $ | 649,571 | |
Income distributions — DWS Central Cash Management
Government Fund | | | 4,819 | |
| Securities lending income, net of borrower rebates | | | 3,219 | |
| Total income | | | 657,609 | |
| Expenses: | | | | |
| |
| Management fee | | | 84,801 | |
| Administration fee | | | 27,084 | |
| Services to shareholders | | | 51,693 | |
| Distribution and service fees | | | 14,747 | |
| Custodian fee | | | 17,030 | |
| Professional fees | | | 47,630 | |
| Reports to shareholders | | | 26,202 | |
| Registration fees | | | 19,640 | |
| Directors’ fees and expenses | | | 2,244 | |
| Other | | | 12,337 | |
| Total expenses before expense reductions | | | 303,408 | |
| Expense reductions | | | (97,022 | ) |
| Total expenses after expense reductions | | | 206,386 | |
| Net investment income | | | 451,223 | |
| |
| Realized and Unrealized Gain (Loss) | | | | |
| Net realized gain (loss) from: | | | | |
| |
| Investments | | | 1,497,583 | |
| Swap contracts | | | 476,354 | |
| Futures | | | (186,015 | ) |
| Forward foreign currency contracts | | | (677,682 | ) |
| Foreign currency | | | 148,204 | |
| | | | 1,258,444 | |
| Change in net unrealized appreciation (depreciation) on: | | | | |
| |
| Investments | | | (1,356,560 | ) |
| Swap contracts | | | (4,959 | ) |
| Futures | | | (238,594 | ) |
| Forward foreign currency contracts | | | 512,812 | |
| Foreign currency | | | 9,127 | |
| | | | (1,078,174 | ) |
| Net gain (loss) | | | 180,270 | |
| Net increase (decrease) in net assets resulting from operations | | $ | 631,493 | |
The accompanying notes are an integral part of the financial statements.
| | | | | | | | |
| | DWS ESG Global Bond Fund | | | | | | 23 | |
Statements of Changes in Net Assets
| | | | | | | | |
| | | Six Months
Ended
April 30, 2020 | | | Year Ended
October 31, | |
| Increase (Decrease) in Net Assets | | (Unaudited) | | | 2019 | |
| | | | | | | | |
| Operations: | | | | | | | | |
| | |
| Net investment income (loss) | | $ | 451,223 | | | $ | 1,468,810 | |
| Net realized gain (loss) | | | 1,258,444 | | | | 1,230,609 | |
| Change in net unrealized appreciation (depreciation) | | | (1,078,174 | ) | | | 3,020,721 | |
| Net increase (decrease) in net assets resulting from operations | | | 631,493 | | | | 5,720,140 | |
| Distributions to shareholders: | | | | | | | | |
| | |
Class A | | | (78,670 | ) | | | (205,682 | ) |
Class C | | | (1,900 | ) | | | (8,389 | ) |
Class S | | | (401,279 | ) | | | (1,021,035 | ) |
| Return of capital distributions to shareholders: | | | | | | | | |
| | |
Class A | | | — | | | | (50,871 | ) |
Class C | | | — | | | | (2,075 | ) |
Class S | | | — | | | | (252,529 | ) |
| Total distributions | | | (481,849 | ) | | | (1,540,581 | ) |
| Fund share transactions: | | | | | | | | |
| | |
| Proceeds from shares sold | | | 3,329,637 | | | | 1,140,705 | |
| Reinvestment of distributions | | | 434,245 | | | | 1,400,670 | |
| Payments for shares redeemed | | | (5,754,131 | ) | | | (8,744,076 | ) |
| Net increase (decrease) in net assets from Fund share transactions | | | (1,990,249 | ) | | | (6,202,701 | ) |
| Increase (decrease) in net assets | | | (1,840,605 | ) | | | (2,023,142 | ) |
| Net assets at beginning of period | | | 57,401,177 | | | | 59,424,319 | |
| | |
| Net assets at end of period | | $ | 55,560,572 | | | $ | 57,401,177 | |
The accompanying notes are an integral part of the financial statements.
| | | | | | |
| 24 | | | | | DWS ESG Global Bond Fund | | |
Financial Highlights
| | | | | | | | | | | | | | | | | | | | | | | | | | |
| | | Six Months
Ended 4/30/20 | | | Years Ended October 31, | |
| Class A | | (Unaudited) | | | 2019 | | | 2018 | | | 2017 | | | 2016 | | | 2015 | |
| | | | | | |
| Selected Per Share Data | | | | | | | | | | | | | | | | | | | | | | | | |
Net asset value, beginning
of period | | | $9.43 | | | | $8.77 | | | | $9.27 | | | | $9.15 | | | | $8.91 | | | | $9.67 | |
| Income (loss) from investment operations: | | | | | | | | | | | | | | | | | | | | | | | | |
| | | | | | |
Net investment incomea | | | .07 | | | | .21 | | | | .23 | | | | .22 | | | | .16 | | | | .25 | |
Net realized and unrealized
gain (loss) | | | .03 | | | | .67 | | | | (.53 | ) | | | .10 | | | | .24 | | | | (.57 | ) |
Total from investment operations | | | .10 | | | | .88 | | | | (.30 | ) | | | .32 | | | | .40 | | | | (.32 | ) |
| Less distributions from: | | | | | | | | | | | | | | | | | | | | | | | | |
| | | | | | |
Net investment income | | | (.07 | ) | | | (.18 | ) | | | (.20 | ) | | | (.20 | ) | | | (.06 | ) | | | (.30 | ) |
Net realized gains | | | — | | | | — | | | | — | | | | — | | | | — | | | | (.10 | ) |
Return of capital | | | — | | | | (.04 | ) | | | — | | | | — | | | | (.10 | ) | | | (.04 | ) |
Total distributions | | | (.07 | ) | | | (.22 | ) | | | (.20 | ) | | | (.20 | ) | | | (.16 | ) | | | (.44 | ) |
| Redemption fees | | | — | | | | — | | | | — | | | | .00 | *** | | | .00 | *** | | | .00 | *** |
| Net asset value, end of period | | | $9.46 | | | | $9.43 | | | | $8.77 | | | | $9.27 | | | | $9.15 | | | | $8.91 | |
| Total Return (%)b,c | | | 1.10 | ** | | | 10.19 | | | | (3.26 | ) | | | 3.60 | | | | 4.57 | | | | (3.41 | ) |
| | | |
| Ratios to Average Net Assets and Supplemental Data | | | | | | | | | | | | | |
Net assets, end of period
($ millions) | | | 11 | | | | 10 | | | | 10 | | | | 13 | | | | 18 | | | | 16 | |
| Ratio of expenses before expense reductions (%) | | | 1.34 | * | | | 1.32 | | | | 1.29 | | | | 1.35 | | | | 1.37 | | | | 1.31 | |
| Ratio of expenses after expense reductions (%) | | | .95 | * | | | 1.00 | | | | .90 | | | | .99 | | | | 1.09 | | | | 1.04 | |
Ratio of net investment
income (%) | | | 1.45 | * | | | 2.33 | | | | 2.53 | | | | 2.36 | | | | 1.75 | | | | 2.76 | |
| Portfolio turnover rate (%) | | | 48 | ** | | | 167 | | | | 183 | | | | 116 | | | | 320 | | | | 336 | |
| a | Based on average shares outstanding during the period. |
| b | Total return does not reflect the effect of any sales charges. |
| c | Total return would have been lower had certain expenses not been reduced. |
| *** | Amount is less than $.005. |
The accompanying notes are an integral part of the financial statements.
| | | | | | | | |
| | DWS ESG Global Bond Fund | | | | | | 25 | |
| | | | | | | | | | | | | | | | | | | | | | | | | | |
| | | Six Months
Ended 4/30/20 | | | Years Ended October 31, | |
| Class C | | (Unaudited) | | | 2019 | | | 2018 | | | 2017 | | | 2016 | | | 2015 | |
| | | | | | |
| Selected Per Share Data | | | | | | | | | | | | | | | | | | | | | | | | |
Net asset value, beginning
of period | | | $9.43 | | | | $8.77 | | | | $9.27 | | | | $9.15 | | | | $8.92 | | | | $9.67 | |
| Income (loss) from investment operations: | | | | | | | | | | | | | | | | | | | | | | | | |
| | | | | | |
Net investment incomea | | | .03 | | | | .15 | | | | .16 | | | | .15 | | | | .09 | | | | .18 | |
Net realized and unrealized
gain (loss) | | | .04 | | | | .66 | | | | (.53 | ) | | | .11 | | | | .24 | | | | (.56 | ) |
Total from investment operations | | | .07 | | | | .81 | | | | (.37 | ) | | | .26 | | | | .33 | | | | (.38 | ) |
| Less distributions from: | | | | | | | | | | | | | | | | | | | | | | | | |
| | | | | | |
Net investment income | | | (.04 | ) | | | (.12 | ) | | | (.13 | ) | | | (.14 | ) | | | (.00 | )*** | | | (.23 | ) |
Net realized gains | | | — | | | | — | | | | — | | | | — | | | | — | | | | (.10 | ) |
Return of capital | | | — | | | | (.03 | ) | | | — | | | | — | | | | (.10 | ) | | | (.04 | ) |
Total distributions | | | (.04 | ) | | | (.15 | ) | | | (.13 | ) | | | (.14 | ) | | | (.10 | ) | | | (.37 | ) |
| Redemption fees | | | — | | | | — | | | | — | | | | .00 | *** | | | .00 | *** | | | .00 | *** |
| Net asset value, end of period | | | $9.46 | | | | $9.43 | | | | $8.77 | | | | $9.27 | | | | $9.15 | | | | $8.92 | |
| Total Return (%)b,c | | | .73 | ** | | | 9.37 | | | | (3.98 | ) | | | 2.83 | | | | 3.78 | | | | (4.13 | ) |
|
| Ratios to Average Net Assets and Supplemental Data | |
| Net assets, end of period ($ millions) | | | .46 | | | | 1 | | | | 1 | | | | 2 | | | | 2 | | | | 2 | |
| Ratio of expenses before expense reductions (%) | | | 2.14 | * | | | 2.12 | | | | 2.08 | | | | 2.12 | | | | 2.15 | | | | 2.07 | |
| Ratio of expenses after expense reductions (%) | | | 1.70 | * | | | 1.75 | | | | 1.65 | | | | 1.74 | | | | 1.84 | | | | 1.79 | |
Ratio of net investment
income (%) | | | .71 | * | | | 1.60 | | | | 1.79 | | | | 1.60 | | | | .96 | | | | 2.01 | |
| Portfolio turnover rate (%) | | | 48 | ** | | | 167 | | | | 183 | | | | 116 | | | | 320 | | | | 336 | |
| a | Based on average shares outstanding during the period. |
| b | Total return does not reflect the effect of any sales charges. |
| c | Total return would have been lower had certain expenses not been reduced. |
| *** | Amount is less than $.005. |
The accompanying notes are an integral part of the financial statements.
| | | | | | |
| 26 | | | | | DWS ESG Global Bond Fund | | |
| | | | | | | | | | | | | | | | | | | | | | | | | | |
| | | Six Months
Ended 4/30/20 | | | Years Ended October 31, | |
| Class S | | (Unaudited) | | | 2019 | | | 2018 | | | 2017 | | | 2016 | | | 2015 | |
| | | | | | |
| Selected Per Share Data | | | | | | | | | | | | | | | | | | | | | | | | |
Net asset value, beginning
of period | | | $9.41 | | | | $8.76 | | | | $9.26 | | | | $9.13 | | | | $8.90 | | | | $9.66 | |
| Income (loss) from investment operations: | | | | | | | | | | | | | | | | | | | | | | | | |
| | | | | | |
Net investment income (loss)a | | | .08 | | | | .23 | | | | .25 | | | | .24 | | | | .18 | | | | .27 | |
Net realized and unrealized
gain (loss) | | | .03 | | | | .67 | | | | (.52 | ) | | | .12 | | | | .24 | | | | (.57 | ) |
Total from investment operations | | | .11 | | | | .90 | | | | (.27 | ) | | | .36 | | | | .42 | | | | (.30 | ) |
| Less distributions from: | | | | | | | | | | | | | | | | | | | | | | | | |
| | | | | | |
Net investment income | | | (.08 | ) | | | (.20 | ) | | | (.23 | ) | | | (.23 | ) | | | (.09 | ) | | | (.32 | ) |
Net realized gains | | | — | | | | — | | | | — | | | | — | | | | — | | | | (.10 | ) |
Return of capital | | | — | | | | (.05 | ) | | | — | | | | — | | | | (.10 | ) | | | (.04 | ) |
Total distributions | | | (.08 | ) | | | (.25 | ) | | | (.23 | ) | | | (.23 | ) | | | (.19 | ) | | | (.46 | ) |
| Redemption fees | | | — | | | | — | | | | — | | | | .00 | *** | | | .00 | *** | | | .00 | *** |
| Net asset value, end of period | | | $9.44 | | | | $9.41 | | | | $8.76 | | | | $9.26 | | | | $9.13 | | | | $8.90 | |
| Total Return (%)b | | | 1.23 | ** | | | 10.36 | | | | (3.02 | ) | | | 3.97 | | | | 4.72 | | | | (3.17 | ) |
|
| Ratios to Average Net Assets and Supplemental Data | |
Net assets, end of period
($ millions) | | | 44 | | | | 47 | | | | 48 | | | | 57 | | | | 58 | | | | 64 | |
| Ratio of expenses before expense reductions (%) | | | 1.05 | * | | | 1.03 | | | | 1.01 | | | | 1.06 | | | | 1.08 | | | | 1.01 | |
| Ratio of expenses after expense reductions (%) | | | .70 | * | | | .75 | | | | .65 | | | | .74 | | | | .84 | | | | .79 | |
| Ratio of net investment income (%) | | | 1.70 | * | | | 2.58 | | | | 2.79 | | | | 2.59 | | | | 1.97 | | | | 3.01 | |
| Portfolio turnover rate (%) | | | 48 | ** | | | 167 | | | | 183 | | | | 116 | | | | 320 | | | | 336 | |
| a | Based on average shares outstanding during the period. |
| b | Total return would have been lower had certain expenses not been reduced. |
| *** | Amount is less than $.005. |
The accompanying notes are an integral part of the financial statements.
| | | | | | | | |
| | DWS ESG Global Bond Fund | | | | | | 27 | |
| | |
| Notes to Financial Statements | | (Unaudited) |
A. Organization and Significant Accounting Policies
DWS ESG Global Bond Fund (the “Fund”) is a diversified series of Deutsche DWS Global/International Fund, Inc. (the “Corporation”), which is registered under the Investment Company Act of 1940, as amended (the “1940 Act”), as an open-end management investment company organized as a Maryland corporation.
The Fund offers multiple classes of shares which provide investors with different purchase options. Class A shares are subject to an initial sales charge. Class C shares are not subject to an initial sales charge but are subject to higher ongoing expenses than Class A shares and a contingent deferred sales charge payable upon certain redemptions within one year of purchase. Class C shares automatically convert to Class A shares in the same fund after 10 years, provided that the fund or the financial intermediary through which the shareholder purchased the Class C shares has records verifying that the Class C shares have been held for at least 10 years. Class S shares are not subject to initial or contingent deferred sales charges and are only available to a limited group of investors.
Investment income, realized and unrealized gains and losses, and certain fund-level expenses and expense reductions, if any, are borne pro rata on the basis of relative net assets by the holders of all classes of shares, except that each class bears certain expenses unique to that class such as services to shareholders, distribution and service fees and certain other class-specific expenses. Differences in class-level expenses may result in payment of different per share dividends by class. All shares of the Fund have equal rights with respect to voting subject to class-specific arrangements.
The Fund’s financial statements are prepared in accordance with accounting principles generally accepted in the United States of America (“U.S. GAAP”) which require the use of management estimates. Actual results could differ from those estimates. The Fund qualifies as an investment company under Topic 946 of Accounting Standards Codification of U.S. GAAP. The policies described below are followed consistently by the Fund in the preparation of its financial statements.
Security Valuation. Investments are stated at value determined as of the close of regular trading on the New York Stock Exchange on each day the exchange is open for trading.
Various inputs are used in determining the value of the Fund’s investments. These inputs are summarized in three broad levels. Level 1 includes other significant observable inputs (including quoted prices for similar securities, interest rates, prepayment speeds and credit risk).
| | | | | | |
| 28 | | | | | DWS ESG Global Bond Fund | | |
Level 3 includes significant unobservable inputs (including the Fund’s own assumptions in determining the fair value of investments). The level assigned to the securities valuations may not be an indication of the risk or liquidity associated with investing in those securities.
Debt securities are valued at prices supplied by independent pricing services approved by the Fund’s Board. Such services may use various pricing techniques which take into account appropriate factors such as yield, quality, coupon rate, maturity, type of issue, trading characteristics, prepayment speeds and other data, as well as broker quotes. If the pricing services are unable to provide valuations, debt securities are valued at the average of the most recent reliable bid quotations or evaluated prices, as applicable, obtained from broker-dealers. These securities are generally categorized as Level 2.
Investments in open-end investment companies are valued at their net asset value each business day and are categorized as Level 1.
ETFs are valued at the most recent sale price or official closing price reported on the exchange (U.S. or foreign) or over-the-counter market on which they trade. ETFs for which no sales are reported are valued at the calculated mean between the most recent bid and asked quotations on the relevant market or, if a mean cannot be determined, at the most recent bid quotation. ETFs are categorized as Level 1 securities.
Futures contracts are generally valued at the settlement prices established each day on the exchange on which they are traded and are categorized as Level 1.
Swap contracts are valued daily based upon prices supplied by a Board approved pricing vendor, if available, and otherwise are valued at the price provided by the broker-dealer. Swap contracts are generally categorized as Level 2.
Forward currency contracts are valued at the prevailing forward exchange rate of the underlying currencies and are categorized as Level 2.
Securities and other assets for which market quotations are not readily available or for which the above valuation procedures are deemed not to reflect fair value are valued in a manner that is intended to reflect their fair value as determined in accordance with procedures approved by the Board and are generally categorized as Level 3. In accordance with the Fund’s valuation procedures, factors considered in determining value may include, but are not limited to, the type of the security; the size of the holding; the initial cost of the security; the existence of any contractual restrictions on the security’s disposition; the price and extent of public trading in similar securities of the issuer or of comparable companies; quotations or evaluated prices from broker-dealers and/or pricing services; information obtained from the issuer, analysts, and/or the appropriate
| | | | | | | | |
| | DWS ESG Global Bond Fund | | | | | | 29 | |
stock exchange (for exchange-traded securities); an analysis of the company’s or issuer’s financial statements; an evaluation of the forces that influence the issuer and the market(s) in which the security is purchased and sold; and with respect to debt securities, the maturity, coupon, creditworthiness, currency denomination and the movement of the market in which the security is normally traded. The value determined under these procedures may differ from published values for the same securities.
Disclosure about the classification of fair value measurements is included in a table following the Fund’s Investment Portfolio.
Securities Lending. Deutsche Bank AG, as lending agent, lends securities of the Fund to certain financial institutions under the terms of its securities lending agreement. During the term of the loans, the Fund continues to receive interest and dividends generated by the securities and to participate in any changes in their market value. The Fund requires the borrowers of the securities to maintain collateral with the Fund consisting of either cash or liquid, unencumbered assets having a value at least equal to the value of the securities loaned. When the collateral falls below specified amounts, the lending agent will use its best effort to obtain additional collateral on the next business day to meet required amounts under the securities lending agreement. As of period end, any securities on loan were collateralized by cash. During the six months ended April 30, 2020, the Fund invested the cash collateral into a joint trading account in DWS Government & Agency Securities Portfolio, an affiliated money market fund managed by DWS Investment Management Americas, Inc. DWS Investment Management Americas, Inc. receives a management/administration fee (0.12% annualized effective rate as of April 30, 2020) on the cash collateral invested in DWS Government & Agency Securities Portfolio. The Fund receives compensation for lending its securities either in the form of fees or by earning interest on invested cash collateral net of borrower rebates and fees paid to a lending agent. Either the Fund or the borrower may terminate the loan at any time, and the borrower, after notice, is required to return borrowed securities within a standard time period. There may be risks of delay and costs in recovery of securities or even loss of rights in the collateral should the borrower of the securities fail financially. If the Fund is not able to recover securities lent, the Fund may sell the collateral and purchase a replacement investment in the market, incurring the risk that the value of the replacement security is greater than the value of the collateral. The Fund is also subject to all investment risks associated with the reinvestment of any cash collateral received, including, but not limited to, interest rate, credit and liquidity risk associated with such investments.
As of April 30, 2020, the Fund had securities on loan, which were classified as bonds in the Investment Portfolio. The value of the related
| | | | | | |
| 30 | | | | | DWS ESG Global Bond Fund | | |
collateral exceeded the value of the securities loaned at period end. As of period end, the remaining contractual maturity of the collateral agreements was overnight and continuous.
Foreign Currency Translations. The books and records of the Fund are maintained in U.S. dollars. Investment securities and other assets and liabilities denominated in a foreign currency are translated into U.S. dollars at the prevailing exchange rates at period end. Purchases and sales of investment securities, income and expenses are translated into U.S. dollars at the prevailing exchange rates on the respective dates of the transactions.
Net realized and unrealized gains and losses on foreign currency transactions represent net gains and losses between trade and settlement dates on securities transactions, the acquisition and disposition of foreign currencies, and the difference between the amount of net investment income accrued and the U.S. dollar amount actually received. The portion of both realized and unrealized gains and losses on investments that results from fluctuations in foreign currency exchange rates is not separately disclosed but is included with net realized and unrealized gain/appreciation and loss/depreciation on investments.
When-Issued/Delayed Delivery Securities. The Fund may purchase or sell securities with delivery or payment to occur at a later date beyond the normal settlement period. At the time the Fund enters into a commitment to purchase or sell a security, the transaction is recorded and the value of the transaction is reflected in the net asset value. The price of such security and the date when the security will be delivered and paid for are fixed at the time the transaction is negotiated. The value of the security may vary with market fluctuations. At the time the Fund enters into a purchase transaction it is required to segregate cash or other liquid assets at least equal to the amount of the commitment. Additionally, the Fund or the counterparty may be required to post securities and/or cash collateral in accordance with the terms of the commitment.
Certain risks may arise upon entering into when-issued or delayed delivery transactions from the potential inability of counterparties to meet the terms of their contracts or if the issuer does not issue the securities due to political, economic, or other factors. Additionally, losses may arise due to changes in the value of the underlying securities.
Taxes. The Fund’s policy is to comply with the requirements of the Internal Revenue Code, as amended, which are applicable to regulated investment companies, and to distribute all of its taxable income to its shareholders.
Additionally, the Fund may be subject to taxes imposed by the governments of countries in which it invests and are generally based on income and/or capital gains earned or repatriated. Estimated tax liabilities on certain foreign securities are recorded on an accrual basis and are reflected as components of interest income or net change in unrealized
| | | | | | | | |
| | DWS ESG Global Bond Fund | | | | | | 31 | |
gain/loss on investments. Tax liabilities realized as a result of security sales are reflected as a component of net realized gain/loss on investments.
At October 31, 2019, the Fund had a net tax basis capital loss carryforward of approximately $3,762,000, which may be applied against realized net taxable capital gains indefinitely, including short-term losses ($1,210,000) and long-term losses ($2,552,000).
At April 30, 2020, the aggregate cost of investments for federal income tax purposes was $58,217,960. The net unrealized appreciation for all investments based on tax cost was $232,930. This consisted of aggregate gross unrealized appreciation for all investments which there was an excess of value over tax cost of $1,593,195 and aggregate gross unrealized depreciation for all investments in which was an excess of tax cost over value of $1,360,265.
The Fund has reviewed the tax positions for the open tax years as of October 31, 2019 and has determined that no provision for income tax and/or uncertain tax provisions is required in the Fund’s financial statements. The Fund’s federal tax returns for the prior three fiscal years remain open subject to examination by the Internal Revenue Service.
Distribution of Income and Gains. Distributions from net investment income of the Fund are declared and distributed to shareholders monthly.
Net realized gains from investment transactions, in excess of available capital loss carryforwards, would be taxable to the Fund if not distributed, and, therefore, will be distributed to shareholders at least annually. The Fund may also make additional distributions for tax purposes if necessary.
The timing and characterization of certain income and capital gain distributions are determined annually in accordance with federal tax regulations which may differ from accounting principles generally accepted in the United States of America. These differences primarily relate to premium amortization on debt securities, investments in foreign denominated investments, forward currency contracts, futures contracts, recognition of certain foreign currency gains (losses) as ordinary income (loss), swap contracts and certain securities sold at a loss. As a result, net investment income (loss) and net realized gain (loss) on investment transactions for a reporting period may differ significantly from distributions during such period. Accordingly, the Fund may periodically make reclassifications among certain of its capital accounts without impacting the net asset value of the Fund.
The tax character of current year distributions will be determined at the end of the current fiscal year.
Expenses. Expenses of the Corporation arising in connection with a specific fund are allocated to that fund. Other Corporation expenses
| | | | | | |
| 32 | | | | | DWS ESG Global Bond Fund | | |
which cannot be directly attributed to a fund are apportioned among the funds in the Corporation based upon the relative net assets or other appropriate measures.
Contingencies. In the normal course of business, the Fund may enter into contracts with service providers that contain general indemnification clauses. The Fund’s maximum exposure under these arrangements is unknown, as this would involve future claims that may be made against the Fund that have not yet been made. However, based on experience, the Fund expects the risk of loss to be remote.
Other. Investment transactions are accounted for on a trade date plus one basis for daily net asset value calculations. However, for financial reporting purposes, investment transactions are reported on trade date. Interest income is recorded on the accrual basis net of foreign withholding taxes. Dividend income is recorded on the ex-dividend date net of foreign withholding taxes. Realized gains and losses from investment transactions are recorded on an identified cost basis. Proceeds from litigation payments, if any, are included in net realized gain (loss) from investments. All premiums and discounts are amortized/accreted for financial reporting purposes, with the exception of securities in default of principal.
B. Derivative Instruments
Swaps. A swap is a contract between two parties to exchange future cash flows at periodic intervals based on the notional amount of the swap. A bilateral swap is a transaction between the Fund and a counterparty where cash flows are exchanged between the two parties. A centrally cleared swap is a transaction executed between the Fund and a counterparty, then cleared by a clearing member through a central clearinghouse. The central clearinghouse serves as the counterparty, with whom the Fund exchanges cash flows.
The value of a swap is adjusted daily, and the change in value, if any, is recorded as unrealized appreciation or depreciation in the Statement of Assets and Liabilities. Gains or losses are realized when the swap expires or is closed. Certain risks may arise when entering into swap transactions including counterparty default; liquidity; or unfavorable changes in interest rates or the value of the underlying reference security, commodity or index. In connection with bilateral swaps, securities and/or cash may be identified as collateral in accordance with the terms of the swap agreement to provide assets of value and recourse in the event of default. The maximum counterparty credit risk is the net present value of the cash flows to be received from or paid to the counterparty over the term of the swap, to the extent that this amount is beneficial to the Fund, in addition to any related collateral posted to the counterparty by the Fund. This risk may be partially reduced by a master netting arrangement between the
| | | | | | | | |
| | DWS ESG Global Bond Fund | | | | | | 33 | |
Fund and the counterparty. Upon entering into a centrally cleared swap, the Fund is required to deposit with a financial intermediary cash or securities (“initial margin”) in an amount equal to a certain percentage of the notional amount of the swap. Subsequent payments (“variation margin”) are made or received by the Fund dependent upon the daily fluctuations in the value of the swap. In a centrally cleared swap transaction, counterparty risk is minimized as the central clearinghouse acts as the counterparty.
An upfront payment, if any, made by the Fund is recorded as an asset in the Statement of Assets and Liabilities. An upfront payment, if any, received by the Fund is recorded as a liability in the Statement of Assets and Liabilities. Payments received or made at the end of the measurement period are recorded as realized gain or loss in the Statement of Operations.
Credit default swaps are agreements between a buyer and a seller of protection against predefined credit events for the reference entity. The Fund may enter into credit default swaps to gain exposure to an underlying issuer’s credit quality characteristics without directly investing in that issuer or to hedge against the risk of a credit event on debt securities. As a seller of a credit default swap, the Fund is required to pay the par (or other agreed-upon) value of the referenced entity to the counterparty with the occurrence of a credit event by a third party, such as a U.S. or foreign corporate issuer, on the reference entity, which would likely result in a loss to the Fund. In return, the Fund receives from the counterparty a periodic stream of payments over the term of the swap provided that no credit event has occurred. If no credit event occurs, the Fund keeps the stream of payments with no payment obligations. The Fund may also buy credit default swaps, in which case the Fund functions as the counterparty referenced above. This involves the risk that the swap may expire worthless. It also involves counterparty risk that the seller may fail to satisfy its payment obligations to the Fund with the occurrence of a credit event. When the Fund sells a credit default swap, it will cover its commitment. This may be achieved by, among other methods, maintaining cash or liquid assets equal to the aggregate notional value of the reference entities for all outstanding credit default swaps sold by the Fund. For the six months ended April 30, 2020, the Fund entered into credit default swap agreements to gain exposure to the underlying issuer’s credit quality characteristics and to hedge the risk of default or other specified credit events on portfolio assets.
Under the terms of a credit default swap, the Fund receives or makes periodic payments based on a specified interest rate on a fixed notional amount. These payments are recorded as a realized gain or loss in the Statement of Operations. Payments received or made as a result of a credit event or termination of the swap are recognized, net of a
| | | | | | |
| 34 | | | | | DWS ESG Global Bond Fund | | |
proportional amount of the upfront payment, as realized gains or losses in the Statement of Operations.
There were no open credit default swap contracts as of April 30, 2020. For the six months ended April 30, 2020, the investment on the credit default swap contracts sold had a total notional value generally indicative of a range from $0 to $1,000,000.
Futures Contracts. A futures contract is an agreement between a buyer or seller and an established futures exchange or its clearinghouse in which the buyer or seller agrees to take or make a delivery of a specific amount of a financial instrument at a specified price on a specific date (settlement date). For the six months ended April 30, 2020, the Fund entered into futures contracts as a hedge against anticipated interest rate changes. The Fund also entered into futures contracts for non-hedging purposes to seek to enhance potential gains.
Upon entering into a futures contract, the Fund is required to deposit with a financial intermediary cash or securities (“initial margin”) in an amount equal to a certain percentage of the face value indicated in the futures contract. Subsequent payments (“variation margin”) are made or received by the Fund dependent upon the daily fluctuations in the value and are recorded for financial reporting purposes as unrealized gains or losses by the Fund. Gains or losses are realized when the contract expires or is closed. Since all futures contracts are exchange traded, counterparty risk is minimized as the exchange’s clearinghouse acts as the counterparty, and guarantees the futures contracts against default.
Certain risks may arise upon entering into futures contracts, including the risk that an illiquid market will limit the Fund’s ability to close out a futures contract prior to the settlement date and the risk that the futures contract is not well correlated with the security, index or currency to which it relates. Risk of loss may exceed amounts disclosed in the Statement of Assets and Liabilities.
A summary of the open futures contracts as of April 30, 2020 is included in a table following the Fund’s Investment Portfolio. For the six months ended April 30, 2020, the investment in futures contracts sold had a total notional value generally indicative of a range from approximately $2,619,000 to 5,733,000.
Forward Foreign Currency Contracts. A forward foreign currency contract (“forward currency contract”) is a commitment to purchase or sell a foreign currency at the settlement date at a negotiated rate. For the six months ended April 30, 2020, the Fund entered into forward currency contracts in order to hedge its exposure to changes in foreign currency exchange rates on its foreign currency denominated portfolio holdings and to facilitate transactions in foreign currency denominated securities and for non-hedging purposes to seek to enhance potential gains.
| | | | | | | | |
| | DWS ESG Global Bond Fund | | | | | | 35 | |
Forward currency contracts are valued at the prevailing forward exchange rate of the underlying currencies and unrealized gain (loss) is recorded daily. On the settlement date of the forward currency contract, the Fund records a realized gain or loss equal to the difference between the value of the contract at the time it was opened and the value of the contract at the time it was closed. Certain risks may arise upon entering into forward currency contracts from the potential inability of counterparties to meet the terms of their contracts. The maximum counterparty credit risk to the Fund is measured by the unrealized gain on appreciated contracts. Additionally, when utilizing forward currency contracts to hedge, the Fund gives up the opportunity to profit from favorable exchange rate movements during the term of the contract.
A summary of the open forward currency contracts as of April 30, 2020 is included in a table following the Fund’s Investment Portfolio. For the six months ended April 30, 2020, the investment in forward currency contracts short vs. U.S. dollars had a total contract value generally indicative of a range from approximately $1,196,000 to $6,815,000, and the investment in forward currency contracts long vs. U.S. dollars had a total contract value generally indicative of a range from approximately $8,873,000 to $11,758,000.
The following tables summarize the value of the Fund’s derivative instruments held as of April 30, 2020 and the related location in the accompanying Statement of Assets and Liabilities, presented by primary underlying risk exposure:
| | | | |
| Asset Derivatives | | Forward
Contracts | |
| Foreign Exchange Contracts (a) | | $ | 272,803 | |
The above derivative is located in the following Statement of Assets and Liabilities accounts:
| (a) | Unrealized appreciation on forward foreign currency contracts |
| | | | | | | | | | | | |
| Liability Derivatives | | Futures
Contracts | | | Forward
Contracts | | | Total | |
| Interest Rate Contracts (b) | | $ | (256,813 | ) | | $ | — | | | $ | (256,813 | ) |
| Foreign Exchange Contracts (c) | | | — | | | | (19,273 | ) | | | (19,273 | ) |
| | | $ | (256,813 | ) | | $ | (19,273 | ) | | $ | (276,086 | ) |
Each of the above derivatives is located in the following Statement of Assets and Liabilities accounts:
| (b) | Includes cumulative depreciation of futures as disclosed in the Investment Portfolio. Unsettled variation margin is disclosed separately within the Statement of Assets and Liabilities. |
| (c) | Unrealized depreciation on forward foreign currency contracts |
| | | | | | |
| 36 | | | | | DWS ESG Global Bond Fund | | |
Additionally, the amount of unrealized and realized gains and losses on derivative instruments recognized in Fund earnings during the six months ended April 30, 2020 and the related location in the accompanying Statement of Operations is summarized in the following tables by primary underlying risk exposure:
| | | | | | | | | | | | | | | | |
| Realized Gain (Loss) | | Futures
Contracts | | | Swap
Contracts | | | Forward
Contracts | | | Total | |
| Interest Rate Contract (d) | | $ | (186,015 | ) | | $ | — | | | $ | — | | | $ | (186,015 | ) |
| Credit Contracts (d) | | | — | | | | 476,354 | | | | — | | | | 476,354 | |
| Foreign Exchange Contracts (d) | | | — | | | | — | | | | (677,682 | ) | | | (677,682 | ) |
| | | $ | (186,015 | ) | | $ | 476,354 | | | $ | (677,682 | ) | | $ | (387,343 | ) |
Each of the above derivatives is located in the following Statement of Operations accounts:
| (d) | Net realized gain (loss) from futures, swaps and forward foreign currency contracts, respectively |
| | | | | | | | | | | | | | | | |
Change in Net Unrealized
Appreciation (Depreciation) | | Futures
Contracts | | | Swap
Contracts | | | Forward
Contracts | | | Total | |
| Interest Rate Contracts (e) | | $ | (238,594 | ) | | $ | — | | | $ | — | | | $ | (238,594 | ) |
| Credit Contracts (e) | | | — | | | | (4,959 | ) | | | — | | | | (4,959 | ) |
| Foreign Exchange Contracts (e) | | | — | | | | — | | | | 512,812 | | | | 512,812 | |
| | | $ | (238,594 | ) | | $ | (4,959 | ) | | $ | 512,812 | | | $ | 269,259 | |
Each of the above derivatives is located in the following Statement of Operations accounts:
| (e) | Change in net unrealized appreciation (depreciation) on futures, swaps and forward foreign currency contracts, respectively |
As of April 30, 2020, the Fund has transactions subject to enforceable master netting agreements which govern the terms of certain transactions, and reduce the counterparty risk associated with such transactions. Master netting agreements allow a Fund to close out and net total exposure to a counterparty in the event of a deterioration in the credit quality or contractual default with respect to all of the transactions with a counterparty. As defined by the master netting agreement, the Fund may have collateral agreements with certain counterparties to mitigate risk. For financial reporting purposes the Statement of Assets and Liabilities generally shows derivatives assets and liabilities on a gross basis, which reflects the full risks and exposures prior to netting. A reconciliation of the gross amounts on the Statement of Assets and
| | | | | | | | |
| | DWS ESG Global Bond Fund | | | | | | 37 | |
Liabilities to the net amounts by counterparty, including any collateral exposure, is included in the following tables:
| | | | | | | | | | | | | | | | |
| Counterparty | | Gross Amounts
of Assets
Presented in the
Statement of
Assets and
Liabilities | | | Financial
Instruments
and Derivatives
Available
for Offset | | | Collateral
Received | | | Net Amount
of Derivative
Assets | |
Bank of America | | $ | 23,463 | | | $ | — | | | $ | — | | | $ | 23,463 | |
| State Street Bank & Trust Co. | | | 240,654 | | | | — | | | | — | | | | 240,654 | |
| Toronto-Dominion Bank | | | 8,686 | | | | (8,686 | ) | | | — | | | | — | |
| | | $ | 272,803 | | | $ | (8,686 | ) | | $ | — | | | $ | 264,117 | |
| | | | |
| Counterparty | | Gross Amounts
of Liabilities
Presented in the
Statement of
Assets and
Liabilities | | | Financial
Instruments
and Derivatives
Available
for Offset | | | Collateral
Pledged | | | Net Amount
of Derivative
Liabilities | |
| Toronto-Dominion Bank | | $ | 19,273 | | | $ | (8,686 | ) | | $ | — | | | $ | 10,587 | |
C. Purchases and Sales of Securities
During the six months ended April 30, 2020, purchases and sales of investment securities, excluding short-term investments, were as follows:
| | | | | | | | |
| | | Purchases | | | Sales | |
| Non-U.S. Treasury Obligations | | $ | 9,779,660 | | | $ | 13,832,345 | |
| U.S. Treasury Obligations | | $ | 15,398,564 | | | $ | 15,191,007 | |
D. Related Parties
Management Agreement. Under the Investment Management Agreement with DWS Investment Management Americas, Inc. (“DIMA” or the “Advisor”), an indirect, wholly owned subsidiary of DWS Group GmbH & Co. KGaA (“DWS Group”), the Advisor directs the investments of the Fund in accordance with its investment objectives, policies and restrictions. The Advisor determines the securities, instruments and other contracts relating to investments to be purchased, sold or entered into by the Fund.
Under the Investment Management Agreement, the Fund pays a monthly management fee equal to an annual rate (exclusive of any applicable waivers/reimbursements) of 0.31% of the Fund’s average daily net assets, computed and accrued daily and payable monthly.
| | | | | | |
| 38 | | | | | DWS ESG Global Bond Fund | | |
For the period from November 1, 2019 through January 31, 2021, the Advisor has contractually agreed to waive its fees and/or reimburse certain operating expenses of the Fund to the extent necessary to maintain the total annual operating expenses (excluding certain expenses such as extraordinary expenses, taxes, brokerage and interest) of each class as follows:
| | | | |
| Class A | | | .95% | |
| Class C | | | 1.70% | |
| Class S | | | .70% | |
For the six months ended April 30, 2020, fees waived and/or expenses reimbursed for each class are as follows:
| | | | |
| Class A | | $ | 19,369 | |
| Class C | | | 1,037 | |
| Class S | | | 76,616 | |
| | | $ | 97,022 | |
Administration Fee. Pursuant to an Administrative Services Agreement, DIMA provides most administrative services to the Fund. Prior to March 1, 2020, for all services provided under the Administrative Services Agreement, the Fund paid the Advisor an annual fee (“Administration Fee”) of 0.10% of the Fund’s average daily net assets, computed and accrued daily and payable monthly. Effective March 1, 2020, for all services provided under the Administrative Services Agreement, the Fund pays the Advisor an annual Administration Fee of 0.097% of the Fund’s average daily net assets, computed and accrued daily and payable monthly. For the six months ended April 30, 2020, the Administration Fee was $27,084, of which $4,309 is unpaid.
Service Provider Fees. DWS Service Company (“DSC”), an affiliate of the Advisor, is the transfer agent, dividend-paying agent and shareholder service agent of the Fund. Pursuant to a sub-transfer agency agreement between DSC and DST Systems, Inc. (“DST”), DSC has delegated certain transfer agent, dividend-paying agent and shareholder service agent functions to DST. DSC compensates DST out of the shareholder servicing fee it receives from the Fund. For the six months ended April 30, 2020, the amounts charged to the Fund by DSC were as follows:
| | | | | | | | |
| Services to Shareholders | | Total
Aggregated | | | Unpaid at
April 30, 2020 | |
| Class A | | $ | 4,715 | | | $ | 1,698 | |
| Class C | | | 270 | | | | 110 | |
| Class S | | | 19,855 | | | | 7,030 | |
| | | $ | 24,840 | | | $ | 8,838 | |
| | | | | | | | |
| | DWS ESG Global Bond Fund | | | | | | 39 | |
In addition, for the six months ended April 30, 2020, the amounts charged to the Fund for recordkeeping and other administrative services provided by unaffiliated third parties, included in the Statement of Operations under “Services to Shareholders,” were as follows:
| | | | |
| Sub-Recordkeeping | | Total
Aggregated | |
| Class A | | $ | 4,672 | |
| Class C | | | 297 | |
| Class S | | | 12,181 | |
| | | $ | 17,150 | |
Distribution and Service Fees. Under the Fund’s Class C 12b-1 Plan, DWS Distributors, Inc., (“DDI”), an affiliate of the Advisor, receives a fee (“Distribution Fee”) of 0.75% of average daily net assets of Class C shares. In accordance with the Fund’s Underwriting and Distribution Services Agreement, DDI enters into related selling group agreements with various firms at various rates for sales of Class C shares. For the six months ended April 30, 2020, the Distribution Fee was as follows:
| | | | | | | | |
| Distribution Fee | | Total
Aggregated | | | Unpaid at
April 30, 2020 | |
| Class C | | $ | 1,751 | | | $ | 277 | |
In addition, DDI provides information and administrative services for a fee (“Service Fee”) to Class A and C shareholders at an annual rate of up to 0.25% of average daily net assets for each such class. DDI in turn has various agreements with financial services firms that provide these services and pays these fees based upon the assets of shareholder accounts the firms service. For the six months ended April 30, 2020, the Service Fee was as follows:
| | | | | | | | | | | | |
| Service Fee | | Total
Aggregated | | | Unpaid at
April 30, 2020 | | | Annualized Rate | |
| Class A | | $ | 12,414 | | | $ | 6,171 | | | | .25 | % |
| Class C | | | 582 | | | | 283 | | | | .25 | % |
| | | $ | 12,996 | | | $ | 6,454 | | | | | |
Underwriting Agreement and Contingent Deferred Sales Charge. DDI is the principal underwriter for the Fund. Underwriting commissions paid in connection with the distribution of Class A shares for the six months ended April 30, 2020, aggregated $2,360.
In addition, DDI receives any contingent deferred sales charge (“CDSC”) from Class C share redemptions occurring within one year of purchase. There is no such charge upon redemption of any share appreciation or reinvested dividends. The CDSC is 1% of the value of the shares
| | | | | | |
| 40 | | | | | DWS ESG Global Bond Fund | | |
redeemed for Class C. A deferred sales charge of up to 0.85% is assessed on certain redemptions of Class A shares.
Typesetting and Filing Service Fees. Under an agreement with the Fund, DIMA is compensated for providing certain pre-press and regulatory services to the Fund. For the six months ended April 30, 2020, the amount charged to the Fund by DIMA included in the Statement of Operations under “Reports to shareholders” aggregated $10,313, of which $7,609 is unpaid.
Directors’ Fees and Expenses. The Fund paid retainer fees to each Director not affiliated with the Advisor, plus specified amounts to the Board Chairperson and to each committee Chairperson.
Affiliated Cash Management Vehicles. The Fund may invest uninvested cash balances in DWS Central Cash Management Government Fund and DWS ESG Liquidity Fund, affiliated money market funds which are managed by the Advisor. Each affiliated money market fund is managed in accordance with Rule 2a-7 under the Investment Company Act of 1940, which governs the quality, maturity, diversity and liquidity of instruments in which a money market fund may invest. DWS Central Cash Management Government Fund seeks to maintain a stable net asset value, and DWS ESG Liquidity Fund maintains a floating net asset value. The Fund indirectly bears its proportionate share of the expenses of each affiliated money market fund in which it invests. DWS Central Cash Management Government Fund does not pay the Advisor an investment management fee. To the extent that DWS ESG Liquidity Fund pays an investment management fee to the Advisor, the Advisor will waive an amount of the investment management fee payable to the Advisor by the Fund equal to the amount of the investment management fee payable on the Fund’s assets invested in DWS ESG Liquidity Fund.
Security Lending Fees. Deutsche Bank AG serves as lending agent for the Fund. For the six months ended April 30, 2020, the Fund incurred lending agent fees to Deutsche Bank AG for the amount of $242.
E. Investing in Emerging Markets
Investing in emerging markets may involve special risks and considerations not typically associated with investing in developed markets. These risks include revaluation of currencies, high rates of inflation or deflation, repatriation restrictions on income and capital, and future adverse political, social and economic developments. Moreover, securities issued in these markets may be less liquid, subject to government ownership controls or delayed settlements, and may have prices that are more volatile or less easily assessed than those of comparable securities of issuers in developed markets.
| | | | | | | | |
| | DWS ESG Global Bond Fund | | | | | | 41 | |
F. Line of Credit
The Fund and other affiliated funds (the “Participants”) share in a $350 million revolving credit facility provided by a syndication of banks. The Fund may borrow for temporary or emergency purposes, including the meeting of redemption requests that otherwise might require the untimely disposition of securities. The Participants are charged an annual commitment fee, which is allocated based on net assets, among each of the Participants. Interest is calculated at a rate per annum equal to the sum of the Federal Funds Rate plus 1.25 percent plus if the one-month LIBOR exceeds the Federal Funds Rate, the amount of such excess. The Fund may borrow up to a maximum of 33 percent of its net assets under the agreement. The Fund had no outstanding loans at April 30, 2020.
G. Fund Share Transactions
The following table summarizes share and dollar activity in the Fund:
| | | | | | | | | | | | | | | | |
| | | Six Months Ended April 30, 2020 | | | Year Ended
October 31, 2019 | |
| | | Shares | | | Dollars | | | Shares | | | Dollars | |
| | | | |
| Shares sold | | | | | | | | | | | | | | | | |
| Class A | | | 133,702 | | | $ | 1,257,040 | | | | 25,442 | | | $ | 230,445 | |
| Class C | | | 1,011 | | | | 9,313 | | | | 1,249 | | | | 11,478 | |
| Class S | | | 218,344 | | | | 2,063,284 | | | | 97,677 | | | | 898,782 | |
| | | | | | | $ | 3,329,637 | | | | | | | $ | 1,140,705 | |
|
| Shares issued to shareholders in reinvestment of distributions | |
| Class A | | | 7,975 | | | $ | 74,402 | | | | 26,835 | | | $ | 243,730 | |
| Class C | | | 146 | | | | 1,368 | | | | 919 | | | | 8,318 | |
| Class S | | | 38,525 | | | | 358,475 | | | | 126,710 | | | | 1,148,622 | |
| | | | | | | $ | 434,245 | | | | | | | $ | 1,400,670 | |
|
| Shares redeemed | |
| Class A | | | (97,911 | ) | | $ | (920,330 | ) | | | (145,048 | ) | | $ | (1,322,071 | ) |
| Class C | | | (9,807 | ) | | | (91,756 | ) | | | (31,688 | ) | | | (284,836 | ) |
| Class S | | | (506,841 | ) | | | (4,742,045 | ) | | | (787,881 | ) | | | (7,137,169 | ) |
| | | | | | | $ | (5,754,131 | ) | | | | | | $ | (8,744,076 | ) |
|
| Net increase (decrease) | |
| Class A | | | 43,766 | | | $ | 411,112 | | | | (92,771 | ) | | $ | (847,896 | ) |
| Class C | | | (8,650 | ) | | | (81,075 | ) | | | (29,520 | ) | | | (265,040 | ) |
| Class S | | | (249,972 | ) | | | (2,320,286 | ) | | | (563,494 | ) | | | (5,089,765 | ) |
| | | | | | | $ | (1,990,249 | ) | | | | | | $ | (6,202,701 | ) |
| | | | | | |
| 42 | | | | | DWS ESG Global Bond Fund | | |
H. Note Concerning December 2019 Distribution
The Fund previously estimated that 100% of the dividend payable on December 10, 2019 was comprised entirely of net investment income. Pursuant to Rule 19a-1(e) of the Investment Company Act of 1940, the Fund has updated its estimated sources to include approximately 1% as derived from return of capital. Such source designation and amount do not reflect the tax character of the distribution; they are estimates only and are not being provided for tax purposes. The final determination of the sources and tax characteristics of all distributions will be made after the end of the Fund’s fiscal year. Shareholders will receive a Form 1099-DIV for the calendar year, which will describe how to report distributions for tax purposes.
I. Other
A novel strain of coronavirus (COVID-19) outbreak was declared a pandemic by the World Health Organization on March 11, 2020. The situation is evolving with various cities and countries around the world responding in different ways to address the pandemic. There are direct and indirect economic effects developing for various industries and individual companies throughout the world. The recent pandemic spread of the novel coronavirus and related geopolitical events could lead to increased financial market volatility, disruption to U.S. and world economies and markets and may have significant adverse effects on the Fund and its investments. A prolonged disruption may result in the Fund and its service providers experiencing operational difficulties in implementing their business continuity plans. Management will continue to monitor the impact COVID-19 has on the Fund and reflect the consequences as appropriate in the Fund’s accounting and financial reporting.
J. Subsequent Event
On June 17, 2020, Deutsche Bank AG (“DB”), an affiliate of DWS Group, resolved with the Commodity Futures Trading Commission (“CFTC”) charges stemming from alleged violations of various swap data reporting requirements and corresponding supervision and other failures. The matter, which was resolved by the issuance of a federal court order (“Consent Order”), involved unintentional conduct that resulted from a system outage that prevented DB from reporting data in accordance with applicable CFTC requirements for a period of five days in April 2016.
The matter giving rise to the Consent Order did not arise out of any investment advisory, fund management activities or distribution activities of DIMA, DWS Distributors, Inc. or their advisory affiliates (the “DWS Service Providers”). DWS Group, of which the DWS Service Providers are
| | | | | | | | |
| | DWS ESG Global Bond Fund | | | | | | 43 | |
wholly-owned subsidiaries, is a separate publicly traded company but continues to be an affiliate of DB due to, among other things, DB’s 79.49% ownership interest in DWS Group. Under the provisions of the Investment Company Act of 1940, as a result of the Consent Order, the DWS Service Providers would not be eligible to continue to provide investment advisory and underwriting services to the Fund absent an order from the Securities and Exchange Commission (the “SEC”). DB and the DWS Service Providers are seeking temporary and permanent orders from the SEC to permit the DWS Service Providers to continue to provide investment advisory and underwriting services to the Fund and other registered investment companies notwithstanding the Consent Order. While there can be no assurance that the requested exemptive orders will be granted, the SEC has granted this type of relief in the past. Consistent with their fiduciary and other relationships with the Fund, and in accordance with the desire of the Board of the Fund, the DWS Service Providers continue to provide investment advisory and distribution services to the Fund. Subject to the receipt of the temporary and permanent exemptive orders, the DWS Service Providers have informed the Fund that they do not believe the Consent Order will have any material impact on the Fund or the ability of the Service Providers to provide services for the Fund.
| | | | | | |
| 44 | | | | | DWS ESG Global Bond Fund | | |
Information About Your Fund’s Expenses
As an investor of the Fund, you incur two types of costs: ongoing expenses and transaction costs. Ongoing expenses include management fees, distribution and service (12b-1) fees and other Fund expenses. Examples of transaction costs include sales charges (loads) and account maintenance fees, which are not shown in this section. The following tables are intended to help you understand your ongoing expenses (in dollars) of investing in the Fund and to help you compare these expenses with the ongoing expenses of investing in other mutual funds. In the most recent six-month period, the Fund limited these expenses; had it not done so, expenses would have been higher. The example in the table is based on an investment of $1,000 invested at the beginning of the six-month period and held for the entire period (November 1, 2019 to April 30, 2020).
The tables illustrate your Fund’s expenses in two ways:
| – | Actual Fund Return. This helps you estimate the actual dollar amount of ongoing expenses (but not transaction costs) paid on a $1,000 investment in the Fund using the Fund’s actual return during the period. To estimate the expenses you paid over the period, simply divide your account value by $1,000 (for example, an $8,600 account value divided by $1,000 = 8.6), then multiply the result by the number in the “Expenses Paid per $1,000” line under the share class you hold. |
| – | Hypothetical 5% Fund Return. This helps you to compare your Fund’s ongoing expenses (but not transaction costs) with those of other mutual funds using the Fund’s actual expense ratio and a hypothetical rate of return of 5% per year before expenses. Examples using a 5% hypothetical fund return may be found in the shareholder reports of other mutual funds. The hypothetical account values and expenses may not be used to estimate the actual ending account balance or expenses you paid for the period. |
Please note that the expenses shown in these tables are meant to highlight your ongoing expenses only and do not reflect any transaction costs. The “Expenses Paid per $1,000” line of the tables is useful in comparing ongoing expenses only and will not help you determine the relative total expense of owning different funds. Subject to certain exceptions, an account maintenance fee of $20.00 assessed once per calendar year for Classes A, C and S shares may apply for accounts with balances less than $10,000. This fee is not included in these tables. If it was, the estimate of expenses paid for Classes A, C and S shares during the period would be higher, and account value during the period would be lower, by this amount.
| | | | | | | | |
| | DWS ESG Global Bond Fund | | | | | | 45 | |
| | | | | | | | | | | | |
Expenses and Value of a $1,000 Investment
for the six months ended April 30, 2020 (Unaudited) | |
| | | |
| Actual Fund Return | | Class A | | | Class C | | | Class S | |
| Beginning Account Value 11/1/19 | | $ | 1,000.00 | | | $ | 1,000.00 | | | $ | 1,000.00 | |
| Ending Account Value 4/30/20 | | $ | 1,011.00 | | | $ | 1,007.30 | | | $ | 1,012.30 | |
| Expenses Paid per $1,000* | | $ | 4.75 | | | $ | 8.48 | | | $ | 3.50 | |
| | | |
| Hypothetical 5% Fund Return | | Class A | | | Class C | | | Class S | |
| Beginning Account Value 11/1/19 | | $ | 1,000.00 | | | $ | 1,000.00 | | | $ | 1,000.00 | |
| Ending Account Value 4/30/20 | | $ | 1,020.14 | | | $ | 1,016.41 | | | $ | 1,021.38 | |
| Expenses Paid per $1,000* | | $ | 4.77 | | | $ | 8.52 | | | $ | 3.52 | |
| * | Expenses are equal to the Fund’s annualized expense ratio for each share class, multiplied by the average account value over the period, multiplied by 182 (the number of days in the most recent six-month period), then divided by 366. |
| | | | | | | | | | | | |
| Annualized Expense Ratios | | Class A | | | Class C | | | Class S | |
| DWS ESG Global Bond Fund | | | .95 | % | | | 1.70 | % | | | .70 | % |
For more information, please refer to the Fund’s prospectus.
For an analysis of the fees associated with an investment in the Fund or similar funds, please refer to tools.finra.org/fund_analyzer/.
| | | | | | |
| 46 | | | | | DWS ESG Global Bond Fund | | |
Liquidity Risk Management
In accordance with Rule 22e-4 (the “Liquidity Rule”) under the Investment Company Act of 1940 (the “1940 Act”), your Fund has adopted a liquidity risk management program (the “Program”), and the Board has designated DWS Investment Management Americas, Inc. (“DIMA”) as Program administrator. The Program is designed to assess and manage your Fund’s liquidity risk (the risk that the Fund would be unable to meet requests to redeem shares of the Fund without significant dilution of remaining investors’ interests in the Fund). DIMA has designated a committee (the “Committee”) composed of personnel from multiple departments within DIMA and its affiliates that is responsible for the implementation and ongoing administration of the Program, which includes assessing the Fund’s liquidity risk under both normal and reasonably foreseeable stressed conditions. Under the Program, every investment held by a fund is classified on a daily basis into one of four liquidity categories based on estimations of the investment’s ability to be sold during designated timeframes in current market conditions without significantly changing the investment’s market value.
In February 2020, as required by the Program and the Liquidity Rule, DIMA provided the Board with an annual written report (the “Report”) addressing the operation of the Program and assessing the adequacy and effectiveness of its implementation during the period from December 1, 2018 through November 30, 2019 (the “Reporting Period”). During the Reporting Period, your Fund was primarily invested in highly liquid investments (investments that the Fund anticipates can be converted to cash within 3 business days or less in current market conditions without significantly changing their market value). As a result, your Fund is not required to adopt, and has not adopted, a “Highly Liquid Investment Minimum” as defined in the Liquidity Rule. During the Reporting Period, the Fund did not approach the 15% limit imposed by the Liquidity Rule on holdings in illiquid investments (investments that cannot be sold or disposed of in seven days or less in current market conditions without the sale of the investment significantly changing the market value of the investment). Your Fund did not experience any issues meeting investor redemptions at any time during the Reporting Period. In the Report, DIMA stated that it believes the Program has operated adequately and effectively to manage the Fund’s liquidity risk during the Reporting Period. DIMA also reported on a material change made to the Program in May 2019 to address Securities and Exchange Commission guidance relating to extended foreign market holidays.
| | | | | | | | |
| | DWS ESG Global Bond Fund | | | | | | 47 | |
Advisory Agreement Board Considerations and Fee Evaluation
The Board of Directors (hereinafter referred to as the “Board” or “Directors”) approved the renewal of DWS ESG Global Bond Fund’s (the “Fund”) investment management agreement (the “Agreement”) with DWS Investment Management Americas, Inc. (“DIMA”) in September 2019.
In terms of the process that the Board followed prior to approving the Agreement, shareholders should know that:
| – | During the entire process, all of the Fund’s Directors were independent of DIMA and its affiliates (the “Independent Directors”). |
| – | The Board met frequently during the past year to discuss fund matters and dedicated a substantial amount of time to contract review matters. Over the course of several months, the Board’s Contract Committee reviewed extensive materials received from DIMA, independent third parties and independent counsel. These materials included an analysis of the Fund’s performance, fees and expenses, and profitability from a fee consultant retained by the Fund’s Independent Directors (the “Fee Consultant”). Based on its evaluation of the information provided, the Contract Committee presented its findings and recommendations to the Board. The Board then reviewed the Contract Committee’s findings and recommendations. |
| – | The Board also received extensive information throughout the year regarding performance of the Fund. |
| – | The Independent Directors regularly met privately with counsel to discuss contract review and other matters. In addition, the Independent Directors were advised by the Fee Consultant in the course of their review of the Fund’s contractual arrangements and considered a comprehensive report prepared by the Fee Consultant in connection with their deliberations. |
| – | In connection with reviewing the Agreement, the Board also reviewed the terms of the Fund’s Rule 12b-1 plan, distribution agreement, administrative services agreement, transfer agency agreement and other material service agreements. |
In connection with the contract review process, the Contract Committee and the Board considered the factors discussed below, among others. The Board also considered that DIMA and its predecessors have managed the Fund since its inception, and the Board believes that a long-term relationship with a capable, conscientious advisor is in the best interests of the Fund. The Board considered, generally, that shareholders chose to
| | | | | | |
| 48 | | | | | DWS ESG Global Bond Fund | | |
invest or remain invested in the Fund knowing that DIMA managed the Fund. DIMA is part of DWS Group GmbH & Co. KGaA (“DWS Group”). DWS Group is a global asset management business that offers a wide range of investing expertise and resources, including research capabilities in many countries throughout the world. In 2018, approximately 20% of DWS Group’s shares were sold in an initial public offering, with Deutsche Bank AG owning the remaining shares.
As part of the contract review process, the Board carefully considered the fees and expenses of each DWS fund overseen by the Board in light of the fund’s performance. In many cases, this led to the negotiation and implementation of expense caps. As part of these negotiations, the Board indicated that it would consider relaxing these caps in future years following sustained improvements in performance, among other considerations.
While shareholders may focus primarily on fund performance and fees, the Fund’s Board considers these and many other factors, including the quality and integrity of DIMA’s personnel and administrative support services provided by DIMA, such as back-office operations, fund valuations, and compliance policies and procedures.
Nature, Quality and Extent of Services. The Board considered the terms of the Agreement, including the scope of advisory services provided under the Agreement. The Board noted that, under the Agreement, DIMA provides portfolio management services to the Fund and that, pursuant to a separate administrative services agreement, DIMA provides administrative services to the Fund. The Board considered the experience and skills of senior management and investment personnel and the resources made available to such personnel. The Board reviewed the Fund’s performance over short-term and long-term periods and compared those returns to various agreed-upon performance measures, including market index(es) and a peer universe compiled using information supplied by Morningstar Direct (“Morningstar”), an independent fund data service. The Board also noted that it has put into place a process of identifying “Funds in Review” (e.g., funds performing poorly relative to a peer universe), and receives additional reporting from DIMA regarding such funds and, where appropriate, DIMA’s plans to address underperformance. The Board believes this process is an effective manner of identifying and addressing underperforming funds. Based on the information provided, the Board noted that, for the one-, three- and five-year periods ended December 31, 2018, the Fund’s performance (Class A shares) was in the 3rd quartile, 4th quartile and 3rd quartile, respectively, of the applicable Morningstar universe (the 1st quartile being the best performers and the 4th quartile being the worst performers). The Board also observed that the Fund has underperformed its benchmark in the one-, three- and five-year periods ended December 31, 2018. The
| | | | | | | | |
| | DWS ESG Global Bond Fund | | | | | | 49 | |
Board noted the disappointing investment performance of the Fund in recent periods and continued to discuss with senior management of DIMA the factors contributing to such underperformance and actions being taken to improve performance. The Board noted changes that incorporated certain Environmental, Social and Corporate Governance (“ESG”) factors and considerations into the Fund’s investment strategy, and related changes to the Fund’s name, effective May 1, 2019. The Board noted further that changes were made to the Fund’s portfolio management team in 2019. The Board observed that the Fund had experienced improved relative performance during the first eight months of 2019. The Board recognized the efforts by DIMA in recent years to enhance its investment platform and improve long-term performance across the DWS fund complex.
Fees and Expenses. The Board considered the Fund’s investment management fee schedule, operating expenses and total expense ratios, and comparative information provided by Broadridge Financial Solutions, Inc. (“Broadridge”) and the Fee Consultant regarding investment management fee rates paid to other investment advisors by similar funds (1st quartile being the most favorable and 4th quartile being the least favorable). With respect to management fees paid to other investment advisors by similar funds, the Board noted that the contractual fee rates paid by the Fund, which include a 0.10% fee paid to DIMA under the Fund’s administrative services agreement, were lower than the median (1st quartile) of the applicable Broadridge peer group (based on Broadridge data provided as of December 31, 2018). The Board considered that, effective July 1, 2017, the Fund adopted a revised management fee schedule reducing DIMA’s management fee under the Agreement by 0.10%. The Board noted that the Fund’s Class A shares total (net) operating expenses (excluding 12b-1 fees) were expected to be lower than the median (2nd quartile) of the applicable Broadridge expense universe (based on Broadridge data provided as of December 31, 2018, and analyzing Broadridge expense universe Class A (net) expenses less any applicable 12b-1 fees) (“Broadridge Universe Expenses”). The Board also reviewed data comparing each other operational share class’s total (net) operating expenses to the applicable Broadridge Universe Expenses. The Board noted that the expense limitations agreed to by DIMA were expected to help the Fund’s total (net) operating expenses remain competitive. The Board considered the Fund’s management fee rate as compared to fees charged by DIMA to comparable DWS U.S. registered funds (“DWS Funds”), noting that DIMA indicated that it does not provide services to any other comparable DWS Funds. The information requested by the Board as part of its review of fees and expenses also included information about institutional accounts (including any sub-advised funds and accounts) and funds offered primarily to European investors (“DWS Europe Funds”) managed by DWS Group. The Board noted that DIMA
| | | | | | |
| 50 | | | | | DWS ESG Global Bond Fund | | |
indicated that DWS Group manages DWS Europe Funds comparable to the Fund, but does not manage any comparable institutional accounts. The Board took note of the differences in services provided to DWS Funds as compared to DWS Europe Funds and that such differences made comparison difficult.
On the basis of the information provided, the Board concluded that management fees were reasonable and appropriate in light of the nature, quality and extent of services provided by DIMA.
Profitability. The Board reviewed detailed information regarding revenues received by DIMA under the Agreement. The Board considered the estimated costs to DIMA, and pre-tax profits realized by DIMA, from advising the DWS Funds, as well as estimates of the pre-tax profits attributable to managing the Fund in particular. The Board also received information regarding the estimated enterprise-wide profitability of DIMA and its affiliates with respect to all fund services in totality and by fund. The Board and the Fee Consultant reviewed DIMA’s methodology in allocating its costs to the management of the Fund. Based on the information provided, the Board concluded that the pre-tax profits realized by DIMA in connection with the management of the Fund were not unreasonable. The Board also reviewed certain publicly available information regarding the profitability of certain similar investment management firms. The Board noted that, while information regarding the profitability of such firms is limited (and in some cases is not necessarily prepared on a comparable basis), DIMA and its affiliates’ overall profitability with respect to the DWS Funds (after taking into account distribution and other services provided to the funds by DIMA and its affiliates) was lower than the overall profitability levels of most comparable firms for which such data was available.
Economies of Scale. The Board considered whether there are economies of scale with respect to the management of the Fund and whether the Fund benefits from any economies of scale. In this regard, the Board observed that while the Fund’s current investment management fee schedule does not include breakpoints, the Fund’s fee schedule represents an appropriate sharing between the Fund and DIMA of such economies of scale as may exist in the management of the Fund at current asset levels.
Other Benefits to DIMA and Its Affiliates. The Board also considered the character and amount of other incidental or “fall-out” benefits received by DIMA and its affiliates, including any fees received by DIMA for administrative services provided to the Fund, any fees received by an affiliate of DIMA for transfer agency services provided to the Fund and any fees received by an affiliate of DIMA for distribution services. The Board also considered benefits to DIMA related to brokerage and soft-dollar
| | | | | | | | |
| | DWS ESG Global Bond Fund | | | | | | 51 | |
allocations, including allocating brokerage to pay for research generated by parties other than the executing broker dealers, which pertain primarily to funds investing in equity securities. In addition, the Board considered the incidental public relations benefits to DIMA related to DWS Funds advertising and cross-selling opportunities among DIMA products and services. The Board considered these benefits in reaching its conclusion that the Fund’s management fees were reasonable.
Compliance. The Board considered the significant attention and resources dedicated by DIMA to its compliance processes in recent years. The Board noted in particular (i) the experience, seniority and time commitment of the individuals serving as DIMA’s and the Fund’s chief compliance officers and (ii) the substantial commitment of resources by DIMA and its affiliates to compliance matters, including the retention of compliance personnel.
Based on all of the information considered and the conclusions reached, the Board determined that the continuation of the Agreement is in the best interests of the Fund. In making this determination, the Board did not give particular weight to any single factor identified above. The Board considered these factors over the course of numerous meetings, certain of which were in executive session with only the Independent Directors and counsel present. It is possible that individual Independent Directors may have weighed these factors differently in reaching their individual decisions to approve the continuation of the Agreement.
| | | | | | |
| 52 | | | | | DWS ESG Global Bond Fund | | |
Account Management Resources
| | |
| For More Information | | The automated telephone system allows you to access personalized account information and obtain information on other DWS funds using either your voice or your telephone keypad. Certain account types within Classes A, C and S also have the ability to purchase, exchange or redeem shares using this system. For more information, contact your financial representative. You may also access our automated telephone system or speak with a Shareholder Service representative by calling: (800) 728-3337 |
| Web Site | | dws.com View your account transactions and balances, trade shares, monitor your asset allocation, subscribe to fund and account updates by e-mail, and change your address, 24 hours a day. Obtain prospectuses and applications, news about DWS funds, insight from DWS economists and investment specialists and access to DWS fund account information. |
| Written Correspondence | | DWS PO Box 219151 Kansas City, MO 64121-9151 |
| Proxy Voting | | The Fund’s policies and procedures for voting proxies for portfolio securities and information about how the Fund voted proxies related to its portfolio securities during the most recent 12-month period ended June 30 are available on our Web site — dws.com/en-us/resources/proxy-voting — or on the SEC’s Web site — sec.gov. To obtain a written copy of the Fund’s policies and procedures without charge, upon request, call us toll free at (800) 728-3337. |
| Portfolio Holdings | | Following the Fund’s fiscal first and third quarter-end, a complete portfolio holdings listing is filed with the SEC on Form N-PORT. The Fund’s Form N-PORT will be available on the SEC’s Web site at sec.gov. The Fund’s portfolio holdings are also posted on dws.com from time to time. Please see the Fund’s current prospectus for more information. |
| Principal Underwriter | | If you have questions, comments or complaints, contact: DWS Distributors, Inc. 222 South Riverside Plaza Chicago, IL 60606-5808 (800) 621-1148 |
| | | | | | | | |
| | DWS ESG Global Bond Fund | | | | | | 53 | |
| | | | | | |
| Investment Management | | DWS Investment Management Americas, Inc. (“DIMA” or the “Advisor”), which is part of the DWS Group GmbH & Co. KGaA (“DWS Group”), is the investment advisor for the Fund. DIMA and its predecessors have more than 90 years of experience managing mutual funds and DIMA provides a full range of investment advisory services to both institutional and retail clients. DIMA is an indirect, wholly owned subsidiary of DWS Group. DWS Group is a global organization that offers a wide range of investing expertise and resources, including hundreds of portfolio managers and analysts and an office network that reaches the world’s major investment centers. This well-resourced global investment platform brings together a wide variety of experience and investment insight across industries, regions, asset classes and investing styles. |
| | | |
| | | Class A | | Class C | | Class S |
| Nasdaq Symbol | | SZGAX | | SZGCX | | SSTGX |
| CUSIP Number | | 25156A 734 | | 25156A 759 | | 25156A 767 |
| Fund Number | | 461 | | 761 | | 2061 |
| | | | | | |
| 54 | | | | | DWS ESG Global Bond Fund | | |
Privacy Statement
| | |
| FACTS | | What Does DWS Do With Your Personal Information? |
| |
| Why? | | Financial companies choose how they share your personal information. Federal law gives consumers the right to limit some but not all sharing. Federal law also requires us to tell you how we collect, share and protect your personal information. Please read this notice carefully to understand what we do. |
| |
| What? | | The types of personal information we collect and share can include: – Social Security number – Account balances – Purchase and transaction history – Bank account information – Contact information such as mailing address, e-mail address and telephone number |
| |
| How? | | All financial companies need to share customers’ personal information to run their everyday business. In the section below, we list the reasons financial companies can share their customers’ personal information, the reasons DWS chooses to share and whether you can limit this sharing. |
| | | | |
Reasons we can share your personal
information | | Does DWS share? | | Can you limit
this sharing? |
| | |
For our everyday business purposes —
such as to process your transactions, maintain your account(s), respond to court orders or legal investigations | | Yes | | No |
| | |
| For our marketing purposes — to offer our products and services to you | | Yes | | No |
| | |
| For joint marketing with other financial companies | | No | | We do not share |
| | |
| For our affiliates’ everyday business purposes — information about your transactions and experiences | | No | | We do not share |
| | |
| For our affiliates’ everyday business purposes — information about your creditworthiness | | No | | We do not share |
| | |
| For non-affiliates to market to you | | No | | We do not share |
| | |
| Questions? | | Call (800) 728-3337 or e-mail us at service@dws.com |
| | | | | | | | |
| | DWS ESG Global Bond Fund | | | | | | 55 | |
| | |
|
| |
| Who we are | | |
| |
| Who is providing this notice? | | DWS Distributors, Inc; DWS Investment Management Americas, Inc.; DWS Trust Company; the DWS Funds |
| |
| What we do | | |
| |
| How does DWS protect my personal information? | | To protect your personal information from unauthorized access and use, we use security measures that comply with federal law. These measures include computer safeguards, secured files, and secured buildings. |
| |
| How does DWS collect my personal information? | | We collect your personal information, for example, when you: – open an account – give us your contact information – provide bank account information for ACH or wire transactions – tell us where to send money – seek advice about your investments |
| |
| Why can’t I limit all sharing? | | Federal law gives you the right to limit only – sharing for affiliates’ everyday business purposes – information about your creditworthiness – affiliates from using your information to market to you – sharing for non-affiliates to market to you State laws and individual companies may give you additional rights to limit sharing. |
| |
| Definitions | | |
| |
| Affiliates | | Companies related by common ownership or control. They can be financial or non-financial companies. Our affiliates include financial companies with the DWS or Deutsche Bank (“DB”) name, such as DB AG Frankfurt. |
| |
| Non-affiliates | | Companies not related by common ownership or control. They can be financial and non-financial companies. Non-affiliates we share with include account service providers, service quality monitoring services, mailing service providers and verification services to help in the fight against money laundering and fraud. |
| |
| Joint marketing | | A formal agreement between non-affiliated financial companies that together market financial products or services to you. DWS does not jointly market. |
California residents may go to https://fundsus.dws.com/us/en-us/legal-resources/privacy-policy.html to obtain additional information relating to their rights under California state law.
Rev. 12/2019
| | | | | | |
| 56 | | | | | DWS ESG Global Bond Fund | | |
DEGBF-3
(R-027569-9 6/20)
| | |
| ITEM 2. | CODE OF ETHICS |
| | |
| | Not applicable. |
| | |
| ITEM 3. | AUDIT COMMITTEE FINANCIAL EXPERT |
| | |
| | Not applicable |
| | |
| ITEM 4. | PRINCIPAL ACCOUNTANT FEES AND SERVICES |
| | |
| | Not applicable |
| | |
| ITEM 5. | AUDIT COMMITTEE OF LISTED REGISTRANTS |
| | |
| | Not applicable |
| | |
| ITEM 6. | SCHEDULE OF INVESTMENTS |
| | |
| | Not applicable |
| | |
| ITEM 7. | DISCLOSURE OF PROXY VOTING POLICIES AND PROCEDURES FOR CLOSED-END MANAGEMENT INVESTMENT COMPANIES |
| | |
| | Not applicable |
| | |
| ITEM 8. | PORTFOLIO MANAGERS OF CLOSED-END MANAGEMENT INVESTMENT COMPANIES |
| | |
| | Not applicable |
| | |
| ITEM 9. | PURCHASES OF EQUITY SECURITIES BY CLOSED-END MANAGEMENT INVESTMENT COMPANY AND AFFILIATED PURCHASERS |
| | |
| | Not applicable |
| | |
| ITEM 10. | SUBMISSION OF MATTERS TO A VOTE OF SECURITY HOLDERS |
| | |
| | There were no material changes to the procedures by which shareholders may recommend nominees to the Fund’s Board. The primary function of the Nominating and Governance Committee is to identify and recommend individuals for membership on the Board and oversee the administration of the Board Governance Guidelines. Shareholders may recommend candidates for Board positions by forwarding their correspondence by U.S. mail or courier service to Keith R. Fox, DWS Funds Board Chair, c/o Thomas R. Hiller, Ropes & Gray LLP, Prudential Tower, 800 Boylston Street, Boston, MA 02199-3600. |
| | |
| ITEM 11. | CONTROLS AND PROCEDURES |
| | |
| | (a) | The Chief Executive and Financial Officers concluded that the Registrant’s Disclosure Controls and Procedures are effective based on the evaluation of the Disclosure Controls and Procedures as of a date within 90 days of the filing date of this report. |
| | |
| | (b) | There have been no changes in the registrant’s internal control over financial reporting that occurred during the period covered by this report that has materially affected, or is reasonably likely to materially affect, the registrant’s internal controls over financial reporting. |
| | |
| ITEM 12. | Disclosure of Securities Lending Activities for Closed-End Management Investment Companies. |
| | |
| | Not applicable |
| | |
| ITEM 13. | EXHIBITS |
| | |
| | (a)(1) | Not applicable |
| | |
| | (a)(2) | Certification pursuant to Rule 30a-2(a) under the Investment Company Act of 1940 (17 CFR 270.30a-2(a)) is filed and attached hereto as Exhibit 99.CERT. |
| | |
| | (b) | Certification pursuant to Rule 30a-2(b) under the Investment Company Act of 1940 (17 CFR 270.30a-2(b)) is furnished and attached hereto as Exhibit 99.906CERT. |
SIGNATURES
Pursuant to the requirements of the Securities Exchange Act of 1934 and the Investment Company Act of 1940, the registrant has duly caused this report to be signed on its behalf by the undersigned, thereunto duly authorized.
| Registrant: | DWS ESG Global Bond Fund, a series of Deutsche DWS Global/International Fund, Inc. |
| | |
| | |
| By: | /s/Hepsen Uzcan Hepsen Uzcan President |
| | |
| Date: | 6/29/2020 |
Pursuant to the requirements of the Securities Exchange Act of 1934 and the Investment Company Act of 1940, this report has been signed below by the following persons on behalf of the registrant and in the capacities and on the dates indicated.
| By: | /s/Hepsen Uzcan Hepsen Uzcan President |
| | |
| Date: | 6/29/2020 |
| | |
| | |
| | |
| By: | /s/Diane Kenneally Diane Kenneally Chief Financial Officer and Treasurer |
| | |
| Date: | 6/29/2020 |