UNITED STATES
SECURITIES AND EXCHANGE COMMISSION
WASHINGTON, D. C. 20549
FORM N-CSRS
Investment Company Act file number: 811-04670
Deutsche DWS Global/International Fund, Inc.
(Exact Name of Registrant as Specified in Charter)
875 Third Avenue
New York, NY 10022-6225
(Address of Principal Executive Offices) (Zip Code)
Registrant’s Telephone Number, including Area Code: (212) 454-4500
Diane Kenneally
100 Summer Street
Boston, MA 02110
(Name and Address of Agent for Service)
| Date of fiscal year end: | 8/31 |
| | |
| Date of reporting period: | 2/28/2021 |
| ITEM 1. | REPORT TO STOCKHOLDERS |
| | |
| | (a) |
| | |

February 28, 2021
Semiannual Report
to Shareholders
DWS International Growth Fund
This report must be preceded or accompanied by a prospectus. To obtain a summary prospectus, if available, or prospectus for any of our funds, refer to the Account Management Resources information provided in the back of this booklet. We advise you to consider the Fund’s objectives, risks, charges and expenses carefully before investing. The summary prospectus and prospectus contain this and other important information about the Fund. Please read the prospectus carefully before you invest.
Investing in foreign securities presents certain risks, such as currency fluctuations, political and economic changes, and market risks. Emerging markets tend to be more volatile and less liquid than the markets of more mature economies, and generally have less diverse and less mature economic structures and less stable political systems than those of developed countries. Stocks may decline in value. Small company stocks tend to be more volatile than medium-sized or large company stocks. Investing in derivatives entails special risks relating to liquidity, leverage and credit that may reduce returns and/or increase volatility. The Fund may lend securities to approved institutions. Please read the prospectus for details.
War, terrorism, economic uncertainty, trade disputes, public health crises (including the recent pandemic spread of the novel coronavirus) and related geopolitical events could lead to increased market volatility, disruption to U.S. and world economies and markets and may have significant adverse effects on the Fund and its investments.
The brand DWS represents DWS Group GmbH & Co. KGaA and any of its subsidiaries such as DWS Distributors, Inc. which offers investment products or DWS Investment Management Americas, Inc. and RREEF America L.L.C. which offer advisory services.
NOT FDIC/NCUA INSURED NO BANK GUARANTEE MAY LOSE VALUE
NOT A DEPOSIT NOT INSURED BY ANY FEDERAL GOVERNMENT AGENCY
| 2 | | DWS International Growth Fund |
Letter to Shareholders
Dear Shareholder:
The outlook for economic recovery remains positive overall, buoyed by progress in the approval and distribution of coronavirus vaccines and a resolution of the 2020 elections. We still, however, have a long road ahead.
Restrictive measures are likely to remain in place, at least to some degree, until broad vaccine distribution is achieved. This suggests that full recovery might take some time. This view appears to be shared by the U.S. Federal Reserve (Fed). Despite more optimism on growth and employment, inflation is expected to remain below the 2% target. Only by 2023 are inflation and unemployment forecasts at levels that would reflect what the Fed would currently see as a full recovery.
As the recovery unfolds, long-term interest rates will likely climb, at least modestly, and S&P earnings per share (EPS) could return to its prior peak in the second quarter of this year. That is a reasonable and constructive outlook, but it provides little help in forecasting equity returns for 2021. Fair or sustainable price-to-earnings ratios (PEs) on mid-cycle earnings remains uncertain.
As we move forward, not all sectors will benefit equally. For this reason, we believe that active management, with its close monitoring of developments, is critical. We believe that the close interaction between our portfolio managers and our CIO Office – which synthesizes the views of more than 900 DWS economists, analysts and investment professionals around the world – positions us to make strategic and tactical decisions.
We appreciate your trust and welcome the opportunity to help you navigate these unusual times. For ongoing updates to our market and economic outlook, please visit the “Insights” section of dws.com.
Best regards,
Hepsen Uzcan
President, DWS Funds
Assumptions, estimates and opinions contained in this document constitute our judgment as of the date of the document and are subject to change without notice. Any projections are based on a number of assumptions as to market conditions and there can be no guarantee that any projected results will be achieved. Past performance is not a guarantee of future results.
| DWS International Growth Fund | | 3 |
| Performance Summary | | February 28, 2021 (Unaudited) |
| Class A | 6-Month ‡ | 1-Year | 5-Year | 10-Year |
| Average Annual Total Returns as of 2/28/21 |
| Unadjusted for Sales Charge | 11.62% | 30.88% | 12.20% | 6.81% |
Adjusted for the Maximum Sales Charge
(max 5.75% load) | 5.20% | 23.36% | 10.88% | 6.18% |
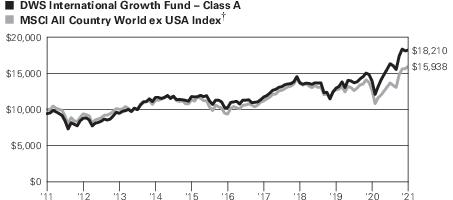
| MSCI All Country World ex USA Index† | 16.65% | 26.18% | 11.21% | 4.77% |
| Average Annual Total Returns as of 12/31/20 (most recent calendar quarter end) |
| Unadjusted for Sales Charge | | 22.09% | 10.69% | 7.26% |
Adjusted for the Maximum Sales Charge
(max 5.75% load) | | 15.07% | 9.39% | 6.63% |
| MSCI All Country World ex USA Index† | | 10.65% | 8.93% | 4.92% |
| Class C | 6-Month ‡ | 1-Year | 5-Year | 10-Year |
| Average Annual Total Returns as of 2/28/21 |
| Unadjusted for Sales Charge | 11.15% | 29.82% | 11.36% | 6.01% |
Adjusted for the Maximum Sales Charge
(max 1.00% CDSC) | 10.15% | 29.82% | 11.36% | 6.01% |
| MSCI All Country World ex USA Index† | 16.65% | 26.18% | 11.21% | 4.77% |
| Average Annual Total Returns as of 12/31/20 (most recent calendar quarter end) |
| Unadjusted for Sales Charge | | 21.14% | 9.86% | 6.46% |
Adjusted for the Maximum Sales Charge
(max 1.00% CDSC) | | 21.14% | 9.86% | 6.46% |
| MSCI All Country World ex USA Index† | | 10.65% | 8.93% | 4.92% |
| Class R | 6-Month ‡ | 1-Year | 5-Year | 10-Year |
| Average Annual Total Returns as of 2/28/21 |
| No Sales Charges | 11.45% | 30.48% | 11.91% | 6.52% |
| MSCI All Country World ex USA Index† | 16.65% | 26.18% | 11.21% | 4.77% |
| Average Annual Total Returns as of 12/31/20 (most recent calendar quarter end) |
| No Sales Charges | | 21.72% | 10.40% | 6.97% |
| MSCI All Country World ex USA Index† | | 10.65% | 8.93% | 4.92% |
| 4 | | DWS International Growth Fund |
| Class R6 | 6-Month ‡ | 1-Year | Life of
Class* |
| Average Annual Total Returns as of 2/28/21 |
| No Sales Charges | 11.82% | 31.38% | 11.31% |
| MSCI All Country World ex USA Index† | 16.65% | 26.18% | 9.80% |
| Average Annual Total Returns as of 12/31/20 (most recent calendar quarter end) |
| No Sales Charges | | 22.56% | 11.88% |
| MSCI All Country World ex USA Index† | | 10.65% | 9.65% |
| Class S | 6-Month ‡ | 1-Year | 5-Year | 10-Year |
| Average Annual Total Returns as of 2/28/21 |
| No Sales Charges | 11.78% | 31.27% | 12.52% | 7.10% |
| MSCI All Country World ex USA Index† | 16.65% | 26.18% | 11.21% | 4.77% |
| Average Annual Total Returns as of 12/31/20 (most recent calendar quarter end) |
| No Sales Charges | | 22.49% | 11.01% | 7.56% |
| MSCI All Country World ex USA Index† | | 10.65% | 8.93% | 4.92% |
| Institutional Class | 6-Month ‡ | 1-Year | 5-Year | 10-Year |
| Average Annual Total Returns as of 2/28/21 |
| No Sales Charges | 11.79% | 31.29% | 12.58% | 7.13% |
| MSCI All Country World ex USA Index† | 16.65% | 26.18% | 11.21% | 4.77% |
| Average Annual Total Returns as of 12/31/20 (most recent calendar quarter end) |
| No Sales Charges | | 22.50% | 11.07% | 7.59% |
| MSCI All Country World ex USA Index† | | 10.65% | 8.93% | 4.92% |
Performance in the Average Annual Total Returns table above and the Growth of an Assumed $10,000 Investment line graph that follows is historical and does not guarantee future results. Investment return and principal fluctuate, so your shares may be worth more or less when redeemed. Current performance may differ from performance data shown. Please visit dws.com for the Fund’s most recent month-end performance. Fund performance includes reinvestment of all distributions. Unadjusted returns do not reflect sales charges and would have been lower if they had.
The gross expense ratios of the Fund, as stated in the fee table of the prospectus dated December 1, 2020 are 1.22%, 2.01%, 1.57%, 0.97%, 0.92% and 0.91% for Class A, Class C, Class R, Class R6, Class S and Institutional Class shares, respectively, and may differ from the expense ratios disclosed in the Financial Highlights tables in this report.
Index returns do not reflect any fees or expenses and it is not possible to invest directly into an index.
| DWS International Growth Fund | | 5 |
Performance figures do not reflect the deduction of taxes that a shareholder would pay on fund distributions or the redemption of fund shares.
Prior to February 1, 2013, the Fund had a sub-advisor and a different management team that operated with a different investment strategy. Performance may have been different if the Fund’s current investment strategy had been in effect.
Prior to October 1, 2017, the Fund operated with a different investment strategy. Performance may have been different if the Fund’s current investment strategy had been in effect.
Generally accepted accounting principles require adjustments to be made to the net assets of the Fund at period end for financial reporting purposes only, and as such, the total return based on the unadjusted net asset value per share may differ from the total return reported in the financial highlights.
Growth of an Assumed $10,000 Investment
(Adjusted for Maximum Sales Charge)
Yearly periods ended February 28
The Fund’s growth of an assumed $10,000 investment is adjusted for the maximum sales charge of 5.75%. This results in a net initial investment of $9,425.
The growth of $10,000 is cumulative.
Performance of other share classes will vary based on the sales charges and the fee structure of those classes.
| * | R6 Class commenced operations on June 1, 2016. |
| † | The Morgan Stanley Capital International (MSCI) All Country World ex USA Index is an unmanaged equity index which captures large and mid-capitalization representation across 22 of 23 developed markets countries excluding the U.S. and 26 emerging markets countries. It covers approximately 85% of the global equity opportunity set outside of the U.S. |
| ‡ | Total returns shown for periods less than one year are not annualized. |
| 6 | | DWS International Growth Fund |
| | Class A | Class C | Class R | Class R6 | Class S | Institutional
Class |
| Net Asset Value |
| 2/28/21 | $45.35 | $42.66 | $45.04 | $45.32 | $45.31 | $45.31 |
| 8/31/20 | $40.84 | $38.38 | $40.51 | $40.90 | $40.87 | $40.87 |
| Distribution Information as of 2/28/21 |
| Income Dividends, Six Months | $ .23 | $ — | $ .11 | $ .41 | $ .37 | $ .37 |
| DWS International Growth Fund | | 7 |
Portfolio Management Team
Sebastian P. Werner, PhD, Head of Investment Strategy Equity
Lead Portfolio Manager of the Fund. Began managing the Fund in 2013.
—
Joined DWS in 2008; previously, he served as a Research Assistant for the Endowed Chair of Asset Management at the European Business School, Oestrich-Winkel while earning his PhD.
—
Portfolio Manager for Global and US Growth Equities: New York.
—
MBA in International Management from the Thunderbird School of Global Management; Master’s Degree (“Diplom-Kaufmann” ) and PhD in Finance (“Dr.rer.pol.” ) from the European Business School, Oestrich-Winkel.
Julia A. Merz, PhD, Portfolio Manager Equity
Portfolio Manager of the Fund. Began managing the Fund in 2019.
—
Joined DWS in 2015; previously, she served as an analyst for consumer discretionary for DWS in Frankfurt.
—
Portfolio Manager and Research Analyst for Global and US Growth Equities: New York.
—
Master’s Degree (“Diplom-Kauffrau” ) in Business Administration and Japanese Studies from University of Mannheim;
—
PhD in Public Finance and Taxation (“Dr.rer.pol.” ) from University of Cologne.
| 8 | | DWS International Growth Fund |
| Portfolio Summary | (Unaudited) |
| Asset Allocation (As a % of Investment Portfolio excluding Securities Lending Collateral) | 2/28/21 | 8/31/20 |
| Common Stocks | 97% | 95% |
| Preferred Stocks | 1% | 1% |
| Other Investments | 1% | 0% |
| Exchange-Traded Funds | 1% | 1% |
| Cash Equivalents | 0% | 3% |
| Convertible Preferred Stocks | — | 0% |
| | 100% | 100% |
| Sector Diversification (As a % of Investment Portfolio excluding Exchange-Traded Funds, Cash Equivalents and Securities Lending Collateral) | 2/28/21 | 8/31/20 |
| Information Technology | 24% | 22% |
| Health Care | 15% | 18% |
| Industrials | 15% | 14% |
| Consumer Discretionary | 14% | 12% |
| Financials | 13% | 14% |
| Communication Services | 6% | 6% |
| Consumer Staples | 6% | 7% |
| Materials | 5% | 5% |
| Energy | 2% | 2% |
| | 100% | 100% |
| Geographical Diversification (As a % of Investment Portfolio excluding Cash Equivalents and Securities Lending Collateral) | 2/28/21 | 8/31/20 |
| Germany | 15% | 15% |
| France | 12% | 12% |
| Japan | 9% | 10% |
| China | 9% | 9% |
| Switzerland | 8% | 10% |
| United States | 8% | 8% |
| Netherlands | 7% | 5% |
| Canada | 6% | 7% |
| United Kingdom | 4% | 3% |
| Sweden | 3% | 3% |
| Ireland | 3% | 4% |
| Brazil | 3% | 2% |
| Taiwan | 2% | 2% |
| Korea | 2% | 1% |
| Argentina | 2% | 2% |
| Singapore | 2% | 2% |
| Other | 5% | 5% |
| | 100% | 100% |
| DWS International Growth Fund | | 9 |
Ten Largest Equity Holdings at February 28, 2021
(24.4% of Net Assets) | Country | Percent |
| 1 Brookfield Asset Management, Inc. | Canada | 3.0% |
| Asset management company focused on the real estate and power generation sectors | | |
| 2 Tencent Holdings Ltd. | China | 2.8% |
| Provider of Internet, mobile, and telicommunication value-added services | | |
| 3 Lonza Group AG | Switzerland | 2.7% |
| Producer of chemicals and plastics | | |
| 4 LVMH Moet Hennessy Louis Vuitton SE | France | 2.7% |
| Diversified luxury goods group | | |
| 5 Taiwan Semiconductor Manufacturing Co., Ltd. | Taiwan | 2.4% |
| Manufacturer of integrated circuits and other semiconductor devices | | |
| 6 Deutsche Boerse AG | Germany | 2.3% |
| Provider of financial services | | |
| 7 Samsung Electronics Co., Ltd. | Korea | 2.2% |
| Manufacturer of electronic parts | | |
| 8 EPAM Systems, Inc. | United States | 2.1% |
| Provider of software development services | | |
| 9 Globant SA | Argentina | 2.1% |
| Software solution company | | |
| 10 Alibaba Group Holding Ltd. | China | 2.1% |
| Provider of internet infrastructure, electronic commerce, online financial, and internet content services through its subsidiaries | | |
Portfolio holdings and characteristics are subject to change.
For more complete details about the Fund’s investment portfolio, see page 11. A quarterly Fact Sheet is available on dws.com or upon request. Please see the Account Management Resources section on page 46 for contact information.
| 10 | | DWS International Growth Fund |
| Investment Portfolio | as of February 28, 2021 (Unaudited) |
| | Shares | Value ($) |
| Common Stocks 96.9% | |
| Argentina 2.1% | |
| Globant SA* (Cost $3,136,952) | | 60,326 | 12,953,199 |
| Australia 0.2% | |
| Appen Ltd. (Cost $2,411,303) | | 112,337 | 1,445,338 |
| Brazil 2.1% | |
| Magazine Luiza SA | | 1,047,365 | 4,518,983 |
| Pagseguro Digital Ltd. “A” * | | 140,799 | 8,174,790 |
| (Cost $7,104,355) | | | 12,693,773 |
| Canada 6.2% | |
| Agnico Eagle Mines Ltd. | | 116,500 | 6,503,347 |
| Alimentation Couche-Tard, Inc. “B” | | 177,200 | 5,326,025 |
| Brookfield Asset Management, Inc. “A” (a) | | 461,250 | 18,629,774 |
| Canadian National Railway Co. | | 72,430 | 7,906,060 |
| (Cost $19,498,175) | | | 38,365,206 |
| China 8.7% | |
| Alibaba Group Holding Ltd. (ADR)* | | 54,343 | 12,920,592 |
| Dada Nexus Ltd. (ADR)* | | 17,597 | 623,990 |
| Minth Group Ltd. | | 490,633 | 2,160,536 |
| Momo, Inc. (ADR) | | 104,200 | 1,650,528 |
| New Oriental Education & Technology Group, Inc. (ADR)* | | 30,500 | 5,417,410 |
| Ping An Healthcare and Technology Co., Ltd. 144A* | | 69,900 | 1,015,588 |
| Ping An Insurance (Group) Co. of China Ltd. “H” | | 1,042,500 | 12,843,169 |
| Tencent Holdings Ltd. | | 201,300 | 17,398,834 |
| (Cost $28,713,071) | | | 54,030,647 |
| France 11.6% | |
| Capgemini SE | | 41,400 | 6,651,527 |
| Cie de Saint-Gobain* | | 99,600 | 5,350,743 |
| LVMH Moet Hennessy Louis Vuitton SE | | 25,868 | 16,416,738 |
| Orpea* | | 34,880 | 4,191,936 |
| Schneider Electric SE | | 15,336 | 2,274,861 |
| SMCP SA 144A* (a) | | 236,037 | 1,474,807 |
| Teleperformance | | 32,267 | 11,474,848 |
| TOTAL SE | | 188,000 | 8,736,431 |
| VINCI SA | | 86,539 | 8,982,729 |
| Vivendi SA | | 170,665 | 5,880,325 |
| (Cost $54,006,582) | | | 71,434,945 |
The accompanying notes are an integral part of the financial statements.
| DWS International Growth Fund | | 11 |
| | Shares | Value ($) |
| Germany 13.6% | |
| adidas AG* | | 10,230 | 3,567,130 |
| Allianz SE (Registered) | | 44,250 | 10,669,759 |
| Auto1 Group SE 144A* | | 52,851 | 2,931,004 |
| BASF SE | | 79,600 | 6,502,512 |
| Deutsche Boerse AG | | 86,889 | 14,223,547 |
| Evonik Industries AG | | 200,920 | 6,765,452 |
| Evotec SE* | | 127,160 | 4,916,225 |
| Fresenius Medical Care AG & Co. KGaA | | 103,060 | 7,127,293 |
| LANXESS AG | | 63,900 | 4,735,883 |
| MYT Netherlands Parent BV (ADR)* (a) | | 88,050 | 2,543,765 |
| SAP SE | | 54,200 | 6,681,566 |
| TeamViewer AG 144A* | | 209,823 | 11,297,380 |
| Wacker Chemie AG | | 15,000 | 1,948,930 |
| (Cost $71,244,392) | | | 83,910,446 |
| Hong Kong 1.3% | |
| Techtronic Industries Co., Ltd. (Cost $1,053,773) | | 517,001 | 7,877,234 |
| Ireland 3.0% | |
| Experian PLC | | 331,600 | 10,516,957 |
| Kerry Group PLC “A” | | 64,070 | 7,740,034 |
| (Cost $11,602,133) | | | 18,256,991 |
| Japan 9.2% | |
| Daikin Industries Ltd. | | 57,300 | 11,206,986 |
| Fast Retailing Co., Ltd. | | 10,300 | 10,237,923 |
| Hoya Corp. | | 83,000 | 9,459,631 |
| Kao Corp. | | 36,900 | 2,484,934 |
| Keyence Corp. | | 25,400 | 12,094,319 |
| MISUMI Group, Inc. | | 122,489 | 3,749,549 |
| Pigeon Corp. | | 73,600 | 2,661,495 |
| Shimadzu Corp. | | 139,900 | 5,062,069 |
| (Cost $32,877,512) | | | 56,956,906 |
| Korea 2.2% | |
| Samsung Electronics Co., Ltd. (Cost $8,010,494) | | 180,900 | 13,341,762 |
| Luxembourg 1.1% | |
| Eurofins Scientific SE* (Cost $1,689,297) | | 77,120 | 6,858,391 |
| Netherlands 7.1% | |
| Adyen NV 144A* | | 2,300 | 5,292,090 |
| Airbus SE* | | 33,602 | 3,902,481 |
| ASML Holding NV | | 17,200 | 9,681,244 |
| ING Groep NV (a) | | 534,868 | 5,864,466 |
The accompanying notes are an integral part of the financial statements.
| 12 | | DWS International Growth Fund |
| | Shares | Value ($) |
| Koninklijke Philips NV* | | 161,184 | 8,755,209 |
| NXP Semiconductors NV | | 35,760 | 6,527,988 |
| Prosus NV | | 32,959 | 3,919,048 |
| (Cost $30,628,610) | | | 43,942,526 |
| Singapore 2.0% | |
| DBS Group Holdings Ltd. (Cost $9,563,255) | | 611,400 | 12,147,391 |
| South Africa 1.2% | |
| Naspers Ltd. “N” (Cost $7,542,377) | | 32,959 | 7,724,699 |
| Sweden 3.3% | |
| Assa Abloy AB “B” | | 126,600 | 3,178,239 |
| Hexagon AB “B” | | 34,839 | 2,907,750 |
| Nobina AB 144A* | | 725,500 | 5,610,683 |
| Spotify Technology SA* (b) | | 28,000 | 8,606,640 |
| (Cost $12,230,725) | | | 20,303,312 |
| Switzerland 8.4% | |
| Alcon, Inc.* | | 20,948 | 1,439,420 |
| Lonza Group AG (Registered) | | 26,600 | 16,775,008 |
| Nestle SA (Registered) | | 112,558 | 11,758,162 |
| Novartis AG (Registered) | | 85,505 | 7,355,317 |
| Roche Holding AG (Genusschein) | | 25,600 | 8,383,421 |
| Zur Rose Group AG* | | 13,100 | 6,166,531 |
| (Cost $26,908,994) | | | 51,877,859 |
| Taiwan 2.4% | |
| Taiwan Semiconductor Manufacturing Co., Ltd. (Cost $4,056,354) | | 670,000 | 14,602,230 |
| United Kingdom 3.6% | |
| Clarivate PLC* | | 158,500 | 3,605,875 |
| Compass Group PLC* | | 225,250 | 4,568,229 |
| Farfetch Ltd. “A” * (b) | | 74,700 | �� 4,921,236 |
| Halma PLC | | 156,200 | 4,932,854 |
| Rentokil Initial PLC* | | 637,400 | 4,151,818 |
| (Cost $16,358,274) | | | 22,180,012 |
| United States 7.6% | |
| Activision Blizzard, Inc. | | 66,000 | 6,310,260 |
| EPAM Systems, Inc.* | | 35,000 | 13,076,350 |
| Marsh & McLennan Companies, Inc. | | 53,393 | 6,151,941 |
| MasterCard, Inc. | | 19,842 | 7,021,092 |
| NVIDIA Corp. | | 10,743 | 5,893,395 |
The accompanying notes are an integral part of the financial statements.
| DWS International Growth Fund | | 13 |
| | Shares | Value ($) |
| Schlumberger NV | | 83,604 | 2,333,388 |
| Thermo Fisher Scientific, Inc. | | 14,000 | 6,301,120 |
| (Cost $16,664,751) | | | 47,087,546 |
| Total Common Stocks (Cost $365,301,379) | | | 597,990,413 |
| Preferred Stocks 1.2% | |
| Germany | |
| Sartorius AG (Cost $4,141,699) | | 14,700 | 7,568,137 |
| Other Investments 0.7% | |
| Brazil | |
| Companhia Vale do Rio Doce (Cost $0) | | 389,000 | 4,156,696 |
| Exchange-Traded Funds 0.5% | |
| iShares MSCI Japan ETF (Cost $2,708,231) | | 45,364 | 3,094,732 |
| Securities Lending Collateral 4.2% | |
| DWS Government & Agency Securities Portfolio “DWS Government Cash Institutional Shares” , 0.01% (c) (d) (Cost $26,017,693) | | 26,017,693 | 26,017,693 |
| Cash Equivalents 0.4% | |
| DWS Central Cash Management Government Fund, 0.03% (c) (Cost $2,427,925) | | 2,427,925 | 2,427,925 |
| | | % of
Net Assets | Value ($) |
| Total Investment Portfolio (Cost $400,596,927) | | 103.9 | 641,255,596 |
| Other Assets and Liabilities, Net | | (3.9) | (23,957,714) |
| Net Assets | | 100.0 | 617,297,882 |
The accompanying notes are an integral part of the financial statements.
| 14 | | DWS International Growth Fund |
A summary of the Fund’s transactions with affiliated investments during the period ended February 28, 2021 are as follows:
Value ($)
at
8/31/2020 | Pur-
chases
Cost
($) | Sales
Proceeds
($) | Net
Real-
ized
Gain/
(Loss)
($) | Net
Change
in
Unreal-
ized
Appreci-
ation
(Depreci-
ation)
($) | Income
($) | Capital
Gain
Distri-
butions
($) | Number of
Shares at
2/28/2021 | Value ($)
at
2/28/2021 |
| Securities Lending Collateral 4.2% |
| DWS Government & Agency Securities Portfolio “DWS Government Cash Institutional Shares” , 0.01% (c) (d) |
| 856,135 | 25,161,558 (e) | — | — | — | 31,706 | — | 26,017,693 | 26,017,693 |
| Cash Equivalents 0.4% |
| DWS Central Cash Management Government Fund, 0.03% (c) |
| 18,294,365 | 26,164,325 | 42,030,765 | — | — | 3,794 | — | 2,427,925 | 2,427,925 |
| 19,150,500 | 51,325,883 | 42,030,765 | — | — | 35,500 | — | 28,445,618 | 28,445,618 |
| * | Non-income producing security. |
| (a) | All or a portion of these securities were on loan. In addition, “Other Assets and Liabilities, Net” may include pending sales that are also on loan. The value of securities loaned at February 28, 2021 amounted to $24,068,196, which is 3.9% of net assets. |
| (b) | Listed on the New York Stock Exchange. |
| (c) | Affiliated fund managed by DWS Investment Management Americas, Inc. The rate shown is the annualized seven-day yield at period end. |
| (d) | Represents cash collateral held in connection with securities lending. Income earned by the Fund is net of borrower rebates. In addition, the Fund held non-cash U.S. Treasury securities collateral having a value of $285,608. |
| (e) | Represents the net increase (purchase cost) or decrease (sales proceeds) in the amount invested in cash collateral for the period ended February 28, 2021. |
| 144A: Security exempt from registration under Rule 144A of the Securities Act of 1933. These securities may be resold in transactions exempt from registration, normally to qualified institutional buyers. |
| ADR: American Depositary Receipt |
| MSCI: Morgan Stanley Capital International |
The accompanying notes are an integral part of the financial statements.
| DWS International Growth Fund | | 15 |
Fair Value Measurements
Various inputs are used in determining the value of the Fund’s investments. These inputs are summarized in three broad levels. Level 1 includes quoted prices in active markets for identical securities. Level 2 includes other significant observable inputs (including quoted prices for similar securities, interest rates, prepayment speeds and credit risk). Level 3 includes significant unobservable inputs (including the Fund’s own assumptions in determining the fair value of investments). The level assigned to the securities valuations may not be an indication of the risk or liquidity associated with investing in those securities.
The following is a summary of the inputs used as of February 28, 2021 in valuing the Fund’s investments. For information on the Fund’s policy regarding the valuation of investments, please refer to the Security Valuation section of Note A in the accompanying Notes to Financial Statements.
| Assets | Level 1 | Level 2 | Level 3 | Total |
| Common Stocks | | | | |
| Argentina | $ 12,953,199 | $ — | $— | $ 12,953,199 |
| Australia | — | 1,445,338 | — | 1,445,338 |
| Brazil | 12,693,773 | — | — | 12,693,773 |
| Canada | 38,365,206 | — | — | 38,365,206 |
| China | 20,612,520 | 33,418,127 | — | 54,030,647 |
| France | — | 71,434,945 | — | 71,434,945 |
| Germany | 2,543,765 | 81,366,681 | — | 83,910,446 |
| Hong Kong | — | 7,877,234 | — | 7,877,234 |
| Ireland | — | 18,256,991 | — | 18,256,991 |
| Japan | — | 56,956,906 | — | 56,956,906 |
| Korea | — | 13,341,762 | — | 13,341,762 |
| Luxembourg | — | 6,858,391 | — | 6,858,391 |
| Netherlands | 6,527,988 | 37,414,538 | — | 43,942,526 |
| Singapore | — | 12,147,391 | — | 12,147,391 |
| South Africa | — | 7,724,699 | — | 7,724,699 |
| Sweden | 8,606,640 | 11,696,672 | — | 20,303,312 |
| Switzerland | — | 51,877,859 | — | 51,877,859 |
| Taiwan | — | 14,602,230 | — | 14,602,230 |
| United Kingdom | 8,527,111 | 13,652,901 | — | 22,180,012 |
| United States | 47,087,546 | — | — | 47,087,546 |
| Preferred Stocks | — | 7,568,137 | — | 7,568,137 |
| Other Investments | 4,156,696 | — | — | 4,156,696 |
| Exchange-Traded Funds | 3,094,732 | — | — | 3,094,732 |
| Short-Term Investments (a) | 28,445,618 | — | — | 28,445,618 |
| Total | $193,614,794 | $447,640,802 | $ — | $641,255,596 |
| (a) | See Investment Portfolio for additional detailed categorizations. |
The accompanying notes are an integral part of the financial statements.
| 16 | | DWS International Growth Fund |
Statement of Assets and Liabilities
as of February 28, 2021 (Unaudited)
| Assets | |
| Investments in non-affiliated securities, at value (cost $372,151,309) — including $24,068,196 of securities loaned | $ 612,809,978 |
| Investment in DWS Government & Agency Securities Portfolio (cost $26,017,693)* | 26,017,693 |
| Investment in DWS Central Cash Management Government Fund (cost $2,427,925) | 2,427,925 |
| Foreign currency, at value (cost $309,529) | 312,292 |
| Receivable for investments sold | 2,429,920 |
| Receivable for Fund shares sold | 49,818 |
| Dividends receivable | 417,552 |
| Interest receivable | 2,898 |
| Foreign taxes recoverable | 424,792 |
| Other assets | 51,416 |
| Total assets | 644,944,284 |
| Liabilities | |
| Payable upon return of securities loaned | 26,017,693 |
| Payable for investments purchased | 926,927 |
| Payable for Fund shares redeemed | 134,503 |
| Accrued management fee | 305,134 |
| Accrued Directors' fees | 6,061 |
| Other accrued expenses and payables | 256,084 |
| Total liabilities | 27,646,402 |
| Net assets, at value | $ 617,297,882 |
| Net Assets Consist of | |
| Distributable earnings (loss) | 237,180,391 |
| Paid-in capital | 380,117,491 |
| Net assets, at value | $ 617,297,882 |
| * | Represents collateral on securities loaned. In addition, the Fund held non-cash collateral having a value of $285,608. |
The accompanying notes are an integral part of the financial statements.
| DWS International Growth Fund | | 17 |
Statement of Assets and Liabilities as of February 28, 2021 (Unaudited) (continued)
| Net Asset Value | |
| Class A | |
Net Asset Value and redemption price per share
($49,350,491 ÷ 1,088,263 shares of capital stock outstanding,
$.01 par value, 50,000,000 shares authorized) | $ 45.35 |
| Maximum offering price per share (100 ÷ 94.25 of $45.35) | $ 48.12 |
| Class C | |
Net Asset Value, offering and redemption price (subject to contingent deferred sales charge) per share
($1,342,271 ÷ 31,462 shares of capital stock outstanding,
$.01 par value, 20,000,000 shares authorized) | $ 42.66 |
| Class R | |
Net Asset Value, offering and redemption price per share
($2,571,160 ÷ 57,091 shares of capital stock outstanding,
$.01 par value, 50,000,000 shares authorized) | $ 45.04 |
| Class R6 | |
Net Asset Value, offering and redemption price per share
($16,614 ÷ 367 shares of capital stock outstanding,
$.01 par value, 50,000,000 shares authorized)** | $ 45.32 |
| Class S | |
Net Asset Value, offering and redemption price per share
($555,712,596 ÷ 12,263,501 shares of capital stock outstanding,
$.01 par value, 100,000,000 shares authorized) | $ 45.31 |
| Institutional Class | |
Net Asset Value, offering and redemption price per share
($8,304,750 ÷ 183,272 shares of capital stock outstanding,
$.01 par value, 100,000,000 shares authorized) | $ 45.31 |
| ** | Net asset value and redemption price per share may not recalculate due to rounding of net assets and/or shares outstanding. |
The accompanying notes are an integral part of the financial statements.
| 18 | | DWS International Growth Fund |
Statement of Operations
for the six months ended February 28, 2021 (Unaudited)
| Investment Income | |
| Income: | |
| Dividends (net of foreign taxes withheld of $287,152) | $ 1,974,254 |
Income distributions — DWS Central Cash Management
Government Fund | 3,794 |
| Securities lending income, net of borrower rebates | 31,706 |
| Total income | 2,009,754 |
| Expenses: | |
| Management fee | 1,848,637 |
| Administration fee | 289,222 |
| Services to shareholders | 360,339 |
| Distribution and service fees | 72,392 |
| Custodian fee | 24,784 |
| Professional fees | 50,640 |
| Reports to shareholders | 32,454 |
| Registration fees | 34,911 |
| Directors' fees and expenses | 10,806 |
| Other | 22,458 |
| Total expenses before expense reductions | 2,746,643 |
| Expense reductions | (718) |
| Total expenses after expense reductions | 2,745,925 |
| Net investment income (loss) | (736,171) |
| Realized and Unrealized Gain (Loss) | |
| Net realized gain (loss) from: | |
| Investments | 7,884,898 |
| Foreign currency | (127,827) |
| | 7,757,071 |
| Change in net unrealized appreciation (depreciation) on: | |
| Investments | 59,381,168 |
| Foreign currency | 77,685 |
| | 59,458,853 |
| Net gain (loss) | 67,215,924 |
| Net increase (decrease) in net assets resulting from operations | $ 66,479,753 |
The accompanying notes are an integral part of the financial statements.
| DWS International Growth Fund | | 19 |
Statements of Changes in Net Assets
| | Six Months
Ended
February 28, 2021 | Year Ended
August 31, |
| Increase (Decrease) in Net Assets | (Unaudited) | 2020 |
| Operations: | | |
| Net investment income (loss) | $ (736,171) | $ 5,145,431 |
| Net realized gain (loss) | 7,757,071 | 3,166,592 |
Change in net unrealized appreciation
(depreciation) | 59,458,853 | 86,969,073 |
| Net increase (decrease) in net assets resulting from operations | 66,479,753 | 95,281,096 |
| Distributions to shareholders: | | |
| Class A | (259,087) | (334,125) |
| Class R | (6,100) | (11,705) |
| Class R6 | (149) | (152) |
| Class S | (4,569,462) | (5,100,720) |
| Institutional Class | (65,052) | (53,387) |
| Total distributions | (4,899,850) | (5,500,089) |
| Fund share transactions: | | |
| Proceeds from shares sold | 6,421,276 | 13,557,354 |
| Reinvestment of distributions | 4,611,930 | 5,178,429 |
| Payments for shares redeemed | (28,602,762) | (63,843,688) |
| Net increase (decrease) in net assets from Fund share transactions | (17,569,556) | (45,107,905) |
| Increase (decrease) in net assets | 44,010,347 | 44,673,102 |
| Net assets at beginning of period | 573,287,535 | 528,614,433 |
| Net assets at end of period | $617,297,882 | $573,287,535 |
The accompanying notes are an integral part of the financial statements.
| 20 | | DWS International Growth Fund |
Financial Highlights
| DWS International Growth Fund — Class A |
| | Six Months
Ended 2/28/21 | Years Ended August 31, |
| | (Unaudited) | 2020 | 2019 | 2018 | 2017 | 2016 |
| Selected Per Share Data |
| Net asset value, beginning of period | $40.84 | $34.50 | $34.79 | $33.55 | $28.76 | $28.49 |
| Income (loss) from investment operations: | | | | | | |
| Net investment income (loss)a | (.11) | .26 | .24 | .26 | .04 | .01 |
| Net realized and unrealized gain (loss) | 4.85 | 6.35 | (.25) | 1.05 | 4.75 | .26 |
| Total from investment operations | 4.74 | 6.61 | (.01) | 1.31 | 4.79 | .27 |
| Less distributions from: | | | | | | |
| Net investment income | (.23) | (.27) | (.28) | (.07) | — | — |
| Redemption fees | — | — | — | — | .00 * | .00 * |
| Net asset value, end of period | $45.35 | $40.84 | $34.50 | $34.79 | $33.55 | $28.76 |
| Total Return (%)b | 11.62 ** | 19.22 c | .16 c | 3.91 c | 16.66 c | .95 c |
| Ratios to Average Net Assets and Supplemental Data |
| Net assets, end of period ($ millions) | 49 | 47 | 46 | 55 | 51 | 55 |
| Ratio of expenses before expense reductions (%) | 1.19 *** | 1.22 | 1.24 | 1.26 | 1.53 | 1.51 |
| Ratio of expenses after expense reductions (%) | 1.19 *** | 1.22 | 1.24 | 1.25 | 1.40 | 1.45 |
| Ratio of net investment income (loss) (%) | (.51) *** | .72 | .73 | .73 | .14 | .05 |
| Portfolio turnover rate (%) | 5 ** | 13 | 12 | 73 | 68 | 39 |
| a | Based on average shares outstanding during the period. |
| b | Total return does not reflect the effect of any sales charges. |
| c | Total return would have been lower had certain expenses not been reduced. |
| * | Amount is less than $.005. |
| ** | Not annualized |
| *** | Annualized |
The accompanying notes are an integral part of the financial statements.
| DWS International Growth Fund | | 21 |
| DWS International Growth Fund — Class C |
| | Six Months
Ended 2/28/21 | Years Ended August 31, |
| | (Unaudited) | 2020 | 2019 | 2018 | 2017 | 2016 |
| Selected Per Share Data |
| Net asset value, beginning of period | $38.38 | $32.45 | $32.70 | $31.71 | $27.38 | $27.33 |
| Income (loss) from investment operations: | | | | | | |
| Net investment income (loss)a | (.26) | (.00) * | (.02) | .01 | (.17) | (.19) |
| Net realized and unrealized gain (loss) | 4.54 | 5.93 | (.16) | .98 | 4.50 | .24 |
| Total from investment operations | 4.28 | 5.93 | (.18) | .99 | 4.33 | .05 |
| Less distributions from: | | | | | | |
| Net investment income | — | — | (.07) | — | — | — |
| Redemption fees | — | — | — | — | .00 * | .00 * |
| Net asset value, end of period | $42.66 | $38.38 | $32.45 | $32.70 | $31.71 | $27.38 |
| Total Return (%)b,c | 11.15 ** | 18.27 | (.51) | 3.12 | 15.81 | .18 |
| Ratios to Average Net Assets and Supplemental Data |
| Net assets, end of period ($ millions) | 1 | 2 | 3 | 4 | 15 | 20 |
| Ratio of expenses before expense reductions (%) | 2.07 *** | 2.01 | 1.97 | 1.99 | 2.26 | 2.24 |
| Ratio of expenses after expense reductions (%) | 2.01 *** | 2.01 | 1.96 | 1.98 | 2.15 | 2.20 |
| Ratio of net investment income (loss) (%) | (1.30) *** | (.01) | (.05) | .02 | (.60) | (.71) |
| Portfolio turnover rate (%) | 5 ** | 13 | 12 | 73 | 68 | 39 |
| a | Based on average shares outstanding during the period. |
| b | Total return does not reflect the effect of any sales charges. |
| c | Total return would have been lower had certain expenses not been reduced. |
| * | Amount is less than $.005. |
| ** | Not annualized |
| *** | Annualized |
The accompanying notes are an integral part of the financial statements.
| 22 | | DWS International Growth Fund |
| DWS International Growth Fund — Class R |
| | Six Months
Ended 2/28/21 | Years Ended August 31, |
| | (Unaudited) | 2020 | 2019 | 2018 | 2017 | 2016 |
| Selected Per Share Data | | | | | | |
| Net asset value, beginning of period | $40.51 | $34.23 | $34.50 | $33.30 | $28.62 | $28.42 |
| Income (loss) from investment operations: | | | | | | |
| Net investment income (loss)a | (.18) | .17 | .15 | .15 | (.02) | (.06) |
| Net realized and unrealized gain (loss) | 4.82 | 6.28 | (.22) | 1.05 | 4.70 | .26 |
| Total from investment operations | 4.64 | 6.45 | (.07) | 1.20 | 4.68 | .20 |
| Less distributions from: | | | | | | |
| Net investment income | (.11) | (.17) | (.20) | — | — | — |
| Redemption fees | — | — | — | — | .00 * | .00 * |
| Net asset value, end of period | $45.04 | $40.51 | $34.23 | $34.50 | $33.30 | $28.62 |
| Total Return (%)b | 11.45 ** | 18.89 | (.07) | 3.60 | 16.35 | .70 |
| Ratios to Average Net Assets and Supplemental Data |
| Net assets, end of period ($ millions) | 3 | 2 | 3 | 3 | 4 | 4 |
| Ratio of expenses before expense reductions (%) | 1.53 *** | 1.57 | 1.58 | 1.59 | 1.87 | 1.84 |
| Ratio of expenses after expense reductions (%) | 1.51 *** | 1.50 | 1.49 | 1.53 | 1.64 | 1.70 |
| Ratio of net investment income (loss) (%) | (.84) *** | .47 | .46 | .45 | (.06) | (.21) |
| Portfolio turnover rate (%) | 5 ** | 13 | 12 | 73 | 68 | 39 |
| a | Based on average shares outstanding during the period. |
| b | Total return would have been lower had certain expenses not been reduced. |
| * | Amount is less than $.005. |
| ** | Not annualized |
| *** | Annualized |
The accompanying notes are an integral part of the financial statements.
| DWS International Growth Fund | | 23 |
| DWS International Growth Fund — Class R6 |
| | Six Months
Ended 2/28/21 | Years Ended August 31, | Period
Ended |
| | (Unaudited) | 2020 | 2019 | 2018 | 2017 | 8/31/16 a |
| Selected Per Share Data | | | | | | |
| Net asset value, beginning of period | $40.90 | $34.56 | $34.85 | $33.56 | $28.74 | $28.41 |
| Income (loss) from investment operations: | | | | | | |
| Net investment income (loss)b | (.03) | .39 | .31 | .44 | .13 | (.00) * |
| Net realized and unrealized gain (loss) | 4.86 | 6.37 | (.20) | 1.01 | 4.73 | .33 |
| Total from investment operations | 4.83 | 6.76 | .11 | 1.45 | 4.86 | .33 |
| Less distributions from: | | | | | | |
| Net investment income | (.41) | (.42) | (.40) | (.16) | (.04) | — |
| Net asset value, end of period | $45.32 | $40.90 | $34.56 | $34.85 | $33.56 | $28.74 |
| Total Return (%)c | 11.82 ** | 19.68 | .59 | 4.33 | 16.94 | 1.16 ** |
| Ratios to Average Net Assets and Supplemental Data |
| Net assets, end of period ($ thousands) | 17 | 15 | 12 | 63 | 12 | 10 |
| Ratio of expenses before expense reductions (%) | .94 *** | .97 | .98 | .89 | 1.32 | 1.22 *** |
| Ratio of expenses after expense reductions (%) | .83 *** | .83 | .83 | .84 | 1.14 | 1.20 *** |
| Ratio of net investment income (loss) (%) | (.16) *** | 1.08 | .94 | 1.26 | .44 | (.05) *** |
| Portfolio turnover rate (%) | 5 ** | 13 | 12 | 73 | 68 | 39 d |
| a | For the period from June 1, 2016 (commencement of operations) to August 31, 2016. |
| b | Based on average shares outstanding during the period. |
| c | Total return would have been lower had certain expenses not been reduced. |
| d | Represents the Fund’s portfolio turnover rate for the year ended August 31, 2016. |
| * | Amount is less than $.005. |
| ** | Not annualized |
| *** | Annualized |
The accompanying notes are an integral part of the financial statements.
| 24 | | DWS International Growth Fund |
| DWS International Growth Fund — Class S |
| | Six Months
Ended 2/28/21 | Years Ended August 31, |
| | (Unaudited) | 2020 | 2019 | 2018 | 2017 | 2016 |
| Selected Per Share Data |
| Net asset value, beginning of period | $40.87 | $34.53 | $34.82 | $33.56 | $28.74 | $28.40 |
| Income (loss) from investment operations: | | | | | | |
| Net investment income (loss)a | (.05) | .36 | .34 | .36 | .13 | .08 |
| Net realized and unrealized gain (loss) | 4.86 | 6.36 | (.26) | 1.06 | 4.73 | .26 |
| Total from investment operations | 4.81 | 6.72 | .08 | 1.42 | 4.86 | .34 |
| Less distributions from: | | | | | | |
| Net investment income | (.37) | (.38) | (.37) | (.16) | (.04) | (.00) * |
| Redemption fees | — | — | — | — | .00 * | .00 * |
| Net asset value, end of period | $45.31 | $40.87 | $34.53 | $34.82 | $33.56 | $28.74 |
| Total Return (%) | 11.78 ** | 19.57 | .48 | 4.23 b | 16.94 b | 1.20 b |
| Ratios to Average Net Assets and Supplemental Data |
| Net assets, end of period ($ millions) | 556 | 516 | 473 | 517 | 538 | 521 |
| Ratio of expenses before expense reductions (%) | .89 *** | .92 | .94 | .95 | 1.22 | 1.21 |
| Ratio of expenses after expense reductions (%) | .89 *** | .92 | .94 | .94 | 1.15 | 1.20 |
| Ratio of net investment income (loss) (%) | (.22) *** | 1.01 | 1.04 | 1.04 | .41 | .30 |
| Portfolio turnover rate (%) | 5 ** | 13 | 12 | 73 | 68 | 39 |
| a | Based on average shares outstanding during the period. |
| b | Total return would have been lower had certain expenses not been reduced. |
| * | Amount is less than $.005. |
| ** | Not annualized |
| *** | Annualized |
The accompanying notes are an integral part of the financial statements.
| DWS International Growth Fund | | 25 |
| DWS International Growth Fund — Institutional Class |
| | Six Months
Ended 2/28/21 | Years Ended August 31, |
| | (Unaudited) | 2020 | 2019 | 2018 | 2017 | 2016 |
| Selected Per Share Data |
| Net asset value, beginning of period | $40.87 | $34.55 | $34.85 | $33.58 | $28.75 | $28.40 |
| Income (loss) from investment operations: | | | | | | |
| Net investment income (loss)a | (.05) | .33 | .37 | .37 | .14 | .11 |
| Net realized and unrealized gain (loss) | 4.86 | 6.40 | (.28) | 1.08 | 4.74 | .24 |
| Total from investment operations | 4.81 | 6.73 | .09 | 1.45 | 4.88 | .35 |
| Less distributions from: | | | | | | |
| Net investment income | (.37) | (.41) | (.39) | (.18) | (.05) | (.00) * |
| Redemption fees | — | — | — | — | .00 * | .00 * |
| Net asset value, end of period | $45.31 | $40.87 | $34.55 | $34.85 | $33.58 | $28.75 |
| Total Return (%) | 11.79 ** | 19.60 | .53 | 4.31 | 17.00 b | 1.24 b |
| Ratios to Average Net Assets and Supplemental Data |
| Net assets, end of period ($ millions) | 8 | 7 | 4 | 14 | 16 | 14 |
| Ratio of expenses before expense reductions (%) | .88 *** | .91 | .86 | .87 | 1.11 | 1.17 |
| Ratio of expenses after expense reductions (%) | .88 *** | .91 | .86 | .87 | 1.10 | 1.16 |
| Ratio of net investment income (loss) (%) | (.22) *** | .93 | 1.12 | 1.07 | .48 | .39 |
| Portfolio turnover rate (%) | 5 ** | 13 | 12 | 73 | 68 | 39 |
| a | Based on average shares outstanding during the period. |
| b | Total return would have been lower had certain expenses not been reduced. |
| * | Amount is less than $.005. |
| ** | Not annualized |
| *** | Annualized |
The accompanying notes are an integral part of the financial statements.
| 26 | | DWS International Growth Fund |
| Notes to Financial Statements | (Unaudited) |
| A. | Organization and Significant Accounting Policies |
DWS International Growth Fund (the “Fund” ) is a diversified series of Deutsche DWS Global/International Fund, Inc. (the “Corporation” ), which is registered under the Investment Company Act of 1940, as amended (the “1940 Act” ), as an open-end management investment company organized as a Maryland corporation.
The Fund offers multiple classes of shares which provide investors with different purchase options. Class A shares are subject to an initial sales charge. Class C shares are not subject to an initial sales charge but are subject to higher ongoing expenses than Class A shares and a contingent deferred sales charge payable upon certain redemptions within one year of purchase. Effective on or about May 10, 2021, Class C shares automatically convert to Class A shares in the same fund after 8 years instead of 10 years, provided that the Fund or the financial intermediary through which the shareholder purchased the Class C shares has records verifying that the Class C shares have been held for at least 8 years. Class R shares and Class R6 shares are not subject to initial or contingent deferred sales charges and are generally available only to certain retirement plans. Class S shares are not subject to initial or contingent deferred sales charges and are available through certain intermediary relationships with financial services firms, or can be purchased by establishing an account directly with the Fund’s transfer agent. Institutional Class shares are not subject to initial or contingent deferred sales charges and are generally available only to qualified institutions.
Investment income, realized and unrealized gains and losses, and certain fund-level expenses and expense reductions, if any, are borne pro rata on the basis of relative net assets by the holders of all classes of shares, except that each class bears certain expenses unique to that class such as distribution and service fees, services to shareholders and certain other class-specific expenses. Differences in class-level expenses may result in payment of different per share dividends by class. All shares of the Fund have equal rights with respect to voting subject to class-specific arrangements.
The Fund’s financial statements are prepared in accordance with accounting principles generally accepted in the United States of America (“U.S. GAAP” ) which require the use of management estimates. Actual results could differ from those estimates. The Fund qualifies as an investment company under Topic 946 of Accounting Standards Codification of U.S. GAAP. The policies described below are followed consistently by the Fund in the preparation of its financial statements.
| DWS International Growth Fund | | 27 |
Security Valuation. Investments are stated at value determined as of the close of regular trading on the New York Stock Exchange on each day the exchange is open for trading.
Various inputs are used in determining the value of the Fund’s investments. These inputs are summarized in three broad levels. Level 1 includes quoted prices in active markets for identical securities. Level 2 includes other significant observable inputs (including quoted prices for similar securities, interest rates, prepayment speeds and credit risk). Level 3 includes significant unobservable inputs (including the Fund’s own assumptions in determining the fair value of investments). The level assigned to the securities valuations may not be an indication of the risk or liquidity associated with investing in those securities.
Equity securities and exchange-traded funds (“ETFs” ) are valued at the most recent sale price or official closing price reported on the exchange (U.S. or foreign) or over-the-counter market on which they trade. Equity securities or ETFs for which no sales are reported are valued at the calculated mean between the most recent bid and asked quotations on the relevant market or, if a mean cannot be determined, at the most recent bid quotation. Equity securities or ETFs are generally categorized as Level 1. For certain international equity securities, in order to adjust for events which may occur between the close of the foreign exchanges and the close of the New York Stock Exchange, a fair valuation model may be used. This fair valuation model takes into account comparisons to the valuation of American Depository Receipts (ADRs), exchange-traded funds, futures contracts and certain indices and these securities are categorized as Level 2.
Investments in open-end investment companies are valued at their net asset value each business day and are categorized as Level 1.
Securities and other assets for which market quotations are not readily available or for which the above valuation procedures are deemed not to reflect fair value are valued in a manner that is intended to reflect their fair value as determined in accordance with procedures approved by the Board and are generally categorized as Level 3. In accordance with the Fund’s valuation procedures, factors considered in determining value may include, but are not limited to, the type of the security; the size of the holding; the initial cost of the security; the existence of any contractual restrictions on the security’s disposition; the price and extent of public trading in similar securities of the issuer or of comparable companies; quotations or evaluated prices from broker-dealers and/or pricing services; information obtained from the issuer, analysts, and/or the appropriate stock exchange (for exchange-traded securities); an analysis of the company’s or issuer’s financial statements; an evaluation of the forces that influence the issuer and the market(s) in which the security is purchased and sold; and with respect to debt securities, the maturity,
| 28 | | DWS International Growth Fund |
coupon, creditworthiness, currency denomination and the movement of the market in which the security is normally traded. The value determined under these procedures may differ from published values for the same securities.
Disclosure about the classification of fair value measurements is included in a table following the Fund’s Investment Portfolio.
Securities Lending. Brown Brothers Harriman & Co., as lending agent, lends securities of the Fund to certain financial institutions under the terms of its securities lending agreement. During the term of the loans, the Fund continues to receive interest and dividends generated by the securities and to participate in any changes in their market value. The Fund requires the borrowers of the securities to maintain collateral with the Fund consisting of either cash and/or U.S. Treasury Securities having a value at least equal to the value of the securities loaned. When the collateral falls below specified amounts, the lending agent will use its best effort to obtain additional collateral on the next business day to meet required amounts under the securities lending agreement. During the six months ended February 28, 2021, the Fund invested the cash collateral into a joint trading account in DWS Government & Agency Securities Portfolio, an affiliated money market fund managed by DWS Investment Management Americas, Inc. DWS Investment Management Americas, Inc. receives a management/ administration fee (0.04% annualized effective rate as of February 28, 2021) on the cash collateral invested in DWS Government & Agency Securities Portfolio. The Fund receives compensation for lending its securities either in the form of fees or by earning interest on invested cash collateral net of borrower rebates and fees paid to a lending agent. Either the Fund or the borrower may terminate the loan at any time, and the borrower, after notice, is required to return borrowed securities within a standard time period. There may be risks of delay and costs in recovery of securities or even loss of rights in the collateral should the borrower of the securities fail financially. If the Fund is not able to recover securities lent, the Fund may sell the collateral and purchase a replacement investment in the market, incurring the risk that the value of the replacement security is greater than the value of the collateral. The Fund is also subject to all investment risks associated with the reinvestment of any cash collateral received, including, but not limited to, interest rate, credit and liquidity risk associated with such investments.
As of February 28, 2021, the Fund had securities on loan. The value of the related collateral exceeded the value of the securities loaned at period end.
| DWS International Growth Fund | | 29 |
Remaining Contractual Maturity of the Agreements as of February 28, 2021
| | Overnight
and
Continuous | <30 days | Between 30
& 90 days | >90 days | Total |
| Securities Lending Transactions |
| Common Stocks | $ 26,017,693 | $ — | $ — | $ 285,608 | $ 26,303,301 |
| Gross amount of recognized liabilities and non-cash collateral for securities lending transactions: | $ 26,303,301 |
Foreign Currency Translations. The books and records of the Fund are maintained in U.S. dollars. Investment securities and other assets and liabilities denominated in a foreign currency are translated into U.S. dollars at the prevailing exchange rates at period end. Purchases and sales of investment securities, income and expenses are translated into U.S. dollars at the prevailing exchange rates on the respective dates of the transactions.
Net realized and unrealized gains and losses on foreign currency transactions represent net gains and losses between trade and settlement dates on securities transactions, the acquisition and disposition of foreign currencies, and the difference between the amount of net investment income accrued and the U.S. dollar amount actually received. The portion of both realized and unrealized gains and losses on investments that results from fluctuations in foreign currency exchange rates is not separately disclosed but is included with net realized and unrealized gain/appreciation and loss/depreciation on investments.
Taxes. The Fund’s policy is to comply with the requirements of the Internal Revenue Code, as amended, which are applicable to regulated investment companies, and to distribute all of its taxable income to its shareholders.
Additionally, the Fund may be subject to taxes imposed by the governments of countries in which it invests and are generally based on income and/or capital gains earned or repatriated. Estimated tax liabilities on certain foreign securities are recorded on an accrual basis and are reflected as components of interest income or net change in unrealized gain/loss on investments. Tax liabilities realized as a result of security sales are reflected as a component of net realized gain/loss on investments.
At August 31, 2020, the Fund had a net tax basis short-term capital loss carryforwards of approximately $9,891,000, which may be applied against realized net taxable capital gains indefinitely.
At February 28, 2021, the aggregate cost of investments for federal income tax purposes was $401,108,592. The net unrealized appreciation for all investments based on tax cost was $240,147,004. This consisted of aggregate gross unrealized appreciation for all investments for which there was an excess of value over tax cost of $258,565,025 and
| 30 | | DWS International Growth Fund |
aggregate gross unrealized depreciation for all investments for which there was an excess of tax cost over value of $18,418,021.
The Fund has reviewed the tax positions for the open tax years as of August 31, 2020 and has determined that no provision for income tax and/or uncertain tax positions is required in the Fund’s financial statements. The Fund’s federal tax returns for the prior three fiscal years remain open subject to examination by the Internal Revenue Service.
Distribution of Income and Gains. Distributions from net investment income of the Fund, if any, are declared and distributed to shareholders annually. Net realized gains from investment transactions, in excess of available capital loss carryforwards, would be taxable to the Fund if not distributed, and, therefore, will be distributed to shareholders at least annually. The Fund may also make additional distributions for tax purposes if necessary.
The timing and characterization of certain income and capital gain distributions are determined annually in accordance with federal tax regulations which may differ from accounting principles generally accepted in the United States of America. These differences primarily relate to investments in foreign denominated investments and investments in certain securities sold at a loss. As a result, net investment income (loss) and net realized gain (loss) on investment transactions for a reporting period may differ significantly from distributions during such period. Accordingly, the Fund may periodically make reclassifications among certain of its capital accounts without impacting the net asset value of the Fund.
The tax character of current year distributions will be determined at the end of the current fiscal year.
Expenses. Expenses of the Corporation arising in connection with a specific fund are allocated to that Fund. Other Corporation expenses which cannot be directly attributed to a fund are apportioned among the funds in the Corporation based upon the relative net assets or other appropriate measures.
Contingencies. In the normal course of business, the Fund may enter into contracts with service providers that contain general indemnification clauses. The Fund’s maximum exposure under these arrangements is unknown, as this would involve future claims that may be made against the Fund that have not yet been made. However, based on experience, the Fund expects the risk of loss to be remote.
Other. Investment transactions are accounted for on a trade date plus one basis for daily net asset value calculations. However, for financial reporting purposes, investment transactions are reported on trade date. Interest income is recorded on the accrual basis. Dividend income is recorded on the ex-dividend date net of foreign withholding taxes. Certain dividends
| DWS International Growth Fund | | 31 |
from foreign securities may be recorded subsequent to the ex-dividend date as soon as the Fund is informed of such dividends. Realized gains and losses from investment transactions are recorded on an identified cost basis. Proceeds from litigation payments, if any, are included in net realized gain (loss) from investments.
| B. | Purchases and Sales of Securities |
During the six months ended February 28, 2021, purchases and sales of investment securities (excluding short-term investments) aggregated $30,948,513 and $37,388,282, respectively.
Management Agreement. Under the Investment Management Agreement with DWS Investment Management Americas, Inc. (“DIMA” or the “Advisor” ), an indirect, wholly owned subsidiary of DWS Group GmbH & Co. KGaA (“DWS Group” ), the Advisor directs the investments of the Fund in accordance with its investment objectives, policies and restrictions. The Advisor determines the securities, instruments and other contracts relating to investments to be purchased, sold or entered into by the Fund.
Under the Investment Management Agreement with the Advisor, the Fund pays the Advisor a management fee based on the Fund’s average daily net assets, computed and accrued daily and payable monthly, at the annual rate (exclusive of any applicable waivers/reimbursements) of 0.62%.
For the period from September 1, 2020 through September 30, 2021, the Advisor has contractually agreed to waive its fees and/or reimburse certain operating expenses of the Fund to the extent necessary to maintain the total annual operating expenses (excluding certain expenses such as extraordinary expenses, taxes, brokerage and interest expense) of each class as follows:
| Class A | 1.26% |
| Class C | 2.01% |
| Class R | 1.51% |
| Class R6 | 1.01% |
| Class S | 1.01% |
| Institutional Class | 1.01% |
In addition, for the period from September 1, 2020 through February 28, 2021, the Advisor had voluntarily agreed to waive its fees and/or reimburse certain operating expenses of Class R6 shares to the extent necessary to maintain the total annual operating expenses (excluding
| 32 | | DWS International Growth Fund |
certain expenses such as extraordinary expenses, taxes, brokerage and interest expense) at 0.83%.
For the six months ended February 28, 2021, fees waived and/or expenses reimbursed for certain classes are as follows:
| Class C | $ 412 |
| Class R | 298 |
| Class R6 | 8 |
| | $ 718 |
Administration Fee. Pursuant to an Administrative Services Agreement, DIMA provides most administrative services to the Fund. For all services provided under the Administrative Services Agreement, the Fund pays the Advisor an annual fee (“Administration Fee” ) of 0.097% of the Fund’s average daily net assets, computed and accrued daily and payable monthly. For the six months ended February 28, 2021, the Administration Fee was $289,222, of which $47,759 is unpaid.
Service Provider Fees. DWS Service Company (“DSC” ), an affiliate of the Advisor, is the transfer agent, dividend-paying agent and shareholder service agent for the Fund. Pursuant to a sub-transfer agency agreement between DSC and DST Systems, Inc. (“DST” ), DSC has delegated certain transfer agent, dividend-paying agent and shareholder service agent functions to DST. DSC compensates DST out of the shareholder servicing fee it receives from the Fund. For the six months ended February 28, 2021, amounts charged to the Fund by DSC were as follows:
| Services to Shareholders | Total
Aggregated | Unpaid at
February 28, 2021 |
| Class A | $ 9,855 | $ 2,437 |
| Class C | 508 | 119 |
| Class R | 178 | 53 |
| Class R6 | 12 | 3 |
| Class S | 134,379 | 31,731 |
| Institutional Class | 252 | 91 |
| | $ 145,184 | $ 34,434 |
In addition, for the six months ended February 28, 2021, the amounts charged to the Fund for recordkeeping and other administrative services
| DWS International Growth Fund | | 33 |
provided by unaffiliated third parties, included in the Statement of Operations under “Services to shareholders,” were as follows:
| Sub-Recordkeeping | Total
Aggregated |
| Class A | $ 26,944 |
| Class C | 1,577 |
| Class R | 2,871 |
| Class S | 135,295 |
| Institutional Class | 3,182 |
| | $ 169,869 |
Distribution and Service Fees. Under the Fund’s Class C and R 12b-1 Plans, DWS Distributors, Inc. (“DDI” ), an affiliate of the Advisor, receives a fee (“Distribution Fee” ) of 0.75% of the average daily net assets of Class C shares and 0.25% of the average daily net assets of Class R shares. In accordance with the Fund’s Underwriting and Distribution Services Agreement, DDI enters into related selling group agreements with various firms at various rates for sales of Class C and R shares. For the six months ended February 28, 2021, the Distribution Fee was as follows:
| Distribution Fee | Total
Aggregated | Unpaid at
February 28, 2021 |
| Class C | $ 5,596 | $ 807 |
| Class R | 3,141 | 523 |
| | $ 8,737 | $ 1,330 |
In addition, DDI provides information and administrative services for a fee (“Service Fee” ) to Class A, C and R shareholders at an annual rate of up to 0.25% of the average daily net assets for each such class. DDI in turn has various agreements with financial services firms that provide these services and pays these fees based upon the assets of shareholder accounts the firms service. For the six months ended February 28, 2021, the Service Fee was as follows:
| Service Fee | Total
Aggregated | Unpaid at
February 28, 2021 | Annualized
Rate |
| Class A | $ 58,698 | $ 19,071 | .24% |
| Class C | 1,818 | 856 | .24% |
| Class R | 3,139 | 1,056 | .25% |
| | $ 63,655 | $ 20,983 | |
Underwriting Agreement and Contingent Deferred Sales Charge. DDI is the principal underwriter for the Fund. Underwriting commissions paid in
| 34 | | DWS International Growth Fund |
connection with the distribution of Class A shares for the six months ended February 28, 2021 aggregated $340.
In addition, DDI receives any contingent deferred sales charge (“CDSC” ) from Class C share redemptions occurring within one year of purchase. There is no such charge upon redemption of any share appreciation or reinvested dividends. The CDSC is 1% of the value of the shares redeemed for Class C. For the six months ended February 28, 2021, the CDSC for Class C shares aggregated $26. A deferred sales charge of up to 0.75% is assessed on certain redemptions of Class A shares.
Other Service Fees. Under an agreement with the Fund, DIMA is compensated for providing regulatory filing services to the Fund. For the six months ended February 28, 2021, the amount charged to the Fund by DIMA included in the Statement of Operations under “Reports to shareholders” aggregated $1,198, of which $207 is unpaid.
Directors' Fees and Expenses. The Fund paid retainer fees to each Director not affiliated with the Advisor, plus specified amounts to the Board Chairperson and to each committee Chairperson.
Affiliated Cash Management Vehicles. The Fund may invest uninvested cash balances in DWS Central Cash Management Government Fund and DWS ESG Liquidity Fund, affiliated money market funds which are managed by the Advisor. Each affiliated money market fund is managed in accordance with Rule 2a-7 under the 1940 Act, which governs the quality, maturity, diversity and liquidity of instruments in which a money market fund may invest. DWS Central Cash Management Government Fund seeks to maintain a stable net asset value, and DWS ESG Liquidity Fund maintains a floating net asset value. The Fund indirectly bears its proportionate share of the expenses of each affiliated money market fund in which it invests. DWS Central Cash Management Government Fund does not pay the Advisor an investment management fee. To the extent that DWS ESG Liquidity Fund pays an investment management fee to the Advisor, the Advisor will waive an amount of the investment management fee payable to the Advisor by the Fund equal to the amount of the investment management fee payable on the Fund’s assets invested in DWS ESG Liquidity Fund.
The Fund and other affiliated funds (the “Participants” ) share in a $350 million revolving credit facility provided by a syndication of banks. The Fund may borrow for temporary or emergency purposes, including the meeting of redemption requests that otherwise might require the untimely disposition of securities. The Participants are charged an annual commitment fee, which is allocated based on net assets, among each of the Participants. Prior to March 18, 2021, interest was calculated at a rate per annum equal to the sum of the Federal Funds Rate plus 1.25% plus if
| DWS International Growth Fund | | 35 |
the one-month LIBOR exceeds the Federal Funds Rate, the amount of such excess. Effective March 18, 2021, interest is calculated at a daily fluctuating rate per annum equal to the sum of 0.10% plus the higher of the Federal Funds Effective Rate and the Overnight Bank Funding Rate, plus 1.25%. The Fund may borrow up to a maximum of 33 percent of its net assets under the agreement. The Fund had no outstanding loans at February 28, 2021.
| E. | Fund Share Transactions |
The following table summarizes share and dollar activity in the Fund:
| | Six Months Ended
February 28, 2021 | Year Ended
August 31, 2020 |
| | Shares | Dollars | Shares | Dollars |
| Shares sold |
| Class A | 28,235 | $ 1,247,645 | 78,949 | $ 2,866,710 |
| Class C | 1,874 | 78,327 | 4,148 | 143,148 |
| Class R | 5,416 | 233,847 | 4,834 | 173,897 |
| Class S | 76,721 | 3,388,067 | 176,956 | 6,566,693 |
| Institutional Class | 33,272 | 1,473,390 | 103,780 | 3,806,906 |
| | | $ 6,421,276 | | $ 13,557,354 |
| Shares issued to shareholders in reinvestment of distributions |
| Class A | 5,263 | $ 236,723 | 8,159 | $ 305,313 |
| Class R | 137 | 6,100 | 315 | 11,705 |
| Class R6 | 4 | 149 | 4 | 152 |
| Class S | 95,828 | 4,304,616 | 128,681 | 4,809,224 |
| Institutional Class | 1,432 | 64,342 | 1,392 | 52,035 |
| | | $ 4,611,930 | | $ 5,178,429 |
| Shares redeemed |
| Class A | (87,397) | $ (3,830,537) | (268,983) | $ (9,512,836) |
| Class C | (21,222) | (830,541) | (32,804) | (1,090,776) |
| Class R | (9,001) | (374,516) | (20,512) | (723,565) |
| Class S | (525,226) | (23,013,912) | (1,402,074) | (50,182,494) |
| Institutional Class | (12,416) | (553,256) | (68,040) | (2,334,017) |
| | | $ (28,602,762) | | $ (63,843,688) |
| 36 | | DWS International Growth Fund |
| | Six Months Ended
February 28, 2021 | Year Ended
August 31, 2020 |
| | Shares | Dollars | Shares | Dollars |
| Net increase (decrease) |
| Class A | (53,899) | $ (2,346,169) | (181,875) | $ (6,340,813) |
| Class C | (19,348) | (752,214) | (28,656) | (947,628) |
| Class R | (3,448) | (134,569) | (15,363) | (537,963) |
| Class R6 | 4 | 149 | 4 | 152 |
| Class S | (352,677) | (15,321,229) | (1,096,437) | (38,806,577) |
| Institutional Class | 22,288 | 984,476 | 37,132 | 1,524,924 |
| | | $ (17,569,556) | | $ (45,107,905) |
| F. | Other — COVID-19 Pandemic |
A novel coronavirus known as COVID-19, declared a pandemic by the World Health Organization, has caused significant uncertainty, market volatility, decreased economic and other activity and increased government activity. Specifically, COVID-19 has led to significant death and morbidity, and concerns about its further spread have resulted in the closing of schools and non-essential businesses, cancellations, shelter-in place orders, lower consumer spending in certain sectors, social distancing, bans on large social gatherings and travel, quarantines, government economic stimulus measures, reduced productivity, rapid increases in unemployment, increased demand for and strain on government and medical resources, border closings and global trade and supply chain interruptions, among others. The full effects, duration and costs of the COVID-19 pandemic are impossible to predict, and the circumstances surrounding the COVID-19 pandemic will continue to evolve. The pandemic may affect certain countries, industries, economic sectors, companies and investment products more than others, may exacerbate existing economic, political, or social tensions and may increase the probability of an economic recession or depression. The Fund and its investments may be adversely affected by the effects of the COVID-19 pandemic, and a prolonged pandemic may result in the Fund and its service providers experiencing operational difficulties in coordinating a remote workforce and implementing their business continuity plans, among others. Management will continue to monitor the impact COVID-19 has on the Fund and reflect the consequences as appropriate in the Fund’s accounting and financial reporting.
| DWS International Growth Fund | | 37 |
Information About Your Fund’s Expenses
As an investor of the Fund, you incur two types of costs: ongoing expenses and transaction costs. Ongoing expenses include management fees, distribution and service (12b-1) fees and other Fund expenses. Examples of transaction costs include sales charges (loads) and account maintenance fees, which are not shown in this section. The following tables are intended to help you understand your ongoing expenses (in dollars) of investing in the Fund and to help you compare these expenses with the ongoing expenses of investing in other mutual funds. In the most recent six-month period, the Fund limited these expenses for Class C, Class R and Class R6 shares; had they not done so, expenses would have been higher. The example in the table is based on an investment of $1,000 invested at the beginning of the six-month period and held for the entire period (September 1, 2020 to February 28, 2021).
The tables illustrate your Fund’s expenses in two ways:
| — | Actual Fund Return. This helps you estimate the actual dollar amount of ongoing expenses (but not transaction costs) paid on a $1,000 investment in the Fund using the Fund’s actual return during the period. To estimate the expenses you paid over the period, simply divide your account value by $1,000 (for example, an $8,600 account value divided by $1,000 = 8.6), then multiply the result by the number in the “Expenses Paid per $1,000” line under the share class you hold. |
| — | Hypothetical 5% Fund Return. This helps you to compare your Fund’s ongoing expenses (but not transaction costs) with those of other mutual funds using the Fund’s actual expense ratio and a hypothetical rate of return of 5% per year before expenses. Examples using a 5% hypothetical fund return may be found in the shareholder reports of other mutual funds. The hypothetical account values and expenses may not be used to estimate the actual ending account balance or expenses you paid for the period. |
Please note that the expenses shown in these tables are meant to highlight your ongoing expenses only and do not reflect any transaction costs. The “Expenses Paid per $1,000” line of the tables is useful in comparing ongoing expenses only and will not help you determine the relative total expense of owning different funds. Subject to certain exceptions, an account maintenance fee of $20.00 assessed once per calendar year for Classes A, C and S shares may apply for accounts with balances less than $10,000. This fee is not included in these tables. If it was, the estimate of expenses paid for Classes A, C and S shares during the period would be higher, and account value during the period would be lower, by this amount.
| 38 | | DWS International Growth Fund |
Expenses and Value of a $1,000 Investment
for the six months ended February 28, 2021 (Unaudited)
| Actual Fund Return | Class A | Class C | Class R | Class R6 | Class S | Institutional
Class |
| Beginning Account Value 9/1/20 | $1,000.00 | $1,000.00 | $1,000.00 | $1,000.00 | $1,000.00 | $1,000.00 |
| Ending Account Value 2/28/21 | $1,116.20 | $1,111.50 | $1,114.50 | $1,118.20 | $1,117.80 | $1,117.90 |
| Expenses Paid per $1,000* | $ 6.24 | $ 10.52 | $ 7.92 | $ 4.36 | $ 4.67 | $ 4.62 |
| Hypothetical 5% Fund Return | Class A | Class C | Class R | Class R6 | Class S | Institutional
Class |
| Beginning Account Value 9/1/20 | $1,000.00 | $1,000.00 | $1,000.00 | $1,000.00 | $1,000.00 | $1,000.00 |
| Ending Account Value 2/28/21 | $1,018.89 | $1,014.83 | $1,017.31 | $1,020.68 | $1,020.38 | $1,020.43 |
| Expenses Paid per $1,000* | $ 5.96 | $ 10.04 | $ 7.55 | $ 4.16 | $ 4.46 | $ 4.41 |
| * | Expenses are equal to the Fund’s annualized expense ratio for each share class, multiplied by the average account value over the period, multiplied by 181 (the number of days in the most recent six-month period), then divided by 365. |
| Annualized Expense Ratios | Class A | Class C | Class R | Class R6 | Class S | Institutional
Class |
| DWS International Growth Fund | 1.19% | 2.01% | 1.51% | .83% | .89% | .88% |
For more information, please refer to the Fund’s prospectus.
For an analysis of the fees associated with an investment in the Fund or similar funds, please refer to tools.finra.org/fund_analyzer/.
| DWS International Growth Fund | | 39 |
Liquidity Risk Management
In accordance with Rule 22e-4 (the “Liquidity Rule” ) under the Investment Company Act of 1940 (the “1940 Act” ), your Fund has adopted a liquidity risk management program (the “Program” ), and the Board has designated DWS Investment Management Americas, Inc. (“DIMA” ) as Program administrator. The Program is designed to assess and manage your Fund’s liquidity risk (the risk that the Fund would be unable to meet requests to redeem shares of the Fund without significant dilution of remaining investors’ interests in the Fund). DIMA has designated a committee (the “Committee” ) composed of personnel from multiple departments within DIMA and its affiliates that is responsible for the implementation and ongoing administration of the Program, which includes assessing the Fund’s liquidity risk under both normal and reasonably foreseeable stressed conditions. Under the Program, every investment held by a Fund is classified on a daily basis into one of four liquidity categories based on estimations of the investment’s ability to be sold during designated timeframes in current market conditions without significantly changing the investment’s market value.
In February 2021, as required by the Program and the Liquidity Rule, DIMA provided the Board with an annual written report (the “Report” ) addressing the operation of the Program and assessing the adequacy and effectiveness of its implementation during the period from December 1, 2019 through November 30, 2020 (the “Reporting Period” ). During the Reporting Period, your Fund was primarily invested in highly liquid investments (investments that the Fund anticipates can be converted to cash within three business days or less in current market conditions without significantly changing their market value). As a result, your Fund is not required to adopt, and has not adopted, a “Highly Liquid Investment Minimum” as defined in the Liquidity Rule. During the Reporting Period, the Fund did not approach the 15% limit imposed by the Liquidity Rule on holdings in illiquid investments (investments that cannot be sold or disposed of in seven days or less in current market conditions without the sale of the investment significantly changing the market value of the investment). Your Fund did not experience any issues meeting investor redemptions at any time during the Reporting Period. In the Report, DIMA stated that it believes the Program has operated adequately and effectively to manage the Fund’s liquidity risk during the Reporting Period. DIMA also reported that there were no material changes made to the Program during the Reporting Period.
| 40 | | DWS International Growth Fund |
Advisory Agreement Board Considerations and Fee Evaluation
The Board of Directors (hereinafter referred to as the “Board” or “Directors” ) approved the renewal of DWS International Growth Fund’s (the “Fund” ) investment management agreement (the “Agreement” ) with DWS Investment Management Americas, Inc. (“DIMA” ) in September 2020.
In terms of the process that the Board followed prior to approving the Agreement, shareholders should know that:
| — | During the entire process, all of the Fund’s Directors were independent of DIMA and its affiliates (the “Independent Directors” ). |
| — | The Board met frequently during the past year to discuss fund matters and dedicated a substantial amount of time to contract review matters. Over the course of several months, the Board reviewed extensive materials received from DIMA, independent third parties and independent counsel. These materials included an analysis of the Fund’s performance, fees and expenses, and profitability from a fee consultant retained by the Fund’s Independent Directors (the “Fee Consultant” ). |
| — | The Board also received extensive information throughout the year regarding performance of the Fund. |
| — | The Independent Directors regularly met privately with counsel to discuss contract review and other matters. In addition, the Independent Directors were advised by the Fee Consultant in the course of their review of the Fund’s contractual arrangements and considered a comprehensive report prepared by the Fee Consultant in connection with their deliberations. |
| — | In connection with reviewing the Agreement, the Board also reviewed the terms of the Fund’s Rule 12b-1 plan, distribution agreement, administrative services agreement, transfer agency agreement and other material service agreements. |
In connection with the contract review process, the Board considered the factors discussed below, among others. The Board also considered that DIMA and its predecessors have managed the Fund since its inception, and the Board believes that a long-term relationship with a capable, conscientious advisor is in the best interests of the Fund. The Board considered, generally, that shareholders chose to invest or remain invested in the Fund knowing that DIMA managed the Fund. DIMA is part of DWS Group GmbH & Co. KGaA (“DWS Group” ). DWS Group is a global asset management business that offers a wide range of investing expertise and resources, including research capabilities in many countries throughout the world. In 2018, approximately 20% of DWS Group’s
| DWS International Growth Fund | | 41 |
shares were sold in an initial public offering, with Deutsche Bank AG owning the remaining shares.
As part of the contract review process, the Board carefully considered the fees and expenses of each DWS fund overseen by the Board in light of the fund’s performance. In many cases, this led to the negotiation and implementation of expense caps.
While shareholders may focus primarily on fund performance and fees, the Fund’s Board considers these and many other factors, including the quality and integrity of DIMA’s personnel and administrative support services provided by DIMA, such as back-office operations, fund valuations, and compliance policies and procedures.
Nature, Quality and Extent of Services. The Board considered the terms of the Agreement, including the scope of advisory services provided under the Agreement. The Board noted that, under the Agreement, DIMA provides portfolio management services to the Fund and that, pursuant to a separate administrative services agreement, DIMA provides administrative services to the Fund. The Board considered the experience and skills of senior management and investment personnel and the resources made available to such personnel. The Board also considered the risks to DIMA in sponsoring or managing the Fund, including financial, operational and reputational risks, the potential economic impact to DIMA from such risks and DIMA’s approach to addressing such risks. The Board reviewed the Fund’s performance over short-term and long-term periods and compared those returns to various agreed-upon performance measures, including market index(es) and a peer universe compiled using information supplied by Morningstar Direct (“Morningstar” ), an independent fund data service. The Board also noted that it has put into place a process of identifying “Funds in Review” (e.g., funds performing poorly relative to a peer universe), and receives additional reporting from DIMA regarding such funds and, where appropriate, DIMA’s plans to address underperformance. The Board believes this process is an effective manner of identifying and addressing underperforming funds. Based on the information provided, the Board noted that, for the one-, three- and five-year periods ended December 31, 2019, the Fund’s performance (Class A shares) was in the 1st quartile, 4th quartile and 3rd quartile, respectively, of the applicable Morningstar universe (the 1st quartile being the best performers and the 4th quartile being the worst performers). The Board also observed that the Fund has outperformed its benchmark in the one-, three- and five-year periods ended December 31, 2019.
Fees and Expenses. The Board considered the Fund’s investment management fee schedule, operating expenses and total expense ratios, and comparative information provided by Broadridge Financial Solutions, Inc. (“Broadridge” ) and the Fee Consultant regarding investment management fee rates paid to other investment advisors by similar funds (1st quartile being the most favorable and 4th quartile being the least
| 42 | | DWS International Growth Fund |
favorable). With respect to management fees paid to other investment advisors by similar funds, the Board noted that the contractual fee rates paid by the Fund, which include a 0.10% fee paid to DIMA under the Fund’s administrative services agreement, were lower than the median (2nd quartile) of the applicable Broadridge peer group (based on Broadridge data provided as of December 31, 2019). The Board noted that, effective March 1, 2020, the fee paid to DIMA under the Fund’s administrative services agreement was reduced to 0.097%. The Board noted that the Fund’s Class A shares total (net) operating expenses (excluding 12b-1 fees) were expected to be higher than the median (3rd quartile) of the applicable Broadridge expense universe (based on Broadridge data provided as of December 31, 2019, and analyzing Broadridge expense universe Class A (net) expenses less any applicable 12b-1 fees) (“Broadridge Universe Expenses” ). The Board also reviewed data comparing each other operational share class’s total (net) operating expenses to the applicable Broadridge Universe Expenses. The Board noted that the expense limitations agreed to by DIMA were expected to help the Fund’s total (net) operating expenses remain competitive. The Board considered the Fund’s management fee rate as compared to fees charged by DIMA to a comparable DWS U.S. registered fund (“DWS Funds” ) and considered differences between the Fund and the comparable DWS Fund. The information requested by the Board as part of its review of fees and expenses also included information about institutional accounts (including any sub-advised funds and accounts) and funds offered primarily to European investors (“DWS Europe Funds” ) managed by DWS Group. The Board noted that DIMA indicated that DWS Group does not manage any institutional accounts or DWS Europe Funds comparable to the Fund.
On the basis of the information provided, the Board concluded that management fees were reasonable and appropriate in light of the nature, quality and extent of services provided by DIMA.
Profitability. The Board reviewed detailed information regarding revenues received by DIMA under the Agreement. The Board considered the estimated costs to DIMA, and pre-tax profits realized by DIMA, from advising the DWS Funds, as well as estimates of the pre-tax profits attributable to managing the Fund in particular. The Board also received information regarding the estimated enterprise-wide profitability of DIMA and its affiliates with respect to all fund services in totality and by fund. The Board and the Fee Consultant reviewed DIMA’s methodology in allocating its costs to the management of the Fund. Based on the information provided, the Board concluded that the pre-tax profits realized by DIMA in connection with the management of the Fund were not unreasonable. The Board also reviewed certain publicly available information regarding the profitability of certain similar investment management firms. The Board noted that, while information regarding the
| DWS International Growth Fund | | 43 |
profitability of such firms is limited (and in some cases is not necessarily prepared on a comparable basis), DIMA and its affiliates’ overall profitability with respect to the DWS Funds (after taking into account distribution and other services provided to the funds by DIMA and its affiliates) was lower than the overall profitability levels of most comparable firms for which such data was available.
Economies of Scale. The Board considered whether there are economies of scale with respect to the management of the Fund and whether the Fund benefits from any economies of scale. In this regard, the Board observed that while the Fund’s current investment management fee schedule does not include breakpoints, the Fund’s fee schedule represents an appropriate sharing between the Fund and DIMA of such economies of scale as may exist in the management of the Fund at current asset levels.
Other Benefits to DIMA and Its Affiliates. The Board also considered the character and amount of other incidental or “fall-out” benefits received by DIMA and its affiliates, including any fees received by DIMA for administrative services provided to the Fund, any fees received by an affiliate of DIMA for transfer agency services provided to the Fund and any fees received by an affiliate of DIMA for distribution services. The Board also considered benefits to DIMA related to brokerage and soft-dollar allocations, including allocating brokerage to pay for research generated by parties other than the executing broker dealers, which pertain primarily to funds investing in equity securities. In addition, the Board considered the incidental public relations benefits to DIMA related to DWS Funds advertising and cross-selling opportunities among DIMA products and services. The Board considered these benefits in reaching its conclusion that the Fund’s management fees were reasonable.
Compliance. The Board considered the significant attention and resources dedicated by DIMA to its compliance processes in recent years. The Board noted in particular (i) the experience, seniority and time commitment of the individuals serving as DIMA’s and the Fund’s chief compliance officers and (ii) the substantial commitment of resources by DIMA and its affiliates to compliance matters, including the retention of compliance personnel.
The Board also considered that on September 24, 2020, the SEC granted a temporary order permitting DIMA and its affiliates to continue providing investment advisory and underwriting services to the DWS Funds notwithstanding a consent order entered into by Deutsche Bank AG on June 17, 2020 (the “Consent Order” ). The Board noted that the temporary order was granted effective as of the date of the Consent Order. The Board also noted various representations by DIMA to the Board relating to the Consent Order, including that the conduct giving rise to the Consent Order (unintentional conduct that resulted from a system outage that prevented Deutsche Bank AG from reporting data in accordance with
| 44 | | DWS International Growth Fund |
applicable CFTC requirements for five days in April 2016) did not involve any DWS Fund or services DIMA and its affiliates provide to the DWS Funds, that DIMA and its personnel had no involvement in the alleged conduct giving rise to the Consent Order, and that the DWS Funds would not bear any financial impact or costs relating to the Consent Order.
Based on all of the information considered and the conclusions reached, the Board determined that the continuation of the Agreement is in the best interests of the Fund. In making this determination, the Board did not give particular weight to any single factor identified above. The Board considered these factors over the course of numerous meetings, certain of which were in executive session with only the Independent Directors and counsel present. It is possible that individual Independent Directors may have weighed these factors differently in reaching their individual decisions to approve the continuation of the Agreement.
| DWS International Growth Fund | | 45 |
Account Management Resources
| For More Information | The automated telephone system allows you to access personalized account information and obtain information on other DWS funds using either your voice or your telephone keypad. Certain account types within Classes A, C and S also have the ability to purchase, exchange or redeem shares using this system. |
For more information, contact your financial representative. You may also access our automated telephone system or speak with a Shareholder Service representative by calling:
(800) 728-3337 |
| Web Site | dws.com
View your account transactions and balances, trade shares, monitor your asset allocation, subscribe to fund and account updates by e-mail, and change your address, 24 hours a day. |
| Obtain prospectuses and applications, news about DWS funds, insight from DWS economists and investment specialists and access to DWS fund account information. |
| Written Correspondence | DWSPO Box 219151
Kansas City, MO 64121-9151 |
| Proxy Voting | The Fund’s policies and procedures for voting proxies for portfolio securities and information about how the Fund voted proxies related to its portfolio securities during the most recent 12-month period ended June 30 are available on our Web site — dws.com/en-us/resources/proxy-voting — or on the SEC’s Web site — sec.gov. To obtain a written copy of the Fund’s policies and procedures without charge, upon request, call us toll free at (800) 728-3337. |
| Portfolio Holdings | Following the Fund’s fiscal first and third quarter-end, a complete portfolio holdings listing is posted on dws.com, and is available free of charge by contacting your financial intermediary, or if you are a direct investor, by calling (800) 728-3337. In addition, the portfolio holdings listing is filed with SEC on the Fund’s Form N-PORT and will be available on the SEC’s Web site at sec.gov. Additional portfolio holdings for the Fund are also posted on dws.com from time to time. Please see the Fund’s current prospectus for more information. |
| Principal Underwriter | If you have questions, comments or complaints, contact:DWS Distributors, Inc.
222 South Riverside Plaza
Chicago, IL 60606-5808
(800) 621-1148 |
| 46 | | DWS International Growth Fund |
| Investment Management | DWS Investment Management Americas, Inc. (“DIMA” or the “Advisor” ), which is part of the DWS Group GmbH & Co. KGaA (“DWS Group” ), is the investment advisor for the Fund. DIMA and its predecessors have more than 90 years of experience managing mutual funds and DIMA provides a full range of investment advisory services to both institutional and retail clients. DIMA is an indirect, wholly owned subsidiary of DWS Group. |
| | DWS Group is a global organization that offers a wide range of investing expertise and resources, including hundreds of portfolio managers and analysts and an office network that reaches the world’s major investment centers. This well-resourced global investment platform brings together a wide variety of experience and investment insight across industries, regions, asset classes and investing styles. |
| | Class A | Class C | Class S | Institutional Class |
| Nasdaq Symbol | SGQAX | SGQCX | SCOBX | SGQIX |
| CUSIP Number | 25156A 775 | 25156A 817 | 25156A 833 | 25156A 700 |
| Fund Number | 407 | 707 | 2007 | 1407 |
| For shareholders of Class R and Class R6 |
| Automated Information Line | | DWS/Ascensus Plan Access (800) 728-3337 |
| 24-hour access to your retirement plan account. |
| Web Site | | dws.com |
Obtain prospectuses and applications, news about DWS funds,
insight from DWS economists and investment specialists and access
to DWS fund account information. |
| | Log in/register to manage retirement account assets at https://www.mykplan.com/participantsecure_net/login.aspx. |
| For More Information | | (800) 728-3337 |
| To speak with a service representative. |
| Written Correspondence | | DWS Service Company222 South Riverside Plaza
Chicago, IL 60606-5806 |
| | Class R | Class R6 |
| Nasdaq Symbol | SGQRX | SGQTX |
| CUSIP Number | 25156A 825 | 25156A 643 |
| Fund Number | 1512 | 1607 |
| DWS International Growth Fund | | 47 |
Privacy Statement
| FACTS | What Does DWS Do With Your Personal Information? |
| Why? | Financial companies choose how they share your personal information. Federal law gives consumers the right to limit some but not all sharing. Federal law also requires us to tell you how we collect, share and protect your personal information. Please read this notice carefully to understand what we do. |
| What? | The types of personal information we collect and share can include:
— Social Security number
— Account balances
— Purchase and transaction history
— Bank account information
— Contact information such as mailing address, e-mail address and telephone number |
| How? | All financial companies need to share customers’ personal information to run their everyday business. In the section below, we list the reasons financial companies can share their customers’ personal information, the reasons DWS chooses to share and whether you can limit this sharing. |
| Reasons we can share your personal information | Does DWS share? | Can you limit
this sharing? |
| For our everyday business purposes —such as to process your transactions, maintain your account(s), respond to court orders or legal investigations | Yes | No |
| For our marketing purposes — to offer our products and services to you | Yes | No |
| For joint marketing with other financial companies | No | We do not share |
| For our affiliates’ everyday business purposes — information about your transactions and experiences | No | We do not share |
| For our affiliates’ everyday business purposes — information about your creditworthiness | No | We do not share |
| For non-affiliates to market to you | No | We do not share |
| Questions? | Call (800) 728-3337 or e-mail us at service@dws.com |
| 48 | | DWS International Growth Fund |
| Who we are |
| Who is providing this notice? | DWS Distributors, Inc; DWS Investment Management Americas,
Inc.; DWS Trust Company; the DWS Funds |
| What we do |
| How does DWS protect my personal information? | To protect your personal information from unauthorized access and use, we use security measures that comply with federal law. These measures include computer safeguards, secured files, and secured buildings. |
| How does DWS collect my personal information? | We collect your personal information, for example, when you:
— open an account
— give us your contact information
— provide bank account information for ACH or wire transactions
— tell us where to send money
— seek advice about your investments |
| Why can’t I limit all sharing? | Federal law gives you the right to limit only
— sharing for affiliates’ everyday business purposes
— information about your creditworthiness
— affiliates from using your information to market to you
— sharing for non-affiliates to market to you
State laws and individual companies may give you additional rights to limit sharing. |
| Definitions |
| Affiliates | Companies related by common ownership or control. They can be
financial or non-financial companies. Our affiliates include financial
companies with the DWS or Deutsche Bank (“DB” ) name, such as
DB AG Frankfurt. |
| Non-affiliates | Companies not related by common ownership or control. They can
be financial and non-financial companies.
Non-affiliates we share with include account service providers,
service quality monitoring services, mailing service providers and
verification services to help in the fight against money laundering
and fraud. |
| Joint marketing | A formal agreement between non-affiliated financial companies that
together market financial products or services to you. DWS does not
jointly market. |
California residents may go to https://fundsus.dws.com/us/en-us/legal-resources/privacy-policy.html to obtain additional information relating to their rights under California state law.
Rev. 12/2020
| DWS International Growth Fund | | 49 |
| | |
| | (b) Not applicable |
| | |
| ITEM 2. | CODE OF ETHICS |
| | |
| | Not applicable. |
| | |
| ITEM 3. | AUDIT COMMITTEE FINANCIAL EXPERT |
| | |
| | Not applicable |
| | |
| ITEM 4. | PRINCIPAL ACCOUNTANT FEES AND SERVICES |
| | |
| | Not applicable |
| | |
| ITEM 5. | AUDIT COMMITTEE OF LISTED REGISTRANTS |
| | |
| | Not applicable |
| | |
| ITEM 6. | SCHEDULE OF INVESTMENTS |
| | |
| | Not applicable |
| | |
| ITEM 7. | DISCLOSURE OF PROXY VOTING POLICIES AND PROCEDURES FOR CLOSED-END MANAGEMENT INVESTMENT COMPANIES |
| | |
| | Not applicable |
| | |
| ITEM 8. | PORTFOLIO MANAGERS OF CLOSED-END MANAGEMENT INVESTMENT COMPANIES |
| | |
| | Not applicable |
| | |
| ITEM 9. | PURCHASES OF EQUITY SECURITIES BY CLOSED-END MANAGEMENT INVESTMENT COMPANY AND AFFILIATED PURCHASERS |
| | |
| | Not applicable |
| | |
| ITEM 10. | SUBMISSION OF MATTERS TO A VOTE OF SECURITY HOLDERS |
| | |
| | There were no material changes to the procedures by which shareholders may recommend nominees to the Fund’s Board. The primary function of the Nominating and Governance Committee is to identify and recommend individuals for membership on the Board and oversee the administration of the Board Governance Guidelines. Shareholders may recommend candidates for Board positions by forwarding their correspondence by U.S. mail or courier service to Keith R. Fox, DWS Funds Board Chair, c/o Thomas R. Hiller, Ropes & Gray LLP, Prudential Tower, 800 Boylston Street, Boston, MA 02199-3600. |
| | |
| ITEM 11. | CONTROLS AND PROCEDURES |
| | |
| | (a) | The Chief Executive and Financial Officers concluded that the Registrant’s Disclosure Controls and Procedures are effective based on the evaluation of the Disclosure Controls and Procedures as of a date within 90 days of the filing date of this report. |
| | |
| | (b) | There have been no changes in the registrant’s internal control over financial reporting that occurred during the period covered by this report that has materially affected, or is reasonably likely to materially affect, the registrant’s internal controls over financial reporting. |
| | |
| ITEM 12. | Disclosure of Securities Lending Activities for Closed-End Management Investment Companies. |
| | |
| | Not applicable |
| | |
| ITEM 13. | EXHIBITS |
| | |
| | (a)(1) | Not applicable |
| | |
| | (a)(2) | Certification pursuant to Rule 30a-2(a) under the Investment Company Act of 1940 (17 CFR 270.30a-2(a)) is filed and attached hereto as Exhibit 99.CERT. |
| | |
| | (b) | Certification pursuant to Rule 30a-2(b) under the Investment Company Act of 1940 (17 CFR 270.30a-2(b)) is furnished and attached hereto as Exhibit 99.906CERT. |
SIGNATURES
Pursuant to the requirements of the Securities Exchange Act of 1934 and the Investment Company Act of 1940, the registrant has duly caused this report to be signed on its behalf by the undersigned, thereunto duly authorized.
| Registrant: | DWS International Growth Fund, a series of Deutsche DWS Global/International Fund, Inc. |
| | |
| | |
| By: | /s/Hepsen Uzcan Hepsen Uzcan President |
| | |
| Date: | 4/29/2021 |
Pursuant to the requirements of the Securities Exchange Act of 1934 and the Investment Company Act of 1940, this report has been signed below by the following persons on behalf of the registrant and in the capacities and on the dates indicated.
| By: | /s/Hepsen Uzcan Hepsen Uzcan President |
| | |
| Date: | 4/29/2021 |
| | |
| | |
| | |
| By: | /s/Diane Kenneally Diane Kenneally Chief Financial Officer and Treasurer |
| | |
| Date: | 4/29/2021 |