UNITED STATES
SECURITIES AND EXCHANGE COMMISSION
Washington, D.C. 20549
FORM N-CSR
CERTIFIED SHAREHOLDER REPORT OF REGISTERED
MANAGEMENT INVESTMENT COMPANIES
| Investment Company Act file number | 811-04665 |
Commonwealth International Series Trust
(Exact name of registrant as specified in charter)
| 5847 San Felipe, Suite 850, Houston , TX | 77057 |
| (Address of principal executive offices) | (Zip code) |
BISYS Fund Services Ohio, Inc.
3435 Stelzer Road
Columbus, Ohio 43219
(Name and address of agent for service)
| Registrant’s telephone number, including area code: | 888-345-1898 |
| Date of fiscal year end: | October 31 |
| Date of reporting period: | October 31, 2006 |
Item 1. Reports to Stockholders.
The Commonwealth International
Series Trust
Australia/New Zealand Fund
Japan Fund
Global Fund
Real Estate Securities Fund
ANNUAL REPORT
October 31, 2006
630-A Fitzwatertown Road, Willow Grove, PA 19090 * 888.345.1898
Commonwealth Australia/New Zealand Fund (CNZLX)
Commonwealth Japan Fund (CNJFX)
Commonwealth Global Fund (CNGLX)
Commonwealth Real Estate Securities Fund (CNREX)
www.commonwealthfunds.com
Dear Shareholder:
We are pleased to present this annual report on the Commonwealth International Series Trust on behalf of its separate series: the Commonwealth Australia/New Zealand Fund, Commonwealth Japan Fund, Commonwealth Global Fund and Commonwealth Real Estate Securities Fund (each a “Fund” and together the “Funds”) for the twelve months ended October 31, 2006.
To obtain a Prospectus and other information about a Commonwealth Fund, please visit www.commonwealthfunds.com or call 1-888-345-1898. Please read the Prospectus carefully before investing.
Commonwealth Australia/New Zealand Fund
Performance Overview
The Commonwealth Australia/New Zealand Fund’s Net Asset Value (“NAV”) as of October 31, 2006, was $17.44 per share compared to $16.43 per share on October 31, 2005. On December 29, 2005, the Fund made distributions of $1.23 per share. For the twelve months under review, Commonwealth Australia/New Zealand Fund posted a 14.6% cumulative total return, assuming reinvestment of gross distributions. For the same period the Funds’ benchmarks, the Australian All Ordinaries Index1 and, the New Zealand Exchange Limited 50 Free Float Total Return Index2, posted returns of 32.6% and 10.2%, respectively. We do not attempt to track any index, but rather undertake investments on the basis of fundamental research. We also invest a portion of the Fund’s assets in fixed income investments. The Fund’s total return is presented net of Fund expenses, which means the Fund’s performance is reduced by applicable Fund fees and expenses whereas the index returns do not include any such fees. Performance data represents past performance, and does not guarantee future results. Investment return and principal value will fluctuate, and your investment may result in a gain or loss when you sell your shares. An investor should consider the Fund’s investment objectives, risks, charges and expenses carefully before investing. This and other important information about the Fund can be found in the Fund’s Prospectus.
With equities outperforming fixed-income (bonds) in both countries, the Fund’s 29.7% bond allocation at year-end was a drag on performance. A decline in the New Zealand dollar versus the U.S. dollar during the year also detracted from returns. However, higher commodity prices and increasing interest rates lifted the Australian dollar versus the U.S. dollar nearly 3.7% over the year. New Zealand equities have made strong returns over the year, reflecting buoyant global economic conditions. While New Zealand equities underperformed global equities, the return from the local market has been much stronger than expected. This probably reflects the undercurrent from strong global equity markets, particularly from the outperforming Australian market, and strong liquidity conditions, with significant private equity money looking for equity exposure and little new equity supply in New Zealand.
COMMONWEALTH INTERNATIONAL SERIES TRUST
| |
PORTFOLIO ALLOCATION (As of 10/31/06) (unaudited) |
| Country/Asset Class* | % of Total Value |
| New Zealand Equities | 50.4% |
| New Zealand Bonds | 21.9% |
| Australia Equities | 19.8% |
| Australia Bonds | 7.8% |
| Short-Term Investments | 0.1% |
*Short term investments include foreign currency valued at the then-current exchange rate. Percentages are based on total market value of investment securities. Holdings are subject to change.
Economic and Market Overview
Recent dataflow in New Zealand on economic activity suggests that growth in the second half of the year will probably be a little stronger than previously expected. The large decline in oil prices and still-surprising strength in the housing market are key reasons for this optimism. The big question is whether the more positive flow of activity data is a sign of a permanent shift up to a strong growth profile, or simply reflects data volatility and, to some extent, the short-term boost from lower fuel prices.
The recent mix of data - some recovery in domestic demand, but also tighter monetary conditions via a stronger currency - suggests a change to the risk profile of the outlook for the economy. The recent strength of the currency, if sustained, puts downside risk to the domestic sector, by perhaps keeping the Reserve Bank of New Zealand on the sidelines, and stimulating demand via cheaper imports.
If 2006 can be categorized as a year of when Australia’s economic growth was restrained by capacity constraints and cost pressures, the 2007 outlook looks set to be dominated by the passing of the supportive factors of loose fiscal and financial conditions to the more negative forces of a peak in the terms of trade, severe drought, flat business investment outlook, slowing household income and employment growth and a moderation in system credit growth.
COMMONWEALTH INTERNATIONAL SERIES TRUST
In short, on the basis of normal cyclical developments, there is reason to believe that 2007 will prove to be a more challenging year for economic growth. However, there is an additional subtext to Australia’s economic outlook that may prove pivotal to the economic outlook. There has already been a marked increase in household saving through 2006, partly reflecting an inflation ‘surprise’ that has challenged assumptions on the path of interest rates and real income growth. While this is probably best interpreted as a period of ‘precautionary’ saving, material changes in the regulatory environment raises the prospect of a ‘structural’ rise in savings sufficient to generate a weaker consumption trend in 2007 and 2008.
| 1. | The Australian All Ordinaries Index is a capitalization-weighted index. The index is made up of the largest 500 companies as measured by market cap that are listed on the Australian Stock Exchange. The index was developed with a base value of 500 as of 1979. Index returns assume reinvestment of dividends and, unlike Fund returns, do not reflect any fees or expenses. It is not possible to invest directly into an index. |
| 2. | The New Zealand Exchange Limited 50 Free Float Total Return Index is a modified market capitalization weighted index. This index consists of the top 50 companies by free float adjusted market capitalization that are listed on the New Zealand Stock Exchange. Index returns assume reinvestment of dividends and, unlike Fund returns, do not reflect any fees or expenses. It is not possible to invest directly into an index. |
COMMONWEALTH INTERNATIONAL SERIES TRUST
Commonwealth Japan Fund
Performance Overview
The Commonwealth Japan Fund’s NAV as of October 31, 2006, was $4.33 per share compared to $4.15 per share on October 31, 2005. On December 29, 2005, the Japan Fund made distributions of $0.05 per share. For the twelve months under review, Commonwealth Japan Fund posted a 5.6% cumulative total return, assuming reinvestment of gross distributions. The Fund underperformed its benchmark, the Tokyo Stock Price Index3, which posted a return of 12.7%, for the same period. We do not attempt to track any index, but rather undertake investments on the basis of fundamental research. We also invest a portion of the Fund’s assets in fixed income investments. The Fund’s total return is presented net of Fund expenses, which means the Fund’s performance is reduced by applicable Fund fees and expenses whereas the index returns do not include any such fees. Performance data represents past performance, and does not guarantee future results. Investment return and principal value will fluctuate, and your investment may result in a gain or loss when you sell your shares. An investor should consider the Fund’s investment objectives, risks, charges and expenses carefully before investing. This and other important information about the Fund can be found in the Fund’s Prospectus.
We believe that Japanese equities underperformed global equities for a number of reasons, including conservative corporate earnings forecasts, downward revisions to economic growth forecasts and uncertainty over Prime Minister Abe’s economic policies. The Commonwealth Japan Fund trailed the Tokyo Stock Price Index during the last twelve months. The principal reason for the underperformance was stock and sector selection, fixed-income securities (8.3%) in the portfolio, and Fund expenses.
| |
PORTFOLIO ALLOCATION (As of 10/31/06) (unaudited) |
| Sector* | % of Total Value |
| Industrial | 25.2% |
| Consumer Cyclical | 20.7% |
| Financial | 17.2% |
| Consumer Non-Cyclical | 11.7% |
| Fixed Income & Other | 8.3% |
| Utilities | 5.6% |
| Technology | 4.0% |
| Communications | 3.1% |
| Basic Materials | 1.8% |
| Funds | 1.5% |
| Energy | 0.9% |
*Allocation is based on Bloomberg level 1 industry sector. Fixed income & other includes foreign currency valued at the then-current exchange. Percentages are based on total market value of investment securities. Holdings subject to change.
COMMONWEALTH INTERNATIONAL SERIES TRUST
Economic and Market Overview
During the fiscal year under review, the financial and economic environment was characterized by continued robust economic growth overseas, particularly in China and the United States. In Japan, as consumer prices began to increase, the Bank of Japan ended quantitative easing in March 2006 but short-term market interest rates continued to be close to zero. Long-term market interest rates showed a degree of weakness over the first half of the year but later increased, anticipating the end of quantitative easing by the Bank of Japan. At the same time, as interest rates further increased in the U.S., the interest rate spread between Japan and the U.S. widened and in the Yen/Dollar foreign exchange market there was a trend to Yen weakness and dollar strength.
Japan’s economic expansion, now close to being the longest-lasting since the Second World War, continues. Activity in the corporate sector in particular remains encouragingly robust, with the Bank of Japan’s September Tankan survey of corporate sentiment showing a stronger than expected improvement in business optimism, with both overall borrowing and borrowing by small companies rising strongly in the second quarter of 2006 in year-on-year terms. Contrary to previous recoveries, this time the pick-up has spread to the non-manufacturing sector, arguing well for the sustainability of the current expansion. We expect continued strength in the corporate sector to allow gross fixed investment to continue to make a large, albeit declining, contribution to economic growth. Annual gross domestic product, at around 2% in both 2007 and 2008, will remain respectable, even if rather slower than the rate of 2.5-3% a year seen in 2005-06.
| 3. | The TOPIX, also known as the Tokyo Stock Price Index, is a capitalization-weighted index of all companies listed on the First Section of the Tokyo Stock Exchange. The index calculation excludes temporary issues and preferred stocks, and had a base value of 100 as of 1/04/68. Index returns assume reinvestment of dividends and, unlike Fund returns, do not reflect any fees or expenses. It is not possible to invest directly into an index. |
COMMONWEALTH INTERNATIONAL SERIES TRUST
Commonwealth Global Fund
Performance Overview
The Commonwealth Global Fund’s NAV as of October 31, 2006, was $17.07 per share compared to $15.06 per share on October 31, 2005. On December 29, 2005, the Global Fund made distributions of $0.37 per share. For the twelve months under review, Commonwealth Global Fund posted an 16.0% cumulative total return, assuming reinvestment of gross distributions. The Fund underperformed its benchmark, the Morgan Stanley Capital International (MSCI) World Index4, which posted a 22.0% total return for the same period. We do not attempt to track any index, but rather undertake investments on the basis of fundamental research. We also invest a portion of the Fund’s assets in fixed income investments. The Fund’s total return is presented net of Fund expenses, which means the Fund’s performance is reduced by applicable Fund fees and expenses whereas the index returns do not include any such fees. Performance data represents past performance, and does not guarantee future results. Investment return and principal value will fluctuate, and your investment may result in a gain or loss when you sell your shares. An investor should consider the Fund’s investment objectives, risks, charges and expenses carefully before investing. This and other important information about the Fund can be found in the Fund’s Prospectus.
Factors affecting the Fund’s returns included rising short-term interest rates in the U.S. and most other developed economies, slowing gross domestic product in the U.S., a weaker dollar versus most other major currencies, volatile commodity prices, and continued unrest in the Middle-East. The Commonwealth Global Fund trailed the MSCI World Index during the last twelve months. The principal reason for the deficit was stock selection and the presence of bonds (4.9%), preferred stock (1.6%) and short-term investments (2.5%) as equities outperformed fixed income securities during the period. Although higher energy prices prevailed during most of the year in review, contrary to conventional wisdom, two of the best performing portfolio securities were Continental Airlines and British Airways.
| |
PORTFOLIO ALLOCATION (As of 10/31/06) (unaudited) |
| Country/Region* | % of Total Value |
| North America | 41.9% |
| Europe | 31.4% |
| Emerging Markets | 9.9% |
| Bonds, Pfd. Stock, & Short Term Investments | 9.0% |
| Japan | 5.0% |
| Developed Asia ex-Japan | 2.8% |
*Short-term investments include cash & cash equivalents. Percentages based on total market value of investment securities. Holdings subject to change.
COMMONWEALTH INTERNATIONAL SERIES TRUST
Economic and Market Overview
The world economy is currently experiencing its longest run of above-trend growth since 1984-89. Indeed, this is already the longest period of global growth in excess of 4% per year since before the first oil shock of 1973. The current global expansion is being driven to an unprecedented extent by rapid growth among developing economies. According to the IMF’s World Economic Outlook database, developing economies have grown at an average annual rate of 7.3% per year over the four years to 2006, accounting for nearly two-thirds of the increase in total global gross domestic product during this period.
The growth of many developing economies has been partially fostered by what can be thought of as the ‘outsourcing’ of production of many goods and services previously produced in ‘advanced’ economies. Thus, the pace of growth in the ‘developing world’, and in the world economy as a whole, will still be influenced by swings in demand from the ‘advanced’ economies and (in particular) from the United States. In that context, the recent signs of a slowdown in the U.S. economy are of considerable importance to the global economy.
The marked downturn in the U.S. housing sector has precipitated a broader-based slowdown in U.S. economic activity. Falling home prices, sharply lower mortgage equity withdrawal and increased debt servicing and fuel costs have moderated household spending growth, while employment gains have weakened. Fortunately, the U.S. corporate sector remains healthy and business investment should continue to support growth in the year ahead. In addition, the recent bond market rally has helped to ease financial conditions which, combined with a marked fall in oil and gasoline prices, could offer some support for the embattled household sector going into 2007. Nonetheless, these factors may not be enough to prevent U.S. growth slowing to below 3% in 2007.
The Eurozone economy is steaming ahead at a growth rate quite a bit above potential. Business sentiment has turned increasingly upbeat again, with some forward-looking components indicating a strong finish to 2006. Eurozone businesses are still driving economic activity, thanks to high profit margins, high capacity utilization and still relatively low interest rates. Households too are increasingly optimistic about the near-term, although not as upbeat as businesses.
| 4. | The MSCI World Index is a free float-adjusted market capitalization index that is designed to measure global developed market equity performance. As of May 2005 the MSCI World Index consisted of the following 23 developed market country indices: Australia, Austria, Belgium, Canada, Denmark, Finland, France, Germany, Greece, Hong Kong, Ireland, Italy, Japan, Netherlands, New Zealand, Norway, Portugal, Singapore, Spain, Sweden, Switzerland, the United Kingdom and the United States. Index returns assume reinvestment of dividends and, unlike Fund returns, do not reflect any fees or expenses. It is not possible to invest directly into an index. |
COMMONWEALTH INTERNATIONAL SERIES TRUST
Commonwealth Real Estate Securities Fund
Performance Overview
The Commonwealth Real Estate Securities Fund’s NAV as of October 31, 2006, was $14.06 per share compared to $11.85 per share on October 31, 2005. On December 29, 2005, the Real Estate Securities Fund made distributions of $0.11 per share. For the twelve months under review, Commonwealth Real Estate Securities Fund posted a 19.7% cumulative total return, assuming reinvestment of gross distributions. The Fund underperformed its benchmark, the Morgan Stanley Capital International (MSCI) US REIT Index5, which posted a 37.8% total return for the same period. We do not attempt to track any index, but rather undertake investments on the basis of fundamental research. We also invest a portion of the Fund’s assets in fixed income investments. The Fund’s total return is presented net of Fund expenses, which means the Fund’s performance is reduced by applicable Fund fees and expenses whereas the index returns do not include any such fees. Performance data represents past performance, and does not guarantee future results. Investment return and principal value will fluctuate, and your investment may result in a gain or loss when you sell your shares. An investor should consider the Fund’s investment objectives, risks, charges and expenses carefully before investing. This and other important information about the Fund can be found in the Fund’s Prospectus.
The Fund’s underperformance of the MSCI US REIT Index may be in part explained by our strategy of investing in REIT’s (40.4%) as well as fixed income and real estate-related securities, as REIT’s outperformed the aforementioned during the period. REIT Indices such as the MSCI US REIT Index, which is comprised of only equity REIT’s, continued their outperformance of the broader market indices. In addition, the Fund continued to build and diversify its portfolio during the period and at times held cash and equivalents until investment opportunities arose.
| |
PORTFOLIO ALLOCATION (As of 10/31/06)* (unaudited) |
| Asset Allocation* | % of Total Value |
| U.S. REITS | 40.4% |
| International | 18.9% |
| Bonds, Pfd. Stock & Short-Term Investments | 15.1% |
| U.S. Other Real Estate | 12.0% |
| Closed End Funds | 8.6% |
| Exchange Traded Funds | 5.0% |
*Percentages are based on total market value of investment securities.
COMMONWEALTH INTERNATIONAL SERIES TRUST
Economic and Market Overview
REIT’s continued their impressive performance for the seventh consecutive year outpacing the broader market indices. Against a back drop of relatively low real interest rates, strong demand, a resilient consumer and healthy economic growth, REIT indices such as the MSCI US REIT Index posted returns of almost 37.7% for the period ended October 31, 2006. Given this and improving fundaments for most REIT sectors, REIT Mutual Funds once again witnessed strong inflows of capital after dropping in 2005. As of October, approximately $3.9 billion of capital flowed into REIT Funds, up from $2.0 billion in 2005.
Backed by strong demand and limited supply, most REIT’s saw increasing rents and occupancy levels, the share prices of Office, Hotel and Industrial REIT’s increased to all time highs. At the same time, the downturn in the residential (homebuilding) sector has improved the performance of residential REIT’s such as apartment REITS as limited supply and condo conversions have allowed apartments to realize higher occupancies and rents. The sector has also benefited from higher interest rates and the reduced affordability of single family homes.
Through the first half of 2006, more than $35 billion in REIT mergers, acquisitions and privatization deals have been finalized. REIT’s valuations have been justified by the large pools of investment cash from private equity investors. The year has seen several REIT’s either acquired or taken private, such as Brookfield Properties and Blackstone Group’s acquisition of Trizec Properties in June. More deals are in the works which may be supporting REIT’s share values.
In June of 2006, the Federal Reserve raised interest rates to 5.25% for the seventeenth consecutive time dating back to 2004. The Fed has since paused raising rates and we believe is one of the contributing factors that has caused the yield on the Ten Year Treasury to decline. Given the strong price outperformance of REIT shares, they now yield around an average 4.25%, less than the approximate 4.6% yield of the ten year U.S. Treasury, which may be an indication of overvaluations.
| 5. | The MSCI US REIT Index is a free float-adjusted market capitalization weighted index that is comprised of equity REITs that are included in the MSCI US Investable Market 2500 Index, with the exception of specialty equity REITs that do not generate a majority of their revenue and income from real estate rental and leasing operations. The index represents approximately 85% of the US REIT universe. Index returns assume reinvestment of dividends and, unlike Fund returns, do not reflect any fees or expenses. It is not possible to invest directly into an index. MSCI started calculating and maintaining the MSCI US REIT Index on June 20, 2005. Prior to this date the MSCI US REIT Index (then known as the Morgan Stanley REIT Index) was calculated and maintained by the AMEX. |
Management Review
In the following interview, the Funds’ Senior Portfolio Manager Robert W. Scharar discusses the Commonwealth International Series Trust’s operations, strategy and the market environment during the twelve-month period ended October 31, 2006.
Who is the advisor?
The Funds’ investment advisor is FCA Corp (“FCA”). FCA is a registered investment advisor located at 5847 San Felipe, Suite 850, Houston, Texas 77057. FCA and its predecessors have been in business since 1975.
COMMONWEALTH INTERNATIONAL SERIES TRUST
Who is the underwriter?
The principal underwriter of the Funds is Matrix Capital Group, Inc., 335 Madison Avenue, 11th Floor, New York, NY 10017.
Why do our Funds include shares of foreign companies?
We invest in companies outside the United States because we believe that there are significant investment opportunities in select foreign markets. We also believe that U.S. investors benefit from the diversification that investments outside the United States can provide. For a U.S. investor, allocation of a portion of the investor’s portfolio to international securities can provide the potential to diminish risk and achieve more consistent long-term performance in the investor’s overall portfolio. International investing also offers exposure to many leading companies and fast growing national economies.
What are some of the factors influencing a Fund’s portfolio turnover?
Each Fund generally invests in equity securities with the view to hold them long-term. The portfolio’s securities are evaluated on their long-term prospects. A particular Fund may experience higher or lower turnover ratios in certain years. Factors influencing portfolio turnover include, but are not limited to the following: rebalancing portfolio securities to take advantage of long-term opportunities and/or to reallocate between fixed income and equity securities; investing new Fund subscriptions; or selling securities to cover Fund redemptions. Higher levels of portfolio activity by a Fund may result in higher transaction costs and/or more realized gains or losses, the impact of which is borne by the Fund’s shareholders.
How can the size of the Fund impact the Funds’ expense ratio?
The operating expense ratios of mutual funds that invest overseas can be expected to be higher than those of mutual funds investing exclusively in securities of United States issuers, since certain costs (such as custodial, valuation, brokerage and communications) are higher when investing abroad. As with every mutual fund, size has an impact on the expense ratio. Typically, larger funds can have lower expense ratios as there is an increased opportunity to spread out fixed and semi-fixed costs necessary to operate the fund among a greater number of shareholders. Such fund expenses are allocated on a daily basis among all its shareholders. This is evidenced by the Commonwealth’s own Australia/New Zealand Fund which grew from assets of $4.53 million and an expense ratio of 5.74% on 10/31/01 to assets of $35.09 million and an expense ratio of 2.94% on 10/31/06.
Other Matters
The Commonwealth Funds, as previously disclosed in the Funds’ 2005 Annual Report and 2006 Semi- Annual Report to its shareholders filed with the SEC, were the subject of an investigation by the staff of the SEC concerning the Funds’ policies, procedures and disclosures relating to market timing transactions in the Australia/New Zealand and Japan Funds by certain investors, and use of the Funds’ borrowing authority to meet large redemption requests. There has been no allegation that anyone at FCA (the “Advisor”) or the Funds entered into any agreements or arrangements with market timers to permit market timing transactions in violation of Funds’ policies, or engaged in any deceptive practices to circumvent Fund policies.
As previously noted in the Funds’ 2006 Semi-annual Report, the SEC staff determined not to recommend that the SEC bring any enforcement action against the Funds or the Funds’ Trustees. Further, the staff also determined that it would not recommend any enforcement action against the Advisor and Mr. Robert W. Scharar, an interested Trustee and President of the Funds and President of the Advisor, relating to the adequacy of the Funds’ prospectus disclosure regarding the volume of, and the Funds’ policies governing, frequent short-term transactions in the Funds. However, the staff indicated that it was prepared to recommend an administrative proceeding against the Advisor and Mr. Scharar arising from the use of the Funds’ line of credit in excess of the Funds’ borrowing limitations set forth in the Funds’ prospectus.
COMMONWEALTH INTERNATIONAL SERIES TRUST
The Advisor and Mr. Scharar, without admitting or denying any of the SEC’s findings, reached a settlement with the SEC to resolve this matter without further litigation. Under the terms of the settlement, the SEC issued an administrative order dated November 29, 2006 sanctioning Mr. Scharar and the Advisor for violations of Sections 13(a)(2) and 34(b) of the Act through a censure, a civil monetary penalty of $25,000 each, and an order that they cease and desist future violations of these provisions. The order acknowledges that Mr. Scharar and FCA cooperated with the SEC staff in its investigation and took remedial steps by, among other things, making a payment, with interest, to the Australia/New Zealand Fund and the Japan Fund of certain amounts of interest incurred by those Funds on the amounts borrowed in excess of borrowing limitations. The payments made amounted to $6,148 and $13,753 for the Australia/New Zealand Fund and the Japan Fund, respectively. These amounts are reflected as expense reimbursement by advisor in the Statement of Operations. A portion of the initial payment made to the Japan Fund was deposited into the custody account of the Australia/New Zealand Fund and the Japan Fund in error. Accordingly, the Japan Fund has a receivable as of October 31, 2006 in the amount of $6,344 and the Australia/New Zealand Fund has a corresponding payable due from the Japan Fund in the same amount. Mr. Scharar will remain an officer and trustee of the Funds and FCA will remain the Funds -Advisor. In his capacity as the Funds President and Trustee, Mr. Scharar requested, during the year ended -October 31, 2006, that the Trust indemnify him for legal fees and expenses associated with his defense of this matter. On December 19, 2006, the Independent Trustees after considering all relevant facts and materials, including the opinion of Fund Counsel, has approved reimbursement of a portion of such legal fees and expenses excluding the fines, as well as the allocation of this indemnity cost to each of the funds based upon their relative average daily net assets.
Expenses incurred by the Funds in connection with this investigation impacted the net assets of the Funds and impacted each Fund’s NAV and the value of the investment made by each of the Funds’ shareholders.
In Closing: As we look forward to starting our fifteenth year as the Advisor to the Commonwealth Funds, we would like to take this opportunity to thank you for your support and continued interest in our Family of Funds. If you have any questions, please feel free to contact us.
| | |
| Robert W. Scharar | Wesley R. Yuhnke | Carlos Rubio |
| President and Portfolio Manager | Assistant Portfolio Manager | Assistant Portfolio Manager |
| Commonwealth International Series | Commonwealth International Series | Commonwealth International Series |
This report is intended for the shareholders of the family of funds of the Commonwealth International Series Trust. It may not be distributed to prospective investors unless it is preceded or accompanied by the current Funds’ Prospectus which may be obtained at www.commonwealthfunds.com or from the principal underwriter of the Funds or your broker.
We advise you to consider each Fund’s objectives, risks, charges and expenses carefully before investing in that Fund. The Prospectus contains information about those and other important matters relating to the Funds. Please read the Prospectus carefully before you invest.
COMMONWEALTH INTERNATIONAL SERIES TRUST
INFORMATION ABOUT YOUR FUNDS’ EXPENSES
As a shareholder of the Funds, you incur ongoing costs, including management fees; distribution; and other Fund expenses. This example is intended to help you understand your ongoing costs (in dollars) of investing in the Funds and to compare these costs with the ongoing costs of investing in other mutual funds.
The Example is based on an investment of $1,000 invested at the beginning of the period and held for the entire period from May 1, 2006 through October 31, 2006.
Actual Expenses
The table below provides information about actual account values and actual expenses. You may use the information below, together with the amount you invested, to estimate the expenses that you paid over the period. Simply divide your account value by $1,000 (for example, an $8,600 account value divided by $1,000 = 8.6), then multiply the result by the number in the table under the heading entitled "Expenses Paid During Period" to estimate the expenses you paid on your account during this period.
| | | Beginning | | End | | Expense Paid | | Expense Ratio | |
| | | Account Value | | Account Value | | During Period* | | Expenses Paid | |
| | | 05/01/06 | | 10/31/06 | | 5/1/06 - 10/31/06 | | 5/1/06 - 10/31/06 | |
| Australia/New Zealand Fund | | $ | 1,000.00 | | $ | 1,065.40 | | $ | 18.22 | | | 3.50 | % |
| Japan Fund | | $ | 1,000.00 | | | 909.70 | | | 18.19 | | | 3.78 | % |
| Global Fund | | $ | 1,000.00 | | | 1,007.70 | | | 15.84 | | | 3.13 | % |
| Real Estate Securities Fund | | $ | 1,000.00 | | | 1,066.00 | | | 17.34 | | | 3.33 | % |
* Expenses are equal to the average account value times the Fund’s annualized expense ratio multiplied by the number of days in the most recent fiscal half-year divided by the number of days in the fiscal year.
Hypothetical Example for Comparison Purposes
The table below provides information about hypothetical account values and hypothetical expenses based on each Fund’s expense ratio and an assumed rate of return of 5% per year before expenses, which is not the Fund’s actual return. The hypothetical account values and expenses may not be used to estimate the actual ending account balance or expenses you paid for the period. You may use this information to compare this 5% hypothetical example with the 5% hypothetical examples that appear in the shareholder reports of other funds.
| | | Beginning | | End | | Expense Paid | | Expense Ratio | |
| | | Account Value | | Account Value | | During Period* | | Expenses Paid | |
| | | 05/01/06 | | 10/31/06 | | 5/1/06 - 10/31/06 | | 5/1/06 - 10/31/06 | |
| Australia/New Zealand Fund | | $ | 1,000.00 | | $ | 1,007.56 | | $ | 17.71 | | | 3.50 | % |
| Japan Fund | | $ | 1,000.00 | | | 1,006.15 | | | 19.11 | | | 3.78 | % |
| Global Fund | | $ | 1,000.00 | | | 1,009.43 | | | 15.85 | | | 3.13 | % |
| Real Estate Securities Fund | | $ | 1,000.00 | | | 1,008.42 | | | 16.86 | | | 3.33 | % |
* Expenses are equal to the average account value times the Fund’s annualized expense ratio multiplied by the number of days in the most recent fiscal half-year divided by the number of days in the fiscal year.
COMMONWEALTH INTERNATIONAL SERIES TRUST
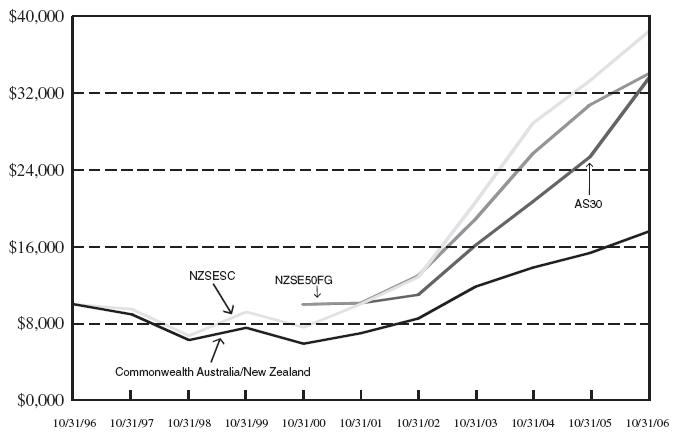
Comparison of Change in Value of a $10,000 Investment in Commonwealth Australia/New Zealand Fund* and the NZSCI**, NZSE50FG*** and AS30**** Indices
PAST PERFORMANCE IS NOT INDICATIVE OF FUTURE RESULTS. The investment return and principal value of an investment will fluctuate so that an investor’s shares, when redeemed, may be worth more or less than their original cost. The graph and the average annual total returns do not reflect the deduction of taxes that a shareholder would pay on Fund distributions and the redemption of Fund shares. Otherwise, returns would have been lower. You should carefully consider the investment objectives, risks, charges and expenses of the Funds before investing. This and other information can be found in the Funds’ prospectus, which can be obtained from www.commonwealthfunds.com, by calling the Funds’ directly at 888-345-1898 or by contacting your investment - representative. Please read it carefully before you invest or send money.
COMMONWEALTH INTERNATIONAL SERIES TRUST
| | | Average Annual Total Return | |
| | | as of October 31, 2006 | |
| | | 1 Year | | 5 Year | | 10 Year | |
| Commonwealth Australia/New Zealand Fund | | | 14.58 | % | | 20.24 | % | | 5.81 | % |
| New Zealand Small Companies Index | | | 15.12 | % | | 30.73 | % | | 14.38 | % |
| New Zealand Limited 50 Free Float Total Return Index | | | 10.21 | % | | 27.28 | % | | — | |
| Australian All Ordinaries Index | | | 32.62 | % | | 27.14 | % | | — | |
| * | The Fund’s performance assumes the reinvestment of all income dividends and capital gains distributions, if any. |
| ** | New Zealand Small Companies Index is capitalization-weighted index of all New Zealand equities excluding those on the New Zealand Stock Exchange 40 Index. It is not possible to invest directly into an index. |
| *** | The New Zealand Exchange Limited 50 Free Float Total Return Index is a modified market capitalization weighted index. This index consists of the top 50 companies by free float adjusted market capitalization that are listed on the New Zealand Exchange Limited. Index returns assume reinvestment of dividends and, unlike Fund returns, do not reflect any fees or expenses. It is not possible to invest directly into an index. |
| **** | The Australian All Ordinaries Index is a cap-weighted index. The index is made up of the largest 500 companies as measured by market cap that are listed on the Australian Stock Exchange. The index was developed with a base value of 500 as of 1979. Index returns assume reinvestment of dividends and, unlike Fund returns, do not reflect any fees or expenses. It is not possible to invest directly into an index. |
COMMONWEALTH INTERNATIONAL SERIES TRUST
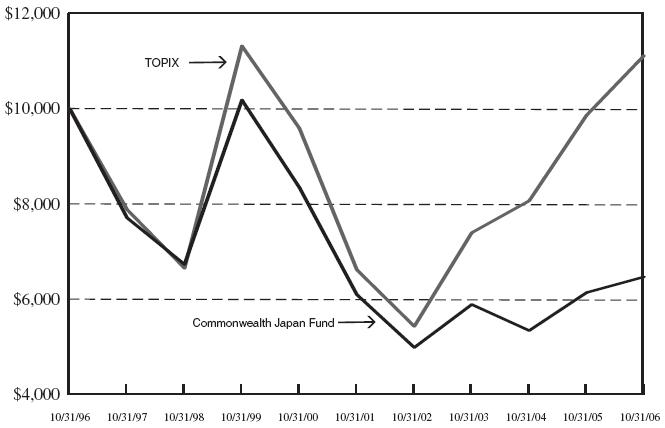
Comparison of Change in Value of a $10,000 Investment in Commonwealth Japan Fund* and the TOPIX**
PAST PERFORMANCE IS NOT INDICATIVE OF FUTURE RESULTS. The investment return and principal value of an investment will fluctuate so that an investor’s shares, when redeemed, may be worth more or less than their original cost. The graph and the average annual total returns do not reflect the deduction of taxes that a shareholder would pay on Fund distributions and the redemption of Fund shares. Otherwise, returns would have been lower. You should carefully consider the investment objectives, risks, charges and expenses of the Funds before investing. This and other information can be found in the Funds’ prospectus, which can be obtained from www.commonwealthfunds.com, by calling the Funds directly at 888-345-1898 or by contacting your investment representative. Please read it carefully before you invest or send money.
| | | Average Annual Total Return | |
| | | as of October 31, 2006 | |
| | | 1 Year | | 5 Year | | 10 Year | |
| Commonwealth Japan Fund | | | 5.60 | % | | 1.24 | % | | (4.24 | )% |
| TOPIX | | | 12.70 | % | | 10.93 | % | | 1.06 | % |
| * | The Fund’s performance assumes the reinvestment of all income dividends and capital gains distributions, if any. |
| ** | The TOPIX, also known as the Tokyo Stock Price Index, is a capitalization-weighted index of all the companies listed on the First Section of the Tokyo Stock Exchange. The index calculation excludes temporary issues and preferred stocks, and has a base value of 100 as of 1/04/68. Index returns assume reinvestment of dividends and, unlike Fund returns, do not reflect any fees or expenses. It is not possible to invest directly into an index. |
COMMONWEALTH INTERNATIONAL SERIES TRUST
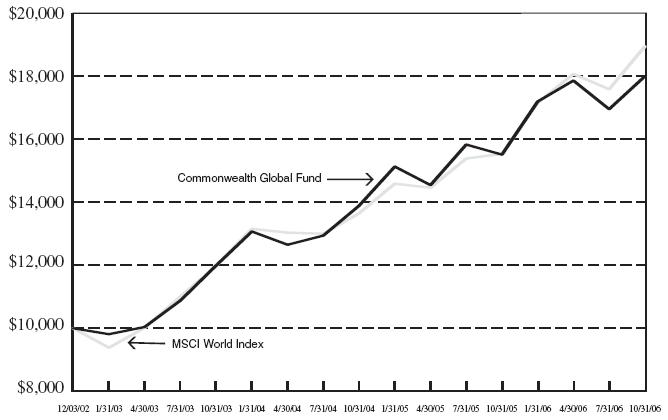
Comparison of Change in Value of a $10,000 Investment in Commonwealth Global Fund* ** and the MSCI World Index***
PAST PERFORMANCE IS NOT INDICATIVE OF FUTURE RESULTS. The investment return and principal value of an investment will fluctuate so that an investor’s shares, when redeemed, may be worth more or less than their original cost. The graph and the average annual total returns do not reflect the deduction of taxes that a shareholder would pay on Fund distributions and the redemption of Fund shares. Otherwise, returns would have been lower. You should carefully consider the investment objectives, risks, charges and expenses of the Funds before investing. This and other information can be found in the Funds’ prospectus, which can be obtained from www.commonwealthfunds.com, by calling the Funds directly at 888-345-1898 or by contacting your investment representative. Please read it carefully before you invest or send money.
| | | Annual Total Return | |
| | | as of October 31, 2006 | |
| | | 1 Year | | Inception* | |
| Commonwealth Global Fund | | | 16.04 | % | | 16.22 | % |
| MSCI World Index | | | 21.97 | % | | 17.75 | % |
| * | The Commonwealth Global Fund commenced operations on December 3, 2002. |
| ** | The Fund’s performance assumes the reinvestment of all income dividends and capital gains distributions, if any. |
| *** | The MSCI World Index is a free float-adjusted market capitalization index that is designed to measure global developed market equity performance. As of May 2005 the MSCI World Index consisted of the following 23 developed market country indices: Australia, Austria, Belgium, Canada, Denmark, Finland, France, Germany, Greece, Hong Kong, Ireland, Italy, Japan, Netherlands, New Zealand, Norway, Portugal, Singapore, Spain, Sweden, Switzerland, the United Kingdom and the United States. Index returns assume reinvestment of dividends and, unlike Fund returns, do not reflect any fees or expenses. It is not possible to invest directly into an index. |
COMMONWEALTH INTERNATIONAL SERIES TRUST
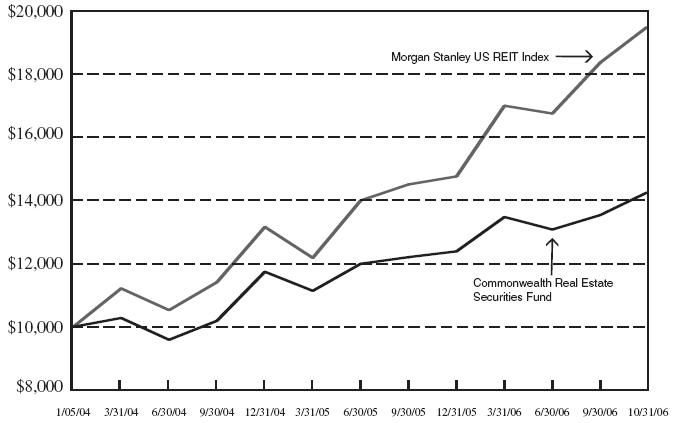
Comparison of Change in Value of a $10,000 Investment in Commonwealth Real Estate Securities Fund* ** and the MSCI US REIT Index***.
PAST PERFORMANCE IS NOT INDICATIVE OF FUTURE RESULTS. The investment return and principal value of an investment will fluctuate so that an investor’s shares, when redeemed, may be worth more or less than their original cost. The graph and the average annual total returns do not reflect the deduction of taxes that a shareholder would pay on Fund distributions and the redemption of Fund shares. Otherwise, returns would have been lower. You should carefully consider the investment objectives, risks, charges and expenses of the Funds before investing. This and other information can be found in the Funds’ prospectus, which can be obtained from www.commonwealthfunds.com, by calling the Funds directly at 888-345-1898 or by contacting your investment representative. Please read it carefully before you invest or send money.
| | | Annual Total Return | |
| | | as of October 31, 2006 | |
| | | 1 Year | | Inception* | |
| Commonwealth Real Estate Securities Fund | | | 19.74 | % | | 13.44 | % |
| Morgan Stanley US REIT Index | | | 37.77 | % | | 26.71 | % |
| * | Real Estate Securities Fund commenced operations on January 5, 2004. |
| ** | The Fund’s performance assumes the reinvestment of all income dividends and capital gains distributions, if any. All market indices are unmanaged, do not incur fees and it is not possible to invest directly in any index. |
| *** | The MSCI US REIT Index is a free float-adjusted market capitalization weighted index that is comprised of equity REITs that are included in the MSCI US Investable Market 2500 Index, with the exception of specialty equity REITs that do not generate a majority of their revenue and income from real estate rental and leasing operations. The index represents approximately 85% of the US REIT universe. Index returns assume reinvestment of dividends and, unlike Fund returns, do not reflect any fees or expenses. It is not possible to invest directly into an index. MSCI started calculating and maintaining the MSCI US REIT Index on June 20, 2005. Prior to this date the MSCI US REIT Index (then known as the Morgan Stanley REIT Index) was calculated and maintained by the AMEX. |
COMMONWEALTH INTERNATIONAL SERIES TRUST
COMMONWEALTH AUSTRALIA/NEW ZEALAND FUND
SCHEDULE OF INVESTMENTS - OCTOBER 31, 2006
| | | Shares | | Value | |
AUSTRALIA (27.08%) | | | | | |
COMMON STOCK (19.41%) | | | | | |
| | | | | | |
APPAREL (0.93%) | | | | | |
| Billabong International, Ltd. | | | 27,000 | | $ | 327,924 | |
| | | | | | | | |
BUILDING MATERIALS (1.68%) | | | | | | | |
| James Hardie Industries NV - ADR | | | 5,200 | | | 158,652 | |
| Rinker Group, Ltd. | | | 30,000 | | | 429,225 | |
| | | | | | | 587,877 | |
CHEMICALS (0.43%) | | | | | | | |
| Nufarm, Ltd. | | | 20,000 | | | 151,871 | |
| | | | | | | | |
COMMERCIAL SERVICES (0.83%) | | | | | | | |
| Brambles Industries, Ltd. | | | 30,000 | | | 290,162 | |
| | | | | | | | |
E-COMMERCE/SERVICES (0.39%) | | | | | | | |
| Webjet, Ltd. * | | | 440,000 | | | 136,934 | |
| | | | | | | | |
FOOD & BEVERAGES (2.81%) | | | | | | | |
| Burns Philp & Co., Ltd. * | | | 500,000 | | | 424,384 | |
| Goodman Fielder, Ltd. | | | 150,000 | | | 241,621 | |
| Woolworths, Ltd. | | | 20,000 | | | 320,299 | |
| | | | | | | 986,304 | |
HEALTHCARE (0.73%) | | | | | | | |
| Sonic Healthcare, Ltd. | | | 25,000 | | | 254,443 | |
COMMONWEALTH INTERNATIONAL SERIES TRUST
COMMONWEALTH AUSTRALIA/NEW ZEALAND FUND
SCHEDULE OF INVESTMENTS - OCTOBER 31, 2006
| | | Shares | | Value | |
HOUSEHOLD PRODUCTS (0.59%) | | | | | |
| Corporate Express Australia, Ltd. | | | 50,000 | | $ | 207,740 | |
| | | | | | | | |
INSURANCE (1.63%) | | | | | | | |
| QBE Insurance Group, Ltd. | | | 30,000 | | | 573,269 | |
| | | | | | | | |
MINING (4.60%) | | | | | | | |
| Jubilee Mines NL | | | 75,000 | | | 756,679 | |
| Oxiana, Ltd. | | | 240,000 | | | 621,242 | |
| Pan Australian Resources, Ltd. * | | | 900,000 | | | 235,210 | |
| | | | | | | 1,613,131 | |
| | | | | | | | |
OIL & GAS (1.79%) | | | | | | | |
| Alinta, Ltd. | | | 6,930 | | | 56,882 | |
| Origin Energy, Ltd. | | | 102,702 | | | 570,181 | |
| | | | | | | 627,063 | |
| | | | | | | | |
RETAIL (1.43%) | | | | | | | |
| Just Group, Ltd. | | | 165,000 | | | 501,567 | |
| | | | | | | | |
TRANSPORTATION (1.16%) | | | | | | | |
| Toll Holdings, Ltd. | | | 34,000 | | | 407,018 | |
| | | | | | | | |
UTILITIES (0.41%) | | | | | | | |
| AGL Energy, Ltd. * | | | 12,000 | | | 142,636 | |
| | | | | | | | |
| | | | | | | | |
TOTAL COMMON STOCK (Cost $4,142,186) | | | | | | 6,807,939 | |
COMMONWEALTH INTERNATIONAL SERIES TRUST
COMMONWEALTH AUSTRALIA/NEW ZEALAND FUND
SCHEDULE OF INVESTMENTS - OCTOBER 31, 2006
| | | Principal | | Value | |
BONDS (7.67%) | | | | | |
| Australia Government Bond, 6.75%, due 11/15/06 † | | | 1,000,000 | | $ | 775,254 | |
| CBA Capital Australia, Ltd., 7.71%, due 04/15/15 # | | | 300,000 | | | 205,774 | |
| Citigroup, Inc., 5.75%, due 02/23/07 † | | | 500,000 | | | 386,246 | |
| Commonwealth Bank of Australia, 8.50%, due 06/01/10 | | | 300,000 | | | 332,180 | |
| Hanson Australia Funding, Ltd., 5.25%, due 03/15/13 | | | 250,000 | | | 243,616 | |
| Queensland Treasury Corp., 8.00%, due 09/14/07 † | | | 431,000 | | | 338,472 | |
| Telstra Corp., Ltd., 6.375%, due 04/01/12 | | | 400,000 | | | 410,843 | |
TOTAL BONDS (Cost $2,700,823) | | | | | | 2,692,385 | |
TOTAL AUSTRALIA (Cost $6,843,009) | | | | | | 9,500,324 | |
| | | Shares | | | |
| | | | | | |
NEW ZEALAND (70.84%) | | | | | |
COMMON STOCK (42.05%) | | | | | |
| | | | | | |
AGRICULTURE (3.01%) | | | | | |
| Allied Farmers, Ltd. | | | 372,786 | | | 539,040 | |
| PGG Wrightson, Ltd. | | | 457,263 | | | 517,143 | |
| | | | | | | 1,056,183 | |
| | | | | | | | |
AIRLINES (0.42%) | | | | | | | |
| Air New Zealand, Ltd. | | | 150,000 | | | 146,554 | |
| | | | | | | | |
APPLIANCES (2.71%) | | | | | | | |
| Fisher & Paykel Appliances Holdings, Ltd. | | | 250,000 | | | 635,743 | |
| Scott Technology, Ltd. * | | | 195,245 | | | 313,995 | |
| | | | | | | 949,738 | |
| | | | | | | | |
CHEMICALS (2.13%) | | | | | | | |
| Nuplex Industries, Ltd. | | | 166,355 | | | 746,452 | |
COMMONWEALTH INTERNATIONAL SERIES TRUST
COMMONWEALTH AUSTRALIA/NEW ZEALAND FUND
SCHEDULE OF INVESTMENTS - OCTOBER 31, 2006
| | | Shares | | Value | |
COMMERCIAL SERVICES (3.30%) | | | | | |
| Mowbray Collectables, Ltd. | | | 511,593 | | $ | 531,160 | |
| Taylors Group, Ltd. | | | 519,431 | | | 626,421 | |
| | | | | | | 1,157,581 | |
| | | | | | | | |
FINANCIAL SERVICES (2.44%) | | | | | | | |
| Canterbury Building Society | | | 251,354 | | | 673,465 | |
| Loan & Building Society | | | 63,333 | | | 184,539 | |
| | | | | | | 858,004 | |
| | | | | | | | |
HEALTHCARE (6.18%) | | | | | | | |
| Fisher & Paykel Healthcare Corp. | | | 263,195 | | | 736,343 | |
| Ryman Healthcare, Ltd. | | | 164,485 | | | 946,849 | |
| Wakefield Health, Ltd. | | | 100,532 | | | 484,721 | |
| | | | | | | 2,167,913 | |
| | | | | | | | |
HUMAN RESOURCES (0.41%) | | | | | | | |
| Allied Work Force Group, Ltd. | | | 127,500 | | | 142,710 | |
| | | | | | | | |
METAL FABRICATION/HARDWARE (2.88%) | | | | | | | |
| Methven, Ltd. | | | 450,000 | | | 569,998 | |
| Steel & Tube Holdings, Ltd. | | | 140,000 | | | 440,959 | |
| | | | | | | 1,010,957 | |
MISCELLANEOUS MANUFACTURING (0.93%) | | | | | | | |
| Skellerup Holdings, Ltd. | | | 300,000 | | | 325,481 | |
| | | | | | | | |
MULTIMEDIA (2.06%) | | | | | | | |
| Sky Network Television, Ltd. | | | 189,745 | | | 721,524 | |
| | | | | | | | |
COMMONWEALTH INTERNATIONAL SERIES TRUST
COMMONWEALTH AUSTRALIA/NEW ZEALAND FUND
SCHEDULE OF INVESTMENTS - OCTOBER 31, 2006
| | | Shares | | Value | |
PORTS (5.59%) | | | | | |
| Port of Tauranga, Ltd. | | | 175,000 | | $ | 726,644 | |
| South Port of New Zealand, Ltd. | | | 1,027,930 | | | 1,234,012 | |
| | | | | | | 1,960,656 | |
| | | | | | | | |
REAL ESTATE (4.93%) | | | | | | | |
| AMP NZ Office Trust | | | 400,000 | | | 308,098 | |
| Calan Healthcare Properties Trust | | | 901,813 | | | 797,974 | |
| ING Property Trust | | | 758,633 | | | 624,936 | |
| | | | | | | 1,731,008 | |
| | | | | | | | |
RETAIL (0.92%) | | | | | | | |
| Pumpkin Patch, Ltd. | | | 50,000 | | | 133,864 | |
| Restaurant Brands New Zealand, Ltd. | | | 302,000 | | | 190,012 | |
| | | | | | | 323,876 | |
| | | | | | | | |
TELECOMMUNICATIONS (1.34%) | | | | | | | |
| Team Talk, Ltd. | | | 300,000 | | | 471,190 | |
| | | | | | | | |
TRANSPORTATION (0.37%) | | | | | | | |
| Toll NZ, Ltd. * | | | 70,000 | | | 131,663 | |
| | | | | | | | |
UTILITIES (2.43%) | | | | | | | |
| Infratil, Ltd. | | | 277,729 | | | 854,283 | |
| | | | | | | | |
TOTAL COMMON STOCK (Cost $10,559,546) | | | | | | 14,755,773 | |
COMMONWEALTH INTERNATIONAL SERIES TRUST
COMMONWEALTH AUSTRALIA/NEW ZEALAND FUND
SCHEDULE OF INVESTMENTS - OCTOBER 31, 2006
| | | Shares | | Value | |
PREFERRED STOCK (0.99%) | | | | | |
BANKS (0.99%) | | | | | |
| ASB Capital, Ltd. | | | 500,000 | | $ | 348,215 | |
| | | | | | | | |
TOTAL PREFERRED STOCK (Cost $364,406) | | | | | | 348,215 | |
| | | �� | | | | | |
INVESTMENT COMPANIES (6.25%) | | | | | | | |
| AMP Investments' World Index Fund * | | | 791,119 | | | 778,136 | |
| New Zealand Investment Trust Plc | | | 220,169 | | | 1,413,645 | |
TOTAL INVESTMENT COMPANIES (Cost $1,482,066) | | | | | | 2,191,781 | |
| | | Principal | | | |
| | | | | | |
BONDS (21.46%) | | | | | |
| ANZ National Bank, Ltd., 7.04%, due 07/23/12 # | | | 1,000,000 | | | 678,478 | |
| ANZ National Bank, Ltd., 3.75%, due 01/05/09 | | | 300,000 | | | 292,095 | |
| Fletcher Building Finance, Ltd., 8.60%, due 03/15/08 # | | | 775,000 | | | 528,364 | |
| Fonterra Cooperative Group, Ltd., Perpetual Variable Rate Notes, 7.75% # ** | | | 90,000 | | | 66,314 | |
| Generator Bonds, Ltd., 8.00%, due 08/20/08 # | | | 270,000 | | | 183,768 | |
Global Corporate Credit, Ltd. Credit Linked Notes, 7.20%, due 12/30/08 # | | | 1,138,000 | | | 754,652 | |
Global Corporate Credit, Ltd. Credit Linked Notes, 8.25%, due 12/30/08 # | | | 1,126,000 | | | 748,957 | |
Global Equity Market Securities, Ltd., zero coupon, due 01/18/08 # | | | 3,350,000 | | | 3,051,778 | |
| GPG Finance Plc, 8.70%, due 12/15/08 # | | | 1,500,000 | | | 1,026,157 | |
| Housing Corp. of New Zealand, 8.00%, due 11/15/06 # | | | 300,000 | | | 201,137 | |
TOTAL BONDS (Cost $6,226,591) | | | | | | 7,531,700 | |
COMMONWEALTH INTERNATIONAL SERIES TRUST
COMMONWEALTH AUSTRALIA/NEW ZEALAND FUND
SCHEDULE OF INVESTMENTS - OCTOBER 31, 2006
| | | Principal | | Value | |
SHORT TERM INVESTMENTS (0.09%) | | | | | |
| Forsyth Barr Money Market, 6.75%# (Cost $34,163) | | | 49,745 | | $ | 33,321 | |
| | | | | | | | |
TOTAL NEW ZEALAND (Cost $18,666,772) | | | | | | 24,860,790 | |
TOTAL INVESTMENTS (Cost $25,509,781) (97.92%) | | | | | | 34,361,114 | |
ASSETS IN EXCESS OF OTHER LIABILITIES (2.08%) | | | | | | 730,118 | |
NET ASSETS (100%) | | | | | | 35,091,232 | |
| * | Non-income producing investment. |
| ** | Rate shown represents the rate at October 31, 2006, is subject to change and resets annually. |
| † | Principal amount shown is in Australian Dollars; Value shown is in U.S. Dollars. |
| # | Principal amount shown is in New Zealand Dollars; Value shown is in U.S. Dollars. |
| ADR | American Depositary Receipt |
The accompanying notes are an integral part of these financial statements.
COMMONWEALTH INTERNATIONAL SERIES TRUST
COMMONWEALTH JAPAN FUND
SCHEDULE OF INVESTMENTS - OCTOBER 31, 2006
| | | Shares | | Value | |
COMMON STOCK (89.73%) | | | | | |
| | | | | | |
AUTOMOBILE MANUFACTURERS (1.42%) | | | | | |
| Toyota Motor Corp. - ADR | | | 1,000 | | $ | 118,000 | |
| | | | | | | | |
AUTOMOBILE PARTS & EQUIPMENT (5.25%) | | | | | | | |
| Denso Corp. | | | 3,000 | | | 114,403 | |
| NGK Spark Plug Co., Ltd. | | | 6,000 | | | 126,459 | |
| Sumitomo Rubber Industries, Inc. | | | 10,000 | | �� | 114,830 | |
| Tokai Rika Co., Ltd. | | | 4,000 | | | 80,031 | |
| | | | | | | 435,723 | |
| | | | | | | | |
BANKS (5.67%) | | | | | | | |
| Bank of Fukuoka, Ltd. | | | 10,000 | | | 79,860 | |
| Mitsubishi UFJ Financial Group, Inc. - ADR | | | 10,000 | | | 127,500 | |
| Sumitomo Mitsui Financial Group, Inc. | | | 24 | | | 262,665 | |
| | | | | | | 470,025 | |
| | | | | | | | |
BUILDING MATERIALS (1.94%) | | | | | | | |
| Taiheiyo Cement Corp. | | | 40,000 | | | 160,746 | |
| | | | | | | | |
CHEMICALS (1.82%) | | | | | | | |
| JSR Corp. | | | 6,000 | | | 150,827 | |
| | | | | | | | |
COMMERCIAL SERVICES (0.65%) | | | | | | | |
| Shinwa Art Auction Co., Ltd. | | | 21 | | | 53,687 | |
| | | | | | | | |
COMPUTERS (3.02%) | | | | | | | |
| Melco Holdings, Inc. | | | 4,500 | | | 132,743 | |
| TDK Corp. - ADR | | | 1,500 | | | 117,300 | |
| | | | | | | 250,043 | |
COMMONWEALTH INTERNATIONAL SERIES TRUST
COMMONWEALTH JAPAN FUND
SCHEDULE OF INVESTMENTS - OCTOBER 31, 2006
| | | Shares | | Value | |
DISTRIBUTION/WHOLESALE (1.85%) | | | | | |
| Marubeni Corp. | | | 30,000 | | $ | 153,649 | |
| | | | | | | | |
ELECTRONICS (7.39%) | | | | | | | |
| Fanuc, Ltd. | | | 1,500 | | | 130,178 | |
| Fujitsu, Ltd. | | | 10,000 | | | 81,570 | |
| Hoya Corp. | | | 4,000 | | | 154,589 | |
| Taiyo Yuden Co., Ltd. | | | 10,000 | | | 154,076 | |
| TOYO Corp. | | | 8,000 | | | 92,618 | |
| | | | | | | 613,031 | |
| | | | | | | | |
ENGINEERING & CONSTRUCTION (2.08%) | | | | | | | |
| Kajima Corp. | | | 36,000 | | | 172,066 | |
| | | | | | | | |
FINANCIAL SERVICES (0.75%) | | | | | | | |
| Nissin Co., Ltd. - ADR | | | 11,520 | | | 61,978 | |
| | | | | | | | |
FOOD & BEVERAGES (0.80%) | | | | | | | |
| Kirin Brewery Co., Ltd. | | | 5,000 | | | 66,521 | |
| | | | | | | | |
HEALTHCARE - PRODUCTS (4.15%) | | | | | | | |
| Nakanishi, Inc. | | | 1,500 | | | 182,634 | |
| Terumo Corp. | | | 4,000 | | | 161,772 | |
| | | | | | | 344,406 | |
| | | | | | | | |
HOME FURNISHINGS (1.39%) | | | | | | | |
| Alpine Electronics, Inc. | | | 8,000 | | | 115,532 | |
| | | | | | | | |
HUMAN RESOURCES (1.73%) | | | | | | | |
| Intelligence, Ltd. | | | 66 | | | 143,337 | |
COMMONWEALTH INTERNATIONAL SERIES TRUST
COMMONWEALTH JAPAN FUND
SCHEDULE OF INVESTMENTS - OCTOBER 31, 2006
| | | Shares | | Value | |
INSURANCE (5.08%) | | | | | |
| Aflac, Inc. | | | 3,000 | | $ | 134,760 | |
| Millea Holdings, Inc. - ADR | | | 3,750 | | | 140,175 | |
| T&D Holdings, Inc. | | | 2,000 | | | 146,210 | |
| | | | | | | 421,145 | |
| | | | | | | | |
INTERNET SERVICES (0.68%) | | | | | | | |
| Internet Initiative Japan, Inc. - ADR * | | | 7,000 | | | 56,700 | |
| | | | | | | | |
LEISURE & RECREATION (5.02%) | | | | | | | |
| Nintendo Co., Ltd. | | | 1,000 | | | 204,523 | |
| Resorttrust, Inc. | | | 2,800 | | | 84,272 | |
| Sankyo Co., Ltd. | | | 2,500 | | | 127,613 | |
| | | | | | | 416,408 | |
| | | | | | | | |
MACHINERY (4.82%) | | | | | | | |
| Kubota Corp. - ADR | | | 2,000 | | | 87,320 | |
| Meidensha Corp. | | | 38,000 | | | 139,062 | |
| Nidec Corp. - ADR | | | 9,000 | | | 173,610 | |
| | | | | | | 399,992 | |
| | | | | | | | |
METAL FABRICATION/HARDWARE (0.89%) | | | | | | | |
| NEOMAX Co., Ltd. | | | 4,000 | | | 73,533 | |
| | | | | | | | |
MISCELLANEOUS MANUFACTURING (0.81%) | | | | | | | |
| Amano Corp. | | | 5,000 | | | 67,291 | |
| | | | | | | | |
OIL & GAS (0.87%) | | | | | | | |
| AOC Holdings, Inc. | | | 4,000 | | | 72,507 | |
COMMONWEALTH INTERNATIONAL SERIES TRUST
COMMONWEALTH JAPAN FUND
SCHEDULE OF INVESTMENTS - OCTOBER 31, 2006
| | | Shares | | Value | |
PHARMACEUTICALS (3.16%) | | | | | |
| Chugai Pharmaceutical Co., Ltd. | | | 6,500 | | $ | 133,385 | |
| Takeda Pharmaceutical Co., Ltd. | | | 2,000 | | | 128,425 | |
| | | | | | | 261,810 | |
| | | | | | | | |
PRINTING (1.18%) | | | | | | | |
| Tosho Printing Co., Ltd. | | | 30,000 | | | 97,473 | |
| | | | | | | | |
PUBLISHING (1.72%) | | | | | | | |
| Kadokawa Holdings, Inc. | | | 4,000 | | | 142,277 | |
| | | | | | | | |
REAL ESTATE (5.74%) | | | | | | | |
| Recrm Research Co., Ltd. | | | 50 | | | 97,473 | |
| Sumitomo Realty & Development Co., Ltd. | | | 6,000 | | | 199,051 | |
| Tokyo Tatemono Co., Ltd. | | | 15,000 | | | 179,044 | |
| | | | | | | 475,568 | |
| | | | | | | | |
RETAIL (3.51%) | | | | | | | |
| Sundrug Co., Ltd. | | | 4,000 | | | 91,659 | |
| Yamada Denki Co., Ltd. | | | 2,000 | | | 199,051 | |
| | | | | | | 290,710 | |
| | | | | | | | |
TELECOMMUNICATIONS (0.74%) | | | | | | | |
| Allied Telesis Holdings KK * | | | 35,000 | | | 61,348 | |
| | | | | | | | |
TEXTILES (1.84%) | | | | | | | |
| Ichikawa Co., Ltd. | | | 35,000 | | | 152,324 | |
COMMONWEALTH INTERNATIONAL SERIES TRUST
COMMONWEALTH JAPAN FUND
SCHEDULE OF INVESTMENTS - OCTOBER 31, 2006
| | | Shares | | Value | |
TRANSPORTATION (8.19%) | | | | | |
| East Japan Railway Co. | | | 15 | | $ | 104,912 | |
| Hankyu Holdings, Inc. | | | 22,000 | | | 132,051 | |
| Keihin Electric Express Railway Co., Ltd. | | | 13,000 | | | 92,702 | |
| Keio Corp. | | | 18,000 | | | 120,046 | |
| Tobu Railway Co., Ltd. | | | 18,000 | | | 88,649 | |
| Yamato Holdings, Co., Ltd. | | | 9,000 | | | 140,516 | |
| | | | | | | 678,876 | |
| | | | | | | | |
UTILITIES (5.57%) | | | | | | | |
| Hokkaido Electric Power Co., Inc. | | | 6,000 | | | 143,132 | |
| Toho Gas Co., Ltd. | | | 35,000 | | | 163,396 | |
| Tohoku Electric Power Co., Inc. | | | 7,000 | | | 155,017 | |
| | | | | | | 461,545 | |
| | | | | | | | |
TOTAL COMMON STOCK (Cost $5,761,141) | | | | | | 7,439,078 | |
| | | | | | | | |
INVESTMENT COMPANIES (1.26%) | | | | | | | |
| Morgan Stanley Asia Pacific Fund, Inc. | | | 6,000 | | | 104,580 | |
TOTAL INVESTMENT COMPANIES (Cost $66,360) | | | | | | 104,580 | |
| | | Principal | | | |
| | | | | | |
BONDS (8.28%) | | | | | |
| Aflac, Inc., 6.50%, due 04/15/09 | | | 78,000 | | | 80,420 | |
| Bank of Tokyo-Mitsubishi UFJ, Ltd., 8.40%, due 04/15/10 | | | 48,000 | | | 52,692 | |
| Osaka Gas Co., Ltd., 7.125%, due 02/07/07 | | | 200,000 | | | 200,616 | |
| SMBC International Finance NV, 8.50%, due 06/15/09 | | | 150,000 | | | 161,364 | |
| Toyota Motor Credit Corp., Step-up bond, due 02/04/25 | | | 200,000 | | | 191,643 | |
TOTAL BONDS (Cost $696,619) | | | | | | 686,735 | |
COMMONWEALTH INTERNATIONAL SERIES TRUST
COMMONWEALTH JAPAN FUND
SCHEDULE OF INVESTMENTS - OCTOBER 31, 2006
| | | Expiration Date | | | | | |
| | | Exercise Price | | Contracts (b) | | | |
CALL OPTIONS PURCHASED (0.61%) | | | | | | | |
| iShares MSCI Japan Index Fund | | | 01/20/07, 10 | | | 50 | | $ | 18,500 | |
| Sony Corp. | | | 01/20/07, 25 | | | 20 | | | 32,400 | |
TOTAL CALL OPTIONS PURCHASED (Cost $47,460) | | | | | | | | | 50,900 | |
TOTAL INVESTMENTS (Cost $ 6,571,580) (99.88%) | | | | | | | | | 8,281,293 | |
ASSETS IN EXCESS OF OTHER LIABILITIES, NET (0.12%) | | | | | | | | | 9,902 | |
NET ASSETS - (100%) | | | | | | | | | 8,291,195 | |
| * | Non-income producing investment |
| ADR | American Depositary Receipt |
| (b) | Each contract is equivalent to 100 shares |
The accompanying notes are an integral part of these financial statements.
COMMONWEALTH INTERNATIONAL SERIES TRUST
COMMONWEALTH GLOBAL FUND
SCHEDULE OF INVESTMENTS - OCTOBER 31, 2006
| | | Shares | | Value | |
COMMON STOCK (80.91%) | | | | | |
| | | | | | |
BRAZIL (2.58%) | | | | | |
| Cia de Saneamento Basico do Estado de Sao Paulo - ADR | | | 10,000 | | $ | 302,300 | |
| Cia Vale do Rio Doce - ADR | | | 12,000 | | | 305,280 | |
| | | | | | | 607,580 | |
| | | | | | | | |
CANADA (1.67%) | | | | | | | |
| Biovail Corp. | | | 8,000 | | | 123,760 | |
| Vitran Corp., Inc. * | | | 16,000 | | | 268,800 | |
| | | | | | | 392,560 | |
| | | | | | | | |
FRANCE (5.97%) | | | | | | | |
| Arkema - ADR * | | | 6,130 | | | 299,270 | |
| BNP Paribas - ADR | | | 6,000 | | | 329,875 | |
| France Telecom SA - ADR | | | 10,000 | | | 261,000 | |
| Thomson - ADR | | | 9,200 | | | 159,528 | |
| Total SA - ADR | | | 5,200 | | | 354,328 | |
| | | | | | | 1,404,001 | |
| | | | | | | | |
GERMANY (5.17%) | | | | | | | |
| Deutsche Bank AG -ADR | | | 3,000 | | | 379,050 | |
| E.ON AG - ADR | | | 8,000 | | | 321,040 | |
| SAP AG - ADR | | | 5,000 | | | 248,200 | |
| Siemens AG - ADR | | | 3,000 | | | 269,430 | |
| | | | | | | 1,217,720 | |
| | | | | | | | |
GREAT BRITAIN (11.10%) | | | | | | | |
| Anglo American Plc - ADR | | | 13,000 | | | 294,840 | |
| British Airways Plc - ADR * | | | 3,800 | | | 332,120 | |
| GlaxoSmithKline Plc - ADR | | | 8,000 | | | 426,000 | |
| Intercontinental Hotels Group Plc - ADR | | | 22,642 | | | 440,613 | |
| Lloyds TSB Group Plc - ADR | | | 6,900 | | | 295,734 | |
| National Grid Plc - ADR | | | 3,071 | | | 194,855 | |
| Signet Group Plc - ADR | | | 8,000 | | | 183,840 | |
| Tate & Lyle Plc - ADR | | | 4,000 | | | 240,464 | |
| Vodafone Group Plc - ADR | | | 7,875 | | | 203,569 | |
| | | | | | | 2,612,035 | |
COMMONWEALTH INTERNATIONAL SERIES TRUST
COMMONWEALTH GLOBAL FUND
SCHEDULE OF INVESTMENTS - OCTOBER 31, 2006
| | | Shares | | Value | |
GUERNSEY (1.65%) | | | | | |
| Amdocs, Ltd. * | | | 10,000 | | $ | 387,600 | |
| | | | | | | | |
HONG KONG (0.61%) | | | | | | | |
| China Netcom Group Corp. (Hong Kong), Ltd. - ADR | | | 4,000 | | | 143,760 | |
| | | | | | | | |
INDIA (2.24%) | | | | | | | |
| ICICI Bank, Ltd. - ADR | | | 10,000 | | | 351,500 | |
| Satyam Computer Services, Ltd. - ADR | | | 8,000 | | | 176,880 | |
| | | | | | | 528,380 | |
| | | | | | | | |
ISRAEL (0.31%) | | | | | | | |
| Teva Pharmaceutical Industries, Ltd. - ADR | | | 2,198 | | | 72,468 | |
| | | | | | | | |
MEXICO (1.57%) | | | | | | | |
| Grupo Televisa SA - ADR | | | 15,000 | | | 370,200 | |
| | | | | | | | |
NETHERLANDS (4.30%) | | | | | | | |
| ABN AMRO Holding NV - ADR | | | 10,706 | | | 312,294 | |
| ING Groep NV - ADR | | | 10,842 | | | 480,626 | |
| Unilever NV - NYS | | | 9,000 | | | 217,800 | |
| | | | | | | 1,010,720 | |
| | | | | | | | |
PORTUGAL (1.08%) | | | | | | | |
| Portugal Telecom SGPS SA - ADR | | | 20,300 | | | 253,547 | |
| | | | | | | | |
SOUTH KOREA (1.58%) | | | | | | | |
| Korea Electric Power Corp. - ADR | | | 8,000 | | | 158,240 | |
| KT Corp. - ADR | | | 9,500 | | | 212,610 | |
| | | | | | | 370,850 | |
COMMONWEALTH INTERNATIONAL SERIES TRUST
COMMONWEALTH GLOBAL FUND
SCHEDULE OF INVESTMENTS - OCTOBER 31, 2006
| | | Shares | | Value | |
SPAIN (1.24%) | | | | | |
| Banco Santander Central Hispano SA - ADR | | | 17,000 | | $ | 291,040 | |
| | | | | | | | |
SWITZERLAND (1.12%) | | | | | | | |
| Nestle SA - ADR | | | 3,100 | | | 264,803 | |
| | | | | | | | |
UNITED STATES (38.72%) | | | | | | | |
| Advanced Micro Devices, Inc. * | | | 1,868 | | | 39,732 | |
| AGCO Corp. * | | | 20,000 | | | 535,000 | |
| American National Insurance | | | 2,998 | | | 347,768 | |
| BJ'S Wholesale Club, Inc. * | | | 5,075 | | | 145,399 | |
| Bunge, Ltd. | | | 6,500 | | | 416,715 | |
| Chemed Corp. | | | 5,200 | | | 184,548 | |
| Compass Bancshares, Inc. | | | 6,150 | | | 345,999 | |
| Conmed Corp. * | | | 7,720 | | | 171,307 | |
| Continental Airlines, Inc. * | | | 10,000 | | | 368,800 | |
| Dentsply International, Inc. | | | 6,700 | | | 209,576 | |
| DST Systems, Inc. * | | | 7,385 | | | 456,319 | |
| Electronic Arts, Inc. * | | | 10,000 | | | 528,900 | |
| Headwaters, Inc. * | | | 10,000 | | | 247,500 | |
| International Rectifier Corp. * | | | 10,000 | | | 359,700 | |
| KVH Industries, Inc. * | | | 16,000 | | | 174,720 | |
| Lifepoint Hospitals, Inc. * | | | 15,000 | | | 532,500 | |
| Lubrizol Corp. | | | 5,055 | | | 227,475 | |
| Lufkin Industries, Inc. | | | 10,000 | | | 603,400 | |
| Lyondell Chemical Co. | | | 10,000 | | | 256,700 | |
| National Oilwell Varco, Inc. * | | | 3,633 | | | 219,433 | |
| Norfolk Southern Corp. | | | 9,000 | | | 473,130 | |
| Pentair, Inc. | | | 12,760 | | | 420,314 | |
| Prudential Financial, Inc. | | | 3,000 | | | 230,790 | |
| Quanex Corp. | | | 6,487 | | | 217,379 | |
| SanDisk Corp. * | | | 5,000 | | | 240,500 | |
COMMONWEALTH INTERNATIONAL SERIES TRUST
COMMONWEALTH GLOBAL FUND
SCHEDULE OF INVESTMENTS - OCTOBER 31, 2006
| | | Shares | | Value | |
UNITED STATES (CONTINUED) | | | | | |
| SCANA Corp. | | | 6,075 | | $ | 242,757 | |
| Smith International, Inc. | | | 4,490 | | | 177,265 | |
| Todco * | | | 4,000 | | | 136,520 | |
| Varian Semiconductor Equipment Associates, Inc. * | | | 10,000 | | | 364,900 | |
| XTO Energy, Inc. | | | 5,000 | | | 233,300 | |
| | | | | | | 9,108,346 | |
TOTAL COMMON STOCK (Cost $13,915,949) | | | | | | 19,035,610 | |
| | | | | | | | |
INVESTMENT COMPANIES (10.30%) | | | | | | | |
| Commonwealth Australia/New Zealand Fund (a) | | | 37,625 | | | 656,183 | |
| Commonwealth Japan Fund (a) | | | 37,032 | | | 159,978 | |
| iShares MSCI EMU Index Fund | | | 2,000 | | | 194,780 | |
| iShares MSCI Japan Index Fund | | | 25,000 | | | 344,500 | |
| iShares S&P Europe 350 Index Fund | | | 1,500 | | | 150,360 | |
| iShares S&P Latin America 40 Index Fund | | | 1,500 | | | 230,100 | |
| iShares S&P/TOPIX 150 Index Fund | | | 3,500 | | | 424,900 | |
| Morgan Stanley Asia Pacific Fund, Inc. | | | 15,000 | | | 261,450 | |
TOTAL INVESTMENT COMPANIES (Cost 1,769,240) | | | | | | 2,422,251 | |
| | | | | | | | |
PREFERRED STOCK (1.56%) | | | | | | | |
| Equity Office Properties Trust | | | 1,000 | | | 59,776 | |
| Chesapeake Energy Corp. | | | 1,000 | | | 100,000 | |
| HSBC USA, Inc. | | | 8,000 | | | 208,000 | |
TOTAL PREFERRED STOCK (Cost $341,870) | | | | | | 367,776 | |
| | | | | | | | |
BONDS (4.94%) | | | | | | | |
| EnCana Corp., 4.60%, due 8/15/09 | | | 135,000 | | | 132,687 | |
| JP Morgan Chase & Co., 0.00%, due 2/10/11 | | | 150,000 | | | 151,500 | |
| Mexico Government International Bond, 4.625%, due 10/08/08 | | | 200,000 | | | 198,350 | |
| SMBC International Finance NV, 8.50%, due 6/15/09 | | | 270,000 | | | 290,455 | |
| Toyota Motor Credit Corp., Step-up Bond, due 2/04/25 | | | 200,000 | | | 191,643 | |
| Vodafone Group Plc, 3.95%, due 1/30/08 | | | 200,000 | | | 196,944 | |
TOTAL BONDS (Cost $1,173,786) | | | | | | 1,161,579 | |
COMMONWEALTH INTERNATIONAL SERIES TRUST
COMMONWEALTH GLOBAL FUND
SCHEDULE OF INVESTMENTS - OCTOBER 31, 2006
| | | Shares | | Value | |
SHORT TERM INVESTMENTS (1.58%) | | | | | |
| Fifth Third Bank Repurchase Agreement, 4.48%, dated 10/31/06, due | | | | | |
| 11/01/06, repurchase price $370,947 (Collateralized by | | | | | |
| FNCI, 4.50%, due 11/01/06, market value $382,257) | | | | | |
| (Cost $370,901) | | | 370,901 | | $ | 370,901 | |
| | | | | | | | |
TOTAL INVESTMENTS (Cost $17,571,746) (99.29%) | | | | | | 23,358,117 | |
ASSETS IN EXCESS OF OTHER LIABILITIES (0.71%) | | | | | | 166,846 | |
NET ASSETS - (100%) | | | | | | 23,524,963 | |
| * | Non-income producing investment. |
| ADR | American Depositary Receipt |
| (a) | Affiliated by having the same Investment Advisor. |
The accompanying notes are an integral part of these financial statements.
COMMONWEALTH INTERNATIONAL SERIES TRUST
COMMONWEALTH REAL ESTATE SECURITIES FUND
SCHEDULE OF INVESTMENTS - OCTOBER 31, 2006
| | | Shares | | Value | |
COMMON STOCK (71.32%) | | | | | |
| | | | | | |
BUILDING MATERIALS (12.46%) | | | | | |
| Cemex SA de CV - ADR | | | 11,538 | | $ | 354,678 | |
| CRH Plc - ADR | | | 9,200 | | | 329,268 | |
| James Hardie Industries NV - ADR | | | 6,900 | | | 210,519 | |
| Lafarge SA - ADR | | | 5,000 | | | 167,750 | |
| Rinker Group, Ltd. - ADR | | | 6,000 | | | 428,160 | |
| Universal Forest Products, Inc. | | | 1,800 | | | 81,684 | |
| USG Corp. * | | | 5,000 | | | 244,450 | |
| | | | | | | 1,816,509 | |
| | | | | | | | |
DISTRIBUTION/WHOLESALE (1.31%) | | | | | | | |
| Wolseley Plc - ADR | | | 8,000 | | | 190,560 | |
| | | | | | | | |
FINANCIAL SERVICES (1.85%) | | | | | | | |
| Delta Financial Corp. | | | 17,000 | | | 163,200 | |
| Fannie Mae | | | 1,800 | | | 106,668 | |
| | | | | | | 269,868 | |
| | | | | | | | |
HOME BUILDERS (2.71%) | | | | | | | |
| Desarrolladora Homex SA de CV - ADR * | | | 9,000 | | | 395,100 | |
| | | | | | | | |
INSURANCE (1.67%) | | | | | | | |
| First American Corp. | | | 3,500 | | | 142,905 | |
| Stewart Information Services Corp. | | | 2,700 | | | 100,062 | |
| | | | | | | 242,967 | |
| | | | | | | | |
LODGING (1.23%) | | | | | | | |
| Starwood Hotels & Resorts Worldwide, Inc. | | | 3,000 | | | 179,220 | |
COMMONWEALTH INTERNATIONAL SERIES TRUST
COMMONWEALTH REAL ESTATE SECURITIES FUND
SCHEDULE OF INVESTMENTS - OCTOBER 31, 2006
| | | Shares | | Value | |
REAL ESTATE (5.53%) | | | | | |
| Alto Palermo SA - ADR | | | 17,000 | | $ | 214,200 | |
| Hang Lung Properties, Ltd. - ADR | | | 18,000 | | | 196,189 | |
| IRSA Inversiones y Representaciones SA - GDR * | | | 10,000 | | | 143,700 | |
| St. Joe Co.# | | | 2,000 | | | 107,560 | |
| WP Carey & Co. LLC | | | 5,000 | | | 144,450 | |
| | | | | | | 806,099 | |
| | | | | | | | |
REAL ESTATE INVESTMENT TRUSTS - APARTMENTS (4.60%) | | | | | | | |
| Camden Property Trust | | | 3,900 | | | 314,808 | |
| Education Realty Trust, Inc. | | | 9,000 | | | 139,230 | |
| GMH Communities Trust | | | 15,500 | | | 216,535 | |
| | | | | | | 670,573 | |
| | | | | | | | |
REAL ESTATE INVESTMENT TRUSTS - DIVERSIFIED (3.59%) | | | | | | | |
| First Potomac Realty Trust | | | 4,000 | | | 123,760 | |
| PS Business Parks, Inc. | | | 3,500 | | | 230,475 | |
| Washington Real Estate Investment Trust | | | 4,000 | | | 168,600 | |
| | | | | | | 522,835 | |
| | | | | | | | |
REAL ESTATE INVESTMENT TRUSTS - HEALTH CARE (1.07%) | | | | | | | |
| Senior Housing Properties Trust | | | 6,800 | | | 155,924 | |
| | | | | | | | |
REAL ESTATE INVESTMENT TRUSTS - HOTELS (9.48%) | | | | | | | |
| DiamondRock Hospitality Co. | | | 12,000 | | | 202,440 | |
| Equity Inns, Inc. | | | 11,000 | | | 184,580 | |
| Hersha Hospitality Trust | | | 12,000 | | | 131,520 | |
| Highland Hospitality Corp. | | | 17,300 | | | 239,086 | |
| Host Hotels & Resorts, Inc. | | | 11,636 | | | 268,326 | |
| Strategic Hotels & Resorts, Inc. | | | 10,000 | | | 212,700 | |
| Winston Hotels, Inc. | | | 11,900 | | | 143,990 | |
| | | | | | | 1,382,642 | |
COMMONWEALTH INTERNATIONAL SERIES TRUST
COMMONWEALTH REAL ESTATE SECURITIES FUND
SCHEDULE OF INVESTMENTS - OCTOBER 31, 2006
| | | Shares | | Value | |
REAL ESTATE INVESTMENT TRUSTS - MANUFACTURED HOMES (0.99%) | | | | | |
| American Land Lease, Inc. | | | 5,600 | | $ | 145,040 | |
| | | | | | | | |
REAL ESTATE INVESTMENT TRUSTS - MORTGAGE (1.32%) | | | | | | | |
| American Mortgage Acceptance Corp. | | | 4,000 | | | 71,760 | |
| RAIT Investment Trust | | | 4,000 | | | 120,240 | |
| | | | | | | 192,000 | |
| | | | | | | | |
REAL ESTATE INVESTMENT TRUSTS - OFFICE PROPERTY (7.01%) | | | | | | | |
| American Financial Realty Trust | | | 12,000 | | | 140,040 | |
| BioMed Realty Trust, Inc. | | | 4,000 | | | 128,920 | |
| Equity Office Properties Trust | | | 4,100 | | | 174,250 | |
| HRPT Properties Trust | | | 10,100 | | | 120,190 | |
| Kilroy Realty Corp. | | | 2,400 | | | 180,792 | |
| Maguire Properties, Inc. | | | 3,000 | | | 128,280 | |
| Republic Property Trust | | | 12,000 | | | 149,280 | |
| | | | | | | 1,021,752 | |
| | | | | | | | |
REAL ESTATE INVESTMENT TRUSTS - REGIONAL MALLS (1.60%) | | | | | | | |
| General Growth Properties, Inc. | | | 4,500 | | | 233,550 | |
| | | | | | | | |
REAL ESTATE INVESTMENT TRUSTS - SHOPPING CENTERS (6.03%) | | | | | | | |
| Acadia Realty Trust | | | 4,800 | | | 122,640 | |
| Agree Realty Corp. | | | 4,400 | | | 154,264 | |
| Kite Realty Group Trust | | | 10,000 | | | 183,400 | |
| Saul Centers, Inc. | | | 4,100 | | | 199,260 | |
| Trustreet Properties, inc. | | | 3,500 | | | 59,395 | |
| Weingarten Realty Investors | | | 3,450 | | | 160,425 | |
| | | | | | | 879,384 | |
COMMONWEALTH INTERNATIONAL SERIES TRUST
COMMONWEALTH REAL ESTATE SECURITIES FUND
SCHEDULE OF INVESTMENTS - OCTOBER 31, 2006
| | | Shares | | Value | |
REAL ESTATE INVESTMENT TRUSTS - STORAGE (3.21%) | | | | | |
| Extra Space Storage, Inc. | | | 13,200 | | $ | 243,408 | |
| Public Storage, Inc. | | | 2,500 | | | 224,275 | |
| | | | | | | 467,683 | |
REAL ESTATE INVESTMENT TRUSTS - WAREHOUSING/INDUSTRIAL (1.52%) | | | | | | | |
| Prologis | | | 3,500 | | | 221,445 | |
| | | | | | | | |
RETAIL-BUILING PRODUCTS (2.91%) | | | | | | | |
| Home Depot, Inc. | | | 3,300 | | | 123,189 | |
| Kingfisher Plc - ADR | | | 12,000 | | | 120,499 | |
| Lowe's Cos., Inc. | | | 6,000 | | | 180,841 | |
| | | | | | | 424,529 | |
SAVINGS AND LOANS (1.23%) | | | | | | | |
| New York Community Bancorp, Inc. | | | 11,000 | | | 179,850 | |
TOTAL COMMON STOCK (Cost $7,122,133) | | | | | | 10,397,530 | |
| | | | | | | | |
INVESTMENT COMPANIES (13.54%) | | | | | | | |
| AEW Real Estate Income Fund | | | 16,000 | | | 357,280 | |
| AIM Select Real Estate Income Fund | | | 16,000 | | | 309,760 | |
| DWS RREEF Real Estate Fund, Inc. | | | 9,000 | | | 230,400 | |
| iShares Cohen & Steers Realty Majors Index Fund | | | 3,000 | | | 293,610 | |
| iShares Dow Jones U.S. Real Estate Index Fund | | | 3,200 | | | 262,976 | |
| LMP Real Estate Income Fund | | | 16,000 | | | 350,240 | |
| streetTRACKS Dow Jones Wilshire REIT ETF Fund | | | 1,950 | | | 169,845 | |
TOTAL INVESTMENT COMPANIES (Cost $1,408,392) | | | | | | 1,974,111 | |
COMMONWEALTH INTERNATIONAL SERIES TRUST
COMMONWEALTH REAL ESTATE SECURITIES FUND
SCHEDULE OF INVESTMENTS - OCTOBER 31, 2006
| | | Shares | | Value | |
PREFERRED STOCK (2.60%) | | | | | |
| Fannie Mae (Cost $398,160) | | | 7,000 | | $ | 378,438 | |
| | | | | | | | |
BONDS (5.42%) | | | | | | | |
| Centex Corp., 4.55%, due 11/01/10 | | | 150,000 | | | 144,509 | |
| Hanson Australia Funding, Ltd., 5.25%, due 03/15/13 | | | 250,000 | | | 243,616 | |
| Hilton Hotels Corp., 7.20%, due 12/15/09 | | | 200,000 | | | 207,000 | |
| Vornado Realty LP, 4.50%, due 08/15/09 | | | 200,000 | | | 195,014 | |
TOTAL BONDS (Cost $802,713) | | | | | | 790,139 | |
| | | | | | | | |
AGENCY OBLIGATIONS (2.75%) | | | | | | | |
| Federal Home Loan Bank System, 4.375%, due 05/16/08 | | | 105,000 | | | 104,019 | |
| Federal Home Loan Bank System, 4.50%, due 11/26/08 | | | 300,000 | | | 296,862 | |
TOTAL AGENCY OBLIGATIONS (Cost $405,000) | | | | | | 400,881 | |
| | | | | | | | |
ASSET-BACKED SECURITIES (2.74%) | | | | | | | |
| Greenpoint Manufactured Housing, 5.29%, due 03/11/23 ** | | | | | | | |
| (Cost $400,000) | | | 400,000 | | | 400,000 | |
| | | | | | | | |
REPURCHASE AGREEMENT (1.63%) | | | | | | | |
| Fifth Third Bank Repurchase Agreement, 4.48%, dated 10/31/06, due | | | | | | | |
| 11/01/06, repurchase price $237,117 (Collateralized by | | | | | | | |
| FNCI, 4.50%, due 11/01/06, market value $244,738 | | | | | | | |
| (Cost $237,087) | | | 237,087 | | | 237,087 | |
| | | | | | | | |
TOTAL INVESTMENTS (Cost $10,773,485) (100%) | | | | | | 14,578,186 | |
CALL OPTIONS WRITTEN (Proceeds $9,335) (-0.07%) | | | | | | (10,000 | ) |
ASSETS IN EXCESS OF OTHER LIABILITIES (0.07%) | | | | | | 10,179 | |
NET ASSETS - (100%) | | | | | | 14,578,365 | |
COMMONWEALTH INTERNATIONAL SERIES TRUST
COMMONWEALTH REAL ESTATE SECURITIES FUND
SCHEDULE OF INVESTMENTS - OCTOBER 31, 2006
| | | Expiration Date | | | | | |
| | | Exercise Price | | Contracts (a) | | | |
CALL OPTIONS WRITTEN (-0.07%) | | | | | | | |
St. Joe Co. (Proceeds $9,335) | | | 01/20/07 - 55 | | | 20 | | | (10,000 | ) |
| * | Non-income producing investment |
| ** | Rate shown represents rate at October 31, 2006, is subject to change and resets monthly. |
| ADR | American Depositary Receipt |
| GDR | Global Depositary Receipt |
| (a) | Each contract is equivalent to 100 shares. |
| # | Call options have been written by the fund against this position. |
The accompanying notes are an integral part of these financial statements.
COMMONWEALTH INTERNATIONAL SERIES TRUST
STATEMENTS OF ASSETS AND LIABILITIES - October 31, 2006
| | | Commonwealth Australia/ New Zealand Fund | | Commonwealth Japan Fund | | Commonwealth Global Fund | | Commonwealth Real Estate Securities Fund | |
ASSETS: | | | | | | | | | |
| Investments, at market (Cost $25,509,781; $6,571,580; $16,935,063; and $10,773,485, respectively) | | $ | 34,361,114 | | $ | 8,281,293 | | $ | 22,541,956 | | $ | 14,578,186 | |
| Investments in affiliated mutual funds (Cost $0, $0, $636,683 and $0, respectively) | | | — | | | — | | | 816,161 | | | — | |
| Total Investments (Cost $25,509,781, $6,571,580, $17,571,746 and $10,773,485, respectively) | | | 34,361,114 | | | 8,281,293 | | | 23,358,117 | | | 14,578,186 | |
| Cash | | | — | | | — | | | 224,400 | | | — | |
| Foreign currency, at value (Cost $63,436, $2,888, $0 and $0, respectively) | | | 67,861 | | | 2,867 | | | — | | | — | |
| Receivables: | | | | | | | | | | | | | |
| Dividends and interest | | | 154,098 | | | 44,089 | | | 27,804 | | | 46,235 | |
| Investments and foreign currency sold | | | 847,446 | | | 170,654 | | | — | | | — | |
| Due from Commonwealth Australia/New Zealand Fund | | | — | | | 6,344 | | | — | | | — | |
| Fund shares sold | | | 26,761 | | | 25,030 | | | 25,000 | | | 25,000 | |
| Due from advisor | | | — | | | 165 | | | — | | | — | |
| Prepaid expenses | | | 16,453 | | | 10,275 | | | 15,543 | | | 8,544 | |
Total Assets | | | 35,473,733 | | | 8,540,717 | | | 23,650,864 | | | 14,657,965 | |
| | | | | | | | | | | | | | |
LIABILITIES: | | | | | | | | | | | | | |
| Payables: | | | | | | | | | | | | | |
| Accured 12b-1 fees | | | 4,346 | | | 35,116 | | | 36,816 | | | 14,289 | |
| Due to advisor | | | 3,637 | | | — | | | 2,805 | | | 1,789 | |
| Accrued indemnification costs | | | 97,072 | | | 22,196 | | | 52,259 | | | 31,712 | |
| Line of credit borrowing | | | 209,192 | | | 178,702 | | | — | | | — | |
| Fund shares redeemed | | | 14,650 | | | — | | | — | | | — | |
| Due to Commonwealth Japan Fund | | | 6,344 | | | — | | | — | | | — | |
| Accrued expenses | | | 47,260 | | | 13,508 | | | 34,021 | | | 21,810 | |
| Covered call options written, at value (premiums received $0, $0, $0 and $9,335, respectively) | | | — | | | — | | | — | | | 10,000 | |
Total Liabilities | | | 382,501 | | | 249,522 | | | 125,901 | | | 79,600 | |
| | | | | | | | | | | | | | |
NET ASSETS: | | $ | 35,091,232 | | $ | 8,291,195 | | $ | 23,524,963 | | $ | 14,578,365 | |
| | | | | | | | | | | | | | |
NET ASSET VALUE, OFFERING AND REDEMPTION(a) PRICE PER SHARE: (2,012,095, 1,916,593, 1,378,092 and 1,036,516 shares of beneficial interest outstanding, respectively, par value .01, unlimited shares authorized) | | $ | 17.44 | | $ | 4.33 | | $ | 17.07 | | $ | 14.06 | |
| | | | | | | | | | | | | | |
SOURCE OF NET ASSETS: | | | | | | | | | | | | | |
| Paid-in capital | | | 21,584,111 | | | 5,462,875 | | | 16,484,156 | | | 10,751,426 | |
| Undistributed net investment income | | | 106,717 | | | — | | | — | | | — | |
| Accumulated net realized gains on investments and foreign currency | | | 4,536,115 | | | 1,118,706 | | | 1,254,436 | | | 22,903 | |
| Net unrealized appreciation on investments and foreign currency | | | 8,864,289 | | | 1,709,614 | | | 5,786,371 | | | 3,804,036 | |
| | | $ | 35,091,232 | | $ | 8,291,195 | | $ | 23,524,963 | | $ | 14,578,365 | |
| (a) | Effective May 1, 2006, subject to certain exceptions, a 2% redemption fee is imposed upon shares redeemed within seven calendar days of their purchase. |
The accompanying notes are an integral part of the financial statements.
COMMONWEALTH INTERNATIONAL SERIES TRUST
STATEMENTS OF OPERATIONS For the Year Ended October 31, 2006
| | | Commonwealth Australia/ New Zealand Fund | | Commonwealth Japan Fund | | Commonwealth Global Fund | | Commonwealth Real Estate Securities Fund | |
INVESTMENT INCOME: | | | | | | | | | | | | | |
| Interest (net of foreign taxes withheld of $26,443, $0, $0 and $0, respectively) | | $ | 661,925 | | $ | 48,850 | | $ | 57,603 | | $ | 101,968 | |
| Dividends (net of foreign taxes withheld of $217,590, $4,458, $0 and $0, respectively) | | | 1,096,166 | | | 77,436 | | | 406,582 | | | 323,760 | |
| Dividends from affiliated mutual funds | | | — | | | — | | | 16,600 | | | — | |
| Total Investment Income | | | 1,758,091 | | | 126,286 | | | 480,785 | | | 425,728 | |
| | | | | | | | | | | | | | |
EXPENSES: | | | | | | | | | | | | | |
| Management fees | | | 309,591 | | | 70,711 | | | 160,728 | | | 100,976 | |
| Legal fees | | | 131,122 | | | 31,772 | | | 76,751 | | | 47,252 | |
| Indemnification fees (Note 13) | | | 109,854 | | | 25,118 | | | 59,140 | | | 35,888 | |
| Administration fees | | | 88,439 | | | 24,782 | | | 49,740 | | | 32,545 | |
| Transfer agent fees | | | 48,166 | | | 5,263 | | | 3,620 | | | 1,221 | |
| Accounting fees | | | 114,354 | | | 26,248 | | | 62,314 | | | 37,795 | |
| Distribution fees | | | 103,197 | | | 23,570 | | | 53,575 | | | 33,659 | |
| Insurance fees | | | 47,859 | | | 7,378 | | | 18,808 | | | 11,517 | |
| Audit fees | | | 24,064 | | | 5,523 | | | 13,125 | | | 7,963 | |
| Custodian fees | | | 30,386 | | | 8,837 | | | 10,039 | | | 5,895 | |
| Miscellaneous fees | | | 55,952 | | | 15,722 | | | 18,366 | | | 13,685 | |
| Trustee fees and expenses | | | 20,554 | | | 16,015 | | | 18,183 | | | 16,761 | |
| Registration fees | | | 26,438 | | | 17,726 | | | 16,909 | | | 13,075 | |
| Pricing fees | | | 31,429 | | | 22,121 | | | 10,171 | | | 7,901 | |
| Compliance officer fees | | | 30,073 | | | 6,707 | | | 16,154 | | | 9,814 | |
| Reports to shareholders | | | 5,703 | | | 1,308 | | | 3,106 | | | 1,884 | |
| Consulting fees | | | 21,525 | | | 5,188 | | | 13,566 | | | 8,221 | |
| Interest expense | | | 19,400 | | | 1,166 | | | 70 | | | 30 | |
| Total expenses | | | 1,218,106 | | | 315,155 | | | 604,365 | | | 386,082 | |
| Less: expense reimbursement by advisor | | | (6,148 | ) | | (13,753 | ) | | — | | | — | |
| Less: fees paid indirectly | | | (100 | ) | | (564 | ) | | (249 | ) | | (352 | ) |
| Net expenses | | | 1,211,858 | | | 300,838 | | | 604,116 | | | 385,730 | |
| Net Investment income (loss) | | | 546,233 | | | (174,552 | ) | | (123,331 | ) | | 39,998 | |
| | | | | | | | | | | | | | |
REALIZED/UNREALIZED GAINS (LOSSES) ON INVESTMENTS: | | | | | | | | | | | | | |
| Net realized gain (loss) on : | | | | | | | | | | | | | |
| Investments, unaffiliated issuers | | | 4,354,636 | | | 1,288,967 | | | 1,332,480 | | | (2,155 | ) |
| Realized gains distributions from affiliated mutual funds | | | — | | | 3,231 | | | 27,984 | | | 46,718 | |
| Realized gains distributions from unaffiliated mutual funds | | | — | | | — | | | 66,665 | | | — | |
| Option contacts written | | | — | | | — | | | (16,287 | ) | | (10,926 | ) |
| Foreign currency transactions | | | (102,558 | ) | | 2,357 | | | — | | | — | |
| Net change in unrealized appreciation(depreciation) on: | | | | | | | | | | | | | |
| Investments, unaffiliated issuers | | | 231,887 | | | (443,824 | ) | | 1,929,234 | | | 2,381,404 | |
| Investments, affiliated mutual funds | | | — | | | — | | | 47,060 | | | — | |
| Option contacts written | | | — | | | — | | | (12,921 | ) | | (1,399 | ) |
| Foreign currency transactions | | | 16,377 | | | 607 | | | — | | | — | |
| Net gain on investments and foreign currency | | | 4,500,342 | | | 851,338 | | | 3,374,215 | | | 2,413,642 | |
| Net increase in net assets resulting from operations | | $ | 5,046,575 | | $ | 676,786 | | $ | 3,250,884 | | $ | 2,453,640 | |
The accompanying notes are an integral part of the financial statements.
COMMONWEALTH INTERNATIONAL SERIES TRUST
STATEMENTS OF CHANGES IN NET ASSETS
| | | Commonwealth Australia/ New Zealand Fund | |
| | | For the Year Ended October 31, 2006 | | For the Year Ended October 31, 2005 | |
OPERATIONS: | | | | | | | |
| Net investment income | | $ | 546,233 | | $ | 1,161,857 | |
| Net realized gain (loss) on: | | | | | | | |
| Investments | | | 4,354,636 | | | 2,740,049 | |
| Foreign currency transactions | | | (102,558 | ) | | (7,950 | ) |
| Net change in unrealized appreciation (depreciation) on investments and foreign currency | | | 248,264 | | | 1,138,598 | |
| Net increase in net assets resulting from operations | | | 5,046,575 | | | 5,032,554 | |
| | | | | | | | |
DISTRIBUTIONS TO SHAREHOLDERS FROM: | | | | | | | |
| Net investment income | | | (1,472,334 | ) | | (1,354,152 | ) |
| Net realized gain | | | (2,303,653 | ) | | (3,498,797 | ) |
| Total Distributions | | | (3,775,987 | ) | | (4,852,949 | ) |
| | | | | | | | |
CAPITAL SHARE TRANSACTIONS: | | | | | | | |
| Increase/(Decrease) in net assets from Fund share transactions | | $ | (19,159,379 | ) | $ | 9,697,386 | |
| Increase/(Decrease) in net assets | | | (17,888,791 | ) | | 9,876,991 | |
| | | | | | | | |
NET ASSETS: | | | | | | | |
| Beginning of year | | | 52,980,023 | | | 43,103,032 | |
| End of year | | $ | 35,091,232 | | $ | 52,980,023 | |
| Undistributed net investment income | | $ | 106,717 | | $ | 1,316,855 | |
| | | Commonwealth Japan Fund | |
| | | For the Year Ended October 31, 2006 | | For the Year Ended October 31, 2005 | |
OPERATIONS: | | | | | |
| Net investment loss | | $ | (174,552 | | $ | (140,906 | |
| Net realized gain (loss) on: | | | | | | | |
| Investments | | | 1,292,198 | | | 449,923 | |
| Foreign currency transactions | | | 2,357 | | | (6,815 | ) |
| Net change in unrealized appreciation (depreciation) on investments and foreign currency | | | (443,217 | ) | | 1,421,747 | |
| Net increase in net assets resulting from operations | | | 676,786 | | | 1,723,949 | |
| | | | | | | | |
DISTRIBUTIONS TO SHAREHOLDERS FROM: | | | | | | | |
| Net investment income | | | — | | | — | |
| Net realized gain | | | (121,620 | ) | | — | |
| Total Distributions | | | (121,620 | ) | | — | |
| | | | | | | | |
CAPITAL SHARE TRANSACTIONS: | | | | | | | |
| Decrease in net assets from Fund share transactions | | $ | (659,384 | ) | $ | (1,201,495 | ) |
| Increase/(Decrease) in net assets | | | (104,218 | ) | | 522,454 | |
| | | | | | | | |
NET ASSETS: | | | | | | | |
| Beginning of year | | | 8,395,413 | | | 7,872,959 | |
| End of year | | $ | 8,291,195 | | $ | 8,395,413 | |
| Undistributed net investment income | | | — | | $ | — | |
The accompanying notes are an integral part of these financial statements.
COMMONWEALTH INTERNATIONAL SERIES TRUST
STATEMENTS OF CHANGES IN NET ASSETS
| | | Commonwealth Global Fund | |
| | | For the Year Ended October 31, 2006 | | For the Year Ended October 31, 2005 | |
OPERATIONS: | | | | | | | |
| Net investment loss | | $ | (123,331 | ) | $ | (19,176 | ) |
| Net realized gain on: | | | | | | | |
| Investments | | | 1,410,842 | | | 482,987 | |
| Foreign currency transactions | | | — | | | — | |
| Net change in unrealized appreciation (depreciation) on investments and foreign currency | | | 1,963,373 | | | 1,284,330 | |
| Net increase in net assets resulting from operations | | | 3,250,884 | | | 1,748,141 | |
| | | | | | | | |
DISTRIBUTIONS TO SHAREHOLDERS FROM: | | | | | | | |
| Net investment income | | | — | | | — | |
| Net realized gain | | | (495,081 | ) | | (528,759 | ) |
| Total Distributions | | | (495,081 | ) | | (528,759 | ) |
| | | | | | | | |
CAPITAL SHARE TRANSACTIONS: | | | | | | | |
| Increase in net assets from Fund share transactions | | $ | 412,825 | | $ | 4,167,959 | |
| Increase in net assets | | | 3,168,628 | | | 5,387,341 | |
| | | | | | | | |
NET ASSETS: | | | | | | | |
| Beginning of year | | | 20,356,335 | | | 14,968,994 | |
| End of year | | $ | 23,524,963 | | $ | 20,356,335 | |
| Undistributed net investment income | | $ | — | | $ | — | |
| | | Commonwealth Real Estate Securities Fund | |
| | | For the Year Ended October 31, 2006 | | For the Year Ended October 31, 2005 | |
OPERATIONS: | | | | | | | |
| Net investment income | | $ | 39,998 | | $ | 100,508 | |
| Net realized gain on: | | | | | | | |
| Investments | | | 33,637 | | | 4,226 | |
| Foreign currency transactions | | | — | | | — | |
| Net change in unrealized appreciation (depreciation) on investments and foreign currency | | | 2,380,005 | | | 919,120 | |
| Net increase in net assets resulting from operations | | | 2,453,640 | | | 1,023,854 | |
| | | | | | | | |
DISTRIBUTIONS TO SHAREHOLDERS FROM: | | | | | | | |
| Net investment income | | | (115,770 | ) | | (46,536 | ) |
| Net realized gain | | | (4,226 | ) | | (3,999 | ) |
| Total Distributions | | | (119,996 | ) | | (50,535 | ) |
| | | | | | | | |
CAPITAL SHARE TRANSACTIONS: | | | | | | | |
| Increase/(Decrease) in net assets from Fund share transactions | | $ | (245,088 | ) | $ | 4,871,891 | |
| Increase in net assets | | | 2,088,556 | | | 5,845,210 | |
| | | | | | | | |
NET ASSETS: | | | | | | | |
| Beginning of year | | | 12,489,809 | | | 6,644,599 | |
| End of year | | $ | 14,578,365 | | $ | 12,489,809 | |
| Undistributed net investment income | | $ | — | | $ | 66,558 | |
The accompanying notes are an integral part of these financial statements.
COMMONWEALTH INTERNATIONAL SERIES TRUST
FINANCIAL HIGHLIGHTS
Selected data for a share outstanding throughout the years indicated.
| | | Commonwealth Australia/New Zealand Fund | |
| | | | | | | | | | | | |
| | | Years Ended October 31, | |
| | | 2006 | | 2005 | | 2004 | | 2003 | | 2002 | |
Net Asset Value, Beginning of Year | | $ | 16.43 | | $ | 16.39 | | $ | 14.44 | | $ | 10.39 | | $ | 8.53 | |
| | | | | | | | | | | | | | | | | |
Investment Operations: | | | | | | | | | | | | | | | | |
| Net investment income (loss) | | | 0.26 | | | 0.35 | | | 0.26 | | | 0.17 | | | (0.05 | ) |
| Net realized and unrealized gain from investments | | | 1.98 | | | 1.41 | | | 2.11 | | | 3.88 | | | 1.91 | |
| Total from investment activities | | | 2.24 | | | 1.76 | | | 2.37 | | | 4.05 | | | 1.86 | |
| | | | | | | | | | | | | | | | | |
Distributions from: | | | | | | | | | | | | | | | | |
| Net investment income | | | (0.48 | ) | | (0.48 | ) | | (0.21 | ) | | — | | | — | |
| Net realized gains | | | (0.75 | ) | | (1.24 | ) | | (0.21 | ) | | — | | | — | |
| Total Distributions | | | (1.23 | ) | | (1.72 | ) | | (0.42 | ) | | — | | | — | |
| | | | | | | | | | | | | | | | | |
Net Asset Value, End of Year | | $ | 17.44 | | $ | 16.43 | | $ | 16.39 | | $ | 14.44 | | $ | 10.39 | |
| | | | | | | | | | | | | | | | | |
Total Return | | | 14.58 | % | | 11.08 | % | | 16.70 | % | | 38.98 | % | | 21.81 | % |
| | | | | | | | | | | | | | | | | |
Ratios/Supplemental Data: | | | | | | | | | | | | | | | | |
| Net Assets at end of year (000) | | $ | 35,091 | | $ | 52,980 | | $ | 43,103 | | $ | 33,036 | | $ | 6,864 | |
| Ratio of expenses to average net assets | | | 2.94 | %(a)(b) | | 2.12% | (a) | | 2.10% | (a) | | 2.53 | % | | 5.63 | % |
| Ratio of net investment income (loss) | | | 1.32 | %(a) | | 2.29% | (a) | | 2.44% | (a) | | 1.87 | % | | (0.56 | )% |
| Portfolio turnover | | | 20 | % | | 32 | % | | 55 | % | | 78 | % | | 28 | % |
| (a) | In accordance with a requirement of the Securities and Exchange Commission, the ratios reflect total expenses prior to the reduction of “fees paid indirectly”. The ratios of expenses to average daily net assets and net investment income to average daily net assets net of fees paid indirectly would have been 2.94% and 1.32%, respectively for the year ended October 31, 2006 and 2.12% and 2.29%, respectively for the year ended October 31, 2005 and 2.09% and 2.45%, respectively for the year ended October 31, 2004. |
| (b) | The reimbursement of certain interest costs by the advisor related to the SEC settlement discussed in Note 12 reduced the expense ratio by .01%. |
The accompanying notes are an integral part of these financial statements.
COMMONWEALTH INTERNATIONAL SERIES TRUST
FINANCIAL HIGHLIGHTS
Selected data for a share outstanding throughout the years indicated.
| | | Commonwealth Japan Fund | |
| | | | | | | | | | | | |
| | | Years Ended October 31, | |
| | | 2006 | | 2005 | | 2004 | | 2003 | | 2002 | |
| | | | | | | | | | | | |
Net Asset Value, Beginning of Year | | $ | 4.15 | | $ | 3.61 | | $ | 3.98 | | $ | 3.37 | | $ | 4.12 | |
| | | | | | | | | | | | | | | | | |
Investment Operations: | | | | | | | | | | | | | | | | |
| Net investment loss | | | (0.09 | ) | | (0.07 | ) | | (0.09 | ) | | (0.11 | ) | | (0.20 | ) |
| Net realized and unrealized gain (losses) from investments | | | 0.32 | | | 0.61 | | | (0.28 | )(b) | | 0.72 | | | (0.55 | ) |
| Total from investment activities | | | 0.23 | | | 0.54 | | | (0.37 | ) | | 0.61 | | | (0.75 | ) |
| | | | | | | | | | | | | | | | | |
Distributions: | | | | | | | | | | | | | | | | |
| Net realized gains | | | (0.05 | ) | | — | | | — | | | — | | | — | |
| Total Distributions | | | (0.05 | ) | | — | | | — | | | — | | | — | |
| | | | | | | | | | | | | | | | | |
Net Asset Value, End of Year | | $ | 4.33 | | $ | 4.15 | | $ | 3.61 | | $ | 3.98 | | $ | 3.37 | |
| | | | | | | | | | | | | | | | | |
Total Return | | | 5.60 | % | | 14.96 | % | | (9.30 | )% | | 18.10 | % | | (18.20 | )% |
| | | | | | | | | | | | | | | | | |
Ratios/Supplemental Data | | | | | | | | | | | | | | | | |
| Net assets, end of year (000) | | $ | 8,291 | | $ | 8,395 | | $ | 7,873 | | $ | 7,079 | | $ | 3,611 | |
| Ratio of expenses to average net assets | | | 3.20 | %(a)(c) | | 3.07 | %(a) | | 3.13 | %(a) | | 4.78 | % | | 6.94 | % |
| Ratio of net investment loss | | | (1.86 | )%(a) | | (1.57 | )%(a) | | (2.42 | )%(a) | | (3.89 | )% | | (6.03 | )% |
| Portfolio turnover | | | 50 | % | | 47 | % | | 77 | % | | 28 | % | | 5 | % |
| (a) | In accordance with a requirement of the Securities and Exchange Commission, the ratios reflect total expenses prior to the reduction of “fees paid indirectly”. The ratios of expenses to average daily net assets and net investment income to average daily net assets net of fees paid indirectly would have been 3.19% and (1.85)%, respectively for the year ended October 31, 2006 and 3.03% and (1.53)%, respectively for the year ended October 31, 2005 and 3.09% and (2.38)%, respectively for the year ended October 31, 2004. |
| (b) | As required by SEC standard per share data calculation methodology, this represents a balancing figure derived from the other amounts in the financial highlights table that captures all other changes affecting net asset value per share. This per share loss amount does not correlate to the aggregate of the net realized and unrealized gain and loss items in the statement of operations, which net to a gain, primarily because of the timing of sales and repurchases of the Funds's shares in relation to fluctuating market values for the Fund’s portfolio. |
| (c) | The reimbursement of certain interest costs by the advisor related to the SEC settlement discussed in Note 12 reduced the expense ratio by .15%. |
The accompanying notes are an integral part of these financial statements.
COMMONWEALTH INTERNATIONAL SERIES TRUST
FINANCIAL HIGHLIGHTS
Selected data for a share outstanding throughout the years indicated.
| | | Commonwealth Global Fund | |
| | | | | | | | | | | | | | |
| | | For the Year Ended October 31, 2006 | | For the Year Ended October 31, 2005 | | For the Year Ended October 31, 2004 | | For the Period Ended October 31, 2003* | |
Net Asset Value, Beginning of Period | | $ | 15.06 | | $ | 13.89 | | $ | 11.99 | | $ | 10.00 | |
Investment Activities: | | | | | | | | | | | | | |
| Net investment loss | | | (0.09 | ) | | (0.01 | ) | | (0.08 | ) | | (0.14 | ) |
| Net realized and unrealized gains from investments | | | 2.47 | | | 1.63 | | | 1.98 | | | 2.13 | |
| Total from investment activities | | | 2.38 | | | 1.62 | | | 1.90 | | | 1.99 | |
| | | | | | | | | | | | | | |
Distributions: | | | | | | | | | | | | | |
| Net investment income | | | — | | | — | | | — | | | — | |
| Net realized gains | | | (0.37 | ) | | (0.45 | ) | | — | | | — | |
| Total Distributions | | | (0.37 | ) | | (0.45 | ) | | — | | | — | |
| | | | | | | | | | | | | | |
Net Asset Value, End of Period | | $ | 17.07 | | $ | 15.06 | | $ | 13.89 | | $ | 11.99 | |
| | | | | | | | | | | | | | |
Total Return | | | 16.04 | % | | 11.68 | % | | 15.85 | % | | 19.90 | %(b) |
| | | | | | | | | | | | | | |
Ratios/Supplementary Data: | | | | | | | | | | | | | |
| Net Assets at end of period (000) | | $ | 23,525 | | $ | 20,356 | | $ | 14,969 | | $ | 9,418 | |
| Ratio of expenses to average net assets | | | 2.72 | %(c) | | 2.38 | %(c) | | 2.45 | %(c) | | 4.62 | %(a) |
| Ratio of net investment loss | | | (0.55 | )%(c) | | (0.15 | )%(c) | | (0.76 | )%(c) | | (2.96 | )%(a) |
| Portfolio turnover | | | 36 | % | | 33 | % | | 44 | % | | 11 | % |
| * | The Commonwealth Global Fund commenced operations on December 3, 2002. |
| (b) | Aggregate total return, not annualized |
| (c) | In accordance with a requirement of the Securities and Exchange Commission, the ratios reflect total expenses prior to the reduction of “fees paid indirectly”. The ratios of expenses to average daily net assets and net investment income to average daily net assets net of fees paid indirectly would have been 2.72% and (0.55)%, respectively for the year ended October 31, 2006 and 2.33% and (0.10)%, respectively for the year ended October 31, 2005 and 2.40% and (0.71)%, respectively for the year ended October 31, 2004. |
The accompanying notes are an integral part of these financial statements.
COMMONWEALTH INTERNATIONAL SERIES TRUST
FINANCIAL HIGHLIGHTS
Selected data for a share outstanding throughout the years indicated.
| | | Commonwealth Real Estate Securities Fund | |
| | | | | | | | |
| | | For the Year Ended October 31, 2006 | | For the Year Ended October 31, 2005 | | For the Period Ended October 31, 2004** | |
Net Asset Value, Beginning of Period | | $ | 11.85 | | $ | 10.54 | | $ | 10.00 | |
| | | | | | | | | | | |
Investment Activities: | | | | | | | | | | |
| Net investment income | | | 0.04 | | | 0.11 | | | 0.02 | |
| Net realized and unrealized gains from investments | | | 2.28 | | | 1.28 | | | 0.52 | |
| Total from investment activities | | | 2.32 | | | 1.39 | | | 0.54 | |
| | | | | | | | | | | |
Distributions: | | | | | | | | | | |
| Net investment income | | | (0.11 | ) | | (0.07 | ) | | — | |
| Net realized gains | | | — | (d) | | (0.01 | ) | | — | |
| Total Distributions | | | (0.11 | ) | | (0.08 | ) | | — | |
| | | | | | | | | | | |
Net Asset Value, End of Period | | $ | 14.06 | | $ | 11.85 | | $ | 10.54 | |
| | | | | | | | | | | |
Total Return | | | 19.74 | % | | 13.11 | % | | 5.40 | %(b) |
| | | | | | | | | | | |
Ratios/Supplementary Data: | | | | | | | | | | |
| Net Assets at end of period (000) | | $ | 14,578 | | $ | 12,490 | | $ | 6,645 | |
| Ratio of expenses to average net assets | | | 2.87 | %(c) | | 2.66 | %(c) | | 3.45 | %(a)(c) |
| Ratio of net investment income | | | 0.29 | %(c) | | 0.93 | %(c) | | 0.33 | %(a)(c) |
| Portfolio turnover | | | 8 | % | | 5 | % | | 3 | % |
| ** | The Commonwealth Real Estate Securities Fund commenced operations on January 5, 2004. |
| (b) | Aggregate total return, not annualized |
| (c) | In accordance with a requirement of the Securities and Exchange Commission, the ratios reflect total expenses prior to the reduction of “fees paid indirectly”. The ratios of expenses to average daily net assets and net investment income to average daily net assets net of fees paid indirectly would have been 2.86% and 0.30%, respectively for the year ended October 31, 2006 and 2.62% and 0.97%, respectively for the year ended October 31, 2005 and 3.40% and 0.38%, respectively for the period ended October 31, 2004. |
| (d) | Value is less than $0.005. |
The accompanying notes are an integral part of these financial statements.
COMMONWEALTH INTERNATIONAL SERIES TRUST |
| NOTES TO FINANCIAL STATEMENTS - October 31, 2006 |
Note 1 - Organization
Commonwealth International Series Trust (the “Trust”) is registered under the Investment Company Act of 1940 (the “Act”), as a diversified open-end management investment company. The Trust currently consists of four diversified series: the Australia/New Zealand Fund, the Japan Fund, the Global Fund and the Real Estate Securities Fund (each a “Fund” and collectively the “Funds”).
Note 2 - Investment Objectives
Each Fund’s investment objective will be to provide long-term capital appreciation and current income.
The Australia/New Zealand Fund invests primarily in equity securities, including common stock, preferred stock, securities convertible into common stock and debt securities of Australia/New Zealand Issuers. Australian/New Zealand Issuers include: issuers that are organized under Australian or New Zealand law; issuers that are listed on the Australian and/or New Zealand Stock Exchanges regardless of the Country in which the Issuer is organized; issuers that derive 50% or more of their total revenue from goods and/or services produced or sold in Australia and/or New Zealand, and Australian or New Zealand central and local government entities.
The Japan Fund invests primarily in equity securities, including common stock, preferred stock, securities convertible into common stock and debt securities of Japanese Issuers. Japanese Issuers include issuers that are organized under Japanese law; issuers that are listed on the Japanese Stock Exchanges regardless of the Country in which the Issuer is organized; issuers that derive 50% or more of their total revenue from goods and/or services produced or sold in Japan, and Japanese central and local government entities.
The Global Fund invests in U.S. and foreign equity securities, including common stock, preferred stock, securities convertible into common stock and debt securities. Although the Fund can invest in companies of any size and from any country, it will generally focus on established companies in countries with developed economies.
The Real Estate Securities Fund seeks to invest its assets in common stock and other equity securities including preferred stock and securities convertible into common stock and debt securities of issuers in Real Estate Industries (i.e., those whose fortunes are impacted by the real estate market) which may include real estate investment trusts (REITs), publicly traded real estate development companies, real estate management companies, building supply companies, timber companies and other publicly-traded companies involved in real estate related activities and industries. Under normal conditions, at least 80% of the Fund’s total assets will be invested in securities of REITs and other publicly-traded real estate industry companies. The Fund’s investments normally will be allocated among a number of companies representing diverse investment policies and real property holdings. Consistent with the Fund’s investment objective, certain securities will be selected for high current return, while others will be chosen for long-term capital appreciation potential.
COMMONWEALTH INTERNATIONAL SERIES TRUST |
| NOTES TO FINANCIAL STATEMENTS - October 31, 2006 (continued) |
Note 3 - Significant Accounting Policies
The following is a summary of significant accounting policies consistently followed by the Funds in the preparation of its financial statements. The policies are in conformity with accounting principles generally accepted in the United States of America.
A) Valuation of Securities - Each Fund’s assets are valued primarily on the basis of market quotations or official closing prices or, if there is no recent last sales price available, at the last current bid quotation. Equity securities that are traded on the NASDAQ National Market System, for which quotations are readily available, are valued at the official closing price. If the Advisor determines that market quotations or official closing prices are not readily available or do not accurately reflect the fair value for a security, the fair value of the security or securities will be determined in accordance with procedures established by the Board of Trustees. Fair value prices are generally provided by an independent fair value service. Debt securities are priced either by using a market quotation or an independent pricing service. The pricing service may use a pricing model. Generally, debt instruments with maturities of less than 60 days (short-term debt) are valued at amortized cost. The Funds have instituted a policy whereby fair value prices provided by a pricing service will be utilized if certain conditions are met. For the year ended October 31, 2006, there were several instances where foreign securities in the Australia/New Zealand Fund and the Japan Fund were valued at fair value in good faith to take into consideration the extraordinary change occurring after the close of the foreign market.
B) New Accounting Pronouncements - On July 13, 2006 the Financial Accounting Standards Board (“FASB”) released FASB Interpretation No. 48 (“FIN 48”) “Accounting for the Uncertainty of Income Taxes”. FIN 48 provides guidance for how uncertain tax positions should be recognized, measured, presented and disclosed in the financial statements. FIN 48 requires the evaluation of tax positions taken in the course of preparing the Funds’ tax returns to determine whether the tax positions are “more-likely-than-not” of being sustained by the applicable tax authority. Tax benefits of positions not deemed to meet the more-likely-than-not threshold would be booked as a tax expense in the current year and recognized as: a liability for unrecognized tax benefits; a reduction of an income tax refund receivable; a reduction of deferred tax asset; an increase in deferred tax liability; or a combination thereof. Adoption of FIN 48 is required for fiscal years beginning after December 15, 2006. At this time, management is evaluating the implications of FIN 48 and its impact on the Funds’ financial statements has not yet been determined.
In September 2006, the FASB issued Statement on Financial Accounting Standards (“SFAS”) No. 157, “Fair Value Measurements.” This standard establishes a single authoritative definition of fair value, sets out a framework for measuring fair value and requires additional disclosures about fair value measurements. SFAS No. 157 applies to fair value measurements already required or permitted by existing standards. SFAS No. 157 is effective for financial statements issued for fiscal years beginning after November 15, 2007 and interim periods within those fiscal years. The changes to current accounting principles generally accepted in the United States of America from the application of this Statement relate to the definition of fair value, the methods used to measure fair value, and the expanded disclosures about fair value measurements. As of October 31, 2006, the Funds do not believe the adoption of SFAS No. 157 will impact the financial statement amounts; however, additional disclosures may be required about the inputs used to develop the measurements and the effect of certain of the measurements on changes in net assets for the period.
COMMONWEALTH INTERNATIONAL SERIES TRUST |
| NOTES TO FINANCIAL STATEMENTS - October 31, 2006 (continued) |
C) Currency Translation - For purposes of determining each Fund’s net asset value, all assets and liabilities initially expressed in foreign currency values are converted into U.S. dollar values at the prevailing market rate on each U.S. business day. The cost of securities is determined by using historical exchange rates. Income is translated at approximate rates prevailing when accrued. The Funds do not isolate that portion of gains and losses on investments which is due to changes in foreign exchange rates from that which is due to changes in the market prices of the investments. Such fluctuations are included with the net realized and unrealized gains and losses from investments.
D) Accounting for Investments - Security transactions are accounted for on the trade date. Realized gains and losses on security transactions are based on the identified cost basis for both financial statement and Federal income tax purposes. Dividend income and distributions to shareholders are recorded on the ex-dividend date. Discounts and premiums on bonds purchased are amortized over the life of the bonds. Interest income and estimated expenses are accrued daily.
E) Federal Income Taxes - No provision has been made for Federal income taxes since it is the policy of each Fund to continue to comply with the special provisions of the Internal Revenue Code applicable to regulated investment companies and to distribute all of its taxable income and realized capital gains, to relieve it from all, or substantially all, such taxes.
Dividends or interest on foreign securities may be subject to the withholding of the country of domicile’s income tax by tax treaty provisions or otherwise. Generally there are no foreign taxes applicable to the Funds’ capital gains realized on foreign securities in their country of domicile.
F) Distributions to Shareholders - The Funds distribute net investment income, if any, and net realized gains (net of any capital loss carryovers) annually. Income and capital gain distributions are determined in accordance with income tax regulations which may differ from accounting principles generally accepted in the United States of America. These differences are primarily due to differing treatments for foreign currency transactions, short-term gains and capital loss carryovers.
G) Option Accounting Principles - When a Fund sells an option, the premium received is recorded as a liability. Each day the option contract liability is valued in accordance with the procedures for security valuation discussed above. When an offsetting option is purchased (a closing transaction) or the option contract expires, the Fund realizes a gain or loss and the liability related to such option contract is eliminated. When a call option is exercised, the Fund realizes a gain or loss from the sale of the underlying security and the proceeds of the sale are increased by the premiums originally received.
COMMONWEALTH INTERNATIONAL SERIES TRUST |
| NOTES TO FINANCIAL STATEMENTS - October 31, 2006 (continued) |
When a Fund purchases an option, the premium paid is recorded as an asset. Each day the option contract is valued in accordance with the procedures for security valuation discussed above. When an offsetting option is written (a closing transaction) or the option contract expires, the Fund realizes a gain or loss and the asset representing such option contract is eliminated. When a call option is exercised, the Fund purchases the underlying security and the cost basis of such purchase is increased by the premium originally paid.
H) Forward Currency Contracts - Forward currency transactions are undertaken to hedge against possible variations in the foreign exchange rates between the United States Dollar and foreign currencies. A forward currency contract is an agreement between two parties to buy or sell a currency at a set price on a future date. Forward contracts are marked-to-market daily and the change in the market value is recorded by the Fund as an unrealized gain or loss. When a contract is closed, the Fund records a realized gain or loss equal to the difference between the value of the contract at the time it was opened and the value at the time it was closed. The Funds could be exposed to risk if the counterparties are unable to meet the terms of the contracts or if the value of the currency changes unfavorably.
At October 31, 2006, the Funds have no forward currency contracts outstanding.
I) Repurchase Agreements - In connection with transactions in repurchase agreements, it is the Funds’ policy that their custodian bank takes possession of the underlying collateral securities, the fair value of which must be equal to the principal amount of the repurchase agreement including accrued interest throughout the term of the repurchase agreement. If the seller defaults and the fair value of the collateral declines, realization of the collateral value by the Funds may be delayed or limited.
J) Use of Estimates - The preparation of the financial statements in conformity with accounting principles generally accepted in the United States of America requires management to make estimates and assumptions that affect the reported amounts of assets and liabilities and the disclosure of contingent assets and liabilities at the date of the financial statements and the reported amounts of increases and decreases in net assets from operations during the reporting period. Actual results can be expected to differ from those estimates.
Note 4 - Investment Advisory Fees, Administrative Fees and Other Transactions with Affiliates
The Funds retain FCA Corp, (“FCA”) as their Investment Adviser. Under the Investment Advisory Agreement (the “Agreement”), the Advisor is paid a monthly fee based on the average daily net assets at the annual rate of 0.75%. Certain officers of the Trust are also officers of FCA Corp.
COMMONWEALTH INTERNATIONAL SERIES TRUST |
| NOTES TO FINANCIAL STATEMENTS - October 31, 2006 (continued) |
InCap Fund Administration, Inc. (“IFA”) was contracted to perform administrative services for the Funds. For its services IFA received monthly fees of $16,000 for July 2005; $18,000 per month for August - December 2005; $16,000 per month for January - May 2006; and $12,000 per month for June - October 2006, which is allocated based on average net assets among the current four series of the Trust. In addition, an asset based fee was charged on the following schedule: 0.075% on daily net assets between $110 million and $210 million; and 0.05% on daily net assets in excess of $210 million. For the year ended October 31, 2006, administration expense amounted to $88,439, $24,782, $49,740 and $32,545 from the Australia/New Zealand Fund, the Japan Fund, the Global Fund, and the Real Estate Securities Fund, respectively. Effective November 1, 2006, BISYS Fund Services Ohio, Inc. became the administrator of the Funds.
Matrix Capital Group, Inc. (“Matrix”), a registered transfer agent, was contracted as accounting, transfer and shareholder servicing agent. The contract provides for an annual fee of $240,000, which is allocated based on average net assets among the current four series of the Trust. In addition, a shareholder account registration charge of $12 per shareholder account per year is payable monthly. Also an asset based fee will be charged on the following schedule: 0.10% on daily net assets between $110 million and $210 million; 0.05% on daily net assets in excess of $210 million. For the year ended October 31, 2006, Matrix earned $162,520, $31,511, $65,934 and $39,016 from the Australia/New Zealand Fund, the Japan Fund, the Global Fund, and the Real Estate Securities Fund, respectively. Certain officers of the Trust were also employees of Matrix for the fiscal year ended October 31, 2006.
Matrix Capital Group, Inc., a registered broker dealer, (the “Distributor”) was contracted with the Trust to serve as the Distributor. For its services, the Distributor receives an annual fee of $20,000. The fees are allocated to the Funds based on their respective percentage of the Trust’s aggregate average net assets for each month. These fees for distribution are paid from accruals made with respect to the Service and Distribution Plan pursuant to Rule 12b-1. For the year ended October 31, 2006, Matrix received fees of $20,000. Certain officers of the Distributor are also officers of Matrix. Matrix also receives $5,000 per Fund for prospectus compliance services rendered to the Funds from June - October 2006. This expense has been included with Administration expense.
The Funds have adopted a Service and Distribution Plan (the “Plan”) pursuant to Rule 12b-1 under the Act whereby Fund assets are used to reimburse the Distributor for costs and expenses incurred with the distribution and marketing of shares of the Funds and servicing of Fund shareholders. Distribution and marketing expenses include, among other things, printing of prospectuses, marketing literature, and costs of personnel involved with the promotion and distribution of the Funds’ shares. Under the Plan, the Funds pay the Distributor an amount computed at an annual rate of up to 0.25% of the Funds’ average net assets (including reinvested dividends paid with respect to those assets). Of this amount, the Distributor may reallocate to securities dealers (which may include the Distributor itself) and other financial institutions and organizations (collectively, “Service Organizations”) amounts based on the Funds’ average net assets owned by stockholders for whom the Service Organizations have a servicing relationship. For the year ended October 31, 2006, the Funds incurred Rule 12b-1 fees of $103,197, $23,570, $53,575, and $33,659, for the Australia/New Zealand Fund, the Japan Fund, the Global Fund and the Real Estate Securities Fund, respectively. Certain officers and trustees of the Funds, who are also officers and directors of the Adviser, the Administrator, or Distributor, received no compensation from the Funds.
COMMONWEALTH INTERNATIONAL SERIES TRUST |
| NOTES TO FINANCIAL STATEMENTS - October 31, 2006 (continued) |
For the year ended October 31, 2006, trustees of the Funds who are not “interested persons” received trustees’ fees and reimbursed expenses of $71,513.
The Trust entered into a Commission Recapture Agreement (the “Agreement”) with Fifth Third Bank (the Funds’ custodian) and Fifth Third Securities, Inc. (an affiliated broker/dealer of the custodian). Under the Agreement, the Trust recaptured a portion of the commissions each Fund paid to Fifth Third Securities, Inc. for the purpose of paying eligible expenses incurred by the Funds. Recaptured amounts are based upon a rebate calculation detailed in the Agreement. During the year ended October 31, 2006, the Funds recaptured expenses of $100, $564, $249 and $352 for the Australia/New Zealand Fund, the Japan Fund, the Global Fund and the Real Estate Securities Fund, respectively. The recaptured amounts were applied to the amounts due under a separate Custody Service Agreement with the custodian. The custodian fees caption on the statement of operations and the expense ratios in the financial highlights include the amounts that would have been incurred by the Funds for such services had they paid for the services directly in arms-length transactions. Such amounts are also shown as a corresponding reduction in total expenses, captioned as “fees paid indirectly”. Effective, May 10, 2006 this agreement was terminated by the Trust.
Note 5 - Investments in Affiliates
The Global Fund invests a portion of its assets in both the Australia/New Zealand Fund and the Japan Fund. The Funds are considered to be affiliated under the Investment Company Act of 1940 because they have the same Investment Advisor. When computing both the Advisory fee and the Rule 12b-1 fee for the Global Fund, average daily net assets are reduced by Fund assets invested in the Australia/New Zealand Fund and the Japan Fund. Details of the Global Fund’s holdings in the Australia/New Zealand and Japan Funds and related transactions during the year ended October 31, 2006 appear below.
| | | Beginning Shares | | Purchases | | Sales | | Ending Shares | | Dividend Income* | | Market Value | |
| Australia/New Zealand Fund | | | 34,855 | | | 2,770 | | | — | | | 37,625 | | $ | 16,600 | | $ | 656,183 | |
| Japan Fund | | | 36,589 | | | 443 | | | — | | | 37,032 | | | — | | | 159,978 | |
| Totals | | | | | | | | | | | | | | $ | 16,600 | | $ | 816,161 | |
* Dividends received were reinvested into the Australia/New Zealand Fund and the Japan Fund. The Global Fund received 2,770 shares and 443 shares of Australia/New Zealand Fund and the Japan Fund, respectively, from the reinvested dividends, includes capital gains distributions.
Note 6 - Capital Stock
At October 31, 2006 there were shares outstanding of 2,012,095, 1,916,593, 1,378,092 and 1,036,516 for the Australia/New Zealand Fund, the Japan Fund, the Global Fund, and the Real Estate Securities Fund, respectively. Transactions in capital stock were as follows:
COMMONWEALTH INTERNATIONAL SERIES TRUST |
| NOTES TO FINANCIAL STATEMENTS - October 31, 2006 (continued) |
| | | Commonwealth Australia/New Zealand Fund | |
| | | Year Ended October 31, 2006 | | Year Ended October 31, 2005 | |
| | | SHARES | | DOLLARS | | SHARES | | DOLLARS | |
| Shares sold | | | 691,048 | | $ | 11,077,046 | | | 9,987,72 | | $ | 164,264,337 | |
| Shares reinvested | | | 202,990 | | | 3,119,952 | | | 254,995 | | | 4,069,718 | |
| Shares redeemed | | | (2,106,168 | ) | | (33,356,377 | ) | | (9,647,640 | ) | | (158,636,669 | ) |
| Net Increase/(Decrease) | | | (1,212,130 | ) | $ | (19,159,379 | ) | | 595,083 | | $ | 9,697,386 | |
| | | Commonwealth Japan Fund | |
| | | Year Ended October 31, 2006 | | Year Ended October 31, 2005 | |
| | | SHARES | | DOLLARS | | SHARES | | DOLLARS | |
| Shares sold | | | 2,585,011 | | $ | 11,321,549 | | | 49,939,494 | | $ | 181,902,701 | |
| Shares reinvested | | | 14,445 | | | 65,578 | | | — | | | — | |
| Shares redeemed | | | (2,705,971 | ) | | (12,046,511 | ) | | (50,099,037 | ) | | (183,104,196 | ) |
| Net Decrease | | | (106,515 | ) | $ | (659,384 | ) | | (159,543 | ) | $ | (1,201,495 | ) |
| | | Commonwealth Global Fund | |
| | | Year Ended October 31, 2006 | | Year Ended October 31, 2005 | |
| | | SHARES | | DOLLARS | | SHARES | | DOLLARS | |
| Shares sold | | | 93,309 | | $ | 1,506,243 | | | 2,020,029 | | $ | 29,682,048 | |
| Shares reinvested | | | 31,567 | | | 490,867 | | | 35,405 | | | 528,241 | |
| Shares redeemed | | | (98,826 | ) | | (1,584,285 | ) | | (1,780,889 | ) | | (26,042,330 | ) |
| Net Increase | | | 26,050 | | $ | 412,825 | | | 274,545 | | $ | 4,167,959 | |
| | | Commonwealth Real Estate Securities Fund | |
| | | Year Ended October 31, 2006 | | Year Ended October 31, 2005 | |
| | | SHARES | | DOLLARS | | SHARES | | DOLLARS | |
| Shares sold | | | 162,866 | | $ | 2,076,563 | | | 509,753 | | $ | 5,875,244 | |
| Shares reinvested | | | 9,722 | | | 118,702 | | | 4,264 | | | 49,754 | |
| Shares redeemed | | | (190,023 | ) | | (2,440,353 | ) | | (90,563 | ) | | (1,053,107 | ) |
| Net Increase/(Decrease) | | | (17,435 | ) | $ | (245,088 | ) | | 423,454 | | $ | 4,871,891 | |
COMMONWEALTH INTERNATIONAL SERIES TRUST |
| NOTES TO FINANCIAL STATEMENTS - October 31, 2006 (continued) |
Note 7 - Purchases and Sales of Securities
Purchases and sales of investment securities (excluding short-term securities) by the Funds for the year ended October 31, 2006 were as follows:
| | | Purchases | | Sales | |
| Australia/New Zealand Fund | | $ | 7,850,434 | | $ | 24,724,420 | |
| Japan Fund | | | 4,414,098 | | | 4,574,168 | |
| Global Fund | | | 8,166,555 | | | 7,749,212 | |
| Real Estate Securities Fund | | | 1,507,109 | | | 1,054,730 | |
Note 8 - Options Written by the Global Fund and the Real Estate Securities Fund
A call option gives the holder the right to buy the underlying stock from the writer (the Funds) at a specified price within a fixed period of time. Therefore, the securities held by the Funds against which options are written may not be traded and are held in escrow by the custodian.
Written option activity for the year ended October 31, 2006 was as follows:
| | Commonwealth Global Fund | |
| | | Number of Options | | Amount of Premium | |
| Options outstanding at October 31, 2005 | | | 272 | | $ | 80,836 | |
| Options written | | | 85 | | | 51,278 | |
| Options expired | | | (70 | ) | | (19,569 | ) |
| Options covered | | | (272 | ) | | (108,620 | ) |
| Options called | | | (15 | ) | | (3,925 | ) |
| Options outstanding at October 31, 2006 | | | — | | $ | — | |
| | | | | | | | |
| | | Commonwealth Real Estate Securities Fund | |
| | | Number of Options | | Amount of Premium | |
| Options outstanding at October 31, 2005 | | | 35 | | $ | 17,534 | |
| Options written | | | 20 | | | 9,335 | |
| Options expired | | | — | | | — | |
| Options covered | | | (35 | ) | | (17,534 | ) |
| Options called | | | — | | | — | |
| Options outstanding at October 31, 2006 | | | 20 | | $ | 9,335 | |
As of October 31, 2006, the aggregate market value of securities subject to call options written is $107,560 or .74% of net assets for the Real Estate Securities Fund.
COMMONWEALTH INTERNATIONAL SERIES TRUST |
| NOTES TO FINANCIAL STATEMENTS - October 31, 2006 (continued) |
Note 9 - Tax Matters
As of October 31, 2006, the Funds’ most recent fiscal year end, the components of distributable earnings on a tax basis for the Funds were as follows:
| | | Undistributed Ordinary Income | | Undistributed Long-Term Capital Gains | | Unrealized Appreciation | | Distributable Earnings | |
| Australia/New Zealand Fund | | $ | 930,253 | | $ | 3,752,070 | | $ | 8,824,798 | | $ | 13,507,121 | |
| Japan Fund | | | 217,022 | | | 902,979 | | | 1,708,319 | | | 2,828,320 | |
| Global Fund | | | — | | | 1,254,436 | | | 5,786,371 | | | 7,040,807 | |
| Real Estate Securities Fund | | | — | | | 24,423 | | | 3,802,516 | | | 3,826,939 | |
The difference between book basis and tax basis unrealized appreciation (depreciation) is attributable primarily to the tax deferral of losses on wash sales. The difference between book basis undistributed net investment income and tax basis undistributed ordinary income is attributable primarily to differing book/tax treatment of short term capital gains.
As of October 31, 2006, the Funds had loss deferrals available for federal income tax purposes as of October 31, 2006 as follows:
| | | Deferred for Tax Purposes | |
| Australia/New Zealand Fund | | $ | 39,491 | |
| Japan Fund | | | 1,295 | |
| Global Fund | | | — | |
| Real Estate Securities Fund | | | 1,520 | |
The losses deferred for tax purposes consist of losses deferred on wash sales.
For U.S. federal income tax purposes, the cost of securities owned, gross appreciation, gross depreciation and net unrealized appreciation/(depreciation) of investments at October 31, 2006 for each fund:
| | | Cost | | Gross Appreciation | | Gross Depreciation | | Net Appreciation | |
| Australia/New Zealand Fund | | $ | 25,549,272 | | $ | 9,378,818 | | $ | (554,020 | ) | $ | 8,824,798 | |
| Japan Fund | | | 6,572,875 | | | 2,047,381 | | | (339,062 | ) | | 1,708,319 | |
| Global Fund | | | 17,571,746 | | | 6,006,836 | | | (220,465 | ) | | 5,786,371 | |
| Real Estate Securities Fund | | | 10,775,005 | | | 3,922,176 | | | (119,660 | ) | | 3,802,516 | |
COMMONWEALTH INTERNATIONAL SERIES TRUST |
| NOTES TO FINANCIAL STATEMENTS - October 31, 2006 (continued) |
The tax character of distributions paid for the year ended October 31, 2006 and for the year ended October 31, 2005 were as follows:
| | | Year ended October 31, 2006 | |
| | | Ordinary Income | | Long-Term Capital Gains | | Total Distributions Paid | |
| Australia/New Zealand Fund | | $ | 1,815,919 | | $ | 1,960,068 | | $ | 3,775,987 | |
| Japan Fund | | | — | | | 121,620 | | | 121,620 | |
| Global Fund | | | 22,634 | | | 472,447 | | | 495,081 | |
| Real Estate Securities Fund | | | 110,782 | | | 9,214 | | | 119,996 | |
| | | |
| | Year ended October 31, 2005 |
| | Ordinary Income | | Long-Term Capital Gains | | Total Distributions Paid | |
| Australia/New Zealand Fund | | $ | 2,477,137 | | $ | 2,375,812 | ) | $ | 4,852,949 | |
| Global Fund | | | 276,742 | | | 252,017 | ) | | 528,759 | |
| Real Estate Securities Fund | | | 50,535 | | | — | ) | | 50,535 | |
There were no distributions paid for the Japan Fund during the year ended October 31, 2005.
Note 10 - Revolving Credit Agreement
The Trust has entered into a Revolving Credit Agreement with Fifth Third Bank N.A. (the “Bank”). Pursuant to the terms of the Agreement, the Bank makes available to the Trust a line of credit facility under which the Bank may make loans to the Trust on behalf of the Funds from time to time as permitted under the Investment Company Act of 1940. Under the terms of the Line of Credit facility, the Trust is permitted to borrow up to the amount of $10,000,000.00. Any principal balance outstanding shall bear interest at the Federal Funds Rate in effect at that time, plus 1.50%. The Australia/New Zealand Fund and the Japan Fund had outstanding loans of $209,192 and $178,702 as of October 31, 2006. There were no loans outstanding for the Global Fund and the Real Estate Securities Fund as of October 31, 2006. The average amount of borrowings and the average interest rate on those borrowings by the Trust during the year ended October 31, 2006 were as follows:
| | | Average Principal | | Average Interest Rate | |
| Australia/New Zealand Fund | | $ | 303,349 | | | 6.36 | % |
| Japan Fund | | | 25,802 | | | 6.54 | % |
| Global Fund | | | 1,190 | | | 6.51 | % |
| Real Estate Securities Fund | | | 460 | | | 6.50 | % |
COMMONWEALTH INTERNATIONAL SERIES TRUST |
| NOTES TO FINANCIAL STATEMENTS - October 31, 2006 (continued) |
Note 11 - Reclass of Capital Accounts
In accordance with accounting pronouncements, the Funds have recorded reclassifications in the capital accounts. These reclassifications have no impact on the net asset value of the Funds and are designed generally to present undistributed net investment income and accumulated net realized gain on a tax basis which is considered to be more informative to the shareholder. As of October 31, 2006, the Funds recorded the following reclassifications to increase (decrease) the capital accounts listed below:
| | | Undistributed Net Investment Income | | Net realized gain (Accumulated losses) | |
| Australia/New Zealand Fund | | $ | (284,037 | ) | $ | 284,037 | |
| Japan Fund | | | 174,552 | | | (174,552 | ) |
| Global Fund | | | 123,331 | | | (123,331 | ) |
| Real Estate Securities Fund | | | 9,214 | | | (9,214 | ) |
Note 12 - Other Matters
The Commonwealth Funds, as previously disclosed in the Funds’ 2005 Annual Report and 2006 Semi- Annual Report to its shareholders filed with the SEC, were the subject of an investigation by the staff of the SEC concerning the Funds’ policies, procedures and disclosures relating to market timing transactions in the Australia/New Zealand and Japan Funds by certain investors, and use of the Funds’ borrowing authority to meet large redemption requests. There has been no allegation that anyone at FCA (the “Advisor”) or the Funds entered into any agreements or arrangements with market timers to permit market timing transactions in violation of Funds’ policies, or engaged in any deceptive practices to circumvent Fund policies.
As previously noted in the Funds’ 2006 Semi-annual Report, the SEC staff determined not to recommend that the SEC bring any enforcement action against the Funds or the Funds’ Trustees. Further, the staff also determined that it would not recommend any enforcement action against the Advisor and Mr. Robert W. Scharar, an interested Trustee and President of the Funds and President of the Advisor, relating to the adequacy of the Funds’ prospectus disclosure regarding the volume of, and the Funds’ policies governing, frequent short-term transactions in the Funds. However, the staff indicated that it was prepared to recommend an administrative proceeding against the Advisor and Mr. Scharar arising from the use of the Funds’ line of credit in excess of the Funds’ borrowing limitations set forth in the Funds’ prospectus.
COMMONWEALTH INTERNATIONAL SERIES TRUST |
| NOTES TO FINANCIAL STATEMENTS - October 31, 2006 (continued) |
The Advisor and Mr. Scharar, without admitting or denying any of the SEC’s findings, reached a settlement with the SEC to resolve this matter without further litigation. Under the terms of the settlement, the SEC issued an administrative order dated November 29, 2006 sanctioning Mr. Scharar and the Advisor for violations of Sections 13(a)(2) and 34(b) of the Act through a censure, a civil monetary penalty of $25,000 each, and an order that they cease and desist future violations of these provisions. The order acknowledges that Mr. Scharar and FCA cooperated with the SEC staff in its investigation and took remedial steps by, among other things, making a payment, with interest, to the Australia/New Zealand Fund and the Japan Fund of certain amounts of interest incurred by those Funds on the amounts borrowed in excess of borrowing limitations. The payments made amounted to $6,148 and $13,753 for the Australia/New Zealand Fund and the Japan Fund, respectively. These amounts are reflected as expense reimbursement by advisor in the Statement of Operations. A portion of the initial payment made to the Japan Fund was deposited into the custody account of the Australia/New Zealand Fund in error. Accordingly, the Japan Fund has a receivable due from the Australia/New Zealand Fund as of October 31, 2006 in the amount of $6,344 and the Australia/New Zealand Fund has a corresponding payable due to the Japan Fund in the same amount. Mr. Scharar will remain an officer and trustee of the Funds and FCA will remain the Funds’ Advisor. In his capacity as the Funds President and Trustee, Mr. Scharar requested, during the year ended October 31, 2006, that the Trust indemnify him for legal fees and expenses associated with his defense of this matter. On December 19, 2006, the Independent Trustees after considering all relevant facts and materials, including the opinion of Fund Counsel, has approved reimbursement of a portion of such legal fees and expenses excluding the fines, as well as the allocation of this indemnity cost to each of the funds based upon their relative average daily net assets.
Expenses incurred by the Funds in connection with this investigation impacted the net assets of the Funds and impacted each Fund’s NAV and the value of the investment made by each of the Funds’ shareholders.
Note 13 - Contractual Obligations
The Funds’ Declaration of Trust and other Trust Agreements contain indemnification provisions which may or may not be covered by insurance, including legal fees incurred by its Advisor in connection with the SEC investigation described in Note 12 above. Except as described below, no such claims are outstanding. The Funds may be subject to unanticipated claims for which no provision has been made in the financial statements.
Subsequent to the end of the fiscal year, Mr. Scharar, in his capacity as an officer and a Trustee of the Trust, pursuant to provisions in the Declaration of Trust allowing indemnification, requested reimbursement of $230,000, which represents a portion of the legal fees and costs incurred by him in defense of administrative proceedings initiated by the SEC. The administrative proceedings alleged violations of certain disclosures in the Trust’s prospectus relating to market timing activities and borrowing limitations. The administrative proceedings were settled as described in Note 12 above. The Trustees who are not “interested persons”, as that term is defined in Section 2(a)(19) of the Act determined that Mr. Scharar had not engaged in the type of disabling conduct enumerated in Section 17(h) of the Act and concluded that it was in the best interest of the Trust to reimburse him for the requested fees and costs. For the fiscal year ended October 31, 2006, the amounts of the indemnity expense incurred under this arrangement amounted to $109,854, $25,118, $59,140 and $35,888 for the Australia/New Zealand Fund, the Japan Fund, the Global Fund and the Real Estate Securities Fund, respectively. Amounts accrued and due to Mr. Scharar under this arrangement as of October 31, 2006 were $97,072, $22,196, $52,259 and $31,712 for the Australia/New Zealand Fund, the Japan Fund, the Global Fund and the Real Estate Securities Fund, respectively. The differences between the amounts of the indemnity expense and the amounts accrued as of October 31, 2006, represent amounts that were advanced to Mr. Scharar on this indemnity claim prior to October 31, 2006.
COMMONWEALTH INTERNATIONAL SERIES TRUST |
| NOTES TO FINANCIAL STATEMENTS - October 31, 2006 (continued) |
Note 14 - Concentration of Market Risk
The Australia/New Zealand Fund has a majority of its investments in securities issued by Australian and New Zealand companies and the Japan Fund invests exclusively in securities issued by Japanese companies. Investing in companies from specific geographic regions, such as Australia, New Zealand or Japan, may pose additional risks inherent to a region’s economical and political situation. These events will not necessarily affect the U.S. economy or similar issuers located in the U.S. In addition, many of the investments in Australia, New Zealand or Japan are denominated in foreign currencies. As a result, changes in the values of these currencies compared to the U.S. dollar may affect (positively or negatively) the value of the Funds’ investments. These events may happen separately from, and in response to, events that do not otherwise affect the values of the securities in the issuers’ home countries.
A large portion of investments held by the Real Estate Securities Fund are considered investments in the real estate sector of the market. Investing in a single market sector may be riskier than investing in a variety of market sectors.
COMMONWEALTH INTERNATIONAL SERIES TRUST |
| |
REPORT OF INDEPENDENT REGISTERED PUBLIC ACCOUNTING FIRM |
To the Shareholders and Board of Trustees
Commonwealth International Series Trust
We have audited the statements of assets and liabilities, including the schedules of investments, of Commonwealth Australia/New Zealand Fund, Commonwealth Japan Fund, Commonwealth Global Fund and Commonwealth Real Estate Securities Fund, each a series of shares of beneficial interest of Commonwealth International Series Trust, as of October 31, 2006, and the related statements of operations for the year then ended, the statements of changes in net assets for each of the years in the two-year period then ended, and the financial highlights for each of the years or periods in the five-year period then ended. These financial statements and financial highlights are the responsibility of the Trust's management. Our responsibility is to express an opinion on these financial statements and financial highlights based on our audits.
We conducted our audits in accordance with the standards of the Public Company Accounting Oversight Board (United States). Those standards require that we plan and perform the audit to obtain reasonable assurance about whether the financial statements and financial highlights are free of material misstatement. An audit includes examining, on a test basis, evidence supporting the amounts and disclosures in the financial statements. Our procedures included confirmation of securities owned as of October 31, 2006 by correspondence with the custodian and brokers. An audit also includes assessing the accounting principles used and significant estimates made by management, as well as evaluating the overall financial statement presentation. We believe that our audits provide a reasonable basis for our opinion.
In our opinion, the financial statements and financial highlights referred to above present fairly, in all material respects, the financial position of Commonwealth Australia/New Zealand Fund, Commonwealth Japan Fund, Commonwealth Global Fund and Commonwealth Real Estate Securities Fund as of October 31, 2006, the results of their operations for the year then ended, the changes in their net assets for each of the years in the two-year period then ended, and their financial highlights for each of the years or periods in the five-year period then ended in conformity with accounting principles generally accepted in the United States of America.
BRIGGS, BUNTING & DOUGHERTY, LLP
Philadelphia, Pennsylvania
December 19, 2006
COMMONWEALTH INTERNATIONAL SERIES TRUST
Additional Information (Unaudited)
The Funds file their complete schedule of portfolio holdings with the Securities and Exchange Commission (the “Commission”) for the first and third quarters of each fiscal year on Form N-Q. The Funds’ Forms N-Q are available on the Commissions website at http://www.sec.gov. The Funds’ Forms N-Q may be reviewed and copied at the Commission’s Public Reference Room in Washington, DC. Information on the operation of the Commission’s Public Reference Room may be obtained by calling 1-800-SEC-0330.
A description of the policies and procedures that the Funds use to determine how to vote proxies relating to portfolio securities is available without charge, upon request, by calling 1-888-345-1898; and on the Commissions website at http://www.sec.gov.
Information regarding how the Fund voted proxies relating to portfolio securities during the most recent 12-month period ended June 30 is available without charge, upon request, by calling 1-888-345-1898; and on the Commission’s website at http://www.sec.gov
Tax Information (Unaudited)
We are required to advise you within 60 days of the Funds’ fiscal year end regarding the federal tax status of certain distributions received by shareholders during such fiscal year. The information below is provided for the fiscal year ended October 31, 2006.
During the fiscal year ended October 31, 2006, the following Funds paid distributions derived from long-term capital gains, and hereby designate as capital gain dividends pursuant to Internal Revenue Code Section 852(b)(3)(c) the following amounts:
| | | | |
| Australia/New Zealand Fund | | $ | 1,960,068 | |
| Japan Fund | | | 121,620 | |
| Global Fund | | | 472,447 | |
| Real Estate Securities Fund | | | 9,214 | |
COMMONWEALTH INTERNATIONAL SERIES TRUST
APPROVAL OF THE RENEWAL OF INVESTMENT ADVISORY AGREEMENT
(COMMONWEALTH INTERNATIONAL SERIES TRUST)
Each series of the Commonwealth International Series Trust (collectively, the “Funds”) has entered into an investment advisory agreement with FCA Corp (“FCA” or the “Adviser”) (collectively, the “Advisory Agreement”). Pursuant to the Advisory Agreement, FCA is responsible for the day-to-day investment management of each Fund’s assets.
The Investment Company Act of 1940 (“1940 Act”) requires that the investment advisory agreements between the Investment Adviser and the Trust be approved initially and annually by: (i) the vote of the Board of Trustees; and (ii) the vote of a majority of the Independent Trustees who are not parties to the Advisory Agreement or “interested persons” (as defined under the 1940 Act), cast in person at a meeting called for the purpose of voting on such approval. In connection with their consideration of such approvals, the Board must request and evaluate, and FCA is required to furnish, such information as may be reasonably necessary to evaluate the terms of the Advisory Agreement. In addition, the Securities and Exchange Commission (“SEC”) takes the position that, as part of their fiduciary duties with respect to a fund’s fees, fund Boards are required to evaluate the material factors applicable to make a decision to approve an Advisory Agreement.
Consistent with the responsibilities referenced above, the Board called and held a meeting on May 10, 2006, to consider whether to renew the Advisory Agreement. In preparation for the meeting, the Board provided FCA with a written request for information and received and reviewed extensive written materials in response to that request, including information as to the performance of the Funds versus benchmarks; the levels of fees for various categories of services provided by FCA and its affiliates; the overall expense ratio of each Fund, comparisons of such fees and expenses with such fees and expenses incurred by other funds; the costs to FCA of providing such services; including a profitability analysis; FCA’s compliance program; and various other matters. The information provided in connection with the Board meeting was in addition to the detailed information about the Funds that the Board reviews during the course of each year, including information that relates to the Funds' operations and the Funds’ performance. The Trustees also received a memorandum from Fund counsel regarding the responsibilities of trustees in connection with their consideration of an investment advisory agreement.
The Independent Trustees met in executive session, outside the presence of Fund management, and evaluated a variety of factors relating to the approval of the Advisory Agreement. The Independent Trustees also participated in question and answer sessions with representatives of the Adviser. Thereafter, the Board met again on May 19, 2006, at which time the Board, including the Independent Trustees, believing it to be in the best interests of each of the Funds, unanimously approved the renewal of the Advisory Agreement for an additional one-year period. The approval was based on the Independent Trustees and the Board’s consideration and evaluation of a variety of specific factors discussed at the Board meetings.
COMMONWEALTH INTERNATIONAL SERIES TRUST
1. Information Received
In evaluating the Investment Advisory Agreements, the Independent Trustees reviewed materials furnished by the Investment Adviser, including a list of personnel which disclosed employee background and experience; financial statements of the Investment Adviser; investment performance and experience managing funds and other information regarding the Investment Adviser or its affiliates and personnel; its operations and financial condition. The Independent Trustees discussed the operations of the Trust and the capabilities of the Investment Adviser to provide advisory and other services to the Trust. Among other information, the Independent Trustees reviewed information regarding:
| | • | the investment performance of each Fund; |
| | • | the fees charged by the Investment Adviser for investment advisory services, as well as other compensation received by the Investment Adviser; |
| | • | the projected total operating expenses of each Fund; |
| | • | the investment performance, fees and total expenses of investment companies with similar objectives and strategies managed by other investment advisers; |
| | • | the experience of the Investment Adviser and other personnel providing services to the Funds and the historical quality of the services provided by the Investment Adviser; and |
| • | the profitability to the Investment Adviser of managing each Fund. |
The Independent Trustees specifically considered the following as relevant to their recommendations: (1) the favorable history, reputation, qualification and background of the Investment Adviser, as well as the qualifications of its personnel and its financial condition; (2) that the fee and expense ratios of each Fund are reasonable given the quality of services expected to be provided comparable to the fee and expense ratios of similar investment companies; (3) the relative performance of the Funds since commencement of operations to comparable investment companies and unmanaged indices; and (4) other factors that the Independent Trustees deemed relevant. The Independent Trustees deemed each of these factors to be relevant to their consideration of the investment advisory agreement.
2. Nature, Extent and Quality of Services
FCA, its personnel and its resources - The Independent Trustees considered the depth and quality of FCA’s investment management process, including its research capabilities; the experience, capability and integrity of its senior management personnel, all of whom have been performing similar functions for the Funds for several consecutive years; its key personnel; the overall financial strength and stability of its organization; and the ability of its organizational structure to address the recent growth in assets under management. The Independent Trustees also considered that FCA made available a variety of resources and systems relating to investment management, compliance, trading, performance and portfolio accounting. The Independent Trustees considered FCA’s commitment to investing in information technology supporting investment management and compliance. The Independent Trustees further considered FCA’s continuity and the commitment of its management to continue to attract and retain qualified personnel and to maintain and enhance its resources and systems. The Independent Trustees considered FCA’s creativity in responding to difficult situations, and the commitment of FCA personnel to finding alternatives and options that allow the Funds to maintain their goals. Further, the Independent Trustees considered FCA’s continued cooperation with the Independent Trustees, the Chief Compliance Officer for the Fund and legal counsel for the Independent Trustees. The Independent Trustees also considered FCA’s continued unlimited access to information relating to the Funds.
COMMONWEALTH INTERNATIONAL SERIES TRUST
Other Services - The Independent Trustees considered FCA’s policies, procedures and systems to ensure compliance with applicable laws and regulations and its commitment to these programs; its efforts to keep the Trustees informed; and its attention to matters that may involve conflicts of interest with the Fund.
The Independent Trustees concluded that the nature, extent and quality of the services provided by FCA has benefited and will continue to benefit the Funds and their shareholders.
3. Investment Performance
The Independent Trustees considered FCA’s unique knowledge in the international markets, the unique composition and investment objectives of the Funds and the investment results of the Funds in light of these compositions and objectives.
The Independent Trustees also reviewed Morningstar ratings and observed that each fund which had sufficient history to be ranked, was reasonably ranked within their respective categories, when taking into consideration (1) the small size of the Funds, (2) the burden placed on the Adviser’s time and energy as a result of the recent extraordinary regulatory climate, and (3) the unique composition of the Funds and investment approach of the Adviser.
4. Advisory Fees and Total Expenses
The Independent Trustees reviewed the advisory fees and total expenses of the Funds (each as a percentage of average net assets) and compared such amounts with the average fee and expense levels of other funds. The Funds’ administrator reported that FCA’s fee was well within the norm for domestic funds and below the norm for international funds. The Independent Trustees independent review of various funds confirmed the administrator’s representation. The Independent Trustees observed that while the Funds’ advisory fees were in line with other funds, the Funds’ total expenses were above the expense levels of the other funds, and notes that the small asset levels, coupled with increasing regulatory and related expenses, prevented realistic comparisons with other funds. The Independent Trustee’s concluded that given the very small asset levels of the Funds, it would be impossible for any adviser to operate the Funds at average cost levels, and that FCA had done an admirable job in keeping fees at the lowest possible levels consistent with the small asset levels and compliance with shareholder service and regulatory standards. The Independent Trustees concluded that although Fund expenses were higher than category averages, such expenses were justified and unavoidable given the complex regulatory requirements, the unique composition of the Funds, and most importantly, the very small levels of assets under management. The Independent Trustees concluded that the fees charged by FCA for management of the portfolios were consistent with fees charged by comparable funds, but that total expense ratios were unavoidably higher than average due to small levels of assets under management, and hence, continued contracting with FCA is in the best interests of the shareholders.
COMMONWEALTH INTERNATIONAL SERIES TRUST
5. Adviser Costs, Level of Profits and Economies of Scale
The Independent Trustees reviewed information regarding FCA’s costs of providing services to the Funds, as well as the resulting level of profits to FCA, noting that those costs were high due primarily to the low asset levels of the Funds. The Independent Trustees received information during the past year regarding the structure and manner in which FCA’s investment professionals were compensated and FCA’s view of the relationship of such compensation to the attraction and retention of quality personnel. The Independent Trustees considered FCA’s need to invest in technology, infrastructure and staff to reinforce and offer new services and to accommodate changing regulatory requirements. The Independent Trustees noted that FCA was required to absorb losses due to the cost of extraordinary regulatory compliance in order to provide services to the Funds. The Independent Trustees concluded that the Funds’ cost structure was reasonable and that FCA was sharing economies of scale with the Funds and their shareholders, to their benefit.
6. Ancillary Benefits
The Independent Trustees and the committee considered a variety of other benefits received by FCA and its affiliates as a result of FCA’s relationship with the Funds and with other entities. The Independent Trustees noted that FCA provides some administrative services at no added cost to the Funds The Independent Trustees considered that with regard to the Australia/New Zealand Fund, the principals of FCA have developed exceptional exposure and reputations as leading spokespersons on Australia/New Zealand stock investments, and hence, add great value to the Funds in terms of marketing opportunities and credibility.
7. Conclusions
Based on their review, including their consideration of each of the factors referred to above, the Independent Trustees concluded that the agreement is fair and reasonable to the Funds and their shareholders, that the Funds’ shareholders received reasonable value in return for the advisory fees paid to FCA by the Funds, and that the continuation of the agreement was in the best interests of the Funds and their shareholders.
COMMONWEALTH INTERNATIONAL SERIES TRUST |
| |
TRUSTEES AND OFFICERS (Unaudited) |
Name, Age and Address | Position(s) With Fund | Term of Office and Length of Time Served | Principal Occupation(s) for the Last Five Years | Number of Portfolios in Complex Overseen by Trustee/Officer | Other Directorships Held By Trustee/Officer |
INTERESTED TRUSTEES: | | | | | |
Robert Scharar (1), 58 5847 San Felipe Suite 850 Houston, TX 77057 | President, Interested Trustee | Indefinite until successor elected and qualified; 4 years. | Investment manager/Attorney/CPA; President, FCA Corp. | 4 | None |
INDEPENDENT TRUSTEES: | | | | | |
John Akard, Jr., 40 5847 San Felipe Suite 850 Houston, TX 77057 | Independent Trustee | Indefinite until successor elected and qualified; 4 years. | Attorney/CPA | 4 | None |
Kathleen Kelly, 54 5847 San Felipe Suite 850 Houston, TX 77057 | Independent Trustee | Indefinite until successor elected and qualified; 4 years. | Consultant | 4 | None |
Jack Ewing, 67 5847 San Felipe Suite 850 Houston, TX 77057 | Independent Trustee | Indefinite until successor elected and qualified; 4 years. | Professor | 4 | None |
(1) Robert Scharar is considered an “interested person” of the Funds because of his affiliation with the Funds’ Investment Advisor as the sole shareholder of that Advisor.
COMMONWEALTH INTERNATIONAL SERIES TRUST |
| |
TRUSTEES AND OFFICERS (Unaudited) (continued) |
Name, Age and Address | Position(s) With Fund | Term of Office and Length of Time Served | Principal Occupation(s) for the Last Five Years | Number of Portfolios in Complex Overseen by Trustee/Officer | Other Directorships Held By Trustee/Officer |
OFFICERS: | | | | | |
Linda A. Durkin, 46 3435 Stelzer Road Columbus, OH 43219 | Treasurer | 12/18/2006- current | Employee of BISYS Fund Services (9/06 to present); from 2003-2006 employee of RR Donnelly; from 1993 - 2002 Vice President - Director of Fund Administration at Mercantile-Safe Deposit and Trust Co. | 4 | None |
Michael Wible, 44 10 West Broad Street, Suite 700 Columbus, Ohio 43215-3435 | Secretary | 12/18/2006- current | Attorney, Thompson Hine LLP | 4 | None |
Charles R. Ropka, 43 215 Fries Mill Road Turnersville, NJ 08012 | Assistant Secretary | 2003- current | Attorney, Rabil, Ropka, LLC | 4 | None |
Bonnie Scott, 57 5847 San Felipe Suite 850 Houston, TX 77057 | Assistant Secretary | 2003- current | Administrator & Private Coordinator, FCA Corp. | 4 | None |
Stephen E. Fodo, 64 2515 Golden Pond Drive Kingwood, Texas 77345 | CCO | 2005- current | CCO Commonwealth Funds - Business Consultant | 4 | None |
Commonwealth International
Series Trust
5847 San Felipe, Suite 850
Houston, Texas 77057
888-345-1898
INVESTMENT ADVISOR
FCA Corp
5847 San Felipe, Suite 850
Houston, TX 77057
713-781-2856
www.fcacorp.com
DISTRIBUTOR & TRANSFER AGENT
Matrix Capital Group, Inc.
630 Fitzwatertown Road
Building A, Second Floor
Willow Grove, PA 19090-1904
CUSTODIAN BANK
Fifth Third Bank
Fifth Third Center
38 Fountain Square Plaza
Cincinnati, OH 45263
INDEPENDENT REGISTERED PUBLIC ACCOUNTING FIRM
Briggs, Bunting & Dougherty, LLP
Two Penn Center Plaza, Suite 820
Philadelphia, PA 19102-1732
LEGAL COUNSEL
Rabil & Ropka, LLC
215 Fries Mill Road
Turnersville, NJ 08012
Item 2. Code of Ethics.
(a) The registrant has adopted a code of ethics that applies to the registrant’s principal executive officer, principal financial officer, principal accounting officer or controller, or persons performing similar functions. This code of ethics is included as an Exhibit.
(b) During the period covered by the report, with respect to the registrant's code of ethics that applies to its principal executive officer, principal financial officer, principal accounting officer or controller, or persons performing similar functions; there have been no amendments to, nor any waivers granted from, a provision that relates to any element of the code of ethics definition enumerated in paragraph (b) of this Item 2.
Item 3. Audit Committee Financial Expert.
3(a)(1) The registrant’s board of directors has determined that the registrant has at least one audit committee financial expert serving on its audit committee.
3(a)(2) The audit committee financial expert is, John Akard, Jr., who is “independent” for purposes of this Item 3 of Form N-CSR.
Item 4. Principal Accountant Fees and Services.
(a) Disclose, under the caption Audit Fees, the aggregate fees billed for each of the last two fiscal years for professional services rendered by the principal accountant for the audit of the registrant’s annual financial statements or services that are normally provided by the accountant in connection with statutory and regulatory filings or engagements for those fiscal years.
2006 - $57,500
2005 - $48,000
(b) Disclose, under the caption Audit-Related Fees, the aggregate fees billed in each of the last two fiscal years for assurance and related services by the principal accountant that are reasonably related to the performance of the audit of the registrant’s financial statements and are not reported under paragraph (a) of this Item. Registrants shall describe the nature of the services comprising the fees disclosed under this category.
2006 - $0
2005 - $0
(c) Disclose, under the caption Tax Fees, the aggregate fees billed in each of the last two fiscal years for professional services rendered by the principal accountant for tax compliance, tax advice, and tax planning. Registrants shall describe the nature of the services comprising the fees disclosed under this category.
2006 - $6,000
2005 -$6,000
(d) Disclose, under the caption All Other Fees, the aggregate fees billed in each of the last two fiscal years for products and services provided by the principal accountant, other than the services reported in paragraphs (a) through (c) of this Item. Registrants shall describe the nature of the services comprising the fees disclosed under this category.
2006 - $0
2005 - $0
(e) (1) Disclose the audit committee’s pre-approval policies and procedures described in paragraph (c)(7) of Rule 2-01 of Regulation S-X.
Not applicable.
(2) Disclose the percentage of services described in each of paragraphs (b) through (d) of this Item that were approved by the audit committee pursuant to paragraph (c)(7)(i)(C) of Rule 2-01 of Regulation S-X.
2006 - 100%
2005 - 100%
(f) If greater than 50 percent, disclose the percentage of hours expended on the principal accountant’s engagement to audit the registrant’s financial statements for the most recent fiscal year that were attributed to work performed by persons other than the principal accountant’s full-time, permanent employees.
Not applicable.
(g) Disclose the aggregate non-audit fees billed by the registrant’s accountant for services rendered to the registrant, and rendered to the registrant’s investment adviser (not including any sub-adviser whose role is primarily portfolio management and is subcontracted with or overseen by another investment adviser), and any entity controlling, controlled by, or under common control with the adviser that provides ongoing services to the registrant for each of the last two fiscal years of the registrant.
Not applicable.
(h) Disclose whether the registrant’s audit committee of the board of directors has considered whether the provision of nonaudit services that were rendered to the registrant’s investment adviser (not including any subadviser whose role is primarily portfolio management and is subcontracted with or overseen by another investment adviser), and any entity controlling, controlled by, or under common control with the investment adviser that provides ongoing services to the registrant that were not pre-approved
pursuant to paragraph (c)(7)(ii) of Rule 2-01 of Regulation S-X is compatible with maintaining the principal accountant’s independence.
Not applicable.
Item 5. Audit Committee of Listed Registrants.
Not applicable.
Item 6. Schedule of Investments.
Not applicable.
Item 7. Disclosure of Proxy Voting Policies and Procedures for Closed-End Management Investment Companies.
Not applicable.
Item 8. Portfolio Managers of Closed-End Management Investment Companies.
Not applicable.
Item 9. Purchases of Equity Securities by Closed-End Management Investment Company and Affiliated Purchasers.
Not applicable.
Item 10. Submission of Matters to a Vote of Security Holders.
Not applicable.
Item 11. Controls and Procedures.
(a)The registrant’s principal executive officer and principal financial officer have concluded, based on their evaluation of the registrant's disclosure controls and procedures as conducted within 90 days of the filing date of this report, that these disclosure controls and procedures are adequately designed and are operating effectively to ensure that information required to be disclosed by the registrant on Form N-CSR is recorded, processed, summarized and reported within the time periods specified in the Securities and Exchange Commission's rules and forms.
(b)There were no changes in the registrant’s internal control over financial reporting (as defined in Rule 30a-3(d) under the Act (17 CFR 270.30a-3(d)) that occurred during the second fiscal quarter of the period covered by this report that have materially affected or are reasonably likely to materially affect, the registrant’s internal control over financial reporting.
Item 12. Exhibits.
(a)(1) The code of ethics that is the subject of the disclosure required by Item 2 is attached hereto.
(a)(2) Certifications pursuant to Rule 30a-2(a) are attached hereto.
(a)(3) Not applicable.
(b) Certifications pursuant to Rule 30a-2(b) are furnished herewith.
SIGNATURES
Pursuant to the requirements of the Securities Exchange Act of 1934 and the Investment Company Act of 1940, the registrant
has duly caused this report to be signed on its behalf by the undersigned, thereunto duly authorized.
(Registrant) Commonwealth International Series Trust
By (Signature and Title)* /s/Robert W. Scharar
Robert W. Scharar, President
Date January 12, 2007
Pursuant to the requirements of the Securities Exchange Act of 1934 and the Investment Company Act of 1940, this report has been signed below by the following persons on behalf of the registrant and in the capacities and on the dates indicated.
By (Signature and Title)* /s/ Robert W. Scharar
Robert W. Scharar, President
Date January 12, 2007
By (Signature and Title)* /s/ Linda A. Durkin
Linda A. Durkin, Treasurer
Date January 12, 2007
* Print the name and title of each signing officer under his or her signature.
Include a code of ethics or amendment to a code of ethics filed under Item 12(a) of Form N-CSR in a single EDGAR exhibit named EX-99.CODE ETH.
All Section 302 certifications should be included in one EDGAR EX-99.CERT exhibit document and all Section 906 certifications should be included in a separate EDGAR EX-99.906CERT exhibit document to Form N-CSR. [Don’t include this language in the filing.]