UNITED STATES
SECURITIES AND EXCHANGE COMMISSION
Washington, D.C. 20549
FORM N-CSR
CERTIFIED SHAREHOLDER REPORT OF REGISTERED
MANAGEMENT INVESTMENT COMPANIES
Investment Company Act file number: 811-04665
Commonwealth International Series Trust
(Exact name of registrant as specified in charter)
791 Town & Country Blvd.
Houston, TX 77024-3925
(Address of principal executive offices) (Zip code)
CT Corporation System
155 Federal Street
Boston, MA 02110
(Name and address of agent for service)
Copies to:
John H. Lively
The Law Offices of John H. Lively & Associates, Inc.
A member firm of The 1940 Act Law GroupTM
11300 Tomahawk Parkway, Suite 310
Leawood, KS 66211
Registrant’s telephone number, including area code: (888)-345-1898
Date of fiscal year end: October 31
Date of reporting period: October 31, 2017
| Item 1. | Reports to Stockholders. |
Commonwealth International Series Trust
791 Town & Country Blvd, Suite 250
Houston, TX 77024-3925
888-345-1898
www.commonwealthfunds.com
INVESTMENT ADVISOR
FCA Corp
791 Town & Country Blvd, Suite 250
Houston, TX 77024-3925
713-781-2856
DISTRIBUTOR
Unified Financial Securities, LLC
9465 Counselors Row, Suite 200
Indianapolis, IN 46240
TRANSFER AGENT & ADMINISTRATOR
Ultimus Asset Services, LLC
225 Pictoria Drive, Suite 450
Cincinnati, OH 45246
CUSTODIAN BANK
Fifth Third Bank N.A.
Fifth Third Center
38 Fountain Square Plaza
Cincinnati, OH 45263
INDEPENDENT REGISTERED PUBLIC
ACCOUNTING FIRM
BBD, LLP
1835 Market Street, 26th Floor
Philadelphia, PA 19103
LEGAL COUNSEL
The Law Offices of John H. Lively & Associates, Inc.
A member firm of The 1940 Act Law GroupTM
11300 Tomahawk Creek Parkway, Ste. 310
Leawood, KS 66211
This report is intended for the shareholders of the family of funds of the Commonwealth International Series Trust. It may not be distributed to prospective investors unless it is preceded or accompanied by the Funds’ current Prospectus. An additional Prospectus may be obtained at www.commonwealthfunds.com or from the principal underwriter of the Funds or your broker.
Distributed by Unified Financial Securities, LLC
Member FINRA/SIPC

Commonwealth Australia/New Zealand Fund
Africa Fund
Commonwealth Japan Fund
Commonwealth Global Fund
Commonwealth Real Estate Securities Fund
ANNUAL REPORT
October 31, 2017
Table of Contents
Commonwealth Australia/New Zealand Fund (CNZLX)
Africa Fund (CAFRX)
Commonwealth Japan Fund (CNJFX)
Commonwealth Global Fund (CNGLX)
Commonwealth Real Estate Securities Fund (CNREX)
www.commonwealthfunds.com
Dear Fellow Shareholders:
We are pleased to present the enclosed annual report for the twelve-months ended October 31, 2017 of the Commonwealth International Series Trust on behalf of its separate series: Commonwealth Australia/New Zealand Fund, Commonwealth Japan Fund, Commonwealth Global Fund, Commonwealth Real Estate Securities Fund and Africa Fund (each a “Fund” and together the “Funds”).
While we cannot forecast with precision how economic or geopolitical events will unfold, we have confidence that a long-term investment program remains essential. FCA Corp’s in-depth fundamental research, active investing and risk management strategies can serve investors well through challenging domestic and international markets.
We believe many of the world’s widely used indices are backward looking and are not representative of the industries and companies that will be successful in the future. With respect to debt indices, we believe they are representative of the most indebted countries as opposed to the most creditworthy. Focusing beyond an index approach can help compensate for these index bias.
Our investment theme includes that our shareholders may select the Funds for their individual attributes and the targeted markets they are designed to invest in. In many cases this could be an asset allocation decision by our shareholders. We continue to offer this differential characteristics among our Funds coupled with a fundamental based approach to investment selections.
1
| | |
 | | ANNUAL REPORT 2017 |
As we begin on our twenty-seventh year as the investment advisor to the Funds, we would like to thank you as shareholders for your support and continued interest in the Commonwealth family of funds.
| | |
 | |  |
Robert W. Scharar | | Wesley R. Yuhnke |
| President and Portfolio Manager | | Assistant Portfolio Manager |
| Commonwealth International Series Trust | | Commonwealth International Series Trust |
The views in the above discussion, along with discussion included under the “Performance Overview” for each Fund below, were those of the Funds’ investment advisor as of the date set forth above and may not reflect its views on the date this annual report is first published or anytime thereafter. These views are intended to assist shareholders in understanding their investment in the Funds and the performance of the Funds during the period covered by this report and do not constitute investment advice.
THE PERFORMANCE INFORMATION QUOTED IN THIS ANNUAL REPORT REPRESENTS PAST PERFORMANCE AND PAST PERFORMANCE DOES NOT GUARANTEE FUTURE RESULTS. INVESTMENT RETURN AND PRINCIPAL VALUE OF AN INVESTMENT WILL FLUCTUATE SO THAT AN INVESTOR’S SHARES, WHEN REDEEMED, MAY BE WORTH MORE OR LESS THAN THEIR ORIGINAL COST. CURRENT PERFORMANCE MAY BE LOWER OR HIGHER THAN THE PERFORMANCE DATA QUOTED. AN INVESTOR SHOULD CONSIDER THE FUND’S INVESTMENT OBJECTIVES, RISKS, AND CHARGES AND EXPENSES CAREFULLY BEFORE INVESTING. THE FUND’S PROSPECTUS CONTAINS THIS AND OTHER IMPORTANT INFORMATION. FOR INFORMATION ON THE FUND’S EXPENSE RATIO, PLEASE SEE THE FINANCIAL HIGHLIGHTS TABLE FOUND WITHIN THIS REPORT. TO OBTAIN A PROSPECTUS AND OTHER INFORMATION ABOUT THE FUNDS, PLEASE VISIT WWW.COMMONWEALTHFUNDS.COM OR CALL 888-345-1898. PLEASE READ THE PROSPECTUS CAREFULLY BEFORE INVESTING.
2
| | |
| | ANNUAL REPORT 2017 |
Questions and Answers
To help shareholders better understand key attributes of the mutual funds (each a “Fund” and collectively the “Funds”) comprising the Commonwealth International Series Trust and their operations, the following Question and Answer section is provided.
Who is the Advisor?
The Funds’ investment advisor is FCA Corp (“FCA”). FCA is an investment advisor that is registered with the U.S. Securities and Exchange Commission and has its principle place of business located at 791 Town & Country Blvd., Suite 250, Houston, Texas 77024-3925. The firm was founded in 1975 and maintains a global perspective on the equity and fixed income marketplaces.
Why is investing outside the U.S. important?
The Funds invest in companies outside the United States because FCA believes there are significant investment opportunities in select foreign markets. In our view, U.S. investors benefit from the diversification that having investments outside the United States can provide. International investing offers exposure to more companies and other nations’ economies, currencies, and growth prospects. Nearly half of the value of equity markets is outside the United States. The growth experienced by many of these foreign economies appears to be attractive. FCA believes that for a U.S. investor, allocation of a portion of the investor’s portfolio to international securities can provide the potential for less risk and can achieve a more consistent long-term performance in the investor’s overall portfolio.
How has international investing changed over the last decade?
International markets now comprise a significant portion of all equity value worldwide. As markets have blended through global commerce, capital has flowed from country to country following investment opportunities. Developed markets and emerging markets both require capital investments to provide the goods and services of their consumers need. During the last decade in particular, accounting and economic statistical information has become more uniform and thus more dependable. The trend appears to be in place for continued development of these distant countries and their markets. Their demand for investment capital outside the U.S. continues which provides opportunities for diversification and growth. The Funds seek to be participants in these opportunities.
What are some of the factors influencing a Fund’s portfolio turnover?
Each Fund generally invests in equity securities with a long-term view and in debt securities to be held to maturity. The Funds’ portfolio securities are evaluated on their long-term prospects. A particular Fund may experience higher or lower turnover ratios in certain years. Factors influencing portfolio turnover include, but are not limited to the following: rebalancing portfolio securities to take advantage of long-term opportunities and/or to reallocate between fixed income and equity securities; investing new subscriptions; or selling securities to cover redemptions. Higher levels of portfolio activity by a Fund will result in higher transaction costs and/or more realized gains or losses, the impact of which is borne by the Fund’s shareholders. The turnover of a portfolio is not predictable because managers do not know when the portfolio transactions will be dictated. Under most circumstances, it is desirable to limit transactions because of the costs associated with trading, currency conversions, and custody fees, although these are generally not the determining factor.
3
| | |
| | ANNUAL REPORT 2017 |
How can the size of the Fund impact the Funds’ expense ratio?
Achieving each Fund’s objective with a portfolio comprised of international securities is historically more expensive than the costs associated with managing a portfolio comprised of domestic securities. Research of foreign markets, trading in different currencies, custody of assets, accurate evaluations of holdings, income tax, securities regulatory compliance, and generally overall communications are all known to be more expensive when managing these types of portfolios. Additionally, as with almost every mutual fund, size has an impact on the expense ratio of Funds. Typically, larger mutual funds can have lower expense ratios as there is an increased opportunity to spread out fixed and partially-fixed costs necessary to operate such mutual funds over a larger asset base. Generally, mutual fund expenses, including those of the Funds, are allocated on a daily basis among all shareholders. In addition, as a portfolio assets increase, it is self-evident that fixed costs as a percentage of the assets managed generally decline. Whenever a new Fund is introduced or invest in highly specific objective portfolios, higher costs can be experienced during time periods of asset growth. The Financial Highlights section of the accompanying financial statements provides supplemental data that includes current and historic expense information, and where applicable, the advisor’s waiver of fees or voluntary expense reimbursements to help reduce these cost.
4
| | |
| | ANNUAL REPORT 2017 |
PERFORMANCE OVERVIEW – October 31, 2017 (Unaudited)
COMMONWEALTH AUSTRALIA/NEW ZEALAND FUND
The Commonwealth Australia/New Zealand Fund’s net asset value (NAV) as of October 31, 2017 was $13.13 per share compared to $12.44 per share on October 31, 2016. For the twelve-month period covered by this Annual Report, the Commonwealth Australia/New Zealand Fund (the “Fund”) returned 8.25%. This return figure includes the $0.307 per share distribution made in December 2016. In presenting comparative performance numbers on the Fund versus indexes, it is important to note that we do not make investment decisions with a view toward attempting to track any index. Rather, we invest based on fundamental research. We also invest a portion of the Fund’s assets in fixed income investments and, as a result, we would note that a comparison of the performance of the Funds to indexes may be less meaningful than a comparison of funds that do not incorporate such fixed income investments. In an attempt to present various aspects of the marketplace return, we provide two indexes for consideration. During the twelve-month period, the NZX 50 Index returned 11.96% and the Australian All Ordinaries Index returned 17.90%. These indexes do not include any fixed income instruments. Additionally, indexes are unmanaged, expressed in terms of U.S. dollars and do not reflect the deduction of fees associated with ownership of a mutual fund, such as investment management and fund accounting fees, nor do they reflect the deduction of taxes associated with ownership of a mutual fund.
From our view, the long term goal of owning the Australia/New Zealand Fund is to benefit from the ownership of companies domiciled and operating in both of these countries. Therefore, both countries are continuously represented in ownership. History shows that the returns of the respective marketplaces can vary significantly from one another. It is rare that both countries markets perform the same. Nonetheless, the overriding goal of long term diversified ownership seeks to be maintained.
There are other considerations as well:
| – | The (4.2) percent decline of the New Zealand dollar versus the U.S. dollar had a predictably negative effect on the Fund’s returns. |
| – | The 0.6 percent appreciation of the Australian dollar versus the U.S. dollar had a positive effect on the Fund’s returns. |
| – | New Zealand small-cap equities generally underperformed New Zealand large-cap equities. Due to the allocation of a portion of the Fund’s assets to the small-cap area during the period covered by this report, the Fund’s performance was negatively impacted. |
| – | The Fund’s holdings in Scott Technology Ltd., Heartland Bank Ltd., Freightways Ltd., South Port New Zealand Ltd., and Mainfreight Ltd. positively impacted the Fund’s performance during the period covered by this report. |
| – | The Fund’s holdings in CBL Corp Ltd., Cavalier Corp. Ltd., Evolve Education Group Ltd., IkeGPS Group Ltd., and Briscoe Group Ltd. had negative returns for the year with the commensurate effects on total return. |
Investment Risks
Equity securities (stocks) are more volatile and carry more risk than other forms of investments, including high-grade fixed income securities. The net asset values per share of a Fund will fluctuate as the value of these securities in the portfolio changes.
The Fund’s investments in debt and/or fixed income securities also contain risk factors. The value of these securities tends to fluctuate inversely with changes in interest rates. Changes in an issuer’s financial strength or creditworthiness also can affect the value of the securities it issues. Convertible and preferred stocks, which have some characteristics of both equity and fixed income securities, also contain, to varying degrees depending on their structure, the associated risks of each.
The Fund’s expenses, as with any mutual fund, detract from the Fund’s performance. The Fund’s asset levels have a direct effect on the expense indirectly paid by shareholders. To the extent the Fund’s assets decline and the expenses of the Fund rise or do not decrease proportionately, performance will be negatively impacted.
International investing involves increased risk and volatility. An investment in this Fund entails the special risks of international investing, including currency exchange fluctuation, government regulations, and the potential for political and economic instability. Because the Fund invests primarily in the securities of, and depositary receipts represented by Australian and New Zealand issuers, the Fund is particularly susceptible to any economic, political, or regulatory developments affecting a particular issuer of those countries.
By itself the Fund does not constitute a complete investment plan and should be considered a long-term investment for investors who can afford to weather change in the value of their investments.
Investors should refer to the Fund’s Prospectus for a more complete description of risks associated with investing in and of the Fund.
Portfolio holdings will change due to ongoing management of the Fund. References to specific securities or sectors should not be construed as recommendations by the Trust, the Fund, the Fund’s investment advisor or distributor.
5
| | |
| | ANNUAL REPORT 2017 |
PERFORMANCE OVERVIEW – October 31, 2017 (Unaudited)
COMMONWEALTH AUSTRALIA/NEW ZEALAND FUND
Comparison of Change in Value of a $10,000 investment in the Commonwealth Australia/New Zealand Fund (the “Fund”), the AAOI and the NZX 50 Index.
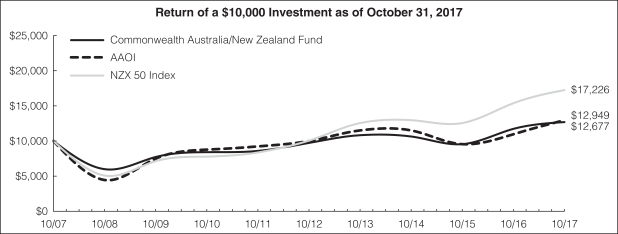
The above graph is a hypothetical $10,000 investment in the Fund from 10/31/07 to 10/31/17, and represents the reinvestment of dividends and distributions in the Fund.
| | | | | | | | | | | | | | | | |
| | | Average Annual Total Returns
as of October 31, 2017 | | | Total Fund
Operating
Expense
Ratio1 | |
| | | 1 Year | | | 5 Year | | | 10 Year | | |
Commonwealth Australia/New Zealand Fund | | | 8.25 | % | | | 5.45 | % | | | 2.40 | % | | | 2.84 | % |
Australian All Ordinaries Index (“AAOI”) | | | 17.90 | % | | | 5.33 | % | | | 2.62 | % | | | — | |
NZX 50 Index | | | 11.96 | % | | | 11.35 | % | | | 5.59 | % | | | — | |
Past performance does not guarantee future results. The performance data quoted represents past performance and current returns which may be lower or higher. The above graph and table do not reflect the deduction of taxes that a shareholder would pay on Fund distributions or the redemption of Fund shares. The investment return and principal value will fluctuate so that an investor’s shares, when redeemed may be worth more or less than the original cost. To obtain performance information current to the most recent month end, please call 888-345-1898.
| 1 | The above expense ratio is from the Fund’s Prospectus, dated February 28, 2017. Additional information pertaining to the Fund’s expense ratio as of October 31, 2017, can be found in the financial highlights. |
The Fund’s performance is measured against the Australian All Ordinaries Index (‘‘AAOI’’), an index made up of the largest 500 companies as measured by market capitalization that are listed on the Australian Stock Exchange; and the NZX 50 Index, a total return index consisting of the top 50 companies by free float adjusted market capitalization that are listed on the New Zealand Stock Exchange. These indices are unmanaged, are expressed in terms of U.S. dollars, and do not reflect the deduction of fees or taxes with a mutual fund, such as investment management and fund accounting fees. The performance of the Fund reflects the deduction of fees for these services. Investors cannot invest directly in an index.
You should carefully consider the investment objectives, risks, charges and expenses of the Fund before investing. This and other information can be found in the Fund’s Prospectus, which can be obtained from www.commonwealthfunds.com, by calling the Funds directly at 888-345-1898 or by contacting your investment representative. Please read it carefully before you invest or send money.
6
| | |
| | ANNUAL REPORT 2017 |
PERFORMANCE OVERVIEW – October 31, 2017 (Unaudited)
The Africa Fund’s net asset value (NAV) as of October 31, 2017 was $9.00 per share compared to $8.25 per share on October 31, 2016. For the twelve-month period covered by this Annual Report, the Africa Fund (the “Fund”) posted a 9.82% cumulative total return. This return figure includes the $0.052 per share distribution made in December 2016. Our investments do not attempt to track any indexes; rather, we make investment decisions on the basis of fundamental research. We also invest a portion of the Fund’s assets in fixed income investments and acknowledge this process may mitigate some meaningful comparisons to indexes that do not have such investments represented within them. The MSCI Emerging Markets Index and the Dow Jones Africa Titans 50 Index returned 26.45% and 10.13%, respectively for the same period. These indexes do not include any fixed income instruments. Additionally, indexes are unmanaged, expressed in terms of U.S. dollars and do not reflect the deduction of fees associated with ownership of a mutual fund such as investment management and fund accounting fees, nor do they reflect the deduction of taxes associated with ownership of a mutual fund. The performance of the Fund reflects the deduction of fees for these services. Investors cannot invest directly in an index.
There are other considerations as well during the period covered by this year’s report:
| – | The MSCI Emerging Markets Index is a global index, with companies domiciled in Africa representing less than 7% of the index, with the Asia Pacific region representing nearly two-thirds of the index. |
| – | For the year ended October 31, 2017, the Advisor limited the Fund operating expenses, which positively affected the Fund’s performance. Had the Advisor not capped the Fund’s operating expenses, performance would have been lower. Please see the accompanying notes to the financial statements for additional information. |
| – | The (4.6) percent decline of the South African Rand versus the U.S. dollar had a predictably negative effect on the Fund’s performance. |
| – | The Fund’s underperformance versus the Dow Jones African Titans 50 Index was largely a result of the Fund’s larger allocation to South Africa compared to the Dow Jones Africa Titans Index. |
| – | The Fund’s holdings in the following securities had the largest positive impact on the Fund’s performance: Naspers Ltd., Capitec Bank Holdings Ltd., and PSG Group Ltd. |
| – | The Fund’s holdings in the following securities had the largest negative impact on the Fund’s performance: Pioneer Foods Group Ltd., Mediclinic International Ltd., Impala Platinum Holdings Ltd., and AngloGold Ashanti Ltd. |
We believe that Africa represents a unique, complicated continent with the potential to be both economically rewarding and punitive. We feel equities listed on African stock exchanges offer investors a way to participate in
what is expected to be sizeable growth in the consumer consumption of goods and services and the economies in general. It takes time for governments to change and for the people of an emerging country to adjust. With the vast number of countries within the African continent, it is an exciting yet daunting task. Our portfolio selection includes using information we gather first hand through trips to the continent as we seek to monitor each investment and to make decisions we view as being in the best interests of the Fund. Because many U.S. investors share our vision for the African continent and have a desire to be informed beyond just financial aspects, we have constructed our web site’s Africa section to provide a variety of information in response to this, and we invite you to visit the website at commonwealthfunds.com.
Investment Risks
Equity securities (stocks) are more volatile and carry more risk than other forms of investments, including high-grade fixed income securities. The net asset values per share of a Fund will fluctuate as the value of these securities in the portfolio changes.
The Fund’s investments in debt and/or fixed income securities also contain risk factors. The value of these securities tends to fluctuate inversely with changes in interest rates. Changes in an issuer’s financial strength or creditworthiness also can affect the value of the securities it issues. Convertible and preferred stocks, which have some characteristics of both equity and fixed income securities, also contain, to varying degrees depending on their structure, the associated risks of each.
The Fund’s expenses, as with any mutual fund, detract from the Fund’s performance. The Fund’s asset levels have a direct effect on the expenses indirectly paid by shareholders. To the extent the Fund’s assets decline and the expenses of the Fund rise or do not decrease proportionately, performance will be negatively impacted.
International investing involves increased risk and volatility. An investment in this Fund entails the special risks of international investing, including currency exchange fluctuation, government regulations, and the potential for political and economic instability. Because the Fund invests primarily in the securities of, and depositary receipts represented by African issuers, the Fund is particularly susceptible to any economic, political, or regulatory developments affecting a particular issuer of those countries.
By itself the Fund does not constitute a complete investment plan and should be considered a long-term investment for investors who can afford to weather change in the value of their investments.
Investors should refer to the Fund’s Prospectus for a more complete description of risks associated with investing in the Fund.
Portfolio holdings will change due to ongoing management of the Fund. References to specific securities or sectors should not be construed as recommendations by the Trust, the Advisor or the Distributor.
7
| | |
| | ANNUAL REPORT 2017 |
PERFORMANCE OVERVIEW – October 31, 2017 (Unaudited)
Comparison of Change in Value of a $10,000 investment in the Africa Fund (the “Fund”), the MSCIEM and the DJAFKT.
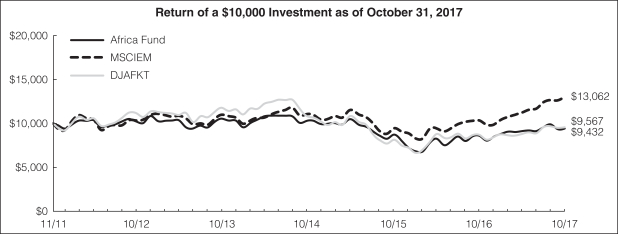
The above graph is a hypothetical $10,000 investment in the Fund from 11/7/11 (inception) to 10/31/17, and represents the reinvestment of dividends and distributions in the Fund.
| | | | | | | | | | | | | | | | |
| | | Average Annual Total Returns
as of October 31, 2017 | | | Total Fund
Operating
Expense
After Fee
Waiver
Ratio1 | |
| | | 1 Year | | | 5 Year | | | Since
Inception
(11/7/11) | | |
Africa Fund | | | 9.82 | % | | | -1.59 | % | | | -0.97 | % | | | 1.95 | % |
MSCI Emerging Markets Index (“MSCIEM”) | | | 26.45 | % | | | 4.83 | % | | | 4.57 | % | | | — | |
Dow Jones Africa Titans 50 Index (“DJAFKT”) | | | 10.13 | % | | | -3.07 | % | | | -0.74 | % | | | — | |
Past performance does not guarantee future results. The performance data quoted represents past performance and current returns which may be lower or higher. The above graph and table do not reflect the deduction of taxes that a shareholder would pay on Fund distributions or the redemption of Fund shares. The investment return and principal value will fluctuate so that an investor’s shares, when redeemed may be worth more or less than the original cost. To obtain performance information current to the most recent month end, please call 888-345-1898.
| 1 | The above expense ratio is from the Fund’s Prospectus, dated February 28, 2017. FCA Corp has entered into a written expense limitation agreement under which it has agreed to limit the total expenses of the Fund (exclusive of interest, distribution fees pursuant to Rule 12b-1 Plans, taxes, acquired fund fees and expenses, brokerage commissions, extraordinary expenses and dividend expense on short sales) to an annual rate of 1.50% of the average daily net assets of the Fund. This expense limitation agreement may be terminated by FCA Corp or the Trust at any time after February 28, 2018. FCA Corp may recoup from the Fund any reduced fees and/or expenses reimbursed pursuant to this agreement if such recoupment does not cause the Fund to exceed the expense limitation in place at the time the fee was reduced and/or expenses were reimbursed and such recoupment is made within three fiscal years after the year in which FCA Corp incurred the expense. Excluding the indirect costs of investing in acquired funds, total fund operating expenses would be 3.89%. Additional information pertaining to the Fund’s expense ratio as of October 31, 2017, can be found in the financial highlights. |
The Fund’s performance is measured against the MSCI Emerging Markets Index (‘‘MSCIEM’’), a free float-adjusted market capitalization index that is designed to measure equity market performance within global emerging markets; and the Dow Jones Africa Titans 50 Index (‘‘DJAFKT’’), a float-adjusted market capitalization index that is designed to measure the stock performance of 50 leading companies that are headquartered or generate the majority of their revenues in Africa. The MSCIEM currently consists of the following 23 emerging market country indices: Brazil, Chile, China, Colombia, Czech Republic, Egypt, Greece, Hungary, India, Indonesia, Korea, Malaysia, Mexico, Peru, Philippines, Poland, Russia, Qatar, South Africa, Taiwan, Thailand, Turkey and United Arab Emirates.. These indices are unmanaged, are expressed in terms of U.S. dollars, and do not reflect the deduction of fees or taxes with a mutual fund, such as investment management and fund accounting fees. The performance of the Fund reflects the deduction of fees for these services. Investors cannot invest directly in an index.
You should carefully consider the investment objectives, risks, charges and expenses of the Fund before investing. This and other information can be found in the Fund’s Prospectus, which can be obtained from www.commonwealthfunds.com, by calling the Funds directly at 888-345-1898 or by contacting your investment representative. Please read it carefully before you invest or send money.
8
| | |
| | ANNUAL REPORT 2017 |
PERFORMANCE OVERVIEW – October 31, 2017 (Unaudited)
The Commonwealth Japan Fund’s net asset value (NAV) as of October 31, 2017 was $3.82 per share compared to $3.38 per share on October 31, 2016. For the twelve-month period covered by this Annual Report, the Commonwealth Japan Fund (the “Fund”) returned 13.02%. Our investments do not attempt to track any index, but rather we undertake investments on the basis of fundamental research. We also may invest a portion of the Fund’s assets in fixed income investments and acknowledge this process may mitigate some meaningful comparisons to indexes that do not have such investments represented within them. The Tokyo Stock Price Index returned 19.53% for the same period. The index does not include any fixed income instruments. Additionally, indexes are unmanaged, expressed in terms of U.S. dollars and do not reflect the deduction of fees or taxes associated with ownership of a mutual fund such as investment management and fund accounting fees, nor do they reflect the deduction of taxes associated with ownership of a mutual fund. The performance of the Fund reflects the deduction of fees for these services. Investors cannot invest directly in an index.
There are other considerations as well during the period covered by this year’s report:
| – | For the year ended October 31, 2017, the Advisor limited the Fund operating expenses, which positively affected the Fund’s performance had the Advisor not capped the Fund’s operating expenses, performance would have been lower. Please see the accompanying notes to the financial statements for additional information. |
| – | The (7.7) percent decline of the Japanese Yen versus the U.S. dollar during the year had a predictably negative effect on the Fund’s returns. |
| – | The Fund’s holdings in the following securities had the largest positive impact on the Fund’s performance: Kajima Corp., Asahi Intecc Co., Ltd., Kyushu Leasing Services Co., Ltd., and Hoya Corp. |
| – | The Fund’s holdings in the following securities had the largest negative impact on the Fund’s performance: Sosei Group Corp., Shimano, Inc., Fukuoka REIT Corp., and Cyberdyne, Inc. |
Investment Risks
Equity securities (stocks) are more volatile and carry more risk than other forms of investments, including high-grade fixed income securities. The net asset values per share of a Fund will fluctuate as the value of these securities in the portfolio changes.
The Fund’s investments in debt and/or fixed income securities also contain risk factors. The value of these securities tends to fluctuate inversely with changes in interest rates. Changes in an issuer’s financial strength or creditworthiness also can affect the value of the securities it issues. Convertible and preferred stocks, which have some characteristics of both equity and fixed income securities, also contain, to varying degrees depending on their structure, the associated risks of each.
The Fund’s expenses, as with any mutual fund, detract from the Fund’s performance. The Fund’s asset levels have a direct effect on the expenses indirectly paid by shareholders. To the extent the Fund’s assets decline and the expenses of the Fund rise or do not decrease proportionately, performance will be negatively impacted.
International investing involves increased risk and volatility. An investment in this Fund entails the special risks of international investing, including currency exchange fluctuation, government regulations, and the potential for political and economic instability. Because the Fund invests primarily in the securities of, and depositary receipts represented by Japanese issuers, the Fund is particularly susceptible to any economic, political, or regulatory developments affecting a particular issuer of those countries.
By itself the Fund does not constitute a complete investment plan and should be considered a long-term investment for investors who can afford to weather change in the value of their investments.
Investors should refer to the Fund’s Prospectus for a more complete description of risks associated with investing in the Fund.
Portfolio holdings will change due to ongoing management of the Fund. References to specific securities or sectors should not be construed as recommendations by the Trust, the Advisor or the Distributor.
9
| | |
| | ANNUAL REPORT 2017 |
PERFORMANCE OVERVIEW – October 31, 2017 (Unaudited)
Comparison of Change in Value of a $10,000 investment in the Commonwealth Japan Fund (the “Fund”) and the TOPIX.
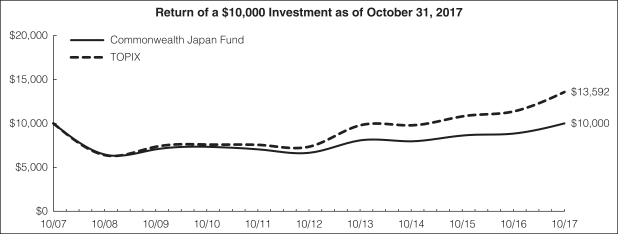
The above graph is a hypothetical $10,000 investment in the Fund from 10/31/07 to 10/31/17, and represents the reinvestment of dividends and distributions in the Fund.
| | | | | | | | | | | | | | | | |
| | | Average Annual Total Returns
as of October 31, 2017 | | | Total Fund
Operating
Expense
After Fee
Waiver
Ratio1 | |
| | | 1 Year | | | 5 Year | | | 10 Year | | |
Commonwealth Japan Fund | | | 13.02 | % | | | 8.50 | % | | | 0.00 | % | | | 1.77 | % |
Tokyo Stock Price Index (“TOPIX”) | | | 19.53 | % | | | 13.09 | % | | | 3.12 | % | | | — | |
Past performance does not guarantee future results. The performance data quoted represents past performance and current returns which may be lower or higher. The above graph and table do not reflect the deduction of taxes that a shareholder would pay on Fund distributions or the redemption of Fund shares. The investment return and principal value will fluctuate so that an investor’s shares, when redeemed may be worth more or less than the original cost. To obtain performance information current to the most recent month end, please call 888-345-1898.
| 1 | The above expense ratio is from the Fund’s Prospectus, dated February 28, 2017. FCA Corp has entered into a written expense limitation agreement under which it has agreed to limit the total expenses of the Fund (exclusive of interest, distribution fees pursuant to Rule 12b-1 Plans, taxes, acquired fund fees and expenses, brokerage commissions, extraordinary expenses and dividend expense on short sales) to an annual rate of 1.50% of the average daily net assets of the Fund. This expense limitation agreement may be terminated by FCA Corp or the Trust at any time after February 28, 2018. FCA Corp may recoup from the Fund any reduced fees and/or expenses reimbursed pursuant to this agreement if such recoupment does not cause the Fund to exceed the expense limitation in place at the time the fee was reduced and/or expenses were reimbursed and such recoupment is made within three fiscal years after the year in which FCA Corp incurred the expense. Excluding the indirect costs of investing in acquired funds, total fund operating expenses would be 3.22%. Additional information pertaining to the Fund’s expense ratio as of October 31, 2017, can be found in the financial highlights. |
The Fund’s performance is measured against the Tokyo Stock Price Index (“TOPIX”), an unmanaged capitalization-weighted index of all the companies stocks on the First Section of the Tokyo Stock Exchange. This index is expressed in terms of U.S. dollars, and does not reflect the deduction of fees or taxes with a mutual fund, such as investment management and fund accounting fees. The performance of the Fund reflects the deduction of fees for these services. Investors cannot invest directly in an index.
You should carefully consider the investment objectives, risks, charges and expenses of the Fund before investing. This and other information can be found in the Fund’s Prospectus, which can be obtained from www.commonwealthfunds.com, by calling the Funds directly at 888-345-1898 or by contacting your investment representative. Please read it carefully before you invest or send money.
10
| | |
| | ANNUAL REPORT 2017 |
PERFORMANCE OVERVIEW – October 31, 2017 (Unaudited)
The Commonwealth Global Fund’s net asset value (NAV) as of October 31, 2017 was $15.33 per share compared to $13.97 per share on October 31, 2016. For the twelve-month period covered by this Annual Report, the Commonwealth Global Fund (the “Fund”) posted a 14.60% cumulative total return. This return figure includes the $0.605 per share distribution made in December 2016. Our investments do not attempt to track any index, but rather we undertake investments on the basis of fundamental research. The MSCI World Index returned 23.46% for the same period. The index does not include any fixed income instruments. Additionally, indexes are unmanaged, expressed in terms of U.S. dollars and do not reflect the deduction of fees or taxes associated with ownership of a mutual fund such as investment management and fund accounting fees, nor do they reflect the deduction of taxes associated with ownership of a mutual fund. The performance of the Fund reflects the deduction of fees for these services. Investors cannot invest directly in an index.
Among developed economies, the U.S. economy has maintained its stable growth, led mainly by solid consumption. The employment situation – which underpins consumption – has been steadily improving, with the unemployment rate declining to around 4.1%, the level close to full employment. The European economy has continued to recover moderately, mainly in the household sector.
There are other considerations as well during the period covered by this year’s report:
| – | The Fund’s holdings in the following securities had the largest positive impact on the Fund’s performance: Apple, Inc. call options, Unilever NV, Skyworks Solutions, Inc., and Norfolk Southern Corp. |
| – | The Fund’s holdings in the following securities had the largest negative impact on the Fund’s performance: Teva Pharmaceutical Industries, Inc., Maiden Holdings Ltd., Halliburton Co. and LifePoint Health, Inc. |
| – | The Fund’s international holdings represented more than half of the Fund’s holdings. This led to some underperformance due to currency exposure. |
| – | As of the report date, the Fund’s allocation to U.S. securities was approximately 42% compared to 58% for the MSCI World Index. |
Investment Risks
Equity securities (stocks) are more volatile and carry more risk than other forms of investments, including high-grade fixed income securities. The net asset values per share of a Fund will fluctuate as the value of these securities in the portfolio changes.
The Fund’s investments in debt and/or fixed income securities also contain risk factors. The value of these securities tends to fluctuate inversely with changes in interest rates. Changes in an issuer’s financial strength or creditworthiness also can affect the value of the securities it issues. Convertible and preferred stocks, which have some characteristics of both equity and fixed income securities, also contain, to varying degrees depending on their structure, the associated risks of each.
The Fund’s expenses, as with any mutual fund, detract from the Fund’s performance. The Fund’s asset levels have a direct effect on the expense indirectly paid by shareholders. To the extent the Fund’s assets decline and the expenses of the Fund rise or do not decrease proportionately, performance will be negatively impacted.
International investing involves increased risk and volatility. An investment in this Fund entails the special risks of international investing, including currency exchange fluctuation, government regulations, and the potential for political and economic instability.
By itself the Fund does not constitute a complete investment plan and should be considered a long-term investment for investors who can afford to weather change in the value of their investments.
Investors should refer to the Fund’s Prospectus for a more complete description of risks associated with investing in and of the Fund.
Portfolio holdings will change due to ongoing management of the Funds. References to specific securities or sectors should not be construed as recommendations by the Trust, the Advisor or the Distributor.
11
| | |
| | ANNUAL REPORT 2017 |
PERFORMANCE OVERVIEW – October 31, 2017 (Unaudited)
Comparison of Change in Value of a $10,000 investment in the Commonwealth Global Fund (the “Fund”) and the MSCI World Index.
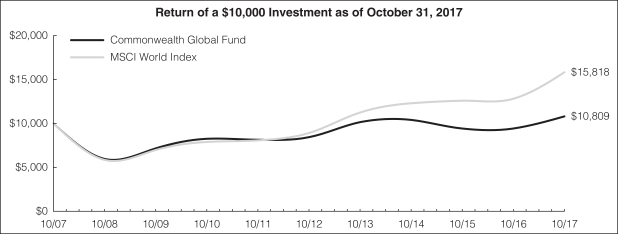
The above graph is a hypothetical $10,000 investment in the Fund from 10/31/07 to 10/31/17, and represents the reinvestment of dividends and distributions in the Fund.
| | | | | | | | | | | | | | | | |
| | | Average Annual Total Returns
as of October 31, 2017 | | | Total Fund
Operating
Expense
Ratio1 | |
| | | 1 Year | | | 5 Year | | | 10 Year | | |
Commonwealth Global Fund | | | 14.60 | % | | | 5.10 | % | | | 0.78 | % | | | 2.93 | % |
MSCI World Index | | | 23.46 | % | | | 12.19 | % | | | 4.69 | % | | | — | |
Past performance does not guarantee future results. The performance data quoted represents past performance and current returns which may be lower or higher. The above graph and table do not reflect the deduction of taxes that a shareholder would pay on Fund distributions or the redemption of Fund shares. The investment return and principal value will fluctuate so that an investor’s shares, when redeemed may be worth more or less than the original cost. To obtain performance information current to the most recent month end, please call 888-345-1898.
| 1 | The above expense ratio is from the Fund’s Prospectus, dated February 28, 2017. Excluding the indirect costs of investing in acquired funds, total fund operating expenses would be 2.92%. Additional information pertaining to the Fund’s expense ratio as of October 31, 2017, can be found in the financial highlights. |
The Fund’s performance is measured against the MSCI World Index, an unmanaged free float-adjusted market capitalization index that is designed to measure global developed market equity performance. Currently the MSCI World Index consists of the following 23 developed market country indices: Australia, Austria, Belgium, Canada, Denmark, Finland, France, Germany, Hong Kong, Ireland, Israel, Italy, Japan, Netherlands, New Zealand, Norway, Portugal, Singapore, Spain, Sweden, Switzerland, the United Kingdom and the United States. The performance of the index is expressed in terms of U.S. dollars, and does not reflect the deduction of fees or taxes with a mutual fund, such as investment management and fund accounting fees. The performance of the Fund reflects the deduction of fees for these services. Investors cannot invest directly in an index.
You should carefully consider the investment objectives, risks, charges and expenses of the Fund before investing. This and other information can be found in the Fund’s Prospectus, which can be obtained from www.commonwealthfunds.com, by calling the Funds directly at 888-345-1898 or by contacting your investment representative. Please read it carefully before you invest or send money.
12
| | |
| | ANNUAL REPORT 2017 |
PERFORMANCE OVERVIEW – October 31, 2017 (Unaudited)
COMMONWEALTH REAL ESTATE SECURITIES FUND
The Commonwealth Real Estate Securities Fund’s net asset value (NAV) as of October 31, 2017, was $16.68 per share compared to $14.41 per share on October 31, 2016. For the twelve-month period covered by this Annual Report, the Commonwealth Real Estate Securities Fund (the “Fund”) posted 15.75% cumulative total return. The MSCI US REIT Index returned 5.56% for the same period. Our investments do not attempt to track any index, but rather we undertake investments on the basis of fundamental research. Additionally, indexes are unmanaged, expressed in terms of U.S. dollars and do not reflect the deduction of fees or taxes associated with ownership of a mutual fund such as investment management and fund accounting fees, nor do they reflect the deduction of taxes associated with ownership of a mutual fund. The performance returns of the Fund do reflect the deduction of fees for these services.
In our view, real estate investment trust (“REIT”) fundamentals in the U.S. remain positive. While the possibility of an interest-rate hike by the Fed in the coming months could at times hinder REITs’ near-term performance, we maintain a favorable view of the market based on strengthening fundamentals and the relative stability of the U.S. economy. We believe that any rise in rates would be accompanied by economic growth, which historically has resulted in stronger demand for all types of real estate. Even modest economic expansion should, in our view, continue to drive cash-flow growth and still low financing costs. Well-managed REITs have been able to replace higher interest rate debt and/or floating credit facilities with lower cost debt. We are also increasing our exposure to Alternative REIT sectors like data centers, timbers, and towers, where growth is stronger on secular demand trends and (or) reduced exposure to the cyclical weakness. Across all sectors, we stress the importance of strong balance sheets and capable management teams.
There are other considerations as well during the period covered by this year’s report:
| – | The Fund’s holdings in the following securities had the largest positive impact on the Fund’s performance: Regions Financial Corp., Toll Brothers, Inc., NVR, Inc., InterContinental Hotels Group Plc., and Lennox International, Inc. |
| – | The Fund’s holdings in the following securities had the largest negative impact on the Fund’s performance: Luby’s, Inc., Brixmor Property Group, Inc., Tanger Factory Outlet Centers, Inc., Acadia Realty Trust, and Farmland Partners, Inc. |
| – | The Fund’s outperformance compared to the MSCI US REIT Index may be in part explained by our strategy of not investing solely in REITs but also investing in real estate and related industries as well as international companies. Real estate and related industries include companies and industries whose fortunes are impacted by the real estate market. |
Investment Risks
Equity securities (stocks) are more volatile and carry more risk than other forms of investments, including high-grade fixed income securities. The net asset values per share of a Fund will fluctuate as the value of these securities in the portfolio changes.
The Fund’s investments in debt and/or fixed income securities also contain risk factors. The value of these securities tends to fluctuate inversely with changes in interest rates. Changes in an issuer’s financial strength or creditworthiness also can affect the value of the securities it issues. Convertible and preferred stocks, which have some characteristics of both equity and fixed income securities, also contain, to varying degrees depending on their structure, the associated risks of each.
The Fund’s expenses, as with any mutual fund, detract from the Fund’s performance. The Fund’s asset levels have a direct effect on the expense indirectly paid by shareholders. To the extent the Fund’s assets decline and the expenses of the Fund rise or do not decrease proportionately, performance will be negatively impacted.
The Fund’s investments in REITs involves certain unique risks in addition to those risks associated with investing in the real estate industry in general. Equity REITs may be affected by changes in the value of the underlying property owned by the REITs, while mortgage REITs may be affected by the quality of any credit extended.
Investments in the Fund are subject to the risks related to direct investment in real estate, such as real estate risk, regulatory risks, concentration risk, and diversification risk.
By itself the Fund does not constitute a complete investment plan and should be considered a long-term investment for investors who can afford to weather change in the value of their investments.
Investors should refer to the Fund’s Prospectus for a more complete description of risks associated with investing in and of the Fund.
Portfolio holdings will change due to ongoing management of the Funds. References to specific securities or sectors should not be construed as recommendations by the Trust, the Advisor or the Distributor.
13
| | |
| | ANNUAL REPORT 2017 |
PERFORMANCE OVERVIEW – October 31, 2017 (Unaudited)
COMMONWEALTH REAL ESTATE SECURITIES FUND
Comparison of Change in Value of a $10,000 investment in the Commonwealth Real Estate Securities Fund (the “Fund”) and the MSCI US REIT Index.
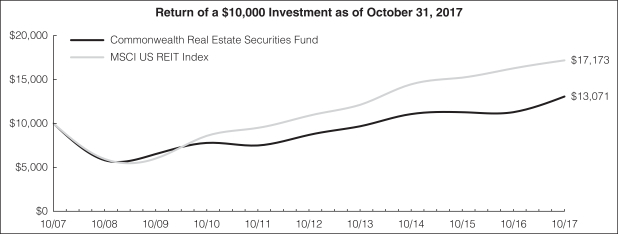
The above graph is a hypothetical $10,000 investment in the Fund from 10/31/07 to 10/31/17, and represents the reinvestment of dividends and distributions in the Fund.
| | | | | | | | | | | | | | | | |
| | | Average Annual Total Returns
as of October 31, 2017 | | | Total Fund
Operating
Expense
Ratio1 | |
| | | 1 Year | | | 5 Year | | | 10 Year | | |
Commonwealth Real Estate Securities Fund | | | 15.75 | % | | | 8.49 | % | | | 2.71 | % | | | 2.95 | % |
MSCI US REIT Index | | | 5.56 | % | | | 9.54 | % | | | 5.56 | % | | | — | |
Past performance does not guarantee future results. The performance data quoted represents past performance and current returns which may be lower or higher. The above graph and table do not reflect the deduction of taxes that a shareholder would pay on Fund distributions or the redemption of Fund shares. The investment return and principal value will fluctuate so that an investor’s shares, when redeemed may be worth more or less than the original cost. To obtain performance information current to the most recent month end, please call 888-345-1898.
| 1 | The above expense ratio is from the Fund’s Prospectus, dated February 28, 2017. Excluding the indirect costs of investing in acquired funds, total fund operating expenses would be 2.93%. Additional information pertaining to the Fund’s expense ratio as of October 31, 2017, can be found in the financial highlights. |
The Fund’s performance is measured against the MSCI US REIT Index which is an unmanaged free float-adjusted market capitalization weighted index that is comprised of equity REITs that are included in the MSCI US Investable Market 2500 Index, with the exception of specialty equity REITs that do not generate a majority of their revenue and income from real estate rental and leasing operations. The index represents approximately 85% of the US REIT universe. This index is expressed in terms of U.S. dollars, and does not reflect the deduction of fees or taxes with a mutual fund, such as investment management and fund accounting fees. The performance of the Fund reflects the deduction of fees for these services. Investors cannot invest directly in an index.
You should carefully consider the investment objectives, risks, charges and expenses of the Fund before investing. This and other information can be found in the Fund’s Prospectus, which can be obtained from www.commonwealthfunds.com, by calling the Funds directly at 888-345-1898 or by contacting your investment representative. Please read it carefully before you invest or send money.
14
| | |
| | ANNUAL REPORT 2017 |
PORTFOLIO COMPOSITION – October 31, 2017* (Unaudited)
| | | | |
| COMMONWEALTH AUSTRALIA/NEW ZEALAND FUND | |
Industry or
Security Type | | Percentage of Total
Investments | |
Marine Ports & Services | | | 22.5 | % |
Air Freight & Logistics | | | 7.6 | % |
Health Care Facilities | | | 5.8 | % |
Specialized Finance | | | 5.0 | % |
Health Care Equipment | | | 4.9 | % |
Health Care Services | | | 4.5 | % |
Electric Utilities | | | 4.4 | % |
Oil & Gas Refining & Marketing | | | 4.1 | % |
Packaged Foods & Meats | | | 3.9 | % |
Education Services | | | 3.2 | % |
Renewable Electricity | | | 3.2 | % |
Banks | | | 3.0 | % |
Property & Casualty Insurance | | | 3.0 | % |
Biotechnology | | | 2.6 | % |
Multi-Utilities and Unregulated Power | | | 2.6 | % |
Personal Products | | | 2.5 | % |
Reinsurance | | | 2.5 | % |
Home Furnishing Retail | | | 2.0 | % |
Human Resource & Employment Services | | | 1.4 | % |
Airport Services | | | 1.3 | % |
Hotels, Resorts & Cruise Lines | | | 1.2 | % |
Internet Software & Services | | | 1.1 | % |
Wireless Telecommunication Services | | | 1.1 | % |
Gas Utilities | | | 1.0 | % |
Paper Packaging | | | 1.0 | % |
Diversified Support Services | | | 0.9 | % |
Industrial Machinery | | | 0.9 | % |
Drug Retail | | | 0.7 | % |
Distillers & Vintners | | | 0.5 | % |
Electronic Equipment Manufacturers | | | 0.5 | % |
Regional Banks | | | 0.4 | % |
Integrated Oil & Gas | | | 0.3 | % |
Integrated Telecommunication Services | | | 0.3 | % |
Short-Term Investments | | | 0.1 | % |
| | | 100.0 | % |
| | | | |
| AFRICA FUND | |
Country or
Security Type | | Percentage of Total
Investments | |
South Africa | | | 79.2 | % |
Exchange Traded Funds – Africa Region | | | 8.7 | % |
Short-Term Investments | | | 5.5 | % |
Exchange Traded Funds – Nigeria | | | 4.2 | % |
Botswana | | | 0.9 | % |
Egypt | | | 0.8 | % |
Zambia | | | 0.7 | % |
| | | 100.0 | % |
| | | | |
| COMMONWEALTH JAPAN FUND | |
Industry or
Security Type | | Percentage of Total
Investments | |
Railroads | | | 13.3 | % |
Health Care Supplies | | | 10.3 | % |
Construction & Engineering | | | 7.1 | % |
Life & Health Insurance | | | 6.5 | % |
Health Care Equipment | | | 6.1 | % |
Industrial Machinery | | | 5.1 | % |
Diversified Real Estate Activities | | | 5.0 | % |
Air Freight & Logistics | | | 3.9 | % |
Leisure Products | | | 3.2 | % |
Brewers | | | 3.1 | % |
Electronic Equipment & Instruments | | | 3.0 | % |
IT Consulting & Other Services | | | 2.8 | % |
Trucking | | | 2.8 | % |
Soft Drinks | | | 2.6 | % |
Household Products | | | 2.5 | % |
Drug Retail | | | 2.4 | % |
Specialized Finance | | | 2.3 | % |
Pharmaceuticals | | | 2.0 | % |
Retail REITs | | | 1.9 | % |
Tires & Rubber | | | 1.8 | % |
Electric Utilities | | | 1.7 | % |
Electronic Components | | | 1.7 | % |
Marine | | | 1.5 | % |
Auto Parts & Equipment | | | 1.3 | % |
Other Diversified Financial Services | | | 1.3 | % |
Distributors | | | 1.1 | % |
Specialty Chemicals | | | 1.1 | % |
Food Retail | | | 1.0 | % |
Regional Banks | | | 0.9 | % |
Short-Term Investments | | | 0.7 | % |
| | | 100.0 | % |
| * | Portfolio composition is subject to change. |
15
| | |
| | ANNUAL REPORT 2017 |
PORTFOLIO COMPOSITION – October 31, 2017* (Unaudited)
| | | | |
| COMMONWEALTH GLOBAL FUND | |
Country or
Security Type | | Percentage of Total
Investments | |
United States | | | 42.0 | % |
United Kingdom | | | 14.9 | % |
Japan | | | 7.1 | % |
Switzerland | | | 5.1 | % |
Israel | | | 4.2 | % |
France | | | 3.2 | % |
Germany | | | 3.1 | % |
Chile | | | 2.5 | % |
India | | | 2.3 | % |
Norway | | | 2.3 | % |
Call Options | | | 2.2 | % |
South Africa | | | 2.1 | % |
Mexico | | | 2.0 | % |
Denmark | | | 1.8 | % |
Short-Term Investments | | | 1.7 | % |
Panama | | | 1.1 | % |
Bermuda | | | 1.0 | % |
Spain | | | 0.8 | % |
Netherlands | | | 0.6 | % |
| | | 100.0 | % |
| | | | |
| COMMONWEALTH REAL ESTATE SECURITIES FUND | |
Industry or
Security Type | | Percentage of Total
Investments | |
Specialized REITs | | | 17.9 | % |
Construction Materials | | | 8.5 | % |
Office REITs | | | 8.0 | % |
Diversified REITs | | | 6.9 | % |
Short-Term Investments | | | 6.4 | % |
Residential REITs | | | 4.2 | % |
Hotels, Resorts & Cruise Lines | | | 3.9 | % |
Real Estate Operating Companies | | | 3.9 | % |
Home Improvement Retail | | | 3.8 | % |
Retail REITs | | | 3.4 | % |
Homebuilding | | | 3.3 | % |
Wireless Telecommunication Services | | | 3.2 | % |
Regional Banks | | | 3.1 | % |
Industrial REITs | | | 3.0 | % |
Building Products | | | 2.9 | % |
Integrated Telecommunication Services | | | 2.8 | % |
Mortgage REITs | | | 2.6 | % |
Exchange-Traded Funds – China | | | 2.3 | % |
Airport Services | | | 2.1 | % |
Construction & Engineering | | | 1.8 | % |
Thrifts & Mortgage Finance | | | 1.7 | % |
Diversified Real Estate Activities | | | 1.3 | % |
Alternative Carriers | | | 1.0 | % |
Hotel & Resort REITs | | | 0.7 | % |
Real Estate Development | | | 0.7 | % |
Home Furnishing | | | 0.3 | % |
Call Options | | | 0.3 | % |
Restaurants | | | 0.0 | %(a) |
| | | 100.0 | % |
| * | Portfolio composition is subject to change. |
| (a) | Amount is less than 0.05%. |
16
| | |
| | ANNUAL REPORT 2017 |
SCHEDULE OF INVESTMENTS – October 31, 2017
Commonwealth Australia/New Zealand Fund
| | | | | | | | |
| | | Shares | | | Fair Value | |
COMMON STOCKS (95.0%) | | | | | | | | |
AUSTRALIA (20.0%) | | | | | | | | |
BIOTECHNOLOGY (2.3%) | | | | | | | | |
CSL Ltd. | | | 2,500 | | | $ | 265,864 | |
Sirtex Medical Ltd. | | | 20,000 | | | | 209,124 | |
| | | | | | | | |
| | | | | | | 474,988 | |
| | | | | | | | |
DIVERSIFIED SUPPORT SERVICES (0.9%) | | | | | | | | |
Brambles Ltd. | | | 25,608 | | | | 185,435 | |
| | | | | | | | |
EDUCATION SERVICES (1.1%) | | | | | | | | |
G8 Education Ltd. | | | 64,141 | | | | 223,885 | |
| | | | | | | | |
GAS UTILITIES (0.9%) | | | | | | | | |
APA Group | | | 30,000 | | | | 196,571 | |
| | | | | | | | |
HEALTH CARE EQUIPMENT (2.6%) | | | | | | | | |
Cochlear Ltd. | | | 4,000 | | | | 538,640 | |
| | | | | | | | |
HEALTH CARE FACILITIES (0.3%) | | | | | | | | |
Estia Health Ltd. | | | 25,000 | | | | 66,595 | |
| | | | | | | | |
HEALTH CARE SERVICES (2.3%) | | | | | | | | |
Sonic Healthcare Ltd. | | | 28,382 | | | | 472,961 | |
| | | | | | | | |
HUMAN RESOURCE & EMPLOYMENT SERVICES (1.3%) | | | | | | | | |
SEEK Ltd. | | | 20,000 | | | | 281,231 | |
| | | | | | | | |
INTEGRATED OIL & GAS (0.3%) | | | | | | | | |
Origin Energy Ltd. * | | | 10,000 | | | | 60,778 | |
| | | | | | | | |
INTERNET SOFTWARE & SERVICES (1.0%) | | | | | | | | |
carsales.com Ltd. | | | 20,501 | | | | 215,147 | |
| | | | | | | | |
INTEGRATED TELECOMMUNICATION SERVICES (0.3%) | | | | | | | | |
Telstra Corp. Ltd. | | | 20,000 | | | | 54,195 | |
| | | | | | | | |
MARINE PORTS & SERVICES (0.4%) | | | | | | | | |
Qube Holdings Ltd. | | | 40,000 | | | | 78,689 | |
| | | | | | | | |
MULTI-UTILITIES & UNREGULATED POWER (2.5%) | | | | | | | | |
AGL Energy Ltd. | | | 27,512 | | | | 532,171 | |
| | | | | | | | |
PAPER PACKAGING (1.0%) | | | | | | | | |
Orora Ltd. | | | 81,526 | | | | 212,177 | |
| | | | | | | | |
PROPERTY & CASUALTY INSURANCE (2.4%) | | | | | | | | |
QBE Insurance Group Ltd. | | | 20,000 | | | | 163,503 | |
Suncorp Group Ltd. | | | 32,163 | | | | 334,334 | |
| | | | | | | | |
| | | | | | | 497,837 | |
| | | | | | | | |
REGIONAL BANKS (0.4%) | | | | | | | | |
Bank of Queensland Ltd. | | | 8,500 | | | | 86,926 | |
| | | | | | | | |
| | | | | | | 4,178,226 | |
| | | | | | | | |
| | | | | | | | |
| | | Shares | | | Fair Value | |
COMMON STOCKS (95.0%) – Continued | | | | | | | | |
NEW ZEALAND (75.0%) | | | | | | | | |
AIR FREIGHT & LOGISTICS (7.5%) | | | | | | | | |
Fliway Group Ltd. | | | 300,000 | | | $ | 244,286 | |
Freightways Ltd. | | | 123,540 | | | | 647,541 | |
Mainfreight Ltd. | | | 40,000 | | | | 669,495 | |
| | | | | | | | |
| | | | | | | 1,561,322 | |
| | | | | | | | |
AIRPORT SERVICES (1.3%) | | | | | | | | |
Airwork Holdings Ltd. | | | 77,917 | | | | 268,716 | |
| | | | | | | | |
BIOTECHNOLOGY (0.2%) | | | | | | | | |
Pacific Edge Ltd. * | | | 200,000 | | | | 46,531 | |
| | | | | | | | |
DISTILLERS & VINTNERS (0.5%) | | | | | | | | |
Delegat Group Ltd. | | | 21,456 | | | | 104,241 | |
| | | | | | | | |
DRUG RETAIL (0.7%) | | | | | | | | |
Green Cross Health Ltd. | | | 104,188 | | | | 137,596 | |
| | | | | | | | |
EDUCATION SERVICES (2.1%) | | | | | | | | |
Evolve Education Group Ltd. | | | 849,107 | | | | 435,767 | |
| | | | | | | | |
ELECTRIC UTILITIES (4.4%) | | | | | | | | |
Genesis Energy Ltd. | | | 200,000 | | | | 335,295 | |
Infratil Ltd. | | | 260,777 | | | | 573,695 | |
| | | | | | | | |
| | | | | | | 908,990 | |
| | | | | | | | |
ELECTRONIC EQUIPMENT MANUFACTURERS (0.5%) | | | | | | | | |
ikeGPS Group Ltd. * | | | 478,802 | | | | 101,566 | |
| | | | | | | | |
HEALTH CARE EQUIPMENT (2.2%) | | | | | | | | |
Fisher & Paykel Healthcare Corp. Ltd. | | | 51,427 | | | | 466,270 | |
| | | | | | | | |
HEALTH CARE FACILITIES (5.4%) | | | | | | | | |
Arvida Group Ltd. | | | 280,000 | | | | 228,001 | |
Ryman Healthcare Ltd. | | | 140,000 | | | | 890,926 | |
| | | | | | | | |
| | | | | | | 1,118,927 | |
| | | | | | | | |
HEALTH CARE SERVICES (2.1%) | | | | | | | | |
Abano Healthcare Group Ltd. | | | 67,163 | | | | 448,090 | |
| | | | | | | | |
HOME FURNISHING RETAIL (1.9%) | | | | | | | | |
Briscoe Group Ltd. | | | 183,520 | | | | 406,873 | |
| | | | | | | | |
HOTELS, RESORTS & CRUISE LINES (1.1%) | | | | | | | | |
Millennium & Copthorne Hotels New Zealand Ltd. | | | 125,000 | | | | 240,352 | |
| | | | | | | | |
INDUSTRIAL MACHINERY (0.9%) | | | | | | | | |
Skellerup Holdings Ltd. | | | 150,000 | | | | 183,728 | |
| | | | | | | | |
MARINE PORTS & SERVICES (21.7%) | |
Marsden Maritime Holdings Ltd. | | | 81,425 | | | | 310,623 | |
Port of Tauranga Ltd. | | | 75,000 | | | | 235,049 | |
South Port New Zealand Ltd. | | | 970,540 | | | | 3,984,700 | |
| | | | | | | | |
| | | | | | | 4,530,372 | |
| | | | | | | | |
See accompanying notes to financial statements.
17
| | |
| | ANNUAL REPORT 2017 |
SCHEDULE OF INVESTMENTS – October 31, 2017
Commonwealth Australia/New Zealand Fund
| | | | | | | | |
| | | Shares | | | Fair Value | |
COMMON STOCKS (95.0%) – Continued | | | | | | | | |
NEW ZEALAND (75.0%) – Continued | | | | | | | | |
OIL & GAS REFINING & MARKETING (4.0%) | |
New Zealand Refining Co., Ltd. | | | 345,157 | | | $ | 595,180 | |
Z Energy Ltd. | | | 47,000 | | | | 237,026 | |
| | | | | | | | |
| | | | | | | 832,206 | |
| | | | | | | | |
PACKAGED FOODS & MEATS (3.8%) | |
Sanford Ltd. | | | 93,406 | | | | 504,932 | |
Tegel Group Holdings Ltd. | | | 300,000 | | | | 285,343 | |
| | | | | | | | |
| | | | | | | 790,275 | |
| | | | | | | | |
PERSONAL PRODUCTS (2.5%) | | | | | | | | |
Comvita Ltd. | | | 50,000 | | | | 291,159 | |
Trilogy International Ltd. | | | 140,000 | | | | 225,127 | |
| | | | | | | | |
| | | | | | | 516,286 | |
| | | | | | | | |
PROPERTY & CASUALTY INSURANCE (0.5%) | |
TOWER Ltd. * | | | 200,000 | | | | 110,853 | |
| | | | | | | | |
REINSURANCE (2.5%) | | | | | | | | |
CBL Corp. Ltd. | | | 255,000 | | | | 513,001 | |
| | | | | | | | |
RENEWABLE ELECTRICITY (3.2%) | | | | | | | | |
Meridian Energy Ltd. | | | 150,000 | | | | 292,528 | |
Tilt Renewables Ltd. | | | 275,000 | | | | 366,943 | |
| | | | | | | | |
| | | | | | | 659,471 | |
| | | | | | | | |
SPECIALIZED FINANCE (4.9%) | | | | | | | | |
Heartland Bank Ltd. | | | 779,758 | | | | 1,013,781 | |
| | | | | | | | |
WIRELESS TELECOMMUNICATION SERVICES (1.1%) | |
TeamTalk Ltd. | | | 415,473 | | | | 227,438 | |
| | | | | | | | |
| | | | | | | 15,622,652 | |
| | | | | | | | |
TOTAL COMMON STOCKS
(Cost $13,207,002) | | | | | | | 19,800,878 | |
| | | | | | | | |
| | | Principal | | | | |
CORPORATE BONDS (3.0%) | | | | | | | | |
NEW ZEALAND (3.0%) | | | | | | | | |
BANKS (3.0%) | | | | | | | | |
Credit Agricole SA,
5.04%, 12/29/49 (1) (2) | | | 900,000 | | | | 617,079 | |
| | | | | | | | |
TOTAL CORPORATE BONDS
(Cost $468,945) | | | | | | | 617,079 | |
| | | | | | | | |
| | | | | | | | |
| | | Shares | | | Fair Value | |
RIGHTS (0.0%) | |
NEW ZEALAND (0.0%) | | | | | | | | |
BIOTECHNOLOGY (0.0%) | | | | | | | | |
Pacific Edge Ltd., Expiring 11/10/17 (3) | | | 33,333 | | | $ | 456 | |
| | | | | | | | |
TOTAL RIGHTS
(Cost $299) | | | | | | | 456 | |
| | | | | | | | |
SHORT-TERM INVESTMENTS (0.1%) | | | | | | | | |
Federated Government Obligations Fund, Institutional Class, 0.92% (4) | | | 29,943 | | | | 29,943 | |
| | | | | | | | |
TOTAL SHORT-TERM INVESTMENTS
(Cost $29,943) | | | | | | | 29,943 | |
| | | | | | | | |
INVESTMENTS (98.1%)
(Cost $13,706,189) | | | | | | | 20,448,356 | |
| | |
| OTHER ASSETS IN EXCESS OF LIABILITIES (1.9%) | | | | | | | 396,703 | |
| | | | | | | | |
| NET ASSETS (100.0%) | | | | | | $ | 20,845,059 | |
| | | | | | | | |
| * | Non-income producing security. |
| (2) | Principal amount shown is in New Zealand Dollars; value shown in U.S. Dollars. |
| (3) | Security is being fair valued in accordance with the Trust’s fair valuation policies and has been deemed illiquid and represents 0.00% of the Fund’s net assets. |
| (4) | Rate disclosed is the seven day effective yield as of October 31, 2017. |
See accompanying notes to financial statements.
18
| | |
| | ANNUAL REPORT 2017 |
SCHEDULE OF INVESTMENTS – October 31, 2017
| | | | | | | | |
| | | Shares | | | Fair Value | |
COMMON STOCKS (81.7%) | | | | | | | | |
BOTSWANA (0.9%) | | | | | | | | |
FOOD RETAIL (0.9%) | | | | | | | | |
Choppies Enterprises Ltd. | | | 121,810 | | | $ | 25,849 | |
| | | | | | | | |
EGYPT (0.8%) | | | | | | | | |
DIVERSIFIED BANKS (0.8%) | | | | | | | | |
Commercial International Bank Egypt SAE | | | 5,000 | | | | 22,825 | |
| | | | | | | | |
SOUTH AFRICA (79.3%) | | | | | | | | |
AGRICULTURAL PRODUCTS (1.2%) | | | | | | | | |
Crookes Brothers Ltd. | | | 8,000 | | | | 33,388 | |
| | | | | | | | |
AIRLINES (1.2%) | | | | | | | | |
Comair Ltd. | | | 83,465 | | | | 33,358 | |
| | | | | | | | |
APPAREL RETAIL (0.5%) | | | | | | | | |
Mr. Price Group Ltd. | | | 1,000 | | | | 12,397 | |
| | | | | | | | |
ASSET MANAGEMENT & CUSTODY BANKS (1.2%) | | | | | | | | |
Coronation Fund Managers Ltd. | | | 6,500 | | | | 32,806 | |
| | | | | | | | |
AUTOMOTIVE RETAIL (1.0%) | | | | | | | | |
Combined Motor Holdings Ltd. | | | 15,000 | | | | 28,097 | |
| | | | | | | | |
CABLE & SATELLITE (6.2%) | | | | | | | | |
Naspers Ltd., N Shares | | | 700 | | | | 170,582 | |
| | | | | | | | |
COAL & CONSUMABLE FUELS (0.7%) | | | | | | | | |
Exxaro Resources Ltd. | | | 2,000 | | | | 20,338 | |
| | | | | | | | |
CONSTRUCTION & ENGINEERING (1.5%) | | | | | | | | |
Murray & Roberts Holdings Ltd. | | | 9,000 | | | | 10,186 | |
Wilson Bayly Holmes-Ovcon Ltd. | | | 3,000 | | | | 32,150 | |
| | | | | | | | |
| | | | | | | 42,336 | |
| | | | | | | | |
DEPARTMENT STORES (0.4%) | | | | | | | | |
Woolworths Holdings Ltd. | | | 3,046 | | | | 12,141 | |
| | | | | | | | |
DISTRIBUTORS (1.3%) | | | | | | | | |
Imperial Holdings Ltd. ADR | | | 2,400 | | | | 34,728 | |
| | | | | | | | |
DIVERSIFIED BANKS (10.5%) | | | | | | | | |
Capitec Bank Holdings Ltd. | | | 2,850 | | | | 189,472 | |
Nedbank Group Ltd. | | | 3,000 | | | | 44,006 | |
Standard Bank Group Ltd. ADR | | | 4,800 | | | | 56,448 | |
| | | | | | | | |
| | | | | | | 289,926 | |
| | | | | | | | |
ENVIRONMENTAL & FACILITIES SERVICES (1.9%) | | | | | | | | |
Interwaste Holdings Ltd. * | | | 802,469 | | | | 52,791 | |
| | | | | | | | |
FOOD DISTRIBUTORS (2.5%) | | | | | | | | |
Bid Corp. Ltd. | | | 3,167 | | | | 69,671 | |
| | | | | | | | |
FOOD RETAIL (2.8%) | | | | | | | | |
Shoprite Holdings Ltd. ADR | | | 5,400 | | | | 78,300 | |
| | | | | | | | |
| | | | | | | | |
| | | Shares | | | Fair Value | |
COMMON STOCKS (81.7%) – Continued | | | | | | | | |
SOUTH AFRICA (79.3%) – Continued | | | | | | | | |
GOLD (1.4%) | | | | | | | | |
AngloGold Ashanti Ltd. ADR | | | 2,000 | | | $ | 18,600 | |
Gold Fields Ltd. ADR | | | 5,000 | | | | 19,850 | |
| | | | | | | | |
| | | | | | | 38,450 | |
| | | | | | | | |
HEALTH CARE FACILITIES (1.8%) | | | | | | | | |
Mediclinic International Ltd. | | | 6,562 | | | | 50,729 | |
| | | | | | | | |
HUMAN RESOURCE & EMPLOYMENT SERVICES (0.7%) | | | | | | | | |
Adcorp Holdings Ltd. | | | 20,000 | | | | 20,160 | |
| | | | | | | | |
INDUSTRIAL CONGLOMERATES (1.8%) | | | | | | | | |
Bidvest Group Ltd. | | | 4,167 | | | | 50,551 | |
| | | | | | | | |
INDUSTRIAL MACHINERY (1.0%) | | | | | | | | |
Howden Africa Holdings Ltd. * | | | 11,000 | | | | 26,456 | |
| | | | | | | | |
INTEGRATED OIL & GAS (1.7%) | | | | | | | | |
Sasol Ltd. ADR | | | 1,600 | | | | 46,576 | |
| | | | | | | | |
LIFE & HEALTH INSURANCE (8.2%) | | | | | | | | |
Clientele Ltd. | | | 90,000 | | | | 108,227 | |
Discovery Ltd. | | | 9,000 | | | | 93,298 | |
MMI Holdings Ltd. | | | 20,000 | | | | 26,597 | |
| | | | | | | | |
| | | | | | | 228,122 | |
| | | | | | | | |
MARINE (1.4%) | | | | | | | | |
Grindrod Ltd. * | | | 35,000 | | | | 38,548 | |
| | | | | | | | |
OTHER DIVERSIFIED FINANCIAL SERVICES (9.8%) | | | | | | | | |
Alexander Forbes Group Holdings Ltd. | | | 50,000 | | | | 25,784 | |
FirstRand Ltd. | | | 14,300 | | | | 51,841 | |
PSG Group Ltd. | | | 10,400 | | | | 193,104 | |
| | | | | | | | |
| | | | | | | 270,729 | |
| | | | | | | | |
PACKAGED FOODS & MEATS (7.5%) | | | | | | | | |
Astral Foods Ltd. | | | 4,000 | | | | 54,881 | |
Pioneer Foods Group Ltd. | | | 4,000 | | | | 33,671 | |
RCL Foods Ltd. | | | 27,559 | | | | 29,261 | |
Sovereign Food Investments Ltd. * | | | 60,000 | | | | 50,506 | |
Tiger Brands Ltd. | | | 1,400 | | | | 38,226 | |
| | | | | | | | |
| | | | | | | 206,545 | |
| | | | | | | | |
PHARMACEUTICALS (0.8%) | | | | | | | | |
Aspen Pharmacare Holdings Ltd. | | | 1,000 | | | | 22,597 | |
| | | | | | | | |
PRECIOUS METALS & MINERALS (1.6%) | | | | | | | | |
Anglo American Platinum Ltd. * | | | 800 | | | | 22,268 | |
Impala Platinum Holdings Ltd. * | | | 8,000 | | | | 22,194 | |
| | | | | | | | |
| | | | | | | 44,462 | |
| | | | | | | | |
See accompanying notes to financial statements.
19
| | |
| | ANNUAL REPORT 2017 |
SCHEDULE OF INVESTMENTS – October 31, 2017
| | | | | | | | |
| | | Shares | | | Fair Value | |
COMMON STOCKS (81.7%) – Continued | | | | | | | | |
SOUTH AFRICA (79.3%) – Continued | | | | | | | | |
TECHNOLOGY DISTRIBUTORS (1.0%) | | | | | | | | |
Alviva Holdings Ltd. | | | 20,700 | | | $ | 28,743 | |
| | | | | | | | |
TRADING COMPANIES & DISTRIBUTORS (3.4%) | | | | | | | | |
Barloworld Ltd. | | | 4,300 | | | | 40,552 | |
Invicta Holdings Ltd. | | | 4,000 | | | | 15,503 | |
Trencor Ltd. | | | 12,000 | | | | 37,349 | |
| | | | | | | | |
| | | | | | | 93,404 | |
| | | | | | | | |
TRUCKING (0.9%) | | | | | | | | |
Value Group Ltd. | | | 87,364 | | | | 23,484 | |
| | | | | | | | |
WIRELESS TELECOMMUNICATION SERVICES (3.4%) | | | | | | | | |
MTN Group Ltd. ADR | | | 7,000 | | | | 60,494 | |
Vodacom Group Ltd. | | | 3,000 | | | | 32,596 | |
| | | | | | | | |
| | | | | | | 93,090 | |
| | | | | | | | |
| | | | | | | 2,193,505 | |
| | | | | | | | |
ZAMBIA (0.7%) | | | | | | | | |
PACKAGED FOODS & MEATS (0.7%) | | | | | | | | |
Zambeef Products PLC * | | | 120,000 | | | | 18,729 | |
| | | | | | | | |
TOTAL COMMON STOCKS
(Cost $2,142,611) | | | | | | | 2,260,908 | |
| | | | | | | | |
EXCHANGE-TRADED FUNDS (13.0%) | | | | | | | | |
Global X MSCI Nigeria ETF | | | 5,550 | | | | 117,272 | |
VanEck Vectors Africa Index ETF | | | 10,340 | | | | 242,267 | |
| | | | | | | | |
TOTAL EXCHANGE-TRADED FUNDS
(Cost $410,921) | | | | | | | 359,539 | |
| | | | | | | | |
| | | Principal | | | | |
SOVEREIGN BONDS (0.5%) | |
SOUTH AFRICA (0.5%) | |
South Africa Government Bond,
8.00%, 12/21/18 (1) | | | 200,000 | | | | 14,234 | |
| | | | | | | | |
TOTAL SOVEREIGN BONDS
(Cost $26,203) | | | | | | | 14,234 | |
| | | | | | | | |
| | | | | | | | |
| | | Shares | | | Fair Value | |
SHORT-TERM INVESTMENTS (5.6%) | | | | | | | | |
Federated Government Obligations Fund, Institutional Class, 0.92% (2) | | | 153,364 | | | $ | 153,364 | |
| | | | | | | | |
TOTAL SHORT-TERM INVESTMENTS
(Cost $153,364) | | | | | | | 153,364 | |
| | | | | | | | |
INVESTMENTS (100.8%)
(Cost $2,733,099) | | | | | | | 2,788,045 | |
| | |
| LIABILITIES IN EXCESS OF OTHER ASSETS (-0.8%) | | | | | | | (21,943 | ) |
| | | | | | | | |
| NET ASSETS (100.0%) | | | | | | $ | 2,766,102 | |
| | | | | | | | |
| * | Non-income producing security. |
| (1) | Principal amount shown is in South African Rand; value shown in U.S. Dollars. |
| (2) | Rate disclosed is the seven day effective yield as of October 31, 2017. |
ADR — American Depositary Receipt
ETF — Exchange-Traded Fund
See accompanying notes to financial statements.
20
| | |
| | ANNUAL REPORT 2017 |
SCHEDULE OF INVESTMENTS – October 31, 2017
| | | | | | | | |
| | | Shares | | | Fair Value | |
COMMON STOCKS (98.5%) | | | | | | | | |
JAPAN (98.5%) | | | | | | | | |
AIR FREIGHT & LOGISTICS (3.9%) | | | | | | | | |
Kintetsu World Express, Inc. | | | 4,000 | | | $ | 68,432 | |
Yamato Holdings Co., Ltd. | | | 7,000 | | | | 142,321 | |
| | | | | | | | |
| | | | | | | 210,753 | |
| | | | | | | | |
AUTO PARTS & EQUIPMENT (1.3%) | | | | | | | | |
NGK Spark Plug Co., Ltd. | | | 3,000 | | | | 67,526 | |
| | | | | | | | |
BREWERS (3.1%) | | | | | | | | |
Kirin Holdings Co., Ltd. | | | 7,000 | | | | 166,519 | |
| | | | | | | | |
CONSTRUCTION & ENGINEERING (7.1%) | | | | | | | | |
Kajima Corp. | | | 25,700 | | | | 265,160 | |
Taihei Dengyo Kaisha Ltd. | | | 3,000 | | | | 76,181 | |
Takada Corp. | | | 6,000 | | | | 39,001 | |
| | | | | | | | |
| | | | | | | 380,342 | |
| | | | | | | | |
DISTRIBUTORS (1.0%) | | | | | | | | |
Yamae Hisano Co., Ltd. | | | 5,200 | | | | 56,716 | |
| | | | | | | | |
DIVERSIFIED REAL ESTATE ACTIVITIES (5.0%) | |
Mitsui Fudosan Co., Ltd. | | | 3,000 | | | | 69,294 | |
Sumitomo Realty & Development Co., Ltd. | | | 4,000 | | | | 132,465 | |
Tokyu Fudosan Holdings Corp. | | | 10,000 | | | | 65,089 | |
| | | | | | | | |
| | | | | | | 266,848 | |
| | | | | | | | |
DRUG RETAIL (2.4%) | | | | | | | | |
Sugi Holdings Co., Ltd. | | | 2,500 | | | | 126,660 | |
| | | | | | | | |
ELECTRIC UTILITIES (1.7%) | | | | | | | | |
Tohoku Electric Power Co., Inc. | | | 7,000 | | | | 91,248 | |
| | | | | | | | |
ELECTRONIC COMPONENTS (1.7%) | | | | | | | | |
ALPS Electronic Co., Ltd. | | | 3,000 | | | | 90,905 | |
| | | | | | | | |
ELECTRONIC EQUIPMENT & INSTRUMENTS (2.9%) | | | | | | | | |
Hitachi Ltd. | | | 20,000 | | | | 157,797 | |
| | | | | | | | |
FOOD RETAIL (1.0%) | | | | | | | | |
Maxvalu Kyushu Co., Ltd. | | | 3,000 | | | | 55,546 | |
| | | | | | | | |
HEALTH CARE EQUIPMENT (6.0%) | | | | | | | | |
CYBERDYNE, Inc. * | | | 9,000 | | | | 118,586 | |
Terumo Corp. | | | 5,000 | | | | 206,922 | |
| | | | | | | | |
| | | | | | | 325,508 | |
| | | | | | | | |
HEALTH CARE SUPPLIES (10.2%) | | | | | | | | |
Asahi Intecc Co., Ltd. | | | 5,750 | | | | 331,779 | |
Hoya Corp. | | | 4,000 | | | | 215,991 | |
| | | | | | | | |
| | | | | | | 547,770 | |
| | | | | | | | |
HOUSEHOLD PRODUCTS (2.5%) | | | | | | | | |
Unicharm Corp. | | | 6,000 | | | | 135,764 | |
| | | | | | | | |
| | | | | | | | |
| | | Shares | | | Fair Value | |
COMMON STOCKS (98.5%) – Continued | | | | | | | | |
JAPAN (98.5%) – Continued | | | | | | | | |
INDUSTRIAL MACHINERY (5.1%) | | | | | | | | |
FANUC Corp. | | | 700 | | | $ | 162,363 | |
Meidensha Corp. | | | 28,000 | | | | 109,842 | |
| | | | | | | | |
| | | | | | | 272,205 | |
| | | | | | | | |
IT CONSULTING & OTHER SERVICES (2.8%) | | | | | | | | |
INES Corp. | | | 5,000 | | | | 46,530 | |
Otsuka Corp. | | | 1,500 | | | | 101,592 | |
| | | | | | | | |
| | | | | | | 148,122 | |
| | | | | | | | |
LEISURE PRODUCTS (3.2%) | | | | | | | | |
Sankyo Co., Ltd. | | | 2,000 | | | | 64,298 | |
Shimano, Inc. | | | 800 | | | | 108,857 | |
| | | | | | | | |
| | | | | | | 173,155 | |
| | | | | | | | |
LIFE & HEALTH INSURANCE (6.4%) | | | | | | | | |
Dai-ichi Life Insurance Co., Ltd. | | | 11,000 | | | | 207,296 | |
T&D Holdings, Inc. | | | 9,000 | | | | 138,416 | |
| | | | | | | | |
| | | | | | | 345,712 | |
| | | | | | | | |
MARINE (1.4%) | | | | | | | | |
Kawasaki Kisen Kaisha Ltd. | | | 3,000 | | | | 77,896 | |
| | | | | | | | |
OTHER DIVERSIFIED FINANCIAL SERVICES (1.3%) | | | | | | | | |
Orix Corp. | | | 4,000 | | | | 68,203 | |
| | | | | | | | |
PHARMACEUTICALS (2.0%) | | | | | | | | |
Sosei Group Corp. * | | | 1,200 | | | | 109,561 | |
| | | | | | | | |
RAILROADS (13.2%) | | | | | | | | |
East Japan Railway Co. | | | 1,500 | | | | 144,736 | |
Hankyu Hanshin Holdings, Inc. | | | 4,400 | | | | 170,481 | |
Keikyu Corp. | | | 6,500 | | | | 133,728 | |
Keio Corp. | | | 3,600 | | | | 156,109 | |
Tobu Railway Co., Ltd. | | | 3,600 | | | | 105,128 | |
| | | | | | | | |
| | | | | | | 710,182 | |
| | | | | | | | |
REGIONAL BANKS (0.9%) | | | | | | | | |
Nishi-Nippon Financial Holdings, Inc. | | | 4,000 | | | | 46,196 | |
| | | | | | | | |
RETAIL REITS (1.8%) | | | | | | | | |
Fukuoka REIT Corp. | | | 70 | | | | 99,314 | |
| | | | | | | | |
SOFT DRINKS (2.6%) | | | | | | | | |
Coca-Cola West Co., Ltd. | | | 4,000 | | | | 138,974 | |
| | | | | | | | |
SPECIALIZED FINANCE (2.3%) | | | | | | | | |
Kyushu Leasing Service Co., Ltd. | | | 13,000 | | | | 121,550 | |
| | | | | | | | |
SPECIALTY CHEMICALS (1.1%) | | | | | | | | |
JSR Corp. | | | 3,000 | | | | 57,736 | |
| | | | | | | | |
See accompanying notes to financial statements.
21
| | |
| | ANNUAL REPORT 2017 |
SCHEDULE OF INVESTMENTS – October 31, 2017
| | | | | | | | |
| | | Shares | | | Fair Value | |
COMMON STOCKS (98.5%) – Continued | | | | | | | | |
JAPAN (98.5%) – Continued | | | | | | | | |
TIRES & RUBBER (1.8%) | | | | | | | | |
Bridgestone Corp. | | | 2,000 | | | $ | 94,819 | |
| | | | | | | | |
TRUCKING 2.8% | | | | | | | | |
Daiichi Koutsu Sangyo Co., Ltd. | | | 7,200 | | | | 57,377 | |
Nippon Express Co., Ltd. | | | 1,500 | | | | 94,599 | |
| | | | | | | | |
| | | | | | | 151,976 | |
| | | | | | | | |
TOTAL COMMON STOCKS
(Cost $3,318,721) | | | | | | | 5,295,503 | |
| | | | | | | | |
SHORT-TERM INVESTMENTS (0.7%) | | | | | | | | |
Federated Government Obligations Fund, Institutional Class, 0.92% (1) | | | 39,893 | | | | 39,893 | |
| | | | | | | | |
TOTAL SHORT-TERM INVESTMENTS
(Cost $39,893) | | | | | | | 39,893 | |
| | | | | | | | |
INVESTMENTS (99.2%)
(Cost $3,358,614) | | | | | | | 5,335,396 | |
| |
| OTHER ASSETS IN EXCESS OF LIABILITIES (0.8%) | | | | 40,862 | |
| | | | | | | | |
| NET ASSETS (100.0%) | | | | | | $ | 5,376,258 | |
| | | | | | | | |
| * | Non-income producing security. |
| (1) | Rate disclosed is the seven day effective yield as of October 31, 2017. |
REIT — Real Estate Investment Trust
See accompanying notes to financial statements.
22
| | |
| | ANNUAL REPORT 2017 |
SCHEDULE OF INVESTMENTS – October 31, 2017
| | | | | | | | |
| | | Shares | | | Fair Value | |
COMMON STOCKS (96.5%) | | | | | | | | |
BERMUDA (1.0%) | | | | | | | | |
REINSURANCE (1.0%) | | | | | | | | |
Maiden Holdings Ltd. | | | 20,000 | | | $ | 165,000 | |
| | | | | | | | |
CHILE (2.5%) | | | | | | | | |
BREWERS (2.5%) | | | | | | | | |
Cia Cervecerias Unidas SA ADR | | | 14,401 | | | | 410,140 | |
| | | | | | | | |
DENMARK (1.8%) | | | | | | | | |
DIVERSIFIED BANKS (1.8%) | | | | | | | | |
Danske Bank A/S ADR | | | 15,000 | | | | 286,950 | |
| | | | | | | | |
FRANCE (3.2%) | | | | | | | | |
DIVERSIFIED CHEMICALS (3.2%) | | | | | | | | |
Arkema SA ADR | | | 4,130 | | | | 522,858 | |
| | | | | | | | |
GERMANY (3.1%) | | | | | | | | |
INDUSTRIAL CONGLOMERATES (3.1%) | | | | | | | | |
Siemens AG ADR | | | 7,000 | | | | 504,140 | |
| | | | | | | | |
INDIA (2.3%) | | | | | | | | |
DIVERSIFIED BANKS (2.3%) | | | | | | | | |
HDFC Bank Ltd. ADR | | | 4,000 | | | | 369,200 | |
| | | | | | | | |
ISRAEL (4.2%) | | | | | | | | |
APPLICATION SOFTWARE (2.8%) | | | | | | | | |
NICE-Systems Ltd. ADR | | | 5,500 | | | | 458,205 | |
| | | | | | | | |
PHARMACEUTICALS (1.4%) | | | | | | | | |
Teva Pharmaceutical Industries Ltd. ADR | | | 16,000 | | | | 220,800 | |
| | | | | | | | |
| | | | | | | 679,005 | |
| | | | | | | | |
JAPAN (7.2%) | | | | | | | | |
CONSUMER ELECTRONICS (1.3%) | | | | | | | | |
Sony Corp. ADR | | | 5,000 | | | | 217,050 | |
| | | | | | | | |
ELECTRICAL COMPONENTS & EQUIPMENT (3.1%) | | | | | | | | |
Nidec Corp. ADR | | | 15,000 | | | | 499,050 | |
| | | | | | | | |
TIRES & RUBBER (2.8%) | | | | | | | | |
Bridgestone Corp. | | | 19,000 | | | | 452,200 | |
| | | | | | | | |
| | | | | | | 1,168,300 | |
| | | | | | | | |
MEXICO (2.0%) | | | | | | | | |
BROADCASTING & CABLE TV (2.0%) | | | | | | | | |
Grupo Televisa SA ADR | | | 15,000 | | | | 328,350 | |
| | | | | | | | |
NETHERLANDS (0.6%) | | | | | | | | |
DIVERSIFIED BANKS (0.6%) | | | | | | | | |
ING Groep N.V. ADR | | | 5,000 | | | | 92,600 | |
| | | | | | | | |
NORWAY (2.3%) | | | | | | | | |
MULTI-LINE INSURANCE (2.3%) | | | | | | | | |
Gjensidige Forsikring ASA ADR | | | 20,000 | | | | 378,860 | |
| | | | | | | | |
PANAMA (1.1%) | | | | | | | | |
AIRLINES (1.1%) | | | | | | | | |
Copa Holdings SA, Class A | | | 1,500 | | | | 184,785 | |
| | | | | | | | |
| | | | | | | | |
| | | Shares | | | Fair Value | |
COMMON STOCKS (96.5%) – Continued | | | | | | | | |
SOUTH AFRICA (2.1%) | | | | | | | | |
FOOD RETAIL (2.1%) | | | | | | | | |
Shoprite Holdings Ltd. ADR | | | 24,000 | | | $ | 348,000 | |
| | | | | | | | |
SPAIN (0.8%) | | | | | | | | |
DIVERSIFIED BANKS (0.8%) | | | | | | | | |
Banco Santander S.A. ADR | | | 20,000 | | | | 134,800 | |
| | | | | | | | |
SWITZERLAND (5.1%) | | | | | | | | |
PACKAGED FOODS & MEATS (3.0%) | | | | | | | | |
Nestle SA ADR | | | 5,750 | | | | 484,322 | |
| | | | | | | | |
PHARMACEUTICALS (2.1%) | | | | | | | | |
Roche Holding AG ADR | | | 12,000 | | | | 346,980 | |
| | | | | | | | |
| | | | | | | 831,302 | |
| | | | | | | | |
UNITED KINGDOM (15.0%) | | | | | | | | |
DISTILLERS & VINTNERS (2.4%) | | | | | | | | |
Diageo PLC ADR | | | 2,800 | | | | 383,628 | |
| | | | | | | | |
INTEGRATED OIL & GAS (3.2%) | | | | | | | | |
BP PLC ADR | | | 12,815 | | | | 521,186 | |
| | | | | | | | |
LIFE & HEALTH INSURANCE (1.9%) | | | | | | | | |
Old Mutual PLC ADR | | | 15,125 | | | | 306,903 | |
| | | | | | | | |
PACKAGED FOODS & MEATS (3.2%) | | | | | | | | |
Unilever NV | | | 9,000 | | | | 521,640 | |
| | | | | | | | |
PHARMACEUTICALS (3.2%) | | | | | | | | |
AstraZeneca PLC ADR | | | 8,000 | | | | 276,000 | |
GlaxoSmithKline PLC ADR | | | 6,500 | | | | 236,795 | |
| | | | | | | | |
| | | | | | | 512,795 | |
| | | | | | | | |
PUBLISHING (1.1%) | | | | | | | | |
Pearson PLC ADR | | | 20,000 | | | | 185,600 | |
| | | | | | | | |
| | | | | | | 2,431,752 | |
| | | | | | | | |
UNITED STATES (42.2%) | | | | | | | | |
AUTOMOTIVE RETAIL (1.9%) | | | | | | | | |
Group 1 Automotive, Inc. | | | 4,000 | | | | 314,280 | |
| | | | | | | | |
BIOTECHNOLOGY (2.0%) | | | | | | | | |
United Therapeutics Corp. * | | | 2,750 | | | | 326,123 | |
| | | | | | | | |
COMMUNICATIONS EQUIPMENT (2.1%) | | | | | | | | |
KVH Industries, Inc. * | | | 30,000 | | | | 346,500 | |
| | | | | | | | |
CONSTRUCTION & ENGINEERING (0.3%) | | | | | | | | |
AECOM * | | | 1,500 | | | | 52,590 | |
| | | | | | | | |
CONSTRUCTION MACHINERY & HEAVY TRUCKS (3.1%) | |
Miller Industries, Inc. | | | 18,000 | | | | 508,500 | |
| | | | | | | | |
DIVERSIFIED BANKS (2.8%) | | | | | | | | |
Wells Fargo & Co. (1) | | | 8,161 | | | | 458,159 | |
| | | | | | | | |
GAS UTILITIES (1.2%) | | | | | | | | |
Northwest Natural Gas Co. | | | 3,000 | | | | 199,050 | |
| | | | | | | | |
See accompanying notes to financial statements.
23
| | |
| | ANNUAL REPORT 2017 |
SCHEDULE OF INVESTMENTS – October 31, 2017
| | | | | | | | | | | | |
| | | | | | Shares | | | Fair Value | |
COMMON STOCKS (96.5%) – Continued | | | | | | | | | |
UNITED STATES (42.2%) – Continued | | | | | | | | | | | | |
HARDWARE, STORAGE & PERIPHERALS (2.5%) | | | | | | | | | |
NetApp, Inc. | | | | | | | 9,000 | | | $ | 399,780 | |
| | | | | | | | | | | | |
HEALTH CARE FACILITIES (1.5%) | | | | | | | | | | | | |
LifePoint Health, Inc. * | | | | | | | 5,000 | | | | 240,750 | |
| | | | | | | | | | | | |
HEALTH CARE SUPPLIES (1.9%) | | | | | | | | | | | | |
Dentsply Sirona, Inc. | | | | | | | 5,000 | | | | 305,350 | |
| | | | | | | | | | | | |
HOUSEHOLD PRODUCTS (1.9%) | | | | | | | | | | | | |
Procter & Gamble Co./The (1) | | | | | | | 3,500 | | | | 302,190 | |
| | | | | | | | | | | | |
INDUSTRIAL MACHINERY (1.6%) | | | | | | | | | | | | |
Briggs & Stratton Corp. | | | | | | | 10,000 | | | | 252,000 | |
| | | | | | | | | | | | |
INTEGRATED OIL & GAS (1.8%) | | | | | | | | | | | | |
Chevron Corp. | | | | | | | 2,500 | | | | 289,725 | |
| | | | | | | | | | | | |
LIFE SCIENCES TOOLS & SERVICES (2.4%) | | | | | | | | | | | | |
Thermo Fisher Scientific, Inc. | | | | | | | 2,000 | | | | 387,660 | |
| | | | | | | | | | | | |
MULTI-LINE UTILITIES & UNREGULATED POWER (2.4%) | | | | | |
Public Service Enterprise Group, Inc. (1) | | | | 8,000 | | | | 393,600 | |
| | | | | | | | | | | | |
OIL & GAS EQUIPMENT & SERVICES (1.6%) | | | | | | | | | | | | |
Halliburton Co. | | | | | | | 6,000 | | | | 256,440 | |
| | | | | | | | | | | | |
PACKAGED FOODS & MEATS (2.5%) | | | | | | | | | | | | |
Cal-Maine Foods, Inc. | | | | | | | 3,000 | | | | 135,000 | |
Pilgrim’s Pride Corp. * | | | | | | | 8,600 | | | | 273,308 | |
| | | | | | | | | | | | |
| | | | | | | | | | | 408,308 | |
| | | | | | | | | | | | |
RAILROADS (3.8%) | | | | | | | | | | | | |
Genesee & Wyoming, Inc., Class A * | | | | | | | 2,250 | | | | 161,505 | |
Norfolk Southern Corp. | | | | | | | 3,500 | | | | 459,970 | |
| | | | | | | | | | | | |
| | | | | | | | | | | 621,475 | |
| | | | | | | | | | | | |
REGIONAL BANKS (1.0%) | | | | | | | | | | | | |
Umpqua Holdings Corp. | | | | | | | 8,000 | | | | 163,680 | |
| | | | | | | | | | | | |
REINSURANCE (1.1%) | | | | | | | | | | | | |
Blue Capital Reinsurance Holdings Ltd. | | | | | | | 14,000 | | | | 185,500 | |
| | | | | | | | | | | | |
SEMICONDUCTORS (2.8%) | | | | | | | | | | | | |
Skyworks Solutions, Inc. | | | | | | | 4,000 | | | | 455,440 | |
| | | | | | | | | | | | |
| | | | | | | | | | | 6,867,100 | |
| | | | | | | | | | | | |
TOTAL COMMON STOCKS
(Cost $11,186,126) | | | | | | | | 15,703,142 | |
| | | | | | | | | | | | |
| | | Contracts | | | Notional
Value | | | | |
CALL OPTIONS PURCHASED (2.2%) | |
UNITED STATES (2.2%) | | | | | | | | | |
Apple, Inc., Strike Price: $90, Expiration 1/19/18 * | | | 30 | | | $ | 507,120 | | | | 237,600 | |
Intel Corp., Strike Price: $28, Expiration 1/18/19 * | | | 35 | | | | 159,215 | | | | 53,375 | |
| | | | | | | | | | | | |
| | | Contracts | | | Notional
Value | | | Fair Value | |
CALL OPTIONS PURCHASED (2.2%) – Continued | |
UNITED STATES (2.2%) – Continued | |
Microsoft Corp.,
Strike Price: $67.50, Expiration 1/18/19 * | | | 15 | | | $ | 124,770 | | | $ | 26,400 | |
Walt Disney Co./The,
Strike Price: $90,
Expiration 1/18/19 * | | | 30 | | | | 293,430 | | | | 38,400 | |
| | | | | | | | | | | | |
TOTAL CALL OPTIONS PURCHASED
(Cost $143,560) | | | | | | | 1,084,535 | | | | 355,775 | |
| | | | | | | | | | | | |
| | | |
| | | | | | Shares | | | | |
SHORT-TERM INVESTMENTS (1.7%) | | | | | | | | | | | | |
Federated Government Obligations Fund, Institutional Class, 0.92% (2) | | | | | | | 277,606 | | | | 277,606 | |
| | | | | | | | | | | | |
TOTAL SHORT-TERM INVESTMENTS
(Cost $277,606) | | | | | | | | 277,606 | |
| | | | | | | | | | | | |
INVESTMENTS (100.4%)
(Cost $11,607,292) | | | | | | | | | | | 16,336,523 | |
| |
| LIABILITIES IN EXCESS OF OTHER ASSETS (-0.4%) | | | | (62,490 | ) |
| | | | | | | | | | | | |
| NET ASSETS (100.0%) | | | | | | | | | | $ | 16,274,033 | |
| | | | | | | | | | | | |
| * | Non-income producing security. |
| (1) | Subject to call options written. |
| (2) | Rate disclosed is the seven day effective yield as of October 31, 2017. |
ADR — American Depositary Receipt
PLC — Public Limited Company
SCHEDULE OF WRITTEN OPTIONS – October 31, 2017
| | | | | | | | | | | | |
| | | Contracts | | | Notional
Value | | | Fair Value | |
WRITTEN CALL OPTIONS (-0.3%) | | | | | | | | | |
UNITED STATES (-0.3%) | | | | | | | | | |
Procter & Gamble Co./The, Strike Price: $95, Expiration 1/19/18 | | | (20 | ) | | $ | (172,680 | ) | | $ | (240 | ) |
Procter & Gamble Co./The, Strike Price: $97.50, Expiration 4/20/18 | | | (15 | ) | | | (129,510 | ) | | | (375 | ) |
Public Service Enterprise Group, Inc., Strike Price: $45, Expiration 12/15/17 | | | (80 | ) | | | (393,600 | ) | | | (32,800 | ) |
Wells Fargo & Co., Strike Price: $52.50, Expiration 1/19/18 | | | (40 | ) | | | (224,560 | ) | | | (17,400 | ) |
| | | | | | | | | | | | |
TOTAL WRITTEN CALL OPTIONS (Premiums Received $24,158) | | | $ | (920,350 | ) | | $ | (50,815 | ) |
| | | | | | | | | | | | |
See accompanying notes to financial statements.
24
| | |
| | ANNUAL REPORT 2017 |
SCHEDULE OF INVESTMENTS – October 31, 2017
Commonwealth Real Estate Securities Fund
| | | | | | | | |
| | | Shares | | | Fair Value | |
COMMON STOCKS (91.8%) | | | | | | | | |
AIRPORT SERVICES (2.1%) | | | | | | | | |
Grupo Aeroportuario del Sureste SAB de CV ADR | | | 1,300 | | | $ | 232,427 | |
| | | | | | | | |
ALTERNATIVE CARRIERS (1.0%) | | | | | | | | |
Zayo Group Holdings, Inc. * | | | 3,000 | | | | 108,180 | |
| | | | | | | | |
BUILDING PRODUCTS (2.9%) | | | | | | | | |
Lennox International, Inc. | | | 1,700 | | | | 324,921 | |
| | | | | | | | |
CONSTRUCTION & ENGINEERING (1.9%) | | | | | | | | |
Kajima Corp. ADR | | | 2,000 | | | | 206,460 | |
| | | | | | | | |
CONSTRUCTION MATERIALS (8.5%) | | | | | | | | |
Boral Ltd. ADR | | | 1,650 | | | | 36,580 | |
Cemex SAB de CV ADR * | | | 28,775 | | | | 233,365 | |
James Hardie Industries PLC ADR | | | 25,000 | | | | 384,750 | |
Summit Materials, Inc., Class A * | | | 2,500 | | | | 78,500 | |
Vulcan Materials Co. | | | 1,800 | | | | 219,150 | |
| | | | | | | | |
| | | | | | | 952,345 | |
| | | | | | | | |
DIVERSIFIED REAL ESTATE ACTIVITIES (1.3%) | |
Lend Lease Group ADR | | | 11,900 | | | | 148,429 | |
| | | | | | | | |
DIVERSIFIED REITS (7.0%) | | | | | | | | |
STORE Capital Corp. | | | 7,600 | | | | 187,644 | |
Vornado Realty Trust | | | 1,207 | | | | 90,356 | |
Washington Real Estate Investment Trust | | | 6,000 | | | | 193,140 | |
WP Carey, Inc. | | | 4,470 | | | | 304,630 | |
| | | | | | | | |
| | | | | | | 775,770 | |
| | | | | | | | |
HOME FURNISHING (0.4%) | | | | | | | | |
Mohawk Industries, Inc. * | | | 150 | | | | 39,264 | |
| | | | | | | | |
HOME IMPROVEMENT RETAIL (3.9%) | | | | | | | | |
Home Depot, Inc./The (1) | | | 325 | | | | 53,878 | |
Kingfisher PLC ADR | | | 20,000 | | | | 168,500 | |
Lowe’s Cos., Inc. | | | 2,600 | | | | 207,870 | |
| | | | | | | | |
| | | | | | | 430,248 | |
| | | | | | | | |
HOMEBUILDING (3.3%) | | | | | | | | |
NVR, Inc. * | | | 50 | | | | 164,068 | |
Toll Brothers, Inc. | | | 4,500 | | | | 207,180 | |
| | | | | | | | |
| | | | | | | 371,248 | |
| | | | | | | | |
HOTEL & RESORT REITS (0.7%) | | | | | | | | |
Summit Hotel Properties, Inc. | | | 5,200 | | | | 82,212 | |
| | | | | | | | |
HOTELS, RESORTS & CRUISE LINES (3.9%) | |
InterContinental Hotels Group PLC ADR | | | 4,319 | | | | 240,093 | |
Ryman Hospitality Properties, Inc. | | | 3,024 | | | | 199,977 | |
| | | | | | | | |
| | | | | | | 440,070 | |
| | | | | | | | |
| | | | | | | | |
| | | Shares | | | Fair Value | |
COMMON STOCKS (91.8%) – Continued | | | | | | | | |
INDUSTRIAL REITS (3.0%) | | | | | | | | |
EastGroup Properties, Inc. | | | 3,000 | | | $ | 271,770 | |
Monmouth Real Estate Investment Corp. | | | 2,000 | | | | 34,080 | |
STAG Industrial, Inc. | | | 1,000 | | | | 27,300 | |
| | | | | | | | |
| | | | | | | 333,150 | |
| | | | | | | | |
INTEGRATED TELECOMMUNICATION SERVICES (2.8%) | |
SBA Communications Corp., Class A * | | | 2,000 | | | | 314,360 | |
| | | | | | | | |
MORTGAGE REITS (2.6%) | | | | | | | | |
Annaly Capital Management, Inc. | | | 13,500 | | | | 154,710 | |
Hannon Armstrong Sustainable Infrastructure Capital, Inc. | | | 3,100 | | | | 74,586 | |
Ladder Capital Corp. | | | 4,534 | | | | 60,937 | |
| | | | | | | | |
| | | | | | | 290,233 | |
| | | | | | | | |
OFFICE REITS (8.1%) | | | | | | | | |
Alexandria Real Estate Equities, Inc. | | | 1,850 | | | | 229,326 | |
Boston Properties, Inc. | | | 2,450 | | | | 296,891 | |
Douglas Emmett, Inc. | | | 3,000 | | | | 119,370 | |
SL Green Realty Corp. | | | 2,720 | | | | 260,250 | |
| | | | | | | | |
| | | | | | | 905,837 | |
| | | | | | | | |
REAL ESTATE DEVELOPMENT (0.7%) | |
China Overseas Land & Investment Ltd. ADR | | | 770 | | | | 74,910 | |
| | | | | | | | |
REAL ESTATE OPERATING COMPANIES (3.9%) | |
Gladstone Land Corp. | | | 9,700 | | | | 128,331 | |
IRSA Inversiones y Representaciones SA ADR | | | 5,046 | | | | 146,940 | |
IRSA Propiedades Comerciales SA ADR | | | 2,950 | | | | 165,200 | |
| | | | | | | | |
| | | | | | | 440,471 | |
| | | | | | | | |
REGIONAL BANKS (3.1%) | | | | | | | | |
PacWest BanCorp | | | 1,480 | | | | 71,514 | |
Regions Financial Corp. | | | 18,000 | | | | 278,640 | |
| | | | | | | | |
| | | | | | | 350,154 | |
| | | | | | | | |
RESIDENTIAL REITS (4.2%) | | | | | | | | |
AvalonBay Communities, Inc. | | | 1,300 | | | | 235,729 | |
Essex Property Trust, Inc. | | | 900 | | | | 236,187 | |
| | | | | | | | |
| | | | | | | 471,916 | |
| | | | | | | | |
RESTAURANTS (0.0%) | | | | | | | | |
Luby’s, Inc. * | | | 50 | | | | 121 | |
| | | | | | | | |
RETAIL REITS (3.4%) | | | | | | | | |
Acadia Realty Trust | | | 4,985 | | | | 140,328 | |
National Retail Properties, Inc. | | | 4,000 | | | | 160,720 | |
Simon Property Group, Inc. (1) | | | 500 | | | | 77,665 | |
| | | | | | | | |
| | | | | | | 378,713 | |
| | | | | | | | |
See accompanying notes to financial statements.
25
| | |
| | ANNUAL REPORT 2017 |
SCHEDULE OF INVESTMENTS – October 31, 2017
Commonwealth Real Estate Securities Fund
| | | | | | | | | | | | |
| | | | | | Shares | | | Fair Value | |
COMMON STOCKS (91.8%) – Continued | |
SPECIALIZED REITS (18.1%) | |
Crown Castle International Corp. | | | | | | | 2,000 | | | $ | 214,160 | |
CyrusOne, Inc. | | | | | | | 1,200 | | | | 73,668 | |
Digital Realty Trust, Inc. | | | | | | | 1,141 | | | | 135,140 | |
Equinix, Inc. | | | | | | | 32 | | | | 14,832 | |
Extra Space Storage, Inc. | | | | | | | 5,100 | | | | 416,109 | |
Global Self Storage, Inc. | | | | | | | 6,000 | | | | 28,020 | |
HCP, Inc. | | | | | | | 2,000 | | | | 51,680 | |
Host Hotels & Resorts, Inc. | | | | | | | 7,717 | | | | 150,945 | |
Jernigan Capital, Inc. | | | | | | | 5,500 | | | | 112,860 | |
Pebblebrook Hotel Trust | | | | | | | 5,000 | | | | 178,300 | |
QTS Realty Trust, Inc., Class A | | | | | | | 3,600 | | | | 208,260 | |
Ventas, Inc. | | | | | | | 2,750 | | | | 172,562 | |
Welltower, Inc. (1) | | | | | | | 1,250 | | | | 83,700 | |
Weyerhaeuser Co. | | | | | | | 5,000 | | | | 179,550 | |
| | | | | | | | | | | | |
| | | | | | | | | | | 2,019,786 | |
| | | | | | | | | | | | |
THRIFTS & MORTGAGE FINANCE (1.8%) | |
Harleysville Financial Corp. | | | | | | | 8,675 | | | | 195,187 | |
| | | | | | | | | | | | |
WIRELESS TELECOMMUNICATION SERVICES (3.2%) | |
American Tower Corp., Class A | | | | | | | 2,500 | | | | 359,175 | |
| | | | | | | | | | | | |
TOTAL COMMON STOCKS
(Cost $6,338,852) | | | | | | | | | | | 10,245,587 | |
| | | | | | | | | | | | |
EXCHANGE-TRADED FUNDS (2.3%) | | | | | | | | | |
Guggenheim China Real Estate ETF | | | | | | | 8,500 | | | | 254,320 | |
| | | | | | | | | | | | |
TOTAL EXCHANGE-TRADED FUNDS
(Cost $144,153) | | | | | | | | 254,320 | |
| | | | | | | | | | | | |
| | | Contracts | | | Notional
Value | | | | |
CALL OPTIONS PURCHASED (0.3%) | |
Granite Construction, Inc.,
Strike Price: $55,
Expiration, 3/16/18 * | | | 30 | | | $ | 191,070 | | | | 31,500 | |
| | | | | | | | | | | | |
TOTAL CALL OPTIONS PURCHASED
(Cost $23,791) | | | | 191,070 | | | | 31,500 | |
| | | | | | | | | | | | |
| | | | | | | | |
| | | Shares | | | Fair Value | |
SHORT-TERM INVESTMENTS (6.4%) | | | | | |
Federated Government Obligations Fund, Institutional Class, 0.92% (2) | | | 715,810 | | | $ | 715,810 | |
| | | | | | | | |
TOTAL SHORT-TERM INVESTMENTS
(Cost $715,810) | | | | 715,810 | |
| | | | | | | | |
INVESTMENTS (100.8%)
(Cost $7,222,606) | | | | 11,247,217 | |
| |
| LIABILITIES IN EXCESS OF OTHER ASSETS (-0.8%) | | | | (84,041 | ) |
| | | | | | | | |
| NET ASSETS (100.0%) | | | | | | $ | 11,163,176 | |
| | | | | | | | |
| * | Non-income producing security. |
| (1) | Subject to call options written. |
| (2) | Rate disclosed is the seven day effective yield as of October 31, 2017. |
ADR — American Depositary Receipt
ETF — Exchange-Traded Fund
REIT — Real Estate Investment Trust
The industries shown on the schedules of investments are based on the Global Industry Classification Standard, or GICS® (“GICS”). The GICS was developed by and/or is the exclusive property of MSCI, Inc. and Standard & Poor’s Financial Services LLC (“S&P”). GICS is a service mark of MSCI, Inc. and S&P and has been licensed for use by the Administrator.
SCHEDULE OF WRITTEN OPTIONS – October 31, 2017
| | | | | | | | | | | | |
| | | Contracts | | | Notional
Value | | | Fair Value | |
WRITTEN CALL OPTIONS (-0.0%) | | | | | |
Home Depot, Inc./The, Strike Price: $165, Expiration 1/19/18 | | | (3 | ) | | $ | (49,734 | ) | | $ | (1,590 | ) |
Simon Property Group, Inc., Strike Price: $180, Expiration 1/18/19 | | | (5 | ) | | | (77,665 | ) | | | (2,075 | ) |
Welltower, Inc., Strike Price: $72.50, Expiration 3/16/18 | | | (12 | ) | | | (80,352 | ) | | | (540 | ) |
| | | | | | | | | | | | |
TOTAL WRITTEN CALL OPTIONS
(Premiums Received $6,249) | | | $ | (207,751 | ) | | $ | (4,205 | ) |
| | | | | | | | | | | | |
See accompanying notes to financial statements.
26
| | |
| | ANNUAL REPORT 2017 |
STATEMENTS OF ASSETS AND LIABILITIES – October 31, 2017
| | | | | | | | | | | | | | | | | | | | |
| | | Commonwealth
Australia/New
Zealand Fund | | | Africa Fund | | | Commonwealth
Japan Fund | | | Commonwealth
Global Fund | | | Commonwealth
Real Estate
Securities Fund | |
ASSETS | | | | | | | | | | | | | | | | | | | | |
Investments in securities at value (cost $13,706,189, $2,733,099, $3,358,614, $11,607,292 and $7,222,606) | | $ | 20,448,356 | | | $ | 2,788,045 | | | $ | 5,335,396 | | | $ | 16,336,523 | | | $ | 11,247,217 | |
Cash | | | 200 | | | | 201 | | | | 200 | | | | 200 | | | | 200 | |
Foreign currencies, at value (Cost $323,622, $29,973, $156,514, $— and $—) | | | 311,585 | | | | 28,550 | | | | 155,838 | | | | — | | | | — | |
Receivable for fund shares sold | | | 5,942 | | | | 255 | | | | — | | | | 104 | | | | — | |
Receivable from Advisor | | | — | | | | 2,714 | | | | 2,109 | | | | — | | | | — | |
Dividends and interest receivable | | | 126,529 | | | | 687 | | | | 21,587 | | | | 9,272 | | | | 6,892 | |
Tax reclaims receivable | | | — | | | | — | | | | — | | | | 12,916 | | | | — | |
Prepaid expenses | | | 26,387 | | | | 5,533 | | | | 12,847 | | | | 23,259 | | | | 15,347 | |
| | | | | | | | | | | | | | | | | | | | |
Total Assets | | | 20,918,999 | | | | 2,825,985 | | | | 5,527,977 | | | | 16,382,274 | | | | 11,269,656 | |
| | | | | | | | | | | | | | | | | | | | |
LIABILITIES | | | | | | | | | | | | | | | | | | | | |
Options written, at value (premium received $—, $—, $—, $24,158 and $6,249) | | | — | | | | — | | | | — | | | | 50,815 | | | | 4,205 | |
Payable for fund shares redeemed | | | 221 | | | | — | | | | — | | | | 1,000 | | | | — | |
Payable for investments purchased | | | — | | | | 51,927 | | | | 135,149 | | | | — | | | | 62,700 | |
Payable to Advisor | | | 13,530 | | | | — | | | | — | | | | 10,327 | | | | 7,075 | |
Payable to Administrator | | | 10,205 | | | | 1,372 | | | | 2,530 | | | | 7,701 | | | | 5,276 | |
Payable to trustees | | | 7,724 | | | | 1,038 | | | | 1,915 | | | | 5,829 | | | | 3,994 | |
Distribution (12b-1) fees accrued | | | 7,578 | | | | 1,026 | | | | 3,336 | | | | 7,459 | | | | 6,476 | |
Other accrued expenses | | | 34,682 | | | | 4,520 | | | | 8,789 | | | | 25,110 | | | | 16,754 | |
| | | | | | | | | | | | | | | | | | | | |
Total Liabilities | | | 73,940 | | | | 59,883 | | | | 151,719 | | | | 108,241 | | | | 106,480 | |
| | | | | | | | | | | | | | | | | | | | |
NET ASSETS | | $ | 20,845,059 | | | $ | 2,766,102 | | | $ | 5,376,258 | | | $ | 16,274,033 | | | $ | 11,163,176 | |
| | | | | | | | | | | | | | | | | | | | |
NET ASSETS CONSIST OF: | | | | | | | | | | | | | | | | | | | | |
Paid-in capital | | $ | 14,162,356 | | | $ | 2,978,955 | | | $ | 3,416,387 | | | $ | 11,751,973 | | | $ | 7,111,405 | |
Accumulated net investment income (loss) | | | 126,835 | | | | 12,441 | | | | (16,007 | ) | | | (68,763 | ) | | | — | |
Accumulated net realized gain (loss) from investments, option contracts and foreign currency transactions | | | (174,246 | ) | | | (278,755 | ) | | | — | | | | (111,751 | ) | | | 25,116 | |
Net unrealized appreciation (depreciation) on: | | | | | | | | | | | | | | | | | | | | |
Investment securities and foreign currency translations | | | 6,730,114 | | | | 53,461 | | | | 1,975,878 | | | | 4,729,231 | | | | 4,024,611 | |
Written option contracts | | | — | | | | — | | | | — | | | | (26,657 | ) | | | 2,044 | |
| | | | | | | | | | | | | | | | | | | | |
NET ASSETS | | $ | 20,845,059 | | | $ | 2,766,102 | | | $ | 5,376,258 | | | $ | 16,274,033 | | | $ | 11,163,176 | |
| | | | | | | | | | | | | | | | | | | | |
Shares outstanding (unlimited number of shares authorized, no par value) | | | 1,587,906 | | | | 307,207 | | | | 1,408,321 | | | | 1,061,832 | | | | 669,363 | |
| | | | | | | | | | | | | | | | | | | | |
Net asset value, offering and redemption price per share (a) | | $ | 13.13 | | | $ | 9.00 | | | $ | 3.82 | | | $ | 15.33 | | | $ | 16.68 | |
| | | | | | | | | | | | | | | | | | | | |
| (a) | Subject to certain exceptions, a 2% redemption fee is imposed upon shares redeemed within 14 calendar days of their purchase. See Note 3 in the Notes to Financial Statements. Par value $0.01, unlimited shares authorized. |
See accompanying notes to financial statements.
27
| | |
| | ANNUAL REPORT 2017 |
STATEMENTS OF OPERATIONS – For the year ended October 31, 2017
| | | | | | | | | | | | | | | | | | | | |
| | | Commonwealth
Australia/New
Zealand Fund | | | Africa Fund | | | Commonwealth
Japan Fund | | | Commonwealth
Global Fund | | | Commonwealth
Real Estate
Securities Fund | |
INVESTMENT INCOME | | | | | | | | | | | | | | | | | | | | |
Dividend income (net of foreign taxes withheld of $141,463, $11,116, $11,632, $65,465 and $5,841) | | $ | 703,746 | | | $ | 53,491 | | | $ | 64,695 | | | $ | 309,878 | | | $ | 270,994 | |
Interest income | | | 32,040 | | | | 1,108 | | | | — | | | | — | | | | — | |
| | | | | | | | | | | | | | | | | | | | |
Total investment income | | | 735,786 | | | | 54,599 | | | | 64,695 | | | | 309,878 | | | | 270,994 | |
| | | | | | | | | | | | | | | | | | | | |
EXPENSES | | | | | | | | | | | | | | | | | | | | |
Investment Advisor | | | 155,793 | | | | 19,225 | | | | 38,143 | | | | 116,148 | | | | 77,669 | |
Distribution (12b-1) | | | 51,931 | | | | 6,408 | | | | 12,714 | | | | 38,716 | | | | 25,889 | |
Administration | | | 124,914 | | | | 15,369 | | | | 30,324 | | | | 92,712 | | | | 61,681 | |
Legal | | | 39,317 | | | | 4,802 | | | | 9,710 | | | | 29,574 | | | | 19,581 | |
Registration | | | 19,716 | | | | 19,004 | | | | 19,656 | | | | 18,908 | | | | 20,380 | |
Custodian | | | 17,909 | | | | 3,195 | | | | 5,454 | | | | 4,753 | | | | 4,199 | |
Audit | | | 28,696 | | | | 3,570 | | | | 6,028 | | | | 18,830 | | | | 12,876 | |
Trustee | | | 31,532 | | | | 3,965 | | | | 7,652 | | | | 23,358 | | | | 15,493 | |
Insurance | | | 17,422 | | | | 2,059 | | | | 4,262 | | | | 13,028 | | | | 8,586 | |
Printing | | | 15,295 | | | | 1,933 | | | | 3,739 | | | | 10,770 | | | | 7,193 | |
Chief Compliance Officer | | | 31,937 | | | | 3,918 | | | | 7,759 | | | | 23,717 | | | | 15,794 | |
Miscellaneous | | | 2,716 | | | | 994 | | | | 1,056 | | | | 2,267 | | | | 1,635 | |
Interest expenses | | | 139 | | | | — | | | | 63 | | | | — | | | | — | |
| | | | | | | | | | | | | | | | | | | | |
Total expenses | | | 537,317 | | | | 84,442 | | | | 146,560 | | | | 392,781 | | | | 270,976 | |
Fees waived and expenses reimbursed by Advisor | | | — | | | | (39,552 | ) | | | (57,433 | ) | | | — | | | | — | |
| | | | | | | | | | | | | | | | | | | | |
Net operating expenses | | | 537,317 | | | | 44,890 | | | | 89,127 | | | | 392,781 | | | | 270,976 | |
| | | | | | | | | | | | | | | | | | | | |
Net investment income (loss) | | | 198,469 | | | | 9,709 | | | | (24,432 | ) | | | (82,903 | ) | | | 18 | |
| | | | | | | | | | | | | | | | | | | | |
NET REALIZED AND CHANGE IN UNREALIZED GAIN (LOSS) | | | | | | | | | | | | | | | | | |
Net realized gain (loss) on: | | | | | | | | | | | | | | | | | | | | |
Investment securities transactions | | | 93,416 | | | | (203,124 | ) | | | 457,099 | | | | (22,417 | ) | | | 65,523 | |
Foreign currency translations | | | (71,633 | ) | | | 2,721 | | | | (8,804 | ) | | | (370 | ) | | | 122 | |
Purchased option contracts | | | — | | | | — | | | | — | | | | (13,032 | ) | | | — | |
Written option contracts | | | — | | | | — | | | | — | | | | 19,232 | | | | 25,449 | |
| | | | | | | | | | | | | | | | | | | | |
Total net realized gain (loss) | | | 21,783 | | | | (200,403 | ) | | | 448,295 | | | | (16,587 | ) | | | 91,094 | |
| | | | | | | | | | | | | | | | | | | | |
Net change in unrealized appreciation (depreciation) on: | | | | | | | | | | | | | | | | | | | | |
Investments | | | 1,432,200 | | | | 426,463 | | | | 207,827 | | | | 2,033,261 | | | | 1,390,000 | |
Foreign currency | | | (11,135 | ) | | | (4,066 | ) | | | 2,099 | | | | 1 | | | | — | |
Purchased option contracts | | | — | | | | — | | | | — | | | | 208,284 | | | | 18,837 | |
Written option contracts | | | — | | | | — | | | | — | | | | (51,267 | ) | | | 3,011 | |
| | | | | | | | | | | | | | | | | | | | |
Total net change in unrealized appreciation (depreciation) | | | 1,421,065 | | | | 422,397 | | | | 209,926 | | | | 2,190,279 | | | | 1,411,848 | |
| | | | | | | | | | | | | | | | | | | | |
Net realized and change in unrealized gain (loss) on investments | | | 1,442,848 | | | | 221,994 | | | | 658,221 | | | | 2,173,692 | | | | 1,502,942 | |
| | | | | | | | | | | | | | | | | | | | |
Net increase in net assets resulting from operations | | $ | 1,641,317 | | | $ | 231,703 | | | $ | 633,789 | | | $ | 2,090,789 | | | $ | 1,502,960 | |
| | | | | | | | | | | | | | | | | | | | |
See accompanying notes to financial statements.
28
| | |
| | ANNUAL REPORT 2017 |
STATEMENTS OF CHANGES IN NET ASSETS
| | | | | | | | | | | | | | | | |
| | | Commonwealth
Australia/New Zealand Fund | | | Africa Fund | |
| | | For the Year
Ended
October 31, 2017 | | | For the Year
Ended
October 31, 2016 | | | For the Year
Ended
October 31, 2017 | | | For the Year
Ended
October 31, 2016 | |
| INCREASE (DECREASE) IN NET ASSETS DUE TO: | | | | | | | | | | | | | | | | |
| | | | |
| OPERATIONS | | | | | | | | | | | | | | | | |
Net investment income (loss) | | $ | 198,469 | | | $ | 340,062 | | | $ | 9,709 | | | $ | 13,872 | |
Net realized gain (loss) | | | 21,783 | | | | 278,439 | | | | (200,403 | ) | | | (56,842 | ) |
Net change in unrealized appreciation (depreciation) | | | 1,421,065 | | | | 2,941,221 | | | | 422,397 | | | | 26,481 | |
| | | | | | | | | | | | | | | | |
Change in net assets resulting from operations | | | 1,641,317 | | | | 3,559,722 | | | | 231,703 | | | | (16,489 | ) |
| | | | | | | | | | | | | | | | |
DISTRIBUTIONS TO SHAREHOLDERS: | | | | | | | | | | | | | | | | |
Net investment income | | | (474,706 | ) | | | (504,861 | ) | | | (15,019 | ) | | | (13,033 | ) |
Net realized gains | | | — | | | | — | | | | — | | | | — | |
| | | | | | | | | | | | | | | | |
Change in net assets from distributions | | | (474,706 | ) | | | (504,861 | ) | | | (15,019 | ) | | | (13,033 | ) |
| | | | | | | | | | | | | | | | |
CAPITAL TRANSACTIONS: | | | | | | | | | | | | | | | | |
Proceeds from shares sold | | | 2,621,587 | | | | 2,466,289 | | | | 353,549 | | | | 335,997 | |
Reinvestment of distributions | | | 468,373 | | | | 494,045 | | | | 14,987 | | | | 13,001 | |
Amount paid for shares redeemed | | | (2,684,658 | ) | | | (4,140,438 | ) | | | (217,899 | ) | | | (135,942 | ) |
Redemption fees | | | 27 | | | | 328 | | | | 203 | | | | — | |
| | | | | | | | | | | | | | | | |
Change in net assets resulting from capital transactions | | | 405,329 | | | | (1,179,776 | ) | | | 150,840 | | | | 213,056 | |
| | | | | | | | | | | | | | | | |
Net increase (decrease) in net assets | | | 1,571,940 | | | | 1,875,085 | | | | 367,524 | | | | 183,534 | |
NET ASSETS: | | | | | | | | | | | | | | | | |
Beginning of year | | | 19,273,119 | | | | 17,398,034 | | | | 2,398,578 | | | | 2,215,044 | |
| | | | | | | | | | | | | | | | |
End of year | | $ | 20,845,059 | | | $ | 19,273,119 | | | $ | 2,766,102 | | | $ | 2,398,578 | |
| | | | | | | | | | | | | | | | |
Accumulated net investment income (loss) | | $ | 126,835 | | | $ | 474,705 | | | $ | 12,441 | | | $ | 15,019 | |
| | | | | | | | | | | | | | | | |
SHARE TRANSACTIONS: | | | | | | | | | | | | | | | | |
Shares sold | | | 208,452 | | | | 212,625 | | | | 40,412 | | | | 44,171 | |
Shares issued in reinvestment of distributions | | | 39,031 | | | | 48,152 | | | | 1,921 | | | | 1,868 | |
Shares redeemed | | | (208,988 | ) | | | (374,650 | ) | | | (25,797 | ) | | | (17,468 | ) |
| | | | | | | | | | | | | | | | |
Change in shares outstanding | | | 38,495 | | | | (113,873 | ) | | | 16,536 | | | | 28,571 | |
| | | | | | | | | | | | | | | | |
See accompanying notes to financial statements.
29
| | |
| | ANNUAL REPORT 2017 |
STATEMENTS OF CHANGES IN NET ASSETS
| | | | | | | | | | | | | | | | | | | | | | |
Commonwealth
Japan Fund | | | Commonwealth
Global Fund | | | Commonwealth
Real Estate Securities Fund | |
For the Year
Ended
October 31, 2017 | | | For the Year
Ended
October 31, 2016 | | | For the Year
Ended
October 31, 2017 | | | For the Year
Ended
October 31, 2016 | | | For the Year
Ended
October 31, 2017 | | | For the Year
Ended
October 31, 2016 | |
| | | | | | | | | | | | | | | | | | | | | | |
| | | | | | | | | | | | | | | | | | | | | | |
| $ | (24,432 | ) | | $ | (27,205 | ) | | $ | (82,903 | ) | | $ | (69,223 | ) | | $ | 18 | | | $ | (1,069 | ) |
| | 448,295 | | | | 165,457 | | | | (16,587 | ) | | | 958,352 | | | | 91,094 | | | | (47,320 | ) |
| | 209,926 | | | | (20,820 | ) | | | 2,190,279 | | | | (868,079 | ) | | | 1,411,848 | | | | 52,592 | |
| | | | | | | | | | | | | | | | | | | | | | |
| | 633,789 | | | | 117,432 | | | | 2,090,789 | | | | 21,050 | | | | 1,502,960 | | | | 4,203 | |
| | | | | | | | | | | | | | | | | | | | | | |
| | | | | | | | | | | | | | | | | | | | | | |
| | — | | | | — | | | | — | | | | — | | | | — | | | | — | |
| | — | | | | — | | | | (627,731 | ) | | | — | | | | — | | | | (140,758 | ) |
| | | | | | | | | | | | | | | | | | | | | | |
| | — | | | | — | | | | (627,731 | ) | | | — | | | | — | | | | (140,758 | ) |
| | | | | | | | | | | | | | | | | | | | | | |
| | | | | | | | | | | | | | | | | | | | | | |
| | 425,990 | | | | 1,030,910 | | | | 489,840 | | | | 695,469 | | | | 476,975 | | | | 242,347 | |
| | — | | | | — | | | | 625,566 | | | | — | | | | — | | | | 139,503 | |
| | (571,433 | ) | | | (1,596,370 | ) | | | (949,612 | ) | | | (1,281,386 | ) | | | (381,683 | ) | | | (399,645 | ) |
| | — | | | | — | | | | — | | | | 65 | | | | — | | | | — | |
| | | | | | | | | | | | | | | | | | | | | | |
| | (145,443 | ) | | | (565,460 | ) | | | 165,794 | | | | (585,852 | ) | | | 95,292 | | | | (17,795 | ) |
| | | | | | | | | | | | | | | | | | | | | | |
| | 488,346 | | | | (448,028 | ) | | | 1,628,852 | | | | (564,802 | ) | | | 1,598,252 | | | | (154,350 | ) |
| | | | | | | | | | | | | | | | | | | | | | |
| | 4,887,912 | | | | 5,335,940 | | | | 14,645,181 | | | | 15,209,983 | | | | 9,564,924 | | | | 9,719,274 | |
| | | | | | | | | | | | | | | | | | | | | | |
| $ | 5,376,258 | | | $ | 4,887,912 | | | $ | 16,274,033 | | | $ | 14,645,181 | | | $ | 11,163,176 | | | $ | 9,564,924 | |
| | | | | | | | | | | | | | | | | | | | | | |
| $ | (16,007 | ) | | $ | (19,326 | ) | | $ | (68,763 | ) | | $ | (50,422 | ) | | $ | — | | | $ | (17,032 | ) |
| | | | | | | | | | | | | | | | | | | | | | |
| | | | | | | | | | | | | | | | | | | | | | |
| | 126,902 | | | | 313,141 | | | | 33,816 | | | | 51,174 | | | | 30,098 | | | | 17,093 | |
| | — | | | | — | | | | 45,829 | | | | — | | | | — | | | | 10,080 | |
| | (165,568 | ) | | | (481,700 | ) | | | (66,070 | ) | | | (93,520 | ) | | | (24,709 | ) | | | (28,219 | ) |
| | | | | | | | | | | | | | | | | | | | | | |
| | (38,666 | ) | | | (168,559 | ) | | | 13,575 | | | | (42,346 | ) | | | 5,389 | | | | (1,046 | ) |
| | | | | | | | | | | | | | | | | | | | | | |
See accompanying notes to financial statements.
30
| | |
| | ANNUAL REPORT 2017 |
FINANCIAL HIGHLIGHTS
Commonwealth Australia/New Zealand Fund
Selected data for a share outstanding throughout each of the years indicated:
| | | | | | | | | | | | | | | | | | | | |
| | | For the year
ended
10/31/2017 | | | For the year
ended
10/31/2016 | | | For the year
ended
10/31/2015 | | | For the year
ended
10/31/2014 | | | For the year
ended
10/31/2013 | |
| Net Asset Value, Beginning of Year | | $ | 12.44 | | | $ | 10.46 | | | $ | 12.54 | | | $ | 13.25 | | | $ | 12.05 | |
| | | | | | | | | | | | | | | | | | | | |
| | | | | |
| Change in net assets from operations: | | | | | | | | | | | | | | | | | | | | |
Net investment income | | | 0.13 | | | | 0.21 | | | | 0.18 | | | | 0.15 | | | | 0.21 | |
Net realized and unrealized gain (loss) from investments | | | 0.87 | | | | 2.08 | | | | (1.38 | ) | | | (0.40 | ) | | | 1.15 | |
| | | | | | | | | | | | | | | | | | | | |
Total from investment activities | | | 1.00 | | | | 2.29 | | | | (1.20 | ) | | | (0.25 | ) | | | 1.36 | |
| | | | | | | | | | | | | | | | | | | | |
| | | | | |
| Distributions: | | | | | | | | | | | | | | | | | | | | |
Net investment income | | | (0.31 | ) | | | (0.31 | ) | | | (0.11 | ) | | | (0.22 | ) | | | (0.16 | ) |
Net realized gains | | | — | | | | — | | | | (0.77 | ) | | | (0.24 | ) | | | — | |
| | | | | | | | | | | | | | | | | | | | |
Total distributions | | | (0.31 | ) | | | (0.31 | ) | | | (0.88 | ) | | | (0.46 | ) | | | (0.16 | ) |
| | | | | | | | | | | | | | | | | | | | |
Redemption fees | | | — | (a) | | | — | (a) | | | — | | | | — | (a) | | | — | (a) |
| | | | | | | | | | | | | | | | | | | | |
| Net Asset Value, End of Year | | $ | 13.13 | | | $ | 12.44 | | | $ | 10.46 | | | $ | 12.54 | | | $ | 13.25 | |
| | | | | | | | | | | | | | | | | | | | |
| | | | | |
| Total Return | | | 8.25 | % | | | 22.51 | % | | | (10.15 | )% | | | (1.74 | )% | | | 11.40 | % |
| | | | | | | | | | | | | | | | | | | | |
Net assets at end of year (000’s) | | $ | 20,845 | | | $ | 19,273 | | | $ | 17,398 | | | $ | 20,501 | | | $ | 23,766 | |
| | | | | |
| Ratios/Supplemental Data: | | | | | | | | | | | | | | | | | | | | |
Ratio of net expenses to average net assets | | | 2.59 | % | | | 2.84 | % | | | 3.29 | % | | | 3.08 | % | | | 3.17 | % |
Ratio of gross expenses before waivers and/or reimbursements | | | 2.59 | % | | | 2.84 | % | | | 3.31 | % | | | 3.08 | % | | | 3.17 | % |
Ratio of net investment income to average net assets | | | 0.95 | % | | | 1.92 | % | | | 1.55 | % | | | 1.11 | % | | | 1.59 | % |
Portfolio turnover rate | | | 31 | % | | | 26 | % | | | 9 | % | | | 16 | % | | | 18 | % |
| (a) | Value is less than $0.005 per share. |
31
See accompanying notes to financial statements.
| | |
| | ANNUAL REPORT 2017 |
FINANCIAL HIGHLIGHTS
Selected data for a share outstanding throughout each of the years indicated:
| | | | | | | | | | | | | | | | | | | | |
| | | For the year
ended
10/31/2017 | | | For the year
ended
10/31/2016 | | | For the year
ended
10/31/2015 | | | For the year
ended
10/31/2014 | | | For the year
ended
10/31/2013 | |
| Net Asset Value, Beginning of Year | | $ | 8.25 | | | $ | 8.45 | | | $ | 9.96 | | | $ | 10.38 | | | $ | 10.23 | |
| | | | | | | | | | | | | | | | | | | | |
| | | | | |
| Change in net assets from operations: | | | | | | | | | | | | | | | | | | | | |
Net investment income | | | 0.03 | | | | 0.05 | | | | 0.07 | | | | 0.01 | | | | 0.22 | |
Net realized and unrealized gain (loss) from investments | | | 0.77 | | | | (0.20 | ) | | | (1.58 | ) | | | (0.25 | ) | | | 0.09 | |
| | | | | | | | | | | | | | | | | | | | |
Total from investment activities | | | 0.80 | | | | (0.15 | ) | | | (1.51 | ) | | | (0.24 | ) | | | 0.31 | |
| | | | | | | | | | | | | | | | | | | | |
| | | | | |
| Distributions: | | | | | | | | | | | | | | | | | | | | |
Net investment income | | | (0.05 | ) | | | (0.05 | ) | | | — | | | | (0.14 | ) | | | (0.16 | ) |
Return of capital | | | — | | | | — | | | | — | | | | (0.04 | ) | | | — | |
| | | | | | | | | | | | | | | | | | | | |
Total distributions | | | (0.05 | ) | | | (0.05 | ) | | | — | | | | (0.18 | ) | | | (0.16 | ) |
| | | | | | | | | | | | | | | | | | | | |
Redemption fees | | | — | (a) | | | — | | | | — | | | | — | (a) | | | — | (a) |
| | | | | | | | | | | | | | | | | | | | |
| Net Asset Value, End of Year | | $ | 9.00 | | | $ | 8.25 | | | $ | 8.45 | | | $ | 9.96 | | | $ | 10.38 | |
| | | | | | | | | | | | | | | | | | | | |
| | | | | |
| Total Return | | | 9.82 | % | | | (1.67 | )% | | | (15.16 | )% | | | (2.32 | )% | | | 3.02 | % |
| | | | | | | | | | | | | | | | | | | | |
Net assets at end of year (000’s) | | $ | 2,766 | | | $ | 2,399 | | | $ | 2,215 | | | $ | 2,478 | | | $ | 2,099 | |
| | | | | |
| Ratios/Supplemental Data: | | | | | | | | | | | | | | | | | | | | |
Ratio of net expenses to average net assets | | | 1.75 | % | | | 1.75 | % | | | 1.84 | %(b) | | | 2.00 | % | | | — | % |
Ratio of gross expenses before waivers and/or reimbursements | | | 3.29 | % | | | 4.04 | % | | | 5.99 | % | | | 5.69 | % | | | 6.13 | % |
Ratio of net investment income to average net assets | | | 0.38 | % | | | 0.67 | % | | | 0.75 | % | | | 0.11 | % | | | 2.28 | % |
Portfolio turnover rate | | | 12 | % | | | 13 | % | | | 1 | % | | | 4 | % | | | 7 | % |
| (a) | Value is less than $0.005 per share. |
| (b) | Effective March 1, 2015, the Fund’s Board approved a fee reduction agreement between the Trust and FCA Corp that limits Fund expenses to 1.50% of average net assets, exclusive of the 0.25% distribution fee. |
32
See accompanying notes to financial statements.
| | |
| | ANNUAL REPORT 2017 |
FINANCIAL HIGHLIGHTS
Selected data for a share outstanding throughout each of the years indicated:
| | | | | | | | | | | | | | | | | | | | |
| | | For the year
ended
10/31/2017 | | | For the year
ended
10/31/2016 | | | For the year
ended
10/31/2015 | | | For the year
ended
10/31/2014 | | | For the year
ended
10/31/2013 | |
| Net Asset Value, Beginning of Year | | $ | 3.38 | | | $ | 3.30 | | | $ | 3.05 | | | $ | 3.08 | | | $ | 2.54 | |
| | | | | | | | | | | | | | | | | | | | |
| | | | | |
| Change in net assets from operations: | | | | | | | | | | | | | | | | | | | | |
Net investment loss | | | (0.02 | ) | | | (0.03 | ) | | | (0.07 | ) | | | (0.05 | ) | | | (0.10 | ) |
Net realized and unrealized gain from investments | | | 0.46 | | | | 0.11 | | | | 0.32 | | | | 0.02 | | | | 0.64 | |
| | | | | | | | | | | | | | | | | | | | |
Total from investment activities | | | 0.44 | | | | 0.08 | | | | 0.25 | | | | (0.03 | ) | | | 0.54 | |
| | | | | | | | | | | | | | | | | | | | |
Redemption fees | | | — | | | | — | | | | — | | | | — | (a) | | | — | (a) |
| | | | | | | | | | | | | | | | | | | | |
| Net Asset Value, End of Year | | $ | 3.82 | | | $ | 3.38 | | | $ | 3.30 | | | $ | 3.05 | | | $ | 3.08 | |
| | | | | | | | | | | | | | | | | | | | |
| | | | | |
| Total Return | | | 13.02 | % | | | 2.42 | % | | | 8.20 | % | | | (0.97 | )% | | | 21.26 | % |
| | | | | | | | | | | | | | | | | | | | |
Net assets at end of year (000’s) | | $ | 5,376 | | | $ | 4,888 | | | $ | 5,336 | | | $ | 4,902 | | | $ | 4,444 | |
| | | | | |
| Ratios/Supplemental Data: | | | | | | | | | | | | | | | | | | | | |
Ratio of net expenses to average net assets | | | 1.75 | % | | | 2.03 | %(b) | | | 3.55 | % | | | 3.49 | % | | | 4.40 | % |
Ratio of gross expenses before waivers and/or reimbursements | | | 2.88 | % | | | 3.22 | % | | | 4.33 | % | | | 4.24 | % | | | 4.40 | % |
Ratio of net investment loss to average net assets | | | (0.48 | )% | | | (0.54 | )% | | | (2.35 | )% | | | (2.22 | )% | | | (3.03 | )% |
Portfolio turnover rate | | | 14 | % | | | 4 | % | | | 10 | % | | | 9 | % | | | 23 | % |
| (a) | Value is less than $0.005 per share. |
| (b) | Effective March 1, 2016, the Fund’s Board approved a fee reduction agreement between the Trust and FCA Corp that limits Fund expenses to 1.50% of average net assets, exclusive of the 0.25% distribution fee. |
33
See accompanying notes to financial statements.
| | |
| | ANNUAL REPORT 2017 |
FINANCIAL HIGHLIGHTS
Selected data for a share outstanding throughout each of the years indicated:
| | | | | | | | | | | | | | | | | | | | |
| | | For the year
ended
10/31/2017 | | | For the year
ended
10/31/2016 | | | For the year
ended
10/31/2015 | | | For the year
ended
10/31/2014 | | | For the year
ended
10/31/2013 | |
| Net Asset Value, Beginning of Year | | $ | 13.97 | | | $ | 13.95 | | | $ | 16.78 | | | $ | 17.00 | | | $ | 14.13 | |
| | | | | | | | | | | | | | | | | | | | |
| | | | | |
| Change in net assets from operations: | | | | | | | | | | | | | | | | | | | | |
Net investment loss | | | (0.08 | ) | | | (0.07 | ) | | | (0.15 | ) | | | (0.08 | ) | | | (0.12 | ) |
Net realized and unrealized gain (loss) from investments | | | 2.04 | | | | 0.09 | | | | (1.35 | ) | | | 0.50 | | | | 2.99 | |
| | | | | | | | | | | | | | | | | | | | |
Total from investment activities | | | 1.96 | | | | 0.02 | | | | (1.50 | ) | | | 0.42 | | | | 2.87 | |
| | | | | | | | | | | | | | | | | | | | |
| | | | | |
| Distributions: | | | | | | | | | | | | | | | | | | | | |
Net realized gains | | | (0.60 | ) | | | — | | | | (1.33 | ) | | | (0.64 | ) | | | — | |
| | | | | | | | | | | | | | | | | | | | |
Total distributions | | | (0.60 | ) | | | — | | | | (1.33 | ) | | | (0.64 | ) | | | — | |
| | | | | | | | | | | | | | | | | | | | |
Redemption fees | | | — | | | | — | (a) | | | — | (a) | | | — | | | | — | (a) |
| | | | | | | | | | | | | | | | | | | | |
| Net Asset Value, End of Year | | $ | 15.33 | | | $ | 13.97 | | | $ | 13.95 | | | $ | 16.78 | | | $ | 17.00 | |
| | | | | | | | | | | | | | | | | | | | |
| | | | | |
| Total Return | | | 14.60 | % | | | 0.14 | % | | | (9.42 | )% | | | 2.56 | % | | | 20.31 | % |
| | | | | | | | | | | | | | | | | | | | |
Net assets at end of year (000’s) | | $ | 16,274 | | | $ | 14,645 | | | $ | 15,210 | | | $ | 16,637 | | | $ | 15,959 | |
| | | | | |
| Ratios/Supplemental Data: | | | | | | | | | | | | | | | | | | | | |
Ratio of net expenses to average net assets | | | 2.53 | % | | | 2.92 | % | | | 3.31 | % | | | 3.08 | % | | | 3.12 | % |
Ratio of gross expenses before waivers and/or reimbursements | | | 2.53 | % | | | 2.92 | % | | | 3.34 | % | | | 3.08 | % | | | 3.12 | % |
Ratio of net investment loss to average net assets | | | (0.53 | )% | | | (0.48 | )% | | | (1.03 | )% | | | (0.52 | )% | | | (0.81 | )% |
Portfolio turnover rate | | | 11 | % | | | 45 | % | | | 45 | % | | | 27 | % | | | 14 | % |
| (a) | Value is less than $0.005 per share. |
34
See accompanying notes to financial statements.
| | |
| | ANNUAL REPORT 2017 |
FINANCIAL HIGHLIGHTS
Commonwealth Real Estate Securities Fund
Selected data for a share outstanding throughout each of the years indicated:
| | | | | | | | | | | | | | | | | | | | |
| | | For the year
ended
10/31/2017 | | | For the year
ended
10/31/2016 | | | For the year
ended
10/31/2015 | | | For the year
ended
10/31/2014 | | | For the year
ended
10/31/2013 | |
| Net Asset Value, Beginning of Year | | $ | 14.41 | | | $ | 14.62 | | | $ | 14.35 | | | $ | 12.55 | | | $ | 11.27 | |
| | | | | | | | | | | | | | | | | | | | |
| | | | | |
| Change in net assets from operations: | | | | | | | | | | | | | | | | | | | | |
Net investment income (loss) | | | — | (a) | | | — | (a) | | | (0.14 | ) | | | 0.02 | | | | (0.02 | ) |
Net realized and unrealized gain from investments | | | 2.27 | | | | — | (a) | | | 0.41 | | | | 1.78 | | | | 1.30 | |
| | | | | | | | | | | | | | | | | | | | |
Total from investment activities | | | 2.27 | | | | — | | | | 0.27 | | | | 1.80 | | | | 1.28 | |
| | | | | | | | | | | | | | | | | | | | |
| | | | | |
| Distributions: | | | | | | | | | | | | | | | | | | | | |
Net realized gains | | | — | | | | (0.21 | ) | | | — | | | | — | | | | — | |
| | | | | | | | | | | | | | | | | | | | |
Total distributions | | | — | | | | (0.21 | ) | | | — | | | | — | | | | — | |
| | | | | | | | | | | | | | | | | | | | |
Redemption fees | | | — | | | | — | | | | — | | | | — | | | | — | (a) |
| | | | | | | | | | | | | | | | | | | | |
| Net Asset Value, End of Year | | $ | 16.68 | | | $ | 14.41 | | | $ | 14.62 | | | $ | 14.35 | | | $ | 12.55 | |
| | | | | | | | | | | | | | | | | | | | |
| | | | | |
| Total Return | | | 15.75 | % | | | 0.07 | % | | | 1.88 | % | | | 14.34 | % | | | 11.36 | % |
| | | | | | | | | | | | | | | | | | | | |
Net assets at end of year (000’s) | | $ | 11,163 | | | $ | 9,565 | | | $ | 9,719 | | | $ | 9,537 | | | $ | 8,362 | |
| | | | | |
| Ratios/Supplemental Data: | | | | | | | | | | | | | | | | | | | | |
Ratio of net expenses to average net assets | | | 2.61 | % | | | 2.93 | % | | | 3.35 | % | | | 3.20 | % | | | 3.33 | % |
Ratio of gross expenses before waivers and/or reimbursements | | | 2.61 | % | | | 2.93 | % | | | 3.38 | % | | | 3.20 | % | | | 3.33 | % |
Ratio of net investment income (loss) to average net assets | | | — | % | | | (0.01 | )% | | | (0.93 | )% | | | 0.10 | % | | | (0.18 | )% |
Portfolio turnover rate | | | 13 | % | | | 12 | % | | | 10 | % | | | 16 | % | | | 4 | % |
| (a) | Value is less than $0.005 per share. |
35
See accompanying notes to financial statements.
| | |
| | ANNUAL REPORT 2017 |
NOTES TO FINANCIAL STATEMENTS – October 31, 2017
Note 1 – Organization
Commonwealth International Series Trust (the ‘‘Trust’’) was organized as a Massachusetts business trust on May 2, 1986, and is registered under the Investment Company Act of 1940, as amended (the ‘‘1940 Act’’), as an open-end management investment company. The Trust currently consists of five diversified series: the Commonwealth Australia/New Zealand Fund (the ‘‘Australia/New Zealand Fund’’), the Africa Fund, the Commonwealth Japan Fund (the ‘‘Japan Fund’’), the Commonwealth Global Fund (the ‘‘Global Fund’’) and the Commonwealth Real Estate Securities Fund (the ‘‘Real Estate Securities Fund’’) (each a ‘‘Fund’’ and collectively the ‘‘Funds’’).
Note 2 – Investment Objectives
Each Fund’s investment objective is to provide long-term capital appreciation and current income. Under normal market conditions, each Fund (other than the Global Fund) invests at least 80% of its assets in the country or asset class specified in its name (i.e., Australia/New Zealand, Africa, Japan or Real Estate).
Note 3 – Significant Accounting Policies
The Funds are investment companies and follow accounting and reporting guidance under Financial Accounting Standards Board Accounting Standards Codification (“ASC”) Topic 946, “Financial Services-Investment Companies.” The following is a summary of significant accounting policies followed by the Funds in the preparation of their financial statements. These policies are in conformity with generally accepted accounting principles in the United States of America (“GAAP”).
A) Valuation of Securities – Each Fund’s assets and liabilities are valued normally on the basis of market quotations or official closing prices or, if there is no recent last sales price available, reference is made to the last mean quotation in the principal market in which the securities are normally traded. Equity securities that are traded on the NASDAQ National Market System, for which quotations are readily available, are valued at the official closing price. Options are valued at the last quoted sales price. If there is no such reported sale on the valuation date, long positions are valued at the most recent bid price, and short positions are valued at the most recent ask price. Debt securities are priced either by using a market quotation or an independent pricing service. The pricing service may use one or more pricing models. Short-term debt securities with remaining maturities of 60 days or less at the time of purchase may be valued at amortized cost only if the Trust can reasonably conclude, at each time it makes a valuation determination, that the amortized cost value of the portfolio security is approximately the same as the fair value of the security as determined without the use of amortized cost valuation. Investments in open-end investment companies are valued at net asset value. If Fund management determines that market quotations or official closing prices are not readily available or do not accurately reflect the fair value for a security, the fair value of the security or securities will be determined in accordance with procedures established by the Board of Trustees (the “Board”). Fair value prices are generally provided by an independent fair value pricing service. The Funds have instituted a policy whereby the value of certain equity securities listed or traded on foreign security exchanges may be valued by an independent fair value pricing service on any day when certain conditions are met. The Australia/New Zealand Fund, Africa Fund and Japan Fund have retained an independent fair value pricing service to assist in the fair valuing of these foreign securities. The service utilizes statistical data based on historical performance of securities, markets, and other data in developing factors used to estimate a fair value. For the Australia/New Zealand Fund and Japan Fund, the measure is based on a comparison between the S&P 500® Futures Index at the time of Tokyo market close to the S&P 500® Futures Index at the time of the New York market close. For the Africa Fund, the measure is based on a comparison between the S&P 500® Futures Index at the time of London market close to the S&P 500® Futures Index at the time of the New York market close.
36
| | |
| | ANNUAL REPORT 2017 |
NOTES TO FINANCIAL STATEMENTS – October 31, 2017 (Continued)
B) Fair Value Measurements – The Funds’ investments have been categorized by tiers dependent upon the various ‘‘inputs’’ used to determine the fair value of the Funds’ investments. These inputs are summarized in the three broad levels listed below:
| | • | | Level 1 – unadjusted quoted prices in active markets for identical investments and/or registered investment companies where the value per share is determined and published and is the basis for current transactions for identical assets or liabilities at the valuation date |
| | • | | Level 2 – other significant observable inputs (including quoted prices for similar securities, interest rates, prepayments speeds, credit risk, etc.) |
| | • | | Level 3 – significant unobservable inputs (including management’s own assumptions in determining the fair value of investments) |
A description of the valuation techniques applied to the Funds’ major categories of assets and liabilities measured at fair value on a recurring basis follows:
Common stocks, preferred stocks and exchange-traded funds. Securities traded on a national exchange (or reported on the NASDAQ national market) are stated at the last reported sales price on the day of valuation. Investments in other open-end registered investment companies, including money market funds, are valued at net asset value. To the extent these securities are actively traded and valuation adjustments are not applied, they are generally categorized in Level 1 of the fair value hierarchy. Securities traded on inactive markets, valued by reference to similar instruments or whose inputs are observable and timely would be categorized in Level 2 of the fair value hierarchy.
Corporate and Sovereign Bonds. The fair value of corporate bonds may be estimated using recently executed transactions, market price quotations (where observable), bond spreads, and/or credit default swap spreads adjusted for any basis difference between cash and derivative instruments. Domestically held corporate bonds are generally categorized in Level 2 of the fair value hierarchy; in instances where prices, spreads, or any of the other aforementioned key inputs are unobservable, they would be categorized in Level 3 of the fair value hierarchy.
Written/Purchased Options. Listed derivatives that are actively traded are valued based on quoted prices from the exchange and are generally categorized in Level 1 of the fair value hierarchy.
The inputs or methodology used for valuing securities are not necessarily an indication of the risk associated with investing in those securities.
The following is a summary of the inputs used to value the Funds’ investments as of October 31, 2017:
| | | | | | | | | | | | | | | | |
| | | Australia/New Zealand Fund | |
| | | Level 1 | | | Level 2 | | | Level 3 | | | Total | |
Security Type | | | | | | | | | | | | | | | | |
Common Stocks(1) | | $ | 19,221,539 | | | $ | 579,339 | (2) | | $ | — | | | $ | 19,800,878 | |
Corporate Bonds | | | 617,079 | | | | — | | | | — | | | | 617,079 | |
Rights | | | — | | | | — | | | | 456 | (3) | | | 456 | |
Short-Term Investments | | | 29,943 | | | | — | | | | — | | | | 29,943 | |
| | | | |
Total | | $ | 19,868,561 | | | $ | 579,339 | | | $ | 456 | | | $ | 20,448,356 | |
| | | | |
| | | | |
37
| | |
| | ANNUAL REPORT 2017 |
NOTES TO FINANCIAL STATEMENTS – October 31, 2017 (Continued)
| | | | | | | | | | | | | | | | |
| | | Africa Fund | |
| | | Level 1 | | | Level 2 | | | Level 3 | | | Total | |
Security Type | | | | | | | | | | | | | | | | |
Common Stocks(1) | | $ | 2,260,908 | | | $ | — | | | $ | — | | | $ | 2,260,908 | |
Exchange-Traded Funds | | | 359,539 | | | | — | | | | — | | | | 359,539 | |
Sovereign Bonds | | | — | | | | 14,234 | | | | — | | | | 14,234 | |
Short-Term Investments | | | 153,364 | | | | — | | | | — | | | | 153,364 | |
| | | | |
Total | | $ | 2,773,811 | | | $ | 14,234 | | | $ | — | | | $ | 2,788,045 | |
| | | | |
| | | | |
| |
| | | Japan Fund | |
| | | Level 1 | | | Level 2 | | | Level 3 | | | Total | |
Security Type | | | | | | | | | | | | | | | | |
Common Stocks(1) | | $ | 5,295,503 | | | $ | — | | | $ | — | | | $ | 5,295,503 | |
Short-Term Investments | | | 39,893 | | | | — | | | | — | | | | 39,893 | |
| | | | |
Total | | $ | 5,335,396 | | | $ | — | | | $ | — | | | $ | 5,335,396 | |
| | | | |
| | | | |
| |
| | | Global Fund | |
| | | Level 1 | | | Level 2 | | | Level 3 | | | Total | |
Security Type | | | | | | | | | | | | | | | | |
Common Stocks(1) | | $ | 15,396,239 | | | $ | 306,903 | (4) | | $ | — | | | $ | 15,703,142 | |
Call Options | | | 302,400 | | | | 53,375 | (4) | | | — | | | | 355,775 | |
Short-Term Investments | | | 277,606 | | | | — | | | | — | | | | 277,606 | |
| | | | |
Total | | $ | 15,976,245 | | | $ | 360,278 | | | $ | — | | | $ | 16,336,523 | |
| | | | |
| | | | |
| |
| | | Real Estate Securities Fund | |
| | | Level 1 | | | Level 2 | | | Level 3 | | | Total | |
Security Type | | | | | | | | | | | | | | | | |
Common Stocks(1) | | $ | 9,964,217 | | | $ | 281,370 | (5) | | $ | — | | | $ | 10,245,587 | |
Exchange-Traded Funds | | | 254,320 | | | | — | | | | — | | | | 254,320 | |
Call Options | | | — | | | | 31,500 | (6) | | | — | | | | 31,500 | |
Short-Term Investments | | | 715,810 | | | | — | | | | — | | | | 715,810 | |
| | | | |
Total | | $ | 10,934,347 | | | $ | 312,870 | | | $ | — | | | $ | 11,247,217 | |
| | | | |
| | | | |
| (1) | All sub-categories within Common Stocks represent Level 1 or Level 2 evaluation status. For a detailed breakout by industry or country, please refer to the Schedules of Investments. |
| (2) | Consists of the holding: Marsden Maritime Holdings Ltd. and Airwork Holdings Ltd. listed under New Zealand. |
| (3) | Consists of the holding: Pacific Edge Ltd., Rights. |
| (4) | Consists of the holdings: Old Mutual PLC listed under United Kingdom and Intel Corp. call options purchased. |
| (5) | Consists of the holdings: China Overseas Land & Investment Ltd. and Kajima Corp. |
| (6) | Consists of the holding: Granite Construction, Inc. call options purchased. |
38
| | |
| | ANNUAL REPORT 2017 |
NOTES TO FINANCIAL STATEMENTS – October 31, 2017 (Continued)
The following is a summary of other financial instruments that are derivative instruments not reflected in the Schedules of Investments, such as futures, written options, forwards and swap contracts. Please refer to Note 6 – Financial Instruments with Off-Balance Sheet Risk for additional information.
| | | | | | | | | | | | | | | | |
| | | Other Financial Instruments at Value | |
| Fund | | Level 1 | | | Level 2 | | | Level 3 | | | Total | |
Global Fund | | | | | | | | | | | | | | | | |
Written Options | | $ | (18,015 | ) | | $ | (32,800 | ) | | $ | — | | | $ | (50,815 | ) |
Real Estate Securities Fund | | | | | | | | | | | | | | | | |
Written Options | | $ | (1,590 | ) | | $ | (2,615 | ) | | $ | — | | | $ | (4,205 | ) |
It is the Funds’ policy to recognize transfers into and out of all Levels at the end of the reporting period. As described under Note 3 – Significant Accounting Policies under A) Valuation of Securities, certain equity securities listed or traded on foreign exchanges may be valued by an independent fair value pricing agent on any day when certain conditions are met and classified in Level 2. When the securities are valued based on an exchange traded closing price, they are classified in Level 1. The following is a reconciliation of transfers between category levels as of October 31, 2016 and October 31, 2017:
| | | | | | | | | | | | |
| | | Australia/
New Zealand Fund | | | Global
Fund | | | Real Estate
Securities Fund | |
Transfers into Level 1 | | $ | 3,984,700 | | | $ | 378,860 | | | $ | 165,200 | |
Transfers out of Level 1 | | | (579,339 | ) | | | — | | | | — | |
| | | | | | | | | | | | |
Net Transfers in (out) of Level 1 | | $ | 3,405,361 | | | $ | 378,860 | | | $ | 165,200 | |
| | | | | | | | | | | | |
Transfers into Level 2 | | $ | 579,339 | | | $ | — | | | $ | — | |
Transfers out of Level 2 | | | (3,984,700 | ) | | | (378,860 | ) | | | (165,200 | ) |
| | | | | | | | | | | | |
Net Transfers in (out) of Level 2 | | $ | (3,405,361 | ) | | $ | (378,860 | ) | | $ | (165,200 | ) |
| | | | | | | | | | | | |
The following is a summary of the Level 3 reconciliation as of October 31, 2017:
| | | | |
| Australia/New Zealand Fund | | Rights | |
Balance as of October 31, 2016 | | $ | — | |
Realized gain/(loss) | | | — | |
Change in unrealized appreciation (depreciation) | | | — | |
Purchases | | | 456 | |
Sales | | | — | |
Transfers in to Level 3 | | | — | |
Transfers out of Level 3 | | | — | |
Balance as of October 31, 2017 | | $ | 456 | |
C) Currency Translation – For purposes of determining each Fund’s net asset value, all assets and liabilities initially expressed in foreign currency values are converted into U.S. dollar values at the prevailing market rate on each U.S. business day. The cost of securities is determined by using an exchange rate provided by an independent third party. Income is translated at approximate rates prevailing when accrued. The Funds do not isolate that portion of gains and losses on investments which is due to changes in foreign exchange rates from that which is due to changes in the market prices of the investments. Such fluctuations are included with the net realized and unrealized gains and losses from investments.
39
| | |
| | ANNUAL REPORT 2017 |
NOTES TO FINANCIAL STATEMENTS – October 31, 2017 (Continued)
D) Allocations of Expenses – Expenses directly attributable to a Fund are charged directly to that Fund, while expenses which are attributable to more than one Fund, or the Trust, are allocated among the respective Funds based upon relative net assets or some other reasonable method.
E) Accounting for Investments – Security transactions are accounted for on the trade date for financial reporting purposes. Realized gains and losses on security transactions are based on the identified cost basis for both financial statement and Federal income tax purposes. Dividend income and distributions to shareholders are recorded on the ex-dividend date or as soon as known if after the ex-dividend date. Discounts and premiums on bonds purchased are amortized over the life of the bonds (which may include maturity or call date). Interest income and estimated expenses are accrued daily.
F) Federal Income Taxes – It is each Fund’s policy to comply with the requirements of Subchapter M of the Internal Revenue Code that are applicable to regulated investment companies and to distribute substantially all investment company taxable income and net capital gain to shareholders in a manner which results in no tax cost to the Funds. Therefore, no federal income tax provision is required.
Dividends or interest on foreign securities may be subject to the withholding of the country of domicile’s income tax by tax treaty provisions or otherwise. Generally, there are no foreign taxes applicable to the Funds’ capital gains realized on foreign securities in their country of domicile.
The Trust has evaluated tax positions taken or expected to be taken in the course of preparing each Fund’s tax returns to determine whether it is more-likely-than not (i.e., greater than 50-percent chance) that each tax position will be sustained upon examination by a taxing authority based on the technical merits of the position. A tax position that meets the more-likely-than-not recognition threshold is measured to determine the amount of benefit to recognize in the financial statements. Differences between tax positions taken in a tax return and amounts recognized in the financial statements will generally result in an increase in a liability for taxes payable (or a reduction of a tax refund receivable), including the recognition of any related interest and penalties as an operating expense. Tax positions taken in tax years remain subject to examination by tax authorities (generally three years plus the interim tax period since then for federal income tax purposes). The determination has been made that there are not any uncertain tax positions that would require the Funds to record a tax liability and, therefore, there is no impact to the Funds’ financial statements.
G) Distributions to Shareholders – The Funds distribute net investment income, if any, and net realized gains (net of any capital loss carryovers) annually. Income and capital gain distributions are determined in accordance with income tax regulations, which may differ from GAAP. These differences are primarily due to differing treatments for foreign currency transactions and deferrals of certain losses.
H) Redemption Fees – Redemption fees are applicable to certain redemptions of shares within fourteen calendar days of purchase. The redemption fee is imposed to discourage abusive trading activity, which can have disruptive effects on the Funds’ portfolio management and can increase the Funds’ expenses. The redemption fees are intended to offset, at least partially, portfolio transaction and administrative costs associated with short-term trading. The shareholder will be charged a fee equal to 2.00% of the amount redeemed and will be charged when shares are sold, exchanged or involuntarily redeemed. In determining the applicability of the redemption fee, shares held for the longest period of time will be treated as being sold first and shares held for the shortest period of time as being sold last. For the fiscal year ended October 31, 2017, the Australia/New Zealand Fund and Africa Fund had contributions to capital due to redemption fees in the amount of $27 and $203, respectively.
40
| | |
| | ANNUAL REPORT 2017 |
NOTES TO FINANCIAL STATEMENTS – October 31, 2017 (Continued)
I) Option Accounting Principles – A Fund may purchase or write put or call options on futures contracts, individual securities, currencies or stock indices to hedge against fluctuations in securities prices and currency exchange rates and to adjust its risk exposure relative to the benchmark. The Fund may use these derivatives for any purpose consistent with its investment objective, such as hedging, obtaining market exposure, and generating premium income.
When a Fund writes an option, the premium received is recorded as a liability. Each day the option contract liability is valued in accordance with the procedures for security valuation discussed previously. When an offsetting option is purchased (a closing transaction) or the option contract expires, the Fund realizes a gain or loss and the liability related to such option contract is eliminated. When a call option is exercised, the Fund realizes a gain or loss from the sale of the underlying security and the proceeds of the sale are increased by the premiums originally received.
When a Fund purchases an option, the premium paid is recorded as an asset. Each day, the option contract is valued in accordance with the procedures for security valuation discussed above. When an offsetting option is written (a closing transaction) or the option contract expires, the Fund realizes a gain or loss and the asset representing such option contract is eliminated. When a call option is exercised, the Fund purchases the underlying security and the cost basis of such purchase is increased by the premium originally paid.
J) Forward Currency Contracts – Forward currency transactions may be undertaken to hedge against possible variations in the foreign exchange rates between the U.S. dollar and foreign currencies. A forward currency contract is an agreement between two parties to buy or sell a currency at a set price on a future date. Forward contracts are marked-to-market daily and the change in the market value is recorded by the Fund as an unrealized gain or loss. When a contract is closed, the Fund records a realized gain or loss equal to the difference between the value of the contract at the time it was opened and the value at the time it was closed. The Funds could be exposed to risk if the counterparties are unable to meet the terms of the contracts or if the value of the currency changes unfavorably. Other risks of forward currency transactions include failing to achieve expected benefit, markets moving in a direction that the Funds did not expect, a Fund’s ability to close out its position in the hedging instrument, and political and social unrest and the possibility of negative governmental actions. During and as of the fiscal year ended October 31, 2017, the Funds held no foreign currency contracts.
K) Use of Estimates – The preparation of the financial statements in conformity with GAAP requires management to make estimates and assumptions that affect the reported amounts of assets and liabilities and the disclosure of contingent assets and liabilities at the date of the financial statements and the reported amounts of increases and decreases in net assets from operations during the reporting period. Actual results could differ from those estimates and these differences could be material.
Note 4 – Related Party Transactions and Other Arrangements
A) Investment Advisor – The Trust, on behalf of each Fund, has retained FCA Corp as the Funds’ investment advisor (the “Advisor”). Under each Fund’s Investment Advisory Agreement, the Advisor is paid a fee (the “Management Fee”), calculated daily and payable monthly, equal to an annual rate of 0.75% of the average net assets of each Fund.
The Advisor entered into an expense limitation agreement through February 28, 2018, under which it has agreed to limit the total expenses of the Africa Fund and the Japan Fund (exclusive of interest, distribution fees pursuant to Rule 12b-1 Plans, taxes, acquired fund fees and expenses, brokerage commissions, extraordinary expenses and dividend expense on short sales) to an annual rate of 1.50% and 1.50% of the average daily net assets of the Africa Fund and the Japan Fund, respectively. The Advisor may not terminate this arrangement prior to February 28, 2018, unless the investment advisory agreement is terminated. The Africa Fund and the Japan Fund each have agreed to repay the Advisor for amounts waived by the Advisor
41
| | |
| | ANNUAL REPORT 2017 |
NOTES TO FINANCIAL STATEMENTS – October 31, 2017 (Continued)
pursuant to the fee waiver agreement to the extent that such repayment occurs within three fiscal years of the date of any such waiver and such repayment does not cause the Fund to exceed the expense limitation in place at the time the fee was waived. As of October 31, 2017, the Adviser may seek repayment of investment advisory fee waivers and expense reimbursements in the amount of $165,822 and $104,318 in the Africa Fund and Japan Fund, respectively, no later than October 31, 2020. Certain officers of the Trust are also officers of the Advisor.
B) Administration, Fund Accounting and Transfer Agent – Ultimus Asset Services, LLC (the “Administrator”), serves as the administrator, transfer agent and fund accountant to the Funds. For these services, the Administrator receives fees computed at an annual rate of the daily net assets of the Funds, subject to a minimum annual contractual fee. Certain officers of the Trust are also employees of the Administrator, but are paid no fees directly by the Funds for serving as an officer of the Trust.
C) Distribution – Unified Financial Securities, LLC (“Unified”), an affiliate of the Administrator, serves as the principal underwriter for the shares of each Fund of the Trust and receives an annual contractual fee.
Each Fund has adopted a Service and Distribution Plan (each a “Plan”) pursuant to Rule 12b-1 under the Act, whereby up to 0.35% of the Funds’ assets may be used to reimburse the Distributor for costs and expenses incurred in connection with the distribution and marketing of shares of the Funds and the servicing of the Funds shareholders. Distribution and marketing expenses include, among other things, printing of prospectuses, marketing literature, and costs of personnel involved with the promotion and distribution of the Funds’ shares. These amounts are disclosed on the Statements of Operations under Distribution (12b-1) fees. While the plans permit each Fund to pay up to 0.35% of its average daily net assets to reimburse for certain expenses in connection with the distribution of its shares, the Board has currently authorized each Fund to pay out only 0.25% under its Plan. If the Board’s intention changes on this matter, the Funds will amend or supplement their prospectus. Out of the foregoing amount, each Fund is permitted to pay up to an aggregate of 0.25% of its average daily net assets to reimburse for certain shareholder services.
D) Legal Counsel – The Law Offices of John H. Lively and Associates, Inc., a member firm of The 1940 Act Law GroupTM, serves as legal counsel to the Trust. John H. Lively, Secretary of the Trust, is the owner of the Law Offices of John H. Lively & Associates, Inc., but he receives no special compensation from the Trust or the Funds for serving as an officer of the Trust.
Note 5 – Purchases and Sales of Securities
Purchases and sales of investment securities (excluding short-term securities) by the Funds for the fiscal year ended October 31, 2017, were as follows:
| | | | | | | | |
| | | Purchases | | | Sales | |
Australia/New Zealand Fund | | $ | 6,082,253 | | | $ | 6,173,393 | |
Africa Fund | | | 466,301 | | | | 293,044 | |
Japan Fund | | | 673,830 | | | | 848,962 | |
Global Fund | | | 2,799,265 | | | | 1,556,223 | |
Real Estate Securities Fund | | | 1,336,643 | | | | 1,613,742 | |
Note 6 – Financial Instruments with Off-Balance Sheet Risk
In the ordinary course of trading activities, certain of the Funds may trade and hold certain derivative contracts. Such contracts include forward currency contracts, where the Funds would be obligated to buy currency at specified prices, and
42
| | |
| | ANNUAL REPORT 2017 |
NOTES TO FINANCIAL STATEMENTS – October 31, 2017 (Continued)
written put and call options, where the Funds would be obligated to purchase or sell securities at specified prices (i.e., the options are exercised by the counterparties). The maximum payout for the put option contracts is limited to the number of contracts written and the related strike prices, respectively. The maximum payout for uncovered written call option contracts is limited only by how high the underlying rises above the strike price. Maximum payout amounts could be offset by the subsequent sale, if any, of assets obtained via the execution of a payout event.
These financial instruments contain varying degrees of off-balance sheet risk whereby changes in the market value of securities underlying the financial instruments may be in excess of the amounts recognized in the Statements of Assets and Liabilities. A Fund, as writer of an option, bears the market risk of an unfavorable change in the price of the security underlying the written option. The risk associated with purchasing an option is that the Fund pays a premium whether or not the option is exercised. Additionally, each Fund bears the risk of loss of premium and change in market value should the counterparty not perform under the contract. A call option gives the holder the right to buy the underlying stock from the writer at a specified price within a fixed period of time. Therefore, the securities held by the Fund against which options are written may not be traded and are held in escrow by the custodian. In the ordinary course of trading activities, certain of the Funds trade and hold certain fair-valued derivative contracts. Such contracts include forward currency contracts, where the Funds would be obligated to buy currency at specified prices, and written put and call options, where the Funds would be obligated to purchase or sell securities at specified prices (i.e., the options are exercised by the counterparties). The maximum payout for the put option contracts is limited to the number of contracts written and the related strike prices, respectively. The maximum payout for uncovered written call option contracts is limited only by how high the underlying security price rises above the strike price. Maximum payout amounts could be offset by the subsequent sale, if any, of assets obtained via the execution of a payout event.
Note 7 – Derivatives
The Funds’ use of derivatives for the fiscal year ended October 31, 2017, was limited to purchased & written options. The derivative instruments outstanding as of October 31, 2017, as disclosed in the Statements of Assets and Liabilities, and the amounts of realized and changes in unrealized gains and losses on derivative instruments during the period, as disclosed in the Statements of Operations, serve as indicators of the volume of derivative activity for the Funds. Following is a summary of how these derivatives are treated in the financial statements and their impact on the Funds.
| | | | | | | | | | | | | | | | |
| | | Statements of Assets and Liabilities | | | Statements of Operations | |
| Fund/Financial Instrument Type | | Location of Asset/Liability
Derivatives | | Value | | | Location of Gain (Loss) on
Derivatives Recognized | | Amount of
Realized
Gain (Loss) | | | Amount of
Unrealized
Gain (Loss) | |
Global Fund | | | | | | | | | | | | | | | | |
Equity Contracts | | Investments in securities at value (purchased options) | | $ | 355,775 | | | Net realized loss from purchased option contracts | | $ | (13,032 | ) | | | | |
| | | | | |
Equity Contracts | | Options written, at value (written options) | | | (50,815 | ) | | Net realized gain from written option contracts | | | 19,232 | | | | | |
| | | | | |
Equity Contracts | | | | | | | | Net change in unrealized appreciation (depreciation) on purchased option contracts | | | | | | $ | 208,284 | |
| | | | | |
Equity Contracts | | | | | | | | Net change in unrealized appreciation (depreciation) on written option contracts | | | | | | | (51,267 | ) |
43
| | |
| | ANNUAL REPORT 2017 |
NOTES TO FINANCIAL STATEMENTS – October 31, 2017 (Continued)
| | | | | | | | | | | | | | | | |
| | | Statements of Assets and Liabilities | | | Statements of Operations | |
| Fund/Financial Instrument Type | | Location of Asset/Liability
Derivatives | | Value | | | Location of Gain (Loss) on
Derivatives Recognized | | Amount of
Realized
Gain | | | Amount of
Unrealized
Gain | |
Real Estate Securities Fund | | | | | | | | | | | | | | | | |
Equity Contracts | | Investments in securities at value (purchased options) | | $ | 31,500 | | | Net realized gain from purchased option contracts | | $ | — | | | | | |
| | | | | |
Equity Contracts | | Options written, at value (written options) | | | (4,205 | ) | | Net realized gain from written option contracts | | | 25,449 | | | | | |
| | | | | |
Equity Contracts | | | | | | | | Net change in unrealized appreciation (depreciation) on purchased option contracts | | | | | | $ | 18,837 | |
| | | | | |
Equity Contracts | | | | | | | | Net change in unrealized appreciation (depreciation) on written option contracts | | | | | | | 3,011 | |
Balance Sheet Offsetting Information During the ordinary course of business, the Funds may enter into transactions subject to enforceable netting agreements or other similar arrangements (“netting agreements”). Generally, the right to offset in netting agreements allows a Fund to offset any exposure to a specific counterparty with any collateral received or delivered to that counterparty based on the terms of the agreement. Generally, a Fund manages its cash collateral and securities collateral on a counterparty basis. As of October 31, 2017, the Funds were not invested in any portfolio securities or derivatives that could be netted subject to netting arrangements.
Note 8 – Tax Matters
At October 31, 2017, the gross unrealized appreciation (depreciation) on investments, foreign currency translations, options written and cost of securities on a tax basis for federal income tax purposes were as follows:
| | | | | | | | | | | | | | | | | | | | |
| | | Australia/New
Zealand Fund | | | Africa Fund | | | Japan Fund | | | Global Fund | | | Real Estate
Securities Fund | |
Gross unrealized appreciation | | $ | 7,746,555 | | | $ | 458,231 | | | $ | 2,115,416 | | | $ | 5,069,429 | | | $ | 4,111,151 | |
Gross unrealized depreciation | | | (1,004,388 | ) | | | (403,285 | ) | | | (140,685 | ) | | | (432,721 | ) | | | (88,185 | ) |
| | | | |
Net unrealized appreciation (depreciation) on investments | | $ | 6,742,167 | | | $ | 54,946 | | | $ | 1,974,731 | | | $ | 4,636,708 | | | $ | 4,022,966 | |
| | | | |
| | | | |
Tax cost of investments | | $ | 13,706,189 | | | $ | 2,733,099 | | | $ | 3,360,665 | | | $ | 11,649,000 | | | $ | 7,220,046 | |
| | | | |
| | | | |
The difference between cost amounts for financial statement and federal income tax purposes is due primarily to wash sale loss deferrals, foreign currency translations and passive foreign investment companies (‘‘PFICs’’).
44
| | |
| | ANNUAL REPORT 2017 |
NOTES TO FINANCIAL STATEMENTS – October 31, 2017 (Continued)
As of October 31, 2017, the Funds’ most recent fiscal year end, the components of accumulated earnings (deficit) on a tax basis were as follows:
| | | | | | | | | | | | | | | | | | | | |
| | | Australia/New
Zealand Fund | | | Africa Fund | | | Japan Fund | | | Global Fund | | | Real Estate
Securities Fund | |
Undistributed ordinary income | | $ | 126,835 | | | $ | 12,441 | | | $ | — | | | $ | — | | | $ | 5,048 | |
Undistributed long-term capital gains | | | — | | | | — | | | | — | | | | — | | | | 23,757 | |
| | | | |
Tax accumulated earnings | | | 126,835 | | | | 12,441 | | | | — | | | | — | | | | 28,805 | |
Accumulated capital and other losses | | | (174,246 | ) | | | (278,755 | ) | | | (13,956 | ) | | | (114,648 | ) | | | — | |
Unrealized appreciation (depreciation) on investments | | | 6,742,167 | | | | 54,946 | | | | 1,974,731 | | | | 4,663,365 | | | | 4,020,922 | |
Unrealized appreciation (depreciation) on written options | | | — | | | | — | | | | — | | | | (26,657 | ) | | | 2,044 | |
Unrealized appreciation (depreciation) on foreign currency translations | | | (12,053 | ) | | | (1,485 | ) | | | (904 | ) | | | — | | | | — | |
| | | | |
Total accumulated earnings (deficit) | | $ | 6,682,703 | | | $ | (212,853 | ) | | $ | 1,959,871 | | | $ | 4,522,060 | | | $ | 4,051,771 | |
| | | | |
| | | | |
The tax character of distributions paid during the tax years ended October 31, 2017 and ended October 31, 2016, were as follows:
| | | | | | | | | | | | | | | | | | | | | | | | | | | | | | | | |
| | | Australia/
New Zealand Fund | | | Africa Fund | | | Global Fund | | | Real Estate Securities Fund | |
| | | Year
Ended
October 31,
2017 | | | Year
Ended
October 31,
2016 | | | Year
Ended
October 31,
2017 | | | Year
Ended
October 31,
2016 | | | Year
Ended
October 31,
2017 | | | Year
Ended
October 31,
2016 | | | Year
Ended
October 31,
2017 | | | Year
Ended
October 31,
2016 | |
Distributions paid from: | | | | | | | | | | | | | | | | | | | | | | | | | | | | | | | | |
Ordinary income | | $ | 474,706 | | | $ | 504,861 | | | $ | 15,019 | | | $ | 13,033 | | | $ | — | | | $ | — | | | $ | — | | | $ | — | |
Net long-term capital gains | | | — | | | | — | | | | — | | | | — | | | | 627,731 | | | | — | | | | — | | | | 138,753 | |
Tax return of capital | | | — | | | | — | | | | — | | | | — | | | | — | | | | — | | | | — | | | | 2,005 | |
| | | | |
Total distributions paid | | $ | 474,706 | | | $ | 504,861 | | | $ | 15,019 | | | $ | 13,033 | | | $ | 627,731 | | | $ | — | | | $ | — | | | $ | 140,758 | |
| | | | |
For the tax years ended October 31, 2016 and October 31, 2017, the Japan Fund did not pay any distributions.
As of October 31, 2017, the following Funds had net capital loss carryforwards which are available to offset future net capital gains, if any:
| | | | | | | | | | | | | | | | | | | | | | | | |
| | | Australia/New Zealand | | | Africa Fund | | | Global Fund | |
| | | Short-Term | | | Long-Term | | | Short-Term | | | Long-Term | | | Short-Term | | | Long-Term | |
For losses expiring October 31, | | | | | | | | | | | | | | | | | | | | | | | | |
Non-Expiring | | $ | 174,246 | | | $ | — | | | $ | 10,947 | | | $ | 267,808 | | | $ | 43,877 | | | $ | 2,009 | |
Capital loss carryovers are available to offset future realized capital gains and thereby reduce further taxable gain distributions. During the fiscal year ended October 31, 2017, the Australia/New Zealand, Japan and Real Estate Funds utilized $93,416, $457,099 and $47,498, respectively of their capital loss carryovers.
As of October 31, 2017, the Japan and Global Funds, respectively, had $13,956 and $68,763 of qualified late-year ordinary losses, which were deferred until fiscal year 2017 for tax purposes. Net late-year losses incurred after December 31 and within the taxable year are deemed to arise on the first day of the Funds’ next taxable year.
45
| | |
| | ANNUAL REPORT 2017 |
NOTES TO FINANCIAL STATEMENTS – October 31, 2017 (Continued)
The Funds have recorded reclassifications in their capital accounts. These reclassifications have no impact on the net asset value of the Funds and are designed generally to present undistributed net investment income and accumulated net realized gain (loss) on a tax basis which is considered to be more informative to the shareholder. As of October 31, 2017, the Funds recorded the following reclassifications to increase (decrease) the capital accounts listed below:
| | | | | | | | | | | | | | | | | | | | |
| | | Australia/New
Zealand Fund | | | Africa
Fund | | | Japan
Fund | | | Global
Fund | | | Real Estate
Securities Fund | |
Paid-in capital | | $ | — | | | $ | — | | | $ | (91,883 | ) | | $ | (37,384 | ) | | $ | — | |
Accumulated net investment income (loss) | | | (71,633 | ) | | | 2,732 | | | | 27,751 | | | | 64,562 | | | | 17,014 | |
Accumulated net realized gains (losses) from investments, options contracts and foreign currency transactions | | | 71,633 | | | | (2,732 | ) | | | 64,132 | | | | (27,178 | ) | | | (17,014 | ) |
Note 9 – Revolving Credit Agreement
The Trust has in place an Amended and Restated Revolving Credit Agreement (the “Agreement”) with its custodian, Fifth Third Bank N.A. (the “Bank”). Pursuant to the terms of the Agreement, the Bank makes available to the Trust, a line of credit facility under which the Bank may make loans to the Trust, on behalf of the Funds, from time to time. The Agreement provides a line of credit in an amount of up to $2,000,000 (the “Committed Amount”) for the Trust with respect to all of the Funds. The Agreement further limits the amount that any Fund may borrow subject to the requirements specified by the 1940 Act, which generally permits a fund to borrow and pledge its shares to secure such borrowing, provided, that immediately thereafter there is asset coverage of at least 300% for all borrowings by a fund from a bank. If borrowings exceed this 300% asset coverage requirement by reason of a decline in net assets of a fund, the fund will reduce its borrowings within three days to the extent necessary to comply with the 300% asset coverage requirement. The 1940 Act also permits a fund to borrow for temporary purposes only in an amount not exceeding 5% of the value of its total assets at the time when the loan is made. The terms of the agreement include a non-refundable commitment fee annually in an amount equal to $2,000. Any principal balance outstanding bears interest at the prime rate in effect at the time plus 0% (prior to August 2017 the interest rate was the London Interbank Offered Rate in effect at that time plus 1.90%) and any amounts not drawn will be assessed unused fees at the rate 0.25% (prior to August 2017 the unused fee rate was 0.40%).
The average amount of borrowings for the days which the Funds borrowed and the average interest rate on those borrowings by the Funds during the fiscal year ended October 31, 2017, were as follows:
| | | | | | | | |
| | | Average Principal | | | Average Interest Rate | |
Australia/New Zealand Fund | | $ | 104,142 | | | | 2.98 | % |
Japan Fund | | $ | 84,627 | | | | 2.69 | % |
During the fiscal year ended October 31, 2017, the Australia/New Zealand Fund and Japan Fund paid $139 and $63 in interest on borrowings, respectively. There were no borrowings outstanding under the Agreement as of October 31, 2017. The Funds only utilize the line of credit for draws greater than $50,000.
Note 10 – Contractual Obligations
Under the Funds’ organizational documents, its Trustees and Officers are indemnified against certain liabilities arising out of the performance of their duties to the Funds. In the normal course of business, the Funds enter into contracts that contain various representations and warranties and provide general indemnifications. The Funds’ maximum exposure under these
46
| | |
| | ANNUAL REPORT 2017 |
NOTES TO FINANCIAL STATEMENTS – October 31, 2017 (Continued)
arrangements is dependent on future claims against the Funds and is presently unknown. Currently however, the Funds expect the risk of loss to be remote.
Note 11 – Concentration of Market Risk
The Australia/New Zealand Fund has a majority of its investments in securities issued by Australian and New Zealand issuers, the Africa Fund invests primarily in securities issued by African issuers and the Japan Fund invests primarily in securities of Japanese issuers. Investing in companies from specific geographic regions, such as Australia, New Zealand, Africa or Japan, may pose additional risks inherent to a region’s economic and political situation. These events will not necessarily affect the U.S. economy or similar issuers located in the U.S. In addition, many of the investments in Australia, New Zealand, Africa or Japan are denominated in foreign currencies. As a result, changes in the values of these currencies compared to the U.S. dollar may affect (positively or negatively) the value of the Funds’ investments. These events may happen separately from, and in response to, events that do not otherwise affect the values of the securities in the issuers’ home countries.
The Africa Fund may be exposed to additional risks by focusing its investments on issuers in African countries to which other funds invested in securities of issuers in a broader region may not be exposed. The Fund is highly dependent on the state of economics of countries throughout Africa and, in particular Sub-Saharan countries. Changes in economics, tax policies, inflation rates, governmental instability, war or other political or economic factors may affect (positively or negatively) the Fund’s investments.
A large portion of investments held by the Real Estate Securities Fund are considered investments in the real estate sector of the market, which may include REITs. Investing in REITs involves certain unique risks in addition to those risks associated with investing in the real estate industry in general. Equity REITs may be affected by changes in the value of the underlying property owned by the REITs, while mortgage REITs may be affected by the quality of any credit extended. REITs are dependent upon management skills, are not diversified, are subject to heavy cash flow dependency, default by borrowers and self-liquidation. REITs are also subject to the possibilities of failing to qualify for tax-free pass through of income and maintaining their exemption from registration under the 1940 Act. Investing in a single market sector may be riskier than investing in a variety of market sectors.
Note 12 – Subsequent Events
Management of the Funds have evaluated the need for disclosures resulting from subsequent events through the date these financial statements were issued.
Subsequent to the period end, income and capital gain distributions were made to the shareholders of certain Commonwealth Funds after October 31, 2017, meeting the criteria of a subsequent event. The record date of the distribution was December 14, 2017, with an ex-date of December 15, 2017 and a payable date of December 15, 2017. The Funds’ distribution type and amount are listed as follows:
| | | | | | | | | | |
| Fund Name | | Distribution Type | | Rate | | | Amount | |
Australia/New Zealand Fund | | Income | | $ | 0.080397 | | | $ | 126,836 | |
Africa Fund | | Income | | | 0.039973 | | | | 12,441 | |
Real Estate Securities Fund | | Short-Term Capital Gain | | | 0.023911 | | | | 16,419 | |
Real Estate Securities Fund | | Long-Term Capital Gain | | | 0.034598 | | | | 23,758 | |
47
| | |
| | ANNUAL REPORT 2017 |
REPORT OF INDEPENDENT REGISTERED PUBLIC ACCOUNTING FIRM

To the Shareholders and Board of Trustees of
Commonwealth International Series Trust
We have audited the accompanying statements of assets and liabilities of Commonwealth Australia/New Zealand Fund, Africa Fund, Commonwealth Japan Fund, Commonwealth Global Fund and Commonwealth Real Estate Securities Fund, each a series of shares of beneficial interest in Commonwealth International Series Trust (the “Funds”), including the schedules of investments, as of October 31, 2017, and the related statements of operations for the year then ended, the statements of changes in net assets for each of the years in the two-year period then ended and the financial highlights for each of the years in the five-year period then ended. These financial statements and financial highlights are the responsibility of the Funds’ management. Our responsibility is to express an opinion on these financial statements and financial highlights based on our audits.
We conducted our audits in accordance with the standards of the Public Company Accounting Oversight Board (United States). Those standards require that we plan and perform the audits to obtain reasonable assurance about whether the financial statements and financial highlights are free of material misstatement. An audit includes examining, on a test basis, evidence supporting the amounts and disclosures in the financial statements. Our procedures included confirmation of securities owned as of October 31, 2017 by correspondence with the custodian and brokers. An audit also includes assessing the accounting principles used and significant estimates made by management, as well as evaluating the overall financial statement presentation. We believe that our audits provide a reasonable basis for our opinion.
In our opinion, the financial statements and financial highlights referred to above present fairly, in all material respects, the financial position of Commonwealth Australia/New Zealand Fund, Africa Fund, Commonwealth Japan Fund, Commonwealth Global Fund and Commonwealth Real Estate Securities Fund as of October 31, 2017, and the results of their operations for the year then ended, the changes in their net assets for each of the years in the two-year period then ended and their financial highlights for each of the years in the five-year period then ended, in conformity with accounting principles generally accepted in the United States of America.

BBD, LLP
Philadelphia, Pennsylvania
December 27, 2017
48
| | |
| | ANNUAL REPORT 2017 |
ADDITIONAL INFORMATION – October 31, 2017 (Unaudited)
Table of Shareholder Expenses
As a shareholder of the Funds, you incur ongoing costs, including management fees, distribution and service fees, and other Fund expenses. This example is intended to help you understand your ongoing costs (in dollars) of investing in the Funds and compare these costs with the ongoing costs of investing in other mutual funds.
The example is based on an investment of $1,000 invested at the beginning of the period and held for the entire period from May 1, 2017 through October 31, 2017.
Actual Expenses
The table below provides information about actual account values and actual expenses. You may use the information below, together with the amount you invested, to estimate the expenses that you paid over the period. Simply divide your account value by $1,000 (for example, an $8,600 account value divided by $1,000 = 8.6), then multiply the result by the number in the table under the heading entitled ‘‘Expenses Paid During Period’’ to estimate the expenses you paid on your account during this period.
| | | | | | | | | | | | | | | | |
| | | Beginning
Account Value
5/1/2017 | | | Ending
Account Value
10/31/2017 | | | Expenses Paid
During Period*
5/1/17 – 10/31/17 | | | Expense Ratio
During Period*
5/1/17 – 10/31/17 | |
Australia/New Zealand Fund | | $ | 1,000.00 | | | $ | 1,033.90 | | | $ | 13.00 | | | | 2.54 | % |
Africa Fund | | | 1,000.00 | | | | 1,033.30 | | | | 8.97 | | | | 1.75 | % |
Japan Fund | | | 1,000.00 | | | | 1,104.00 | | | | 9.28 | | | | 1.75 | % |
Global Fund | | | 1,000.00 | | | | 1,060.90 | | | | 12.83 | | | | 2.47 | % |
Real Estate Securities Fund | | | 1,000.00 | | | | 1,058.40 | | | | 13.23 | | | | 2.55 | % |
Hypothetical Example for Comparison Purposes
The table below provides information about hypothetical account values and hypothetical expenses based on each Fund’s actual expense ratio and an assumed rate of return of 5% per year before expenses, which is not the Fund’s actual return. The hypothetical account values and expenses may not be used to estimate the actual ending account balance or expenses you paid for the period. You may use this information to compare this 5% hypothetical example with the 5% hypothetical examples that appear in the shareholder reports of other funds.
Please note that the expenses shown in the table are meant to highlight your ongoing costs only and do not reflect any transactional costs, such as sales charges (loads), short-term redemption or exchange fees. Therefore, the table is useful in comparing ongoing costs only, and will not help you determine the relative total costs of owning different funds. In addition, if these transactional costs were included, your costs would have been higher.
| | | | | | | | | | | | | | | | |
| | | Beginning
Account Value
5/1/2017 | | | Ending
Account Value
10/31/2017 | | | Expenses Paid
During Period*
5/1/17 – 10/31/17 | | | Expense Ratio
During Period*
5/1/17 – 10/31/17 | |
Australia/New Zealand Fund | | $ | 1,000.00 | | | $ | 1,012.42 | | | $ | 12.86 | | | | 2.54 | % |
Africa Fund | | | 1,000.00 | | | | 1,016.38 | | | | 8.89 | | | | 1.75 | % |
Japan Fund | | | 1,000.00 | | | | 1,016.38 | | | | 8.89 | | | | 1.75 | % |
Global Fund | | | 1,000.00 | | | | 1,012.75 | | | | 12.53 | | | | 2.47 | % |
Real Estate Securities Fund | | | 1,000.00 | | | | 1,012.35 | | | | 12.94 | | | | 2.55 | % |
| * | Expenses are equal to the average account value times the Fund’s annualized expense ratio multiplied by 184 (the number of days in the most recent fiscal half-year) divided by 365 (the number of days in the fiscal year) to reflect the one-half year period. |
49
| | |
| | ANNUAL REPORT 2017 |
ADDITIONAL INFORMATION – October 31, 2017 (Unaudited) – (Continued)
Disclosure of Portfolio Holdings
The Funds file their complete schedule of portfolio holdings with the Securities and Exchange Commission (the ‘‘Commission’’) for the first and third quarters of each fiscal year on Form N-Q. The Funds’ Forms N-Q are available on the Commission’s website at http://www.sec.gov. The Funds’ Forms N-Q may be reviewed and copied at the Commission’s Public Reference Room in Washington, DC. Information on the operation of the Commission’s Public Reference Room may be obtained by calling 800-SEC-0330.
Proxy Voting
A description of the policies and procedures that the Funds use to determine how to vote proxies relating to portfolio securities is available without charge, upon request, by calling 888-345-1898, and on the Commissions website at http://www.sec.gov.
Information regarding how the Funds voted proxies relating to portfolio securities during the most recent 12-month period ended June 30 is available without charge, upon request, by calling 888-345-1898, and on the Commission’s website at http://www.sec.gov.
Additional Federal Income Tax Information
The Form 1099-DIV you receive in January 2018 will show the tax status of all distributions paid to your account in calendar year 2017. Shareholders are advised to consult their own tax adviser with respect to the tax consequences of their investment in the Fund. As required by the Internal Revenue Code and/or regulations, shareholders must be notified regarding the status of qualified dividend income for individuals and the dividends received deduction for corporations.
Qualified Dividend Income
The Australia/New Zealand Fund and Africa Fund designates approximately 100% and 100%, respectively, or up to the maximum amount of such dividends allowable pursuant to the Internal Revenue Code, as qualified dividend income eligible for the reduced tax rate of 15%.
For the year ended October 31, 2017, Global Fund designated $627,731 as 20% long-term capital gain distribution.
Dividends Received Deduction
Corporate shareholders are generally entitled to take the dividends received deduction on the portion of the Fund’s dividend distribution that qualifies under tax law. For the Africa Fund’s calendar year 2017 ordinary income dividends, 24% qualifies for the corporate dividends received deduction.
Foreign Tax Credit Pass Through
The Funds intend to elect to pass through to shareholders the income tax credit for taxes paid to foreign countries. The Australia/New Zealand Fund and Africa Fund foreign source income per share was $0.55 and $0.18, respectively, and the foreign tax expense per share was $0.09 and $0.04, respectively. The pass-through of the foreign tax credit will only affect those persons who are shareholders on the dividend record date in October 2017. These shareholders will receive more detailed information along with the 2017 Form 1099-DIV.
50
| | |
| | ANNUAL REPORT 2017 |
TRUSTEES AND OFFICERS – October 31, 2017 (Unaudited)
Overall responsibility for management of the Funds rests with the Board of Trustees. The names of the Trustees and Officers of the Funds, their addresses, ages and principal occupations during the past five years are provided in the tables below. Trustees who are deemed ‘‘interested persons”, as defined in the 1940 Act, are included in the table titled, ‘‘Interested Trustees.’’ Trustees who are not ‘‘interested persons’’ are referred to as Independent Trustees. The Funds’ Statement of Additional Information (“SAI”) includes additional information about the Funds’ Trustees and is available, without charge and upon request, by calling 888-345-1898.
| | | | | | | | | | | | |
| Name, Address and Age | | Position(s)
With the Fund | | Term of Office/
Length of
Time Served | | Principal Occupation(s)
for the Past 5 Years | | Number of
Portfolios in
the Trust Overseen
by Trustee/Officer(1) | | | Other
Directorships
Held By
Trustee/Officer |
| INTERESTED TRUSTEES: | | | | | | | | | | | | |
Robert Scharar(2) 791 Town & Country Blvd, Suite 250 Houston, TX 77024-3925 Birth year: 1948 | | President, Interested Trustee | | Indefinite until Successor elected and qualified; since 2000 | | Investment manager / Attorney / CPA; President, FCA Corp (investment advisor), 1975 to present. | | | 5 | | | See Below(3) |
| INDEPENDENT TRUSTEES: | | | | | | | | | | | | |
John Akard, Jr. 791 Town & Country Blvd, Suite 250 Houston, TX 77024-3925 Birth year: 1966 | | Independent Trustee | | Indefinite until Successor elected and qualified; since 2000 | | Attorney-CPA, Owner, John Akard Jr. P.C. (and its predecessor) (law firm), 1996 to present; Shareholder (2014 to present) and of Counsel (1999 to 2014), Coplen & Banks, P.C. (and its predecessor) (law firm). | | | 5 | | | None |
Kathleen Kelly 791 Town & Country Blvd,
Suite 250 Houston, TX 77024-3925 Birth year: 1952 | | Independent Trustee | | Indefinite until Successor elected and qualified; since 2000 | | Honorary Consul, New Zealand Consulate, 1995 to 2014; Owner, International Protocol Advisors (consulting services), August 1992 to present. | | | 5 | | | None |
Jack Ewing 791 Town & Country Blvd, Suite 250 Houston, TX 77024-3925 Birth year: 1939 | | Independent Trustee | | Indefinite until Successor elected and qualified; since 2000 | | Adjunct Economics Professor, University of Houston-Downtown, 2005 to 2015; Adjunct Professor, Lonestar College, 2001 to 2011; Professor, Houston Community College, September 2000 to May 2011. | | | 5 | | | Member, Board
of Directors of
the Japan-
America
Society of
Houston
(a non-profit
organization) |
| (1) | The five (5) portfolios comprising the Trust include the five mutual funds covered by this annual report. |
| (2) | Robert Scharar is considered an ‘‘interested person’’ of the Funds’ as defined in the 1940 Act, as amended, because he is an officer of the Trust and an officer of the Trust’s investment advisor. |
| (3) | Mr. Scharar is also an officer, director and/or manager of the following companies: NICO Holdings, Ltd. (Malawi), Africap, LLC, First Commonwealth Holdings Corporation, First Commonwealth Mortgage Trust, Holly Mortgage Trust, Ivy Realty Trust, Nashville Properties, Inc., subsidiary companies at some of the above and other closely held entities. |
51
| | |
| | ANNUAL REPORT 2017 |
TRUSTEES AND OFFICERS – October 31, 2017 (Unaudited)
| | | | | | | | | | | | |
| Name, Address and Age | | Position(s)
With Fund | | Term of Office/
Length of
Time Served | | Principal Occupation(s)
for the Past 5 Years | | Number of
Portfolios in
the Trust Overseen
by Trustee/Officer | | | Other
Directorships Held By
Trustee/Officer |
| OFFICERS: | | | | | | | | | | | | |
Zachary P. Richmond 225 Pictoria Drive, Suite 450 Cincinnati, OH 45246 Birth year: 1980 | | Treasurer | | Since 2015 | | Assistant Vice President, Associate Director of Financial Administration, Ultimus Fund Solutions, LLC (December 2015 to present); Assistant Vice President, Fund Administration, Huntington Asset Services, Inc. (n/k/a Ultimus Asset Services, LLC) (January 2011 to December 2015). | | | N/A | | | Treasurer and
Chief Financial
Officer, Unified
Series Trust &
Capitol Series
Trust (August
2014 to
present). |
Wesley Yuhnke 791 Town & Country Blvd. Suite 250 Houston, TX 77024-3925 Birth year: 1979 | | Executive Vice President | | Since 2013 | | Portfolio manager, FCA Corp., 2002—present. | | | N/A | | | N/A |
John H. Lively 11300 Tomahawk Creek Parkway, Suite 310 Leawood, Kansas 66211 Birth year: 1969 | | Secretary | | Since 2008 | | Attorney, The Law Offices of John H. Lively & Associates, Inc. (law firm) March 2010 to present; Attorney, Husch Blackwell Sanders LLP (law firm), March 2007 to February 2010; Managing Attorney, Raymond James Financial (financial services), September 2005 to March 2007. | | | N/A | | | N/A |
Bonnie Scott 791 Town & Country Blvd, Suite 250 Houston, TX 77024-3925 Birth year: 1949 | | Assistant Secretary | | Since 2003 | | Administrator, FCA Corp (investment advisor), 1998 to present. | | | N/A | | | N/A |
Stephen E. Fodo 791 Town & Country Blvd. Suite 250 Houston, TX 77024-3925 Birth year: 1942 | | CCO | | Since 2004 | | Independent Consultant, January 2000 to present; Advisory Director, Ingenero Inc., Engineering and Consulting Services, from January 2002 to present. | | | N/A | | | N/A |
52
| | |
| | ANNUAL REPORT 2017 |
NOTICE OF PRIVACY POLICY & PRACTICES (Unaudited)
Commonwealth International Series Trust (the ‘‘Trust’’) recognizes and respects the privacy expectations of our customers1. We provide this notice to you so that you will know what kinds of information we collect about our customers and the circumstances in which that information may be disclosed to third parties who are not affiliated with the Trust.
Collection of Customer Information
We collect nonpublic personal information about our customers from the following sources:
| | • | | Account Applications and other forms, which may include a customer’s name, address, social security number, and information about a customer’s investment goals and risk tolerance; |
| | • | | Account History, including information about the transactions and balances in a customer’s accounts; and |
| | • | | Correspondence, including written, telephonic or electronic, between a customer and the Trust or service providers to the Trust. |
Disclosure of Customer Information
We may disclose all of the consumer information outlined above to third parties who are not affiliated with the Trust:
| | • | | as permitted by law – for example with service providers who maintain or service shareholder accounts for the Trust or to a shareholder’s broker or agent; |
| | • | | to perform marketing services on our behalf or pursuant to a joint marketing agreement with another financial institution. |
Security of Customer Information
We require service providers to the Trust:
| | • | | to maintain policies and procedures designed to assure only appropriate access to, and use of information about customers of the Trust; and |
| | • | | to maintain physical, electronic and procedural safeguards that comply with federal standards to guard nonpublic personal information of customers of the Trust. |
We will adhere to the policies and practices described in this notice regardless of whether you are a current or former customer of the Trust.
| 1 | For purposes of this notice, the terms ‘‘customer’’ or ‘‘customers’’ includes both individual shareholders of the Trust and individuals who provide nonpublic personal information to the Trust, but do not invest in Trust shares. |
53
| | (a) | The Registrant has adopted a code of ethics (the “Code”) that applies to the Registrant’s principal executive officer and principal financial officer. This Code is included as an Exhibit. |
| | (b) | During the period covered by the report, with respect to the Registrant’s Code that applies to its principal executive officer and principal financial officer, there have been no amendments to, nor any waivers granted from, a provision that relates to any element of the Code definition enumerated in paragraph (b) of this Item 2. |
| Item 3. | Audit Committee Financial Expert. |
3(a)(1) The Registrant’s board of trustees has determined that the Registrant has a least one audit committee financial expert serving on its audit committee.
3(a)(2) The audit committee financial expert is John Akard, Jr., who is “independent” for purposes of this Item 3 of Form N-CSR.
| Item 4. | Principal Accountant Fees and Services. |
The aggregate fees billed for professional services by BBD, LLP during the fiscal year 2017 and 2016 were as follows:
(a) Audit Fees for Registrant.
| | | | |
Fiscal year ended October 31, 2017 | | $ | 62,500 | |
Fiscal year ended October 31, 2016 | | $ | 62,500 | |
(b) Audit-Related Fees for Registrant. These fees were billed by the Registrant’s independent auditors for assurance and related services that were reasonably related to the performance of the audit of the Registrant’s financial statements.
| | | | |
Fiscal year ended October 31, 2017 | | $ | 0 | |
Fiscal year ended October 31, 2016 | | $ | 0 | |
(c) Tax Fees for Registrant. These fees were billed for professional services rendered by the Registrant’s independent auditors for tax compliance, tax advice and tax planning.
| | | | |
Fiscal year ended October 31, 2017 | | $ | 7,500 | |
Fiscal year ended October 31, 2016 | | $ | 7,500 | |
(d) All Other Fees.
| | | | |
Fiscal year ended October 31, 2017 | | $ | 0 | |
Fiscal year ended October 31, 2016 | | $ | 0 | |
(e) Audit Committee’s pre-approval policies and procedures.
| | (1) | The audit committee has adopted pre-approval policies and procedures that require the audit committee to pre-approve all audit and non-audit services of the Registrant, including services provided to the Registrant’s investment adviser or any entity controlling, controlled by or under common control with the Registrant’s investment adviser that provides ongoing services to the Registrant with respect to any engagement that directly relates to the operations and financial reporting of the Registrant. |
| | (2) | Services approved pursuant to paragraph (c)(7)(i)(C) of Rule 2-01 of Regulation S-X: 100% of these fees were approved by the Registrant’s Audit Committee as required pursuant to paragraph (c)(7)(ii) of Rule 2-01 of Regulation S-X. |
(f) None.
(g) The aggregate non-audit fees billed by the registrant’s accountant for services rendered to the registrant, and rendered to the registrant’s investment adviser (not including any sub-adviser whose role is primarily portfolio management and is subcontracted with or overseen by another investment adviser), and any entity controlling, controlled by, or under common control with the adviser that provides ongoing services to the registrant:
| | | | | | | | |
| | | Registrant | | | Adviser | |
FY 2017 | | $ | 7,500 | | | $ | 0 | |
FY 2016 | | $ | 7,500 | | | $ | 0 | |
(h) Not applicable.
| Item 5. | Audit Committee of Listed Registrants. |
Not applicable.
| Item 6. | Schedule of Investments. |
| | (a) | Included as part of the report to shareholders filed under Item 1 of this Form N-CSR. |
| Item 7. | Disclosure of Proxy Voting Policies and Procedures for Closed-End Management Investment Companies. |
Not applicable to open-end management investment companies.
| Item 8. | Portfolio Managers of Closed-End Management Investment Companies. |
Not applicable to open-end management investment companies.
| Item 9. | Purchases of Equity Securities by Closed-End Management Investment Company and Affiliated Purchasers. |
Not applicable to open-end management investment companies.
| Item 10. | Submission of Matters to a Vote of Security Holders. |
None.
| Item 11. | Controls and Procedures. |
| (a) | The Registrant’s principal executive officer and principal financial officer have reviewed the Registrant’s disclosure controls and procedures (as defined in Rule 30a-3(c) under the Investment Company Act of 1940, as amended, (the “Act”)) as of a date within 90 days of the filing of this report, as required by Rule 30a-3(b) under the Act. Based on their review, such officers have concluded that the disclosure controls and procedures were effective in ensuring that information required to be disclosed in this report was appropriately recorded, processed, summarized and reported within the time periods specified by the Securities and Exchange Commission’s rules and forms. |
| (b) | There were no changes in the Registrant’s internal control over financial reporting (as defined in Rule 30a-3(d) under the Act (17 CFR 270.30a-3(d)) that occurred during the Registrant’s second fiscal quarter of the period covered by this report that materially affected, or were reasonably likely to materially affect, the Registrant’s internal control over financial reporting. |
| Item 12. | Disclosure of Securities Lending Activities for Closed-End Management Investment Companies. |
Not applicable
(a) (1) Code of Ethics. The code of ethics that is the subject of the disclosure required by Item 2 is attached hereto.
(a) (2) Certifications required pursuant to Section 30a-2(a) of the Act are attached hereto.
(a) (3) Not applicable to open-end management investment companies.
(b) Certifications pursuant to Section 30a-2(b) of the Act are furnished herewith.
SIGNATURES
Pursuant to the requirements of the Securities Exchange Act of 1934 and the Investment Company Act of 1940, the registrant
has duly caused this report to be signed on its behalf by the undersigned, thereunto duly authorized.
(Registrant) Commonwealth International Series Trust
| | |
| |
| By (Signature and Title) | | /s/ Robert Scharar |
| | Robert Scharar, President |
Pursuant to the requirements of the Securities Exchange Act of 1934 and the Investment Company Act of 1940, this report has been signed below by the following persons on behalf of the registrant and in the capacities and on the dates indicated.
| | |
| |
| By (Signature and Title) | | /s/ Robert Scharar |
| | Robert Scharar, President |
| | |
| |
| By (Signature and Title) | | /s/ Zachary P. Richmond |
| | Zachary P. Richmond, Treasurer |