UNITED STATES
SECURITIES AND EXCHANGE COMMISSION
Washington, D.C. 20549
Form N-CSR
CERTIFIED SHAREHOLDER REPORT OF
REGISTERED MANAGEMENT INVESTMENT COMPANIES
Investment Company Act file number: 811-4676
Harbor Funds
(Exact name of Registrant as specified in charter)
111 South Wacker Drive, 34th Floor
Chicago, Illinois 60606-4302
(Address of principal executive offices) (Zip code)
Charles F. McCain, Esq. HARBOR FUNDS 111 South Wacker Drive, 34th Floor Chicago, Illinois 60606-4302 | Christopher P. Harvey, Esq. DECHERT LLP One International Place – 40th Floor 100 Oliver Street Boston, MA 02110-2605 |
(Name and address of agent for service)
Registrant’s telephone number, including area code: (312) 443-4400
Date of fiscal year end: April 30
Date of reporting period: April 30, 2023
ITEM 1 – REPORTS TO STOCKHOLDERS
The following are copies of reports transmitted to shareholders pursuant to Rule 30e-1 under the Investment Company Act of 1940, as amended (the “1940 Act”) (17 CFR 270.30e-1):
Semi-Annual Report
Harbor Funds
April 30, 2023
Harbor Capital Appreciation Fund Harbor Convertible Securities Fund Harbor Core Bond Fund Harbor Core Plus Fund Harbor Disruptive Innovation Fund Harbor Diversified International All Cap Fund Harbor Global Leaders Fund Harbor International Fund Harbor International Core Fund (formerly, Harbor Overseas Fund) Harbor International Growth Fund Harbor International Small Cap Fund Harbor Large Cap Value Fund Harbor Mid Cap Fund Harbor Mid Cap Value Fund Harbor Small Cap Growth Fund Harbor Small Cap Value Fund |
Table of Contents
1 | |
3 | |
7 | |
13 | |
20 | |
22 | |
29 | |
31 | |
38 | |
47 | |
50 | |
53 | |
55 | |
57 | |
60 | |
62 | |
65 | |
71 | |
75 | |
87 | |
120 | |
132 | |
137 | |
137 | |
137 | |
137 | |
147 |
This material is intended for the Funds’ shareholders. It may be distributed to prospective investors only if it is preceded or accompanied by the current prospectus. Prospective investors should carefully consider the investment objectives, risks, charges and expenses of a Harbor Fund before investing. To obtain a summary prospectus or prospectus for this and other information, visit harborcapital.com or call 800-422-1050. Read it carefully before investing.
Harbor Funds Distributors, Inc. is the Distributor of the Harbor Funds.
Harbor Capital Appreciation Fund
Portfolio of Investments—April 30, 2023 (Unaudited)
Subadvisor: Jennison Associates LLC
Sector Allocation (% of investments)
Portfolio of Investments
Value and Cost in Thousands
COMMON STOCKS—99.1% | |||
Shares | Value | ||
AUTOMOBILES—3.6% | |||
4,859,744 | Tesla Inc.* | $798,504 | |
BIOTECHNOLOGY—1.3% | |||
846,344 | Vertex Pharmaceuticals Inc.* | 288,375 | |
BROADLINE RETAIL—7.4% | |||
11,642,216 | Amazon.com Inc.* | 1,227,671 | |
348,329 | MercadoLibre Inc. (Brazil)* | 444,987 | |
1,672,658 | |||
CAPITAL MARKETS—1.7% | |||
341,055 | Goldman Sachs Group Inc. | 117,132 | |
329,501 | Moody's Corp. | 103,173 | |
442,896 | S&P Global Inc. | 160,585 | |
380,890 | |||
CONSUMER FINANCE—0.5% | |||
682,450 | American Express Co. | 110,106 | |
CONSUMER STAPLES DISTRIBUTION & RETAIL—2.2% | |||
1,003,628 | Costco Wholesale Corp. | 505,046 | |
ENERGY EQUIPMENT & SERVICES—1.6% | |||
7,268,489 | Schlumberger Ltd. | 358,700 | |
ENTERTAINMENT—1.4% | |||
850,115 | Netflix Inc.* | 280,478 | |
902,041 | Roblox Corp.* | 32,113 | |
312,591 | |||
FINANCIAL SERVICES—7.5% | |||
179,366 | Adyen NV (Netherlands)*,1 | 288,215 | |
1,658,828 | Mastercard Inc. Class A | 630,404 | |
3,345,549 | Visa Inc. | 778,610 | |
1,697,229 | |||
GROUND TRANSPORTATION—1.7% | |||
12,164,173 | Uber Technologies Inc.* | 377,698 |
COMMON STOCKS—Continued | |||
Shares | Value | ||
HEALTH CARE EQUIPMENT & SUPPLIES—2.1% | |||
1,738,442 | Dexcom Inc.* | $210,943 | |
877,329 | Intuitive Surgical Inc.* | 264,269 | |
475,212 | |||
HEALTH CARE PROVIDERS & SERVICES—2.0% | |||
891,692 | UnitedHealth Group Inc. | 438,793 | |
HOTELS, RESTAURANTS & LEISURE—3.0% | |||
1,717,557 | Airbnb Inc.* | 205,540 | |
79,117 | Chipotle Mexican Grill Inc.* | 163,584 | |
1,282,570 | Marriott International Inc. | 217,190 | |
825,130 | Starbucks Corp. | 94,304 | |
680,618 | |||
INTERACTIVE MEDIA & SERVICES—6.8% | |||
5,571,697 | Alphabet Inc. Class A* | 598,066 | |
5,554,664 | Alphabet Inc. Class C* | 601,126 | |
1,406,165 | Meta Platforms Inc.* | 337,929 | |
1,537,121 | |||
IT SERVICES—1.1% | |||
1,627,450 | Snowflake Inc.* | 240,993 | |
LIFE SCIENCES TOOLS & SERVICES—1.6% | |||
753,270 | Danaher Corp. | 178,457 | |
339,979 | Thermo Fisher Scientific Inc. | 188,654 | |
367,111 | |||
MEDIA—0.5% | |||
1,883,209 | Trade Desk Inc.* | 121,166 | |
PERSONAL CARE PRODUCTS—1.4% | |||
639,096 | L'Oreal SA (France) | 305,435 | |
PHARMACEUTICALS—6.7% | |||
3,599,040 | AstraZeneca plc ADR (United Kingdom)2 | 263,521 | |
1,840,850 | Eli Lilly & Co. | 728,719 | |
3,035,280 | Novo Nordisk AS ADR (Denmark)2 | 507,165 | |
1,499,405 |
1
Harbor Capital Appreciation Fund
Portfolio of Investments—Continued
Value and Cost in Thousands
COMMON STOCKS—Continued | |||
Shares | Value | ||
SEMICONDUCTORS & SEMICONDUCTOR EQUIPMENT—11.4% | |||
3,699,424 | Advanced Micro Devices Inc.* | $330,617 | |
474,865 | ASML Holding NV New York Registry Shares (Netherlands) | 302,423 | |
746,350 | Broadcom Inc. | 467,588 | |
5,262,319 | NVIDIA Corp. | 1,460,241 | |
2,560,869 | |||
SOFTWARE—13.8% | |||
923,573 | Adobe Inc.* | 348,704 | |
1,218,496 | Atlassian Corp. plc* | 179,923 | |
988,109 | Cadence Design Systems Inc.* | 206,960 | |
1,256,954 | CrowdStrike Holdings Inc.* | 150,898 | |
5,881,345 | Microsoft Corp. | 1,807,102 | |
1,551,122 | Salesforce.com Inc.* | 307,696 | |
246,111 | ServiceNow Inc.* | 113,068 | |
3,114,351 | |||
SPECIALIZED REITs—1.3% | |||
1,442,651 | American Tower Corp. | 294,863 | |
SPECIALTY RETAIL—4.1% | |||
739,562 | Home Depot Inc. | 222,268 | |
301,904 | O'Reilly Automotive Inc.* | 276,940 | |
3,126,743 | TJX Companies Inc. | 246,450 | |
303,934 | ULTA Beauty Inc.* | 167,598 | |
913,256 |
COMMON STOCKS—Continued | |||
Shares | Value | ||
TECHNOLOGY HARDWARE, STORAGE & PERIPHERALS—7.3% | |||
9,629,017 | Apple Inc. | $1,633,852 | |
TEXTILES, APPAREL & LUXURY GOODS—5.9% | |||
1,037,943 | Lululemon Athletica Inc.* | 394,346 | |
679,413 | LVMH Moet Hennessy Louis Vuitton SE (France) | 653,514 | |
2,164,497 | NIKE Inc. | 274,285 | |
1,322,145 | |||
WIRELESS TELECOMMUNICATION SERVICES—1.2% | |||
1,951,464 | T-Mobile US Inc.* | 280,816 | |
TOTAL COMMON STOCKS | |||
(Cost $12,856,821) | 22,287,803 | ||
PREFERRED STOCKS—0.7% | |||
(Cost $106,445) | |||
AUTOMOBILES—0.7% | |||
1,316,365 | Dr. Ing. h.c. F. Porsche AG (Germany)*,1 | 164,834 | |
TOTAL INVESTMENTS—99.8% | |||
(Cost $12,963,266) | 22,452,637 | ||
CASH AND OTHER ASSETS, LESS LIABILITIES—0.2% | 40,228 | ||
TOTAL NET ASSETS—100.0% | $22,492,865 |
FAIR VALUE MEASUREMENTS
As of April 30, 2023, the investments in Adyen NV, Dr. Ing. h.c.F. Porsche AG, L’Oreal SA, and LVMH Moet Hennessy Loius Vuitton SE (as disclosed in the preceding Portfolio of Investments) were classified as Level 2 and all other investments were classified as Level 1.
For more information on valuation inputs and their aggregation into the levels identified above, please refer to the Fair Value Measurements and Disclosures in Note 2 of the accompanying Notes to Financial Statements.
* | Non-income producing security |
1 | Securities purchased in a transaction exempt from registration under Rule 144A of the Securities Act of 1933. These securities may be resold in transactions exempt from registration, normally to qualified institutional buyers. The Fund has no right to demand registration of these securities. As of April 30, 2023, the aggregate value of these securities was $453,049 or 2% of net assets. |
2 | Depositary receipts such as American Depositary Receipts (ADRs), Global Depositary Receipts (GDRs) and other country specific depositary receipts are certificates evidencing ownership of shares of a foreign issuer. These certificates are issued by depositary banks and generally trade on an established market in the U.S. or elsewhere. |
The accompanying notes are an integral part of the Financial Statements.
2
Harbor Convertible Securities Fund
Portfolio of Investments—April 30, 2023 (Unaudited)
Subadvisor: BlueCove Limited
Sector Allocation (% of investments)
Portfolio of Investments
Principal Amounts, Value and Cost in Thousands
CONVERTIBLE BONDS—84.0% | |||
Principal Amount | Value | ||
AEROSPACE & DEFENSE—1.7% | |||
Axon Enterprise Inc. | |||
$ | 500 | 0.500%—12/15/20271 | $565 |
Virgin Galactic Holdings | |||
200 | 2.500%—02/01/20271 | 83 | |
648 | |||
AIRLINES—1.8% | |||
American Airlines Group Inc. | |||
200 | 6.500%—07/01/2025 | 223 | |
Jetblue Airways Corp. | |||
600 | 0.500%—04/01/2026 | 470 | |
693 | |||
AUTO COMPONENTS—0.9% | |||
Fisker Inc. | |||
200 | 2.500%—09/15/20261 | 89 | |
Patrick Industries Inc. | |||
300 | 1.750%—12/01/2028 | 272 | |
361 | |||
BIOTECHNOLOGY—5.2% | |||
Bridgebio Pharma Inc. | |||
600 | 2.500%—03/15/2027 | 436 | |
Exact Sciences Corp. | |||
300 | 0.375%—03/15/2027 | 274 | |
400 | 1.000%—01/15/2025 | 447 | |
721 | |||
Mannkind Corp. | |||
300 | 2.500%—03/01/2026 | 304 | |
Sarepta Therapeutics Inc. | |||
500 | 1.250%—09/15/20271 | 565 | |
2,026 | |||
CAPITAL MARKETS—2.3% | |||
Coinbase Global Inc. | |||
900 | 0.500%—06/01/2026 | 584 | |
New Mountain Finance Corp. | |||
200 | 7.500%—10/15/20251 | 202 |
CONVERTIBLE BONDS—Continued | |||
Principal Amount | Value | ||
CAPITAL MARKETS—Continued | |||
WisdomTree Investments | |||
$ | 100 | 4.250%—06/15/2023 | $108 |
894 | |||
COMMUNICATIONS EQUIPMENT—0.6% | |||
Infinera Corp. | |||
200 | 2.500%—03/01/2027 | 218 | |
CONSTRUCTION & ENGINEERING—0.7% | |||
Granite Construction Inc. | |||
200 | 2.750%—11/01/2024 | 257 | |
CONSUMER FINANCE—1.6% | |||
EZCorp Inc. | |||
400 | 3.750%—12/15/20291 | 397 | |
SoFi Technologies Inc. | |||
300 | 0.000%—10/15/20261,2 | 215 | |
612 | |||
DIVERSIFIED CONSUMER SERVICES—0.3% | |||
Stride Inc. | |||
100 | 1.125%—09/01/2027 | 105 | |
ELECTRICAL EQUIPMENT—1.0% | |||
Array Technologies Inc. | |||
300 | 1.000%—12/01/2028 | 315 | |
Sunrun Inc. | |||
100 | 0.000%—02/01/20262 | 68 | |
383 | |||
ELECTRONIC EQUIPMENT, INSTRUMENTS & COMPONENTS—1.7% | |||
Insight Enterprises Inc. | |||
200 | 0.750%—02/15/2025 | 356 | |
Itron Inc. | |||
200 | 0.000%—03/15/20262 | 168 | |
Par Technology Corp. | |||
200 | 1.500%—10/15/2027 | 154 | |
678 |
3
Harbor Convertible Securities Fund
Portfolio of Investments—Continued
Principal Amounts, Value and Cost in Thousands
CONVERTIBLE BONDS—Continued | |||
Principal Amount | Value | ||
ENERGY EQUIPMENT & SERVICES—1.6% | |||
Helix Energy Solutions | |||
$ | 300 | 6.750%—02/15/2026 | $396 |
Oil States International Inc. | |||
200 | 4.750%—04/01/2026 | 209 | |
605 | |||
ENTERTAINMENT—2.2% | |||
Cinemark Holdings Inc. | |||
100 | 4.500%—08/15/2025 | 141 | |
Liberty Media Corp. | |||
200 | 2.250%—08/15/20271 | 212 | |
Live Nation Entertainment Inc. | |||
500 | 2.000%—02/15/2025 | 487 | |
840 | |||
FINANCIAL SERVICES—0.8% | |||
Block Inc. | |||
400 | 0.000%—05/01/20262 | 330 | |
FOOD PRODUCTS—1.3% | |||
Chefs' Warehouse Inc | |||
100 | 2.375%—12/15/20281 | 101 | |
Post Holdings Inc. | |||
400 | 2.500%—08/15/20271 | 421 | |
522 | |||
HEALTH CARE EQUIPMENT & SUPPLIES—6.3% | |||
Alphatec Holdings Inc. | |||
400 | 0.750%—08/01/2026 | 413 | |
CONMED Corp. | |||
200 | 2.250%—06/15/20271 | 217 | |
Dexcom Inc. | |||
200 | 0.750%—12/01/2023 | 590 | |
Haemonetics Corp. | |||
600 | 0.000%—03/01/20262 | 514 | |
Insulet Corp. | |||
100 | 0.375%—09/01/2026 | 150 | |
Integer Holdings Corp. | |||
100 | 2.125%—02/15/20281 | 114 | |
Integra Lifesciences Holdings Corp. | |||
100 | 0.500%—08/15/2025 | 97 | |
Lantheus Holdings Inc. Co. | |||
200 | 2.625%—12/15/20271 | 266 | |
Mesa Laboratories Inc. | |||
100 | 1.375%—08/15/2025 | 92 | |
2,453 | |||
HEALTH CARE TECHNOLOGY—0.8% | |||
Teladoc Health Inc. | |||
400 | 1.250%—06/01/2027 | 321 | |
HOTELS, RESTAURANTS & LEISURE—10.0% | |||
Airbnb Inc. | |||
800 | 0.000%—03/15/20262 | 699 | |
Booking Holdings Inc. | |||
300 | 0.750%—05/01/2025 | 449 | |
Carnival Corp. Co. | |||
100 | 5.750%—10/01/2024 | 117 | |
Cracker Barrel Old Count | |||
300 | 0.625%—06/15/2026 | 267 | |
DraftKings Inc. | |||
500 | 0.000%—03/15/20282 | 363 |
CONVERTIBLE BONDS—Continued | |||
Principal Amount | Value | ||
HOTELS, RESTAURANTS & LEISURE—Continued | |||
NCL Corp. Ltd. | |||
$ | 100 | 1.125%—02/15/2027 | $73 |
600 | 2.500%—02/15/2027 | 455 | |
528 | |||
Royal Caribbean Cruises Ltd. | |||
400 | 2.875%—11/15/2023 | 409 | |
400 | 4.250%—06/15/2023 | 406 | |
100 | 6.000%—08/15/20251 | 153 | |
968 | |||
Shake Shack Inc. | |||
200 | 0.000%—03/01/20282 | 150 | |
The Cheesecake Factory Inc. | |||
400 | 0.375%—06/15/2026 | 335 | |
3,876 | |||
INDEPENDENT POWER AND RENEWABLE ELECTRICITY PRODUCERS—1.4% | |||
Ormat Technologies Inc. | |||
200 | 2.500%—07/15/20271 | 227 | |
Sunnova Energy International Inc. | |||
200 | 0.250%—12/01/2026 | 155 | |
200 | 2.625%—02/15/20281 | 163 | |
318 | |||
545 | |||
INTERACTIVE MEDIA & SERVICES—2.1% | |||
Liberty Tripadvisor Holdings Inc. | |||
400 | 0.500%—06/30/20511 | 312 | |
Snap Inc. | |||
700 | 0.000%—05/01/20272 | 511 | |
823 | |||
INTERNET & DIRECT MARKETING RETAIL—2.7% | |||
Etsy Inc. | |||
400 | 0.125%—10/01/2026 | 538 | |
Wayfair Inc. | |||
600 | 0.625%—10/01/2025 | 455 | |
100 | 1.000%—08/15/2026 | 66 | |
521 | |||
1,059 | |||
IT SERVICES—7.1% | |||
Block Inc. | |||
600 | 0.250%—11/01/2027 | 465 | |
Cloudflare Inc. | |||
700 | 0.000%—08/15/20262 | 581 | |
Fastly Inc. | |||
600 | 0.000%—03/15/20262 | 483 | |
Okta Inc. | |||
600 | 0.125%—09/01/2025 | 537 | |
400 | 0.375%—06/15/2026 | 339 | |
876 | |||
Shift4 Payments Inc. | |||
400 | 0.500%—08/01/2027 | 358 | |
2,763 | |||
LEISURE PRODUCTS—0.2% | |||
Peloton Interactive Inc. | |||
100 | 0.000%—02/15/20262 | 75 |
4
Harbor Convertible Securities Fund
Portfolio of Investments—Continued
Principal Amounts, Value and Cost in Thousands
CONVERTIBLE BONDS—Continued | |||
Principal Amount | Value | ||
MACHINERY—0.7% | |||
Greenbrier Cos. Inc. | |||
$ | 100 | 2.875%—04/15/2028 | $82 |
John Bean Technologies Corp. | |||
200 | 0.250%—05/15/2026 | 185 | |
267 | |||
MEDIA—1.4% | |||
Dish Network Corp. | |||
900 | 0.000%—12/15/20252 | 443 | |
200 | 3.375%—08/15/2026 | 95 | |
538 | |||
METALS & MINING—0.7% | |||
ATI Inc. | |||
100 | 3.500%—06/15/2025 | 254 | |
OIL, GAS & CONSUMABLE FUELS—1.9% | |||
Northern Oil And Gas Inc. | |||
200 | 3.625%—04/15/20291 | 227 | |
Peabody Energy Corp. | |||
200 | 3.250%—03/01/2028 | 291 | |
Pioneer Natural Resources Co. | |||
100 | 0.250%—05/15/2025 | 228 | |
746 | |||
PERSONAL CARE PRODUCTS—0.6% | |||
Beauty Health Co. | |||
300 | 1.250%—10/01/20261 | 247 | |
PHARMACEUTICALS—1.5% | |||
Collegium Pharma Inc. | |||
400 | 2.875%—02/15/20291 | 356 | |
Revance Therapeutics Inc. | |||
200 | 1.750%—02/15/2027 | 244 | |
600 | |||
REAL ESTATE MANAGEMENT & DEVELOPMENT—1.1% | |||
GEO Corrections Holdings Co. | |||
100 | 6.500%—02/23/20261 | 115 | |
Redfin Corp. | |||
400 | 0.000%—10/15/20252 | 295 | |
410 | |||
SEMICONDUCTORS & SEMICONDUCTOR EQUIPMENT—4.0% | |||
Enphase Energy Inc. | |||
100 | 0.250%—03/01/2025 | 211 | |
Impinj Inc. | |||
300 | 1.125%—05/15/2027 | 324 | |
MACOM Technology Solutions Holdings Inc. | |||
200 | 0.250%—03/15/2026 | 193 | |
Microchip Technology Inc. | |||
400 | 0.125%—11/15/2024 | 426 | |
ON Semiconductor Corp. | |||
200 | 0.000%—05/01/20272 | 295 | |
Wolfspeed Inc. | |||
100 | 1.750%—05/01/2026 | 121 | |
1,570 | |||
SOFTWARE—17.8% | |||
Alteryx Inc. | |||
400 | 1.000%—08/01/2026 | 335 |
CONVERTIBLE BONDS—Continued | |||
Principal Amount | Value | ||
SOFTWARE—Continued | |||
Bentley Systems Inc. | |||
$ | 500 | 0.125%—01/15/2026 | $473 |
200 | 0.375%—07/01/2027 | 169 | |
642 | |||
Blackline Inc. | |||
500 | 0.000%—03/15/20262 | 423 | |
Ceridian HCM Holding Inc. | |||
500 | 0.250%—03/15/2026 | 439 | |
Dropbox Inc. | |||
100 | 0.000%—03/01/20262 | 89 | |
Envestnet Inc. Co. | |||
400 | 0.750%—08/15/2025 | 373 | |
Guidewire Software Inc. | |||
500 | 1.250%—03/15/2025 | 483 | |
HubSpot Inc. | |||
100 | 0.375%—06/01/2025 | 156 | |
InterDigital Inc. | |||
300 | 3.500%—06/01/20271 | 327 | |
Microstrategy Inc. | |||
300 | 0.750%—12/15/2025 | 314 | |
Nutanix Inc. | |||
200 | 0.250%—10/01/2027 | 166 | |
Palo Alto Networks Inc. | |||
500 | 0.375%—06/01/2025 | 926 | |
100 | 0.750%—07/01/2023 | 205 | |
1,131 | |||
Pegasystems Inc. | |||
500 | 0.750%—03/01/2025 | 453 | |
Porch Group Inc. | |||
500 | 0.750%—09/15/20261 | 163 | |
Progress Software Corp. | |||
200 | 1.000%—04/15/2026 | 213 | |
Rapid7 Inc. | |||
100 | 2.250%—05/01/2025 | 105 | |
Splunk Inc. | |||
300 | 0.500%—09/15/2023 | 295 | |
700 | 1.125%—09/15/2025-06/15/2027 | 653 | |
948 | |||
Unity Software Inc. | |||
100 | 0.000%—11/15/20262 | 78 | |
Verint Systems Inc. | |||
100 | 0.250%—04/15/2026 | 89 | |
6,927 | |||
TOTAL CONVERTIBLE BONDS | |||
(Cost $33,459) | 32,646 | ||
CONVERTIBLE PREFERRED STOCKS—14.8% | |||
Shares | |||
AUTO COMPONENTS—1.1% | |||
3,700 | Aptiv plc (Jersey)—5.500% | 419 | |
BANKS—3.3% | |||
100 | Bank of America Corp—7.250%. | 118 | |
1,000 | Wells Fargo + Co—7.500%. | 1,168 | |
1,286 |
5
Harbor Convertible Securities Fund
Portfolio of Investments—Continued
Principal Amounts, Value and Cost in Thousands
CONVERTIBLE PREFERRED STOCKS—Continued | |||
Shares | Value | ||
CAPITAL MARKETS—0.9% | |||
5,800 | KKR + Co. Inc—6.000%. | $371 | |
CONSTRUCTION & ENGINEERING—0.0% | |||
14 | Fluor Corp.—6.500% | 16 | |
ELECTRIC UTILITIES—4.9% | |||
8,966 | American Electric Power—6.125% | 456 | |
4,800 | Nextera Energy Inc—6.219%. | 235 | |
14,000 | Nextera Energy Inc—6.926%. | 663 | |
3,700 | PG+E Corp—5.500%. | 555 | |
1,909 | |||
HEALTH CARE EQUIPMENT & SUPPLIES—1.0% | |||
5,700 | Becton Dickinson and Co—6.000%. | 288 | |
900 | Boston Scientific Corp.—5.500% | 113 | |
401 | |||
HOTEL & RESORT REITs—0.8% | |||
12,400 | RLJ Lodging Trust—1.950% | 299 |
CONVERTIBLE PREFERRED STOCKS—Continued | |||
Shares | Value | ||
HOTELS, RESTAURANTS & LEISURE—0.1% | |||
800 | Sabre Corp.—6.500% | $48 | |
INDEPENDENT POWER AND RENEWABLE ELECTRICITY PRODUCERS—0.8% | |||
3,400 | AES Corp.—6.875% | 306 | |
MACHINERY—1.0% | |||
3,400 | RBC Bearings Inc.—5.000% | 376 | |
OIL, GAS & CONSUMABLE FUELS—0.9% | |||
7,200 | El Paso Energy Capital—4.750% | 334 | |
TOTAL CONVERTIBLE PREFERRED STOCKS | |||
(Cost $5,833) | 5,765 | ||
TOTAL INVESTMENTS—98.8% | |||
(Cost $39,292) | 38,411 | ||
CASH AND OTHER ASSETS, LESS LIABILITIES—1.2% | 479 | ||
TOTAL NET ASSETS—100.0% | $38,890 |
FAIR VALUE MEASUREMENTS
All investments as of April 30, 2023 (as disclosed in the preceding Portfolio of Investments) were classified as Level 2.
For more information on valuation inputs and their aggregation into the levels identified above, please refer to the Fair Value Measurements and Disclosures in Note 2 of the accompanying Notes to Financial Statements.
1 | Securities purchased in a transaction exempt from registration under Rule 144A of the Securities Act of 1933. These securities may be resold in transactions exempt from registration, normally to qualified institutional buyers. The Fund has no right to demand registration of these securities. As of April 30, 2023, the aggregate value of these securities was $5,738 or 15% of net assets. |
2 | Zero coupon bond |
The accompanying notes are an integral part of the Financial Statements.
6
Harbor Core Bond Fund
Portfolio of Investments—April 30, 2023 (Unaudited)
Subadvisor: Income Research + Management
Investment Allocation (% of investments)
Portfolio of Investments
Principal Amounts, Value and Cost in Thousands
ASSET-BACKED SECURITIES—10.0% | |||
Principal Amount | Value | ||
Aligned Data Centers LLC | |||
Series 2021-1A Cl. A2 | |||
$ | 385 | 1.937%—08/15/20461 | $342 |
American Tower Trust I | |||
Series 2028 Cl. 1 | |||
514 | 5.490%—03/15/20281 | 526 | |
AMSR Trust | |||
Series 2021-SFR3 Cl. A | |||
410 | 1.476%—10/17/20381 | 365 | |
BA Credit Card Trust | |||
Series 2022-A2 Cl. A2 | |||
366 | 5.000%—04/15/2028 | 371 | |
CF Hippolyta Issuer LLC | |||
Series 2020-1 Cl. A1 | |||
136 | 1.690%—07/15/20601 | 123 | |
DB Master Finance LLC | |||
Series 2021-1A Cl. A2I | |||
168 | 2.045%—11/20/20511 | 150 | |
Discover Card Execution Note Trust | |||
Series 2022-A4 Cl. A | |||
291 | 5.030%—10/15/2027 | 295 | |
Domino's Pizza Master Issuer LLC | |||
Series 2021-1A Cl. A2I | |||
481 | 2.662%—04/25/20511 | 417 | |
FirstKey Homes Trust | |||
Series 2020-SFR2 Cl. A | |||
359 | 1.266%—10/19/20371 | 327 | |
Series 2021-SFR1 | |||
372 | 1.538%—08/17/20381 | 331 | |
658 | |||
Ford Credit Auto Owner Trust | |||
Series 2020-1 Cl. A | |||
250 | 2.040%—08/15/20311 | 237 | |
GM Financial Consumer Automobile Receivables Trust | |||
Series 2022-3 Cl A4 | |||
288 | 3.710%—12/16/2027 | 283 | |
Home Partners of America Trust | |||
Series 2020-2 Cl. A | |||
259 | 1.532%—01/17/20411 | 222 |
ASSET-BACKED SECURITIES—Continued | |||
Principal Amount | Value | ||
Series 2022-1 | |||
$ | 541 | 3.930%—04/17/20391 | $517 |
739 | |||
Mercedes Benz Automobile Receivables Trust | |||
Series 2022-1 Cl. A4 | |||
362 | 5.250%—02/15/2029 | 371 | |
Navient Private Education Refi Loan Trust | |||
Series 2021-A Cl. A | |||
130 | 0.840%—05/15/20691 | 114 | |
Series 2021-BA Cl. A | |||
287 | 0.940%—07/15/20691 | 253 | |
367 | |||
NextGear Capital | |||
Series 2023 Cl. A | |||
322 | 5.740%—03/15/20281 | 331 | |
Oak Street Investment Grade Net Lease Fund | |||
Series 2020-1A Cl. A1 | |||
334 | 1.850%—11/20/20501 | 300 | |
Palmer Square CLO Ltd.2 | |||
Series 2013 Cl. 2A | |||
447 | 5.800% (3 Month USD LIBOR + 1.000) 10/17/20311,3 | 443 | |
Palmer Square Loan Funding Ltd. | |||
Series 2022-2A Cl. A1 | |||
342 | 5.930% (3 Month CME Term SOFR + 1.270) 10/15/20301,3 | 340 | |
PFS Financing Corp. | |||
Series 2022-D Cl. A | |||
232 | 4.270%—08/15/20271 | 229 | |
Series 2023 Cl. A | |||
522 | 5.800%—03/15/20281 | 535 | |
764 | |||
Progress Residential Trust | |||
Series 2019-SFR3 Cl. A | |||
441 | 2.271%—09/17/20361 | 420 | |
Series 2019-SFR4 Cl. A | |||
413 | 2.687%—10/17/20361 | 396 | |
816 | |||
Sabey Data Center Issuer LLC | |||
Series 2020-1 Cl. A2 | |||
202 | 3.812%—04/20/20451 | 193 |
7
Harbor Core Bond Fund
Portfolio of Investments—Continued
Principal Amounts, Value and Cost in Thousands
ASSET-BACKED SECURITIES—Continued | |||
Principal Amount | Value | ||
SBA Tower Trust | |||
Series 2022-1C | |||
$ | 230 | 6.599%—01/15/20281 | $242 |
Stack Infrastructure Issuer LLC | |||
Series 2019-2A Cl. A2 | |||
185 | 3.080%—10/25/20441 | 176 | |
Store Master Funding I-VII | |||
Series 2019-1 Cl. A1 | |||
164 | 2.820%—11/20/20491 | 150 | |
Series 2018-1A Cl. A1 | |||
193 | 3.960%—10/20/20481 | 188 | |
338 | |||
Taco Bell Funding LLC | |||
Series 2021-1A Cl. A2II | |||
380 | 2.294%—08/25/20511 | 320 | |
Texas Natural Gas Securitization | |||
Series 2041 Cl. 1 | |||
296 | 5.169%—04/01/2041 | 323 | |
Vantage Data Centers LLC | |||
Series 2020-2A Cl. A2 | |||
251 | 1.992%—09/15/20451 | 214 | |
Wendy's Funding LLC | |||
Series 2021-1A Cl. A2I | |||
200 | 2.370%—06/15/20511 | 169 | |
Series 2019-1A Cl. A2I | |||
372 | 3.783%—06/15/20491 | 351 | |
520 | |||
TOTAL ASSET-BACKED SECURITIES | |||
(Cost $10,954) | 10,564 | ||
COLLATERALIZED MORTGAGE OBLIGATIONS—6.8% | |||
Barclays Commercial Mortgage Trust | |||
Series 2022-C18 Cl. A5 | |||
357 | 5.710% (1 Month USD LIBOR + 1.040) 12/15/20553 | 379 | |
Benchmark Mortgage Trust | |||
Series 2021-B26 Cl. A3 | |||
387 | 2.391%—06/15/2054 | 340 | |
BX Commercial Mortgage Trust | |||
Series 2021-VOLT Cl. A | |||
403 | 5.160% (1 Month USD LIBOR + 0.700) 09/15/20361,3 | 390 | |
Series 2019-XL Cl. A | |||
409 | 5.510% (1 Month Term SOFR + + 1.034) 10/15/20361,3 | 404 | |
794 | |||
Commercial Mortgage Pass-Through Certificates | |||
Series 2014-CR21 Cl. A3 | |||
224 | 3.528%—12/10/2047 | 216 | |
Series 2014-UBS3 Cl. A3 | |||
441 | 3.546%—06/10/2047 | 430 | |
646 | |||
Commercial Mortgage Trust | |||
Series 2016-COR1 Cl. A3 | |||
387 | 2.826%—10/10/2049 | 361 | |
Flagstar Mortgage Trust | |||
Series 2021-8INV Cl. A3 | |||
330 | 2.500%—09/25/20511 | 273 | |
Freddie Mac Seasoned Credit Risk Transfer Trust | |||
Series 2020-2 Cl. MA | |||
149 | 2.000%—11/25/2059 | 136 | |
Series 2020-3 Cl. MA | |||
176 | 2.000%—05/25/2060 | 159 |
COLLATERALIZED MORTGAGE OBLIGATIONS—Continued | |||
Principal Amount | Value | ||
Series 2021-1 Cl. MA | |||
$ | 249 | 2.000%—09/25/2060 | $223 |
Series 2021-3 Cl. MA | |||
278 | 2.000%—03/25/2061 | 248 | |
Series 2020-1 Cl. MA | |||
164 | 2.500%—08/25/2059 | 152 | |
Series 2017-2 Cl. MA | |||
56 | 3.000%—08/25/2056 | 53 | |
Series 2018-1 Cl. MA | |||
114 | 3.000%—05/25/2057 | 107 | |
Series 2019-2 Cl. MA | |||
180 | 3.500%—08/25/2058 | 173 | |
1,251 | |||
FRESB Mortgage Trust | |||
Series 2019-SB63 Cl. A5H | |||
249 | 2.550% (1 Month USD LIBOR + 0.700) 02/25/20393 | 243 | |
GS Mortgage Backed Securities Trust | |||
Series 2020-INV1 Cl. A14 | |||
169 | 2.930%—10/25/20501,3 | 146 | |
Series 2020-PJ4 Cl. A2 | |||
108 | 3.000%—01/25/20511,3 | 94 | |
240 | |||
GS Mortgage Securities Trust | |||
Series 2016-GS3 Cl. A4 | |||
550 | 2.850%—10/10/2049 | 509 | |
MetLife Securitization Trust | |||
Series 2020-INV1 Cl. A2A | |||
128 | 2.500%—05/25/20501,3 | 108 | |
Morgan Stanley Bank of America Merill Lynch Trust | |||
Series 2015-C25 Cl. A4 | |||
260 | 3.372%—10/15/2048 | 249 | |
Series 2015-C26 Cl. A5 | |||
600 | 3.531%—10/15/2048 | 574 | |
823 | |||
PSMC Trust | |||
Series 2021-2 Cl. A3 | |||
465 | 2.500%—05/25/20511,3 | 410 | |
Series 2020-2 Cl. A2 | |||
55 | 3.000%—05/25/20501,3 | 50 | |
460 | |||
Tricon American Homes Trust | |||
Series 2020-SFR1 Cl. A | |||
334 | 1.499%—07/17/20381 | 302 | |
Wells Fargo Commercial Mortgage Trust | |||
Series 2015-C31 Cl. A4 | |||
380 | 3.695%—11/15/2048 | 365 | |
TOTAL COLLATERALIZED MORTGAGE OBLIGATIONS | |||
(Cost $7,550) | 7,094 | ||
CORPORATE BONDS & NOTES—30.9% | |||
AEROSPACE & DEFENSE—1.1% | |||
BAE Systems Holdings Inc. | |||
361 | 3.400%—04/15/20301 | 333 | |
Boeing Co. | |||
349 | 5.150%—05/01/2030 | 352 | |
116 | 5.805%—05/01/2050 | 116 | |
468 | |||
Lockheed Martin Corp. | |||
235 | 4.700%—05/15/2046 | 234 |
8
Harbor Core Bond Fund
Portfolio of Investments—Continued
Principal Amounts, Value and Cost in Thousands
CORPORATE BONDS & NOTES—Continued | |||
Principal Amount | Value | ||
AEROSPACE & DEFENSE—Continued | |||
Northrop Grumman Corp. | |||
$ | 148 | 5.250%—05/01/2050 | $153 |
1,188 | |||
AIRLINES—1.4% | |||
Air Canada Pass-Through Trust | |||
259 | 3.600%—03/15/20271 | 242 | |
Delta Air Lines Pass-Through Trust | |||
330 | 3.625%—07/30/2027 | 305 | |
United Airlines Pass-Through Trust | |||
210 | 3.100%—01/07/2030 | 192 | |
823 | 4.000%—04/11/2026 | 782 | |
974 | |||
1,521 | |||
AUTOMOBILES—0.9% | |||
Apriv PLC / Aptiv Corp | |||
490 | 3.250%—03/01/2032 | 428 | |
General Motors Financial Co Inc. | |||
454 | 2.400%—10/15/2028 | 390 | |
Toyota Motor Credit Corp. MTN4 | |||
147 | 3.375%—04/01/2030 | 139 | |
957 | |||
BANKS—4.9% | |||
Bank of America Corp. MTN4 | |||
440 | 2.572%—10/20/20325 | 361 | |
116 | 4.330%—03/15/20505 | 100 | |
505 | 4.950%—07/22/20285 | 504 | |
965 | |||
Barclays | |||
310 | 5.304%—08/09/20265 | 307 | |
Capital One Financial Co. | |||
513 | 5.470%—02/01/20295 | 505 | |
Citigroup Inc. | |||
171 | 3.400%—05/01/2026 | 165 | |
239 | 3.520%—10/27/20285 | 224 | |
279 | 4.410%—03/31/20315 | 267 | |
656 | |||
Credit Suisse AG | |||
448 | 7.950%—01/09/2025 | 457 | |
Discover Financial Services | |||
135 | 6.700%—11/29/2032 | 143 | |
HSBC Holdings PLC | |||
212 | 7.390%—11/03/20285 | 228 | |
JPMorgan Chase & Co. | |||
586 | 4.200%—07/23/20295 | 565 | |
250 | 4.490%—03/24/20315 | 244 | |
809 | |||
Lloyds Banking Group plc | |||
500 | 2.440% (U.S. Treasury 1 Year Constant Maturity Yield + 1.000) 02/05/20263 | 473 | |
Mitsubishi UFJ Finance Group | |||
310 | 5.017%—07/20/20285 | 309 | |
Toronto Dominion Bank MTN4 | |||
340 | 1.950%—01/12/2027 | 308 | |
5,160 |
CORPORATE BONDS & NOTES—Continued | |||
Principal Amount | Value | ||
BEVERAGES—0.3% | |||
Anheuser-Busch Cos. LLC / Anheuser-Busch InBev Worldwide Inc. | |||
$ | 358 | 4.900%—02/01/2046 | $355 |
BIOTECHNOLOGY—0.3% | |||
Abbvie Inc. | |||
310 | 4.500%—05/14/2035 | 302 | |
CAPITAL MARKETS—3.0% | |||
Bank of NY Mellon Corp. MTN4 | |||
300 | 5.802%—10/25/20285 | 314 | |
Blackstone Holdings Finance Co. LLC | |||
173 | 2.800%—09/30/20501 | 101 | |
356 | 3.500%—09/10/20491 | 243 | |
344 | |||
Goldman Sachs Group Inc. | |||
301 | 3.800%—03/15/2030 | 283 | |
KKR Group Finance Co. II LLC | |||
54 | 5.500%—02/01/20431 | 52 | |
KKR Group Finance Co. III LLC | |||
170 | 5.125%—06/01/20441 | 152 | |
Macquarie Group Ltd. | |||
493 | 1.340%—01/12/20271,5 | 442 | |
Moody's S Corp. | |||
300 | 3.250%—05/20/2050 | 219 | |
Morgan Stanley MTN4 | |||
665 | 3.125%—07/27/2026 | 633 | |
295 | 3.620%—04/01/20315 | 270 | |
903 | |||
UBS Group AG | |||
500 | 4.125%—04/15/20261 | 479 | |
3,188 | |||
COMMERCIAL SERVICES & SUPPLIES—0.2% | |||
Waste Management Inc. | |||
230 | 4.150%—04/15/2032 | 226 | |
CONSTRUCTION MATERIALS—0.2% | |||
Carlisle Cos Inc. | |||
193 | 2.750%—03/01/2030 | 167 | |
DIVERSIFIED FINANCIAL SERVICES—1.1% | |||
American Express Co. | |||
322 | 5.043%—05/01/20345 | 323 | |
Ferguson Finance plc | |||
510 | 3.250%—06/02/20301 | 447 | |
PNC Financial Services | |||
410 | 5.070%—01/24/20345 | 404 | |
1,174 | |||
DIVERSIFIED REITs—0.5% | |||
Healthpeak OP LLC Co. | |||
540 | 3.250%—07/15/2026 | 512 | |
DIVERSIFIED TELECOMMUNICATION SERVICES—0.8% | |||
AT&T Inc. | |||
240 | 2.300%—06/01/2027 | 220 | |
504 | 5.920% (3 Month USD LIBOR + 1.180) 06/12/20243 | 507 | |
727 | |||
Verizon Communications Inc. | |||
162 | 4.500%—08/10/2033 | 157 | |
884 |
9
Harbor Core Bond Fund
Portfolio of Investments—Continued
Principal Amounts, Value and Cost in Thousands
CORPORATE BONDS & NOTES—Continued | |||
Principal Amount | Value | ||
ELECTRIC UTILITIES—2.4% | |||
Berkshire Hathaway Energy Co. | |||
$ | 275 | 6.125%—04/01/2036 | $308 |
Duke Energy Florida LLC | |||
330 | 3.800%—07/15/2028 | 323 | |
Eversource Energy | |||
200 | 2.900%—10/01/2024 | 194 | |
Exelon Corp. | |||
62 | 4.700%—04/15/2050 | 57 | |
243 | 5.100%—06/15/2045 | 230 | |
287 | |||
Florida Power + Light Co. | |||
630 | 2.450%—02/03/2032 | 541 | |
Northern States Power | |||
158 | 4.500%—06/01/2052 | 149 | |
Southern Co. | |||
230 | 3.250%—07/01/2026 | 220 | |
308 | 4.250%—07/01/2036 | 286 | |
506 | |||
Xcel Energy Inc. | |||
230 | 3.400%—06/01/2030 | 212 | |
2,520 | |||
ENTERTAINMENT—0.1% | |||
Magallanes Inc. | |||
155 | 5.141%—03/15/20521 | 124 | |
EQUITY REAL ESTATE INVESTMENT TRUSTS (REITs)—1.0% | |||
Alexandria Real Estate Equities Inc | |||
290 | 2.000%—05/18/2032 | 224 | |
115 | 4.750%—04/15/2035 | 110 | |
334 | |||
Digital Realty Trust LP | |||
253 | 3.600%—07/01/2029 | 227 | |
Federal Realty Investment Trust | |||
533 | 1.250%—02/15/2026 | 483 | |
1,044 | |||
FINANCIAL SERVICES—0.2% | |||
Berkshire Hathaway Finance Co. | |||
198 | 3.850%—03/15/2052 | 169 | |
HEALTH CARE PROVIDERS & SERVICES—2.2% | |||
Cigna Corp. | |||
320 | 3.400%—03/01/2027 | 308 | |
CommonSpirit Health | |||
232 | 4.187%—10/01/2049 | 191 | |
CVS Pass-Through Trust | |||
173 | 5.773%—01/10/20331 | 172 | |
84 | 5.880%—01/10/2028 | 84 | |
507 | 8.353%—07/10/20311 | 550 | |
806 | |||
Elevance Health Inc. | |||
425 | 4.750%—02/15/2033 | 428 | |
PeaceHealth Obligated Group | |||
590 | 1.375%—11/15/2025 | 538 | |
2,271 | |||
INSURANCE—2.5% | |||
AIA Group Ltd. | |||
419 | 3.600%—04/09/20291 | 398 |
CORPORATE BONDS & NOTES—Continued | |||
Principal Amount | Value | ||
INSURANCE—Continued | |||
Equitable Financial Life Global Funding | |||
$ | 325 | 1.400%—07/07/20251 | $299 |
Five Corners Funding Trust | |||
150 | 4.419%—11/15/20231 | 149 | |
Ga Global Funding Trust | |||
420 | 3.850%—04/11/20251 | 404 | |
Liberty Mutual Group Inc. | |||
530 | 4.569%—02/01/20291 | 512 | |
Lincoln National Corp. | |||
276 | 3.400%—01/15/2031 | 223 | |
Mass Mutual Life Insurance Co. | |||
180 | 3.375%—04/15/20501 | 133 | |
160 | 5.672%—12/01/20521 | 167 | |
300 | |||
MetLife, Inc. MTN4 | |||
340 | 3.300%—03/21/20291 | 315 | |
2,600 | |||
INTERNET & DIRECT MARKETING RETAIL—0.3% | |||
Amazon.com Inc. | |||
371 | 4.100%—04/13/2062 | 323 | |
MEDIA—0.8% | |||
Charter Communications Operating LLC / Charter Communications Operating Capital | |||
498 | 6.384%—10/23/2035 | 493 | |
COX Communications Inc. | |||
400 | 1.800%—10/01/20301 | 318 | |
811 | |||
MULTI-UTILITIES—0.8% | |||
PG&E Wildfire Recovery Funding LLC | |||
103 | 3.594%—06/01/2032 | 98 | |
330 | 4.022%—06/01/2033 | 324 | |
183 | 4.722%—06/01/2039 | 185 | |
607 | |||
Rogers Communications Inc. | |||
257 | 5.450%—10/01/2043 | 244 | |
851 | |||
OIL, GAS & CONSUMABLE FUELS—1.4% | |||
Dominion Energy Inc. | |||
310 | 5.250%—08/01/2033 | 314 | |
Energy Transfer LP | |||
505 | 3.900%—07/15/2026 | 487 | |
Occidental Petroleum Corp. | |||
474 | 0.000%—10/10/20366 | 248 | |
Schlumberger Holdings Corp. | |||
192 | 3.900%—05/17/20281 | 186 | |
Southern Co. Gas Capital Corp. | |||
230 | 1.750%—01/15/2031 | 184 | |
1,419 | |||
PROFESSIONAL SERVICES—0.2% | |||
Verisk Analytics Inc. | |||
295 | 3.625%—05/15/2050 | 218 | |
ROAD & RAIL—0.6% | |||
Canadian Pacific Railway Co. | |||
190 | 6.125%—09/15/2115 | 203 | |
Norfolk Southern Corp. | |||
155 | 4.837%—10/01/2041 | 148 |
10
Harbor Core Bond Fund
Portfolio of Investments—Continued
Principal Amounts, Value and Cost in Thousands
CORPORATE BONDS & NOTES—Continued | |||
Principal Amount | Value | ||
ROAD & RAIL—Continued | |||
Ryder System Inc. MTN4 | |||
$ | 237 | 3.650%—03/18/2024 | $233 |
584 | |||
SEMICONDUCTORS & SEMICONDUCTOR EQUIPMENT—0.7% | |||
Broadcom Inc. | |||
272 | 4.110%—09/15/2028 | 262 | |
NXP BV/ NXP FDG/ NXP USA Co. | |||
450 | 3.150%—05/01/2027 | 422 | |
684 | |||
SOFTWARE—0.5% | |||
Oracle Corp. | |||
340 | 1.650%—03/25/2026 | 313 | |
343 | 3.950%—03/25/2051 | 259 | |
572 | |||
SPECIALTY RETAIL—1.1% | |||
Home Depot Inc. | |||
170 | 3.300%—04/15/2040 | 142 | |
Lowe's Cos. Inc. | |||
77 | 3.700%—04/15/2046 | 60 | |
199 | 5.000%—04/15/2040 | 192 | |
117 | 5.625%—04/15/2053 | 118 | |
370 | |||
Penske Truck Leasing/Ptl | |||
637 | 5.550%—05/01/20281 | 642 | |
1,154 | |||
TECHNOLOGY HARDWARE, STORAGE & PERIPHERALS—0.2% | |||
NXP BV/ NXP FDG/ NXP USA Co. | |||
265 | 2.700%—05/01/2025 | 252 | |
TRADING COMPANIES & DISTRIBUTORS—0.5% | |||
AerCap Ireland Capital DAC / AerCap Global Aviation Trust | |||
201 | 3.000%—10/29/2028 | 175 | |
Air Lease Corp. | |||
374 | 3.875%—07/03/2023 | 373 | |
548 | |||
WATER UTILITIES—0.2% | |||
Aquarion Co. | |||
238 | 4.000%—08/15/20241 | 235 | |
WIRELESS TELECOMMUNICATION SERVICES—0.5% | |||
T Mobile USA Inc. | |||
511 | 5.050%—07/15/2033 | 515 | |
TOTAL CORPORATE BONDS & NOTES | |||
(Cost $33,781) | 32,528 | ||
MORTGAGE PASS-THROUGH—25.2% | |||
Federal Home Loan Mortgage Corp. | |||
225 | 2.000%—06/01/2050 | 190 | |
2,701 | 2.500%—03/01/2051-05/01/2052 | 2,365 | |
2,349 | 3.000%—01/01/2033-08/01/2050 | 2,163 | |
152 | 3.370% (12 Month USD LIBOR + 1.597) 06/01/20473 | 153 | |
989 | 3.500%—05/01/2042 | 944 | |
763 | 4.000%—12/01/2037-02/01/2046 | 751 | |
137 | 4.500%—03/01/2049 | 137 |
MORTGAGE PASS-THROUGH—Continued | |||
Principal Amount | Value | ||
$ | 352 | 5.000%—10/01/2052 | $353 |
248 | 5.500%—12/01/2052 | 252 | |
7,308 | |||
Federal National Mortgage Association | |||
2,866 | 2.000%—08/01/2050-04/01/2051 | 2,406 | |
3,773 | 2.500%—03/01/2035-04/01/2052 | 3,325 | |
2,266 | 3.000%—02/01/2035-08/01/2050 | 2,124 | |
821 | 3.500%—03/01/2048-06/01/2050 | 773 | |
3,581 | 4.000%—03/01/2038-09/01/2049 | 3,493 | |
158 | 4.310% (Fed 12 Month Treasury Average Constant Maturity Treasury + 2.268) 12/01/20363 | 159 | |
2,543 | 4.500%—05/01/2046-08/01/2052 | 2,527 | |
1,307 | 5.000%—07/01/2050-08/01/2052 | 1,315 | |
1,052 | 5.500%—11/01/2052 | 1,065 | |
17,187 | |||
Government National Mortgage Association | |||
854 | 2.500%—01/20/2051 | 758 | |
391 | 4.000%—09/20/2041-09/15/2046 | 386 | |
845 | 4.500%—01/15/2042-08/20/2047 | 848 | |
1,992 | |||
TOTAL MORTGAGE PASS-THROUGH | |||
(Cost $27,625) | 26,487 | ||
MUNICIPAL BONDS—2.0% | |||
Metropolitan Water Reclamation District of Greater Chicago | |||
145 | 5.720%—12/01/2038 | 160 | |
Michigan State University | |||
83 | 4.165%—08/15/2122 | 67 | |
New York City Transitional Finance Authority | |||
440 | 3.950%—08/01/2032 | 423 | |
New York State Urban Development Corp. | |||
555 | 5.770%—03/15/2039 | 585 | |
Sales Tax Securitization Corp. | |||
530 | 4.637%—01/01/2040 | 511 | |
State of California | |||
300 | 7.500%—04/01/2034 | 376 | |
TOTAL MUNICIPAL BONDS | |||
(Cost $2,198) | 2,122 | ||
U.S. GOVERNMENT OBLIGATIONS—24.8% | |||
U.S. Small Business Administration | |||
Series 2012-20C Cl. 1 | |||
71 | 2.510%—03/01/2032 | 66 | |
Series 2017-20H Cl. 1 | |||
105 | 2.750%—08/01/2037 | 98 | |
Series 2014-20K Cl. 1 | |||
188 | 2.800%—11/01/2034 | 177 | |
Series 2015-20H Cl. 1 | |||
194 | 2.820%—08/01/2035 | 183 | |
Series 2017-20J Cl. 1 | |||
152 | 2.850%—10/01/2037 | 142 | |
Series 2018-20B Cl. 1 | |||
184 | 3.220%—02/01/2038 | 175 | |
Series 2018-20G Cl. 1 | |||
289 | 3.540%—07/01/2038 | 277 | |
Series 2022-25E Cl. 1 | |||
409 | 3.940%—05/01/2047 | 395 |
11
Harbor Core Bond Fund
Portfolio of Investments—Continued
Principal Amounts, Value and Cost in Thousands
U.S. GOVERNMENT OBLIGATIONS—Continued | |||
Principal Amount | Value | ||
Series 2023-25B Cl. 1 | |||
$ | 302 | 4.610%—02/01/2048 | $306 |
Series 2022-25L Cl. 1 | |||
379 | 4.710%—12/01/2047 | 385 | |
Series 2023-25A Cl. 1 | |||
364 | 4.910%—01/01/2048 | 373 | |
Series 2023-25C Cl. 1 | |||
518 | 4.930%—03/01/2048 | 533 | |
Series 2022-25K Cl. 1 | |||
355 | 5.130%—11/01/2047 | 369 | |
Series 2023-10A Cl. 1 | |||
525 | 5.168%—03/10/2033 | 533 | |
4,012 | |||
U.S. Treasury Bonds | |||
1,284 | 2.250%—02/15/2052 | 958 | |
1,688 | 2.375%—02/15/2042 | 1,363 | |
4,381 | 3.000%—08/15/2052 | 3,850 | |
6,713 | 3.375%—08/15/2042 | 6,324 |
U.S. GOVERNMENT OBLIGATIONS—Continued | |||
Principal Amount | Value | ||
$ | 5,348 | 3.500%—01/31/2028 | $5,342 |
2,214 | 4.125%—01/31/2025 | 2,211 | |
20,048 | |||
U.S. Treasury Inflation Index Notes7 | |||
567 | 0.125%—01/15/2030 | 527 | |
U.S. Treasury Notes | |||
1,635 | 2.750%—08/15/2032 | 1,548 | |
TOTAL U.S. GOVERNMENT OBLIGATIONS | |||
(Cost $25,723) | 26,135 | ||
TOTAL INVESTMENTS—99.7% | |||
(Cost $107,831) | 104,930 | ||
CASH AND OTHER ASSETS, LESS LIABILITIES—0.3% | 351 | ||
TOTAL NET ASSETS—100.0% | $105,281 |
FAIR VALUE MEASUREMENTS
All investments as of April 30, 2023 (as disclosed in the preceding Portfolio of Investments) were classified as Level 2.
For more information on valuation inputs and their aggregation into the levels identified above, please refer to the Fair Value Measurements and Disclosures in Note 2 of the accompanying Notes to Financial Statements.
1 | Securities purchased in a transaction exempt from registration under Rule 144A of the Securities Act of 1933. These securities may be resold in transactions exempt from registration, normally to qualified institutional buyers. The Fund has no right to demand registration of these securities. As of April 30, 2023, the aggregate value of these securities was $18,193 or 17% of net assets. |
2 | CLO after the name of a security stands for Collateralized Loan Obligation. |
3 | Variable or floating rate security; the stated rate represents the rate in effect as of April 30, 2023. The variable rate for such securities may be based on the indicated reference rate and spread or on an underlying asset or pool of assets rather than a reference rate and may be determined by current interest rates, prepayments or other financial indicators. |
4 | MTN after the name of a security stands for Medium Term Note. |
5 | Rate changes from fixed to variable rate at a specified date prior to its final maturity. Stated rate is fixed rate currently in effect and stated date is the final maturity date. |
6 | Zero coupon bond |
7 | Inflation-protected securities (“IPS”) are securities in which the principal amount is adjusted for inflation and interest payments are applied to the inflation-adjusted principal. |
The accompanying notes are an integral part of the Financial Statements.
12
Harbor Core Plus Fund
Portfolio of Investments—April 30, 2023 (Unaudited)
Subadvisor: Income Research + Management
Investment Allocation (% of investments)
Portfolio of Investments
Principal Amounts, Value and Cost in Thousands
ASSET-BACKED SECURITIES—11.4% | |||
Principal Amount | Value | ||
Air Canada Pass-Through Trust | |||
Series 2017-1AA Cl. PTT | |||
$ | 3,232 | 3.300%—07/15/20311 | $2,891 |
Aligned Data Centers LLC | |||
Series 2021-1A Cl. A2 | |||
7,301 | 1.937%—08/15/20461 | 6,493 | |
American Airlines Pass-Through Trust | |||
Series 15-2 Cl. AA | |||
1,396 | 3.600%—03/22/2029 | 1,290 | |
American Tower Trust I | |||
Series 2028 Cl. 1 | |||
3,029 | 5.490%—03/15/20281 | 3,098 | |
AMMC CLO 20 Ltd.2 | |||
Series 2017-20A Cl. AR | |||
428 | 5.662% (3 Month USD LIBOR + 2.600) 04/17/20291,3 | 427 | |
AMMC CLO XII Ltd.2 | |||
Series 2013-12A Cl. AR2 | |||
4,178 | 5.542% (3 Month USD LIBOR + 2.050) 11/10/20301,3 | 4,128 | |
Apidos CLO XXVI2 | |||
Series 2017-26A Cl. A1AR | |||
3,951 | 5.695% (3 Month USD LIBOR + 2.410) 07/18/20291,3 | 3,916 | |
Ares LII CLO Ltd.2 | |||
Series 2019-52A Cl. A1R | |||
4,000 | 5.865% (3 Month USD LIBOR + 2.060) 04/22/20311,3 | 3,948 | |
Birch Grove CLO Ltd.2 | |||
Series 19-AR | |||
4,000 | 5.899% (3 Month USD LIBOR + 1.880) 06/15/20311,3 | 3,925 | |
Catamaran CLO Ltd.2 | |||
Series 2014-1A Cl. A1AR | |||
4,410 | 5.915% (3 Month USD LIBOR + 2.000) 04/22/20301,3 | 4,368 | |
CF Hippolyta Issuer LLC | |||
Series 2021-1A Cl. A1 | |||
3,900 | 1.530%—03/15/20611 | 3,435 | |
DB Master Finance LLC | |||
Series 2021-1A Cl. A2II | |||
2,256 | 2.493%—11/20/20511 | 1,942 | |
Diamond Infrastructure Funding LLC | |||
Series 2021-1A | |||
4,375 | 1.760%—04/15/20491 | 3,791 | |
Domino's Pizza Master Issuer LLC | |||
Series 2021-1A Cl. A2I | |||
1,323 | 2.662%—04/25/20511 | 1,147 |
ASSET-BACKED SECURITIES—Continued | |||
Principal Amount | Value | ||
FirstKey Homes Trust | |||
Series 2021-SFR1 | |||
$ | 7,344 | 1.538%—08/17/20381 | $6,538 |
GSAA Home Equity Trust | |||
Series 2006-20 Cl. 1A2 | |||
3,208 | 4.866% (1 Month USD LIBOR + 3.310) 12/25/20463 | 976 | |
Home Partners of America Trust | |||
Series 2022-1 | |||
3,214 | 3.930%—04/17/20391 | 3,074 | |
IXIS Real Estate Capital Trust | |||
Series 2005-HE1 Cl. M4 | |||
643 | 5.556% (1 Month USD LIBOR + 2.840) 06/25/20353 | 640 | |
JetBlue Pass Through Trust | |||
Series 2015-2 Cl. AA | |||
3,911 | 4.000%—05/15/2034 | 3,609 | |
JPMorgan Mortgage Acquisition Corp. | |||
Series 2007-HE1 Cl. AF3 | |||
660 | 4.188%—05/25/20354 | 443 | |
Morgan Stanley Capital Inc. | |||
Series 2007-HE1 Cl. A2C | |||
1,556 | 3.736% (1 Month USD LIBOR + 0.150) 11/25/20363 | 889 | |
Series 2007-HE6 Cl. A3 | |||
2,969 | 4.686% (1 Month USD LIBOR + 2.230) 05/25/20373 | ��2,613 | |
3,502 | |||
New Economy Assets Phase 1 Sponsor LLC | |||
Series 2021 Cl. 1A1 | |||
4,500 | 1.910%—10/20/20611 | 3,915 | |
Palmer Square Loan Funding Ltd. | |||
Series 2021-4A Cl. A1 | |||
3,018 | 5.592% (3 Month USD LIBOR + 2.120) 10/15/20291,3 | 2,986 | |
Planet Fitness Master Issuer LLC | |||
Series 2022-1A Cl. A2I | |||
4,333 | 3.251%—12/05/20511 | 3,913 | |
Series 2018-1A Cl. A2II | |||
611 | 4.666%—09/05/20481 | 594 | |
4,507 | |||
SBA Tower Trust | |||
Series 2022-1C | |||
3,034 | 6.599%—01/15/20281 | 3,188 |
13
Harbor Core Plus Fund
Portfolio of Investments—Continued
Principal Amounts, Value and Cost in Thousands
ASSET-BACKED SECURITIES—Continued | |||
Principal Amount | Value | ||
ServiceMaster Funding LLC | |||
Series 2021-1 Cl. A2I | |||
$ | 3,185 | 2.865%—07/30/20511 | $2,645 |
Series 2020-1 Cl A2II | |||
368 | 3.337%—01/30/20511 | 294 | |
2,939 | |||
Servpro Master Issuer LLC | |||
Series 2021-1A Cl A2 | |||
3,430 | 2.394%—04/25/20511 | 2,847 | |
Sound Point CLO XII Ltd.2 | |||
Series 2016-2A Cl. AR2 | |||
1,142 | 5.858% (3 Month USD LIBOR + 2.610) 10/20/20281,3 | 1,136 | |
Specialty Underwriting & Residential Finance Trust | |||
Series 2006-BC4 Cl. A2B | |||
2,356 | 3.806% (1 Month USD LIBOR + 0.220) 09/25/20373 | 819 | |
Stack Infrastructure Issuer LLC | |||
Series 2021-1A Cl. A2 | |||
7,000 | 1.877%—03/26/20461 | 6,249 | |
Taco Bell Funding LLC | |||
Series 2021-1A Cl. A2I | |||
6,913 | 1.946%—08/25/20511 | 6,083 | |
Trinity Rail Leasing 2020 LLC | |||
Series 2020-2A Cl. A2 | |||
5,000 | 2.560%—11/19/20501 | 4,393 | |
United Airlines Pass-Through Trust | |||
Series 2019-2 Cl. AA | |||
1,150 | 2.700%—11/01/2033 | 993 | |
Vantage Data Centers Issuer LLC | |||
Series 2021-1A Cl. A2 | |||
1,093 | 2.165%—10/15/20461 | 975 | |
VB-S1 Issuer LLC - Vbtel | |||
Series 2022-1A Cl. C2I | |||
6,810 | 3.156%—02/15/20521 | 6,184 | |
Wendy's Funding LLC | |||
Series 2021-1A Cl. A2I | |||
6,878 | 2.370%—06/15/20511 | 5,797 | |
TOTAL ASSET-BACKED SECURITIES | |||
(Cost $124,805) | 116,592 | ||
COLLATERALIZED MORTGAGE OBLIGATIONS—11.1% | |||
Angel Oak Mortgage Trust | |||
Series 2022-1 Cl. A1 | |||
3,542 | 2.881%—12/25/20661,4 | 3,148 | |
Argent Securities Inc. | |||
Series 2006-W4 Cl. A2C | |||
5,538 | 3.906% (1 Month USD LIBOR + 0.320) 05/25/20363 | 1,387 | |
Series 2004-W11 Cl. M3 | |||
685 | 4.711% (1 Month USD LIBOR + 1.125) 11/25/20343 | 669 | |
2,056 | |||
Banc of America Alternative Loan Trust | |||
Series 2006 -7 Cl. A3 | |||
6,768 | 5.913%—10/25/20363 | 2,008 | |
Banc of America Funding Corp. | |||
Series 2007-C Cl. 7A5 | |||
437 | 4.089% (1 Month USD LIBOR + 0.600) 05/20/20473 | 392 | |
BCAP LLC Trust | |||
Series 2007-AA2 Cl. 12A1 | |||
2,849 | 4.006% (1 Month USD LIBOR + 0.420) 05/25/20473 | 2,589 | |
Series 2011-RR5 Cl. 12A1 | |||
159 | 4.653%—03/26/20371,4 | 155 |
COLLATERALIZED MORTGAGE OBLIGATIONS—Continued | |||
Principal Amount | Value | ||
Series 2011-RR4 Cl. 8A1 | |||
$ | 1,243 | 5.250%—02/26/20361,3 | $569 |
3,312 | |||
Bear Stearns Adjustable Rate Mortgage Trust | |||
Series 2000-2 Cl. A1 | |||
10 | 2.778%—11/25/20303 | 9 | |
Series 2004-1 Cl. 12A5 | |||
134 | 2.989%—04/25/20343 | 122 | |
131 | |||
Benchmark Mortgage Trust | |||
Series 2020-B21 | |||
4,730 | 1.978%—12/17/2053 | 3,831 | |
Series 2019-B9 Cl. A5 | |||
5,200 | 4.016%—03/15/2052 | 4,902 | |
8,733 | |||
BX Commercial Mortgage Trust | |||
Series 2021-VOLT Cl. A | |||
1,429 | 5.159% (1 Month USD LIBOR + 4.510) 09/15/20361,3 | 1,381 | |
Series 2022-LP2 | |||
3,824 | 5.491% (1 Month CME Term SOFR + 4.140) 02/15/20391,3 | 3,712 | |
5,093 | |||
Citigroup Commercial Mortgage Trust | |||
Series 2015-GC27 | |||
3,390 | 3.137%—02/10/2048 | 3,260 | |
COMM Mortgage Trust | |||
Series 2016-787S Cl. A | |||
5,400 | 3.545%—02/10/20361 | 4,978 | |
Series 2014-LC17 | |||
6,500 | 3.917%—10/10/2047 | 6,317 | |
11,295 | |||
Countrywide Alternative Loan Trust | |||
Series 2006-6BC Cl. 1A2 | |||
1,694 | 3.986% (1 Month USD LIBOR + 0.400) 05/25/20363 | 1,333 | |
Series 2005-20CB Cl. 2A5 | |||
1,234 | 5.500%—07/25/2035 | 855 | |
Series 2006-1R Cl.2A3 | |||
2,862 | 6.000%—08/25/2037 | 1,506 | |
3,694 | |||
Countrywide Asset-Backed Certificates | |||
Series 2006-2 Cl. M1 | |||
263 | 4.186% (1 Month USD LIBOR + 0.600) 06/25/20363 | 260 | |
Credit Suisse First Boston Mortgage Securities Corp. | |||
Series 2006-C2 Cl. A3 | |||
187 | 6.000%—11/25/2035 | 138 | |
DC Office Trust | |||
Series 2019-MTC Cl. A | |||
4,900 | 2.965%—09/15/20451 | 4,024 | |
Deutsche Alt-A Securities Inc. Mortgage Loan Trust | |||
Series 2007-AR2 Cl. A1 | |||
2,631 | 3.886% (1 Month USD LIBOR + 0.300) 03/25/20373 | 2,478 | |
DSLA Mortgage Loan Trust | |||
Series 2006-AR1 Cl. 1A1A | |||
838 | 2.291% (Fed 12 Month Treasury Average Constant Maturity Treasury + 0.920) 3/19/20463 | 673 | |
First Franklin Mortgage Loan Trust | |||
Series 2006-FF14 Cl. A6 | |||
8,000 | 3.896% (1 Month USD LIBOR + 0.310) 10/25/20363 | 6,344 |
14
Harbor Core Plus Fund
Portfolio of Investments—Continued
Principal Amounts, Value and Cost in Thousands
COLLATERALIZED MORTGAGE OBLIGATIONS—Continued | |||
Principal Amount | Value | ||
First Horizon Asset Securities Inc. | |||
Series 2005-AR6 Cl. 4A1 | |||
$ | 116 | 2.683%—02/25/20363 | $106 |
First Nationwide Trust | |||
Series 2001-3 Cl. 1A1 | |||
— | 6.750%—08/21/2031 | — | |
GS Mortgage Securities Trust | |||
Series 2015-GC30 | |||
3,888 | 3.119%—05/10/2050 | 3,724 | |
GSMPS Mortgage Loan Trust | |||
Series 2006-RP2 Cl. 1AF1 | |||
3,075 | 3.986% (1 Month USD LIBOR + 0.400) 04/25/20361,3 | 2,545 | |
GSR Mortgage Loan Trust | |||
Series 2005-AR3 Cl. 3A1 | |||
189 | 3.081%—05/25/20353 | 139 | |
IndyMac ARM Trust | |||
Series 2001-H2 Cl. A2 | |||
2 | 3.544%—01/25/20323 | 2 | |
IndyMac INDX Mortgage Loan Trust | |||
Series 2005-AR31 Cl. 1A1 | |||
557 | 3.051%—01/25/20363 | 474 | |
JP Morgan Mortgage Trust | |||
Series 2006-A6 Cl. 1A4L | |||
983 | 3.640%—10/25/20363 | 740 | |
Series 2006-S1 Cl. 3A1 | |||
43 | 5.500%—04/25/2036 | 42 | |
782 | |||
Manhattan West Mortgage Trust | |||
Series 2020-1MW Cl. A | |||
4,900 | 2.130%—09/10/20391 | 4,248 | |
Merrill Lynch Alternative Note Asset Trust | |||
Series 2007-F1 Cl. 2A6 | |||
423 | 6.000%—03/25/2037 | 170 | |
MetLife Securitization Trust | |||
Series 2018-1A Cl. A | |||
2,072 | 3.750%—03/25/20571,3 | 1,973 | |
Morgan Stanley Bank of America Merrill Lynch Trust | |||
Series 2014-C14 Cl. A5 | |||
2,638 | 4.064%—02/15/2047 | 2,599 | |
Onslow Bay Financial LLC | |||
Series 2018-1 Cl. A2 | |||
2,248 | 4.236% (1 Month USD LIBOR + 0.650) 06/25/20571,3 | 2,130 | |
Residential Asset Securitization Trust | |||
Series 2007-A8 Cl. 2A1 | |||
17,457 | 6.250%—08/25/2037 | 4,882 | |
Residential Funding Mortgage Securities | |||
Series 2007-SA1 Cl. 2A2 | |||
135 | 4.261%—02/25/20373 | 92 | |
Saxon Asset Securities Trust | |||
Series 2006-3 Cl. A3 | |||
1,514 | 3.756% (1 Month USD LIBOR + 0.170) 10/25/20463 | 1,475 | |
Sequoia Mortgage Trust | |||
Series 2023-1 Cl. A4 | |||
4,820 | 5.000%—01/25/20531,3 | 4,759 | |
Series 2023-2 Cl. A4 | |||
4,532 | 5.000%—03/25/20531,3 | 4,438 | |
9,197 | |||
Structured Adjustable Rate Mortgage Loan Trust | |||
Series 2005-21A Cl. 3A1 | |||
89 | 3.914%—04/25/20353 | 86 | |
Suntrust Adjustable Rate Mortgage Loan Trust | |||
Series 2007-S1 Cl. 1A | |||
228 | 3.360%—01/25/20373 | 169 |
COLLATERALIZED MORTGAGE OBLIGATIONS—Continued | |||
Principal Amount | Value | ||
Towd Point Mortgage Trust | |||
Series 2019-1 Cl. A1 | |||
$ | 4,650 | 3.704%—03/25/20581,3 | $4,449 |
Tricon American Homes Trust | |||
Series 2020-SFR1 Cl. A | |||
2,316 | 1.499%—07/17/20381 | 2,096 | |
Washington Mutual Mortgage Pass Through Certificates Trust | |||
Series 2006-AR8 Cl. 1A4 | |||
1,539 | 3.676%—08/25/20463 | 1,363 | |
Series 2005-AR6 Cl. 2A1A | |||
149 | 4.046% (1 Month USD LIBOR + 0.460) 04/25/20453 | 144 | |
Series 2005-AR13 Cl. A1A1 | |||
73 | 4.166% (1 Month USD LIBOR + 0.580) 10/25/20453 | 69 | |
1,576 | |||
Wells Fargo Commercial Mortgage Trust | |||
Series 2018-C48 Cl. A5 | |||
7,117 | 4.302%—01/15/2052 | 6,864 | |
WFRBS Commercial Mortgage Trust | |||
Series 2014-C23 | |||
6,450 | 3.917%—10/15/2057 | 6,243 | |
TOTAL COLLATERALIZED MORTGAGE OBLIGATIONS | |||
(Cost $131,167) | 113,061 | ||
CORPORATE BONDS & NOTES—28.7% | |||
AEROSPACE & DEFENSE—1.0% | |||
BAE Systems plc | |||
5,391 | 1.900%—02/15/20311 | 4,411 | |
Boeing Co. | |||
4,625 | 5.150%—05/01/2030 | 4,663 | |
1,214 | 5.805%—05/01/2050 | 1,209 | |
5,872 | |||
10,283 | |||
AUTO COMPONENTS—0.4% | |||
Aptiv plc / Aptiv Corp. | |||
5,000 | 4.150%—05/01/2052 | 3,877 | |
AUTOMOBILE COMPONENTS—0.2% | |||
ZF North America Capital Co. | |||
1,980 | 6.875%—04/14/20281 | 2,040 | |
AUTOMOBILES—1.5% | |||
Ford Motor Credit Co. LLC | |||
4,000 | 3.375%—11/13/2025 | �� 3,720 | |
1,900 | 6.950%—03/06/2026 | 1,920 | |
5,640 | |||
Volkswagen Group of America Finance LLC | |||
4,700 | 3.350%—05/13/20251 | 4,553 | |
4,800 | 4.750%—11/13/20281 | 4,801 | |
9,354 | |||
14,994 | |||
BANKS—1.0% | |||
Citigroup Inc. | |||
4,700 | 2.570%—06/03/20315 | 3,980 | |
HSBC Holdings PLC | |||
2,850 | 7.390%—11/03/20285 | 3,070 |
15
Harbor Core Plus Fund
Portfolio of Investments—Continued
Principal Amounts, Value and Cost in Thousands
CORPORATE BONDS & NOTES—Continued | |||
Principal Amount | Value | ||
BANKS—Continued | |||
JPMorgan Chase & Co. | |||
$ | 4,000 | 1.470%—09/22/20275 | $3,564 |
10,614 | |||
BEVERAGES—0.4% | |||
Anheuser-Busch Cos. LLC / Anheuser-Busch InBev Worldwide Inc. | |||
4,441 | 4.900%—02/01/2046 | 4,406 | |
BUILDING PRODUCTS—1.3% | |||
Carlisle Cos. Inc. | |||
3,250 | 2.200%—03/01/2032 | 2,576 | |
Carrier Global Corp. | |||
2,925 | 3.377%—04/05/2040 | 2,280 | |
Ferguson Finance plc | |||
4,800 | 4.650%—04/20/20321 | 4,592 | |
Fortune Brands Home & Security Inc. | |||
4,700 | 3.250%—09/15/2029 | 4,216 | |
13,664 | |||
CAPITAL MARKETS—4.2% | |||
Ares Finance Co. IV LLC | |||
4,500 | 3.650%—02/01/20521 | 2,997 | |
BGC Partners Inc. | |||
6,300 | 5.375%—07/24/2023 | 6,279 | |
BlackRock TCP Capital Corp. | |||
5,800 | 2.850%—02/09/2026 | 5,199 | |
Blackstone Holdings Finance Co. LLC | |||
6,000 | 3.200%—01/30/20521 | 3,834 | |
Block Financial LLC Co. | |||
3,600 | 3.875%—08/15/2030 | 3,195 | |
Golub Capital BDC Inc. | |||
5,800 | 2.500%—08/24/2026 | 5,021 | |
Hercules Capital Inc. | |||
2,816 | 2.625%—09/16/2026 | 2,410 | |
KKR Group Finance Co. X LLC | |||
3,000 | 3.250%—12/15/20511 | 1,981 | |
Oaktree Specialty Lending Corp. | |||
1,709 | 2.700%—01/15/2027 | 1,480 | |
Owl Rock Core Income Corp. | |||
5,700 | 4.700%—02/08/2027 | 5,214 | |
Sixth Street Specialty Lending Inc. | |||
5,500 | 2.500%—08/01/2026 | 4,859 | |
42,469 | |||
COMMERCIAL SERVICES & SUPPLIES—0.5% | |||
Allegion US Holding Co. | |||
1,927 | 5.411%—07/01/2032 | 1,944 | |
Triton Container International Ltd. | |||
3,519 | 2.050%—04/15/20261 | 3,134 | |
5,078 | |||
CONSUMER FINANCE—0.7% | |||
Navient Corp. MTN6 | |||
1,704 | 6.125%—03/25/2024 | 1,691 | |
OneMain Finance Corp | |||
2,800 | 6.875%—03/15/2025 | 2,744 | |
Rocket Mortgage LLC / Rocket Mortgage Co-Issuer Inc. | |||
2,856 | 2.875%—10/15/20261 | 2,546 | |
6,981 |
CORPORATE BONDS & NOTES—Continued | |||
Principal Amount | Value | ||
DIVERSIFIED CONSUMER SERVICES—0.4% | |||
Service Corp. International | |||
$ | 4,400 | 4.000%—05/15/2031 | $3,883 |
DIVERSIFIED FINANCIAL SERVICES—0.1% | |||
National Rural Utilities Cooperative Corp. | |||
1,222 | 4.750% (3 Month USD LIBOR + 2.910) 04/30/20433 | 1,191 | |
DIVERSIFIED TELECOMMUNICATION SERVICES—0.2% | |||
Verizon Communications Inc. | |||
2,915 | 3.700%—03/22/2061 | 2,170 | |
ELECTRIC UTILITIES—1.7% | |||
Exelon Corp. | |||
3,100 | 4.050%—04/15/2030 | 2,980 | |
1,500 | 5.625%—06/15/2035 | 1,583 | |
4,563 | |||
Jersey Central Power & Light Co. | |||
900 | 4.300%—01/15/20261 | 887 | |
1,600 | 4.700%—04/01/20241 | 1,588 | |
2,475 | |||
New England Power Co. | |||
2,877 | 5.936%—11/25/20521 | 3,168 | |
NRG Energy Inc. | |||
2,865 | 7.000%—03/15/20331 | 2,976 | |
Pacific Gas & Electric Co. | |||
2,900 | 3.150%—01/01/2026 | 2,735 | |
1,700 | 3.400%—08/15/2024 | 1,653 | |
4,388 | |||
17,570 | |||
ENTERTAINMENT—0.2% | |||
Magallanes Inc. | |||
2,000 | 5.141%—03/15/20521 | 1,600 | |
EQUITY REAL ESTATE INVESTMENT TRUSTS (REITs)—3.3% | |||
Agree LP Co. | |||
1,400 | 2.900%—10/01/2030 | 1,194 | |
Alexandria Real Estate Equities Inc. | |||
2,100 | 2.750%—12/15/2029 | 1,824 | |
2,300 | 4.850%—04/15/2049 | 1,998 | |
3,822 | |||
Boston Properties LP | |||
4,905 | 2.750%—10/01/2026 | 4,377 | |
Brandywine Operating Partnership LP | |||
3,000 | 4.100%—10/01/2024 | 2,823 | |
Digital Realty Trust LP | |||
5,500 | 4.450%—07/15/2028 | 5,245 | |
EPR Properties | |||
1,900 | 4.500%—06/01/2027 | 1,694 | |
600 | 4.950%—04/15/2028 | 536 | |
2,230 | |||
Equinix Inc. | |||
5,000 | 1.000%—09/15/2025 | 4,542 | |
GLP Capital LP / GLP Financing II Inc. | |||
4,500 | 4.000%—01/15/2030 | 3,996 | |
Physicians Realty LP | |||
1,400 | 3.950%—01/15/2028 | 1,316 | |
Spirit Realty LP | |||
4,700 | 3.400%—01/15/2030 | 4,075 | |
33,620 |
16
Harbor Core Plus Fund
Portfolio of Investments—Continued
Principal Amounts, Value and Cost in Thousands
CORPORATE BONDS & NOTES—Continued | |||
Principal Amount | Value | ||
HEALTH CARE PROVIDERS & SERVICES—1.3% | |||
CommonSpirit Health | |||
$ | 1,325 | 4.187%—10/01/2049 | $1,092 |
CVS Pass-Through Trust | |||
382 | 6.943%—01/10/2030 | 394 | |
4,454 | 7.507%—01/10/20321 | 4,817 | |
5,211 | |||
HCA Inc. | |||
4,000 | 5.375%—09/01/2026 | 4,031 | |
Pediatrix Medical Group Inc. | |||
3,347 | 5.375%—02/15/20301 | 3,061 | |
13,395 | |||
HOTELS, RESTAURANTS & LEISURE—0.8% | |||
Expedia Group Inc. | |||
3,450 | 6.250%—05/01/20251 | 3,493 | |
Marriott International Inc. | |||
5,000 | 3.500%—10/15/2032 | 4,388 | |
7,881 | |||
INDUSTRIAL CONGLOMERATES—0.8% | |||
Ashtead Capital Inc. | |||
4,540 | 5.550%—05/30/20331 | 4,519 | |
Textron Inc. | |||
3,800 | 2.450%—03/15/2031 | 3,226 | |
7,745 | |||
INSURANCE—0.8% | |||
GA Global Funding Trust | |||
4,000 | 1.950%—09/15/20281 | 3,420 | |
SBL Holdings Inc. | |||
5,675 | 5.000%—02/18/20311 | 4,728 | |
8,148 | |||
MEDIA—0.6% | |||
Charter Communications Operating LLC / Charter Communications Operating Capital | |||
4,775 | 5.375%—05/01/2047 | 3,912 | |
2,400 | 6.384%—10/23/2035 | 2,374 | |
6,286 | |||
METALS & MINING—0.5% | |||
Anglo American Capital plc | |||
5,267 | 3.875%—03/16/20291 | 4,881 | |
OIL, GAS & CONSUMABLE FUELS—1.0% | |||
Kinder Morgan Inc. | |||
1,193 | 5.050%—02/15/2046 | 1,050 | |
New Fortress Energy Inc. | |||
2,020 | 6.750%—09/15/20251 | 1,927 | |
Occidental Petroleum Corp. | |||
13,200 | 0.000%—10/10/20367 | 6,895 | |
9,872 | |||
PHARMACEUTICALS—0.4% | |||
Takeda Pharmaceutical Co. Ltd. | |||
1,500 | 2.050%—03/31/2030 | 1,276 | |
Teva Pharmaceutical Finance Netherlands III BV | |||
3,000 | 6.750%—03/01/2028 | 2,990 | |
4,266 |
CORPORATE BONDS & NOTES—Continued | |||
Principal Amount | Value | ||
PROFESSIONAL SERVICES—0.2% | |||
KBR Inc. | |||
$ | 1,642 | 4.750%—09/30/20281 | $1,520 |
ROAD & RAIL—0.4% | |||
Canadian Pacific Railway Co. | |||
1,145 | 6.125%—09/15/2115 | 1,224 | |
Norfolk Southern Corp. | |||
3,800 | 4.050%—08/15/2052 | 3,200 | |
4,424 | |||
SEMICONDUCTORS & SEMICONDUCTOR EQUIPMENT—1.4% | |||
Broadcom Inc. | |||
6,904 | 3.137%—11/15/20351 | 5,350 | |
4,003 | 3.469%—04/15/20341 | 3,309 | |
8,659 | |||
KLA Corp. | |||
1,230 | 5.650%—11/01/2034 | 1,297 | |
NXP BV/ NXP FDG/ NXP USA Co. | |||
4,600 | 3.875%—06/18/2026 | 4,455 | |
14,411 | |||
SOFTWARE—0.6% | |||
Oracle Corp. | |||
3,500 | 3.600%—04/01/2040 | 2,721 | |
VMware Inc. | |||
3,600 | 4.650%—05/15/2027 | 3,573 | |
6,294 | |||
SPECIALTY RETAIL—1.0% | |||
Group 1 Automotive Inc. | |||
2,900 | 4.000%—08/15/20281 | 2,576 | |
Lithia Motors Inc. | |||
2,956 | 3.875%—06/01/20291 | 2,563 | |
Lowe's Cos. Inc. | |||
2,113 | 5.625%—04/15/2053 | 2,127 | |
Macy's Retail Holdings LLC | |||
3,612 | 5.875%—03/15/20301 | 3,211 | |
10,477 | |||
TECHNOLOGY HARDWARE, STORAGE & PERIPHERALS—0.3% | |||
Entegris Escrow Corp. | |||
3,210 | 5.950%—06/15/20301 | 3,055 | |
TRADING COMPANIES & DISTRIBUTORS—1.0% | |||
Aircastle Ltd. | |||
6,200 | 2.850%—01/26/20281 | 5,412 | |
Aviation Capital Group LLC | |||
5,300 | 4.125%—08/01/20251 | 5,067 | |
10,479 | |||
WIRELESS TELECOMMUNICATION SERVICES—0.5% | |||
American Tower Corp. | |||
1,118 | 3.650%—03/15/2027 | 1,070 | |
Crown Castle International Corp. | |||
4,000 | 3.700%—06/15/2026 | 3,869 | |
4,939 | |||
TOTAL CORPORATE BONDS & NOTES | |||
(Cost $317,161) | 292,513 | ||
17
Harbor Core Plus Fund
Portfolio of Investments—Continued
Principal Amounts, Value and Cost in Thousands
MORTGAGE PASS-THROUGH—25.4% | |||
Principal Amount | Value | ||
Federal Home Loan Mortgage Corp. | |||
$ | 30,884 | 2.500%—07/01/2050-05/01/2052 | $26,898 |
22,422 | 3.000%—12/15/2027-01/01/2050 | 12,422 | |
230 | 3.500%—01/01/2026-02/01/2035 | 223 | |
13,012 | 4.000%—03/01/2025-11/01/2048 | 12,720 | |
5 | 4.284% (U.S. Treasury Yield Curve Rate T Note 1 Year Constant Maturity Treasury + 2.250) 08/01/20353 | 5 | |
— | 4.342% (U.S. Treasury Yield Curve Rate T Note 1 Year Constant Maturity Treasury + 2.253) 06/01/20243 | — | |
153 | 4.500%—12/01/2040-09/01/2041 | 153 | |
419 | 5.500%—02/01/2038-07/01/2038 | 436 | |
1,441 | 6.000%—01/01/2029-05/01/2040 | 1,499 | |
54,356 | |||
Federal Home Loan Mortgage Corp. REMIC8 | |||
1,382 | 2.725% (1 Month USD LIBOR + 0.350) 08/15/20403 | 1,343 | |
1,360 | 2.914% (1 Month USD LIBOR + 0.350) 10/15/20403 | 1,323 | |
4,112 | 3.000%—05/15/2035 | 372 | |
— | 3.862% (1 Month USD LIBOR + 0.450) 11/15/20303 | — | |
4,335 | 4.000%—10/15/2042 | 724 | |
3,762 | |||
Federal Home Loan Mortgage Corp. Structured Pass Through Certificates | |||
Series T-63 Cl. 1A1 | |||
45 | 2.304% (Fed 12 Month Treasury Average Constant Maturity Treasury + 1.200) 02/25/20453 | 44 | |
Series E3 Cl. A | |||
10 | 3.814%—08/15/20323 | 10 | |
54 | |||
Federal National Mortgage Association | |||
35,174 | 2.500%—06/01/2050-04/01/2052 | 30,702 | |
29,621 | 3.000%—11/01/2025-12/01/2050 | 27,014 | |
95 | 3.449% (Fed 12 Month Treasury Average Constant Maturity Treasury + 1.400) 10/01/20403 | 93 | |
32,814 | 3.500%—12/01/2025-01/01/2051 | 20,930 | |
197 | 3.764% (12 Month USD LIBOR + 1.715) 06/01/20353 | 201 | |
18 | 3.820% (12 Month USD LIBOR + 1.695) 05/01/20353 | 18 | |
249 | 3.943% (12 Month USD LIBOR + 1.693) 08/01/20353 | 245 | |
41,490 | 4.000%—02/01/2024-07/01/2051 | 40,599 | |
29,003 | 4.500%—05/01/2023-12/01/2050 | 28,884 | |
1,015 | 5.000%—10/01/2031-06/01/2044 | 1,027 | |
10,240 | 5.500%—01/01/2025-09/01/2041 | 10,599 | |
3,222 | 6.000%—07/01/2023-06/01/2040 | 3,339 | |
163,651 | |||
Federal National Mortgage Association REMIC8 | |||
11,003 | 0.369%—09/25/20573 | 457 | |
23 | 2.869%—05/25/20353 | 23 | |
1,667 | 2.874% (1 Month USD LIBOR + 0.310) 06/25/20553 | 1,624 | |
4,892 | 3.500%—10/25/2041 | 4,654 | |
7,154 | 4.000%—07/25/2050 | 1,406 | |
94 | 4.867%—12/25/20423 | 91 | |
10,465 | 5.000%—04/25/2033-05/25/2045 | 2,210 | |
2,289 | 6.000%—07/25/2041 | 386 | |
10,851 | |||
Government National Mortgage Association | |||
588 | 3.000%—11/15/2049 | 542 | |
4,518 | 3.111%—07/20/20373 | 215 | |
3,690 | 3.211%—07/20/20373 | 312 | |
8,719 | 4.000%—03/20/2041-03/15/2050 | 4,716 | |
23,450 | 5.000%—08/15/2033-06/15/2050 | 19,711 |
MORTGAGE PASS-THROUGH—Continued | |||
Principal Amount | Value | ||
$ | 758 | 5.500%—02/20/2039 | $144 |
353 | 6.000%—10/20/2038 | 50 | |
25,690 | |||
Government National Mortgage Association II | |||
1 | 2.000% (U.S. Treasury Yield Curve Rate T Note 1 Year Constant Maturity Treasury + 1.500) 10/20/20253 | 1 | |
122 | 2.625% (U.S. Treasury Yield Curve Rate T Note 1 Year Constant Maturity Treasury + 1.500) 09/20/2023-02/20/20323 | 121 | |
32 | 2.750% (U.S. Treasury Yield Curve Rate T Note 1 Year Constant Maturity Treasury + 1.500) 10/20/2025-11/20/20293 | 31 | |
5 | 2.875% (U.S. Treasury Yield Curve Rate T Note 1 Year Constant Maturity Treasury + 1.500) 05/20/20243 | 5 | |
6 | 3.000% (U.S. Treasury Yield Curve Rate T Note 1 Year Constant Maturity Treasury + 1.500) 07/20/2024-09/20/20243 | 6 | |
1,233 | 4.500%—02/20/2049 | 1,224 | |
49 | 5.000%—01/20/2049 | 49 | |
1,437 | |||
TOTAL MORTGAGE PASS-THROUGH | |||
(Cost $281,509) | 259,801 | ||
MUNICIPAL BONDS—0.6% | |||
New York State Dormitory Authority | |||
2,845 | 3.399%—03/15/2032 | 2,623 | |
New York State Urban Development Corp. | |||
3,900 | 1.496%—03/15/2027 | 3,528 | |
TOTAL MUNICIPAL BONDS | |||
(Cost $6,745) | 6,151 | ||
U.S. GOVERNMENT OBLIGATIONS—21.9% | |||
Small Business Administration Participation Certificates | |||
Series 2003-20I Cl. 1 | |||
2 | 5.130%—09/01/2023 | 2 | |
Series 2009-20A Cl. 1 | |||
635 | 5.720%—01/01/2029 | 632 | |
Series 2008-20H Cl. 1 | |||
964 | 6.020%—08/01/2028 | 949 | |
1,583 | |||
U.S. Treasury Bonds | |||
2,619 | 1.375%—08/15/2050 | 1,577 | |
74,081 | 1.750%—08/15/2041 | 53,921 | |
34,359 | 2.000%—08/15/2051 | 24,199 | |
9,447 | 2.250%—02/15/2052 | 7,053 | |
7,730 | 2.375%—02/15/2042 | 6,241 | |
10,665 | 3.000%—08/15/2052 | 9,372 | |
1,006 | 3.250%—08/31/2024 | 990 | |
17,205 | 3.375%—08/15/2042 | 16,208 | |
57,392 | 3.500%—01/31/2028 | 57,334 | |
1,831 | 3.875%—01/15/2026 | 1,834 | |
6,070 | 4.125%—01/31/2025 | 6,061 | |
184,790 |
18
Harbor Core Plus Fund
Portfolio of Investments—Continued
Principal Amounts, Value and Cost in Thousands
U.S. GOVERNMENT OBLIGATIONS—Continued | |||
Principal Amount | Value | ||
U.S. Treasury Notes | |||
$ | 39,490 | 2.750%—08/15/2032 | $37,383 |
TOTAL U.S. GOVERNMENT OBLIGATIONS | |||
(Cost $248,403) | 223,756 | ||
TOTAL INVESTMENTS—99.1% | |||
(Cost $1,109,790) | 1,011,874 | ||
CASH AND OTHER ASSETS, LESS LIABILITIES—0.9% | 9,073 | ||
TOTAL NET ASSETS—100.0% | $1,020,947 |
FAIR VALUE MEASUREMENTS
All investments as of April 30, 2023 (as disclosed in the preceding Portfolio of Investments) were classified as Level 2.
For more information on valuation inputs and their aggregation into the levels identified above, please refer to the Fair Value Measurements and Disclosures in Note 2 of the accompanying Notes to Financial Statements.
1 | Securities purchased in a transaction exempt from registration under Rule 144A of the Securities Act of 1933. These securities may be resold in transactions exempt from registration, normally to qualified institutional buyers. The Fund has no right to demand registration of these securities. As of April 30, 2023, the aggregate value of these securities was $256,942 or 25% of net assets. |
2 | CLO after the name of a security stands for Collateralized Loan Obligation. |
3 | Variable or floating rate security; the stated rate represents the rate in effect as of April 30, 2023. The variable rate for such securities may be based on the indicated reference rate and spread or on an underlying asset or pool of assets rather than a reference rate and may be determined by current interest rates, prepayments or other financial indicators. |
4 | Step coupon security; the stated rate represents the rate in effect as of April 30, 2023. |
5 | Rate changes from fixed to variable rate at a specified date prior to its final maturity. Stated rate is fixed rate currently in effect and stated date is the final maturity date. |
6 | MTN after the name of a security stands for Medium Term Note. |
7 | Zero coupon bond |
8 | REMICs are collateralized mortgage obligations which can hold mortgages secured by any type of real property and issue multiple-class securities backed by those mortgages. |
The accompanying notes are an integral part of the Financial Statements.
19
Harbor Disruptive Innovation Fund
Portfolio of Investments—April 30, 2023 (Unaudited)
Adviser: Harbor Capital Advisors, Inc.
Sector Allocation (% of investments)
Portfolio of Investments
Value and Cost in Thousands
COMMON STOCKS—99.8% | |||
Shares | Value | ||
AUTOMOBILES—1.2% | |||
6,004 | Tesla Inc.* | $986 | |
BIOTECHNOLOGY—11.5% | |||
5,434 | 89bio Inc.* | 87 | |
32,035 | Alkermes plc (Ireland)* | 915 | |
51,339 | Allogene Therapeutics Inc.* | 279 | |
3,668 | Apellis Pharmaceuticals Inc.* | 306 | |
15,262 | Arrowhead Pharmaceuticals Inc.* | 540 | |
10,267 | Ascendis Pharma AS ADR (Denmark)*,1 | 718 | |
216,283 | Autolus Therapeutics plc ADR (United Kingdom)*,1 | 391 | |
22,211 | Avidity Biosciences Inc.* | 275 | |
18,613 | Bicycle Therapeutics plc ADR (United Kingdom)*,1 | 368 | |
51,869 | C4 Therapeutics Inc.* | 157 | |
10,727 | Fate Therapeutics Inc.* | 65 | |
110,247 | Freeline Therapeutics Holdings plc ADR (United Kingdom)*,1 | 37 | |
9,767 | Intellia Therapeutics Inc.* | 369 | |
49,829 | Iovance Biotherapeutics Inc.* | 281 | |
6,190 | Krystal Biotech Inc.* | 520 | |
11,034 | Kymera Therapeutics Inc.* | 348 | |
148,102 | Magenta Therapeutics Inc.* | 116 | |
98,498 | Precision BioSciences Inc.* | 83 | |
1,748 | Prometheus Biosciences Inc.* | 339 | |
23,634 | REGENXBIO Inc.* | 458 | |
32,711 | Repare Therapeutics Inc. (Canada)* | 293 | |
22,792 | Replimune Group Inc.* | 381 | |
47,977 | Rocket Pharmaceuticals Inc.* | 860 | |
2,451 | Sarepta Therapeutics Inc.* | 301 | |
257,020 | Synlogic Inc.* | 136 | |
65,825 | TCR² Therapeutics Inc.* | 116 | |
19,143 | UniQure NV (Netherlands)* | 372 | |
9,111 | |||
BROADLINE RETAIL—7.7% | |||
33,497 | Amazon.com Inc.* | 3,532 | |
2,048 | MercadoLibre Inc. (Brazil)* | 2,617 | |
6,149 | |||
CONSUMER STAPLES DISTRIBUTION—1.0% | |||
125,806 | Dada Nexus Ltd. ADR (China)*,1 | 762 |
COMMON STOCKS—Continued | |||
Shares | Value | ||
CONTAINERS & PACKAGING—2.0% | |||
30,409 | Ball Corp. | $1,617 | |
ELECTRIC UTILITIES—2.1% | |||
21,802 | NextEra Energy Inc. | 1,671 | |
ENTERTAINMENT—0.7% | |||
7,092 | Sea Ltd. ADR (Singapore)*,1 | 540 | |
FINANCIAL SERVICES—6.8% | |||
1,402 | Adyen NV (Netherlands)*,2 | 2,253 | |
22,767 | Block Inc.* | 1,384 | |
10,931 | Fiserv Inc.* | 1,335 | |
23,879 | Toast Inc.* | 434 | |
5,406 | |||
HEALTH CARE EQUIPMENT & SUPPLIES—4.6% | |||
11,845 | Dexcom Inc.* | 1,437 | |
874 | IDEXX Laboratories Inc.* | 430 | |
1,080 | Inspire Medical Systems Inc.* | 289 | |
1,920 | Insulet Corp.* | 611 | |
5,140 | Lantheus Holdings Inc.* | 439 | |
1,114 | The Cooper Companies Inc. | 425 | |
3,631 | |||
HEALTH CARE PROVIDERS & SERVICES—0.9% | |||
160,085 | Invitae Corp.* | 218 | |
1,028 | UnitedHealth Group Inc. | 506 | |
724 | |||
HOTELS, RESTAURANTS & LEISURE—4.7% | |||
7,263 | Airbnb Inc.* | 869 | |
550 | Chipotle Mexican Grill Inc.* | 1,137 | |
981,180 | Deliveroo plc (United Kingdom)*,2 | 1,350 | |
6,268 | DoorDash Inc.* | 384 | |
3,740 | |||
INSURANCE—1.1% | |||
6,309 | The Progressive Corp. | 861 | |
INTERACTIVE MEDIA & SERVICES—1.8% | |||
13,558 | Alphabet Inc. Class A* | 1,455 |
20
Harbor Disruptive Innovation Fund
Portfolio of Investments—Continued
Value and Cost in Thousands
COMMON STOCKS—Continued | |||
Shares | Value | ||
IT SERVICES—5.6% | |||
16,984 | Cloudflare Inc.* | $799 | |
2,725 | MongoDB Inc.* | 654 | |
19,289 | Okta Inc.* | 1,322 | |
11,803 | Shopify Inc. (Canada)* | 572 | |
7,289 | Snowflake Inc.* | 1,079 | |
4,426 | |||
LEISURE PRODUCTS—0.8% | |||
69,349 | Peloton Interactive Inc.* | 616 | |
LIFE SCIENCES TOOLS & SERVICES—5.1% | |||
1,046 | Bio-Rad Laboratories Inc.* | 472 | |
5,575 | Danaher Corp. | 1,321 | |
5,913 | ICON plc (Ireland)* | 1,139 | |
926 | Lonza Group AG (Switzerland) | 577 | |
932 | Thermo Fisher Scientific Inc. | 517 | |
4,026 | |||
MACHINERY—0.6% | |||
3,558 | Chart Industries Inc.* | 474 | |
PHARMACEUTICALS—1.7% | |||
12,803 | Arvinas Inc.* | 336 | |
7,579 | Catalent Inc.* | 380 | |
1,577 | Eli Lilly & Co. | 624 | |
1,340 | |||
SEMICONDUCTORS & SEMICONDUCTOR EQUIPMENT—12.2% | |||
6,530 | Advanced Micro Devices Inc.* | 583 | |
6,719 | Applied Materials Inc. | 760 | |
1,907 | ASML Holding NV (Netherlands) | 1,210 | |
4,286 | Lam Research Corp. | 2,246 | |
25,941 | Microchip Technology Inc. | 1,893 | |
3,451 | NVIDIA Corp. | 958 | |
9,427 | Texas Instruments Inc. | 1,576 | |
11,078 | Wolfspeed Inc.* | 516 | |
9,742 |
COMMON STOCKS—Continued | |||
Shares | Value | ||
SOFTWARE—24.5% | |||
309,728 | Agora Inc. ADR (China)*,1 | $1,038 | |
9,341 | Atlassian Corp. plc* | 1,379 | |
9,684 | Cadence Design Systems Inc.* | 2,028 | |
6,262 | Datadog Inc. Class A* | 422 | |
9,015 | Dynatrace Inc.* | 381 | |
13,866 | Fortinet Inc.* | 874 | |
2,177 | HubSpot Inc.* | 917 | |
10,219 | Microsoft Corp. | 3,140 | |
3,102 | Palo Alto Networks Inc.* | 566 | |
6,685 | Salesforce.com Inc.* | 1,326 | |
62,627 | Samsara Inc.* | 1,131 | |
4,993 | ServiceNow Inc.* | 2,294 | |
16,420 | Smartsheet Inc.* | 671 | |
6,669 | Splunk Inc.* | 575 | |
14,829 | Workday Inc.* | 2,760 | |
19,502 | |||
SPECIALTY RETAIL—1.2% | |||
236,459 | Farfetch Ltd. (United Kingdom)* | 953 | |
WIRELESS TELECOMMUNICATION SERVICES—2.0% | |||
11,261 | T-Mobile US Inc.* | 1,620 | |
TOTAL COMMON STOCKS | |||
(Cost $86,618) | 79,352 | ||
TOTAL INVESTMENTS—99.8% | |||
(Cost $86,618) | 79,352 | ||
CASH AND OTHER ASSETS, LESS LIABILITIES—0.2% | 151 | ||
TOTAL NET ASSETS—100.0% | $79,503 |
FAIR VALUE MEASUREMENTS
As of April 30, 2023, the investments in Adyen NV, ASML Holding NV, Deliveroo plc, and Lonza Group AG (as disclosed in the preceding Portfolio of Investments) were classified as Level 2 and all other investments were classified as Level 1.
For more information on valuation inputs and their aggregation into the levels identified above, please refer to the Fair Value Measurements and Disclosures in Note 2 of the accompanying Notes to Financial Statements.
* | Non-income producing security |
1 | Depositary receipts such as American Depositary Receipts (ADRs), Global Depositary Receipts (GDRs) and other country specific depositary receipts are certificates evidencing ownership of shares of a foreign issuer. These certificates are issued by depositary banks and generally trade on an established market in the U.S. or elsewhere. |
2 | Securities purchased in a transaction exempt from registration under Rule 144A of the Securities Act of 1933. These securities may be resold in transactions exempt from registration, normally to qualified institutional buyers. The Fund has no right to demand registration of these securities. As of April 30, 2023, the aggregate value of these securities was $3,603 or 5% of net assets. |
The accompanying notes are an integral part of the Financial Statements.
21
Harbor Diversified International All Cap Fund
Portfolio of Investments—April 30, 2023 (Unaudited)
Subadvisor: Marathon Asset Management Limited
REGION BREAKDOWN (% of investments)
(Excludes short-term investments and derivatives)
The Fund’s Portfolio of Investments include investments denominated in foreign currencies. As of April 30, 2023, there was no foreign currency denomination that comprised more than 25% of the Fund’s net assets.
Portfolio of Investments
Value and Cost in Thousands
COMMON STOCKS—97.6% | |||
Shares | Value | ||
AEROSPACE & DEFENSE—1.2% | |||
18,020 | Airbus SE (France) | $2,523 | |
332,518 | BAE Systems plc (United Kingdom) | 4,236 | |
105,778 | Melrose Industries plc (United Kingdom) | 545 | |
1,541,012 | Rolls-Royce Holdings plc (United Kingdom)* | 2,952 | |
11,143 | Thales SA (France) | 1,701 | |
11,957 | |||
AIR FREIGHT & LOGISTICS—0.1% | |||
213,073 | National Express Group plc (United Kingdom)* | 326 | |
24,037 | Oesterreichische Post AG (Austria) | 926 | |
1,252 | |||
AIRLINES—1.0% | |||
157,000 | Air Canada (Canada)* | 2,197 | |
57,207 | Copa Holdings SA (Panama) | 5,167 |
COMMON STOCKS—Continued | |||
Shares | Value | ||
AIRLINES—Continued | |||
253,817 | EasyJet plc (United Kingdom)* | $1,592 | |
313,568 | Qantas Airways Ltd. (Australia)* | 1,383 | |
10,339 | |||
AUTO COMPONENTS—0.7% | |||
93,900 | Bridgestone Corp. (Japan) | 3,771 | |
104,008 | Dowlais Group plc (United Kingdom)* | 173 | |
238,097 | Gestamp Automocion SA (Spain)1 | 1,031 | |
309,156 | Johnson Electric Holdings Ltd. (Hong Kong) | 346 | |
31,991 | Magna International Inc. (Canada) | 1,668 | |
6,989 | |||
AUTOMOBILES—0.4% | |||
32,587 | Bayerische Motoren Werke AG (Germany) | 3,653 |
22
Harbor Diversified International All Cap Fund
Portfolio of Investments—Continued
Value and Cost in Thousands
COMMON STOCKS—Continued | |||
Shares | Value | ||
BANKS—11.2% | |||
152,780 | Australia & New Zealand Banking Group Ltd (Australia) | $2,481 | |
609,208 | Bank of Ireland Group plc (Ireland)* | 6,301 | |
60,932 | Bank of Nova Scotia (Canada)2 | 3,041 | |
3,534,142 | Barclays plc (United Kingdom) | 7,119 | |
113,027 | BNP Paribas SA (France)* | 7,303 | |
1,036,315 | CaixaBank SA (Spain) | 3,836 | |
53,213 | Capitec Bank Holdings Ltd. (South Africa) | 4,638 | |
52,384 | Close Brothers Group plc (United Kingdom) | 599 | |
16,067 | Danske Bank AS (Denmark)* | 340 | |
151,547 | DBS Group Holdings Ltd. (Singapore)* | 3,745 | |
89,678 | DNB Bank ASA (Norway)2 | 1,577 | |
52,500 | Fukuoka Financial Group Inc. (Japan) | 989 | |
943,600 | Grupo Financiero Banorte SAB de CV (Mexico)* | 8,178 | |
189,711 | HDFC Bank Ltd. ADR (India)3 | 13,242 | |
131,162 | HSBC Holdings plc (Hong Kong) | 941 | |
64,492 | Intesa Sanpaolo SpA (Italy)* | 170 | |
9,814,578 | Lloyds Banking Group plc (United Kingdom) | 5,962 | |
18,324,400 | PT Bank Central Asia TBK (Indonesia) | 11,340 | |
1,157,600 | Resona Holdings Inc. (Japan) | 5,769 | |
194,641 | Shinhan Financial Group Co. Ltd. (South Korea)* | 5,096 | |
360,018 | Standard Chartered plc (United Kingdom) | 2,852 | |
31,800 | Sumitomo Mitsui Financial Group Inc. (Japan) | 1,300 | |
119,700 | Sumitomo Mitsui Trust Holdings Inc. (Japan) | 4,315 | |
293,174 | Svenska Handelsbanken AB (Sweden) | 2,592 | |
358,863 | UniCredit SpA (Italy) | 7,111 | |
84,782 | United Overseas Bank Ltd. (Singapore) | 1,801 | |
112,638 | |||
BEVERAGES—3.1% | |||
28,576 | Anheuser-Busch InBev SA NV (Belgium) | 1,858 | |
428,400 | Arca Continental SAB de CV (Mexico) | 4,092 | |
50,700 | Asahi Group Holdings Ltd. (Japan) | 1,959 | |
16,293 | Carlsberg AS (Denmark) | 2,696 | |
32,454 | Coca-Cola Europacific Partners plc (United States) | 2,092 | |
130,944 | Davide Campari-Milano NV (Italy) | 1,688 | |
105,151 | Diageo plc (United Kingdom) | 4,796 | |
43,182 | Heineken NV (Netherlands) | 4,958 | |
428,100 | Kirin Holdings Co. Ltd. (Japan) | 6,955 | |
1,949 | Pernod Ricard SA (France) | 450 | |
31,544 | |||
BIOTECHNOLOGY—0.5% | |||
22,940 | CSL Ltd. (Australia) | 4,580 | |
BUILDING PRODUCTS—1.1% | |||
209,547 | Assa Abloy AB Class B (Sweden)2 | 4,993 | |
299,619 | Fletcher Building Ltd. (New Zealand) | 835 | |
7,273 | Geberit AG (Switzerland) | 4,142 | |
157,165 | GWA Group Ltd. (Australia) | 184 | |
26,500 | LIXIL Group Corp. (Japan) | 417 | |
10,571 | |||
CAPITAL MARKETS—2.1% | |||
301,260 | 3i Group plc (United Kingdom) | 6,703 | |
49,781 | Brookfield Asset Management A (Canada) | 1,669 | |
199,122 | Brookfield Corp. (Canada) | 6,461 | |
134,085 | IG Group Holdings plc (United Kingdom) | 1,238 | |
451,206 | Jupiter Fund Management plc (United Kingdom) | 738 | |
565,200 | Nomura Holdings Inc. (Japan) | 2,026 | |
28,206 | Rathbone Brothers plc (United Kingdom) | 694 | |
125,173 | St. James's Place plc (United Kingdom) | 1,903 | |
21,432 |
COMMON STOCKS—Continued | |||
Shares | Value | ||
CHEMICALS—0.8% | |||
195,200 | Air Water Inc. (Japan) | $2,467 | |
61,973 | BASF SE (Germany) | 3,206 | |
33,600 | Nissan Chemical Corp. (Japan) | 1,493 | |
27,100 | Sumitomo Bakelite Co. Ltd. (Japan) | 1,036 | |
8,202 | |||
COMMERCIAL SERVICES & SUPPLIES—1.2% | |||
12,000 | AEON Delight Co. Ltd. (Japan) | 266 | |
11,351 | Befesa SA (Germany)1 | 511 | |
121,338 | Brambles Ltd. (Australia) | 1,149 | |
808,419 | Cleanaway Waste Management Ltd. (Australia) | 1,302 | |
37,300 | Daiei Kankyo Co. Ltd. (Japan)* | 506 | |
33,860 | Elis SA (France) | 672 | |
74,820 | Ritchie Bros Auctioneers Inc. (Canada)2 | 4,281 | |
16,100 | SECOM Co. Ltd. (Japan) | 1,031 | |
1,119,646 | Serco Group plc (United Kingdom) | 2,142 | |
11,860 | |||
CONSTRUCTION & ENGINEERING—1.1% | |||
17,053 | Ferrovial SA (Spain) | 535 | |
192,700 | Infroneer Holdings Inc. (Japan) | 1,522 | |
380,100 | Obayashi Corp. (Japan) | 3,169 | |
267,900 | Penta-Ocean Construction Co. Ltd. (Japan) | 1,302 | |
167,805 | SNC-Lavalin Group Inc. (Canada) | 3,864 | |
5,855 | Taisei Corp. (Japan) | 199 | |
10,591 | |||
CONSTRUCTION MATERIALS—1.1% | |||
160,900 | Beijing Oriental Yuhong Waterproof Technology Co. Ltd. Class A (China) | 690 | |
20,032 | CRH plc (Ireland) | 967 | |
55,073 | Holcim Ltd. (Switzerland)* | 3,639 | |
5,752 | Imerys SA (France) | 236 | |
23,762 | James Hardie Industries PLC CDI (Australia)*3 | 530 | |
141,800 | Taiheiyo Cement Corp. (Japan) | 2,543 | |
8,516 | Vicat SA (France) | 248 | |
77,904 | Wienerberger AG (Austria) | 2,347 | |
11,200 | |||
CONSUMER FINANCE—0.2% | |||
322,755 | International Personal Finance plc (United Kingdom) | 399 | |
83,400 | Marui Group Co. Ltd. (Japan) | 1,329 | |
388,582 | Non-Standard Finance plc (United Kingdom)*,1 | 3 | |
228,305 | Provident Financial plc (United Kingdom) | 646 | |
2,377 | |||
CONSUMER STAPLES DISTRIBUTION—0.2% | |||
83,484 | HelloFresh SE (Germany)* | 2,242 | |
CONSUMER STAPLES DISTRIBUTION & RETAIL—0.6% | |||
120,369 | Alimentation Couche-Tard Inc. (Canada) | 6,008 | |
CONTAINERS & PACKAGING—0.4% | |||
577,478 | DS Smith plc (United Kingdom) | 2,255 | |
152,800 | Toyo Seikan Group Holdings Ltd. (Japan) | 2,158 | |
4,413 | |||
DISTRIBUTORS—0.2% | |||
239,357 | Inchcape plc (United Kingdom) | 2,437 | |
DIVERSIFIED FINANCIAL SERVICES—1.5% | |||
785,443 | AMP Ltd. (Australia)* | 594 | |
2,827,800 | B3 Brasil Bolsa Balcao SA (Brazil)* | 6,622 |
23
Harbor Diversified International All Cap Fund
Portfolio of Investments—Continued
Value and Cost in Thousands
COMMON STOCKS—Continued | |||
Shares | Value | ||
DIVERSIFIED FINANCIAL SERVICES—Continued | |||
677,802 | Chailease Holding Co. Ltd. (Taiwan) | $4,936 | |
98,896 | Challenger Ltd. (Australia) | 398 | |
21,058 | Macquarie Group Ltd. (Australia) | 2,569 | |
15,119 | |||
DIVERSIFIED TELECOMMUNICATION SERVICES—1.5% | |||
44,026 | BCE Inc. (Canada) | 2,116 | |
47,251 | Deutsche Telekom AG (Germany) | 1,139 | |
714,165 | Koninklijke KPN NV (Netherlands) | 2,605 | |
274,800 | Nippon Telegraph & Telephone Corp. (Japan) | 8,385 | |
285,461 | Telstra Corp. Ltd. (Australia) | 828 | |
15,073 | |||
ELECTRIC UTILITIES—0.2% | |||
22,711 | Orsted AS (Denmark)1 | 2,038 | |
ELECTRICAL EQUIPMENT—2.8% | |||
115,905 | ABB Ltd. (Switzerland) | 4,181 | |
3,635 | Accelleron Industries AG (Switzerland)* | 90 | |
232,208 | Havells India Ltd. (India)* | 3,498 | |
51,371 | Legrand SA (France) | 4,862 | |
235,800 | Mitsubishi Electric Corp. (Japan) | 2,924 | |
27,389 | Schneider Electric SE (France) | 4,776 | |
270,212 | Vestas Wind Systems AS (Denmark)* | 7,477 | |
27,808 | |||
ELECTRONIC EQUIPMENT, INSTRUMENTS & COMPONENTS—1.1% | |||
653,315 | Delta Electronics Inc. (Taiwan) | 6,400 | |
22,200 | Kyocera Corp. (Japan) | 1,165 | |
11,900 | Omron Corp. (Japan) | 698 | |
60,000 | TDK Corp. (Japan) | 2,063 | |
33,700 | Topcon Corp. (Japan) | 480 | |
10,806 | |||
ENERGY EQUIPMENT & SERVICES—0.1% | |||
271,117 | John Wood Group plc (United Kingdom)* | 769 | |
113,028 | Petrofac Ltd. (United Kingdom)* | 102 | |
27,814 | Technip Energies NV (France) | 617 | |
1,488 | |||
ENTERTAINMENT—0.2% | |||
24,055 | CTS Eventim AG & Co. KGaA (Germany) | 1,585 | |
54,668 | Modern Times Group MTG AB Class B (Sweden)* | 439 | |
2,024 | |||
FINANCIAL SERVICES—0.4% | |||
68,643 | Edenred (France) | 4,460 | |
FOOD & STAPLES RETAILING—2.5% | |||
269,788 | Bid Corp. Ltd. (South Africa) | 6,146 | |
252,675 | Clicks Group Ltd. (South Africa) | 3,689 | |
103,706 | Koninklijke Ahold Delhaize NV (Netherlands) | 3,566 | |
71,649 | Loblaw Cos. Ltd. (Canada) | 6,739 | |
17,800 | Matsumotokiyoshi Holdings Co. Ltd. (Japan) | 953 | |
279,974 | Metcash Ltd. (Australia) | 726 | |
35,600 | Seven & I Holdings Co. Ltd. (Japan) | 1,613 | |
466,255 | Tesco plc (United Kingdom) | 1,649 | |
140,921 | X5 Retail Group NV GDR (Russia)* | —x | |
25,081 | |||
FOOD PRODUCTS—1.1% | |||
828,000 | China Mengniu Dairy Co. Ltd. (China)* | 3,342 | |
710,000 | First Pacific Co. Ltd. (Hong Kong) | 238 |
COMMON STOCKS—Continued | |||
Shares | Value | ||
FOOD PRODUCTS—Continued | |||
57,600 | Megmilk Snow Brand Co. Ltd. (Japan) | $827 | |
52,600 | NH Foods Ltd. (Japan) | 1,535 | |
52,300 | Toyo Suisan Kaisha Ltd. (Japan) | 2,335 | |
27,302 | Viscofan SA (Spain) | 1,871 | |
9,600 | Yakult Honsha Co. Ltd. (Japan) | 722 | |
10,870 | |||
GROUND TRANSPORTATION—1.3% | |||
80,427 | Canadian Pacific Kansas City (Canada) | 6,340 | |
574,454 | Localiza Rent A Car Ltd. (Brazil)* | 6,681 | |
13,021 | |||
HEALTH CARE EQUIPMENT & SUPPLIES—2.4% | |||
41,756 | Coloplast AS Class B (Denmark) | 6,016 | |
1,085,293 | ConvaTec Group plc (United Kingdom)1 | 3,000 | |
76,743 | Demant AS (Denmark)* | 3,289 | |
27,172 | EssilorLuxottica SA (France) | 5,380 | |
52,594 | Getinge AB Class B (Sweden) | 1,335 | |
67,583 | Koninklijke Philips NV (Netherlands)* | 1,427 | |
41,193 | Smith & Nephew plc (United Kingdom) | 678 | |
7,715 | Sonova Holding AG (Switzerland) | 2,447 | |
23,572 | |||
HEALTH CARE PROVIDERS & SERVICES—0.8% | |||
62,136 | Amplifon SpA (Italy) | 2,281 | |
76,392 | Fresenius Medical Care AG & Co. KGaA (Germany) | 3,707 | |
97,400 | MediPAL Holdings Corp. (Japan) | 1,488 | |
42,300 | Ship Healthcare Holdings Inc. (Japan) | 746 | |
8,222 | |||
HOTELS, RESTAURANTS & LEISURE—3.1% | |||
50,344 | Aristocrat Leisure Ltd. (Australia) | 1,273 | |
40,401 | Carnival plc (United Kingdom)* | 334 | |
271,688 | Compass Group plc (United Kingdom) | 7,167 | |
258,158 | Entain plc (United Kingdom)* | 4,704 | |
42,686 | Flutter Entertainment plc (Ireland)* | 8,529 | |
287,000 | Galaxy Entertainment Group Ltd. (Hong Kong)* | 2,043 | |
13,563 | InterContinental Hotels Group plc (United Kingdom) | 933 | |
73,978 | Playtech plc (United Kingdom)* | 537 | |
1,182,276 | SSP Group plc (United Kingdom)* | 3,830 | |
231,851 | TUI AG (Germany)* | 1,483 | |
30,833 | |||
HOUSEHOLD DURABLES—1.3% | |||
92,367 | Barratt Developments plc (United Kingdom) | 581 | |
55,476 | GN Store Nord AS (Denmark)* | 1,481 | |
879,400 | Midea Group Co. Ltd. (China) | 7,218 | |
62,700 | Sekisui Chemical Co. Ltd. (Japan) | 892 | |
22,000 | Sony Group Corp. (Japan) | 1,991 | |
673,004 | Taylor Wimpey plc (United Kingdom) | 1,086 | |
13,249 | |||
HOUSEHOLD PRODUCTS—0.5% | |||
59,367 | Reckitt Benckiser Group plc (United Kingdom) | 4,797 | |
INDUSTRIAL CONGLOMERATES—1.2% | |||
214,500 | CK Hutchison Holdings Ltd. (Hong Kong) | 1,434 | |
31,848 | DCC plc (United Kingdom) | 1,981 | |
99,900 | Hitachi Ltd. (Japan) | 5,526 | |
46,000 | Jardine Matheson Holdings Ltd. (Hong Kong) | 2,224 | |
156,100 | Nisshinbo Holdings Inc. (Japan) | 1,202 | |
12,367 |
24
Harbor Diversified International All Cap Fund
Portfolio of Investments—Continued
Value and Cost in Thousands
COMMON STOCKS—Continued | |||
Shares | Value | ||
INSURANCE—6.3% | |||
76,354 | Admiral Group plc (United Kingdom) | $2,219 | |
1,765,600 | AIA Group Ltd. (Hong Kong) | 19,222 | |
160,844 | AXA SA (France) | 5,250 | |
218,900 | Dai-ichi Life Holdings Inc. (Japan) | 4,072 | |
17,580 | Fairfax Financial Holdings Ltd. (Canada) | 12,285 | |
71,800 | Great Eastern Holdings Ltd. (Singapore) | 918 | |
5,889 | Hannover Rueck SE (Germany) | 1,258 | |
4,472 | Helvetia Holding AG (Switzerland) | 669 | |
74,250 | Hiscox Ltd. (United Kingdom) | 1,105 | |
186,600 | Japan Post Holdings Co. Ltd. (Japan) | 1,536 | |
19,350 | Prudential plc (Hong Kong) | 292 | |
155,369 | Prudential plc. (United Kingdom) | 2,377 | |
316,764 | QBE Insurance Group Ltd. (Australia) | 3,239 | |
98,603 | Sampo OYJ (Finland) | 5,001 | |
196,500 | Tokio Marine Holdings Inc. (Japan) | 3,951 | |
63,394 | |||
INTERACTIVE MEDIA & SERVICES—1.2% | |||
233,184 | Auto Trader Group plc (United Kingdom)1 | 1,865 | |
36,022 | Baidu Inc. ADR (China)*,3 | 4,345 | |
58,156 | Carsales.com Ltd. (Australia) | 922 | |
678,352 | Rightmove plc (United Kingdom) | 4,910 | |
12,042 | |||
INTERNET & DIRECT MARKETING RETAIL—1.8% | |||
11,534 | Just Eat Takeaway.com NV (Netherlands)*,1 | 202 | |
53,247 | Naspers Ltd. (South Africa) | 9,492 | |
360,155 | Vipshop Holdings Ltd. ADR (China)*,3 | 5,654 | |
39,189 | Zalando SE (Germany)*,1 | 1,612 | |
61,800 | ZOZO Inc. (Japan) | 1,301 | |
18,261 | |||
IT SERVICES—2.3% | |||
13,901 | ALTEN SA (France) | 2,363 | |
299,985 | Infosys Ltd. ADR (India)3 | 4,662 | |
83,400 | NEC Corp. (Japan) | 3,207 | |
49,100 | NET One Systems Co. Ltd. (Japan)* | 1,158 | |
38,700 | NS Solutions Corp. (Japan) | 1,053 | |
58,500 | NTT Data Corp. (Japan) | 795 | |
5,800 | Reply SpA (Italy) | 676 | |
99,400 | SCSK Corp. (Japan) | 1,501 | |
52,676 | Softcat plc (United Kingdom) | 887 | |
172,964 | Tata Consultancy Services Ltd. (India) | 6,829 | |
23,131 | |||
LEISURE PRODUCTS—0.7% | |||
12,416 | Mips AB (Sweden) | 671 | |
125,000 | Sega Sammy Holdings Inc. (Japan) | 2,337 | |
128,466 | Spin Master Corp. (Canada)1 | 3,655 | |
6,663 | |||
LIFE SCIENCES TOOLS & SERVICES—0.4% | |||
38,262 | Eurofins Scientific SE (France) | 2,673 | |
7,884 | Gerresheimer AG (Germany) | 859 | |
3,532 | |||
MACHINERY—4.0% | |||
31,260 | ALFA Laval AB (Sweden) | 1,147 | |
21,218 | Andritz AG (Austria) | 1,378 | |
342,552 | CNH Industrial NV (Italy) | 4,820 | |
71,300 | Daifuku Co. Ltd. (Japan) | 1,314 | |
123,642 | Fluidra SA (Spain) | 2,118 | |
15,128 | GEA Group AG (Germany) | 711 |
COMMON STOCKS—Continued | |||
Shares | Value | ||
MACHINERY—Continued | |||
70,285 | Iveco Group NV (Italy)* | $632 | |
26,900 | Komatsu Ltd. (Japan) | 669 | |
69,800 | Kubota Corp. (Japan) | 1,058 | |
88,600 | Mitsubishi Heavy Industries Ltd. (Japan) | 3,360 | |
�� 34,600 | Miura Co. Ltd. (Japan) | 922 | |
101,600 | NSK Ltd. (Japan) | 574 | |
127,394 | Rotork plc (United Kingdom) | 525 | |
126,739 | Sandvik AB (Sweden)2 | 2,582 | |
1,328,800 | Sany Heavy Industry Co. Ltd. (China) | 3,170 | |
27,037 | Stabilus SA (Germany) | 1,767 | |
542,500 | Techtronic Industries Co. Ltd. (Hong Kong) | 5,869 | |
27,800 | Toyota Industries Corp. (Japan) | 1,616 | |
94,295 | Wartsila OYJ ABP (Finland) | 1,093 | |
3,031,000 | Weichai Power Co. Ltd. (China) | 4,480 | |
39,805 | |||
MARINE—0.1% | |||
207,747 | Irish Continental Group plc (Ireland) | 1,072 | |
14,800 | Kawasaki Kisen Kaisha Ltd. (Japan) | 352 | |
1,424 | |||
MEDIA—1.6% | |||
193,200 | Fuji Media Holdings Inc. (Japan) | 1,811 | |
91,906 | Future plc (United Kingdom) | 1,304 | |
78,400 | Hakuhodo DY Holdings Inc. (Japan) | 924 | |
104,893 | Informa plc (United Kingdom) | 954 | |
2,084,163 | ITV plc (United Kingdom) | 2,121 | |
78,796 | JCDecaux SA (France)* | 1,744 | |
130,820 | Nippon Television Holdings Inc. (Japan) | 1,177 | |
23,388 | Schibsted ASA Class A (Norway) | 415 | |
10,497 | Schibsted ASA Class B (Norway) | 170 | |
86,200 | TBS Holdings Inc. (Japan) | 1,300 | |
45,453 | Viaplay Group (Sweden)* | 1,162 | |
218,153 | WPP plc (United Kingdom) | 2,542 | |
15,624 | |||
METALS & MINING—5.9% | |||
114,931 | Acerinox SA (Spain)* | 1,242 | |
379,615 | African Rainbow Minerals Ltd. (South Africa) | 4,769 | |
27,825 | Alleima AB (Sweden)* | 143 | |
152,107 | ArcelorMittal SA (France) | 4,321 | |
314,106 | Barrick Gold Corp. (Canada) | 5,972 | |
184,312 | BHP Group Ltd. (Australia) | 5,470 | |
92,997 | BlueScope Steel Ltd. (Australia) | 1,236 | |
36,100 | Dowa Holdings Co. Ltd. (Japan) | 1,179 | |
360,832 | Evolution Mining Ltd. (Australia) | 851 | |
176,584 | First Quantum Minerals Ltd. (Canada) | 4,291 | |
27,687 | Franco-Nevada Corp. (Canada) | 4,201 | |
1,220,113 | Glencore plc (United Kingdom)* | 7,202 | |
84,464 | Newcrest Mining Ltd. (Australia) | 1,613 | |
67,739 | Rio Tinto plc (United Kingdom) | 4,306 | |
320,373 | Severstal PJSC GDR (Russia)* | —x | |
125,172 | Southern Copper Corp. (Peru) | 9,617 | |
60,300 | Sumitomo Metal Mining Co. Ltd. (Japan) | 2,226 | |
58,639 | |||
OIL, GAS & CONSUMABLE FUELS—4.3% | |||
773,610 | Beach Energy Ltd. (Australia) | 762 | |
2,451,062 | BP plc (United Kingdom) | 16,444 | |
149,259 | Canadian Natural Resources Ltd. (Canada) | 9,095 | |
234,173 | Equinor ASA (Norway)2 | 6,742 | |
209,600 | INPEX Corp. (Japan) | 2,294 | |
244,051 | PrairieSky Royalty Ltd. (Canada) | 3,851 |
25
Harbor Diversified International All Cap Fund
Portfolio of Investments—Continued
Value and Cost in Thousands
COMMON STOCKS—Continued | |||
Shares | Value | ||
OIL, GAS & CONSUMABLE FUELS—Continued | |||
535,966 | Santos Ltd. (Australia) | $2,539 | |
74,789 | Woodside Energy Group Ltd. (Australia) | 1,697 | |
43,424 | |||
PAPER & FOREST PRODUCTS—0.2% | |||
501,100 | Oji Holdings Corp. (Japan) | 1,969 | |
PERSONAL PRODUCTS—1.3% | |||
531,971 | Dabur India Ltd. (India) | 3,473 | |
281,459 | L'Occitane International SA (Hong Kong) | 716 | |
578,909 | Marico Ltd. (India)* | 3,530 | |
98,815 | Unilever plc (United Kingdom) | 5,502 | |
13,221 | |||
PHARMACEUTICALS—3.0% | |||
103,383 | Novo Nordisk AS (Denmark) | 17,198 | |
34,875 | Roche Holding AG (Switzerland) | 10,921 | |
14,800 | Sawai Group Holdings Co. Ltd. (Japan) | 428 | |
64,900 | Tsumura & Co. (Japan) | 1,317 | |
29,864 | |||
PROFESSIONAL SERVICES—2.6% | |||
51,942 | Adecco Group AG (Switzerland)* | 1,787 | |
138,843 | ALS Ltd. (Australia) | 1,212 | |
1,863,282 | Capita plc (United Kingdom)* | 814 | |
101,560 | Experian plc (United Kingdom) | 3,596 | |
1,657,534 | Hays plc (United Kingdom) | 2,378 | |
92,006 | Intertek Group plc (United Kingdom) | 4,813 | |
98,366 | IPH Ltd. (Australia) | 532 | |
44,100 | Nomura Co. Ltd. (Japan) | 305 | |
120,711 | PageGroup plc (United Kingdom)* | 689 | |
40,100 | Persol Holdings Co. Ltd. (Japan) | 827 | |
12,623 | Randstad NV (Netherlands) | 686 | |
160,426 | RELX plc (United Kingdom) | 5,345 | |
155,762 | RWS Holdings plc (United Kingdom) | 500 | |
22,900 | TechnoPro Holdings Inc. (Japan) | 625 | |
7,519 | Teleperformance (France) | 1,503 | |
25,612 | |||
REAL ESTATE MANAGEMENT & DEVELOPMENT—0.6% | |||
163,700 | Daiwa House Industry Co. Ltd. (Japan) | 4,172 | |
46,176 | Singapore Land Group Ltd (Singapore) | 76 | |
209,500 | Swire Pacific Ltd. (Hong Kong) | 1,663 | |
5,911 | |||
ROAD & RAIL—0.2% | |||
27,300 | East Japan Railway Co. (Japan) | 1,562 | |
106,800 | Senko Group Holdings Co. Ltd. (Japan) | 763 | |
2,325 | |||
SEMICONDUCTORS & SEMICONDUCTOR EQUIPMENT—2.9% | |||
72,600 | ASM Pacific Technology Ltd. (Hong Kong) | 571 | |
16,054 | ASML Holding NV (Netherlands) | 10,188 | |
142,000 | MediaTek Inc. (Taiwan)* | 3,088 | |
195,900 | Renesas Electronics Corp. (Japan)* | 2,553 | |
3,400 | ROHM Co. Ltd. (Japan) | 256 | |
760,000 | Taiwan Semiconductor Manufacturing Co. Ltd. (Taiwan) | 12,445 | |
29,101 | |||
SOFTWARE—1.0% | |||
4,083 | Constellation Software Inc. (Canada) | 7,992 |
COMMON STOCKS—Continued | |||
Shares | Value | ||
SOFTWARE—Continued | |||
12,250 | Lumine Group Inc. (Canada)* | $165 | |
21,100 | Oracle Corp. (Japan) | 1,514 | |
9,671 | |||
SPECIALTY RETAIL—1.1% | |||
21,300 | ABC-Mart Inc. (Japan) | 1,210 | |
1,384,700 | Esprit Holdings Ltd. (Hong Kong)* | 113 | |
256,839 | Pets at Home Group plc (United Kingdom) | 1,246 | |
63,000 | USS Co. Ltd. (Japan) | 1,059 | |
106,659 | WH Smith plc (United Kingdom) | 2,116 | |
1,136,500 | Zhongsheng Group Holdings Ltd (China) | 4,855 | |
10,599 | |||
TECHNOLOGY HARDWARE, STORAGE & PERIPHERALS—1.6% | |||
513,000 | Advantech Co. Ltd. (Taiwan) | 6,211 | |
20,869 | Logitech International SA (Switzerland) | 1,235 | |
18,704 | Quadient SA (France) | 372 | |
157,811 | Samsung Electronics Co Ltd. (South Korea) | 7,765 | |
15,583 | |||
TEXTILES, APPAREL & LUXURY GOODS—2.1% | |||
17,893 | Adidas AG (Germany) | 3,151 | |
41,541 | Cie Financiere Richemont SA (Switzerland) | 6,867 | |
56,177 | Gildan Activewear Inc. (Canada) | 1,829 | |
463,500 | Li Ning Co. Ltd. (China) | 3,315 | |
303,600 | Samsonite International SA (Hong Kong)*,1 | 962 | |
443,600 | Shenzhou International Group Holdings Ltd. (China) | 4,261 | |
436,570 | Stella International Holdings Ltd. (Hong Kong) | 454 | |
20,839 | |||
THRIFTS & MORTGAGE FINANCE—0.3% | |||
74,355 | Housing Development Finance Corp. Ltd. (India) | 2,528 | |
TRADING COMPANIES & DISTRIBUTORS—1.7% | |||
442,800 | BOC Aviation Ltd. (China)1 | 3,510 | |
49,629 | Brenntag SE (Germany) | 4,045 | |
106,286 | Bunzl plc (United Kingdom) | 4,231 | |
104,587 | Finning International Inc. (Canada) | 2,710 | |
65,100 | ITOCHU Corp. (Japan) | 2,160 | |
29,891 | Rexel SA (France)* | 692 | |
17,348 | |||
TRANSPORTATION INFRASTRUCTURE—0.9% | |||
86,479 | Getlink SE (France) | 1,616 | |
326,634 | Grupo Aeroportuario del Pacifico SAB de CV Class B (Mexico) | 5,808 | |
52,400 | Mitsubishi Logistics Corp. (Japan) | 1,298 | |
8,722 | |||
WIRELESS TELECOMMUNICATION SERVICES—0.3% | |||
30,200 | KDDI Corp. (Japan) | 943 | |
35,984 | Rogers Communications Inc. (Canada) | 1,778 | |
2,721 | |||
TOTAL COMMON STOCKS | |||
(Cost $875,568) | 977,066 | ||
26
Harbor Diversified International All Cap Fund
Portfolio of Investments—Continued
Value and Cost in Thousands
PREFERRED STOCKS—0.3% | |||
(Cost $2,967) | |||
Shares | Value | ||
AUTOMOBILES—0.3% | |||
18,856 | Volkswagen AG (Germany) | $2,575 | |
SHORT-TERM INVESTMENTS—0.9% | |||
(Cost $9,176) | |||
Shares | |||
9,176,318 | State Street Navigator Securities Lending Government Money Market Portfolio (1 day yield of 4.840%)4 | 9,176 | |
TOTAL INVESTMENTS—98.8% | |||
(Cost $887,711) | 988,817 | ||
CASH AND OTHER ASSETS, LESS LIABILITIES—1.2% | 12,198 | ||
TOTAL NET ASSETS—100.0% | $1,001,015 |
RIGHTS/WARRANTS
Description | No. of Contracts | Strike Price | Expiration Date | Cost (000s) | Value (000s) |
Localiza Rent A Car SA Right | 2,570 | BRL 41.15 | 05/11/2023 | $ — | $9 |
FAIR VALUE MEASUREMENTS
The following table summarizes the Fund’s investments as of April 30, 2023 based on the inputs used to value them.
Asset Category | Quoted Prices Level 1 (000s) | Other Significant Observable Inputs Level 2 (000s) | Significant Unobservable Inputs Level 3 (000s) | Total (000s) |
Investments in Securities | ||||
Common Stocks | ||||
Africa | $— | $28,734 | $— | $28,734 |
Europe | 173 | 428,567 | — | 428,740 |
Latin America | 46,165 | — | — | 46,165 |
Middle East/Central Asia | 17,904 | 19,858 | — | 37,762 |
North America | 104,301 | — | — | 104,301 |
Pacific Basin | 9,999 | 321,365 | — | 331,364 |
Preferred Stocks | ||||
Europe | — | 2,575 | — | 2,575 |
Short-Term Investments | ||||
Investment Company-Securities Lending Investment Fund | 9,176 | — | — | 9,176 |
Total Investments in Securities | $187,718 | $801,099 | $— | $988,817 |
Financial Derivative Instruments - Assets | ||||
Rights/Warrants | $9 | $— | $— | $9 |
Total Investments | $187,727 | $801,099 | $— | $988,826 |
For more information on valuation inputs and their aggregation into the levels identified above, please refer to the Fair Value Measurements and Disclosures in Note 2 of the accompanying Notes to Financial Statements.
27
Harbor Diversified International All Cap Fund
Portfolio of Investments—Continued
The following is a rollforward of the Fund’s Level 3 investments during the period ended April 30, 2023.
Valuation Description | Beginning Balance as of 11/01/2022 (000s) | Purchases (000s) | Sales (000s) | Discount/ (Premium) (000s) | Total Realized Gain/(Loss) (000s) | Change in Unrealized Appreciation/ (Depreciation) (000s) | Transfers Into Level 3 (000s) | Transfers Out of Level 3 (000s) | Ending Balance as of 04/30/2023 (000s) | Unrealized Gain/ Loss as of 04/30/2023 (000s) |
Common Stocks | $— | $— | $— | $— | $— | $— | $— | $— | $— | $(11,174 ) |
The following is a summary of significant unobservable inputs used in the fair valuations of assets and liabilities categorized within Level 3 of the fair value hierarchy.
Valuation Descriptions | Ending Balance as of 04/30/2023 (000s) | Valuation Technique | Unobservable Input(s) | Input Value(s) |
Investments in Securities | ||||
Common Stocks | ||||
Severstal PJSC GDR (Russia)* | $ — | Market Approach | Estimated Recovery Value | $ 0.00 |
X5 Retail Group NV GDR (Russia)* | — | Market Approach | Estimated Recovery Value | $ 0.00 |
$— |
* | Non-income producing security |
x | Fair valued in accordance with Harbor Funds' Valuation Procedures. |
1 | Securities purchased in a transaction exempt from registration under Rule 144A of the Securities Act of 1933. These securities may be resold in transactions exempt from registration, normally to qualified institutional buyers. The Fund has no right to demand registration of these securities. As of April 30, 2023, the aggregate value of these securities was $18,389 or 2% of net assets. |
2 | All or a portion of this security was out on loan as of April 30, 2023. |
3 | Depositary receipts such as American Depositary Receipts (ADRs), Global Depositary Receipts (GDRs) and other country specific depositary receipts are certificates evidencing ownership of shares of a foreign issuer. These certificates are issued by depositary banks and generally trade on an established market in the U.S. or elsewhere. |
4 | Represents the investment of collateral received from securities lending activities |
BRL | Brazilian Real |
The accompanying notes are an integral part of the Financial Statements.
28
Harbor Global Leaders Fund
Portfolio of Investments—April 30, 2023 (Unaudited)
Subadvisor: Sands Capital Management, LLC
REGION BREAKDOWN (% of investments)
The Fund’s Portfolio of Investments include investments denominated in foreign currencies. As of April 30, 2023, there was no foreign currency denomination that comprised more than 25% of the Fund’s net assets.
Portfolio of Investments
Value and Cost in Thousands
COMMON STOCKS—99.5% | |||
Shares | Value | ||
AEROSPACE & DEFENSE—5.1% | |||
5,766 | Axon Enterprise Inc. (United States)* | $1,215 | |
2,879 | TransDigm Group Inc. (United States)* | 2,202 | |
3,417 | |||
AUTO COMPONENTS—2.1% | |||
13,345 | Aptiv plc (United States)* | 1,373 | |
BANKS—3.2% | |||
30,139 | HDFC Bank Ltd. ADR (India)1 | 2,104 | |
BROADLINE RETAIL—1.4% | |||
56,975 | Coupang Inc. (South Korea)* | 955 | |
CAPITAL MARKETS—3.6% | |||
168,497 | Allfunds Group plc (Netherlands) | 1,118 | |
11,526 | Intercontinental Exchange Inc. (United States) | 1,255 | |
2,373 | |||
CHEMICALS—2.2% | |||
5,246 | Sika AG (Switzerland) | 1,449 | |
COMMERCIAL SERVICES & SUPPLIES—3.7% | |||
308,650 | Rentokil Initial plc (United Kingdom) | 2,457 | |
CONSUMER STAPLES DISTRIBUTION & RETAIL—3.9% | |||
41,130 | Alimentation Couche-Tard Inc. (Canada) | 2,053 | |
12,570 | Zur Rose Group AG (Switzerland)* | 550 | |
2,603 | |||
DIVERSIFIED CONSUMER SERVICES—3.9% | |||
142,733 | Chegg Inc. (United States)* | 2,566 | |
ELECTRONIC EQUIPMENT, INSTRUMENTS & COMPONENTS—3.9% | |||
5,760 | Keyence Corp. (Japan) | 2,598 | |
ENTERTAINMENT—4.1% | |||
37,356 | Liberty Media Corp. (United Kingdom)* | 2,697 |
COMMON STOCKS—Continued | |||
Shares | Value | ||
FINANCIAL SERVICES—6.7% | |||
854 | Adyen NV (Netherlands)*,2 | $1,372 | |
13,152 | Visa Inc. (United States) | 3,061 | |
4,433 | |||
HEALTH CARE EQUIPMENT & SUPPLIES—2.3% | |||
7,982 | Steris plc (United States) | 1,505 | |
HEALTH CARE PROVIDERS & SERVICES—1.6% | |||
2,157 | UnitedHealth Group Inc. (United States) | 1,061 | |
INSURANCE—4.3% | |||
261,700 | AIA Group Ltd. (Hong Kong) | 2,849 | |
IT SERVICES—6.4% | |||
38,700 | Cloudflare Inc. (United States)* | 1,821 | |
4,038 | Globant SA (Argentina)* | 633 | |
37,501 | Shopify Inc. (Canada)* | 1,817 | |
4,271 | |||
LIFE SCIENCES TOOLS & SERVICES—7.3% | |||
13,635 | Bio-Techne Corp. (United States) | 1,089 | |
10,168 | Iqvia Holdings Inc. (United States)* | 1,914 | |
2,966 | Lonza Group AG (Switzerland) | 1,850 | |
4,853 | |||
MEDIA—3.5% | |||
6,352 | Charter Communications Inc. (United States)* | 2,342 | |
PHARMACEUTICALS—2.3% | |||
8,861 | Zoetis Inc. (United States) | 1,558 | |
PROFESSIONAL SERVICES—5.1% | |||
31,814 | CoStar Group Inc. (United States)* | 2,448 | |
34,650 | Recruit Holdings Co. Ltd. (Japan) | 972 | |
3,420 |
29
Harbor Global Leaders Fund
Portfolio of Investments—Continued
Value and Cost in Thousands
COMMON STOCKS—Continued | |||
Shares | Value | ||
SEMICONDUCTORS & SEMICONDUCTOR EQUIPMENT—5.3% | |||
24,147 | Entegris Inc. (United States) | $1,809 | |
10,326 | Texas Instruments Inc. (United States) | 1,727 | |
3,536 | |||
SOFTWARE—14.6% | |||
1,538 | Constellation Software Inc. (Canada) | 3,011 | |
6,650 | Microsoft Corp. (United States) | 2,043 | |
6,656 | Roper Technologies Inc. (United States) | 3,027 | |
3,600 | ServiceNow Inc. (United States)* | 1,654 | |
9,735 | |||
TRADING COMPANIES & DISTRIBUTORS—3.0% | |||
70,500 | Monotaro Co. Ltd. (Japan) | 1,066 | |
6,178 | Siteone Landscape Supply Inc. (United States)* | 913 | |
1,979 | |||
TOTAL COMMON STOCKS | |||
(Cost $58,144) | 66,134 | ||
TOTAL INVESTMENTS—99.5% | |||
(Cost $58,144) | 66,134 | ||
CASH AND OTHER ASSETS, LESS LIABILITIES—0.5% | 359 | ||
TOTAL NET ASSETS—100.0% | $66,493 |
FAIR VALUE MEASUREMENTS
The following table summarizes the Fund’s investments as of April 30, 2023 based on the inputs used to value them.
Asset Category | Quoted Prices Level 1 (000s) | Other Significant Observable Inputs Level 2 (000s) | Significant Unobservable Inputs Level 3 (000s) | Total (000s) |
Common Stocks | ||||
Europe | $2,697 | $8,796 | $— | $11,493 |
Latin America | 633 | — | — | 633 |
Middle East/Central Asia | 2,104 | — | — | 2,104 |
North America | 43,464 | — | — | 43,464 |
Pacific Basin | 955 | 7,485 | — | 8,440 |
Total Investments in Securities | $49,853 | $16,281 | $— | $66,134 |
For more information on valuation inputs and their aggregation into the levels identified above, please refer to the Fair Value Measurements and Disclosures in Note 2 of the accompanying Notes to Financial Statements.
* | Non-income producing security |
1 | Depositary receipts such as American Depositary Receipts (ADRs), Global Depositary Receipts (GDRs) and other country specific depositary receipts are certificates evidencing ownership of shares of a foreign issuer. These certificates are issued by depositary banks and generally trade on an established market in the U.S. or elsewhere. |
2 | Securities purchased in a transaction exempt from registration under Rule 144A of the Securities Act of 1933. These securities may be resold in transactions exempt from registration, normally to qualified institutional buyers. The Fund has no right to demand registration of these securities. As of April 30, 2023, the aggregate value of these securities was $1,372 or 2% of net assets. |
The accompanying notes are an integral part of the Financial Statements.
30
Harbor International Fund
Portfolio of Investments—April 30, 2023 (Unaudited)
Subadvisor: Marathon Asset Management Limited
REGION BREAKDOWN (% of investments)
(Excludes short-term investments and derivatives)
The Fund’s Portfolio of Investments include investments denominated in foreign currencies. As of April 30, 2023, there was no foreign currency denomination that comprised more than 25% of the Fund’s net assets.
Portfolio of Investments
Value and Cost in Thousands
COMMON STOCKS—97.4% | |||
Shares | Value | ||
AEROSPACE & DEFENSE—1.8% | |||
99,453 | Airbus SE (France) | $13,927 | |
1,811,226 | BAE Systems plc (United Kingdom) | 23,075 | |
583,894 | Melrose Industries plc (United Kingdom) | 3,008 | |
8,389,951 | Rolls-Royce Holdings plc (United Kingdom)* | 16,072 | |
59,693 | Thales SA (France) | 9,109 | |
65,191 | |||
AIR FREIGHT & LOGISTICS—0.2% | |||
1,162,135 | National Express Group plc (United Kingdom)* | 1,776 | |
127,905 | Oesterreichische Post AG (Austria) | 4,927 | |
6,703 | |||
AIRLINES—0.4% | |||
34,480 | Copa Holdings SA (Panama) | 3,114 |
COMMON STOCKS—Continued | |||
Shares | Value | ||
AIRLINES—Continued | |||
1,354,021 | EasyJet plc (United Kingdom)* | $8,495 | |
944,149 | Qantas Airways Ltd. (Australia)* | 4,164 | |
15,773 | |||
AUTO COMPONENTS—0.8% | |||
499,400 | Bridgestone Corp. (Japan) | 20,055 | |
583,894 | Dowlais Group plc (United Kingdom)* | 973 | |
1,306,467 | Gestamp Automocion SA (Spain)1 | 5,656 | |
73,395 | Hankook Tire & Technology Co. Ltd. (South Korea) | 1,896 | |
755,183 | Johnson Electric Holdings Ltd. (Hong Kong) | 844 | |
29,424 |
31
Harbor International Fund
Portfolio of Investments—Continued
Value and Cost in Thousands
COMMON STOCKS—Continued | |||
Shares | Value | ||
AUTOMOBILES—0.6% | |||
177,234 | Bayerische Motoren Werke AG (Germany) | $19,865 | |
8,457 | Hyundai Motor Co. (South Korea) | 1,253 | |
21,118 | |||
BANKS—10.4% | |||
460,476 | Australia & New Zealand Banking Group Ltd (Australia) | 7,477 | |
187,503 | Axis Bank Ltd. (India) | 1,979 | |
3,250,702 | Bank of Ireland Group plc (Ireland)* | 33,622 | |
19,198,407 | Barclays plc (United Kingdom) | 38,674 | |
613,462 | BNP Paribas SA (France)* | 39,638 | |
5,716,728 | CaixaBank SA (Spain) | 21,161 | |
32,422 | Capitec Bank Holdings Ltd. (South Africa) | 2,826 | |
284,713 | Close Brothers Group plc (United Kingdom) | 3,254 | |
90,271 | Danske Bank AS (Denmark)* | 1,908 | |
455,834 | DBS Group Holdings Ltd. (Singapore)* | 11,264 | |
488,366 | DNB Bank ASA (Norway)2 | 8,590 | |
278,200 | Fukuoka Financial Group Inc. (Japan) | 5,240 | |
570,900 | Grupo Financiero Banorte SAB de CV (Mexico)* | 4,948 | |
113,129 | Hana Financial Group Inc. (South Korea) | 3,555 | |
114,779 | HDFC Bank Ltd. ADR (India)3 | 8,012 | |
378,769 | HSBC Holdings plc (Hong Kong) | 2,717 | |
344,334 | Intesa Sanpaolo SpA (Italy)* | 905 | |
301,100 | Kasikornbank PCL (Thailand) | 1,105 | |
53,468,913 | Lloyds Banking Group plc (United Kingdom) | 32,484 | |
11,079,000 | PT Bank Central Asia TBK (Indonesia) | 6,856 | |
6,049,800 | Resona Holdings Inc. (Japan) | 30,152 | |
118,804 | Shinhan Financial Group Co. Ltd. (South Korea)* | 3,110 | |
1,310,059 | Standard Chartered plc (United Kingdom) | 10,380 | |
168,300 | Sumitomo Mitsui Financial Group Inc. (Japan) | 6,879 | |
632,000 | Sumitomo Mitsui Trust Holdings Inc. (Japan) | 22,782 | |
1,586,346 | Svenska Handelsbanken AB (Sweden) | 14,023 | |
1,941,297 | UniCredit SpA (Italy) | 38,468 | |
254,600 | United Overseas Bank Ltd. (Singapore) | 5,407 | |
367,416 | |||
BEVERAGES—4.3% | |||
155,417 | Anheuser-Busch InBev SA/NV (Belgium) | 10,105 | |
259,200 | Arca Continental SAB de CV (Mexico) | 2,476 | |
267,200 | Asahi Group Holdings Ltd. (Japan) | 10,323 | |
87,092 | Carlsberg AS (Denmark) | 14,413 | |
176,192 | Coca-Cola Europacific Partners plc (United States) | 11,359 | |
701,957 | Davide Campari-Milano NV (Italy) | 9,046 | |
569,813 | Diageo plc (United Kingdom) | 25,993 | |
232,994 | Heineken NV (Netherlands) | 26,754 | |
2,254,500 | Kirin Holdings Co. Ltd. (Japan) | 36,625 | |
10,486 | Pernod Ricard SA (France) | 2,422 | |
7,091,900 | Thai Beverage PCL (Singapore) | 3,408 | |
152,924 | |||
BIOTECHNOLOGY—0.4% | |||
71,122 | CSL Ltd. (Australia) | 14,199 | |
BUILDING PRODUCTS—1.6% | |||
1,134,584 | Assa Abloy AB Class B (Sweden) | 27,033 | |
953,112 | Fletcher Building Ltd. (New Zealand) | 2,658 | |
39,787 | Geberit AG (Switzerland) | 22,661 | |
496,690 | GWA Group Ltd. (Australia) | 580 | |
138,900 | LIXIL Group Corp. (Japan) | 2,186 | |
55,118 | |||
CAPITAL MARKETS—2.0% | |||
1,619,335 | 3i Group plc (United Kingdom) | 36,029 |
COMMON STOCKS—Continued | |||
Shares | Value | ||
CAPITAL MARKETS—Continued | |||
738,887 | IG Group Holdings plc (United Kingdom) | $6,821 | |
2,394,037 | Jupiter Fund Management plc (United Kingdom) | 3,918 | |
2,947,900 | Nomura Holdings Inc. (Japan) | 10,568 | |
151,987 | Rathbone Brothers plc (United Kingdom) | 3,738 | |
689,113 | St. James's Place plc (United Kingdom) | 10,480 | |
71,554 | |||
CHEMICALS—1.2% | |||
1,026,000 | Air Water Inc. (Japan) | 12,964 | |
335,979 | BASF SE (Germany) | 17,378 | |
178,400 | Nissan Chemical Corp. (Japan) | 7,929 | |
141,500 | Sumitomo Bakelite Co. Ltd. (Japan) | 5,411 | |
43,682 | |||
COMMERCIAL SERVICES & SUPPLIES—1.0% | |||
63,700 | AEON Delight Co. Ltd. (Japan) | 1,412 | |
60,176 | Befesa SA (Germany)1 | 2,709 | |
351,226 | Brambles Ltd. (Australia) | 3,327 | |
2,480,914 | Cleanaway Waste Management Ltd. (Australia) | 3,995 | |
198,000 | Daiei Kankyo Co. Ltd. (Japan)* | 2,685 | |
176,840 | Elis SA (France) | 3,513 | |
84,900 | SECOM Co. Ltd. (Japan) | 5,436 | |
5,983,593 | Serco Group plc (United Kingdom) | 11,446 | |
34,523 | |||
CONSTRUCTION & ENGINEERING—1.0% | |||
91,092 | Ferrovial SA (Spain) | 2,856 | |
1,020,000 | Infroneer Holdings Inc. (Japan) | 8,057 | |
1,985,000 | Obayashi Corp. (Japan) | 16,549 | |
1,404,500 | Penta-Ocean Construction Co. Ltd. (Japan) | 6,828 | |
30,674 | Taisei Corp. (Japan) | 1,043 | |
35,333 | |||
CONSTRUCTION MATERIALS—1.6% | |||
97,700 | Beijing Oriental Yuhong Waterproof Technology Co. Ltd. Class A (China) | 419 | |
108,851 | CRH plc (Ireland) | 5,252 | |
298,604 | Holcim Ltd. (Switzerland)* | 19,730 | |
18,826 | Imerys SA (France) | 774 | |
73,121 | James Hardie Industries PLC CDI (Australia)*3 | 1,632 | |
746,100 | Taiheiyo Cement Corp. (Japan) | 13,378 | |
47,815 | Vicat SA (France) | 1,395 | |
416,685 | Wienerberger AG (Austria) | 12,552 | |
55,132 | |||
CONSUMER FINANCE—0.4% | |||
1,721,747 | International Personal Finance plc (United Kingdom) | 2,131 | |
441,800 | Marui Group Co. Ltd. (Japan) | 7,039 | |
2,290,775 | Non-Standard Finance plc (United Kingdom)*,1 | 16 | |
1,292,989 | Provident Financial plc (United Kingdom) | 3,657 | |
12,843 | |||
CONSUMER STAPLES DISTRIBUTION—0.3% | |||
454,903 | HelloFresh SE (Germany)* | 12,215 | |
CONTAINERS & PACKAGING—0.7% | |||
3,153,866 | DS Smith plc (United Kingdom) | 12,313 | |
794,400 | Toyo Seikan Group Holdings Ltd. (Japan) | 11,222 | |
23,535 | |||
DISTRIBUTORS—0.4% | |||
1,302,743 | Inchcape plc (United Kingdom) | 13,263 |
32
Harbor International Fund
Portfolio of Investments—Continued
Value and Cost in Thousands
COMMON STOCKS—Continued | |||
Shares | Value | ||
DIVERSIFIED FINANCIAL SERVICES—0.5% | |||
2,379,925 | AMP Ltd. (Australia)* | $1,799 | |
1,717,300 | B3 Brasil Bolsa Balcao SA (Brazil)* | 4,021 | |
410,545 | Chailease Holding Co. Ltd. (Taiwan) | 2,990 | |
306,099 | Challenger Ltd. (Australia) | 1,232 | |
64,845 | Macquarie Group Ltd. (Australia) | 7,911 | |
17,953 | |||
DIVERSIFIED TELECOMMUNICATION SERVICES—1.9% | |||
260,604 | Deutsche Telekom AG (Germany) | 6,284 | |
3,827,943 | Koninklijke KPN NV (Netherlands) | 13,960 | |
1,447,700 | Nippon Telegraph & Telephone Corp. (Japan) | 44,175 | |
862,199 | Telstra Corp. Ltd. (Australia) | 2,501 | |
66,920 | |||
ELECTRIC UTILITIES—0.3% | |||
124,784 | Orsted AS (Denmark)1 | 11,199 | |
ELECTRICAL EQUIPMENT—3.8% | |||
626,045 | ABB Ltd. (Switzerland) | 22,584 | |
22,405 | Accelleron Industries AG (Switzerland)* | 552 | |
140,394 | Havells India Ltd. (India)* | 2,115 | |
281,049 | Legrand SA (France) | 26,602 | |
1,231,600 | Mitsubishi Electric Corp. (Japan) | 15,270 | |
147,241 | Schneider Electric SE (France) | 25,678 | |
1,456,016 | Vestas Wind Systems AS (Denmark)* | 40,289 | |
133,090 | |||
ELECTRONIC EQUIPMENT, INSTRUMENTS & COMPONENTS—0.8% | |||
394,000 | Delta Electronics Inc. (Taiwan) | 3,860 | |
117,800 | Kyocera Corp. (Japan) | 6,183 | |
63,100 | Omron Corp. (Japan) | 3,701 | |
318,100 | TDK Corp. (Japan) | 10,936 | |
179,400 | Topcon Corp. (Japan) | 2,555 | |
27,235 | |||
ENERGY EQUIPMENT & SERVICES—0.2% | |||
1,491,610 | John Wood Group plc (United Kingdom)* | 4,232 | |
225,684 | Petrofac Ltd. (United Kingdom)* | 203 | |
147,525 | Technip Energies NV (France) | 3,273 | |
7,708 | |||
ENTERTAINMENT—0.3% | |||
124,318 | CTS Eventim AG & Co. KGaA (Germany) | 8,191 | |
296,479 | Modern Times Group MTG AB Class B (Sweden)* | 2,383 | |
10,574 | |||
FINANCIAL SERVICES—0.7% | |||
365,591 | Edenred (France) | 23,754 | |
FOOD & STAPLES RETAILING—1.4% | |||
164,105 | Bid Corp. Ltd. (South Africa) | 3,739 | |
153,856 | Clicks Group Ltd. (South Africa) | 2,247 | |
561,597 | Koninklijke Ahold Delhaize NV (Netherlands) | 19,310 | |
94,200 | Matsumotokiyoshi Holdings Co. Ltd. (Japan) | 5,044 | |
887,147 | Metcash Ltd. (Australia) | 2,299 | |
190,600 | Seven & I Holdings Co. Ltd. (Japan) | 8,638 | |
2,548,518 | Tesco plc (United Kingdom) | 9,010 | |
95,013 | X5 Retail Group NV GDR (Russia)* | —x | |
50,287 | |||
FOOD PRODUCTS—1.2% | |||
501,000 | China Mengniu Dairy Co. Ltd. (China)* | 2,022 | |
1,716,000 | First Pacific Co. Ltd. (Hong Kong) | 575 |
COMMON STOCKS—Continued | |||
Shares | Value | ||
FOOD PRODUCTS—Continued | |||
300,600 | Megmilk Snow Brand Co. Ltd. (Japan) | $4,315 | |
274,600 | NH Foods Ltd. (Japan) | 8,014 | |
1,516,000 | Tingyi Cayman Islands Holding Corp. (China) | 2,649 | |
274,300 | Toyo Suisan Kaisha Ltd. (Japan) | 12,247 | |
149,026 | Viscofan SA (Spain) | 10,215 | |
50,900 | Yakult Honsha Co. Ltd. (Japan) | 3,828 | |
43,865 | |||
GROUND TRANSPORTATION—0.1% | |||
349,793 | Localiza Rent A Car Ltd. (Brazil)* | 4,068 | |
HEALTH CARE EQUIPMENT & SUPPLIES—3.6% | |||
225,498 | Coloplast AS Class B (Denmark) | 32,490 | |
5,813,020 | ConvaTec Group plc (United Kingdom)1 | 16,071 | |
419,813 | Demant AS (Denmark)* | 17,992 | |
148,066 | EssilorLuxottica SA (France) | 29,314 | |
290,235 | Getinge AB Class B (Sweden) | 7,366 | |
367,869 | Koninklijke Philips NV (Netherlands)* | 7,766 | |
224,310 | Smith & Nephew plc (United Kingdom) | 3,694 | |
42,588 | Sonova Holding AG (Switzerland) | 13,506 | |
128,199 | |||
HEALTH CARE PROVIDERS & SERVICES—1.3% | |||
341,383 | Amplifon SpA (Italy) | 12,532 | |
413,965 | Fresenius Medical Care AG & Co. KGaA (Germany) | 20,087 | |
510,600 | MediPAL Holdings Corp. (Japan) | 7,801 | |
223,000 | Ship Healthcare Holdings Inc. (Japan) | 3,934 | |
44,354 | |||
HOTELS, RESTAURANTS & LEISURE—4.7% | |||
2,515,000 | Ajisen China Holdings Ltd. (China) | 314 | |
154,995 | Aristocrat Leisure Ltd. (Australia) | 3,921 | |
222,855 | Carnival plc (United Kingdom)* | 1,840 | |
1,475,488 | Compass Group plc (United Kingdom) | 38,925 | |
1,398,565 | Entain plc (United Kingdom)* | 25,483 | |
230,474 | Flutter Entertainment plc (Ireland)* | 46,053 | |
858,000 | Galaxy Entertainment Group Ltd. (Hong Kong)* | 6,107 | |
72,368 | InterContinental Hotels Group plc (United Kingdom) | 4,976 | |
393,221 | Playtech plc (United Kingdom)* | 2,854 | |
6,733,291 | SSP Group plc (United Kingdom)* | 21,815 | |
45,473 | Trip.com Group Ltd. ADR (China)*,3 | 1,615 | |
1,271,019 | TUI AG (Germany)* | 8,128 | |
93,892 | Yum China Holdings Inc. (China) | 5,744 | |
167,775 | |||
HOUSEHOLD DURABLES—1.0% | |||
502,133 | Barratt Developments plc (United Kingdom) | 3,159 | |
301,374 | GN Store Nord AS (Denmark)* | 8,046 | |
544,400 | Midea Group Co. Ltd. (China) | 4,468 | |
332,300 | Sekisui Chemical Co. Ltd. (Japan) | 4,729 | |
117,500 | Sony Group Corp. (Japan) | 10,631 | |
3,706,463 | Taylor Wimpey plc (United Kingdom) | 5,982 | |
37,015 | |||
HOUSEHOLD PRODUCTS—0.7% | |||
320,874 | Reckitt Benckiser Group plc (United Kingdom) | 25,930 | |
INDUSTRIAL CONGLOMERATES—1.7% | |||
650,000 | CK Hutchison Holdings Ltd. (Hong Kong) | 4,345 | |
169,885 | DCC plc (United Kingdom) | 10,570 | |
528,100 | Hitachi Ltd. (Japan) | 29,212 | |
141,800 | Jardine Matheson Holdings Ltd. (Hong Kong) | 6,855 |
33
Harbor International Fund
Portfolio of Investments—Continued
Value and Cost in Thousands
COMMON STOCKS—Continued | |||
Shares | Value | ||
INDUSTRIAL CONGLOMERATES—Continued | |||
21,154 | LG Corp. (South Korea) | $1,384 | |
815,300 | Nisshinbo Holdings Inc. (Japan) | 6,277 | |
58,643 | |||
INSURANCE—5.3% | |||
414,650 | Admiral Group plc (United Kingdom) | 12,051 | |
2,464,000 | AIA Group Ltd. (Hong Kong) | 26,826 | |
878,019 | AXA SA (France) | 28,659 | |
1,150,100 | Dai-ichi Life Holdings Inc. (Japan) | 21,393 | |
208,500 | Great Eastern Holdings Ltd. (Singapore) | 2,664 | |
31,462 | Hannover Rueck SE (Germany) | 6,722 | |
24,493 | Helvetia Holding AG (Switzerland) | 3,664 | |
402,488 | Hiscox Ltd. (United Kingdom) | 5,990 | |
985,900 | Japan Post Holdings Co. Ltd. (Japan) | 8,116 | |
369,000 | Ping An Insurance Group Co. of China Ltd. (China) | 2,692 | |
54,950 | Prudential plc (Hong Kong) | 828 | |
667,273 | Prudential plc. (United Kingdom) | 10,210 | |
988,759 | QBE Insurance Group Ltd. (Australia) | 10,111 | |
535,512 | Sampo OYJ (Finland) | 27,159 | |
1,040,800 | Tokio Marine Holdings Inc. (Japan) | 20,927 | |
188,012 | |||
INTERACTIVE MEDIA & SERVICES—1.3% | |||
1,271,028 | Auto Trader Group plc (United Kingdom)1 | 10,164 | |
41,586 | Baidu Inc. ADR (China)*,3 | 5,016 | |
160,602 | Carsales.com Ltd. (Australia) | 2,547 | |
3,694,638 | Rightmove plc (United Kingdom) | 26,742 | |
44,469 | |||
INTERNET & DIRECT MARKETING RETAIL—0.7% | |||
62,031 | Just Eat Takeaway.com NV (Netherlands)*,1 | 1,088 | |
32,348 | Naspers Ltd. (South Africa) | 5,766 | |
217,751 | Vipshop Holdings Ltd. ADR (China)*,3 | 3,419 | |
207,686 | Zalando SE (Germany)*,1 | 8,542 | |
326,000 | ZOZO Inc. (Japan) | 6,860 | |
25,675 | |||
IT SERVICES—2.0% | |||
76,274 | ALTEN SA (France) | 12,967 | |
181,372 | Infosys Ltd. ADR (India)3 | 2,819 | |
439,100 | NEC Corp. (Japan) | 16,886 | |
257,800 | NET One Systems Co. Ltd. (Japan)* | 6,078 | |
202,900 | NS Solutions Corp. (Japan) | 5,522 | |
308,400 | NTT Data Corp. (Japan) | 4,189 | |
32,402 | Reply SpA (Italy) | 3,775 | |
525,800 | SCSK Corp. (Japan) | 7,938 | |
302,665 | Softcat plc (United Kingdom) | 5,100 | |
104,877 | Tata Consultancy Services Ltd. (India) | 4,141 | |
69,415 | |||
LEISURE PRODUCTS—0.5% | |||
68,736 | Mips AB (Sweden) | 3,717 | |
652,000 | Sega Sammy Holdings Inc. (Japan) | 12,187 | |
15,904 | |||
LIFE SCIENCES TOOLS & SERVICES—0.5% | |||
208,735 | Eurofins Scientific SE (France) | 14,580 | |
42,997 | Gerresheimer AG (Germany) | 4,685 | |
19,265 | |||
MACHINERY—4.2% | |||
66,109 | ALFA Laval AB (Sweden) | 2,425 |
COMMON STOCKS—Continued | |||
Shares | Value | ||
MACHINERY—Continued | |||
115,149 | Andritz AG (Austria) | $7,478 | |
1,852,727 | CNH Industrial NV (Italy) | 26,071 | |
378,700 | Daifuku Co. Ltd. (Japan) | 6,978 | |
676,980 | Fluidra SA (Spain) | 11,597 | |
82,446 | GEA Group AG (Germany) | 3,878 | |
380,312 | Iveco Group NV (Italy)* | 3,422 | |
142,500 | Komatsu Ltd. (Japan) | 3,544 | |
366,600 | Kubota Corp. (Japan) | 5,555 | |
464,300 | Mitsubishi Heavy Industries Ltd. (Japan) | 17,606 | |
183,400 | Miura Co. Ltd. (Japan) | 4,885 | |
535,400 | NSK Ltd. (Japan) | 3,023 | |
693,744 | Rotork plc (United Kingdom) | 2,859 | |
692,420 | Sandvik AB (Sweden) | 14,105 | |
802,600 | Sany Heavy Industry Co. Ltd. (China) | 1,915 | |
147,265 | Stabilus SA (Germany) | 9,624 | |
505,000 | Techtronic Industries Co. Ltd. (Hong Kong) | 5,463 | |
147,500 | Toyota Industries Corp. (Japan) | 8,572 | |
512,624 | Wartsila OYJ ABP (Finland) | 5,945 | |
1,844,000 | Weichai Power Co. Ltd. (China) | 2,726 | |
147,671 | |||
MARINE—0.2% | |||
1,132,072 | Irish Continental Group plc (Ireland) | 5,840 | |
77,800 | Kawasaki Kisen Kaisha Ltd. (Japan) | 1,854 | |
7,694 | |||
MEDIA—2.4% | |||
1,010,800 | Fuji Media Holdings Inc. (Japan) | 9,476 | |
503,204 | Future plc (United Kingdom) | 7,141 | |
407,300 | Hakuhodo DY Holdings Inc. (Japan) | 4,799 | |
568,740 | Informa plc (United Kingdom) | 5,171 | |
11,463,468 | ITV plc (United Kingdom) | 11,668 | |
428,533 | JCDecaux SA (France)* | 9,487 | |
682,800 | Nippon Television Holdings Inc. (Japan) | 6,144 | |
130,169 | Schibsted ASA Class A (Norway) | 2,311 | |
57,830 | Schibsted ASA Class B (Norway) | 936 | |
451,200 | TBS Holdings Inc. (Japan) | 6,803 | |
219,200 | Viaplay Group (Sweden)* | 5,601 | |
1,181,610 | WPP plc (United Kingdom) | 13,771 | |
83,308 | |||
METALS & MINING—4.3% | |||
634,243 | Acerinox SA (Spain)* | 6,853 | |
229,676 | African Rainbow Minerals Ltd. (South Africa) | 2,885 | |
151,419 | Alleima AB (Sweden)* | 777 | |
825,717 | ArcelorMittal SA (France) | 23,458 | |
636,009 | BHP Group Ltd. (Australia) | 18,875 | |
257,885 | BlueScope Steel Ltd. (Australia) | 3,428 | |
188,500 | Dowa Holdings Co. Ltd. (Japan) | 6,158 | |
1,090,371 | Evolution Mining Ltd. (Australia) | 2,571 | |
106,837 | First Quantum Minerals Ltd. (Canada) | 2,596 | |
6,666,101 | Glencore plc (United Kingdom)* | 39,348 | |
252,855 | Newcrest Mining Ltd. (Australia) | 4,828 | |
366,904 | Rio Tinto plc (United Kingdom) | 23,325 | |
217,215 | Severstal PJSC GDR (Russia)* | —x | |
75,916 | Southern Copper Corp. (Peru) | 5,833 | |
317,200 | Sumitomo Metal Mining Co. Ltd. (Japan) | 11,708 | |
152,643 | |||
OIL, GAS & CONSUMABLE FUELS—4.3% | |||
2,350,350 | Beach Energy Ltd. (Australia) | 2,313 | |
13,300,786 | BP plc (United Kingdom) | 89,235 | |
1,274,002 | Equinor ASA (Norway)2 | 36,680 |
34
Harbor International Fund
Portfolio of Investments—Continued
Value and Cost in Thousands
COMMON STOCKS—Continued | |||
Shares | Value | ||
OIL, GAS & CONSUMABLE FUELS—Continued | |||
1,097,200 | INPEX Corp. (Japan) | $12,007 | |
1,713,557 | Santos Ltd. (Australia) | 8,117 | |
248,748 | Woodside Energy Group Ltd. (Australia) | 5,644 | |
153,996 | |||
PAPER & FOREST PRODUCTS—0.3% | |||
2,627,100 | Oji Holdings Corp. (Japan) | 10,324 | |
PERSONAL PRODUCTS—1.0% | |||
20,757 | AMOREPACIFIC Group (South Korea) | 569 | |
322,354 | Dabur India Ltd. (India) | 2,104 | |
868,250 | L'Occitane International SA (Hong Kong) | 2,209 | |
350,011 | Marico Ltd. (India)* | 2,134 | |
533,090 | Unilever plc (United Kingdom) | 29,684 | |
36,700 | |||
PHARMACEUTICALS—4.6% | |||
559,672 | Novo Nordisk AS (Denmark) | 93,104 | |
188,713 | Roche Holding AG (Switzerland) | 59,094 | |
78,900 | Sawai Group Holdings Co. Ltd. (Japan) | 2,283 | |
340,100 | Tsumura & Co. (Japan) | 6,901 | |
161,382 | |||
PROFESSIONAL SERVICES—3.8% | |||
282,219 | Adecco Group AG (Switzerland)* | 9,708 | |
366,086 | ALS Ltd. (Australia) | 3,195 | |
9,849,469 | Capita plc (United Kingdom)* | 4,305 | |
557,299 | Experian plc (United Kingdom) | 19,731 | |
9,076,807 | Hays plc (United Kingdom) | 13,022 | |
498,065 | Intertek Group plc (United Kingdom) | 26,056 | |
309,467 | IPH Ltd. (Australia) | 1,674 | |
234,500 | Nomura Co. Ltd. (Japan) | 1,624 | |
659,132 | PageGroup plc (United Kingdom)* | 3,762 | |
216,700 | Persol Holdings Co. Ltd. (Japan) | 4,468 | |
69,047 | Randstad NV (Netherlands) | 3,752 | |
870,477 | RELX plc (United Kingdom) | 29,003 | |
861,547 | RWS Holdings plc (United Kingdom) | 2,766 | |
120,300 | TechnoPro Holdings Inc. (Japan) | 3,282 | |
41,351 | Teleperformance (France) | 8,264 | |
134,612 | |||
REAL ESTATE MANAGEMENT & DEVELOPMENT—0.8% | |||
863,800 | Daiwa House Industry Co. Ltd. (Japan) | 22,017 | |
652,500 | Swire Pacific Ltd. (Hong Kong) | 5,180 | |
27,197 | |||
ROAD & RAIL—0.3% | |||
144,400 | East Japan Railway Co. (Japan) | 8,263 | |
564,000 | Senko Group Holdings Co. Ltd. (Japan) | 4,030 | |
12,293 | |||
SEMICONDUCTORS & SEMICONDUCTOR EQUIPMENT—1.5% | |||
219,700 | ASM Pacific Technology Ltd. (Hong Kong) | 1,727 | |
43,325 | ASML Holding NV (Netherlands) | 27,495 | |
86,000 | MediaTek Inc. (Taiwan)* | 1,870 | |
1,026,100 | Renesas Electronics Corp. (Japan)* | 13,373 | |
17,900 | ROHM Co. Ltd. (Japan) | 1,348 | |
462,000 | Taiwan Semiconductor Manufacturing Co. Ltd. (Taiwan) | 7,565 | |
53,378 | |||
SOFTWARE—0.2% | |||
109,800 | Oracle Corp. (Japan) | 7,880 |
COMMON STOCKS—Continued | |||
Shares | Value | ||
SPECIALTY RETAIL—1.0% | |||
112,100 | ABC-Mart Inc. (Japan) | $6,371 | |
3,987,400 | Esprit Holdings Ltd. (Hong Kong)* | 326 | |
1,400,939 | Pets at Home Group plc (United Kingdom) | 6,796 | |
332,300 | USS Co. Ltd. (Japan) | 5,584 | |
593,813 | WH Smith plc (United Kingdom) | 11,779 | |
690,000 | Zhongsheng Group Holdings Ltd (China) | 2,947 | |
33,803 | |||
TECHNOLOGY HARDWARE, STORAGE & PERIPHERALS—0.6% | |||
309,000 | Advantech Co. Ltd. (Taiwan) | 3,741 | |
114,218 | Logitech International SA (Switzerland) | 6,759 | |
106,944 | Quadient SA (France) | 2,126 | |
190,264 | Samsung Electronics Co Ltd. (South Korea) | 9,362 | |
21,988 | |||
TEXTILES, APPAREL & LUXURY GOODS—1.9% | |||
97,229 | Adidas AG (Germany) | 17,123 | |
226,103 | Cie Financiere Richemont SA (Switzerland) | 37,375 | |
27,511 | CIE Financiere Richemont SA (South Africa) | 4,534 | |
281,000 | Li Ning Co. Ltd. (China) | 2,010 | |
910,800 | Samsonite International SA (Hong Kong)*,1 | 2,886 | |
270,318 | Shenzhou International Group Holdings Ltd. (China) | 2,596 | |
926,521 | Stella International Holdings Ltd. (Hong Kong) | 965 | |
67,489 | |||
THRIFTS & MORTGAGE FINANCE—0.0% | |||
44,912 | Housing Development Finance Corp. Ltd. (India) | 1,527 | |
TRADING COMPANIES & DISTRIBUTORS—1.8% | |||
267,700 | BOC Aviation Ltd. (China)1 | 2,122 | |
269,927 | Brenntag SE (Germany) | 22,000 | |
582,408 | Bunzl plc (United Kingdom) | 23,184 | |
344,400 | ITOCHU Corp. (Japan) | 11,426 | |
160,041 | Rexel SA (France)* | 3,707 | |
62,439 | |||
TRANSPORTATION INFRASTRUCTURE—0.5% | |||
475,745 | Getlink SE (France) | 8,891 | |
197,484 | Grupo Aeroportuario del Pacifico SAB de CV Class B (Mexico) | 3,512 | |
275,400 | Mitsubishi Logistics Corp. (Japan) | 6,824 | |
19,227 | |||
WIRELESS TELECOMMUNICATION SERVICES—0.1% | |||
158,600 | KDDI Corp. (Japan) | 4,951 | |
TOTAL COMMON STOCKS | |||
(Cost $2,918,047) | 3,451,757 | ||
PREFERRED STOCKS—0.4% | |||
AUTOMOBILES—0.4% | |||
101,388 | Volkswagen AG (Germany) | 13,845 | |
PERSONAL PRODUCTS—0.0% | |||
8,795 | AMOREPACIFIC Group (South Korea) | 169 | |
TOTAL PREFERRED STOCKS | |||
(Cost $16,057) | 14,014 | ||
35
Harbor International Fund
Portfolio of Investments—Continued
Value and Cost in Thousands
SHORT-TERM INVESTMENTS—0.1% | |||
(Cost $4,158) | |||
Shares | Value | ||
4,158,390 | State Street Navigator Securities Lending Government Money Market Portfolio (1 day yield of 4.840%)4 | $4,158 | |
TOTAL INVESTMENTS—97.9% | |||
(Cost $2,938,262) | 3,469,929 | ||
CASH AND OTHER ASSETS, LESS LIABILITIES—2.1% | 75,425 | ||
TOTAL NET ASSETS—100.0% | $3,545,354 |
RIGHTS/WARRANTS
Description | No. of Contracts | Strike Price | Expiration Date | Cost (000s) | Value (000s) |
CIE Financiere Richemont SA Warrant | 74,788 | ZAR 4.95 | 11/22/2023 | $ — | $ 95 |
Localiza Rent A Car SA Right | 1,597 | BRL 41.15 | 05/11/2023 | — | 6 |
Total Rights/Warrants | $101 |
FAIR VALUE MEASUREMENTS
The following table summarizes the Fund’s investments as of April 30, 2023 based on the inputs used to value them.
Asset Category | Quoted Prices Level 1 (000s) | Other Significant Observable Inputs Level 2 (000s) | Significant Unobservable Inputs Level 3 (000s) | Total (000s) |
Common Stocks | ||||
Africa | $4,535 | $17,463 | $— | $21,998 |
Europe | 973 | 2,286,233 | — | 2,287,206 |
Latin America | 27,972 | — | — | 27,972 |
Middle East/Central Asia | 10,830 | 14,000 | — | 24,830 |
North America | 13,955 | — | — | 13,955 |
Pacific Basin | 16,899 | 1,058,897 | — | 1,075,796 |
Preferred Stocks | ||||
Europe | — | 13,845 | — | 13,845 |
Pacific Basin | — | 169 | — | 169 |
Short-Term Investments | ||||
Investment Company-Securities Lending Investment Fund | 4,158 | — | — | 4,158 |
Total Investments in Securities | $79,322 | $3,390,607 | $— | $3,469,929 |
Financial Derivative Instruments - Assets | ||||
Rights/Warrants | $101 | $— | $— | $101 |
Total Investments | $79,423 | $3,390,607 | $— | $3,470,030 |
For more information on valuation inputs and their aggregation into the levels identified above, please refer to the Fair Value Measurements and Disclosures in Note 2 of the accompanying Notes to Financial Statements.
The following is a rollforward of the Fund’s Level 3 investments during the period ended April 30, 2023.
Valuation Description | Beginning Balance as of 11/01/2022 (000s) | Purchases (000s) | Sales (000s) | Discount/ (Premium) (000s) | Total Realized Gain/(Loss) (000s) | Change in Unrealized Appreciation/ (Depreciation ) (000s) | Transfers Into Level 3 (000s) | Transfers Out of Level 3 (000s) | Ending Balance as of 04/30/2023 (000s) | Unrealized Gain/ Loss as of 04/30/2023 (000s) |
Common Stocks | $— | $— | $— | $— | $— | $— | $— | $— | $— | $(7,678 ) |
36
Harbor International Fund
Portfolio of Investments—Continued
The following is a summary of significant unobservable inputs used in the fair valuations of assets and liabilities categorized within Level 3 of the fair value hierarchy.
Valuation Descriptions | Ending Balance as of 04/30/2023 (000s) | Valuation Technique | Unobservable Input(s) | Input Value(s) |
Investments in Securities | ||||
Common Stocks | ||||
Severstal PJSC GDR (Russia)* | $ — | Market Approach | Estimated Recovery Value | $ 0.00 |
X5 Retail Group NV GDR (Russia)* | — | Market Approach | Estimated Recovery Value | $ 0.00 |
$— |
* | Non-income producing security |
x | Fair valued in accordance with Harbor Funds' Valuation Procedures. |
1 | Securities purchased in a transaction exempt from registration under Rule 144A of the Securities Act of 1933. These securities may be resold in transactions exempt from registration, normally to qualified institutional buyers. The Fund has no right to demand registration of these securities. As of April 30, 2023, the aggregate value of these securities was $60,453 or 2% of net assets. |
2 | All or a portion of this security was out on loan as of April 30, 2023. |
3 | Depositary receipts such as American Depositary Receipts (ADRs), Global Depositary Receipts (GDRs) and other country specific depositary receipts are certificates evidencing ownership of shares of a foreign issuer. These certificates are issued by depositary banks and generally trade on an established market in the U.S. or elsewhere. |
4 | Represents the investment of collateral received from securities lending activities |
BRL | Brazilian Real |
ZAR | South African Rand |
The accompanying notes are an integral part of the Financial Statements.
37
Harbor International Core Fund
Portfolio of Investments—April 30, 2023 (Unaudited)
Subadvisor: Acadian Asset Management LLC
REGION BREAKDOWN (% of investments)
The Fund’s Portfolio of Investments include investments denominated in foreign currencies. As of April 30, 2023, 25.6% of the Fund’s investments were denominated in Euro. No other foreign currency denomination comprised more than 25% of the Fund’s net assets.
Portfolio of Investments
Value and Cost in Thousands
COMMON STOCKS—97.1% | |||
Shares | Value | ||
AEROSPACE & DEFENSE—1.9% | |||
1,128 | Dassault Aviation SA (France) | $221 | |
1,959 | Kongsberg Gruppen ASA (Norway) | 88 | |
12,645 | QinetiQ Group plc (United Kingdom) | 59 | |
539,952 | Rolls-Royce Holdings plc (United Kingdom)* | 1,034 | |
9,764 | Thales SA (France) | 1,490 | |
2,892 | |||
AIR FREIGHT & LOGISTICS—0.0% | |||
169 | Mainfreight Ltd. (New Zealand) | 8 |
COMMON STOCKS—Continued | |||
Shares | Value | ||
AIRLINES—2.5% | |||
103,975 | Air Arabia PJSC (United Arab Emirates) | $62 | |
196,278 | Deutsche Lufthansa AG (Germany)* | 2,110 | |
391,553 | Qantas Airways Ltd. (Australia)* | 1,727 | |
3,899 | |||
AUTO COMPONENTS—0.2% | |||
5,641 | Bulten AB (Sweden) | 52 | |
4,933 | ElringKlinger AG (Germany) | 56 | |
8,700 | Ichikoh Industries Ltd. (Japan) | 35 | |
28,000 | Johnson Electric Holdings Ltd. (Hong Kong) | 31 |
38
Harbor International Core Fund
Portfolio of Investments—Continued
Value and Cost in Thousands
COMMON STOCKS—Continued | |||
Shares | Value | ||
AUTO COMPONENTS—Continued | |||
8,986 | Martinrea International Inc. (Canada) | $94 | |
2,400 | T. RAD Co. Ltd. (Japan)* | 42 | |
6,500 | Thai Stanley Electric PCL NVDR (Thailand)2 | 35 | |
345 | |||
BANKS—5.5% | |||
24,014 | ABN AMRO Bank NV Dutch Depository Recepit (Netherlands)1,2 | 385 | |
119,012 | Australia & New Zealand Banking Group Ltd (Australia) | 1,932 | |
150,900 | Bangkok Bank PCL NVDR (Thailand)2 | 696 | |
2,452 | Bank Handlowy w Warszawie SA (Poland) | 53 | |
71,494 | Bank Leumi Le-Israel BM (Israel) | 567 | |
834,000 | China Construction Bank Corp. (China) | 557 | |
32,260 | Commercial Bank of Dubai PSC (United Arab Emirates) | 39 | |
4,300 | Ehime Bank Ltd. (The) (Japan) | 27 | |
15,832 | Erste Group Bank AG (Austria) | 576 | |
53,361 | Faisal Islamic Bank of Egypt (Egypt) | 57 | |
352,712 | Lloyds Banking Group plc (United Kingdom) | 214 | |
261,577 | NatWest Group plc (United Kingdom) | 862 | |
22,000 | North Pacific Bank Ltd. (Japan) | 47 | |
741,065 | PT Bank Danamon Indonesia TBK (Indonesia) | 143 | |
14,933 | Raiffeisen Bank International AG (Austria) | 229 | |
3,400 | Shikoku Bank Ltd. (Japan) | 22 | |
139,939 | Standard Chartered plc (United Kingdom) | 1,109 | |
11,100 | Towa Bank Ltd. (Japan) | 46 | |
50,212 | UniCredit SpA (Italy) | 995 | |
8,556 | |||
BEVERAGES—1.2% | |||
56,842 | Australian Vintage Ltd. (Australia) | 19 | |
3,442 | Coca-Cola HBC AG (Switzerland)* | 105 | |
2,013 | Corby Spirit and Wine Ltd. (Canada) | 23 | |
14,638 | Ginebra San Miguel Inc. (Philippines) | 39 | |
16,942 | Heineken Holding NV (Netherlands) | 1,626 | |
3,800 | Primo Water Corp. (Canada) | 58 | |
1,870 | |||
BIOTECHNOLOGY—0.1% | |||
48,544 | Aroa Biosurgery Ltd. (New Zealand)* | 34 | |
1,926 | Swedish Orphan Biovitrum AB (Sweden)* | 47 | |
81 | |||
BROADLINE RETAIL—0.2% | |||
15,156 | MINISO Group Holding Ltd. ADR (China)*,2 | 279 | |
BUILDING PRODUCTS—1.3% | |||
10,800 | BRC Asia Ltd. (Singapore) | 14 | |
31,743 | Compagnie de Saint-Gobain SA (France) | 1,838 | |
5,400 | Maezawa Kasei Industries Co. Ltd. (Japan) | 65 | |
4,400 | Okabe Co. Ltd. (Japan) | 27 | |
97,898 | RAS Al Khaimah Ceramics (United Arab Emirates) | 70 | |
2,014 | |||
CAPITAL MARKETS—2.1% | |||
12,400 | AGF Management Ltd. Class B (Canada) | 69 | |
315 | Cie Financiere Tradition SA (Switzerland) | 42 | |
99,657 | Deutsche Bank AG (Germany) | 1,095 | |
956 | Deutsche Boerse AG (Germany) | 182 | |
2,082 | Fiducian Group Ltd. (Australia) | 8 | |
2,256 | Foresight Group Holdings Ltd. (United Kingdom)* | 12 | |
83,841 | Investec plc (United Kingdom) | 468 | |
4,100 | IwaiCosmo Holdings Inc. (Japan) | 40 | |
18,600 | Japan Exchange Group Inc. (Japan) | 302 |
COMMON STOCKS—Continued | |||
Shares | Value | ||
CAPITAL MARKETS—Continued | |||
131,408 | Man Group plc (Jersey) | $376 | |
1,446 | Titanium OYJ (Finland) | 25 | |
5,500 | TMX Group Ltd. (Canada)* | 557 | |
3,176 | |||
CHEMICALS—2.8% | |||
2,500 | Achilles Corp. (Japan) | 27 | |
6,800 | AirBoss of America Corp. (Canada) | 36 | |
1,200 | Asahi Yukizai Corp. (Japan) | 28 | |
5,600 | Carlit Holdings Co. Ltd. (Japan) | 29 | |
2,900 | DAI Nippon Toryo Co. Ltd. (Japan) | 18 | |
89,325 | Danakali Ltd. (Australia)* | 24x | |
18,476 | DGL Group Ltd. (Australia)* | 18 | |
2,900 | Fujimori Kogyo Co. Ltd. (Japan) | 67 | |
800 | Hodogaya Chemical Co. Ltd. (Japan) | 18 | |
318,537 | Incitec Pivot Ltd. (Australia) | 679 | |
2,800 | Ishihara Sangyo Kaisha Ltd. (Japan) | 24 | |
699 | Johnson Matthey plc (United Kingdom) | 17 | |
510 | KPX Chemical Co. Ltd. (South Korea) | 18 | |
2,800 | Kyowa Leather Cloth Co. Ltd. (Japan) | 11 | |
3,426 | Misr Fertilizers Production Co. SAE (Egypt) | 20 | |
2,000 | Moresco Corp. (Japan) | 17 | |
7,786 | Neo Performance Materials Inc. (Canada) | 52 | |
4,200 | Nihon Parkerizing Co. Ltd. (Japan) | 33 | |
2,200 | Nippon Carbide Industries Co. Inc. (Japan) | 21 | |
1,300 | Okura Industrial Co. Ltd. (Japan) | 20 | |
80,933 | Orica Ltd. (Australia) | 874 | |
728 | PCC Rokita SA (Poland) | 25 | |
7,100 | Riken Technos Corp. (Japan)* | 32 | |
5,600 | Sekisui Kasei Co. Ltd. (Japan) | 19 | |
2,985 | Serge Ferrari Group (France) | 46 | |
600 | Soken Chemical & Engineering Co. Ltd. (Japan) | 8 | |
3,904 | Solvay SA (Belgium) | 469 | |
1,100 | Sumitomo Seika Chemicals Co. Ltd. (Japan) | 35 | |
2,400 | Tayca Corp. (Japan) | 21 | |
16,600 | Tokuyama Corp. (Japan) | 271 | |
32,917 | Yara International ASA (Norway) | 1,325 | |
4,302 | |||
COMMERCIAL SERVICES & SUPPLIES—1.0% | |||
4,000 | AEON Delight Co. Ltd. (Japan) | 89 | |
2,100 | AGS Corp. (Japan) | 11 | |
800 | AJIS Co. Ltd. (Japan) | 14 | |
4,000 | Azienda Bresciana Petroli Nocivelli SpA (Italy)* | 17 | |
47,073 | Brambles Ltd. (Australia) | 446 | |
1,074 | Cewe Stiftung + Co. KGAA (Germany) | 110 | |
340 | Fursys Inc. (South Korea) | 7 | |
2,746 | GL Events SA (France)* | 66 | |
15,710 | ISS AS (Denmark)* | 328 | |
14,200 | Kokuyo Co. Ltd. (Japan) | 203 | |
1,800 | Kyodo Printing Co. Ltd. (Japan) | 37 | |
8,961 | Mears Group plc (United Kingdom) | 25 | |
2,400 | NAC Co. Ltd. (Japan) | 17 | |
5,900 | Prestige International Inc. (Japan) | 26 | |
1,900 | SATO Holdings Corp. (Japan) | 32 | |
1,501 | SPIE SA (France) | 47 | |
2,500 | Takara + Co. Ltd. (Japan) | 44 | |
1,519 | |||
CONSTRUCTION & ENGINEERING—0.3% | |||
406,000 | Analogue Holdings Ltd. (Hong Kong) | 76 | |
13,188 | Boustead Singapore Ltd. (Singapore) | 8 | |
305 | Burkhalter Holding AG (Switzerland)* | 33 |
39
Harbor International Core Fund
Portfolio of Investments—Continued
Value and Cost in Thousands
COMMON STOCKS—Continued | |||
Shares | Value | ||
CONSTRUCTION & ENGINEERING—Continued | |||
1,900 | Dai-Ichi Cutter Kogyo KK (Japan) | $17 | |
424 | Hochtief AG (Germany) | 35 | |
1,706 | Implenia AG (Switzerland) | 77 | |
3,816 | Lycopodium Ltd. (Australia) | 26 | |
3,900 | Meisei Industrial Co. Ltd. (Japan) | 27 | |
905 | Morgan Sindall Group plc (United Kingdom) | 19 | |
122,700 | Naim Holdings BHD (Malaysia)* | 15 | |
3,722 | Orascom Construction plc (United Arab Emirates) | 12 | |
133,009 | SRG Global Ltd. (Australia) | 67 | |
7,700 | Tomoe Corp. (Japan) | 25 | |
1,500 | Yondenko Corp. (Japan) | 22 | |
459 | |||
CONSTRUCTION MATERIALS—0.7% | |||
4,100 | Asia Pile Holdings Corp. (Japan) | 22 | |
66,764 | Breedon Group plc (United Kingdom) | 58 | |
9,139 | Heidelbergcement AG (Germany) | 692 | |
12,394 | Qatar National Cement Co. QPSC (Qatar) | 14 | |
800 | Shinagawa Refractories Co. Ltd. (Japan) | 27 | |
29,705 | Wagners Holding Co. Ltd. (Australia)* | 15 | |
9,027 | Wienerberger AG (Austria) | 272 | |
1,100 | |||
CONSUMER FINANCE—0.0% | |||
3,300 | AEON Financial Service Co. Ltd. (Japan) | 29 | |
284 | H&T Group plc (United Kingdom) | 2 | |
31 | |||
CONSUMER STAPLES DISTRIBUTION—0.0% | |||
500 | Tsuruha Holdings Inc. (Japan) | 33 | |
CONTAINERS & PACKAGING—0.2% | |||
9,998 | DS Smith plc (United Kingdom) | 39 | |
39,400 | Hanwell Holdings Ltd. (Singapore) | 11 | |
11,718 | Orora Ltd. (Australia) | 27 | |
6,177 | Pro-Pac Packaging Ltd. (Australia)* | 1 | |
1,900 | Richards Packaging Income Fund (Canada) | 54 | |
9,900 | Thantawan Industry PCL NVDR (Thailand)2 | 9 | |
1,700 | Tomoku Co. Ltd. (Japan) | 20 | |
579 | Vetropack Holding AG (Switzerland) | 30 | |
1,308 | Winpak Ltd. (Canada) | 44 | |
235 | |||
DISTRIBUTORS—0.1% | |||
4,194 | Inchcape plc (United Kingdom) | 43 | |
52,861 | Smiths News plc (United Kingdom)* | 35 | |
1,731 | Uni-Select Inc. (Canada)* | 59 | |
137 | |||
DIVERSIFIED CONSUMER SERVICES—0.1% | |||
2,926 | JLS Co. Ltd. (South Korea) | 16 | |
22,700 | JP-Holdings Inc. (Japan)* | 52 | |
2,713 | MegaStudy Co Ltd. (South Korea) | 23 | |
4,500 | Meiko Network Japan Co. Ltd. (Japan) | 22 | |
3,700 | Tear Corp. (Japan) | 12 | |
125 | |||
DIVERSIFIED FINANCIAL SERVICES—0.0% | |||
95,700 | Pacific Century Regional Developments Ltd. (Singapore)* | 27 | |
DIVERSIFIED TELECOMMUNICATION SERVICES—0.0% | |||
4,273 | B Communications Ltd. (Israel)* | 14 |
COMMON STOCKS—Continued | |||
Shares | Value | ||
DIVERSIFIED TELECOMMUNICATION SERVICES—Continued | |||
604 | Magyar Telekom Telecommunications plc ADR (Hungary)2 | $4 | |
125 | Telefonica SA (Spain)* | 1 | |
19 | |||
ELECTRICAL EQUIPMENT—1.6% | |||
36,551 | ABB Ltd. (Switzerland) | 1,318 | |
5,600 | Chiyoda Integre Co. Ltd. (Japan) | 96 | |
1,700 | Daihen Corp. (Japan) | 56 | |
2,000 | Hammond Power Solutions Inc. (Canada) | 59 | |
1,000 | Mirai Industry Co. Ltd. (Japan) | 16 | |
70,600 | Mitsubishi Electric Corp. (Japan) | 875 | |
2,500 | Sinfonia Technology Co. Ltd. (Japan) | 32 | |
2,200 | Takaoka Toko Co. Ltd. (Japan) | 33 | |
51,000 | Xingye Alloy Materials Group Ltd. (Hong Kong)* | 7 | |
2,492 | |||
ELECTRONIC EQUIPMENT, INSTRUMENTS & COMPONENTS—1.0% | |||
912 | AT&S Austria Technologie & Systemtechnik AG (Austria)* | 28 | |
4,800 | Azbil Corp. (Japan) | 134 | |
7,300 | Celestica Inc. (Canada)* | 79 | |
2,300 | Daitron Co. Ltd. (Japan) | 44 | |
77,905 | DataTec Ltd. (South Africa)* | 155 | |
5,000 | Kyosan Electric Manufacturing Co. Ltd. (Japan) | 16 | |
265 | Nedap NV (Netherlands) | 16 | |
2,700 | Nihon Denkei Co. Ltd. (Japan) | 38 | |
7,200 | Optex Group Co. Ltd. (Japan) | 108 | |
3,800 | Osaki Electric Co. Ltd. (Japan) | 16 | |
12,592 | Rakon Ltd. (New Zealand)* | 8 | |
10 | Schaffner Holding AG (Switzerland) | 3 | |
2,700 | Sigma Koki Co. Ltd. (Japan) | 32 | |
2,700 | SMK Corp. (Japan) | 48 | |
3,689 | Spectris plc (United Kingdom) | 175 | |
2,000 | Sun-Wa Technos Corp. (Japan) | 28 | |
7,700 | Topcon Corp. (Japan) | 110 | |
29,000 | Yokogawa Electric Corp. (Japan) | 471 | |
1,509 | |||
ENERGY EQUIPMENT & SERVICES—0.9% | |||
8,560 | Computer Modelling Group Ltd. (Canada) | 45 | |
9,400 | Ensign Energy Services Inc. (Canada)* | 18 | |
13,597 | Hunting plc (United Kingdom) | 40 | |
62,210 | MMA Offshore Ltd. (Australia)* | 50 | |
6,500 | MODEC Inc. (Japan)* | 70 | |
10,553 | Pason Systems Inc. (Canada) | 92 | |
23,013 | PHX Energy Services Corp. (Canada) | 115 | |
5,730 | Shawcor Ltd. (Canada)* | 52 | |
9,418 | Technip Energies NV (France) | 209 | |
42,615 | Tenaris SA (Luxembourg) | 610 | |
14,300 | Trican Well Service Ltd. (Canada)* | 33 | |
1,334 | |||
ENTERTAINMENT—0.8% | |||
7,900 | Ateam Inc. (Japan) | 39 | |
9,800 | Capcom Co. Ltd. (Japan) | 369 | |
46,000 | IGG Inc. (Singapore)* | 38 | |
397 | PlayWay SA (Poland) | 40 | |
5,323 | Spotify Technology SA (Sweden)* | 711 | |
1,197 | |||
EQUITY REAL ESTATE INVESTMENT TRUSTS (REITs)—0.0% | |||
57,300 | Pavilion Real Estate Investment Trust (Malaysia)* | 18 |
40
Harbor International Core Fund
Portfolio of Investments—Continued
Value and Cost in Thousands
COMMON STOCKS—Continued | |||
Shares | Value | ||
FINANCIAL SERVICES—0.1% | |||
800 | GMO Financial Gate Inc. (Japan) | $64 | |
2,200 | Zenkoku Hosho Co. Ltd. (Japan) | 81 | |
145 | |||
FOOD & STAPLES RETAILING—1.3% | |||
2,000 | Axial Retailing Inc. (Japan) | 52 | |
16,210 | Eurocash SA (Poland)* | 74 | |
8,600 | George Weston Ltd. (Canada) | 1,155 | |
6,564 | Jeronimo Martins SGPS SA (Portugal) | 166 | |
6,895 | Kitwave Group plc (United Kingdom)* | 23 | |
6,800 | Lawson Inc. (Japan) | 309 | |
2,600 | Mitsubishi Shokuhin Co. Ltd. (Japan) | 67 | |
3,600 | Orsero SpA (Italy) | 50 | |
2,700 | Qol Holdings Co. Ltd. (Japan) | 25 | |
1,300 | Toho Co. Ltd. (Japan) | 23 | |
1,944 | |||
FOOD PRODUCTS—0.4% | |||
12,400 | AustAsia Group Ltd. (Singapore)* | 5 | |
469,500 | CCK Consolidated Holdings BHD (Malaysia) | 75 | |
1,500,000 | China Starch Holdings Ltd. (Hong Kong) | 37 | |
39,400 | Delfi Ltd. (Singapore) | 34 | |
18,055 | Finsbury Food Group plc (United Kingdom) | 22 | |
848 | Industrial Milk Co. (Luxembourg)* | 3 | |
58,700 | Kawan Food BHD (Malaysia) | 28 | |
39,800 | Kim Loong Resources BHD (Malaysia) | 17 | |
579 | Maeil Holdings Co. Ltd. (South Korea) | 4 | |
1,760 | Nestlé SA (Switzerland) | 226 | |
5,437 | PGG Wrightson Ltd. (New Zealand) | 15 | |
376,800 | PT Salim Ivomas Pratama TBK (Indonesia) | 10 | |
27,953 | Ridley Corp. Ltd. (Australia) | 40 | |
1,562 | Sajodaerim Corp. (South Korea) | 31 | |
103,800 | Sarawak Plantation BHD (Malaysia) | 49 | |
23,330 | Synlait Milk Ltd. (New Zealand)* | 23 | |
619 | |||
GAS UTILITIES—0.0% | |||
4,400 | Hiroshima Gas Co. Ltd. (Japan) | 12 | |
GROUND TRANSPORTATION—0.4% | |||
220 | Jungfraubahn Holding AG (Switzerland) | 38 | |
343,400 | PT Blue Bird TBK (Indonesia) | 41 | |
4,800 | TFI International Inc. (Canada) | 517 | |
596 | |||
HEALTH CARE EQUIPMENT & SUPPLIES—1.5% | |||
22,437 | ADDvise Group AB (Sweden)* | 32 | |
4,312 | Carl Zeiss Meditec AG (Germany) | 580 | |
6,515 | Cochlear Ltd. (Australia) | 1,068 | |
2,200 | Fukuda Denshi Co. Ltd. (Japan) | 68 | |
924 | Ion Beam Applications (Belgium) | 17 | |
4,800 | JEOL Ltd. (Japan) | 140 | |
5,000 | JMS Co. Ltd. (Japan) | 20 | |
36 | Paul Hartmann AG (Germany) | 9 | |
790 | Sonova Holding AG (Switzerland) | 250 | |
10,598 | Viemed Healthcare Inc. (Canada)* | 114 | |
2,298 | |||
HEALTH CARE PROVIDERS & SERVICES—0.1% | |||
5,406 | Dedicare AB (Sweden) | 76 | |
288 | Ilex Medical Ltd. (Israel) | 6 | |
4,800 | Japan Medical Dynamic Marketing Inc. (Japan) | 36 | |
60,000 | Ladprao General Hospital PCL NVDR (Thailand)*,2 | 10 |
COMMON STOCKS—Continued | |||
Shares | Value | ||
HEALTH CARE PROVIDERS & SERVICES—Continued | |||
6,322 | Oriola Corp. Class A (Finland) | $10 | |
951 | Oriola OYJ (Finland) | 2 | |
140 | |||
HEALTH CARE TECHNOLOGY—0.2% | |||
211 | Ascom Holding AG (Switzerland) | 2 | |
7,502 | Pro Medicus Ltd. (Australia) | 308 | |
300 | Software Service Inc. (Japan) | 19 | |
329 | |||
HOTELS, RESTAURANTS & LEISURE—3.1% | |||
81,600 | After You PCL NVDR (Thailand)2 | 25 | |
22,805 | Aristocrat Leisure Ltd. (Australia) | 577 | |
169,000 | Berjaya Food BHD (Malaysia) | 34 | |
4,523 | Betsson AB (Sweden)* | 49 | |
10,222 | Cie Des Alpes SA (France) | 162 | |
1,859,100 | Genting Singapore Ltd. (Singapore) | 1,582 | |
24,720 | Hollywood Bowl Group plc (United Kingdom)* | 75 | |
83,100 | Jaya Bersama Indo TBK PT (Indonesia)* | —x | |
50,200 | Kimly Ltd. (Singapore) | 12 | |
37,898 | La Francaise Des Jeux SAEM (France)1 | 1,620 | |
404,300 | PT Champ Resto Indonesia TBK (Indonesia)* | 33 | |
38,137 | STS Holding SA (Poland)* | 186 | |
8,233 | Whitbread plc (United Kingdom) | 337 | |
2,500 | Yossix Holdings Co. Ltd. (Japan) | 41 | |
61,600 | Zen Corp. Group PCL NVDR (Thailand)*,2 | 27 | |
4,760 | |||
HOUSEHOLD DURABLES—0.1% | |||
5 | Dom Development SA (Poland) | — | |
1,500 | FJ Next Holdings Co. Ltd. (Japan) | 12 | |
3,800 | JANOME Corp. (Japan) | 17 | |
2,700 | Nihon Trim Co. Ltd. (Japan)* | 58 | |
1,479 | Nikon Corp. (Japan) | 15 | |
10,993 | Toya SA (Poland) | 17 | |
119 | |||
HOUSEHOLD PRODUCTS—0.0% | |||
2,200 | ES Energy Save Holding AB (Sweden)* | 29 | |
INDUSTRIAL CONGLOMERATES—1.9% | |||
2,561 | Industries Qatar QSC (Qatar) | 9 | |
14,034 | Qatar Industrial Manufacturing Co. QSC (Qatar) | 11 | |
16,689 | Siemens AG (Germany) | 2,751 | |
8,221 | Smiths Group plc (United Kingdom) | 174 | |
2,945 | |||
INSURANCE—3.4% | |||
7,300 | Allianz Malaysia BHD (Malaysia) | 23 | |
21,539 | Chesnara plc (United Kingdom) | 75 | |
45,300 | Dai-ichi Life Holdings Inc. (Japan) | 843 | |
4,300 | iA Financial Corp. Inc. (Canada) | 289 | |
18,300 | Japan Post Insurance Co. Ltd. (Japan) | 297 | |
58,700 | Manulife Financial Corp. (Canada) | 1,159 | |
800 | MS&AD Insurance Group Holdings Inc. (Japan) | 26 | |
3,626 | Muenchener Rueckversicherungs-Gesellschaft AG (Germany) | 1,363 | |
145,600 | PT Asuransi Tugu Pratama Indonesia TBK (Indonesia)* | 23 | |
600 | Sompo Holdings Inc. (Japan) | 25 | |
562 | Talanx AG (Germany) | 28 | |
55,500 | Tokio Marine Holdings Inc. (Japan) | 1,116 | |
5,267 |
41
Harbor International Core Fund
Portfolio of Investments—Continued
Value and Cost in Thousands
COMMON STOCKS—Continued | |||
Shares | Value | ||
INTERACTIVE MEDIA & SERVICES—0.5% | |||
8,917 | Autohome Inc. ADR (China)2 | $264 | |
11,515 | JOYY Inc. ADR (China)2 | 351 | |
13,600 | Kakaku.com Inc. (Japan) | 187 | |
802 | |||
INTERNET & DIRECT MARKETING RETAIL—0.0% | |||
9,200 | Hai-O Enterprise BHD (Malaysia) | 2 | |
IT SERVICES—2.1% | |||
545 | ALTEN SA (France) | 93 | |
4,958 | Atea ASA (Norway)* | 68 | |
7,794 | B3 Consulting Group AB (Sweden) | 119 | |
1,400 | Business Brain Showa-Ota Inc. (Japan) | 20 | |
800 | CDS Co. Ltd. (Japan) | 11 | |
640 | Comarch SA (Poland) | 24 | |
62,386 | Computershare Ltd. (Australia) | 929 | |
4,200 | Core Corp. (Japan) | 52 | |
700 | Fujitsu Ltd. (Japan) | 93 | |
1,484 | Hecto Financial Co. Ltd. (South Korea) | 20 | |
5,800 | Hennge KK (Japan)* | 31 | |
1,300 | Himacs Ltd. (Japan) | 13 | |
2,600 | ID Holdings Corp. (Japan) | 21 | |
40,100 | NEC Corp. (Japan) | 1,542 | |
1,500 | oRo Co. Ltd. (Japan) | 27 | |
571 | Sopra Steria Group SACA (France) | 124 | |
4,200 | Ubicom Holdings Inc. (Japan) | 67 | |
1,500 | VINX Corp. (Japan) | 15 | |
700 | Zuken Inc. (Japan) | 18 | |
3,287 | |||
LEISURE PRODUCTS—0.1% | |||
2,400 | Furyu Corp. (Japan) | 20 | |
30,798 | ME Group International plc (United Kingdom)* | 50 | |
1,500 | Sankyo Co. Ltd. (Japan) | 66 | |
3,600 | TOMY Co. Ltd. (Japan) | 41 | |
177 | |||
MACHINERY—2.9% | |||
629 | AG Growth International Inc. (Canada) | 27 | |
8,100 | Amada Co. Ltd. (Japan) | 76 | |
3,623 | Andritz AG (Austria) | 235 | |
7,300 | Daihatsu Diesel Manufacturing Co Ltd. (Japan) | 34 | |
13,379 | Deutz AG (Germany) | 89 | |
5,396 | Duerr AG (Germany) | 187 | |
268 | Exel Industries (France) | 15 | |
1,327 | Famur SA (Poland)* | 1 | |
3,300 | Freund Corp. (Japan)* | 16 | |
4,800 | Fuji Corp. (Japan) | 80 | |
6,776 | GEA Group AG (Germany) | 319 | |
1,691 | Georg Fischer AG (Switzerland) | 123 | |
54 | Groupe Gorge SA (France)* | 1 | |
7,500 | Hino Motors Ltd. (Japan)* | 30 | |
1,800 | Hoshizaki Corp. (Japan) | 63 | |
6,457 | IMI plc (United Kingdom) | 130 | |
11,747 | Iveco Group NV (Italy)* | 106 | |
2,600 | Iwaki Co. Ltd. (Japan) | 25 | |
9,839 | Knorr-Bremse AG (Germany) | 690 | |
19,100 | Miura Co. Ltd. (Japan) | 509 | |
1,300 | Nichias Corp. (Japan) | 26 | |
8,800 | Nippon Thompson Co. Ltd. (Japan) | 38 | |
2,200 | Nitto Kohki Co. Ltd. (Japan) | 33 | |
2,900 | OKUMA Corp. (Japan) | 129 | |
371 | Palfinger AG (Austria) | 12 |
COMMON STOCKS—Continued | |||
Shares | Value | ||
MACHINERY—Continued | |||
409 | Rational AG (Germany) | $296 | |
600 | RIX Corp. (Japan) | 12 | |
4,711 | Schindler Holding AG (Switzerland) | 1,053 | |
5,200 | Shibaura Machine Co. Ltd. (Japan) | 121 | |
4,700 | Sodick Co. Ltd. (Japan) | 26 | |
3,000 | Toyo Machinery & Metal Co. Ltd. (Japan) | 14 | |
4,516 | |||
MARINE—2.4% | |||
833 | AP Moller - Maersk AS (Denmark) | 1,506 | |
36,069 | Hoegh Autoliners ASA (Norway)* | 234 | |
2,544 | Kuehne + Nagel International AG (Switzerland) | 754 | |
1,228,800 | Marco Polo Marine Ltd. (Singapore)* | 42 | |
1,100 | Nippon Concept Corp. (Japan) | 13 | |
310,200 | Samudera Shipping Line Ltd. (Singapore)* | 311 | |
400,000 | SITC International Holdings Co. Ltd. (Hong Kong) | 740 | |
1,029 | Stolt-Nielsen Ltd. (Bermuda) | 30 | |
2,303 | Western Bulk Chartering AS (Norway) | 9 | |
1,724 | Wilson ASA (Norway) | 10 | |
3,649 | |||
MEDIA—1.1% | |||
1,200 | AlphaPolis Co. Ltd. (Japan)* | 30 | |
4,842 | Bloomsbury Publishing plc (United Kingdom) | 27 | |
16,020 | Enero Group Ltd. (Australia) | 19 | |
1,900 | FAN Communications Inc. (Japan) | 6 | |
85 | GTN Ltd. (Australia) | — | |
2,451 | HighCo SA (France) | 13 | |
300 | Macbee Planet Inc. (Japan)* | 33 | |
53,310 | NZME Ltd. (New Zealand) | 34 | |
158,443 | Pico Far East Holdings Ltd. (Hong Kong) | 27 | |
6,600 | Proto Corp. (Japan) | 58 | |
33,805 | PRT Co. Ltd. (Australia)* | —x | |
8,535 | Publicis Groupe SA (France) | 698 | |
16,315 | Sky Network Television Ltd. (New Zealand) | 27 | |
2,400 | Vector Inc. (Japan) | 23 | |
8,802 | Wix.Com Ltd. (Israel)* | 768 | |
1,763 | |||
METALS & MINING—8.1% | |||
1,595 | Anglo American plc (United Kingdom) | 49 | |
233,117 | Base Resources Ltd. (Australia) | 29 | |
108,690 | BHP Group Ltd. (Australia) | 3,226 | |
67,085 | BlueScope Steel Ltd. (Australia) | 892 | |
21,301 | Boryszew SA (Poland)* | 39 | |
15,929 | Fortescue Metals Group Ltd. (Australia) | 223 | |
17,744 | Gem Diamonds Ltd. (United Kingdom)* | 6 | |
137,331 | Gerdau SA ADR (Brazil)2 | 685 | |
74,600 | Grange Resources Ltd. (Australia) | 31 | |
105,087 | Iluka Resources Ltd. (Australia) | 772 | |
6,948 | Major Drilling Group International Inc (Canada)* | 54 | |
17,660 | Mineral Resources Ltd. (Australia) | 871 | |
35,973 | Perenti Global Ltd. (Australia)* | 28 | |
327,104 | Pilbara Minerals Ltd. (Australia) | 931 | |
13,549 | Rana Gruber ASA (Norway) | 73 | |
37,573 | Rio Tinto plc ADR (United Kingdom)2 | 2,404 | |
93,363 | Sierra Rutile Holdings Ltd. (Australia)* | 14 | |
405,202 | South32 Ltd. (Australia) | 1,145 | |
9,600 | Stelco Holdings Inc. (Canada) | 336 | |
5,500 | Tree Island Steel Ltd. (Canada) | 12 | |
18,759 | Voestalpine AG (Austria) | 650 | |
3,359 | Zimplats Holdings Ltd. (Australia) | 56 | |
12,526 |
42
Harbor International Core Fund
Portfolio of Investments—Continued
Value and Cost in Thousands
COMMON STOCKS—Continued | |||
Shares | Value | ||
MULTILINE RETAIL—0.0% | |||
2,400 | Ryohin Keikaku Co. Ltd. (Japan) | $25 | |
MULTI-UTILITIES—0.5% | |||
43,985 | E.ON SE (Germany) | 582 | |
45,600 | Sembcorp. Industries Ltd. (Singapore) | 146 | |
1,058 | Telecom Plus plc (United Kingdom) | 24 | |
169,100 | YTL Power International BHD (Malaysia) | 42 | |
794 | |||
OIL, GAS & CONSUMABLE FUELS—7.3% | |||
36,669 | Awilco LNG AS (Norway)* | 33 | |
1,365,900 | Banpu PCL NVDR (Thailand)2 | 365 | |
70,113 | BP plc ADR (United Kingdom)2 | 2,824 | |
55,749 | CES Energy Solutions Corp. (Canada) | 111 | |
64,200 | Crescent Point Energy Corp. (Canada) | 475 | |
7,000 | Crew Energy Inc. (Canada)* | 24 | |
59,304 | Equinor ASA (Norway)3 | 1,707 | |
507,155 | Horizon Oil Ltd. (Australia) | 54 | |
19,700 | InPlay Oil Corp. (Canada)* | 41 | |
162,500 | Lanna Resources PCL NVDR (Thailand)2 | 69 | |
3,518 | Lubelski Wegiel Bogdanka SA (Poland) | 33 | |
4,700 | MEG Energy Corp. (Canada)* | 78 | |
4,409 | New Hope Corp. Ltd. (Australia) | 16 | |
55,295 | New Zealand Refining Co. Ltd. (New Zealand)* | 51 | |
6,900 | Obsidian Energy Ltd. (Canada)* | 45 | |
10,529 | OMV AG (Austria) | 498 | |
1,000 | Parkland Corp. (Canada) | 24 | |
2,500 | Pegasus Sewing Machine Manufacturing Co. Ltd. (Japan) | 11 | |
114,000 | PetroChina Co. Ltd. (China) | 79 | |
3,079 | Petroleo Brasileiro SA ADR (Brazil)2 | 33 | |
577,000 | Petron Corp. (Philippines)* | 35 | |
250,300 | PT ABM Investama TBK (Indonesia) | 57 | |
1,395,100 | PT Adaro Energy TBK (Indonesia) | 299 | |
1,443,900 | PT AKR Corporindo TBK (Indonesia) | 160 | |
551,700 | PT Baramulti Suksessarana TBK (Indonesia)* | 156 | |
104,000 | PT Bayan Resources TBK (Indonesia) | 152 | |
214,500 | PT Bukit Asam TBK (Indonesia) | 61 | |
32,900 | PT Golden Energy Mines TBK (Indonesia)* | 15 | |
182,800 | PT Indika Energy TBK (Indonesia)* | 33 | |
52,200 | PT Prima Andalan Mandiri TBK (Indonesia) | 25 | |
80,800 | PT United Tractors TBK (Indonesia) | 159 | |
136,800 | PTT Exploration & Production PCL NVDR (Thailand)2 | 595 | |
121,882 | Repsol SA (Spain) | 1,790 | |
866,500 | Resource Alam Indonesia TBK (Indonesia)* | 29 | |
3,637 | Shell plc (United Kingdom) | 112 | |
10,883 | Stanmore Resources Ltd. (Australia)* | 22 | |
225,386 | TerraCom Ltd. (Australia) | 96 | |
281,000 | Thai Oil PCL NVDR (Thailand)2 | 385 | |
2,184 | Unimot SA (Poland)* | 64 | |
4,788 | Washington H Soul Pattinson & Co. Ltd. (Australia) | 100 | |
83,223 | Whitehaven Coal Ltd. (Australia) | 399 | |
11,315 | |||
PAPER & FOREST PRODUCTS—0.4% | |||
15,838 | Arctic Paper SA (Poland) | 74 | |
2,600 | Daiken Corp. (Japan) | 45 | |
1,311 | Midway Ltd. (Australia)* | 1 | |
7,200 | Mitsubishi Paper Mills Ltd. (Japan) | 21 | |
7,047 | Stella-Jones Inc. (Canada) | 276 | |
21,100 | Supremex Inc. (Canada) | 89 |
COMMON STOCKS—Continued | |||
Shares | Value | ||
PAPER & FOREST PRODUCTS—Continued | |||
25,200 | TA Ann Holdings BHD (Malaysia) | $17 | |
25,869 | Western Forest Products Inc. (Canada) | 20 | |
543 | |||
PASSENGER AIRLINES—1.1% | |||
20,430 | Jet2 plc (United Kingdom)* | 316 | |
316,300 | Singapore Airlines Ltd. (Singapore)* | 1,391 | |
1,707 | |||
PERSONAL CARE PRODUCTS—0.0% | |||
434 | Interparfums SA (France) | 34 | |
PERSONAL PRODUCTS—0.0% | |||
2,600 | Mandom Corp. (Japan) | 31 | |
PHARMACEUTICALS—10.5% | |||
4,400 | DRI Healthcare Trust (Canada) | 29 | |
5,082 | GSK plc (United Kingdom) | 92 | |
25,899 | GSK plc ADR (United Kingdom)2 | 933 | |
1,436 | Ipsen SA (France) | 174 | |
6,515 | Merck KGaA (Germany) | 1,169 | |
31,700 | Nippon Shinyaku Co. Ltd. (Japan) | 1,450 | |
29,934 | Novo Nordisk AS (Denmark) | 4,980 | |
22,300 | Ono Pharmaceutical Co. Ltd. (Japan) | 449 | |
284 | Orion OYJ Class A (Finland) | 13 | |
30,600 | Otsuka Holdings Co. Ltd. (Japan) | 1,041 | |
13,785 | Recordati Industria Chimica E Farmaceutica SpA (Italy) | 634 | |
10,397 | Roche Holding AG (Switzerland) | 3,256 | |
5,600 | Seikagaku Corp. (Japan) | 34 | |
42,500 | Shionogi + Co. Ltd. (Japan) | 1,902 | |
274 | Vetoquinol SA (France) | 27 | |
1,322 | Vitura Health Ltd. (Australia)* | — | |
16,183 | |||
PROFESSIONAL SERVICES—2.4% | |||
600 | Abist Co. Ltd. (Japan) | 13 | |
2,500 | Asia Air Survey Co. Ltd. (Japan) | 16 | |
613 | Bertrandt AG (Germany) | 34 | |
3,529 | Brunel International NV (Netherlands) | 48 | |
1,700 | Career Design Center Co. Ltd. (Japan) | 26 | |
1,800 | Creek & River Co. Ltd. (Japan) | 28 | |
1,800 | Dip Corp. (Japan) | 44 | |
1,910 | e-Credible Co. Ltd. (South Korea) | 23 | |
5,300 | en Japan Inc. (Japan) | 95 | |
1,745 | Impellam Group plc (United Kingdom)* | 15 | |
1,100 | JAC Recruitment Co. Ltd. (Japan) | 21 | |
2,600 | Matching Service Japan Co. Ltd. (Japan) | 19 | |
2,400 | Meitec Corp. (Japan) | 41 | |
57,000 | Nihon M&A Center Inc. (Japan) | 436 | |
11,864 | PageGroup plc (United Kingdom)* | 68 | |
2,337 | Poolia AB (Sweden) | 2 | |
23,700 | Recruit Holdings Co. Ltd. (Japan) | 665 | |
5,300 | SIGMAXYZ Holdings Inc. (Japan) | 42 | |
8,500 | Space Co. Ltd. (Japan) | 58 | |
3,412 | SThree plc (United Kingdom) | 18 | |
500 | Visional Inc. (Japan)* | 26 | |
6,185 | Wilmington plc (United Kingdom) | 21 | |
14,260 | Wolters Kluwer NV (Netherlands) | 1,889 | |
1,600 | YAMADA Consulting Group Co. Ltd. (Japan) | 18 | |
3,666 | |||
REAL ESTATE MANAGEMENT & DEVELOPMENT—0.9% | |||
946 | Almogim Holdings Ltd. (Israel)* | 1 |
43
Harbor International Core Fund
Portfolio of Investments—Continued
Value and Cost in Thousands
COMMON STOCKS—Continued | |||
Shares | Value | ||
REAL ESTATE MANAGEMENT & DEVELOPMENT—Continued | |||
3,500 | Daito Trust Construction Co. Ltd. (Japan) | $332 | |
23,367 | Emaar Development PJSC (United Arab Emirates) | 35 | |
116,681 | Ever Reach Group Holdings Co. Ltd. (Hong Kong)* | 4 | |
998 | K Wah International Holdings Ltd. (Hong Kong) | 1 | |
75,300 | KSL Holdings BHD (Malaysia)* | 14 | |
120,700 | LPN Development PCL NVDR (Thailand)2 | 16 | |
1,677 | Melcor Developments Ltd. (Canada) | 14 | |
20,963 | Modern Land China Co. Ltd. (Hong Kong)* | —x | |
2,400 | Propnex Ltd. (Singapore) | 2 | |
4,596,500 | PT Agung Podomoro Land TBK (Indonesia)* | 42 | |
118,500 | Swire Pacific Ltd. (Hong Kong) | 941 | |
1,402 | |||
ROAD & RAIL—0.3% | |||
4,400 | Alps Logistics Co. Ltd. (Japan) | 42 | |
1,900 | Chilled & Frozen Logistics Holdings Co. Ltd. (Japan) | 19 | |
50,609 | FirstGroup plc (United Kingdom)* | 71 | |
1,000 | Maruzen Showa Unyu Co. Ltd. (Japan) | 25 | |
3,400 | Mullen Group Ltd. (Canada) | 38 | |
14,007 | PKP Cargo SA (Poland)* | 53 | |
2,800 | Sankyu Inc. (Japan) | 99 | |
9,300 | Seino Holdings Co. Ltd. (Japan) | 103 | |
450 | |||
SEMICONDUCTORS & SEMICONDUCTOR EQUIPMENT—4.3% | |||
221,814 | ASE Technology Holding ADR (Taiwan)2 | 1,522 | |
1,378 | ChipMos Technologies Inc. ADR (Taiwan)2 | 33 | |
1,500 | Disco Corp. (Japan) | 171 | |
51,863 | Infineon Technologies AG (Germany) | 1,889 | |
3,100 | MegaChips Corp. (Japan) | 74 | |
2,000 | Optorun Co. Ltd. (Japan) | 30 | |
12,300 | ROHM Co. Ltd. (Japan) | 926 | |
900 | RS Technologies Co. Ltd. (Japan) | 20 | |
2,500 | Sanken Electric Co. Ltd. (Japan) | 188 | |
100 | SCREEN Holdings Co. Ltd. (Japan) | 8 | |
33,523 | STMicroelectronics NV New York Registry Shares (France) | 1,437 | |
1,172 | Suess Microtec Se (Germany)* | 31 | |
1,500 | Tokyo Seimitsu Co. Ltd. (Japan) | 55 | |
6,300 | Ulvac Inc. (Japan) | 250 | |
6,634 | |||
SOFTWARE—4.0% | |||
2,388 | Altium Ltd. (Australia) | 61 | |
18,482 | Check Point Software Technologies Ltd. (Israel)* | 2,354 | |
100 | Constellation Software Inc. (Canada) | 196 | |
14,600 | Coveo Solutions Inc. (Canada)* | 71 | |
3,500 | Cybozu Inc. (Japan) | 70 | |
1,100 | Digital Arts Inc. (Japan) | 41 | |
8,085 | Enghouse Systems Ltd. (Canada) | 222 | |
3,700 | Intelligent Wave Inc. (Japan) | 20 | |
5,400 | ISB Corp. (Japan) | 48 | |
3,999 | LiveChat Software SA (Poland)* | 134 | |
3,573 | Monday.com Ltd. (Israel)* | 436 | |
5,070 | NICE Ltd. ADR (Israel)*,2 | 1,034 | |
600 | NTT Data Intramart Corp. (Japan) | 7 | |
2,700 | Plus Alpha Consulting Co. Ltd. (Japan) | 58 | |
38,155 | Sage Group plc (United Kingdom) | 393 | |
1,800 | Soliton Systems KK (Japan) | 14 | |
13,642 | Symbio Holdings Ltd. (Australia) | 19 | |
18,282 | Technology One Ltd. (Australia) | 184 |
COMMON STOCKS—Continued | |||
Shares | Value | ||
SOFTWARE—Continued | |||
1,801 | Telcoware Co. Ltd. (South Korea) | $12 | |
17,119 | WiseTech Global Ltd. (Australia) | 784 | |
6,158 | |||
SPECIALTY RETAIL—2.4% | |||
2,300 | ABC-Mart Inc. (Japan) | 131 | |
6,743 | Autosports Group Ltd. (Australia) | 10 | |
21,823 | Carasso Motors Ltd. (Israel) | 97 | |
75,144 | Card Factory plc (United Kingdom)* | 104 | |
441 | Castro Model Ltd. (Israel)* | 4 | |
888 | Delta Israel Brands Ltd. (Israel) | 10 | |
4,300 | Fuji Corp. (Japan) | 42 | |
10,966 | Hennes & Mauritz AB Class B (Sweden) | 161 | |
80,290 | Industria de Diseño Textil SA (Spain) | 2,760 | |
6,986 | Naturhouse Health SAU (Spain)* | 13 | |
152,900 | Padini Holdings BHD (Malaysia)* | 139 | |
5,404 | Pet Valu Holdings Ltd. (Canada) | 145 | |
92,600 | PT Map Aktif Adiperkasa (Indonesia)* | 29 | |
70 | Samse SA (France) | 15 | |
3,660 | |||
TECHNOLOGY HARDWARE, STORAGE & PERIPHERALS—1.2% | |||
30,700 | Brother Industries Ltd. (Japan) | 482 | |
1,100 | Canon Inc. (Japan) | 26 | |
1,712 | EVS Broadcast Equipment SA (Belgium) | 42 | |
75,300 | Ricoh Co. Ltd. (Japan) | 623 | |
49,100 | Seiko Epson Corp. (Japan) | 751 | |
1,924 | |||
TEXTILES, APPAREL & LUXURY GOODS—6.5% | |||
797 | Bijou Brigitte AG (Germany)* | 48 | |
20,533 | Burberry Group plc (United Kingdom) | 670 | |
117 | Christian Dior SE (France) | 107 | |
16,093 | Cie Financiere Richemont SA (Switzerland) | 2,660 | |
75,209 | Geox SpA (Italy)* | 85 | |
700 | Goldwin Inc. (Japan) | 64 | |
1,290 | Hermes International (France) | 2,801 | |
500 | Jichodo Co. Ltd. (Japan) | 26 | |
210,000 | Justin Allen Holdings Ltd. (China) | 15 | |
96 | LVMH Moet Hennessy Louis Vuitton SE (France) | 92 | |
94,100 | MC Group PCL NVDR (Thailand)2 | 28 | |
12,252 | Pandora AS (Denmark)* | 1,134 | |
20,400 | Prada SpA (Italy) | 150 | |
600 | Rhythm Co. Ltd. (Japan) | 9 | |
42,600 | Sabina PCL NVDR (Thailand)2 | 35 | |
5,838 | Swatch Group AG (Switzerland) | 2,003 | |
28,227 | Texhong Textile Group Ltd. (Hong Kong)* | 21 | |
9,948 | |||
TOBACCO—0.0% | |||
652,400 | PT Wismilak Inti Makmur TBK (Indonesia) | 48 | |
TRADING COMPANIES & DISTRIBUTORS—1.0% | |||
60,000 | APAC Resources Ltd. (Hong Kong)* | 8 | |
2,000 | Chori Co. Ltd. (Japan) | 38 | |
18,900 | Finning International Inc. (Canada) | 490 | |
2,900 | Gecoss Corp. (Japan) | 19 | |
2,853 | Howden Joinery Group plc (United Kingdom) | 24 | |
2,349 | Jacquet Metals SA (France) | 46 | |
2,200 | Kanaden Corp. (Japan) | 19 | |
4,900 | Kanematsu Corp. (Japan) | 64 | |
800 | Nanyo Corp. (Japan) | 14 | |
252,987 | New Times Energy Corp. Ltd. (Bermuda)* | 4 |
44
Harbor International Core Fund
Portfolio of Investments—Continued
Value and Cost in Thousands
COMMON STOCKS—Continued | |||
Shares | Value | ||
TRADING COMPANIES & DISTRIBUTORS—Continued | |||
900 | NICE Corp. (Japan) | $9 | |
2,300 | Parker Corp. (Japan) | 11 | |
34,095 | Rexel SA (France)* | 790 | |
900 | Totech Corp. (Japan) | 28 | |
500 | Tsubakimoto Kogyo Co. Ltd. (Japan) | 15 | |
1,579 | |||
TRANSPORTATION INFRASTRUCTURE—0.0% | |||
341,700 | BTS Rail Mass Transit Growth Infrastructure Fund (Thailand)* | 26 | |
91,000 | Qilu Expressway Co. Ltd. (China) | 27 | |
53 | |||
WIRELESS TELECOMMUNICATION SERVICES—0.1% | |||
3,400 | Okinawa Cellular Telephone Co. (Japan) | 76 | |
TOTAL COMMON STOCKS | |||
(Cost $143,258) | 149,812 | ||
EXCHANGE-TRADED FUNDS—1.0% | |||
(Cost $1,494) | |||
Shares | |||
CAPITAL MARKETS—1.0% | |||
20,917 | iShares MSCI EAFE ETF (United States) | 1,540 | |
PREFERRED STOCKS—0.6% | |||
Shares | Value | ||
AUTO COMPONENTS—0.0% | |||
6,114 | Schaeffler AG (Germany) | $45 | |
MACHINERY—0.1% | |||
173 | KSB SE & Co. KGaA (Germany) | 94 | |
OIL, GAS & CONSUMABLE FUELS—0.5% | |||
165,500 | Petroleo Brasileiro SA (Brazil) | 786 | |
TOTAL PREFERRED STOCKS | |||
(Cost $1,026) | 925 | ||
TOTAL INVESTMENTS—98.7% | |||
(Cost $145,778) | 152,277 | ||
CASH AND OTHER ASSETS, LESS LIABILITIES—1.3% | 1,975 | ||
TOTAL NET ASSETS—100.0% | $154,252 |
FAIR VALUE MEASUREMENTS
The following table summarizes the Fund’s investments as of April 30, 2023 based on the inputs used to value them.
Asset Category | Quoted Prices Level 1 (000s) | Other Significant Observable Inputs Level 2 (000s) | Significant Unobservable Inputs Level 3 (000s) | Total (000s) |
Common Stocks | ||||
Africa | $— | $232 | $— | $232 |
Europe | 8,352 | 71,828 | — | 80,180 |
Latin America | 718 | — | — | 718 |
Middle East/Central Asia | 4,592 | 953 | — | 5,545 |
North America | 7,587 | — | — | 7,587 |
Pacific Basin | 2,475 | 53,051 | 24 | 55,550 |
Exchange-Traded Funds | ||||
North America | 1,540 | — | — | 1,540 |
Preferred Stocks | ||||
Europe | — | 139 | — | 139 |
Latin America | 786 | — | — | 786 |
Total Investments in Securities | $26,050 | $126,203 | $24 | $152,277 |
For more information on valuation inputs and their aggregation into the levels identified above, please refer to the Fair Value Measurements and Disclosures in Note 2 of the accompanying Notes to Financial Statements.
45
Harbor International Core Fund
Portfolio of Investments—Continued
The following is a rollforward of the Fund’s Level 3 investments during the period ended April 30, 2023. Transfers into or out of Level 3 are recognized as of the last day in the fiscal quarter of the period in which the event or change in circumstances that caused the reclassification occured.
Valuation Description | Beginning Balance as of 11/01/2022 (000s) | Purchases (000s) | Sales (000s) | Discount/ (Premium) (000s) | Total Realized Gain/(Loss) (000s) | Change in Unrealized Appreciation/ (Depreciation) (000s) | Transfers Into Level 3h (000s) | Transfers Out of Level 3 (000s) | Ending Balance as of 04/30/2023 (000s) | Unrealized Gain/ Loss as of 04/30/2023 (000s) |
Common Stocks | $— | $— | $— | $— | $— | $— | $24 | $— | $24 | $(15 ) |
The following is a summary of significant unobservable inputs used in the fair valuations of assets and liabilities categorized within Level 3 of the fair value hierarchy.
Valuation Descriptions | Ending Balance as of 04/30/2023 (000s) | Valuation Technique | Unobservable Input(s) | Input Value(s) |
Investments in Securities | ||||
Common Stocks | ||||
Danakali Ltd. (Australia)* | $ 24 | Market Approach | Last Traded Price | AUD 0.41 |
Jaya Bersama Indo TBK PT (Indonesia)* | — | Market Approach | Estimated Recovery Value | IDR 0.00 |
Modern Land China Co. Ltd. (Hong Kong)* | — | Market Approach | Estimated Recovery Value | HKD 0.00 |
$24 |
* | Non-income producing security |
x | Fair valued in accordance with Harbor Funds' Valuation Procedures. |
1 | Securities purchased in a transaction exempt from registration under Rule 144A of the Securities Act of 1933. These securities may be resold in transactions exempt from registration, normally to qualified institutional buyers. The Fund has no right to demand registration of these securities. As of April 30, 2023, the aggregate value of these securities was $2,005 or 1% of net assets. |
2 | Depositary receipts such as American Depositary Receipts (ADRs), Global Depositary Receipts (GDRs) and other country specific depositary receipts are certificates evidencing ownership of shares of a foreign issuer. These certificates are issued by depositary banks and generally trade on an established market in the U.S. or elsewhere. |
3 | All or a portion of this security was out on loan as of April 30, 2023. |
h | Transferred from Level 2 to Level 3 due to the unavailability of observable market data for pricing |
AUD | Australian Dollar |
HKD | Hong Kong Dollar |
IDR | Indonesian Rupiah |
The accompanying notes are an integral part of the Financial Statements.
46
Harbor International Growth Fund
Portfolio of Investments—April 30, 2023 (Unaudited)
Subadvisor: Baillie Gifford Overseas Limited
REGION BREAKDOWN (% of investments)
The Fund’s Portfolio of Investments include investments denominated in foreign currencies. As of April 30, 2023, there was no foreign currency denomination that comprised more than 25% of the Fund’s net assets.
Portfolio of Investments
Value and Cost in Thousands
COMMON STOCKS—97.2% | |||
Shares | Value | ||
AIR FREIGHT & LOGISTICS—0.6% | |||
11,424 | DSV AS (Denmark) | $2,150 | |
AUTO COMPONENTS—0.9% | |||
55,940 | Denso Corp. (Japan) | 3,377 | |
AUTOMOBILES—0.2% | |||
23,260 | Suzuki Motor Corp. (Japan) | 811 | |
BANKS—2.4% | |||
423,107 | United Overseas Bank Ltd. (Singapore) | 8,986 | |
BEVERAGES—4.2% | |||
90,323 | Anheuser-Busch InBev SA NV (Belgium) | 5,873 | |
33,701 | Remy Cointreau SA (France) | 5,831 | |
3,296,140 | Thai Beverage PCL (Thailand) | 1,584 | |
265,045 | United Spirits Ltd. (India)* | 2,524 | |
15,812 | |||
BIOTECHNOLOGY—0.8% | |||
162,443 | BeiGene Ltd. (China)* | 3,188 | |
BROADLINE RETAIL—2.6% | |||
133,383 | Coupang Inc. (South Korea)* | 2,236 | |
5,990 | MercadoLibre Inc. (Brazil)* | 7,652 | |
9,888 |
COMMON STOCKS—Continued | |||
Shares | Value | ||
BUILDING PRODUCTS—0.6% | |||
185,020 | NIBE Industrier AB (Sweden) | $2,072 | |
CAPITAL MARKETS—0.8% | |||
303,999 | Hargreaves Lansdown plc (United Kingdom) | 3,078 | |
DIVERSIFIED FINANCIAL SERVICES—3.0% | |||
47,206 | Exor NV (Netherlands)* | 3,885 | |
340,771 | Investor AB Class B (Sweden) | 7,321 | |
11,206 | |||
ELECTRICAL EQUIPMENT—1.9% | |||
109,900 | Contemporary Amperex Technology Co. Ltd. (China) | 3,677 | |
70,280 | Nidec Corp. (Japan) | 3,478 | |
7,155 | |||
ELECTRONIC EQUIPMENT, INSTRUMENTS & COMPONENTS—2.7% | |||
10,940 | Keyence Corp. (Japan) | 4,934 | |
91,660 | Murata Manufacturing Co. Ltd. (Japan) | 5,200 | |
10,134 | |||
ENTERTAINMENT—1.3% | |||
25,088 | Spotify Technology SA (Sweden)* | 3,352 | |
50,693 | Ubisoft Entertainment SA (France)* | 1,484 | |
4,836 |
47
Harbor International Growth Fund
Portfolio of Investments—Continued
Value and Cost in Thousands
COMMON STOCKS—Continued | |||
Shares | Value | ||
FINANCIAL SERVICES—2.3% | |||
3,641 | Adyen NV (Netherlands)*,1 | $5,851 | |
398,352 | Wise plc (United Kingdom)* | 2,758 | |
8,609 | |||
FOOD & STAPLES RETAILING—4.9% | |||
32,990 | Cosmos Pharmaceutical Corp. (Japan) | 3,245 | |
234,281 | Jeronimo Martins SGPS SA (Portugal) | 5,912 | |
927,680 | Raia Drogasil SA (Brazil)* | 4,888 | |
36,620 | Sugi Holdings Co. Ltd. (Japan) | 1,553 | |
689,197 | Wal-Mart de Mexico SAB de CV (Mexico) | 2,778 | |
18,376 | |||
GROUND TRANSPORTATION—0.9% | |||
44,352 | Canadian Pacific Kansas City (Canada) | 3,496 | |
HEALTH CARE EQUIPMENT & SUPPLIES—4.5% | |||
34,565 | Cochlear Ltd. (Australia) | 5,668 | |
359,780 | Olympus Corp. (Japan) | 6,298 | |
77,440 | Sysmex Corp. (Japan) | 4,981 | |
16,947 | |||
HOTELS, RESTAURANTS & LEISURE—1.7% | |||
61,605 | MakeMyTrip Ltd. (India)* | 1,444 | |
750,096 | Trainline plc (United Kingdom)*,1 | 2,347 | |
75,267 | Trip.com Group Ltd. (China)* | 2,676 | |
6,467 | |||
HOUSEHOLD PRODUCTS—1.7% | |||
114,140 | Pigeon Corp. (Japan) | 1,777 | |
118,400 | Unicharm Corp. (Japan) | 4,780 | |
6,557 | |||
INSURANCE—3.5% | |||
616,360 | AIA Group Ltd. (Hong Kong) | 6,710 | |
120,892 | ICICI Lombard General Insurance Co. Ltd. (India)1 | 1,598 | |
685,600 | Ping An Insurance Group Co. of China Ltd. (China) | 5,002 | |
13,310 | |||
INTERACTIVE MEDIA & SERVICES—4.8% | |||
894,008 | Auto Trader Group plc (United Kingdom)1 | 7,149 | |
172,448 | Baidu Inc. Class A (China)* | 2,596 | |
832,475 | Rightmove plc (United Kingdom) | 6,026 | |
839,400 | Z Holdings Corp. (Japan) | 2,299 | |
18,070 | |||
INTERNET & DIRECT MARKETING RETAIL—7.3% | |||
442,936 | Alibaba Group Holding Ltd. (China)* | 4,684 | |
35,519 | Games Workshop Group plc (United Kingdom) | 4,433 | |
228,240 | Meituan Class B (China)*,1 | 3,901 | |
116,792 | Prosus NV (Netherlands)* | 8,740 | |
135,509 | Zalando SE (Germany)*,1 | 5,573 | |
27,331 | |||
IT SERVICES—2.0% | |||
110,397 | Shopify Inc. (Canada)* | 5,349 | |
34,762 | Topicus.Com Inc. (Canada)* | 2,315 | |
7,664 | |||
LEISURE PRODUCTS—1.1% | |||
25,680 | Shimano Inc. (Japan) | 3,971 |
COMMON STOCKS—Continued | |||
Shares | Value | ||
LIFE SCIENCES TOOLS & SERVICES—3.3% | |||
6,255 | Lonza Group AG (Switzerland) | $3,901 | |
5,778 | Mettler-Toledo International Inc. (Switzerland)* | 8,618 | |
12,519 | |||
MACHINERY—8.2% | |||
648,476 | Atlas Copco AB Class A (Sweden) | 9,380 | |
275,784 | Epiroc AB Class B (Sweden) | 4,748 | |
12,880 | SMC Corp. (Japan) | 6,424 | |
511,800 | Techtronic Industries Co. Ltd. (Hong Kong) | 5,537 | |
202,639 | Weir Group plc (United Kingdom) | 4,690 | |
30,779 | |||
OIL, GAS & CONSUMABLE FUELS—0.8% | |||
97,742 | Reliance Industries Ltd. (India) | 2,902 | |
PERSONAL PRODUCTS—2.8% | |||
42,940 | Kao Corp. (Japan) | 1,735 | |
174,520 | Shiseido Co. Ltd. (Japan) | 8,748 | |
10,483 | |||
PROFESSIONAL SERVICES—2.6% | |||
107,523 | Experian plc (United Kingdom) | 3,807 | |
57,226 | Intertek Group plc (United Kingdom) | 2,994 | |
103,700 | Recruit Holdings Co. Ltd. (Japan) | 2,909 | |
9,710 | |||
SEMICONDUCTORS & SEMICONDUCTOR EQUIPMENT—6.5% | |||
13,954 | ASML Holding NV (Netherlands) | 8,856 | |
569,580 | Longi Green Energy Technology Co. Ltd. (China) | 2,877 | |
151,011 | Taiwan Semiconductor Manufacturing Co. Ltd. ADR (Taiwan)2 | 12,730 | |
24,463 | |||
SOFTWARE—2.1% | |||
44,199 | Nemetschek SE (Germany) | 3,455 | |
70,637 | Xero Ltd. (New Zealand)* | 4,409 | |
7,864 | |||
SPECIALTY RETAIL—0.6% | |||
189,375 | AUTO1 Group SE (Germany)*,1 | 1,494 | |
214,687 | Farfetch Ltd. (United Kingdom)* | 865 | |
2,359 | |||
TEXTILES, APPAREL & LUXURY GOODS—8.9% | |||
17,724 | Adidas AG (Germany) | 3,121 | |
133,791 | Burberry Group plc (United Kingdom) | 4,367 | |
66,055 | Cie Financiere Richemont SA (Switzerland) | 10,919 | |
6,482 | Kering SA (France) | 4,151 | |
473,900 | Li Ning Co. Ltd. China) | 3,389 | |
7,976 | LVMH Moet Hennessy Louis Vuitton SE (France) | 7,672 | |
33,619 | |||
THRIFTS & MORTGAGE FINANCE—2.4% | |||
270,120 | Housing Development Finance Corp. Ltd. (India) | 9,185 |
48
Harbor International Growth Fund
Portfolio of Investments—Continued
Value and Cost in Thousands
COMMON STOCKS—Continued | |||
Shares | Value | ||
TRADING COMPANIES & DISTRIBUTORS—2.3% | |||
64,777 | Ashtead Group plc (United Kingdom) | $3,735 | |
32,412 | IMCD NV (Netherlands) | 4,879 | |
8,614 | |||
TOTAL COMMON STOCKS | |||
(Cost $291,967) | 365,988 | ||
PREFERRED STOCKS—2.0% | |||
(Cost $1,999) | |||
HEALTH CARE EQUIPMENT & SUPPLIES—2.0% | |||
19,050 | Sartorius AG (Germany) | 7,404 | |
TOTAL INVESTMENTS—99.2% | |||
(Cost $293,966) | 373,392 | ||
CASH AND OTHER ASSETS, LESS LIABILITIES—0.8% | 3,188 | ||
TOTAL NET ASSETS—100.0% | $376,580 |
FAIR VALUE MEASUREMENTS
The following table summarizes the Fund’s investments as of April 30, 2023 based on the inputs used to value them.
Asset Category | Quoted Prices Level 1 (000s) | Other Significant Observable Inputs Level 2 (000s) | Significant Unobservable Inputs Level 3 (000s) | Total (000s) |
Common Stocks | ||||
Europe | $12,835 | $162,652 | $— | $175,487 |
Latin America | 15,318 | — | — | 15,318 |
Middle East/Central Asia | 1,444 | 16,209 | — | 17,653 |
North America | 11,160 | — | — | 11,160 |
Pacific Basin | 14,966 | 131,404 | — | 146,370 |
Preferred Stocks | ||||
Europe | — | 7,404 | — | 7,404 |
Total Investments in Securities | $55,723 | $317,669 | $— | $373,392 |
For more information on valuation inputs and their aggregation into the levels identified above, please refer to the Fair Value Measurements and Disclosures in Note 2 of the accompanying Notes to Financial Statements.
* | Non-income producing security |
1 | Securities purchased in a transaction exempt from registration under Rule 144A of the Securities Act of 1933. These securities may be resold in transactions exempt from registration, normally to qualified institutional buyers. The Fund has no right to demand registration of these securities. As of April 30, 2023, the aggregate value of these securities was $27,913 or 7% of net assets. |
2 | Depositary receipts such as American Depositary Receipts (ADRs), Global Depositary Receipts (GDRs) and other country specific depositary receipts are certificates evidencing ownership of shares of a foreign issuer. These certificates are issued by depositary banks and generally trade on an established market in the U.S. or elsewhere. |
The accompanying notes are an integral part of the Financial Statements.
49
Harbor International Small Cap Fund
Portfolio of Investments—April 30, 2023 (Unaudited)
Subadvisor: Cedar Street Asset Management LLC
REGION BREAKDOWN (% of investments)
(Excludes derivatives)
The Fund’s Portfolio of Investments include investments denominated in foreign currencies. As of April 30, 2023, 30.9% of the Fund’s investments were denominated in Euro and 25.4% were denominated in Japanese Yen. No other foreign currency denomination comprised more than 25% of the Fund’s net assets.
Portfolio of Investments
Value and Cost in Thousands
COMMON STOCKS—94.9% | |||
Shares | Value | ||
AIR FREIGHT & LOGISTICS—1.5% | |||
9,771,800 | Singapore Post Ltd. (Singapore) | $3,743 | |
AUTO COMPONENTS—0.7% | |||
1,647,230 | Johnson Electric Holdings Ltd. (Hong Kong) | 1,842 | |
BANKS—1.5% | |||
1,975,665 | Virgin Money UK plc (United Kingdom) | 3,883 | |
BEVERAGES—1.9% | |||
231,191 | A.G. Barr plc (United Kingdom) | 1,460 | |
1,745,278 | C&C Group plc (Ireland)* | 3,435 | |
4,895 | |||
BUILDING PRODUCTS—1.3% | |||
876,092 | Genuit Group plc (United Kingdom) | 3,311 | |
CAPITAL MARKETS—1.5% | |||
1,773,798 | TP ICAP Group plc (Jersey) | 3,794 | |
CHEMICALS—2.4% | |||
204,994 | Neo Performance Materials Inc. (Canada) | 1,359 | |
220,271 | Victrex plc (United Kingdom) | 4,654 | |
6,013 | |||
COMMERCIAL SERVICES & SUPPLIES—4.5% | |||
170,586 | ISS AS (Denmark)* | 3,567 |
COMMON STOCKS—Continued | |||
Shares | Value | ||
COMMERCIAL SERVICES & SUPPLIES—Continued | |||
109,942 | Loomis AB (Sweden) | $3,519 | |
2,169,032 | Serco Group plc (United Kingdom) | 4,149 | |
11,235 | |||
CONSTRUCTION & ENGINEERING—1.6% | |||
957,551 | Maire Tecnimont SpA (Italy) | 4,110 | |
CONSUMER FINANCE—1.5% | |||
46,508 | Cembra Money Bank AG (Switzerland) | 3,735 | |
CONTAINERS & PACKAGING—3.2% | |||
331,688 | Fuji Seal International Inc. (Japan) | 3,770 | |
407,781 | Transcontinental Inc. (Canada) | 4,391 | |
8,161 | |||
DISTRIBUTORS—4.5% | |||
858,516 | Bapcor Ltd. (Australia) | 3,746 | |
402,078 | Inchcape plc (United Kingdom) | 4,093 | |
88,616 | PALTAC Corp. (Japan) | 3,400 | |
11,239 | |||
DIVERSIFIED FINANCIAL SERVICES—0.9% | |||
243,898 | BFF Bank SpA (Italy)1 | 2,347 | |
ELECTRICAL EQUIPMENT—1.3% | |||
79,726 | Mersen SA (France) | 3,216 |
50
Harbor International Small Cap Fund
Portfolio of Investments—Continued
Value and Cost in Thousands
COMMON STOCKS—Continued | |||
Shares | Value | ||
ELECTRONIC EQUIPMENT, INSTRUMENTS & COMPONENTS—9.2% | |||
181,877 | Amano Corp. (Japan) | $3,703 | |
319,961 | Anritsu Corp. (Japan) | 2,930 | |
74,118 | AT&S Austria Technologie + Systemtechnik AG (Austria) | 2,267 | |
93,021 | Daiwabo Holdings Co. Ltd. (Japan) | 1,755 | |
48,611 | Landis+Gyr Group AG (Switzerland)* | 4,027 | |
185,172 | Optex Group Co. Ltd. (Japan) | 2,787 | |
171,153 | Topcon Corp. (Japan) | 2,438 | |
254,520 | Venture Corp. Ltd. (Singapore) | 3,252 | |
23,159 | |||
ENERGY EQUIPMENT & SERVICES—1.6% | |||
186,135 | Technip Energies NV (France) | 4,130 | |
FINANCIAL SERVICES—1.1% | |||
393,108 | Illimity Bank Spa (Italy)* | 2,774 | |
FOOD & STAPLES RETAILING—0.9% | |||
242,652 | Qol Holdings Co. Ltd. (Japan) | 2,225 | |
FOOD PRODUCTS—8.1% | |||
105,515 | Ariake Japan Co. Ltd. (Japan) | 4,279 | |
2,510,579 | Aryzta AG (Switzerland)* | 4,461 | |
508,336 | AustAsia Group Ltd. (Singapore)* | 207 | |
554,156 | Elders Ltd. (Australia) | 2,984 | |
290,098 | Glanbia plc (Ireland) | 4,399 | |
890,482 | Japfa Ltd. (Singapore) | 141 | |
133,805 | Morinaga & Co. Ltd. (Japan) | 3,965 | |
20,436 | |||
GAS UTILITIES—1.8% | |||
152,160 | Rubis SCA (France) | 4,497 | |
HEALTH CARE EQUIPMENT & SUPPLIES—5.8% | |||
218,902 | Ansell Ltd. (Australia) | 3,895 | |
847,218 | Arjo AB B Shares (Sweden) | 3,758 | |
292,217 | Eiken Chemical Co. Ltd. (Japan) | 3,398 | |
122,720 | JEOL Ltd. (Japan) | 3,581 | |
14,632 | |||
HEALTH CARE PROVIDERS & SERVICES—1.7% | |||
228,674 | Fagron NV (Belgium) | 4,251 | |
HOTELS, RESTAURANTS & LEISURE—2.8% | |||
200,205 | RESORTTRUST, Inc. (Japan) | 3,306 | |
867,862 | Round One Corp. (Japan) | 3,754 | |
7,060 | |||
INDUSTRIAL CONGLOMERATES—0.9% | |||
78,519 | Indus Holding AG (Germany) | 2,326 | |
INSURANCE—4.7% | |||
99,478 | ASR Nederland NV (Netherlands) | 4,376 | |
223,303 | Coface SA (France) | 3,418 | |
839,789 | Direct Line Insurance Group plc (United Kingdom) | 1,815 | |
1,165,313 | Mapfre SA (Spain) | 2,334 | |
11,943 |
COMMON STOCKS—Continued | |||
Shares | Value | ||
IT SERVICES—1.7% | |||
137,475 | Tietoevry OYJ (Finland) | $4,393 | |
LEISURE PRODUCTS—2.4% | |||
161,400 | Globeride Inc. (Japan) | 2,959 | |
111,137 | Spin Master Corp. (Canada)1 | 3,162 | |
6,121 | |||
MACHINERY—9.7% | |||
162,108 | Construcciones y Auxiliar de Ferrocarrilies SA (Spain) | 5,031 | |
407,169 | Husqvarna AB (Sweden) | 3,514 | |
23,540 | Krones AG (Germany) | 3,093 | |
213,900 | METAWATER Co. Ltd. (Japan) | 2,819 | |
142,340 | Nabtesco Corp. (Japan) | 3,431 | |
129,250 | Norma Group SE (Germany) | 3,075 | |
252,600 | OSG Corp. (Japan) | 3,548 | |
24,511 | |||
MEDIA—4.4% | |||
811,225 | Atresmedia Corp. de Medios de Comunicacion SA (Spain) | 3,244 | |
129,665 | Criteo SA ADR (France)*,2 | 4,078 | |
77,776 | RTL Group SA (Luxembourg) | 3,646 | |
10,968 | |||
PERSONAL PRODUCTS—1.4% | |||
418,336 | Ontex Group NV (Belgium)* | 3,588 | |
PROFESSIONAL SERVICES—1.2% | |||
206,762 | Open Up Group Inc. (Japan) | 3,063 | |
ROAD & RAIL—1.4% | |||
724,198 | Redde Northgate plc (United Kingdom) | 3,425 | |
SEMICONDUCTORS & SEMICONDUCTOR EQUIPMENT—1.4% | |||
421,046 | X-FAB Silicon Foundries SE (Belgium)*,1 | 3,586 | |
SOFTWARE—2.7% | |||
295,555 | Computer Engineering & Consulting Ltd. (Japan) | 3,073 | |
437,092 | TomTom NV (Netherlands)* | 3,747 | |
6,820 | |||
TEXTILES, APPAREL & LUXURY GOODS—1.7% | |||
4,243,253 | Coats Group plc (United Kingdom) | 4,178 | |
TOTAL COMMON STOCKS | |||
(Cost $223,158) | 239,610 | ||
TOTAL INVESTMENTS—94.9% | |||
(Cost $223,158) | 239,610 | ||
CASH AND OTHER ASSETS, LESS LIABILITIES—5.1% | 12,747 | ||
TOTAL NET ASSETS—100.0% | $252,357 |
51
Harbor International Small Cap Fund
Portfolio of Investments—Continued
RIGHTS/WARRANTS
Description | No. of Contracts | Strike Price | Expiration Date | Cost (000s) | Value (000s) |
Mersen SA Right | 79,726 | EUR 28.00 | 05/02/2023 | $ — | $127 |
FAIR VALUE MEASUREMENTS
The following table summarizes the Fund’s investments as of April 30, 2023 based on the inputs used to value them.
Asset Category | Quoted Prices Level 1 (000s) | Other Significant Observable Inputs Level 2 (000s) | Significant Unobservable Inputs Level 3 (000s) | Total (000s) |
Investments in Securities | ||||
Common Stocks | ||||
Europe | $4,398 | $142,306 | $— | $146,704 |
North America | 8,912 | — | — | 8,912 |
Pacific Basin | — | 83,994 | — | 83,994 |
Total Investments in Securities | $13,310 | $226,300 | $— | $239,610 |
Financial Derivative Instruments - Assets | ||||
Rights/Warrants | $127 | $— | $— | $127 |
Total Investments | $13,437 | $226,299 | $— | $239,737 |
For more information on valuation inputs and their aggregation into the levels identified above, please refer to the Fair Value Measurements and Disclosures in Note 2 of the accompanying Notes to Financial Statements.
* | Non-income producing security |
1 | Securities purchased in a transaction exempt from registration under Rule 144A of the Securities Act of 1933. These securities may be resold in transactions exempt from registration, normally to qualified institutional buyers. The Fund has no right to demand registration of these securities. As of April 30, 2023, the aggregate value of these securities was $9,095 or 4% of net assets. |
2 | Depositary receipts such as American Depositary Receipts (ADRs), Global Depositary Receipts (GDRs) and other country specific depositary receipts are certificates evidencing ownership of shares of a foreign issuer. These certificates are issued by depositary banks and generally trade on an established market in the U.S. or elsewhere. |
EUR | EURO |
The accompanying notes are an integral part of the Financial Statements.
52
Harbor Large Cap Value Fund
Portfolio of Investments—April 30, 2023 (Unaudited)
Subadvisor: Aristotle Capital Management, LLC
Sector Allocation (% of investments)
Portfolio of Investments
Value and Cost in Thousands
COMMON STOCKS—97.4% | |||
Shares | Value | ||
AEROSPACE & DEFENSE—2.0% | |||
176,000 | General Dynamics Corp. | $38,428 | |
AUTO COMPONENTS—1.9% | |||
2,307,000 | Cie Generale des Etablissements Michelin SCA ADR (France),1 | 36,543 | |
BANKS—6.2% | |||
420,000 | Commerce Bancshares Inc. | 23,457 | |
301,000 | Cullen/Frost Bankers Inc. | 33,185 | |
4,072,000 | Mitsubishi UFJ Financial Group Inc. ADR (Japan)1 | 25,572 | |
267,000 | PNC Financial Services Group Inc. | 34,777 | |
116,991 | |||
BEVERAGES—4.5% | |||
742,000 | Coca-Cola Co. | 47,599 | |
163,000 | Constellation Brands Inc. | 37,404 | |
85,003 | |||
BIOTECHNOLOGY—2.5% | |||
193,000 | Amgen Inc. | 46,270 | |
CAPITAL MARKETS—4.7% | |||
168,000 | Ameriprise Financial Inc. | 51,260 | |
421,000 | Blackstone Group Inc. | 37,608 | |
88,868 | |||
CHEMICALS—7.8% | |||
1,181,000 | Corteva Inc. | 72,183 | |
226,000 | Ecolab Inc. | 37,932 | |
449,000 | RPM International Inc. | 36,831 | |
146,946 | |||
CONSTRUCTION MATERIALS—2.7% | |||
138,000 | Martin Marietta Materials Inc. | 50,122 | |
CONSUMER FINANCE—2.2% | |||
428,000 | Capital One Financial Corp. | 41,644 | |
CONSUMER STAPLES DISTRIBUTION—2.1% | |||
508,000 | Sysco Corp. | 38,984 |
COMMON STOCKS—Continued | |||
Shares | Value | ||
ELECTRIC UTILITIES—2.6% | |||
688,000 | Xcel Energy Inc. | $48,098 | |
ENTERTAINMENT—2.1% | |||
495,000 | Activision Blizzard Inc.* | 38,466 | |
GAS UTILITIES—2.6% | |||
425,000 | Atmos Energy Corp. | 48,510 | |
HEALTH CARE EQUIPMENT & SUPPLIES—4.0% | |||
539,000 | Alcon Inc. (Switzerland) | 39,067 | |
388,000 | Medtronic plc (Ireland) | 35,288 | |
74,355 | |||
HOUSEHOLD DURABLES—5.5% | |||
499,000 | Lennar Corp. Class A | 56,292 | |
7,126 | Lennar Corp. Class B | 697 | |
523,000 | Sony Corp. ADR (Japan)1 | 46,898 | |
103,887 | |||
HOUSEHOLD PRODUCTS—2.4% | |||
284,000 | Procter & Gamble Co. | 44,412 | |
INDUSTRIAL CONGLOMERATES—2.5% | |||
230,000 | Honeywell International Inc. | 45,963 | |
INSURANCE—2.1% | |||
378,000 | Cincinnati Financial Corp | 40,234 | |
LIFE SCIENCES TOOLS & SERVICES—2.7% | |||
216,000 | Danaher Corp. | 51,173 | |
MACHINERY—6.6% | |||
310,000 | Oshkosh Corp. | 23,721 | |
172,000 | Parker-Hannifin Corp. | 55,880 | |
424,000 | Xylem Inc. | 44,028 | |
123,629 | |||
OIL, GAS & CONSUMABLE FUELS—4.3% | |||
1,774,000 | Coterra Energy Inc. | 45,414 | |
353,000 | Phillips 66 | 34,947 | |
80,361 |
53
Harbor Large Cap Value Fund
Portfolio of Investments—Continued
Value and Cost in Thousands
COMMON STOCKS—Continued | |||
Shares | Value | ||
PHARMACEUTICALS—2.8% | |||
462,000 | Merck & Co. Inc. | $53,347 | |
RESIDENTIAL REITs—1.5% | |||
410,000 | Equity Lifestyle Properties Inc. | 28,249 | |
SEMICONDUCTORS & SEMICONDUCTOR EQUIPMENT—5.0% | |||
694,000 | Microchip Technology Inc. | 50,655 | |
368,000 | QUALCOMM Inc. | 42,982 | |
93,637 | |||
SOFTWARE—12.1% | |||
136,000 | Adobe Inc.* | 51,348 | |
174,000 | ANSYS Inc.* | 54,622 | |
216,000 | Autodesk Inc.* | 42,075 | |
254,000 | Microsoft Corp. | 78,044 | |
226,089 |
COMMON STOCKS—Continued | |||
Shares | Value | ||
SPECIALIZED REITs—2.0% | |||
306,000 | Crown Castle International Corp. | $37,666 | |
TOTAL COMMON STOCKS | |||
(Cost $1,340,168) | 1,827,875 | ||
TOTAL INVESTMENTS—97.4% | |||
(Cost $1,340,168) | 1,827,875 | ||
CASH AND OTHER ASSETS, LESS LIABILITIES—2.6% | 48,403 | ||
TOTAL NET ASSETS—100.0% | $1,876,278 |
FAIR VALUE MEASUREMENTS
All investments as of April 30, 2023 (as disclosed in the preceding Portfolio of Investments) were classified as Level 1.
For more information on valuation inputs and their aggregation into the levels identified above, please refer to the Fair Value Measurements and Disclosures in Note 2 of the accompanying Notes to Financial Statements.
* | Non-income producing security |
1 | Depositary receipts such as American Depositary Receipts (ADRs), Global Depositary Receipts (GDRs) and other country specific depositary receipts are certificates evidencing ownership of shares of a foreign issuer. These certificates are issued by depositary banks and generally trade on an established market in the U.S. or elsewhere. |
The accompanying notes are an integral part of the Financial Statements.
54
Harbor Mid Cap Fund
Portfolio of Investments—April 30, 2023 (Unaudited)
Subadvisor: EARNEST Partners, LLC
Sector Allocation (% of investments)
Portfolio of Investments
Value and Cost in Thousands
COMMON STOCKS—98.0% | |||
Shares | Value | ||
AEROSPACE & DEFENSE—6.8% | |||
6,728 | General Dynamics Corp. | $1,469 | |
25,986 | Hexcel Corp. | 1,873 | |
42,515 | Spirit AeroSystems Holdings Inc. | 1,265 | |
15,120 | Woodward Inc. | 1,452 | |
6,059 | |||
BANKS—1.2% | |||
93,554 | KeyCorp | 1,053 | |
BUILDING PRODUCTS—2.2% | |||
37,683 | Masco Corp. | 2,016 | |
CAPITAL MARKETS—7.3% | |||
16,738 | Houlihan Lokey Inc. | 1,529 | |
16,761 | Intercontinental Exchange Inc. | 1,826 | |
18,565 | Raymond James Financial Inc. | 1,681 | |
25,107 | Stifel Financial Corp. | 1,506 | |
6,542 | |||
CHEMICALS—4.2% | |||
7,653 | Albemarle Corp. | 1,420 | |
10,219 | Eastman Chemical Co. | 861 | |
22,726 | Scotts Miracle-Gro Co. | 1,518 | |
3,799 | |||
COMMERCIAL SERVICES & SUPPLIES—4.0% | |||
18,426 | Republic Services Inc. | 2,665 | |
20,437 | Stericycle Inc.* | 933 | |
3,598 | |||
COMMUNICATIONS EQUIPMENT—1.0% | |||
19,143 | Lumentum Holdings Inc.* | 924 | |
CONSUMER STAPLES DISTRIBUTION—1.4% | |||
16,230 | Sysco Corp. | 1,245 | |
CONTAINERS & PACKAGING—2.7% | |||
7,907 | Packaging Corp. of America | 1,070 | |
28,159 | Sealed Air Corp. | 1,351 | |
2,421 |
COMMON STOCKS—Continued | |||
Shares | Value | ||
ELECTRICAL EQUIPMENT—1.9% | |||
38,562 | Sensata Technologies Holding plc (United Kingdom) | $1,675 | |
ELECTRONIC EQUIPMENT, INSTRUMENTS & COMPONENTS—3.8% | |||
12,508 | Arrow Electronics Inc.* | 1,431 | |
13,802 | Keysight Technologies Inc.* | 1,997 | |
3,428 | |||
ENERGY EQUIPMENT & SERVICES—1.9% | |||
34,955 | ChampionX Corp. | 947 | |
21,755 | Helmerich & Payne Inc. | 721 | |
1,668 | |||
ENTERTAINMENT—1.7% | |||
19,882 | Activision Blizzard Inc.* | 1,545 | |
FINANCIAL SERVICES—1.6% | |||
12,970 | Global Payments Inc. | 1,462 | |
GROUND TRANSPORTATION—1.5% | |||
43,833 | CSX Corp. | 1,343 | |
HEALTH CARE EQUIPMENT & SUPPLIES—1.4% | |||
30,101 | Dentsply Sirona Inc. | 1,262 | |
HEALTH CARE PROVIDERS & SERVICES—2.8% | |||
8,439 | AmerisourceBergen Corp. | 1,408 | |
4,855 | Laboratory Corp. of America Holdings | 1,101 | |
2,509 | |||
HOTELS, RESTAURANTS & LEISURE—2.4% | |||
14,149 | Darden Restaurants Inc. | 2,150 | |
HOUSEHOLD DURABLES—2.0% | |||
16,484 | D.R. Horton Inc. | 1,810 | |
INDUSTRIAL REITs—1.8% | |||
53,496 | Americold Realty Trust Inc. | 1,583 | |
INSURANCE—6.5% | |||
12,831 | Reinsurance Group of America Inc. | 1,826 |
55
Harbor Mid Cap Fund
Portfolio of Investments—Continued
Value and Cost in Thousands
COMMON STOCKS—Continued | |||
Shares | Value | ||
INSURANCE—Continued | |||
9,704 | RenaissanceRe Holdings Ltd. (Bermuda) | $2,090 | |
13,825 | The Progressive Corp. | 1,886 | |
5,802 | |||
IT SERVICES—1.4% | |||
15,097 | Akamai Technologies Inc.* | 1,237 | |
LIFE SCIENCES TOOLS & SERVICES—5.5% | |||
14,056 | Agilent Technologies Inc. | 1,904 | |
3,445 | Bio-Rad Laboratories Inc.* | 1,553 | |
36,712 | Syneos Health Inc.* | 1,441 | |
4,898 | |||
MACHINERY—4.9% | |||
5,849 | Cummins Inc. | 1,375 | |
8,762 | Dover Corp. | 1,281 | |
6,659 | Snap-on Inc. | 1,727 | |
4,383 | |||
MULTI-UTILITIES—1.4% | |||
13,409 | WEC Energy Group Inc. | 1,289 | |
OFFICE REITs—1.0% | |||
16,137 | Boston Properties Inc. | 861 | |
OIL, GAS & CONSUMABLE FUELS—2.8% | |||
63,761 | Coterra Energy Inc. | 1,632 | |
22,865 | Murphy Oil Corp. | 840 | |
2,472 | |||
PHARMACEUTICALS—1.4% | |||
25,084 | Catalent Inc.* | 1,257 | |
PROFESSIONAL SERVICES—1.4% | |||
8,462 | Broadridge Financial Solutions Inc. | 1,230 |
COMMON STOCKS—Continued | |||
Shares | Value | ||
REAL ESTATE MANAGEMENT & DEVELOPMENT—2.3% | |||
27,534 | CBRE Group Inc.* | $2,111 | |
SEMICONDUCTORS & SEMICONDUCTOR EQUIPMENT—4.8% | |||
10,242 | Applied Materials Inc. | 1,158 | |
22,009 | Entegris Inc. | 1,649 | |
14,542 | Skyworks Solutions Inc. | 1,540 | |
4,347 | |||
SOFTWARE—5.9% | |||
6,474 | ANSYS Inc.* | 2,032 | |
20,992 | Black Knight Inc.* | 1,147 | |
5,711 | Synopsys Inc.* | 2,121 | |
5,300 | |||
SPECIALIZED REITs—1.2% | |||
4,277 | SBA Communications Corp. | 1,116 | |
SPECIALTY RETAIL—0.8% | |||
8,839 | TJX Companies Inc. | 697 | |
TRADING COMPANIES & DISTRIBUTORS—3.1% | |||
37,383 | Air Lease Corp. | 1,503 | |
11,236 | GATX Corp. | 1,280 | |
2,783 | |||
TOTAL COMMON STOCKS | |||
(Cost $85,177) | 87,875 | ||
TOTAL INVESTMENTS—98.0% | |||
(Cost $85,177) | 87,875 | ||
CASH AND OTHER ASSETS, LESS LIABILITIES—2.0% | 1,821 | ||
TOTAL NET ASSETS—100.0% | $89,696 |
FAIR VALUE MEASUREMENTS
All investments as of April 30, 2023 (as disclosed in the preceding Portfolio of Investments) were classified as Level 1.
For more information on valuation inputs and their aggregation into the levels identified above, please refer to the Fair Value Measurements and Disclosures in Note 2 of the accompanying Notes to Financial Statements.
* | Non-income producing security |
The accompanying notes are an integral part of the Financial Statements.
56
Harbor Mid Cap Value Fund
Portfolio of Investments—April 30, 2023 (Unaudited)
Subadvisor: LSV Asset Management
Sector Allocation (% of investments)
Portfolio of Investments
Value and Cost in Thousands
COMMON STOCKS—99.0% | |||
Shares | Value | ||
AEROSPACE & DEFENSE—1.4% | |||
3,700 | Huntington Ingalls Industries Inc. | $746 | |
15,200 | Moog Inc. | 1,370 | |
25,300 | Textron Inc. | 1,693 | |
3,809 | |||
AUTO COMPONENTS—1.3% | |||
137,900 | American Axle & Manufacturing Holdings Inc.* | 986 | |
36,000 | BorgWarner Inc. | 1,733 | |
68,900 | Goodyear Tire & Rubber Co.* | 735 | |
3,454 | |||
AUTOMOBILES—1.3% | |||
62,200 | Harley-Davidson Inc. | 2,308 | |
17,400 | THOR Industries Inc. | 1,375 | |
3,683 | |||
BANKS—3.5% | |||
83,200 | Citizens Financial Group Inc. | 2,574 | |
42,800 | Fifth Third Bancorp | 1,121 | |
127,600 | KeyCorp | 1,437 | |
170,600 | Regions Financial Corp. | 3,115 | |
52,900 | Zions Bancorporation | 1,474 | |
9,721 | |||
BEVERAGES—1.6% | |||
72,300 | Molson Coors Beverage Co. | 4,300 | |
BIOTECHNOLOGY—1.4% | |||
176,100 | Ironwood Pharmaceuticals Inc.* | 1,833 | |
8,800 | United Therapeutics Corp.* | 2,025 | |
3,858 | |||
BROADLINE RETAIL—1.4% | |||
44,700 | eBay Inc. | 2,076 | |
20,400 | Kohl's Corp. | 449 | |
82,300 | Macy's Inc. | 1,345 | |
3,870 | |||
BUILDING PRODUCTS—1.5% | |||
39,600 | Owens Corning | 4,230 |
COMMON STOCKS—Continued | |||
Shares | Value | ||
CAPITAL MARKETS—3.8% | |||
11,700 | Ameriprise Financial Inc. | $3,570 | |
60,800 | Bank of New York Mellon Corp. | 2,589 | |
30,900 | Jefferies Financial Group Inc. | 990 | |
24,600 | Lazard Ltd. (Bermuda) | 770 | |
34,300 | State Street Corp. | 2,479 | |
10,398 | |||
CHEMICALS—3.4% | |||
56,013 | Chemours Co. | 1,629 | |
14,300 | Eastman Chemical Co. | 1,205 | |
95,300 | Huntsman Corp. | 2,553 | |
16,170 | Ingevity Corp.* | 1,160 | |
52,300 | Koppers Holdings Inc. | 1,716 | |
12,600 | LyondellBasell Industries N.V. (Netherlands) | 1,192 | |
9,455 | |||
CONSUMER FINANCE—3.0% | |||
117,500 | Ally Financial Inc. | 3,100 | |
10,900 | Discover Financial Services | 1,128 | |
166,600 | Navient Corp. | 2,755 | |
46,400 | Synchrony Financial | 1,369 | |
8,352 | |||
CONSUMER STAPLES DISTRIBUTION—3.3% | |||
14,329 | Ingles Markets Inc. | 1,319 | |
87,900 | Kroger Co. | 4,275 | |
71,500 | Sprouts Farmers Market Inc.* | 2,478 | |
31,500 | Walgreens Boots Alliance Inc. | 1,110 | |
9,182 | |||
CONTAINERS & PACKAGING—3.2% | |||
33,400 | Berry Global Group Inc. | 1,931 | |
30,010 | Greif Inc. | 1,884 | |
78,400 | O-I Glass Inc.* | 1,762 | |
37,300 | Silgan Holdings Inc. | 1,837 | |
45,900 | WestRock Co. | 1,374 | |
8,788 | |||
DIVERSIFIED CONSUMER SERVICES—0.5% | |||
36,800 | H&R Block Inc. | 1,248 |
57
Harbor Mid Cap Value Fund
Portfolio of Investments—Continued
Value and Cost in Thousands
COMMON STOCKS—Continued | |||
Shares | Value | ||
ELECTRIC UTILITIES—1.1% | |||
88,600 | NRG Energy Inc. | $3,028 | |
ELECTRICAL EQUIPMENT—1.0% | |||
21,800 | Atkore Inc.* | 2,754 | |
ELECTRONIC EQUIPMENT, INSTRUMENTS & COMPONENTS—4.7% | |||
23,300 | Arrow Electronics Inc.* | 2,666 | |
24,200 | Avnet Inc. | 998 | |
41,300 | Jabil Inc. | 3,228 | |
21,400 | Methode Electronics Inc. | 877 | |
37,427 | Sanmina Corp.* | 1,956 | |
10,300 | SYNNEX Corp. | 917 | |
69,900 | TTM Technologies Inc.* | 826 | |
69,800 | Vishay Intertechnology Inc. | 1,486 | |
12,954 | |||
EQUITY REAL ESTATE INVESTMENT TRUSTS (REITs)—1.1% | |||
99,400 | Brandywine Realty Trust | 390 | |
121,600 | Brixmor Property Group Inc. | 2,594 | |
2,984 | |||
FINANCIAL SERVICES—3.3% | |||
79,987 | Banco Latinoamericano de Comercio Exterior SA (Panama) | 1,440 | |
132,900 | MGIC Investment Corp. | 1,976 | |
19,700 | PennyMac Financial Services Inc. | 1,231 | |
77,000 | Radian Group Inc. | 1,869 | |
16,300 | Voya Financial Inc. | 1,247 | |
117,600 | Western Union Co. | 1,285 | |
9,048 | |||
FOOD PRODUCTS—2.8% | |||
24,900 | Archer Daniels Midland Co. | 1,944 | |
47,700 | Conagra Brands Inc. | 1,811 | |
23,800 | Ingredion Inc. | 2,527 | |
23,300 | Tyson Foods Inc. | 1,456 | |
7,738 | |||
GAS UTILITIES—1.8% | |||
40,000 | National Fuel Gas Co. | 2,236 | |
78,200 | UGI Corp. | 2,650 | |
4,886 | |||
GROUND TRANSPORTATION—0.8% | |||
26,268 | Ryder System Inc. | 2,079 | |
HEALTH CARE PROVIDERS & SERVICES—4.6% | |||
41,800 | Cardinal Health Inc. | 3,432 | |
34,359 | Centene Corp.* | 2,368 | |
16,600 | DaVita Inc.* | 1,500 | |
4,800 | Laboratory Corp. of America Holdings | 1,088 | |
7,000 | McKesson Corp. | 2,550 | |
11,200 | Universal Health Services Inc. | 1,684 | |
12,622 | |||
HEALTH CARE REITs—0.9% | |||
114,400 | Medical Properties Trust Inc. | 1,003 | |
50,900 | Omega Healthcare Investors Inc. | 1,362 | |
2,365 | |||
HOTEL & RESORT REITs—1.0% | |||
137,900 | Hersha Hospitality Trust | 869 |
COMMON STOCKS—Continued | |||
Shares | Value | ||
HOTEL & RESORT REITs—Continued | |||
80,100 | Sabra Health Care REIT Inc. | $913 | |
102,411 | Service Properties Trust | 898 | |
2,680 | |||
HOTELS, RESTAURANTS & LEISURE—0.6% | |||
56,500 | Bloomin' Brands Inc. | 1,399 | |
19,900 | Ruth S Hospitality Group Inc. | 322 | |
1,721 | |||
HOUSEHOLD DURABLES—4.8% | |||
49,557 | Ethan Allen Interiors Inc. | 1,384 | |
11,400 | Meritage Homes Corp. | 1,460 | |
53,900 | PulteGroup Inc. | 3,620 | |
53,700 | Toll Brothers Inc. | 3,432 | |
23,500 | Whirlpool Corp. | 3,280 | |
13,176 | |||
INDEPENDENT POWER AND RENEWABLE ELECTRICITY PRODUCERS—1.2% | |||
142,700 | Vistra Corp. | 3,405 | |
INSURANCE—6.6% | |||
48,300 | Aflac Inc. | 3,374 | |
9,200 | American Financial Group Inc. | 1,129 | |
34,900 | American International Group Inc. | 1,851 | |
21,800 | First American Financial Corp. | 1,256 | |
62,400 | Hartford Financial Services Group Inc. | 4,430 | |
35,800 | Lincoln National Corp. | 778 | |
129,100 | Old Republic International Corp. | 3,262 | |
37,000 | Universal Insurance Holdings Inc. | 571 | |
37,000 | Unum Group | 1,561 | |
18,212 | |||
IT SERVICES—0.6% | |||
73,300 | DXC Technology Co.* | 1,748 | |
LEISURE PRODUCTS—0.6% | |||
19,500 | Brunswick Corp. | 1,654 | |
MACHINERY—6.8% | |||
32,700 | AGCO Corp. | 4,053 | |
67,000 | Allison Transmission Holdings Inc. | 3,269 | |
17,600 | Cummins Inc. | 4,137 | |
17,700 | Snap-on Inc. | 4,591 | |
24,500 | Timken Co. | 1,883 | |
70,400 | Titan International Inc.* | 687 | |
18,620 | |||
MEDIA—2.3% | |||
64,500 | Fox Corp. | 2,145 | |
15,600 | Nexstar Media Group Inc. | 2,706 | |
78,300 | TEGNA Inc. | 1,339 | |
6,190 | |||
METALS & MINING—1.2% | |||
13,000 | Reliance Steel & Aluminum Co. | 3,221 | |
MORTGAGE REAL ESTATE INVESTMENT TRUSTS (REITs)—0.3% | |||
41,650 | Annaly Capital Management Inc. | 832 | |
OFFICE REITs—0.8% | |||
240,078 | Franklin Street Properties Corp. | 278 | |
52,750 | Office Properties Income Trust | 344 |
58
Harbor Mid Cap Value Fund
Portfolio of Investments—Continued
Value and Cost in Thousands
COMMON STOCKS—Continued | |||
Shares | Value | ||
OFFICE REITs—Continued | |||
139,000 | Paramount Group Inc. | $602 | |
138,248 | Piedmont Office Realty Trust Inc. | 900 | |
2,124 | |||
OIL, GAS & CONSUMABLE FUELS—4.5% | |||
55,700 | APA Corp. | 2,053 | |
33,200 | Devon Energy Corp. | 1,774 | |
60,500 | HF Sinclair Corp. | 2,669 | |
22,200 | Marathon Petroleum Corp. | 2,708 | |
19,500 | Phillips 66 | 1,930 | |
10,700 | Valero Energy Corp. | 1,227 | |
3,636 | Vitesse Energy Inc. | 67 | |
12,428 | |||
PAPER & FOREST PRODUCTS—0.3% | |||
17,200 | Sylvamo Corp. | 788 | |
PASSENGER AIRLINES—1.1% | |||
36,000 | Alaska Air Group Inc.* | 1,564 | |
31,500 | United Airlines Holdings Inc.* | 1,380 | |
2,944 | |||
PHARMACEUTICALS—2.0% | |||
26,800 | Jazz Pharmaceuticals plc (Ireland)* | 3,765 | |
13,800 | Prestige Consumer Healthcare Inc.* | 849 | |
93,493 | Viatris Inc. | 872 | |
5,486 | |||
PROFESSIONAL SERVICES—0.8% | |||
27,500 | ManpowerGroup Inc. | 2,082 | |
RETAIL REITs—1.8% | |||
19,400 | Simon Property Group Inc. | 2,198 | |
95,800 | SITE Centers Corp. | 1,182 | |
82,900 | Tanger Factory Outlet Centers Inc. | 1,626 | |
5,006 |
COMMON STOCKS—Continued | |||
Shares | Value | ||
SEMICONDUCTORS & SEMICONDUCTOR EQUIPMENT—1.7% | |||
123,600 | Amkor Technology Inc. | $2,765 | |
25,600 | Diodes Inc.* | 2,040 | |
4,805 | |||
SPECIALTY RETAIL—4.1% | |||
24,100 | Best Buy Co. Inc. | 1,796 | |
9,500 | Dick's Sporting Goods Inc. | 1,378 | |
67,500 | Foot Locker Inc. | 2,834 | |
6,800 | Group 1 Automotive Inc. | 1,526 | |
36,200 | ODP Corp.* | 1,564 | |
15,700 | Penske Automotive Group Inc. | 2,176 | |
11,274 | |||
TECHNOLOGY HARDWARE, STORAGE & PERIPHERALS—2.4% | |||
147,900 | HP Inc. | 4,394 | |
11,300 | Seagate Technology Holdings plc (Ireland) | 664 | |
93,900 | Xerox Holdings Corp. | 1,472 | |
6,530 | |||
TEXTILES, APPAREL & LUXURY GOODS—0.5% | |||
25,800 | Capri Holdings Ltd. (Virgin Islands)* | 1,071 | |
28,100 | G-III Apparel Group Ltd.* | 441 | |
1,512 | |||
TRADING COMPANIES & DISTRIBUTORS—0.3% | |||
10,758 | Triton International Ltd. (Bermuda) | 889 | |
TOTAL COMMON STOCKS | |||
(Cost $251,595) | 272,133 | ||
TOTAL INVESTMENTS—99.0% | |||
(Cost $251,595) | 272,133 | ||
CASH AND OTHER ASSETS, LESS LIABILITIES—1.0% | 2,675 | ||
TOTAL NET ASSETS—100.0% | $274,808 |
FAIR VALUE MEASUREMENTS
All investments as of April 30, 2023 (as disclosed in the preceding Portfolio of Investments) were classified as Level 1.
For more information on valuation inputs and their aggregation into the levels identified above, please refer to the Fair Value Measurements and Disclosures in Note 2 of the accompanying Notes to Financial Statements.
* | Non-income producing security |
The accompanying notes are an integral part of the Financial Statements.
59
Harbor Small Cap Growth Fund
Portfolio of Investments—April 30, 2023 (Unaudited)
Subadvisor: Westfield Capital Management Company, L.P.
Sector Allocation (% of investments)
Portfolio of Investments
Value and Cost in Thousands
COMMON STOCKS—95.6% | |||
Shares | Value | ||
AEROSPACE & DEFENSE—2.3% | |||
319,156 | Hexcel Corp. | $23,005 | |
AUTO COMPONENTS—1.3% | |||
94,730 | Visteon Corp.* | 13,299 | |
BIOTECHNOLOGY—11.8% | |||
398,010 | 89bio Inc.* | 6,360 | |
1,082,901 | Alkermes plc* | 30,917 | |
178,931 | Apellis Pharmaceuticals Inc.* | 14,928 | |
285,150 | Ascendis Pharma AS ADR (Denmark)*,1 | 19,949 | |
246,370 | Iveric Bio Inc.* | 8,103 | |
140,933 | Prometheus Biosciences Inc.* | 27,334 | |
654,185 | Rocket Pharmaceuticals Inc.* | 11,723 | |
119,314 | |||
BUILDING PRODUCTS—2.0% | |||
204,660 | AAON Inc. | 20,057 | |
CAPITAL MARKETS—0.9% | |||
428,537 | StepStone Group Inc. | 9,441 | |
CHEMICALS—3.3% | |||
417,350 | Avient Corp. | 16,072 | |
557,150 | Axalta Coating Systems Ltd. (Bermuda)* | 17,589 | |
33,661 | |||
COMMERCIAL SERVICES & SUPPLIES—2.0% | |||
228,940 | Casella Waste Systems Inc.* | 20,376 | |
COMMUNICATIONS EQUIPMENT—1.6% | |||
119,413 | F5 Networks Inc.* | 16,044 | |
CONSTRUCTION & ENGINEERING—1.9% | |||
420,219 | Willscot Mobile Mini Holdings Corp.* | 19,078 | |
CONTAINERS & PACKAGING—0.2% | |||
441,691 | Ranpak Holdings Corp.* | 1,802 | |
ELECTRICAL EQUIPMENT—3.7% | |||
83,235 | Atkore Inc.* | 10,515 |
COMMON STOCKS—Continued | |||
Shares | Value | ||
ELECTRICAL EQUIPMENT—Continued | |||
101,343 | Encore Wire Corp. | $15,843 | |
259,690 | Sensata Technologies Holding plc (United Kingdom) | 11,284 | |
37,642 | |||
ENERGY EQUIPMENT & SERVICES—2.1% | |||
310,320 | ChampionX Corp. | 8,403 | |
1,584,760 | Nextier Oilfield Solutions Inc.* | 12,805 | |
21,208 | |||
FINANCIAL SERVICES—5.2% | |||
670,888 | Flywire Corp.* | 19,570 | |
305,500 | Shift4 Payments Inc.* | 20,703 | |
70,741 | WEX Inc.* | 12,546 | |
52,819 | |||
GROUND TRANSPORTATION—3.0% | |||
99,910 | Saia Inc.* | 29,750 | |
HEALTH CARE EQUIPMENT & SUPPLIES—5.4% | |||
192,700 | Haemonetics Corp.* | 16,131 | |
90,330 | Inspire Medical Systems Inc.* | 24,175 | |
171,660 | Lantheus Holdings Inc.* | 14,668 | |
54,974 | |||
HEALTH CARE PROVIDERS & SERVICES—4.3% | |||
226,338 | Amedisys Inc.* | 18,175 | |
776,527 | Option Care Health Inc.* | 24,965 | |
43,140 | |||
HEALTH CARE TECHNOLOGY—1.2% | |||
971,420 | Veradigm Inc* | 12,133 | |
HOTELS, RESTAURANTS & LEISURE—8.6% | |||
68,336 | Churchill Downs Inc. | 19,990 | |
222,030 | Planet Fitness Inc.* | 18,460 | |
191,390 | Texas Roadhouse Inc. | 21,172 | |
136,380 | Wingstop Inc. | 27,291 | |
86,913 | |||
INDUSTRIAL REITs—1.1% | |||
311,300 | STAG Industrial Inc. | 10,544 |
60
Harbor Small Cap Growth Fund
Portfolio of Investments—Continued
Value and Cost in Thousands
COMMON STOCKS—Continued | |||
Shares | Value | ||
INSURANCE—4.5% | |||
64,304 | Kinsale Capital Group Inc. | $21,009 | |
158,184 | Palomar Holdings Inc.* | 7,950 | |
92,070 | Primerica Inc. | 16,804 | |
45,763 | |||
LEISURE PRODUCTS—1.3% | |||
178,323 | BRP Inc. (Canada) | 13,333 | |
LIFE SCIENCES TOOLS & SERVICES—3.4% | |||
303,530 | Azenta Inc.* | 13,200 | |
46,371 | Bio-Rad Laboratories Inc.* | 20,904 | |
34,104 | |||
MACHINERY—4.2% | |||
263,604 | ITT Inc. | 22,259 | |
117,670 | Lincoln Electric Holdings Inc. | 19,745 | |
42,004 | |||
OIL, GAS & CONSUMABLE FUELS—3.8% | |||
624,080 | Northern Oil And Gas Inc. | 20,701 | |
275,700 | PDC Energy Inc. | 17,934 | |
38,635 | |||
PHARMACEUTICALS—1.0% | |||
897,936 | Innoviva Inc.* | 10,533 | |
PROFESSIONAL SERVICES—1.5% | |||
167,418 | WNS Holdings Ltd. ADR (India)*,1 | 15,096 | |
RETAIL REITs—1.6% | |||
424,720 | Spirit Realty Capital Inc. | 16,335 |
COMMON STOCKS—Continued | |||
Shares | Value | ||
SEMICONDUCTORS & SEMICONDUCTOR EQUIPMENT—4.7% | |||
33,345 | Impinj Inc.* | $2,946 | |
192,050 | Macom Technology Solutions Holdings Inc.* | 11,204 | |
156,271 | Onto Innovation Inc.* | 12,655 | |
83,376 | Synaptics Inc.* | 7,384 | |
98,500 | Universal Display Corp. | 13,146 | |
47,335 | |||
SOFTWARE—7.1% | |||
496,349 | Box Inc.* | 13,134 | |
254,570 | Dynatrace Inc.* | 10,763 | |
737,829 | Samsara Inc.* | 13,318 | |
607,100 | Smartsheet Inc.* | 24,812 | |
268,270 | Tenable Holdings Inc.* | 9,923 | |
71,950 | |||
SPECIALTY RETAIL—0.6% | |||
295,675 | National Vision Holdings Inc.* | 6,221 | |
TOTAL COMMON STOCKS | |||
(Cost $885,530) | 966,509 | ||
TOTAL INVESTMENTS—95.6% | |||
(Cost $885,530) | 966,509 | ||
CASH AND OTHER ASSETS, LESS LIABILITIES—4.4% | 44,790 | ||
TOTAL NET ASSETS—100.0% | $1,011,299 |
FAIR VALUE MEASUREMENTS
All investments as of April 30, 2023 (as disclosed in the preceding Portfolio of Investments) were classified as Level 1.
For more information on valuation inputs and their aggregation into the levels identified above, please refer to the Fair Value Measurements and Disclosures in Note 2 of the accompanying Notes to Financial Statements.
* | Non-income producing security |
1 | Depositary receipts such as American Depositary Receipts (ADRs), Global Depositary Receipts (GDRs) and other country specific depositary receipts are certificates evidencing ownership of shares of a foreign issuer. These certificates are issued by depositary banks and generally trade on an established market in the U.S. or elsewhere. |
The accompanying notes are an integral part of the Financial Statements.
61
Harbor Small Cap Value Fund
Portfolio of Investments—April 30, 2023 (Unaudited)
Subadvisor: EARNEST Partners LLC
Sector Allocation (% of investments)
Portfolio of Investments
Value and Cost in Thousands
COMMON STOCKS—96.6% | |||
Shares | Value | ||
AEROSPACE & DEFENSE—8.9% | |||
830,577 | AAR Corp.* | $43,838 | |
810,501 | Hexcel Corp. | 58,421 | |
422,745 | Moog Inc. | 38,093 | |
1,078,062 | Parsons Corp.* | 46,896 | |
187,248 | |||
BANKS—10.5% | |||
842,623 | Enterprise Financial Services Corp. | 36,031 | |
1,000,938 | First Merchants Corp. | 29,207 | |
832,298 | Heartland Financial USA Inc. | 27,100 | |
620,337 | South State Corp. | 42,791 | |
1,256,191 | Trustmark Corp. | 30,010 | |
859,831 | United Bankshares Inc. | 28,486 | |
1,134,587 | United Community Banks | 28,251 | |
221,876 | |||
CAPITAL MARKETS—4.5% | |||
699,222 | Houlihan Lokey Inc. | 63,895 | |
514,522 | Stifel Financial Corp. | 30,856 | |
94,751 | |||
CHEMICALS—4.0% | |||
595,974 | Cabot Corp. | 42,767 | |
623,399 | Scotts Miracle-Gro Co. | 41,649 | |
84,416 | |||
COMMERCIAL SERVICES & SUPPLIES—4.6% | |||
896,542 | Casella Waste Systems Inc.* | 79,792 | |
2,059,236 | Steelcase Inc. | 16,474 | |
96,266 | |||
CONSUMER FINANCE—2.1% | |||
438,233 | FirstCash Holdings Inc. | 45,151 | |
ELECTRICAL EQUIPMENT—1.7% | |||
441,101 | EnerSys | 36,598 | |
ELECTRONIC EQUIPMENT, INSTRUMENTS & COMPONENTS—7.5% | |||
360,223 | Advanced Energy Industries Inc. | 31,159 | |
747,405 | CTS Corp. | 29,306 | |
169,786 | Littelfuse Inc. | 41,129 |
COMMON STOCKS—Continued | |||
Shares | Value | ||
ELECTRONIC EQUIPMENT, INSTRUMENTS & COMPONENTS—Continued | |||
678,573 | Methode Electronics Inc. | $27,815 | |
340,720 | Plexus Corp.* | 29,803 | |
159,212 | |||
ENERGY EQUIPMENT & SERVICES—3.5% | |||
1,981,537 | Archrock Inc. | 20,390 | |
436,883 | Core Laboratories NV (Netherlands) | 9,834 | |
456,014 | DMC Global Inc.* | 8,637 | |
1,938,456 | Oceaneering International Inc.* | 34,369 | |
73,230 | |||
FOOD PRODUCTS—2.4% | |||
844,344 | Darling Ingredients Inc.* | 50,298 | |
GROUND TRANSPORTATION—1.1% | |||
297,700 | Ryder System Inc. | 23,566 | |
HEALTH CARE EQUIPMENT & SUPPLIES—5.4% | |||
563,852 | CONMED Corp. | 70,803 | |
521,979 | Integer Holdings Corp.* | 42,985 | |
113,788 | |||
HEALTH CARE PROVIDERS & SERVICES—1.5% | |||
2,146,424 | Pediatrix Medical Group Inc.* | 30,758 | |
HOTEL & RESORT REITs—1.0% | |||
1,489,074 | Pebblebrook Hotel Trust | 21,190 | |
HOTELS, RESTAURANTS & LEISURE—4.8% | |||
1,211,420 | Cheesecake Factory Inc. | 40,812 | |
384,314 | Cracker Barrel Old Country Store Inc. | 40,799 | |
5,121,706 | Sabre Corp.* | 20,487 | |
102,098 | |||
HOUSEHOLD DURABLES—2.9% | |||
258,121 | Helen of Troy Ltd.* | 25,900 | |
274,666 | Meritage Homes Corp. | 35,171 | |
61,071 | |||
INDUSTRIAL REITs—1.9% | |||
1,170,724 | STAG Industrial Inc. | 39,652 |
62
Harbor Small Cap Value Fund
Portfolio of Investments—Continued
Value and Cost in Thousands
COMMON STOCKS—Continued | |||
Shares | Value | ||
INSURANCE—3.7% | |||
540,908 | Horace Mann Educators Corp. | $16,920 | |
337,852 | Reinsurance Group of America Inc. | 48,083 | |
454,867 | United Fire Group Inc. | 12,236 | |
77,239 | |||
MACHINERY—10.0% | |||
456,014 | Albany International Corp. | 41,593 | |
1,283,724 | Flowserve Corp. | 42,864 | |
667,100 | Franklin Electric Co. Inc. | 59,686 | |
582,415 | SPX Technologies Inc.* | 37,088 | |
398,704 | Timken Co. | 30,640 | |
211,871 | |||
OFFICE REITs—1.2% | |||
1,134,014 | Corporate Office Properties Trust | 25,958 | |
PROFESSIONAL SERVICES—1.1% | |||
258,582 | Trinet Group Inc.* | 23,991 | |
SEMICONDUCTORS & SEMICONDUCTOR EQUIPMENT—5.5% | |||
1,046,826 | Amkor Technology Inc. | 23,417 | |
414,715 | Diodes Inc.* | 33,053 | |
270,167 | Entegris Inc. | 20,241 | |
1,469,572 | FormFactor Inc.* | 40,134 | |
116,845 |
COMMON STOCKS—Continued | |||
Shares | Value | ||
SOFTWARE—3.6% | |||
1,338,790 | Box Inc.* | $35,424 | |
647,184 | Envestnet Inc.* | 41,019 | |
76,443 | |||
TEXTILES, APPAREL & LUXURY GOODS—1.2% | |||
1,439,745 | Wolverine World Wide Inc. | 24,101 | |
TRADING COMPANIES & DISTRIBUTORS—2.0% | |||
372,268 | GATX Corp. | 42,405 | |
TOTAL COMMON STOCKS | |||
(Cost $1,623,485) | 2,040,022 | ||
TOTAL INVESTMENTS—96.6% | |||
(Cost $1,623,485) | 2,040,022 | ||
CASH AND OTHER ASSETS, LESS LIABILITIES—3.4% | 72,786 | ||
TOTAL NET ASSETS—100.0% | $2,112,808 |
FAIR VALUE MEASUREMENTS
All investments as of April 30, 2023 (as disclosed in the preceding Portfolio of Investments) were classified as Level 1.
For more information on valuation inputs and their aggregation into the levels identified above, please refer to the Fair Value Measurements and Disclosures in Note 2 of the accompanying Notes to Financial Statements.
* | Non-income producing security |
The accompanying notes are an integral part of the Financial Statements.
63
Harbor Funds
StatementS of Assets and Liabilities—April 30, 2023 (Unaudited)
(All amounts in thousands, except per share amounts)
Harbor Capital Appreciation Fund | Harbor Convertible Securities Fund | Harbor Core Bond Fund | Harbor Core Plus Fund | Harbor Disruptive Innovation Fund | Harbor Diversified International All Cap Fund | Harbor Global Leaders Fund | |
ASSETS | |||||||
Investments, at identified cost | $12,963,266 | $39,292 | $107,831 | $1,109,790 | $86,618 | $887,711 | $58,144 |
Investments, at value (Including securities loaned of $0, $0, $0, $0, $0, $9,176 and $0) | $22,452,637 | $38,411 | $104,930 | $1,011,874 | $79,352 | $988,817 | $66,134 |
Cash | 96,262 | 236 | 2,544 | 16,334 | 1,038 | 13,215 | 452 |
Foreign currency, at value (cost: $4,228, $0, $0, $3, $0, $2,458 and $0) | 4,226 | — | — | 2 | — | 2,443 | — |
Receivables for: | |||||||
Investments sold | 163,757 | 402 | 169 | 3,831 | — | 13,919 | — |
Capital shares sold | 24,159 | — | 7 | 746 | 19 | 459 | 21 |
Dividends | 1,191 | 2 | — | — | 4 | 4,239 | 33 |
Interest | — | 102 | 664 | 6,869 | — | — | — |
Securities lending income | — | — | — | — | — | 3 | — |
Purchased options, at value (cost: $0, $0, $0, $0, $0, $0 and $0) | — | — | — | — | — | 9 | — |
Withholding tax | 963 | — | 4 | — | 1 | 894 | 7 |
Prepaid registration fees | 69 | 24 | 14 | 20 | 21 | 27 | 24 |
Prepaid fund insurance | 215 | 2 | 1 | 10 | 1 | 9 | 1 |
Other assets | 3,107 | 32 | 9 | 386 | 68 | 128 | 12 |
Total Assets | 22,746,586 | 39,211 | 108,342 | 1,040,072 | 80,504 | 1,024,162 | 66,684 |
LIABILITIES | |||||||
Payables for: | |||||||
Investments purchased | 213,919 | 247 | 2,493 | 17,273 | — | 12,423 | — |
Capital shares reacquired | 22,335 | — | 508 | 830 | 832 | 136 | 74 |
Collateral for securities loaned | — | — | — | — | — | 9,176 | — |
Dividends to shareholders | — | — | 5 | 100 | — | — | — |
Accrued expenses: | |||||||
Tax compliance fee payable (see Note 2) | — | — | — | — | — | — | — |
Management fees | 10,217 | 17 | 20 | 209 | 47 | 612 | 39 |
12b-1 fees | 204 | — | — | 2 | 4 | 4 | 2 |
Transfer agent fees | 1,423 | 2 | 4 | 83 | 6 | 38 | 5 |
Trustees' fees and expenses | 3,768 | 30 | 5 | 470 | 64 | 67 | 8 |
Other | 1,855 | 25 | 26 | 158 | 48 | 691 | 63 |
Total Liabilities | 253,721 | 321 | 3,061 | 19,125 | 1,001 | 23,147 | 191 |
NET ASSETS | $22,492,865 | $38,890 | $105,281 | $1,020,947 | $79,503 | $1,001,015 | $66,493 |
Net Assets Consist of: | |||||||
Paid-in capital | $14,120,881 | $55,406 | $114,748 | $1,202,333 | $210,669 | $951,534 | $60,675 |
Total distributable earnings/(loss) | 8,371,984 | (16,516 ) | (9,467 ) | (181,386 ) | (131,166 ) | 49,481 | 5,818 |
$22,492,865 | $38,890 | $105,281 | $1,020,947 | $79,503 | $1,001,015 | $66,493 | |
The accompanying notes are an integral part of the Financial Statements.
65
Harbor Capital Appreciation Fund | Harbor Convertible Securities Fund | Harbor Core Bond Fund | Harbor Core Plus Fund | Harbor Disruptive Innovation Fund | Harbor Diversified International All Cap Fund | Harbor Global Leaders Fund | |
NET ASSET VALUE PER SHARE BY CLASS | |||||||
Retirement Class | |||||||
Net assets | $7,441,421 | $10,029 | $72,695 | $13,270 | $10,550 | $676,998 | $15,684 |
Shares of beneficial interest1 | 98,798 | 1,028 | 8,019 | 1,289 | 2,269 | 57,673 | 628 |
Net asset value per share2 | $75.32 | $9.75 | $9.06 | $10.29 | $4.65 | $11.74 | $24.97 |
Institutional Class | |||||||
Net assets | $14,047,453 | $27,126 | $32,586 | $997,110 | $51,011 | $304,853 | $39,099 |
Shares of beneficial interest1 | 186,931 | 2,783 | 3,596 | 97,023 | 11,116 | 25,960 | 1,575 |
Net asset value per share2 | $75.15 | $9.75 | $9.06 | $10.28 | $4.59 | $11.74 | $24.83 |
Administrative Class | |||||||
Net assets | $201,939 | $68 | N/A | $10,567 | $2,050 | $9,243 | $1,008 |
Shares of beneficial interest1 | 2,800 | 7 | N/A | 1,027 | 528 | 789 | 42 |
Net asset value per share2 | $72.11 | $9.58 | N/A | $10.29 | $3.88 | $11.71 | $23.99 |
Investor Class | |||||||
Net assets | $802,052 | $1,667 | N/A | N/A | $15,892 | $9,921 | $10,702 |
Shares of beneficial interest1 | 11,561 | 172 | N/A | N/A | 4,585 | 851 | 457 |
Net asset value per share2 | $69.38 | $9.70 | N/A | N/A | $3.47 | $11.66 | $23.43 |
1 | Par value $0.01 (unlimited authorizations) |
2 | Per share amounts can be recalculated to the amounts disclosed herein when total net assets and shares of beneficial interest are not rounded to thousands. |
66
Harbor Funds
StatementS of Assets and Liabilities—April 30, 2023 (Unaudited)—Continued
(All amounts in thousands, except per share amounts)
Harbor International Fund | Harbor International Core Fund | Harbor International Growth Fund | Harbor International Small Cap Fund | Harbor Large Cap Value Fund | Harbor Mid Cap Fund | |
ASSETS | ||||||
Investments, at identified cost | $2,938,262 | $145,778 | $293,966 | $223,158 | $1,340,168 | $85,177 |
Investments, at value (Including securities loaned of $4,158, $0, $0, $0, $0 and $0) | $3,469,929 | $152,277 | $373,392 | $239,610 | $1,827,875 | $87,875 |
Cash | 52,364 | 1,016 | 2,508 | 10,964 | 30,706 | 1,998 |
Foreign currency, at value (cost: $11,222, $100, $6, $842, $0 and $0) | 11,188 | 98 | 6 | 843 | — | — |
Receivables for: | ||||||
Investments sold | 71,450 | — | 493 | 660 | 16,654 | — |
Capital shares sold | 1,313 | 215 | 49 | 766 | 1,101 | — |
Dividends | 20,432 | 780 | 954 | 1,379 | 1,463 | 26 |
Interest | — | — | — | — | — | — |
Securities lending income | 39 | — | — | 1 | — | — |
Purchased options, at value (cost: $0, $0, $0, $0, $0, and $0) | 101 | — | — | 127 | — | — |
Withholding tax | 4,494 | 237 | 273 | 94 | 458 | — |
Prepaid registration fees | 51 | 29 | 21 | 36 | 27 | 23 |
Prepaid fund insurance | 31 | 1 | 4 | 2 | 22 | 1 |
Other assets | 3,875 | 40 | 98 | 20 | 146 | 6 |
Total Assets | 3,635,267 | 154,693 | 377,798 | 254,502 | 1,878,452 | 89,929 |
LIABILITIES | ||||||
Payables for: | ||||||
Investments purchased | 65,792 | — | 312 | 1,651 | — | — |
Capital shares reacquired | 694 | 82 | 159 | 119 | 836 | 149 |
Collateral for securities loaned | 4,158 | — | — | — | — | — |
Dividends to shareholders | — | — | — | — | — | — |
Accrued expenses: | ||||||
Tax compliance fee payable (see Note 2) | 10,737 | — | — | — | — | — |
Management fees | 2,153 | 94 | 232 | 167 | 929 | 55 |
12b-1 fees | 59 | 2 | 2 | 1 | 6 | — |
Transfer agent fees | 274 | 12 | 26 | 15 | 80 | 3 |
Trustees' fees and expenses | 3,630 | 4 | 84 | 8 | 153 | 4 |
Other | 2,416 | 247 | 403 | 184 | 170 | 22 |
Total Liabilities | 89,913 | 441 | 1,218 | 2,145 | 2,174 | 233 |
NET ASSETS | $3,545,354 | $154,252 | $376,580 | $252,357 | $1,876,278 | $89,696 |
Net Assets Consist of: | ||||||
Paid-in capital | $3,499,036 | $151,668 | $301,672 | $233,267 | $1,361,731 | $88,246 |
Total distributable earnings/(loss) | 46,318 | 2,584 | 74,908 | 19,090 | 514,547 | 1,450 |
$3,545,354 | $154,252 | $376,580 | $252,357 | $1,876,278 | $89,696 | |
The accompanying notes are an integral part of the Financial Statements.
67
Harbor International Fund | Harbor International Core Fund | Harbor International Growth Fund | Harbor International Small Cap Fund | Harbor Large Cap Value Fund | Harbor Mid Cap Fund | |
NET ASSET VALUE PER SHARE BY CLASS | ||||||
Retirement Class | ||||||
Net assets | $594,840 | $23,669 | $78,503 | $71,736 | $1,169,000 | $65,801 |
Shares of beneficial interest1 | 13,669 | 2,131 | 4,985 | 4,871 | 60,488 | 5,319 |
Net asset value per share2 | $43.52 | $11.11 | $15.75 | $14.73 | $19.33 | $12.37 |
Institutional Class | ||||||
Net assets | $2,658,846 | $119,335 | $289,851 | $175,143 | $678,087 | $23,054 |
Shares of beneficial interest1 | 60,848 | 10,756 | 18,440 | 11,891 | 35,076 | 1,864 |
Net asset value per share2 | $43.70 | $11.10 | $15.72 | $14.73 | $19.33 | $12.37 |
Administrative Class | ||||||
Net assets | $11,604 | N/A | $156 | $521 | $3,005 | N/A |
Shares of beneficial interest1 | 263 | N/A | 10 | 36 | 155 | N/A |
Net asset value per share2 | $44.09 | N/A | $15.68 | $14.70 | $19.34 | N/A |
Investor Class | ||||||
Net assets | $280,064 | $11,248 | $8,070 | $4,957 | $26,186 | $841 |
Shares of beneficial interest1 | 6,471 | 1,020 | 518 | 338 | 1,338 | 68 |
Net asset value per share2 | $43.28 | $11.03 | $15.58 | $14.67 | $19.57 | $12.32 |
68
Harbor Funds
StatementS of Assets and Liabilities—April 30, 2023 (Unaudited)—Continued
(All amounts in thousands, except per share amounts)
Harbor Mid Cap Value Fund | Harbor Small Cap Growth Fund | Harbor Small Cap Value Fund | |
ASSETS | |||
Investments, at identified cost | $251,595 | $885,530 | $1,623,485 |
Investments, at value (Including securities loaned of $0, $0, and $0) | $272,133 | $966,509 | $2,040,022 |
Cash | 536 | 48,613 | 72,466 |
Foreign currency, at value (cost: $0, $0, and $0) | — | — | — |
Receivables for: | |||
Investments sold | 2,193 | 9,298 | 1,888 |
Capital shares sold | 79 | 1,105 | 1,019 |
Dividends | 263 | 38 | 787 |
Interest | — | — | — |
Securities lending income | — | — | — |
Purchased options, at value (cost: $0, $0, and $0) | — | — | — |
Withholding tax | — | — | — |
Prepaid registration fees | 26 | 32 | 39 |
Prepaid fund insurance | 3 | 10 | 23 |
Other assets | 83 | 102 | 145 |
Total Assets | 275,316 | 1,025,707 | 2,116,389 |
LIABILITIES | |||
Payables for: | |||
Investments purchased | 116 | 13,122 | 634 |
Capital shares reacquired | 65 | 386 | 1,059 |
Collateral for securities loaned | — | — | — |
Dividends to shareholders | — | — | — |
Accrued expenses: | |||
Tax compliance fee payable (see Note 2) | — | — | — |
Management fees | 172 | 620 | 1,308 |
12b-1 fees | 6 | 2 | 9 |
Transfer agent fees | 24 | 60 | 136 |
Trustees' fees and expenses | 79 | 130 | 212 |
Other | 46 | 88 | 223 |
Total Liabilities | 508 | 14,408 | 3,581 |
NET ASSETS | $274,808 | $1,011,299 | $2,112,808 |
Net Assets Consist of: | |||
Paid-in capital | $239,311 | $1,039,285 | $1,532,525 |
Total distributable earnings/(loss) | 35,497 | (27,986 ) | 580,283 |
$274,808 | $1,011,299 | $2,112,808 | |
The accompanying notes are an integral part of the Financial Statements.
69
Harbor Mid Cap Value Fund | Harbor Small Cap Growth Fund | Harbor Small Cap Value Fund | |
NET ASSET VALUE PER SHARE BY CLASS | |||
Retirement Class | |||
Net assets | $17,373 | $352,445 | $610,392 |
Shares of beneficial interest1 | 774 | 30,076 | 16,556 |
Net asset value per share2 | $22.45 | $11.72 | $36.87 |
Institutional Class | |||
Net assets | $227,122 | $650,339 | $1,459,101 |
Shares of beneficial interest1 | 10,114 | 55,998 | 39,586 |
Net asset value per share2 | $22.46 | $11.61 | $36.86 |
Administrative Class | |||
Net assets | $3,225 | $612 | $8,239 |
Shares of beneficial interest1 | 142 | 61 | 226 |
Net asset value per share2 | $22.77 | $9.96 | $36.54 |
Investor Class | |||
Net assets | $27,088 | $7,903 | $35,076 |
Shares of beneficial interest1 | 1,205 | 880 | 986 |
Net asset value per share2 | $22.48 | $8.99 | $35.57 |
70
Harbor Funds
StatementS of Operations—Period Ended April 30, 2023 (Unaudited)
(All amounts in thousands)
Harbor Capital Appreciation Fund | Harbor Convertible Securities Fund | |
Investment Income | ||
Dividends | $83,741 | $71 |
Interest | 2,689 | 929 |
Net securities lending income | — | — |
Foreign taxes withheld | (1,869 ) | — |
Foreign tax reclaims, net of applicable tax compliance fee (see Note 2) | — | — |
Total Investment Income | 84,561 | 1,000 |
Operating Expenses | ||
Management fees | 63,897 | 253 |
12b-1 fees: | ||
Administrative Class | 234 | 1 |
Investor Class | 951 | 2 |
Shareholder communications | 356 | 6 |
Custodian fees | 281 | 11 |
Transfer agent fees: | ||
Retirement Class | 705 | 3 |
Institutional Class | 6,650 | 27 |
Administrative Class | 94 | — |
Investor Class | 798 | 2 |
Professional fees | 777 | 29 |
Trustees' fees and expenses | 607 | 3 |
Registration fees | 90 | 28 |
Miscellaneous | 267 | 6 |
Total expenses | 75,707 | 371 |
Management fees waived | (4,479 ) | (17 ) |
Other expenses reimbursed | — | (36 ) |
Net expenses | 71,228 | 318 |
Net Investment Income/(Loss) | 13,333 | 682 |
Net Realized and Change in Net Unrealized Gain/(Loss) on Investment Transactions | ||
Net realized gain/(loss) on: | ||
Investments (net of foreign capital gains tax: $0, $0, $0, $0, $0, $(1), $0 and $(2)) | (27,635 ) | (10,709 ) |
In-kind redemptions | 87,729 | — |
Foreign currency transactions | (194 ) | — |
Purchased options | — | — |
Change in net unrealized appreciation/(depreciation) on: | ||
Investments (net of foreign capital gains tax accrual: $0, $0, $0, $0, $0, $0, $0 and $0) | 2,510,094 | 13,479 |
Purchased options | — | — |
Translations of assets and liabilities in foreign currencies | 13 | — |
Net gain/(loss) on investment transactions | 2,570,007 | 2,770 |
Net Increase/(Decrease) in Net Assets Resulting from Operations | $2,583,340 | $3,452 |
The accompanying notes are an integral part of the Financial Statements.
71
Harbor Core Bond Fund | Harbor Core Plus Fund | Harbor Disruptive Innovation Fund | Harbor Diversified International All Cap Fund | Harbor Global Leaders Fund | Harbor International Fund |
$— | $— | $140 | $13,041 | $209 | $51,462 |
1,721 | 19,852 | 42 | 245 | 26 | 759 |
— | 56 | — | 58 | — | 226 |
— | — | (2 ) | (1,321 ) | (17 ) | (4,831 ) |
— | — | — | — | — | 3,120 |
1,721 | 19,908 | 180 | 12,023 | 218 | 50,736 |
99 | 1,221 | 322 | 3,516 | 254 | 12,631 |
N/A | 14 | 3 | 11 | 1 | 14 |
N/A | N/A | 20 | 12 | 14 | 339 |
5 | 38 | 14 | 16 | 5 | 116 |
13 | 48 | 10 | 168 | 12 | 244 |
6 | 1 | 2 | 63 | 2 | 56 |
15 | 477 | 29 | 144 | 20 | 1,265 |
N/A | 5 | 1 | 4 | 1 | 6 |
N/A | N/A | 17 | 10 | 11 | 284 |
2 | 36 | 3 | 53 | 9 | 120 |
2 | 28 | 3 | 25 | 2 | 90 |
15 | 25 | 30 | 29 | 27 | 51 |
4 | 15 | 6 | 15 | 5 | 43 |
161 | 1,908 | 460 | 4,066 | 363 | 15,259 |
— | — | — | — | (17 ) | — |
(36 ) | (44 ) | (52 ) | (540 ) | (41 ) | (2,012 ) |
125 | 1,864 | 408 | 3,526 | 305 | 13,247 |
1,596 | 18,044 | (228 ) | 8,497 | (87 ) | 37,489 |
(1,105 ) | (11,846 ) | (32,171 ) | (11,182 ) | (368 ) | (26,728 ) |
— | — | — | — | — | — |
— | — | (1 ) | 534 | 2 | 3,106 |
— | — | — | — | — | 4 |
5,430 | 64,748 | 37,461 | 181,208 | 7,539 | 730,216 |
— | — | — | 9 | — | 64 |
— | 26 | — | 54 | 2 | 529 |
4,325 | 52,928 | 5,469 | 170,623 | 7,171 | 707,191 |
$5,921 | $70,972 | $5,241 | $179,120 | $7,084 | $744,680 |
72
Harbor Funds
StatementS of Operations—Period Ended April 30, 2023 (Unaudited)—Continued
(All amounts in thousands)
Harbor International Core Fund | Harbor International Growth Fund | Harbor International Small Cap Fund | |
Investment Income | |||
Dividends | $2,936 | $1,971 | $3,026 |
Interest | 42 | 44 | 236 |
Net securities lending income | 5 | — | 1 |
Foreign taxes withheld | (279 ) | (169 ) | (304 ) |
Foreign tax reclaims, net of applicable tax compliance fee (see Note 2) | — | — | — |
Total Investment Income | 2,704 | 1,846 | 2,959 |
Operating Expenses | |||
Management fees | 468 | 1,397 | 790 |
12b-1 fees: | |||
Administrative Class | N/A | — | 1 |
Investor Class | 8 | 9 | 4 |
Shareholder communications | 7 | 9 | 5 |
Custodian fees | 88 | 66 | 40 |
Transfer agent fees: | |||
Retirement Class | 2 | 8 | 5 |
Institutional Class | 48 | 143 | 66 |
Administrative Class | — | — | — |
Investor Class | 7 | 8 | 3 |
Professional fees | 28 | 44 | 11 |
Trustees' fees and expenses | 3 | 10 | 4 |
Registration fees | 23 | 28 | 31 |
Miscellaneous | 6 | 9 | 6 |
Total expenses | 688 | 1,731 | 966 |
Management fees waived | — | — | — |
Other expenses reimbursed | (154 ) | (166 ) | (88 ) |
Net expenses | 534 | 1,565 | 878 |
Net Investment Income/(Loss) | 2,170 | 281 | 2,081 |
Net Realized and Change in Net Unrealized Gain/(Loss) on Investment Transactions | |||
Net realized gain/(loss) on: | |||
Investments (net of foreign capital gains tax: $0, $214, $0, $0, $0, $0, $0 and $0) | 638 | 6,746 | 878 |
In-kind redemptions | — | — | — |
Foreign currency transactions | (44 ) | (7 ) | (62 ) |
Purchased options | — | — | — |
Change in net unrealized appreciation/(depreciation) on: | |||
Investments (net of foreign capital gains tax accrual: $0, $172, $0, $0, $0, $0, $0 and $0) | 11,130 | 70,065 | 26,570 |
Purchased options | — | — | 127 |
Translations of assets and liabilities in foreign currencies | 11 | 35 | (5 ) |
Net gain/(loss) on investment transactions | 11,735 | 76,839 | 27,508 |
Net Increase/(Decrease) in Net Assets Resulting from Operations | $13,905 | $77,120 | $29,589 |
The accompanying notes are an integral part of the Financial Statements.
73
Harbor Large Cap Value Fund | Harbor Mid Cap Fund | Harbor Mid Cap Value Fund | Harbor Small Cap Growth Fund | Harbor Small Cap Value Fund |
$20,616 | $729 | $4,299 | $3,281 | $15,326 |
796 | 31 | 43 | 720 | 1,192 |
— | — | — | — | — |
(66 ) | — | — | (7 ) | (1 ) |
— | — | — | — | — |
21,346 | 760 | 4,342 | 3,994 | 16,517 |
6,032 | 340 | 1,140 | 3,575 | 8,034 |
4 | N/A | 4 | 1 | 11 |
33 | 1 | 35 | 9 | 46 |
30 | 5 | 15 | 11 | 64 |
27 | 7 | 11 | 18 | 33 |
127 | 7 | 3 | 33 | 61 |
355 | 11 | 122 | 308 | 742 |
2 | N/A | 2 | — | 5 |
28 | 1 | 30 | 8 | 39 |
75 | 3 | 11 | 33 | 76 |
58 | 2 | 9 | 27 | 60 |
47 | 21 | 28 | 51 | 48 |
30 | 5 | 8 | 15 | 30 |
6,848 | 403 | 1,418 | 4,089 | 9,249 |
— | — | — | — | — |
(368 ) | (30 ) | (82 ) | — | — |
6,480 | 373 | 1,336 | 4,089 | 9,249 |
14,866 | 387 | 3,006 | (95 ) | 7,268 |
28,457 | 1,518 | 11,100 | (61,900 ) | 181,727 |
— | — | — | — | — |
— | — | — | 1 | — |
— | — | — | — | — |
40,808 | 665 | (7,804 ) | 101,791 | (183,188 ) |
— | — | — | — | — |
— | — | — | — | — |
69,265 | 2,183 | 3,296 | 39,892 | (1,461 ) |
$84,131 | $2,570 | $6,302 | $39,797 | $5,807 |
74
Harbor Funds
Statements of Changes In Net Assets
(All amounts in thousands)
Harbor Capital Appreciation Fund | Harbor Convertible Securities Fund | Harbor Core Bond Fund | ||||
November 1, 2022 through April 30, 2023 | November 1, 2021 through October 31, 2022 | November 1, 2022 through April 30, 2023 | November 1, 2021 through October 31, 2022 | November 1, 2022 through April 30, 2023 | November 1, 2021 through October 31, 2022 | |
INCREASE/(DECREASE) IN NET ASSETS | (Unaudited) | (Unaudited) | (Unaudited) | |||
Operations: | ||||||
Net investment income/(loss) | $13,333 | $(43,377) | $682 | $503 | $1,596 | $1,820 |
Net realized gain/(loss) on investments | 59,900 | 165,694 | (10,709) | (4,062) | (1,105) | (4,988) |
Change in net unrealized appreciation/(depreciation) of investments | 2,510,107 | (14,648,695) | 13,479 | (31,493) | 5,430 | (11,308) |
Net increase/(decrease) in assets resulting from operations | 2,583,340 | (14,526,378) | 3,452 | (35,052) | 5,921 | (14,476) |
Distributions to Shareholders | ||||||
Retirement Class | — | (1,774,533) | (288) | (5,078) | (1,196) | (864) |
Institutional Class | — | (4,236,598) | (579) | (20,117) | (670) | (1,726) |
Administrative Class | — | (64,010) | (1) | (10) | N/A | N/A |
Investor Class | — | (245,539) | (15) | (352) | N/A | N/A |
Total distributions to shareholders | — | (6,320,680) | (883) | (25,557) | (1,866) | (2,590) |
Net Increase/(Decrease) Derived from Capital Share Transactions | (1,774,583) | 263,781 | (126,401) | 17,371 | 31,849 | (56,045) |
Net increase/(decrease) in net assets | 808,757 | (20,583,277) | (123,832) | (43,238) | 35,904 | (73,111) |
Net Assets | ||||||
Beginning of period | 21,684,108 | 42,267,385 | 162,722 | 205,960 | 69,377 | 142,488 |
End of period | $22,492,865 | $21,684,108 | $38,890 | $162,722 | $105,281 | $69,377 |
The accompanying notes are an integral part of the Financial Statements.
75
Harbor Core Plus Fund | Harbor Disruptive Innovation Fund | Harbor Diversified International All Cap Fund | Harbor Global Leaders Fund | Harbor International Fund | |||||
November 1, 2022 through April 30, 2023 | November 1, 2021 through October 31, 2022 | November 1, 2022 through April 30, 2023 | November 1, 2021 through October 31, 2022 | November 1, 2022 through April 30, 2023 | November 1, 2021 through October 31, 2022 | November 1, 2022 through April 30, 2023 | November 1, 2021 through October 31, 2022 | November 1, 2022 through April 30, 2023 | November 1, 2021 through October 31, 2022 |
(Unaudited) | (Unaudited) | (Unaudited) | (Unaudited) | (Unaudited) | |||||
$18,044 | $35,812 | $(228) | $(515) | $8,497 | $19,600 | $(87) | $(274) | $37,489 | $98,461 |
(11,846) | (47,933) | (32,172) | (89,319) | (10,648) | (11,363) | (370) | 6,299 | (23,618) | (1,372) |
64,774 | (199,083) | 37,641 | (42,370) | 181,271 | (272,409) | 7,541 | (50,292) | 730,809 | (1,118,338) |
70,972 | (211,204) | 5,241 | (132,204) | 179,120 | (264,172) | 7,084 | (44,267) | 744,680 | (1,021,249) |
(284) | (4,079) | — | (23,847) | (9,126) | (59,014) | (1,241) | (2,179) | (17,969) | (18,874) |
(21,572) | (43,520) | — | (77,166) | (3,990) | (22,740) | (3,157) | (7,958) | (81,213) | (68,529) |
(230) | (541) | — | (2,270) | (102) | (638) | (75) | (154) | (332) | (269) |
N/A | N/A | — | (25,465) | (93) | (661) | (863) | (2,404) | (7,758) | (6,320) |
(22,086) | (48,140) | — | (128,748) | (13,311) | (83,053) | (5,336) | (12,695) | (107,272) | (93,992) |
24,032 | (358,945) | (33,958) | 21,971 | 27,470 | (50,281) | (2,808) | (18,033) | (108,889) | (438,491) |
72,918 | (618,289) | (28,717) | (238,981) | 193,279 | (397,506) | (1,060) | (74,995) | 528,519 | (1,533,732) |
948,029 | 1,566,318 | 108,220 | 347,201 | 807,736 | 1,205,242 | 67,553 | 142,548 | 3,016,835 | 4,570,567 |
$1,020,947 | $948,029 | $79,503 | $108,220 | $1,001,015 | $807,736 | $66,493 | $67,553 | $3,545,354 | $3,016,835 |
76
Harbor Funds
Statements of Changes In Net Assets—Continued
(All amounts in thousands)
Harbor International Core Fund | Harbor International Growth Fund | Harbor International Small Cap Fund | ||||
November 1, 2022 through April 30, 2023 | November 1, 2021 through October 31, 2022 | November 1, 2022 through April 30, 2023 | November 1, 2021 through October 31, 2022 | November 1, 2022 through April 30, 2023 | November 1, 2021 through October 31, 2022 | |
INCREASE/(DECREASE) IN NET ASSETS | (Unaudited) | (Unaudited) | (Unaudited) | |||
Operations: | ||||||
Net investment income/(loss) | $2,170 | $2,572 | $281 | $1,312 | $2,081 | $1,648 |
Net realized gain/(loss) on investments | 594 | (6,072) | 6,739 | (3,649) | 816 | 2,143 |
Change in net unrealized appreciation/(depreciation) of investments | 11,141 | (11,551) | 70,100 | (308,631) | 26,692 | (16,401) |
Net increase/(decrease) in assets resulting from operations | 13,905 | (15,051) | 77,120 | (310,968) | 29,589 | (12,610) |
Distributions to Shareholders | ||||||
Retirement Class | (556) | (1,921) | — | (11,011) | (1,030) | (731) |
Institutional Class | (2,011) | (3,283) | — | (55,495) | (2,528) | (3,330) |
Administrative Class | N/A | N/A | — | (36) | (11) | (31) |
Investor Class | (62) | (12) | — | (992) | (29) | (121) |
Total distributions to shareholders | (2,629) | (5,216) | – | (67,534) | (3,598) | (4,213) |
Net Increase/(Decrease) Derived from Capital Share Transactions | 52,516 | 57,654 | (46,731) | (146,117) | 100,763 | 80,999 |
Net increase/(decrease) in net assets | 63,792 | 37,387 | 30,389 | (524,619) | 126,754 | 64,176 |
Net Assets | ||||||
Beginning of period | 90,460 | 53,073 | 346,191 | 870,810 | 125,603 | 61,427 |
End of period | $154,252 | $90,460 | $376,580 | $346,191 | $252,357 | $125,603 |
The accompanying notes are an integral part of the Financial Statements.
77
Harbor Large Cap Value Fund | Harbor Mid Cap Fund | Harbor Mid Cap Value Fund | Harbor Small Cap Growth Fund | Harbor Small Cap Value Fund | |||||
November 1, 2022 through April 30, 2023 | November 1, 2021 through October 31, 2022 | November 1, 2022 through April 30, 2023 | November 1, 2021 through October 31, 2022 | November 1, 2022 through April 30, 2023 | November 1, 2021 through October 31, 2022 | November 1, 2022 through April 30, 2023 | November 1, 2021 through October 31, 2022 | November 1, 2022 through April 30, 2023 | November 1, 2021 through October 31, 2022 |
(Unaudited) | (Unaudited) | (Unaudited) | (Unaudited) | (Unaudited) | |||||
$14,866 | $28,002 | $387 | $395 | $3,006 | $7,372 | $(95) | $(1,568) | $7,268 | $8,959 |
28,457 | 88,519 | 1,518 | 54 | 11,100 | 29,401 | (61,899) | 40,115 | 181,727 | 142,404 |
40,808 | (435,986) | 665 | (6,927) | (7,804) | (49,490) | 101,791 | (301,227) | (183,188) | (335,267) |
84,131 | (319,465) | 2,570 | (6,478) | 6,302 | (12,717) | 39,797 | (262,680) | 5,807 | (183,904) |
(61,110) | (52,480) | (2,210) | (799) | (2,850) | (756) | (14,253) | (83,797) | (39,751) | (32,266) |
(33,052) | (36,416) | (657) | (507) | (18,642) | (4,476) | (26,126) | (148,196) | (97,526) | (107,712) |
(145) | (126) | N/A | N/A | (233) | (37) | (33) | (230) | (577) | (624) |
(1,145) | (979) | (25) | (17) | (2,052) | (306) | (406) | (2,234) | (2,454) | (3,413) |
(95,452) | (90,001) | (2,892) | (1,323) | (23,777) | (5,575) | (40,818) | (234,457) | (140,308) | (144,015) |
(220,127) | (40,120) | 1,000 | 35,025 | (24,958) | (111,979) | 97,656 | 281,609 | 105,805 | (229,263) |
(231,448) | (449,586) | 678 | 27,224 | (42,433) | (130,271) | 96,635 | (215,528) | (28,696) | (557,182) |
2,107,726 | 2,557,312 | 89,018 | 61,794 | 317,241 | 447,512 | 914,664 | 1,130,192 | 2,141,504 | 2,698,686 |
$1,876,278 | $2,107,726 | $89,696 | $89,018 | $274,808 | $317,241 | $1,011,299 | $914,664 | $2,112,808 | $2,141,504 |
78
Harbor Funds
Statements of Changes in Net Assets—Capital Stock Activity
(All amounts in thousands)
Harbor Capital Appreciation Fund | Harbor Convertible Securities Fund | Harbor Core Bond Fund | ||||
November 1, 2022 through April 30, 2023 | November 1, 2021 through October 31, 2022 | November 1, 2022 through April 30, 2023 | November 1, 2021 through October 31, 2022 | November 1, 2022 through April 30, 2023 | November 1, 2021 through October 31, 2022 | |
(Unaudited) | (Unaudited) | (Unaudited) | ||||
AMOUNT ($) | ||||||
Retirement Class | ||||||
Net proceeds from sale of shares | $666,223 | $2,201,220 | $9,934 | $333 | $31,887 | $20,943 |
Reinvested distributions | — | 1,592,630 | 288 | 5,077 | 1,161 | 817 |
Cost of shares reacquired | (1,193,892) | (2,000,911) | (34,777) | (687) | (4,344) | (11,313) |
Cost of shares reacquired through in-kind redemptions | — | (104,908) | — | — | — | — |
Net increase/(decrease) in net assets | $(527,669) | $1,688,031 | $(24,555) | $4,723 | $28,704 | $10,447 |
Institutional Class | ||||||
Net proceeds from sale of shares | $899,367 | $2,793,878 | $4,246 | $41,896 | $4,444 | $5,104 |
Reinvested distributions | — | 4,073,379 | 560 | 19,729 | 661 | 1,708 |
Cost of shares reacquired | (1,898,379) | (6,101,128) | (106,240) | (49,025) | (1,960) | (73,304) |
Cost of shares reacquired through in-kind redemptions | (155,296) | (2,160,346) | — | — | — | — |
Net increase/(decrease) in net assets | $(1,154,308) | $(1,394,217) | $(101,434) | $12,600 | $3,145 | $(66,492) |
Administrative Class | ||||||
Net proceeds from sale of shares | $14,616 | $50,951 | $7,132 | $— | N/A | N/A |
Reinvested distributions | — | 59,341 | 1 | 10 | N/A | N/A |
Cost of shares reacquired | (22,756) | (142,425) | (7,154) | — | N/A | N/A |
Net increase/(decrease) in net assets | $(8,140) | $(32,133) | $(21) | $10 | N/A | N/A |
Investor Class | ||||||
Net proceeds from sale of shares | $41,750 | $137,419 | $1,349 | $363 | N/A | N/A |
Reinvested distributions | — | 240,718 | 15 | 352 | N/A | N/A |
Cost of shares reacquired | (126,216) | (376,037) | (1,755) | (677) | N/A | N/A |
Net increase/(decrease) in net assets | $(84,466) | $2,100 | $(391) | $38 | N/A | N/A |
The accompanying notes are an integral part of the Financial Statements.
79
Harbor Core Plus Fund | Harbor Disruptive Innovation Fund | Harbor Diversified International All Cap Fund | Harbor Global Leaders Fund | Harbor International Fund | |||||
November 1, 2022 through April 30, 2023 | November 1, 2021 through October 31, 2022 | November 1, 2022 through April 30, 2023 | November 1, 2021 through October 31, 2022 | November 1, 2022 through April 30, 2023 | November 1, 2021 through October 31, 2022 | November 1, 2022 through April 30, 2023 | November 1, 2021 through October 31, 2022 | November 1, 2022 through April 30, 2023 | November 1, 2021 through October 31, 2022 |
(Unaudited) | (Unaudited) | (Unaudited) | (Unaudited) | (Unaudited) | |||||
$3,088 | $24,136 | $2,696 | $9,859 | $68,436 | $118,341 | $386 | $1,792 | $78,568 | $98,153 |
283 | 4,079 | — | 23,286 | 9,017 | 58,029 | 1,201 | 2,059 | 16,714 | 18,178 |
(3,091) | (167,693) | (9,516) | (30,096) | (55,124) | (251,456) | (2,065) | (1,635) | (62,800) | (347,322) |
— | — | — | — | — | — | — | — | — | — |
$280 | $(139,478) | $(6,820) | $3,049 | $22,329 | $(75,086) | $(478) | $2,216 | $32,482 | $(230,991) |
$94,678 | $92,911 | $3,658 | $40,752 | $22,542 | $69,833 | $1,327 | $6,957 | $88,210 | $1,135,261 |
20,752 | 41,739 | — | 55,436 | 3,287 | 19,287 | 3,055 | 7,698 | 76,238 | 63,912 |
(90,461) | (351,268) | (28,783) | (86,214) | (20,845) | (66,997) | (6,505) | (29,397) | (285,970) | (1,368,732) |
— | — | — | — | — | — | — | — | — | — |
$24,969 | $(216,618) | $(25,125) | $9,974 | $4,984 | $22,123 | $(2,123) | $(14,742) | $(121,522) | $(169,559) |
$224 | $1,569 | $70 | $442 | $943 | $1,298 | $11 | $148 | $342 | $1,230 |
230 | 538 | — | 2,269 | 102 | 638 | 75 | 154 | 326 | 265 |
(1,671) | (4,956) | (631) | (1,000) | (793) | (730) | (15) | (391) | (1,638) | (2,727) |
$(1,217) | $(2,849) | $(561) | $1,711 | $252 | $1,206 | $71 | $(89) | $(970) | $(1,232) |
N/A | N/A | $754 | $10,514 | $717 | $1,955 | $188 | $606 | $7,158 | $15,131 |
N/A | N/A | — | 23,829 | 93 | 661 | 857 | 2,383 | 7,669 | 6,246 |
N/A | N/A | (2,206) | (27,106) | (905) | (1,140) | (1,323) | (8,407) | (33,706) | (58,086) |
N/A | N/A | $(1,452) | $7,237 | $(95) | $1,476 | $(278) | $(5,418) | $(18,879) | $(36,709) |
80
Harbor Funds
Statements of Changes in Net Assets—Capital Stock Activity—Continued
(All amounts in thousands)
Harbor International Core Fund | Harbor International Growth Fund | Harbor International Small Cap Fund | ||||
November 1, 2022 through April 30, 2023 | November 1, 2021 through October 31, 2022 | November 1, 2022 through April 30, 2023 | November 1, 2021 through October 31, 2022 | November 1, 2022 through April 30, 2023 | November 1, 2021 through October 31, 2022 | |
(Unaudited) | (Unaudited) | (Unaudited) | ||||
AMOUNT ($) | ||||||
Retirement Class | ||||||
Net proceeds from sale of shares | $905 | $10,846 | $1,264 | $7,637 | $40,739 | $26,387 |
Reinvested distributions | 556 | 1,921 | — | 9,892 | 1,029 | 731 |
Cost of shares reacquired | (1,430) | (4,158) | (11,186) | (27,149) | (7,010) | (3,508) |
Cost of shares reacquired through in-kind redemptions | — | — | — | — | — | — |
Net increase/(decrease) in net assets | $31 | $8,609 | $(9,922) | $(9,620) | $34,758 | $23,610 |
Institutional Class | ||||||
Net proceeds from sale of shares | $47,399 | $54,089 | $14,293 | $63,120 | $77,365 | $64,841 |
Reinvested distributions | 1,714 | 3,014 | — | 39,092 | 2,447 | 3,197 |
Cost of shares reacquired | (5,265) | (10,449) | (50,818) | (237,968) | (17,332) | (10,241) |
Cost of shares reacquired through in-kind redemptions | — | — | — | — | — | — |
Net increase/(decrease) in net assets | $43,848 | $46,654 | $(36,525) | $(135,756) | $62,480 | $57,797 |
Administrative Class | ||||||
Net proceeds from sale of shares | N/A | N/A | $11 | $24 | $— | $36 |
Reinvested distributions | N/A | N/A | — | 36 | 11 | 31 |
Cost of shares reacquired | N/A | N/A | (36) | (347) | — | — |
Net increase/(decrease) in net assets | N/A | N/A | $(25) | $(287) | $11 | $67 |
Investor Class | ||||||
Net proceeds from sale of shares | $9,599 | $2,615 | $396 | $582 | $3,822 | $570 |
Reinvested distributions | 62 | 12 | — | 983 | 29 | 121 |
Cost of shares reacquired | (1,024) | (236) | (655) | (2,019) | (337) | (1,166) |
Net increase/(decrease) in net assets | $8,637 | $2,391 | $(259) | $(454) | $3,514 | $(475) |
The accompanying notes are an integral part of the Financial Statements.
81
Harbor Large Cap Value Fund | Harbor Mid Cap Fund | Harbor Mid Cap Value Fund | Harbor Small Cap Growth Fund | Harbor Small Cap Value Fund | |||||
November 1, 2022 through April 30, 2023 | November 1, 2021 through October 31, 2022 | November 1, 2022 through April 30, 2023 | November 1, 2021 through October 31, 2022 | November 1, 2022 through April 30, 2023 | November 1, 2021 through October 31, 2022 | November 1, 2022 through April 30, 2023 | November 1, 2021 through October 31, 2022 | November 1, 2022 through April 30, 2023 | November 1, 2021 through October 31, 2022 |
(Unaudited) | (Unaudited) | (Unaudited) | (Unaudited) | (Unaudited) | |||||
$75,671 | $348,261 | $2,439 | $45,026 | $1,776 | $6,964 | $48,560 | $60,506 | $94,384 | $175,100 |
44,632 | 35,373 | 2,210 | 798 | 2,844 | 756 | 13,969 | 81,741 | 25,422 | 21,850 |
(269,378) | (291,879) | (5,658) | (12,252) | (29,685) | (18,313) | (20,584) | (51,731) | (71,287) | (123,005) |
— | — | — | — | — | — | — | — | — | — |
$(149,075) | $91,755 | $(1,009) | $33,572 | $(25,065) | $(10,593) | $41,945 | $90,516 | $48,519 | $73,945 |
$44,091 | $178,362 | $2,354 | $9,725 | $22,783 | $57,830 | $97,694 | $221,233 | $166,895 | $288,779 |
29,109 | 31,988 | 657 | 507 | 17,471 | 4,303 | 24,279 | 140,465 | 88,682 | 99,186 |
(143,462) | (342,873) | (1,010) | (8,807) | (40,591) | (160,855) | (67,193) | (173,419) | (196,540) | (671,440) |
— | — | — | — | — | — | — | — | — | — |
$(70,262) | $(132,523) | $2,001 | $1,425 | $(337) | $(98,722) | $54,780 | $188,279 | $59,037 | $(283,475) |
$37 | $95 | N/A | N/A | $438 | $652 | $12 | $91 | $420 | $1,029 |
144 | 125 | N/A | N/A | 142 | 23 | 33 | 230 | 511 | 557 |
(391) | (315) | N/A | N/A | (467) | (1,080) | (75) | (189) | (1,338) | (2,834) |
$(210) | $(95) | N/A | N/A | $113 | $(405) | $(30) | $132 | $(407) | $(1,248) |
$1,386 | $7,760 | $54 | $242 | $1,934 | $5,569 | $1,200 | $2,086 | $1,428 | $4,759 |
1,083 | 931 | 25 | 17 | 1,961 | 293 | 395 | 2,183 | 2,316 | 3,282 |
(3,049) | (7,948) | (71) | (231) | (3,564) | (8,121) | (634) | (1,587) | (5,088) | (26,526) |
$(580) | $743 | $8 | $28 | $331 | $(2,259) | $961 | $2,682 | $(1,344) | $(18,485) |
82
Harbor Funds
Statements of Changes in Net Assets—Capital Stock Activity—Continued
(All amounts in thousands)
Harbor Capital Appreciation Fund | Harbor Convertible Securities Fund | Harbor Core Bond Fund | ||||
November 1, 2022 through April 30, 2023 | November 1, 2021 through October 31, 2022 | November 1, 2022 through April 30, 2023 | November 1, 2021 through October 31, 2022 | November 1, 2022 through April 30, 2023 | November 1, 2021 through October 31, 2022 | |
(Unaudited) | (Unaudited) | (Unaudited) | ||||
SHARES | ||||||
Retirement Class | ||||||
Shares sold | 9,798 | 24,726 | 982 | 30 | 3,591 | 2,385 |
Shares issued due to reinvestment of distributions | — | 16,588 | 29 | 445 | 129 | 84 |
Shares reacquired | (17,391) | (24,703) | (3,415) | (56) | (483) | (1,132) |
Shares reacquired through in-kind redemptions | — | (1,382) | — | — | — | — |
Net increase/(decrease) in shares outstanding | (7,593) | 15,229 | (2,404) | 419 | 3,237 | 1,337 |
Institutional Class | ||||||
Shares sold | 13,293 | 33,349 | 422 | 3,995 | 493 | 501 |
Shares issued due to reinvestment of distributions | — | 42,475 | 57 | 1,729 | 74 | 171 |
Shares reacquired | (27,972) | (73,341) | (10,617) | (4,626) | (219) | (7,405) |
Shares reacquired through in-kind redemptions | (2,168) | (30,336) | — | — | — | — |
Net increase/(decrease) in shares outstanding | (16,847) | (27,853) | (10,138) | 1,098 | 348 | (6,733) |
Administrative Class | ||||||
Shares sold | 223 | 633 | 737 | — | N/A | N/A |
Shares issued due to reinvestment of distributions | — | 643 | — | 1 | N/A | N/A |
Shares reacquired | (348) | (1,779) | (737) | — | N/A | N/A |
Net increase/(decrease) in shares outstanding | (125) | (503) | — | 1 | N/A | N/A |
Investor Class | ||||||
Shares sold | 665 | 1,763 | 132 | 34 | N/A | N/A |
Shares issued due to reinvestment of distributions | — | 2,705 | 1 | 31 | N/A | N/A |
Shares reacquired | (2,029) | (4,883) | (174) | (61) | N/A | N/A |
Net increase/(decrease) in shares outstanding | (1,364) | (415) | (41) | 4 | N/A | N/A |
The accompanying notes are an integral part of the Financial Statements.
83
Harbor Core Plus Fund | Harbor Disruptive Innovation Fund | Harbor Diversified International All Cap Fund | Harbor Global Leaders Fund | Harbor International Fund | |||||
November 1, 2022 through April 30, 2023 | November 1, 2021 through October 31, 2022 | November 1, 2022 through April 30, 2023 | November 1, 2021 through October 31, 2022 | November 1, 2022 through April 30, 2023 | November 1, 2021 through October 31, 2022 | November 1, 2022 through April 30, 2023 | November 1, 2021 through October 31, 2022 | November 1, 2022 through April 30, 2023 | November 1, 2021 through October 31, 2022 |
(Unaudited) | (Unaudited) | (Unaudited) | (Unaudited) | (Unaudited) | |||||
305 | 2,119 | 582 | 1,653 | 5,979 | 10,154 | 15 | 59 | 1,922 | 2,586 |
28 | 350 | — | 3,230 | 849 | 4,733 | 53 | 60 | 434 | 402 |
(310) | (15,525) | (2,055) | (5,607) | (4,933) | (20,840) | (83) | (58) | (1,529) | (8,148) |
— | — | — | — | — | — | — | — | — | — |
23 | (13,056) | (1,473) | (724) | 1,895 | (5,953) | (15) | 61 | 827 | (5,160) |
9,297 | 8,400 | 811 | 6,128 | 2,039 | 5,624 | 53 | 222 | 2,158 | 28,770 |
2,042 | 3,725 | — | 7,775 | 309 | 1,573 | 135 | 227 | 1,971 | 1,406 |
(8,927) | (31,555) | (6,599) | (12,431) | (1,838) | (5,799) | (266) | (963) | (7,064) | (34,392) |
— | — | — | — | — | — | — | — | — | — |
2,412 | (19,430) | (5,788) | 1,472 | 510 | 1,398 | (78) | (514) | (2,935) | (4,216) |
22 | 140 | 18 | 98 | 87 | 108 | 1 | 5 | 8 | 30 |
23 | 48 | — | 375 | 9 | 52 | 3 | 5 | 8 | 6 |
(165) | (471) | (172) | (213) | (71) | (65) | (1) | (14) | (39) | (66) |
(120) | (283) | (154) | 260 | 25 | 95 | 3 | (4) | (23) | (30) |
N/A | N/A | 224 | 1,688 | 64 | 172 | 8 | 20 | 174 | 370 |
N/A | N/A | — | 4,405 | 9 | 54 | 40 | 74 | 200 | 139 |
N/A | N/A | (654) | (5,652) | (84) | (99) | (56) | (285) | (828) | (1,378) |
N/A | N/A | (430) | 441 | (11) | 127 | (8) | (191) | (454) | (869) |
84
Harbor Funds
Statements of Changes in Net Assets—Capital Stock Activity—Continued
(All amounts in thousands)
Harbor International Core Fund | Harbor International Growth Fund | Harbor International Small Cap Fund | ||||
November 1, 2022 through April 30, 2023 | November 1, 2021 through October 31, 2022 | November 1, 2022 through April 30, 2023 | November 1, 2021 through October 31, 2022 | November 1, 2022 through April 30, 2023 | November 1, 2021 through October 31, 2022 | |
(Unaudited) | (Unaudited) | (Unaudited) | ||||
SHARES | ||||||
Retirement Class | ||||||
Shares sold | 84 | 919 | 84 | 474 | 2,895 | 2,025 |
Shares issued due to reinvestment of distributions | 53 | 157 | — | 488 | 77 | 50 |
Shares reacquired | (132) | (358) | (748) | (1,584) | (504) | (256) |
Shares reacquired through in-kind redemptions | — | — | — | — | — | — |
Net increase/(decrease) in shares outstanding | 5 | 718 | (664) | (622) | 2,468 | 1,819 |
Institutional Class | ||||||
Shares sold | 4,369 | 5,060 | 948 | 3,777 | 5,531 | 4,917 |
Shares issued due to reinvestment of distributions | 164 | 246 | — | 1,931 | 182 | 220 |
Shares reacquired | (487) | (968) | (3,467) | (14,928) | (1,227) | (747) |
Shares reacquired through in-kind redemptions | — | — | — | — | — | — |
Net increase/(decrease) in shares outstanding | 4,046 | 4,338 | (2,519) | (9,220) | 4,486 | 4,390 |
Administrative Class | ||||||
Shares sold | N/A | N/A | 1 | 2 | — | 3 |
Shares issued due to reinvestment of distributions | N/A | N/A | — | 2 | 1 | 2 |
Shares reacquired | N/A | N/A | (3) | (20) | — | — |
Net increase/(decrease) in shares outstanding | N/A | N/A | (2) | (16) | 1 | 5 |
Investor Class | ||||||
Shares sold | 874 | 249 | 26 | 35 | 269 | 42 |
Shares issued due to reinvestment of distributions | 6 | 1 | — | 48 | 2 | 8 |
Shares reacquired | (95) | (22) | (44) | (128) | (23) | (80) |
Net increase/(decrease) in shares outstanding | 785 | 228 | (18) | (45) | 248 | (30) |
The accompanying notes are an integral part of the Financial Statements.
85
Harbor Large Cap Value Fund | Harbor Mid Cap Fund | Harbor Mid Cap Value Fund | Harbor Small Cap Growth Fund | Harbor Small Cap Value Fund | |||||
November 1, 2022 through April 30, 2023 | November 1, 2021 through October 31, 2022 | November 1, 2022 through April 30, 2023 | November 1, 2021 through October 31, 2022 | November 1, 2022 through April 30, 2023 | November 1, 2021 through October 31, 2022 | November 1, 2022 through April 30, 2023 | November 1, 2021 through October 31, 2022 | November 1, 2022 through April 30, 2023 | November 1, 2021 through October 31, 2022 |
(Unaudited) | (Unaudited) | (Unaudited) | (Unaudited) | (Unaudited) | |||||
3,906 | 16,962 | 191 | 3,697 | 74 | 282 | 4,097 | 4,693 | 2,491 | 4,452 |
2,408 | 1,628 | 187 | 56 | 129 | 31 | 1,297 | 5,657 | 724 | 548 |
(13,819) | (13,983) | (448) | (921) | (1,251) | (740) | (1,770) | (3,906) | (1,864) | (3,074) |
— | — | — | — | — | — | — | — | N/A | N/A |
(7,505) | 4,607 | (70) | 2,832 | (1,048) | (427) | 3,624 | 6,444 | 1,351 | 1,926 |
2,280 | 8,415 | 191 | 705 | 967 | 2,335 | 8,584 | 17,184 | 4,369 | 7,235 |
1,569 | 1,474 | 55 | 36 | 792 | 178 | 2,273 | 9,796 | 2,524 | 2,486 |
(7,302) | (16,559) | (79) | (678) | (1,760) | (6,634) | (5,840) | (12,362) | (5,173) | (16,748) |
— | — | — | — | — | — | — | — | — | — |
(3,453) | (6,670) | 167 | 63 | (1) | (4,121) | 5,017 | 14,618 | 1,720 | (7,027) |
2 | 4 | N/A | N/A | 19 | 26 | 1 | 8 | 11 | 26 |
7 | 6 | N/A | N/A | 7 | 1 | 4 | 19 | 15 | 14 |
(20) | (14) | N/A | N/A | (20) | (43) | (8) | (17) | (35) | (73) |
(11) | (4) | N/A | N/A | 6 | (16) | (3) | 10 | (9) | (33) |
71 | 368 | 5 | 17 | 83 | 228 | 138 | 201 | 38 | 122 |
58 | 42 | 2 | 1 | 89 | 12 | 48 | 193 | 68 | 85 |
(154) | (376) | (6) | (17) | (153) | (341) | (72) | (149) | (137) | (666) |
(25) | 34 | 1 | 1 | 19 | (101) | 114 | 245 | (31) | (459) |
86
Harbor Funds Financial Highlights
Selected Data for a Share Outstanding for the Periods Presented
HARBOR CAPITAL APPRECIATION FUND | ||||||
Retirement Class | ||||||
6-Month Period Ended April 30, 2023 | Year Ended October 31, | |||||
2022 | 2021 | 2020 | 2019 | 2018 | ||
(Unaudited) | ||||||
Net asset value beginning of period | $66.82 | $124.89 | $99.19 | $75.79 | $73.98 | $75.34 |
Income from Investment Operations | ||||||
Net investment income/(loss)a,e | 0.07 | (0.06) | (0.27) | (0.08) | 0.13 | 0.23 |
Net realized and unrealized gain/(loss) on investments | 8.43 | (39.22) | 38.73 | 30.27 | 8.54 | 6.50 |
Total from investment operations | 8.50 | (39.28) | 38.46 | 30.19 | 8.67 | 6.73 |
Less Distributions | ||||||
Dividends from net investment income | — | — | — | (0.12) | (0.21) | (0.17) |
Distributions from net realized capital gains | — | (18.79) | (12.76) | (6.67) | (6.65) | (7.92) |
Total distributions | — | (18.79) | (12.76) | (6.79) | (6.86) | (8.09) |
Net asset value end of period | 75.32 | 66.82 | 124.89 | 99.19 | 75.79 | 73.98 |
Net assets end of period (000s) | $7,441,421 | $7,108,919 | $11,385,191 | $9,549,061 | $6,970,617 | $5,393,675 |
Ratios and Supplemental Data (%) | ||||||
Total returnb | 12.72 %c | (36.03)% | 41.33% | 42.79% | 13.73% | 9.50% |
Ratio of total expenses to average net assets^ | 0.64 d | 0.64 | 0.63 | 0.64 | 0.63 | 0.62 |
Ratio of net expenses to average net assetsa | 0.60 d | 0.58 | 0.57 | 0.58 | 0.58 | 0.57 |
Ratio of net investment income/(loss) to average net assetsa | 0.19 d | (0.07) | (0.25) | (0.09) | 0.18 | 0.30 |
Portfolio turnover | 15 c | 34 | 48 | 51 | 40 | 40 |
Administrative Class | ||||||
6-Month Period Ended April 30, 2023 | Year Ended October 31, | |||||
2022 | 2021 | 2020 | 2019 | 2018 | ||
(Unaudited) | ||||||
Net asset value beginning of period | $64.08 | $120.94 | $96.68 | $74.15 | $72.54 | $74.08 |
Income from Investment Operations | ||||||
Net investment income/(loss)a,e | (0.04 ) | (0.33) | (0.61) | (0.34) | (0.09) | (0.01) |
Net realized and unrealized gain/(loss) on investments | 8.07 | (37.74) | 37.63 | 29.54 | 8.35 | 6.39 |
Total from investment operations | 8.03 | (38.07) | 37.02 | 29.20 | 8.26 | 6.38 |
Less Distributions | ||||||
Dividends from net investment income | — | — | — | — | — | — |
Distributions from net realized capital gains | — | (18.79) | (12.76) | (6.67) | (6.65) | (7.92) |
Total distributions | — | (18.79) | (12.76) | (6.67) | (6.65) | (7.92) |
Net asset value end of period | 72.11 | 64.08 | 120.94 | 96.68 | 74.15 | 72.54 |
Net assets end of period (000s) | $201,939 | $187,390 | $414,600 | $420,324 | $345,550 | $448,241 |
Ratios and Supplemental Data (%) | ||||||
Total returnb | 12.53 %c | (36.23)% | 40.86% | 42.32% | 13.35% | 9.16% |
Ratio of total expenses to average net assets^ | 0.97 d | 0.97 | 0.96 | 0.97 | 0.96 | 0.95 |
Ratio of net expenses to average net assetsa | 0.93 d | 0.91 | 0.90 | 0.91 | 0.91 | 0.90 |
Ratio of net investment income/(loss) to average net assetsa | (0.14 )d | (0.41) | (0.57) | (0.41) | (0.13) | (0.01) |
Portfolio turnover | 15 c | 34 | 48 | 51 | 40 | 40 |
See page 119 for notes to the Financial Highlights.
The accompanying notes are an integral part of the Financial Statements.
87
Institutional Class | |||||
6-Month Period Ended April 30, 2023 | Year Ended October 31, | ||||
2022 | 2021 | 2020 | 2019 | 2018 | |
(Unaudited) | |||||
$66.69 | $124.78 | $99.18 | $75.78 | $73.97 | $75.32 |
0.04 | (0.13) | (0.36) | (0.14) | 0.08 | 0.18 |
8.42 | (39.17) | 38.72 | 30.26 | 8.53 | 6.50 |
8.46 | (39.30) | 38.36 | 30.12 | 8.61 | 6.68 |
— | — | — | (0.05) | (0.15) | (0.11) |
— | (18.79) | (12.76) | (6.67) | (6.65) | (7.92) |
— | (18.79) | (12.76) | (6.72) | (6.80) | (8.03) |
75.15 | 66.69 | 124.78 | 99.18 | 75.78 | 73.97 |
$14,047,453 | $13,590,549 | $28,902,862 | $25,579,181 | $21,311,587 | $22,366,214 |
12.69 %c | (36.08)% | 41.22% | 42.68% | 13.63% | 9.44% |
0.72 d | 0.72 | 0.71 | 0.72 | 0.71 | 0.70 |
0.68 d | 0.66 | 0.65 | 0.66 | 0.66 | 0.65 |
0.11 d | (0.16) | (0.33) | (0.16) | 0.11 | 0.23 |
15 c | 34 | 48 | 51 | 40 | 40 |
Investor Class | |||||
6-Month Period Ended April 30, 2023 | Year Ended October 31, | ||||
2022 | 2021 | 2020 | 2019 | 2018 | |
(Unaudited) | |||||
$61.68 | $117.30 | $94.19 | $72.48 | $71.15 | $72.88 |
(0.08 ) | (0.40) | (0.72) | (0.43) | (0.17) | (0.10) |
7.78 | (36.43) | 36.59 | 28.81 | 8.15 | 6.29 |
7.70 | (36.83) | 35.87 | 28.38 | 7.98 | 6.19 |
— | — | — | — | — | — |
— | (18.79) | (12.76) | (6.67) | (6.65) | (7.92) |
— | (18.79) | (12.76) | (6.67) | (6.65) | (7.92) |
69.38 | 61.68 | 117.30 | 94.19 | 72.48 | 71.15 |
$802,052 | $797,250 | $1,564,732 | $1,282,355 | $1,083,896 | $1,327,790 |
12.48 %c | (36.31)% | 40.71% | 42.15% | 13.21% | 9.03% |
1.08 d | 1.08 | 1.08 | 1.09 | 1.08 | 1.07 |
1.04 d | 1.02 | 1.01 | 1.03 | 1.03 | 1.02 |
(0.24 )d | (0.52) | (0.69) | (0.53) | (0.25) | (0.13) |
15 c | 34 | 48 | 51 | 40 | 40 |
88
Harbor Funds Financial Highlights—Continued
Selected Data for a Share Outstanding for the Periods Presented
HARBOR CONVERTIBLE SECURITIES FUND | ||||||
Retirement Class | ||||||
6-Month Period Ended April 30, 2023m | Year Ended October 31, | |||||
2022 | 2021 | 2020 | 2019 | 2018 | ||
(Unaudited) | ||||||
Net asset value beginning of period | $9.82 | $13.69 | $12.49 | $10.82 | $10.47 | $11.27 |
Income from Investment Operations | ||||||
Net investment income/(loss)a,e | 0.08 | 0.04 | 0.02 | 0.07 | 0.10 | 0.10 |
Net realized and unrealized gain/(loss) on investments | (0.02 ) | (2.22) | 2.43 | 2.02 | 0.92 | 0.19 |
Total from investment operations | 0.06 | (2.18) | 2.45 | 2.09 | 1.02 | 0.29 |
Less Distributions | ||||||
Dividends from net investment income | (0.13 ) | (0.08) | (0.09) | (0.09) | (0.18) | (0.09) |
Distributions from net realized capital gains | — | (1.61) | (1.16) | (0.33) | (0.49) | (1.00) |
Total distributions | (0.13 ) | (1.69) | (1.25) | (0.42) | (0.67) | (1.09) |
Proceeds from redemption fees | N/A | N/A | —* | —* | —* | —* |
Net asset value end of period | 9.75 | 9.82 | 13.69 | 12.49 | 10.82 | 10.47 |
Net assets end of period (000s) | $10,029 | $33,711 | $41,250 | $34,307 | $24,697 | $25,412 |
Ratios and Supplemental Data (%) | ||||||
Total returnb | 0.63 %c | (17.59)% | 20.23% | 19.93% | 10.48% | 2.80% |
Ratio of total expenses to average net assets^ | 0.85 d | 0.74 | 0.73 | 0.74 | 0.74 | 0.74 |
Ratio of net expenses to average net assetsa | 0.72 d | 0.68 | 0.67 | 0.69 | 0.69 | 0.69 |
Ratio of net investment income/(loss) to average net assetsa | 1.69 d | 0.35 | 0.15 | 0.60 | 0.98 | 0.95 |
Portfolio turnover | 80 c | 66 | 50 | 101 | 74 | 94 |
Administrative Class | ||||||
6-Month Period Ended April 30, 2023m | Year Ended October 31, | |||||
2022 | 2021 | 2020 | 2019 | 2018 | ||
(Unaudited) | ||||||
Net asset value beginning of period | $9.78 | $13.63 | $12.46 | $10.80 | $10.44 | $11.26 |
Income from Investment Operations | ||||||
Net investment income/(loss)a,e | 0.12 | —* | (0.02) | 0.03 | 0.07 | 0.07 |
Net realized and unrealized gain/(loss) on investments | (0.27 ) | (2.20) | 2.42 | 2.01 | 0.91 | 0.17 |
Total from investment operations | (0.15 ) | (2.20) | 2.40 | 2.04 | 0.98 | 0.24 |
Less Distributions | ||||||
Dividends from net investment income | (0.05 ) | (0.04) | (0.07) | (0.05) | (0.13) | (0.06) |
Distributions from net realized capital gains | — | (1.61) | (1.16) | (0.33) | (0.49) | (1.00) |
Total distributions | (0.05 ) | (1.65) | (1.23) | (0.38) | (0.62) | (1.06) |
Proceeds from redemption fees | N/A | N/A | —* | —* | —* | —* |
Net asset value end of period | 9.58 | 9.78 | 13.63 | 12.46 | 10.80 | 10.44 |
Net assets end of period (000s) | $68 | $70 | $85 | $70 | $59 | $53 |
Ratios and Supplemental Data (%) | ||||||
Total returnb | (1.50 )%c | (17.84)% | 19.87% | 19.48% | 10.11% | 2.27% |
Ratio of total expenses to average net assets^ | 1.08 d | 1.07 | 1.06 | 1.07 | 1.07 | 1.07 |
Ratio of net expenses to average net assetsa | 0.97 d | 1.01 | 1.00 | 1.02 | 1.02 | 1.01 |
Ratio of net investment income/(loss) to average net assetsa | 2.49 d | 0.02 | (0.18) | 0.29 | 0.64 | 0.63 |
Portfolio turnover | 80 c | 66 | 50 | 101 | 74 | 94 |
See page 119 for notes to the Financial Highlights.
The accompanying notes are an integral part of the Financial Statements.
89
Institutional Class | |||||
6-Month Period Ended April 30, 2023m | Year Ended October 31, | ||||
2022 | 2021 | 2020 | 2019 | 2018 | |
(Unaudited) | |||||
$9.82 | $13.68 | $12.48 | $10.83 | $10.48 | $11.27 |
0.08 | 0.03 | 0.01 | 0.06 | 0.09 | 0.09 |
(0.02 ) | (2.21) | 2.43 | 2.00 | 0.92 | 0.20 |
0.06 | (2.18) | 2.44 | 2.06 | 1.01 | 0.29 |
(0.13 ) | (0.07) | (0.08) | (0.08) | (0.17) | (0.08) |
— | (1.61) | (1.16) | (0.33) | (0.49) | (1.00) |
(0.13 ) | (1.68) | (1.24) | (0.41) | (0.66) | (1.08) |
N/A | N/A | —* | —* | —* | —* |
9.75 | 9.82 | 13.68 | 12.48 | 10.83 | 10.48 |
$27,126 | $126,865 | $161,772 | $117,269 | $114,130 | $93,424 |
0.57 %c | (17.62)% | 20.18% | 19.63% | 10.39% | 2.82% |
0.93 d | 0.82 | 0.81 | 0.82 | 0.82 | 0.82 |
0.80 d | 0.76 | 0.75 | 0.77 | 0.77 | 0.76 |
1.66 d | 0.27 | 0.06 | 0.55 | 0.89 | 0.88 |
80 c | 66 | 50 | 101 | 74 | 94 |
Investor Class | |||||
6-Month Period Ended April 30, 2023m | Year Ended October 31, | ||||
2022 | 2021 | 2020 | 2019 | 2018 | |
(Unaudited) | |||||
$9.77 | $13.62 | $12.46 | $10.80 | $10.45 | $11.25 |
0.09 | (0.01) | (0.04) | 0.02 | 0.05 | 0.05 |
(0.06 ) | (2.20) | 2.43 | 2.00 | 0.92 | 0.19 |
0.03 | (2.21) | 2.39 | 2.02 | 0.97 | 0.24 |
(0.10 ) | (0.03) | (0.07) | (0.03) | (0.13) | (0.04) |
— | (1.61) | (1.16) | (0.33) | (0.49) | (1.00) |
(0.10 ) | (1.64) | (1.23) | (0.36) | (0.62) | (1.04) |
N/A | N/A | —* | —* | —* | —* |
9.70 | 9.77 | 13.62 | 12.46 | 10.80 | 10.45 |
$1,667 | $2,076 | $2,853 | $2,420 | $2,066 | $1,861 |
0.32 %c | (17.92)% | 19.76% | 19.33% | 9.99% | 2.35% |
1.26 d | 1.18 | 1.17 | 1.19 | 1.19 | 1.19 |
1.14 d | 1.12 | 1.11 | 1.14 | 1.14 | 1.13 |
1.92 d | (0.10) | (0.29) | 0.17 | 0.52 | 0.51 |
80 c | 66 | 50 | 101 | 74 | 94 |
90
Harbor Funds Financial Highlights—Continued
Selected Data for a Share Outstanding for the Periods Presented
HARBOR CORE BOND FUND | ||||||
Retirement Class | ||||||
6-Month Period Ended April 30, 2023 | Year Ended October 31, | |||||
2022 | 2021 | 2020 | 2019 | 2018h | ||
(Unaudited) | ||||||
Net asset value beginning of period | $8.64 | $10.61 | $11.06 | $10.64 | $9.84 | $10.00 |
Income from Investment Operations | ||||||
Net investment income/(loss)a,e | 0.17 | 0.22 | 0.19 | 0.26 | 0.31 | 0.12 |
Net realized and unrealized gain/(loss) on investments | 0.45 | (1.90) | (0.19) | 0.50 | 0.79 | (0.19) |
Total from investment operations | 0.62 | (1.68) | — | 0.76 | 1.10 | (0.07) |
Less Distributions | ||||||
Dividends from net investment income | (0.20 ) | (0.29) | (0.23) | (0.27) | (0.30) | (0.09) |
Distributions from net realized capital gains | — | — | (0.22) | (0.07) | — | — |
Total distributions | (0.20 ) | (0.29) | (0.45) | (0.34) | (0.30) | (0.09) |
Net asset value end of period | 9.06 | 8.64 | 10.61 | 11.06 | 10.64 | 9.84 |
Net assets end of period (000s) | $72,695 | $41,312 | $36,557 | $29,428 | $5,298 | $3,061 |
Ratios and Supplemental Data (%) | ||||||
Total returnb | 7.16 %c | (16.14)% | (0.01)% | 7.36% | 11.34% | (0.73)%c |
Ratio of total expenses to average net assets^ | 0.34 d | 0.37 | 0.43 | 0.43 | 0.45 | 0.77d |
Ratio of net expenses to average net assetsa | 0.26 d | 0.27 | 0.37 | 0.37 | 0.37 | 0.37d |
Ratio of net investment income/(loss) to average net assetsa | 3.73 d | 2.28 | 1.77 | 2.35 | 2.98 | 2.98d |
Portfolio turnover | 52 c | 60 | 47 | 70 | 61 | 97c |
See page 119 for notes to the Financial Highlights.
The accompanying notes are an integral part of the Financial Statements.
91
Institutional Class | |||||
6-Month Period Ended April 30, 2023 | Year Ended October 31, | ||||
2022 | 2021 | 2020 | 2019 | 2018 | |
(Unaudited) | |||||
$8.64 | $10.61 | $11.06 | $10.64 | $9.84 | $10.00 |
0.16 | 0.20 | 0.18 | 0.26 | 0.30 | 0.12 |
0.45 | (1.89) | (0.19) | 0.50 | 0.79 | (0.19) |
0.61 | (1.69) | (0.01) | 0.76 | 1.09 | (0.07) |
(0.19 ) | (0.28) | (0.22) | (0.27) | (0.29) | (0.09) |
— | — | (0.22) | (0.07) | — | — |
(0.19 ) | (0.28) | (0.44) | (0.34) | (0.29) | (0.09) |
9.06 | 8.64 | 10.61 | 11.06 | 10.64 | 9.84 |
$32,586 | $28,065 | $105,931 | $86,173 | $79,458 | $52,249 |
7.12 %c | (16.21)% | (0.09)% | 7.28% | 11.26% | (0.75)% |
0.42 d | 0.45 | 0.51 | 0.51 | 0.53 | 0.85 |
0.34 d | 0.36 | 0.45 | 0.45 | 0.45 | 0.45 |
3.62 d | 2.03 | 1.70 | 2.35 | 2.89 | 2.86 |
52 c | 60 | 47 | 70 | 61 | 97 |
92
Harbor Funds Financial Highlights—Continued
Selected Data for a Share Outstanding for the Periods Presented
HARBOR CORE PLUS FUND | ||||||
Retirement Class | ||||||
6-Month Period Ended April 30, 2023 | Year Ended October 31, | |||||
2022l | 2021 | 2020 | 2019 | 2018h | ||
(Unaudited) | ||||||
Net asset value beginning of period | $9.78 | $12.06 | $12.35 | $11.90 | $11.09 | $11.28 |
Income from Investment Operations | ||||||
Net investment income/(loss)a,e | 0.19 | 0.32 | 0.32 | 0.31 | 0.38 | 0.16 |
Net realized and unrealized gain/(loss) on investments | 0.55 | (2.18) | (0.21) | 0.49 | 0.80 | (0.16) |
Total from investment operations | 0.74 | (1.86) | 0.11 | 0.80 | 1.18 | —* |
Less Distributions | ||||||
Dividends from net investment income | (0.23 ) | (0.40) | (0.27) | (0.35) | (0.37) | (0.19) |
Distributions from net realized capital gains | — | (0.02) | (0.13) | — | — | — |
Total distributions | (0.23 ) | (0.42) | (0.40) | (0.35) | (0.37) | (0.19) |
Net asset value end of period | 10.29 | 9.78 | 12.06 | 12.35 | 11.90 | 11.09 |
Net assets end of period (000s) | $13,270 | $12,389 | $172,699 | $166,740 | $12,802 | $6,921 |
Ratios and Supplemental Data (%) | ||||||
Total returnb | 7.64 %c | (15.78)% | 0.88% | 6.82% | 10.84% | 0.01%c |
Ratio of total expenses to average net assets^ | 0.31 d | 0.42 | 0.53 | 0.58 | 1.06 | 1.16d |
Ratio of net expenses to average net assetsa | 0.30 d | 0.36 | 0.43 | 0.48 | 0.96 | 1.06d |
Ratio of net expenses excluding interest expense to average net assetsa | 0.30 d | 0.36 | 0.43 | 0.43 | 0.43 | 0.43d |
Ratio of net investment income/(loss) to average net assetsa | 3.78 d | 2.83 | 2.63 | 2.56 | 3.30 | 3.44d |
Portfolio turnover | 19 c | 219 | 370 | 558 | 644 | 674c |
Administrative Class | ||||||
6-Month Period Ended April 30, 2023 | Year Ended October 31, | |||||
2022l | 2021 | 2020 | 2019 | 2018 | ||
(Unaudited) | ||||||
Net asset value beginning of period | $9.78 | $12.08 | $12.37 | $11.92 | $11.11 | $11.69 |
Income from Investment Operations | ||||||
Net investment income/(loss)a,e | 0.17 | 0.29 | 0.28 | 0.28 | 0.35 | 0.31 |
Net realized and unrealized gain/(loss) on investments | 0.56 | (2.21) | (0.21) | 0.48 | 0.79 | (0.53) |
Total from investment operations | 0.73 | (1.92) | 0.07 | 0.76 | 1.14 | (0.22) |
Less Distributions | ||||||
Dividends from net investment income | (0.22 ) | (0.36) | (0.23) | (0.31) | (0.33) | (0.36) |
Distributions from net realized capital gains | — | (0.02) | (0.13) | — | — | — |
Total distributions | (0.22 ) | (0.38) | (0.36) | (0.31) | (0.33) | (0.36) |
Net asset value end of period | 10.29 | 9.78 | 12.08 | 12.37 | 11.92 | 11.11 |
Net assets end of period (000s) | $10,567 | $11,223 | $17,270 | $18,302 | $19,498 | $31,111 |
Ratios and Supplemental Data (%) | ||||||
Total returnb | 7.46 %c | (16.20)% | 0.54% | 6.44% | 10.44% | (1.88)% |
Ratio of total expenses to average net assets^ | 0.64 d | 0.71 | 0.86 | 0.97 | 1.39 | 1.16 |
Ratio of net expenses to average net assetsa | 0.63 d | 0.67 | 0.76 | 0.87 | 1.29 | 1.06 |
Ratio of net expenses excluding interest expense to average net assetsa | 0.63 d | 0.67 | 0.76 | 0.76 | 0.76 | 0.76 |
Ratio of net investment income/(loss) to average net assetsa | 3.45 d | 2.64 | 2.29 | 2.32 | 3.01 | 2.69 |
Portfolio turnover | 19 c | 219 | 370 | 558 | 644 | 674 |
See page 119 for notes to the Financial Highlights.
The accompanying notes are an integral part of the Financial Statements.
93
Institutional Class | |||||
6-Month Period Ended April 30, 2023 | Year Ended October 31, | ||||
2022l | 2021 | 2020 | 2019 | 2018 | |
(Unaudited) | |||||
$9.77 | $12.07 | $12.36 | $11.91 | $11.10 | $11.68 |
0.19 | 0.32 | 0.31 | 0.31 | 0.37 | 0.33 |
0.55 | (2.21) | (0.21) | 0.48 | 0.80 | (0.52) |
0.74 | (1.89) | 0.10 | 0.79 | 1.17 | (0.19) |
(0.23 ) | (0.39) | (0.26) | (0.34) | (0.36) | (0.39) |
— | (0.02) | (0.13) | — | — | — |
(0.23 ) | (0.41) | (0.39) | (0.34) | (0.36) | (0.39) |
10.28 | 9.77 | 12.07 | 12.36 | 11.91 | 11.10 |
$997,110 | $924,416 | $1,376,349 | $1,844,961 | $1,958,600 | $1,899,680 |
7.60 %c | (15.99)% | 0.79% | 6.72% | 10.74% | (1.63)% |
0.39 d | 0.46 | 0.61 | 0.73 | 1.14 | 0.90 |
0.38 d | 0.42 | 0.51 | 0.62 | 1.04 | 0.80 |
0.38 d | 0.42 | 0.51 | 0.51 | 0.51 | 0.51 |
3.70 d | 2.88 | 2.52 | 2.58 | 3.23 | 2.93 |
19 c | 219 | 370 | 558 | 644 | 674 |
94
Harbor Funds Financial Highlights—Continued
Selected Data for a Share Outstanding for the Periods Presented
HARBOR DISRUPTIVE INNOVATION FUND | ||||||
Retirement Class | ||||||
6-Month Period Ended April 30, 2023 | Year Ended October 31, | |||||
2022 | 2021g | 2020 | 2019 | 2018 | ||
(Unaudited) | ||||||
Net asset value beginning of period | $4.37 | $14.40 | $12.93 | $10.91 | $10.88 | $11.25 |
Income from Investment Operations | ||||||
Net investment income/(loss)a,e | (0.01 ) | (0.01) | (0.08) | (0.06) | (0.04) | (0.03) |
Net realized and unrealized gain/(loss) on investments | 0.29 | (4.60) | 3.48 | 4.25 | 1.85 | 0.88 |
Total from investment operations | 0.28 | (4.61) | 3.40 | 4.19 | 1.81 | 0.85 |
Less Distributions | ||||||
Dividends from net investment income | — | — | — | — | — | — |
Distributions from net realized capital gains | — | (5.42) | (1.93) | (2.17) | (1.78) | (1.22) |
Total distributions | — | (5.42) | (1.93) | (2.17) | (1.78) | (1.22) |
Net asset value end of period | 4.65 | 4.37 | 14.40 | 12.93 | 10.91 | 10.88 |
Net assets end of period (000s) | $10,550 | $16,353 | $64,310 | $64,242 | $31,265 | $144,137 |
Ratios and Supplemental Data (%) | ||||||
Total returnb | 6.41 %c | (46.85)% | 27.41% | 46.03% | 21.38% | 8.02% |
Ratio of total expenses to average net assets^ | 0.86 d | 0.83 | 0.85 | 0.83 | 0.82 | 0.80 |
Ratio of net expenses to average net assetsa | 0.75 d | 0.52 | 0.74 | 0.79 | 0.81 | 0.80 |
Ratio of net investment income/(loss) to average net assetsa | (0.35 )d | (0.15) | (0.56) | (0.53) | (0.37) | (0.28) |
Portfolio turnover | 35 c | 75 | 182 | 113 | 70 | 85 |
Administrative Class | ||||||
6-Month Period Ended April 30, 2023 | Year Ended October 31, | |||||
2022 | 2021g | 2020 | 2019 | 2018 | ||
(Unaudited) | ||||||
Net asset value beginning of period | $3.66 | $13.08 | $11.93 | $10.26 | $10.37 | $10.81 |
Income from Investment Operations | ||||||
Net investment income/(loss)a,e | (0.01 ) | (0.03) | (0.11) | (0.08) | (0.06) | (0.06) |
Net realized and unrealized gain/(loss) on investments | 0.23 | (3.97) | 3.19 | 3.92 | 1.73 | 0.84 |
Total from investment operations | 0.22 | (4.00) | 3.08 | 3.84 | 1.67 | 0.78 |
Less Distributions | ||||||
Dividends from net investment income | — | — | — | — | — | — |
Distributions from net realized capital gains | — | (5.42) | (1.93) | (2.17) | (1.78) | (1.22) |
Total distributions | — | (5.42) | (1.93) | (2.17) | (1.78) | (1.22) |
Net asset value end of period | 3.88 | 3.66 | 13.08 | 11.93 | 10.26 | 10.37 |
Net assets end of period (000s) | $2,050 | $2,492 | $5,518 | $3,666 | $2,687 | $26,936 |
Ratios and Supplemental Data (%) | ||||||
Total returnb | 6.01 %c | (46.96)% | 26.98% | 45.42% | 21.04% | 7.68% |
Ratio of total expenses to average net assets^ | 1.19 d | 1.16 | 1.17 | 1.16 | 1.15 | 1.13 |
Ratio of net expenses to average net assetsa | 1.08 d | 0.86 | 1.06 | 1.12 | 1.14 | 1.12 |
Ratio of net investment income/(loss) to average net assetsa | (0.69 )d | (0.48) | (0.88) | (0.84) | (0.66) | (0.55) |
Portfolio turnover | 35 c | 75 | 182 | 113 | 70 | 85 |
See page 119 for notes to the Financial Highlights.
The accompanying notes are an integral part of the Financial Statements.
95
Institutional Class | |||||
6-Month Period Ended April 30, 2023 | Year Ended October 31, | ||||
2022 | 2021g | 2020 | 2019 | 2018 | |
(Unaudited) | |||||
$4.32 | $14.31 | $12.87 | $10.88 | $10.86 | $11.24 |
(0.01 ) | (0.01) | (0.09) | (0.06) | (0.05) | (0.04) |
0.28 | (4.56) | 3.46 | 4.22 | 1.85 | 0.88 |
0.27 | (4.57) | 3.37 | 4.16 | 1.80 | 0.84 |
— | — | — | — | — | — |
— | (5.42) | (1.93) | (2.17) | (1.78) | (1.22) |
— | (5.42) | (1.93) | (2.17) | (1.78) | (1.22) |
4.59 | 4.32 | 14.31 | 12.87 | 10.88 | 10.86 |
$51,011 | $72,988 | $220,842 | $236,863 | $198,544 | $158,680 |
6.25 %c | (46.87)% | 27.29% | 45.84% | 21.32% | 7.94% |
0.94 d | 0.91 | 0.93 | 0.91 | 0.90 | 0.88 |
0.83 d | 0.61 | 0.82 | 0.87 | 0.89 | 0.87 |
(0.44 )d | (0.24) | (0.64) | (0.58) | (0.48) | (0.36) |
35 c | 75 | 182 | 113 | 70 | 85 |
Investor Class | |||||
6-Month Period Ended April 30, 2023 | Year Ended October 31, | ||||
2022 | 2021g | 2020 | 2019 | 2018 | |
(Unaudited) | |||||
$3.27 | $12.36 | $11.37 | $9.88 | $10.07 | $10.54 |
(0.01 ) | (0.03) | (0.12) | (0.09) | (0.08) | (0.08) |
0.21 | (3.64) | 3.04 | 3.75 | 1.67 | 0.83 |
0.20 | (3.67) | 2.92 | 3.66 | 1.59 | 0.75 |
— | — | — | — | — | — |
— | (5.42) | (1.93) | (2.17) | (1.78) | (1.22) |
— | (5.42) | (1.93) | (2.17) | (1.78) | (1.22) |
3.47 | 3.27 | 12.36 | 11.37 | 9.88 | 10.07 |
$15,892 | $16,387 | $56,531 | $36,399 | $20,891 | $16,929 |
6.12 %c | (47.05)% | 26.88% | 45.32% | 20.83% | 7.57% |
1.30 d | 1.27 | 1.29 | 1.28 | 1.27 | 1.25 |
1.19 d | 0.96 | 1.17 | 1.24 | 1.26 | 1.24 |
(0.80 )d | (0.59) | (0.99) | (0.96) | (0.85) | (0.72) |
35 c | 75 | 182 | 113 | 70 | 85 |
96
Harbor Funds Financial Highlights—Continued
Selected Data for a Share Outstanding for the Periods Presented
HARBOR DIVERSIFIED INTERNATIONAL ALL CAP FUND | ||||||
Retirement Class | ||||||
6-Month Period Ended April 30, 2023 | Year Ended October 31, | |||||
2022 | 2021 | 2020 | 2019 | 2018 | ||
(Unaudited) | ||||||
Net asset value beginning of period | $9.75 | $13.83 | $10.25 | $11.17 | $10.41 | $11.79 |
Income from Investment Operations | ||||||
Net investment income/(loss)a,e | 0.10 | 0.23 | 0.21 | 0.14 | 0.26 | 0.21 |
Net realized and unrealized gain/(loss) on investments | 2.05 | (3.36) | 3.50 | (0.81) | 0.92 | (1.19) |
Total from investment operations | 2.15 | (3.13) | 3.71 | (0.67) | 1.18 | (0.98) |
Less Distributions | ||||||
Dividends from net investment income | (0.16 ) | (0.23) | (0.13) | (0.25) | (0.13) | (0.12) |
Distributions from net realized capital gains | — | (0.72) | — | — | (0.29) | (0.28) |
Total distributions | (0.16 ) | (0.95) | (0.13) | (0.25) | (0.42) | (0.40) |
Net asset value end of period | 11.74 | 9.75 | 13.83 | 10.25 | 11.17 | 10.41 |
Net assets end of period (000s) | $676,998 | $543,857 | $853,454 | $533,318 | $499,288 | $420,056 |
Ratios and Supplemental Data (%) | ||||||
Total returnb | 22.27 %c | (24.03)% | 36.32% | (6.25)% | 11.99% | (8.55)% |
Ratio of total expenses to average net assets^ | 0.84 d | 0.84 | 0.84 | 0.85 | 0.87 | 0.90 |
Ratio of net expenses to average net assetsa | 0.72 d | 0.72 | 0.71 | 0.70 | 0.68 | 0.74 |
Ratio of net investment income/(loss) to average net assetsa | 1.85 d | 1.98 | 1.54 | 1.32 | 2.42 | 1.87 |
Portfolio turnover | 7 c | 24 | 51 | 25 | 22 | 42 |
Administrative Class | ||||||
6-Month Period Ended April 30, 2023 | Year Ended October 31, | |||||
2022 | 2021 | 2020 | 2019 | 2018 | ||
(Unaudited) | ||||||
Net asset value beginning of period | $9.71 | $13.77 | $10.22 | $11.14 | $10.39 | $11.76 |
Income from Investment Operations | ||||||
Net investment income/(loss)a,e | 0.08 | 0.20 | 0.16 | 0.10 | 0.22 | 0.22 |
Net realized and unrealized gain/(loss) on investments | 2.05 | (3.35) | 3.48 | (0.80) | 0.92 | (1.22) |
Total from investment operations | 2.13 | (3.15) | 3.64 | (0.70) | 1.14 | (1.00) |
Less Distributions | ||||||
Dividends from net investment income | (0.13 ) | (0.19) | (0.09) | (0.22) | (0.10) | (0.09) |
Distributions from net realized capital gains | — | (0.72) | — | — | (0.29) | (0.28) |
Total distributions | (0.13 ) | (0.91) | (0.09) | (0.22) | (0.39) | (0.37) |
Net asset value end of period | 11.71 | 9.71 | 13.77 | 10.22 | 11.14 | 10.39 |
Net assets end of period (000s) | $9,243 | $7,419 | $9,213 | $6,446 | $6,800 | $5,734 |
Ratios and Supplemental Data (%) | ||||||
Total returnb | 22.06 %c | (24.24)% | 35.76% | (6.54)% | 11.58% | (8.76)% |
Ratio of total expenses to average net assets^ | 1.17 d | 1.17 | 1.17 | 1.18 | 1.20 | 1.23 |
Ratio of net expenses to average net assetsa | 1.05 d | 1.05 | 1.04 | 1.03 | 1.01 | 1.06 |
Ratio of net investment income/(loss) to average net assetsa | 1.50 d | 1.73 | 1.17 | 0.99 | 2.06 | 1.96 |
Portfolio turnover | 7 c | 24 | 51 | 25 | 22 | 42 |
See page 119 for notes to the Financial Highlights.
The accompanying notes are an integral part of the Financial Statements.
97
Institutional Class | |||||
6-Month Period Ended April 30, 2023 | Year Ended October 31, | ||||
2022 | 2021 | 2020 | 2019 | 2018 | |
(Unaudited) | |||||
$9.75 | $13.82 | $10.25 | $11.17 | $10.41 | $11.79 |
0.10 | 0.23 | 0.19 | 0.13 | 0.25 | 0.20 |
2.05 | (3.36) | 3.50 | (0.81) | 0.92 | (1.18) |
2.15 | (3.13) | 3.69 | (0.68) | 1.17 | (0.98) |
(0.16 ) | (0.22) | (0.12) | (0.24) | (0.12) | (0.12) |
— | (0.72) | — | — | (0.29) | (0.28) |
(0.16 ) | (0.94) | (0.12) | (0.24) | (0.41) | (0.40) |
11.74 | 9.75 | 13.82 | 10.25 | 11.17 | 10.41 |
$304,853 | $248,130 | $332,503 | $247,212 | $257,860 | $238,470 |
22.27 %c | (24.04)% | 36.12% | (6.33)% | 11.90% | (8.62)% |
0.92 d | 0.92 | 0.92 | 0.93 | 0.95 | 0.98 |
0.80 d | 0.80 | 0.79 | 0.78 | 0.76 | 0.82 |
1.75 d | 1.99 | 1.43 | 1.25 | 2.34 | 1.72 |
7 c | 24 | 51 | 25 | 22 | 42 |
Investor Class | |||||
6-Month Period Ended April 30, 2023 | Year Ended October 31, | ||||
2022 | 2021 | 2020 | 2019 | 2018 | |
(Unaudited) | |||||
$9.66 | $13.70 | $10.17 | $11.08 | $10.33 | $11.71 |
0.08 | 0.18 | 0.14 | 0.09 | 0.21 | 0.15 |
2.04 | (3.33) | 3.47 | (0.80) | 0.91 | (1.17) |
2.12 | (3.15) | 3.61 | (0.71) | 1.12 | (1.02) |
(0.12 ) | (0.17) | (0.08) | (0.20) | (0.08) | (0.08) |
— | (0.72) | — | — | (0.29) | (0.28) |
(0.12 ) | (0.89) | (0.08) | (0.20) | (0.37) | (0.36) |
11.66 | 9.66 | 13.70 | 10.17 | 11.08 | 10.33 |
$9,921 | $8,330 | $10,072 | $7,037 | $9,122 | $5,456 |
22.02 %c | (24.32)% | 35.56% | (6.58)% | 11.43% | (8.93)% |
1.28 d | 1.28 | 1.29 | 1.30 | 1.32 | 1.35 |
1.16 d | 1.16 | 1.15 | 1.15 | 1.13 | 1.19 |
1.40 d | 1.60 | 1.07 | 0.86 | 1.99 | 1.34 |
7 c | 24 | 51 | 25 | 22 | 42 |
98
Harbor Funds Financial Highlights—Continued
Selected Data for a Share Outstanding for the Periods Presented
HARBOR GLOBAL LEADERS FUND | ||||||
Retirement Class | ||||||
6-Month Period Ended April 30, 2023 | Year Ended October 31, | |||||
2022 | 2021 | 2020 | 2019 | 2018 | ||
(Unaudited) | ||||||
Net asset value beginning of period | $24.43 | $41.81 | $33.89 | $30.81 | $25.52 | $25.33 |
Income from Investment Operations | ||||||
Net investment income/(loss)a,e | (0.02 ) | (0.04) | (0.09) | 0.02 | 0.13 | 0.02 |
Net realized and unrealized gain/(loss) on investments | 2.51 | (13.64) | 10.84 | 4.89 | 5.76 | 2.40 |
Total from investment operations | 2.49 | (13.68) | 10.75 | 4.91 | 5.89 | 2.42 |
Less Distributions | ||||||
Dividends from net investment income | — | — | — | (0.09) | — | (0.03) |
Distributions from net realized capital gains | (1.95 ) | (3.70) | (2.83) | (1.74) | (0.60) | (2.20) |
Total distributions | (1.95 ) | (3.70) | (2.83) | (1.83) | (0.60) | (2.23) |
Net asset value end of period | 24.97 | 24.43 | 41.81 | 33.89 | 30.81 | 25.52 |
Net assets end of period (000s) | $15,684 | $15,702 | $24,324 | $17,703 | $12,245 | $6,846 |
Ratios and Supplemental Data (%) | ||||||
Total returnb | 10.94 %c | (35.22)% | 33.12% | 16.56% | 23.72% | 10.01% |
Ratio of total expenses to average net assets^ | 0.95 d | 0.92 | 0.87 | 0.90 | 0.92 | 0.96 |
Ratio of net expenses to average net assetsa | 0.78 d | 0.78 | 0.78 | 0.78 | 0.80 | 0.82 |
Ratio of net investment income/(loss) to average net assetsa | (0.13 )d | (0.14) | (0.24) | 0.07 | 0.46 | 0.09 |
Portfolio turnover | 6 c | 29 | 27 | 55 | 47 | 20 |
Administrative Class | ||||||
6-Month Period Ended April 30, 2023 | Year Ended October 31, | |||||
2022 | 2021 | 2020 | 2019 | 2018 | ||
(Unaudited) | ||||||
Net asset value beginning of period | $23.58 | $40.63 | $33.10 | $30.15 | $25.06 | $24.97 |
Income from Investment Operations | ||||||
Net investment income/(loss)a,e | (0.05 ) | (0.14) | (0.22) | (0.08) | 0.06 | (0.05) |
Net realized and unrealized gain/(loss) on investments | 2.41 | (13.21) | 10.58 | 4.77 | 5.63 | 2.34 |
Total from investment operations | 2.36 | (13.35) | 10.36 | 4.69 | 5.69 | 2.29 |
Less Distributions | ||||||
Dividends from net investment income | — | — | — | — | — | — |
Distributions from net realized capital gains | (1.95 ) | (3.70) | (2.83) | (1.74) | (0.60) | (2.20) |
Total distributions | (1.95 ) | (3.70) | (2.83) | (1.74) | (0.60) | (2.20) |
Net asset value end of period | 23.99 | 23.58 | 40.63 | 33.10 | 30.15 | 25.06 |
Net assets end of period (000s) | $1,008 | $914 | $1,757 | $2,067 | $3,050 | $1,111 |
Ratios and Supplemental Data (%) | ||||||
Total returnb | 10.78 %c | (35.45)% | 32.71% | 16.13% | 23.35% | 9.61% |
Ratio of total expenses to average net assets^ | 1.28 d | 1.25 | 1.20 | 1.23 | 1.25 | 1.29 |
Ratio of net expenses to average net assetsa | 1.11 d | 1.11 | 1.11 | 1.11 | 1.13 | 1.15 |
Ratio of net investment income/(loss) to average net assetsa | (0.46 )d | (0.48) | (0.58) | (0.25) | 0.22 | (0.21) |
Portfolio turnover | 6 c | 29 | 27 | 55 | 47 | 20 |
See page 119 for notes to the Financial Highlights.
The accompanying notes are an integral part of the Financial Statements.
99
Institutional Class | |||||
6-Month Period Ended April 30, 2023 | Year Ended October 31, | ||||
2022 | 2021 | 2020 | 2019 | 2018 | |
(Unaudited) | |||||
$24.32 | $41.67 | $33.80 | $30.75 | $25.49 | $25.31 |
(0.03 ) | (0.08) | (0.13) | —* | 0.11 | 0.01 |
2.49 | (13.57) | 10.83 | 4.86 | 5.75 | 2.38 |
2.46 | (13.65) | 10.70 | 4.86 | 5.86 | 2.39 |
— | — | — | (0.07) | — | (0.01) |
(1.95 ) | (3.70) | (2.83) | (1.74) | (0.60) | (2.20) |
(1.95 ) | (3.70) | (2.83) | (1.81) | (0.60) | (2.21) |
24.83 | 24.32 | 41.67 | 33.80 | 30.75 | 25.49 |
$39,099 | $40,193 | $90,307 | $78,120 | $72,429 | $33,574 |
10.87 %c | (35.27)% | 33.02% | 16.46% | 23.63% | 9.90% |
1.03 d | 1.00 | 0.95 | 0.98 | 1.00 | 1.04 |
0.86 d | 0.86 | 0.86 | 0.86 | 0.88 | 0.90 |
(0.21 )d | (0.25) | (0.33) | 0.01 | 0.37 | 0.03 |
6 c | 29 | 27 | 55 | 47 | 20 |
Investor Class | |||||
6-Month Period Ended April 30, 2023 | Year Ended October 31, | ||||
2022 | 2021 | 2020 | 2019 | 2018 | |
(Unaudited) | |||||
$23.09 | $39.90 | $32.59 | $29.74 | $24.76 | $24.72 |
(0.07 ) | (0.18) | (0.25) | (0.11) | (0.01) | (0.09) |
2.36 | (12.93) | 10.39 | 4.70 | 5.59 | 2.33 |
2.29 | (13.11) | 10.14 | 4.59 | 5.58 | 2.24 |
— | — | — | — | — | — |
(1.95 ) | (3.70) | (2.83) | (1.74) | (0.60) | (2.20) |
(1.95 ) | (3.70) | (2.83) | (1.74) | (0.60) | (2.20) |
23.43 | 23.09 | 39.90 | 32.59 | 29.74 | 24.76 |
$10,702 | $10,744 | $26,160 | $20,865 | $18,748 | $12,416 |
10.70 %c | (35.50)% | 32.53% | 16.01% | 23.18% | 9.50% |
1.39 d | 1.36 | 1.31 | 1.35 | 1.37 | 1.41 |
1.22 d | 1.22 | 1.22 | 1.23 | 1.25 | 1.27 |
(0.57 )d | (0.61) | (0.69) | (0.35) | (0.03) | (0.35) |
6 c | 29 | 27 | 55 | 47 | 20 |
100
Harbor Funds Financial Highlights—Continued
Selected Data for a Share Outstanding for the Periods Presented
HARBOR INTERNATIONAL FUND | ||||||
Retirement Class | ||||||
6-Month Period Ended April 30, 2023 | Year Ended October 31, | |||||
2022 | 2021 | 2020 | 2019 | 2018j | ||
(Unaudited) | ||||||
Net asset value beginning of period | $35.91 | $48.47 | $36.52 | $39.00 | $58.31 | $69.91 |
Income from Investment Operations | ||||||
Net investment income/(loss)a,e | 0.48 | 1.09 | 0.72 | 0.91 | 0.91 | 1.21 |
Net realized and unrealized gain/(loss) on investments | 8.47 | (12.60) | 11.73 | (2.10) | 1.62 | (8.51) |
Total from investment operations | 8.95 | (11.51) | 12.45 | (1.19) | 2.53 | (7.30) |
Less Distributions | ||||||
Dividends from net investment income | (1.34 ) | (1.05) | (0.50) | (1.29) | (0.97) | (1.30) |
Distributions from net realized capital gains | — | — | — | — | (20.87) | (3.00) |
Total distributions | (1.34 ) | (1.05) | (0.50) | (1.29) | (21.84) | (4.30) |
Net asset value end of period | 43.52 | 35.91 | 48.47 | 36.52 | 39.00 | 58.31 |
Net assets end of period (000s) | $594,840 | $461,129 | $872,647 | $871,743 | $1,299,776 | $2,703,360 |
Ratios and Supplemental Data (%) | ||||||
Total returnb | 25.42 %c | (24.19)% | 34.23% | (3.35)% | 10.29% | (11.24)% |
Ratio of total expenses to average net assets^ | 0.81 d | 0.81 | 0.80 | 1.61n | 0.80 | 0.74 |
Ratio of net expenses to average net assetsa | 0.69 d | 0.69 | 0.69 | 0.69n | 0.67 | 0.64 |
Ratio of net investment income/(loss) to average net assetsa | 2.35 d | 2.57 | 1.55 | 2.52n | 2.33 | 1.80 |
Portfolio turnover | 7 c | 14 | 21 | 12 | 12 | 64 |
Administrative Class | ||||||
6-Month Period Ended April 30, 2023 | Year Ended October 31, | |||||
2022 | 2021 | 2020 | 2019 | 2018j | ||
(Unaudited) | ||||||
Net asset value beginning of period | $36.30 | $48.95 | $36.78 | $39.26 | $58.08 | $69.57 |
Income from Investment Operations | ||||||
Net investment income/(loss)a,e | 0.41 | 1.02 | 0.57 | 0.47 | 0.76 | 0.88 |
Net realized and unrealized gain/(loss) on investments | 8.58 | (12.80) | 11.84 | (1.81) | 1.70 | (8.37) |
Total from investment operations | 8.99 | (11.78) | 12.41 | (1.34) | 2.46 | (7.49) |
Less Distributions | ||||||
Dividends from net investment income | (1.20 ) | (0.87) | (0.24) | (1.14) | (0.41) | (1.00) |
Distributions from net realized capital gains | — | — | — | — | (20.87) | (3.00) |
Total distributions | (1.20 ) | (0.87) | (0.24) | (1.14) | (21.28) | (4.00) |
Net asset value end of period | 44.09 | 36.29 | 48.95 | 36.78 | 39.26 | 58.08 |
Net assets end of period (000s) | $11,604 | $10,375 | $15,464 | $15,825 | $70,981 | $90,009 |
Ratios and Supplemental Data (%) | ||||||
Total returnb | 25.21 %c | (24.46)% | 33.80% | (3.67)% | 9.94% | (11.53)% |
Ratio of total expenses to average net assets^ | 1.14 d | 1.14 | 1.13 | 1.65n | 1.13 | 1.07 |
Ratio of net expenses to average net assetsa | 1.02 d | 1.02 | 1.02 | 1.02n | 1.00 | 0.97 |
Ratio of net investment income/(loss) to average net assetsa | 2.00 d | 2.40 | 1.22 | 1.25n | 1.94 | 1.30 |
Portfolio turnover | 7 c | 14 | 21 | 12 | 12 | 64 |
See page 119 for notes to the Financial Highlights.
The accompanying notes are an integral part of the Financial Statements.
101
Institutional Class | |||||
6-Month Period Ended April 30, 2023 | Year Ended October 31, | ||||
2022 | 2021 | 2020 | 2019 | 2018j | |
(Unaudited) | |||||
$36.04 | $48.64 | $36.64 | $39.12 | $58.31 | $69.90 |
0.47 | 1.12 | 0.70 | 0.92 | 0.84 | 1.04 |
8.50 | (12.71) | 11.76 | (2.15) | 1.67 | (8.39) |
8.97 | (11.59) | 12.46 | (1.23) | 2.51 | (7.35) |
(1.31 ) | (1.01) | (0.46) | (1.25) | (0.83) | (1.24) |
— | — | — | — | (20.87) | (3.00) |
(1.31 ) | (1.01) | (0.46) | (1.25) | (21.70) | (4.24) |
43.70 | 36.04 | 48.64 | 36.64 | 39.12 | 58.31 |
$2,658,846 | $2,298,600 | $3,307,683 | $2,750,824 | $3,814,616 | $8,577,147 |
25.35 %c | (24.25)% | 34.15% | (3.43)% | 10.18% | (11.31)% |
0.89 d | 0.89 | 0.89 | 1.76n | 0.88 | 0.82 |
0.77 d | 0.77 | 0.77 | 0.77n | 0.75 | 0.72 |
2.28 d | 2.68 | 1.50 | 2.52n | 2.11 | 1.53 |
7 c | 14 | 21 | 12 | 12 | 64 |
Investor Class | |||||
6-Month Period Ended April 30, 2023 | Year Ended October 31, | ||||
2022 | 2021 | 2020 | 2019 | 2018j | |
(Unaudited) | |||||
$35.63 | $48.08 | $36.22 | $38.65 | $57.66 | $69.14 |
0.39 | 0.95 | 0.52 | 0.75 | 0.70 | 0.81 |
8.41 | (12.57) | 11.64 | (2.12) | 1.65 | (8.33) |
8.80 | (11.62) | 12.16 | (1.37) | 2.35 | (7.52) |
(1.15 ) | (0.83) | (0.30) | (1.06) | (0.49) | (0.96) |
— | — | — | — | (20.87) | (3.00) |
(1.15 ) | (0.83) | (0.30) | (1.06) | (21.36) | (3.96) |
43.28 | 35.63 | 48.08 | 36.22 | 38.65 | 57.66 |
$280,064 | $246,731 | $374,773 | $323,686 | $510,270 | $895,711 |
25.12 %c | (24.53)% | 33.66% | (3.79)% | 9.80% | (11.65)% |
1.25 d | 1.25 | 1.25 | 2.10n | 1.25 | 1.19 |
1.13 d | 1.13 | 1.13 | 1.14n | 1.12 | 1.09 |
1.91 d | 2.28 | 1.13 | 2.06n | 1.80 | 1.21 |
7 c | 14 | 21 | 12 | 12 | 64 |
102
Harbor Funds Financial Highlights—Continued
Selected Data for a Share Outstanding for the Periods Presented
HARBOR INTERNATIONAL CORE FUND (FORMERLY, HARBOR OVERSEAS FUND) | |||||
Retirement Class | |||||
6-Month Period Ended April 30, 2023 | Year Ended October 31, | ||||
2022 | 2021 | 2020 | 2019i | ||
(Unaudited) | |||||
Net asset value beginning of period | $9.98 | $14.02 | $10.12 | $10.31 | $10.00 |
Income from Investment Operations | |||||
Net investment income/(loss)a,e | 0.18 | 0.46 | 0.28 | 0.17 | 0.24 |
Net realized and unrealized gain/(loss) on investments | 1.22 | (3.14) | 3.79 | (0.09) | 0.07 |
Total from investment operations | 1.40 | (2.68) | 4.07 | 0.08 | 0.31 |
Less Distributions | |||||
Dividends from net investment income | (0.27 ) | (0.36) | (0.17) | (0.27) | — |
Distributions from net realized capital gains | — | (1.00) | — | — | — |
Total distributions | (0.27 ) | (1.36) | (0.17) | (0.27) | — |
Net asset value end of period | 11.11 | 9.98 | 14.02 | 10.12 | 10.31 |
Net assets end of period (000s) | $23,669 | $21,221 | $19,742 | $13,790 | $13,090 |
Ratios and Supplemental Data (%) | |||||
Total returnb | 14.21 %c | (20.93)% | 40.51% | 0.64% | 3.10%c |
Ratio of total expenses to average net assets^ | 1.02 d | 1.16 | 1.19 | 1.35 | 1.79d |
Ratio of net expenses to average net assetsa | 0.77 d | 0.77 | 0.77 | 0.77 | 0.77d |
Ratio of net investment income/(loss) to average net assetsa | 3.30 d | 4.05 | 2.14 | 1.73 | 3.61d |
Portfolio turnover | 49 c | 100 | 108 | 80 | 73c |
Investor Class | |||||
6-Month Period Ended April 30, 2023 | Year Ended October 31, | ||||
2022 | 2021 | 2020 | 2019i | ||
(Unaudited) | |||||
Net asset value beginning of period | $9.92 | $13.96 | $10.08 | $10.28 | $10.00 |
Income from Investment Operations | |||||
Net investment income/(loss)a,e | 0.22 | 0.38 | 0.23 | 0.14 | 0.21 |
Net realized and unrealized gain/(loss) on investments | 1.14 | (3.10) | 3.78 | (0.11) | 0.07 |
Total from investment operations | 1.36 | (2.72) | 4.01 | 0.03 | 0.28 |
Less Distributions | |||||
Dividends from net investment income | (0.25 ) | (0.32) | (0.13) | (0.23) | — |
Distributions from net realized capital gains | — | (1.00) | — | — | — |
Total distributions | (0.25 ) | (1.32) | (0.13) | (0.23) | — |
Net asset value end of period | 11.03 | 9.92 | 13.96 | 10.08 | 10.28 |
Net assets end of period (000s) | $11,248 | $2,331 | $101 | $35 | $31 |
Ratios and Supplemental Data (%) | |||||
Total returnb | 13.89 %c | (21.29)% | 39.98% | 0.14% | 2.80%c |
Ratio of total expenses to average net assets^ | 1.46 d | 1.60 | 1.63 | 1.80 | 2.24d |
Ratio of net expenses to average net assetsa | 1.21 d | 1.21 | 1.21 | 1.22 | 1.22d |
Ratio of net investment income/(loss) to average net assetsa | 4.03 d | 3.67 | 1.73 | 1.41 | 3.17d |
Portfolio turnover | 49 c | 100 | 108 | 80 | 73c |
See page 119 for notes to the Financial Highlights.
The accompanying notes are an integral part of the Financial Statements.
103
Institutional Class | ||||
6-Month Period Ended April 30, 2023 | ||||
2022 | 2021 | 2020 | 2019i | |
(Unaudited) | ||||
$9.97 | $14.01 | $10.11 | $10.31 | $10.00 |
0.19 | 0.43 | 0.29 | 0.17 | 0.24 |
1.21 | (3.12) | 3.77 | (0.11) | 0.07 |
1.40 | (2.69) | 4.06 | 0.06 | 0.31 |
(0.27 ) | (0.35) | (0.16) | (0.26) | — |
— | (1.00) | — | — | — |
(0.27 ) | (1.35) | (0.16) | (0.26) | — |
11.10 | 9.97 | 14.01 | 10.11 | 10.31 |
$119,335 | $66,908 | $33,230 | $13,226 | $13,131 |
14.18 %c | (21.00)% | 40.46% | 0.48% | 3.10%c |
1.10 d | 1.24 | 1.27 | 1.43 | 1.87d |
0.85 d | 0.85 | 0.85 | 0.85 | 0.85d |
3.48 d | 3.85 | 2.16 | 1.65 | 3.54d |
49 c | 100 | 108 | 80 | 73c |
104
Harbor Funds Financial Highlights—Continued
Selected Data for a Share Outstanding for the Periods Presented
HARBOR INTERNATIONAL GROWTH FUND | ||||||
Retirement Class | ||||||
6-Month Period Ended April 30, 2023 | Year Ended October 31, | |||||
2022 | 2021 | 2020 | 2019 | 2018 | ||
(Unaudited) | ||||||
Net asset value beginning of period | $12.76 | $23.53 | $19.10 | $16.14 | $13.70 | $15.71 |
Income from Investment Operations | ||||||
Net investment income/(loss)a,e | 0.02 | 0.06 | 0.02 | 0.03 | 0.30 | 0.17 |
Net realized and unrealized gain/(loss) on investments | 2.97 | (8.96) | 4.56 | 3.25 | 2.25 | (1.99) |
Total from investment operations | 2.99 | (8.90) | 4.58 | 3.28 | 2.55 | (1.82) |
Less Distributions | ||||||
Dividends from net investment income | — | (0.14) | (0.15) | (0.32) | (0.11) | (0.19) |
Distributions from net realized capital gains | — | (1.73) | — | — | — | — |
Total distributions | — | (1.87) | (0.15) | (0.32) | (0.11) | (0.19) |
Net asset value end of period | 15.75 | 12.76 | 23.53 | 19.10 | 16.14 | 13.70 |
Net assets end of period (000s) | $78,503 | $72,107 | $147,545 | $163,202 | $143,276 | $93,815 |
Ratios and Supplemental Data (%) | ||||||
Total returnb | 23.43 %c | (40.76)% | 24.00% | 20.56% | 18.81% | (11.74)% |
Ratio of total expenses to average net assets^ | 0.86 d | 0.83 | 0.81 | 0.83 | 0.83 | 0.81 |
Ratio of net expenses to average net assetsa | 0.77 d | 0.77 | 0.77 | 0.77 | 0.77 | 0.77 |
Ratio of net investment income/(loss) to average net assetsa | 0.22 d | 0.34 | 0.08 | 0.19 | 2.01 | 1.07 |
Portfolio turnover | 6 c | 18 | 12 | 24 | 16 | 17 |
Administrative Class | ||||||
6-Month Period Ended April 30, 2023 | Year Ended October 31, | |||||
2022 | 2021 | 2020 | 2019 | 2018 | ||
(Unaudited) | ||||||
Net asset value beginning of period | $12.73 | $23.42 | $19.05 | $16.10 | $13.66 | $15.67 |
Income from Investment Operations | ||||||
Net investment income/(loss)a,e | (0.01 ) | (0.02) | (0.06) | (0.02) | 0.22 | 0.08 |
Net realized and unrealized gain/(loss) on investments | 2.96 | (8.91) | 4.54 | 3.24 | 2.28 | (1.95) |
Total from investment operations | 2.95 | (8.93) | 4.48 | 3.22 | 2.50 | (1.87) |
Less Distributions | ||||||
Dividends from net investment income | — | (0.03) | (0.11) | (0.27) | (0.06) | (0.14) |
Distributions from net realized capital gains | — | (1.73) | — | — | — | — |
Total distributions | — | (1.76) | (0.11) | (0.27) | (0.06) | (0.14) |
Net asset value end of period | 15.68 | 12.73 | 23.42 | 19.05 | 16.10 | 13.66 |
Net assets end of period (000s) | $156 | $148 | $662 | $507 | $390 | $330 |
Ratios and Supplemental Data (%) | ||||||
Total returnb | 23.17 %c | (40.93)% | 23.54% | 20.17% | 18.45% | (12.03)% |
Ratio of total expenses to average net assets^ | 1.19 d | 1.16 | 1.14 | 1.16 | 1.16 | 1.14 |
Ratio of net expenses to average net assetsa | 1.10 d | 1.10 | 1.10 | 1.10 | 1.10 | 1.10 |
Ratio of net investment income/(loss) to average net assetsa | (0.15 )d | (0.09) | (0.24) | (0.15) | 1.50 | 0.51 |
Portfolio turnover | 6 c | 18 | 12 | 24 | 16 | 17 |
See page 119 for notes to the Financial Highlights.
The accompanying notes are an integral part of the Financial Statements.
105
Institutional Class | |||||
6-Month Period Ended April 30, 2023 | Year Ended October 31, | ||||
2022 | 2021 | 2020 | 2019 | 2018 | |
(Unaudited) | |||||
$12.75 | $23.50 | $19.08 | $16.13 | $13.69 | $15.69 |
0.01 | 0.04 | —* | 0.02 | 0.26 | 0.13 |
2.96 | (8.94) | 4.55 | 3.24 | 2.28 | (1.95) |
2.97 | (8.90) | 4.55 | 3.26 | 2.54 | (1.82) |
— | (0.12) | (0.13) | (0.31) | (0.10) | (0.18) |
— | (1.73) | — | — | — | — |
— | (1.85) | (0.13) | (0.31) | (0.10) | (0.18) |
15.72 | 12.75 | 23.50 | 19.08 | 16.13 | 13.69 |
$289,851 | $267,148 | $709,080 | $600,240 | $414,528 | $399,911 |
23.29 %c | (40.78)% | 23.92% | 20.42% | 18.73% | (11.75)% |
0.94 d | 0.91 | 0.89 | 0.91 | 0.91 | 0.89 |
0.85 d | 0.85 | 0.85 | 0.85 | 0.85 | 0.85 |
0.14 d | 0.21 | 0.01 | 0.11 | 1.75 | 0.84 |
6 c | 18 | 12 | 24 | 16 | 17 |
Investor Class | |||||
6-Month Period Ended April 30, 2023 | Year Ended October 31, | ||||
2022 | 2021 | 2020 | 2019 | 2018 | |
(Unaudited) | |||||
$12.66 | $23.30 | $18.93 | $16.00 | $13.58 | $15.57 |
(0.02 ) | (0.02) | (0.11) | (0.04) | 0.21 | 0.11 |
2.94 | (8.89) | 4.54 | 3.22 | 2.26 | (1.98) |
2.92 | (8.91) | 4.43 | 3.18 | 2.47 | (1.87) |
— | — | (0.06) | (0.25) | (0.05) | (0.12) |
— | (1.73) | — | — | — | — |
— | (1.73) | (0.06) | (0.25) | (0.05) | (0.12) |
15.58 | 12.66 | 23.30 | 18.93 | 16.00 | 13.58 |
$8,070 | $6,788 | $13,523 | $32,757 | $34,238 | $32,225 |
23.06 %c | (41.00)% | 23.41% | 20.06% | 18.29% | (12.12)% |
1.30 d | 1.27 | 1.26 | 1.28 | 1.28 | 1.26 |
1.21 d | 1.21 | 1.22 | 1.22 | 1.22 | 1.22 |
(0.20 )d | (0.10) | (0.49) | (0.27) | 1.40 | 0.69 |
6 c | 18 | 12 | 24 | 16 | 17 |
106
Harbor Funds Financial Highlights—Continued
Selected Data for a Share Outstanding for the Periods Presented
HARBOR INTERNATIONAL SMALL CAP FUND | ||||||
Retirement Class | ||||||
6-Month Period Ended April 30, 2023 | Year Ended October 31, | |||||
2022 | 2021 | 2020 | 2019k | 2018 | ||
(Unaudited) | ||||||
Net asset value beginning of period | $12.65 | $16.39 | $11.37 | $12.49 | $12.38 | $13.90 |
Income from Investment Operations | ||||||
Net investment income/(loss)a,e | 0.17 | 0.27 | 0.28 | 0.07 | 0.24 | 0.17 |
Net realized and unrealized gain/(loss) on investments | 2.27 | (2.91) | 4.91 | (0.82) | 0.35 | (1.50) |
Total from investment operations | 2.44 | (2.64) | 5.19 | (0.75) | 0.59 | (1.33) |
Less Distributions | ||||||
Dividends from net investment income | (0.16 ) | (0.28) | (0.17) | (0.37) | (0.10) | (0.09) |
Distributions from net realized capital gains | (0.20 ) | (0.82) | — | — | (0.38) | (0.10) |
Total distributions | (0.36 ) | (1.10) | (0.17) | (0.37) | (0.48) | (0.19) |
Net asset value end of period | 14.73 | 12.65 | 16.39 | 11.37 | 12.49 | 12.38 |
Net assets end of period (000s) | $71,736 | $30,387 | $9,559 | $5,525 | $19,408 | $8,213 |
Ratios and Supplemental Data (%) | ||||||
Total returnb | 19.54 %c | (16.94)% | 45.95% | (6.36)% | 5.23% | (9.71)% |
Ratio of total expenses to average net assets^ | 0.97 d | 1.11 | 1.17 | 1.37 | 1.24 | 1.07 |
Ratio of net expenses to average net assetsa | 0.88 d | 0.88 | 0.88 | 0.88 | 0.88 | 0.87 |
Ratio of net investment income/(loss) to average net assetsa | 2.36 d | 2.04 | 1.79 | 0.64 | 1.98 | 1.19 |
Portfolio turnover | 8 c | 23 | 43 | 39 | 178 | 53 |
Administrative Class | ||||||
6-Month Period Ended April 30, 2023 | Year Ended October 31, | |||||
2022 | 2021 | 2020 | 2019k | 2018 | ||
(Unaudited) | ||||||
Net asset value beginning of period | $12.60 | $16.33 | $11.34 | $12.46 | $12.34 | $13.87 |
Income from Investment Operations | ||||||
Net investment income/(loss)a,e | 0.12 | 0.29 | 0.20 | 0.06 | 0.15 | 0.11 |
Net realized and unrealized gain/(loss) on investments | 2.30 | (2.97) | 4.93 | (0.85) | 0.40 | (1.49) |
Total from investment operations | 2.42 | (2.68) | 5.13 | (0.79) | 0.55 | (1.38) |
Less Distributions | ||||||
Dividends from net investment income | (0.12 ) | (0.23) | (0.14) | (0.33) | (0.05) | (0.05) |
Distributions from net realized capital gains | (0.20 ) | (0.82) | — | — | (0.38) | (0.10) |
Total distributions | (0.32 ) | (1.05) | (0.14) | (0.33) | (0.43) | (0.15) |
Net asset value end of period | 14.70 | 12.60 | 16.33 | 11.34 | 12.46 | 12.34 |
Net assets end of period (000s) | $521 | $436 | $487 | $333 | $356 | $309 |
Ratios and Supplemental Data (%) | ||||||
Total returnb | 19.38 %c | (17.25)% | 45.44% | (6.65)% | 4.90% | (10.06)% |
Ratio of total expenses to average net assets^ | 1.30 d | 1.44 | 1.50 | 1.70 | 1.57 | 1.40 |
Ratio of net expenses to average net assetsa | 1.21 d | 1.21 | 1.21 | 1.21 | 1.21 | 1.20 |
Ratio of net investment income/(loss) to average net assetsa | 1.68 d | 2.12 | 1.30 | 0.49 | 1.25 | 0.76 |
Portfolio turnover | 8 c | 23 | 43 | 39 | 178 | 53 |
See page 119 for notes to the Financial Highlights.
The accompanying notes are an integral part of the Financial Statements.
107
Institutional Class | |||||
6-Month Period Ended April 30, 2023 | Year Ended October 31, | ||||
2022 | 2021 | 2020 | 2019k | 2018 | |
(Unaudited) | |||||
$12.65 | $16.39 | $11.37 | $12.49 | $12.37 | $13.90 |
0.15 | 0.32 | 0.24 | 0.09 | 0.19 | 0.15 |
2.28 | (2.97) | 4.95 | (0.86) | 0.40 | (1.50) |
2.43 | (2.65) | 5.19 | (0.77) | 0.59 | (1.35) |
(0.15 ) | (0.27) | (0.17) | (0.35) | (0.09) | (0.08) |
(0.20 ) | (0.82) | — | — | (0.38) | (0.10) |
(0.35 ) | (1.09) | (0.17) | (0.35) | (0.47) | (0.18) |
14.73 | 12.65 | 16.39 | 11.37 | 12.49 | 12.37 |
$175,143 | $93,640 | $49,419 | $25,716 | $25,758 | $50,358 |
19.47 %c | (17.00)% | 45.87% | (6.48)% | 5.25% | (9.83)% |
1.05 d | 1.19 | 1.25 | 1.45 | 1.32 | 1.15 |
0.96 d | 0.96 | 0.96 | 0.96 | 0.96 | 0.95 |
2.20 d | 2.32 | 1.53 | 0.76 | 1.60 | 1.05 |
8 c | 23 | 43 | 39 | 178 | 53 |
Investor Class | |||||
6-Month Period Ended April 30, 2023 | Year Ended October 31, | ||||
2022 | 2021 | 2020 | 2019k | 2018 | |
(Unaudited) | |||||
$12.58 | $16.32 | $11.34 | $12.45 | $12.34 | $13.86 |
0.15 | 0.23 | 0.18 | 0.04 | 0.13 | 0.10 |
2.25 | (2.92) | 4.93 | (0.84) | 0.40 | (1.48) |
2.40 | (2.69) | 5.11 | (0.80) | 0.53 | (1.38) |
(0.11 ) | (0.23) | (0.13) | (0.31) | (0.04) | (0.04) |
(0.20 ) | (0.82) | — | — | (0.38) | (0.10) |
(0.31 ) | (1.05) | (0.13) | (0.31) | (0.42) | (0.14) |
14.67 | 12.58 | 16.32 | 11.34 | 12.45 | 12.34 |
$4,957 | $1,140 | $1,962 | $398 | $428 | $619 |
19.24 %c | (17.29)% | 45.25% | (6.76)% | 4.70% | (10.08)% |
1.41 d | 1.55 | 1.61 | 1.82 | 1.69 | 1.52 |
1.32 d | 1.32 | 1.32 | 1.33 | 1.33 | 1.32 |
2.19 d | 1.66 | 1.16 | 0.36 | 1.10 | 0.73 |
8 c | 23 | 43 | 39 | 178 | 53 |
108
Harbor Funds Financial Highlights—Continued
Selected Data for a Share Outstanding for the Periods Presented
HARBOR LARGE CAP VALUE FUND | ||||||
Retirement Class | ||||||
6-Month Period Ended April 30, 2023 | Year Ended October 31, | |||||
2022 | 2021 | 2020 | 2019 | 2018 | ||
(Unaudited) | ||||||
Net asset value beginning of period | $19.50 | $23.23 | $17.11 | $16.33 | $14.37 | $14.87 |
Income from Investment Operations | ||||||
Net investment income/(loss)a,e | 0.15 | 0.26 | 0.19 | 0.18 | 0.18 | 0.17 |
Net realized and unrealized gain/(loss) on investments | 0.60 | (3.16) | 6.62 | 0.76 | 2.17 | (0.13) |
Total from investment operations | 0.75 | (2.90) | 6.81 | 0.94 | 2.35 | 0.04 |
Less Distributions | ||||||
Dividends from net investment income | (0.20 ) | (0.22) | (0.17) | (0.16) | (0.16) | (0.13) |
Distributions from net realized capital gains | (0.72 ) | (0.61) | (0.52) | — | (0.23) | (0.41) |
Total distributions | (0.92 ) | (0.83) | (0.69) | (0.16) | (0.39) | (0.54) |
Net asset value end of period | 19.33 | 19.50 | 23.23 | 17.11 | 16.33 | 14.37 |
Net assets end of period (000s) | $1,169,000 | $1,326,142 | $1,472,349 | $655,562 | $457,908 | $313,721 |
Ratios and Supplemental Data (%) | ||||||
Total returnb | 4.08 %c | (12.82)% | 40.62% | 5.80% | 16.92% | 0.18% |
Ratio of total expenses to average net assets^ | 0.65 d | 0.64 | 0.64 | 0.64 | 0.65 | 0.64 |
Ratio of net expenses to average net assetsa | 0.61 d | 0.61 | 0.61 | 0.61 | 0.61 | 0.60 |
Ratio of net investment income/(loss) to average net assetsa | 1.51 d | 1.26 | 0.90 | 1.08 | 1.19 | 1.12 |
Portfolio turnover | 3 c | 24 | 13 | 26 | 11 | 15 |
Administrative Class | ||||||
6-Month Period Ended April 30, 2023 | Year Ended October 31, | |||||
2022 | 2021 | 2020 | 2019 | 2018 | ||
(Unaudited) | ||||||
Net asset value beginning of period | $19.50 | $23.21 | $17.11 | $16.33 | $14.36 | $14.84 |
Income from Investment Operations | ||||||
Net investment income/(loss)a,e | 0.11 | 0.19 | 0.13 | 0.13 | 0.14 | 0.13 |
Net realized and unrealized gain/(loss) on investments | 0.60 | (3.14) | 6.59 | 0.75 | 2.17 | (0.15) |
Total from investment operations | 0.71 | (2.95) | 6.72 | 0.88 | 2.31 | (0.02) |
Less Distributions | ||||||
Dividends from net investment income | (0.15 ) | (0.15) | (0.10) | (0.10) | (0.11) | (0.05) |
Distributions from net realized capital gains | (0.72 ) | (0.61) | (0.52) | — | (0.23) | (0.41) |
Total distributions | (0.87 ) | (0.76) | (0.62) | (0.10) | (0.34) | (0.46) |
Net asset value end of period | 19.34 | 19.50 | 23.21 | 17.11 | 16.33 | 14.36 |
Net assets end of period (000s) | $3,005 | $3,228 | $3,941 | $11,502 | $12,195 | $15,460 |
Ratios and Supplemental Data (%) | ||||||
Total returnb | 3.87 %c | (13.06)% | 40.05% | 5.42% | 16.60% | (0.23)% |
Ratio of total expenses to average net assets^ | 0.98 d | 0.97 | 0.97 | 0.97 | 0.98 | 0.97 |
Ratio of net expenses to average net assetsa | 0.94 d | 0.94 | 0.94 | 0.94 | 0.94 | 0.93 |
Ratio of net investment income/(loss) to average net assetsa | 1.18 d | 0.92 | 0.64 | 0.78 | 0.91 | 0.84 |
Portfolio turnover | 3 c | 24 | 13 | 26 | 11 | 15 |
See page 119 for notes to the Financial Highlights.
The accompanying notes are an integral part of the Financial Statements.
109
Institutional Class | |||||
6-Month Period Ended April 30, 2023 | Year Ended October 31, | ||||
2022 | 2021 | 2020 | 2019 | 2018 | |
(Unaudited) | |||||
$19.50 | $23.23 | $17.11 | $16.33 | $14.37 | $14.87 |
0.14 | 0.25 | 0.18 | 0.17 | 0.17 | 0.16 |
0.60 | (3.17) | 6.61 | 0.76 | 2.17 | (0.13) |
0.74 | (2.92) | 6.79 | 0.93 | 2.34 | 0.03 |
(0.19 ) | (0.20) | (0.15) | (0.15) | (0.15) | (0.12) |
(0.72 ) | (0.61) | (0.52) | — | (0.23) | (0.41) |
(0.91 ) | (0.81) | (0.67) | (0.15) | (0.38) | (0.53) |
19.33 | 19.50 | 23.23 | 17.11 | 16.33 | 14.37 |
$678,087 | $751,476 | $1,049,830 | $880,755 | $761,262 | $605,040 |
4.01 %c | (12.90)% | 40.52% | 5.72% | 16.83% | 0.11% |
0.73 d | 0.72 | 0.72 | 0.72 | 0.73 | 0.72 |
0.69 d | 0.69 | 0.69 | 0.69 | 0.69 | 0.68 |
1.43 d | 1.17 | 0.84 | 1.02 | 1.12 | 1.05 |
3 c | 24 | 13 | 26 | 11 | 15 |
Investor Class | |||||
6-Month Period Ended April 30, 2023 | Year Ended October 31, | ||||
2022 | 2021 | 2020 | 2019 | 2018 | |
(Unaudited) | |||||
$19.72 | $23.46 | $17.28 | $16.48 | $14.49 | $14.99 |
0.10 | 0.17 | 0.10 | 0.11 | 0.12 | 0.11 |
0.61 | (3.18) | 6.68 | 0.76 | 2.19 | (0.14) |
0.71 | (3.01) | 6.78 | 0.87 | 2.31 | (0.03) |
(0.14 ) | (0.12) | (0.08) | (0.07) | (0.09) | (0.06) |
(0.72 ) | (0.61) | (0.52) | — | (0.23) | (0.41) |
(0.86 ) | (0.73) | (0.60) | (0.07) | (0.32) | (0.47) |
19.57 | 19.72 | 23.46 | 17.28 | 16.48 | 14.49 |
$26,186 | $26,880 | $31,192 | $23,527 | $35,622 | $45,548 |
3.78 %c | (13.15)% | 39.96% | 5.32% | 16.39% | (0.27)% |
1.09 d | 1.08 | 1.08 | 1.09 | 1.10 | 1.09 |
1.05 d | 1.05 | 1.05 | 1.06 | 1.06 | 1.05 |
1.07 d | 0.81 | 0.47 | 0.67 | 0.79 | 0.70 |
3 c | 24 | 13 | 26 | 11 | 15 |
110
Harbor Funds Financial Highlights—Continued
Selected Data for a Share Outstanding for the Periods Presented
HARBOR MID CAP FUND | ||||||||
Retirement Class | Institutional Class | |||||||
6-Month Period Ended April 30, 2023 | Year Ended October 31, | 6-Month Period Ended April 30, 2023 | Year Ended October 31, | |||||
2022 | 2021 | 2020f | 2022 | 2021 | 2020f | |||
(Unaudited) | (Unaudited) | |||||||
Net asset value beginning of period | $12.45 | $14.52 | $10.57 | $10.00 | $12.44 | $14.51 | $10.56 | $10.00 |
Income from Investment Operations | ||||||||
Net investment income/(loss)a,e | 0.05 | 0.09 | 0.05 | 0.05 | 0.05 | 0.09 | 0.04 | 0.04 |
Net realized and unrealized gain/(loss) on investments | 0.28 | (1.84) | 3.93 | 0.53 | 0.28 | (1.85) | 3.93 | 0.53 |
Total from investment operations | 0.33 | (1.75) | 3.98 | 0.58 | 0.33 | (1.76) | 3.97 | 0.57 |
Less Distributions | ||||||||
Dividends from net investment income | (0.07 ) | (0.05) | (0.03) | (0.01) | (0.06 ) | (0.04) | (0.02) | (0.01) |
Distributions from net realized capital gains | (0.34 ) | (0.27) | — | — | (0.34 ) | (0.27) | — | — |
Total distributions | (0.41 ) | (0.32) | (0.03) | (0.01) | (0.40 ) | (0.31) | (0.02) | (0.01) |
Net asset value end of period | 12.37 | 12.45 | 14.52 | 10.57 | 12.37 | 12.44 | 14.51 | 10.56 |
Net assets end of period (000s) | $65,801 | $67,079 | $37,135 | $5,148 | $23,054 | $21,105 | $23,710 | $5,411 |
Ratios and Supplemental Data (%) | ||||||||
Total returnb | 2.78 %c | (12.36)% | 37.61% | 5.86%c | 2.76 %c | (12.43)% | 37.54% | 5.75%c |
Ratio of total expenses to average net assets^ | 0.87 d | 0.92 | 0.93 | 2.28d | 0.95 d | 1.00 | 1.01 | 2.36d |
Ratio of net expenses to average net assetsa | 0.80 d | 0.80 | 0.80 | 0.80d | 0.88 d | 0.88 | 0.88 | 0.88d |
Ratio of net investment income/(loss) to average net assetsa | 0.88 d | 0.65 | 0.40 | 0.54d | 0.79 d | 0.64 | 0.27 | 0.46d |
Portfolio turnover | 8 c | 42 | 11 | 9c | 8 c | 42 | 11 | 9c |
See page 119 for notes to the Financial Highlights.
The accompanying notes are an integral part of the Financial Statements.
111
Investor Class | |||
6-Month Period Ended April 30, 2023 | Year Ended October 31, | ||
2022 | 2021 | 2020f | |
(Unaudited) | |||
$12.37 | $14.44 | $10.54 | $10.00 |
0.03 | 0.04 | (0.01) | 0.01 |
0.27 | (1.84) | 3.91 | 0.53 |
0.30 | (1.80) | 3.90 | 0.54 |
(0.01 ) | —* | —* | —* |
(0.34 ) | (0.27) | — | — |
(0.35 ) | (0.27) | —* | —* |
12.32 | 12.37 | 14.44 | 10.54 |
$841 | $834 | $949 | $455 |
2.55 %c | (12.72)% | 37.00% | 5.42%c |
1.31 d | 1.36 | 1.38 | 2.73d |
1.24 d | 1.24 | 1.24 | 1.25d |
0.43 d | 0.28 | (0.06) | 0.07d |
8 c | 42 | 11 | 9c |
112
Harbor Funds Financial Highlights—Continued
Selected Data for a Share Outstanding for the Periods Presented
HARBOR MID CAP VALUE FUND | ||||||
Retirement Class | ||||||
6-Month Period Ended April 30, 2023 | Year Ended October 31, | |||||
2022 | 2021 | 2020 | 2019 | 2018 | ||
(Unaudited) | ||||||
Net asset value beginning of period | $23.93 | $24.97 | $16.83 | $20.82 | $21.39 | $23.33 |
Income from Investment Operations | ||||||
Net investment income/(loss)a,e | 0.25 | 0.49 | 0.42 | 0.43 | 0.48 | 0.50 |
Net realized and unrealized gain/(loss) on investments | 0.14 | (1.18) | 8.21 | (3.73) | 0.47 | (1.52) |
Total from investment operations | 0.39 | (0.69) | 8.63 | (3.30) | 0.95 | (1.02) |
Less Distributions | ||||||
Dividends from net investment income | (0.42 ) | (0.35) | (0.49) | (0.54) | (0.37) | (0.33) |
Distributions from net realized capital gains | (1.45 ) | — | — | (0.15) | (1.15) | (0.59) |
Total distributions | (1.87 ) | (0.35) | (0.49) | (0.69) | (1.52) | (0.92) |
Net asset value end of period | 22.45 | 23.93 | 24.97 | 16.83 | 20.82 | 21.39 |
Net assets end of period (000s) | $17,373 | $43,591 | $56,156 | $29,897 | $102,945 | $103,552 |
Ratios and Supplemental Data (%) | ||||||
Total returnb | 1.77 %c | (2.80)% | 51.99% | (16.55)% | 5.53% | (4.75)% |
Ratio of total expenses to average net assets^ | 0.82 d | 0.81 | 0.81 | 0.82 | 0.80 | 0.79 |
Ratio of net expenses to average net assetsa | 0.77 d | 0.77 | 0.78 | 0.80 | 0.77 | 0.76 |
Ratio of net investment income/(loss) to average net assetsa | 2.12 d | 2.00 | 1.78 | 2.39 | 2.39 | 2.15 |
Portfolio turnover | 5 c | 9 | 18 | 4 | 11 | 24 |
Administrative Class | ||||||
6-Month Period Ended April 30, 2023 | Year Ended October 31, | |||||
2022 | 2021 | 2020 | 2019 | 2018 | ||
(Unaudited) | ||||||
Net asset value beginning of period | $24.20 | $25.24 | $16.98 | $20.98 | $21.52 | $23.47 |
Income from Investment Operations | ||||||
Net investment income/(loss)a,e | 0.21 | 0.41 | 0.34 | 0.36 | 0.42 | 0.43 |
Net realized and unrealized gain/(loss) on investments | 0.14 | (1.20) | 8.31 | (3.77) | 0.48 | (1.54) |
Total from investment operations | 0.35 | (0.79) | 8.65 | (3.41) | 0.90 | (1.11) |
Less Distributions | ||||||
Dividends from net investment income | (0.33 ) | (0.25) | (0.39) | (0.44) | (0.29) | (0.25) |
Distributions from net realized capital gains | (1.45 ) | — | — | (0.15) | (1.15) | (0.59) |
Total distributions | (1.78 ) | (0.25) | (0.39) | (0.59) | (1.44) | (0.84) |
Net asset value end of period | 22.77 | 24.20 | 25.24 | 16.98 | 20.98 | 21.52 |
Net assets end of period (000s) | $3,225 | $3,291 | $3,828 | $4,945 | $18,508 | $42,557 |
Ratios and Supplemental Data (%) | ||||||
Total returnb | 1.57 %c | (3.14)% | 51.53% | (16.85)% | 5.19% | (5.06)% |
Ratio of total expenses to average net assets^ | 1.15 d | 1.14 | 1.14 | 1.15 | 1.13 | 1.12 |
Ratio of net expenses to average net assetsa | 1.10 d | 1.10 | 1.11 | 1.13 | 1.10 | 1.08 |
Ratio of net investment income/(loss) to average net assetsa | 1.75 d | 1.67 | 1.46 | 1.98 | 2.08 | 1.83 |
Portfolio turnover | 5 c | 9 | 18 | 4 | 11 | 24 |
See page 119 for notes to the Financial Highlights.
The accompanying notes are an integral part of the Financial Statements.
113
Institutional Class | |||||
6-Month Period Ended April 30, 2023 | Year Ended October 31, | ||||
2022 | 2021 | 2020 | 2019 | 2018 | |
(Unaudited) | |||||
$23.93 | $24.97 | $16.83 | $20.82 | $21.38 | $23.33 |
0.23 | 0.47 | 0.40 | 0.40 | 0.47 | 0.49 |
0.15 | (1.18) | 8.21 | (3.73) | 0.47 | (1.54) |
0.38 | (0.71) | 8.61 | (3.33) | 0.94 | (1.05) |
(0.40 ) | (0.33) | (0.47) | (0.51) | (0.35) | (0.31) |
(1.45 ) | — | — | (0.15) | (1.15) | (0.59) |
(1.85 ) | (0.33) | (0.47) | (0.66) | (1.50) | (0.90) |
22.46 | 23.93 | 24.97 | 16.83 | 20.82 | 21.38 |
$227,122 | $242,004 | $355,431 | $277,767 | $520,629 | $714,309 |
1.71 %c | (2.88)% | 51.87% | (16.64)% | 5.48% | (4.85)% |
0.90 d | 0.89 | 0.89 | 0.90 | 0.88 | 0.87 |
0.85 d | 0.85 | 0.86 | 0.88 | 0.85 | 0.83 |
2.00 d | 1.93 | 1.71 | 2.25 | 2.33 | 2.09 |
5 c | 9 | 18 | 4 | 11 | 24 |
Investor Class | |||||
6-Month Period Ended April 30, 2023 | Year Ended October 31, | ||||
2022 | 2021 | 2020 | 2019 | 2018 | |
(Unaudited) | |||||
$23.90 | $24.93 | $16.80 | $20.78 | $21.31 | $23.23 |
0.19 | 0.39 | 0.32 | 0.34 | 0.39 | 0.40 |
0.14 | (1.18) | 8.20 | (3.74) | 0.48 | (1.53) |
0.33 | (0.79) | 8.52 | (3.40) | 0.87 | (1.13) |
(0.30 ) | (0.24) | (0.39) | (0.43) | (0.25) | (0.20) |
(1.45 ) | — | — | (0.15) | (1.15) | (0.59) |
(1.75 ) | (0.24) | (0.39) | (0.58) | (1.40) | (0.79) |
22.48 | 23.90 | 24.93 | 16.80 | 20.78 | 21.31 |
$27,088 | $28,355 | $32,097 | $26,785 | $58,928 | $82,539 |
1.52 %c | (3.20)% | 51.26% | (16.94)% | 5.08% | (5.20)% |
1.26 d | 1.25 | 1.25 | 1.27 | 1.25 | 1.24 |
1.21 d | 1.21 | 1.22 | 1.25 | 1.22 | 1.20 |
1.64 d | 1.57 | 1.36 | 1.89 | 1.95 | 1.71 |
5 c | 9 | 18 | 4 | 11 | 24 |
114
Harbor Funds Financial Highlights—Continued
Selected Data for a Share Outstanding for the Periods Presented
HARBOR SMALL CAP GROWTH FUND | ||||||
Retirement Class | ||||||
6-Month Period Ended April 30, 2023 | Year Ended October 31, | |||||
2022 | 2021 | 2020 | 2019 | 2018 | ||
(Unaudited) | ||||||
Net asset value beginning of period | $11.78 | $19.95 | $15.91 | $13.18 | $14.39 | $15.08 |
Income from Investment Operations | ||||||
Net investment income/(loss)a,e | — | (0.01) | (0.07) | (0.04) | (0.01) | (0.05) |
Net realized and unrealized gain/(loss) on investments | 0.46 | (3.94) | 5.41 | 3.25 | 1.56 | 0.82 |
Total from investment operations | 0.46 | (3.95) | 5.34 | 3.21 | 1.55 | 0.77 |
Less Distributions | ||||||
Dividends from net investment income | — | — | — | — | — | — |
Distributions from net realized capital gains | (0.52 ) | (4.22) | (1.30) | (0.48) | (2.76) | (1.46) |
Total distributions | (0.52 ) | (4.22) | (1.30) | (0.48) | (2.76) | (1.46) |
Net asset value end of period | 11.72 | 11.78 | 19.95 | 15.91 | 13.18 | 14.39 |
Net assets end of period (000s) | $352,445 | $311,509 | $399,174 | $348,997 | $281,603 | $306,026 |
Ratios and Supplemental Data (%) | ||||||
Total returnb | 4.29 %c | (23.72)% | 34.40% | 24.93% | 16.23% | 5.11% |
Ratio of total expenses to average net assets^ | 0.80 d | 0.80 | 0.79 | 0.81 | 0.80 | 0.79 |
Ratio of net expenses to average net assetsa | 0.80 d | 0.79 | 0.78 | 0.80 | 0.80 | 0.79 |
Ratio of net investment income/(loss) to average net assetsa | 0.04 d | (0.11) | (0.37) | (0.27) | (0.12) | (0.33) |
Portfolio turnover | 44 c | 75 | 71 | 95 | 74 | 99 |
Administrative Class | ||||||
6-Month Period Ended April 30, 2023 | Year Ended October 31, | |||||
2022 | 2021 | 2020 | 2019 | 2018 | ||
(Unaudited) | ||||||
Net asset value beginning of period | $10.10 | $17.80 | $14.36 | $11.98 | $13.39 | $14.17 |
Income from Investment Operations | ||||||
Net investment income/(loss)a,e | (0.01 ) | (0.05) | (0.12) | (0.08) | (0.05) | (0.09) |
Net realized and unrealized gain/(loss) on investments | 0.39 | (3.43) | 4.86 | 2.94 | 1.40 | 0.77 |
Total from investment operations | 0.38 | (3.48) | 4.74 | 2.86 | 1.35 | 0.68 |
Less Distributions | ||||||
Dividends from net investment income | — | — | — | — | — | — |
Distributions from net realized capital gains | (0.52 ) | (4.22) | (1.30) | (0.48) | (2.76) | (1.46) |
Total distributions | (0.52 ) | (4.22) | (1.30) | (0.48) | (2.76) | (1.46) |
Net asset value end of period | 9.96 | 10.10 | 17.80 | 14.36 | 11.98 | 13.39 |
Net assets end of period (000s) | $612 | $648 | $965 | $866 | $395 | $769 |
Ratios and Supplemental Data (%) | ||||||
Total returnb | 4.21 %c | (24.00)% | 33.91% | 24.49% | 15.87% | 4.76% |
Ratio of total expenses to average net assets^ | 1.13 d | 1.13 | 1.12 | 1.14 | 1.13 | 1.12 |
Ratio of net expenses to average net assetsa | 1.13 d | 1.12 | 1.11 | 1.13 | 1.12 | 1.11 |
Ratio of net investment income/(loss) to average net assetsa | (0.29 )d | (0.44) | (0.69) | (0.62) | (0.44) | (0.65) |
Portfolio turnover | 44 c | 75 | 71 | 95 | 74 | 99 |
See page 119 for notes to the Financial Highlights.
The accompanying notes are an integral part of the Financial Statements.
115
Institutional Class | |||||
6-Month Period Ended April 30, 2023 | Year Ended October 31, | ||||
2022 | 2021 | 2020 | 2019 | 2018 | |
(Unaudited) | |||||
$11.68 | $19.84 | $15.84 | $13.13 | $14.35 | $15.06 |
— | (0.03) | (0.08) | (0.05) | (0.03) | (0.06) |
0.45 | (3.91) | 5.38 | 3.24 | 1.57 | 0.81 |
0.45 | (3.94) | 5.30 | 3.19 | 1.54 | 0.75 |
— | — | — | — | — | — |
(0.52 ) | (4.22) | (1.30) | (0.48) | (2.76) | (1.46) |
(0.52 ) | (4.22) | (1.30) | (0.48) | (2.76) | (1.46) |
11.61 | 11.68 | 19.84 | 15.84 | 13.13 | 14.35 |
$650,339 | $595,476 | $721,405 | $633,535 | $440,553 | $400,389 |
4.24 %c | (23.81)% | 34.29% | 24.87% | 16.18% | 4.97% |
0.88 d | 0.88 | 0.87 | 0.89 | 0.88 | 0.87 |
0.88 d | 0.87 | 0.86 | 0.88 | 0.87 | 0.86 |
(0.05 )d | (0.19) | (0.45) | (0.35) | (0.20) | (0.40) |
44 c | 75 | 71 | 95 | 74 | 99 |
Investor Class | |||||
6-Month Period Ended April 30, 2023 | Year Ended October 31, | ||||
2022 | 2021 | 2020 | 2019 | 2018 | |
(Unaudited) | |||||
$9.18 | $16.60 | $13.47 | $11.28 | $12.79 | $13.62 |
(0.02 ) | (0.06) | (0.13) | (0.08) | (0.06) | (0.11) |
0.35 | (3.14) | 4.56 | 2.75 | 1.31 | 0.74 |
0.33 | (3.20) | 4.43 | 2.67 | 1.25 | 0.63 |
— | — | — | — | — | — |
(0.52 ) | (4.22) | (1.30) | (0.48) | (2.76) | (1.46) |
(0.52 ) | (4.22) | (1.30) | (0.48) | (2.76) | (1.46) |
8.99 | 9.18 | 16.60 | 13.47 | 11.28 | 12.79 |
$7,903 | $7,031 | $8,648 | $6,811 | $6,670 | $7,076 |
4.09 %c | (24.05)% | 33.84% | 24.32% | 15.81% | 4.58% |
1.24 d | 1.24 | 1.23 | 1.26 | 1.25 | 1.24 |
1.24 d | 1.23 | 1.23 | 1.25 | 1.24 | 1.23 |
(0.40 )d | (0.55) | (0.81) | (0.71) | (0.57) | (0.77) |
44 c | 75 | 71 | 95 | 74 | 99 |
116
Harbor Funds Financial Highlights—Continued
Selected Data for a Share Outstanding for the Periods Presented
HARBOR SMALL CAP VALUE FUND | ||||||
Retirement Class | ||||||
6-Month Period Ended April 30, 2023 | Year Ended October 31, | |||||
2022 | 2021 | 2020 | 2019 | 2018 | ||
(Unaudited) | ||||||
Net asset value beginning of period | $39.47 | $45.11 | $31.65 | $33.55 | $33.60 | $36.16 |
Income from Investment Operations | ||||||
Net investment income/(loss)a,e | 0.14 | 0.18 | 0.12 | 0.21 | 0.21 | 0.17 |
Net realized and unrealized gain/(loss) on investments | (0.11 ) | (3.38) | 13.54 | (1.59) | 2.84 | (1.98) |
Total from investment operations | 0.03 | (3.20) | 13.66 | (1.38) | 3.05 | (1.81) |
Less Distributions | ||||||
Dividends from net investment income | (0.15 ) | (0.08) | (0.20) | (0.20) | (0.15) | (0.06) |
Distributions from net realized capital gains | (2.48 ) | (2.36) | — | (0.32) | (2.95) | (0.69) |
Total distributions | (2.63 ) | (2.44) | (0.20) | (0.52) | (3.10) | (0.75) |
Net asset value end of period | 36.87 | 39.47 | 45.11 | 31.65 | 33.55 | 33.60 |
Net assets end of period (000s) | $610,392 | $600,143 | $599,016 | $300,473 | $230,861 | $155,036 |
Ratios and Supplemental Data (%) | ||||||
Total returnb | 0.42 %c | (7.16)% | 43.19% | (4.22)% | 10.98% | (5.18)% |
Ratio of total expenses to average net assets^ | 0.80 d | 0.80 | 0.79 | 0.80 | 0.80 | 0.79 |
Ratio of net expenses to average net assetsa | 0.80 d | 0.79 | 0.78 | 0.80 | 0.80 | 0.79 |
Ratio of net investment income/(loss) to average net assetsa | 0.74 d | 0.46 | 0.27 | 0.67 | 0.67 | 0.45 |
Portfolio turnover | 18 c | 15 | 17 | 17 | 27 | 22 |
Administrative Class | ||||||
6-Month Period Ended April 30, 2023 | Year Ended October 31, | |||||
2022 | 2021 | 2020 | 2019 | 2018 | ||
(Unaudited) | ||||||
Net asset value beginning of period | $39.06 | $44.72 | $31.41 | $33.30 | $33.36 | $35.97 |
Income from Investment Operations | ||||||
Net investment income/(loss)a,e | 0.08 | 0.05 | (0.02) | 0.10 | 0.11 | 0.06 |
Net realized and unrealized gain/(loss) on investments | (0.11 ) | (3.35) | 13.42 | (1.57) | 2.82 | (1.98) |
Total from investment operations | (0.03 ) | (3.30) | 13.40 | (1.47) | 2.93 | (1.92) |
Less Distributions | ||||||
Dividends from net investment income | (0.01 ) | — | (0.09) | (0.10) | (0.04) | — |
Distributions from net realized capital gains | (2.48 ) | (2.36) | — | (0.32) | (2.95) | (0.69) |
Total distributions | (2.49 ) | (2.36) | (0.09) | (0.42) | (2.99) | (0.69) |
Net asset value end of period | 36.54 | 39.06 | 44.72 | 31.41 | 33.30 | 33.36 |
Net assets end of period (000s) | $8,239 | $9,177 | $11,962 | $10,082 | $6,537 | $7,253 |
Ratios and Supplemental Data (%) | ||||||
Total returnb | 0.23 %c | (7.45)% | 42.72% | (4.54)% | 10.59% | (5.50)% |
Ratio of total expenses to average net assets^ | 1.13 d | 1.13 | 1.12 | 1.13 | 1.13 | 1.12 |
Ratio of net expenses to average net assetsa | 1.13 d | 1.12 | 1.11 | 1.13 | 1.12 | 1.11 |
Ratio of net investment income/(loss) to average net assetsa | 0.41 d | 0.13 | (0.04) | 0.32 | 0.35 | 0.16 |
Portfolio turnover | 18 c | 15 | 17 | 17 | 27 | 22 |
See page 119 for notes to the Financial Highlights.
The accompanying notes are an integral part of the Financial Statements.
117
Institutional Class | |||||
6-Month Period Ended April 30, 2023 | Year Ended October 31, | ||||
2022 | 2021 | 2020 | 2019 | 2018 | |
(Unaudited) | |||||
$39.44 | $45.07 | $31.63 | $33.53 | $33.57 | $36.14 |
0.13 | 0.15 | 0.09 | 0.18 | 0.19 | 0.15 |
(0.11 ) | (3.38) | 13.52 | (1.58) | 2.84 | (2.00) |
0.02 | (3.23) | 13.61 | (1.40) | 3.03 | (1.85) |
(0.12 ) | (0.04) | (0.17) | (0.18) | (0.12) | (0.03) |
(2.48 ) | (2.36) | — | (0.32) | (2.95) | (0.69) |
(2.60 ) | (2.40) | (0.17) | (0.50) | (3.07) | (0.72) |
36.86 | 39.44 | 45.07 | 31.63 | 33.53 | 33.57 |
$1,459,101 | $1,493,462 | $2,023,164 | $1,350,681 | $1,346,098 | $1,149,857 |
0.38 %c | (7.22)% | 43.11% | (4.33)% | 10.91% | (5.28)% |
0.88 d | 0.88 | 0.87 | 0.88 | 0.88 | 0.87 |
0.88 d | 0.87 | 0.86 | 0.88 | 0.87 | 0.86 |
0.66 d | 0.38 | 0.20 | 0.59 | 0.60 | 0.40 |
18 c | 15 | 17 | 17 | 27 | 22 |
Investor Class | |||||
6-Month Period Ended April 30, 2023 | Year Ended October 31, | ||||
2022 | 2021 | 2020 | 2019 | 2018 | |
(Unaudited) | |||||
$38.09 | $43.72 | $30.71 | $32.56 | $32.68 | $35.29 |
0.06 | 0.01 | (0.06) | 0.07 | 0.08 | 0.01 |
(0.10 ) | (3.28) | 13.12 | (1.55) | 2.75 | (1.93) |
(0.04 ) | (3.27) | 13.06 | (1.48) | 2.83 | (1.92) |
— | — | (0.05) | (0.05) | — | — |
(2.48 ) | (2.36) | — | (0.32) | (2.95) | (0.69) |
(2.48 ) | (2.36) | (0.05) | (0.37) | (2.95) | (0.69) |
35.57 | 38.09 | 43.72 | 30.71 | 32.56 | 32.68 |
$35,076 | $38,722 | $64,544 | $51,370 | $57,931 | $70,819 |
0.21 %c | (7.56)% | 42.56% | (4.67)% | 10.48% | (5.60)% |
1.24 d | 1.24 | 1.23 | 1.25 | 1.25 | 1.24 |
1.24 d | 1.23 | 1.23 | 1.25 | 1.24 | 1.23 |
0.30 d | 0.01 | (0.15) | 0.23 | 0.24 | 0.03 |
18 c | 15 | 17 | 17 | 27 | 22 |
118
Harbor Funds Financial Highlights—Continued
Selected Data for a Share Outstanding for the Periods Presented
* | Less than $0.01 |
^ | Percentage does not reflect reduction for credit balance arrangements (see the “Custodian” section in Note 2 of the accompanying Notes to Financial Statements) |
a | Reflects the Adviser’s waiver, if any, of its management fees and/or other operating expenses |
b | The total returns would have been lower had certain expenses not been waived during the periods shown. |
c | Unannualized |
d | Annualized |
e | Amounts are based on average daily shares outstanding during the period. |
f | For the period December 1, 2019 (inception) through October 31, 2020 |
g | Effective September 1, 2021, the Board of Trustees appointed Harbor Capital Advisors, Inc. to manage the Fund’s assets based upon model portfolios provided by multiple non-discretionary subadvisors. |
h | For the period June 1, 2018 (inception) through October 31, 2018 |
i | For the period March 1, 2019 (inception) through October 31, 2019 |
j | Effective August 22, 2018, the Board of Trustees appointed Marathon Asset Management Limited as subadvisor to Harbor International Fund. |
k | Effective May 23, 2019, the Board of Trustees appointed Cedar Street Asset Management LLC as subadvisor to Harbor International Small Cap Fund. |
l | Effective February 2, 2022, the Board of Trustees appointed Income Research+Management as the subadvisor to the Fund. |
m | Effective March 1, 2023, the Board of Trustees appointed BlueCove Limited as subadvisor to Harbor Convertible Securities Fund. |
n | The net investment income ratio includes dividends and interest income and related tax compliance fee and interest expense, from foreign tax reclaims and interest received by the Fund. The ratios of total expenses to average net assets include the tax compliance fee and related interest expense due to this receipt of foreign tax reclaims and interest income by the Fund. For the year ended October 31, 2020, the ratios of net expenses to average net assets including tax compliance fee for the Retirement Class, Institutional Class, Administrative Class, and Investor Class were 1.49%, 1.64%, 1.53%, and 1.98%, respectively. |
The accompanying notes are an integral part of the Financial Statements.
119
Harbor Funds
Notes to Financial Statements—April 30, 2023 (Unaudited)
Note 1—Organizational Matters
Harbor Funds (the “Trust”) is registered under the Investment Company Act of 1940, as amended (the “Investment Company Act”), as an open-end management investment company. As of April 30, 2023, the Trust consists of the following separate portfolios (individually or collectively referred to as a “Fund” or the “Funds,” respectively). Harbor Capital Advisors, Inc. (the “Adviser” or “Harbor Capital”) is the investment adviser for the Funds.
Harbor Capital Appreciation Fund | Harbor International Core Fund (formerly, Harbor Overseas Fund) |
Harbor Convertible Securities Fund | Harbor International Growth Fund |
Harbor Core Bond Fund | Harbor International Small Cap Fund |
Harbor Core Plus Fund | Harbor Large Cap Value Fund |
Harbor Disruptive Innovation Fund | Harbor Mid Cap Fund |
Harbor Diversified International All Cap Fund | Harbor Mid Cap Value Fund |
Harbor Global Leaders Fund | Harbor Small Cap Growth Fund |
Harbor International Fund | Harbor Small Cap Value Fund |
Effective March 1, 2023, Harbor Overseas Fund was renamed Harbor International Core Fund.
The Funds currently offer up to four classes of shares, designated as Retirement Class, Institutional Class, Administrative Class and Investor Class. The shares of each class represent an interest in the same portfolio of investments of the Funds and have equal rights with respect to voting, redemptions, dividends, and liquidations, except that: (i) certain expenses, subject to the approval of the Trust’s Board of Trustees (the “Board of Trustees”), may be applied differently to each class of shares in accordance with current regulations of the Securities and Exchange Commission (“SEC”) and the Internal Revenue Service; and (ii) shareholders of a class that bears distribution and service expenses under terms of a distribution plan have exclusive voting rights as to that distribution plan.
Note 2—Significant Accounting Policies
The following is a summary of significant accounting policies followed by the Trust in the preparation of its financial statements. Each Fund follows the investment company reporting requirements under U.S. Generally Accepted Accounting Principles (“U.S. GAAP”), which includes the accounting and reporting guidelines under Accounting Standards Codification (“ASC”) Topic 946, Financial Services-Investment Companies. The preparation of financial statements in accordance with U.S. GAAP requires management to make estimates and assumptions that affect the reported amounts and disclosures in the financial statements. Actual results may differ from those estimates.
Security Valuation
Investments are valued pursuant to valuation procedures approved by the Board of Trustees. The valuation procedures permit the Adviser to use a variety of valuation methodologies, consider a number of subjective factors, analyze applicable facts and circumstances and, in general, exercise judgment, when valuing Fund investments. The methodology used for a specific type of investment may vary based on the circumstances and relevant considerations, including available market data.
Equity securities (including common stock, preferred stock, and convertible preferred stock), exchange-traded funds and financial derivative instruments (such as rights and warrants) that are traded on a national securities exchange or system (except securities listed on the National Association of Securities Dealers Automated Quotation (“NASDAQ”) system and United Kingdom securities) are valued at the last sale price on a national exchange or system on which they are principally traded as of the valuation date. Securities listed on the NASDAQ system or a United Kingdom exchange are valued at the official closing price of those securities. In the case of securities for which there are no sales on the valuation day, (i) securities traded principally on a U.S. exchange, including NASDAQ, are valued at the mean (or average) of the closing bid and ask price; and (ii) securities traded principally on a foreign exchange, including United Kingdom securities, are valued at the official bid price determined as of the close of the primary exchange. Shares of open-end registered investment companies that are held by a Fund are valued at net asset value. To the extent these securities are actively traded and fair valuation adjustments are not applied, they are normally categorized as Level 1 in the fair value hierarchy. Equity securities traded on inactive markets or valued by reference to similar instruments are normally categorized as Level 2 in the fair value hierarchy. For more information on the fair value hierarchy, please refer to the Fair Value Measurements and Disclosures section.
120
Harbor Funds
Notes to Financial Statements—Continued
Note 2—Significant Accounting Policies—Continued
Debt securities (including corporate bonds, municipal bonds and notes, U.S. government agencies, U.S. treasury obligations, mortgage-backed and asset-backed securities, foreign government obligations, and convertible securities, other than short-term securities, with a remaining maturity of less than 60 days at the time of acquisition), are valued using evaluated prices furnished by a pricing vendor selected by the Board of Trustees. An evaluated price represents an assessment by the pricing vendor using various market inputs of what the pricing vendor believes is the fair value of a security at a particular point in time. The pricing vendor determines evaluated prices for debt securities that would be transacted at institutional-size quantities using inputs including, but not limited to, (i) recent transaction prices and dealer quotes, (ii) transaction prices for what the pricing vendor believes are securities with similar characteristics, (iii) the pricing vendor’s assessment of the risk inherent in the security taking into account criteria such as credit quality, payment history, liquidity and market conditions, and (iv) various correlations and relationships between security price movements and other factors, such as interest rate changes, which are recognized by institutional traders. In the case of asset-backed and mortgage-backed securities, the inputs used by the pricing vendor may also include information about cash flows, prepayment rates, default rates, delinquency and loss assumption, collateral characteristics, credit enhancements and other specific information about the particular offering. Because many debt securities trade infrequently, the pricing vendor will often not have current transaction price information available as an input in determining an evaluated price for a particular security. When current transaction price information is available, it is one input into the pricing vendor’s evaluation process, which means that the evaluated price supplied by the pricing vendor will frequently differ from that transaction price. Securities that use similar valuation techniques and inputs as described above are normally categorized as Level 2 in the fair value hierarchy.
Short-term securities with a remaining maturity of less than 60 days at the time of acquisition that are held by a Fund are valued at amortized cost to the extent amortized cost represents fair value. Such securities are normally categorized as Level 2 in the fair value hierarchy.
A Fund may also use fair value pricing if the value of some or all of the Fund’s securities have been materially affected by events occurring before the Fund’s pricing time but after the close of the primary markets or exchanges on which the security is traded. This most commonly occurs with foreign securities, but may occur with other securities as well. In such cases, the Fund may apply a fair value factor supplied by the pricing vendor to a foreign security’s market close value to reflect changes in value that may have occurred between the close of the primary market or exchange on which the security is traded and the Fund’s pricing time. That factor may be derived using observable inputs such as a comparison of the trading patterns of a foreign security to intraday trading in the U.S. markets that are highly correlated to the foreign security or other information that becomes available after the close of the foreign market on which the security principally traded. When fair value pricing is employed, the prices of securities used by a Fund to calculate its net asset value may differ from market quotations, official closing prices or evaluated prices for the same securities, which means that the Fund may value those securities higher or lower than another given fund that uses market quotations, official closing prices or evaluated prices supplied by a pricing vendor in its calculation of net asset value. Securities valued using observable inputs, such as those described above, are normally categorized as Level 2 of the fair value hierarchy.
When reliable market quotations or evaluated prices supplied by a pricing vendor are not readily available or are not believed to accurately reflect fair value, securities fair value determinations are made by the Adviser as designated by the Board of Trustees pursuant to the Investment Company Act. Fair value determinations for investments which incorporate significant unobservable inputs are normally categorized as Level 3 in the fair value hierarchy.
Fair Value Measurements and Disclosures
Various inputs may be used to determine the value of each Fund’s investments, which are summarized in three broad categories defined as Level 1, Level 2, and Level 3. The inputs or methodologies used for valuing investments are not necessarily indicative of the risk associated with investing in those investments. The assignment of an investment to Levels 1, 2, or 3 is based on the lowest level of significant inputs used to determine its fair value.
Level 1– | Quoted prices in active markets for identical securities. |
Level 2– | Other significant observable inputs (including quoted prices for similar securities, interest rates, prepayment speeds, credit risk, etc.). |
Level 3– | Significant unobservable inputs are used in situations where quoted prices or other observable inputs are not available or are deemed unreliable. Significant unobservable inputs may include each Fund’s own assumptions. |
121
Harbor Funds
Notes to Financial Statements—Continued
Note 2—Significant Accounting Policies—Continued
The categorization of investments into Levels 1, 2, or 3, and a summary of significant unobservable inputs used for Level 3 investments, when applicable, can be found at the end of each Fund’s Portfolio of Investments schedule.
Each Fund used observable inputs in its valuation methodologies whenever they were available and deemed reliable.
Investment Income
Dividends declared on portfolio securities are accrued on the ex-dividend date. Dividend information on certain foreign securities may not be available on ex-dividend date, therefore, such dividends will be recorded as soon as reliable information becomes available. Distributions from real estate investment trust securities are recorded as dividend income, and may be reclassified as capital gains and/or return of capital, based on the information reported by the issuer, when available. Interest income is accrued daily as earned. Discounts and premiums on fixed income securities are amortized over the life of the respective securities (except for premiums on certain callable debt securities that are amortized to the earliest call date) using the effective yield method. Paydown gains and losses on mortgage-backed and asset-backed securities are recognized as a component of interest income. Inflation adjustments to the face amount of inflation-indexed securities are included in interest income. Consent fees relating to corporate actions from investments held are recorded as income upon receipt.
Expenses
Expenses are charged directly to the Fund that incurred such expense whenever possible. With respect to expenses incurred by any two or more Harbor funds where amounts cannot be identified on a fund by fund basis, such expenses are generally allocated in proportion to the average net assets or the number of shareholders of each Fund.
Class Allocations
Income, common expenses and realized and unrealized gains/(losses) are determined at the Fund level and allocated daily to each class of shares based on the applicable net assets of the respective classes. Distribution and service fees, if any, and transfer agent fees are calculated daily at the class level based on the applicable net assets of each class and the expense rate(s) applicable to each class.
Securities Transactions
Securities transactions are accounted for on the trade date (the date the order to buy or sell is executed). Realized gains or losses on security transactions are determined on the basis of identified cost.
Distribution to Shareholders
Distributions on Fund shares are recorded on the ex-dividend date.
Taxes
Each Fund is treated as a separate entity for U.S. federal tax purposes. Each Fund’s policy is to meet the requirements of Subchapter M of the Internal Revenue Code of 1986, as amended (the “Internal Revenue Code”) applicable to regulated investment companies and to distribute to its shareholders all of its taxable income within the prescribed time. It is also the intention of each Fund to distribute an amount sufficient to avoid imposition of any excise tax under Section 4982 of the Internal Revenue Code. Therefore, no provision has been made for U.S. federal taxes on income, capital gains or unrealized appreciation of securities held or excise taxes on income and capital gains.
Each Fund may be subject to taxes imposed by foreign countries in which they invest. Such taxes are provided for in accordance with each Fund’s understanding of the applicable foreign country’s tax law and are generally based on income and/or capital gains earned or repatriated. Taxes are accrued and applied to net investment income, net realized gains and unrealized appreciation as such income and/or gains are earned. Certain Funds have filed for additional foreign tax reclaims related to prior years. These additional foreign tax reclaims are recorded as income when both the amount is known and significant contingencies or uncertainties regarding collectability are removed.
122
Harbor Funds
Notes to Financial Statements—Continued
Note 2—Significant Accounting Policies—Continued
Management has analyzed each Fund’s tax positions for all open tax years (in particular, U.S. federal, state and local income tax returns for the tax years ended October 31, 2019–2021), including all positions expected to be taken upon filing the 2022 tax return (if applicable), in all material jurisdictions where each Fund operates, and has concluded that no provision for income tax is required in the Funds’ financial statements. Each Fund will recognize interest and penalties, if any, related to unrecognized tax benefits as income tax expense in the Statement of Operations.
During 2020 and 2022, Harbor International Fund received payments, including interest, from member countries of the European Union based on foreign tax reclaims relating to amounts withheld on dividends received by the Fund during fiscal years October 31, 2009 through 2021. A portion of the foreign tax reclaims and interest received is due to the Internal Revenue Service (“IRS”), in the form of a tax compliance fee and that amount is based on the percentage of foreign tax credits previously passed through to the Fund’s shareholders. The estimated amount due to the IRS, including interest, is included in tax compliance fee payable in the Fund’s Statement of Asset and Liabilities. The Fund filed a closing agreement with the IRS related to the amount received in 2020 and in December 2022, the agreement was finalized and the related tax compliance fee, including interest, was paid to the IRS. The Fund will enter into another closing agreement with the IRS relating to the amounts received in 2022. The actual tax compliance fee and related interest due to the IRS will be determined based on the closing agreement with the IRS and may differ from estimates.
Custodian
Each Fund has credit balance arrangements with its custodian whereby positive balances in demand deposit accounts used by the transfer and shareholder servicing agent for clearing shareholder transactions in the Fund generate credits that are applied against gross custody expenses. Such custodial expense reductions, if any, are reflected on the respective Fund’s accompanying Statement of Operations.
Foreign Currency Translations
Purchases and sales of securities are translated into U.S. dollars at the current exchange rate on the respective dates of the transactions. Income and withholding taxes are translated at the prevailing exchange rate when accrued or incurred. The accounting records of the Funds are maintained in U.S. dollars. Investment securities and other assets and liabilities denominated in a foreign currency, when applicable, are translated into U.S. dollars based on the current exchange rates at period end.
Reported net realized gains and losses on foreign currency transactions, when applicable, represent net gains and losses from sales and maturities of foreign currency contracts, disposition of foreign currencies, currency gains and losses realized between the trade and settlement dates on securities transactions, and the difference between the amount of investment income accrued and tax reclaims receivable and the U.S. dollar amount actually received. The effects of changes in foreign currency exchange rates on investments in securities, when applicable, are included in the net realized and unrealized gain or loss on investments in the Statements of Operations.
Proceeds from Litigation
Each Fund may receive proceeds from shareholder litigation settlements involving current and/or previously held portfolio holdings. Any proceeds received from litigation involving portfolio holdings are reflected in the Statements of Operations in realized gain/(loss) if the security has been disposed of by a Fund, or in unrealized gain/(loss) if the security is still held by a Fund.
New Accounting Pronouncements
In March 2020, FASB issued ASU 2020-04, Reference Rate Reform: Facilitation of the Effects of Reference Rate Reform on Financial Reporting. The main objective of this ASU is to provide optional guidance to ease the potential accounting burden associated with transitioning away from the London Interbank Offered Rate (“LIBOR”) and other reference rates that are expected to be discontinued. The ASU was effective immediately upon release of the update on March 12, 2020, and can generally be applied through December 31, 2022. In March 2021, the administrator for LIBOR announced the extension of the publication of a majority of the USD LIBOR settings to June 30, 2023. In December 2022, FASB issued ASU 2022-06, which includes amendments to extend the duration of the LIBOR transition relief to December 31, 2024, after which entities
123
Harbor Funds
Notes to Financial Statements—Continued
Note 2—Significant Accounting Policies—Continued
will no longer be permitted to apply the reference rate reform relief. Management is continuously evaluating the potential effect a discontinuation of LIBOR could have on each Fund’s investments (if applicable) and has determined that it is unlikely the ASU’s adoption will have a material impact on the Fund’s financial statements.
Certain instruments held by the Funds rely in some fashion upon LIBOR. The United Kingdom’s Financial Conduct Authority, which regulates LIBOR, announced plans to ultimately phase out the use of LIBOR. Although the transition process away from LIBOR has become increasingly well-defined in advance of the anticipated discontinuation date, there remains uncertainty regarding the nature of any replacement rate, and any potential effects of the transition away from LIBOR on the Funds or on certain instruments in which the Funds invests can be difficult to ascertain. The transition process may involve, among other things, increased volatility or illiquidity in markets for instruments that currently rely on LIBOR and may result in a reduction in the value of certain instruments held by the Funds.
Inflation-Indexed Bonds
Inflation-indexed bonds are fixed-income securities whose principal value is periodically adjusted based on the rate of inflation. The interest rate on these bonds is generally fixed at issuance at a rate lower than typical bonds. Over the life of an inflation-indexed bond, however, interest will be paid based on a principal value that is adjusted for inflation. Any increase or decrease in the principal amount of an inflation-indexed bond will be included as interest income even though investors do not receive the principal until maturity.
During the period, Harbor Core Bond Fund and Harbor Core Plus Fund invested in inflation-indexed bonds.
Rights and Warrants
Rights represent a privilege offered to holders of record of issued securities to subscribe (usually on a pro rata basis) for additional securities of the same class, of a different class or of a different issuer. Warrants are contracts that generally give the holder the right, but not the obligation, to buy a stated number of shares of common stock at a specified price at any time during the life of the warrant. Rights and warrants are typically written by the issuer of the security underlying the right or warrant. Although some rights and warrants may be non-transferable, others may be traded over-the-counter or on an exchange.
A Fund may acquire rights or warrants in order to gain exposure to the underlying security without owning the security, including, for example, cases where the Fund hopes to lock in the price today of a security it may wish to purchase in the future. In order for a warrant to be profitable, the market price of the underlying security must rise sufficiently above the exercise price to cover any premium and transaction costs. The value of a right or warrant may not necessarily change with the value of the underlying securities. When a Fund acquires rights or warrants, it runs the risk that it will lose its entire investment in the rights or warrants, unless the Fund exercises the right or warrant, acquires the underlying securities, or enters into a closing transaction before expiration. Rights and warrants cease to have value if they are not exercised prior to their expiration date. If the price of the underlying security does not rise to an extent sufficient to cover any premium and transaction costs, the Fund will lose part or all of its investment. Any premiums or purchase price paid for rights or other warrants that expire are treated as realized losses. If a Fund enters into a closing sale transaction, it realizes a gain or loss, depending on whether the proceeds from the sale are greater or less than the cost of the rights or warrants.
Rights or warrants outstanding at the end of the period, if any, are disclosed at the end of each applicable Fund’s Portfolio of Investments and are included in “Purchased options” in the Statements of Assets and Liabilities. Realized gain/(loss) and unrealized appreciation/(depreciation) recognized during the period are included in “Purchased options” in the Statements of Operations.
During the period, Harbor Diversified International All Cap Fund, Harbor International Fund, Harbor International Core Fund, and Harbor International Small Cap Fund held rights/warrants as a result of their investments in underlying securities.
124
Harbor Funds
Notes to Financial Statements—Continued
Note 2—Significant Accounting Policies—Continued
Other Matters
The Funds in the normal course of business invest in financial instruments where the risk of potential loss exists due to changes in the market, economic, political and regulatory developments, as well as events such as war, terrorism or spread of infectious disease (market risk) or failure or inability of the counterparty to a transaction to perform (credit and counterparty risk). In addition, certain Funds invest primarily in foreign securities and as such are also subject to foreign currencies and foreign securities risks. Each Fund’s prospectus provides further details regarding the Fund’s principal risks.
Note 3—Investment Portfolio Transactions
Investment Portfolio Transactions
Purchases and sales of investments, other than short-term securities and U.S. government obligations, for each Fund for the period ended April 30, 2023 were as follows:
Purchases (000s) | Sales (000s) | |
Harbor Capital Appreciation Fund | $3,138,167 | $4,744,774* |
Harbor Convertible Securities Fund | 64,214 | 184,474 |
Harbor Core Bond Fund | 93,955 | 42,830 |
Harbor Core Plus Fund | 234,309 | 183,339 |
Harbor Disruptive Innovation Fund | 32,204 | 62,067 |
Harbor Diversified International All Cap Fund | 90,608 | 65,368 |
Harbor Global Leaders Fund | 4,295 | 12,040 |
Harbor International Fund | 219,107 | 415,784 |
Harbor International Core Fund | 112,113 | 60,137 |
Harbor International Growth Fund | 21,435 | 68,904 |
Harbor International Small Cap Fund | 112,297 | 14,333 |
Harbor Large Cap Value Fund | 54,392 | 346,132 |
Harbor Mid Cap Fund | 6,964 | 9,262 |
Harbor Mid Cap Value Fund | 14,588 | 59,363 |
Harbor Small Cap Growth Fund | 447,359 | 414,867 |
Harbor Small Cap Value Fund | 373,000 | 389,123 |
* | Sales for this Fund include $154,663 in connection with in-kind redemptions of the Fund’s capital shares. |
In-Kind Redemption Transactions
In accordance with the Trust’s prospectus, the Funds may distribute portfolio securities rather than cash as payment for a redemption of Fund shares. For financial reporting purposes, a Fund recognizes a gain or loss on the securities distributed related to the in-kind redemption. Such Fund-level gains and losses on in-kind redemptions are not taxable to shareholders. For the period ended April 30, 2023, and the year ended October 31, 2022, Harbor Capital Appreciation Fund realized gains of $87,729,000 and $1,270,427,000, respectively, upon the disposition of portfolio securities in connection with in-kind redemptions of the Fund’s shares.
Securities Lending
Each Fund may engage in securities lending, whereby a Fund lends its securities to financial institutions in order to increase its income. The Trust has engaged State Street Bank and Trust Company to act as its agent (the “Lending Agent”) with respect to the lending of portfolio securities of the Funds, pursuant to the terms and conditions of a Securities Lending Authorization Agreement (the “SLA Agreement”). Securities loans are required to be secured at all times during the term of the loan by collateral that is at least equal to the value of the loaned securities determined at the close of each business day. Collateral may consist of cash and/or securities issued by the U.S. Treasury. Any additional collateral that may be required to secure a loan is delivered to the Fund on the next business day. Cash collateral is recognized as the gross liability for securities loaned in the Statements of Assets and Liabilities. Non-cash collateral is not recorded in the Funds' Statements of Assets and Liabilities as it is held by the Lending Agent on behalf of the Funds, and the Funds do not have the ability to rehypothecate those securities. Cash collateral is invested in the State Street Navigator Securities Lending Government Money Market Portfolio (the “Navigator
125
Harbor Funds
Notes to Financial Statements—Continued
Note 3—Investment Portfolio Transactions—Continued
Portfolio”), a money market mutual fund that seeks to provide income while maintaining a stable net asset value of $1.00. There is no assurance that the Navigator Portfolio will maintain a stable net asset value and the Funds are subject to the risk of loss on the cash collateral invested. A portion of the earnings generated by the investment of the cash collateral is rebated to the borrower for the use of the cash collateral and these earnings (less any rebate) are then divided between the Fund and the Lending Agent, as a fee for its services, according to agreed-upon rates. The Lending Agent and a Fund will share in any shortfall in the rebate due to the borrower, according to agreed-upon rates.
In addition to receiving a fee from the borrower based on the demand for securities loaned and earning income on the investment of the cash collateral, a Fund receives substitute interest, dividends, or other amounts on the loaned securities, during the term of a loan. Net securities lending income is disclosed as such in the Statements of Operations and represents the income earned from the non-cash collateral and the investment of cash collateral, net of fee rebates paid to the borrower and net of fees paid to the Lending Agent.
Loans may be terminated at the option of the borrower or the Funds. Upon termination of the loan, the borrower will return to the Fund securities that are identical to the loaned securities. The Funds bear the risk of delay in recovery of, or loss of rights in, the securities loaned and the risk that the value of the collateral falls below the value of the securities on loan. Each Fund seeks to mitigate this risk through the SLA Agreement, which provides that in the event of default, the Lending Agent may apply the proceeds of the cash collateral from the loaned securities toward the purchase of replacement securities. If such proceeds are insufficient or the collateral is unavailable, the Lending Agent will purchase replacement securities at its sole expense, or if unable to do so, the Lending Agent may credit to the Fund’s account an amount equal to the fair value of the unreturned loaned securities. As the securities loans are subject to termination by the Fund or the borrower at any time, the remaining contractual maturities of each securities lending transaction is considered to be overnight and continuous.
The following table shows the Funds that engaged in securities lending during the period and summarizes the value of equity securities loaned and related cash and non-cash collateral as of April 30, 2023.
Value of Securities on Loan (000s) | Cash Collateral (000s) | Non-Cash Collateral (000s) | |
Harbor Diversified International All Cap Fund | $18,315 | $9,176 | $10,110 |
Harbor International Fund | 23,982 | 4,158 | 21,207 |
Harbor International Core Fund | 1,627 | — | 1,714 |
Harbor International Small Cap Fund | — | — | — |
Note 4—FEES AND OTHER Transactions with Affiliates
Investment Adviser
Harbor Capital is a wholly owned subsidiary of ORIX Corporation. Harbor Capital is the Funds’ investment adviser and is also responsible for administrative and other services.
126
Harbor Funds
Notes to Financial Statements—Continued
Note 4—FEES AND OTHER Transactions with Affiliates—Continued
Each Fund has a separate advisory agreement with Harbor Capital. The agreements provide for management fees based on an annual percentage rate of average daily net assets as follows:
Contractual Rate | Actual Rate | |
Harbor Capital Appreciation Fund | 0.60%a | 0.56% |
Harbor Convertible Securities Fund | 0.50b | 0.58 |
Harbor Core Bond Fund | 0.23 | 0.23 |
Harbor Core Plus Fund | 0.25 | 0.25 |
Harbor Disruptive Innovation Fund | 0.70 | 0.70 |
Harbor Diversified International All Cap Fund | 0.75 | 0.75 |
Harbor Global Leaders Fund | 0.75c | 0.70 |
Harbor International Fund | 0.75d | 0.75 |
Harbor International Core Fund | 0.75 | 0.75 |
Harbor International Growth Fund | 0.75 | 0.75 |
Harbor International Small Cap Fund | 0.85 | 0.85 |
Harbor Large Cap Value Fund | 0.60e | 0.60 |
Harbor Mid Cap Fund | 0.75 | 0.75 |
Harbor Mid Cap Value Fund | 0.75f | 0.75 |
Harbor Small Cap Growth Fund | 0.75 | 0.75 |
Harbor Small Cap Value Fund | 0.75 | 0.75 |
a | The Adviser has contractually agreed to reduce the management fee to 0.56% on assets between $5 billion and $10 billion, 0.54% on assets between $10 billion and $20 billion and 0.53% on assets over $20 billion through February 29, 2024. |
b | For the period November 1, 2022 through February 28, 2023, the management fee was 0.65%. In addition, the Adviser contractually agreed to reduce the management fee to 0.60% through February 28, 2023. Effective March 1, 2023, the contractual management fee was reduced to 0.50%. |
c | The Adviser has contractually agreed to waive 0.05% of its management fee through February 29, 2024. |
d | The management fee is 0.75% on assets up to $12 billion and 0.65% on assets in excess of $12 billion. |
e | The management fee rate is 0.60% on assets up to $4 billion and 0.55% on assets over $4 billion. |
f | The Adviser has contractually agreed to reduce the management fee to 0.70% on assets between $350 million and $1 billion and 0.65% on assets over $1 billion through February 29, 2024. |
Harbor Capital has from time to time voluntarily or contractually agreed not to impose a portion of its management fees and/or to bear a portion of the expenses incurred in the operation of certain Funds in order to limit Fund expenses. Such waivers, if any, are reflected on the accompanying Statements of Operations. Interest expense, if any, is excluded from contractual limitations. During the period, the following expense limitation agreements were in effect:
Retirement Class | Institutional Class | Administrative Class | Investor Class | Expense Limitation Agreement Expiration Date | |
Harbor Convertible Securities Fund1 | 0.63% | 0.71% | 0.96% | 1.07% | 02/29/2024 |
Harbor Core Bond Fund | 0.26 | 0.34 | N/A | N/A | 02/29/2024 |
Harbor Core Plus Fund | 0.30 | 0.38 | 0.63 | N/A | 02/29/2024 |
Harbor Disruptive Innovation Fund | 0.75 | 0.83 | 1.08 | 1.19 | 02/29/2024 |
Harbor Diversified International All Cap Fund | 0.72 | 0.80 | 1.05 | 1.16 | 02/29/2024 |
Harbor Global Leaders Fund | 0.78 | 0.86 | 1.11 | 1.22 | 02/29/2024 |
Harbor International Fund | 0.69 | 0.77 | 1.02 | 1.13 | 02/29/2024 |
Harbor International Core Fund | 0.77 | 0.85 | 1.10 | 1.21 | 02/29/2024 |
Harbor International Growth Fund | 0.77 | 0.85 | 1.10 | 1.21 | 02/29/2024 |
Harbor International Small Cap Fund | 0.88 | 0.96 | 1.21 | 1.32 | 02/29/2024 |
Harbor Large Cap Value Fund | 0.61 | 0.69 | 0.94 | 1.05 | 02/29/2024 |
Harbor Mid Cap Fund | 0.80 | 0.88 | 1.13 | 1.24 | 02/29/2024 |
Harbor Mid Cap Value Fund | 0.77 | 0.85 | 1.10 | 1.21 | 02/29/2024 |
1 | The operating expense limitation for the Fund was effective March 1, 2023. |
All expense limitation agreements include the transfer agent fee waiver discussed in the Transfer Agent note.
127
Harbor Funds
Notes to Financial Statements—Continued
Note 4—FEES AND OTHER Transactions with Affiliates—Continued
Distributor
Harbor Funds Distributors, Inc. (the “Distributor”), a wholly-owned subsidiary of Harbor Capital, is the distributor for Harbor Funds’ shares. Under the Trust’s current distribution plan pursuant to Rule 12b-1 under the Investment Company Act with respect to each Fund’s Administrative and Investor Class shares (each, a “12b-1 Plan”) as applicable, each Fund pays the Distributor compensation at the annual rate of 0.25% of the average daily net assets of its Administrative and Investor Class shares. Pursuant to each 12b-1 Plan, the Distributor is compensated for financing any activity that is primarily intended to result in the sale of Administrative and Investor Class shares of each Fund or for recordkeeping services or the servicing of shareholder accounts in a Administrative and Investor Class shares of each Fund. Such activities include, but are not limited to: printing of prospectuses and statements of additional information and reports for prospective shareholders (i.e., other than existing shareholders); preparation and distribution of advertising material and sales literature; expenses of organizing and conducting sales seminars; supplemental payments to dealers or other institutions such as asset-based sales charges, payments of recordkeeping fees under recordkeeping arrangements, or payments of service fees under shareholder service arrangements; and costs of administering each 12b-1 Plan.
Amounts payable by a Fund under each 12b-1 Plan need not be directly related to the expenses actually incurred by the Distributor on behalf of each Fund. Each 12b-1 Plan does not obligate each Fund to reimburse the Distributor for the actual expenses the Distributor may incur in fulfilling its obligations under each 12b-1 Plan. Thus, even if the Distributor’s actual expenses exceed the fee payable to the Distributor at any given time, each Fund will not be obligated to pay more than that fee. If the Distributor’s expenses are less than the fee it receives, the Distributor will retain the difference.
The fees attributable to each Fund’s respective class are shown on the accompanying Statements of Operations.
Transfer Agent
Harbor Services Group, Inc. (“Harbor Services Group”), a wholly-owned subsidiary of Harbor Capital, is the transfer and shareholder servicing agent for the Funds. The transfer agency and service agreement is reviewed and approved annually by the Board of Trustees and provides currently for compensation up to the following amounts per class of each Fund:
Transfer Agent Fees | |
Retirement Class | 0.02% of the average daily net assets of all Retirement Class shares |
Institutional Class | 0.10% of the average daily net assets of all Institutional Class shares |
Administrative Class | 0.10% of the average daily net assets of all Administrative Class shares |
Investor Class | 0.21% of the average daily net assets of all Investor Class shares |
Fees incurred for these transfer agent services are shown on each Fund’s Statement of Operations.
Affiliated Transactions
The Investment Company Act permits purchase and sale transactions among affiliated investment companies subject to an exemptive rule. Harbor Funds has adopted policies and procedures pursuant to such rule. During the period, the Funds did not enter into any transactions with any other Harbor fund.
Shareholders
As of April 30, 2023, Harbor Capital and its wholly owned subsidiaries collectively held 10% or more of the following shares of beneficial interest in each of the following Funds:
Number of Shares Owned by Harbor Capital and Subsidiaries | Percentage of Outstanding Shares | |||||
Retirement Class | Institutional Class | Administrative Class | Investor Class | Total | ||
Harbor Convertible Securities Fund | 999,388 | - | - | - | 999,388 | 25.0% |
Harbor International Small Cap Fund | 44,612 | 1,777,322 | 29,528 | 29,343 | 1,880,805 | 11.0 |
128
Harbor Funds
Notes to Financial Statements—Continued
Note 4—FEES AND OTHER Transactions with Affiliates—Continued
Independent Trustees
The fees and expenses of the Independent Trustees are included in “Trustees’ fees and expenses” on each Fund’s Statement of Operations.
The Board of Trustees has adopted a Deferred Compensation Plan for Independent Trustees (the “Plan”), which enables Trustees to elect to defer receipt of all or a portion of the annual compensation they are entitled to receive from the Trust. For purposes of determining the amount owed to a Trustee under the Plan, deferred amounts are treated as though they had been invested in shares of the Fund(s) selected by the Trustee. While not required to do so, each Fund makes an investment equal to the Trustee’s investment election. The deferred compensation liability and the offsetting deferred compensation investment asset are included as a component of “Accrued expenses – Trustees’ fees and expenses” and “Other assets”, respectively, in the Statements of Assets and Liabilities. Such amounts fluctuate with changes in the value of the selected Fund(s). The deferred compensation and related mark-to-market impact liability and an offsetting investment asset will remain on each Fund’s Statement of Assets and Liabilities until distributed in accordance with the Plan.
Indemnification
Under the Trust’s organizational documents, its officers and Trustees are indemnified against certain liabilities arising out of the performance of their duties to the Trust. In addition, in the normal course of business the Trust enters into contracts that provide general indemnities to other parties. The Trust’s maximum exposure under these arrangements is unknown as this would involve future claims that may be made against the Trust that have not yet occurred. The risk of material loss as a result of such indemnification claims is considered remote.
NOTE 5—TAX INFORMATION
The identified cost for federal income tax purposes of investments owned by each Fund and its respective gross unrealized appreciation and depreciation as of April 30, 2023 are as follows:
Identified Cost (000s) | Gross Unrealized | Net Unrealized Appreciation/ (Depreciation) (000s) | ||
Appreciation (000s) | (Depreciation) (000s) | |||
Harbor Capital Appreciation Fund* | $12,967,494 | $10,056,882 | $(567,536) | $9,489,346 |
Harbor Convertible Securities Fund* | 39,292 | 799 | (1,680) | (881) |
Harbor Core Bond Fund* | 107,831 | 1,462 | (4,363) | (2,901) |
Harbor Core Plus Fund* | 1,109,793 | 10,290 | (108,226) | (97,936) |
Harbor Disruptive Innovation Fund* | 86,618 | 6,524 | (13,790) | (7,266) |
Harbor Diversified International All Cap Fund* | 890,169 | 176,916 | (75,859) | 101,057 |
Harbor Global Leaders Fund | 58,144 | 16,553 | (8,563) | 7,990 |
Harbor International Fund* | 2,949,484 | 785,521 | (253,958) | 531,563 |
Harbor International Core Fund* | 145,878 | 12,119 | (5,622) | 6,497 |
Harbor International Growth Fund* | 293,972 | 111,420 | (32,170) | 79,250 |
Harbor International Small Cap Fund | 224,000 | 23,567 | (7,005) | 16,562 |
Harbor Large Cap Value Fund | 1,340,168 | 538,704 | (50,997) | 487,707 |
Harbor Mid Cap Fund | 85,177 | 8,106 | (5,408) | 2,698 |
Harbor Mid Cap Value Fund | 251,595 | 63,055 | (42,517) | 20,538 |
Harbor Small Cap Growth Fund* | 885,530 | 152,674 | (71,969) | 80,705 |
Harbor Small Cap Value Fund | 1,623,485 | 554,139 | (137,602) | 416,537 |
* | Capital loss carryforwards are available, which may reduce taxable income from future net realized gain on investments. |
Note 6—Derivatives
Each Fund’s derivative holdings do not qualify for hedge accounting treatment and as such are recorded at current fair value. For a discussion of risks related to these investments please refer to the descriptions of each type of derivative instrument in Note 2— Significant Accounting Policies.
129
Harbor Funds
Notes to Financial Statements—Continued
Note 6—Derivatives—Continued
Each Fund’s derivative instruments outstanding as of the period ended April 30, 2023, if any, as disclosed in the Portfolio of Investments, and the related amounts of net realized and changes in net unrealized gains and losses on derivative instruments during the period as disclosed in the Statement of Operations, are indicators of the volume of derivative activity for each Fund.
Derivative Instruments
As of April 30, 2023, the fair values of derivatives, by primary risk exposure, were reflected in the Statement of Assets and Liabilities as follows:
HARBOR DIVERSIFIED INTERNATIONAL ALL CAP FUND
Statement of Assets and Liabilities Caption | Equity Contracts (000s) |
Purchased options (rights/warrants) | $9 |
HARBOR INTERNATIONAL FUND
Statement of Assets and Liabilities Caption | Equity Contracts (000s) |
Purchased options (rights/warrants) | $101 |
HARBOR INTERNATIONAL SMALL CAP FUND
Statement of Assets and Liabilities Caption | Equity Contracts (000s) |
Purchased options (rights/warrants) | $127 |
Net realized gain/(loss) and the change in net unrealized appreciation / (depreciation) on derivatives, by primary risk exposure, for the period ended April 30, 2023, were:
HARBOR DIVERSIFIED INTERNATIONAL ALL CAP FUND
Change in net unrealized appreciation/(depreciation) on derivatives | Equity Contracts (000s) |
Purchased options (rights/warrants) | $9 |
HARBOR INTERNATIONAL FUND
Net realized gain/(loss) on derivatives | Equity Contracts (000s) |
Purchased options (rights/warrants) | $4 |
Change in net unrealized appreciation/(depreciation) on derivatives | Equity Contracts (000s) |
Purchased options (rights/warrants) | $64 |
HARBOR INTERNATIONAL SMALL CAP FUND
Net realized gain/(loss) on derivatives | Equity Contracts (000s) |
Purchased options (rights/warrants) | $127 |
130
Harbor Funds
Notes to Financial Statements—Continued
Note 7—Subsequent Events
At the meeting of the Board of Trustees held on May 22, 2023, the Board of Trustees voted to liquidate and dissolve Harbor Global Leaders Fund. The liquidation of the Fund is expected to occur on August 23, 2023. Additional information related to the liquidation can be found in the supplement to the Fund’s prospectus and statement of additional information as filed with the SEC on May 25, 2023.
Effective June 1, 2023, Harbor Capital contractually agreed to limit Harbor International Small Cap Fund’s operating expenses, excluding interest expense (if any), to 0.85%, 0.93%, 1.18%, and 1.29% for the Retirement Class, Institutional Class, Administrative Class, and Investor Class, respectively, through May 31, 2024.
Through the date the financial statements were issued, there were no other subsequent events or transactions that would have materially impacted the financial statements or related disclosures as presented herein.
131
Harbor Funds
Fees and Expenses Example (Unaudited)
Example
As a shareholder of a Fund, you incur two types of costs: (1) transaction costs, including redemption fees (if any) and (2) ongoing costs, including management fees, distribution and service (12b-1) fees (if any), and other Fund expenses. This example is intended to help you understand your ongoing costs (in dollars) of investing in a Fund and to compare these costs with the ongoing costs of investing in other mutual funds.
The example is based on an investment of $1,000 invested at the beginning of the period and held for the entire period November 1, 2022 through April 30, 2023.
Actual Expenses
The first line of the table below provides information about actual account values and actual expenses for each share class. You may use the information in the respective class line, together with the amount you invested, to estimate the expenses that you paid over the period. Simply divide your account value by $1,000 (for example, an $8,600 account value divided by $1,000 = 8.6), then multiply the result by the number in the first line of the respective class under the heading entitled “Expenses Paid During Period” to estimate the expenses you paid on your account during this period.
Hypothetical Example for Comparison Purposes
The second line of the table for each share class below provides information about hypothetical account values and hypothetical expenses based on the respective Fund/Class’s actual expense ratio and an assumed rate of return of 5% per year before expenses, which is not the respective Fund/Class’s actual return. The hypothetical account values and expenses may not be used to estimate the actual ending account balance or expenses you paid for the period. You may use this information to compare the ongoing costs of investing in a Fund to other funds. To do so, compare this 5% hypothetical example with the 5% hypothetical examples that appear in the shareholder reports of the other funds.
Please note that the expenses shown in the table are meant to highlight your ongoing costs only and do not reflect any transactional costs, such as redemption fees. Therefore, the second line of the table is useful in comparing ongoing costs only, and will not help you determine the relative total costs of owning different funds. In addition, if these transactional costs were included, your costs would have been higher.
Annualized Expense Ratios* | Expenses Paid During Period** | Beginning Account Value (November 1, 2022) | Ending Account Value (April 30, 2023) | |||||
Harbor Capital Appreciation Fund | ||||||||
Retirement Class | 0.60% | |||||||
Actual | $3.17 | $1,000 | $1,127.20 | |||||
Hypothetical (5% return) | 3.01 | 1,000 | 1,021.75 | |||||
Institutional Class | 0.68% | |||||||
Actual | $3.58 | $1,000 | $1,126.90 | |||||
Hypothetical (5% return) | 3.41 | 1,000 | 1,021.34 | |||||
Administrative Class | 0.93% | |||||||
Actual | $4.90 | $1,000 | $1,125.30 | |||||
Hypothetical (5% return) | 4.66 | 1,000 | 1,020.07 | |||||
Investor Class | 1.04% | |||||||
Actual | $5.48 | $1,000 | $1,124.80 | |||||
Hypothetical (5% return) | 5.21 | 1,000 | 1,019.51 |
132
Harbor Funds
Fees and Expenses Example—Continued
Annualized Expense Ratios* | Expenses Paid During Period** | Beginning Account Value (November 1, 2022) | Ending Account Value (April 30, 2023) | |||||
Harbor Convertible Securities Fund | ||||||||
Retirement Class | 0.72% | |||||||
Actual | $3.58 | $1,000 | $1,006.30 | |||||
Hypothetical (5% return) | 3.61 | 1,000 | 1,021.14 | |||||
Institutional Class | 0.80% | |||||||
Actual | $3.98 | $1,000 | $1,005.70 | |||||
Hypothetical (5% return) | 4.01 | 1,000 | 1,020.73 | |||||
Administrative Class | 0.97% | |||||||
Actual | $4.77 | $1,000 | $985.00 | |||||
Hypothetical (5% return) | 4.86 | 1,000 | 1,019.87 | |||||
Investor Class | 1.14% | |||||||
Actual | $5.66 | $1,000 | $1,003.20 | |||||
Hypothetical (5% return) | 5.71 | 1,000 | 1,019.00 | |||||
Harbor Core Bond Fund | ||||||||
Retirement Class | 0.26% | |||||||
Actual | $1.34 | $1,000 | $1,071.60 | |||||
Hypothetical (5% return) | 1.30 | 1,000 | 1,023.47 | |||||
Institutional Class | 0.34% | |||||||
Actual | $1.75 | $1,000 | $1,071.20 | |||||
Hypothetical (5% return) | 1.71 | 1,000 | 1,023.07 | |||||
Harbor Core Plus Fund | ||||||||
Retirement Class | 0.30% | |||||||
Actual | $1.55 | $1,000 | $1,076.40 | |||||
Hypothetical (5% return) | 1.50 | 1,000 | 1,023.27 | |||||
Institutional Class | 0.38% | |||||||
Actual | $1.95 | $1,000 | $1,076.00 | |||||
Hypothetical (5% return) | 1.91 | 1,000 | 1,022.86 | |||||
Administrative Class | 0.63% | |||||||
Actual | $3.24 | $1,000 | $1,074.60 | |||||
Hypothetical (5% return) | 3.16 | 1,000 | 1,021.59 | |||||
Harbor Disruptive Innovation Fund | ||||||||
Retirement Class | 0.75% | |||||||
Actual | $3.84 | $1,000 | $1,064.10 | |||||
Hypothetical (5% return) | 3.76 | 1,000 | 1,020.98 | |||||
Institutional Class | 0.83% | |||||||
Actual | $4.25 | $1,000 | $1,062.50 | |||||
Hypothetical (5% return) | 4.16 | 1,000 | 1,020.58 | |||||
Administrative Class | 1.08% | |||||||
Actual | $5.52 | $1,000 | $1,060.10 | |||||
Hypothetical (5% return) | 5.41 | 1,000 | 1,019.31 | |||||
Investor Class | 1.19% | |||||||
Actual | $6.08 | $1,000 | $1,061.20 | |||||
Hypothetical (5% return) | 5.96 | 1,000 | 1,018.75 |
133
Harbor Funds
Fees and Expenses Example—Continued
Annualized Expense Ratios* | Expenses Paid During Period** | Beginning Account Value (November 1, 2022) | Ending Account Value (April 30, 2023) | |||||
Harbor Diversified International All Cap Fund | ||||||||
Retirement Class | 0.72% | |||||||
Actual | $3.97 | $1,000 | $1,222.70 | |||||
Hypothetical (5% return) | 3.61 | 1,000 | 1,021.14 | |||||
Institutional Class | 0.80% | |||||||
Actual | $4.41 | $1,000 | $1,222.70 | |||||
Hypothetical (5% return) | 4.01 | 1,000 | 1,020.73 | |||||
Administrative Class | 1.05% | |||||||
Actual | $5.78 | $1,000 | $1,220.60 | |||||
Hypothetical (5% return) | 5.26 | 1,000 | 1,019.46 | |||||
Investor Class | 1.16% | |||||||
Actual | $6.38 | $1,000 | $1,220.20 | |||||
Hypothetical (5% return) | 5.81 | 1,000 | 1,018.90 | |||||
Harbor Global Leaders Fund | ||||||||
Retirement Class | 0.78% | |||||||
Actual | $4.08 | $1,000 | $1,109.40 | |||||
Hypothetical (5% return) | 3.91 | 1,000 | 1,020.83 | |||||
Institutional Class | 0.86% | |||||||
Actual | $4.49 | $1,000 | $1,108.70 | |||||
Hypothetical (5% return) | 4.31 | 1,000 | 1,020.42 | |||||
Administrative Class | 1.11% | |||||||
Actual | $5.80 | $1,000 | $1,107.80 | |||||
Hypothetical (5% return) | 5.56 | 1,000 | 1,019.15 | |||||
Investor Class | 1.22% | |||||||
Actual | $6.37 | $1,000 | $1,107.00 | |||||
Hypothetical (5% return) | 6.11 | 1,000 | 1,018.59 | |||||
Harbor International Fund | ||||||||
Retirement Class | 0.69% | |||||||
Actual | $3.85 | $1,000 | $1,254.20 | |||||
Hypothetical (5% return) | 3.46 | 1,000 | 1,021.29 | |||||
Institutional Class | 0.77% | |||||||
Actual | $4.30 | $1,000 | $1,253.50 | |||||
Hypothetical (5% return) | 3.86 | 1,000 | 1,020.88 | |||||
Administrative Class | 1.02% | |||||||
Actual | $5.70 | $1,000 | $1,252.10 | |||||
Hypothetical (5% return) | 5.11 | 1,000 | 1,019.61 | |||||
Investor Class | 1.13% | |||||||
Actual | $6.30 | $1,000 | $1,251.20 | |||||
Hypothetical (5% return) | 5.66 | 1,000 | 1,019.05 | |||||
Harbor International Core Fund | ||||||||
Retirement Class | 0.77% | |||||||
Actual | $4.09 | $1,000 | $1,142.10 | |||||
Hypothetical (5% return) | 3.86 | 1,000 | 1,020.88 | |||||
Institutional Class | 0.85% | |||||||
Actual | $4.52 | $1,000 | $1,141.80 | |||||
Hypothetical (5% return) | 4.26 | 1,000 | 1,020.47 | |||||
Investor Class | 1.21% | |||||||
Actual | $6.42 | $1,000 | $1,138.90 | |||||
Hypothetical (5% return) | 6.06 | 1,000 | 1,018.65 |
134
Harbor Funds
Fees and Expenses Example—Continued
Annualized Expense Ratios* | Expenses Paid During Period** | Beginning Account Value (November 1, 2022) | Ending Account Value (April 30, 2023) | |||||
Harbor International Growth Fund | ||||||||
Retirement Class | 0.77% | |||||||
Actual | $4.27 | $1,000 | $1,234.30 | |||||
Hypothetical (5% return) | 3.86 | 1,000 | 1,020.88 | |||||
Institutional Class | 0.85% | |||||||
Actual | $4.71 | $1,000 | $1,232.90 | |||||
Hypothetical (5% return) | 4.26 | 1,000 | 1,020.47 | |||||
Administrative Class | 1.10% | |||||||
Actual | $6.08 | $1,000 | $1,231.70 | |||||
Hypothetical (5% return) | 5.51 | 1,000 | 1,019.20 | |||||
Investor Class | 1.21% | |||||||
Actual | $6.69 | $1,000 | $1,230.60 | |||||
Hypothetical (5% return) | 6.06 | 1,000 | 1,018.65 | |||||
Harbor International Small Cap Fund | ||||||||
Retirement Class | 0.88% | |||||||
Actual | $4.79 | $1,000 | $1,195.40 | |||||
Hypothetical (5% return) | 4.41 | 1,000 | 1,020.32 | |||||
Institutional Class | 0.96% | |||||||
Actual | $5.22 | $1,000 | $1,194.70 | |||||
Hypothetical (5% return) | 4.81 | 1,000 | 1,019.92 | |||||
Administrative Class | 1.21% | |||||||
Actual | $6.58 | $1,000 | $1,193.80 | |||||
Hypothetical (5% return) | 6.06 | 1,000 | 1,018.65 | |||||
Investor Class | 1.32% | |||||||
Actual | $7.18 | $1,000 | $1,192.40 | |||||
Hypothetical (5% return) | 6.60 | 1,000 | 1,018.09 | |||||
Harbor Large Cap Value Fund | ||||||||
Retirement Class | 0.61% | |||||||
Actual | $3.08 | $1,000 | $1,040.80 | |||||
Hypothetical (5% return) | 3.06 | 1,000 | 1,021.69 | |||||
Institutional Class | 0.69% | |||||||
Actual | $3.49 | $1,000 | $1,040.10 | |||||
Hypothetical (5% return) | 3.46 | 1,000 | 1,021.29 | |||||
Administrative Class | 0.94% | |||||||
Actual | $4.75 | $1,000 | $1,038.70 | |||||
Hypothetical (5% return) | 4.71 | 1,000 | 1,020.02 | |||||
Investor Class | 1.05% | |||||||
Actual | $5.31 | $1,000 | $1,037.80 | |||||
Hypothetical (5% return) | 5.26 | 1,000 | 1,019.46 | |||||
Harbor Mid Cap Fund | ||||||||
Retirement Class | 0.80% | |||||||
Actual | $4.03 | $1,000 | $1,027.80 | |||||
Hypothetical (5% return) | 4.01 | 1,000 | 1,020.73 | |||||
Institutional Class | 0.88% | |||||||
Actual | $4.42 | $1,000 | $1,027.60 | |||||
Hypothetical (5% return) | 4.41 | 1,000 | 1,020.32 | |||||
Investor Class | 1.24% | |||||||
Actual | $6.23 | $1,000 | $1,025.50 | |||||
Hypothetical (5% return) | 6.21 | 1,000 | 1,018.49 |
135
Harbor Funds
Fees and Expenses Example—Continued
Annualized Expense Ratios* | Expenses Paid During Period** | Beginning Account Value (November 1, 2022) | Ending Account Value (April 30, 2023) | |||||
Harbor Mid Cap Value Fund | ||||||||
Retirement Class | 0.77% | |||||||
Actual | $3.85 | $1,000 | $1,017.70 | |||||
Hypothetical (5% return) | 3.86 | 1,000 | 1,020.88 | |||||
Institutional Class | 0.85% | |||||||
Actual | $4.26 | $1,000 | $1,017.10 | |||||
Hypothetical (5% return) | 4.26 | 1,000 | 1,020.47 | |||||
Administrative Class | 1.10% | |||||||
Actual | $5.49 | $1,000 | $1,015.70 | |||||
Hypothetical (5% return) | 5.51 | 1,000 | 1,019.20 | |||||
Investor Class | 1.21% | |||||||
Actual | $6.05 | $1,000 | $1,015.20 | |||||
Hypothetical (5% return) | 6.06 | 1,000 | 1,018.65 | |||||
Harbor Small Cap Growth Fund | ||||||||
Retirement Class | 0.80% | |||||||
Actual | $4.06 | $1,000 | $1,042.90 | |||||
Hypothetical (5% return) | 4.01 | 1,000 | 1,020.73 | |||||
Institutional Class | 0.88% | |||||||
Actual | $4.45 | $1,000 | $1,042.40 | |||||
Hypothetical (5% return) | 4.41 | 1,000 | 1,020.32 | |||||
Administrative Class | 1.13% | |||||||
Actual | $5.72 | $1,000 | $1,042.10 | |||||
Hypothetical (5% return) | 5.66 | 1,000 | 1,019.05 | |||||
Investor Class | 1.24% | |||||||
Actual | $6.28 | $1,000 | $1,040.90 | |||||
Hypothetical (5% return) | 6.21 | 1,000 | 1,018.49 | |||||
Harbor Small Cap Value Fund | ||||||||
Retirement Class | 0.80% | |||||||
Actual | $3.98 | $1,000 | $1,004.20 | |||||
Hypothetical (5% return) | 4.01 | 1,000 | 1,020.73 | |||||
Institutional Class | 0.88% | |||||||
Actual | $4.37 | $1,000 | $1,003.80 | |||||
Hypothetical (5% return) | 4.41 | 1,000 | 1,020.32 | |||||
Administrative Class | 1.13% | |||||||
Actual | $5.61 | $1,000 | $1,002.30 | |||||
Hypothetical (5% return) | 5.66 | 1,000 | 1,019.05 | |||||
Investor Class | 1.24% | |||||||
Actual | $6.16 | $1,000 | $1,002.10 | |||||
Hypothetical (5% return) | 6.21 | 1,000 | 1,018.49 |
* | Reflective of all fee waivers and expense reimbursements |
** | Expenses are equal to the Fund’s annualized net expense ratio, multiplied by the average account value over the period, multiplied by 181/365 (to reflect the one-half year period). |
136
Harbor Funds
Additional Information (Unaudited)
Proxy Voting
Harbor Funds has adopted Proxy Voting Policies and Procedures under which proxies relating to securities held by the Harbor funds are voted. In addition, Harbor Funds files Form N-PX, with its complete proxy voting record for the 12 months ended June 30th, no later than August 31st of each year. A description of Harbor Funds’ Proxy Voting Policies and Procedures and the proxy voting records (Form N-PX) are available (i) without charge, upon request, by calling Harbor toll-free at 800-422-1050; (ii) on Harbor’s website at harborcapital.com; and (iii) on the SEC’s website at sec.gov.
Householding
Harbor Funds has adopted a policy that allows it to send only one copy of a Fund’s prospectus, proxy materials, annual report and semi-annual report to certain shareholders residing at the same household. This reduces Fund expenses, which benefits you and other shareholders. If you need additional copies or do not want your mailings to be “householded,” please call the Shareholder Servicing Agent at 800-422-1050. Individual copies will be sent within thirty (30) days after the Shareholder Servicing Agent receives your instructions. Your consent to householding is considered valid until revoked.
Quarterly Portfolio Disclosures
The Funds file a complete portfolio of investments for their first and third fiscal quarters with the SEC as an exhibit to Form N-PORT. The Funds’ Form N-PORT exhibit is available (i) without charge, upon request, by calling Harbor toll-free at 800-422-1050, (ii) on Harbor’s website at harborcapital.com, and (iii) on the SEC’s website at sec.gov.
ADVISORY AGREEMENT APPROVALS
The Investment Company Act requires that the Investment Advisory and Subadvisory Agreement(s) of each Fund be approved initially, and following an initial two-year term, at least annually, by the Harbor Funds (the “Trust”) Board of Trustees (the “Board” or the “Trustees”), including a majority of the Independent Trustees voting separately.
FACTORS CONSIDERED BY THE TRUSTEES IN APPROVING THE INVESTMENT ADVISORY AGREEMENTS AND SUBADVISORY AGREEMENTS OF THE HARBOR FUNDS
At a meeting of the Board held on February 17-18, 2023 (the “Meeting”), the Board, including the Independent Trustees voting separately, considered and approved the continuation of each Investment Advisory Agreement with Harbor Capital, the adviser to each Fund, and each Subadvisory Agreement with each Fund’s subadviser (each, a “Subadviser”) with respect to Harbor Capital Appreciation Fund, Harbor Convertible Securities Fund (Investment Advisory Agreement only), Harbor Core Bond Fund, Harbor Core Plus Fund, Harbor Disruptive Innovation Fund, Harbor Diversified International All Cap Fund, Harbor Global Leaders Fund, Harbor International Fund, Harbor International Core Fund (formerly, Harbor Overseas Fund), Harbor International Growth Fund, Harbor International Small Cap Fund, Harbor Large Cap Value Fund, Harbor Mid Cap Fund, Harbor Mid Cap Value Fund, Harbor Small Cap Growth Fund and Harbor Small Cap Value Fund (each a “Fund” and, collectively, the “Funds”). The Trustees noted that the Subadvisory Agreement for Harbor Convertible Securities Fund was considered and approved for an initial two-year term by the Board on November 13-14, 2022.
In evaluating each Investment Advisory Agreement and each Subadvisory Agreement, the Trustees reviewed materials furnished by Harbor Capital and each Subadviser, including information about their respective affiliates, personnel, and operations, and also relied upon their knowledge of Harbor Capital and the Subadvisers resulting from their quarterly meetings, periodic telephonic meetings and other prior communications. In connection with the Meeting, which had been called for the purpose of considering the continuation of the Investment Advisory Agreements and Subadvisory Agreements, and at prior meetings, the Trustees, including the Independent Trustees, requested and received materials and presentations relating to Fund performance and the services rendered by Harbor Capital and each Subadviser. These materials included a comprehensive written response from Harbor Capital to a 15(c) request letter prepared by legal counsel to the Independent Trustees in consultation with the Independent Trustees. The Trustees also discussed with representatives of Harbor Capital, at the Meeting and at prior meetings, the Trust’s operations and Harbor Capital’s ability, consistent with the “manager-of-managers” structure of many Harbor funds, to (i) identify and recommend to the Trustees a subadviser for each such Fund, (ii) monitor and oversee the performance and investment capabilities of each subadviser, and (iii) recommend the replacement of a subadviser where appropriate. The Trustees specifically considered Harbor Capital’s history as a manager-of-managers, including its history of replacing subadvisers for particular Harbor funds in circumstances in which the Board and Harbor Capital had determined that a change in subadviser
137
Harbor Funds
Additional Information—Continued
ADVISORY AGREEMENT APPROVALS—Continued
was in the best interests of a fund and its shareholders, whether as a result of (i) long-term underperformance not explained by market conditions or market cycles relative to the subadviser’s investment style, (ii) prolonged style inconsistency, (iii) material adverse changes in management or personnel, or (iv) other factors, such as if Harbor Capital were to identify another subadviser believed to better serve the shareholders than the existing subadviser.
At the Meeting, the Trustees, including all of the Independent Trustees voting separately, determined, in the exercise of their business judgment, that the terms of each Investment Advisory Agreement and each Subadvisory Agreement were fair and reasonable and approved the continuation for a one-year period of each such Investment Advisory Agreement and Subadvisory Agreement as being in the best interests of each Fund and its shareholders.
In their deliberations, the Independent Trustees had the opportunity to meet privately without representatives of Harbor Capital or any Subadviser present and were represented throughout the process by legal counsel to the Independent Trustees and the Funds.
In considering the approval of each Fund’s Investment Advisory Agreement and, as applicable, Subadvisory Agreement, the Board, including the Independent Trustees, evaluated a number of factors it considered relevant to its determination. The Board did not identify any single factor as all-important or controlling, and individual Trustees did not necessarily attribute the same weight or importance to each factor.
Among the factors considered by the Trustees were the following:
•
The nature, extent, and quality of the services provided by Harbor Capital and each Subadviser, including the background, education, expertise and experience of the investment professionals of Harbor Capital and each Subadviser providing services to the Funds;
•
The favorable history, reputation, qualifications and background of Harbor Capital and each Subadviser, as well as the qualifications of their respective personnel;
•
The profitability of Harbor Capital with respect to each Fund, including the effect of revenues of Harbor Services Group, Inc. (“Harbor Services Group”), the Funds’ transfer agent, and Harbor Funds Distributors, Inc. (“Harbor Funds Distributors”), the Funds’ principal underwriter, on such profitability;
•
The fees charged by Harbor Capital and Subadvisers for investment advisory and subadvisory services, respectively, including, in each case, the portion of the fee to be retained by Harbor Capital, after payment of subadvisory fees, for the investment advisory and related services, including investment, business, legal, compliance, trading (in the case of Harbor Disruptive Innovation Fund), financial and administrative services, that Harbor Capital provides;
•
The extent to which economies of scale might be realized as each Fund grows, and the extent to which each Fund’s advisory fee level reflects any economies of scale for the benefit of Fund investors;
•
The fees and expense ratios of each Fund relative to the quality of services provided and the fees and expense ratios of similar investment companies;
•
The short- and long-term investment performance of each Fund in comparison to peer groups and certain relevant benchmark indices and Harbor Capital’s efforts to address circumstances of underperformance where applicable;
•
The compensation received by Harbor Services Group and Harbor Funds Distributors in consideration of the services each provides to the Funds;
•
Any “fall out” benefits that might inure to Harbor Capital, the Subadvisers and their respective affiliates as a result of their relationship with the Funds;
•
Information received at regular meetings throughout the year related to Fund performance and services rendered by Harbor Capital, as well as each of the Subadvisers, and research arrangements with brokers who execute transactions on behalf of each applicable Subadviser;
•
Information contained in materials provided by Harbor Capital and compiled by Broadridge as to the investment returns, advisory fees and total expense ratios of the Institutional Class of each Fund (and, in certain cases, total expense ratios of the Investor Class) relative to those of other investment companies with similar objectives and strategies managed by other investment advisers, consisting both of a peer group of funds as well as a broader universe of funds compiled by Broadridge; and
138
Harbor Funds
Additional Information—Continued
ADVISORY AGREEMENT APPROVALS—Continued
•
Information contained in materials compiled by Morningstar as to the investment returns of the Institutional Class of each Fund relative to those of other investment companies with similar objectives and strategies managed by other investment advisers.
Nature, Extent, and Quality of Services
The Trustees separately considered the nature, extent, and quality of the services provided by Harbor Capital and each Subadviser. In their deliberations as to the approval of each Fund’s Investment Advisory Agreement and, as applicable, Subadvisory Agreement(s), the Trustees were mindful of the fact that, by choosing to invest in a Fund, the shareholders had entrusted Harbor Capital with the responsibility, subject to the approval of the Trustees, for selecting each Fund’s Subadviser, overseeing and monitoring that Subadviser’s performance and replacing the Subadviser if necessary. The Trustees also considered as relevant to their determination the favorable history, reputation, qualifications and background of Harbor Capital and each Subadviser, as well as the qualifications of their respective personnel.
The Adviser’s Services. The Board evaluated the nature, extent, and quality of Harbor Capital’s services in light of the Board’s experience with Harbor Capital, as well as materials provided by Harbor Capital concerning the financial and other resources devoted by Harbor Capital to the Trust, including the breadth and depth of experience and expertise of the investment, accounting, administrative, legal and compliance professionals dedicated to the Trust’s operations. The Trustees determined that Harbor Capital has the expertise and resources to manage and operate effectively each Fund.
The Subadvisers’ Services. The Trustees’ consideration of the services provided by the Subadvisers included a review of each Subadviser’s portfolio managers, investment philosophy, style and processes and record of consistency therewith, performance results for different time periods, its approach to controlling risk, and the quality and extent of its investment capabilities and resources, including the nature and extent of research it receives from broker-dealers (to the extent applicable) and other sources. In their deliberations with respect to each applicable Fund, the Trustees considered the history of the Trust’s relationship with each Subadviser and the Trust’s experience with each Subadviser in this capacity.
The Trustees also considered each Subadviser’s breadth and depth of experience and investment results in managing other accounts similar to the respective Fund. The Trustees regularly receive presentations by investment professionals from the Subadvisers. The Trustees reviewed information concerning each Subadviser’s historical investment results in managing accounts and/or funds, as applicable, in a manner substantially similar to the relevant Fund.
Investment Performance, Advisory Fees and Expense Ratios
In considering each Fund’s performance, advisory fees and expense ratio, the Trustees requested and received from Harbor Capital data compiled by Broadridge and Morningstar. The Trustees also received information explaining the methodology for compilation of certain of this information and what it was intended to demonstrate. The Trustees analyzed the Institutional Class performance of each Fund, the advisory fees of each Fund, and the Institutional Class expenses of each Fund (after giving effect to waivers and/or reimbursements, if applicable, that reduced the fees or expenses of the Fund or its peer funds) and made certain observations and findings as to each Fund as noted below. The Trustees also reviewed certain Investor Class comparative fee and expense information they considered relevant to their deliberations. In evaluating performance, the Trustees recognized that the performance data reflects a snapshot of a period as of a particular date and that selecting a different performance period could produce significantly different results.
Harbor Capital Appreciation Fund. The Trustees considered Harbor Capital Appreciation Fund (inception date December 29, 1987), noting that, according to the Broadridge report, the Fund’s Institutional Class had underperformed its Broadridge group and universe medians for the one-, three- and five-year periods ended December 31, 2022. The Morningstar data presented showed that the Fund’s one-, three- and five-year rolling returns ranked in the fourth, third and third quartile, respectively, for the periods ended December 31, 2022. The Trustees also considered that the Fund had underperformed its primary benchmark, the Russell 1000® Growth Index, for the one-, three- and five-year periods ended December 31, 2022.
The Trustees considered the expertise of Jennison Associates LLC (“Jennison”) in managing assets generally and specifically with respect to the Fund’s strategy, noting that Jennison managed approximately $54 billion in assets in this strategy, out of a firm-wide total of approximately $164.1 billion in assets under management. The Trustees also noted the experience of the Fund’s portfolio managers in this strategy.
The Trustees observed that the Broadridge comparison of contractual management fees for the Fund’s expense group, assuming an asset level of $21.7 billion, showed that the Fund’s contractual management fee was above the group median for the Institutional Class. The Broadridge data also showed that the actual total expense ratio for the Fund’s Institutional Class was below its
139
Harbor Funds
Additional Information—Continued
ADVISORY AGREEMENT APPROVALS—Continued
group and universe medians. The Trustees also considered that Harbor Capital had agreed to continue the Fund’s existing contractual fee waiver/expense reimbursement arrangement until at least February 29, 2024. The Trustees noted that Harbor Capital’s profitability in operating the Fund was not excessive.
Harbor Convertible Securities Fund. The Trustees considered Harbor Convertible Securities Fund (inception date May 1, 2011), noting that, according to the Broadridge report, the Fund’s Institutional Class had outperformed its Broadridge group and universe medians for the one-year period ended December 31, 2022 and underperformed its Broadridge group and universe medians for the three- and five-year periods ended December 31, 2022. The Morningstar data presented showed that the Fund’s one-, three- and five-year rolling returns ranked in the first, third and third quartiles, respectively, for the periods ended December 31, 2022. The Trustees also considered that the Fund had outperformed its benchmark, the ICE Bank of America (“ICE BofA”) U.S. Convertible Ex Mandatory Index, for the one-year period ended December 31, 2022, and underperformed its benchmark for the three- and five-year periods ended December 31, 2022. The Trustees noted that BlueCove Limited (“BlueCove”) had been appointed the Fund’s subadviser for an initial two-year period effective March 1, 2023 and therefore the Fund’s performance for the periods shown was not attributable to BlueCove.
The Trustees considered the expertise of BlueCove in managing assets generally and in fixed income securities specifically, noting that BlueCove has a firm-wide total of $1.6 billion in assets under management. The Trustees also noted the experience of the Fund’s portfolio managers in this strategy.
The Trustees observed that the Broadridge comparison of contractual management fees for the Fund’s expense group, assuming an asset level of $175 million, showed the Fund’s management fee was below the group median for the Institutional Class. The Broadridge data also showed that the actual total expense ratio of the Fund’s Institutional Class was below the group median and above the universe median.The Trustees also considered that Harbor Capital had agreed to implement a contractual fee waiver/expense reimbursement arrangement until at least February 29, 2024. The Trustees noted that Harbor Capital’s profitability in operating the Fund was not excessive.
Harbor Core Bond Fund. The Trustees considered Harbor Core Bond Fund (inception date June 1, 2018), noting that, according to the Broadridge report, the Fund’s Institutional Class had outperformed its Broadridge group and universe medians for the one-year period ended December 31, 2022, underperformed its Broadridge group medians for the three- and five-year periods ended December 31, 2022 and outperformed its Broadridge universe medians for the three- and five-year periods ended December 31, 2022. The Morningstar data presented showed that the Fund’s one- and three-year period rolling returns ranked in the second quartile for the periods ended December 31, 2022. The Trustees also considered that the Fund had underperformed its benchmark, the Bloomberg U.S. Aggregate Bond Index, for the one-year period ended December 31, 2022 and outperformed the benchmark for the three-year and since inception period ended December 31, 2022.
The Trustees considered the expertise of Income Research & Management (“IR+M”) in managing assets generally and in the core bond strategy specifically, noting that IR+M managed approximately $14.4 billion in assets in this strategy, out of a firm-wide total of approximately $89.0 billion in assets under management as of December 31, 2022. The Trustees also noted the experience of the Fund’s portfolio managers in this strategy.
The Trustees observed that the Broadridge comparison of contractual management fees for the Fund’s expense group, assuming an asset level of $75 million, showed the Fund’s management fee was below the group median for the Institutional Class. The Broadridge data also showed that the actual total expense ratio of the Fund’s Institutional Class was below the group and universe medians.The Trustees also considered that Harbor Capital had agreed to continue the Fund’s existing contractual fee waiver/expense reimbursement arrangement until at least February 29, 2024. The Trustees noted that Harbor Capital’s profitability in operating the Fund was negative.
Harbor Core Plus Fund. The Trustees considered Harbor Core Plus Fund (inception date December 29, 1987), noting that, according to the Broadridge report, the Fund’s Institutional Class had outperformed its Broadridge group and universe medians for the one- and three-year periods ended December 31, 2022, underperformed its Broadridge group median for the five-year period ended December 31, 2022 and outperformed its Broadridge universe median for the five-year period ended December 31, 2022. The Morningstar data presented showed that the Fund’s one-, three- and five-year rolling returns ranked in the second quartile for the periods ended December 31, 2022. The Trustees considered that Harbor Core Plus Fund had underperformed its benchmark, the Bloomberg U.S. Aggregate Bond Index, for the one-year period ended December 31, 2022, and outperformed its benchmark for the three- and five-year periods ended December 31, 2022. The Trustees noted the fact that IR+M had been appointed the Fund’s subadviser for an initial two-year term effective February 2, 2022 and therefore the Fund’s performance for the periods shown was not wholly attributable to IR+M.
140
Harbor Funds
Additional Information—Continued
ADVISORY AGREEMENT APPROVALS—Continued
The Trustees considered the expertise of IR+M in managing assets generally and in the core plus strategy specifically, noting that IR+M managed approximately $1.3 billion in core plus assets out of a firm-wide total of approximately $89.0 billion in assets under management as of December 31, 2022. The Trustees also noted the experience of the Fund’s portfolio managers in this strategy.
The Trustees observed that the Broadridge comparison of contractual management fees for the Fund’s expense group, assuming an asset level of $950 million, showed the Fund’s management fee was below the group median for the Institutional Class. The Broadridge data also showed that the actual total expense ratio of the Fund’s Institutional Class was below the group and universe medians. The Trustees also considered that Harbor Capital had agreed to continue the Fund’s existing contractual fee waiver/expense reimbursement arrangement until at least February 29, 2024. The Trustees noted that Harbor Capital’s profitability in operating the Fund was not excessive.
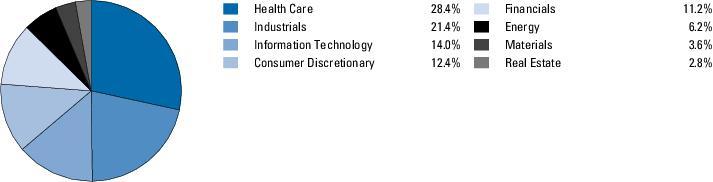
Harbor Disruptive Innovation Fund. The Trustees considered Harbor Disruptive Innovation Fund (inception date November 1, 2000), noting that, according to the Broadridge report, the Fund’s Institutional Class had underperformed its Broadridge group and universe medians for the one-, three- and five-year periods ended December 31, 2022. The Morningstar data presented showed that the Fund’s one-, three- and five-year rolling returns ranked in the second, third and third quartile, respectively, for the periods ended December 31, 2022. The Trustees also considered that the Fund had underperformed its primary benchmark, the S&P 500 Index, for the one-, three- and five-year periods ended December 31, 2022.
The Trustees noted the fact that 4BIO Partners LLP (“4BIO Capital”), NZS Capital, LLC (“NZS Capital”), Sands Capital Management, LLC (“Sands Capital”), Tekne Capital Management, LLC (“Tekne”), and Westfield Capital Management Company, L.P. (“Westfield Capital”) had been appointed as the Fund’s subadvisers effective September 1, 2021 and that performance prior to that date is not attributable to 4BIO Capital, NZS Capital, Sands Capital, Tekne, and Westfield Capital. The Trustees further noted that, prior to that date, the Fund was compared to a different benchmark index. The Trustees considered the expertise of 4BIO Capital, NZS Capital, Sands Capital, Tekne, and Westfield Capital in the strategies for which they provide model portfolios.
The Trustees observed that the Broadridge comparison of contractual management fees for the Fund’s expense group, assuming an asset level of $125 million, showed that the Fund’s contractual management fee was below the group median for the Institutional Class. The Broadridge data also showed that the actual total expense ratio for the Fund’s Institutional Class was below its group and universe medians. The Trustees also considered that Harbor Capital had agreed to a contractual fee waiver/expense reimbursement arrangement with the Fund until at least February 29, 2024. The Trustees noted that Harbor Capital’s profitability in operating the Fund was negative.
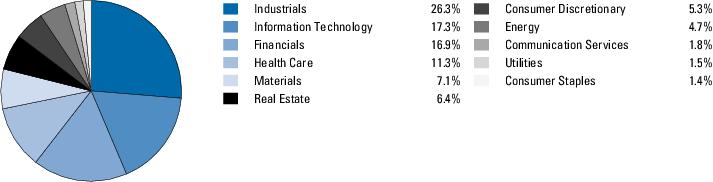
Harbor Diversified International All Cap Fund. The Trustees considered Harbor Diversified International All Cap Fund (inception date November 2, 2015), noting that, according to the Broadridge report, the Fund’s Institutional Class had outperformed its Broadridge group and universe medians for the one-, three- and five-year periods ended December 31, 2022. The Morningstar data presented showed that the Fund’s one-, three- and five-year rolling returns ranked in the second quartile for the periods ended December 31, 2022. The Trustees also considered that the Fund had outperformed its benchmark, the MSCI All Country World Ex. U.S. (ND) Index, for the one-, three- and five-year periods ended December 31, 2022.
The Trustees considered the expertise of Marathon Asset Management Limited (“Marathon-London”) in managing assets generally and in the strategy used with respect to the Fund specifically, noting that Marathon-London managed approximately $4.3 billion in assets in this strategy, out of a firm-wide total of approximately $38.5 billion in assets under management. The Trustees also noted the experience of the Fund’s portfolio managers in this strategy.
The Trustees observed that the Broadridge comparison of contractual management fees for the Fund’s expense group, assuming an asset level of $825 million, showed the Fund’s management fee was below the group median for the Institutional Class. The Broadridge data also showed that the actual total expense ratio for the Fund’s Institutional Class was below the group median and equal to the universe median. The Trustees also considered that Harbor Capital had agreed to continue the Fund’s existing contractual fee waiver/expense reimbursement arrangement until at least February 29, 2024.The Trustees noted that Harbor Capital’s profitability in operating the Fund was not excessive.
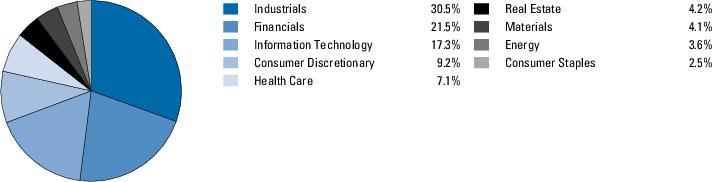
Harbor Global Leaders Fund. The Trustees considered Harbor Global Leaders Fund (inception date March 1, 2009), noting that, according to the Broadridge report, the Fund’s Institutional Class had underperformed its Broadridge group and universe medians for the one- and three-year periods ended December 31, 2022 and outperformed its Broadridge group and universe medians for the five-year period ended December 31, 2022. The Morningstar data presented showed that the Fund’s one-, three- and five-year rolling returns ranked in the third, fourth, and second quartile, respectively, for the periods ended December 31, 2022. The Trustees considered that the Fund had underperformed its benchmark, the MSCI All Country World (ND) Index, for the one- and three-year periods ended December 31, 2022 and outperformed the benchmark for the five-year period ended December 31, 2022.
141
Harbor Funds
Additional Information—Continued
ADVISORY AGREEMENT APPROVALS—Continued
The Trustees considered the expertise of Sands Capital in managing assets generally and in the international equity strategy specifically, noting that Sands Capital managed approximately $3.3 billion in assets in this strategy, out of a firm-wide total of approximately $38.9 billion in assets under management. The Trustees also noted the experience of the Fund’s portfolio managers in this strategy.
The Trustees noted that the Broadridge comparison of contractual management fees for the Fund’s expense group, assuming an asset level of $75 million, showed the Fund’s management fee was below the group median for the Institutional Class. The Broadridge data also showed that the actual total expense ratio for the Fund’s Institutional Class was below the group and universe medians. The Trustees also considered that Harbor Capital had agreed to continue the Fund’s existing contractual fee waiver/expense reimbursement arrangement until at least February 29, 2024. The Trustees noted that the Adviser’s profitability in operating the Fund was not excessive.
Harbor International Fund. The Trustees considered Harbor International Fund (inception date December 29, 1987), noting that, according to the Broadridge report, the Fund’s Institutional Class had outperformed its Broadridge group and universe medians for the one- and three-year periods ended December 31, 2022, underperformed its Broadridge group median for the five-year period ended December 31, 2022 and outperformed its Broadridge universe median for the five-year period ended December 31, 2022. The Morningstar data presented showed that the Fund’s one-, three- and five-year rolling returns ranked in the first, first and third quartile, respectively, for the periods ended December 31, 2022. The Trustees considered that the Fund had outperformed its benchmark, the MSCI EAFE® (ND) Index, for the one- and three-year periods ended December 31, 2022 and underperformed the benchmark for the five-year period ended December 31, 2022.
The Trustees considered the expertise of Marathon-London in managing assets generally and in the strategy used with respect to the Fund specifically, noting that Marathon-London managed approximately $20.3 billion in this strategy, out of a firm-wide total of approximately $38.5 billion in assets under management. The Trustees also noted the experience of the Fund’s portfolio managers in this strategy.
The Trustees observed that the Broadridge comparison of contractual management fees for the Fund’s expense group, assuming an asset level of $3.05 billion, showed the Fund’s management fee was equal to the group median for the Institutional Class. The Broadridge data also showed that the actual total expense ratio for the Fund’s Institutional Class was below the group and universe medians. The Trustees also considered that Harbor Capital had agreed to continue the Fund’s existing contractual fee waiver/expense reimbursement arrangement until at least February 29, 2024. The Trustees noted that Harbor Capital’s profitability in operating the Fund was not excessive.
Harbor International Core Fund. The Trustees considered Harbor International Core Fund (formerly, Harbor Overseas Fund; inception date March 1, 2019), noting that, according to the Broadridge report, the Fund’s Institutional Class had outperformed its Broadridge group and universe medians for the one-year, three-year and since inception periods ended December 31, 2022. The Morningstar data presented showed that the Fund’s one- and three-year rolling returns ranked in the second and first quartile, respectively, for the periods ended December 31, 2022. The Trustees considered that the Fund had underperformed its benchmark, the MSCI EAFE (ND) Index, for the one-year period ended December 31, 2022, and outperformed its benchmark for the three-year and since inception periods ended December 31, 2022.
The Trustees considered the expertise of Acadian Asset Management LLC (“Acadian”) in managing assets generally and in the strategy used with respect to the Fund specifically, noting that Acadian managed approximately $7.4 billion in assets in this strategy out of a firm-wide total of approximately $92.8 billion in assets under management. The Trustees also noted the experience of the Fund’s portfolio managers in this strategy.
The Trustees observed that the Broadridge comparison of contractual management fees for the Fund’s expense group, assuming an asset level of $100 million, showed the Fund’s management fee was equal to the group median for the Institutional Class. The Broadridge data also showed that the actual total expense ratio for the Fund’s Institutional Class was below the group median and above the universe median. The Trustees also considered that Harbor Capital had agreed to continue the Fund’s existing contractual fee waiver/expense reimbursement arrangement until at least February 29, 2024.The Trustees noted that Harbor Capital’s profitability in operating the Fund was negative.
Harbor International Growth Fund. The Trustees considered Harbor International Growth Fund (inception date November 1, 1993), noting that, according to the Broadridge report, the Fund’s Institutional Class had underperformed its Broadridge group and universe medians for the one-, three- and five-year periods ended December 31, 2022. The Morningstar data presented showed that the Fund’s one-, three- and five-year rolling returns ranked in the fourth quartile for the periods ended December 31, 2022. The Trustees considered that the Fund had underperformed its benchmark, the MSCI All Country World Ex. U.S. (ND) Index, for the one-, three- and five-year periods ended December 31, 2022. The Trustees noted, however, that based on data for the periods ended January 31, 2023, the Fund had outperformed the benchmark over recent short-term periods (one and three months) and had also outperformed the benchmark for the five-year period.
142
Harbor Funds
Additional Information—Continued
ADVISORY AGREEMENT APPROVALS—Continued
The Trustees considered the expertise of Baillie Gifford Overseas Limited (“Baillie Gifford”) in managing assets generally and in the ACWI ex-US Focus strategy specifically, noting that Baillie Gifford managed approximately $9.2 billion in assets in this strategy, out of a firm-wide total of approximately $268.7 billion in assets under management. The Trustees also noted the experience of the Fund’s portfolio managers in this strategy.
The Trustees observed that the Broadridge comparison of contractual management fees for the Fund’s expense group, assuming an asset level of $350 million, showed the Fund’s management fee was below the group median for the Institutional Class. The Broadridge data also showed that the actual total expense ratio for the Fund’s Institutional Class was below the group median and above the universe median. The Trustees also considered that Harbor Capital had agreed to continue the Fund’s existing contractual fee waiver/expense reimbursement arrangement until at least February 29, 2024.The Trustees noted that the Adviser’s profitability in operating the Fund was not excessive.
Harbor International Small Cap Fund. The Trustees considered Harbor International Small Cap Fund (inception date February 1, 2016), noting that, according to the Broadridge report, the Fund’s Institutional Class had outperformed its Broadridge group and universe medians for the one-, three- and five-year periods ended December 31, 2022. The Morningstar data presented showed that the Fund’s one-, three- and five-year rolling returns ranked in the first quartile for the periods ended December 31, 2022. The Trustees considered that the Fund had outperformed its benchmark, the MSCI EAFE Small Cap (ND) Index, for the one-, three- and five-year periods ended December 31, 2022.
The Trustees considered the expertise of Cedar Street in managing assets generally and in the international small cap strategy specifically, noting that Cedar Street managed approximately $338.5 million in assets in this strategy out of a firm-wide total of approximately $399.3 million in assets under management. The Trustees also noted the experience of the Fund’s portfolio managers in this strategy.
The Trustees observed that the Broadridge comparison of contractual management fees for the Fund’s expense group, assuming an asset level of $125 million, showed the Fund’s management fee was below the group median for the Institutional Class. The Broadridge data also showed that the actual total expense ratio for the Fund’s Institutional Class was below the group and universe medians. The Trustees also considered that Harbor Capital had agreed to continue the Fund’s existing contractual fee waiver/expense reimbursement arrangement until at least February 29, 2024.The Trustees noted that Harbor Capital’s profitability in operating the Fund was not excessive.
Harbor Large Cap Value Fund. The Trustees considered Harbor Large Cap Value Fund (inception date December 29, 1987), noting that, according to the Broadridge report, the Fund’s Institutional Class had underperformed its Broadridge group and universe medians for the one- and three-year periods ended December 31, 2022 and outperformed its Broadridge group and universe medians for the five-year period ended December 31, 2022. The Morningstar data presented showed that the Fund’s one-, three- and five-year rolling returns ranked in the fourth, third and second quartile, respectively, for the periods ended December 31, 2022. The Trustees also considered that the Fund had underperformed its benchmark, the Russell 1000® Value Index, for the one-year period ended December 31, 2022 and outperformed the benchmark for the three- and five-year periods ended December 31, 2022.
The Trustees considered the expertise of Aristotle Capital Management, LLC (“Aristotle”) in managing assets generally and in large cap value strategies specifically, noting that Aristotle managed approximately $42.5 billion in assets in the value equity strategy used by the Fund, out of a firm-wide total of approximately $48.6 billion in assets under management. The Trustees also noted the experience of the Fund’s portfolio managers in this strategy.
The Trustees observed that the Broadridge comparison of contractual management fees for the Fund’s expense group, assuming an asset level of $2.125 billion, showed the Fund’s management fee was below the group median for the Institutional Class. The Broadridge data also showed that the actual total expense ratio for the Fund’s Institutional Class was below its group median and above its universe median. The Trustees also considered that Harbor Capital had agreed to continue the Fund’s contractual fee waiver/expense reimbursement arrangement until at least February 29, 2024. The Trustees noted that the Adviser’s profitability in operating the Fund was not excessive.
Harbor Mid Cap Fund. The Trustees considered Harbor Mid Cap Fund (inception date December 1, 2019), noting that, according to the Broadridge report, the Fund’s Institutional Class had underperformed its Broadridge group and universe medians for the one-year period ended December 31, 2022 and outperformed its Broadridge group and universe medians for the three-year and since inception periods ended December 31, 2022. The Morningstar data presented showed that the Fund’s one- and three-year rolling returns ranked in the third and second quartile, respectively, for the period ended December 31, 2022. The Trustees also considered that the Fund had outperformed its benchmark, the Russell Midcap® Index, for the one- and three-year periods ended December 31, 2022.
143
Harbor Funds
Additional Information—Continued
ADVISORY AGREEMENT APPROVALS—Continued
The Trustees considered the expertise of EARNEST Partners LLC (“EARNEST”) in managing assets generally and in the mid cap strategy specifically, noting that EARNEST managed approximately $1.9 billion in assets in this strategy, out of a firm-wide total of approximately $26.2 billion in assets under management. The Trustees also noted the experience of the Fund’s portfolio manager in this strategy, noting that he is the founder of EARNEST.
The Trustees observed that the Broadridge comparison of contractual management fees for the Fund’s expense group, assuming an asset level of $100 million, showed the Fund’s management fee was above the group median for the Institutional Class. The Broadridge data also showed that the actual total expense ratio for the Fund’s Institutional Class was below the group median and above the universe median. The Trustees also considered that Harbor Capital had agreed to continue the Fund’s contractual fee waiver/expense reimbursement arrangement until at least February 29, 2024. The Trustees noted that Harbor Capital’s profitability in operating the Fund was not excessive.
Harbor Mid Cap Value Fund. The Trustees considered Harbor Mid Cap Value Fund (inception date March 1, 2002), noting that, according to the Broadridge report, the Fund’s Institutional Class had outperformed its Broadridge group and universe medians for the one-year period ended December 31, 2022 and underperformed its Broadridge group and universe medians for the three-and five-year periods ended December 31, 2022. The Morningstar data presented showed that the Fund’s one-, three- and five-year rolling returns ranked in the second, third and fourth quartile, respectively, for the periods ended December 31, 2022. The Trustees considered that the Fund had outperformed its benchmark, the Russell Midcap® Value Index, for the one-year period ended December 31, 2022 and underperformed the benchmark for three- and five-year periods ended December 31, 2022.
The Trustees considered the expertise of LSV Asset Management (“LSV”) in managing assets generally and in the mid cap value strategy specifically, noting that LSV managed approximately $1.5 billion in assets in this strategy, out of a firm-wide total of approximately $91.3 billion in assets under management. The Trustees also noted the experience of the Fund’s portfolio managers in this strategy, noting that one of the portfolio managers was a founding partner of LSV.
The Trustees noted that the Broadridge comparison of contractual management fees for the Fund’s expense group, assuming an asset level of $325 million, showed the Fund’s management fee was equal to the group median for the Institutional Class. The Broadridge data also showed that the actual total expense ratio for the Fund’s Institutional Class was above the group and universe medians. The Trustees also considered that Harbor Capital had agreed to continue the Fund’s existing contractual fee waiver/expense reimbursement arrangement until at least February 29, 2024. The Trustees noted that the Adviser’s profitability in operating the Fund was not excessive.
Harbor Small Cap Growth Fund. The Trustees considered Harbor Small Cap Growth Fund (inception date November 1, 2000), noting that, according to the Broadridge report, the Fund’s Institutional Class had outperformed its Broadridge group and universe medians for the one- and five-year periods ended December 31 2022, underperformed its Broadridge group median for the three-year period ended December 31, 2022 and outperformed its Broadridge universe median for the three-year period ended December 31, 2022. The Morningstar data presented showed that the Fund’s one-, three- and five-year rolling returns ranked in the second quartile for the periods ended December 31, 2022. The Trustees also considered that the Fund had outperformed its benchmark, the Russell 2000® Growth Index, for the one-, three- and five-year periods ended December 31, 2022.
The Trustees considered the expertise of Westfield Capital in managing assets generally and in the small cap growth strategy specifically, noting that Westfield Capital managed approximately $1.8 billion in assets in this strategy, out of a firm-wide total of approximately $13.3 billion in assets under management. The Trustees also noted the experience of the Fund’s portfolio managers in this strategy.
The Trustees observed that the Broadridge comparison of contractual management fees for the Fund’s expense group, assuming an asset level of $925 million, showed the Fund’s contractual management fee was below the group median for the Institutional Class. The Broadridge data also showed that the Fund’s actual total expense ratio for the Fund’s Institutional Class was below the group and universe medians. The Trustees noted that Harbor Capital’s profitability in operating the Fund was not excessive.
Harbor Small Cap Value Fund. The Trustees considered Harbor Small Cap Value Fund (inception date December 14, 2001), noting that, according to the Broadridge report, the Fund’s Institutional Class had underperformed its Broadridge group median for the one-year period ended December 31, 2022, matched its Broadridge universe median for the one-year period ended December 31, 2022, underperformed its Broadridge group and universe medians for the three-year period ended December 31, 2022, and outperformed its Broadridge group and universe medians for the five-year period ended December 31, 2022. The Morningstar data presented showed that the Fund’s one-, three- and five-year rolling returns ranked in the second, third and second quartile, respectively, for the periods ended December 31, 2022. The Trustees also considered that the Fund outperformed its benchmark, the Russell 2000®Value Index, for the one-, three- and five-year periods ended December 31, 2022.
144
Harbor Funds
Additional Information—Continued
ADVISORY AGREEMENT APPROVALS—Continued
The Trustees considered the expertise of EARNEST in managing assets generally and in the small cap value strategy specifically, noting that EARNEST managed approximately $5.8 billion in assets in this strategy, out of a firm-wide total of approximately $26.2 billion in assets under management. The Trustees also noted the experience of the Fund’s portfolio manager in this strategy, noting that he is the founder of EARNEST.
The Trustees observed that the Broadridge comparison of contractual management fees for the Fund’s expense group, assuming an asset level of $2.15 billion, showed the Fund’s management fee was below the group median. The Broadridge data also showed that the actual total expense ratio for the Fund’s Institutional Class was below the group and universe median expense ratios. The Trustees noted that Harbor Capital’s profitability in operating the Fund was not excessive.
The Trustees also separately considered the allocation between Harbor Capital and each Subadviser of the relevant Fund’s investment advisory fee (i.e., the amount of the advisory fee retained by Harbor Capital relative to that paid to the relevant Subadviser as a subadvisory fee). They determined in each case that the allocation was reasonable and the product of arm’s length negotiation between Harbor Capital and the Subadviser.
Profitability
The Trustees also considered Harbor Capital’s profitability in operating each of the Funds (as well as on a fund complex-wide basis) as presented by Harbor Capital, and the allocation methodology used by Harbor Capital to compute such profitability. The Trustees concluded that the allocation methodology was reasonable and that a reasonable level of profitability was important to provide suitable incentives for Harbor Capital to continue to attract and maintain high-quality personnel and to invest in infrastructure and other resources to support and enhance the Funds’ operations. In considering Harbor Capital’s profitability generally, the Trustees also reviewed the compensation received by Harbor Services Group and Harbor Funds Distributors in consideration of the transfer agency and distribution services, respectively, that are provided to the Funds and any other benefits enjoyed by Harbor Capital and its affiliates as a result of their relationship with the Funds.
The Trustees also considered that profitability calculations with respect to advisory, transfer agency and distribution operations vary significantly depending on whether revenues on which the calculation is based are taken gross or net of amounts paid to third parties, such as subadvisory fee expenses and certain transfer agency expenses, and noted that subadvisory fee expenses are a direct expense of Harbor Capital. The Trustees also noted that Harbor Capital was, in certain cases, waiving a portion of its advisory fee and/or paying or reimbursing a portion of Fund expenses. The Trustees determined that Harbor Capital’s profitability in operating each Fund was not excessive.
Economies of Scale
The Trustees also considered the extent to which economies of scale might be realized as each Fund grows, and the extent to which each Fund’s advisory fee level reflects these economies of scale for the benefit of Fund investors. The Trustees specifically considered whether any advisory fee reduction “breakpoints” should be added to the advisory fee payable by any Fund. As noted above, the Trustees concluded that Harbor Capital’s profitability in each case was not excessive. They concluded that the Funds’ fee structures reflected economies of scale to date and that the addition of breakpoints in these fee structures was not required at the present time. The Trustees noted they intend to monitor each Fund’s asset growth in connection with future reviews of each Fund’s Investment Advisory Agreement to determine whether breakpoints may be appropriate at such time.
FACTORS CONSIDERED BY THE TRUSTEES IN APPROVING THE Investment Advisory Agreement and subadvisory agreement OF Harbor Convertible Securities Fund
At a meeting of the Board held on November 13-14, 2022 (the “Meeting”), the Board approved the subadvisory agreement among Harbor Capital, the Trust on behalf of Harbor Convertible Securities Fund (the “Fund”) and BlueCove Limited (“BlueCove”). As a result, BlueCove replaced Shenkman Capital Management, Inc. (“Shenkman”) as subadviser to the Fund.
At the Meeting, the Board, including the Independent Trustees voting separately, unanimously determined, in the exercise of their business judgment, that it was in the best interests of the Fund and its shareholders for Shenkman to be replaced by BlueCove as subadviser to the Fund and that the terms of the new subadvisory agreement among the Trust, on behalf of the Fund, Harbor Capital and BlueCove were fair and reasonable. Accordingly, the Trustees approved the new subadvisory agreement for an initial two-year term. In their deliberations, the Independent Trustees had the opportunity to meet privately without representatives of Harbor Capital or BlueCove present and were represented throughout the process by legal counsel to the Independent Trustees and the Fund.
In connection with their approval of these changes, the Trustees also approved an amended and restated investment advisory agreement between Harbor Capital and the Trust, on behalf of the Fund, to lower the contractual fee rate payable to Harbor Capital thereunder.
145
Harbor Funds
Additional Information—Continued
ADVISORY AGREEMENT APPROVALS—Continued
The Trustees considered that, given the lack of a reasonable, viable commercial growth path for the Fund, Harbor Capital determined that a change in subadviser would better enable the Fund to fulfill Harbor Capital’s goal of offering a vibrant, competitively priced, actively managed fund that could serve shareholders over the long term and gain additional traction in the marketplace. Harbor Capital believes that the hiring of BlueCove offers the Fund and its shareholders the opportunity for attractive risk-adjusted returns over the long term. Furthermore, Harbor Capital believes that BlueCove’s record as a strong partner to Harbor Capital would place the Fund in a better position to continue to grow and remain viable for shareholders over the long term.
In considering potential replacement subadvisers, Harbor Capital conducted research on asset managers across the fixed income universe and also relied on knowledge built from its ongoing monitoring of BlueCove, as an existing subadviser to certain series of Harbor ETF Trust, and other comparable managers. That research led to the identification of BlueCove as a firm in which Harbor Capital has a high degree of investment conviction. Harbor Capital believes that BlueCove will provide the investment approach needed to help the Fund become both sustainable and vibrant over the long term. At the Meeting, the Trustees received presentations by (i) Harbor Capital regarding its recommendation, and (ii) BlueCove regarding the firm’s experience, investment philosophy and process, operational and trading capabilities, and BlueCove’s proposed approach to managing the Fund’s assets, among other things.
In determining whether to approve the new subadvisory agreement, the Trustees reviewed materials furnished by Harbor Capital and BlueCove, including information regarding BlueCove, its investment philosophy and strategies, past performance, financial condition, operational capabilities and personnel. The Trustees also took into account their knowledge of BlueCove resulting from its role as subadviser to Harbor Scientific Alpha Income ETF and Harbor Scientific Alpha High-Yield ETF, and they considered Harbor Capital’s rationale for its recommendation to appoint BlueCove to succeed Shenkman as the Fund’s subadviser.
The Trustees considered that, in recommending BlueCove, Harbor Capital had conducted a search for a fixed income investment adviser and believed BlueCove had the potential to add value for the Fund’s shareholders.
Specific Factors
In considering the approval of the new subadvisory agreement, the Board, including the Independent Trustees, evaluated a number of factors relevant to their determination. They did not identify any single factor as all-important or controlling, and individual Trustees did not necessarily attribute the same weight or importance to each factor.
Among the factors considered by the Trustees in approving the new subadvisory agreement were the following:
The nature, extent, and quality of the services proposed to be provided by BlueCove, including the background, education, expertise and experience of the investment professionals of BlueCove who would provide investment management services to the Fund;
The favorable history, reputation, qualifications and background of BlueCove, as well as the reputations, qualifications and background of BlueCove’s personnel;
The proposed fee to be charged by BlueCove to Harbor Capital for subadvisory services, including the impact of any differences between the current and proposed subadvisory fees on the portion of the advisory fee to be retained by Harbor Capital, after payment of BlueCove’s fee, for the subadviser oversight, administration and manager-of-managers services Harbor Capital provides;
That Harbor Capital had agreed to reduce its contractual management fee rate;
The analysis of backtested investment performance of BlueCove in the style to be utilized in managing the Fund relative to the performance of the Fund under Shenkman;
The expected impact of the implementation of the subadvisory agreement and the new investment advisory agreement on the profitability of Harbor Capital with respect to the Fund;
Any “fall out” benefits that might inure to Harbor Capital, BlueCove and their affiliates as a result of the implementation of the new subadvisory agreement; and
The desire to continue to offer to Fund shareholders exposure to the convertible securities asset class through a fund that is competitively priced and viable over the long term.
The Trustees considered the nature, extent and quality of the services proposed to be provided by BlueCove in relation to the services provided by Shenkman since the inception of the Fund on May 1, 2011. In their deliberations, the Trustees were mindful of the fact that, by choosing to invest in the Fund, the Fund’s shareholders entrusted Harbor Capital with the responsibility,
146
Harbor Funds
Additional Information—Continued
ADVISORY AGREEMENT APPROVALS—Continued
subject to the approval of the Trustees, for selecting the Fund’s subadviser, overseeing and monitoring that subadviser’s performance and replacing the subadviser if necessary. The Trustees also considered as relevant to their determination the depth, knowledge and experience level of the investment team, the quality of the investment process and the culture of BlueCove.
The Board considered the potential tax and financial impacts of liquidating portfolio holdings and realizing gains and incurring brokerage costs in transitioning the portfolio, and potential options for mitigating the tax consequences to Fund shareholders. The Trustees evaluated the tax ramifications of a subadviser change with respect to the estimated level of net realized and unrealized losses in the portfolio following the portfolio transition based on certain assumptions with respect to the market value of the portfolio securities and expected redemptions in the portfolio. The Board considered the portion of portfolio holdings that will likely be replaced as a result of the proposed engagement of BlueCove.
The Trustees also discussed other potential options for the Fund.
Subadvisory Fee. In considering the proposed subadvisory fee payable to BlueCove pursuant to the new subadvisory agreement, the Trustees compared the proposed fee to the fee payable to Shenkman under the prior subadvisory agreement. The Trustees noted that, based on the Fund’s assets as of September 30, 2022, the effective aggregate annual fee rate for the Fund under the prior subadvisory agreement with Shenkman was higher than the effective annual fee rate to be paid by Harbor Capital under the new subadvisory agreement with BlueCove. The Trustees also considered that the reduction in subadvisory fee will enable Harbor Capital to, effective March 1, 2023, reduce the Fund’s contractual management fee rate, which will result in a reduction in the Fund’s net expense ratios.
Advisory Agreement. The Trustees considered that, although they were being asked to approve an amended investment advisory agreement for the Fund to implement an advisory fee reduction, the Trustees would nonetheless have the opportunity to perform a full review of the agreement in connection with their annual review of investment advisory agreements, at which time the Trustees would consider the nature, extent and quality of services provided; investment performance; advisory fees and expense ratios; profitability; any “fall out” benefits; and economies of scale.
As a result of these deliberations, the Trustees agreed that the Fund’s prior subadvisory agreement should be terminated and voted to approve the new subadvisory agreement with BlueCove for the Fund as well as the amended and restated investment advisory agreement.
Review of Liqudity Risk Management Program
The Trust has adopted pursuant to Rule 22e-4 under the Investment Company Act (“Rule 22e-4”) a Liquidity Risk Management Program (the “Program”) for the Funds. The Board has designated a committee of Harbor Capital employees as the Program Administrator.
The Program is designed to assess and manage each Fund’s liquidity risk. For purposes of Rule 22e-4, “liquidity risk” is defined as the risk that a Fund is unable to satisfy redemption requests without significantly diluting remaining investors’ interests in the Fund. Components of the Program include: (i) periodic assessment of each Fund’s liquidity risk based on certain factors; (ii) classification of each Fund’s holdings into one of four liquidity categories (Highly Liquid, Moderately Liquid, Less Liquid and Illiquid) that reflect an estimate of liquidity under current market conditions; (iii) to the extent a Fund does not invest primarily in Highly Liquid investments, establishment of an appropriate Highly Liquid Investment Minimum (“HLIM”) (as defined in Rule 22e-4) for such Fund and ongoing monitoring of the Fund’s net assets to assess compliance with the Fund’s HLIM; (iv) a limit on the ability of a Fund to acquire illiquid investments in excess of 15% of the Fund’s net assets; and (v) periodic reporting to the Board.
At a meeting held on November 10, 2022, the Board of Trustees reviewed the operation and effectiveness of the Program for the period beginning October 1, 2021 and ending September 30, 2022 (the “period”). At the November 10, 2022 meeting, the Board reviewed a report prepared by, and received a presentation from, the Program Administrator regarding the operation of the Program, its adequacy, and the effectiveness of its implementation during the period. The Program Administrator’s report included, among other things, a review of: (i) the operation of the Program overall during the period; (ii) the activities conducted by the Program Administrator with respect to the Program; (iii) the level of portfolio investments classified into each of the four liquidity categories and the services provided by the third-party vendor engaged by the Trust to facilitate such classification with respect to certain of the Funds; and (iv) the most recent liquidity risk assessment for the Funds conducted by the Program Administrator in accordance with Rule 22e-4. Based upon its review, the Program Administrator determined that the Program was adequate and effective in facilitating the Funds’ compliance with Rule 22e-4 during the period.
147
ITEM 2 – CODE OF ETHICS
Not applicable.
ITEM 3 – AUDIT COMMITTEE FINANCIAL EXPERT
Not applicable.
ITEM 4 – PRINCIPAL ACCOUNTANT FEES AND SERVICES
Not applicable.
ITEM 5 – AUDIT COMMITTEE OF LISTED REGISTRANTS
Not applicable.
ITEM 6 – INVESTMENTS
(a)
The Registrant has elected to include the schedule of investments in securities of unaffiliated issuers as part of the report to shareholders filed under Item 1 of this report on Form N-CSR.
(b)
Not applicable.
ITEM 7 – DISCLOSURE OF PROXY VOTING POLICIES AND PROCEDURES FOR CLOSED-END MANAGEMENT INVESTMENT COMPANIES
Not applicable.
ITEM 8 – PORTFOLIO MANAGERS OF CLOSED-END MANAGEMENT INVESTMENT COMPANIES
Not applicable.
ITEM 9 – PURCHASES OF EQUITY SECURITIES BY CLOSED-END MANAGEMENT INVESTMENT COMPANY AND AFFILIATED PURCHASERS
Not applicable.
ITEM 10 – SUBMISSION OF MATTERS TO A VOTE OF SECURITY HOLDERS
There were no material changes to the procedures by which shareholders may recommend nominees to the Registrant’s Board of Trustees since the date of the Registrant’s prior report on Form N-CSR.
ITEM 11 – CONTROLS AND PROCEDURES
(a)
The Registrant’s Principal Executive and Principal Financial Officers concluded that the Registrant’s disclosure controls and procedures (as defined in Rule 30a-3(c) under the 1940 Act) are effective, based on the evaluation of these disclosure controls and procedures as of a date within 90 days of the filing of this report.
(b)
There was no change in the Registrant’s internal control over financial reporting (as defined in Rule 30a-3(d) under the 1940 Act) that occurred during the period covered by this report that has materially affected, or is reasonably likely to materially affect, the Registrant’s internal control over financial reporting.
ITEM 12 – DISCLOSURE OF SECURITIES LENDING ACTIVITIES FOR CLOSED-END MANAGEMENT INVESTMENT COMPANIES
Not applicable.
ITEM 13 – EXHIBITS
(a) | |
(b) |
SIGNATURES
Pursuant to the requirements of the Securities Exchange Act of 1934 and the Investment Company Act of 1940, the Registrant has duly caused this report to be signed June 23, 2023 on its behalf by the undersigned, thereunto duly authorized.
HARBOR FUNDS
By: /s/ Charles F. McCain
Charles F. McCain
Chairman, President and Trustee
(Principal Executive Officer)
Chairman, President and Trustee
(Principal Executive Officer)
Pursuant to the requirements of the Securities Exchange Act of 1934 and the Investment Company Act of 1940, this report has been signed below by the following persons on behalf of the Registrant and in the capacities and on the dates indicated.
By: | /s/ Charles F. McCain Charles F. McCain | Chairman, President and Trustee (Principal Executive Officer) | June 23, 2023 |
By: | /s/ John M. Paral John M. Paral | Treasurer (Principal Financial and Accounting Officer) | June 23, 2023 |
Exhibit Index
Number | Description |
99.CERT1 | Certification for each principal executive officer and principal financial officer of the Registrant as required by Rule 30a-2(a) under the 1940 Act (17 CFR 270.30a-2(a)). |
99.CERT2 | Certification for each principal executive officer and principal financial officer of the Registrant as required by Rule 30a-2(a) under the 1940 Act (17 CFR 270.30a-2(a)). |
99.906CERT | Certification as required by Section 1350 of Chapter 63 of Title 18 of the United States Code (18 U.S.C. 1350). |