Table of Contents
UNITED STATES
SECURITIES AND EXCHANGE COMMISSION
Washington, D.C. 20549
FORM N-CSR
CERTIFIED SHAREHOLDER REPORT OF REGISTERED
MANAGEMENT INVESTMENT COMPANIES
Investment Company Act file number | 811-5034 |
Legg Mason Partners Funds Trust
| (Exact name of registrant as specified in charter) |
| 125 Broad Street, New York, NY | 10004 | |
| (Address of principal executive offices) | (Zip code) |
Robert I. Frenkel, Esq.
Legg Mason & Co., LLC
300 First Stamford Place, 4th Floor
Stamford, CT 06902
| (Name and address of agent for service) |
Registrant’s telephone number, including area code: (800) 451–2010
Date of fiscal year end: December 31
Date of reporting period: December 31, 2006
Table of Contents
| ITEM 1. | REPORT TO STOCKHOLDERS. |
The Annual Report to Stockholders is filed herewith.
Table of Contents
ANNUAL REPORT
DECEMBER 31, 2006

Legg Mason Partners Funds Trust
Legg Mason Partners National Tax Free Bond Fund
Legg Mason Partners California Tax Free Bond Fund
Legg Mason Partners New York Tax Free Bond Fund
INVESTMENT PRODUCTS: NOT FDIC INSURED Ÿ NO BANK GUARANTEE Ÿ MAY LOSE VALUE
Table of Contents
Legg Mason Partners Funds Trust
Annual Report • December 31, 2006
What’s
Inside
| I | ||
Legg Mason Partners National Tax Free Bond Fund: | ||
| 1 | ||
| 4 | ||
| 5 | ||
| 7 | ||
| 8 | ||
Legg Mason Partners California Tax Free Bond Fund: | ||
| 9 | ||
| 12 | ||
| 13 | ||
| 15 | ||
| 16 | ||
Legg Mason Partners New York Tax Free Bond Fund: | ||
| 17 | ||
| 20 | ||
| 21 | ||
| 23 | ||
| 24 | ||
| 25 | ||
| 36 | ||
| 37 | ||
| 38 | ||
| 41 | ||
| 53 | ||
| 66 | ||
| 67 | ||
| 73 | ||
| 77 | ||
Table of Contents

R. JAY GERKEN, CFA
Chairman, President and Chief Executive Officer
Dear Shareholder,
U.S. economic growth was mixed during the 12-month reporting period. After gross domestic product (“GDP”)i increased 1.7% in the fourth quarter of 2005, the economy then rebounded sharply in the first quarter of 2006. Over this period, GDP rose 5.6%, its best showing since the third quarter of 2003. In the second quarter of 2006, GDP growth was 2.6% and it further moderated to 2.0% in the third quarter. The economy then strengthened in the fourth quarter, due largely to increased consumer spending. Over this time, the advance estimate for GDP growth was 3.5%.
After increasing the federal funds rateii to 5.25% in June—its 17th consecutive rate hike—the Federal Reserve Board (“Fed”)iii paused from raising rates at its next five meetings. In its statement accompanying the January 2007 meeting, the Fed stated, “Recent indicators have suggested somewhat firmer economic growth, and some tentative signs of stabilization have appeared in the housing market. Readings on core inflation have improved modestly in recent months, and inflation pressures seem likely to moderate over time.”
During the reporting period, short- and long-term Treasury yields experienced periods of significant volatility. After peaking in late June—with two- and 10-year Treasuries hitting 5.29% and 5.25%, respectively—rates fell sharply as the Fed paused from its tightening cycle. In addition, inflationary pressures eased as oil prices fell after reaching a record high in mid-July. Overall, during the 12 months ended December 31, 2006, two-year Treasury yields increased to 4.82% versus 4.41% when the reporting period began. Over the same period, 10-year Treasury yields moved from 4.39% to 4.71%.
Looking at the municipal market, it outperformed its taxable bond counterparts over the 12-months ended December 31, 2006. Over that period, the Lehman Brothers
Legg Mason Partners Funds Trust I
Table of Contents
Municipal Bond Indexiv and the Lehman Brothers U.S. Aggregate Indexv, returned 4.84% and 4.33%, respectively.
Please read on for a more detailed look at prevailing economic and market conditions during the Funds’ fiscal year and to learn how those conditions have affected each Fund’s performance.
Special Shareholder Notices
Effective August 1, 2006, Legg Mason Partners Fund Advisor, LLC (“LMPFA”) became each Fund’s investment manager and Western Asset Management Company (“Western Asset”) became each Fund’s subadviser. The portfolio managers who are responsible for the day-to-day management of the Funds remained the same immediately prior to and immediately after the date of these changes. LMPFA and Western Asset are wholly-owned subsidiaries of Legg Mason, Inc.
Certain changes regarding share class pricing and related matters were implemented on November 20, 2006.
Legg Mason Partners National Tax Free Bond Fund
Shareholder approval of a reorganization pursuant to which the Fund’s assets will be acquired, and its liabilities assumed by Legg Mason Partners Managed Municipals Fund, Inc. (the “Acquiring Fund”), in exchange for shares of the Acquiring Fund has been obtained. It is expected that the Fund will be terminated, and shares of the Acquiring Fund will be distributed to Fund shareholders on or about March 2, 2007.
Prior to November 20, 2006, the Fund was known as Salomon Brothers National Tax Free Bond Fund.
Legg Mason Partners California Tax Free Bond Fund
Shareholder approval of a reorganization pursuant to which the Fund’s assets will be acquired, and its liabilities assumed by Legg Mason Partners California Municipals Fund, Inc. (the “Acquiring Fund”), in exchange for shares of the Acquiring Fund has been obtained. It is expected that the
II Legg Mason Partners Funds Trust
Table of Contents
Fund will be terminated, and shares of the Acquiring Fund will be distributed to Fund shareholders on or about March 2, 2007.
Prior to November 20, 2006, the Fund was known as Salomon Brothers California Tax Free Bond Fund.
Legg Mason Partners New York Tax Free Bond Fund
Shareholder approval of a reorganization pursuant to which the Fund’s assets will be acquired, and its liabilities assumed by Legg Mason Partners New York Municipals Fund (the “Acquiring Fund”), in exchange for shares of the Acquiring Fund has been obtained. It is expected that the Fund will be terminated, and shares of the Acquiring Fund will be distributed to Fund shareholders on or about March 2, 2007.
Prior to November 20, 2006, the Fund was known as Salomon Brothers New York Tax Free Bond Fund.
Information About Your Funds
As you may be aware, several issues in the mutual fund industry have come under the scrutiny of federal and state regulators. Affiliates of the Funds’ manager have, in recent years, received requests for information from various government regulators regarding market timing, late trading, fees, and other mutual fund issues in connection with various investigations. The regulators appear to be examining, among other things, the Funds’ response to market timing and shareholder exchange activity, including compliance with prospectus disclosure related to these subjects. The Funds are not in a position to predict the outcome of these requests and investigations.
Important information with regard to recent regulatory developments that may affect the Funds is contained in the Notes to Financial Statements included in this report.
Legg Mason Partners Funds Trust III
Table of Contents
As always, thank you for your confidence in our stewardship of your assets. We look forward to helping you meet your financial goals.
Sincerely,

R. Jay Gerken, CFA
Chairman, President and Chief Executive Officer
January 31, 2007
IV Legg Mason Partners Funds Trust
All index performance reflects no deduction for fees, expenses or taxes. Please note that an investor cannot invest directly in an index.
i | Gross domestic product is a market value of goods and services produced by labor and property in a given country. |
ii | The federal funds rate is the interest rate that banks with excess reserves at a Federal Reserve district bank charge other banks that need overnight loans. |
iii | The Federal Reserve Board is responsible for the formulation of a policy designed to promote economic growth, full employment, stable prices, and a sustainable pattern of international trade and payments. |
iv | The Lehman Brothers Municipal Bond Index is a broad measure of the municipal bond market with maturities of at least one year. |
v | The Lehman Brothers U.S. Aggregate Index is a broad-based bond index comprised of government, corporate, mortgage and asset-backed issues, rated investment grade or higher, and having at least one year to maturity. |
Table of Contents
Legg Mason Partners National Tax Free Bond Fund
Q. What were the overall market conditions during the Fund’s reporting period?
A. The economy weakened during the period due, in part, to the lagged effect of higher short-term interest rates and a rapidly cooling housing market. Inflationary pressures intensified during the first half of the reporting period. However, as oil prices retreated from their July record high and housing prices moderated, inflation became less of an issue. The Federal Reserve Board (“Fed”)i boosted its target federal funds rateii from 4.25% when the reporting period began to 5.25% in June 2006. The Fed then held rates steady during the remainder of the year.
The Treasury yield curveiii flattened in 2006 as the difference between short- and long-term yields narrowed. Overall, during the 12-months ended December 31, 2006, two-year Treasury yields increased from 4.41% to 4.82%. Over the same period, 10-year Treasury yields moved from 4.39% to 4.71%. Throughout much of 2006, the Treasury yield curve was inverted, with two-year Treasury yields surpassing their 10-year counterparts. This anomaly has often been a precursor of slowing economic growth and, in many cases, a recession.iv
The municipal yield curve continued to flatten over the last year and the spreads between two- and 10-year securities tightened to near historically low levels. As was the case in 2005, longer-term and lower-rated municipal bonds generated the strongest results during the 12-month period ended December 31, 2006.v
Performance Review
For the 12 months ended December 31, 2006, Class A shares of Legg Mason Partners National Tax Free Bond Fund, excluding sales charges, returned 3.70%. These shares underperformed the Lipper General Municipal Debt Funds Category Average1, which increased 4.50%. The Fund’s unmanaged benchmarks, the Lehman Brothers Municipal 4 Years Plus Bond Indexvi and Lehman Brothers Municipal Bond Indexvii, returned 5.21% and 4.84%, respectively, for the same period.
Certain investors may be subject to the Federal Alternative Minimum Tax, and state and local taxes will apply. Capital gains, if any, are fully taxable. Please consult your personal tax or legal adviser.
1 Lipper, Inc. is a major independent mutual-fund tracking organization. Returns are based on the 12-month period ended December 31, 2006, including the reinvestment of all distributions, including returns of capital, if any, calculated among the 257 funds in the Fund’s Lipper category, and excluding sales charges
Legg Mason Partners Funds Trust 2006 Annual Report 1
Table of Contents
| Performance Snapshot as of December 31, 2006 (excluding sales charges) (unaudited) | ||||
| 6 months | 12 months | |||
National Tax Free Bond Fund — Class A Shares | 4.08% | 3.70% | ||
Lehman Brothers Municipal 4 Years Plus Bond Index | 4.99% | 5.21% | ||
Lehman Brothers Municipal Bond Index | 4.55% | 4.84% | ||
Lipper General Municipal Debt Funds Category Average | 4.26% | 4.50% | ||
| The performance shown represents past performance. Past performance is no guarantee of future results and current performance may be higher or lower than the performance shown above. Principal value, investment returns and yields will fluctuate and investors’ shares, when redeemed, may be worth more or less than their original cost. Current reimbursements and/or fee waivers are voluntary, and may be reduced or terminated at any time. Absent these reimbursements or waivers, performance would have been lower. To obtain performance data current to the most recent month-end, please visit our website at www.leggmason.com/InvestorServices. | ||||
| Excluding sales charges, Class B shares returned 3.68%, Class C shares returned 3.90% and Class O shares returned 4.20% over the six months ended December 31, 2006. Excluding sales charges, Class B shares returned 3.02%, Class C shares returned 3.27%, and Class O shares returned 4.05% over the twelve months ended December 31, 2006. All share class returns assume the reinvestment of all distributions, including returns of capital, if any, at net asset value and the deduction of all Fund expenses. Returns have not been adjusted to include sales charges that may apply when shares are purchased or the deduction of taxes that a shareholder would pay on Fund distributions. | ||||
| The 30-Day SEC Yields for Class A, Class B, Class C, and Class O shares were 3.49%, 2.89%, 3.14%, and 3.89%, respectively. Absent current reimbursements or waivers, the 30-Day SEC Yields for Class A, Class B, Class C and Class O shares would have been, 2.83%, 2.14%, 2.54% and 3.01%, respectively. | ||||
| The 30-Day SEC Yield is the average annualized net investment income per share for the 30-day period indicated and is subject to change. | ||||
| Lipper, Inc. is a major independent mutual-fund tracking organization. Returns are based on the period ended December 31, 2006, including the reinvestment of all distributions, including returns of capital, if any, calculated among the 265 funds for the six-month period and among the 257 funds for the 12-month period in the Fund’s Lipper category and excluding sales charges. | ||||
Q. What were the most significant factors affecting Fund performance?
What were the leading contributors to performance?
A. The Fund benefited from the pre-refunding of several of its securities during the reporting period. In addition, its tactical credit exposure enhanced results.
What were the leading detractors from performance?
A. The Fund was underweight in lower quality, more speculative issues during the year. This positioning hurt the Fund’s performance as lower quality municipal bonds outperformed their higher quality counterparts. Based on our expectations for higher interest rates, the Fund did not have as large an exposure to the long end of the curve as its benchmark. This detracted from results given the flattening of the municipal yield curve.
2 Legg Mason Partners Funds Trust 2006 Annual Report
Table of Contents
Q. Were there any significant changes to the Fund during the reporting period?
A. There were no significant changes to the Fund’s portfolio.
Thank you for your investment in Legg Mason Partners National Tax Free Bond Fund. As always, we appreciate that you have chosen us to manage your assets.
Sincerely,
Western Asset Management Company
January 26, 2007
The information provided is not intended to be a forecast of future events, a guarantee of future results or investment advice. Views expressed may differ from those of the firm as a whole.
RISKS: The Fund is a non-diversified mutual fund. This means that the Fund may invest a relatively high percentage of its assets in the obligations of a limited number of issuers. Investments in bonds are subject to interest rate and credit risks. As interest rates rise, bond prices fall, reducing the value of the Fund’s share price. The Fund may use derivatives, such as options or futures, which can be illiquid, may disproportionately increase losses, and have a potentially large impact on the Fund’s performance. Please see the Fund’s prospectus for more information on these and other risks.
All index performance reflects no deduction for fees, expenses or taxes. Please note an investor cannot invest directly in an index.
i | The Federal Reserve Board is responsible for the formulation of a policy designed to promote economic growth, full employment, stable prices, and a sustainable pattern of international trade and payments. |
ii | The federal funds rate is the interest rate that banks with excess reserves at a Federal Reserve district bank charge other banks that need overnight loans. |
iii | The yield curve is the graphical depiction of the relationship between the yield on bonds of the same credit quality but different maturities. |
iv | Source: The Wall Street Journal, 1/07. |
v | Source: The Bond Buyer, 1/07. |
vi | The Lehman Brothers 4 Years Plus Bond Index is a broad measure of the municipal bond market with maturities of at least four years. |
vii | The Lehman Brothers Municipal Bond Index is a broad measure of the municipal bond market with maturities of at least one year. |
Legg Mason Partners Funds Trust 2006 Annual Report 3
Table of Contents
Legg Mason Partners National Tax Free Bond Fund
4 Legg Mason Partners Funds Trust 2006 Annual Report
Table of Contents
Example
As a shareholder of the Fund, you may incur two types of costs: (1) transaction costs, including front-end and back-end sales charges (loads) on purchase payments and (2) ongoing costs, including management fees; distribution and/or service (12b-1) fees; and other Fund expenses. This example is intended to help you understand your ongoing costs (in dollars) of investing in the Fund and to compare these costs with the ongoing costs of investing in other mutual funds.
This example is based on an investment of $1,000 invested on July 1, 2006 and held for the six months ended December 31, 2006.
Actual Expenses
The table below titled “Based on Actual Total Return” provides information about actual account values and actual expenses. You may use the information provided in this table, together with the amount you invested, to estimate the expenses that you paid over the period. To estimate the expenses you paid on your account, divide your ending account value by $1,000 (for example, an $8,600 ending account value divided by $1,000 = 8.6), then multiply the result by the number under the heading entitled “Expenses Paid During the Period”.
| Based on Actual Total Return(1) | |||||||||||||||
| Legg Mason Partners National Tax Free Bond Fund | Actual Total Return Without Sales Charges(2) | Beginning Account Value | Ending Account Value | Annualized Expense Ratio(3) | Expenses Paid During the Period(4) | ||||||||||
Class A | 4.08 | % | $ | 1,000.00 | $ | 1,040.80 | 0.75 | % | $ | 3.86 | |||||
Class B | 3.68 | 1,000.00 | 1,036.80 | 1.50 | 7.70 | ||||||||||
Class C | 3.90 | 1,000.00 | 1,039.00 | 1.25 | 6.42 | ||||||||||
Class O | 4.20 | 1,000.00 | 1,042.00 | 0.50 | 2.57 | ||||||||||
(1) | For the six months ended December 31, 2006. |
(2) | Assumes reinvestment of all distributions, including returns of capital, if any, at net asset value and does not reflect the deduction of the applicable sales charge with respect to Class A shares or the applicable contingent deferred sales charge (“CDSC”) with respect to Class B and C shares. Total return is not annualized, as it may not be representative of the total return for the year. Performance figures may reflect fee waivers and/or expense reimbursements. Past performance is no guarantee of future results. In the absence of fee waivers and/or expense reimbursements, the total return would have been lower. |
(3) | The expense ratios do not include the non-recurring restructuring and/or reorganization fees. |
(4) | Expenses (net of fee waivers and/or expense reimbursements) are equal to each class’ respective annualized expense ratio multiplied by the average account value over the period, multiplied by the number of days in the most recent fiscal half-year, then divided by 365. |
Legg Mason Partners Funds Trust 2006 Annual Report 5
Table of Contents
Fund Expenses (unaudited) (continued)
Hypothetical Example for Comparison Purposes
The table below titled “Based on Hypothetical Total Return” provides information about hypothetical account values and hypothetical expenses based on the actual expense ratio and an assumed rate of return of 5.00% per year before expenses, which is not the Fund’s actual return. The hypothetical account values and expenses may not be used to estimate the actual ending account balance or expenses you paid for the period. You may use the information provided in this table to compare the ongoing costs of investing in the Fund and other funds. To do so, compare the 5.00% hypothetical example relating to the Fund with the 5.00% hypothetical examples that appear in the shareholder reports of the other funds.
Please note that the expenses shown in the table below are meant to highlight your ongoing costs only and do not reflect any transactional costs, such as front-end or back-end sales charges (loads). Therefore, the table is useful in comparing ongoing costs only, and will not help you determine the relative total costs of owning different funds. In addition, if these transaction costs were included, your costs would have been higher.
| Based on Hypothetical Total Return(1) | |||||||||||||||
| Legg Mason Partners National Tax Free Bond Fund | Hypothetical Annualized Total Return | Beginning Account Value | Ending Account Value | Annualized Expense Ratio(2) | Expenses Paid During the Period(3) | ||||||||||
Class A | 5.00 | % | $ | 1,000.00 | $ | 1,021.42 | 0.75 | % | $ | 3.82 | |||||
Class B | 5.00 | 1,000.00 | 1,017.64 | 1.50 | 7.63 | ||||||||||
Class C | 5.00 | 1,000.00 | 1,018.90 | 1.25 | 6.36 | ||||||||||
Class O | 5.00 | 1,000.00 | 1,022.68 | 0.50 | 2.55 | ||||||||||
(1) | For the six months ended December 31, 2006. |
(2) | The expense ratios do not include the non-recurring restructuring and/or reorganization fees. |
(3) | Expenses (net of fee waivers and/or expense reimbursements) are equal to each class’ respective annualized expense ratio multiplied by the average account value over the period, multiplied by the number of days in the most recent fiscal half-year, then divided by 365. |
6 Legg Mason Partners Funds Trust 2006 Annual Report
Table of Contents
Legg Mason Partners National Tax Free Bond Fund
| Average Annual Total Returns(1) (unaudited) | ||||||||||||
| Without Sales Charges(2) | ||||||||||||
| Class A | Class B | Class C | Class O | |||||||||
Twelve Months Ended 12/31/06 | 3.70 | % | 3.02 | % | 3.27 | % | 4.05 | % | ||||
Five Years Ended 12/31/06 | 4.98 | 4.21 | 4.49 | 5.27 | ||||||||
Ten Years Ended 12/31/06 | 5.71 | N/A | N/A | N/A | ||||||||
Inception* through 12/31/06 | 5.97 | 3.61 | 3.96 | 4.73 | ||||||||
| With Sales Charges(3) | ||||||||||||
| Class A(4) | Class B(5) | Class C | Class O | |||||||||
Twelve Months Ended 12/31/06 | (0.69 | )% | (1.48 | )% | 2.27 | % | 4.05 | % | ||||
Five Years Ended 12/31/06 | 4.08 | 4.04 | 4.49 | 5.27 | ||||||||
Ten Years Ended 12/31/06 | 5.25 | N/A | N/A | N/A | ||||||||
Inception* through 12/31/06 | 5.57 | 3.61 | 3.96 | 4.73 | ||||||||
| Cumulative Total Returns(1) (unaudited) | ||||||||||
| Without Sales Charges(2) | ||||||||||
Class A (12/31/96 through 12/31/06) | 74.29% | |||||||||
Class B (Inception* through 12/31/06) | 20.35 | |||||||||
Class C (Inception* through 12/31/06) | 21.95 | |||||||||
Class O (Inception* through 12/31/06) | 26.69 | |||||||||
(1) | All figures represent past performance and are not a guarantee of future results. Investment return and principal value of an investment will fluctuate so that an investor’s shares, when redeemed, may be worth more or less than their original cost. The returns shown do not reflect the deduction of taxes that a shareholder would pay on Fund distributions or the redemption of Fund shares. Performance figures may reflect fee waivers and/or expense reimbursements. In the absence of fee waivers and/or expense reimbursements, the total return would have been lower. |
(2) | Assumes reinvestment of all distributions, including returns of capital, if any, at net asset value and does not reflect the deduction of the applicable sales charge with respect to Class A shares or the applicable CDSC with respect to Class B and C shares. |
(3) | Assumes reinvestment of all distributions, including returns of capital, if any, at net asset value. In addition, Class A shares reflect the deduction of the maximum initial sales charge of 4.25%; Class B shares reflect the deduction of a 4.50% CDSC, which applies if shares are redeemed within one year from purchase payment. This CDSC declines by 0.50% the first year after purchase and thereafter by 1.00% per year until no CDSC is incurred. Class C shares reflect the deduction of a 1.00% CDSC, which applies if shares are redeemed within one year from purchase payment. |
(4) | Class A shares maximum initial sales charge increased from 4.00% to 4.25% on November 20, 2006. |
(5) | Class B shares CDSC increased from 4.00% to 4.50% on November 20, 2006. |
| * | Inception dates for Class A and B shares are August 17, 1995 and October 12, 2001, respectively. Inception date for Class C and O shares is November 19, 2001. |
Legg Mason Partners Funds Trust 2006 Annual Report 7
Table of Contents
Historical Performance (unaudited)
Value of $10,000 Invested in Class A Shares of the Legg Mason Partners National Tax Free Bond Fund vs. Lehman Brothers Municipal 4 Years Plus Bond Index† (December 1996 — December 2006)
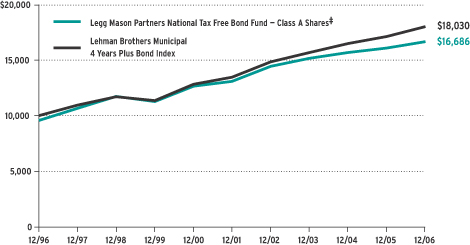
| † | Hypothetical illustration of $10,000 invested in Class A shares on December 31, 1996, assuming deduction of the maximum initial sales charge of 4.25% at the time of investment and reinvestment of all distributions, including returns of capital, if any, at net asset value through December 31, 2006. The Lehman Brothers Municipal 4 Years Plus Bond Index is valued at month end only. The Index is unmanaged and is not subject to the same management and trading expenses as a mutual fund. Please note that an investor cannot invest directly in an index. The performance of the Fund’s other classes may be greater or less than the Class A shares’ performance indicated on this chart, depending on whether greater or lesser sales charges and fees were incurred by shareholders investing in the other classes. |
| ‡ | Class A shares maximum initial sales charge increased from 4.00% to 4.25% on November 20, 2006. |
All figures represent past performance and are not a guarantee of future results. Investment return and principal value of an investment will fluctuate so that an investor’s shares, when redeemed, may be worth more or less than their original cost. The returns shown do not reflect the deduction of taxes that a shareholder would pay on Fund distributions or the redemption of Fund shares. Performance figures may reflect fee waivers and/or expense reimbursements. In the absence of fee waivers and/or expense reimbursements, the total return would have been lower.
8 Legg Mason Partners Funds Trust 2006 Annual Report
Table of Contents
Legg Mason Partners California Tax Free Bond Fund
Q. What were the overall market conditions during the Fund’s reporting period?
A. The economy weakened during the period due, in part, to the lagged effect of higher short-term interest rates and a rapidly cooling housing market. Inflationary pressures intensified during the first half of the reporting period. However, as oil prices retreated from their July record high and housing prices moderated, inflation became less of an issue. The Federal Reserve Board (“Fed”)i boosted its target federal funds rateii from 4.25% when the reporting period began to 5.25% in June 2006. The Fed then held rates steady during the remainder of the year.
The Treasury yield curveiii flattened in 2006 as the difference between short- and long-term yields narrowed. Overall, during the 12-months ended December 31, 2006, two-year Treasury yields increased from 4.41% to 4.82%. Over the same period, 10-year Treasury yields moved from 4.39% to 4.71%. Throughout much of 2006, the Treasury yield curve was inverted, with two-year Treasury yields surpassing their 10-year counterparts. This anomaly has often been a precursor of slowing economic growth and, in many cases, a recession.iv
The municipal yield curve continued to flatten over the last year and the spreads between two- and 10-year securities tightened to near historically low levels. As was the case in 2005, longer-term and lower-rated municipal bonds generated the strongest results during the 12-month period ended December 31, 2006.v
Performance Review
For the 12 months ended December 31, 2006, Class A shares of Legg Mason Partners California Tax Free Bond Fund, excluding sales charges, returned 2.77%. These shares underperformed the Lipper California Municipal Debt Funds Category Average1, which increased 4.55%. The Fund’s unmanaged benchmarks, the Lehman Brothers Municipal California 4 Years Plus Bond Indexvi and the Lehman Brothers Municipal Bond Indexvii, returned 5.47% and 4.84%, respectively, for the same period.
Certain investors may be subject to the Federal Alternative Minimum Tax, and state and local taxes may apply. Capital gains, if any, are fully taxable. Please consult your personal tax or legal adviser.
1 | Lipper, inc. is a major independent mutual-fund tracking organization. Returns are based on the 12-month period ended December 31, 2006, including the reinvestment of distributions, including returns of capital, if any, calculated among the 116 funds in the Fund’s Lipper category and excluding sales charges. |
Legg Mason Partners Funds Trust 2006 Annual Report 9
Table of Contents
| Performance Snapshot as of December 31, 2006 (excluding sales charges) (unaudited) | ||||
| 6 months | 12 months | |||
California Tax Free Bond Fund — Class A Shares | 3.57% | 2.77% | ||
Lehman Brothers California 4 Years Plus Bond Index | 5.14% | 5.47% | ||
Lehman Brothers Municipal Bond Index | 4.55% | 4.84% | ||
Lipper California Municipal Debt Fund Category Average | 4.38% | 4.55% | ||
| The performance shown represents past performance. Past performance is no guarantee of future results and current performance may be higher or lower than the performance shown above. Principal value, investment returns and yields will fluctuate and investors’ shares, when redeemed, may be worth more or less than their original cost. Current reimbursements and/or fee waivers are voluntary, and may be reduced or terminated at any time. Absent these reimbursements or waivers, performance would have been lower. To obtain performance data current to the most recent month-end, please visit our website at www.leggmason.com/InvestorServices. | ||||
| Excluding sales charges, Class B shares returned 3.28%, Class C shares returned 3.31%, and Class O shares returned 3.71% over the six months ended December 31, 2006. Excluding sales charges, Class B shares returned 2.11%, Class C shares returned 2.27% and Class O shares returned 3.13% over the twelve months ended December 31, 2006. All share class returns assume the reinvestment of all distributions, including returns of capital, if any, at net asset value and the deduction of all Fund expenses. Returns have not been adjusted to include sales charges that may apply when shares are purchased or the deduction of taxes that a shareholder would pay on Fund distributions. | ||||
| The 30-Day SEC Yields for Class A, Class B, Class C, and Class O shares were 3.51%, 2.91%, 3.16% and 3.80%, respectively. Absent current reimbursements or waivers, the 30-Day SEC Yields for Class A, Class B, Class C, and Class O shares would have been 2.87%, 1.86%, 1.96% and –8.61%, respectively. | ||||
| The 30-Day SEC Yield is the average annualized net investment income per share for the 30-day period indicated and is subject to change. | ||||
| Lipper, Inc. is a major independent mutual-fund tracking organization. Returns are based on the period ended December 31, 2006, including the reinvestment of all distributions, including returns of capital, if any, calculated among the 120 funds for the six-month period and among the 116 funds for the 12-month period in the Fund’s Lipper category and excluding sales charges. | ||||
Q. What were the most significant factors affecting Fund performance?
What were the leading contributors to performance?
A. The Fund benefited from the pre-refunding of several of its securities during the reporting period. In addition, its tactical credit exposure enhanced results.
What were the leading detractors from performance?
A. The Fund was underweight in lower quality, more speculative issues during the year. This positioning hurt the Fund’s performance as lower quality municipal bonds outperformed their higher quality counterparts. Based on our expectations for higher interest rates, the Fund did not have as large an exposure to the long end of the curve as its benchmark. This detracted from results given the flattening of the municipal yield curve.
10 Legg Mason Partners Funds Trust 2006 Annual Report
Table of Contents
Q. Were there any significant changes to the Fund during the reporting period?
A. There were no significant changes to the Fund’s portfolio.
Thank you for your investment in Legg Mason Partners California Tax Free Bond Fund. As always, we appreciate that you have chosen us to manage your assets.
Sincerely,
Western Asset Management Company
January 26, 2007
The information provided is not intended to be a forecast of future events, a guarantee of future results or investment advice. Views expressed may differ from those of the firm as a whole.
RISKS: The Fund is not diversified, which means that it is permitted to invest a higher percentage of its assets in any one issuer than a diversified fund. This may magnify the Fund’s losses from events affecting a particular issuer. Investments in bonds are subject to interest rate and credit risks. As interest rates rise, bond prices fall, reducing the value of the Fund’s share price. The Fund may use derivatives, such as options or futures, which can be illiquid, may disproportionately increase losses, and have a potentially large impact on the Fund’s performance. Please see the Fund’s prospectus for more information on these and other risks.
All index performance reflects no deduction for fees, expenses or taxes. Please note an investor cannot invest directly in an index.
i | The Federal Reserve Board is responsible for the formulation of a policy designed to promote economic growth, full employment, stable prices, and a sustainable pattern of international trade and payments. |
ii | The federal funds rate is the interest rate that banks with excess reserves at a Federal Reserve district bank charge other banks that need overnight loans. |
iii | The yield curve is the graphical depiction of the relationship between the yield on bonds of the same credit quality but different maturities. |
iv | Source: The Wall Street Journal, 1/07. |
v | Source: The Bond Buyer, 1/07. |
vi | The Lehman Brothers California 4 Years Plus Bond Index is a broad measure of the California municipal bond market with maturities of at least four years. |
vii | The Lehman Brothers Municipal Bond Index is a broad measure of the municipal bond market with maturities of at least one year. |
Legg Mason Partners Funds Trust 2006 Annual Report 11
Table of Contents
Legg Mason Partners California Tax Free Bond Fund
12 Legg Mason Partners Funds Trust 2006 Annual Report
Table of Contents
Example
As a shareholder of the Fund, you may incur two types of costs: (1) transaction costs, including front-end and back-end sales charges (loads) on purchase payments and (2) ongoing costs, including management fees; distribution and/or service (12b-1) fees; and other Fund expenses. This example is intended to help you understand your ongoing costs (in dollars) of investing in the Fund and to compare these costs with the ongoing costs of investing in other mutual funds.
This example is based on an investment of $1,000 invested on July 1, 2006 and held for the six months ended December 31, 2006.
Actual Expenses
The table below titled “Based on Actual Total Return” provides information about actual account values and actual expenses. You may use the information provided in this table, together with the amount you invested, to estimate the expenses that you paid over the period. To estimate the expenses you paid on your account, divide your ending account value by $1,000 (for example, an $8,600 ending account value divided by $1,000 = 8.6), then multiply the result by the number under the heading entitled “Expenses Paid During the Period”.
| Based on Actual Total Return(1) | |||||||||||||||
| Legg Mason Partners California Tax Free Bond Fund | Actual Total Return Without Sales Charges(2) | Beginning Account Value | Ending Account Value | Annualized Expense Ratio(3) | Expenses Paid During the Period(4) | ||||||||||
Class A | 3.57 | % | $ | 1,000.00 | $ | 1,035.70 | 0.80 | % | $ | 4.10 | |||||
Class B | 3.28 | 1,000.00 | 1,032.80 | 1.55 | 7.94 | ||||||||||
Class C | 3.31 | 1,000.00 | 1,033.10 | 1.30 | 6.66 | ||||||||||
Class O | 3.71 | 1,000.00 | 1,037.10 | 0.53 | 2.72 | ||||||||||
(1) | For the six months ended December 31, 2006. |
(2) | Assumes reinvestment of all distributions, including returns of capital, if any, at net asset value and does not reflect the deduction of the applicable sales charge with respect to Class A shares or the applicable CDSC with respect to Class B and C shares. Total return is not annualized, as it may not be representative of the total return for the year. Performance figures may reflect fee waivers and/or expense reimbursements. Past performance is no guarantee of future results. In the absence of fee waivers and/or expense reimbursements, the total return would have been lower. |
(3) | The expense ratios do not include the non-recurring restructuring and/or reorganization fees. |
(4) | Expenses (net of fee waivers and/or expense reimbursements) are equal to each class’ respective annualized expense ratio multiplied by the average account value over the period, multiplied by the number of days in the most recent fiscal half-year, then divided by 365. |
Legg Mason Partners Funds Trust 2006 Annual Report 13
Table of Contents
Fund Expenses (unaudited) (continued)
Hypothetical Example for Comparison Purposes
The table below titled “Based on Hypothetical Total Return” provides information about hypothetical account values and hypothetical expenses based on the actual expense ratio and an assumed rate of return of 5.00% per year before expenses, which is not the Fund’s actual return. The hypothetical account values and expenses may not be used to estimate the actual ending account balance or expenses you paid for the period. You may use the information provided in this table to compare the ongoing costs of investing in the Fund and other funds. To do so, compare the 5.00% hypothetical example relating to the Fund with the 5.00% hypothetical examples that appear in the shareholder reports of the other funds.
Please note that the expenses shown in the table below are meant to highlight your ongoing costs only and do not reflect any transactional costs, such as front-end or back-end sales charges (loads). Therefore, the table is useful in comparing ongoing costs only, and will not help you determine the relative total costs of owning different funds. In addition, if these transaction costs were included, your costs would have been higher.
| Based on Hypothetical Total Return(1) | |||||||||||||||
| Legg Mason Partners California Tax Free Bond Fund | Hypothetical Annualized Total Return | Beginning Account Value | Ending Account Value | Annualized Expense Ratio(2) | Expenses Paid During the Period(3) | ||||||||||
Class A | 5.00 | % | $ | 1,000.00 | $ | 1,021.17 | 0.80 | % | $ | 4.08 | |||||
Class B | 5.00 | 1,000.00 | 1,017.39 | 1.55 | 7.88 | ||||||||||
Class C | 5.00 | 1,000.00 | 1,018.65 | 1.30 | 6.61 | ||||||||||
Class O | 5.00 | 1,000.00 | 1,022.53 | 0.53 | 2.70 | ||||||||||
(1) | For the six months ended December 31, 2006. |
(2) | The expense ratios do not include the non-recurring restructuring and/or reorganization fees. |
(3) | Expenses (net of fee waivers and/or expense reimbursements) are equal to each class’ respective annualized expense ratio multiplied by the average account value over the period, multiplied by the number of days in the most recent fiscal half-year, then divided by 365. |
14 Legg Mason Partners Funds Trust 2006 Annual Report
Table of Contents
Legg Mason Partners California Tax Free Bond Fund
| Average Annual Total Returns(1) (unaudited) | ||||||||||||
| Without Sales Charges(2) | ||||||||||||
| Class A | Class B | Class C | Class O | |||||||||
Twelve Months Ended 12/31/06 | 2.77 | % | 2.11 | % | 2.27 | % | 3.13 | % | ||||
Five Years Ended 12/31/06 | 3.99 | 3.24 | N/A | N/A | ||||||||
Inception* through 12/31/06 | 4.30 | 2.61 | 2.15 | 2.83 | ||||||||
| With Sales Charges(3) | ||||||||||||
| Class A(4) | Class B(5) | Class C | Class O | |||||||||
Twelve Months Ended 12/31/06 | (1.60 | )% | (2.35 | )% | 1.28 | % | 3.13 | % | ||||
Five Years Ended 12/31/06 | 3.10 | 3.06 | N/A | N/A | ||||||||
Inception* through 12/31/06 | 3.76 | 2.61 | 2.15 | 2.83 | ||||||||
| Cumulative Total Returns(1) (unaudited) | ||||||||||
| Without Sales Charges(2) | ||||||||||
Class A (Inception* through 12/31/06) | 41.05% | |||||||||
Class B (Inception* through 12/31/06) | 14.47 | |||||||||
Class C (Inception* through 12/31/06) | 9.60 | |||||||||
Class O (Inception* through 12/31/06) | 12.51 | |||||||||
(1) | All figures represent past performance and are not a guarantee of future results. Investment return and principal value of an investment will fluctuate so that an investor’s shares, when redeemed, may be worth more or less than their original cost. The returns shown do not reflect the deduction of taxes that a shareholder would pay on Fund distributions or the redemption of Fund shares. Performance figures may reflect fee waivers and/or expense reimbursements. In the absence of fee waivers and/or expense reimbursements, the total return would have been lower. |
(2) | Assumes reinvestment of all distributions, including returns of capital, if any, at net asset value and does not reflect the deduction of the applicable sales charge with respect to Class A shares or the applicable CDSC with respect to Class B and C shares. |
(3) | Assumes reinvestment of all distributions, including returns of capital, if any, at net asset value. In addition, Class A shares reflect the deduction of the maximum initial sales charge of 4.25%; Class B shares reflect the deduction of a 4.50% CDSC, which applies if shares are redeemed within one year from purchase payment. This CDSC declines by 0.50% the first year after purchase and thereafter by 1.00% per year until no CDSC is incurred. Class C shares also reflect the deduction of a 1.00% CDSC, which applies if shares are redeemed within one year from purchase payment. |
(4) | Class A shares maximum initial sales charge increased from 4.00% to 4.25% on November 20, 2006. |
(5) | Class B shares CDSC increased from 4.00% to 4.50% on November 20, 2006. |
| * | Inception dates for Class A, B, C and O shares are November 2, 1998, October 5, 2001, September 9, 2002 and October 8, 2002, respectively. |
Legg Mason Partners Funds Trust 2006 Annual Report 15
Table of Contents
Historical Performance (unaudited)
Value of $10,000 Invested in Class A Shares of the Legg Mason Partners California Tax Free Bond Fund vs. Lehman Brothers California 4 Years Plus Bond Index† (November 1998 — December 2006)
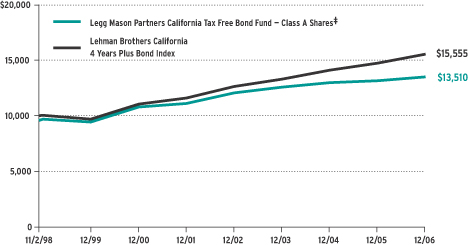
| † | Hypothetical illustration of $10,000 invested in Class A shares at inception on November 2, 1998, assuming deduction of the maximum initial sales charge of 4.25% at the time of investment and reinvestment of all distributions, including returns of capital, if any, at net asset value through December 31, 2006. The Lehman Brothers California 4 Years Plus Bond Index is valued at month end only. As a result, while the Fund’s total return calculations used in this comparison are for the period November 2, 1998 through December 31, 2006, the combined Index returns are for the period October 31, 1998 through December 31, 2006. The Index is unmanaged and is not subject to the same management and trading expenses as a mutual fund. Please note that an investor cannot invest directly in an index. The performance of the Fund’s other classes may be greater or less than the Class A shares’ performance indicated on this chart, depending on whether greater or lesser sales charges and fees were incurred by shareholders investing in the other classes. |
| ‡ | Class A shares maximum initial sales charge increased from 4.00% to 4.25% on November 20, 2006. |
All figures represent past performance and are not a guarantee of future results. Investment return and principal value of an investment will fluctuate so that an investor’s shares, when redeemed, may be worth more or less than their original cost. The returns shown do not reflect the deduction of taxes that a shareholder would pay on Fund distributions or the redemption of Fund shares. Performance figures may reflect fee waivers and/or expense reimbursements. In the absence of fee waivers and/or expense reimbursements, the total return would have been lower.
16 Legg Mason Partners Funds Trust 2006 Annual Report
Table of Contents
Legg Mason Partners New York Tax Free Bond Fund
Q. What were the overall market conditions during the Fund’s reporting period?
A. The economy weakened during the period due, in part, to the lagged effect of higher short-term interest rates and a rapidly cooling housing market. Inflationary pressures intensified during the first half of the reporting period. However, as oil prices retreated from their July record high and housing prices moderated, inflation became less of an issue. The Federal Reserve Board (“Fed”)i boosted its target federal funds rateii from 4.25% when the reporting period began to 5.25% in June 2006. The Fed then held rates steady during the remainder of the year.
The Treasury yield curveiii flattened in 2006 as the difference between short- and long-term yields narrowed. Overall, during the 12-months ended December 31, 2006, two-year Treasury yields increased from 4.41% to 4.82%. Over the same period, 10-year Treasury yields moved from 4.39% to 4.71%. Throughout much of 2006, the Treasury yield curve was inverted, with two-year Treasury yields surpassing their 10-year counterparts. This anomaly has often been a precursor of slowing economic growth and, in many cases, a recession.iv
The municipal yield curve continued to flatten over the last year and the spreads between two- and 10-year securities tightened to near historically low levels. As was the case in 2005, longer-term and lower-rated municipal bonds generated the strongest results during the 12-month period ended December 31, 2006.v
Performance Review
For the 12 months ended December 31, 2006, Class A shares of Legg Mason Partners New York Tax Free Bond Fund, excluding sales charges, returned 3.98%. These shares underperformed the Lipper New York Municipal Debt Funds Category Average1, which increased 4.65%. The Fund’s unmanaged benchmark, the Lehman Brothers Municipal Bond Indexvi, returned 4.84% for the same period.
Certain investors may be subject to the Federal Alternative Minimum Tax, and state and local taxes may apply. Capital gains, if any, are fully taxable. Please consult your personal tax or legal adviser.
1 | Lipper, Inc. is a major independent mutual-fund tracking organization. Returns are based on the 12-month period ended December 31, 2006, including the reinvestment of all distributions, including returns of capital, if any, calculated among the 99 funds in the Fund’s Lipper category, and excluding sales charges |
Legg Mason Partners Funds Trust 2006 Annual Report 17
Table of Contents
| Performance Snapshot as of December 31, 2006 (excluding sales charges) (unaudited) | ||||
| 6 months | 12 months | |||
New York Tax Free Bond Fund — Class A Shares | 4.53% | 3.98% | ||
Lehman Brothers Municipal Bond Index | 4.55% | 4.84% | ||
Lipper New York Municipal Debt Funds Category Average | 4.43% | 4.65% | ||
| The performance shown represents past performance. Past performance is no guarantee of future results and current performance may be higher or lower than the performance shown above. Principal value, investment returns and yields will fluctuate and investors’ shares, when redeemed, may be worth more or less than their original cost. Current reimbursements and/or fee waivers are voluntary, and may be reduced or terminated at any time. Absent these reimbursements or waivers, performance would have been lower. To obtain performance data current to the most recent month-end, please visit our website at www.leggmason.com/InvestorServices. | ||||
| Excluding sales charges, Class B shares returned 4.14%, Class C shares returned 4.28% and Class O shares returned 4.66% over the six months ended December 31, 2006. Excluding sales charges, Class B shares returned 3.21%, Class C shares returned 3.47% and Class O shares returned 4.24% over the twelve months ended December 31, 2006. All share class returns assume the reinvestment of all distributions, including returns of capital, if any, at net asset value and the deduction of all Fund expenses. Returns have not been adjusted to include sales charges that may apply when shares are purchased or the deduction of taxes that a shareholder would pay on Fund distributions. | ||||
| The 30-Day SEC Yields for Class A, Class B, Class C and Class O shares was 3.31%, 2.70%, 2.90% and 3.70%, respectively. Absent current reimbursements or waivers, the 30-Day SEC Yields for Class A, Class B, Class C and Class O shares would have been 3.16%, 2.54%, 2.82% and 3.55%. | ||||
| The 30-Day SEC Yield is the average annualized net investment income per share for the 30-day period indicated and is subject to change. | ||||
| Lipper, Inc. is a major independent mutual-fund tracking organization. Returns are based on the period ended December 31, 2006, including the reinvestment of all distributions, including returns of capital, if any, calculated among the 99 funds for the six-month period and among the 99 funds for the 12-month period in the Fund’s Lipper category and excluding sales charges. | ||||
Q. What were the most significant factors affecting Fund performance?
What were the leading contributors to performance?
A. The Fund benefited from the pre-refunding of several of its securities during the reporting period. In addition, its tactical credit exposure enhanced results.
What were the leading detractors from performance?
A. The Fund was underweight in lower quality, more speculative issues during the year. This positioning hurt the Fund’s performance as lower quality municipal bonds outperformed their higher quality counterparts. Based on our expectations for higher interest rates, the Fund did not have as large an exposure to the long end of the curve as its benchmark. This detracted from results given the flattening of the municipal yield curve.
18 Legg Mason Partners Funds Trust 2006 Annual Report
Table of Contents
Q. Were there any significant changes to the Fund during the reporting period?
A. There were no significant changes to the Fund’s portfolio.
Thank you for your investment in Legg Mason Partners New York Tax Free Bond Fund. As always, we appreciate that you have chosen us to manage your assets.
Sincerely,
Western Asset Management Company
January 26, 2007
The information provided is not intended to be a forecast of future events, a guarantee of future results or investment advice. Views expressed may differ from those of the firm as a whole.
RISKS: The Fund is a non-diversified mutual fund. This means that the Fund may invest a relatively high percentage of its assets in the obligations of a limited number of issuers. Investments in bonds are subject to interest rate and credit risks. As interest rates rise, bond prices fall, reducing the value of the Fund’s share price. The Fund may use derivatives, such as options or futures, which can be illiquid, may disproportionately increase losses, and have a potentially large impact on the Fund’s performance. Please see the Fund’s prospectus for more information on these and other risks.
All index performance reflects no deduction for fees, expenses or taxes. Please note an investor cannot invest directly in an index.
i | The Federal Reserve Board is responsible for the formulation of a policy designed to promote economic growth, full employment, stable prices, and a sustainable pattern of international trade and payments. |
ii | The federal funds rate is the interest rate that banks with excess reserves at a Federal Reserve district bank charge other banks that need overnight loans. |
iii | The yield curve is the graphical depiction of the relationship between the yield on bonds of the same credit quality but different maturities. |
iv | Source: The Wall Street Journal, 1/07. |
v | Source: The Bond Buyer, 1/07. |
vi | The Lehman Brothers Municipal Bond Index is a broad measure of the municipal bond market with maturities of at least one year. |
Legg Mason Partners Funds Trust 2006 Annual Report 19
Table of Contents
Legg Mason Partners New York Tax Free Bond Fund
20 Legg Mason Partners Funds Trust 2006 Annual Report
Table of Contents
Example
As a shareholder of the Fund, you may incur two types of costs: (1) transaction costs, including front-end and back-end sales charges (loads) on purchase payments and (2) ongoing costs, including management fees; distribution and/or service (12b-1) fees; and other Fund expenses. This example is intended to help you understand your ongoing costs (in dollars) of investing in the Fund and to compare these costs with the ongoing costs of investing in other mutual funds.
This example is based on an investment of $1,000 invested on July 1, 2006 and held for the six months ended December 31, 2006.
Actual Expenses
The table below titled “Based on Actual Total Return” provides information about actual account values and actual expenses. You may use the information provided in this table, together with the amount you invested, to estimate the expenses that you paid over the period. To estimate the expenses you paid on your account, divide your ending account value by $1,000 (for example, an $8,600 ending account value divided by $1,000 = 8.6), then multiply the result by the number under the heading entitled “Expenses Paid During the Period”.
| Based on Actual Total Return(1) | |||||||||||||||
| Legg Mason Partners New York Tax Free Bond Fund | Actual Total Return Without Sales Charges(2) | Beginning Account Value | Ending Account Value | Annualized Expense Ratio(3) | Expenses Paid During the Period(4) | ||||||||||
Class A | 4.53 | % | $ | 1,000.00 | $ | 1,045.30 | 0.80 | % | $ | 4.12 | |||||
Class B | 4.14 | 1,000.00 | 1,041.40 | 1.55 | 7.98 | ||||||||||
Class C | 4.28 | 1,000.00 | 1,042.80 | 1.29 | 6.64 | ||||||||||
Class O | 4.66 | 1,000.00 | 1,046.60 | 0.55 | 2.84 | ||||||||||
(1) | For the six months ended December 31, 2006. |
(2) | Assumes reinvestment of all distributions, including returns of capital, if any, at net asset value and does not reflect the deduction of the applicable sales charge with respect to Class A shares or the applicable CDSC with respect to Class B and C shares. Total return is not annualized, as it may not be representative of the total return for the year. Performance figures may reflect fee waivers and/or expense reimbursements. Past performance is no guarantee of future results. In the absence of fee waivers and/or expense reimbursements, the total return would have been lower. |
(3) | The expense ratios do not include the non-recurring restructuring and/or reorganization fees. |
(4) | Expenses (net of fee waivers and/or expense reimbursements) are equal to each class’ respective annualized expense ratio multiplied by the average account value over the period, multiplied by the number of days in the most recent fiscal half-year, then divided by 365. |
Legg Mason Partners Funds Trust 2006 Annual Report 21
Table of Contents
Fund Expenses (unaudited) (continued)
Hypothetical Example for Comparison Purposes
The table below titled “Based on Hypothetical Total Return” provides information about hypothetical account values and hypothetical expenses based on the actual expense ratio and an assumed rate of return of 5.00% per year before expenses, which is not the Fund’s actual return. The hypothetical account values and expenses may not be used to estimate the actual ending account balance or expenses you paid for the period. You may use the information provided in this table to compare the ongoing costs of investing in the Fund and other funds. To do so, compare the 5.00% hypothetical example relating to the Fund with the 5.00% hypothetical examples that appear in the shareholder reports of the other funds.
Please note that the expenses shown in the table below are meant to highlight your ongoing costs only and do not reflect any transactional costs, such as front-end or back-end sales charges (loads). Therefore, the table is useful in comparing ongoing costs only, and will not help you determine the relative total costs of owning different funds. In addition, if these transaction costs were included, your costs would have been higher.
| Based on Hypothetical Total Return(1) | |||||||||||||||
| Legg Mason Partners New York Tax Free Bond Fund | Hypothetical Annualized Total Return | Beginning Account Value | Ending Account Value | Annualized Expense Ratio(2) | Expenses Paid During the Period(3) | ||||||||||
Class A | 5.00 | % | $ | 1,000.00 | $ | 1,021.17 | 0.80 | % | $ | 4.08 | |||||
Class B | 5.00 | 1,000.00 | 1,017.39 | 1.55 | 7.88 | ||||||||||
Class C | 5.00 | 1,000.00 | 1,018.70 | 1.29 | 6.56 | ||||||||||
Class O | 5.00 | 1,000.00 | 1,022.43 | 0.55 | 2.80 | ||||||||||
(1) | For the six months ended December 31, 2006. |
(2) | The expense ratios do not include the non-recurring restructuring and/or reorganization fees. |
(3) | Expenses (net of fee waivers and/or expense reimbursements) are equal to each class’ respective annualized expense ratio multiplied by the average account value over the period, multiplied by the number of days in the most recent fiscal half-year, then divided by 365. |
22 Legg Mason Partners Funds Trust 2006 Annual Report
Table of Contents
Legg Mason Partners New York Tax Free Bond Fund
| Average Annual Total Returns(1) (unaudited) | ||||||||||||
| Without Sales Charges(2) | ||||||||||||
| Class A | Class B | Class C | Class O | |||||||||
Twelve Months Ended 12/31/06 | 3.98 | % | 3.21 | % | 3.47 | % | 4.24 | % | ||||
Five Years Ended 12/31/06 | 4.78 | 3.99 | N/A | 5.04 | ||||||||
Ten Years Ended 12/31/06 | 5.08 | N/A | N/A | N/A | ||||||||
Inception* through 12/31/06 | 5.95 | 3.52 | 3.32 | 4.45 | ||||||||
| With Sales Charges(3) | ||||||||||||
| Class A(4) | Class B(5) | Class C | Class O | |||||||||
Twelve Months Ended 12/31/06 | (0.43 | )% | (1.29 | )% | 2.47 | % | 4.24 | % | ||||
Five Years Ended 12/31/06 | 3.88 | 3.82 | N/A | 5.04 | ||||||||
Ten Years Ended 12/31/06 | 4.63 | N/A | N/A | N/A | ||||||||
Inception* through 12/31/06 | 5.72 | 3.52 | 3.32 | 4.45 | ||||||||
| Cumulative Total Returns(1) (unaudited) | ||||||||||
| Without Sales Charges(2) | ||||||||||
Class A (12/31/96 through 12/31/06) | 64.20% | |||||||||
Class B (Inception* through 12/31/06) | 19.34 | |||||||||
Class C (Inception* through 12/31/06) | 15.65 | |||||||||
Class O (Inception* through 12/31/06) | 25.25 | |||||||||
(1) | All figures represent past performance and are not a guarantee of future results. Investment return and principal value of an investment will fluctuate so that an investor’s shares, when redeemed, may be worth more or less than their original cost. The returns shown do not reflect the deduction of taxes that a shareholder would pay on Fund distributions or the redemption of Fund shares. Performance figures may reflect fee waivers and/or expense reimbursements. In the absence of fee waivers and/or expense reimbursements, the total return would have been lower. |
(2) | Assumes reinvestment of all distributions, including returns of capital, if any, at net asset value and does not reflect the deduction of the applicable sales charge with respect to Class A shares or the applicable CDSC with respect to Class B and C shares. |
(3) | Assumes reinvestment of all distributions, including returns of capital, if any, at net asset value. In addition, Class A shares reflect the deduction of the maximum initial sales charge of 4.25%; Class B shares reflect the deduction of a 4.50% CDSC, which applies if shares are redeemed within one year from purchase payment. This CDSC declines by 0.50% the first year after purchase and thereafter by 1.00% per year until no CDSC is incurred. Class C shares also reflect the deduction of a 1.00% CDSC, which applies if shares are redeemed within one year from purchase payment. |
(4) | Class A shares maximum initial sales charge increased from 4.00% to 4.25% on November 20, 2006. |
(5) | Class B shares CDSC increased from 4.00% to 4.50% on November 20, 2006. |
| * | Inception dates for Class A, B, C and O shares are September 7, 1986, November 19, 2001, July 19, 2002 and October 29, 2001, respectively. |
Legg Mason Partners Funds Trust 2006 Annual Report 23
Table of Contents
Historical Performance (unaudited)
Value of $10,000 Invested in Class A Shares of the Legg Mason Partners New York Tax Free Bond Fund vs. Lehman Brothers Municipal Bond Index† (December 1996 — December 2006)
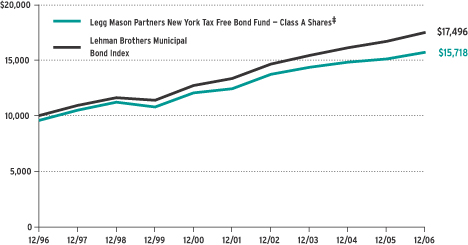
| † | Hypothetical illustration of $10,000 invested in Class A shares on December 31, 1996, assuming deduction of the maximum initial sales charge of 4.25% at the time of investment and reinvestment of all distributions, including returns of capital, if any, at net asset value through December 31, 2006. The Lehman Brothers Municipal Bond Index is a broad-based, total return index comprised of bonds which are all investment-grade, fixed-rate, long-term maturities (greater than one year) and are selected from issues larger than $50 million dated since January 1991. The Index is unmanaged and is not subject to the same management and trading expenses as a mutual fund. Please note that an investor cannot invest directly in an index. The performance of the Fund’s other classes may be greater or less than the Class A shares’ performance indicated on this chart, depending on whether greater or lesser sales charges and fees were incurred by shareholders investing in the other classes. |
| ‡ | Class A shares maximum initial sales charge increased from 4.00% to 4.25% on November 20, 2006. |
All figures represent past performance and are not a guarantee of future results. Investment return and principal value of an investment will fluctuate so that an investor’s shares, when redeemed, may be worth more or less than their original cost. The returns shown do not reflect the deduction of taxes that a shareholder would pay on Fund distributions or the redemption of Fund shares. Performance figures may reflect fee waivers and/or expense reimbursements. In the absence of fee waivers and/or expense reimbursements, the total return would have been lower.
24 Legg Mason Partners Funds Trust 2006 Annual Report
Table of Contents
Schedules of Investments (December 31, 2006)
LEGG MASON PARTNERS NATIONAL TAX FREE BOND FUND
| Face Amount | Rating‡ | Security | Value | ||||||
| MUNICIPAL BONDS — 90.7% | |||||||||
| California — 5.2% | |||||||||
| $ | 1,000,000 | AAA | Calleguas Las Virgines, CA, Public Financing Authority Revenue, Refunding Bonds, Calleguas Municipal Water District, Series B, MBIA-Insured, 5.250% due 7/1/17 | $ | 1,087,520 | ||||
| 450,000 | AAA | El Segundo, CA, GO, USD, Refunding Bonds, FGIC-Insured, 5.250% due 9/1/22 | 491,107 | ||||||
Total California | 1,578,627 | ||||||||
| Colorado — 3.5% | |||||||||
| 500,000 | BBB+ | Colorado Health Facilities Authority Revenue, Poudre Valley Health Care, Series F, 5.000% due 3/1/25 | 515,505 | ||||||
| 500,000 | AAA | Pueblo County, CO, School District Number 60, GO, FGIC-Insured, 5.250% due 12/15/20 | 537,705 | ||||||
Total Colorado | 1,053,210 | ||||||||
| Florida — 12.8% | |||||||||
| 2,000,000 | AAA | Jacksonville, FL, Sales Tax Revenue, Better Jacksonville, MBIA-Insured, 5.250% due 10/1/21 | 2,162,280 | ||||||
Miami-Dade County, FL, Aviation Revenue, Miami International Airport: | |||||||||
| 250,000 | AAA | Series A, FGIC-Insured, 5.550% due 10/1/13 (a) | 266,470 | ||||||
| 300,000 | AAA | Series B, MBIA-Insured, 5.250% due 10/1/17 (a) | 321,216 | ||||||
Orlando, FL, Utilities Commission, Water & Electric Revenue, Series C: | |||||||||
| 90,000 | AA | 5.250% due 10/1/21 | 96,526 | ||||||
| 60,000 | AA | 5.250% due 10/1/23 | 64,191 | ||||||
Call 10/1/12 @ 100: | |||||||||
| 540,000 | Aa1(b) | 5.250% due 10/1/21 (c) | 584,652 | ||||||
| 340,000 | Aa1(b) | 5.250% due 10/1/23 (c) | 368,115 | ||||||
Total Florida | 3,863,450 | ||||||||
| Illinois — 16.2% | |||||||||
| 1,250,000 | AAA | Chicago, IL, O’Hare International Airport Revenue, Refunding Bonds, Lien A-2, FSA-Insured, 5.750% due 1/1/19 (a) | 1,380,662 | ||||||
| 500,000 | AAA | Cook County, IL, GO, Refunding, Series B, MBIA-Insured, 5.250% due 11/15/18 | 544,680 | ||||||
Illinois State, GO: | |||||||||
| 1,500,000 | AAA | First Series, FGIC-Insured, 6.100% due 1/1/20 | 1,596,690 | ||||||
| 500,000 | AAA | Refunding, First Series, MBIA-Insured, 5.500% due 8/1/19 | 543,635 | ||||||
| 750,000 | Aaa(b) | Will County, IL, GO, Community Consolidated School District Number 30-C, Troy Township, Series B, FSA-Insured, 5.250% due 2/1/20 | 814,470 | ||||||
Total Illinois | 4,880,137 | ||||||||
| Indiana — 0.9% | |||||||||
| 250,000 | AAA | Indiana Health Facility Financing Authority, Hospital Revenue, Community Hospital Project, Series A, AMBAC-Insured, 5.000% due 5/1/35 | 262,123 | ||||||
See Notes to Financial Statements.
Legg Mason Partners Funds Trust 2006 Annual Report 25
Table of Contents
Schedules of Investments (December 31, 2006) (continued)
| Face Amount | Rating‡ | Security | Value | ||||||
| Iowa — 0.2% | |||||||||
| $ | 55,000 | AAA | Iowa Finance Authority Single Family Revenue, Mortgage-Backed Securities Program, Series A, FNMA/GNMA-Collateralized, 6.000% due 7/1/13 | $ | 56,723 | ||||
| Kentucky — 3.7% | |||||||||
| 750,000 | AAA | Kenton County, KY, Airport Board Revenue, Refunding Bonds, Cincinnati/Northern Kentucky, Series A, MBIA-Insured, 5.625% due 3/1/15 (a) | 809,520 | ||||||
| 300,000 | AAA | Louisville & Jefferson County, KY, Regional Airport Authority, Airport Systems Revenue, Series A, FSA-Insured, 5.750% due 7/1/17 (a) | 324,672 | ||||||
Total Kentucky | 1,134,192 | ||||||||
| Mississippi — 0.0% | |||||||||
| 5,000 | A(d) | Mississippi Higher Education Student Loan, Subordinated Series C, 6.050% due 9/1/07 (a) | 5,019 | ||||||
| Missouri — 3.5% | |||||||||
| 1,000,000 | AA | Missouri State, HEFA Revenue, BJC Health System, Series A, | 1,061,680 | ||||||
| Montana — 2.6% | |||||||||
| 750,000 | AAA | Forsyth, MT, PCR, Refunding, Northwestern Corp. Colstrip, | 773,970 | ||||||
| New Hampshire — 3.6% | |||||||||
| 1,000,000 | AAA | New Hampshire HEFA Revenue, University Systems of New Hampshire, AMBAC-Insured, 5.375% due 7/1/20 | 1,081,920 | ||||||
| New Jersey — 5.5% | |||||||||
New Jersey EDA, Motor Vehicle Surcharges Revenue, Series A, MBIA-Insured: | |||||||||
| 500,000 | AAA | 5.250% due 7/1/16 | 546,200 | ||||||
| 750,000 | AAA | 5.250% due 7/1/17 | 819,300 | ||||||
| 280,000 | AAA | Passaic Valley, NJ, Sewage Commissioners, Sewer System, | 285,449 | ||||||
Total New Jersey | 1,650,949 | ||||||||
| New Mexico — 1.8% | |||||||||
| 500,000 | AAA | New Mexico Finance Authority State Transportation Revenue, Senior Lien, Series A, MBIA-Insured, 5.250% due 6/15/23 | 541,910 | ||||||
| New York — 12.8% | |||||||||
| 1,300,000 | AAA | Metropolitan Transportation Authority, New York Services Contract, Refunding Bonds, Series A, AMBAC-Insured, 5.500% due 11/15/15 | 1,426,581 | ||||||
New York City, NY, GO: | |||||||||
| 500,000 | AA- | Series A, 5.750% due 8/1/16 | 550,665 | ||||||
| 750,000 | AAA | Series D, FSA-Insured, 5.000% due 11/1/17 | 806,182 | ||||||
| 250,000 | AA- | New York State Dormitory Authority Lease Revenue, State University Dormitory Facilities, Series A, Call 7/1/10 @ 101, | 271,558 | ||||||
| 750,000 | AA- | Triborough Bridge & Tunnel Authority Revenues, Refunding Bonds, Series B, 5.250% due 11/15/16 | 809,512 | ||||||
Total New York | 3,864,498 | ||||||||
See Notes to Financial Statements.
26 Legg Mason Partners Funds Trust 2006 Annual Report
Table of Contents
Schedules of Investments (December 31, 2006) (continued)
| Face Amount | Rating‡ | Security | Value | ||||||
| Oregon — 7.2% | |||||||||
Multnomah County, OR, Hospital Facilities Authority Revenue, Providence Health Systems: | |||||||||
| $ | 1,000,000 | AA | 5.250% due 10/1/16 | $ | 1,095,700 | ||||
| 1,000,000 | AA | 5.250% due 10/1/20 | 1,088,700 | ||||||
Total Oregon | 2,184,400 | ||||||||
| Texas — 6.7% | |||||||||
| 500,000 | AAA | Austin, TX, Airport System Revenue, Refunding, Prior Lien, MBIA-Insured, 5.250% due 11/15/17 | 541,220 | ||||||
| 1,100,000 | AAA | Hidalgo County, TX, GO, Certificates of Obligation, FGIC-Insured, Call 8/15/12 @ 100, 5.500% due 8/15/16 (c) | 1,202,993 | ||||||
| 85,000 | AAA | Houston, TX, GO, Refunding Bonds, Public Improvement, FSA-Insured, 5.750% due 3/1/17 | 90,786 | ||||||
| 115,000 | AAA | Keller, TX, ISD, GO, Unrefunded Balance, Refunding, PSF-GTD-Insured, 5.250% due 8/15/22 | 121,941 | ||||||
| 55,000 | AAA | Northside Texas, GO, ISD, Unrefunded Balance, PSFG, | 59,221 | ||||||
Total Texas | 2,016,161 | ||||||||
| Washington — 4.5% | |||||||||
| 750,000 | AAA | Energy Northwest Washington Electric Revenue, Refunding Bonds, Columbia Generating Station, Series A, FSA-Insured, 5.500% due 7/1/16 | 808,845 | ||||||
| 500,000 | AAA | Snohomish County, WA, School District Number 2, Everett, GO, FSA-Insured, 5.500% due 12/1/16 | 545,010 | ||||||
Total Washington | 1,353,855 | ||||||||
| TOTAL INVESTMENTS BEFORE SHORT-TERM INVESTMENTS | |||||||||
| (Cost — $26,944,553) | 27,362,824 | ||||||||
| SHORT-TERM INVESTMENTS (f) — 8.0% | |||||||||
| Michigan — 5.0% | |||||||||
| 1,500,000 | VMIG1(b) | Northern Michigan University, MI, Revenue, General, AMBAC-Insured, SPA-Depfa Bank PLC, 4.000%, 1/2/07 | 1,500,000 | ||||||
| Illinois — 3.0% | |||||||||
| 900,000 | A-1+ | Chicago Board of Education, IL, GO, Dedicated Revenues, Series D-2, SPA-Depfa Bank PLC, CIFG-Insured, 4.000%, 1/2/07 | 900,000 | ||||||
| TOTAL SHORT-TERM INVESTMENTS (Cost — $2,400,000) | 2,400,000 | ||||||||
| TOTAL INVESTMENTS — 98.7% (Cost — $29,344,553#) | 29,762,824 | ||||||||
Other Assets in Excess of Liabilities — 1.3% | 401,810 | ||||||||
| TOTAL NET ASSETS — 100.0% | $ | 30,164,634 | |||||||
| ‡ | All ratings are by Standard & Poor’s Ratings Service, unless otherwise noted. All ratings are unaudited. |
(a) | Income from this issue is considered a preference item for purposes of calculating the alternative minimum tax (“AMT”). |
(b) | Rating by Moody’s Investors Service. All ratings are unaudited. |
(c) | Pre-Refunded bonds are escrowed with U.S. government obligations and/or U.S. government agency securities and are considered by the Manager to be triple-A rated even if issuer has not applied for new ratings. |
See Notes to Financial Statements.
Legg Mason Partners Funds Trust 2006 Annual Report 27
Table of Contents
Schedules of Investments (December 31, 2006) (continued)
(d) | Rating by Fitch Ratings Service. All ratings are unaudited. |
(e) | Bonds are escrowed to maturity by U.S. government securities and/or U.S. government agency securities and are considered by the Manager to be triple-A rated even if issuer has not applied for new ratings. |
(f) | Variable rate demand obligations have a demand feature under which the Fund can tender them back to the issuer on no more than 7 days notice. Date shown is the date of the next interest rate change. |
| # | Aggregate cost for federal income tax purposes is substantially the same. |
See pages 34 and 35 for definitions of ratings.
Abbreviations used in this schedule: | ||
| AMBAC | — Ambac Assurance Corporation | |
| EDA | — Economic Development Authority | |
| FGIC | — Financial Guaranty Insurance Company | |
| FNMA | — Federal National Mortgage Association | |
| FSA | — Financial Security Assurance | |
| GNMA | — Government National Mortgage Association | |
| GO | — General Obligation | |
| GTD | — Guaranteed | |
| HEFA | — Health & Educational Facilities Authority | |
| ISD | — Independent School District | |
| MBIA | — Municipal Bond Investors Assurance Corporation | |
| PCR | — Pollution Control Revenue | |
| PSF | — Permanent School Fund | |
| PSFG | — Permanent School Fund Guaranty | |
| SPA | — Standby Bond Purchase Agreement | |
| USD | — Unified School District | |
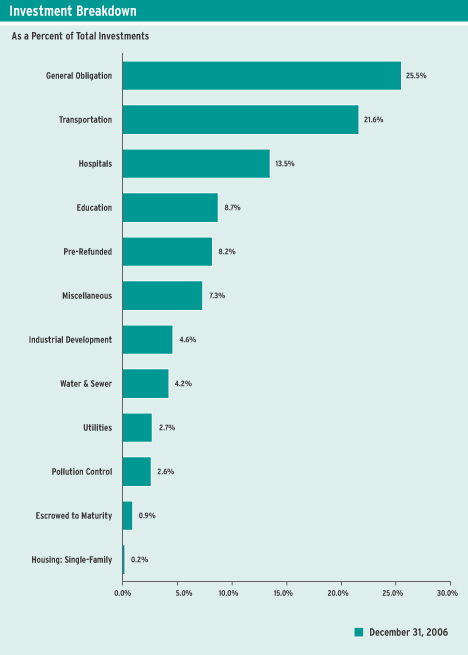
Summary of Investments by Industry and Pre-Refunded Securities*
General Obligation | 25.5 | % | |
Transportation | 21.6 | ||
Hospitals | 13.5 | ||
Education | 8.7 | ||
Pre-Refunded | 8.2 | ||
Miscellaneous | 7.3 | ||
Industrial Development | 4.6 | ||
Water & Sewer | 4.2 | ||
Utilities | 2.7 | ||
Pollution Control | 2.6 | ||
Escrowed to Maturity | 0.9 | ||
Housing: Single-Family | 0.2 | ||
| 100.0 | % | ||
| *As | a percentage of total investments. Please note that Fund holdings are as of December 31, 2006 and are subject to change. |
See Notes to Financial Statements.
28 Legg Mason Partners Funds Trust 2006 Annual Report
Table of Contents
Schedules of Investments (December 31, 2006) (continued)
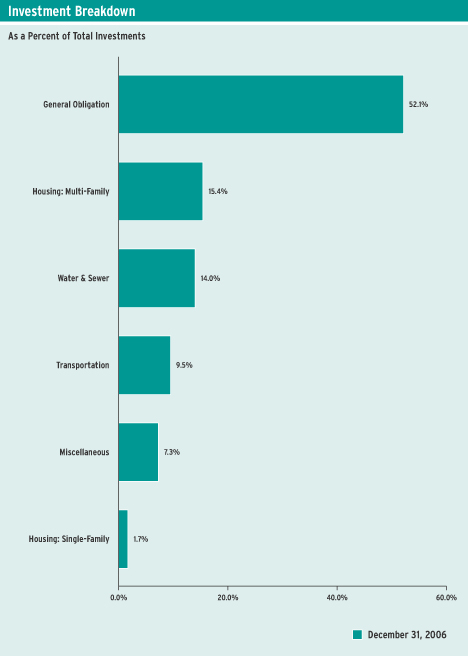
LEGG MASON PARTNERS CALIFORNIA TAX FREE BOND FUND
| Face Amount | Rating‡ | Security | Value | ||||||
| MUNICIPAL BONDS — 94.0% | |||||||||
| General Obligation — 50.5% | |||||||||
| $ | 350,000 | AAA | Anaheim, CA, School District, GO, Refunding, FGIC-Insured, | $ | 375,711 | ||||
| 350,000 | A+ | California State, GO, Refunding, 5.250% due 2/1/21 | 375,273 | ||||||
| 350,000 | AAA | Cerritos, CA, Community College District, GO, Refunding, | 379,893 | ||||||
| 150,000 | AAA | El Segundo, CA, GO, USD, Refunding Bonds, FGIC-Insured, | 163,703 | ||||||
| 250,000 | AAA | Los Altos, CA, School District, GO, Refunding, AMBAC-Insured, | 270,793 | ||||||
| 350,000 | AAA | Moreland, CA, School District, GO, Refunding, Series B, AMBAC-Insured, 5.000% due 8/1/23 | 378,182 | ||||||
| 325,000 | AAA | San Francisco, CA, Community College District, GO, Election 2001, Series B, AMBAC-Insured, 5.000% due 6/15/15 | 352,333 | ||||||
| 350,000 | AAA | Shasta Tehama Trinity, CA, Joint Community College District, GO, Election 2002, Series B, FSA-Insured, 5.250% due 8/1/24 | 387,443 | ||||||
| 500,000 | AAA | Ventura, CA, Communiy College District, GO, Series A, MBIA-Insured, 5.500% due 8/1/23 | 550,885 | ||||||
| 215,000 | AAA | Walnut Valley, CA, USD, Refunding Bonds, FSA-Insured, | 238,123 | ||||||
Total General Obligation | 3,472,339 | ||||||||
| Housing: Multi-Family — 14.8% | |||||||||
| 1,000,000 | AAA | California Housing Finance Agency Revenue, MFH III, Series A, | 1,020,950 | ||||||
| Housing: Single-Family — 1.7% | |||||||||
| 115,000 | AA- | California Housing Finance Agency Revenue, Single Family Mortgage Purpose Program, Series A-2, Class III, 4.800% due 8/1/12 (a) | 115,044 | ||||||
| Miscellaneous — 7.1% | |||||||||
| 200,000 | AAA | Puerto Rico Public Finance Corp., Commonwealth Appropriation, Refunding Bonds, Series A, FGIC-Insured, LOC-Government Bank for Puerto Rico (Expires 4/12/12), 5.250% due 8/1/31 (b) | 213,932 | ||||||
| 250,000 | AA | Sacramento County, CA, Sanitation District Financing Authority Revenue, Refunding Bonds, Series A, 6.000% due 12/1/14 | 273,093 | ||||||
Total Miscellaneous | 487,025 | ||||||||
| Transportation — 9.2% | |||||||||
| 250,000 | AAA | Los Angeles, CA, Harbor Department Revenue, Refunding, Series A, MBIA-Insured, 5.000% due 8/1/19 | 274,040 | ||||||
| 350,000 | AAA | San Francisco, CA, Bay Area Rapid Transit, District Sales Tax Revenue, Unrefunded Balance, AMBAC-Insured, 5.000% due 7/1/28 | 359,600 | ||||||
Total Transportation | 633,640 | ||||||||
See Notes to Financial Statements.
Legg Mason Partners Funds Trust 2006 Annual Report 29
Table of Contents
Schedules of Investments (December 31, 2006) (continued)
| Face Amount | Rating‡ | Security | Value | ||||||
| Water & Sewer — 10.7% | |||||||||
| $ | 300,000 | AAA | Puerto Rico Commonwealth Aqueduct & Sewer Authority Revenue, Refunding Bonds, MBIA-IBC Insured, 6.250% due 7/1/13 | $ | 344,907 | ||||
| 355,000 | AAA | San Francisco, CA, City & County Public Utilities Commission, Water Revenue, Series A, FSA-Insured, 5.000% due 11/1/18 | 387,585 | ||||||
Total Water & Sewer | 732,492 | ||||||||
| TOTAL INVESTMENTS BEFORE SHORT-TERM INVESTMENT (Cost — $6,327,506) | 6,461,490 | ||||||||
| SHORT-TERM INVESTMENT — 2.9% | |||||||||
| Water & Sewer — 2.9% | |||||||||
| 200,000 | A-1+ | California State Department of Water Resource Power Supply Revenue, Series B-2, LOC-BNP Paribas, 3.860%, 1/2/07 (c) | 200,000 | ||||||
| TOTAL INVESTMENTS — 96.9% (Cost — $6,527,506#) | 6,661,490 | ||||||||
Other Assets in Excess of Liabilities — 3.1% | 210,939 | ||||||||
| TOTAL NET ASSETS — 100.0% | $ | 6,872,429 | |||||||
| ‡ | All ratings are by Standard & Poor’s Ratings Service, unless otherwise noted. All ratings are unaudited. |
(a) | Income from this issue is considered a preference item for purposes of calculating the alternative minimum tax (“AMT”). |
(b) | Variable rate security. Interest rate disclosed is that which is in effect at December 31, 2006. |
(c) | Variable rate demand obligations have a demand feature under which the Fund can tender them back to the issuer on no more than 7 days notice. Date shown is the date of the next interest rate change. |
| # | Aggregate cost for federal income tax purposes is substantially the same. |
See pages 34 and 35 for definitions of ratings.
Abbreviations used in this schedule: | ||
| AMBAC | — Ambac Assurance Corporation | |
| FGIC | — Financial Guaranty Insurance Company | |
| FSA | — Financial Security Assurance | |
| GO | — General Obligation | |
| IBC | — Insured Bond Certificates | |
| LOC | — Letter of Credit | |
| MBIA | — Municipal Bond Investors Assurance Corporation | |
| MFH | — Multi-Family Housing | |
| USD | — Unified School District | |
See Notes to Financial Statements.
30 Legg Mason Partners Funds Trust 2006 Annual Report
Table of Contents
Schedules of Investments (December 31, 2006) (continued)
LEGG MASON PARTNERS NEW YORK TAX FREE BOND FUND
| Face Amount | Rating‡ | Security | Value | ||||||
| MUNICIPAL BONDS — 96.7% | |||||||||
| Education — 24.5% | |||||||||
New York State Dormitory Authority Revenue: | |||||||||
| $ | 3,000,000 | AAA | City University of New York, Consolidated Second General Resolution, Series A, AMBAC-Insured, | $ | 3,435,480 | ||||
New York University, Series A, MBIA-Insured: | |||||||||
| 1,000,000 | AAA | 5.750% due 7/1/15 | 1,145,080 | ||||||
| 6,300,000 | AAA | 5.750% due 7/1/27 | 7,696,458 | ||||||
| 1,500,000 | AAA | School District Financing Program, Series A, MBIA-Insured, 5.750% due 10/1/17 | 1,658,475 | ||||||
State University: | |||||||||
| 1,070,000 | AAA | Adult Facilities, Series C, FSA-Insured, 5.750% due 5/15/17 | 1,244,325 | ||||||
| 2,030,000 | AA- | Educational Facilities, Series B, 5.250% due 5/15/13 | 2,202,083 | ||||||
New York State Municipal Bond Bank Agency, Special School Purpose Revenue, State Aid Withholding, Series C: | |||||||||
| 1,000,000 | A+ | 5.500% due 6/1/16 | 1,088,730 | ||||||
| 1,700,000 | A+ | 5.250% due 12/1/21 | 1,818,031 | ||||||
Total Education | 20,288,662 | ||||||||
| Escrowed to Maturity (a) — 5.3% | |||||||||
Metropolitan Transportation Authority, New York Services Contract, Transportation Facilities, Series O: | |||||||||
| 3,000,000 | AAA | 5.750% due 7/1/13 | 3,228,480 | ||||||
| 1,000,000 | AAA | MBIA/IBC Insured, 5.500% due 7/1/17 | 1,129,920 | ||||||
Total Escrowed to Maturity | 4,358,400 | ||||||||
| General Obligation — 8.3% | |||||||||
| 2,100,000 | Aaa(b) | Erie County, NY, Public Improvement, Series A, FGIC-Insured, 5.000% due 9/1/15 | 2,239,230 | ||||||
New York City, NY: | |||||||||
| 1,000,000 | AA- | Series B, 5.625% due 12/1/13 | 1,086,110 | ||||||
| 380,000 | AA- | Unrefunded Balance, GO, Series B, 5.750% due 8/1/14 | 408,656 | ||||||
| 1,600,000 | AA- | New York City, NY, GO, Series A, 5.750% due 8/1/16 | 1,762,128 | ||||||
| 1,250,000 | AAA | Puerto Rico Commonwealth, Refunding, Public Improvement, Series A, MBIA-Insured, 5.500% due 7/1/16 | 1,423,350 | ||||||
Total General Obligation | 6,919,474 | ||||||||
| Hospitals — 6.0% | |||||||||
New York State Dormitory Authority Revenue: | |||||||||
| 2,000,000 | AAA | Mental Health Services Facilities Improvement, Series D, FGIC-Insured, 5.000% due 2/15/23 | 2,131,620 | ||||||
| 2,500,000 | AAA | North Shore University Hospital, MBIA-Insured, | 2,801,375 | ||||||
Total Hospitals | 4,932,995 | ||||||||
See Notes to Financial Statements.
Legg Mason Partners Funds Trust 2006 Annual Report 31
Table of Contents
Schedules of Investments (December 31, 2006) (continued)
| Face Amount | Rating‡ | Security | Value | ||||||
| Housing: Multi-Family — 2.1% | |||||||||
| $ | 1,645,000 | AA | New York City Housing Development Corp., MFH Revenue, | $ | 1,732,958 | ||||
| Housing: Single-Family — 3.9% | |||||||||
| 3,200,000 | Aa1(b) | New York State Mortgage Agency Revenue, Homeowner Mortgage, Series 71, 5.350% due 10/1/18 (c) | 3,269,696 | ||||||
| Lease — 5.1% | |||||||||
| 3,500,000 | AAA | New York State Dormitory Authority Revenue, Court Facilities Lease, NYC Issue, Non State Supported Debt, Series A, | 4,232,130 | ||||||
| Pre-Refunded (d) — 6.5% | |||||||||
| 2,070,000 | AA- | New York City, NY, GO, Series B, Call 8/1/10 @ 101, | 2,234,751 | ||||||
| 580,000 | AAA | New York City, NY, TFA Revenue, Future Tax Secured, Series A, Call 2/15/10 @ 101, 5.750% due 2/15/14 | 622,120 | ||||||
| 1,500,000 | A+ | New York State Dormitory Authority Revenue, Court Facilities, Series A, Call 5/15/13 @ 100, 5.500% due 5/15/17 | 1,654,455 | ||||||
| 785,000 | AAA | New York State Thruway Authority, Highway and Bridge Transportation Fund, Series C, AMBAC-Insured, | 856,011 | ||||||
Total Pre-Refunded | 5,367,337 | ||||||||
| Sales Tax — 19.6% | |||||||||
New York City, NY, TFA Revenue: | |||||||||
| 1,155,000 | AAA | Future Tax Secured, Series B, 5.375% due 2/1/15 | 1,251,015 | ||||||
| 1,685,000 | AAA | Series A, 5.500% due 11/15/17 | 1,842,564 | ||||||
| 175,000 | AAA | Unrefunded, Future Tax, Series A, 5.750% due 2/15/16 | 187,280 | ||||||
New York State Local Assistance Corp., Refunded: | |||||||||
| 3,000,000 | AAA | Series C, 5.500% due 4/1/17 | 3,384,420 | ||||||
| 2,255,000 | AAA | Series E, 6.000% due 4/1/14 | 2,531,350 | ||||||
Sales Tax Asset Receivables Corp. NY, Series A, MBIA-Insured: | |||||||||
| 2,500,000 | AAA | 5.250% due 10/15/18 | 2,738,525 | ||||||
| 4,000,000 | AAA | 5.000% due 10/15/21 | 4,289,840 | ||||||
Total Sales Tax | 16,224,994 | ||||||||
| Tax Allocation — 1.4% | |||||||||
| 1,090,000 | Aa3(b) | 34th Street Partnership Inc., New York, Refunding, Capital Improvement, 5.000% due 1/1/16 | 1,152,915 | ||||||
| Transportation — 12.0% | |||||||||
Metropolitan Transportation Authority: | |||||||||
| 2,500,000 | AAA | New York Services Contract, Refunding Bonds, Series A, AMBAC-Insured, 5.500% due 11/15/15 | 2,743,425 | ||||||
| 1,000,000 | AAA | Revenue, Refunding, Series A, AMBAC-Insured, 5.500% due 11/15/18 | 1,091,300 | ||||||
See Notes to Financial Statements.
32 Legg Mason Partners Funds Trust 2006 Annual Report
Table of Contents
Schedules of Investments (December 31, 2006) (continued)
| Face Amount | Rating‡ | Security | Value | ||||||
| Transportation — 12.0% (continued) | |||||||||
New York State Thruway Authority: | |||||||||
| $ | 215,000 | AAA | Highway and Bridge Transportation Fund Unrefunded Balance, Series C, AMBAC-Insured, 5.500% due 4/1/15 | $ | 234,449 | ||||
| 1,100,000 | AA- | Service Contract Revenue, Local Highway and Bridge, 5.500% due 4/1/14 | 1,196,767 | ||||||
| 3,000,000 | AA- | Unrefunded Balance, Series E, 5.250% due 1/1/13 | 3,077,640 | ||||||
| 1,500,000 | AAA | Puerto Rico Commonwealth, Highway & Transportation Authority, Highway Revenue, Series G, FGIC-Insured, 5.250% due 7/1/16 | 1,633,080 | ||||||
Total Transportation | 9,976,661 | ||||||||
| Utilities — 2.0% | |||||||||
| 1,500,000 | AAA | Long Island Power Authority, New York Electric System Revenue, Series C, MBIA/IBC-Insured, 5.500% due 9/1/21 | 1,665,450 | ||||||
| TOTAL INVESTMENTS BEFORE SHORT-TERM INVESTMENT | |||||||||
| (Cost — $76,873,952) | 80,121,672 | ||||||||
| SHORT-TERM INVESTMENT (e) — 1.8% | |||||||||
| Industrial Development — 1.8% | |||||||||
| 1,500,000 | A-1+ | New York City, NY, IDA Revenue, Civic Facilities Revenue, Lycee Francais Development NY Project, Series B, LOC-JPMorgan Chase, 3.600%, 1/2/07 (Cost — $1,500,000) | 1,500,000 | ||||||
| TOTAL INVESTMENTS — 98.5% (Cost — $78,373,952#) | 81,621,672 | ||||||||
Other Assets in Excess of Liabilities — 1.5% | 1,264,031 | ||||||||
| TOTAL NET ASSETS — 100.0% | $ | 82,885,703 | |||||||
| ‡ | All ratings are by Standard & Poor’s Ratings Service, unless otherwise noted. All ratings are unaudited. |
(a) | Bonds are escrowed to maturity by U.S. government securities and/or U.S. government agency securities and are considered by the Manager to be triple-A rated even if issuer has not applied for new ratings. |
(b) | Rating by Moody’s Investors Service. All ratings are unaudited. |
(c) | Income from this issue is considered a preference item for purposes of calculating the alternative minimum tax (“AMT”). |
(d) | Pre-Refunded bonds are escrowed with U.S. government obligations and/or U.S. government agency securities and are considered by the Manager to be triple-A rated even if issuer has not applied for new ratings. |
(e) | Variable rate demand obligations have a demand feature under which the Fund can tender them back to the issuer on no more than 7 days notice. Date shown is the date of the next interest rate change. |
| # | Aggregate cost for federal income tax purposes is substantially the same. |
See pages 34 and 35 for definitions of ratings.
Abbreviations used in this schedule: | ||
| AMBAC | — Ambac Assurance Corporation | |
| FGIC | — Financial Guaranty Insurance Company | |
| FSA | — Financial Security Assurance | |
| GO | — General Obligation | |
| IBC | — Insured Bond Certificates | |
| IDA | — Industrial Development Authority | |
| LOC | — Letter of Credit | |
| MBIA | — Municipal Bond Investors Assurance Corporation | |
| MFH | — Multi-Family Housing | |
| SONYMA | — State of New York Mortgage Association | |
| TFA | — Transitional Finance Authority | |
See Notes to Financial Statements.
Legg Mason Partners Funds Trust 2006 Annual Report 33
Table of Contents
Bond Ratings (unaudited)
The definitions of the applicable rating symbols are set forth below:
Standard & Poor’s Ratings Service (“Standard & Poor’s”) — Ratings from “AA” to “CCC” may be modified by the addition of a plus (+) or a minus (-) sign to show relative standings within the major rating categories.
AAA | — Bonds rated “AAA” have the highest rating assigned by Standard & Poor’s. Capacity to pay interest and repay principal is extremely strong. |
AA | — Bonds rated “AA” have a very strong capacity to pay interest and repay principal and differ from the highest rated issue only in a small degree. |
A | — Bonds rated “A” have a strong capacity to pay interest and repay principal although they are somewhat more susceptible to the adverse effects of changes in circumstances and economic conditions than debt in higher rated categories. |
BBB | — Bonds rated “BBB” are regarded as having an adequate capacity to pay interest and repay principal. Whereas they normally exhibit adequate protection parameters, adverse economic conditions or changing circumstances are more likely to lead to a weakened capacity to pay interest and repay principal for bonds in this category than in higher rated categories. |
BB, B, CCC and CC | — Bonds rated “BB”, “B”, “CCC” and “CC” are regarded, on balance, as predominantly speculative with respect to capacity to pay interest and repay principal in accordance with the terms of the obligation. “BB” represents a lower degree of speculation than “B” and “CC” the highest degree of speculation. While such bonds will likely have some quality and protective characteristics, these are outweighed by large uncertainties or major risk exposures to adverse conditions. |
D | — Bonds rated “D” are in default and payment of interest and/or repayment of principal is in arrears. |
Moody’s Investors Service (“Moody’s”) — Numerical modifiers 1, 2 and 3 may be applied to each generic rating from “Aa” to “Caa,” where 1 is the highest and 3 the lowest ranking within its generic category.
Aaa | — Bonds rated “Aaa” are judged to be of the best quality. They carry the smallest degree of investment risk and are generally referred to as “gilt edge.” Interest payments are protected by a large or by an exceptionally stable margin and principal is secure. While the various protective elements are likely to change, such changes as can be visualized are most unlikely to impair the fundamentally strong position of such issues. |
Aa | — Bonds rated “Aa” are judged to be of high quality by all standards. Together with the “Aaa” group they comprise what are generally known as high grade bonds. They are rated lower than the best bonds because margins of protection may not be as large as in “Aaa” securities or fluctuation of protective elements may be of greater amplitude or there may be other elements present which make the long-term risks appear somewhat larger than in “Aaa” securities. |
A | — Bonds rated “A” possess many favorable investment attributes and are to be considered as upper medium grade obligations. Factors giving security to principal and interest are considered adequate but elements may be present which suggest a susceptibility to impairment some time in the future. |
Baa | — Bonds rated “Baa” are considered as medium grade obligations, i.e., they are neither highly protected nor poorly secured. Interest payments and principal security appear adequate for the present but certain protective elements may be lacking or may be characteristically unreliable over any great length of time. Such bonds lack outstanding investment characteristics and in fact have speculative characteristics as well. |
Ba | — Bonds rated “Ba” are judged to have speculative elements; their future cannot be considered as well assured. Often the protection of interest and principal payments may be very moderate and therefore not well safeguarded during both good and bad times over the future. Uncertainty of position characterizes bonds in this class. |
B | — Bonds rated “B” generally lack characteristics of desirable investments. Assurance of interest and principal payments or of maintenance of other terms of the contract over any long period of time may be small. |
Caa | — Bonds rated “Caa” are of poor standing. These may be in default, or present elements of danger may exist with respect to principal or interest. |
Ca | — Bonds rated “Ca” represent obligations which are speculative in a high degree. Such issues are often in default or have other marked short-comings. |
C | — Bonds rated “C” are the lowest class of bonds and issues so rated can be regarded as having extremely poor prospects of ever attaining any real investment standing. |
34 Legg Mason Partners Funds Trust 2006 Annual Report
Table of Contents
Bond Ratings (unaudited) (continued)
Fitch Ratings Service (“Fitch”) — Ratings from “AA” to “CCC” may be modified by the addition of a plus (+) or minus (-) sign to show relative standings within the major rating categories.
AAA | — Bonds rated “AAA” have the highest rating assigned by Fitch. Capacity to pay interest and repay principal is extremely strong. |
AA | — Bonds rated “AA” have a very strong capacity to pay interest and repay principal and differ from the highest rated issues only in a small degree. |
A | — Bonds rated “A” have a strong capacity to pay interest and repay principal although they are somewhat more susceptible to the adverse effects of changes in circumstances and economic conditions than debt in higher rated categories. |
BBB | — Bonds rated “BBB” are regarded as having an adequate capacity to pay interest and repay principal. Whereas they normally exhibit adequate protection parameters, adverse economic conditions or changing circumstances are more likely to lead to a weakened capacity to pay interest and repay principal for bonds in this category than in higher rated categories. |
BB, B, CCC and CC | — Bonds rated “BB”, “B”, “CCC” and “CC” are regarded, on balance, as predominantly speculative with respect to capacity to pay interest and repay principal in accordance with the terms of the obligation. “BB” represents a lower degree of speculation than “B”, and “CC” the highest degree of speculation. While such bonds will likely have some quality and protective characteristics, these are outweighed by large uncertainties or major risk exposures to adverse conditions. |
NR | — Indicates that the bond is not rated by Standard & Poor’s, Moody’s or Fitch Ratings Service. |
Short-Term Security Ratings (unaudited)
SP-1 | — Standard & Poor’s highest rating indicating very strong or strong capacity to pay principal and interest; those issues determined to possess overwhelming safety characteristics are denoted with a plus (+) sign. |
A-1 | — Standard & Poor’s highest commercial paper and variable-rate demand obligation (VRDO) rating indicating that the degree of safety regarding timely payment is either overwhelming or very strong; those issues determined to possess overwhelming safety characteristics are denoted with a plus (+) sign. |
VMIG 1 | — Moody’s highest rating for issues having a demand feature — VRDO. |
MIG 1 | — Moody’s highest rating for short-term municipal obligations. |
P-1 | — Moody’s highest rating for commercial paper and for VRDO prior to the advent of the VMIG 1 rating. |
F-1 | — Fitch’s highest rating indicating the strongest capacity for timely payment of financial commitments; those issues determined to possess overwhelming strong credit feature are denoted with a plus (+) sign. |
Legg Mason Partners Funds Trust 2006 Annual Report 35
Table of Contents
Statements of Assets and Liabilities (December 31, 2006)
| Legg Mason Partners National Tax Free Bond Fund | Legg Mason Partners California Tax Free Bond Fund | Legg Mason Partners New York Tax Free Bond Fund | ||||||||||
| ASSETS: | ||||||||||||
Investments, at cost | $ | 29,344,553 | $ | 6,527,506 | $ | 78,373,952 | ||||||
Investments, at value | $ | 29,762,824 | $ | 6,661,490 | $ | 81,621,672 | ||||||
Cash | 54,867 | 78,978 | 219,907 | |||||||||
Interest receivable | 441,360 | 121,093 | 1,221,515 | |||||||||
Receivable for Fund shares sold | 11,962 | 38,544 | 900 | |||||||||
Receivable from manager | 5,699 | 4,572 | 2,206 | |||||||||
Prepaid expenses | 15,434 | 19,346 | 18,937 | |||||||||
Total Assets | 30,292,146 | 6,924,023 | 83,085,137 | |||||||||
| LIABILITIES: | ||||||||||||
Payable for Fund shares repurchased | 33,446 | 2,996 | 74,936 | |||||||||
Distributions payable | 8,599 | 1,982 | 11,584 | |||||||||
Distribution fees payable | 7,558 | 1,638 | 17,965 | |||||||||
Trustees’ fees payable | 3,888 | 1,438 | 6,395 | |||||||||
Investment management fee payable | — | — | 24,360 | |||||||||
Accrued expenses | 74,021 | 43,540 | 64,194 | |||||||||
Total Liabilities | 127,512 | 51,594 | 199,434 | |||||||||
Total Net Assets | $ | 30,164,634 | $ | 6,872,429 | $ | 82,885,703 | ||||||
| NET ASSETS: | ||||||||||||
Paid-in capital in excess of par value | $ | 33,785,216 | $ | 9,061,017 | $ | 83,347,187 | ||||||
Accumulated net realized loss on investments | (4,038,853 | ) | (2,322,572 | ) | (3,709,204 | ) | ||||||
Net unrealized appreciation on investments | 418,271 | 133,984 | 3,247,720 | |||||||||
Total Net Assets | $ | 30,164,634 | $ | 6,872,429 | $ | 82,885,703 | ||||||
Shares Outstanding: | ||||||||||||
Class A | 2,365,546 | 639,386 | 7,002,924 | |||||||||
Class B | 117,194 | 20,248 | 21,912 | |||||||||
Class C | 54,333 | 9,676 | 5,339 | |||||||||
Class O | 20,510 | 218 | 12,014 | |||||||||
Net Asset Value: | ||||||||||||
Class A (and redemption price) | $11.79 | $10.26 | $11.77 | |||||||||
Class B(1) (and offering price) | $11.81 | $10.28 | $11.77 | |||||||||
Class C(1) (and offering price) | $11.81 | $10.26 | $11.75 | |||||||||
Class O (offering price and redemption price) | $11.81 | $10.27 | $11.76 | |||||||||
Maximum Public Offering Price Per Share: |
| |||||||||||
Class A(2) (based on maximum initial sales charge of 4.25%) | $12.31 | $10.72 | $12.29 | |||||||||
(1) | Redemption price per share is equal to net asset value less any applicable CDSC (See Note 2). |
(2) | Class A shares maximum initial sales charge increased from 4.00% to 4.25% on November 20, 2006. |
See Notes to Financial Statements.
36 Legg Mason Partners Funds Trust 2006 Annual Report
Table of Contents
Statements of Operations (For the year ended December 31, 2006)
| Legg Mason Partners National Tax Free Bond Fund | Legg Mason Partners California Tax Free Bond Fund | Legg Mason Partners New York Tax Free Bond Fund | ||||||||||
| INVESTMENT INCOME: | ||||||||||||
Interest | $ | 1,459,754 | $ | 365,055 | $ | 3,867,281 | ||||||
| EXPENSES: | ||||||||||||
Investment management fee (Note 2) | 175,942 | 40,140 | 441,849 | |||||||||
Distribution fees (Notes 2 and 5) | 106,220 | 21,650 | 222,633 | |||||||||
Shareholder reports (Note 5) | 77,866 | 1,936 | 9,777 | |||||||||
Registration fees | 47,323 | 44,522 | 45,342 | |||||||||
Restructuring and reorganization fees (Note 12) | 30,593 | 29,002 | 34,962 | |||||||||
Audit and tax | 25,596 | 21,593 | 25,872 | |||||||||
Legal fees | 25,122 | 26,232 | 43,657 | |||||||||
Transfer agent fees (Note 5) | 24,972 | 1,882 | 20,096 | |||||||||
Trustees’ fees (Note 12) | 9,736 | 8,206 | 12,492 | |||||||||
Insurance | 1,730 | 202 | 672 | |||||||||
Custody fees | 101 | 38 | 175 | |||||||||
Miscellaneous expenses | 12,852 | 6,381 | 10,050 | |||||||||
Total Expenses | 538,053 | 201,784 | 867,577 | |||||||||
Less: Fee waivers and/or expense reimbursements | (226,158 | ) | (107,186 | ) | (126,034 | ) | ||||||
Net Expenses | 311,895 | 94,598 | 741,543 | |||||||||
Net Investment Income | 1,147,859 | 270,457 | 3,125,738 | |||||||||
| REALIZED AND UNREALIZED GAIN (LOSS) ON INVESTMENTS (NOTES 1 AND 3): | ||||||||||||
Net Realized Gain From Investment Transactions | 130,639 | 445,370 | 448,004 | |||||||||
Change in Net Unrealized Appreciation/Depreciation From Investments | (94,591 | ) | (505,973 | ) | (196,128 | ) | ||||||
Net Gain (Loss) on Investments | 36,048 | (60,603 | ) | 251,876 | ||||||||
Increase in Net Assets From Operations | $ | 1,183,907 | $ | 209,854 | $ | 3,377,614 | ||||||
See Notes to Financial Statements.
Legg Mason Partners Funds Trust 2006 Annual Report 37
Table of Contents
Statements of Changes in Net Assets (For the years ended December 31,)
| Legg Mason Partners National Tax Free Bond Fund | 2006 | 2005 | ||||||
| OPERATIONS: | ||||||||
Net investment income | $ | 1,147,859 | $ | 1,350,953 | ||||
Net realized gain | 130,639 | 1,308,861 | ||||||
Change in net unrealized appreciation/depreciation | (94,591 | ) | (1,657,345 | ) | ||||
Increase in Net Assets From Operations | 1,183,907 | 1,002,469 | ||||||
| DISTRIBUTIONS TO SHAREHOLDERS FROM (NOTES 1 AND 6): | ||||||||
Net investment income | (1,178,452 | ) | (1,350,953 | ) | ||||
Decrease in Net Assets From Distributions to Shareholders | (1,178,452 | ) | (1,350,953 | ) | ||||
| FUND SHARE TRANSACTIONS (NOTE 7): | ||||||||
Net proceeds from sale of shares | 4,454,849 | 3,893,404 | ||||||
Reinvestment of distributions | 1,075,016 | 1,230,768 | ||||||
Cost of shares repurchased | (14,607,282 | ) | (7,525,020 | ) | ||||
Decrease in Net Assets From Fund Share Transactions | (9,077,417 | ) | (2,400,848 | ) | ||||
Decrease in Net Assets | (9,071,962 | ) | (2,749,332 | ) | ||||
| NET ASSETS: | ||||||||
Beginning of year | 39,236,596 | 41,985,928 | ||||||
End of year | $ | 30,164,634 | $ | 39,236,596 | ||||
See Notes to Financial Statements.
38 Legg Mason Partners Funds Trust 2006 Annual Report
Table of Contents
Statements of Changes in Net Assets (For the years ended December 31,) (continued)
| Legg Mason Partners California Tax Free Bond Fund | 2006 | 2005 | ||||||
| OPERATIONS: | ||||||||
Net investment income | $ | 270,457 | $ | 403,437 | ||||
Net realized gain | 445,370 | 172,505 | ||||||
Change in net unrealized appreciation/depreciation | (505,973 | ) | (441,143 | ) | ||||
Increase in Net Assets From Operations | 209,854 | 134,799 | ||||||
| DISTRIBUTIONS TO SHAREHOLDERS FROM (NOTES 1 AND 6): | ||||||||
Net investment income | (299,459 | ) | (403,437 | ) | ||||
Decrease in Net Assets From Distributions to Shareholders | (299,459 | ) | (403,437 | ) | ||||
| FUND SHARE TRANSACTIONS (NOTE 7): | ||||||||
Net proceeds from sale of shares | 235,597 | 117,953 | ||||||
Reinvestment of distributions | 291,894 | 398,073 | ||||||
Cost of shares repurchased | (3,049,497 | ) | (2,171,280 | ) | ||||
Decrease in Net Assets From Fund Share Transactions | (2,522,006 | ) | (1,655,254 | ) | ||||
Decrease in Net Assets | (2,611,611 | ) | (1,923,892 | ) | ||||
| NET ASSETS: | ||||||||
Beginning of year | 9,484,040 | 11,407,932 | ||||||
End of year | $ | 6,872,429 | $ | 9,484,040 | ||||
See Notes to Financial Statements.
Legg Mason Partners Funds Trust 2006 Annual Report 39
Table of Contents
Statements of Changes in Net Assets (For the years ended December 31,) (continued)
| Legg Mason Partners New York Tax Free Bond Fund | 2006 | 2005 | ||||||
| OPERATIONS: | ||||||||
Net investment income | $ | 3,125,738 | $ | 3,527,498 | ||||
Net realized gain | 448,004 | 1,719,404 | ||||||
Change in net unrealized appreciation/depreciation | (196,128 | ) | (3,347,275 | ) | ||||
Increase in Net Assets From Operations | 3,377,614 | 1,899,627 | ||||||
| DISTRIBUTIONS TO SHAREHOLDERS FROM (NOTES 1 AND 6): | ||||||||
Net investment income | (3,160,700 | ) | (3,527,498 | ) | ||||
Decrease in Net Assets From Distributions to Shareholders | (3,160,700 | ) | (3,527,498 | ) | ||||
| FUND SHARE TRANSACTIONS (NOTE 7): | ||||||||
Net proceeds from sale of shares | 1,234,752 | 1,618,336 | ||||||
Reinvestment of distributions | 3,082,287 | 3,477,331 | ||||||
Cost of shares repurchased | (15,939,122 | ) | (13,822,663 | ) | ||||
Decrease in Net Assets From Fund Share Transactions | (11,622,083 | ) | (8,726,996 | ) | ||||
Decrease in Net Assets | (11,405,169 | ) | (10,354,867 | ) | ||||
| NET ASSETS: | ||||||||
Beginning of year | 94,290,872 | 104,645,739 | ||||||
End of year | $ | 82,885,703 | $ | 94,290,872 | ||||
See Notes to Financial Statements.
40 Legg Mason Partners Funds Trust 2006 Annual Report
Table of Contents
Legg Mason Partners National Tax Free Bond Fund
Financial Highlights
For a share of each class of beneficial interest outstanding throughout each year ended December 31:
| Class A Shares(1) | 2006 | 2005 | 2004 | 2003 | 2002 | |||||||||||||||
Net Asset Value, Beginning of Year | $ | 11.76 | $ | 11.85 | $ | 11.91 | $ | 11.79 | $ | 11.13 | ||||||||||
Income (Loss) From Operations: | ||||||||||||||||||||
Net investment income | 0.39 | 0.40 | 0.44 | 0.46 | 0.48 | |||||||||||||||
Net realized and unrealized gain (loss) | 0.04 | (0.09 | ) | (0.06 | ) | 0.13 | 0.66 | |||||||||||||
Total Income From Operations | 0.43 | 0.31 | 0.38 | 0.59 | 1.14 | |||||||||||||||
Less Distributions From: | ||||||||||||||||||||
Net investment income | (0.40 | ) | (0.40 | ) | (0.44 | ) | (0.47 | ) | (0.48 | ) | ||||||||||
Total Distributions | (0.40 | ) | (0.40 | ) | (0.44 | ) | (0.47 | ) | (0.48 | ) | ||||||||||
Net Asset Value, End of Year | $ | 11.79 | $ | 11.76 | $ | 11.85 | $ | 11.91 | $ | 11.79 | ||||||||||
Total Return(2) | 3.70 | % | 2.63 | % | 3.28 | % | 5.07 | % | 10.41 | % | ||||||||||
Net Assets, End of Year (000s) | $27,897 | $35,671 | $37,343 | $42,210 | $50,325 | |||||||||||||||
Ratios to Average Net Assets: | ||||||||||||||||||||
Gross expenses | 1.48 | %† | 1.39 | % | 1.26 | % | 1.10 | % | 1.18 | % | ||||||||||
Net expenses(3)(4) | 0.84 | † | 0.75 | 0.75 | 0.75 | 0.76 | ||||||||||||||
Net investment income | 3.31 | 3.37 | 3.73 | 3.92 | 4.22 | |||||||||||||||
Portfolio Turnover Rate | 25 | % | 36 | % | 41 | % | 42 | % | 12 | % | ||||||||||
(1) | Per share amounts have been calculated using the average shares method. |
(2) | Performance figures may reflect fee waivers and/or expense reimbursements. Past performance is no guarantee of future results. In the absence of fee waivers and/or expense reimbursements, the total return would have been lower. |
(3) | As a result of a voluntary expense limitation, the ratio of expenses to average net assets, other than interest, brokerage, taxes and extraordinary expenses, of Class A shares will not exceed 0.75%. Prior to January 30, 2002, the expense limitation was 0.80%. |
(4) | Reflects fee waivers and/or expense reimbursements. |
| † | Included in the expense ratios are certain non-recurring restructuring (and reorganization if applicable) fees that were incurred by the Fund during the period. Without these fees, the gross and net expense ratios would have been 1.39% and 0.75%, respectively (Note 12). |
See Notes to Financial Statements.
Legg Mason Partners Funds Trust 2006 Annual Report 41
Table of Contents
Legg Mason Partners National Tax Free Bond Fund
Financial Highlights (continued)
For a share of each class of beneficial interest outstanding throughout each year ended December 31:
| Class B Shares(1) | 2006 | 2005 | 2004 | 2003 | 2002 | |||||||||||||||
Net Asset Value, Beginning of Year | $ | 11.77 | $ | 11.87 | $ | 11.93 | $ | 11.80 | $ | 11.14 | ||||||||||
Income (Loss) From Operations: | ||||||||||||||||||||
Net investment income | 0.31 | 0.31 | 0.35 | 0.37 | 0.40 | |||||||||||||||
Net realized and unrealized gain (loss) | 0.04 | (0.10 | ) | (0.06 | ) | 0.13 | 0.65 | |||||||||||||
Total Income From Operations | 0.35 | 0.21 | 0.29 | 0.50 | 1.05 | |||||||||||||||
Less Distributions From: | ||||||||||||||||||||
Net investment income | (0.31 | ) | (0.31 | ) | (0.35 | ) | (0.37 | ) | (0.39 | ) | ||||||||||
Total Distributions | (0.31 | ) | (0.31 | ) | (0.35 | ) | (0.37 | ) | (0.39 | ) | ||||||||||
Net Asset Value, End of Year | $ | 11.81 | $ | 11.77 | $ | 11.87 | $ | 11.93 | $ | 11.80 | ||||||||||
Total Return(2) | 3.02 | % | 1.78 | % | 2.51 | % | 4.35 | % | 9.59 | % | ||||||||||
Net Assets, End of Year (000s) | $1,384 | $2,271 | $2,944 | $4,330 | $4,839 | |||||||||||||||
Ratios to Average Net Assets: | ||||||||||||||||||||
Gross expenses | 2.26 | %† | 2.15 | % | 2.01 | % | 1.85 | % | 1.91 | % | ||||||||||
Net expenses(3)(4) | 1.58 | † | 1.50 | 1.50 | 1.50 | 1.49 | ||||||||||||||
Net investment income | 2.57 | 2.63 | 2.98 | 3.16 | 3.43 | |||||||||||||||
Portfolio Turnover Rate | 25 | % | 36 | % | 41 | % | 42 | % | 12 | % | ||||||||||
(1) | Per share amounts have been calculated using the average shares method. |
(2) | Performance figures may reflect fee waivers and/or expense reimbursements. Past performance is no guarantee of future results. In the absence of fee waivers and/or expense reimbursements, the total return would have been lower. |
(3) | As a result of a voluntary expense limitation, the ratio of expenses to average net assets, other than interest, brokerage, taxes and extraordinary expenses, of Class B shares will not exceed 1.50%. Prior to January 30, 2002, the expense limitation was 1.55%. |
(4) | Reflects fee waivers and/or expense reimbursements. |
| † | Included in the expense ratios are certain non-recurring restructuring (and reorganization if applicable) fees that were incurred by the Fund during the period. Without these fees, the gross and net expense ratios would have been 2.18% and 1.50%, respectively (Note 12). |
See Notes to Financial Statements.
42 Legg Mason Partners Funds Trust 2006 Annual Report
Table of Contents
Legg Mason Partners National Tax Free Bond Fund
Financial Highlights (continued)
For a share of each class of beneficial interest outstanding throughout each year ended December 31:
| Class C Shares(1) | 2006 | 2005 | 2004 | 2003 | 2002 | |||||||||||||||
Net Asset Value, Beginning of Year | $ | 11.77 | $ | 11.87 | $ | 11.92 | $ | 11.80 | $ | 11.13 | ||||||||||
Income (Loss) From Operations: | ||||||||||||||||||||
Net investment income | 0.33 | 0.34 | 0.38 | 0.40 | 0.43 | |||||||||||||||
Net realized and unrealized gain (loss) | 0.05 | (0.10 | ) | (0.05 | ) | 0.12 | 0.66 | |||||||||||||
Total Income From Operations | 0.38 | 0.24 | 0.33 | 0.52 | 1.09 | |||||||||||||||
Less Distributions From: | ||||||||||||||||||||
Net investment income | (0.34 | ) | (0.34 | ) | (0.38 | ) | (0.40 | ) | (0.42 | ) | ||||||||||
Total Distributions | (0.34 | ) | (0.34 | ) | (0.38 | ) | (0.40 | ) | (0.42 | ) | ||||||||||
Net Asset Value, End of Year | $ | 11.81 | $ | 11.77 | $ | 11.87 | $ | 11.92 | $ | 11.80 | ||||||||||
Total Return(2) | 3.27 | % | 2.04 | % | 2.85 | % | 4.53 | % | 9.96 | % | ||||||||||
Net Assets, End of Year (000s) | $642 | $1,133 | $1,539 | $1,923 | $1,763 | |||||||||||||||
Ratios to Average Net Assets: | ||||||||||||||||||||
Gross expenses | 1.89 | %† | 1.92 | % | 1.76 | % | 1.60 | % | 1.67 | % | ||||||||||
Net expenses(3)(4) | 1.34 | † | 1.25 | 1.25 | 1.25 | 1.25 | ||||||||||||||
Net investment income | 2.80 | 2.88 | 3.22 | 3.41 | 3.69 | |||||||||||||||
Portfolio Turnover Rate | 25 | % | 36 | % | 41 | % | 42 | % | 12 | % | ||||||||||
(1) | Per share amounts have been calculated using the average shares method. |
(2) | Performance figures may reflect fee waivers and/or expense reimbursements. Past performance is no guarantee of future results. In the absence of fee waivers and/or expense reimbursements, the total return would have been lower. |
(3) | As a result of a voluntary expense limitation, the ratio of expenses to average net assets, other than interest, brokerage, taxes and extraordinary expenses, of Class C shares will not exceed 1.25%. |
(4) | Reflects fee waivers and/or expense reimbursements. |
| † | Included in the expense ratios are certain non-recurring restructuring (and reorganization if applicable) fees that were incurred by the Fund during the period. Without these fees, the gross and net expense ratios would have been 1.80% and 1.25%, respectively (Note 12). |
See Notes to Financial Statements.
Legg Mason Partners Funds Trust 2006 Annual Report 43
Table of Contents
Legg Mason Partners National Tax Free Bond Fund
Financial Highlights (continued)
For a share of each class of beneficial interest outstanding throughout each year ended December 31:
| Class O Shares(1) | 2006 | 2005 | 2004 | 2003 | 2002 | |||||||||||||||
Net Asset Value, Beginning of Year | $ | 11.77 | $ | 11.87 | $ | 11.93 | $ | 11.79 | $ | 11.13 | ||||||||||
Income (Loss) From Operations: | ||||||||||||||||||||
Net investment income | 0.41 | 0.43 | 0.47 | 0.49 | 0.50 | |||||||||||||||
Net realized and unrealized gain (loss) | 0.06 | (0.10 | ) | (0.06 | ) | 0.14 | 0.67 | |||||||||||||
Total Income From Operations | 0.47 | 0.33 | 0.41 | 0.63 | 1.17 | |||||||||||||||
Less Distributions From: | ||||||||||||||||||||
Net investment income | (0.43 | ) | (0.43 | ) | (0.47 | ) | (0.49 | ) | (0.51 | ) | ||||||||||
Total Distributions | (0.43 | ) | (0.43 | ) | (0.47 | ) | (0.49 | ) | (0.51 | ) | ||||||||||
Net Asset Value, End of Year | $ | 11.81 | $ | 11.77 | $ | 11.87 | $ | 11.93 | $ | 11.79 | ||||||||||
Total Return(2) | 4.05 | % | 2.80 | % | 3.54 | % | 5.48 | % | 10.69 | % | ||||||||||
Net Assets, End of Year (000s) | $242 | $162 | $160 | $157 | $216 | |||||||||||||||
Ratios to Average Net Assets: | ||||||||||||||||||||
Gross expenses | 1.59 | %† | 2.11 | % | 1.01 | % | 0.85 | % | 0.91 | % | ||||||||||
Net expenses(3)(4) | 0.62 | † | 0.50 | 0.50 | 0.50 | 0.50 | ||||||||||||||
Net investment income | 3.50 | 3.61 | 3.97 | 4.18 | 4.39 | |||||||||||||||
Portfolio Turnover Rate | 25 | % | 36 | % | 41 | % | 42 | % | 12 | % | ||||||||||
(1) | Per share amounts have been calculated using the average shares method. |
(2) | Performance figures may reflect fee waivers and/or expense reimbursements. Past performance is no guarantee of future results. In the absence of fee waivers and/or expense reimbursements, the total return would have been lower. |
(3) | As a result of a voluntary expense limitation, the ratio of expenses to average net assets, other than interest, brokerage, taxes and extraordinary expenses, of Class O shares will not exceed 0.50%. |
(4) | Reflects fee waivers and/or expense reimbursements. |
| † | Included in the expense ratios are certain non-recurring restructuring (and reorganization if applicable) fees that were incurred by the Fund during the period. Without these fees, the gross and net expense ratios would have been 1.47% and 0.50%, respectively (Note 12). |
See Notes to Financial Statements.
44 Legg Mason Partners Funds Trust 2006 Annual Report
Table of Contents
Legg Mason Partners California Tax Free Bond Fund
Financial Highlights (continued)
For a share of each class of beneficial interest outstanding throughout each year ended December 31:
| Class A Shares(1) | 2006 | 2005 | 2004 | 2003 | 2002 | |||||||||||||||
Net Asset Value, Beginning of Year | $ | 10.36 | $ | 10.63 | $ | 10.70 | $ | 10.63 | $ | 10.17 | ||||||||||
Income (Loss) From Operations: | ||||||||||||||||||||
Net investment income | 0.35 | 0.41 | 0.40 | 0.39 | 0.39 | |||||||||||||||
Net realized and unrealized gain (loss) | (0.07 | ) | (0.28 | ) | (0.07 | ) | 0.07 | 0.46 | ||||||||||||
Total Income From Operations | 0.28 | 0.13 | 0.33 | 0.46 | 0.85 | |||||||||||||||
Less Distributions From: | ||||||||||||||||||||
Net investment income | (0.38 | ) | (0.40 | ) | (0.40 | ) | (0.39 | ) | (0.39 | ) | ||||||||||
Total Distributions | (0.38 | ) | (0.40 | ) | (0.40 | ) | (0.39 | ) | (0.39 | ) | ||||||||||
Net Asset Value, End of Year | $ | 10.26 | $ | 10.36 | $ | 10.63 | $ | 10.70 | $ | 10.63 | ||||||||||
Total Return(2) | 2.77 | % | 1.29 | % | 3.19 | % | 4.40 | % | 8.47 | % | ||||||||||
Net Assets, End of Year (000s) | $6,563 | $9,310 | $11,242 | $13,009 | $15,280 | |||||||||||||||
Ratios to Average Net Assets: | ||||||||||||||||||||
Gross expenses | 2.47 | %† | 2.43 | % | 1.97 | % | 1.40 | % | 2.05 | % | ||||||||||
Net expenses(3)(4) | 1.15 | † | 0.80 | 0.80 | 0.80 | 0.80 | ||||||||||||||
Net investment income | 3.40 | 3.87 | 3.80 | 3.64 | 3.71 | |||||||||||||||
Portfolio Turnover Rate | 60 | % | 10 | % | 5 | % | 0 | % | 9 | % | ||||||||||
(1) | Per share amounts have been calculated using the average shares method. |
(2) | Performance figures may reflect fee waivers and/or expense reimbursements. Past performance is no guarantee of future results. In the absence of fee waivers and/or expense reimbursements, the total return would have been lower. |
(3) | As a result of a voluntary expense limitation, the ratio of expenses to average net assets, other than interest, brokerage, taxes and extraordinary expenses, of Class A shares will not exceed 0.80%. |
(4) | Reflects fee waivers and/or expense reimbursements. |
| † | Included in the expense ratios are certain non-recurring restructuring (and reorganization if applicable) fees that were incurred by the Fund during the period. Without these fees, the gross and net expense ratios would have been 2.12% and 0.80%, respectively (Note 12). |
See Notes to Financial Statements.
Legg Mason Partners Funds Trust 2006 Annual Report 45
Table of Contents
Legg Mason Partners California Tax Free Bond Fund
Financial Highlights (continued)
For a share of each class of beneficial interest outstanding throughout each year ended December 31:
| Class B Shares(1) | 2006 | 2005 | 2004 | 2003 | 2002 | |||||||||||||||
Net Asset Value, Beginning of Year | $ | 10.37 | $ | 10.64 | $ | 10.71 | $ | 10.63 | $ | 10.18 | ||||||||||
Income (Loss) From Operations: | ||||||||||||||||||||
Net investment income | 0.25 | 0.33 | 0.32 | 0.31 | 0.30 | |||||||||||||||
Net realized and unrealized gain (loss) | (0.04 | ) | (0.27 | ) | (0.07 | ) | 0.08 | 0.46 | ||||||||||||
Total Income From Operations | 0.21 | 0.06 | 0.25 | 0.39 | 0.76 | |||||||||||||||
Less Distributions From: | ||||||||||||||||||||
Net investment income | (0.30 | ) | (0.33 | ) | (0.32 | ) | (0.31 | ) | (0.31 | ) | ||||||||||
Total Distributions | (0.30 | ) | (0.33 | ) | (0.32 | ) | (0.31 | ) | (0.31 | ) | ||||||||||
Net Asset Value, End of Year | $ | 10.28 | $ | 10.37 | $ | 10.64 | $ | 10.71 | $ | 10.63 | ||||||||||
Total Return(2) | 2.11 | % | 0.54 | % | 2.42 | % | 3.70 | % | 7.66 | % | ||||||||||
Net Assets, End of Year (000s) | $208 | $134 | $127 | $178 | $247 | |||||||||||||||
Ratios to Average Net Assets: | ||||||||||||||||||||
Gross expenses | 3.73 | %† | 3.47 | % | 2.70 | % | 2.11 | % | 2.76 | % | ||||||||||
Net expenses(3)(4) | 2.04 | † | 1.55 | 1.55 | 1.55 | 1.53 | ||||||||||||||
Net investment income | 2.42 | 3.11 | 3.04 | 2.86 | 2.88 | |||||||||||||||
Portfolio Turnover Rate | 60 | % | 10 | % | 5 | % | 0 | % | 9 | % | ||||||||||
(1) | Per share amounts have been calculated using the average shares method. |
(2) | Performance figures may reflect fee waivers and/or expense reimbursements. Past performance is no guarantee of future results. In the absence of fee waivers and/or expense reimbursements, the total return would have been lower. |
(3) | As a result of a voluntary expense limitation, the ratio of expenses to average net assets, other than interest, brokerage, taxes and extraordinary expenses, of Class B shares will not exceed 1.55%. |
(4) | Reflects fee waivers and/or expense reimbursements. |
| † | Included in the expense ratios are certain non-recurring restructuring (and reorganization if applicable) fees that were incurred by the Fund during the period. Without these fees, the gross and net expense ratios would have been 3.24% and 1.55%, respectively (Note 12). |
See Notes to Financial Statements.
46 Legg Mason Partners Funds Trust 2006 Annual Report
Table of Contents
Legg Mason Partners California Tax Free Bond Fund
Financial Highlights (continued)
For a share of each class of beneficial interest outstanding throughout each year ended December 31, unless otherwise noted:
| Class C Shares(1) | 2006 | 2005 | 2004 | 2003 | 2002(2) | |||||||||||||||
Net Asset Value, Beginning of Year | $ | 10.36 | $ | 10.63 | $ | 10.70 | $ | 10.63 | $ | 10.76 | ||||||||||
Income (Loss) From Operations: | ||||||||||||||||||||
Net investment income | 0.25 | 0.35 | 0.35 | 0.33 | 0.10 | |||||||||||||||
Net realized and unrealized gain (loss) | (0.02 | ) | (0.27 | ) | (0.07 | ) | 0.07 | (0.13 | ) | |||||||||||
Total Income (Loss) From Operations | 0.23 | 0.08 | 0.28 | 0.40 | (0.03 | ) | ||||||||||||||
Less Distributions From: | ||||||||||||||||||||
Net investment income | (0.33 | ) | (0.35 | ) | (0.35 | ) | (0.33 | ) | (0.10 | ) | ||||||||||
Total Distributions | (0.33 | ) | (0.35 | ) | (0.35 | ) | (0.33 | ) | (0.10 | ) | ||||||||||
Net Asset Value, End of Year | $ | 10.26 | $ | 10.36 | $ | 10.63 | $ | 10.70 | $ | 10.63 | ||||||||||
Total Return(3) | 2.27 | % | 0.79 | % | 2.67 | % | 3.87 | % | (0.28 | )% | ||||||||||
Net Assets, End of Year (000s) | $99 | $38 | $37 | $27 | $26 | |||||||||||||||
Ratios to Average Net Assets: | ||||||||||||||||||||
Gross expenses | 3.96 | %† | 3.45 | % | 2.60 | % | 1.89 | % | 2.51 | %(4) | ||||||||||
Net expenses(5)(6) | 1.93 | † | 1.30 | 1.29 | 1.30 | 1.30 | (4) | |||||||||||||
Net investment income | 2.48 | 3.36 | 3.27 | 3.14 | 3.07 | (4) | ||||||||||||||
Portfolio Turnover Rate | 60 | % | 10 | % | 5 | % | 0 | % | 9 | % | ||||||||||
(1) | Per share amounts have been calculated using the average shares method. |
(2) | For the period September 9, 2002 (inception date) to December 31, 2002. |
(3) | Performance figures may reflect fee waivers and/or expense reimbursements. Past performance is no guarantee of future results. In the absence of fee waivers and/or expense reimbursements, the total return would have been lower. Total returns for periods of less than one year are not annualized. |
(4) | Annualized. |
(5) | As a result of a voluntary expense limitation, the ratio of expenses to average net assets, other than interest, brokerage, taxes and extraordinary expenses, of Class C shares will not exceed 1.30%. |
(6) | Reflects fee waivers and/or expense reimbursements. |
| † | Included in the expense ratios are certain non-recurring restructuring (and reorganization if applicable) fees that were incurred by the Fund during the period. Without these fees, the gross and net expense ratios would have been 3.33% and 1.30%, respectively (Note 12). |
See Notes to Financial Statements.
Legg Mason Partners Funds Trust 2006 Annual Report 47
Table of Contents
Legg Mason Partners California Tax Free Bond Fund
Financial Highlights (continued)
For a share of each class of beneficial interest outstanding throughout each year ended December 31, unless otherwise noted:
| Class O Shares(1) | 2006 | 2005 | 2004 | 2003 | 2002(2) | |||||||||||||||
Net Asset Value, Beginning of Year | $ | 10.36 | $ | 10.63 | $ | 10.71 | $ | 10.63 | $ | 10.81 | ||||||||||
Income (Loss) From Operations: | ||||||||||||||||||||
Net investment income | 0.36 | 0.43 | 0.43 | 0.42 | 0.09 | |||||||||||||||
Net realized and unrealized gain (loss) | (0.04 | ) | (0.27 | ) | (0.08 | ) | 0.08 | (0.18 | ) | |||||||||||
Total Income (Loss) From Operations | 0.32 | 0.16 | 0.35 | 0.50 | (0.09 | ) | ||||||||||||||
Less Distributions From: | ||||||||||||||||||||
Net investment income | (0.41 | ) | (0.43 | ) | (0.43 | ) | (0.42 | ) | (0.09 | ) | ||||||||||
Total Distributions | (0.41 | ) | (0.43 | ) | (0.43 | ) | (0.42 | ) | (0.09 | ) | ||||||||||
Net Asset Value, End of Year | $ | 10.27 | $ | 10.36 | $ | 10.63 | $ | 10.71 | $ | 10.63 | ||||||||||
Total Return(3) | 3.13 | % | 1.57 | % | 3.35 | % | 4.76 | % | (0.79 | )% | ||||||||||
Net Assets, End of Year (000s) | $2 | $2 | $2 | $2 | $2 | |||||||||||||||
Ratios to Average Net Assets: | ||||||||||||||||||||
Gross expenses | 9.28 | %† | 6.00 | % | 1.73 | % | 1.06 | % | 1.70 | %(4) | ||||||||||
Net expenses(5)(6) | 0.96 | † | 0.55 | 0.53 | 0.45 | 0.47 | (4) | |||||||||||||
Net investment income | 3.55 | 4.14 | 4.03 | 3.94 | 3.94 | (4) | ||||||||||||||
Portfolio Turnover Rate | 60 | % | 10 | % | 5 | % | 0 | % | 9 | % | ||||||||||
(1) | Per share amounts have been calculated using the average shares method. |
(2) | For the period October 9, 2002 (inception date) to December 31, 2002. |
(3) | Performance figures may reflect fee waivers and/or expense reimbursements. Past performance is no guarantee of future results. In the absence of fee waivers and/or expense reimbursements, the total return would have been lower. Total returns for periods of less than one year are not annualized. |
(4) | Annualized. |
(5) | As a result of a voluntary expense limitation, the ratio of expenses to average net assets, other than interest, brokerage, taxes and extraordinary expenses, of Class O shares will not exceed 0.55%. |
(6) | Reflects fee waivers and/or expense reimbursements. |
| † | Included in the expense ratios are certain non-recurring restructuring (and reorganization if applicable) fees that were incurred by the Fund during the period. Without these fees, the gross and net expense ratios would have been 8.86% and 0.54%, respectively (Note 12). |
See Notes to Financial Statements.
48 Legg Mason Partners Funds Trust 2006 Annual Report
Table of Contents
Legg Mason Partners New York Tax Free Bond Fund
Financial Highlights (continued)
For a share of each class of beneficial interest outstanding throughout each year ended December 31:
| Class A Shares(1) | 2006 | 2005 | 2004 | 2003 | 2002 | |||||||||||||||
Net Asset Value, Beginning of Year | $ | 11.73 | $ | 11.92 | $ | 11.99 | $ | 11.91 | $ | 11.26 | ||||||||||
Income (Loss) From Operations: | ||||||||||||||||||||
Net investment income | 0.41 | 0.42 | 0.44 | 0.47 | 0.49 | |||||||||||||||
Net realized and unrealized gain (loss) | 0.05 | (0.19 | ) | (0.07 | ) | 0.08 | 0.65 | |||||||||||||
Total Income From Operations | 0.46 | 0.23 | 0.37 | 0.55 | 1.14 | |||||||||||||||
Less Distributions From: | ||||||||||||||||||||
Net investment income | (0.42 | ) | (0.42 | ) | (0.44 | ) | (0.47 | ) | (0.49 | ) | ||||||||||
Total Distributions | (0.42 | ) | (0.42 | ) | (0.44 | ) | (0.47 | ) | (0.49 | ) | ||||||||||
Net Asset Value, End of Year | $ | 11.77 | $ | 11.73 | $ | 11.92 | $ | 11.99 | $ | 11.91 | ||||||||||
Total Return(2) | 3.98 | % | 1.94 | % | 3.17 | % | 4.77 | % | 10.25 | % | ||||||||||
Net Assets, End of Year (000s) | $82,424 | $93,549 | $104,260 | $116,982 | $127,482 | |||||||||||||||
Ratios to Average Net Assets: | ||||||||||||||||||||
Gross expenses | 0.98 | %† | 0.98 | % | 0.96 | % | 0.96 | % | 1.00 | % | ||||||||||
Net expenses(3)(4) | 0.84 | † | 0.80 | 0.80 | 0.80 | 0.80 | ||||||||||||||
Net investment income | 3.54 | 3.54 | 3.72 | 3.95 | 4.19 | |||||||||||||||
Portfolio Turnover Rate | 3 | % | 34 | % | 21 | % | 12 | % | 13 | % | ||||||||||
(1) | Per share amounts have been calculated using the average shares method. |
(2) | Performance figures may reflect fee waivers and/or expense reimbursements. Past performance is no guarantee of future results. In the absence of fee waivers and/or expense reimbursements, the total return would have been lower. |
(3) | As a result of a voluntary expense limitation, the ratio of expenses to average net assets, other than interest, brokerage, taxes and extraordinary expenses, of Class A shares will not exceed 0.80%. |
(4) | Reflects fee waivers and/or expense reimbursements. |
| † | Included in the expense ratios are certain non-recurring restructuring (and reorganization if applicable) fees that were incurred by the Fund during the period. Without these fees, the gross and net expense ratios would have been 0.94% and 0.80%, respectively (Note 12). |
See Notes to Financial Statements.
Legg Mason Partners Funds Trust 2006 Annual Report 49
Table of Contents
Legg Mason Partners New York Tax Free Bond Fund
Financial Highlights (continued)
For a share of each class of beneficial interest outstanding throughout each year ended December 31:
| Class B Shares(1) | 2006 | 2005 | 2004 | 2003 | 2002 | |||||||||||||||
Net Asset Value, Beginning of Year | $ | 11.73 | $ | 11.92 | $ | 11.99 | $ | 11.91 | $ | 11.26 | ||||||||||
Income (Loss) From Operations: | ||||||||||||||||||||
Net investment income | 0.33 | 0.33 | 0.35 | 0.38 | 0.32 | |||||||||||||||
Net realized and unrealized gain (loss) | 0.04 | (0.19 | ) | (0.07 | ) | 0.08 | 0.73 | |||||||||||||
Total Income From Operations | 0.37 | 0.14 | 0.28 | 0.46 | 1.05 | |||||||||||||||
Less Distributions From: | ||||||||||||||||||||
Net investment income | (0.33 | ) | (0.33 | ) | (0.35 | ) | (0.38 | ) | (0.40 | ) | ||||||||||
Total Distributions | (0.33 | ) | (0.33 | ) | (0.35 | ) | (0.38 | ) | (0.40 | ) | ||||||||||
Net Asset Value, End of Year | $ | 11.77 | $ | 11.73 | $ | 11.92 | $ | 11.99 | $ | 11.91 | ||||||||||
Total Return(2) | 3.21 | % | 1.18 | % | 2.41 | % | 3.94 | % | 9.43 | % | ||||||||||
Net Assets, End of Year (000s) | $258 | $294 | $275 | $363 | $218 | |||||||||||||||
Ratios to Average Net Assets: | ||||||||||||||||||||
Gross expenses | 2.30 | %† | 2.22 | % | 1.71 | % | 1.71 | % | 1.74 | % | ||||||||||
Net expenses(3)(4) | 1.59 | † | 1.55 | 1.55 | 1.55 | 1.55 | ||||||||||||||
Net investment income | 2.80 | 2.78 | 2.96 | 3.18 | 3.32 | |||||||||||||||
Portfolio Turnover Rate | 3 | % | 34 | % | 21 | % | 12 | % | 13 | % | ||||||||||
(1) | Per share amounts have been calculated using the average shares method. |
(2) | Performance figures may reflect fee waivers and/or expense reimbursements. Past performance is no guarantee of future results. In the absence of fee waivers and/or expense reimbursements, the total return would have been lower. |
(3) | As a result of a voluntary expense limitation, the ratio of expenses to average net assets, other than interest, brokerage, taxes and extraordinary expenses, of Class B shares will not exceed 1.55%. |
(4) | Reflects fee waivers and/or expense reimbursements. |
| † | Included in the expense ratios are certain non-recurring restructuring (and reorganization if applicable) fees that were incurred by the Fund during the period. Without these fees, the gross and net expense ratios would have been 2.26% and 1.55%, respectively (Note 12). |
See Notes to Financial Statements.
50 Legg Mason Partners Funds Trust 2006 Annual Report
Table of Contents
Legg Mason Partners New York Tax Free Bond Fund
Financial Highlights (continued)
For a share of each class of beneficial interest outstanding throughout each year ended December 31, unless otherwise noted:
| Class C Shares(1) | 2006 | 2005 | 2004 | 2003 | 2002(2) | |||||||||||||||
Net Asset Value, Beginning of Year | $ | 11.71 | $ | 11.90 | $ | 12.00 | $ | 11.92 | $ | 11.72 | ||||||||||
Income (Loss) From Operations: | ||||||||||||||||||||
Net investment income | 0.35 | 0.36 | 0.38 | 0.41 | 0.18 | |||||||||||||||
Net realized and unrealized gain (loss) | 0.05 | (0.19 | ) | (0.10 | ) | 0.08 | 0.21 | |||||||||||||
Total Income From Operations | 0.40 | 0.17 | 0.28 | 0.49 | 0.39 | |||||||||||||||
Less Distributions From: | ||||||||||||||||||||
Net investment income | (0.36 | ) | (0.36 | ) | (0.38 | ) | (0.41 | ) | (0.19 | ) | ||||||||||
Total Distributions | (0.36 | ) | (0.36 | ) | (0.38 | ) | (0.41 | ) | (0.19 | ) | ||||||||||
Net Asset Value, End of Year | $ | 11.75 | $ | 11.71 | $ | 11.90 | $ | 12.00 | $ | 11.92 | ||||||||||
Total Return(3) | 3.47 | % | 1.43 | % | 2.40 | % | 4.18 | % | 3.30 | % | ||||||||||
Net Assets, End of Year (000s) | $63 | $60 | $33 | $636 | $37 | |||||||||||||||
Ratios to Average Net Assets: | ||||||||||||||||||||
Gross expenses | 2.95 | %† | 4.22 | % | 1.45 | % | 1.47 | % | 1.50 | %(4) | ||||||||||
Net expenses(5)(6) | 1.33 | † | 1.29 | 1.30 | 1.30 | 1.30 | (4) | |||||||||||||
Net investment income | 3.03 | 3.01 | 3.31 | 3.38 | 3.63 | (4) | ||||||||||||||
Portfolio Turnover Rate | 3 | % | 34 | % | 21 | % | 12 | % | 13 | % | ||||||||||
(1) | Per share amounts have been calculated using the average shares method. |
(2) | For the period July 19, 2002 (inception date) to December 31, 2002. |
(3) | Performance figures may reflect fee waivers and/or expense reimbursements. Past performance is no guarantee of future results. In the absence of fee waivers and/or expense reimbursements, the total return would have been lower. Total returns for periods of less than one year are not annualized. |
(4) | Annualized. |
(5) | As a result of a voluntary expense limitation, the ratio of expenses to average net assets, other than interest, brokerage, taxes and extraordinary expenses, of Class C shares will not exceed 1.30%. |
(6) | Reflects fee waivers and/or expense reimbursements. |
| † | Included in the expense ratios are certain non-recurring restructuring (and reorganization if applicable) fees that were incurred by the Fund during the period. Without these fees, the gross and net expense ratios would have been 2.91% and 1.29%, respectively (Note 12). |
See Notes to Financial Statements.
Legg Mason Partners Funds Trust 2006 Annual Report 51
Table of Contents
Legg Mason Partners New York Tax Free Bond Fund
Financial Highlights (continued)
For a share of each class of beneficial interest outstanding throughout each year ended December 31:
| Class O Shares(1) | 2006 | 2005 | 2004 | 2003 | 2002 | |||||||||||||||
Net Asset Value, Beginning of Year | $ | 11.72 | $ | 11.91 | $ | 11.98 | $ | 11.90 | $ | 11.25 | ||||||||||
Income (Loss) From Operations: | ||||||||||||||||||||
Net investment income | 0.45 | 0.45 | 0.47 | 0.50 | 0.52 | |||||||||||||||
Net realized and unrealized gain (loss) | 0.04 | (0.19 | ) | (0.07 | ) | 0.08 | 0.64 | |||||||||||||
Total Income From Operations | 0.49 | 0.26 | 0.40 | 0.58 | 1.16 | |||||||||||||||
Less Distributions From: | ||||||||||||||||||||
Net investment income | (0.45 | ) | (0.45 | ) | (0.47 | ) | (0.50 | ) | (0.51 | ) | ||||||||||
Total Distributions | (0.45 | ) | (0.45 | ) | (0.47 | ) | (0.50 | ) | (0.51 | ) | ||||||||||
Net Asset Value, End of Year | $ | 11.76 | $ | 11.72 | $ | 11.91 | $ | 11.98 | $ | 11.90 | ||||||||||
Total Return(2) | 4.24 | % | 2.19 | % | 3.44 | % | 4.99 | % | 10.54 | % | ||||||||||
Net Assets, End of Year (000s) | $141 | $388 | $78 | $93 | $92 | |||||||||||||||
Ratios to Average Net Assets: | ||||||||||||||||||||
Gross expenses | 1.01 | %† | 1.63 | % | 0.71 | % | 0.71 | % | 0.75 | % | ||||||||||
Net expenses(3)(4) | 0.57 | † | 0.55 | 0.55 | 0.55 | 0.56 | ||||||||||||||
Net investment income | 3.81 | 3.89 | 3.96 | 4.20 | 4.40 | |||||||||||||||
Portfolio Turnover Rate | 3 | % | 34 | % | 21 | % | 12 | % | 13 | % | ||||||||||
(1) | Per share amounts have been calculated using the average shares method. |
(2) | Performance figures may reflect fee waivers and/or expense reimbursements. Past performance is no guarantee of future results. In the absence of fee waivers and/or expense reimbursements, the total return would have been lower. |
(3) | As a result of a voluntary expense limitation, the ratio of expenses to average net assets, other than interest, brokerage, taxes and extraordinary expenses, of Class O shares will not exceed 0.55%. |
(4) | Reflects fee waivers and/or expense reimbursements. |
| † | Included in the expense ratios are certain non-recurring restructuring (and reorganization if applicable) fees that were incurred by the Fund during the period. Without these fees, the gross and net expense ratios would have been 0.99% and 0.55%, respectively (Note 12). |
See Notes to Financial Statements.
52 Legg Mason Partners Funds Trust 2006 Annual Report
Table of Contents
| 1. | Organization and Significant Accounting Policies |
Legg Mason Partners National Tax Free Bond Fund (“National Tax Free Bond Fund”), Legg Mason Partners California Tax Free Bond Fund (“California Tax Free Bond Fund”) and Legg Mason Partners New York Tax Free Bond Fund (“New York Tax Free Bond Fund”) (formerly known as Salomon Brothers National Tax Free Bond Fund, Salomon Brothers California Tax Free Bond Fund and Salomon Brothers New York Tax Free Bond Fund, respectively) (collectively, the “Funds”) are each a separate non-diversified series of Legg Mason Partners Funds Trust (formerly known as Salomon Funds Trust) (the “Trust”). The Trust, a Massachusetts business trust, is registered under the Investment Company Act of 1940, as amended (the “1940 Act”), as an open-end management investment company.
The following are significant accounting policies consistently followed by the Funds and are in conformity with U.S. generally accepted accounting principles (“GAAP”). Estimates and assumptions are required to be made regarding assets, liabilities and changes in net assets resulting from operations when financial statements are prepared. Changes in the economic environment, financial markets and any other parameters used in determining these estimates could cause actual results to differ.
(a) Investment Valuation. Debt securities are valued at the mean between the bid and asked prices provided by an independent pricing service that are based on transactions in municipal obligations, quotations from municipal bond dealers, market transactions in comparable securities and various other relationships between securities. When prices are not readily available, or are determined not to reflect fair value, such as when the value of a security has been significantly affected by events after the close of the exchange or market on which the security is principally traded, but before the Funds calculate their net asset value, the Funds may value these investments at fair value as determined in accordance with the procedures approved by the Funds’ Board of Trustees. Short-term obligations with maturities of 60 days or less are valued at amortized cost, which approximates market value.
(b) Fund Concentration. Since the California Tax Free Bond Fund and the New York Tax Free Bond Fund invest primarily in obligations of issuers within California and New York, respectively, they are subject to possible concentration risks associated with the economic, political, or legal developments or industrial or regional matters specifically affecting California and New York, respectively.
(c) Security Transactions and Investment Income. Security transactions are accounted for on a trade date basis. Interest income, adjusted for amortization of premium and accretion of discount, is recorded on the accrual basis. Dividend income is recorded on the ex-dividend date. The cost of investments sold is determined by use of the specific identification method. To the extent any issuer defaults on an expected interest payment, the Funds’ policy is to generally halt any additional interest income accruals and consider the realizability of interest accrued up to the date of default.
(d) Distributions to Shareholders. Distributions from net investment income on the shares of the Funds are declared each business day to shareholders of record, and are paid monthly. The Funds intends to satisfy conditions that will enable interest from municipal securities, which is exempt from federal and certain state income taxes, to retain such
Legg Mason Partners Funds Trust 2006 Annual Report 53
Table of Contents
Notes to Financial Statements (continued)
tax-exempt status when distributed to the shareholders of the Funds. Distributions of net realized gains, if any, are taxable and are declared at least annually. Distributions are recorded on the ex-dividend date and are determined in accordance with income tax regulations, which may differ from GAAP.
(e) Class Accounting. Investment income, common expenses and realized/unrealized gain (loss) on investments are allocated to the various classes of the Funds on the basis of daily net assets of each class. Fees relating to a specific class are charged directly to that class.
(f) Expenses. The Funds bear all their costs of operation other than expenses specifically assumed by the manager. Expenses incurred by the Trust with respect to any two or more funds in the series are allocated in proportion to the average net assets of each Fund, except when allocations of direct expenses to each Fund can otherwise be made fairly. Expenses directly attributable to a fund are charged to that fund.
(g) Federal and Other Taxes. It is the Funds’ policy to comply with the federal income and excise tax requirements of the Internal Revenue Code of 1986, as amended, applicable to regulated investment companies. Accordingly, the Funds intend to distribute substantially all of its income and net realized gains on investments, if any, to shareholders each year. Therefore, no federal income tax provision is required in the Funds’ financial statements.
(h) Reclassification. GAAP requires that certain components of net assets be adjusted to reflect permanent differences between financial and tax reporting. These reclassifications have no effect on net assets or net asset values per share. During the current year, the following reclassifications have been made:
| Fund | Net Investment Income | Paid-in Capital | ||||
| National Tax Free Bond Fund | (a) | $30,593 | $(30,593) | |||
| California Tax Free Bond Fund | (a) | 29,002 | (29,002) | |||
| New York Tax Free Bond Fund | (a) | 34,962 | (34,962) | |||
(a) | Reclassifications are primarily due to a book/tax differences in the treatment of various items. |
| 2. | Investment Management Agreement and Other Transactions with Affiliates |
Prior to August 1, 2006, Salomon Brothers Asset Management Inc. (“SBAM”), a wholly-owned subsidiary of Legg Mason, Inc. (“Legg Mason”), acted as the investment manager of the Funds. Under the investment management agreement, the Funds paid an investment management fee calculated daily and paid monthly at an annual rate of 0.50% of the Funds’ average daily net assets.
Effective August 1, 2006, Legg Mason Partners Fund Advisor, LLC (“LMPFA”) became the Funds’ investment manager and Western Asset Management Company (“Western Asset”) became the Funds’ subadviser. The portfolio managers who are responsible for the day-to-day management of the Funds remained the same immediately prior to and immediately after the date of these changes. LMPFA and Western Asset are wholly-owned subsidiaries of Legg Mason.
LMPFA provides administrative and certain oversight services to the Funds. LMPFA has delegated to the subadviser the day-to-day portfolio management of the Funds. The
54 Legg Mason Partners Funds Trust 2006 Annual Report
Table of Contents
Notes to Financial Statements (continued)
Funds’ investment management fee remains unchanged. For its services, LMPFA pays Western Asset 70% of the net management fee it receives from the Funds.
During the year ended December 31, 2006, the Funds had the following voluntary expense limitations:
| Class A | Class B | Class C | Class O | |||||||||
National Tax Free Bond Fund | 0.75 | % | 1.50 | % | 1.25 | % | 0.50 | % | ||||
California Tax Free Bond Fund | 0.80 | 1.55 | 1.30 | 0.55 | ||||||||
New York Tax Free Bond Fund | 0.80 | 1.55 | 1.30 | 0.55 | ||||||||
During the year ended December 31, 2006, SBAM and LMPFA waived a portion of their investment management fee in the amount of $175,942, $40,140 and $123,828 for National Tax Free Bond Fund, California Tax Free Bond Fund and New York Tax Free Bond Fund, respectively. In addition, during the year ended December 31, 2006, the Funds were reimbursed for expenses in the amount of $50,216, $67,046, and $2,206 for National Tax Free Bond Fund, California Tax Free Bond Fund and New York Tax Free Bond Fund, respectively.
Citigroup Global Markets Inc. (“CGM”) and Legg Mason Investor Services, LLC (“LMIS”), serve as co-distributors of the Funds. LMIS is a wholly-owned broker-dealer subsidiary of Legg Mason.
There was a maximum initial sales charge of 4.00% on Class A shares of the Funds. Effective November 20, 2006, the maximum initial sales charge on Class A shares of the Funds increased from 4.00% to 4.25% for shares purchased on or after that date. There was also a 4.00% contingent deferred sales charge (“CDSC”) on Class B shares of the Funds, which applies if redemption occurs one year from purchase payment. This CDSC declines thereafter by 1.00% per year until no CDSC is incurred. Effective November 20, 2006, the CDSC on Class B shares of the Funds increased to 4.50% if shares are redeemed within one year from purchase payment. This CDSC declines by 0.50% the first year after purchase and thereafter by 1.00% per year until no CDSC is incurred. Class C shares of the Funds have a 1.00% CDSC, which applies if redemption occurs within one year from purchase payment. In certain cases, Class A shares of the Funds have a 1.00% CDSC, which applies if redemption occurs within one year from purchase payment. This CDSC only applies to those purchases of Class A shares, which, when combined with current holdings of Class A shares, equal or exceed $1,000,000 in the aggregate. These purchases do not incur an initial sales charge.
For the year ended December 31, 2006, LMIS and its affiliates received initial sales charges of approximately $3,900, $500 and $2,100 from National Tax Free Bond Fund, California Tax Free Bond Fund and New York Tax Free Bond Fund, respectively on sales of the Funds’ Class A shares. In addition, for the year ended December 31, 2006, CDSCs paid to LMIS and its affiliates on Class B shares were approximately $200 for National Tax Free Bond Fund.
During a special meeting in June 2006, the Funds’ Board approved a number of initiatives to streamline and restructure the fund complex. In that connection, the Board
Legg Mason Partners Funds Trust 2006 Annual Report 55
Table of Contents
Notes to Financial Statements (continued)
voted to establish a mandatory retirement age of 75 for current Trustees and 72 for all future Trustees, and to allow current Trustees to elect to retire as of the date on which Trustees, elected in accordance with the Joint Proxy Statement (see Note 12) commence service as Trustees of the realigned and consolidated Board (the “Effective Date”).
On July 10, 2006, the Board also voted to amend its retirement plans to provide for the payment of certain benefits (in lieu of any other retirement payments under the plans) to Trustees who have not elected to retire as of the Effective Date. Under the amended plan, Trustees electing to receive benefits under the amendments must waive all rights under the plan prior to amendment. Each fund overseen by the Board (including the Fund) will pay a pro rata share (based upon asset size) of such benefits. As of December 31, 2006, the Funds’ allocable share of benefits under this amendment are $3,831.
Under the previous Retirement Plan (the “Plan”), all Trustees who were not “Interested Persons” of the Fund, within the meaning of the 1940 Act, were required to retire from the Board as of the last day of the calendar year in which the applicable Trustee attained age 75. Trustees were able to retire under the Plan before attaining the mandatory retirement age. Trustees who had served as Trustee of the Trust or any of the investment companies associated with CFM and LMPFA for at least ten years when they retired, continue to be eligible to receive the maximum retirement benefit under the previous Plan, subject to the terms of the amended Plans. The maximum retirement benefit was an amount equal to five times the amount of retainer and regular meeting fees payable to a Trustee during the entirety of the calendar year of the Trustee’s retirement (assuming no change in relevant facts for the balance of the year following the Trustee’s retirement). Amounts owed under the Plan may be paid in installments or in a lump sum (discounted to present value). Benefits under the Plan are unfunded. Two former Trustees are currently receiving payments under the Plan. In addition, four other Trustees received full payment under the Plan.
Certain officers and one Trustee of the Trust are employees of Legg Mason or its affiliates and do not receive compensation from the Trust.
| 3. | Investments |
During the year ended December 31, 2006, the aggregate cost of purchases and proceeds from sales of investments (excluding short-term investments) were as follows:
| Purchases | Sales | |||||
National Tax Free Bond Fund | $ | 8,525,464 | $ | 19,506,859 | ||
California Tax Free Bond Fund | 4,552,507 | 7,257,798 | ||||
New York Tax Free Bond Fund | 2,655,012 | 12,879,474 | ||||
56 Legg Mason Partners Funds Trust 2006 Annual Report
Table of Contents
Notes to Financial Statements (continued)
At December 31, 2006, the aggregate gross unrealized appreciation and depreciation of investments for federal income tax purposes were as follows:
| Gross Unrealized Appreciation | Gross Unrealized Depreciation | Net Unrealized Appreciation | ||||||||
National Tax Free Bond Fund | $ | 433,222 | $ | (14,951 | ) | $ | 418,271 | |||
California Tax Free Bond Fund | 137,298 | (3,314 | ) | 133,984 | ||||||
New York Tax Free Bond Fund | 3,344,796 | (97,076 | ) | 3,247,720 | ||||||
| 4. | Line of Credit |
The Funds, along with other affiliated funds, entered into an agreement with a syndicate of banks which allows the funds collectively to borrow up to $250 million. Interest on borrowing, if any, is charged to the specific fund executing the borrowing at the base rate of the bank. The line of credit requires a quarterly payment of a commitment fee based on the average daily unused portion of the line of credit. For the year ended December 31, 2006, the commitment fee allocated to the National Tax Free Bond Fund, California Tax Free Bond Fund and New York Tax Free Bond Fund were $1,855, $412 and $4,736, respectively. Since the line of credit was established, there have been no borrowings. Effective November 17, 2006, the line of credit was terminated.
| 5. | Class Specific Expenses |
The Funds have adopted a Rule 12b-1distribution plan and under that plan each Fund pays a service fee with respect to its Class A, B and C shares calculated at the annual rate of 0.25% of the average daily net assets of each respective class. Each Fund also pays a distribution fee with respect to its Class B shares calculated at the annual rate of 0.75% of the average daily net assets of Class B shares. Each Fund pays a distribution fee with respect to Class C shares calculated at the annual rate of 0.50% of the average daily net assets of Class C shares. Distribution fees are accrued daily and paid monthly.
For the year ended December 31, 2006, class specific expenses were as follows:
| National Tax Free Bond Fund | Distribution Fees | Transfer Agent Fees | Shareholder Reports Expenses | ||||||
Class A | $ | 80,410 | $ | 23,374 | $ | 70,101 | |||
Class B | 18,108 | 1,072 | 4,976 | ||||||
Class C | 7,702 | 345 | 1,790 | ||||||
Class O | — | 181 | 999 | ||||||
Total | $ | 106,220 | $ | 24,972 | $ | 77,866 | |||
| California Tax Free Bond Fund | |||||||||
Class A | $ | 19,483 | $ | 1,569 | $ | 825 | |||
Class B | 1,689 | 224 | 535 | ||||||
Class C | 478 | 57 | 453 | ||||||
Class O | — | 32 | 123 | ||||||
Total | $ | 21,650 | $ | 1,882 | $ | 1,936 | |||
Legg Mason Partners Funds Trust 2006 Annual Report 57
Table of Contents
Notes to Financial Statements (continued)
| New York Tax Free Bond Fund | Distribution Fees | Transfer Agent Fees | Shareholder Reports Expenses | ||||||
Class A | $ | 219,505 | $ | 19,812 | $ | 6,726 | |||
Class B | 2,673 | 103 | 1,504 | ||||||
Class C | 455 | 116 | 797 | ||||||
Class O | — | 65 | 750 | ||||||
Total | $ | 222,633 | $ | 20,096 | $ | 9,777 | |||
| 6. | Distributions to Shareholders by Class |
| National Tax Free Bond Fund | Year Ended December 31, 2006 | Year Ended December 31, 2005 | ||||
Net Investment Income: | ||||||
Class A | $ | 1,093,966 | $ | 1,239,386 | ||
Class B | 47,989 | 67,445 | ||||
Class C | 29,732 | 38,317 | ||||
Class O | 6,765 | 5,805 | ||||
Total | $ | 1,178,452 | $ | 1,350,953 | ||
| California Tax Free Bond Fund | ||||||
Net Investment Income: | ||||||
Class A | $ | 292,473 | $ | 397,920 | ||
Class B | 4,925 | 4,137 | ||||
Class C | 1,974 | 1,291 | ||||
Class O | 87 | 89 | ||||
Total | $ | 299,459 | $ | 403,437 | ||
| New York Tax Free Bond Fund | ||||||
Net Investment Income: | ||||||
Class A | $ | 3,142,046 | $ | 3,511,403 | ||
Class B | 7,561 | 8,763 | ||||
Class C | 1,865 | 1,746 | ||||
Class O | 9,228 | 5,586 | ||||
Total | $ | 3,160,700 | $ | 3,527,498 | ||
| 7. | Shares of Beneficial Interest |
The Declaration of Trust permits the Trustees to issue an unlimited number of full and fractional shares of beneficial interest without par value for National Tax Free Bond Fund, California Tax Free Bond Fund and New York Tax Free Bond Fund.
58 Legg Mason Partners Funds Trust 2006 Annual Report
Table of Contents
Notes to Financial Statements (continued)
Transactions in Fund shares for the periods indicated were as follows:
| Year Ended December 31, 2006 | Year Ended December 31, 2005 | |||||||||||||
| National Tax Free Bond Fund | Shares | Amount | Shares | Amount | ||||||||||
Class A | ||||||||||||||
Shares sold | 351,404 | $ | 4,124,466 | 324,787 | $ | 3,842,029 | ||||||||
Shares issued on reinvestment | 86,670 | 1,014,783 | 96,935 | 1,144,052 | ||||||||||
Shares repurchased | (1,106,317 | ) | (12,913,415 | ) | (537,914 | ) | (6,340,704 | ) | ||||||
Net Decrease | (668,243 | ) | $ | (7,774,166 | ) | (116,192 | ) | $ | (1,354,623 | ) | ||||
Class B | ||||||||||||||
Shares sold | 17,007 | $ | 198,571 | 3,757 | $ | 44,068 | ||||||||
Shares issued on reinvestment | 2,925 | 34,268 | 4,327 | 51,135 | ||||||||||
Shares repurchased | (95,596 | ) | (1,121,832 | ) | (63,291 | ) | (748,406 | ) | ||||||
Net Decrease | (75,664 | ) | $ | (888,993 | ) | (55,207 | ) | $ | (653,203 | ) | ||||
Class C | ||||||||||||||
Shares sold | 4,609 | $ | 53,805 | 559 | $ | 6,630 | ||||||||
Shares issued on reinvestment | 2,014 | 23,605 | 2,818 | 33,302 | ||||||||||
Shares repurchased | (48,520 | ) | (571,230 | ) | (36,789 | ) | (435,744 | ) | ||||||
Net Decrease | (41,897 | ) | $ | (493,820 | ) | (33,412 | ) | $ | (395,812 | ) | ||||
Class O | ||||||||||||||
Shares sold | 6,646 | $ | 78,007 | 58 | $ | 677 | ||||||||
Shares issued on reinvestment | 201 | 2,360 | 193 | 2,279 | ||||||||||
Shares repurchased | (69 | ) | (805 | ) | (14 | ) | (166 | ) | ||||||
Net Increase | 6,778 | $ | 79,562 | 237 | $ | 2,790 | ||||||||
| California Tax Free Bond Fund | ||||||||||||||
Class A | ||||||||||||||
Shares sold | 8,062 | $ | 82,766 | 9,160 | $ | 96,417 | ||||||||
Shares issued on reinvestment | 28,385 | 291,089 | 37,890 | 397,169 | ||||||||||
Shares repurchased | (296,082 | ) | (3,030,348 | ) | (205,857 | ) | (2,160,798 | ) | ||||||
Net Decrease | (259,635 | ) | $ | (2,656,493 | ) | (158,807 | ) | $ | (1,667,212 | ) | ||||
Class B | ||||||||||||||
Shares sold | 8,154 | $ | 82,267 | 967 | $ | 10,222 | ||||||||
Shares issued on reinvestment | 30 | 305 | 31 | 322 | ||||||||||
Shares repurchased | (863 | ) | (8,825 | ) | (31 | ) | (324 | ) | ||||||
Net Increase | 7,321 | $ | 73,747 | 967 | $ | 10,220 | ||||||||
Class C | ||||||||||||||
Shares sold | 6,998 | $ | 70,564 | 1,076 | $ | 11,314 | ||||||||
Shares issued on reinvestment | 40 | 413 | 47 | 493 | ||||||||||
Shares repurchased | (1,002 | ) | (10,324 | ) | (965 | ) | (10,158 | ) | ||||||
Net Increase | 6,036 | $ | 60,653 | 158 | $ | 1,649 | ||||||||
Class O | ||||||||||||||
Shares issued on reinvestment | 8 | $ | 87 | 9 | $ | 89 | ||||||||
Net Increase | 8 | $ | 87 | 9 | $ | 89 | ||||||||
Legg Mason Partners Funds Trust 2006 Annual Report 59
Table of Contents
Notes to Financial Statements (continued)
| Year Ended December 31, 2006 | Year Ended December 31, 2005 | |||||||||||||
| New York Tax Free Bond Fund | Shares | Amount | Shares | Amount | ||||||||||
Class A | ||||||||||||||
Shares sold | 94,516 | $ | 1,110,999 | 102,008 | $ | 1,209,701 | ||||||||
Shares issued on reinvestment | 262,951 | 3,071,577 | 293,368 | 3,470,489 | ||||||||||
Shares repurchased | (1,329,008 | ) | (15,528,773 | ) | (1,164,766 | ) | (13,773,628 | ) | ||||||
Net Decrease | (971,541 | ) | $ | (11,346,197 | ) | (769,390 | ) | $ | (9,093,438 | ) | ||||
Class B | ||||||||||||||
Shares sold | 10,279 | $ | 121,162 | 4,031 | $ | 48,060 | ||||||||
Shares issued on reinvestment | 266 | 3,107 | 256 | 3,027 | ||||||||||
Shares repurchased | (13,695 | ) | (160,319 | ) | (2,246 | ) | (26,187 | ) | ||||||
Net Increase (Decrease) | (3,150 | ) | $ | (36,050 | ) | 2,041 | $ | 24,900 | ||||||
Class C | ||||||||||||||
Shares sold | 179 | $ | 2,091 | 2,541 | $ | 30,575 | ||||||||
Shares issued on reinvestment | 40 | 471 | 41 | 488 | ||||||||||
Shares repurchased | (2 | ) | (30 | ) | (204 | ) | (2,394 | ) | ||||||
Net Increase | 217 | $ | 2,532 | 2,378 | $ | 28,669 | ||||||||
Class O | ||||||||||||||
Shares sold | 42 | $ | 500 | 28,032 | $ | 330,000 | ||||||||
Shares issued on reinvestment | 613 | 7,132 | 285 | 3,327 | ||||||||||
Shares repurchased | (21,757 | ) | (250,000 | ) | (1,713 | ) | (20,454 | ) | ||||||
Net Increase (Decrease) | (21,102 | ) | $ | (242,368 | ) | 26,604 | $ | 312,873 | ||||||
| 8. | Income Tax Information and Distributions to Shareholders |
Subsequent to the fiscal year end, the Fund has made the following tax-exempt distributions for:
National Tax Free Bond Fund | ||||||||||||
Record Date Payable Date | Class A | Class B | Class C | Class O | ||||||||
Daily | ||||||||||||
1/31/2007 | $ | 0.032590 | $ | 0.025121 | $ | 0.027636 | $ | 0.035126 | ||||
California Tax Free Bond Fund | ||||||||||||
Record Date Payable Date | Class A | Class B | Class C | Class O | ||||||||
Daily | ||||||||||||
1/31/2007 | $ | 0.030062 | $ | 0.023538 | $ | 0.025697 | $ | 0.032254 | ||||
60 Legg Mason Partners Funds Trust 2006 Annual Report
Table of Contents
Notes to Financial Statements (continued)
New York Tax Free Bond Fund | ||||||||||||
Record Date Payable Date | Class A | Class B | Class C | Class O | ||||||||
Daily | ||||||||||||
1/31/2007 | $ | 0.034482 | $ | 0.027022 | $ | 0.029443 | $ | 0.036903 | ||||
The tax character of distributions paid during the fiscal year ended December 31, 2006 were as follows:
| National Tax Free Bond Fund | California Tax Free Bond Fund | New York Tax Free Bond Fund | |||||||
Distributions Paid From: | |||||||||
Tax-Exempt Income | $ | 1,178,414 | $ | 297,353 | $ | 3,138,223 | |||
Ordinary Income | 38 | 2,106 | 22,477 | ||||||
Total Distributions Paid | $ | 1,178,452 | $ | 299,459 | $ | 3,160,700 | |||
The tax character of distributions paid during the fiscal year ended December 31, 2005 were as follows:
| National Tax Free Bond Fund | California Tax Free Bond Fund | New York Tax Free Bond Fund | |||||||
Distributions Paid From: | |||||||||
Tax-Exempt Income | $ | 1,350,543 | $ | 401,286 | $ | 3,502,422 | |||
Ordinary Income | 410 | 2,151 | 25,076 | ||||||
Total Distributions Paid | $ | 1,350,953 | $ | 403,437 | $ | 3,527,498 | |||
As of December 31, 2006, the components of accumulated earnings on a tax basis were as follows:
| National Tax Free Bond Fund | California Tax Free Bond Fund | New York Tax Free Bond Fund | ||||||||||
Capital loss carryforward* | $ | (4,038,853 | ) | $ | (2,322,572 | ) | $ | (3,692,269 | ) | |||
Other book/tax temporary differences | — | — | (16,935 | )(a) | ||||||||
Unrealized appreciation/(depreciation) | 418,271 | 133,984 | 3,247,720 | |||||||||
Total accumulated earnings/(losses) — net | $ | (3,620,582 | ) | $ | (2,188,588 | ) | $ | (461,484 | ) | |||
Legg Mason Partners Funds Trust 2006 Annual Report 61
Table of Contents
Notes to Financial Statements (continued)
| * | During the taxable year ended December 31, 2006, Legg Mason Partners National Tax Free Bond Fund utilized $130,639, Legg Mason Partners California Tax Free Bond Fund utilized $442,465, Legg Mason Partners New York Tax Free Bond Fund utilized $464,939 of each of their respective capital loss carryovers available from prior years. As of December 31, 2006, the Funds had the following net capital loss carryforwards remaining: |
Year of Expiration | National Tax Free Bond Fund | California Tax Free Bond Fund | New York Tax Free Bond Fund | |||||||||
12/31/2007 | $ | (607,561 | ) | $ | (1,611,076 | ) | — | |||||
12/31/2008 | (3,431,292 | ) | (711,496 | ) | $ | (3,489,390 | ) | |||||
12/31/2009 | — | — | (202,879 | ) | ||||||||
| $ | (4,038,853 | ) | $ | (2,322,572 | ) | $ | (3,692,269 | ) | ||||
These amounts will be available to offset any future taxable capital gains.
(a) | Other book/tax temporary differences are attributable primarily to the deferral of post-October capital losses for tax purposes. |
Due to the proposed reorganizations described in Note 12, the expiration dates of these loss carryforwards will move up by one year. Additionally, as a result of these reorganizations, the loss carryforwards will be subject to various tax limitations, which may result in future taxable capital gain distributions to shareholders due to the fact that some portion of the Funds’ loss carryforwards may be unable to be utilized.
| 9. | Regulatory Matters |
On May 31, 2005, the U.S. Securities and Exchange Commission (“SEC”) issued an order in connection with the settlement of an administrative proceeding against Smith Barney Fund Management LLC (“SBFM”) and CGM relating to the appointment of an affiliated transfer agent for the Smith Barney family of mutual funds (the “Affected Funds”).
The SEC order finds that SBFM and CGM willfully violated Section 206(1) of the Investment Advisers Act of 1940 (“Advisers Act”). Specifically, the order finds that SBFM and CGM knowingly or recklessly failed to disclose to the boards of the Affected Funds in 1999 when proposing a new transfer agent arrangement with an affiliated transfer agent that: First Data Investors Services Group (“First Data”), the Affected Funds’ then existing transfer agent, had offered to continue as transfer agent and do the same work for substantially less money than before; and that Citigroup Asset Management (“CAM”), the Citigroup business unit that, at the time, included the Affected Funds’ investment manager and other investment advisory companies, had entered into a side letter with First Data under which CAM agreed to recommend the appointment of First Data as sub-transfer agent to the affiliated transfer agent in exchange for, among other things, a guarantee by First Data of specified amounts of asset management and investment banking fees to CAM and CGM. The order also finds that SBFM and CGM willfully violated Section 206(2) of the Advisers Act by virtue of the omissions discussed above and other misrepresentations and omissions in the materials provided to the Affected Funds’ boards, including the failure to make clear that the affiliated transfer agent would earn a high profit for performing limited functions while First Data continued to perform almost all of the transfer agent functions, and the suggestion that the proposed arrangement was in the Affected Funds’ best interests and that no viable alternatives existed. SBFM and CGM do not admit or deny any wrongdoing or liability. The settlement does not establish wrongdoing or liability for purposes of any other proceeding.
62 Legg Mason Partners Funds Trust 2006 Annual Report
Table of Contents
Notes to Financial Statements (continued)
The SEC censured SBFM and CGM and ordered them to cease and desist from violations of Sections 206(1) and 206(2) of the Advisers Act. The order requires Citigroup to pay $208.1 million, including $109 million in disgorgement of profits, $19.1 million in interest, and a civil money penalty of $80 million. Approximately $24.4 million has already been paid to the Affected Funds, primarily through fee waivers. The remaining $183.7 million, including the penalty, has been paid to the U.S. Treasury and will be distributed pursuant to a plan submitted for approval by the SEC. At this time, there is no certainty as to how the proceeds of the settlement will be distributed, to whom such distributions will be made, the methodology by which such distributions will be allocated, and when such distributions will be made.
The order also requires that transfer agency fees received from the Affected Funds since December 1, 2004 less certain expenses, be placed in escrow and provides that a portion of such fees may be subsequently distributed in accordance with the terms of the order.
On April 3, 2006, an aggregate amount of approximately $9 million was distributed to the Affected Funds.
The order required SBFM to recommend a new transfer agent contract to the Affected Funds’ boards within 180 days of the entry of the order; if a Citigroup affiliate submitted a proposal to serve as transfer agent or sub-transfer agent, SBFM and CGM would have been required, at their expense, to engage an independent monitor to oversee a competitive bidding process. On November 21, 2005, and within the specified timeframe, the Fund’s Board selected a new transfer agent for the Fund. No Citigroup affiliate submitted a proposal to serve as transfer agent. Under the order, SBFM also must comply with an amended version of a vendor policy that Citigroup instituted in August 2004.
Although there can be no assurance, the Funds’ manager does not believe that this matter will have a material adverse effect on the Affected Funds.
These Funds are not among the Affected Funds and therefore did not implement the transfer agent arrangement described above and therefore will not receive any portion of the distributions.
On December 1, 2005, Citigroup completed the sale of substantially all of its global asset management business, including SBFM, to Legg Mason.
| 10. | Legal Matters |
Beginning in August 2005, five class action lawsuits alleging violations of federal securities laws and state law were filed against CGM and SBFM, (collectively, the “Defendants”) based on the May 31, 2005 settlement order issued against the Defendants by the SEC as described in Note 9. The complaints seek injunctive relief and compensatory and punitive damages, removal of SBFM as the investment manager for the Smith Barney family of funds, rescission of the Funds’ management and other contracts with SBFM, recovery of all fees paid to SBFM pursuant to such contracts, and an award of attorneys’ fees and litigation expenses.
On October 5, 2005, a motion to consolidate the five actions and any subsequently-filed, related action was filed. That motion contemplates that a consolidated amended complaint alleging substantially similar causes of action will be filed in the future.
Legg Mason Partners Funds Trust 2006 Annual Report 63
Table of Contents
Notes to Financial Statements (continued)
As of the date of this report, the Funds’ manager believes that resolution of the pending lawsuit will not have a material effect on the financial position or results of operations of the Funds or the ability of the Funds’ manager and its affiliates to continue to render services to the Funds under their respective contracts.
* * *
Beginning in June 2004, class action lawsuits alleging violations of the federal securities laws were filed against CGM and a number of its then affiliates, including SBFM and SBAM, which were then investment adviser or manager to certain of the Funds (the “Managers”), substantially all of the mutual funds then managed by the Managers (the “Defendant Funds”), and Board Members of the Defendant Funds (collectively, the “Defendants”). The complaints alleged, among other things, that CGM created various undisclosed incentives for its brokers to sell Smith Barney and Salomon Brothers funds. In addition, according to the complaints, the Managers caused the Defendant Funds to pay excessive brokerage commissions to CGM for steering clients towards proprietary funds. The complaints also alleged that the defendants breached their fiduciary duty to the Defendant Funds by improperly charging Rule 12b-1 fees and by drawing on fund assets to make undisclosed payments of soft dollars and excessive brokerage commissions. The complaints also alleged that the Defendant Funds failed to adequately disclose certain of the allegedly wrongful conduct. The complaints sought injunctive relief and compensatory and punitive damages, rescission of the Defendant Funds’ contracts with the Managers, recovery of all fees paid to the Managers pursuant to such contracts and an award of attorneys’ fees and litigation expenses.
On December 15, 2004, a consolidated amended complaint (the “Complaint”) was filed alleging substantially similar causes of action. On May 27, 2005, all of the Defendants filed motions to dismiss the Complaint. On July 26, 2006, the court issued a decision and order (1) finding that plaintiffs lacked standing to sue on behalf of the shareholders of the Funds in which none of the plaintiffs had invested (including the Funds) and dismissing those Funds from the case (although stating that they could be brought back into the case if standing as to them could be established), and (2) other than one stayed claim, dismissing all of the causes of action against the remaining Defendants, with prejudice, except for the cause of action under Section 36(b) of the 1940 Act, which the court granted plaintiffs leave to replead as a derivative claim.
On October 16, 2006, plaintiffs filed their Second Consolidated Amended Complaint (“Second Amended Complaint”) which alleges derivative claims on behalf of nine funds identified in the Second Amended Complaint, under Section 36(b) of the 1940 Act, against CAM, SBAM, SBFM and CGM as investment advisers to the identified funds, as well as CGM as a distributor for the identified funds (collectively, the “Second Amended Complaint Defendants”). The Funds was not identified in the Second Amended Complaint. The Second Amended Complaint alleges no claims against any of the Funds or any of their Board Members. Under Section 36(b), the Second Amended Complaint alleges similar facts and seeks similar relief against the Second Amended Complaint Defendants as the Complaint.
64 Legg Mason Partners Funds Trust 2006 Annual Report
Table of Contents
Notes to Financial Statements (continued)
Additional lawsuits arising out of these circumstances and presenting similar allegations and requests for relief may be filed in the future.
| 11. | Other Matters |
On September 16, 2005, the staff of the SEC informed SBFM and SBAM that the staff is considering recommending that the SEC institute administrative proceedings against SBFM and SBAM for alleged violations of Section 19(a) and 34(b) of the 1940 Act (and related Rule 19a-1). The notification is a result of an industry wide inspection by the SEC and is based upon alleged deficiencies in disclosures regarding dividends and distributions paid to shareholders of certain funds. Section 19(a) and related Rule 19a-1 of the 1940 Act generally require funds that are making dividend and distribution payments to provide shareholders with a written statement disclosing the source of the dividends and distributions, and, in particular, the portion of the payments made from each of net investment income, undistributed net profits and/or paid-in capital. In connection with the contemplated proceedings, the staff may seek a cease and desist order and/or monetary damages from SBFM or SBAM.
Although there can be no assurance, the Funds’ manager believes that this matter is not likely to have a material adverse effect on the Funds.
| 12. | Special Shareholder Meeting and Reorganization |
Shareholder approvals of mergers and reorganizations pursuant to which the National Tax Free Bond Fund, California Tax Free Bond Fund and New York Tax Free Bond Fund (collectively the “Funds”) assets will be acquired, and their liabilities assumed by Legg Mason Partners Managed Municipals Fund, Inc., Legg Mason Partners California Municipals Fund, Inc. and Legg Mason Partners New York Municipals Fund, respectively (collectively the “Acquiring Funds”), each in exchange for shares of the respective Acquiring Fund were obtained at December, 2006 and January, 2007 meetings. It is expected that the Funds will be terminated, and shares of the Acquiring Funds will be distributed to Fund shareholders on or about March 2, 2007. Under the reorganization, shareholders will receive shares of the respective Acquiring Fund with the same aggregate net asset value as their shares of the Funds. It is anticipated that as a result of the reorganization, Funds shareholders will recognize no gain or loss for Federal income tax purposes.
Shareholders also approved a number of initiatives designed to streamline and restructure the fund complex. These matters generally are expected to be implemented in 2007. As noted in the proxy materials, Legg Mason will pay for a portion of the costs related to these initiatives. The portion of the costs that are borne by the Funds will be recognized in the period during which the expense is incurred. Such expenses relate to obtaining shareholder votes for proposals presented in the proxy, the election of board members, retirement of board members, as well as printing, mailing, and soliciting proxies. The portions of these costs borne by the Funds and reflected in the Statement of Operations are deemed extraordinary for expense cap purposes and are not subject to the Funds’ expense limitation agreement. See also “Additional Shareholder Information” at the end of this report.
Legg Mason Partners Funds Trust 2006 Annual Report 65
Table of Contents
Report of Independent Registered Public Accounting Firm
The Board of Trustees and Shareholders
Legg Mason Partners Funds Trust:
We have audited the accompanying statements of assets and liabilities, including the schedules of investments, of Legg Mason Partners National Tax Free Bond Fund (formerly Salomon Brothers National Tax Free Bond Fund), Legg Mason Partners California Tax Free Bond Fund (formerly Salomon Brothers California Tax Free Bond Fund) and Legg Mason Partners New York Tax Free Bond Fund (formerly Salomon Brothers New York Tax Free Bond Fund), each a series of Legg Mason Partners Funds Trust (formerly Salomon Funds Trust), as of December 31, 2006, and the related statements of operations for the year then ended, the statements of changes in net assets for each of the years in the two-year period then ended, and the financial highlights for each of the years in the five-year period then ended. These financial statements and financial highlights are the responsibility of the Funds’ management. Our responsibility is to express an opinion on these financial statements and financial highlights based on our audits.
We conducted our audits in accordance with the standards of the Public Company Accounting Oversight Board (United States). Those standards require that we plan and perform the audit to obtain reasonable assurance about whether the financial statements and financial highlights are free of material misstatement. An audit includes examining, on a test basis, evidence supporting the amounts and disclosures in the financial statements. Our procedures included confirmation of securities owned as of December 31, 2006, by correspondence with the custodian and brokers or by other appropriate auditing procedures. An audit also includes assessing the accounting principles used and significant estimates made by management, as well as evaluating the overall financial statement presentation. We believe that our audits provide a reasonable basis for our opinion.
In our opinion, the financial statements and financial highlights referred to above present fairly, in all material respects, the financial position of Legg Mason Partners National Tax Free Bond Fund, Legg Mason Partners California Tax Free Bond Fund and Legg Mason Partners New York Tax Free Bond Fund as of December 31, 2006, and the results of their operations for the year then ended, the changes in their net assets for each of the years in the two-year period then ended, and the financial highlights for each of the years in the five-year period then ended, in conformity with U.S. generally accepted accounting principles.

New York, New York
February 26, 2007
66 Legg Mason Partners Funds Trust 2006 Annual Report
Table of Contents
Additional Information (unaudited)
Information about Trustees and Officers
The business and affairs of the Legg Mason Partners Funds Trust (formerly known as Salomon Funds Trust) (the “Trust”) are managed under the direction of the Board of Trustees. Information pertaining to the Trustees and officers of the Trust is set forth below. The Statement of Additional Information includes additional information about the Trustees and is available, without charge, upon request by calling Legg Mason Partners Shareholder Services at 1-800-451-2010.
| Name, Address and Birth Year | Position(s) Held with Fund | Term of Office* and Length of Time Served | Principal Occupation(s) During Past Five Years | Number of Portfolios in Fund Complex Overseen by Trustee | Other Board Memberships Held by Trustee | |||||
| Non-Interested Trustees: | ||||||||||
Elliott J. Berv 399 Park Avenue, 4th Floor New York, NY 10022 | Trustee | Since 1986 | President and Chief Executive Officer, Catalyst (consulting) (since 1984); Chief Executive Officer, Rocket City Enterprises (media) (2000 to 2005); Chief Executive Officer, Landmark City (real estate development) (from 2001 to 2004); Executive Vice President, DigiGym Systems (personal fitness systems) (from 2001 to 2004); Chief Executive Officer, Motorcity USA (Motorsport Racing) (from 2004 to 2005) | 37 | Board Member, American Identity Corp. (doing business as Morpheus Technologies) (biometric information management) (since 2001); Director, Lapoint Industries (industrial filter company) (since 2002); Director, Alzheimer’s Association (New England Chapter) (since 1998) | |||||
Donald M. Carlton** 399 Park Avenue, New York, NY 10022 | Trustee | Since 2001 | Consultant, URS Corporation (engineering) (since 1999); Member of the Management Committee, Signature Science (research and development) (since 2000) | 37 | Director, Temple-Inland (forest products) (since 2003); Director, American Electric Power Co. (electric utility) (since 1999); Director, National Instruments Corp. (technology) (since 1994); Former 14, Director, Valcro Energy (petroleum refining) (from 1999 to 2003) | |||||
Legg Mason Partners Funds Trust 67
Table of Contents
Additional Information (unaudited) (continued)
| Name, Address and Birth Year | Position(s) Held with Fund | Term of Office* and Length of Time Served | Principal Occupation(s) During Past Five Years | Number of Portfolios in Fund Complex Overseen by Trustee | Other Board Memberships Held by Trustee | |||||
A. Benton Cocanougher 399 Park Avenue, 4th Floor | Trustee | Since 2001 | Dean Emeritus and Professor, Texas A&M University (since 2001); Formerly, Interim Chancellor, Texas A&M University System (from 2003 to 2004); Formerly, Special Adviser to President, Texas A&M University (from 2002 to 2003); Formerly, Dean and Professor of Marketing, College and Graduate School of Business, Texas A&M University (from 1987 to 2001) | 37 | None | |||||
Mark T. Finn 399 Park Avenue, 4th Floor | Trustee | Since 1990 | Adjunct Professor, College of William & Mary (since 2002); Principal/Member, Balvan Partners (investment management) (since 2002); Chairman, Chief Executive Officer and Owner, Vantage Consulting Group, Inc. (investment management) (since 1998); Formerly, Vice President and Chief Operating Officer, Lindner Asset Management Company (mutual fund company) (from 1999 to 2001); Formerly, General Partner and Shareholder, Greenwich Ventures, L.L.C. (investment partnership) (from 1996 to 2001) | 37 | None | |||||
68 Legg Mason Partners Funds Trust
Table of Contents
Additional Information (unaudited) (continued)
| Name, Address and Birth Year | Position(s) Held with Fund | Term of Office* and Length of Time Served | Principal Occupation(s) During Past Five Years | Number of Portfolios in Fund Complex Overseen by Trustee | Other Board Memberships Held by Trustee | |||||
Stephen Randolph Gross 399 Park Avenue, 4th Floor | Trustee | Since 2001 | Chairman, HLB Gross Collins, P.C. (accounting and consulting firm) (since 1979); Treasurer Coventry Limited, Inc. (Senior Living Facilities) (since 1985); Formerly, Managing Director, Fountainhead Ventures, L.L.C. (technology accelerator) (from 1998 to 2003); Formerly, Treasurer, Hank Aaron Enterprises (fast food franchise) (from 1985 to 2001); Formerly Partner, Capital Investment Advisory Partners (leverage buyout consulting) (from 2000 to 2002); Formerly, Secretary, Carint N.A. (manufacturing) (from 1998 to 2002) | 37 | Director, Andersen Calhoun (assisted living) (since 1987); Formerly, Director, United Telesis, Inc. (telecommunications) (from 1997 to 2002); Formerly, Director, ebank Financial Services, Inc. (from 1997 to 2004) | |||||
Diana R. Harrington 399 Park Avenue, 4th Floor | Trustee | Since 1992 | Professor, Babson College (since 1992) | 37 | None | |||||
Susan B. Kerley 399 Park Avenue, 4th Floor | Trustee | Since 1992 | Investment Consulting Partner, Strategic Management Advisors, LLC (investment consulting) (since 1990) | 37 | Chairperson and Independent Board Member of Eclipse Fund, Inc. and Eclipse Funds (which trade as Mainstay Funds) (currently supervises 16 investment companies in the fund complex) (since 1991) | |||||
Legg Mason Partners Funds Trust 69
Table of Contents
Additional Information (unaudited) (continued)
| Name, Address and Birth Year | Position(s) Held with Fund | Term of Office* and Length of Time Served | Principal Occupation(s) During Past Five Years | Number of Portfolios in Fund Complex Overseen by Trustee | Other Board Memberships Held by Trustee | |||||
Alan G. Merten 4th Floor New York, NY 10022 | Trustee | Since 2001 | President, George Mason University (since 1996) | 37 | Trustee, First Potomac Roalty Trust (since 2005); Director, Xybernaut Corporation (information technology) (from 2004 to 2006); Director, Digital Net Holdings, Inc. (from 2003 to 2004); Director, Comshare, Inc. (information technology) (1985 to 2003); Director, BTG, Inc. (information systems) (from 1997 to 2001) | |||||
R. Richardson Pettit 4th Floor New York, NY 10022 | Trustee | Since 2001 | Formerly, Duncan Professor of Finance, University of Houston (1977 to 2006) | 37 | None | |||||
70 Legg Mason Partners Funds Trust
Table of Contents
Additional Information (unaudited) (continued)
| Name, Address and Birth Year | Position(s) Held with Fund | Term of Office* and Length of Time Served | Principal Occupation(s) During Past Five Years | Number of Portfolios in Fund Complex Overseen by Trustee | Other Board Memberships Held by Trustee | |||||
| Interested Trustee: | ||||||||||
| R. Jay Gerken*** Legg Mason 399 Park Avenue, 4th Floor New York, NY 10022 Birth Year: 1951 | Chairman, President, and Chief Executive Officer | Since 2002 | Managing Director of Legg Mason; President and Chief Executive Officer of Legg Mason Partners Fund Advisors, LLC (“LMPFA”) (Since 2006); President and Chief Executive Officer of Smith Barney Fund Management LLC (“SBFM”) and CitiFund Management Inc, (“CFM”); President and Chief Executive Officer of certain mutual funds associated with Legg Mason; Formerly, Chairman of SBFM and CFM (from 2002 to 2006); Formerly, Chairman, President and Chief Executive Officer of Travelers Investment Advisers, Inc. (from 2002 to 2005) | 162 | None | |||||
| Officers: | ||||||||||
Frances M. Guggino 10th Floor | Chief Financial Officer and Treasurer | Since 2004 | Director of Legg Mason, Chief Financial Officer and Treasurer of certain mutual funds associated with Legg Mason, Formerly, Controller of certain mutual funds associated with Legg Mason (from 1999 to 2004) | N/A | N/A | |||||
Legg Mason Partners Funds Trust 71
Table of Contents
Additional Information (unaudited) (continued)
| Name, Address and Birth Year | Position(s) Held with Fund | Term of Office* and Length of Time Served | Principal Occupation(s) During Past Five Years | Number of Portfolios in Fund Complex Overseen by Trustee | Other Board Memberships Held by Trustee | |||||
| Ted P. Becker Legg Mason 399 Park Avenue, 4th Floor New York, NY 10022 Birth Year: 1951 | Chief Compliance Officer | Since 2006 | Director of Global Compliance at Legg Mason (since 2006); Chief Compliance Officer of LMPFA (since 2006); Managing Director of Compliance at Legg Mason (since 2005); Chief Compliance Officer with certain mutual funds associated with Legg Mason (since 2006); Managing Director of Compliance at Legg Mason or its predecessor (from 2002 to 2005); Prior to 2002, Managing Director—Internal Audit & Risk Review at Citigroup, Inc. | N/A | N/A | |||||
| John Chiota Legg Mason 300 First Stamford Place 4th Floor Stamford, CT 06902 Birth Year: 1968 | Chief Anti-Money Laundering Compliance Officer | Since 2006 | Vice President of Legg Mason or its predecessor (since 2004); Chief Anti-Money Laundering Compliance Officer with certain mutual funds associated with Legg Mason (since 2006); Prior to August 2004, Chief AML Compliance Officer with TD Waterhouse | N/A | N/A | |||||
| Robert I. Frenkel Legg Mason 300 First Stamford Place 4th Floor Stamford, CT 06902 Birth Year: 1954 | Secretary and Chief Legal Officer | Since 2000 | Managing Director and General Counsel of Global Mutual Funds for Legg Mason and its predecessor (since 1994); Secretary and Chief Legal Officer of mutual funds associated with Legg Mason (since 2003); formerly, Secretary of CFM (from 2001 to 2004) | N/A | N/A | |||||
| * | Each Trustee and officer serves until his or her successor has been duly elected and qualified. |
| ** | Mr. Carlton retired as a Trustee of the Trust effective December 31, 2006. |
| *** | Mr. Gerken is an “interested person” of the Fund as defined in the Investment Company Act of 1940, as amended, because Mr. Gerken is an officer of LMPFA and certain of its affiliates. |
72 Legg Mason Partners Funds Trust
Table of Contents
Additional Shareholder Information (unaudited)
Results of Special Meetings of Shareholders
On December 11, 2006, a Special Meeting of Shareholders was held to vote on various proposals recently approved by the Fund's Board Members. The following tables provide the number of votes cast for, against or withheld, as well as the number of abstentions and broker non-votes as to the following proposals: (1) elect Board Members, (2) Regroup and Reorganize Fund and (3) Revise Fundamental Investment Policies.
Proposal 1: Elect Board Members
| Nominees | Votes For | Authority Withheld | Abstentions | Broker Non-Votes | ||||
Elliot J. Berv | 4,566,232.262 | 357,391.304 | 0.000 | 0.000 | ||||
A. Benton Cocanougher | 4,570,952.262 | 352,671.304 | 0.000 | 0.000 | ||||
Jane F. Dasher | 4,570,952.262 | 352,671.304 | 0.000 | 0.000 | ||||
Mark T. Finn | 4,570,212.262 | 353,411.304 | 0.000 | 0.000 | ||||
Rainer Greeven | 4,570,282.262 | 353,341.304 | 0.000 | 0.000 | ||||
Stephen Randolph Gross | 4,566,232.262 | 357,391.304 | 0.000 | 0.000 | ||||
Richard E. Hanson Jr. | 4,570,952.262 | 352,671.304 | 0.000 | 0.000 | ||||
Diana R. Harrington | 4,566,156.262 | 357,467.304 | 0.000 | 0.000 | ||||
Susan M. Heilbron | 4,566,156.262 | 357,467.304 | 0.000 | 0.000 | ||||
Susan B. Kerley | 4,562,176.262 | 361,447.304 | 0.000 | 0.000 | ||||
Alan G. Merten | 4,566,232.262 | 357,391.304 | 0.000 | 0.000 | ||||
R. Richardson Pettit | 4,570,687.262 | 352,936.304 | 0.000 | 0.000 | ||||
R. Jay Gerken, CFA | 4,565,296.262 | 358,327.304 | 0.000 | 0.000 | ||||
Proposal 2: Regroup and Reorganize Fund
Fund | Votes For | Votes Against | Abstentions | Broker Non-Votes | ||||
National Tax Free Bond Fund | 1,044,321.507 | 49,058.230 | 62,221.000 | 308,588.000 | ||||
Proposal 3: Revise Fundamental Investment Policies
| Items Voted On | Votes For | Votes Against | Abstentions | Broker Non-Votes | ||||
National Tax Free Bond Fund: | ||||||||
Borrowing Money | 1,027,758.507 | 55,569.230 | 72,273.000 | 308,588.000 | ||||
Underwriting | 1,027,687.507 | 55,640.230 | 72,273.000 | 308,588.000 | ||||
Lending | 1,026,069.507 | 57,258.230 | 72,273.000 | 308,588.000 | ||||
Issuing Senior Securities | 1,023,108.092 | 60,015.340 | 72,477.305 | 308,588.000 | ||||
Real Estate | 1,025,024.397 | 58,303.340 | 72,273.000 | 308,588.000 | ||||
Commodities | 1,024,795.092 | 58,303.340 | 72,502.305 | 308,588.000 | ||||
Concentration | 1,025,433.507 | 57,894.230 | 72,273.000 | 308,588.000 | ||||
Legg Mason Partners Funds Trust 73
Table of Contents
Additional Shareholder Information (unaudited) (continued)
On December 21, 2006, a Special Meeting of Shareholder was held to approve an Agreement and Plan of Reorganization, providing for (i) the acquisition of all of the assets and the assumption of all of the liabilities of the California Tax Free Bond Fund ( the “Acquired Fund”), in exchange for shares of the corresponding Legg Mason Partners California Municipals Fund, Inc. ( the “Acquiring Fund”) to be distributed to the shareholders of the Acquired Fund and (ii) the subsequent termination of the Acquired Fund. The following table provides the number of votes cast for, against, as well as the number of abstentions for the matter voted on at the Special Meeting of Shareholder:
Approval of Agreement and Plan of Reorganization
| Fund | Votes For | Votes Against | Abstentions | |||
California Tax Free Bond Fund | 340,218.135 | 9,542.000 | 26,154.000 | |||
On January 12, 2007, a Special Meeting of Shareholders was held to vote on various proposals recently approved by the Board of Trustees. The following tables provide the number of votes cast for, against or withheld, as well as the number of abstentions and broker non-votes as to the following proposals: (1) Regroup and Reorganize Fund and (2) Revise Fundamental Investment Policies.
Proposal 1: Regroup and Reorganize Fund
| Fund | Votes For | Votes Against | Abstentions | Broker Non-Votes | ||||
New York Tax Free Bond Fund | 3,287,792.851 | 184,685.413 | 158,650.000 | 79,843.000 | ||||
Proposal 2: Revise Fundamental Investment Policies
| Items Voted On | Votes For | Votes Against | Abstentions | Broker Non-Votes | ||||
New York Tax Free Bond Fund: | ||||||||
Borrowing Money | 3,215,180.851 | 235,420.413 | 180,527.000 | 79,843.000 | ||||
Underwriting | 3,215,067.851 | 233,760.413 | 182,300.000 | 79,843.000 | ||||
Lending | 3,231,430.851 | 221,320.413 | 178,377.000 | 79,843.000 | ||||
Issuing Senior Securities | 3,214,003.851 | 229,101.413 | 188,023.000 | 79,843.000 | ||||
Real Estate | 3,227,567.851 | 226,064.413 | 177,496.000 | 79,843.000 | ||||
Commodities | 3,227,754.851 | 222,756.413 | 180,617.000 | 79,843.000 | ||||
Concentration | 3,224,919.851 | 215,258.413 | 190,950.000 | 79,843.000 | ||||
74 Legg Mason Partners Funds Trust
Table of Contents
Additional Shareholder Information (unaudited) (continued)
On January 19, 2007, a Special Meeting of Shareholder was held to approve an Agreement and Plan of Reorganization, providing for (i) the acquisition of all of the assets and the assumption of all of the liabilities of the National Tax Free Bond Fund and the New York Tax Free Bond Fund (collectively the “Acquired Funds”), in exchange for shares of the corresponding Legg Mason Partners Managed Municipals Fund, Inc. and Legg Mason Partners New York Municipals Fund, respectively (collectively the “Acquiring Funds”) to be distributed to the shareholders of the Acquired Funds and (ii) the subsequent termination of the Acquired Funds. The following tables provide the number of votes cast for, against, as well as the number of abstentions for the matter voted on at the Special Meeting of Shareholder:
Approval of Agreement and Plan of Reorganization
| Fund | Votes For | Votes Against | Abstentions | |||
National Tax Free Bond Fund | 1,263,856.986 | 42,776.300 | 40,275.364 | |||
| Fund | Votes For | Votes Against | Abstentions | |||
New York Tax Free Bond Fund | 3,347,024.093 | 266,826.413 | 144,995.136 | |||
On January 29, 2007, a Special Meeting of Shareholders was held to vote on various proposals recently approved by the Board of Trustees. The following tables provide the number of votes cast for, against or withheld, as well as the number of abstentions and broker non-votes as to the following proposals: (1) Regroup and Reorganize Fund and (2) Revise Fundamental Investment Policies.
Proposal 1: Regroup and Reorganize Fund
| Fund | Votes For | Votes Against | Abstentions | Broker Non-Votes | ||||
California Tax Free Bond Fund | 261,756.090 | 4,093.074 | 12,586.000 | 2,240.000 | ||||
Legg Mason Partners Funds Trust 75
Table of Contents
Additional Shareholder Information (unaudited) (continued)
Proposal 2: Revise Fundamental Investment Policies
| Items Voted On | Votes For | Votes Against | Abstentions | Broker Non-Votes | ||||
California Tax Free Bond Fund: | ||||||||
Borrowing Money | 252,931.090 | 13,367.074 | 12,137.000 | 2,240.000 | ||||
Underwriting | 250,208.090 | 10,796.074 | 17,431.000 | 2,240.000 | ||||
Lending | 255,053.090 | 16,090.074 | 7,292.000 | 2,240.000 | ||||
Issuing Senior Securities | 252,205.090 | 12,158.074 | 14,072.000 | 2,240.000 | ||||
Real Estate | 256,863.090 | 9,435.074 | 12,137.000 | 2,240.000 | ||||
Commodities | 250,996.090 | 13,367.074 | 14,072.000 | 2,240.000 | ||||
Concentration | 246,046.090 | 5,455.074 | 26,934.000 | 2,240.000 | ||||
76 Legg Mason Partners Funds Trust
Table of Contents
Important Tax Information (unaudited)
The following information is provided with respect to the distributions paid during the taxable year ended December 31, 2006 for:
National Tax Free Bond Fund
All of the net investment income distributions paid monthly by the Fund from January 2006 through December 2006 qualify as tax-exempt interest dividends for Federal income tax purposes.
California Tax Free Bond Fund
All of the net investment income distributions paid monthly by the Fund from January 2006 through November 2006 qualify as tax-exempt interest dividends for Federal income tax purposes. Additionally, 89.42% of the net investment income distribution paid in December 2006 qualifies as a tax-exempt interest dividend for Federal income tax purposes.
New York Tax Free Bond Fund
All of the net investment income distributions paid monthly by the Fund from January 2006 through November 2006 qualify as tax-exempt interest dividends for Federal income tax purposes. Additionally, 90.77% of the net investment income distribution paid in December 2006 qualifies as a tax-exempt interest dividend for Federal income tax purposes.
Legg Mason Partners Funds Trust 77
Table of Contents
Legg Mason Partners Funds Trust
TRUSTEES Elliott J. Berv Donald M. Carlton* A. Benton Cocanougher Mark T. Finn R. Jay Gerken, CFA Chairman Stephen Randolph Gross Diana R. Harrington Susan B. Kerley Alan G. Merten R. Richardson Pettit | INVESTMENT MANAGER Legg Mason Partners Fund Advisor, LLC
SUBADVISERS Western Asset Management Company
DISTRIBUTORS Citigroup Global Markets Inc. Legg Mason Investor Services, LLC
CUSTODIAN State Street Bank and Trust Company
TRANSFER AGENT PFPC Inc. 4400 Computer Drive Westborough, Massachusetts 01581
INDEPENDENT REGISTERED PUBLIC ACCOUNTING FIRM KPMG LLP 345 Park Avenue New York, New York 10154
| |
* Mr. Carlton retired as Trustee of the Trust effective December 31, 2006. | ||
Table of Contents
This report is submitted for the general information of the shareholders of Legg Mason Partners Funds Trust, but it may also be used as sales literature when preceded or accompanied by the current prospectus.
This report must be preceded or accompanied by a free prospectus. Investors should consider the Fund’s investment objectives, risks, charges and expenses carefully before investing. The prospectus contains this and other important information about the Funds. Please read the prospectus carefully before investing.
www.leggmason.com/InvestorServices
©2007 Legg Mason Investor Services, LLC.
Member NASD, SIPC
FDO4095 2/07 | SR07-278 |
Legg Mason Partners Funds Trust
Legg Mason Partners National Tax Free Bond Fund
Legg Mason Partners California Tax Free Bond Fund
Legg Mason Partners New York Tax Free Bond Fund
The Funds are separate investment Funds of the Legg Mason Partners Funds Trust, a Massachusetts business trust.
LEGG MASON PARTNERS FUNDS TRUST
Legg Mason Partners Fund
125 Broad Street
10th Floor, MF-2
New York, New York 10004
Each Fund files its complete schedule of portfolio holdings with the Securities and Exchange Commission (“Commission”) for the first and third quarters of each fiscal year on Form N-Q. The Funds’ Forms N-Q are available on the Commission’s website at www.sec.gov. The Funds’ Forms N-Q may be reviewed and copied at the Commission’s Public Reference Room in Washington, D.C., and information on the operation of the Public Reference Room may be obtained by calling 1-800-SEC-0330. To obtain information on Form N-Q from the Funds, shareholders can call Legg Mason Partners Shareholder Services at 1-800-451-2010.
Information on how the Funds voted proxies relating to portfolio securities during the prior 12-month period ended June 30th of each year and a description of the policies and procedures that the Funds use to determine how to vote proxies relating to portfolio transactions is available (1) without charge, upon request, by calling 1-800-451-2010, (2) on the Funds’ website at www.leggmason.com/InvestorServices and (3) on the SEC’s website at www.sec.gov.
Table of Contents
| ITEM 2. | CODE OF ETHICS. |
The registrant has adopted a code of ethics that applies to the registrant’s principal executive officer, principal financial officer, principal accounting officer or controller.
| ITEM 3. | AUDIT COMMITTEE FINANCIAL EXPERT. |
The Board of Trustees of the registrant has determined that Stephen Randolph Gross, the Chairman of the Board’s Audit Committee, possesses the technical attributes identified in Instruction 2(b) of Item 3 to Form N-CSR to qualify as an “audit committee financial expert,” and has designated Mr. Gross as the Audit Committee’s financial expert. Mr. Gross is an “independent” Trustee pursuant to paragraph (a)(2) of Item 3 to Form N-CSR.
| ITEM 4. | Principal Accountant Fees and Services |
a) Audit Fees. The aggregate fees billed in the last two fiscal years ending December 31, 2005 and December 31, 2006 (the “Reporting Periods”) for professional services rendered by the Registrant’s principal accountant (the “Auditor”) for the audit of the Registrant’s annual financial statements, or services that are normally provided by the Auditor in connection with the statutory and regulatory filings or engagements for the Reporting Periods, were $78,000 in 2005 and $81,500 in 2006.
b) Audit-Related Fees. The aggregate fees billed in the Reporting Periods for assurance and related services by the Auditor that are reasonably related to the performance of the audit of the Registrant’s financial statements and are not reported under paragraph (a) of this Item 4 were $255 in 2005 and $0 in 2006. These services consisted of procedures performed in connection with the Review of KPMG Workpaper Review.
In addition, there were no Audit-Related Fees billed in the Reporting Period for assurance and related services by the Auditor to the Registrant’s investment adviser (not including any sub-adviser whose role is primarily portfolio management and is subcontracted with or overseen by another investment adviser), and any entity controlling, controlled by or under common control with the investment adviser that provides ongoing services to the Legg Mason Partners Funds Trust (“service affiliates”), that were reasonably related to the performance of the annual audit of the service affiliates. Accordingly, there were no such fees that required pre-approval by the Audit Committee for the Reporting Periods (prior to May 6, 2003 services provided by the Auditor were not required to be pre-approved).
(c) Tax Fees. The aggregate fees billed in the Reporting Periods for professional services rendered by the Auditor for tax compliance, tax advice and tax planning (“Tax Services”) were $8,100 in 2005 and $8,900 in 2006. These services consisted of (i) review or preparation of U.S. federal, state, local and excise tax returns; (ii) U.S. federal, state and local tax planning, advice and assistance regarding statutory, regulatory or administrative
Table of Contents
developments, and (iii) tax advice regarding tax qualification matters and/or treatment of various financial instruments held or proposed to be acquired or held.
There were no fees billed for tax services by the Auditors to service affiliates during the Reporting Periods that required pre-approval by the Audit Committee.
d) All Other Fees. There were no other fees billed in the Reporting Periods for products and services provided by the Auditor, other than the services reported in paragraphs (a) through (c) of this Item 4 on behalf of the Legg Mason Partners Funds Trust.
All Other Fees. There were no other non-audit services rendered by the Auditor to Smith Barney Fund Management LLC (“SBFM”), and any entity controlling, controlled by or under common control with SBFM that provided ongoing services to Legg Mason Partners Funds Trust requiring pre-approval by the Audit Committee in the Reporting Period.
(e) Audit Committee’s pre–approval policies and procedures described in paragraph (c) (7) of Rule 2-01 of Regulation S-X.
(1) The Charter for the Audit Committee (the “Committee”) of the Board of each registered investment company (the “Fund”) advised by Smith Barney Fund Management LLC or Salomon Brothers Asset Management Inc. or one of their affiliates (each, an “Adviser”) requires that the Committee shall approve (a) all audit and permissible non-audit services to be provided to the Fund and (b) all permissible non-audit services to be provided by the Fund’s independent auditors to the Adviser and any Covered Service Providers if the engagement relates directly to the operations and financial reporting of the Fund. The Committee may implement policies and procedures by which such services are approved other than by the full Committee.
The Committee shall not approve non-audit services that the Committee believes may impair the independence of the auditors. As of the date of the approval of this Audit Committee Charter, permissible non-audit services include any professional services (including tax services), that are not prohibited services as described below, provided to the Fund by the independent auditors, other than those provided to the Fund in connection with an audit or a review of the financial statements of the Fund. Permissible non-audit services may not include: (i) bookkeeping or other services related to the accounting records or financial statements of the Fund; (ii) financial information systems design and implementation;
Table of Contents
(iii) appraisal or valuation services, fairness opinions or contribution-in-kind reports; (iv) actuarial services; (v) internal audit outsourcing services; (vi) management functions or human resources; (vii) broker or dealer, investment adviser or investment banking services; (viii) legal services and expert services unrelated to the audit; and (ix) any other service the Public Company Accounting Oversight Board determines, by regulation, is impermissible.
Pre-approval by the Committee of any permissible non-audit services is not required so long as: (i) the aggregate amount of all such permissible non-audit services provided to the Fund, the Adviser and any service providers controlling, controlled by or under common control with the Adviser that provide ongoing services to the Fund (“Covered Service Providers”) constitutes not more than 5% of the total amount of revenues paid to the independent auditors during the fiscal year in which the permissible non-audit services are provided to (a) the Fund, (b) the Adviser and (c) any entity controlling, controlled by or under common control with the Adviser that provides ongoing services to the Fund during the fiscal year in which the services are provided that would have to be approved by the Committee; (ii) the permissible non-audit services were not recognized by the Fund at the time of the engagement to be non-audit services; and (iii) such services are promptly brought to the attention of the Committee and approved by the Committee (or its delegate(s)) prior to the completion of the audit.
Table of Contents
(2) For the Legg Mason Partners Funds Trust, the percentage of fees that were approved by the audit committee, with respect to: Audit-Related Fees were 100% and 0% for 2005 and 2006; Tax Fees were 100% and 0% for 2005 and 2006; and Other Fees were 100% and 0% for 2005 and 2006.
(f) N/A
(g) Non-audit fees billed by the Auditor for services rendered to Legg Mason Partners Funds Trust and CAM and any entity controlling, controlled by, or under common control with CAM that provides ongoing services to Legg Mason Partners Funds Trust during the reporting period were $0 in 2006 for fees related to the transfer agent matter as fully described in the notes the financial statements titled “additional information” and $75,000 for 2005.
(h) Yes. Legg Mason Partners Funds Trust’s Audit Committee has considered whether the provision of non-audit services that were rendered to Service Affiliates which were not pre-approved (not requiring pre-approval) is compatible with maintaining the Accountant’s independence. All services provided by the Auditor to the Legg Mason Partners Funds Trust or to Service Affiliates, which were required to be pre-approved, were pre-approved as required.
| ITEM 5. | AUDIT COMMITTEE OF LISTED REGISTRANTS. |
Not applicable.
| ITEM 6. | SCHEDULE OF INVESTMENTS. |
Included herein under Item 1.
| ITEM 7. | DISCLOSURE OF PROXY VOTING POLICIES AND PROCEDURES FOR CLOSED-END MANAGEMENT INVESTMENT COMPANIES. |
Not applicable.
| ITEM 8. | PORTFOLIO MANAGERS OF CLOSED-END MANAGEMENT INVESTMENT COMPANIES. |
Not applicable.
| ITEM 9. | PURCHASES OF EQUITY SECURITIES BY CLOSED-END MANAGEMENT INVESTMENT COMPANY AND AFFILIATED PURCHASERS. |
Not applicable.
| ITEM 10. | SUBMISSION OF MATTERS TO A VOTE OF SECURITY HOLDERS. |
Not applicable.
Table of Contents
| ITEM 11. | CONTROLS AND PROCEDURES. |
| (a) | The registrant’s principal executive officer and principal financial officer have concluded that the registrant’s disclosure controls and procedures (as defined in Rule 30a- 3(c) under the Investment Company Act of 1940, as amended (the “1940 Act”)) are effective as of a date within 90 days of the filing date of this report that includes the disclosure required by this paragraph, based on their evaluation of the disclosure controls and procedures required by Rule 30a-3(b) under the 1940 Act and 15d-15(b) under the Securities Exchange Act of 1934. |
| (b) | There were no changes in the registrant’s internal control over financial reporting (as defined in Rule 30a-3(d) under the 1940 Act) that occurred during the registrant’s last fiscal half-year (the registrant’s second fiscal half-year in the case of an annual report) that have materially affected, or are likely to materially affect the registrant’s internal control over financial reporting. |
| ITEM 12. | EXHIBITS. |
| (a)(1) | Code of Ethics attached hereto. |
Exhibit 99.CODE ETH
| (a)(2) | Certifications pursuant to section 302 of the Sarbanes-Oxley Act of 2002 attached hereto. |
Exhibit 99.CERT
| (b) | Certifications pursuant to Section 906 of the Sarbanes-Oxley Act of 2002 attached hereto. |
Exhibit 99.906CERT
Table of Contents
SIGNATURES
Pursuant to the requirements of the Securities Exchange Act of 1934 and the Investment Company Act of 1940, the registrant has duly caused this Report to be signed on its behalf by the undersigned, there unto duly authorized.
| Legg Mason Partners Funds Trust | ||
| By: | /s/ R. Jay Gerken | |
| (R. Jay Gerken) | ||
| Chief Executive Officer of | ||
| Legg Mason Partners Funds Trust | ||
| Date: March 9, 2007 | ||
Pursuant to the requirements of the Securities Exchange Act of 1934 and the Investment Company Act of 1940, this report has been signed below by the following persons on behalf of the registrant and in the capacities and on the dates indicated.
| By: | /s/ R. Jay Gerken | |
| (R. Jay Gerken) | ||
| Chief Executive Officer of | ||
| Legg Mason Partners Funds Trust | ||
| Date: March 9, 2007 | ||
| By: | /s/ Frances M. Guggino | |
| (Frances M. Guggino) | ||
| Chief Financial Officer of | ||
| Legg Mason Partners Funds Trust | ||
| Date: March 9, 2007 | ||