| | | |
| |
| UNITED STATES |
| SECURITIES AND EXCHANGE COMMISSION |
| Washington, D.C. 20549 |
|
| FORM N-CSR |
|
| CERTIFIED SHAREHOLDER REPORT OF REGISTERED |
| MANAGEMENT INVESTMENT COMPANIES |
|
| Investment Company Act file number: (811- 04524) |
|
| Exact name of registrant as specified in charter: Putnam Global Income Trust |
|
| Address of principal executive offices: One Post Office Square, Boston, Massachusetts 02109 |
|
| Name and address of agent for service: | Beth S. Mazor, Vice President |
| | One Post Office Square |
| | Boston, Massachusetts 02109 |
| |
| Copy to: | John W. Gerstmayr, Esq. |
| | Ropes & Gray LLP |
| | One International Place |
| | Boston, Massachusetts 02110 |
| |
| Registrant’s telephone number, including area code: | | (617) 292-1000 | |
| | | |
| Date of fiscal year end: October 31, 2009 | |
| |
| Date of reporting period: November 1, 2008 — April 30, 2009 |
Item 1. Report to Stockholders:
The following is a copy of the report transmitted to stockholders pursuant to Rule 30e-1 under the Investment Company Act of 1940:

Since 1937, when George Putnam created a prudent mix of stocks and bonds in a single, professionally managed portfolio, we have championed the wisdom of the balanced approach. Today, we offer a world of equity, fixed-income, multi-asset, and absolute-return portfolios so investors can pursue a range of financial goals. Our seasoned portfolio managers seek superior results over time, backed by original, fundamental research on a global scale. We believe in service excellence, in the value of experienced financial advice, and in putting clients first in everything we do.

In 1830, Massachusetts Supreme Judicial Court Justice Samuel Putnam established The Prudent Man Rule, a legal foundation for responsible money management.

THE PRUDENT MAN RULE
All that can be required of a trustee to invest is that he shall conduct himself faithfully and exercise a sound discretion. He is to observe how men of prudence, discretion, and intelligence manage their own affairs, not in regard to speculation, but in regard to the permanent disposition of their funds, considering the probable income, as well as the probable safety of the capital to be invested.

Putnam
Global Income
Trust
Semiannual Report
4 | 30 | 09
| |
| Message from the Trustees | 2 |
|
| About the fund | 4 |
|
| Performance snapshot | 6 |
|
| Interview with your fund’s Portfolio Manager | 7 |
|
| Performance in depth | 12 |
|
| Expenses | 14 |
|
| Portfolio turnover | 16 |
|
| Your fund’s management | 17 |
|
| Terms and definitions | 19 |
|
| Trustee approval of management contract | 20 |
|
| Other information for shareholders | 25 |
|
| Financial statements | 26 |
|
Message from the Trustees
Dear Fellow Shareholder:
Since the fourth quarter of 2007, investors have endured one of the most difficult downturns in decades, but there now seem to be early signs that the storm clouds may be starting to clear in the stock market. Although this downturn is far from over and we remain cautious, we are encouraged by a number of developments.
Before its climb was interrupted by profit taking in early May, the stock market experienced a two-month run-up from its March lows. Although many analysts agree that the stock market is in the process of bottoming out, they are careful to note that the market is fairly valued today and that it will require positive corporate earnings growth to continue its climb.
The outlook for the fixed-income market is less clear. Hundreds of billions of dollars in economic stimulus spending have increased the U.S. deficit, which may weaken demand for Treasuries. Corporate and municipal debt may fare slightly better.
Under President and CEO Robert L. Reynolds, Putnam Investments has instituted several changes in order to position Putnam mutual funds for a market recovery. In April, Walter C. Donovan, a 25-year investment industry veteran, joined Putnam as Chief Investment Officer. Mr. Donovan will lead a reinvigorated investment organization strengthened by the arrival during the past few months of several well-regarded senior portfolio managers, research analysts, and equity traders.
We also are pleased to announce that Ravi Akhoury has been elected to the Board of Trustees of the Putnam Funds and W. Thomas Stephens has rejoined the Board. From 1992 to 2007, Mr. Akhoury was Chairman and CEO of MacKay Shields, a multi-product investment management firm with over $40 billion in assets under management. He serves as advisor to New York Life Insurance Company, and previously was a member of its Executive Management Committee.
2
Mr. Stephens retired in December 2008 as Chairman and Chief Executive Officer of Boise Cascade, L.L.C., a paper, forest products, and timberland assets company. He is a Director of TransCanada Pipelines, Ltd., an energy infrastructure company. From 1997 to 2008, Mr. Stephens served on the Board of Trustees of the Putnam Funds. Until 2004, he also was a Director of Xcel Energy Incorporated, Qwest Communications, and Norske Canada, Inc.
We would like to take this opportunity to welcome new shareholders to the fund and to thank all of our investors for your continued confidence in Putnam.

About the fund
Investing for income from global sources

For investors with an appetite for income, it makes sense to look far and wide for income sources. Putnam Global Income Trust searches the world for income-generating securities.
This fund was launched in 1987, when the best international income opportunities involved taking advantage of differences in bond yields and fluctuations in currency exchange rates across international markets. However, at the time, only a handful of the world’s markets allowed foreign investors to participate fully.
Since then, income opportunities have changed. Regulatory reforms opened many markets to outside investors. A convergence of interest rates to lower levels limited the effectiveness of traditional strategies. New approaches focused on opportunities in recently opened markets and budding sectors as a broader variety of bonds and specially structured debt securities developed.
Putnam Global Income Trust has kept pace with these evolving opportunities. Today, the portfolio continues to hold bonds issued by foreign governments in an effort to benefit from foreign currency exposure, but it invests a greater share of assets in securities backed by mortgage and consumer debt. The advantage of this variety of holdings is that the sources of return are, to some extent, independent and unrelated, rather than dependent on a single factor, like interest-rate trends, that can negatively affect the fund.
The fund’s managers work with Putnam’s fixed-income group and possess a range of specialized research skills. Putnam analysts sift through thousands of securities, supporting the managers as they construct a portfolio seeking high current income.
International investing involves certain risks, such as currency fluctuations, economic instability, and political developments. Additional risks may be associated with emerging-market securities, including illiquidity and volatility. Mortgage-backed securities are subject to prepayment risk. The use of derivatives involves special risks and may result in losses. Mutual funds that invest in bonds are subject to certain risks, including interest-rate risk, credit risk, and inflation risk. As interest rates rise, the prices of bonds fall. Long-term bonds are more exposed to interest-rate risk than short-term bonds. Unlike bonds, bond funds have ongoing fees and expenses. Lower-rated bonds may offer higher yields in return for more risk. Mutual funds that invest in government securities are not guaranteed. The fund invests in fewer issuers and involves more risk than a fund that invests more broadly.
Key drivers of returns
in global bond markets
U.S. investment-grade bonds
Most government, mortgage-backed, and asset-backed securities are investment-grade bonds. The performance of investment-grade bonds is influenced primarily by changes in interest rates. Generally, bond prices rise when interest rates fall, and prices fall when rates rise. The fluctuations are caused by investor expectations about future inflation and the pace of economic growth.
International bonds
Bonds issued outside the United States, including sovereign debt of foreign governments, are affected by inflation and economic conditions in the countries where the bonds are issued. Also, changes in currency exchange rates affect the performance of international bonds.
Allocations and holdings in each country will vary over time. For more information on current fund holdings, see pages 27–67.
All data as of 4/30/09.
This illustration shows the fund’s six largest country weightings, which together represent 94.26% of the fund’s portfolio value. The balance of the fund’s portfolio is invested in 12 other countries. Data excludes exposure to some countries achieved through various derivative investments and collateral received on certain derivative instruments. Weightings will vary over time.
Finding income opportunities in a variety of world markets
The fund’s management team identifies bonds in the United States and international markets that offer
the potential for high current income. The fund favors currencies considered to offer relative strength.

Performance
snapshot
Average annual total return (%) comparison as of 4/30/09

Current performance may be lower or higher than the quoted past performance, which cannot guarantee future results. Share price, principal value, and return will fluctuate, and you may have a gain or a loss when you sell your shares. Performance of class A shares assumes reinvestment of distributions and does not account for taxes. Fund returns in the bar chart do not reflect a sales charge of 4.00%; had they, returns would have been lower. See pages 7 and 12–14 for additional performance information. For a portion of the periods, this fund may have limited expenses, without which returns would have been lower. Due to market volatility, current performance may be higher or lower than performance shown. A 1% short-term trading fee may apply. To obtain the most recent month-end performance, visit putnam.com.
* The fund’s benchmark was not in existence at the time of the fund’s inception. The Barclays Capital Global Aggregate Bond Index commenced 12/31/89.
† Returns for the six-month period are not annualized, but cumulative.
6
Interview with your
fund’s Portfolio Manager
D. William Kohli
Bill, how did Putnam Global Income Trust perform during its most recent semiannual period?
The fund posted a positive return during a tumultuous time for the credit markets, though it slightly underperformed its benchmark (which is more highly concentrated in government securities) and its Lipper peers. There were two starkly contrasting periods for the credit markets during recent months. At the peak of the financial crisis last October and November, even issues with very secure cash flows found few buyers. Interest-rate spreads, or differences in yield between credit instruments and Treasuries, widened dramatically, as prices of many credit instruments plummeted. In an almost desperate flight to perceived quality during the height of the credit crisis, investors fled credit instruments for the perceived safe haven of Treasuries. However, the credit markets began to stabilize last December and performed much more positively during the first four months of 2009. Specifically, for the six-month period, the fund gained 4. 89% at net asset value, versus a return of 6.68% for the Barclays Capital Global Aggregate Bond Index and a 5.79% return for the fund’s peer group, Lipper Global Income Funds.
How did the period begin in terms of major events affecting the credit markets, and how did it evolve?
Over the past 18 months, we witnessed the dramatic unfolding of a significant deleveraging process in the United States —
Broad market index and fund performance
This comparison shows your fund’s performance in the context of broad market indexes for the six months ended 4/30/09. See page 6 and pages 12–14 for additional fund performance information. Index descriptions can be found on page 19.

7
as well as worldwide — on a scale that was unprecedented. Following Lehman Brothers’ bankruptcy declaration, breakup, and liquidation last September, credit market prices declined sharply during the fall of 2008. Leading up to that point, we had seen a surge in home foreclosures, severe problems for the securitized loan markets, the collapse of Bear Stearns, and instances where the money markets virtually froze and short-term Treasury yields turned negative because of unprecedented Treasury security demand. In November, another significant drop in commercial and residential property values was reported, and panic selling of credit instruments by individuals and institutions, including large hedge funds, ensued. Yields of credit instruments compared with Treasuries spiked to spread levels that had never been seen before.
The dramatic reduction of access to credit for individuals and businesses drove the United States and all major European countries into the worst economic downturn since the Great Depression. The Fed [U.S. Federal Reserve] and several other central banks around the world responded with a series of short-term interest-rate cuts designed to stimulate economic activity, and the Fed and U.S. Treasury introduced a number of new lending facilities designed to spur renewed credit flows and lending among — and by —large financial institutions.
In early February, Congress approved an $800 billion stimulus package designed to buoy the economy with new spending, and in March, Treasury Secretary Timothy Geithner announced a public/private partnership to buy up so-called “toxic” mortgage assets from banks as another way to restore credit flows. The government’s series of “stress tests” on major banks this spring was helpful in providing a kind of third-party endorsement concerning these banks’ relative stability, spurring improved liquidity within the credit markets.
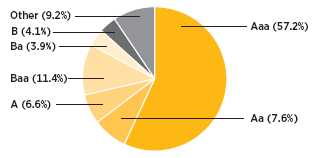
Credit quality overview
Credit qualities shown as a percentage of portfolio value as of 4/30/09. A bond rated Baa or higher (MIG3/VMIG3 or higher, for short-term debt) is considered investment grade. The chart reflects Moody’s ratings; percentages may include bonds not rated by Moody’s but considered by Putnam Management to be of comparable quality. Ratings will vary over time.
8
Bill, how did the portfolio managers invest the fund through this period?
First of all, we continued our strategy of focusing on high-quality credit instruments that we believe carry minimal fundamental credit risk. Though the performance of most credit instruments was highly correlated at the low point for the bond market last fall [as many investors fled to Treasuries], we believe that our focus on high credit quality will reward investors over time. Beginning in late 2007, we began to find compelling opportunities among what we perceived to be severely undervalued securities in commercial mortgage-backed securities [CMBSs] and collateralized mortgage obligations [CMOs], particularly interest-only securities [IOs] and inverse floating rate notes markets. We purchased large amounts of these securities at various points over the last 15 months.
Two factors helped the fund bounce back somewhat from the tremendous market downdraft last fall. First, the fund’s investments in IOs and inverse floating rate securities benefited from the slow rate of prepayments that the mortgage market is currently experiencing. Both types of securities are producing substantial cash flows even in this difficult economic environment, and these two types of holdings strongly benefited performance from December through February when the credit markets stabilized. Second, during the latter part of the period the fund profited from our prior decision to position the portfolio for yield-curve steepening. This strategy was based on our view that the yield curve would continue to steepen [with longer-term yields rising], as we predicted that central banks would keep short-term rates low and concerns would continue to grow over government budget deficits and longer-term inflation.
Did you incorporate any additional changes in strategy during the time frame?
Yes. With the intent of decreasing the fund’s price volatility, we have been reducing the
Comparison of top country weightings
This chart shows how the fund’s top weightings have changed over the past six months. Data excludes exposure to some countries achieved through various derivative instruments and collateral received on certain derivative instruments. Weightings are shown as a percentage of portfolio value. Holdings will vary over time.

9
overall level of commercial mortgage assets in the fund, and shifting to short-duration commercial mortgages and residential mortgages. Within the residential mortgage area, we have emphasized hybrid ARMs [combining features of both fixed-rate and adjustable-rate mortgages] and Alt-A mortgages [considered more risky than prime mortgages, but higher quality than subprime] at what we feel are very depressed prices. We believe both types of residential mortgages were unfairly punished by the market during the most intense periods of market illiquidity over the past 18 months.
Bill, what is your outlook for the economy, the credit markets, and the fund over the next several months?
We have seen a gradual shift in attitude among market participants in the first four months of 2009, and though the economy could deteriorate further, we are also preparing for the possibility that the fundamental improvements we’ve witnessed — along with the enhanced market liquidity that we are seeing — could build on one another to markedly improve the state of the economy and financial markets. However, because it is impossible to predict even the short-term economic future, we are focusing on cash flows. That is, we are looking to invest in bonds that will produce steady return even if the U.S. economy turns down again or recovers much more slowly than many are hoping. We are also emphasizing short duration and high quality. Although we expect market volatility to persist, we think that the level of value in the bond market is very high. For the first time in more than 15 years, double-digit yields are available from fixed-income instruments duri ng a period when inflation is still very low. To us, the potential returns from a select mix of credit instruments are extremely attractive.
Thanks Bill, for sharing your insights with us.
IN THE NEWS
The Obama administration estimates a record $1.84 trillion budget deficit for 2009. The combination of higher government debt and stimulus spending has cooled investors’ attitudes toward Treasury bonds, whose prices have fallen more than 20% since the start of 2009, despite their safe-haven status. Historically, Treasury bonds have been among the investments most vulnerable to fears of rising inflation, which can result from increased government spending. Massive government stimulus often leads to higher prices for consumer goods because the Federal Reserve, in effect, prints more money to pay for the additional spending. This, in turn, can diminish the purchasing power of the dollar. Higher interest rates will push down Treasury prices because when interest rates rise, bond prices fall, and vice versa.
The views expressed in this report are exclusively those of Putnam Management. They are not meant as investment advice.
Please note that the holdings discussed in this report may not have been held by the fund for the entire period. Portfolio composition is subject to review in accordance with the fund’s investment strategy and may vary in the future. Current and future portfolio holdings are subject to risk.
10
Of special interest
We are pleased to report that effective March 2009, your fund’s monthly dividend was increased from $0.058 to $0.062 per share, an increase of 6.90%. This dividend increase was possible due to an increase in interest income driven primarily by increased exposure to the securitized bond markets.
11
Your fund’s performance
This section shows your fund’s performance, price, and distribution information for periods ended April 30, 2009, the end of the first half of its current fiscal year. In accordance with regulatory requirements for mutual funds, we also include performance as of the most recent calendar quarter-end and expense information taken from the fund’s current prospectus. Performance should always be considered in light of a fund’s investment strategy. Data represents past performance. Past performance does not guarantee future results. More recent returns may be less or more than those shown. Investment return and principal value will fluctuate, and you may have a gain or a loss when you sell your shares. Performance information does not reflect any deduction for taxes a shareholder may owe on fund distributions or on the redemption of fund shares. For the most recent month-end performance, please visit the Individual Investors section of putnam.com or call P utnam at 1-800-225-1581. Class Y shares are generally only available to corporate and institutional clients and clients in other approved programs. See the Terms and Definitions section in this report for definitions of the share classes offered by your fund.
Fund performance Total return for periods ended 4/30/09
| | | | | | | | | | |
| | Class A | Class B | Class C | Class M | Class R | Class Y |
| (inception dates) | (6/1/87) | (2/1/94) | (7/26/99) | (3/17/95) | (12/1/03) | (10/4/05) |
|
| | NAV | POP | NAV | CDSC | NAV | CDSC | NAV | POP | NAV | NAV |
|
| Annual average | | | | | | | | | | |
| (life of fund) | 6.34% | 6.15% | 5.52% | 5.52% | 5.55% | 5.55% | 6.04% | 5.88% | 6.08% | 6.39% |
|
| 10 years | 42.49 | 36.80 | 32.27 | 32.27 | 32.28 | 32.28 | 39.05 | 34.58 | 39.03 | 43.75 |
| Annual average | 3.60 | 3.18 | 2.84 | 2.84 | 2.84 | 2.84 | 3.35 | 3.01 | 3.35 | 3.70 |
|
| 5 years | 10.25 | 5.81 | 6.18 | 4.44 | 6.26 | 6.26 | 8.87 | 5.31 | 9.01 | 11.22 |
| Annual average | 1.97 | 1.14 | 1.21 | 0.87 | 1.22 | 1.22 | 1.71 | 1.04 | 1.74 | 2.15 |
|
| 3 years | 2.54 | –1.54 | 0.24 | –2.40 | 0.27 | 0.27 | 1.72 | –1.56 | 1.71 | 3.22 |
| Annual average | 0.84 | –0.52 | 0.08 | –0.81 | 0.09 | 0.09 | 0.57 | –0.52 | 0.57 | 1.06 |
|
| 1 year | –12.38 | –15.90 | –13.09 | –17.19 | –13.00 | –13.82 | –12.60 | –15.44 | –12.60 | –12.22 |
|
| 6 months | 4.89 | 0.66 | 4.41 | –0.59 | 4.49 | 3.49 | 4.70 | 1.29 | 4.76 | 4.91 |
|
Current performance may be lower or higher than the quoted past performance, which cannot guarantee future results. After-sales-charge returns (public offering price, or POP) for class A and M shares reflect a maximum 4.00% and 3.25% load, respectively. Class B share returns reflect the applicable contingent deferred sales charge (CDSC), which is 5% in the first year, declining to 1% in the sixth year, and is eliminated thereafter. Class C shares reflect a 1% CDSC for the first year that is eliminated thereafter. Class R and Y shares have no initial sales charge or CDSC. Performance for class B, C, M, R, and Y shares before their inception is derived from the historical performance of class A shares, adjusted for the applicable sales charge (or CDSC) and, except for class Y shares, the higher operating expenses for such shares.
For a portion of the periods, this fund may have limited expenses, without which returns would have been lower.
Due to market volatility, current performance may be higher or lower than performance shown.
A 1% short-term trading fee may be applied to shares exchanged or sold within 90 days of purchase.
12
Comparative index returns For periods ended 4/30/09
| | |
| | Barclays Capital Global Aggregate | Lipper Global Income Funds |
| | Bond Index | category average* |
|
| Annual average (life of fund) | —† | 6.98% |
|
| 10 years | 67.97% | 59.70 |
| Annual average | 5.32 | 4.68 |
|
| 5 years | 26.82 | 18.04 |
| Annual average | 4.87 | 3.27 |
|
| 3 years | 17.32 | 5.72 |
| Annual average | 5.47 | 1.71 |
|
| 1 year | –2.20 | –7.01 |
|
| 6 months | 6.68 | 5.79 |
|
Index and Lipper results should be compared to fund performance at net asset value.
* Over the 6-month, 1-year, 3-year, 5-year, 10-year, and life-of-fund periods ended 4/30/09, there were 137, 127, 96, 87, 52, and 3 funds, respectively, in this Lipper category.
† The fund’s benchmark was not in existence at the time of the fund’s inception. The Barclays Capital Global Aggregate Bond Index commenced 12/31/89.
Fund price and distribution information For the six-month period ended 4/30/09
| | | | | | | | |
| Distributions | Class A | Class B | Class C | Class M | Class R | Class Y |
|
| Number | 6 | 6 | 6 | 6 | 6 | 6 |
|
| Income | $0.356 | $0.318 | $0.317 | $0.344 | $0.343 | $0.368 |
|
| Capital gains | — | — | — | — | — | — |
|
| Total | $0.356 | $0.318 | $0.317 | $0.344 | $0.343 | $0.368 |
|
| Share value | NAV | POP | NAV | NAV | NAV | POP | NAV | NAV |
|
| 10/31/08 | $10.47 | $10.91 | $10.44 | $10.44 | $10.40 | $10.75 | $10.46 | $10.48 |
|
| 4/30/09 | 10.60 | 11.04 | 10.56 | 10.57 | 10.52 | 10.87 | 10.59 | 10.60 |
|
| Current yield (end of period) | NAV | POP | NAV | NAV | NAV | POP | NAV | NAV |
|
| Current dividend rate 1 | 7.02% | 6.74% | 6.25% | 6.36% | 6.84% | 6.62% | 6.80% | 7.25% |
|
| Current 30-day SEC yield 2,3 | | | | | | | | |
| (with expense limitation) | N/A | 6.86 | 6.41 | 6.42 | N/A | 6.68 | 6.91 | 7.40 |
|
| Current 30-day SEC yield 3 | | | | | | | | |
| (without expense limitation) | N/A | 6.48 | 6.01 | 6.01 | N/A | 6.30 | 6.51 | 7.00 |
|
The classification of distributions, if any, is an estimate. Final distribution information will appear on your year-end tax forms.
1 Most recent distribution, excluding capital gains, annualized and divided by NAV or POP at end of period.
2 For a portion of the period, this fund may have limited expenses, without which yields would have been lower.
3 Based only on investment income and calculated using the maximum offering price for each share class, in accordance with SEC guidelines.
13
Fund performance as of most recent calendar quarter
Total return for periods ended 3/31/09
| | | | | | | | | | |
| (inception | Class A | Class B | Class C | Class M | Class R | Class Y |
| dates) | (6/1/87) | (2/1/94) | (7/26/99) | (3/17/95) | (12/1/03) | (10/4/05) |
|
| | NAV | POP | NAV | CDSC | NAV | CDSC | NAV | POP | NAV | NAV |
|
| Annual average | | | | | | | | | | |
| (life of fund) | 6.15% | 5.95% | 5.32% | 5.32% | 5.35% | 5.35% | 5.84% | 5.68% | 5.88% | 6.19% |
|
| 10 years | 37.09 | 31.60 | 27.22 | 27.22 | 27.21 | 27.21 | 33.72 | 29.41 | 33.76 | 38.27 |
| Annual average | 3.20 | 2.78 | 2.44 | 2.44 | 2.44 | 2.44 | 2.95 | 2.61 | 2.95 | 3.29 |
|
| 5 years | 1.58 | –2.51 | –2.20 | –3.81 | –2.14 | –2.14 | 0.25 | –2.99 | 0.33 | 2.45 |
| Annual average | 0.31 | –0.51 | –0.44 | –0.77 | –0.43 | –0.43 | 0.05 | –0.61 | 0.07 | 0.49 |
|
| 3 years | 0.01 | –4.03 | –2.24 | –4.81 | –2.22 | –2.22 | –0.81 | –4.06 | –0.80 | 0.67 |
| Annual average | 0.00 | –1.36 | –0.75 | –1.63 | –0.75 | –0.75 | –0.27 | –1.37 | –0.27 | 0.22 |
|
| 1 year | –17.17 | –20.51 | –17.80 | –21.69 | –17.78 | –18.56 | –17.42 | –20.12 | –17.33 | –16.95 |
|
| 6 months | –7.77 | –11.48 | –8.22 | –12.67 | –8.15 | –9.04 | –7.93 | –10.91 | –7.89 | –7.74 |
|
Fund’s annual operating expenses For the fiscal year ended 10/31/08
| | | | | | |
| | Class A | Class B | Class C | Class M | Class R | Class Y |
|
| Net expenses* | 1.16% | 1.91% | 1.91% | 1.41% | 1.41% | 0.91% |
|
| Total annual fund operating expenses | 1.48 | 2.23 | 2.23 | 1.73 | 1.73 | 1.23 |
|
* Reflects Putnam Management’s decision to contractually limit expenses through 10/31/09.
Expense information in this table is taken from the most recent prospectus, is subject to change, and may differ from that shown in the next section and in the financial highlights of this report. Expenses are shown as a percentage of average net assets.
Your fund’s expenses
As a mutual fund investor, you pay ongoing expenses, such as management fees, distribution fees (12b-1 fees), and other expenses. In the most recent six-month period, your fund limited these expenses; had it not done so, expenses would have been higher. Using the following information, you can estimate how these expenses affect your investment and compare them with the expenses of other funds. You may also pay one-time transaction expenses, including sales charges (loads) and redemption fees, which are not shown in this section and would have resulted in higher total expenses. For more information, see your fund’s prospectus or talk to your financial representative.
14
Review your fund’s expenses
The following table shows the expenses you would have paid on a $1,000 investment in Putnam Global Income Trust from November 1, 2008, to April 30, 2009. It also shows how much a $1,000 investment would be worth at the close of the period, assuming actual returns and expenses.
| | | | | | |
| | Class A | Class B | Class C | Class M | Class R | Class Y |
|
| Expenses paid per $1,000* | $5.64 | $9.43 | $9.43 | $6.90 | $6.90 | $4.37 |
|
| Ending value (after expenses) | $1,048.90 | $1,044.10 | $1,044.90 | $1,047.00 | $1,047.60 | $1,049.10 |
|
* Expenses for each share class are calculated using the fund’s annualized expense ratio for each class, which represents the ongoing expenses as a percentage of average net assets for the six months ended 4/30/09. The expense ratio may differ for each share class (see the last table in this section). Expenses are calculated by multiplying the expense ratio by the average account value for the period; then multiplying the result by the number of days in the period; and then dividing that result by the number of days in the year.
Estimate the expenses you paid
To estimate the ongoing expenses you paid for the six months ended April 30, 2009, use the following calculation method. To find the value of your investment on November 1, 2008, call Putnam at 1-800-225-1581.

Compare expenses using the SEC’s method
The Securities and Exchange Commission (SEC) has established guidelines to help investors assess fund expenses. Per these guidelines, the following table shows your fund’s expenses based on a $1,000 investment, assuming a hypothetical 5% annualized return. You can use this information to compare the ongoing expenses (but not transaction expenses or total costs) of investing in the fund with those of other funds. All mutual fund shareholder reports will provide this information to help you make this comparison. Please note that you cannot use this information to estimate your actual ending account balance and expenses paid during the period.
| | | | | | |
| | Class A | Class B | Class C | Class M | Class R | Class Y |
|
| Expenses paid per $1,000* | $5.56 | $9.30 | $9.30 | $6.80 | $6.80 | $4.31 |
|
| Ending value (after expenses) | $1,019.29 | $1,015.57 | $1,015.57 | $1,018.05 | $1,018.05 | $1,020.53 |
|
* Expenses for each share class are calculated using the fund’s annualized expense ratio for each class, which represents the ongoing expenses as a percentage of average net assets for the six months ended 4/30/09. The expense ratio may differ for each share class (see the last table in this section). Expenses are calculated by multiplying the expense ratio by the average account value for the period; then multiplying the result by the number of days in the period; and then dividing that result by the number of days in the year.
15
Compare expenses using industry averages
You can also compare your fund’s expenses with the average of its peer group, as defined by Lipper, an independent fund-rating agency that ranks funds relative to others that Lipper considers to have similar investment styles or objectives. The expense ratio for each share class shown indicates how much of your fund’s average net assets have been used to pay ongoing expenses during the period.
| | | | | | |
| | Class A | Class B | Class C | Class M | Class R | Class Y |
|
| Your fund’s annualized | | | | | | |
| expense ratio | 1.11% | 1.86% | 1.86% | 1.36% | 1.36% | 0.86% |
|
| Average annualized expense | | | | | | |
| ratio for Lipper peer group* | 1.12% | 1.87% | 1.87% | 1.37% | 1.37% | 0.87% |
|
* Putnam keeps fund expenses below the Lipper peer group average expense ratio by limiting our fund expenses if they exceed the Lipper average. The Lipper average is a simple average of front-end load funds in the peer group that excludes 12b-1 fees as well as any expense offset and brokerage/service arrangements that may reduce fund expenses. To facilitate the comparison in this presentation, Putnam has adjusted the Lipper average to reflect 12b-1 fees. Investors should note that the other funds in the peer group may be significantly smaller or larger than the fund, and that an asset-weighted average would likely be lower than the simple average. Also, the fund and Lipper report expense data at different times; the fund’s expense ratio shown here is annualized data for the most recent six-month period, while the quarterly updated Lipper average is based on the most recent fiscal year-end data available for the peer group funds as of 3/31/09.
Your fund’s portfolio turnover
Putnam funds are actively managed by experts who buy and sell securities based on intensive analysis of companies, industries, economies, and markets. Portfolio turnover is a measure of how often a fund’s managers buy and sell securities for your fund. A portfolio turnover of 100%, for example, means that the managers sold and replaced securities valued at 100% of a fund’s average portfolio value within a given period. Funds with high turnover may be more likely to generate capital gains that must be distributed to shareholders as taxable income. High turnover may also cause a fund to pay more brokerage commissions and other transaction costs, which may detract from performance.
Funds that invest in bonds or other fixed-income instruments may have higher turnover than funds that invest only in stocks. Short-term bond funds tend to have higher turnover than longer-term bond funds, because shorter-term bonds will mature or be sold more frequently than longer-term bonds. You can use the following table to compare your fund’s turnover with the average turnover for funds in its Lipper category.
16
Turnover comparisons Percentage of holdings that change every year
| | | | | |
| | 2008 | 2007 | 2006 | 2005 | 2004 |
|
| Putnam Global Income Trust | 182% | 103% | 98% | 198% | 162% |
|
| Lipper Global Income Funds | | | | | |
| category average | 192% | 156% | 159% | 158% | 194% |
|
Turnover data for the fund is calculated based on the fund’s fiscal-year period, which ends on October 31. Turnover data for the fund’s Lipper category is calculated based on the average of the turnover of each fund in the category for its fiscal year ended during the indicated year. Fiscal years vary across funds in the Lipper category, which may limit the comparability of the fund’s portfolio turnover rate to the Lipper average. Comparative data for 2008 is based on information available as of 12/31/08.
Your fund’s management
In addition to D. William Kohli, your fund’s Portfolio Managers are Michael Atkin, Rob Bloemker, Michael Salm, and Raman Srivastava.
Portfolio management fund ownership
The following table shows how much the fund’s current Portfolio Managers have invested in the fund and in all Putnam mutual funds (in dollar ranges). Information shown is as of April 30, 2009, and April 30, 2008.

Trustee and Putnam employee fund ownership
As of April 30, 2009, all of the Trustees of the Putnam funds owned fund shares. The following table shows the approximate value of investments in the fund and all Putnam funds as of that date by the Trustees and Putnam employees. These amounts include investments by the Trustees’ and employees’ immediate family members and investments through retirement and deferred compensation plans.
| | |
| | Assets in the fund | Total assets in all Putnam funds |
|
| Trustees | $96,000 | $32,000,000 |
|
| Putnam employees | $3,129,000 | $339,000,000 |
|
17
Other Putnam funds managed by the Portfolio Managers
D. William Kohli is also a Portfolio Manager of Putnam Absolute Return 100 Fund, Putnam Absolute Return 300 Fund, Putnam Diversified Income Trust, Putnam Master Intermediate Income Trust, and Putnam Premier Income Trust.
Michael Atkin is also a Portfolio Manager of Putnam Diversified Income Trust, Putnam Master Intermediate Income Trust, and Putnam Premier Income Trust.
Rob Bloemker is also a Portfolio Manager of Putnam Absolute Return 100 Fund, Putnam Absolute Return 300 Fund, Putnam American Government Income Fund, Putnam Diversified Income Trust, Putnam Income Fund, Putnam Master Intermediate Income Trust, Putnam Premier Income Trust, and Putnam U.S. Government Income Trust.
Michael Salm is also a Portfolio Manager of Putnam Absolute Return 100 Fund, Putnam Absolute Return 300 Fund, Putnam American Government Income Fund, Putnam Income Fund, and Putnam U.S. Government Income Trust.
Raman Srivastava is also a Portfolio Manager of Putnam Absolute Return 100 Fund, Putnam Absolute Return 300 Fund, Putnam Income Fund, and The George Putnam Fund of Boston.
D. William Kohli, Michael Atkin, Rob Bloemker, Michael Salm, and Raman Srivastava may also manage other accounts and variable trust funds advised by Putnam Management or an affiliate.
18
Terms and definitions
Important terms
Total return shows how the value of the fund’s shares changed over time, assuming you held the shares through the entire period and reinvested all distributions in the fund.
Net asset value (NAV) is the price, or value, of one share of a mutual fund, without a sales charge. NAVs fluctuate with market conditions. NAV is calculated by dividing the net assets of each class of shares by the number of outstanding shares in the class.
Public offering price (POP) is the price of a mutual fund share plus the maximum sales charge levied at the time of purchase. POP performance figures shown here assume the 4.00% maximum sales charge for class A shares and 3.25% for class M shares.
Contingent deferred sales charge (CDSC) is generally a charge applied at the time of the redemption of class B or C shares and assumes redemption at the end of the period. Your fund’s class B CDSC declines from a 5% maximum during the first year to 1% during the sixth year. After the sixth year, the CDSC no longer applies. The CDSC for class C shares is 1% for one year after purchase.
Current yield is the annual rate of return earned from dividends or interest of an investment. Current yield is expressed as a percentage of the price of a security, fund share, or principal investment.
Share classes
Class A shares are generally subject to an initial sales charge and no CDSC (except on certain redemptions of shares bought without an initial sales charge).
Class B shares are not subject to an initial sales charge. They may be subject to a CDSC.
Class C shares are not subject to an initial sales charge and are subject to a CDSC only if the shares are redeemed during the first year.
Class M shares have a lower initial sales charge and a higher 12b-1 fee than class A shares and no CDSC (except on certain redemptions of shares bought without an initial sales charge).
Class R shares are not subject to an initial sales charge or CDSC and are available only to certain defined contribution plans.
Class Y shares are not subject to an initial sales charge or CDSC, and carry no 12b-1 fee. They are generally only available to corporate and institutional clients and clients in other approved programs.
Comparative indexes
Barclays Capital Aggregate Bond Index is an unmanaged index of U.S. investment-grade fixed-income securities.
Barclays Capital Global Aggregate Bond Index is an unmanaged index of global investment-grade fixed-income securities.
Merrill Lynch U.S. 3-Month Treasury Bill Index is an unmanaged index that seeks to measure the performance of U.S. Treasury bills available in the marketplace.
S&P 500 Index is an unmanaged index of common stock performance.
Indexes assume reinvestment of all distributions and do not account for fees. Securities and performance of a fund and an index will differ. You cannot invest directly in an index.
Lipper is a third-party industry-ranking entity that ranks mutual funds. Its rankings do not reflect sales charges. Lipper rankings are based on total return at net asset value relative to other funds that have similar current investment styles or objectives as determined by Lipper. Lipper may change a fund’s category assignment at its discretion. Lipper category averages reflect performance trends for funds within a category.
19
Trustee approval of management contract
General conclusions
The Board of Trustees of the Putnam funds oversees the management of each fund and, as required by law, determines annually whether to approve the continuance of your fund’s management contract with Putnam Investment Management (“Putnam Management”) and the sub-management contract, in respect of your fund, between Putnam Management’s affiliate, Putnam Investments Limited (“PIL”), and Putnam Management. In this regard, the Board of Trustees, with the assistance of its Contract Committee consisting solely of Trustees who are not “interested persons” (as such term is defined in the Investment Company Act of 1940, as amended) of the Putnam funds (the “Independent Trustees”), requests and evaluates all information it deems reasonably necessary under the circumstances. Over the course of several months ending in June 2008, the Contract Committee met several times to consider the information provided by Putnam Management an d other information developed with the assistance of the Board’s independent counsel and independent staff. The Contract Committee reviewed and discussed key aspects of this information with all of the Independent Trustees. The Contract Committee recommended, and the Independent Trustees approved, the continuance of your fund’s management and sub-management contracts, effective July 1, 2008. (Because PIL is an affiliate of Putnam Management and Putnam Management remains fully responsible for all services provided by PIL, the Trustees have not evaluated PIL as a separate entity, and all subsequent references to Putnam Management below should be deemed to include reference to PIL as necessary or appropriate in the context.)
The Independent Trustees’ approval was based on the following conclusions:
• That the fee schedule in effect for your fund represented reasonable compensation in light of the nature and quality of the services being provided to the fund, the fees paid by competitive funds and the costs incurred by Putnam Management in providing such services, and
• That this fee schedule represented an appropriate sharing between fund shareholders and Putnam Management of such economies of scale as may exist in the management of the fund at current asset levels.
These conclusions were based on a comprehensive consideration of all information provided to the Trustees, were subject to the continued application of certain expense reductions and waivers and other considerations noted below, and were not the result of any single factor. Some of the factors that figured particularly in the Trustees’ deliberations and how the Trustees considered these factors are described below, although individual Trustees may have evaluated the information presented differently, giving different weights to various factors. It is also important to recognize that the fee arrangements for your fund and the other Putnam funds are the result of many years of review and discussion between the Independent Trustees and Putnam Management, that certain aspects of such arrangements may receive greater scrutiny in some years than others, and that the Trustees’ conclusions may be based, in part, on their consideration of these same arrangements in prior years.
Management fee schedules and
categories; total expenses
The Trustees reviewed the management fee schedules in effect for all Putnam funds, including fee levels and breakpoints, and the assignment of funds to particular feecategories. In reviewing fees and expenses, the Trustees
20
generally focused their attention on material changes in circumstances — for example, changes in a fund’s size or investment style, changes in Putnam Management’s operating costs or responsibilities, or changes in competitive practices in the mutual fund industry — that suggest that consideration of fee changes might be warranted. The Trustees concluded that the circumstances did not warrant changes to the management fee structure of your fund, which had been carefully developed over the years, re-examined on many occasions and adjusted where appropriate. In this regard, the Trustees also noted that shareholders of your fund voted in 2007 to approve new management contracts containing an identical fee structure. The Trustees focused on two areas of particular interest, as discussed further below:
• Competitiveness. The Trustees reviewed comparative fee and expense information for competitive funds, which indicated that, in a custom peer group of competitive funds selected by Lipper Inc., your fund ranked in the 4th percentile in management fees and in the 52nd percentile in total expenses (less any applicable 12b-1 fees) as of December 31, 2007 (the first percentile being the least expensive funds and the 100th percentile being the most expensive funds). (Because the fund’s custom peer group is smaller than the fund’s broad Lipper Inc. peer group, this expense information may differ from the Lipper peer expense information found elsewhere in this report.) The Trustees noted that expense ratios for a number of Putnam funds, which show the percentage of fund assets used to pay for management and administrative services, distribution (12b-1) fees and other expenses, ha d been increasing recently as a result of declining net assets and the natural operation of fee breakpoints.
The Trustees noted that the expense ratio increases described above were currently being controlled by expense limitations initially implemented in January 2004. The Trustees have received a commitment from Putnam Management and its parent company to continue this program through at least June 30, 2009. These expense limitations give effect to a commitment by Putnam Management that the expense ratio of each open-end fund would be no higher than the average expense ratio of the competitive funds included in the fund’s relevant Lipper universe (exclusive of any applicable 12b-1 charges in each case). The Trustees observed that this commitment to limit fund expenses has served shareholders well since its inception.
In order to ensure that the expenses of the Putnam funds continue to meet evolving competitive standards, the Trustees requested, and Putnam Management agreed, to extend for the twelve months beginning July 1, 2008, an additional expense limitation for certain funds at an amount equal to the average expense ratio (exclusive of 12b-1 charges) of a custom peer group of competitive funds selected by Lipper to correspond to the size of the fund. This additional expense limitation will be applied to those open-end funds that had above-average expense ratios (exclusive of 12b-1 charges) based on the custom peer group data for the period ended December 31, 2007. This additional expense limitation will be applied to your fund.
In addition, the Trustees devoted particular attention to analyzing the Putnam funds’ fees and expenses relative to those of competitors in fund complexes of comparable size and with a comparable mix of asset categories. The Trustees concluded that this analysis did not reveal any matters requiring further attention at the current time.
• Economies of scale. Your fund currently has the benefit of breakpoints in its management fee that provide shareholders with significant economies of scale, which means that the effective management fee rate of the fund (as a percentage of fund assets) declines as the fund grows in size and crosses specified asset
21
thresholds. Conversely, if the fund shrinks in size — as has been the case for many Putnam funds in recent years — these breakpoints result in increasing fee levels. In recent years, the Trustees have examined the operation of the existing breakpoint structure during periods of both growth and decline in asset levels. The Trustees concluded that the fee schedule in effect for your fund represented an appropriate sharing of economies of scale at current asset levels.
In connection with their review of the management fees and total expenses of the Putnam funds, the Trustees also reviewed the costs of the services to be provided and profits to be realized by Putnam Management and its affiliates from the relationship with the funds. This information included trends in revenues, expenses and profitability of Putnam Management and its affiliates relating to the investment management and distribution services provided to the funds. In this regard, the Trustees also reviewed an analysis of Putnam Management’s revenues, expenses and profitability with respect to the funds’ management contracts, allocated on a fund-by-fund basis.
Investment performance
The quality of the investment process provided by Putnam Management represented a major factor in the Trustees’ evaluation of the quality of services provided by Putnam Management under your fund’s management contract. The Trustees were assisted in their review of the Putnam funds’ investment process and performance by the work of the Investment Oversight Coordinating Committee of the Trustees and the Investment Oversight Committees of the Trustees, which had met on a regular monthly basis with the funds’ portfolio teams throughout the year. The Trustees concluded that Putnam Management generally provides a high-quality investment process — as measured by the experience and skills of the individuals assigned to the management of fund portfolios, the resources made available to such personnel, and in general the ability of Putnam Management to attract and retain high-quality personnel — but also recogn ized that this does not guarantee favorable investment results for every fund in every time period. The Trustees considered the investment performance of each fund over multiple time periods and considered information comparing each fund’s performance with various benchmarks and with the performance of competitive funds.
While the Trustees noted the satisfactory investment performance of certain Putnam funds, they considered the disappointing investment performance of many funds in recent periods, particularly over periods in 2007 and 2008. They discussed with senior management of Putnam Management the factors contributing to such underperformance and actions being taken to improve performance. The Trustees recognized that, in recent years, Putnam Management has taken steps to strengthen its investment personnel and processes to address areas of underperformance, including recent efforts to further centralize Putnam Management’s equity research function. In this regard, the Trustees took into consideration efforts by Putnam Management to improve its ability to assess and mitigate investment risk in individual funds, across asset classes, and across the complex as a whole. The Trustees indicated their intention to continue to monitor performance trends to assess the effectivenes s of these efforts and to evaluate whether additional changes to address areas of underperformance are warranted.
In the case of your fund, the Trustees considered that your fund’s class A share cumulative total return performance at net asset value was in the following percentiles of its Lipper Inc. peer group (Lipper Global Income Funds) for the one-year, three-year and five-year periods ended December 31, 2007 (the first percentile being the best-performing funds and the 100th percentile being the worst-performing funds):
22
| | | |
| One-year period | 38th | | |
| | |
| Three-year period | 67th | | |
| | |
| Five-year period | 42nd | | |
| | |
(Because of the passage of time, these performance results may differ from the performance results for more recent periods shown elsewhere in this report.) Over the one-year, three-year and five-year periods ended December 31, 2007, there were 110, 92, and 84 funds, respectively, in your fund’s Lipper peer group.* Past performance is no guarantee of future returns.
As a general matter, the Trustees believe that cooperative efforts between the Trustees and Putnam Management represent the most effective way to address investment performance problems. The Trustees noted that investors in the Putnam funds have, in effect, placed their trust in the Putnam organization, under the oversight of the funds’ Trustees, to make appropriate decisions regarding the management of the funds. Based on the responsiveness of Putnam Management in the recent past to Trustee concerns about investment performance, the Trustees concluded that it is preferable to seek change within Putnam Management to address performance shortcomings. In the Trustees’ view, the alternative of engaging a new investment adviser for an underperforming fund would entail significant disruptions and would not provide any greater assurance of improved investment performance.
Brokerage and soft-dollar allocations;
other benefits
The Trustees considered various potential benefits that Putnam Management may receive in connection with the services it provides under the management contract with your fund. These include benefits related to brokerage and soft-dollar allocations, whereby a portion of the commissions paid by a fund for brokerage may be used to acquire research services that may be useful to Putnam Management in managing the assets of the fund and of other clients. The Trustees considered changes made in 2008, at Putnam Management’s request, to the Putnam funds’ brokerage allocation policy, which expanded the permitted categories of brokerage and research services payable with soft dollars and increased the permitted soft dollar allocation to third-party services over what had been authorized in previous years. The Trustees indicated their continued intent to monitor the potential benefits associated with the allocation of fund brokerage and trends in industry practice to ensure that the principle of seeking “best price and execution” remains paramount in the portfolio trading process.
The Trustees’ annual review of your fund’s management contract arrangements also included the review of its distributor’s contract and distribution plan with Putnam Retail Management Limited Partnership and the investor servicing agreement with Putnam Fiduciary Trust Company (“PFTC”), each of which provides benefits to affiliates of Putnam
* The percentile rankings for your fund’s class A share annualized total return performance in the Lipper Global Income Funds category for the one-year, five-year, and ten-year periods ended March 31, 2009, were 87%, 83%, and 78%, respectively. Over the one-year, five-year, and ten-year periods ended March 31, 2009, your fund ranked 106th out of 121, 73rd out of 88, and 42nd out of 53 funds, respectively. Note that this more recent information was not available when the Trustees approved the continuance of your fund’s management contract.
23
Management. In the case of the investor servicing agreement, the Trustees considered that certain shareholder servicing functions were shifted to a third-party service provider by PFTC in 2007.
Comparison of retail and institutional
fee schedules
The information examined by the Trustees as part of their annual contract review has included for many years information regarding fees charged by Putnam Management and its affiliates to institutional clients such as defined benefit pension plans, college endowments, etc. This information included comparisons of such fees with fees charged to the funds, as well as a detailed assessment of the differences in the services provided to these two types of clients. The Trustees observed, in this regard, that the differences in fee rates between institutional clients and mutual funds are by no means uniform when examined by individual asset sectors, suggesting that differences in the pricing of investment management services to these types of clients reflect to a substantial degree historical competitive forces operating in separate market places. The Trustees considered the fact that fee rates across different asset classes are typicall y higher on average for mutual funds than for institutional clients, as well as the differences between the services that Putnam Management provides to the Putnam funds and those that it provides to institutional clients of the firm, but did not rely on such comparisons to any significant extent in concluding that the management fees paid by your fund are reasonable.
24
Other information for shareholders
Important notice regarding delivery
of shareholder documents
In accordance with SEC regulations, Putnam sends a single copy of annual and semiannual shareholder reports, prospectuses, and proxy statements to Putnam shareholders who share the same address, unless a shareholder requests otherwise. If you prefer to receive your own copy of these documents, please call Putnam at 1-800-225-1581, and Putnam will begin sending individual copies within 30 days.
Proxy voting
Putnam is committed to managing our mutual funds in the best interests of our shareholders. The Putnam funds’ proxy voting guidelines and procedures, as well as information regarding how your fund voted proxies relating to portfolio securities during the 12-month period ended June 30, 2008, are available in the Individual Investors section of putnam.com, and on the SEC’s Web site, www.sec.gov. If you have questions about finding forms on the SEC’s Web site, you may call the SEC at 1-800-SEC-0330. You may also obtain the Putnam funds’ proxy voting guidelines and procedures at no charge by calling Putnam’s Shareholder Services at 1-800-225-1581.
Fund portfolio holdings
The fund will file a complete schedule of its portfolio holdings with the SEC for the first and third quarters of each fiscal year on Form N-Q. Shareholders may obtain the fund’s Forms N-Q on the SEC’s Web site at www.sec.gov. In addition, the fund’s Forms N-Q may be reviewed and copied at the SEC’s Public Reference Room in Washington, D.C. You may call the SEC at 1-800-SEC-0330 for information about the SEC’s Web site or the operation of the Public Reference Room.
25
Financial statements
A guide to financial statements
These sections of the report, as well as the accompanying Notes, constitute the fund’s financial statements.
The fund’s portfolio lists all the fund’s investments and their values as of the last day of the reporting period. Holdings are organized by asset type and industry sector, country, or state to show areas of concentration and diversification.
Statement of assets and liabilities shows how the fund’s net assets and share price are determined. All investment and noninvestment assets are added together. Any unpaid expenses and other liabilities are subtracted from this total. The result is divided by the number of shares to determine the net asset value per share, which is calculated separately for each class of shares. (For funds with preferred shares, the amount subtracted from total assets includes the liquidation preference of preferred shares.)
Statement of operations shows the fund’s net investment gain or loss. This is done by first adding up all the fund’s earnings — from dividends and interest income — and subtracting its operating expenses to determine net investment income (or loss). Then, any net gain or loss the fund realized on the sales of its holdings — as well as any unrealized gains or losses over the period — is added to or subtracted from the net investment result to determine the fund’s net gain or loss for the fiscal period.
Statement of changes in net assets shows how the fund’s net assets were affected by the fund’s net investment gain or loss, by distributions to shareholders, and by changes in the number of the fund’s shares. It lists distributions and their sources (net investment income or realized capital gains) over the current reporting period and the most recent fiscal year-end. The distributions listed here may not match the sources listed in the Statement of operations because the distributions are determined on a tax basis and may be paid in a different period from the one in which they were earned. Dividend sources are estimated at the time of declaration. Actual results may vary. Any non-taxable return of capital cannot be determined until final tax calculations are completed after the end of the fund’s fiscal year.
Financial highlights provide an overview of the fund’s investment results, per-share distributions, expense ratios, net investment income ratios, and portfolio turnover in one summary table, reflecting the five most recent reporting periods. In a semiannual report, the highlight table also includes the current reporting period.
26
The fund’s portfolio 4/30/09 (Unaudited)
| | |
| U.S. GOVERNMENT AND AGENCY MORTGAGE OBLIGATIONS (58.2%)* | Principal amount | Value |
|
| U.S. Government Guaranteed Mortgage Obligations (0.4%) | | |
| Government National Mortgage Association | | |
| Pass-Through Certificates 6 1/2s, with due dates | | |
| from August 20, 2037 to October 20, 2037 | $460,737 | $485,629 |
|
| | | 485,629 |
| U.S. Government Agency Mortgage Obligations (57.8%) | | |
| Federal Home Loan Mortgage Corporation | | |
| Pass-Through Certificates | | |
| 6s, with due dates from July 1, 2021 to | | |
| September 1, 2021 | 107,261 | 112,863 |
| 5 1/2s, June 1, 2035 | 115,674 | 120,834 |
| 5 1/2s, April 1, 2020 | 119,183 | 124,709 |
|
| Federal National Mortgage Association | | |
| Pass-Through Certificates | | |
| 7s, with due dates from March 1, 2033 to | | |
| April 1, 2035 | 353,621 | 383,485 |
| 6 1/2s, with due dates from September 1, 2036 | | |
| to November 1, 2037 | 385,608 | 409,137 |
| 6 1/2s, TBA, May 1, 2039 | 2,000,000 | 2,118,438 |
| 6s, July 1, 2037 | 41,477 | 43,431 |
| 6s, with due dates from May 1, 2021 to | | |
| October 1 , 2021 | 296,443 | 312,157 |
| 5 1/2s, with due dates from February 1, 2018 | | |
| to March 1, 2021 | 289,993 | 303,734 |
| 5s, July 1, 2035 i | 1,221,827 | 1,262,110 |
| 5s, May 1, 2037 | 2,999,998 | 3,089,530 |
| 5s, with due dates from May 1, 2020 to March 1, 2021 | 43,658 | 45,484 |
| 5s, TBA, June 1, 2039 | 8,000,000 | 8,205,938 |
| 5s, TBA, May 1, 2039 | 46,000,000 | 47,311,718 |
| 4 1/2s, TBA, May 1, 2039 | 1,000,000 | 1,017,500 |
| 4s, with due dates from May 1, 2019 to | | |
| September 1, 2020 | 557,460 | 570,294 |
|
| | | 65,431,362 |
| Total U.S. government and agency mortgage obligations (cost $65,682,457) | $65,916,991 |
|
| |
| U.S. TREASURY OBLIGATIONS (0.7%)* | Principal amount | Value |
|
| U.S. Treasury Bonds 6 1/4s, May 15, 2030 | $646,000 | $840,910 |
|
| Total U.S. treasury obligations (cost $749,275) | | $840,910 |
|
| |
| MORTGAGE-BACKED SECURITIES (39.3%)* | Principal amount | Value |
|
| Asset Securitization Corp. Ser. 96-MD6, Class A7, | | |
| 8.631s, 2029 | $98,832 | $109,166 |
|
| Banc of America Commercial Mortgage, Inc. | | |
| FRB Ser. 07-3, Class A3, 5.837s, 2049 | 90,000 | 64,665 |
| Ser. 07-2, Class A2, 5.634s, 2049 | 1,146,000 | 973,985 |
| Ser. 06-4, Class A2, 5.522s, 2046 | 748,000 | 686,596 |
| Ser. 04-3, Class A5, 5.498s, 2039 | 160,000 | 146,130 |
| Ser. 06-5, Class A2, 5.317s, 2047 | 858,000 | 757,160 |
| Ser. 05-6, Class A2, 5.165s, 2047 | 214,000 | 194,784 |
| Ser. 07-5, Class XW, Interest only (IO), 0.606s, 2051 | 5,688,920 | 85,334 |
|
27
| | | |
| MORTGAGE-BACKED SECURITIES (39.3%)* cont. | Principal amount | Value |
|
| Banc of America Commercial Mortgage, Inc. 144A | | | |
| Ser. 01-PB1, Class K, 6.15s, 2035 | | $100,000 | $67,484 |
| Ser. 04-4, Class XC, IO, 0.29s, 2042 | | 2,602,009 | 27,659 |
| Ser. 06-4, Class XC, IO, 0.122s, 2046 | | 3,846,311 | 23,918 |
| Ser. 06-5, Class XC, IO, 0.117s, 2016 | | 1,905,035 | 11,419 |
|
| Banc of America Funding Corp. FRB Ser. 06-D, | | | |
| Class 6A1, 5.935s, 2036 | | 387,583 | 193,792 |
|
| Banc of America Mortgage Securities Ser. 05-E, | | | |
| Class 2, IO, 0.3s, 2035 | | 2,068,744 | 5,818 |
|
| Banc of America Structured Security Trust 144A | | | |
| Ser. 02-X1, Class A3, 5.436s, 2033 | | 53,712 | 53,562 |
|
| Bayview Commercial Asset Trust 144A | | | |
| Ser. 07-1, Class S, IO, 2.477s, 2037 | | 1,265,177 | 75,405 |
| Ser. 07-CD1A, IO, 2.14s, 2021 | CAD | 12,492,599 | 523,755 |
| Ser. 06-CD1A, IO, 1.68s, 2023 | CAD | 9,293,330 | 389,625 |
| Ser. 07-5A, IO, 1.55s, 2037 | | $724,110 | 52,788 |
| FRB Ser. 06-CD1A, Class A1, 0.707s, 2023 F | CAD | 1,821,814 | 1,252,325 |
|
| Bear Stearns Alternate Trust | | | |
| FRB Ser. 06-5, Class 2A2, 6 1/4s, 2036 | | $472,150 | 211,165 |
| FRB Ser. 06-6, Class 2A1, 5.878s, 2036 | | 245,094 | 118,508 |
| FRB Ser. 05-7, Class 23A1, 5.645s, 2035 | | 257,045 | 120,027 |
|
| Bear Stearns Commercial Mortgage Securities, Inc. | | | |
| FRB Ser. 00-WF2, Class F, 8.449s, 2032 | | 100,000 | 56,716 |
| Ser. 07-PW17, Class A3, 5.736s, 2050 | | 1,047,000 | 759,180 |
| Ser. 05-PWR9, Class A2, 4.735s, 2042 | | 143,000 | 135,634 |
|
| Bear Stearns Commercial Mortgage Securities, Inc. 144A | | | |
| Ser. 06-PW14, Class XW, IO, 0.882s, 2038 F | | 1,183,407 | 31,287 |
| Ser. 06-PW14, Class X1, IO, 0.136s, 2038 F | | 1,274,211 | 12,247 |
| Ser. 07-PW18, Class X1, IO, 0.095s, 2050 | | 3,216,277 | 17,388 |
|
| Chase Commercial Mortgage Securities Corp. 144A | | | |
| Ser. 98-1, Class F, 6.56s, 2030 | | 362,000 | 314,207 |
| Ser. 98-1, Class H, 6.34s, 2030 | | 203,000 | 73,937 |
|
| Citigroup Commercial Mortgage Trust | | | |
| Ser. 08-C7, Class A3, 6.299s, 2014 | | 370,000 | 250,460 |
| Ser. 08-C7, Class A2A, 6.034s, 2049 | | 200,000 | 161,392 |
|
| Citigroup Commercial Mortgage Trust 144A Ser. 06-C5, | | | |
| Class XC, IO, 0.1s, 2049 | | 6,884,569 | 48,880 |
|
| Citigroup Mortgage Loan Trust, Inc. | | | |
| IFB Ser. 07-6, Class 2A5, IO, 6.213s, 2037 | | 255,951 | 23,852 |
| FRB Ser. 06-AR5, Class 2A5A, 6.192s, 2036 | | 306,077 | 169,876 |
| FRB Ser. 05-10, Class 1A5A, 5.83s, 2035 | | 101,085 | 55,597 |
| FRB Ser. 06-AR7, Class 2A2A, 5.64s, 2036 | | 369,079 | 155,013 |
|
| Citigroup/Deutsche Bank Commercial Mortgage | | | |
| Trust 144A | | | |
| Ser. 07-CD4, Class XC, IO, 0.089s, 2049 | | 7,989,726 | 33,557 |
| Ser. 07-CD5, Class XS, IO, 0.077s, 2044 | | 1,711,020 | 6,059 |
|
| Commercial Mortgage Acceptance Corp. 144A | | | |
| Ser. 98-C1, Class F, 6.23s, 2031 | | 157,000 | 129,809 |
|
| Commercial Mortgage Loan Trust Ser. 08-LS1, | | | |
| Class A4B, 6.22s, 2017 | | 199,000 | 142,936 |
|
28
| | | |
| MORTGAGE-BACKED SECURITIES (39.3%)* cont. | Principal amount | Value |
|
| Countrywide Alternative Loan Trust | | | |
| IFB Ser. 04-2CB, Class 1A5, IO, 7.163s, 2034 | | $243,685 | $13,963 |
| Ser. 06-45T1, Class 2A2, 6s, 2037 | | 470,255 | 247,031 |
| Ser. 06-J8, Class A4, 6s, 2037 | | 292,962 | 153,897 |
| Ser. 07-HY5R, Class 2A1A, 5.544s, 2047 | | 151,004 | 97,863 |
| Ser. 05-24, Class 1AX, IO, zero %, 2035 | | 1,195,763 | 14,760 |
|
| Countrywide Home Loans | | | |
| FRB Ser. 05-HYB7, Class 6A1, 5.674s, 2035 | | 620,479 | 316,445 |
| FRB Ser. 06-HYB1, Class 1A1, 5.318s, 2036 | | 76,625 | 35,078 |
| FRB Ser. 05-HYB4, Class 2A1, 4.893s, 2035 | | 729,532 | 393,947 |
|
| Credit Suisse Mortgage Capital Certificates | | | |
| FRB Ser. 07-C4, Class A2, 6.004s, 2039 | | 328,000 | 276,704 |
| Ser. 07-3, Class 1A1A, 5.837s, 2037 | | 170,214 | 86,809 |
|
| Credit Suisse Mortgage Capital Certificates 144A | | | |
| Ser. 07-C2, Class AX, IO, 0.279s, 2049 | | 10,861,457 | 54,307 |
| Ser. 06-C4, Class AX, IO, 0.134s, 2039 | | 5,882,977 | 41,646 |
|
| CS First Boston Mortgage Securities Corp. | | | |
| Ser. 97-C2, Class F, 7.46s, 2035 | | 119,000 | 99,963 |
| Ser. 04-C2, Class A2, 5.416s, 2036 | | 180,000 | 157,006 |
|
| CS First Boston Mortgage Securities Corp. 144A | | | |
| Ser. 98-C2, Class F, 6 3/4s, 2030 | | 362,000 | 256,403 |
| Ser. 02-CP5, Class M, 5 1/4s, 2035 | | 81,000 | 4,025 |
| Ser. 04-C4, Class AX, IO, 0.572s, 2039 | | 1,001,934 | 15,005 |
| Ser. 03-C3, Class AX, IO, 0.554s, 2038 | | 1,344,620 | 53,566 |
| Ser. 03-CK2, Class AX, IO, 0.38s, 2036 | | 2,121,299 | 44,335 |
|
| CWCapital Cobalt Ser. 07-C2, Class A2, 5.334s, 2047 | | 554,000 | 477,630 |
|
| DLJ Commercial Mortgage Corp. | | | |
| Ser. 99-CG2, Class B3, 6.1s, 2032 | | 129,000 | 127,569 |
| Ser. 99-CG2, Class B4, 6.1s, 2032 | | 219,000 | 76,650 |
|
| European Loan Conduit 144A FRB Ser. 22A, Class D, | | | |
| 2.336s, 2014 (United Kingdom) | GBP | 103,500 | 30,671 |
|
| European Prime Real Estate PLC 144A FRB Ser. 1-A, | | | |
| Class D, 2.325s, 2014 (United Kingdom) | GBP | 180,378 | 13,363 |
|
| Fannie Mae | | | |
| IFB Ser. 07-75, Class JS, 48.86s, 2037 | | $151,573 | 217,780 |
| IFB Ser. 07-80, Class AS, 45.86s, 2037 | | 92,781 | 130,176 |
| IFB Ser. 07-W7, Class 1A4, 36.555s, 2037 | | 91,862 | 115,627 |
| IFB Ser. 07-1, Class NK, 33.344s, 2037 | | 230,861 | 310,859 |
| IFB Ser. 07-30, Class FS, 27.801s, 2037 | | 79,598 | 101,365 |
| IFB Ser. 06-49, Class SE, 27 1/4s, 2036 | | 140,902 | 182,030 |
| IFB Ser. 05-25, Class PS, 26.235s, 2035 | | 79,460 | 106,536 |
| IFB Ser. 05-57, Class CD, 23.484s, 2035 | | 84,695 | 106,859 |
| IFB Ser. 05-74, Class CP, 23.146s, 2035 | | 94,029 | 108,130 |
| IFB Ser. 06-8, Class HP, 22.963s, 2036 | | 147,972 | 182,140 |
| IFB Ser. 06-8, Class WK, 22.963s, 2036 | | 234,050 | 285,488 |
| IFB Ser. 05-99, Class SA, 22.963s, 2035 | | 109,351 | 132,560 |
| IFB Ser. 05-45, Class DC, 22.706s, 2035 | | 126,128 | 154,172 |
| Ser. 02-T4, Class A4, 9 1/2s, 2041 | | 265,683 | 292,086 |
| Ser. 01-T10, Class A2, 7 1/2s, 2041 | | 103,609 | 111,606 |
| Ser. 02-T4, Class A3, 7 1/2s, 2041 | | 89,691 | 96,614 |
| Ser. 01-T12, Class A2, 7 1/2s, 2041 | | 108,369 | 116,733 |
| Ser. 99-T2, Class A1, 7 1/2s, 2039 | | 203,921 | 217,113 |
29
| | |
| MORTGAGE-BACKED SECURITIES (39.3%)* cont. | Principal amount | Value |
|
| Fannie Mae | | |
| Ser. 00-T6, Class A1, 7 1/2s, 2030 | $90,889 | $97,223 |
| IFB Ser. 07-W6, Class 6A2, IO, 7.363s, 2037 | 117,614 | 12,989 |
| IFB Ser. 03-66, Class SA, IO, 7.213s, 2033 | 190,516 | 17,489 |
| IFB Ser. 04-17, Class ST, IO, 7.163s, 2034 | 46,457 | 5,943 |
| IFB Ser. 08-7, Class SA, IO, 7.113s, 2038 | 708,048 | 83,032 |
| Ser. 02-26, Class A1, 7s, 2048 | 78,252 | 84,267 |
| Ser. 03-W8, Class 2A, 7s, 2042 | 296,608 | 319,409 |
| Ser. 02-T16, Class A2, 7s, 2042 | 436,225 | 469,760 |
| Ser. 02-14, Class A1, 7s, 2042 | 116,177 | 125,108 |
| Ser. 383, Class 80, IO, 7s, 2037 | 78,384 | 7,571 |
| IFB Ser. 07-W6, Class 5A2, IO, 6.853s, 2037 | 182,461 | 18,755 |
| IFB Ser. 07-W4, Class 4A2, IO, 6.843s, 2037 | 843,769 | 86,604 |
| IFB Ser. 07-W2, Class 3A2, IO, 6.843s, 2037 | 211,840 | 21,743 |
| IFB Ser. 06-125, Class SM, IO, 6.763s, 2037 | 332,082 | 28,393 |
| IFB Ser. 06-58, Class SQ, IO, 6.763s, 2036 | 549,021 | 41,237 |
| IFB Ser. 08-36, Class YI, IO, 6.763s, 2036 | 520,982 | 47,228 |
| IFB Ser. 06-43, Class SU, IO, 6.763s, 2036 | 119,833 | 11,667 |
| IFB Ser. 06-24, Class QS, IO, 6.763s, 2036 | 257,798 | 30,567 |
| IFB Ser. 05-52, Class DC, IO, 6.763s, 2035 | 107,301 | 10,338 |
| IFB Ser. 06-60, Class SI, IO, 6.713s, 2036 | 550,035 | 53,023 |
| IFB Ser. 06-60, Class UI, IO, 6.713s, 2036 | 95,188 | 8,931 |
| IFB Ser. 04-89, Class EI, IO, 6.713s, 2034 | 720,468 | 64,577 |
| IFB Ser. 04-24, Class CS, IO, 6.713s, 2034 | 271,469 | 26,863 |
| IFB Ser. 07-W7, Class 3A2, IO, 6.693s, 2037 | 314,357 | 18,971 |
| IFB Ser. 03-122, Class SA, IO, 6.663s, 2028 | 322,101 | 21,499 |
| IFB Ser. 03-122, Class SJ, IO, 6.663s, 2028 | 337,238 | 23,279 |
| IFB Ser. 04-60, Class SW, IO, 6.613s, 2034 | 509,345 | 49,318 |
| IFB Ser. 03-130, Class BS, IO, 6.613s, 2033 | 700,874 | 64,686 |
| IFB Ser. 05-65, Class KI, IO, 6.563s, 2035 | 355,208 | 32,004 |
| IFB Ser. 03-34, Class WS, IO, 6.563s, 2029 | 666,041 | 52,983 |
| IFB Ser. 08-20, Class SA, IO, 6.553s, 2038 | 165,511 | 14,732 |
| IFB Ser. 08-10, Class LI, IO, 6.543s, 2038 | 678,582 | 66,705 |
| IFB Ser. 08-01, Class GI, IO, 6.523s, 2037 | 981,123 | 95,993 |
| Ser. 383, Class 64, IO, 6 1/2s, 2037 | 76,760 | 8,310 |
| Ser. 383, Class 58, IO, 6 1/2s, 2037 | 74,895 | 6,773 |
| Ser. 381, Class 14, IO, 6 1/2s, 2037 | 114,551 | 10,310 |
| Ser. 381, Class 15, IO, 6 1/2s, 2037 | 77,079 | 6,454 |
| Ser. 383, Class 73, IO, 6 1/2s, 2037 | 79,562 | 9,006 |
| IFB Ser. 08-41, Class S, IO, 6.363s, 2036 | 507,612 | 35,824 |
| IFB Ser. 07-39, Class LI, IO, 6.333s, 2037 | 663,980 | 61,631 |
| IFB Ser. 07-54, Class CI, IO, 6.323s, 2037 | 169,851 | 15,928 |
| IFB Ser. 07-39, Class PI, IO, 6.323s, 2037 | 148,963 | 10,986 |
| IFB Ser. 07-42, Class SD, IO, 6.323s, 2037 | 121,648 | 8,191 |
| IFB Ser. 07-58, Class SP, IO, 6.313s, 2037 | 187,389 | 16,693 |
| IFB Ser. 07-28, Class SE, IO, 6.313s, 2037 | 161,117 | 14,996 |
| IFB Ser. 06-128, Class SH, IO, 6.313s, 2037 | 89,077 | 6,532 |
| IFB Ser. 06-79, Class SI, IO, 6.313s, 2036 | 171,569 | 16,257 |
| IFB Ser. 05-12, Class SC, IO, 6.313s, 2035 | 210,257 | 20,084 |
| IFB Ser. 05-17, Class ES, IO, 6.313s, 2035 | 217,019 | 20,287 |
30
| | |
| MORTGAGE-BACKED SECURITIES (39.3%)* cont. | Principal amount | Value |
|
| Fannie Mae | | |
| IFB Ser. 05-17, Class SY, IO, 6.313s, 2035 | $100,449 | $9,467 |
| IFB Ser. 07-W5, Class 2A2, IO, 6.303s, 2037 | 91,728 | 8,672 |
| IFB Ser. 07-30, Class IE, IO, 6.303s, 2037 | 455,308 | 60,897 |
| IFB Ser. 06-123, Class CI, IO, 6.303s, 2037 | 366,184 | 33,887 |
| IFB Ser. 06-123, Class UI, IO, 6.303s, 2037 | 512,783 | 45,843 |
| IFB Ser. 05-82, Class SY, IO, 6.293s, 2035 | 424,994 | 34,637 |
| IFB Ser. 05-45, Class EW, IO, 6.283s, 2035 | 689,785 | 52,222 |
| IFB Ser. 05-45, Class SR, IO, 6.283s, 2035 | 596,990 | 44,241 |
| IFB Ser. 07-15, Class BI, IO, 6.263s, 2037 | 831,793 | 71,846 |
| IFB Ser. 06-126, Class CS, IO, 6.263s, 2037 | 248,087 | 20,105 |
| IFB Ser. 06-16, Class SM, IO, 6.263s, 2036 | 148,990 | 15,909 |
| IFB Ser. 05-95, Class CI, IO, 6.263s, 2035 | 251,461 | 28,800 |
| IFB Ser. 05-84, Class SG, IO, 6.263s, 2035 | 408,759 | 34,417 |
| IFB Ser. 05-57, Class NI, IO, 6.263s, 2035 | 82,003 | 8,019 |
| IFB Ser. 05-54, Class SA, IO, 6.263s, 2035 | 408,795 | 30,580 |
| IFB Ser. 05-23, Class SG, IO, 6.263s, 2035 | 325,053 | 27,802 |
| IFB Ser. 05-29, Class SX, IO, 6.263s, 2035 | 281,144 | 25,081 |
| IFB Ser. 05-29, Class SY, IO, 6.263s, 2035 | 995,679 | 86,896 |
| IFB Ser. 05-17, Class SA, IO, 6.263s, 2035 | 289,168 | 27,673 |
| IFB Ser. 05-17, Class SE, IO, 6.263s, 2035 | 312,841 | 27,781 |
| IFB Ser. 05-57, Class DI, IO, 6.263s, 2035 | 668,658 | 52,690 |
| IFB Ser. 04-92, Class S, IO, 6.263s, 2034 | 896,427 | 77,540 |
| IFB Ser. 06-104, Class EI, IO, 6.253s, 2036 | 343,690 | 33,718 |
| IFB Ser. 05-83, Class QI, IO, 6.253s, 2035 | 77,102 | 7,311 |
| IFB Ser. 06-128, Class GS, IO, 6.243s, 2037 | 186,860 | 17,170 |
| IFB Ser. 06-114, Class IS, IO, 6.213s, 2036 | 177,078 | 14,375 |
| IFB Ser. 06-116, Class LS, IO, 6.213s, 2036 | 74,729 | 6,915 |
| IFB Ser. 04-92, Class SQ, IO, 6.212s, 2034 | 374,457 | 36,549 |
| IFB Ser. 06-115, Class IE, IO, 6.203s, 2036 | 137,926 | 14,392 |
| IFB Ser. 06-117, Class SA, IO, 6.203s, 2036 | 208,425 | 16,967 |
| IFB Ser. 06-109, Class SH, IO, 6.183s, 2036 | 188,996 | 20,687 |
| IFB Ser. 06-111, Class SA, IO, 6.183s, 2036 | 1,209,225 | 111,697 |
| IFB Ser. 07-W6, Class 4A2, IO, 6.163s, 2037 | 767,019 | 70,903 |
| IFB Ser. 06-128, Class SC, IO, 6.163s, 2037 | 172,845 | 14,328 |
| IFB Ser. 06-116, Class S, IO, 6.163s, 2036 | 575,018 | 45,667 |
| IFB Ser. 06-104, Class SG, IO, 6.163s, 2036 | 67,214 | 5,000 |
| IFB Ser. 06-43, Class SI, IO, 6.163s, 2036 | 768,148 | 63,317 |
| IFB Ser. 06-8, Class JH, IO, 6.163s, 2036 | 640,971 | 60,963 |
| IFB Ser. 06-8, Class PS, IO, 6.163s, 2036 | 417,109 | 51,061 |
| IFB Ser. 09-12, Class CI, IO, 6.163s, 2036 | 722,839 | 73,469 |
| IFB Ser. 05-122, Class SG, IO, 6.163s, 2035 | 152,433 | 16,050 |
| IFB Ser. 06-101, Class SA, IO, 6.143s, 2036 | 655,169 | 56,364 |
| IFB Ser. 06-92, Class LI, IO, 6.143s, 2036 | 204,984 | 16,724 |
| IFB Ser. 06-17, Class SI, IO, 6.143s, 2036 | 308,373 | 25,993 |
| IFB Ser. 06-60, Class YI, IO, 6.133s, 2036 | 306,142 | 30,060 |
| IFB Ser. 06-85, Class TS, IO, 6.123s, 2036 | 277,648 | 20,127 |
| IFB Ser. 06-95, Class SH, IO, 6.113s, 2036 | 661,413 | 54,785 |
| IFB Ser. 06-61, Class SE, IO, 6.113s, 2036 | 105,230 | 7,676 |
| IFB Ser. 07-75, Class PI, IO, 6.103s, 2037 | 257,286 | 18,763 |
| IFB Ser. 07-W7, Class 2A2, IO, 6.093s, 2037 | 592,999 | 54,194 |
| IFB Ser. 07-88, Class MI, IO, 6.083s, 2037 | 172,164 | 14,614 |
31
| | |
| MORTGAGE-BACKED SECURITIES (39.3%)* cont. | Principal amount | Value |
|
| Fannie Mae | | |
| IFB Ser. 09-12, Class AI, IO, 6.063s, 2037 | $713,603 | $65,330 |
| IFB Ser. 07-116, Class IA, IO, 6.063s, 2037 | 901,818 | 82,011 |
| IFB Ser. 07-103, Class AI, IO, 6.063s, 2037 | 1,008,336 | 91,698 |
| IFB Ser. 07-15, Class NI, IO, 6.063s, 2022 | 269,925 | 20,217 |
| IFB Ser. 07-106, Class SM, IO, 6.023s, 2037 | 490,929 | 35,470 |
| IFB Ser. 08-3, Class SC, IO, 6.013s, 2038 | 94,566 | 8,699 |
| IFB Ser. 07-109, Class XI, IO, 6.013s, 2037 | 183,454 | 16,042 |
| IFB Ser. 07-109, Class YI, IO, 6.013s, 2037 | 217,969 | 15,484 |
| IFB Ser. 07-W8, Class 2A2, IO, 6.013s, 2037 | 411,989 | 37,157 |
| IFB Ser. 07-88, Class JI, IO, 6.013s, 2037 | 158,238 | 12,857 |
| IFB Ser. 06-79, Class SH, IO, 6.013s, 2036 | 349,304 | 35,832 |
| IFB Ser. 07-54, Class KI, IO, 6.003s, 2037 | 111,893 | 8,056 |
| IFB Ser. 07-30, Class JS, IO, 6.003s, 2037 | 372,022 | 31,585 |
| IFB Ser. 07-30, Class OI, IO, 6.003s, 2037 | 741,061 | 64,724 |
| IFB Ser. 07-14, Class ES, IO, 6.003s, 2037 | 460,719 | 31,670 |
| Ser. 383, Class 98, IO, 6s, 2022 | 64,189 | 4,831 |
| IFB Ser. 07-W2, Class 1A2, IO, 5.993s, 2037 | 197,122 | 17,719 |
| IFB Ser. 07-106, Class SN, IO, 5.973s, 2037 | 247,530 | 17,549 |
| IFB Ser. 07-54, Class IA, IO, 5.973s, 2037 | 198,250 | 17,139 |
| IFB Ser. 07-54, Class IB, IO, 5.973s, 2037 | 198,250 | 17,139 |
| IFB Ser. 07-54, Class IC, IO, 5.973s, 2037 | 198,250 | 17,139 |
| IFB Ser. 07-54, Class ID, IO, 5.973s, 2037 | 198,250 | 17,139 |
| IFB Ser. 07-54, Class IE, IO, 5.973s, 2037 | 198,250 | 17,139 |
| IFB Ser. 07-54, Class IF, IO, 5.973s, 2037 | 294,543 | 25,422 |
| IFB Ser. 07-54, Class NI, IO, 5.973s, 2037 | 184,154 | 14,085 |
| IFB Ser. 07-54, Class UI, IO, 5.973s, 2037 | 247,603 | 23,005 |
| IFB Ser. 07-109, Class AI, IO, 5.963s, 2037 | 935,669 | 80,748 |
| IFB Ser. 07-91, Class AS, IO, 5.963s, 2037 | 166,007 | 12,160 |
| IFB Ser. 07-91, Class HS, IO, 5.963s, 2037 | 178,196 | 15,230 |
| IFB Ser. 07-15, Class CI, IO, 5.943s, 2037 | 681,025 | 58,883 |
| IFB Ser. 06-124, Class SC, IO, 5.943s, 2037 | 361,734 | 28,709 |
| IFB Ser. 06-115, Class JI, IO, 5.943s, 2036 | 488,864 | 38,474 |
| IFB Ser. 07-109, Class PI, IO, 5.913s, 2037 | 254,333 | 21,090 |
| IFB Ser. 06-123, Class LI, IO, 5.883s, 2037 | 328,818 | 26,638 |
| IFB Ser. 08-1, Class NI, IO, 5.813s, 2037 | 439,286 | 38,301 |
| IFB Ser. 07-116, Class BI, IO, 5.813s, 2037 | 827,940 | 72,188 |
| IFB Ser. 08-01, Class AI, IO, 5.813s, 2037 | 1,203,481 | 104,931 |
| IFB Ser. 08-10, Class GI, IO, 5.793s, 2038 | 154,685 | 12,559 |
| IFB Ser. 08-13, Class SA, IO, 5.783s, 2038 | 1,083,961 | 75,377 |
| IFB Ser. 08-1, Class HI, IO, 5.763s, 2037 | 556,581 | 48,111 |
| IFB Ser. 07-39, Class AI, IO, 5.683s, 2037 | 341,660 | 26,212 |
| IFB Ser. 07-32, Class SD, IO, 5.673s, 2037 | 235,133 | 17,479 |
| IFB Ser. 07-30, Class UI, IO, 5.663s, 2037 | 192,973 | 14,683 |
| IFB Ser. 07-1, Class CI, IO, 5.663s, 2037 | 223,167 | 17,997 |
| IFB Ser. 09-12, Class DI, IO, 5.593s, 2037 | 681,976 | 54,647 |
| IFB Ser. 05-58, Class IK, IO, 5.563s, 2035 | 337,414 | 31,450 |
| IFB Ser. 04-46, Class PJ, IO, 5.563s, 2034 | 254,367 | 21,810 |
| Ser. 383, Class 18, IO, 5 1/2s, 2038 | 168,584 | 16,015 |
| Ser. 383, Class 19, IO, 5 1/2s, 2038 | 153,552 | 14,587 |
| Ser. 383, Class 4, IO, 5 1/2s, 2037 | 231,023 | 20,242 |
| Ser. 383, Class 5, IO, 5 1/2s, 2037 | 147,308 | 13,994 |
32
| | |
| MORTGAGE-BACKED SECURITIES (39.3%)* cont. | Principal amount | Value |
|
| Fannie Mae | | |
| Ser. 383, Class 6, IO, 5 1/2s, 2037 | $131,412 | $11,499 |
| Ser. 383, Class 7, IO, 5 1/2s, 2037 | 129,924 | 11,368 |
| Ser. 383, Class 20, IO, 5 1/2s, 2037 | 95,968 | 9,117 |
| Ser. 383, Class 21, IO, 5 1/2s, 2037 | 90,786 | 8,625 |
| Ser. 383, Class 22, IO, 5 1/2s, 2037 | 83,735 | 8,671 |
| Ser. 383, Class 95, IO, 5 1/2s, 2022 | 72,738 | 5,408 |
| IFB Ser. 08-1, Class BI, IO, 5.473s, 2038 | 1,389,860 | 90,957 |
| Ser. 06-W3, Class 1AS, IO, 5.461s, 2046 | 705,461 | 52,063 |
| IFB Ser. 07-75, Class ID, IO, 5.433s, 2037 | 214,170 | 16,861 |
| Ser. 03-W10, Class 1, IO, 1.902s, 2043 | 854,401 | 36,262 |
| Ser. 03-W8, Class 12, IO, 1.633s, 2042 | 1,819,890 | 65,987 |
| Ser. 03-W17, Class 12, IO, 1.145s, 2033 | 873,447 | 22,207 |
| Ser. 02-T18, IO, 0.513s, 2042 | 4,992,385 | 57,510 |
| Ser. 02-T4, IO, 0.449s, 2041 | 279,075 | 2,870 |
| Ser. 02-26, IO, 0.226s, 2048 | 13,075,095 | 89,086 |
| Ser. 07-64, Class LO, Principal only (PO), zero %, 2037 | 110,682 | 97,435 |
| Ser. 06-37, Class ON, PO, zero %, 2036 | 104,030 | 98,201 |
| Ser. 05-50, Class LO, PO, zero %, 2035 | 46,064 | 42,618 |
| Ser. 04-38, Class AO, PO, zero %, 2034 | 341,438 | 274,550 |
| Ser. 08-37, Class DO, PO, zero %, 2033 | 100,000 | 86,322 |
| Ser. 04-61, Class JO, PO, zero %, 2032 | 52,247 | 46,154 |
| Ser. 326, Class 1, PO, zero %, 2032 | 76,454 | 66,440 |
| Ser. 318, Class 1, PO, zero %, 2032 | 28,626 | 25,320 |
| Ser. 04-61, Class CO, PO, zero %, 2031 | 180,188 | 166,528 |
| Ser. 314, Class 1, PO, zero %, 2031 | 136,673 | 124,245 |
| FRB Ser. 06-115, Class SN, zero %, 2036 | 105,180 | 77,795 |
| FRB Ser. 05-65, Class ER, zero %, 2035 | 155,342 | 142,125 |
| FRB Ser. 05-57, Class UL, zero %, 2035 | 131,517 | 127,292 |
| FRB Ser. 05-51, Class FV, zero %, 2035 | 156,008 | 149,537 |
|
| Federal Home Loan Mortgage Corp. Structured | | |
| Pass-Through Securities | | |
| IFB Ser. T-56, Class 2ASI, IO, 7.663s, 2043 | 131,392 | 12,482 |
| Ser. T-42, Class A5, 7 1/2s, 2042 | 32,764 | 35,293 |
| Ser. T-60, Class 1A2, 7s, 2044 | 342,323 | 364,360 |
| Ser. T-41, Class 2A, 6.976s, 2032 | 21,691 | 22,640 |
|
| FFCA Secured Lending Corp. Ser. 99-1A, Class C1, | | |
| 7.59s, 2025 F | 225,000 | 26,752 |
|
| First Chicago Lennar Trust 144A Ser. 97-CHL1, | | |
| Class E, 7.8s, 2039 | 17,179 | 16,836 |
|
| First Horizon Alternative Mortgage Securities FRB | | |
| Ser. 05-AA10, Class 2A1, 5.723s, 2035 | 146,174 | 71,625 |
|
| First Union-Lehman Brothers Commercial Mortgage Trust II | | |
| Ser. 97-C2, Class F, 7 1/2s, 2029 | 209,000 | 169,617 |
| Ser. 97-C2, Class G, 7 1/2s, 2029 | 119,000 | 89,250 |
|
| First Union-Lehman Brothers-Bank of America 144A | | |
| Ser. 98-C2, Class G, 7s, 2035 | 285,000 | 176,700 |
|
| Freddie Mac | | |
| IFB Ser. 3202, Class HM, 30.994s, 2036 | 72,244 | 94,174 |
| IFB Ser. 3182, Class PS, 26.795s, 2032 | 275,391 | 358,529 |
33
| | |
| MORTGAGE-BACKED SECURITIES (39.3%)* cont. | Principal amount | Value |
|
| Freddie Mac | | |
| IFB Ser. 3182, Class SP, 26.795s, 2032 | $77,345 | $87,018 |
| IFB Ser. 3211, Class SI, IO, 25.768s, 2036 | 99,970 | 45,973 |
| IFB Ser. 2976, Class KL, 22.729s, 2035 | 176,628 | 216,836 |
| IFB Ser. 3065, Class DC, 18.506s, 2035 | 151,808 | 175,346 |
| IFB Ser. 2990, Class LB, 15.792s, 2034 | 181,979 | 205,451 |
| IFB Ser. 3031, Class BS, 15.597s, 2035 | 200,280 | 223,055 |
| IFB Ser. 2828, Class GI, IO, 7.049s, 2034 | 283,838 | 32,925 |
| IFB Ser. 2927, Class SI, IO, 7s, 2035 | 235,750 | 17,675 |
| IFB Ser. 3184, Class SP, IO, 6.899s, 2033 | 256,858 | 23,139 |
| IFB Ser. 3345, Class SI, IO, 6.869s, 2036 | 651,334 | 67,739 |
| IFB Ser. 2869, Class JS, IO, 6.799s, 2034 | 570,753 | 38,240 |
| IFB Ser. 3149, Class LS, IO, 6.749s, 2036 | 595,158 | 74,335 |
| IFB Ser. 2882, Class LS, IO, 6.749s, 2034 | 264,782 | 23,541 |
| IFB Ser. 3200, Class SB, IO, 6.699s, 2036 | 389,684 | 34,998 |
| IFB Ser. 3149, Class SE, IO, 6.699s, 2036 | 199,006 | 20,271 |
| IFB Ser. 3203, Class SH, IO, 6.689s, 2036 | 150,287 | 15,040 |
| IFB Ser. 2815, Class PT, IO, 6.599s, 2032 | 278,597 | 24,804 |
| IFB Ser. 2594, Class SE, IO, 6.599s, 2030 | 213,032 | 12,835 |
| IFB Ser. 2828, Class TI, IO, 6.599s, 2030 | 124,380 | 10,491 |
| IFB Ser. 3397, Class GS, IO, 6.549s, 2037 | 152,591 | 12,327 |
| IFB Ser. 3311, Class BI, IO, 6.309s, 2037 | 520,390 | 48,997 |
| IFB Ser. 3297, Class BI, IO, 6.309s, 2037 | 591,151 | 50,682 |
| IFB Ser. 3287, Class SD, IO, 6.299s, 2037 | 237,330 | 20,190 |
| IFB Ser. 3281, Class BI, IO, 6.299s, 2037 | 110,851 | 8,975 |
| IFB Ser. 3281, Class CI, IO, 6.299s, 2037 | 256,514 | 20,760 |
| IFB Ser. 3249, Class SI, IO, 6.299s, 2036 | 83,751 | 8,396 |
| IFB Ser. 3028, Class ES, IO, 6.299s, 2035 | 666,999 | 68,330 |
| IFB Ser. 2922, Class SE, IO, 6.299s, 2035 | 334,106 | 31,292 |
| IFB Ser. 3316, Class SA, IO, 6.279s, 2037 | 441,615 | 36,788 |
| IFB Ser. 3236, Class ES, IO, 6.249s, 2036 | 173,431 | 14,955 |
| IFB Ser. 3136, Class NS, IO, 6.249s, 2036 | 156,480 | 14,400 |
| IFB Ser. 3118, Class SD, IO, 6.249s, 2036 | 542,444 | 46,079 |
| IFB Ser. 2950, Class SM, IO, 6.249s, 2016 | 353,488 | 31,032 |
| IFB Ser. 3256, Class S, IO, 6.239s, 2036 | 284,204 | 23,106 |
| IFB Ser. 3031, Class BI, IO, 6.239s, 2035 | 139,120 | 12,770 |
| IFB Ser. 3370, Class TS, IO, 6.219s, 2037 | 598,519 | 50,430 |
| IFB Ser. 3244, Class SB, IO, 6.209s, 2036 | 160,081 | 12,974 |
| IFB Ser. 3244, Class SG, IO, 6.209s, 2036 | 190,047 | 15,952 |
| IFB Ser. 3236, Class IS, IO, 6.199s, 2036 | 289,442 | 26,412 |
| IFB Ser. 3033, Class SG, IO, 6.199s, 2035 | 142,019 | 12,225 |
| IFB Ser. 2962, Class BS, IO, 6.199s, 2035 | 773,579 | 61,925 |
| IFB Ser. 3114, Class TS, IO, 6.199s, 2030 | 842,420 | 65,044 |
| IFB Ser. 3128, Class JI, IO, 6.179s, 2036 | 149,528 | 12,919 |
| IFB Ser. 2990, Class LI, IO, 6.179s, 2034 | 276,886 | 26,151 |
| IFB Ser. 3240, Class S, IO, 6.169s, 2036 | 560,244 | 47,722 |
| IFB Ser. 3065, Class DI, IO, 6.169s, 2035 | 104,329 | 9,767 |
| IFB Ser. 3210, Class S, IO, 6.149s, 2036 | 109,006 | 6,872 |
| IFB Ser. 3145, Class GI, IO, 6.149s, 2036 | 124,193 | 11,314 |
| IFB Ser. 3114, Class GI, IO, 6.149s, 2036 | 141,419 | 13,309 |
| IFB Ser. 3218, Class AS, IO, 6.129s, 2036 | 200,990 | 15,496 |
| IFB Ser. 3221, Class SI, IO, 6.129s, 2036 | 230,840 | 17,924 |
34
| | |
| MORTGAGE-BACKED SECURITIES (39.3%)* cont. | Principal amount | Value |
|
| Freddie Mac | | |
| IFB Ser. 3153, Class UI, IO, 6.119s, 2036 | $455,224 | $57,071 |
| IFB Ser. 3424, Class XI, IO, 6.119s, 2036 | 593,947 | 50,198 |
| IFB Ser. 3485, Class SI, IO, 6.099s, 2036 | 185,348 | 24,564 |
| IFB Ser. 3153, Class QI, IO, 6.099s, 2036 | 277,235 | 28,350 |
| IFB Ser. 3202, Class PI, IO, 6.089s, 2036 | 656,839 | 52,211 |
| IFB Ser. 3355, Class AI, IO, 6.049s, 2037 | 612,661 | 45,696 |
| IFB Ser. 3355, Class MI, IO, 6.049s, 2037 | 178,737 | 12,663 |
| IFB Ser. 3201, Class SG, IO, 6.049s, 2036 | 304,176 | 27,473 |
| IFB Ser. 3203, Class SE, IO, 6.049s, 2036 | 266,273 | 23,515 |
| IFB Ser. 3238, Class LI, IO, 6.039s, 2036 | 292,867 | 24,984 |
| IFB Ser. 3171, Class PS, IO, 6.034s, 2036 | 255,362 | 23,289 |
| IFB Ser. 3510, Class CI, IO, 6.029s, 2037 | 664,278 | 58,330 |
| IFB Ser. 3510, Class DI, IO, 6.029s, 2035 | 412,258 | 36,988 |
| IFB Ser. 3181, Class PS, IO, 6.019s, 2036 | 166,665 | 15,773 |
| IFB Ser. 3366, Class SA, IO, 5.999s, 2037 | 543,349 | 44,215 |
| IFB Ser. 3284, Class BI, IO, 5.999s, 2037 | 182,372 | 13,312 |
| IFB Ser. 3260, Class SA, IO, 5.999s, 2037 | 188,947 | 12,872 |
| IFB Ser. 3261, Class SA, IO, 5.979s, 2037 | 241,690 | 21,116 |
| IFB Ser. 3359, Class SN, IO, 5.969s, 2037 | 428,179 | 29,107 |
| IFB Ser. 3311, Class EI, IO, 5.959s, 2037 | 205,376 | 14,634 |
| IFB Ser. 3311, Class IA, IO, 5.959s, 2037 | 277,413 | 24,349 |
| IFB Ser. 3311, Class IB, IO, 5.959s, 2037 | 277,413 | 24,349 |
| IFB Ser. 3311, Class IC, IO, 5.959s, 2037 | 277,413 | 24,349 |
| IFB Ser. 3311, Class ID, IO, 5.959s, 2037 | 277,413 | 24,349 |
| IFB Ser. 3311, Class IE, IO, 5.959s, 2037 | 400,708 | 35,170 |
| IFB Ser. 3311, Class PI, IO, 5.959s, 2037 | 408,828 | 29,819 |
| IFB Ser. 3510, Class AS, IO, 5.959s, 2037 | 1,455,372 | 127,272 |
| IFB Ser. 3265, Class SC, IO, 5.959s, 2037 | 196,307 | 15,008 |
| IFB Ser. 3375, Class MS, IO, 5.949s, 2037 | 767,764 | 53,665 |
| IFB Ser. 3240, Class GS, IO, 5.929s, 2036 | 337,886 | 28,491 |
| IFB Ser. 3257, Class SI, IO, 5.869s, 2036 | 143,668 | 9,197 |
| IFB Ser. 3225, Class JY, IO, 5.839s, 2036 | 623,728 | 50,078 |
| IFB Ser. 3416, Class BI, IO, 5.799s, 2038 | 1,192,976 | 96,548 |
| IFB Ser. 3502, Class DS, IO, 5.699s, 2039 | 220,121 | 15,593 |
| IFB Ser. 3339, Class TI, IO, 5.689s, 2037 | 326,400 | 26,024 |
| IFB Ser. 3284, Class CI, IO, 5.669s, 2037 | 519,314 | 41,247 |
| IFB Ser. 3510, Class BI, IO, 5.579s, 2037 | 596,278 | 46,015 |
| IFB Ser. 3397, Class SQ, IO, 5.519s, 2037 | 985,298 | 71,266 |
| IFB Ser. 248, Class IO, 5 1/2s, 2037 | 605,423 | 60,724 |
| IFB Ser. 3500, Class SE, IO, 5.499s, 2039 | 245,885 | 11,596 |
| IFB Ser. 3384, Class ST, IO, 5.449s, 2037 | 445,392 | 35,290 |
| IFB Ser. 3424, Class UI, IO, 5.309s, 2037 | 414,252 | 28,362 |
| Ser. 3327, Class IF, IO, zero %, 2037 | 117,373 | 2,007 |
| Ser. 3300, PO, zero %, 2037 | 79,801 | 69,651 |
| Ser. 242, PO, zero %, 2036 | 1,178,670 | 1,101,135 |
| Ser. 2587, Class CO, PO, zero %, 2032 | 83,714 | 76,996 |
| Ser. 201, PO, zero %, 2029 | 83,142 | 72,022 |
| FRB Ser. 3241, Class FH, zero %, 2036 | 42,111 | 41,269 |
| FRB Ser. 3130, Class JF, zero %, 2036 | 57,738 | 56,061 |
| FRB Ser. 3326, Class WF, zero %, 2035 | 247,337 | 227,782 |
| FRB Ser. 3251, Class TP, zero %, 2035 | 119,646 | 112,770 |
35
| | |
| MORTGAGE-BACKED SECURITIES (39.3%)* cont. | Principal amount | Value |
|
| Freddie Mac | | |
| FRB Ser. 3003, Class XF, zero %, 2035 | $186,807 | $172,197 |
| FRB Ser. 2980, Class BU, zero %, 2035 | 31,572 | 30,493 |
| FRB Ser. 2963, Class TW, zero %, 2035 | 44,682 | 42,543 |
|
| GE Capital Commercial Mortgage Corp. 144A | | |
| FRB Ser. 00-1, Class F, 7.789s, 2033 | 41,000 | 32,345 |
| Ser. 07-C1, Class XC, IO, 0.107s, 2019 | 16,469,095 | 50,807 |
|
| Government National Mortgage Association | | |
| IFB Ser. 07-38, Class AS, 48.06s, 2037 | 200,176 | 281,772 |
| IFB Ser. 07-44, Class SP, 34.086s, 2036 | 98,046 | 124,101 |
| Ser. 07-17, Class CI, IO, 7 1/2s, 2037 | 171,287 | 27,838 |
| IFB Ser. 05-68, Class PU, IO, 6.853s, 2032 | 292,889 | 31,414 |
| IFB Ser. 04-59, Class SC, IO, 6.748s, 2034 | 128,654 | 11,256 |
| IFB Ser. 04-26, Class IS, IO, 6.748s, 2034 | 238,758 | 15,012 |
| IFB Ser. 07-47, Class SA, IO, 6.648s, 2036 | 336,819 | 35,445 |
| IFB Ser. 07-36, Class SW, IO, 6.453s, 2035 | 256,259 | 12,608 |
| IFB Ser. 07-35, Class NY, IO, 6.448s, 2035 | 340,631 | 30,503 |
| IFB Ser. 07-22, Class S, IO, 6.353s, 2037 | 175,738 | 15,436 |
| IFB Ser. 05-84, Class AS, IO, 6.353s, 2035 | 495,250 | 39,775 |
| IFB Ser. 07-26, Class SD, IO, 6.348s, 2037 | 280,788 | 23,392 |
| IFB Ser. 07-51, Class SJ, IO, 6.303s, 2037 | 216,599 | 19,284 |
| IFB Ser. 07-53, Class SY, IO, 6.288s, 2037 | 619,999 | 50,340 |
| IFB Ser. 07-58, Class PS, IO, 6.253s, 2037 | 778,028 | 57,538 |
| IFB Ser. 04-88, Class S, IO, 6.253s, 2032 | 277,465 | 16,286 |
| IFB Ser. 07-59, Class PS, IO, 6.223s, 2037 | 168,970 | 11,371 |
| IFB Ser. 07-59, Class SP, IO, 6.223s, 2037 | 91,335 | 6,213 |
| IFB Ser. 07-48, Class SB, IO, 6.198s, 2037 | 216,734 | 14,943 |
| IFB Ser. 07-74, Class SI, IO, 6.118s, 2037 | 324,393 | 21,501 |
| IFB Ser. 07-17, Class AI, IO, 6.098s, 2037 | 690,978 | 52,734 |
| IFB Ser. 07-78, Class SA, IO, 6.078s, 2037 | 580,348 | 44,763 |
| IFB Ser. 06-26, Class S, IO, 6.053s, 2036 | 1,849,262 | 136,875 |
| IFB Ser. 08-2, Class SM, IO, 6.048s, 2038 | 844,462 | 62,454 |
| IFB Ser. 07-9, Class AI, IO, 6.048s, 2037 | 249,272 | 19,095 |
| IFB Ser. 08-9, Class SK, IO, 6.033s, 2038 | 913,212 | 68,327 |
| IFB Ser. 05-71, Class SA, IO, 5.908s, 2035 | 611,082 | 44,511 |
| IFB Ser. 05-65, Class SI, IO, 5.903s, 2035 | 141,951 | 10,521 |
| IFB Ser. 06-16, Class SX, IO, 5.843s, 2036 | 642,751 | 46,336 |
| IFB Ser. 07-17, Class IB, IO, 5.803s, 2037 | 135,577 | 12,385 |
| IFB Ser. 06-10, Class SM, IO, 5.803s, 2036 | 1,373,882 | 98,136 |
| IFB Ser. 06-14, Class S, IO, 5.803s, 2036 | 240,902 | 15,984 |
| IFB Ser. 05-57, Class PS, IO, 5.803s, 2035 | 414,332 | 32,661 |
| IFB Ser. 06-11, Class ST, IO, 5.793s, 2036 | 150,752 | 10,535 |
| IFB Ser. 07-7, Class JI, IO, 5.753s, 2037 | 415,138 | 27,714 |
| IFB Ser. 07-25, Class KS, IO, 5.748s, 2037 | 289,535 | 23,609 |
| IFB Ser. 07-21, Class S, IO, 5.748s, 2037 | 336,081 | 22,656 |
| IFB Ser. 05-17, Class S, IO, 5.733s, 2035 | 343,853 | 27,955 |
| IFB Ser. 07-31, Class AI, IO, 5.728s, 2037 | 218,131 | 21,390 |
| IFB Ser. 07-62, Class S, IO, 5.698s, 2037 | 383,530 | 26,962 |
| IFB Ser. 05-3, Class SN, IO, 5.653s, 2035 | 916,325 | 66,588 |
| IFB Ser. 07-43, Class SC, IO, 5.648s, 2037 | 214,756 | 14,020 |
| IFB Ser. 04-41, Class SG, IO, 5.553s, 2034 | 832,424 | 41,074 |
| FRB Ser. 07-49, Class UF, zero %, 2037 | 21,613 | 21,047 |
36
| | | |
| MORTGAGE-BACKED SECURITIES (39.3%)* cont. | Principal amount | Value |
|
| Government National Mortgage Association | | | |
| FRB Ser. 07-33, Class TB, zero %, 2037 | | $227,576 | $220,240 |
| FRB Ser. 07-35, Class UF, zero %, 2037 | | 45,905 | 45,660 |
| FRB Ser. 07-6, Class TD, zero %, 2037 | | 202,809 | 195,985 |
|
| Granite Mortgages PLC FRB Ser. 03-2, Class 3C, 3.058s, 2043 F | GBP | 217,605 | 38,591 |
|
| Greenwich Capital Commercial Funding Corp. | | | |
| Ser. 05-GG5, Class A2, 5.117s, 2037 | | $155,000 | 143,976 |
|
| GS Mortgage Securities Corp. II | | | |
| FRB Ser. 07-GG10, Class A3, 5.993s, 2045 | | 170,000 | 125,889 |
| Ser. 06-GG6, Class A2, 5.506s, 2038 | | 272,000 | 250,087 |
|
| GS Mortgage Securities Corp. II 144A | | | |
| Ser. 98-C1, Class F, 6s, 2030 | | 99,000 | 84,150 |
| Ser. 06-GG8, Class X, IO, 0.666s, 2039 | | 2,042,323 | 41,750 |
| Ser. 03-C1, Class X1, IO, 0.35s, 2040 | | 4,788,026 | 83,076 |
|
| HSI Asset Loan Obligation FRB Ser. 07-AR1, | | | |
| Class 2A1, 6.1s, 2037 | | 651,711 | 325,855 |
|
| IMPAC Secured Assets Corp. FRB Ser. 07-2, | | | |
| Class 1A1A, 0.548s, 2037 | | 487,825 | 272,057 |
|
| IndyMac Indx Mortgage Loan Trust | | | |
| FRB Ser. 06-AR25, Class 5A1, 6.119s, 2036 | | 111,709 | 49,626 |
| FRB Ser. 07-AR15, Class 1A1, 6.074s, 2037 | | 374,536 | 187,268 |
| FRB Ser. 07-AR9, Class 2A1, 5.883s, 2037 | | 380,296 | 190,148 |
| FRB Ser. 05-AR31, Class 3A1, 5.528s, 2036 | | 761,396 | 373,084 |
| FRB Ser. 05-AR5, Class 4A1, 5.486s, 2035 | | 310,206 | 146,629 |
| FRB Ser. 07-AR11, Class 1A1, 5.421s, 2037 | | 350,029 | 133,011 |
|
| JPMorgan Alternative Loan Trust | | | |
| FRB Ser. 06-A3, Class 2A1, 6.062s, 2036 | | 272,756 | 131,365 |
| FRB Ser. 06-A1, Class 5A1, 5.939s, 2036 | | 261,501 | 130,751 |
| FRB Ser. 06-A6, Class 1A1, 0.598s, 2036 | | 169,670 | 71,224 |
|
| JPMorgan Chase Commercial Mortgage Securities Corp. | | | |
| FRB Ser. 07-LD12, Class A3, 6.188s, 2051 | | 72,000 | 53,267 |
| FRB Ser. 07-LD11, Class A3, 6.007s, 2049 | | 213,000 | 147,453 |
| Ser. 07-CB20, Class A3, 5.863s, 2051 | | 422,000 | 314,955 |
| Ser. 06-CB15, Class A4, 5.814s, 2043 | | 317,000 | 201,232 |
| Ser. 07-CB20, Class A4, 5.794s, 2051 | | 96,000 | 71,305 |
| Ser. 05-LDP2, Class AM, 4.78s, 2042 | | 50,000 | 29,955 |
| Ser. 06-LDP8, Class X, IO, 0.762s, 2045 | | 2,713,244 | 53,367 |
| Ser. 06-CB17, Class X, IO, 0.7s, 2043 | | 2,413,054 | 48,044 |
| Ser. 07-LDPX, Class X, IO, 0.525s, 2049 | | 4,778,724 | 54,191 |
| Ser. 06-CB16, Class X1, IO, 0.126s, 2045 | | 3,087,077 | 23,825 |
|
| JPMorgan Chase Commercial Mortgage Securities Corp. | | | |
| 144A Ser. 07-CB20, Class X1, IO, 0.113s, 2051 | | 8,316,140 | 57,298 |
|
| LB Commercial Conduit Mortgage Trust 144A | | | |
| Ser. 98-C4, Class J, 5.6s, 2035 | | 119,000 | 73,780 |
|
| LB-UBS Commercial Mortgage Trust | | | |
| Ser. 04-C7, Class A6, 4.786s, 2029 | | 128,000 | 110,411 |
| Ser. 07-C2, Class XW, IO, 0.737s, 2040 | | 1,053,169 | 19,953 |
| Ser. 07-C7, Class XW, IO, 0.526s, 2045 | | 2,975,847 | 41,758 |
|
| LB-UBS Commercial Mortgage Trust 144A | | | |
| Ser. 06-C7, Class XW, IO, 0.914s, 2038 | | 1,743,647 | 40,480 |
| Ser. 03-C5, Class XCL, IO, 0.291s, 2037 | | 1,226,385 | 19,712 |
| Ser. 05-C2, Class XCL, IO, 0.178s, 2040 | | 5,845,508 | 37,838 |
37
| | |
| MORTGAGE-BACKED SECURITIES (39.3%)* cont. | Principal amount | Value |
|
| LB-UBS Commercial Mortgage Trust 144A | | |
| Ser. 06-C7, Class XCL, IO, 0.138s, 2038 | $3,196,520 | $28,881 |
| Ser. 06-C1, Class XCL, IO, 0.129s, 2041 | 12,244,344 | 71,775 |
| Ser. 07-C2, Class XCL, IO, 0.09s, 2040 | 9,053,263 | 61,139 |
|
| Lehman Brothers Floating Rate Commercial Mortgage | | |
| Trust 144A FRB Ser. 04-LLFA, Class H, 1.401s, 2017 | 66,000 | 39,600 |
|
| Lehman Mortgage Trust | | |
| IFB Ser. 06-7, Class 1A9, 38.295s, 2036 | 58,879 | 57,374 |
| IFB Ser. 07-5, Class 4A3, 37.455s, 2037 | 126,297 | 121,476 |
| IFB Ser. 07-4, Class 3A2, IO, 6.763s, 2037 | 216,869 | 21,999 |
| IFB Ser. 06-5, Class 2A2, IO, 6.713s, 2036 | 449,928 | 45,303 |
| IFB Ser. 07-4, Class 2A2, IO, 6.233s, 2037 | 882,996 | 82,551 |
| IFB Ser. 06-9, Class 2A2, IO, 6.183s, 2037 | 634,122 | 58,808 |
| IFB Ser. 06-6, Class 1A3, IO, 6.063s, 2036 | 1,023,607 | 93,087 |
| IFB Ser. 07-5, Class 10A2, IO, 5.903s, 2037 | 422,826 | 37,437 |
|
| Mach One Commercial Mortgage Trust 144A Ser. 04-1A, | | |
| Class H, 6.452s, 2040 | 156,000 | 15,600 |
|
| MASTR Adjustable Rate Mortgages Trust | | |
| Ser. 04-03, Class 4AX, IO, 0.376s, 2034 | 124,256 | 457 |
| Ser. 05-2, Class 7AX, IO, 0.17s, 2035 | 376,053 | 743 |
|
| MASTR Alternative Loans Trust Ser. 06-3, Class 1A1, | | |
| 6 1/4s, 2036 | 219,004 | 119,426 |
|
| Merrill Lynch Capital Funding Corp. Ser. 06-4, | | |
| Class XC, IO, 0.148s, 2049 | 6,006,693 | 36,299 |
|
| Merrill Lynch Floating Trust 144A FRB Ser. 06-1, | | |
| Class TM, 0.951s, 2022 | 270,899 | 167,958 |
|
| Merrill Lynch Mortgage Investors, Inc. | �� | |
| FRB Ser. 98-C3, Class E, 6.986s, 2030 | 49,000 | 33,955 |
| FRB Ser. 05-A9, Class 3A1, 5.274s, 2035 | 309,245 | 236,755 |
|
| Merrill Lynch Mortgage Trust | | |
| FRB Ser. 07-C1, Class A3, 6.022s, 2050 | 118,000 | 80,118 |
| FRB Ser. 07-C1, Class A4, 6.022s, 2050 | 127,000 | 85,263 |
|
| Merrill Lynch/Countrywide Commercial | | |
| Mortgage Trust | | |
| FRB Ser. 07-8, Class A3, 6.156s, 2049 | 503,000 | 340,783 |
| FRB Ser. 07-8, Class A2, 6.119s, 2049 | 138,000 | 96,848 |
|
| Merrill Lynch/Countrywide Commercial Mortgage Trust | | |
| 144A Ser. 07-7, Class X, IO, 0.019s, 2050 | 16,802,113 | 34,181 |
|
| Mezz Cap Commercial Mortgage Trust Ser. 07-C5, | | |
| Class X, 4.867s, 2017 | 215,796 | 17,264 |
|
| Morgan Stanley Capital I | | |
| Ser. 98-CF1, Class E, 7.35s, 2032 | 256,000 | 147,987 |
| FRB Ser. 08-T29, Class A3, 6.458s, 2043 | 69,000 | 53,713 |
| FRB Ser. 06-IQ11, Class A4, 5.942s, 2042 | 317,000 | 221,131 |
| FRB Ser. 07-IQ14, Class AM, 5.877s, 2049 | 53,000 | 19,080 |
| Ser. 05-HQ6, Class A4A, 4.989s, 2042 | 183,000 | 143,454 |
| Ser. 04-HQ4, Class A7, 4.97s, 2040 | 151,000 | 132,095 |
|
| Morgan Stanley Capital I 144A | | |
| FRB Ser. 04-RR, Class F7, 6s, 2039 | 360,000 | 21,600 |
| Ser. 07-HQ13, Class X1, IO, 0.819s, 2044 F | 4,956,414 | 94,328 |
| Ser. 05-HQ5, Class X1, IO, 0.189s, 2042 F | 1,920,955 | 8,321 |
|
38
| | | |
| MORTGAGE-BACKED SECURITIES (39.3%)* cont. | Principal amount | Value |
|
| Morgan Stanley Mortgage Loan Trust Ser. 05-5AR, | | | |
| Class 2A1, 4.767s, 2035 F | | $305,100 | $152,550 |
|
| Mortgage Capital Funding, Inc. FRB Ser. 98-MC2, | | | |
| Class E, 7.186s, 2030 | | 78,000 | 50,700 |
|
| Nomura Asset Acceptance Corp. 144A Ser. 04-R2, | | | |
| Class PT, 9.087s, 2034 | | 31,695 | 30,188 |
|
| PNC Mortgage Acceptance Corp. 144A | | | |
| Ser. 00-C1, Class J, 6 5/8s, 2010 | | 100,000 | 32,335 |
| Ser. 00-C2, Class J, 6.22s, 2033 | | 76,000 | 38,977 |
|
| Residential Asset Securitization Trust | | | |
| IFB Ser. 07-A3, Class 2A2, IO, 6.253s, 2037 | | 865,671 | 81,191 |
| Ser. 07-A5, Class 2A3, 6s, 2037 | | 430,183 | 223,695 |
|
| Salomon Brothers Mortgage Securities VII 144A | | | |
| Ser. 02-KEY2, Class X1, IO, 0.73s, 2036 | | 656,064 | 20,994 |
|
| Structured Adjustable Rate Mortgage Loan Trust | | | |
| FRB Ser. 07-8, Class 1A2, 6 1/4s, 2037 | | 673,834 | 330,179 |
| FRB Ser. 06-9, Class 1A1, 5.675s, 2036 | | 120,853 | 56,806 |
| Ser. 05-9, Class AX, IO, 1.259s, 2035 | | 1,438,414 | 23,734 |
| Ser. 04-19, Class 2A1X, IO, 1.108s, 2035 | | 527,979 | 6,072 |
|
| Structured Asset Securities Corp. | | | |
| IFB Ser. 07-4, Class 1A3, IO, 5.815s, 2037 | | 1,512,612 | 114,807 |
| Ser. 07-4, Class 1A4, IO, 1s, 2037 | | 1,512,612 | 30,782 |
|
| Structured Asset Securities Corp. 144A Ser. 07-RF1, | | | |
| Class 1A, IO, 5.247s, 2037 | | 902,884 | 58,146 |
|
| Titan Europe PLC 144A | | | |
| FRB Ser. 05-CT2A, Class E, 7.095s, 2014 | | | |
| (United Kingdom) | GBP | 46,127 | 49,893 |
| FRB Ser. 05-CT1A, Class D, 7.095s, 2014 | | | |
| (United Kingdom) | GBP | 102,358 | 55,024 |
|
| Ursus EPC 144A FRB Ser. 1-A, Class D, 6.938s, 2012 | | | |
| (Ireland) | GBP | 54,725 | 20,272 |
|
| Wachovia Bank Commercial Mortgage Trust | | | |
| FRB Ser. 07-C33, Class A3, 6.1s, 2051 | | $395,000 | 284,330 |
| Ser. 07-C30, Class A3, 5.246s, 2043 | | 4,090,000 | 3,241,949 |
| Ser. 04-C15, Class A4, 4.803s, 2041 | | 226,000 | 196,707 |
| Ser. 07-C34, IO, 0.519s, 2046 | | 2,288,373 | 35,336 |
|
| Wachovia Bank Commercial Mortgage Trust 144A | | | |
| FRB Ser. 05-WL5A, Class L, 3.751s, 2018 | | 100,000 | 25,000 |
| Ser. 07-C31, IO, 0.435s, 2047 | | 8,197,146 | 79,264 |
| Ser. 06-C27, Class XC, IO, 0.124s, 2045 | | 3,522,164 | 17,131 |
|
| WAMU Commercial Mortgage Securities Trust 144A | | | |
| Ser. 05-C1A, Class G, 5.72s, 2036 F | | 87,000 | 18,086 |
| Ser. 06-SL1, Class X, IO, 1.181s, 2043 | | 425,924 | 11,905 |
| Ser. 07-SL2, Class X, IO, 0.85s, 2049 | | 1,323,396 | 32,754 |
|
| WAMU Mortgage Pass-Through Certificates 144A | | | |
| Ser. 04-RP1, Class 1S, IO, 5.15s, 2034 | | 516,646 | 34,775 |
|
| Total mortgage-backed securities (cost $48,806,210) | | | $44,446,968 |
39
| | | |
| CORPORATE BONDS AND NOTES (23.9%)* | Principal amount | Value |
|
| Basic materials (1.1%) | | | |
| Domtar Corp. company guaranty Ser. *, 7 7/8s, 2011 | | | |
| (Canada) | | $25,000 | $22,250 |
|
| Dow Chemical Co. (The) Pass Through Trust 144A | | | |
| company guaranty 4.027s, 2009 | | 165,000 | 160,512 |
|
| Freeport-McMoRan Copper & Gold, Inc. sr. sec. | | | |
| notes 6 7/8s, 2014 | | 55,000 | 54,450 |
|
| Freeport-McMoRan Copper & Gold, Inc. sr. unsec. | | | |
| notes 8 3/8s, 2017 | | 50,000 | 49,000 |
|
| International Paper Co. sr. unsec. notes 7.4s, 2014 | | 145,000 | 133,654 |
|
| Mosaic Co. (The) 144A sr. unsec. | | | |
| unsub. notes 7 5/8s, 2016 | | 60,000 | 60,300 |
|
| Potash Corp. of Saskatchewan, Inc. sr. unsec. | | | |
| notes 6 1/2s, 2019 (Canada) | | 59,000 | 61,315 |
|
| Potash Corp. of Saskatchewan, Inc. sr. unsec. | | | |
| notes 5 1/4s, 2014 (Canada) | | 16,000 | 16,396 |
|
| Rhodia SA 144A company guaranty unsec. | | | |
| sr. notes 4.185s, 2013 (France) | EUR | 645,000 | 564,521 |
|
| Rio Tinto Finance USA LTD company | | | |
| guaranty sr. unsec. notes 8.95s, 2014 | | | |
| (United Kingdom) | | $72,000 | 74,526 |
|
| | | | 1,196,924 |
| Capital goods (0.7%) | | | |
| Allied Waste North America, Inc. sec. notes Ser. B, | | | |
| 5 3/4s, 2011 | | 35,000 | 35,175 |
|
| Bombardier, Inc. 144A unsec. notes 6 3/4s, 2012 (Canada) | | 375,000 | 343,125 |
|
| Eaton Corp. notes 5.6s, 2018 | | 65,000 | 61,370 |
|
| Rexam PLC 144A bond 6 3/4s, 2013 (United Kingdom) | | 255,000 | 219,668 |
|
| United Technologies Corp. sr. unsec. notes 6 1/8s, 2038 | | 110,000 | 108,842 |
|
| United Technologies Corp. sr. unsec. notes 5 3/8s, 2017 | | 45,000 | 46,566 |
|
| | | | 814,746 |
| Communication services (2.1%) | | | |
| Ameritech Capital Funding company guaranty 6 1/4s, 2009 | | 100,000 | 100,127 |
|
| AT&T Wireless Services, Inc. sr. notes 8 3/4s, 2031 | | 31,000 | 35,484 |
|
| AT&T Wireless Services, Inc. sr. notes 7 7/8s, 2011 | | 385,000 | 417,480 |
|
| AT&T, Inc. sr. unsec. unsub. bonds 5 1/2s, 2018 | | 85,000 | 84,852 |
|
| Comcast Cable Communications company | | | |
| guaranty sr. unsub. notes 8 7/8s, 2017 | | 20,000 | 22,429 |
|
| Comcast Corp. company guaranty 5.9s, 2016 | | 155,000 | 154,779 |
|
| Comcast Corp. company guaranty sr. unsec. | | | |
| unsub. notes 6.95s, 2037 | | 75,000 | 74,057 |
|
| Cox Communications, Inc. 144A bonds 8 3/8s, 2039 | | 220,000 | 213,445 |
|
| Cox Communications, Inc. 144A notes 5 7/8s, 2016 | | 30,000 | 27,423 |
|
| Rogers Communications Inc. company | | | |
| guaranty notes 6.8s, 2018 (Canada) | | 80,000 | 83,300 |
|
| Rogers Wireless, Inc. sec. notes 6 3/8s, 2014 (Canada) | | 105,000 | 110,691 |
|
| Telefonica Emisones SAU company guaranty 6.221s, | | | |
| 2017 (Spain) | | 155,000 | 160,463 |
|
| Telefonica Europe BV company guaranty 7 3/4s, 2010 (Spain) | | 150,000 | 157,521 |
|
40
| | | |
| CORPORATE BONDS AND NOTES (23.9%)* cont. | Principal amount | Value |
|
| Communication services cont. | | | |
| Time Warner Cable, Inc. company | | | |
| guaranty sr. notes 7.3s, 2038 | | $105,000 | $105,585 |
|
| Time Warner Cable, Inc. company guaranty sr. unsec. | | | |
| 6 3/4s, 2018 | | 45,000 | 45,378 |
|
| Time Warner Cable, Inc. company guaranty sr. unsec. | | | |
| notes 7 1/2s, 2014 | | 25,000 | 26,947 |
|
| Verizon Communications, Inc. sr. unsec. notes 7.35s, 2039 | | 68,000 | 70,505 |
|
| Verizon Communications, Inc. sr. unsec. notes 6.35s, 2019 | | 27,000 | 28,054 |
|
| Verizon Communications, Inc. sr. unsec. | | | |
| unsub. notes 8 3/4s, 2018 | | 50,000 | 59,941 |
|
| Verizon Global Funding Corp. notes 7 3/4s, 2030 | | 110,000 | 115,920 |
|
| Verizon Wireless, Inc. 144A notes 5.55s, 2014 | | 220,000 | 230,786 |
|
| Wind Aquisition Finance SA notes 9 3/4s, 2015 | | | |
| (Netherlands) | EUR | 80,000 | 98,131 |
|
| | | | 2,423,298 |
| Conglomerates (0.1%) | | | |
| Honeywell International, Inc. sr. unsec. notes 5.3s, 2018 | | $50,000 | 51,327 |
|
| Honeywell International, Inc. sr. unsec. notes 5s, 2019 | | 20,000 | 20,277 |
|
| Tyco International Finance SA company | | | |
| guaranty sr. unsec. unsub. notes 8 1/2s, 2019 | | 30,000 | 32,089 |
|
| | | | 103,693 |
| Consumer cyclicals (2.7%) | | | |
| D.R. Horton, Inc. sr. notes 7 7/8s, 2011 | | 175,000 | 173,688 |
|
| DaimlerChrysler NA Holding Corp. company | | | |
| guaranty unsec. notes 7.2s, 2009 (Germany) | | 40,000 | 40,211 |
|
| DaimlerChrysler NA Holding Corp. company | | | |
| guaranty unsec. unsub. notes Ser. MTN, 5 3/4s, 2011 | | | |
| (Germany) | | 155,000 | 152,257 |
|
| Mohawk Industries, Inc. sr. unsec. notes 6 5/8s, 2016 | | 575,000 | 487,430 |
|
| News America, Inc. 144A company guaranty notes | | | |
| 6.9s, 2019 | | 245,000 | 237,753 |
|
| Pulte Homes, Inc. company guaranty 7 7/8s, 2011 | | 168,000 | 167,580 |
|
| Starwood Hotels & Resorts Worldwide, Inc. company | | | |
| guaranty 7 7/8s, 2012 | | 1,740,000 | 1,618,200 |
|
| Time Warner, Inc. company guaranty sr. unsec. | | | |
| notes FRN 1.461s, 2009 | | 40,000 | 39,731 |
|
| Time Warner, Inc. debs. 9 1/8s, 2013 | | 125,000 | 133,323 |
|
| Whirlpool Corp. sr. unsec. notes 8.6s, 2014 | | 15,000 | 15,370 |
|
| | | | 3,065,543 |
| Consumer staples (2.9%) | | | |
| Altria Group, Inc. company guaranty sr. unsec. | | | |
| unsub. notes 8 1/2s, 2013 | | 70,000 | 78,271 |
|
| Anheuser-Busch InBev Worldwide, Inc. 144A company | | | |
| guaranty sr. notes 8.2s, 2039 | | 50,000 | 50,101 |
|
| Cadbury Schweppes US Finance LLC 144A company | | | |
| guaranty sr. unsec. notes 5 1/8s, 2013 | | | |
| (United Kingdom) | | 560,000 | 546,729 |
|
| Campbell Soup Co. debs. 8 7/8s, 2021 | | 50,000 | 63,804 |
|
| Coca-Cola Co. (The) sr. unsec. unsub. notes 4 7/8s, 2019 | | 50,000 | 51,378 |
|
| ConAgra Foods, Inc. unsec. notes 7 7/8s, 2010 | | 70,000 | 73,504 |
|
| CVS Caremark, Corp. notes 6.6s, 2019 | | 80,000 | 85,215 |
|
41
| | |
| CORPORATE BONDS AND NOTES (23.9%)* cont. | Principal amount | Value |
|
| Consumer staples cont. | | |
| CVS Caremark, Corp. 144A pass-through certificates | | |
| 6.117s, 2013 | $57,906 | $59,105 |
|
| H.J. Heinz Co. sr. unsec. notes 5.35s, 2013 | 55,000 | 56,962 |
|
| McDonald’s Corp. sr. unsec. notes 5.7s, 2039 | 150,000 | 144,725 |
|
| Reynolds American, Inc. company guaranty 7 1/4s, 2013 | 1,705,000 | 1,673,244 |
|
| SABMiller PLC 144A notes 6 1/2s, 2018 | | |
| (United Kingdom) | 135,000 | 132,518 |
|
| Sara Lee Corp. sr. unsec. unsub. notes 6 1/4s, 2011 | 75,000 | 78,493 |
|
| Tesco PLC 144A sr. unsec. unsub. notes 6.15s, 2037 | | |
| (United Kingdom) | 160,000 | 149,403 |
|
| | | 3,243,452 |
| Energy (1.0%) | | |
| Amerada Hess Corp. unsub notes 6.65s, 2011 | 100,000 | 104,845 |
|
| ConocoPhillips notes 6 1/2s, 2039 | 85,000 | 84,216 |
|
| Devon Energy Corp. sr. notes 6.3s, 2019 | 20,000 | 20,701 |
|
| EnCana Corp. sr. unsec. notes 6 1/2s, 2019 (Canada) | 10,000 | 10,263 |
|
| EOG Resources, Inc. notes 6 7/8s, 2018 | 105,000 | 113,685 |
|
| Halliburton Co. sr. unsec. notes 7.45s, 2039 | 90,000 | 94,440 |
|
| Kerr-McGee Corp. sec. notes 6.95s, 2024 | 50,000 | 39,890 |
|
| Nexen, Inc. unsec. unsub. notes 6.4s, 2037 (Canada) | 15,000 | 10,914 |
|
| Petrobras International Finance Co. company | | |
| guaranty sr. unsec. notes 7 7/8s, 2019 (Brazil) | 110,000 | 118,250 |
|
| Petro-Canada sr. unsec. unsub. notes 6.05s, 2018 (Canada) | 30,000 | 27,322 |
|
| Weatherford International, Ltd. company | | |
| guaranty sr. unsec. notes 9 7/8s, 2039 | 175,000 | 171,744 |
|
| Williams Cos., Inc. (The) 144A sr. unsec. | | |
| notes 8 3/4s, 2020 | 90,000 | 92,475 |
|
| XTO Energy, Inc. sr. unsec. notes 6 3/4s, 2037 | 85,000 | 80,689 |
|
| XTO Energy, Inc. sr. unsec. notes 5 1/2s, 2018 | 55,000 | 52,625 |
|
| XTO Energy, Inc. sr. unsec. unsub. notes 6 1/2s, 2018 | 65,000 | 66,061 |
|
| | | 1,088,120 |
| Financials (4.4%) | | |
| American International Group, Inc. sr. unsec. | | |
| Ser. G, 5.85s, 2018 | 230,000 | 73,600 |
|
| Bank of New York Mellon Corp. (The) sr. unsec. | | |
| unsub. notes Ser. G, 4.95s, 2012 | 15,000 | 15,570 |
|
| BankAmerica Capital III bank guaranty jr. unsec. FRN | | |
| Ser. *, 1.701s, 2027 | 160,000 | 52,019 |
|
| Barclays Bank PLC 144A sub. bonds FRB 7.7s, 2049 | 330,000 | 199,650 |
|
| Bear Stearns Cos., Inc. (The) notes Ser. MTN, | | |
| 6.95s, 2012 | 115,000 | 121,073 |
|
| Bear Stearns Cos., Inc. (The) sr. unsec. | | |
| notes 7 1/4s, 2018 | 230,000 | 234,880 |
|
| Bosphorus Financial Services, Ltd. 144A | | |
| sr. notes FRN 3.034s, 2012 | 206,250 | 178,207 |
|
| Capital One Financial Corp. sr. unsec. | | |
| unsub. notes FRN Ser. MTN, 1.573s, 2009 | 60,000 | 58,788 |
|
| Chubb Corp. (The) sr. notes 6 1/2s, 2038 | 40,000 | 36,609 |
|
| CIT Group, Inc. sr. notes 5s, 2014 | 15,000 | 8,400 |
|
| Citigroup, Inc. sr. notes 6 1/2s, 2013 | 315,000 | 287,471 |
|
42
| | | |
| CORPORATE BONDS AND NOTES (23.9%)* cont. | Principal amount | Value |
|
| Financials cont. | | | |
| Citigroup, Inc. sr. unsec. unsub. notes FRN 1.424s, 2009 | | $105,000 | $104,743 |
|
| Citigroup, Inc. sub. notes 5s, 2014 | | 110,000 | 75,345 |
|
| Deutsche Bank AG/London notes 4 7/8s, 2013 (Germany) | | 330,000 | 327,708 |
|
| Duke Realty LP sr. unsec. notes 6 1/4s, 2013 | | 40,000 | 32,061 |
|
| Fleet Capital Trust V bank guaranty FRN 2.309s, 2028 | | 135,000 | 39,746 |
|
| General Electric Capital Corp. sr. unsec. FRN | | | |
| Ser. MTN, 1.174s, 2016 | | 145,000 | 98,849 |
|
| General Electric Capital Corp. sr. unsec. | | | |
| notes Ser. MTN, 6 7/8s, 2039 | | 150,000 | 118,385 |
|
| General Electric Capital Corp. 144A sub. notes FRN | | | |
| 4 5/8s, 2066 | EUR | 90,000 | 50,888 |
|
| Genworth Financial, Inc. sr. unsec. Ser. MTN, | | | |
| 6.515s, 2018 | | $540,000 | 156,600 |
|
| Goldman Sachs Group, Inc. (The) sr. notes | | | |
| 7 1/2s, 2019 | | 55,000 | 56,738 |
|
| Goldman Sachs Group, Inc. (The) sub. notes | | | |
| 6 3/4s, 2037 | | 30,000 | 22,270 |
|
| Health Care Property Investors, Inc. sr. unsec. | | | |
| notes 6s, 2017 | | 60,000 | 48,953 |
|
| HSBC Holdings PLC sub. notes 6 1/2s, 2037 | | | |
| (United Kingdom) | | 320,000 | 272,716 |
|
| JPMorgan Chase & Co. notes 6.4s, 2038 | | 30,000 | 29,228 |
|
| JPMorgan Chase & Co. sr. unsec. unsub. notes | | | |
| 6.3s, 2019 | | 80,000 | 78,723 |
|
| Liberty Mutual Group 144A company guaranty FRB | | | |
| 10 3/4s, 2058 | | 190,000 | 103,414 |
|
| Marsh & McLennan Cos., Inc. sr. unsec. notes | | | |
| 6 1/4s, 2012 | | 140,000 | 133,000 |
|
| Marsh & McLennan Cos., Inc. sr. unsec. notes | | | |
| 5 3/8s, 2014 | | 75,000 | 65,350 |
|
| Merrill Lynch & Co., Inc. jr. sub. bonds 7 3/4s, 2038 | | 80,000 | 54,638 |
|
| Merrill Lynch & Co., Inc. notes 5.45s, 2013 | | 125,000 | 111,065 |
|
| Merrill Lynch & Co., Inc. notes FRN Ser. MTN, | | | |
| 1.292s, 2011 | | 35,000 | 30,333 |
|
| MetLife Capital Trust X 144A collateral trust FRB | | | |
| 9 1/4s, 2068 | | 300,000 | 189,154 |
|
| Monumental Global Funding, Ltd. 144A notes | | | |
| 5 1/2s, 2013 | | 105,000 | 97,940 |
|
| Morgan Stanley & Co. sr. unsec. notes Ser. MTN, | | | |
| 5 3/4s, 2016 | | 100,000 | 92,154 |
|
| Nationwide Financial Services, Inc. notes | | | |
| 5 5/8s, 2015 | | 35,000 | 28,964 |
|
| Prudential Financial, Inc. sr. unsec. | | | |
| unsub. notes Ser. MTNB, 5.1s, 2014 | | 170,000 | 134,555 |
|
| Simon Property Group LP sr. unsec. notes | | | |
| 6 1/8s, 2018 R | | 80,000 | 66,050 |
|
| SLM Corp. notes Ser. MTNA, 4 1/2s, 2010 | | 90,000 | 78,509 |
|
| VTB Capital SA 144A notes 6 7/8s, 2018 (Russia) | | 459,000 | 368,348 |
|
| VTB Capital SA 144A sec. notes 6.609s, 2012 (Russia) | | 450,000 | 385,371 |
|
43
| | | |
| CORPORATE BONDS AND NOTES (23.9%)* cont. | Principal amount | Value |
|
| Financials cont. | | | |
| Wachovia Corp. sr. unsec. notes Ser. MTN, 5 1/2s, 2013 | | $105,000 | $102,940 |
|
| Wachovia Corp. sr. unsec. notes FRN Ser. MTNE, | | | |
| 1.411s, 2012 | | 35,000 | 30,773 |
|
| Wells Fargo Capital XV jr. sub. unsec. company | | | |
| guaranty FRN 9 3/4s, 2049 | | 105,000 | 88,200 |
|
| | | | 4,939,978 |
| Government (4.3%) | | | |
| European Investment Bank supranational bank | | | |
| bonds sr. unsec. 3 1/2s, 2014 (Luxembourg) | CHF | 700,000 | 660,666 |
|
| Norddeutsche Landesbank Girozentrale bonds Ser. 7, | | | |
| 5 3/4s, 2010 (Germany) | EUR | 1,500,000 | 2,090,557 |
|
| Oester Postspark Bawag foreign government | | | |
| guaranty Ser. EMTN, 3 1/4s, 2011 (Austria) | CHF | 2,375,000 | 2,133,738 |
|
| | | | 4,884,961 |
| Health care (0.9%) | | | |
| Aetna, Inc. sr. unsec. unsub. notes 6 3/4s, 2037 | | $200,000 | 174,261 |
|
| Eli Lilly & Co. sr. unsec. unsub. notes 5.95s, 2037 | | 45,000 | 45,293 |
|
| GlaxoSmith Kline Capital, Inc. company | | | |
| guaranty sr. notes 5.65s, 2018 | | 175,000 | 181,635 |
|
| Novartis Securities Investment, Ltd. company | | | |
| guaranty sr. unsec. notes 5 1/8s, 2019 | | 160,000 | 163,823 |
|
| Pfizer, Inc. sr. unsec. notes 7.2s, 2039 | | 141,000 | 154,922 |
|
| Pfizer, Inc. sr. unsec. notes 6.2s, 2019 | | 44,000 | 47,803 |
|
| Roche Holdings, Inc. 144A company | | | |
| guaranty sr. unsec. notes 7s, 2039 | | 90,000 | 97,101 |
|
| UnitedHealth Group, Inc. sr. unsec. notes 5.8s, 2036 | | 85,000 | 63,869 |
|
| WellPoint, Inc. notes 7s, 2019 | | 80,000 | 81,261 |
|
| | | | 1,009,968 |
| Technology (0.2%) | | | |
| Fiserv, Inc. sr. unsec. unsub. notes company | | | |
| guaranty 6.8s, 2017 | | 60,000 | 57,129 |
|
| Fiserv, Inc. sr. unsec. unsub. notes company | | | |
| guaranty 6 1/8s, 2012 | | 53,000 | 52,529 |
|
| Lexmark International Inc, sr. unsec. notes 5.9s, 2013 | | 105,000 | 94,889 |
|
| Xerox Corp. sr. unsec. notes 6.35s, 2018 | | 90,000 | 72,900 |
|
| Xerox Corp. sr. unsec. notes FRN 2.059s, 2009 | | 10,000 | 9,760 |
|
| | | | 287,207 |
| Transportation (0.2%) | | | |
| Burlington Northern Santa Fe Corp. sr. unsec. | | | |
| notes 7s, 2014 | | 10,000 | 10,765 |
|
| Canadian National Railway Co. sr. unsec. | | | |
| unsub. notes 5.55s, 2019 (Canada) | | 35,000 | 35,064 |
|
| Canadian National Railway Co. sr. unsec. | | | |
| unsub. notes 5.55s, 2018 (Canada) | | 25,000 | 25,311 |
|
| Union Pacific Corp. sr. unsec. notes 6 1/8s, 2020 | | 110,000 | 110,424 |
|
| United AirLines, Inc. pass-through certificates | | | |
| 6.636s, 2022 | | 46,552 | 31,422 |
|
| | | | 212,986 |
| Utilities and power (3.3%) | | | |
| American Water Capital Corp. sr. unsec. | | | |
| bonds 6.085s, 2017 | | 40,000 | 36,341 |
|
| Atmos Energy Corp. sr. unsec. sub. notes 8 1/2s, 2019 | | 85,000 | 88,003 |
|
44
| | | |
| CORPORATE BONDS AND NOTES (23.9%)* cont. | Principal amount | Value |
|
| Utilities and power cont. | | | |
| Beaver Valley II Funding debs. 9s, 2017 | | $95,000 | $93,363 |
|
| Bruce Mansfield Unit pass-through certificates | | | |
| 6.85s, 2034 | | 110,000 | 77,940 |
|
| CMS Energy Corp. unsub. notes 6.55s, 2017 | | 5,000 | 4,350 |
|
| Commonwealth Edison Co. 1st mtge. sec. bonds | | | |
| 5.8s, 2018 | | 70,000 | 66,623 |
|
| Consumers Energy Co. 1st mtge. sec. bond 6 1/8s, 2019 | | 120,000 | 120,434 |
|
| Dominion Resources, Inc. sr. unsec. | | | |
| unsub. notes Ser. 07-A, 6s, 2017 | | 215,000 | 217,514 |
|
| Duke Energy Corp. sr. unsec. notes 6 1/4s, 2018 | | 90,000 | 90,773 |
|
| Electricite de France 144A notes 6.95s, 2039 (France) | | 200,000 | 210,877 |
|
| Enterprise Products Operating, LLC company | | | |
| guaranty sr. notes 6 1/2s, 2019 | | 100,000 | 91,740 |
|
| Fortum OYJ sr. unsecd. notes Ser. 14, Class EMTN, | | | |
| 4 1/2s, 2016 (Finland) | EUR | 255,000 | 326,378 |
|
| Ipalco Enterprises, Inc. 144A sr. sec. notes | | | |
| 7 1/4s, 2016 | | $20,000 | 18,800 |
|
| ITC Holdings Corp. 144A sr. unsec. notes 6.05s, 2018 | | 125,000 | 114,435 |
|
| National Fuel Gas Co. notes 5 1/4s, 2013 | | 40,000 | 37,103 |
|
| Nevada Power Co. notes 6 1/2s, 2018 | | 195,000 | 188,107 |
|
| Oncor Electric Delivery Co. 144A 1st mtge. sec. bond | | | |
| 5.95s, 2013 | | 165,000 | 165,975 |
|
| Pacific Gas & Electric Co. sr. notes 8 1/4s, 2018 | | 30,000 | 35,709 |
|
| Pacific Gas & Electric Co. sr. unsec. | | | |
| unsub. notes 6 1/4s, 2039 | | 35,000 | 35,948 |
|
| Power Receivable Finance, LLC 144A sr. notes | | | |
| 6.29s, 2012 | | 48,840 | 47,828 |
|
| Public Service Co. of Colorado 1st mtge. sec. bond | | | |
| 5.8s, 2018 | | 70,000 | 74,233 |
|
| Public Service Co. of Colorado sr. notes Ser. A, | | | |
| 6 7/8s, 2009 | | 150,000 | 150,815 |
|
| Southern California Edison Co. 1st mtge. sr. sec. | | | |
| bond 5 1/2s, 2018 | | 80,000 | 83,998 |
|
| Spectra Energy Capital, LLC company | | | |
| guaranty sr. unsec. notes 5.9s, 2013 | | 140,000 | 136,610 |
|
| Spectra Energy Capital, LLC company | | | |
| guaranty sr. unsec. unsub. notes 6.2s, 2018 | | 75,000 | 67,336 |
|
| Texas-New Mexico Power Co. 144A 1st mtge. sec. | | | |
| 9 1/2s, 2019 | | 165,000 | 164,914 |
|
| TransCanada Pipelines, Ltd. sr. unsec. | | | |
| unsub. notes 6 1/2s, 2018 (Canada) | | 30,000 | 31,302 |
|
| Union Electric Co. 1st mtge. sr. sec. bond 6.7s, 2019 | | 45,000 | 44,600 |
|
| Veolia Environnement sr. unsub. notes Ser. EMTN, | | | |
| 5 3/8s, 2018 (France) | EUR | 505,000 | 638,935 |
|
| West Penn Power Co. 1st mtge. 5.95s, 2017 | | $170,000 | 152,547 |
|
| Westar Energy, Inc. 1st mtge. sec. bonds 8 5/8s, 2018 | | 145,000 | 158,851 |
|
| | | | 3,772,382 |
| Total corporate bonds and notes (cost $28,023,386) | | | $27,043,258 |
45
| | | |
| FOREIGN GOVERNMENT BONDS AND NOTES (14.6%)* | Principal amount/Units | Value |
|
| Abu Dhabi (Emirate of) 144A notes 5 1/2s, 2014 | AED | 325,000 | $327,672 |
|
| Austria (Republic of) notes Ser. EMTN, 3 3/8s, 2012 | CHF | 2,900,000 | 2,641,985 |
|
| Brazil (Federal Republic of) notes zero %, 2012 | BRL | 837 | 384,512 |
|
| Canada (Government of) bonds 5 3/4s, 2033 | CAD | 750,000 | 807,215 |
|
| Denmark (Kingdom of) bonds 6s, 2009 | DKK | 9,640,000 | 1,748,497 |
|
| France (Government of) bonds 4s, 2013 | EUR | 63 | 89 |
|
| Italy (Republic of) unsub. notes Ser. 11, Tranche 1, | | | |
| 3 1/8s, 2010 | CHF | 1,900,000 | 1,696,252 |
|
| Japan (Government of) 30 yr bonds Ser. 23, | | | |
| 2 1/2s, 2036 | JPY | 106,000,000 | 1,158,030 |
|
| Japan (Government of) CPI Linked bonds Ser. 12, | | | |
| 1.2s, 2017 | JPY | 46,754,400 | 412,839 |
|
| Japan (Government of) CPI Linked bonds Ser. 8, | | | |
| 1s, 2016 | JPY | 262,600,000 | 2,330,216 |
|
| Netherlands (Government of) bonds 5s, 2012 | EUR | 2,500,000 | 3,606,296 |
|
| Sweden (Government of) debs. Ser. 1041, 6 3/4s, 2014 | SEK | 3,585,000 | 537,636 |
|
| United Kingdom treasury bonds 4 1/4s, 2036 | GBP | 610,000 | 882,326 |
|
| Total foreign government bonds and notes (cost $15,047,660) | | | $16,533,565 |
|
| |
| ASSET-BACKED SECURITIES (6.5%)* | Principal amount | Value |
|
| Ace Securities Corp. FRB Ser. 06-OP2, Class A2C, | | | |
| 0.588s, 2036 | | $56,000 | $12,660 |
|
| BankAmerica Manufactured Housing Contract Trust | | | |
| Ser. 97-2, Class M, 6.9s, 2028 | | 19,000 | 16,910 |
|
| Bay View Auto Trust Ser. 05-LJ2, Class D, 5.27s, 2014 | | 82,000 | 69,546 |
|
| Bear Stearns Asset Backed Securities, Inc. FRB | | | |
| Ser. 04-FR3, Class M6, 3.688s, 2034 | | 25,622 | 14,916 |
|
| Bombardier Capital Mortgage Securitization Corp. | | | |
| Ser. 00-A, Class A4, 8.29s, 2030 | | 241,803 | 112,635 |
| Ser. 00-A, Class A2, 7.575s, 2030 | | 51,608 | 23,685 |
| Ser. 99-B, Class A-5, 7.44s, 2020 | | 147,905 | 60,641 |
| Ser. 99-B, Class A4, 7.3s, 2016 | | 146,647 | 62,857 |
| Ser. 99-B, Class A3, 7.18s, 2015 | | 234,131 | 102,128 |
|
| Conseco Finance Securitizations Corp. | | | |
| Ser. 02-2, Class A, IO, 8 1/2s, 2033 | | 258,097 | 20,127 |
| Ser. 00-4, Class A6, 8.31s, 2032 | | 666,110 | 341,381 |
| Ser. 00-5, Class A7, 8.2s, 2032 | | 192,000 | 121,413 |
| Ser. 00-1, Class A5, 8.06s, 2031 | | 120,838 | 70,927 |
| Ser. 00-4, Class A5, 7.97s, 2032 | | 41,413 | 24,998 |
| Ser. 00-5, Class A6, 7.96s, 2032 | | 87,433 | 57,889 |
| Ser. 01-4, Class A4, 7.36s, 2033 | | 222,813 | 173,043 |
| Ser. 00-6, Class A5, 7.27s, 2031 | | 29,244 | 21,398 |
| Ser. 01-1, Class A5, 6.99s, 2032 | | 333,355 | 237,990 |
| FRB Ser. 02-1, Class M1A, 2.56s, 2033 | | 418,000 | 149,219 |
|
| Countrywide Asset Backed Certificates FRB Ser. 04-6, | | | |
| Class 2A5, 0.828s, 2034 | | 80,690 | 53,278 |
|
| CS First Boston Mortgage Securities Corp. 144A | | | |
| Ser. 04-FR1N, Class A, 5s, 2034 (In default) † | | 11,121 | 222 |
|
| First Franklin Mortgage Loan Asset Backed | | | |
| Certificates FRB Ser. 06-FF7, Class 2A3, 0.588s, 2036 | | 87,000 | 29,953 |
|
46
| | | |
| ASSET-BACKED SECURITIES (6.5%)* cont. | Principal amount | Value |
|
| Fremont Home Loan Trust FRB Ser. 05-E, Class 2A4, | | | |
| 0.768s, 2036 | | $124,000 | $27,438 |
|
| Granite Mortgages PLC FRB Ser. 03-2, Class 2C1, 5.2s, 2043 F | EUR | 455,000 | 72,218 |
|
| Green Tree Financial Corp. | | | |
| Ser. 94-6, Class B2, 9s, 2020 | | $197,860 | 160,267 |
| Ser. 94-4, Class B2, 8.6s, 2019 | | 80,451 | 49,075 |
| Ser. 99-5, Class A5, 7.86s, 2030 | | 1,053,537 | 706,876 |
| Ser. 95-4, Class B1, 7.3s, 2025 | | 84,541 | 50,481 |
| Ser. 97-6, Class M1, 7.21s, 2029 | | 14,000 | 7,520 |
| Ser. 96-1, Class M1, 7s, 2027 | | 116,475 | 84,391 |
| Ser. 93-3, Class B, 6.85s, 2018 | | 4,346 | 2,535 |
| Ser. 98-3, Class A6, 6.76s, 2030 | | 233,504 | 167,442 |
| Ser. 99-3, Class A7, 6.74s, 2031 | | 252,298 | 217,148 |
| Ser. 99-1, Class A6, 6.37s, 2025 | | 22,000 | 18,729 |
| Ser. 99-1, Class A5, 6.11s, 2023 | | 21,441 | 20,865 |
|
| Greenpoint Manufactured Housing Ser. 00-3, Class IA, | | | |
| 8.45s, 2031 | | 887,960 | 607,940 |
|
| GS Auto Loan Trust 144A Ser. 04-1, Class D, 5s, 2011 | | 111,442 | 105,870 |
|
| Guggenheim Structured Real Estate Funding, Ltd. 144A | | | |
| FRB Ser. 05-1A, Class E, 2.238s, 2030 | | 56,488 | 11,298 |
|
| High Income Trust Securities 144A FRB Ser. 03-1A, | | | |
| Class A, 1.241s, 2036 | | 148,281 | 54,864 |
|
| Home Equity Asset Trust FRB Ser. 06-1, Class 2A4, | | | |
| 0.768s, 2036 | | 63,000 | 36,434 |
|
| Lehman XS Trust | | | |
| Ser. 07-6, Class 3A6, 6 1/2s, 2037 | | 1,055,707 | 619,629 |
| IFB Ser. 07-3, Class 4B, IO, 6.253s, 2037 | | 305,281 | 28,632 |
| FRB Ser. 07-6, Class 2A1, 0.648s, 2037 | | 542,321 | 164,811 |
|
| LNR CDO, Ltd. 144A FRB Ser. 02-1A, Class FFL, 3.19s, 2037 | | 300,000 | 60,000 |
|
| Local Insight Media Finance, LLC Ser. 07-1W, | | | |
| Class A1, 5.53s, 2012 F | | 365,235 | 158,877 |
|
| Long Beach Mortgage Loan Trust FRB Ser. 06-4, | | | |
| Class 2A4, 0.698s, 2036 | | 59,000 | 16,037 |
|
| Marriott Vacation Club Owner Trust 144A Ser. 04-1A, | | | |
| Class C, 5.265s, 2026 | | 12,211 | 9,064 |
|
| Merrill Lynch Mortgage Investors, Inc. Ser. 04-WMC3, | | | |
| Class B3, 5s, 2035 | | 9,884 | 446 |
|
| Morgan Stanley ABS Capital I FRB Ser. 04-HE8, | | | |
| Class B3, 3.638s, 2034 | | 16,317 | 1,131 |
|
| Novastar Home Equity Loan | | | |
| FRB Ser. 06-1, Class A2C, 0.598s, 2036 | | 74,000 | 36,736 |
| FRB Ser. 06-2, Class A2C, 0.588s, 2036 | | 74,000 | 26,693 |
|
| Oakwood Mortgage Investors, Inc. | | | |
| Ser. 96-C, Class B1, 7.96s, 2027 | | 82,218 | 30,421 |
| Ser. 99-D, Class A1, 7.84s, 2029 | | 196,582 | 106,154 |
| Ser. 00-A, Class A2, 7.765s, 2017 | | 29,366 | 15,751 |
| Ser. 00-D, Class A4, 7.4s, 2030 | | 309,000 | 160,781 |
| Ser. 02-B, Class A4, 7.09s, 2032 | | 80,121 | 50,853 |
| Ser. 01-D, Class A4, 6.93s, 2031 | | 170,908 | 100,819 |
47
| | | |
| ASSET-BACKED SECURITIES (6.5%)* cont. | Principal amount | Value |
|
| Oakwood Mortgage Investors, Inc. | | | |
| Ser. 98-A, Class M, 6.825s, 2028 | | $12,000 | $5,572 |
| Ser. 01-E, Class A4, 6.81s, 2031 | | 10,833 | 7,360 |
| Ser. 01-C, Class A2, 5.92s, 2017 | | 97,635 | 35,901 |
| Ser. 01-D, Class A3, 5.9s, 2022 | | 58,394 | 34,152 |
| Ser. 02-C, Class A1, 5.41s, 2032 | | 254,370 | 137,360 |
| Ser. 01-E, Class A2, 5.05s, 2019 | | 248,571 | 149,008 |
| Ser. 02-A, Class A2, 5.01s, 2020 | | 126,704 | 82,456 |
|
| Oakwood Mortgage Investors, Inc. 144A Ser. 01-B, | | | |
| Class A4, 7.21s, 2030 | | 53,172 | 38,047 |
|
| People’s Financial Realty Mortgage Securities Trust | | | |
| FRB Ser. 06-1, Class 1A2, 0.568s, 2036 | | 114,000 | 56,112 |
|
| Pillar Funding PLC 144A | | | |
| FRB Ser. 04-1A, Class C1, 2.32s, 2011 | | | |
| (United Kingdom) | | 120,000 | 115,166 |
| FRB Ser. 04-2A, Class C, 2.2s, 2011 (United Kingdom) | | 100,000 | 87,207 |
|
| SAIL Net Interest Margin Notes 144A Ser. 04-4A, | | | |
| Class B, 7 1/2s, 2034 (In default) † | | 30,709 | 614 |
|
| Securitized Asset Backed Receivables, LLC | | | |
| FRB Ser. 07-BR5, Class A2A, 0.568s, 2037 | | 131,643 | 81,619 |
| FRB Ser. 07-BR4, Class A2A, 0.528s, 2037 | | 117,880 | 72,210 |
|
| SG Mortgage Securities Trust FRB Ser. 06-OPT2, | | | |
| Class A3D, PO, 0.648s, 2036 | | 125,000 | 22,046 |
|
| Soundview Home Equity Loan Trust | | | |
| FRB Ser. 06-OPT3, Class 2A3, 0.608s, 2036 | | 59,000 | 25,097 |
| FRB Ser. 06-3, Class A3, 0.598s, 2036 | | 25,000 | 8,430 |
|
| Structured Asset Investment Loan Trust FRB | | | |
| Ser. 06-BNC2, Class A6, 0.698s, 2036 | | 59,000 | 1,666 |
|
| Structured Asset Receivables Trust 144A FRB | | | |
| Ser. 05-1, 1.602s, 2015 | | 384,931 | 219,411 |
|
| TIAA Real Estate CDO, Ltd. 144A FRB Ser. 02-1A, | | | |
| Class III, 7.6s, 2037 | | 188,000 | 52,640 |
|
| WAMU Asset-Backed Certificates FRB Ser. 07-HE2, | | | |
| Class 2A1, 0.548s, 2037 | | 748,718 | 406,179 |
|
| Total asset-backed securities (cost $12,306,173) | | | $7,404,295 |
|
| |
| PURCHASED OPTIONS | Expiration date/ | Contract | |
| OUTSTANDING (2.2%)* | strike price | amount | Value |
|
| Option on an interest rate swap with JPMorgan | | | |
| Chase Bank, N.A. for the right to pay a fixed | | | |
| rate of 5.03% versus the three month | | | |
| USD-LIBOR-BBA maturing on February 16, 2020. | Feb-10/5.03 | $6,600,000 | $46,085 |
|
| Option on an interest rate swap with JPMorgan | | | |
| Chase Bank, N.A. for the right to pay a fixed | | | |
| rate of 5.355% versus the three month | | | |
| USD-LIBOR-BBA maturing on November 12, 2019. | Nov-09/5.355 | 9,000,000 | 20,962 |
|
| Option on an interest rate swap with JPMorgan | | | |
| Chase Bank, N.A. for the right to receive a | | | |
| fixed rate of 5.03% versus the three month | | | |
| USD-LIBOR-BBA maturing on February 16, 2020. | Feb-10/5.03 | 6,600,000 | 902,748 |
|
48
| | | |
| PURCHASED OPTIONS | Expiration date/ | Contract | |
| OUTSTANDING (2.2%)* cont. | strike price | amount | Value |
|
| Option on an interest rate swap with JPMorgan | | | |
| Chase Bank, N.A. for the right to receive a | | | |
| fixed rate of 5.355% versus the three month | | | |
| USD-LIBOR-BBA maturing on November 12, 2019. | Nov-09/5.355 | $9,000,000 | $1,512,270 |
|
| Total purchased options outstanding (cost $1,289,296) | | | $2,482,065 |
|
| |
| SENIOR LOANS (0.7%)* c | Principal amount | Value |
|
| Basic materials (—%) | | | |
| Georgia-Pacific, LLC bank term loan FRN Ser. B, | | | |
| 3.258s, 2013 | | $16,696 | $15,502 |
|
| NewPage Holding Corp. bank term loan FRN 4.792s, 2014 | 20,483 | 15,800 |
|
| | | | 31,302 |
| Capital goods (0.1%) | | | |
| Hawker Beechcraft Acquisition Co., LLC bank term | | | |
| loan FRN 3.22s, 2014 | | 1,068 | 549 |
|
| Hawker Beechcraft Acquisition Co., LLC bank term | | | |
| loan FRN Ser. B, 2 3/4s, 2014 | | 18,803 | 9,662 |
|
| Polypore, Inc. bank term loan FRN Ser. B, 3.224s, 2014 | | 26,661 | 22,662 |
|
| Sequa Corp. bank term loan FRN 4.224s, 2014 | | 38,947 | 24,342 |
|
| Wesco Aircraft Hardware Corp. bank term loan FRN | | | |
| 2.77s, 2013 | | 27,000 | 22,221 |
|
| | | | 79,436 |
| Communication services (0.1%) | | | |
| Charter Communications, Inc. bank term loan FRN | | | |
| 2.974s, 2014 | | 26,663 | 22,404 |
|
| Intelsat Corp. bank term loan FRN Ser. B2, 2.989s, 2011 | | 8,885 | 8,078 |
|
| Intelsat Corp. bank term loan FRN Ser. B2-A, 2.989s, 2013 | 8,888 | 8,081 |
|
| Intelsat Corp. bank term loan FRN Ser. B2-C, 2.989s, 2013 | 8,885 | 8,078 |
|
| Level 3 Communications, Inc. bank term loan FRN | | | |
| 3.195s, 2014 | | 27,000 | 21,560 |
|
| MetroPCS Wireless, Inc. bank term loan FRN 3.213s, 2013 | 26,658 | 24,835 |
|
| TW Telecom, Inc. bank term loan FRN Ser. B, 3.224s, 2013 | 26,659 | 24,222 |
|
| West Corp. bank term loan FRN 2.834s, 2013 | | 26,727 | 22,443 |
|
| | | | 139,701 |
| Consumer cyclicals (0.3%) | | | |
| Allison Transmission, Inc. bank term loan FRN | | | |
| Ser. B, 3.219s, 2014 | | 26,106 | 18,622 |
|
| Aramark Corp. bank term loan FRN 2 7/8s, 2014 | | 1,613 | 1,467 |
|
| Aramark Corp. bank term loan FRN Ser. B, 2.849s, 2014 | | 25,387 | 23,096 |
|
| Cinemark USA, Inc. bank term loan FRN 2.724s, 2013 | | 13,381 | 12,444 |
|
| Dana Corp. bank term loan FRN 7 1/4s, 2015 | | 16,862 | 4,974 |
|
| Goodman Global Holdings, Inc. bank term loan FRN | | | |
| Ser. B, 6 1/2s, 2011 | | 20,265 | 17,610 |
|
| Goodyear Tire & Rubber Co. (The) bank term loan FRN | | | |
| 2.19s, 2010 | | 27,000 | 22,487 |
|
| Harrah’s Operating Co., Inc. bank term loan FRN | | | |
| Ser. B2, 4.09s, 2015 | | 26,730 | 18,934 |
|
49
| | |
| SENIOR LOANS (0.7%)* c cont. | Principal amount | Value |
|
| Consumer cyclicals cont. | | |
| Lear Corp. bank term loan FRN 3.205s, 2013 | $130,886 | $51,569 |
|
| Lender Processing Services, Inc. bank term loan FRN | | |
| Ser. B, 3.474s, 2014 | 49,500 | 47,891 |
|
| National Bedding Co. bank term loan FRN 2.457s, 2011 | 11,848 | 6,813 |
|
| Navistar Financial Corp. bank term loan FRN 4.385s, 2012 | 7,200 | 5,822 |
|
| Navistar International Corp. bank term loan FRN | | |
| 4.974s, 2012 | 19,800 | 16,010 |
|
| Univision Communications, Inc. bank term loan FRN | | |
| Ser. B, 2.768s, 2014 | 27,000 | 16,423 |
|
| VNU Group BV bank term loan FRN Ser. B, 2.469s, 2013 | | |
| (Netherlands) | 26,658 | 22,517 |
|
| Yankee Candle Co., Inc. bank term loan FRN 2.974s, 2014 | 15,154 | 12,568 |
|
| | | 299,247 |
| Consumer staples (—%) | | |
| Pinnacle Foods Holding Corp. bank term loan FRN | | |
| Ser. B, 3.474s, 2014 | 26,661 | 22,128 |
|
| Spectrum Brands, Inc. bank term loan FRN 2.916s, | | |
| 2013 (In default) † | 1,723 | 1,358 |
|
| Spectrum Brands, Inc. bank term loan FRN Ser. B1, | | |
| 7.019s, 2013 (In default) † | 25,019 | 19,727 |
|
| | | 43,213 |
| Government (—%) | | |
| Affinion Group, Inc. bank term loan FRN Ser. B, | | |
| 3.474s, 2013 | 26,736 | 23,260 |
|
| | | 23,260 |
| Health care (0.1%) | | |
| Health Management Associates, Inc. bank term loan | | |
| FRN 2.97s, 2014 | 25,271 | 21,828 |
|
| IASIS Healthcare Corp. bank term loan FRN Ser. DD, | | |
| 2.974s, 2014 | 6,424 | 5,666 |
|
| IASIS Healthcare, LLC/IASIS Capital Corp. bank term | | |
| loan FRN 2.974s, 2014 | 1,726 | 1,522 |
|
| IASIS Healthcare, LLC/IASIS Capital Corp. bank term | | |
| loan FRN Ser. B, 2.518s, 2014 | 18,564 | 16,374 |
|
| Sun Healthcare Group, Inc. bank term loan FRN | | |
| 2.724s, 2014 | 4,502 | 3,853 |
|
| Sun Healthcare Group, Inc. bank term loan FRN | | |
| Ser. B, 2.974s, 2014 | 30,351 | 25,975 |
|
| | | 75,218 |
| Technology (0.1%) | | |
| First Data Corp. bank term loan FRN Ser. B1, | | |
| 3.224s, 2014 | 26,662 | 19,416 |
|
| Freescale Semiconductor, Inc. bank term loan FRN | | |
| Ser. B, 2.724s, 2013 | 17,651 | 10,210 |
|
| SunGard Data Systems, Inc. bank term loan FRN | | |
| 2.974s, 2014 | 26,659 | 23,875 |
|
| Travelport bank term loan FRN Ser. B, 3.023s, 2013 | 10,786 | 7,176 |
|
| Travelport bank term loan FRN Ser. DD, 3.224s, 2013 | 16,010 | 10,807 |
|
| | | 71,484 |
50
| | |
| SENIOR LOANS (0.7%)* c cont. | Principal amount | Value |
|
| Utilities and power (—%) | | |
| Energy Future Holdings Corp. bank term loan FRN | | |
| Ser. B2, 3.97s, 2014 | $26,662 | $18,000 |
|
| NRG Energy, Inc. bank term loan FRN 2.72s, 2014 | 15,962 | 14,811 |
|
| NRG Energy, Inc. bank term loan FRN 1.12s, 2014 | 8,528 | 7,914 |
|
| | | 40,725 |
| Total senior loans (cost $987,969) | | $803,586 |
|
| |
| MUNICIPAL BONDS AND NOTES (0.2%)* | Principal amount | Value |
|
| CA State G.O. Bonds (Build America Bonds), 7 1/2s, | | |
| 4/1/34 | $100,000 | $103,559 |
|
| Tobacco Settlement Fin. Auth. of WVA Rev. Bonds, | | |
| Ser. A, 7.467s, 6/1/47 | 170,000 | 95,628 |
|
| Total municipal bonds and notes (cost $270,735) | | $199,187 |
|
| |
| SHORT-TERM INVESTMENTS (10.3%)* | Principal amount/shares | Value |
|
| Putnam Money Market Liquidity Fund e | 3,773,988 | $3,773,988 |
|
| SSgA Prime Money Market Fund i | 3,950,000 | 3,950,000 |
|
| U.S. Treasury Bills with effective yields ranging | | |
| from 0.45% to 0.48%, November 19, 2009 # | $176,000 | 175,383 |
|
| U.S. Treasury Cash Management Bills for an effective | | |
| yield of 0.88%, May 15, 2009 # | 3,785,000 | 3,783,705 |
|
| Total short-term investments (cost $11,683,227) | | $11,683,076 |
|
| |
| TOTAL INVESTMENTS | | |
|
| Total investments (cost $184,846,388) | | $177,353,901 |
Key to holding’s currency abbreviations
| |
| AED | United Arab Emirates Dirham |
| AUD | Australian Dollar |
| BRL | Brazilian Real |
| CAD | Canadian Dollar |
| CHF | Swiss Franc |
| DKK | Danish Krone |
| EUR | Euro |
| GBP | British Pound |
| JPY | Japanese Yen |
| MXN | Mexican Peso |
| PLN | Polish Zloty |
| SEK | Swedish Krona |
| USD / $ | United States Dollar |
* Percentages indicated are based on net assets of $113,168,069.
† Non-income-producing security.
# These securities, in part or in entirety, were pledged and segregated with the custodian or broker to cover margin requirements for futures contracts at April 30, 2009.
c Senior loans are exempt from registration under the Securities Act of 1933, as amended, but contain certain restrictions on resale and cannot be sold publicly. These loans pay interest at rates which adjust periodically. The interest rates shown for senior loans are the current interest rates at April 30, 2009. Senior loans are also subject to mandatory and/or optional prepayment which cannot be predicted. As a result, the remaining maturity may be substantially less than the stated maturity shown (Notes 1 and 6).
e See Note 5 to the financial statements regarding investments in Putnam Money Market Liquidity Fund.
51
F Is valued at fair value following procedures approved by the Trustees. Securities may be classified as a Level 2 or Level 3 for SFAS 157 disclosures based on the securities valuation inputs.
i Securities purchased with cash or received, that were pledged to the fund for collateral on certain derivative contracts (Note 1).
R Real Estate Investment Trust.
At April 30, 2009, liquid assets totaling $68,656,917 have been designated as collateral for open forward commitments, swap contracts, forward contracts and futures contracts.
Debt obligations are considered secured unless otherwise indicated.
144A after the name of an issuer represents securities exempt from registration under Rule 144A under the Securities Act of 1933, as amended. These securities may be resold in transactions exempt from registration, normally to qualified institutional buyers.
TBA after the name of a security represents to be announced securities (Note 1).
The rates shown on Floating Rate Bonds (FRB) and Floating Rate Notes (FRN) are the current interest rates at April 30, 2009.
The dates shown on debt obligations are the original maturity dates.
Inverse Floating Rate Bonds (IFB) are securities that pay interest rates that vary inversely to changes in the market interest rates. As interest rates rise, inverse floaters produce less current income. The interest rates shown are the current interest rates at April 30, 2009.
DIVERSIFICATION BY COUNTRY
Distribution of investments by country of risk at April 30, 2009 (as a percentage of Portfolio Value):
| | | | |
| United States | 84.0% | | Denmark | 1.0% |
| |
|
| Austria | 2.8 | | Italy | 1.0 |
| |
|
| Japan | 2.3 | | Canada | 0.9 |
| |
|
| Netherlands | 2.2 | | France | 0.8 |
| |
|
| United Kingdom | 1.5 | | Other | 2.0 |
| |
|
| Germany | 1.5 | | Total | 100.0% |
| | |
FORWARD CURRENCY CONTRACTS TO BUY at 4/30/09 (aggregate face value $65,859,071) (Unaudited)
| | | | | |
| | | | | | Unrealized |
| | | Aggregate | | Delivery | appreciation/ |
| | Value | face value | | date | (depreciation) |
|
| Australian Dollar | $6,687,888 | $6,539,373 | | 5/20/09 | $148,515 |
|
| British Pound | 4,055,904 | 4,053,872 | | 5/20/09 | 2,032 |
|
| Canadian Dollar | 85,116 | 85,438 | | 5/20/09 | (322) |
|
| Czech Koruna | 155,819 | 156,702 | | 5/20/09 | (883) |
|
| Euro | 27,637,687 | 28,071,571 | | 5/20/09 | (433,884) |
|
| Hungarian Forint | 137,837 | 133,863 | | 5/20/09 | 3,974 |
|
| Japanese Yen | 20,151,474 | 19,894,384 | | 5/20/09 | 257,090 |
|
| Malaysian Ringgit | 273,829 | 271,220 | | 5/20/09 | 2,609 |
|
| Mexican Peso | 316,906 | 319,484 | | 5/20/09 | (2,578) |
|
| Norwegian Krone | 2,277,271 | 2,266,246 | | 5/20/09 | 11,025 |
|
| Polish Zloty | 751,483 | 744,288 | | 5/20/09 | 7,195 |
|
| Singapore Dollar | 229,849 | 225,766 | | 5/20/09 | 4,083 |
|
| South African Rand | 472,279 | 439,454 | | 5/20/09 | 32,825 |
|
| South Korean Won | 978,340 | 936,456 | | 5/20/09 | 41,884 |
|
| Swedish Krona | 1,141,906 | 1,131,874 | | 5/20/09 | 10,032 |
|
| Swiss Franc | 200,261 | 201,062 | | 5/20/09 | (801) |
|
| Taiwan Dollar | 395,194 | 388,018 | | 5/20/09 | 7,176 |
|
| Total | | | | | $89,972 |
52
FORWARD CURRENCY CONTRACTS TO SELL at 4/30/09 (aggregate face value $26,064,657) (Unaudited)
| | | | | |
| | | | | | Unrealized |
| | | Aggregate | | Delivery | appreciation/ |
| | Value | face value | | date | (depreciation) |
|
| Australian Dollar | $750,582 | $735,464 | | 5/20/09 | $(15,118) |
|
| Brazilian Real | 362,049 | 351,386 | | 5/20/09 | (10,663) |
|
| British Pound | 880,878 | 880,829 | | 5/20/09 | (49) |
|
| Canadian Dollar | 2,709,341 | 2,614,929 | | 5/20/09 | (94,412) |
|
| Czech Koruna | 374,057 | 375,794 | | 5/20/09 | 1,737 |
|
| Danish Krone | 1,195,204 | 1,210,435 | | 5/20/09 | 15,231 |
|
| Euro | 6,284,354 | 6,377,201 | | 5/20/09 | 92,847 |
|
| Norwegian Krone | 963,145 | 959,522 | | 5/20/09 | (3,623) |
|
| Polish Zloty | 156,923 | 155,301 | | 5/20/09 | (1,622) |
|
| South African Rand | 197,642 | 184,428 | | 5/20/09 | (13,214) |
|
| Swedish Krona | 1,942,398 | 1,933,262 | | 5/20/09 | (9,136) |
|
| Swiss Franc | 10,259,268 | 10,286,106 | | 5/20/09 | 26,838 |
|
| Total | | | | | $(11,184) |
FUTURES CONTRACTS OUTSTANDING at 4/30/09 (Unaudited)
| | | | | |
| | | | | | Unrealized |
| Number of | | | Expiration | appreciation/ |
| contracts | Value | | date | (depreciation) |
|
| Australian Government Treasury Bond | | | | | |
| 10 yr (Long) | 4 | $2,087,340 | | Jun-09 | $(6,247) |
|
| Canadian Government Bond 10 yr (Long) | 5 | 519,328 | | Jun-09 | (9,116) |
|
| Euro-Bobl 5 yr (Short) | 25 | 3,845,027 | | Jun-09 | (8,868) |
|
| Euro-Bund 10 yr (Short) | 61 | 9,911,709 | | Jun-09 | (241) |
|
| Euro-Buxl 30 yr Bond (Long) | 12 | 1,562,676 | | Jun-09 | 3,143 |
|
| Euro-Dollar 90 day (Short) | 15 | 3,714,563 | | Jun-09 | (69,891) |
|
| Euro-Dollar 90 day (Short) | 43 | 10,643,038 | | Sep-09 | (218,580) |
|
| Euro-Dollar 90 day (Short) | 80 | 19,761,000 | | Dec-09 | (404,888) |
|
| Euro-Dollar 90 day (Short) | 3 | 740,063 | | Mar-10 | (17,671) |
|
| Euro-Euribor Interest Rate 90 day (Long) | 13 | 4,217,164 | | Dec-10 | 15,886 |
|
| Euro-Euribor Interest Rate 90 day (Long) | 20 | 6,504,521 | | Sep-10 | 19,709 |
|
| Euro-Euribor Interest Rate 90 day (Short) | 17 | 5,555,049 | | Dec-09 | (23,694) |
|
| Euro-Euribor Interest Rate 90 day (Short) | 20 | 6,545,630 | | Sep-09 | (22,527) |
|
| Euro-Schatz 2 yr (Short) | 110 | 15,762,091 | | Jun-09 | (57,970) |
|
| Japanese Government Bond | | | | | |
| 10 yr Mini (Long) | 20 | 2,774,220 | | Jun-09 | (15,930) |
|
| Sterling 90 day (Long) | 3 | 542,802 | | Sep-10 | (878) |
|
| Sterling Interest Rate 90 day (Short) | 3 | 548,136 | | Sep-09 | (360) |
|
| U.K. Gilt 10 yr (Long) | 23 | 4,109,939 | | Jun-09 | (87,507) |
|
| U.S. Treasury Bond 20 yr (Long) | 27 | 3,309,188 | | Jun-09 | (138,262) |
|
| U.S. Treasury Note 2 yr (Long) | 17 | 3,698,297 | | Jun-09 | 6,875 |
|
| U.S. Treasury Note 5 yr (Short) | 99 | 11,596,922 | | Jun-09 | (16,265) |
|
| U.S. Treasury Note 10 yr (Short) | 5 | 604,688 | | Jun-09 | 3,893 |
|
| Total | | | | | $(1,049,389) |
53
WRITTEN OPTIONS OUTSTANDING at 4/30/09 (premiums received $1,660,532) (Unaudited)
| | | | |
| | Contract | | Expiration date/ | |
| | amount | | strike price | Value |
|
| Option on an interest rate swap with JPMorgan Chase | | | | |
| Bank, N.A. for the obligation to pay a fixed rate of 4.40% | | | | |
| versus the three month USD-LIBOR-BBA maturing on | | | | |
| November 9, 2019. | $14,966,000 | | Nov-09/4.40 | $1,401,267 |
|
| Option on an interest rate swap with JPMorgan Chase | | | | |
| Bank, N.A. for the obligation to pay a fixed rate of 5.51% | | | | |
| versus the three month USD-LIBOR-BBA maturing on | | | | |
| May 14, 2022. | 3,954,500 | | May-12/5.51 | 558,257 |
|
| Option on an interest rate swap with JPMorgan Chase | | | | |
| Bank, N.A. for the obligation to receive a fixed rate of | | | | |
| 4.40% versus the three month USD-LIBOR-BBA maturing | | | | |
| on November 9, 2019. | 14,966,000 | | Nov-09/4.40 | 126,180 |
|
| Option on an interest rate swap with JPMorgan Chase | | | | |
| Bank, N.A. for the obligation to receive a fixed rate of | | | | |
| 5.51% versus the three month USD-LIBOR-BBA maturing on | | | |
| May 14, 2022. | 3,954,500 | | May-12/5.51 | 95,778 |
|
| Total | | | | $2,181,482 |
TBA SALE COMMITMENTS OUTSTANDING at 4/30/09 (proceeds receivable $8,225,625) (Unaudited)
| | | | |
| | Principal | | Settlement | |
| Agency | amount | | date | Value |
|
| FNMA, 5s, May 1, 2039 | $8,000,000 | | 5/12/09 | $8,228,125 |
|
| Total | | | | $8,228,125 |
INTEREST RATE SWAP CONTRACTS OUTSTANDING at 4/30/09 (Unaudited)
| | | | | | | |
| | Upfront | | | Payments | Payments | Unrealized |
| Swap counterparty / | premium | Termination | | made by | received by | appreciation/ |
| Notional amount | received (paid) | date | | fund per annum | fund per annum | (depreciation) |
|
| Bank of America, N.A. | | | | | | |
| $4,142,000 | $— | 5/23/10 | | 3 month USD- | | |
| | | | | LIBOR-BBA | 3.155% | $136,546 |
|
| 5,900,000 | — | 7/18/13 | | 4.14688% | 3 month USD- | |
| | | | | | LIBOR-BBA | (493,453) |
|
| 1,000,000 | — | 7/29/18 | | 3 month USD- | | |
| | | | | LIBOR-BBA | 4.75% | 141,080 |
|
| 3,598,000 | — | 8/26/18 | | 3 month USD- | | |
| | | | | LIBOR-BBA | 4.54375% | 425,038 |
|
| 48,160,000 | — | 9/10/10 | | 3 month USD- | | |
| | | | | LIBOR-BBA | 3.22969% | 1,429,908 |
|
| 6,774,000 | — | 9/18/38 | | 4.36125% | 3 month USD- | |
| | | | | | LIBOR-BBA | (925,530) |
|
| 83,132,000 | — | 9/18/10 | | 3 month USD- | | |
| | | | | LIBOR-BBA | 2.86667% | 2,007,576 |
|
| 2,000,000 | — | 9/19/18 | | 3 month USD- | | |
| | | | | LIBOR-BBA | 4.07% | 152,513 |
|
| 1,222,000 | (3,814) | 10/1/18 | | 4.30% | 3 month USD- | |
| | | | | | LIBOR-BBA | (119,485) |
|
| 3,364,000 | (14,175) | 10/8/38 | | 3 month USD- | | |
| | | | | LIBOR-BBA | 4.30% | 403,089 |
|
| 1,867,000 | (705) | 10/20/18 | | 4.60% | 3 month USD- | |
| | | | | | LIBOR-BBA | (221,454) |
|
54
INTEREST RATE SWAP CONTRACTS OUTSTANDING at 4/30/09 (Unaudited) cont.
| | | | | | | |
| | | Upfront | | | Payments | Payments | Unrealized |
| Swap counterparty / | premium | Termination | | made by | received by | appreciation/ |
| Notional amount | received (paid) | date | | fund per annum | fund per annum | (depreciation) |
|
| Bank of America, N.A. cont. | | | | | |
| | $885,000 | $(805) | 10/20/10 | | 3.00% | 3 month USD- | |
| | | | | | | LIBOR-BBA | $(23,708) |
|
| | 8,981,000 | — | 10/26/12 | | 4.6165% | 3 month USD- | |
| | | | | | | LIBOR-BBA | (761,693) |
|
| | 4,436,000 | — | 5/19/10 | | 3.2925% | 3 month USD- | |
| | | | | | | LIBOR-BBA | (155,785) |
|
| | 6,373,000 | — | 7/22/10 | | 3 month USD- | | |
| | | | | | LIBOR-BBA | 3.5375% | 243,057 |
|
| | 2,580,000 | — | 5/8/28 | | 4.95% | 3 month USD- | |
| | | | | | | LIBOR-BBA | (545,437) |
|
| Barclays Bank PLC | | | | | | |
| | 9,735,000 | — | 12/9/20 | | 3 month USD- | | |
| | | | | | LIBOR-BBA | 2.91875% | (322,590) |
|
| Citibank, N.A. | | | | | | |
| JPY | 222,000,000 | — | 9/11/16 | | 1.8675% | 6 month JPY- | |
| | | | | | | LIBOR-BBA | (122,283) |
|
| MXN | 12,100,000 F | — | 7/18/13 | | 1 month MXN- | | |
| | | | | | TIIE-BANXICO | 9.175% | 92,594 |
|
| MXN | 3,630,000 F | — | 7/22/13 | | 1 month MXN- | | |
| | | | | | TIIE-BANXICO | 9.21% | 28,631 |
|
| AUD | 700,000 E | — | 9/11/18 | | 6.1% | 6 month AUD- | |
| | | | | | | BBR-BBSW | (3,828) |
|
| | $1,730,000 | — | 9/16/10 | | 3.175% | 3 month USD- | |
| | | | | | | LIBOR-BBA | (49,707) |
|
| | 27,682,000 | — | 9/17/13 | | 3 month USD- | | |
| | | | | | LIBOR-BBA | 3.4975% | 1,333,724 |
|
| | 6,548,000 | — | 9/18/38 | | 4.45155% | 3 month USD- | |
| | | | | | | LIBOR-BBA | (1,003,334) |
|
| | 40,458,000 | — | 9/18/10 | | 3 month USD- | | |
| | | | | | LIBOR-BBA | 2.92486% | 1,014,039 |
|
| | 23,214,000 | — | 2/24/16 | | 2.77% | 3 month USD- | |
| | | | | | | LIBOR-BBA | 127,308 |
|
| | 3,678,000 | — | 3/25/19 | | 2.95% | 3 month USD- | |
| | | | | | | LIBOR-BBA | 81,270 |
|
| | 7,224,000 | — | 3/27/14 | | 3 month USD- | | |
| | | | | | LIBOR-BBA | 2.335% | (61,390) |
|
| MXN | 6,500,000 E | — | 3/28/13 | | 1 month MXN- | | |
| | | | | | TIIE-BANXICO | 6.9425% | 574 |
|
| | $1,938,000 | — | 4/6/39 | | 3.295% | 3 month USD- | |
| | | | | | | LIBOR-BBA | 118,473 |
|
| | 3,225,000 | — | 4/15/19 | | 3.065% | 3 month USD- | |
| | | | | | | LIBOR-BBA | 43,572 |
|
| | 5,414,000 | — | 4/29/19 | | 3 month USD- | | |
| | | | | | LIBOR-BBA | 3.05% | (84,399) |
|
| Citibank, N.A., London | | | | | | |
| JPY | 530,000,000 | — | 2/10/16 | | 6 month JPY- | | |
| | | | | | LIBOR-BBA | 1.755% | 250,230 |
|
55
INTEREST RATE SWAP CONTRACTS OUTSTANDING at 4/30/09 (Unaudited) cont.
| | | | | | | |
| | | Upfront | | | Payments | Payments | Unrealized |
| Swap counterparty / | premium | Termination | | made by | received by | appreciation/ |
| Notional amount | received (paid) | date | | fund per annum | fund per annum | (depreciation) |
|
| Credit Suisse International | | | | | |
| | $16,626,000 | $— | 9/18/10 | | 3 month USD- | | |
| | | | | | LIBOR-BBA | 2.91916% | $415,271 |
|
| | 3,527,000 | — | 9/23/10 | | 3 month USD- | | |
| | | | | | LIBOR-BBA | 3.32% | 109,285 |
|
| | 9,069,000 | — | 10/9/10 | | 3 month USD- | | |
| | | | | | LIBOR-BBA | 2.81% | 211,896 |
|
| | 20,955,000 | 14,701 | 10/31/13 | | 3.80% | 3 month USD- | |
| | | | | | | LIBOR-BBA | (1,216,126) |
|
| | 10,660,000 | 10,134 | 10/31/18 | | 4.35% | 3 month USD- | |
| | | | | | | LIBOR-BBA | (1,022,628) |
|
| | 4,740,000 | (50,663) | 12/10/38 | | 2.69% | 3 month USD- | |
| | | | | | | LIBOR-BBA | 728,029 |
|
| | 13,660,000 | 89,944 | 12/10/28 | | 3 month USD- | | |
| | | | | | LIBOR-BBA | 2.81% | (1,318,691) |
|
| | 6,050,000 | — | 6/30/38 | | 2.71% | 3 month USD- | |
| | | | | | | LIBOR-BBA | 963,925 |
|
| | 3,207,000 | — | 1/16/19 | | 3 month USD- | | |
| | | | | | LIBOR-BBA | 2.32% | (221,767) |
|
| | 12,386,000 | — | 1/22/14 | | 2.03719% | 3 month USD- | |
| | | | | | | LIBOR-BBA | 189,418 |
|
| | 3,215,000 | — | 2/5/14 | | 2.475% | 3 month USD- | |
| | | | | | | LIBOR-BBA | (5,400) |
|
| | 1,047,000 | — | 2/5/29 | | 3 month USD- | | |
| | | | | | LIBOR-BBA | 3.35% | (31,442) |
|
| SEK | 16,940,000 | — | 4/7/14 | | 2.735% | 3 month SEK- | |
| | | | | | | STIBOR-SIDE | (11,976) |
|
| CHF | 8,430,000 | — | 11/17/11 | | 2.5125% | 6 month CHF- | |
| | | | | | | LIBOR-BBA | (276,145) |
|
| | $1,730,000 | — | 4/28/39 | | 3.50375% | 3 month USD- | |
| | | | | | | LIBOR-BBA | 41,256 |
|
| CHF | 3,190,000 | — | 4/29/11 | | 6 month CHF- | | |
| | | | | | LIBOR-BBA | 0.83% | 1,418 |
|
| CHF | 690,000 | — | 4/29/19 | | 2.3875% | 6 month CHF- | |
| | | | | | | LIBOR-BBA | 4,762 |
|
| EUR | 2,150,000 | — | 4/29/11 | | 1.8725% | 6 month EUR- | |
| | | | | | | EURIBOR- | |
| | | | | | | REUTERS | (4,208) |
|
| EUR | 490,000 | — | 4/29/19 | | 6 month EUR- | | |
| | | | | | EURIBOR- | | |
| | | | | | REUTERS | 3.43% | 34 |
|
| SEK | 16,940,000 E | — | 5/4/14 | | 3 month SEK- | | |
| | | | | | STIBOR-SIDE | 2.625% | (4,143) |
|
| EUR | 1,590,000 E | — | 5/4/14 | | 2.685% | 6 month EUR- | |
| | | | | | | EURIBOR- | |
| | | | | | | REUTERS | 1,371 |
|
56
INTEREST RATE SWAP CONTRACTS OUTSTANDING at 4/30/09 (Unaudited) cont.
| | | | | | | |
| | Upfront | | | Payments | Payments | Unrealized |
| Swap counterparty / | premium | Termination | | made by | received by | appreciation/ |
| Notional amount | received (paid) | date | | fund per annum | fund per annum | (depreciation) |
|
| Deutsche Bank AG | | | | | | |
| $10,402,000 | $— | 4/21/14 | | 2.51% | 3 month USD- | |
| | | | | | LIBOR-BBA | $17,568 |
|
| 3,895,000 | — | 4/30/19 | | 3.145% | 3 month USD- | |
| | | | | | LIBOR-BBA | 28,751 |
|
| 2,298,000 | — | 9/23/38 | | 4.75% | 3 month USD- | |
| | | | | | LIBOR-BBA | (477,558) |
|
| 3,412,000 | — | 10/17/18 | | 4.585% | 3 month USD- | |
| | | | | | LIBOR-BBA | (399,990) |
|
| 47,500,000 | — | 11/25/13 | | 3 month USD- | | |
| | | | | LIBOR-BBA | 2.95409% | 1,533,128 |
|
| 7,586,000 | — | 11/28/13 | | 3 month USD- | | |
| | | | | LIBOR-BBA | 2.8725% | 213,619 |
|
| 12,606,000 | — | 12/11/18 | | 3 month USD- | | |
| | | | | LIBOR-BBA | 2.94% | (157,651) |
|
| 3,595,000 | — | 12/15/18 | | 3 month USD- | | |
| | | | | LIBOR-BBA | 2.80776% | (87,968) |
|
| 2,083,000 | — | 12/16/28 | | 3 month USD- | | |
| | | | | LIBOR-BBA | 2.845% | (205,005) |
|
| 3,822,000 | — | 12/19/10 | | 3 month USD- | | |
| | | | | LIBOR-BBA | 1.53429% | 23,273 |
|
| 2,000,000 | — | 12/22/13 | | 2.008% | 3 month USD- | |
| | | | | | LIBOR-BBA | 29,708 |
|
| 1,345,000 | — | 12/24/13 | | 2.165% | 3 month USD- | |
| | | | | | LIBOR-BBA | 10,065 |
|
| 6,046,000 | — | 12/30/13 | | 2.15633% | 3 month USD- | |
| | | | | | LIBOR-BBA | 50,105 |
|
| 4,679,000 | — | 1/9/14 | | 3 month USD- | | |
| | | | | LIBOR-BBA | 2.165% | (39,336) |
|
| 3,351,000 | — | 1/13/19 | | 3 month USD- | | |
| | | | | LIBOR-BBA | 2.52438% | (171,084) |
|
| 2,954,000 | — | 1/20/19 | | 3 month USD- | | |
| | | | | LIBOR-BBA | 2.347% | (198,283) |
|
| 3,116,000 | — | 1/22/29 | | 3 month USD- | | |
| | | | | LIBOR-BBA | 2.8875% | (292,544) |
|
| 2,477,000 | — | 1/22/14 | | 2.055% | 3 month USD- | |
| | | | | | LIBOR-BBA | 35,778 |
|
| 5,244,000 | — | 1/28/29 | | 3 month USD- | | |
| | | | | LIBOR-BBA | 3.1785% | (270,739) |
|
| 12,620,000 | — | 1/30/11 | | 3 month USD- | | |
| | | | | LIBOR-BBA | 1.45% | 64,190 |
|
| 52,041,000 | — | 2/3/14 | | 2.44% | 3 month USD- | |
| | | | | | LIBOR-BBA | (14,165) |
|
| 21,426,000 | — | 2/3/24 | | 3 month USD- | | |
| | | | | LIBOR-BBA | 3.27% | (532,199) |
|
| 3,306,000 | — | 2/5/29 | | 3 month USD- | | |
| | | | | LIBOR-BBA | 3.324% | (111,850) |
|
| 9,251,000 | — | 2/5/14 | | 2.44661% | 3 month USD- | |
| | | | | | LIBOR-BBA | (3,068) |
|
57
INTEREST RATE SWAP CONTRACTS OUTSTANDING at 4/30/09 (Unaudited) cont.
| | | | | | | |
| | Upfront | | | Payments | Payments | Unrealized |
| Swap counterparty / | premium | Termination | | made by | received by | appreciation/ |
| Notional amount | received (paid) | date | | fund per annum | fund per annum | (depreciation) |
|
| Deutsche Bank AG cont. | | | | | |
| $28,569,000 | $— | 2/6/14 | | 2.5529% | 3 month USD- | |
| | | | | | LIBOR-BBA | $(151,831) |
|
| 10,509,000 | — | 2/6/29 | | 3 month USD- | | |
| | | | | LIBOR-BBA | 3.42575% | (200,139) |
|
| 1,000,000 | — | 2/6/14 | | 2.5675% | 3 month USD- | |
| | | | | | LIBOR-BBA | (6,009) |
|
| 18,943,000 | — | 2/10/14 | | 2.5825% | 3 month USD- | |
| | | | | | LIBOR-BBA | (121,657) |
|
| 6,027,000 | — | 2/10/29 | | 3 month USD- | | |
| | | | | LIBOR-BBA | 3.4725% | (75,369) |
|
| 6,549,000 | — | 2/25/14 | | 2.4675% | 3 month USD- | |
| | | | | | LIBOR-BBA | 792 |
|
| 1,000,000 | — | 3/10/16 | | 3 month USD- | | |
| | | | | LIBOR-BBA | 2.845% | (1,947) |
|
| 153,000,000 | — | 3/16/11 | | 1.6725% | 3 month USD- | |
| | | | | | LIBOR-BBA | (749,363) |
|
| 75,000,000 | — | 3/16/16 | | 3 month USD- | | |
| | | | | LIBOR-BBA | 2.85% | (161,563) |
|
| 19,000,000 | — | 3/16/29 | | 3.29% | 3 month USD- | |
| | | | | | LIBOR-BBA | 792,189 |
|
| 46,139,000 | — | 3/20/11 | | 3 month USD- | | |
| | | | | LIBOR-BBA | 1.43% | 1,827 |
|
| 19,600,000 | — | 3/23/11 | | 3 month USD- | | |
| | | | | LIBOR-BBA | 1.45% | 10,612 |
|
| 63,000,000 | — | 3/30/14 | | 2.36% | 3 month USD- | |
| | | | | | LIBOR-BBA | 480,235 |
|
| 29,000,000 | — | 3/30/21 | | 3 month USD- | | |
| | | | | LIBOR-BBA | 3.125% | (678,427) |
|
| 5,334,000 | — | 4/8/19 | | 3.115% | 3 month USD- | |
| | | | | | LIBOR-BBA | 46,240 |
|
| 2,936,000 | — | 4/14/19 | | 3 month USD- | | |
| | | | | LIBOR-BBA | 3.037% | (46,693) |
|
| 1,480,000 E | — | 4/17/39 | | 3.66904% | 3 month USD- | |
| | | | | | LIBOR-BBA | 46,561 |
|
| EUR | 3,272,500 E | — | 4/23/24 | | 6 month EUR- | | |
| | | | | EURIBOR- | | |
| | | | | REUTERS | 4.926% | 24,606 |
|
| Goldman Sachs International | | | | | |
| $15,167,000 | — | 4/3/18 | | 3 month USD- | | |
| | | | | LIBOR-BBA | 4.19% | 1,294,406 |
|
| 3,159,000 | — | 4/23/18 | | 4.43% | 3 month USD- | |
| | | | | | LIBOR-BBA | (325,739) |
|
| 3,198,000 | — | 5/19/18 | | 4.525% | 3 month USD- | |
| | | | | | LIBOR-BBA | (409,203) |
|
| 3,393,000 | — | 5/30/28 | | 5.014% | 3 month USD- | |
| | | | | | LIBOR-BBA | (743,274) |
|
| JPY | 139,000,000 | — | 6/10/16 | | 1.953% | 6 month JPY- | |
| | | | | | LIBOR-BBA | (88,189) |
|
58
INTEREST RATE SWAP CONTRACTS OUTSTANDING at 4/30/09 (Unaudited) cont.
| | | | | | | |
| | | Upfront | | | Payments | Payments | Unrealized |
| Swap counterparty / | premium | Termination | | made by | received by | appreciation/ |
| Notional amount | received (paid) | date | | fund per annum | fund per annum | (depreciation) |
|
| Goldman Sachs International cont. | | | | | |
| | $1,012,000 | $6,264 | 11/18/18 | | 4.10% | 3 month USD- | |
| | | | | | | LIBOR-BBA | $(86,519) |
|
| | 2,630,000 | — | 1/23/19 | | 2.61125% | 3 month USD- | |
| | | | | | | LIBOR-BBA | 115,999 |
|
| AUD | 4,550,000 E | — | 2/14/12 | | 3 month AUD- | | |
| | | | | | BBR-BBSW | 4.39% | (13,912) |
|
| GBP | 5,170,000 | — | 4/7/11 | | 2.2% | 6 month GBP- | |
| | | | | | | LIBOR-BBA | (19,485) |
|
| GBP | 4,350,000 | — | 4/7/14 | | 6 month GBP- | | |
| | | | | | LIBOR-BBA | 3.26% | 77,050 |
|
| GBP | 1,200,000 | — | 4/7/19 | | 3.85% | 6 month GBP- | |
| | | | | | | LIBOR-BBA | (29,728) |
|
| JPMorgan Chase Bank, N.A. | | | | | |
| | $3,004,000 | — | 3/7/18 | | 4.45% | 3 month USD- | |
| | | | | | | LIBOR-BBA | (324,185) |
|
| | 809,000 | — | 3/11/38 | | 5.0025% | 3 month USD- | |
| | | | | | | LIBOR-BBA | (204,951) |
|
| | 6,839,000 | — | 3/20/13 | | 3 month USD- | | |
| | | | | | LIBOR-BBA | 3.145% | 241,415 |
|
| | 18,147,000 | — | 3/26/10 | | 3 month USD- | | |
| | | | | | LIBOR-BBA | 2.33375% | 217,714 |
|
| | 3,922,000 | — | 4/8/13 | | 3 month USD- | | |
| | | | | | LIBOR-BBA | 3.58406% | 201,259 |
|
| | 6,903,000 | — | 5/23/10 | | 3 month USD- | | |
| | | | | | LIBOR-BBA | 3.16% | 227,198 |
|
| | 1,000,000 | — | 6/27/18 | | 3 month USD- | | |
| | | | | | LIBOR-BBA | 4.8305% | 149,897 |
|
| | 700,000 | — | 7/17/18 | | 4.52% | 3 month USD- | |
| | | | | | | LIBOR-BBA | (85,539) |
|
| | 5,103,000 | — | 7/22/10 | | 3 month USD- | | |
| | | | | | LIBOR-BBA | 3.565% | 195,620 |
|
| | 18,666,000 | — | 7/28/10 | | 3 month USD- | | |
| | | | | | LIBOR-BBA | 3.5141% | 706,858 |
|
| AUD | 3,480,000 E | — | 8/6/18 | | 6 month AUD- | | |
| | | | | | BBR-BBSW | 6.865% | 92,135 |
|
| JPY | 153,840,000 | — | 9/18/15 | | 1.19% | 6 month JPY- | |
| | | | | | | LIBOR-BBA | (14,471) |
|
| | $4,340,000 | — | 9/23/38 | | 4.70763% | 3 month USD- | |
| | | | | | | LIBOR-BBA | (868,087) |
|
| | 2,297,000 | — | 10/22/10 | | 3 month USD- | | |
| | | | | | LIBOR-BBA | 2.78% | 51,508 |
|
| | 1,531,000 | — | 10/22/18 | | 3 month USD- | | |
| | | | | | LIBOR-BBA | 4.2825% | 140,263 |
|
| | 2,802,000 | — | 10/23/13 | | 3 month USD- | | |
| | | | | | LIBOR-BBA | 3.535% | 133,743 |
|
| EUR | 11,390,000 | — | 11/4/18 | | 6 month EUR- | | |
| | | | | | EURIBOR- | | |
| | | | | | REUTERS | 4.318% | 1,110,141 |
|
59
INTEREST RATE SWAP CONTRACTS OUTSTANDING at 4/30/09 (Unaudited) cont.
| | | | | | | |
| | | Upfront | | | Payments | Payments | Unrealized |
| Swap counterparty / | premium | Termination | | made by | received by | appreciation/ |
| Notional amount | received (paid) | date | | fund per annum | fund per annum | (depreciation) |
|
| JPMorgan Chase Bank, N.A. cont. | | | | | |
| | $1,741,000 | $(5,121) | 11/4/18 | | 3 month USD- | | |
| | | | | | LIBOR-BBA | 4.45% | $210,419 |
|
| JPY | 1,650,000,000 | — | 11/10/15 | | 6 month JPY- | | |
| | | | | | LIBOR-BBA | 1.3225% | 326,630 |
|
| | $7,418,000 | — | 11/10/18 | | 3 month USD- | | |
| | | | | | LIBOR-BBA | 4.83% | 1,162,802 |
|
| | 3,000,000 | — | 12/3/18 | | 3 month USD- | | |
| | | | | | LIBOR-BBA | 2.918% | (41,088) |
|
| EUR | 15,200,000 | — | 12/11/13 | | 6 month EUR- | | |
| | | | | | EURIBOR- | | |
| | | | | | REUTERS | 3.536% | 771,925 |
|
| | $2,981,000 | — | 12/19/18 | | 5% | 3 month USD- | |
| | | | | | | LIBOR-BBA | (500,305) |
|
| PLN | 2,820,000 | — | 1/26/11 | | 6 month PLN- | | |
| | | | | | WIBOR-WIBO | 4.177% | (9,160) |
|
| JPY | 730,000,000 | — | 6/6/13 | | 1.83% | 6 month JPY- | |
| | | | | | | LIBOR-BBA | (317,627) |
|
| | $2,310,000 | — | 1/27/24 | | 3.1% | 3 month USD- | |
| | | | | | | LIBOR-BBA | 96,782 |
|
| AUD | 3,640,000 E | — | 1/27/12 | | 3 month AUD- | | |
| | | | | | BBR-BBSW | 4.21% | (14,052) |
|
| | $1,155,000 | — | 2/3/24 | | 3 month USD- | | |
| | | | | | LIBOR-BBA | 3.2825% | (26,956) |
|
| AUD | 1,400,000 | — | 2/24/19 | | 4.825% | 6 month AUD- | |
| | | | | | | BBR-BBSW | 18,343 |
|
| | $22,000,000 | — | 3/3/11 | | 3 month USD- | | |
| | | | | | LIBOR-BBA | 1.68283% | 122,677 |
|
| EUR | 4,800,000 | — | 3/4/14 | | 1 month EUR- | | |
| | | | | | EURIBOR- | | |
| | | | | | REUTERS | 2.74% | 24,736 |
|
| | $2,105,000 | — | 3/6/39 | | 3.48% | 3 month USD- | |
| | | | | | | LIBOR-BBA | 52,708 |
|
| AUD | 1,050,000 | — | 3/6/19 | | 4.93% | 6 month AUD- | |
| | | | | | | BBR-BBSW | 8,318 |
|
| CAD | 2,050,000 | — | 3/16/11 | | 0.98% | 3 month CAD- | |
| | | | | | | BA-CDOR | (6,369) |
|
| CAD | 450,000 | — | 3/16/19 | | 3 month CAD- | | |
| | | | | | BA-CDOR | 2.7% | (8,862) |
|
| CAD | 2,110,000 | — | 3/17/13 | | 1.56% | 3 month CAD- | |
| | | | | | | BA-CDOR | 2,039 |
|
| | $2,140,000 | — | 3/19/13 | | 3 month USD- | | |
| | | | | | LIBOR-BBA | 2.28% | 4,318 |
|
| | 690,000 | — | 3/19/24 | | 3.37% | 3 month USD- | |
| | | | | | | LIBOR-BBA | 11,468 |
|
| CAD | 670,000 | — | 3/17/24 | | 3 month CAD- | | |
| | | | | | BA-CDOR | 3.46% | (18,193) |
|
| | $18,000,000 | — | 3/20/19 | | 3.20875% | 3 month USD- | |
| | | | | | | LIBOR-BBA | (11,742) |
|
60
INTEREST RATE SWAP CONTRACTS OUTSTANDING at 4/30/09 (Unaudited) cont.
| | | | | | | |
| | | Upfront | | | Payments | Payments | Unrealized |
| Swap counterparty / | premium | Termination | | made by | received by | appreciation/ |
| Notional amount | received (paid) | date | | fund per annum | fund per annum | (depreciation) |
|
| JPMorgan Chase Bank, N.A. cont. | | | | | |
| | $18,953,000 | $— | 3/23/16 | | 3 month USD- | | |
| | | | | | LIBOR-BBA | 2.6125% | $(335,686) |
|
| | 17,000,000 | — | 3/24/11 | | 3 month USD- | | |
| | | | | | LIBOR-BBA | 1.4625% | 10,952 |
|
| | 1,500,000 | — | 4/1/24 | | 3 month USD- | | |
| | | | | | LIBOR-BBA | 3.17% | (61,822) |
|
| | 12,400,000 | — | 4/3/11 | | 3 month USD- | | |
| | | | | | LIBOR-BBA | 1.365% | (19,116) |
|
| | 4,620,000 | — | 4/3/13 | | 1.963% | 3 month USD- | |
| | | | | | | LIBOR-BBA | 50,213 |
|
| | 26,580,000 | — | 4/3/14 | | 2.203% | 3 month USD- | |
| | | | | | | LIBOR-BBA | 401,409 |
|
| | 450,000 | — | 4/8/19 | | 3.135% | 3 month USD- | |
| | | | | | | LIBOR-BBA | 3,117 |
|
| | 14,520,000 | — | 4/9/11 | | 3 month USD- | | |
| | | | | | LIBOR-BBA | 1.5025% | 16,782 |
|
| | 581,000 | — | 4/9/19 | | 3 month USD- | | |
| | | | | | LIBOR-BBA | 3.1125% | (5,194) |
|
| EUR | 3,420,000 E | — | 4/17/24 | | 6 month EUR- | | |
| | | | | | EURIBOR- | | |
| | | | | | REUTERS | 4.95% | 29,207 |
|
| | $1,480,000 E | — | 4/17/39 | | 3.7% | 3 month USD- | |
| | | | | | | LIBOR-BBA | 42,076 |
|
| GBP | 2,620,000 | — | 4/20/11 | | 2.2% | 6 month GBP- | |
| | | | | | | LIBOR-BBA | (12,913) |
|
| GBP | 2,210,000 | — | 4/20/14 | | 6 month GBP- | | |
| | | | | | LIBOR-BBA | 3.17875% | 25,010 |
|
| GBP | 610,000 | — | 4/20/19 | | 3.725% | 6 month GBP- | |
| | | | | | | LIBOR-BBA | (4,899) |
|
| AUD | 4,404,000 E | — | 4/22/11 | | 3 month AUD- | | |
| | | | | | BBR-BBSW | 4.05% | 7,804 |
|
| AUD | 4,404,000 | — | 4/22/10 | | 3% | 3 month AUD- | |
| | | | | | | BBR-BBSW | (3,589) |
|
| CAD | 1,100,000 | — | 4/21/19 | | 2.7425% | 6 month CAD- | |
| | | | | | | BA-CDOR | 20,985 |
|
| | $2,960,000 E | — | 5/1/39 | | 3 month USD- | | |
| | | | | | LIBOR-BBA | 3.84125% | (42,890) |
|
| EUR | 6,692,500 E | — | 5/6/24 | | 4.76248% | 6 month EUR- | |
| | | | | | | EURIBOR- | |
| | | | | | | REUTERS | (5,059) |
|
| Merrill Lynch Capital Services, Inc. | | | | | |
| JPY | 139,000,000 | — | 6/10/16 | | 1.99625% | 6 month JPY- | |
| | | | | | | LIBOR-BBA | (92,621) |
|
| Merrill Lynch Derivative Products AG | | | | | |
| JPY | 69,500,000 | — | 6/11/17 | | 2.05625% | 6 month JPY- | |
| | | | | | | LIBOR-BBA | (51,199) |
|
61
INTEREST RATE SWAP CONTRACTS OUTSTANDING at 4/30/09 (Unaudited) cont.
| | | | | | | |
| | Upfront | | | Payments | Payments | Unrealized |
| Swap counterparty / | premium | Termination | | made by | received by | appreciation/ |
| Notional amount | received (paid) | date | | fund per annum | fund per annum | (depreciation) |
|
| UBS AG | | | | | | |
| $6,088,000 | $209,069 | 11/10/38 | | 4.45% | 3 month USD- | |
| | | | | | LIBOR-BBA | $(814,562) |
|
| 26,508,000 | 673,401 | 11/10/18 | | 4.45% | 3 month USD- | |
| | | | | | LIBOR-BBA | (2,593,424) |
|
| 1,899,000 | 24,983 | 11/24/38 | | 3.3% | 3 month USD- | |
| | | | | | LIBOR-BBA | 117,631 |
|
| 674,000 | 3,290 | 11/24/18 | | 3.4% | 3 month USD- | |
| | | | | | LIBOR-BBA | (16,599) |
|
| 518,000 | (164) | 11/24/10 | | 3 month USD- | | |
| | | | | LIBOR-BBA | 2.05% | 9,121 |
|
| 58,630,000 | — | 11/24/10 | | 3 month USD- | | |
| | | | | LIBOR-BBA | 2.05% | 1,050,866 |
|
| Total | | | | | | $1,270,429 |
E See Note 1 to the financial statements regarding extended effective dates.
F Is valued at fair value following procedures approved by the Trustees. Securities may be classified as a Level 2 or Level 3 for SFAS 157 disclosures based on securities valuation inputs.
TOTAL RETURN SWAP CONTRACTS OUTSTANDING at 4/30/09 (Unaudited)
| | | | | | |
| | | | | Fixed payments | Total return | Unrealized |
| Swap counterparty / | Termination | | received (paid) by | received by | appreciation/ |
| Notional amount | date | | fund per annum | or paid by fund | (depreciation) |
|
| Deutsche Bank AG | | | | | |
| EUR | 1,242,000 | 3/27/14 | | 1.785% | Eurostat Eurozone | $13,176 |
| | | | | | HICP excluding | |
| | | | | | tobacco | |
|
| Goldman Sachs International | | | | | |
| EUR | 2,070,000 | 4/30/13 | | 2.375% | French Consumer | 114,716 |
| | | | | | Price Index | |
| | | | | | excluding tobacco | |
|
| EUR | 2,070,000 | 4/30/13 | | (2.41%) | Eurostat Eurozone | (121,852) |
| | | | | | HICP excluding | |
| | | | | | tobacco | |
|
| EUR | 2,070,000 | 5/6/13 | | 2.34% | French Consumer | 110,899 |
| | | | | | Price Index | |
| | | | | | excluding tobacco | |
|
| EUR | 2,070,000 | 5/6/13 | | (2.385%) | Eurostat Eurozone | (119,546) |
| | | | | | HICP excluding | |
| | | | | | tobacco | |
|
| EUR | 1,640,000 | 4/23/14 | | 1.67% | Eurostat Eurozone | 6,872 |
| | | | | | HICP excluding | |
| | | | | | tobacco | |
|
| EUR | 1,242,000 | 4/14/14 | | 1.835% | Eurostat Eurozone | (7,543) |
| | | | | | HICP excluding | |
| | | | | | tobacco | |
|
62
TOTAL RETURN SWAP CONTRACTS OUTSTANDING at 4/30/09 (Unaudited) cont.
| | | | | | |
| | | | Fixed payments | Total return | Unrealized |
| Swap counterparty / | Termination | | received (paid) by | received by | appreciation/ |
| Notional amount | date | | fund per annum | or paid by fund | (depreciation) |
|
| JPMorgan Chase Bank, N.A. | | | | | |
| $450,000 F | 4/8/19 | | (2.40%) | USA Non Revised | $10,791 |
| | | | | Consumer Price | |
| | | | | Index- Urban | |
| | | | | (CPI-U) | |
|
| Total | | | | | $7,513 |
F Is valued at fair value following procedures approved by the Trustees. Securities may be classified as a Level 2 or Level 3 for SFAS 157 disclosures based on securities valuation inputs.
CREDIT DEFAULT CONTRACTS OUTSTANDING at 4/30/09 (Unaudited)
| | | | | | | |
| | | Upfront | | | | Fixed payments | |
| | | premium | | | Termi- | received | Unrealized |
| Swap counterparty / | | received | Notional | | nation | (paid) by fund | appreciation/ |
| Referenced debt* | Rating*** | (paid)** | amount | | date | per annum | (depreciation) |
|
| Bank of America, N.A. | | | | | | | |
| DJ ABX CMBX BBB | | | | | | | |
| Index | — | $166 | $242,000 | | 10/12/52 | (134 bp) | $213,833 |
|
| Financial Security | | | | | | | |
| Assurance Holdings, | | | | | | | |
| Ltd, 6.4%, 12/15/66 | Baa1 | — | 25,000 | | 12/20/12 | 95 bp | (8,685) |
|
| Marsh & Mclennan | | | | | | | |
| Co. Inc., 5 3/8%, | | | | | | | |
| 7/15/14 | — | — | 140,000 | | 3/20/12 | (95 bp) | (1,621) |
|
| MetLife Inc., 5%, | | | | | | | |
| 6/15/15 | — | — | 70,000 | | 12/20/13 | (384 bp) | 5,438 |
|
| Barclays Bank PLC | | | | | | | |
| DJ ABX HE PEN AAA | | | | | | | |
| Series 6 Version 1 | | | | | | | |
| Index | AAA | 35,635 | 246,486 | | 7/25/45 | 18 bp | 1,440 |
|
| DJ ABX HE PEN AAA | | | | | | | |
| Series 6 Version 1 | | | | | | | |
| Index | AAA | 28,196 | 184,864 | | 7/25/45 | 18 bp | 2,550 |
|
| DJ ABX HE PEN AAA | | | | | | | |
| Series 7 Version 1 | | | | | | | |
| Index | A | 170,919 | 290,000 | | 8/25/37 | 9 bp | (24,828) |
|
| DJ CDX NA IG Series | | | | | | | |
| 12 Version 1 Index | — | (69,015) | 1,830,000 | | 6/20/14 | (100 bp) | (18,141) |
|
| Citibank, N.A. | | | | | | | |
| Conagra Foods Inc., | | | | | | | |
| 7%, 10/1/28 | — | — | 70,000 | | 9/20/10 | (27 bp) | (16) |
|
| DJ ABX HE PEN AAA | | | | | | | |
| Series 6 Version 1 | | | | | | | |
| Index | AA | 50,822 | 253,987 | | 5/25/46 | 11 bp | (53,209) |
|
| DJ ABX HE PEN AAA | | | | | | | |
| Series 6 Version 1 | | | | | | | |
| Index | AAA | 16,938 | 104,606 | | 7/25/45 | 18 bp | 2,117 |
|
| DJ ABX HE PEN AAA | | | | | | | |
| Series 6 Version 2 | | | | | | | |
| Index | AA | 20,322 | 117,618 | | 5/25/46 | 11 bp | (27,854) |
|
63
CREDIT DEFAULT CONTRACTS OUTSTANDING at 4/30/09 (Unaudited) cont.
| | | | | | | |
| | | Upfront | | | | Fixed payments | |
| | | premium | | | Termi- | received | Unrealized |
| Swap counterparty / | | received | Notional | | nation | (paid) by fund | appreciation/ |
| Referenced debt* | Rating*** | (paid)** | amount | | date | per annum | (depreciation) |
|
| Citibank, N.A. cont. | | | | | | | |
| Marsh & Mclennan | | | | | | | |
| Co. Inc., 5 3/8%, | | | | | | | |
| 7/15/14 | — | $— | $75,000 | | 9/20/14 | (105 bp) | $(1,897) |
|
| Mohawk Industries, | | | | | | | |
| Inc., 7.2%, 4/15/12 | — | — | 575,000 | | 3/20/16 | (140 bp) | 32,514 |
|
| Rexam PLC, 4 3/8%, | | | | | | | |
| 3/15/13 | — | — | 155,000 | | 6/20/13 | (145 bp) | 8,881 |
|
| Sara Lee Corp., | | | | | | | |
| 6 1/8%, 11/1/32 | — | — | 75,000 | | 9/20/11 | (43 bp) | 1 |
|
| Credit Suisse International | | | | | | |
| DJ ABX HE AAA | | | | | | | |
| Series 7 Version 2 | | | | | | | |
| Index | BB+ | 26,085 | 47,000 | | 1/25/38 | 76 bp | (8,926) |
|
| DJ ABX HE PEN AAA | | | | | | | |
| Series 6 Version 1 | | | | | | | |
| Index | AAA | 35,995 | 220,334 | | 7/25/45 | 18 bp | 5,428 |
|
| DJ ABX HE PEN AAA | | | | | | | |
| Series 6 Version 1 | | | | | | | |
| Index | AAA | 14,310 | 88,374 | | 7/25/45 | 18 bp | 2,050 |
|
| DJ ABX HE PEN AAA | | | | | | | |
| Series 6 Version 1 | | | | | | | |
| Index | AAA | 11,341 | 70,038 | | 7/25/45 | 18 bp | 1,624 |
|
| DJ ABX HE PEN AAA | | | | | | | |
| Series 6 Version 1 | | | | | | | |
| Index | AAA | 5,451 | 33,666 | | 7/25/45 | 18 bp | 781 |
|
| DJ ABX HE PEN AAA | | | | | | | |
| Series 6 Version 1 | | | | | | | |
| Index | AAA | 6,898 | 37,273 | | 7/25/45 | 18 bp | 1,727 |
|
| DJ ABX HE PEN AAA | | | | | | | |
| Series 6 Version 1 | | | | | | | |
| Index | AAA | 10,111 | 57,413 | | 7/25/45 | 18 bp | 2,146 |
|
| DJ ABX HE PEN AAA | | | | | | | |
| Series 6 Version 2 | | | | | | | |
| Index | AA | 85,825 | 417,630 | | 5/25/46 | 11 bp | (84,360) |
|
| DJ ABX HE PEN AAA | | | | | | | |
| Series 6 Version 2 | | | | | | | |
| Index | AA | 104,809 | 321,319 | | 5/25/46 | 11 bp | (26,128) |
|
| DJ ABX HE PEN AAA | | | | | | | |
| Series 7 Version 1 | | | | | | | |
| Index | A | 217,906 | 367,000 | | 8/25/37 | 9 bp | (29,815) |
|
| DJ CDX NA HY Series | | | | | | | |
| 10 | B+ | 10,626 | 101,200 | | 6/20/13 | 500 bp | (7,054) |
|
| DJ CDX NA HY Series | | | | | | | |
| 10 | B+ | 42,033 | 395,600 | | 6/20/13 | 500 bp | (27,082) |
|
| DJ CMB NA CMBX AAA | | | | | | | |
| Index | — | (680,516) | 4,344,000 | | 2/17/51 | (35 bp) | 475,863 |
|
| DJ CMB NA CMBX AAA | | | | | | | |
| Index | — | (147,332) | 1,089,000 | | 2/17/51 | (35 bp) | 142,561 |
|
64
CREDIT DEFAULT CONTRACTS OUTSTANDING at 4/30/09 (Unaudited) cont.
| | | | | | | |
| | | Upfront | | | | Fixed payments | |
| | | premium | | | Termi- | received | Unrealized |
| Swap counterparty / | | received | Notional | | nation | (paid) by fund | appreciation/ |
| Referenced debt* | Rating*** | (paid)** | amount | | date | per annum | (depreciation) |
|
| Credit Suisse International cont. | | | | | | |
| General Electric | | | | | | | |
| Capital Corp., | | | | | | | |
| 5 5/8%, 9/15/17 | Aa2 | $— | $135,000 | | 12/20/13 | 530 bp | $(6,403) |
|
| Liberty Mutual | | | | | | | |
| Insurance, 7 7/8%, | | | | | | | |
| 10/15/26 | — | — | 15,000 | | 12/20/13 | (210 bp) | 506 |
|
| Deutsche Bank AG | | | | | | | |
| Cadbury Schweppes | | | | | | | |
| US Finance LLC, | | | | | | | |
| 5 1/8%, 10/1/13 | — | — | 560,000 | | 12/20/13 | (86 bp) | (9,460) |
|
| DJ ABX HE AAA | | | | | | | |
| Series 6 Version 1 | | | | | | | |
| Index | AAA | 16,936 | 155,918 | | 7/25/45 | 18 bp | (31,723) |
|
| DJ ABX HE PEN AAA | | | | | | | |
| Series 6 Version 1 | | | | | | | |
| Index | AAA | 12,099 | 69,737 | | 7/25/45 | 18 bp | 2,424 |
|
| DJ ABX HE PEN AAA | | | | | | | |
| Series 6 Version 2 | | | | | | | |
| Index | AA | 67,668 | 190,916 | | 5/25/46 | 11 bp | (10,529) |
|
| DJ CDX NA HY Series | | | | | | | |
| 11 Version 1 Index | B | 79,994 | 340,400 | | 12/20/13 | 500 bp | 8,092 |
|
| DJ CDX NA IG Series | | | | | | | |
| 12 Version 1 Index | — | (153,298) | 3,973,000 | | 6/20/14 | (100 bp) | (42,628) |
|
| General Electric | | | | | | | |
| Capital Corp., 6%, | | | | | | | |
| 6/15/12 | Aa2 | — | 275,000 | | 9/20/13 | 109 bp | (52,756) |
|
| Genworth Financial | | | | | | | |
| Inc., 5 3/4%, | | | | | | | |
| 6/15/14 | — | — | 515,000 | | 6/20/18 | (143 bp) | 315,948 |
|
| India Government | | | | | | | |
| Bond, 5 7/8%, 1/2/10 | BBB–/F | — | 370,000 | | 1/11/10 | 170 bp | 6,384 |
|
| Korea Monetary STAB | | | | | | | |
| Bond, 5.15%, 2/12/10 | A2 | — | 480,000 F | | 2/19/10 | 115 bp | 3,927 |
|
| Korea Monetary STAB | | | | | | | |
| Bond, 5.45%, 1/23/10 | AA/F | — | 695,000 F | | 2/1/10 | 101 bp | 3,127 |
|
| MetLife Inc., 5%, | | | | | | | |
| 6/15/15 | — | — | 70,000 | | 12/20/13 | (405 bp) | 4,662 |
|
| Reynolds American, | | | | | | | |
| Inc., 7 5/8%, 6/1/16 | — | — | 1,705,000 | | 6/20/13 | (105 bp) | 62,122 |
|
| Goldman Sachs International | | | | | | |
| DJ ABX HE AAA Index | BB+ | 24,677 | 105,000 | | 1/25/38 | 76 bp | (53,539) |
|
| DJ CDX NA CMBX AAA | | | | | | | |
| Index | AAA | 4,389 | 120,000 | | 3/15/49 | 7 bp | (23,210) |
|
| DJ CDX NA IG Series | | | | | | | |
| 12 Version 1 Index | — | (186,247) | 4,238,000 | | 6/20/14 | (100 bp) | (67,724) |
|
65
CREDIT DEFAULT CONTRACTS OUTSTANDING at 4/30/09 (Unaudited) cont.
| | | | | | | | |
| | | Upfront | | | | Fixed payments | |
| | | premium | | | Termi- | received | Unrealized |
| Swap counterparty / | | received | Notional | | nation | (paid) by fund | appreciation/ |
| Referenced debt* | Rating*** | (paid)** | amount | | date | per annum | (depreciation) |
|
| Goldman Sachs International cont. | | | | | | |
| DJ CMB NA CMBX AAA | | | | | | | |
| Index | — | $(143,720) | $1,729,000 | | 2/17/51 | (35 bp) | $318,703 |
|
| Rhodia SA, | | | | | | | |
| Euribor+275, | | | | | | | |
| 10/15/13 | — | — | EUR | 645,000 | | 9/20/13 | (387 bp) | 163,496 |
|
| JPMorgan Chase Bank, N.A. | | | | | | |
| DJ ABX HE PEN AAA | | | | | | | |
| Series 6 Version 2 | | | | | | | |
| Index | AA | 56,224 | $273,590 | | 5/25/46 | 11 bp | (55,835) |
|
| DJ ABX HE PEN AAA | | | | | | | |
| Series 6 Version 2 | | | | | | | |
| Index | AA | 68,955 | 191,769 | | 5/25/46 | 11 bp | (9,591) |
|
| DJ CMBX NA AAA | | | | | | | |
| Series 4 Version 1 | | | | | | | |
| Index | AAA | 1,958,739 | 5,016,000 | | 2/17/51 | 35 bp | 601,410 |
|
| Lexmark | | | | | | | |
| International, | | | | | | | |
| Inc., 5.9%, 6/1/13 | — | — | 105,000 | | 6/20/13 | (113 bp) | 6,686 |
|
| Merrill Lynch Capital Services, Inc. | | | | | | |
| Bombardier, Inc, | | | | | | | |
| 6 3/4%, 5/1/12 | — | — | 250,000 | | 6/20/12 | (150 bp) | 31,370 |
|
| D.R. Horton Inc., | | | | | | | |
| 7 7/8%, 8/15/11 | — | — | 170,000 | | 9/20/11 | (426 bp) | (7,740) |
|
| Pulte Homes Inc., | | | | | | | |
| 5.25%, 1/15/14 | — | — | 159,000 | | 9/20/11 | (482 bp) | (11,617) |
|
| Morgan Stanley Capital Services, Inc. | | | | | |
| Bombardier, Inc, | | | | | | | |
| 6 3/4%, 5/1/12 | — | — | 125,000 | | 6/20/12 | (114 bp) | 16,934 |
|
| DJ CDX NA IG Series | | | | | | | |
| 12 Version 1 Index | — | (427,814) | 10,530,000 | | 6/20/14 | (100 bp) | (135,080) |
|
| DJ CMB NA CMBX AAA | | | | | | | |
| Index | AAA | 214,166 | 1,973,500 | | 2/17/51 | 35 bp | (316,254) |
|
| UBS, AG | | | | | | | |
| Starwood Hotels & | | | | | | | |
| Resorts Worldwide, | | | | | | | |
| Inc., 7 7/8%, 5/1/12 | — | — | 1,740,000 | | 6/20/12 | (195 bp) | 70,566 |
|
| Total | | | | | | | $1,361,606 |
* Payments related to the reference debt are made upon a credit default event.
** Upfront premium is based on the difference between the original spread on issue and the market spread on day of execution.
*** Ratings are presented for credit default contracts in which the fund has sold protection on the underlying referenced debt. Ratings for an underlying index represent the average of the ratings of all the securities included in that index. The Moody’s, Standard & Poor’s or Fitch ratings are believed to be the most recent ratings available at April 30, 2009. Securities rated by Fitch are indicated by “/F.”
F Is valued at fair value following procedures approved by the Trustees. Securities may be classified as a Level 2 or Level 3 for SFAS 157 disclosures based on securities valuation inputs.
66
In September 2006, the FASB issued Statement of Financial Accounting Standards No. 157, Fair Value Measurements (” SFAS 157” ). SFAS 157 is effective for financial statements issued for fiscal years beginning after November 15, 2007 and interim periods within those fiscal years. While the adoption of SFAS 157 does not have a material effect on the fund’s net asset value, it does require additional disclosures about fair value measurements. SFAS 157 establishes a three-level hierarchy for disclosure of fair value measurements. The valuation hierarchy is based upon the transparency of inputs to the valuation of the fund’s investments. The three levels are defined as follows:
Level 1 — Valuations based on quoted prices for identical securities in active markets.
Level 2 — Valuations based on quoted prices in markets that are not active or for which all significant inputs are observable, either directly or indirectly.
Level 3 — Valuations based on inputs that are unobservable and significant to the fair value measurement.
The following is a summary of the inputs used to value the fund’s net assets as of April 30, 2009:
| | |
| Valuation inputs | Investments in securities | Other financial instruments |
|
| Level 1 | $7,723,988 | $(1,049,389) |
|
| Level 2 | 169,214,044 | 2,194,886 |
|
| Level 3 | 415,869 | — |
|
| Total | $177,353,901 | $1,145,497 |
Other financial instruments include futures, written options, TBA sale commitments, swaps and forward contracts which are valued at the unrealized appreciation/(depreciation) on the instrument.
The following is a reconciliation of Level 3 assets as of April 30, 2009:
| | |
| | Investment in securities | Other financial instruments |
|
| Balance as of October 31, 2008 | $1,083,539 | $— |
|
| Accrued discounts/premiums | — | — |
|
| Realized gain/(loss) | (49,237) | — |
|
| Change in net unrealized appreciation/(depreciation) | (29,944) | — |
|
| Net purchases/sales | (11,352) | — |
|
| Net transfers in and/or out of Level 3 | (577,137) | — |
|
| Balance as of April 30, 2009 | $415,869 | $— |
Other financial instruments include futures, written options, TBA sale commitments, swaps and forward contracts which are valued at the unrealized appreciation/(depreciation) on the instrument.
The accompanying notes are an integral part of these financial statements.
67
Statement of assets and liabilities 4/30/09 (Unaudited)
| |
| ASSETS | |
|
| Investment in securities, at value (Note 1): | |
| Unaffiliated issuers (identified cost $181,072,400) | $173,579,913 |
| Affiliated issuers (identified cost $3,773,988) (Note 5) | 3,773,988 |
|
| Cash | 26,256 |
|
| Foreign currency (cost $25,166) (Note 1) | 24,640 |
|
| Interest and other receivables | 1,588,893 |
|
| Receivable for shares of the fund sold | 84,269 |
|
| Receivable for investments sold | 9,664,547 |
|
| Receivable for sales of delayed delivery securities (Notes 1 and 6) | 15,180,486 |
|
| Unrealized appreciation on swap contracts (Note 1) | 26,430,443 |
|
| Receivable for variation margin (Note 1) | 19,048 |
|
| Unrealized appreciation on forward currency contracts (Note 1) | 684,588 |
|
| Receivable for receivable purchase agreement (Note 2) | 74,807 |
|
| Premiums paid on swap contracts (Note 1) | 1,883,389 |
|
| Total assets | 233,015,267 |
|
| |
| LIABILITIES | |
|
| Payable for investments purchased | 9,435,413 |
|
| Payable for purchases of delayed delivery securities (Notes 1 and 6) | 65,394,609 |
|
| Payable for shares of the fund repurchased | 189,638 |
|
| Payable for compensation of Manager (Note 2) | 89,084 |
|
| Payable for investor servicing fees (Note 2) | 18,717 |
|
| Payable for custodian fees (Note 2) | 25,824 |
|
| Payable for Trustee compensation and expenses (Note 2) | 81,632 |
|
| Payable for administrative services (Note 2) | 1,364 |
|
| Payable for distribution fees (Note 2) | 31,742 |
|
| Unrealized depreciation on forward currency contracts (Note 1) | 605,800 |
|
| Written options outstanding, at value (premiums received $1,660,532) (Notes 1 and 3) | 2,181,482 |
|
| Premiums received on swap contracts (Note 1) | 4,430,021 |
|
| Unrealized depreciation on swap contracts (Note 1) | 23,790,895 |
|
| TBA sale commitments, at value (proceeds receivable $8,225,625) (Note 1) | 8,228,125 |
|
| Collateral on certain derivative contracts, at value (Note 1) | 5,212,110 |
|
| Other accrued expenses | 130,742 |
|
| Total liabilities | 119,847,198 |
| |
| Net assets | $113,168,069 |
|
| |
| REPRESENTED BY | |
|
| Paid-in capital (Unlimited shares authorized) (Notes 1 and 4) | $133,755,604 |
|
| Undistributed net investment income (Note 1) | 10,823,795 |
|
| Accumulated net realized loss on investments and foreign currency transactions (Note 1) | (25,101,782) |
|
| Net unrealized depreciation of investments and assets and liabilities in foreign currencies | (6,309,548) |
|
| Total — Representing net assets applicable to capital shares outstanding | $113,168,069 |
(Continued on next page)
68
Statement of assets and liabilities (Continued)
| |
| COMPUTATION OF NET ASSET VALUE AND OFFERING PRICE | |
|
| Net asset value and redemption price per class A share ($80,652,213 divided by 7,611,021 shares) | $10.60 |
|
| Offering price per class A share (100/96.00 of $10.60)* | $11.04 |
|
| Net asset value and offering price per class B share ($7,373,166 divided by 698,074 shares)** | $10.56 |
|
| Net asset value and offering price per class C share ($2,974,437 divided by 281,480 shares)** | $10.57 |
|
| Net asset value and redemption price per class M share ($17,191,144 divided by 1,634,075 shares) | $10.52 |
|
| Offering price per class M share (100/96.75 of $10.52)*** | $10.87 |
|
| Net asset value, offering price and redemption price per class R share | |
| ($483,620 divided by 45,672 shares) | $10.59 |
|
| Net asset value, offering price and redemption price per class Y share | |
| ($4,493,489 divided by 423,808 shares) | $10.60 |
|
* On single retail sales of less than $100,000. On sales of $100,000 or more the offering price is reduced.
** Redemption price per share is equal to net asset value less any applicable contingent deferred sales charge.
*** On single retail sales of less than $50,000. On sales of $50,000 or more the offering price is reduced.
The accompanying notes are an integral part of these financial statements.
69
Statement of operations Six months ended 4/30/09 (Unaudited)
| |
| INVESTMENT INCOME | |
|
| Interest (net of foreign tax of $10,582) (including interest income of $803 | |
| from investments in affiliated issuers) (Note 5) | $3,231,039 |
| |
| EXPENSES | |
|
| Compensation of Manager (Note 2) | 395,285 |
|
| Investor servicing fees (Note 2) | 134,499 |
|
| Custodian fees (Note 2) | 36,332 |
|
| Trustee compensation and expenses (Note 2) | 14,788 |
|
| Administrative services (Note 2) | 11,985 |
|
| Distribution fees — Class A (Note 2) | 100,795 |
|
| Distribution fees — Class B (Note 2) | 39,373 |
|
| Distribution fees — Class C (Note 2) | 15,801 |
|
| Distribution fees — Class M (Note 2) | 40,488 |
|
| Distribution fees — Class R (Note 2) | 1,173 |
|
| Auditing | 88,472 |
|
| Other | 44,285 |
|
| Fees waived and reimbursed by Manager (Note 2) | (238,235) |
|
| Total expenses | 685,041 |
| | |
| Expense reduction (Note 2) | (1,591) |
|
| Net expenses | 683,450 |
| |
| Net investment income | 2,547,589 |
|
| |
| Net realized gain on investments (Notes 1 and 3) | 1,084,263 |
|
| Net realized loss on swap contracts (Note 1) | (9,987,181) |
|
| Net realized gain on futures contracts (Note 1) | 51,266 |
|
| Net realized loss on foreign currency transactions (Note 1) | (4,682,917) |
|
| Net realized gain on written options (Notes 1 and 3) | 210,401 |
|
| Net unrealized appreciation of assets and liabilities in | |
| foreign currencies during the period | 4,316,435 |
|
| Net unrealized appreciation of investments, futures contracts, swap contracts, | |
| written options, and TBA sale commitments during the period | 10,933,978 |
|
| Net gain on investments | 1,926,245 |
| |
| Net increase in net assets resulting from operations | $4,473,834 |
|
The accompanying notes are an integral part of these financial statements.
70
Statement of changes in net assets
| | |
| DECREASE IN NET ASSETS | Six months ended 4/30/09* | Year ended 10/31/08 |
|
| Operations: | | |
| Net investment income | $2,547,589 | $7,232,990 |
|
| Net realized gain (loss) on investments | | |
| and foreign currency transactions | (13,324,168) | 2,154,860 |
|
| Net unrealized appreciation (depreciation) of investments | | |
| and assets and liabilities in foreign currencies | 15,250,413 | (29,993,978) |
|
| Net increase (decrease) in net assets resulting from operations | 4,473,834 | (20,606,128) |
|
| Distributions to shareholders (Note 1): | | |
| From ordinary income | | |
| Net investment income | | |
|
| Class A | (2,839,038) | (5,804,158) |
|
| Class B | (246,814) | (576,836) |
|
| Class C | (97,828) | (225,169) |
|
| Class M | (559,347) | (975,735) |
|
| Class R | (15,929) | (28,158) |
|
| Class Y | (169,449) | (371,685) |
|
| Redemption fees (Note 1) | 6,977 | 59,041 |
|
| Increase (decrease) from capital share transactions (Note 4) | (14,582,371) | 26,898,328 |
|
| Total decrease in net assets | (14,029,965) | (1,630,500) |
|
| |
| NET ASSETS | | |
|
| Beginning of period | 127,198,034 | 128,828,534 |
|
| End of period (including undistributed net investment | | |
| income of $10,823,795 and $12,204,611, respectively) | $113,168,069 | $127,198,034 |
|
* Unaudited
The accompanying notes are an integral part of these financial statements.
71
Financial highlights (For a common share outstanding throughout the period)
| | | | | | | | | | | | | |
| INVESTMENT OPERATIONS: | | | LESS DISTRIBUTIONS: | | | RATIOS AND SUPPLEMENTAL DATA: | |
|
| | | | | | | | | | | | Ratio | Ratio of net | |
| | | | Net realized | | | | | | | | of expenses | investment | |
| | Net asset value, | | and unrealized | Total from | | | | Net asset | Total return | Net assets, | to average | income (loss) | |
| | beginning | Net investment | gain (loss) on | investment | From net | Total | Redemption | value, end of | at net asset | end of period | net assets | to average net | Portfolio |
| Period ended | of period | income (loss) a,b | investments | operations | investment income | distributions | fees | period | value (%) c | (in thousands) | (%) b,d | assets (%) b | turnover (%) |
|
| Class A | | | | | | | | | | | | | |
| April 30, 2009 ** | $10.47 | .23 | .26 | .49 | (.36) | (.36) | — e | $10.60 | 4.89 * | $80,652 | .55 * | 2.29 * | 119.52 * f |
| October 31, 2008 | 12.68 | .62 | (2.16) | (1.54) | (.68) | (.68) | .01 | 10.47 | (12.79) | 90,998 | 1.13 | 4.96 | 181.55 f |
| October 31, 2007 | 12.12 | .47 | .57 | 1.04 | (.48) | (.48) | — e | 12.68 | 8.76 | 91,616 | 1.16 | 3.82 | 103.10 f |
| October 31, 2006 | 12.18 | .37 g | .22 | .59 | (.65) | (.65) | — e | 12.12 | 5.01 | 87,210 | 1.17 g | 3.04 g | 97.83 f |
| October 31, 2005 | 12.73 | .38 | (.42) | (.04) | (.51) | (.51) | — e | 12.18 | (.39) | 98,198 | 1.22 | 2.96 | 197.70 f |
| October 31, 2004 | 12.65 | .33 | .88 | 1.21 | (1.13) | (1.13) | — e | 12.73 | 9.99 | 104,736 | 1.29 | 2.65 | 162.13 |
|
| Class B | | | | | | | | | | | | | |
| April 30, 2009 ** | $10.44 | .19 | .25 | .44 | (.32) | (.32) | — e | $10.56 | 4.41 * | $7,373 | .92 * | 1.93 * | 119.52 * f |
| October 31, 2008 | 12.64 | .53 | (2.14) | (1.61) | (.59) | (.59) | — e | 10.44 | (13.40) | 9,559 | 1.88 | 4.24 | 181.55 f |
| October 31, 2007 | 12.08 | .37 | .57 | .94 | (.38) | (.38) | — e | 12.64 | 7.97 | 10,644 | 1.91 | 3.09 | 103.10 f |
| October 31, 2006 | 12.13 | .28 g | .23 | .51 | (.56) | (.56) | — e | 12.08 | 4.31 | 15,238 | 1.92 g | 2.37 g | 97.83 f |
| October 31, 2005 | 12.69 | .28 | (.42) | (.14) | (.42) | (.42) | — e | 12.13 | (1.23) | 23,480 | 1.97 | 2.20 | 197.70 f |
| October 31, 2004 | 12.61 | .24 | .87 | 1.11 | (1.03) | (1.03) | — e | 12.69 | 9.20 | 29,246 | 2.04 | 1.93 | 162.13 |
|
| Class C | | | | | | | | | | | | | |
| April 30, 2009 ** | $10.44 | .19 | .26 | .45 | (.32) | (.32) | — e | $10.57 | 4.49 * | $2,974 | .92 * | 1.94 * | 119.52 * f |
| October 31, 2008 | 12.65 | .53 | (2.15) | (1.62) | (.59) | (.59) | — e | 10.44 | (13.45) | 3,887 | 1.88 | 4.21 | 181.55 f |
| October 31, 2007 | 12.09 | .38 | .56 | .94 | (.38) | (.38) | — e | 12.65 | 7.96 | 2,830 | 1.91 | 3.07 | 103.10 f |
| October 31, 2006 | 12.14 | .27 g | .24 | .51 | (.56) | (.56) | — e | 12.09 | 4.32 | 2,712 | 1.92 g | 2.28 g | 97.83 f |
| October 31, 2005 | 12.70 | .29 | (.43) | (.14) | (.42) | (.42) | — e | 12.14 | (1.19) | 2,699 | 1.97 | 2.22 | 197.70 f |
| October 31, 2004 | 12.62 | .23 | .88 | 1.11 | (1.03) | (1.03) | — e | 12.70 | 9.16 | 1,682 | 2.04 | 1.90 | 162.13 |
|
| Class M | | | | | | | | | | | | | |
| April 30, 2009 ** | $10.40 | .21 | .25 | .46 | (.34) | (.34) | — e | $10.52 | 4.70 * | $17,191 | .68 * | 2.14 * | 119.52 * f |
| October 31, 2008 | 12.60 | .58 | (2.13) | (1.55) | (.65) | (.65) | — e | 10.40 | (13.01) | 16,798 | 1.38 | 4.70 | 181.55 f |
| October 31, 2007 | 12.04 | .43 | .58 | 1.01 | (.45) | (.45) | — e | 12.60 | 8.54 | 20,088 | 1.41 | 3.58 | 103.10 f |
| October 31, 2006 | 12.10 | .34 g | .22 | .56 | (.62) | (.62) | — e | 12.04 | 4.79 | 21,974 | 1.42 g | 2.81 g | 97.83 f |
| October 31, 2005 | 12.66 | .34 | (.42) | (.08) | (.48) | (.48) | — e | 12.10 | (.73) | 25,065 | 1.47 | 2.70 | 197.70 f |
| October 31, 2004 | 12.58 | .30 | .87 | 1.17 | (1.09) | (1.09) | — e | 12.66 | 9.77 | 31,245 | 1.54 | 2.40 | 162.13 |
|
| Class R | | | | | | | | | | | | | |
| April 30, 2009 ** | $10.46 | .22 | .25 | .47 | (.34) | (.34) | — e | $10.59 | 4.76 * | $484 | .68 * | 2.17 * | 119.52 * f |
| October 31, 2008 | 12.67 | .59 | (2.15) | (1.56) | (.65) | (.65) | — e | 10.46 | (13.01) | 527 | 1.38 | 4.69 | 181.55 f |
| October 31, 2007 | 12.12 | .44 | .56 | 1.00 | (.45) | (.45) | — e | 12.67 | 8.42 | 422 | 1.41 | 3.52 | 103.10 f |
| October 31, 2006 | 12.17 | .32 g | .25 | .57 | (.62) | (.62) | — e | 12.12 | 4.86 | 127 | 1.42 g | 2.67 g | 97.83 f |
| October 31, 2005 | 12.74 | .36 | (.44) | (.08) | (.49) | (.49) | — e | 12.17 | (.74) | 70 | 1.47 | 2.72 | 197.70 f |
| October 31, 2004 † | 12.81 | .27 | .73 | 1.00 | (1.07) | (1.07) | — e | 12.74 | 8.21 * | 2 | 1.41 * | 2.21 * | 162.13 |
|
| Class Y | | | | | | | | | | | | | |
| April 30, 2009 ** | $10.48 | .24 | .25 | .49 | (.37) | (.37) | — e | $10.60 | 4.91 * | $4,493 | .43 * | 2.42 * | 119.52 * f |
| October 31, 2008 | 12.70 | .66 | (2.18) | (1.52) | (.71) | (.71) | .01 | 10.48 | (12.61) | 5,429 | .88 | 5.24 | 181.55 f |
| October 31, 2007 | 12.13 | .50 | .58 | 1.08 | (.51) | (.51) | — e | 12.70 | 9.12 | 3,228 | .91 | 4.06 | 103.10 f |
| October 31, 2006 | 12.18 | .40 g | .23 | .63 | (.68) | (.68) | — e | 12.13 | 5.34 | 2,517 | .92 g | 3.31 g | 97.83 f |
| October 31, 2005 †† | 12.31 | .03 | (.10) | (.07) | (.06) | (.06) | — e | 12.18 | (.61) * | 3,529 | .07 * | .24 * | 197.70 f |
|
See notes to financial highlights at the end of this section.
The accompanying notes are an integral part of these financial statements.
Financial highlights (Continued)
* Not annualized.
**Unaudited.
† For the period December 1, 2003 (commencement of operations) to October 31, 2004.
†† For the period October 4, 2005 (commencement of operations) to October 31, 2005.
a Per share net investment income (loss) has been determined on the basis of the weighted average number of shares outstanding during the period.
b Reflects an involuntary contractual expense limitation in effect during the period. For periods prior to April 30, 2009, certain fund expenses were waived in connection with the fund’s investment in Putnam Prime Money Market Fund. As a result of such limitation and/or waivers, the expenses of each class reflect a reduction of the following amounts (Note 2):
| | | | | | |
| | 4/30/09 | 10/31/08 | 10/31/07 | 10/31/06 | 10/31/05 | 10/31/04 |
|
| Class A | 0.21% | 0.33% | 0.34% | 0.31% | 0.14% | 0.09% |
|
| Class B | 0.21 | 0.33 | 0.34 | 0.31 | 0.14 | 0.09 |
|
| Class C | 0.21 | 0.33 | 0.34 | 0.31 | 0.14 | 0.09 |
|
| Class M | 0.21 | 0.33 | 0.34 | 0.31 | 0.14 | 0.09 |
|
| Class R | 0.21 | 0.33 | 0.34 | 0.31 | 0.14 | 0.09 |
|
| Class Y | 0.21 | 0.33 | 0.34 | 0.31 | 0.02 | N/A |
|
c Total return assumes dividend reinvestment and does not reflect the effect of sales charges.
d Includes amounts paid through expense offset arrangements (Note 2).
e Amount represents less than $0.01 per share.
f Portfolio turnover excludes dollar roll transactions.
g Reflects a non-recurring reimbursement from Putnam Investments relating to the calculation of certain amounts paid by the fund to Putnam in previous years for transfer agent services, which amounted to less than $0.01 per share and 0.01% of average net assets for the period ended October 31, 2006.
The accompanying notes are an integral part of these financial statements.
74
Notes to financial statements 4/30/09 (Unaudited)
Note 1: Significant accounting policies
Putnam Global Income Trust (the “fund”), a Massachusetts business trust, is registered under the Investment Company Act of 1940, as amended, as a non-diversified, open-end management investment company. The investment objective of the fund is to seek high current income by investing in a portfolio primarily consisting of investment-grade debt securities of sovereign and private issuers worldwide, including supranational issuers, that have intermediate- to long-term maturities. The fund’s secondary objectives are preservation of capital and long-term total return, but only to the extent that these are consistent with the objective of seeking high current income. The fund may invest in higher yielding, lower rated bonds that may have a higher rate of default. The fund may invest a significant portion of its assets in securitized debt instruments, including mortgage-backed and asset-backed investments. The yields and values of these investments are sensi tive to changes in interest rates, the rate of principal payments on the underlying assets and the market’s perception of the issuers. The market for these investments may be volatile and limited, which may make them difficult to buy or sell.
The fund offers class A, class B, class C, class M, class R and class Y shares. Class A and class M shares are sold with a maximum front-end sales charge of 4.00% and 3.25%, respectively, and generally do not pay a contingent deferred sales charge. Class B shares, which convert to class A shares after approximately eight years, do not pay a front-end sales charge and are subject to a contingent deferred sales charge, if those shares are redeemed within six years of purchase. Class C shares have a one-year 1.00% contingent deferred sales charge and do not convert to class A shares. Class R shares, which are offered to qualified employee-benefit plans, are sold at net asset value. The expenses for class A, class B, class C, class M and class R shares may differ based on the distribution fee of each class, which is identified in Note 2. Class Y shares, which are sold at net asset value, are generally subject to the same expenses as class A, class B, class C, class M an d class R shares, but do not bear a distribution fee. Class Y shares are generally only available to corporate and institutional clients and clients in other approved programs.
A 1.00% redemption fee may apply on any shares that are redeemed (either by selling or exchanging into another fund) within 90 days of purchase. The redemption fee is accounted for as an addition to paid-in-capital.
Investment income, realized and unrealized gains and losses and expenses of the fund are borne pro-rata based on the relative net assets of each class to the total net assets of the fund, except that each class bears expenses unique to that class (including the distribution fees applicable to such classes). Each class votes as a class only with respect to its own distribution plan or other matters on which a class vote is required by law or determined by the Trustees. If the fund were liquidated, shares of each class would receive their pro-rata share of the net assets of the fund. In addition, the Trustees declare separate dividends on each class of shares.
In the normal course of business, the fund enters into contracts that may include agreements to indemnify another party under given circumstances. The fund’s maximum exposure under these arrangements is unknown as this would involve future claims that may be, but have not yet been, made against the fund. However, the fund’s management team expects the risk of material loss to be remote.
The following is a summary of significant accounting policies consistently followed by the fund in the preparation of its financial statements. The preparation of financial statements is in conformity with accounting principles generally accepted in the United States of America and requires management to make estimates and assumptions that affect the reported amounts of assets and liabilities in the financial statements and the reported amounts of increases and decreases in net assets from operations during the reporting period. Actual results could differ from those estimates.
A) Security valuation Market quotations are not considered to be readily available for certain debt obligations; such investments are valued on the basis of valuations furnished by an independent pricing service approved by the Trustees or dealers selected by Putnam Investment Management, LLC (“Putnam Management”), the fund’s manager, a wholly-owned subsidiary of Putnam Investments, LLC. Such services or dealers determine valuations for normal institutional-size trading units of such securities using methods based on market transactions for comparable securities and various relationships, generally recognized by institutional traders, between securities. Securities quoted in foreign currencies, if any, are translated into U.S. dollars at the current exchange rate. To the extent a pricing service or dealer is unable to value a security or provides a valuation which Putnam Management does not believe accurately reflects the security’s fair value, the security will be valued at fair value by Putnam Management. Certain investments, including certain restricted and illiquid securities and derivatives, are also valued at fair value following procedures approved by the Trustees. Such valuations and procedures are
75
reviewed periodically by the Trustees. Certain securities may be valued on the basis of a price provided by a single source. The fair value of securities is generally determined as the amount that the fund could reasonably expect to realize from an orderly disposition of such securities over a reasonable period of time. By its nature, a fair value price is a good faith estimate of the value of a security at a given point in time and does not reflect an actual market price, which may be different by a material amount.
B) Security transactions and related investment income Security transactions are recorded on the trade date (the date the order to buy or sell is executed). Gains or losses on securities sold are determined on the identified cost basis.
Interest income is recorded on the accrual basis. All premiums/discounts are amortized/accreted on a yield-to-maturity basis.
Securities purchased or sold on a delayed delivery basis may be settled a month or more after the trade date; interest income is accrued based on the terms of the securities. Losses may arise due to changes in the market value of the underlying securities or if the counterparty does not perform under the contract.
The fund earned certain fees in connection with its senior loan purchasing activities. These fees are treated as market discount and are recorded as income in the Statement of operations.
C) Stripped securities The fund may invest in stripped securities which represent a participation in securities that may be structured in classes with rights to receive different portions of the interest and principal. Interest-only securities receive all of the interest and principal-only securities receive all of the principal. If the interest-only securities experience greater than anticipated prepayments of principal, the fund may fail to recoup fully its initial investment in these securities. Conversely, principal-only securities increase in value if prepayments are greater than anticipated and decline if prepayments are slower than anticipated. The market value of these securities is highly sensitive to changes in interest rates.
D) Foreign currency translation The accounting records of the fund are maintained in U.S. dollars. The market value of foreign securities, currency holdings, and other assets and liabilities is recorded in the books and records of the fund after translation to U.S. dollars based on the exchange rates on that day. The cost of each security is determined using historical exchange rates. Income and withholding taxes are translated at prevailing exchange rates when earned or incurred. The fund does not isolate that portion of realized or unrealized gains or losses resulting from changes in the foreign exchange rate on investments from fluctuations arising from changes in the market prices of the securities. Such gains and losses are included with the net realized and unrealized gain or loss on investments. Net realized gains and losses on foreign currency transactions represent net realized e xchange gains or losses on closed forward currency contracts, disposition of foreign currencies, currency gains and losses realized between the trade and settlement dates on securities transactions and the difference between the amount of investment income and foreign withholding taxes recorded on the fund’s books and the U.S. dollar equivalent amounts actually received or paid. Net unrealized appreciation and depreciation of assets and liabilities in foreign currencies arise from changes in the value of open forward currency contracts and assets and liabilities other than investments at the period end, resulting from changes in the exchange rate. Investments in foreign securities involve certain risks, including those related to economic instability, unfavorable political developments, and currency fluctuations, not present with domestic investments.
E) Futures and options contracts The fund may use futures and options contracts to hedge against changes in the values of securities the fund owns, owned or expects to purchase, or for other investment purposes. The fund may also write options on swaps or securities it owns or in which it may invest to increase its current returns.
The potential risk to the fund is that the change in value of futures and options contracts may not correspond to the change in value of the hedged instruments. In addition, losses may arise from changes in the value of the underlying instruments, if there is an illiquid secondary market for the contracts, interest or exchange rates moving unexpectedly or if the counterparty to the contract is unable to perform. Risks may exceed amounts recognized on the Statement of assets and liabilities. When the contract is closed, the fund records a realized gain or loss equal to the difference between the value of the contract at the time it was opened and the value at the time it was closed. Realized gains and losses on purchased options are included in realized gains and losses on investment securities. If a written call option is exercised, the premium originally received is recorded as an addition to sales proceeds. If a written put option is exercised, the premium origina lly received is recorded as a reduction to the cost of investments.
Futures contracts are valued at the quoted daily settlement prices established by the exchange on which they trade. The fund and the broker agree to exchange an amount of cash equal to the daily fluctuation in the value of the futures contract. Such receipts or payments are known as “variation margin.” Exchange traded options are valued at the last sale price or, if no sales are reported, the last bid price for purchased
76
options and the last ask price for written options. Options traded over-the-counter are valued using prices supplied by dealers. Futures and written option contracts outstanding at period end, if any, are listed after the fund’s portfolio.
F) Forward currency contracts The fund may buy and sell forward currency contracts, which are agreements between two parties to buy and sell currencies at a set price on a future date. These contracts are used to protect against a decline in value relative to the U.S. dollar of the currencies in which its portfolio securities are denominated or quoted (or an increase in the value of a currency in which securities a fund intends to buy are denominated, when a fund holds cash reserves and short term investments), or for other investment purposes. The U.S. dollar value of forward currency contracts is determined using current forward currency exchange rates supplied by a quotation service. The market value of the contract will fluctuate with changes in currency exchange rates. The contract is marked to market daily and the change in market value is recorded as an unrealized gain or loss. When the contract is closed, the fund r ecords a realized gain or loss equal to the difference between the value of the contract at the time it was opened and the value at the time it was closed. The fund could be exposed to risk if the value of the currency changes unfavorably, if the counterparties to the contracts are unable to meet the terms of their contracts or if the fund is unable to enter into a closing position. Risks may exceed amounts recognized on the Statement of assets and liabilities. Forward currency contracts outstanding at period end, if any, are listed after the fund’s portfolio.
G) Total return swap contracts The fund may enter into total return swap contracts, which are arrangements to exchange a market linked return for a periodic payment, both based on a notional principal amount. To the extent that the total return of the security, index or other financial measure underlying the transaction exceeds or falls short of the offsetting interest rate obligation, the fund will receive a payment from or make a payment to the counterparty. Total return swap contracts are marked to market daily based upon quotations from market makers and the change, if any, is recorded as an unrealized gain or loss. Payments received or made are recorded as realized gains or losses. Certain total return swap contracts may include extended effective dates. Payments related to these swap contracts are accrued based on the terms of the contract. The fund could be exposed to credit or market risk due to unfavorable changes in the fluctuation of interest rates or in the price of the underlying security or index, the possibility that there is no liquid market for these agreements or that the counterparty may default on its obligation to perform. Risk of loss may exceed amounts recognized on the Statement of assets and liabilities. Total return swap contracts outstanding at period end, if any, are listed after the fund’s portfolio.
H) Interest rate swap contracts The fund may enter into interest rate swap contracts, which are arrangements between two parties to exchange cash flows based on a notional principal amount, to manage the fund’s exposure to interest rates. An interest rate swap can be purchased or sold with an upfront premium. An upfront payment received by the fund is recorded as a liability on the fund’s books. An upfront payment made by the fund is recorded as an asset on the fund’s books. Interest rate swap contracts are marked to market daily based upon quotations from an independent pricing service or market makers and the change, if any, is recorded as an unrealized gain or loss. Payments received or made are recorded as realized gains or losses. Certain interest rate swap contracts may include extended effective dates. Payments related to these swap contracts are accrued based on the terms of the contract. The fund cou ld be exposed to credit or market risk due to unfavorable changes in the fluctuation of interest rates or if the counterparty defaults on its obligation to perform. Risk of loss may exceed amounts recognized on the Statement of assets and liabilities. Interest rate swap contracts outstanding at period end, if any, are listed after the fund’s portfolio.
I) Credit default contracts The fund may enter into credit default contracts to provide a measure of protection against risk of loss following a default, or other credit event in respect of issuers within an underlying index or a single issuer, or to gain credit exposure to an underlying index or issuer. In a credit default contract, the protection buyer typically makes an up front payment and a periodic stream of payments to a counterparty, the protection seller, in exchange for the right to receive a contingent payment upon the occurrence of a credit event on the reference obligation or all other equally ranked obligations of the reference entity. Credit events are contract specific but may include bankruptcy, failure to pay, restructuring and obligation acceleration. An upfront payment received by the fund, as the protection seller, is recorded as a liability on the fund’s books. An upfront payment made by the fund, as the protection buyer, is recorded as an asset on the fund’s books. Periodic payments received or paid by the fund are recorded as realized gains or losses. The credit default contracts are marked to market daily based upon quotations from an independent pricing service or market makers and the change, if any, is recorded as an unrealized gain or loss. Upon the occurrence of a credit event, the difference between the par value and market value of the reference obligation, net of any proportional amount of the upfront payment, is recorded as a realized gain or loss.
77
In addition to bearing the risk that the credit event will occur, the fund could be exposed to market risk due to unfavorable changes in interest rates or in the price of the underlying security or index or the possibility that the fund may be unable to close out its position at the same time or at the same price as if it had purchased the underlying reference obligations. In certain circumstances, the fund may enter into offsetting credit default contracts which would mitigate its risk of loss. Risks of loss may exceed amounts recognized on the Statement of assets and liabilities.. The fund’s maximum risk of loss from counterparty risk, either as the protection seller or as the protection buyer, is the fair value of the contract. This risk is mitigated by having a master netting arrangement between the fund and the counterparty. Where the fund is a seller of protection, the maximum potential amount of future payments the fund may be required to make is equal t o the notional amount of the relevant credit default contract. Credit default contracts outstanding, including their respective notional amounts at period end, if any, are listed after the fund’s portfolio.
J) Master agreements The fund is a party to ISDA (International Swap and Derivatives Association, Inc.) Master Agreements (“Master Agreements”) with certain counterparties that govern over the counter derivative and foreign exchange contracts entered into from time to time. The Master Agreements may contain provisions regarding, among other things, the parties’ general obligations, representations, agreements, collateral requirements, events of default and early termination. With respect to certain counterparties, in accordance with the terms of the Master Agreements, collateral posted to the fund is held in a segregated account by the fund’s custodian; collateral pledged by the fund is segregated by the fund’s custodian and identified in The fund’s portfolio. Collateral can be in the form of cash or debt securities issued by the U.S. Government or related agencies or other securities as agreed to by the fund and the applicable counterparty. Termination events applicable to the fund may occur upon a decline in the fund’s net assets below a specified threshold over a certain period of time. Termination events applicable to counterparties may occur upon a decline in the counterparty’s long-term and short-term credit ratings below a specified level. In each case, upon occurrence, the other party may elect to terminate early and cause settlement of all derivative and foreign exchange contracts outstanding, including the payment of any losses and costs resulting from such early termination, as reasonably determined by the terminating party. Any decision by one or more of the fund’s counterparties to elect early termination could impact the fund’s future derivative activity.
K) TBA purchase commitments The fund may enter into “TBA” (to be announced) commitments to purchase securities for a fixed unit price at a future date beyond customary settlement time. Although the unit price has been established, the principal value has not been finalized. However ,it is anticipated that the amount of the commitments will not significantly differ from the principal amount. The fund holds, and maintains until settlement date, cash or high-grade debt obligations in an amount sufficient to meet the purchase price, or the fund may enter into offsetting contracts for the forward sale of other securities it owns. Income on the securities will not be earned until settlement date. TBA purchase commitments may be considered securities themselves, and involve a risk of loss if the value of the security to be purchased declines prior to the settlement date, which risk is in addition to the risk of decline i n the value of the fund’s other assets. Unsettled TBA purchase commitments are valued at fair value of the underlying securities, according to the procedures described under “Security valuation” above. The contract is marked to market daily and the change in market value is recorded by the fund as an unrealized gain or loss.
Although the fund will generally enter into TBA purchase commitments with the intention of acquiring securities for its portfolio or for delivery pursuant to options contracts it has entered into, the fund may dispose of a commitment prior to settlement if Putnam Management deems it appropriate to do so.
L) TBA sale commitments The fund may enter into TBA sale commitments to hedge its portfolio positions or to sell mortgage-backed securities it owns under delayed delivery arrangements. Proceeds of TBA sale commitments are not received until the contractual settlement date. During the time a TBA sale commitment is outstanding, equivalent deliverable securities or an offsetting TBA purchase commitment deliverable on or before the sale commitment date, are held as “cover” for the transaction.
Unsettled TBA sale commitments are valued at the fair value of the underlying securities, generally according to the procedures described under “Security valuation” above. The contract is marked to market daily and the change in market value is recorded by the fund as an unrealized gain or loss. If the TBA sale commitment is closed through the acquisition of an offsetting TBA purchase commitment, the fund realizes a gain or loss. If the fund delivers securities under the commitment, the fund realizes a gain or a loss from the sale of the securities based upon the unit price established at the date the commitment was entered into. TBA sale commitments outstanding at period end, if any, are listed after the fund’s portfolio.
78
M) Dollar rolls To enhance returns, the fund may enter into dollar rolls (principally using TBAs) in which the fund sells securities for delivery in the current month and simultaneously contracts to purchase similar securities on a specified future date. During the period between the sale and subsequent purchase, the fund will not be entitled to receive income and principal payments on the securities sold. The fund will, however, retain the difference between the initial sales price and the forward price for the future purchase. The fund will also be able to earn interest on the cash proceeds that are received from the initial sale, on settlement date. The fund may be exposed to market or credit risk if the price of the security changes unfavorably or the counterparty fails to perform under the terms of the agreement.
N) Federal taxes It is the policy of the fund to distribute all of its taxable income within the prescribed time and otherwise comply with the provisions of the Internal Revenue Code of 1986, as amended (the “Code”), applicable to regulated investment companies. It is also the intention of the fund to distribute an amount sufficient to avoid imposition of any excise tax under Section 4982 of the Code. The fund is subject to the provisions of FASB Interpretation No. 48, Accounting for Uncertainties in Income Taxes (“FIN 48”). FIN 48 sets forth a minimum threshold for financial statement recognition of the benefit of a tax position taken or expected to be taken in a tax return. The fund did not have any unrecognized tax benefits in the accompanying financial statements. No provision has been made for federal taxes on income, cap ital gains or unrealized appreciation on securities held nor for excise tax on income and capital gains. Each of the fund’s federal tax returns for the prior three fiscal years remains subject to examination by the Internal Revenue Service and state departments of revenue.
At October 31, 2008, the fund had a capital loss carryover of $10,676,677 available to the extent allowed by the Code to offset future net capital gain, if any. The amount of the carryover and the expiration dates are:
| | | |
| Loss Carryover | Expiration | | |
| | |
| $1,114,179 | October 31, 2009 | | |
| | |
| 3,236,861 | October 31, 2010 | | |
| | |
| 249,360 | October 31, 2014 | | |
| | |
| 1,885,328 | October 31, 2015 | | |
| | |
| 4,190,949 | October 31, 2016 | | |
| | |
The aggregate identified cost on a tax basis is $186,325,302, resulting in gross unrealized appreciation and depreciation of $9,205,020 and $18,176,421, respectively, or net unrealized depreciation of $8,971,401.
O) Distributions to shareholders Distributions to shareholders from net investment income are recorded by the fund on the ex-dividend date. Distributions from capital gains, if any, are recorded on the ex-dividend date and paid at least annually. The amount and character of income and gains to be distributed are determined in accordance with income tax regulations, which may differ from generally accepted accounting principles. Dividend sources are estimated at the time of declaration. Actual results may vary. Any non-taxable return of capital cannot be determined until final tax calculations are completed after the end of the fund’s fiscal year. Reclassifications are made to the fund’s capital accounts to reflect income and gains available for distribution (or available capital loss carryovers) under income tax regulations.
Note 2: Management fee, administrative
services and other transactions
The fund pays Putnam Management for management and investment advisory services quarterly based on the average net assets of the fund. Such fee is based on the following annual rates: 0.70% of the first $500 million of average net assets, 0.60% of the next $500 million, 0.55% of the next $500 million, 0.50% of the next $5 billion, 0.475% of the next $5 billion, 0.455% of the next $5 billion, 0.44% of the next $5 billion and 0.43% thereafter.
Putnam Management has agreed to waive fees and reimburse expenses of the fund through October 31, 2009 to the extent necessary to ensure that the fund’s expenses do not exceed the simple average of the expenses of all front-end load funds viewed by Lipper Inc. as having the same investment classification or objective as the fund. The expense reimbursement is based on a comparison of the fund’s expenses with the average annualized operating expenses of the funds in its Lipper peer group for each calendar quarter during the fund’s last fiscal year, excluding 12b-1 fees and without giving effect to any expense offset and brokerage/service arrangements that may reduce fund expenses.
Putnam Management has further agreed to waive fees and reimburse expenses of the fund for the period from July 1, 2008 through June 30, 2009 to the extent necessary to ensure that the fund’s expenses do not exceed the simple average of the expenses of a custom group of competitive funds selected by Lipper Inc. based on the size of the fund. The expense reimbursement is based on a comparison of the fund’s total expenses with the average operating expenses of the funds in this Lipper custom peer group for their respective 2007 fiscal years, excluding 12b-1 fees and after adjustment for certain expense offset and brokerage/service arrangements that reduced expenses of the fund.
79
For the period ended April 30, 2009, the fund’s expenses were limited to the lower of the limits specified above and accordingly, Putnam Management waived $238,235 of its management fee from the fund.
Putnam Investments Limited (“PIL”), an affiliate of Putnam Management, is authorized by the Trustees to manage a separate portion of the assets of the fund as determined by Putnam Management from time to time. Putnam Management pays a quarterly sub-management fee to PIL for its services at an annual rate of 0.40% of the average net assets of the portion of the fund managed by PIL.
On September 26, 2008, the fund entered into Agreements with other registered investment companies (each a “Purchaser”) managed by Putnam Management. Under the Agreements, the fund sold to the Purchasers the fund’s right to receive, in the aggregate, $290,270 in net payments from Lehman Brothers Special Financing, Inc. in connection with certain terminated derivatives transactions (the “Receivable”), in each case in exchange for an initial payment plus (or minus) additional amounts based on the applicable Purchaser’s ultimate realized gain (or loss) on the Receivable. The Receivable will be offset against the funds net receivable from Lehman Brothers Special Financing, Inc. which is included in the Statement of assets and liabilities within Receivable for investments sold. The Agreements, which are included in the Statement of assets and liabilities, are valued at fair value following procedures approved by the Trustees. All remaining p ayments under the agreement will be recorded as realized gain or loss.
The fund reimburses Putnam Management an allocated amount for the compensation and related expenses of certain officers of the fund and their staff who provide administrative services to the fund. The aggregate amount of all such reimbursements is determined annually by the Trustees.
Custodial functions for the fund’s assets were provided by State Street Bank and Trust Company (“State Street”). Custody fees are based on the fund’s asset level, the number of its security holdings and transaction volumes.
Putnam Investor Services, Inc., an affiliate of Putnam Management, provided investor servicing agent functions to the fund. Prior to December 31, 2008, these services were provided by Putnam Investor Services, a division of Putnam Fiduciary Trust Company (“PFTC”), which is an affiliate of Putnam Management. Putnam Investor Services, Inc. and Putnam Investor Services received fees for investor servicing, subject to certain limitations, based on the number of shareholder accounts in the fund and the level of defined contribution plan assets in the fund. The amounts incurred for investor servicing agent functions provided by affiliates of Putnam Management during the six months ended April, 30, 2009 are included in Investor servicing fees in the Statement of operations.
The fund has entered into expense offset arrangements with PFTC and State Street whereby PFTC’s and State Street’s fees are reduced by credits allowed on cash balances. For the six months ended April 30, 2009, the fund’s expenses were reduced by $1,591 under the expense offset arrangements.
Each independent Trustee of the fund receives an annual Trustee fee, of which $319, as a quarterly retainer, has been allocated to the fund, and an additional fee for each Trustees meeting attended. Trustees receive additional fees for attendance at certain committee meetings and industry seminars and for certain compliance-related matters. Trustees also are reimbursed for expenses they incur relating to their services as Trustees.
The fund has adopted a Trustee Fee Deferral Plan (the “Deferral Plan”) which allows the Trustees to defer the receipt of all or a portion of Trustees fees payable on or after July 1, 1995. The deferred fees remain invested in certain Putnam funds until distribution in accordance with the Deferral Plan.
The fund has adopted an unfunded noncontributory defined benefit pension plan (the “Pension Plan”) covering all Trustees of the fund who have served as a Trustee for at least five years and were first elected prior to 2004. Benefits under the Pension Plan are equal to 50% of the Trustee’s average annual attendance and retainer fees for the three years ended December 31, 2005. The retirement benefit is payable during a Trustee’s lifetime, beginning the year following retirement, for the number of years of service through December 31, 2006. Pension expense for the fund is included in Trustee compensation and expenses in the Statement of operations. Accrued pension liability is included in Payable for Trustee compensation and expenses in the Statement of assets and liabilities. The Trustees have terminated the Pension Plan with respect to any Trustee first elected after 2003.
The fund has adopted distribution plans (the “Plans”) with respect to its class A, class B, class C, class M and class R shares pursuant to Rule 12b-1 under the Investment Company Act of 1940. The purpose of the Plans is to compensate Putnam Retail Management Limited Partnership, a wholly-owned subsidiary of Putnam Investments, LLC and Putnam Retail Management GP, Inc., for services provided and expenses incurred in distributing shares of the fund. The Plans provide for payments by the fund to Putnam Retail Management Limited Partnership at an annual rate of up to 0.35%, 1.00%, 1.00%, 1.00% and 1.00% of the average net assets attributable to class A, class B, class C, class M and class R shares, respectively. The
80
Trustees have approved payment by the fund at an annual rate of 0.25%, 1.00%, 1.00%, 0.50% and 0.50% of the average net assets attributable to class A, class B, class C, class M and class R shares, respectively.
For the six months ended April 30, 2009, Putnam Retail Management Limited Partnership, acting as underwriter, received net commissions of $2,361 and $2,794 from the sale of class A and class M shares, respectively, and received $3,133 and $320 in contingent deferred sales charges from redemptions of class B and class C shares, respectively.
A deferred sales charge of up to 1.00% and 0.40% is assessed on certain redemptions of class A and class M shares, respectively. For the six months ended April 30, 2009, Putnam Retail Management Limited Partnership, acting as underwriter, received $8 and no monies on class A and class M redemptions, respectively.
Note 3: Purchases and sales of securities
During the six months ended April 30, 2009, cost of purchases and proceeds from sales of investment securities other than U.S. government securities and short-term investments aggregated $132,886,512 and $148,930,723, respectively. There were no purchases or sales of U.S. government securities.
Written option transactions during the six months ended April 30, 2009 are summarized as follows:
| | | | | |
| | | Contract | Premiums | | |
| | | Amounts | Received | | |
| | |
| Written | | | | | |
| options | | | | | |
| outstanding | | | | | |
| at beginning | USD | 13,871,000 | $491,706 | | |
| of period | EUR | — | $ — | | |
| | |
| Options | USD | 29,932,000 | 1,346,941 | | |
| opened | EUR | 2,170,000 | 102,424 | | |
| | |
| Options | USD | — | — | | |
| exercised | EUR | — | — | | |
| | |
| Options | USD | (5,962,000) | (178,115) | | |
| expired | EUR | — | — | | |
| | |
| Options | USD | — | — | | |
| closed | EUR | (2,170,000) | (102,424) | | |
| | |
| Written | | | | | |
| options | | | | | |
| outstanding | | | | | |
| at end | USD | 37,841,000 | $1,660,532 | | |
| of period | EUR | — | $ — | | |
| | |
Note 4: Capital shares
At April 30, 2009, there was an unlimited number of shares of beneficial interest authorized. Transactions in capital shares were as follows:
| | | | |
| | Six months ended 4/30/09 | Year ended 10/31/08 |
|
| Class A | Shares | Amount | Shares | Amount |
|
| Shares sold | 561,686 | $5,639,241 | 4,376,689 | $55,684,614 |
|
| Shares issued in connection with | 245,189 | 2,462,437 | 409,026 | 5,059,650 |
| reinvestment of distributions | | | | |
|
| | 806,875 | 8,101,678 | 4,785,715 | 60,744,264 |
|
| Shares repurchased | (1,883,935) | (18,810,837) | (3,320,921) | (40,847,725) |
|
| Net increase (decrease) | (1,077,060) | $(10,709,159) | 1,464,794 | $19,896,539 |
|
| |
| | Six months ended 4/30/09 | Year ended 10/31/08 |
|
| Class B | Shares | Amount | Shares | Amount |
|
| Shares sold | 52,842 | $534,276 | 730,943 | $9,290,110 |
|
| Shares issued in connection with | 20,602 | 206,064 | 39,503 | 488,018 |
| reinvestment of distributions | | | | |
|
| | 73,444 | 740,340 | 770,446 | 9,778,128 |
|
| Shares repurchased | (290,909) | (2,929,095) | (696,747) | (8,626,622) |
|
| Net increase (decrease) | (217,465) | $(2,188,755) | 73,699 | $1,151,506 |
|
81
| | | | |
| | Six months ended 4/30/09 | Year ended 10/31/08 |
|
| Class C | Shares | Amount | Shares | Amount |
|
| Shares sold | 27,806 | $281,138 | 327,120 | $4,179,325 |
|
| Shares issued in connection with | 8,235 | 82,474 | 14,376 | 177,230 |
| reinvestment of distributions | | | | |
|
| | 36,041 | 363,612 | 341,496 | 4,356,555 |
|
| Shares repurchased | (126,775) | (1,257,110) | (193,046) | (2,302,711) |
|
| Net increase (decrease) | (90,734) | $(893,498) | 148,450 | $2,053,844 |
|
| |
| | Six months ended 4/30/09 | Year ended 10/31/08 |
|
| Class M | Shares | Amount | Shares | Amount |
|
| Shares sold | 123,913 | $1,234,726 | 332,773 | $4,053,852 |
|
| Shares issued in connection with | 4,508 | 44,862 | 10,026 | 123,581 |
| reinvestment of distributions | | | | |
|
| | 128,421 | 1,279,588 | 342,799 | 4,177,433 |
|
| Shares repurchased | (109,340) | (1,100,524) | (322,283) | (4,023,388) |
|
| Net increase | 19,081 | $179,064 | 20,516 | $154,045 |
|
| |
| | Six months ended 4/30/09 | Year ended 10/31/08 |
|
| Class R | Shares | Amount | Shares | Amount |
|
| Shares sold | 10,651 | $ 107,479 | 25,931 | $325,120 |
|
| Shares issued in connection with | 1,562 | 15,670 | 2,277 | 28,080 |
| reinvestment of distributions | | | | |
|
| | 12,213 | 123,149 | 28,208 | 353,200 |
|
| Shares repurchased | (16,922) | (171,493) | (11,110) | (141,211) |
|
| Net increase (decrease) | (4,709) | $(48,344) | 17,098 | $211,989 |
|
| |
| | Six months ended 4/30/09 | Year ended 10/31/08 |
|
| Class Y | Shares | Amount | Shares | Amount |
|
| Shares sold | 37,837 | $380,982 | 452,247 | $5,756,139 |
|
| Shares issued in connection with | 16,880 | 169,438 | 30,007 | 371,544 |
| reinvestment of distributions | | | | |
|
| | 54,717 | 550,420 | 482,254 | 6,127,683 |
|
| Shares repurchased | (149,000) | (1,472,099) | (218,352) | (2,697,278) |
|
| Net increase (decrease) | (94,283) | $(921,679) | 263,902 | $3,430,405 |
|
Note 5: Investment in Putnam Money Market
Liquidity Fund
The fund invested in Putnam Money Market Liquidity Fund, an open-end management investment company managed by Putnam Management. Investments in Putnam Money Market Liquidity Fund are valued at its closing net asset value each business day. Income distributions earned by the fund are recorded as interest income in the Statement of operations and totaled $803 for the period ended April 30, 2009. During the period ended April 30, 2009, cost of purchases and proceeds of sales of investments in Putnam Money Market Liquidity Fund aggregated $6,048,535 and $2,274,547, respectively. Management fees charged to Putnam Money Market Liquidity Fund have been waived by Putnam Management.
Note 6: Senior loan commitments
Senior loans are purchased or sold on a when-issued or delayed delivery basis and may be settled a month or more after the trade date, which from time to time can delay the actual investment of available cash balances; interest income is accrued based on the terms of the securities. Senior loans can be acquired through an agent, by assignment from another holder of the loan, or as a participation interest in another holder’s portion of the loan. When the fund invests in a loan or participation, the fund is subject to the risk that an
82
intermediate participant between the fund and the borrower will fail to meet its obligations to the fund, in addition to the risk that the borrower under the loan may default on its obligations.
Note 7: Regulatory matters and litigation
In late 2003 and 2004, Putnam Management settled charges brought by the Securities and Exchange Commission (the “SEC”) and the Massachusetts Securities Division in connection with excessive short-term trading in Putnam funds. Distribution of payments from Putnam Management to certain open-end Putnam funds and their shareholders is expected to be completed in the next several months. These allegations and related matters have served as the general basis for certain lawsuits, including purported class action lawsuits against Putnam Management and, in a limited number of cases, some Putnam funds. Putnam Management believes that these lawsuits will have no material adverse effect on the funds or on Putnam Management’s ability to provide investment management services. In addition, Putnam Management has agreed to bear any costs incurred by the Putnam funds as a result of these matters.
Note 8: New accounting pronouncements
In March 2008, Statement of Financial Accounting Standards No. 161, Disclosures about Derivative Instruments and Hedging Activities (“SFAS 161”) — an amendment of FASB Statement No. 133, was issued and is effective for fiscal years and interim periods beginning after November 15, 2008. SFAS 161 requires enhanced disclosures about how and why an entity uses derivative instruments and how derivative instruments affect an entity’s financial position. Putnam Management is currently evaluating the impact the adoption of SFAS 161 will have on the fund’s financial statement disclosures.
In April 2009, FASB issued a new FASB Staff Position FSP FAS 157-4 which amends FASB Statement No. 157, Fair Value Measurements, and is effective for interim and annual periods ending after June 15, 2009. FSP FAS 157-4 provides additional guidance when the volume and level of activity for the asset or liability measured at fair value has significantly decreased. Additionally, FSP FAS 157-4 expands disclosure by reporting entities with respect to categories of assets and liabilities carried at fair value. Putnam Management believes applying the provisions of FSP FAS 157-4 will not have a material impact on the funds financial statements.
Note 9: Market and credit risk
In the normal course of business, the fund trades financial instruments and enters into financial transactions where risk of potential loss exists due to changes in the market (market risk) or failure of the contracting party to the transaction to perform (credit risk). The fund may be exposed to additional credit risk that an institution or other entity with which the funds have unsettled or open transactions will default.
83
Services for shareholders
Investor services
Systematic investment plan Tell us how much you wish to invest regularly — weekly, semimonthly, or monthly — and the amount you choose will be transferred automatically from your checking or savings account. There’s no additional fee for this service, and you can suspend it at any time. This plan may be a great way to save for college expenses or to plan for your retirement.
Please note that regular investing does not guarantee a profit or protect against loss in a declining market. Before arranging a systematic investment plan, consider your financial ability to continue making purchases in periods when prices are low.
Systematic exchange You can make regular transfers from one Putnam fund to another Putnam fund. There are no additional fees for this service, and you can cancel or change your options at any time.
Dividends PLUS You can choose to have the dividend distributions from one of your Putnam funds automatically reinvested in another Putnam fund at no additional charge.
Free exchange privilege You can exchange money between Putnam funds free of charge, as long as they are the same class of shares. A signature guarantee is required if you are exchanging more than $500,000.
Reinstatement privilege If you’ve sold Putnam shares or received a check for a dividend or capital gain, you may reinvest the proceeds with Putnam within 90 days of the transaction and they will be reinvested at the fund’s current net asset value — with no sales charge. However, reinstatement of class B shares may have special tax consequences. Ask your financial or tax representative for details.
Check-writing service You have ready access to many Putnam accounts. It’s as simple as writing a check, and there are no special fees or service charges. For more information about the check-writing service, call Putnam or visit our Web site.
Dollar cost averaging When you’re investing for long-term goals, it’s time, not timing, that counts. Investing on a systematic basis is a better strategy than trying to figure out when the markets will go up or down. This means investing the same amount of money regularly over a long period. This method of investing is called dollar cost averaging. When a fund’s share price declines, your investment dollars buy more shares at lower prices. When it increases, they buy fewer shares. Over time, you will pay a lower average price per share.
For more information
Visit the Individual Investors section at putnam.com A secure section of our Web site contains complete information on your account, including balances and transactions, updated daily. You may also conduct transactions, such as exchanges, additional investments, and address changes. Log on today to get your password.
Call us toll free at 1-800-225-1581 Ask a helpful Putnam representative or your financial advisor for details about any of these or other services, or see your prospectus.
84
Fund information
Founded over 70 years ago, Putnam Investments was built around the concept that a balance between risk and reward is the hallmark of a well-rounded financial program. We manage over 100 mutual funds across income, value, blend, growth, asset allocation, absolute return, and global sector categories.
| | |
| Investment Manager | George Putnam, III | James P. Pappas |
| Putnam Investment | Robert L. Reynolds | Vice President |
| Management, LLC | W. Thomas Stephens | |
| One Post Office Square | Richard B. Worley | Francis J. McNamara, III |
| Boston, MA 02109 | | Vice President and |
| | Officers | Chief Legal Officer |
| Investment Sub-Manager | Charles E. Haldeman, Jr. | |
| Putnam Investments Limited | President | Robert R. Leveille |
| 57–59 St James’s Street | | Vice President and Chief |
| London, England SW1A 1LD | Charles E. Porter | Compliance Officer |
| | Executive Vice President, | |
| Marketing Services | Principal Executive Officer, | Mark C. Trenchard |
| Putnam Retail Management | Associate Treasurer and | Vice President and BSA |
| One Post Office Square | Compliance Liaison | Compliance Officer |
| Boston, MA 02109 | | |
| Jonathan S. Horwitz | Judith Cohen |
| Custodian | Senior Vice President | Vice President, Clerk and |
| State Street Bank | and Treasurer | Assistant Treasurer |
| and Trust Company | | |
| Steven D. Krichmar | Wanda M. McManus |
| Legal Counsel | Vice President and Principal | Vice President, Senior Associate |
| Ropes & Gray LLP | Financial Officer | Treasurer and Assistant Clerk |
| | | |
| Trustees | Janet C. Smith | Nancy E. Florek |
| John A. Hill, Chairman | Vice President, Principal | Vice President, Assistant Clerk, |
| Jameson A. Baxter, | Accounting Officer and | Assistant Treasurer and |
| Vice Chairman | Assistant Treasurer | Proxy Manager |
| Ravi Akhoury | | |
| Charles B. Curtis | Susan G. Malloy | |
| Robert J. Darretta | Vice President and | |
| Myra R. Drucker | Assistant Treasurer | |
| Charles E. Haldeman, Jr. | | |
| Paul L. Joskow | Beth S. Mazor | |
| Elizabeth T. Kennan | Vice President | |
| Kenneth R. Leibler | | |
| Robert E. Patterson | | |
This report is for the information of shareholders of Putnam Global Income Trust. It may also be used as sales literature when preceded or accompanied by the current prospectus, the most recent copy of Putnam’s Quarterly Performance Summary, and Putnam’s Quarterly Ranking Summary. For more recent performance, please visit putnam.com. Investors should carefully consider the investment objective, risks, charges, and expenses of a fund, which are described in its prospectus. For this and other information or to request a prospectus, call 1-800-225-1581 toll free. Please read the prospectus carefully before investing. The fund’s Statement of Additional Information contains additional information about the fund’s Trustees and is available without charge upon request by calling 1-800-225-1581.

Item 2. Code of Ethics:
Not applicable
Item 3. Audit Committee Financial Expert:
Not applicable
Item 4. Principal Accountant Fees and Services:
Not applicable
Item 5. Audit Committee of Listed Registrants
Not applicable
Item 6. Schedule of Investments:
The registrant’s schedule of investments in unaffiliated issuers is included in the report to shareholders in Item 1 above.
Item 7. Disclosure of Proxy Voting Policies and Procedures For Closed-End Management Investment Companies:
Not applicable
Item 8. Portfolio Managers of Closed-End Investment Companies
Not Applicable
Item 9. Purchases of Equity Securities by Closed-End Management Investment Companies and Affiliated Purchasers:
Not applicable
Item 10. Submission of Matters to a Vote of Security Holders:
Not applicable
Item 11. Controls and Procedures:
(a) The registrant's principal executive officer and principal financial officer have concluded, based on their evaluation of the effectiveness of the design and operation of the registrant's disclosure controls and procedures as of a date within 90 days of the filing date of this report, that the design and operation of such procedures are generally effective to provide reasonable assurance that information required to be disclosed by the registrant in this report is recorded, processed, summarized and reported within the time periods specified in the Commission's rules and forms.
(b) Changes in internal control over financial reporting: Not applicable
Item 12. Exhibits:
(a)(1) Not applicable
(a)(2) Separate certifications for the principal executive officer and principal financial officer of the registrant as required by Rule 30a-2(a) under the Investment Company Act of 1940, as amended, are filed herewith.
(b) The certifications required by Rule 30a-2(b) under the Investment Company Act of 1940, as amended, are filed herewith.
SIGNATURES
Pursuant to the requirements of the Securities Exchange Act of 1934 and the Investment Company Act of 1940, the registrant has duly caused this report to be signed on its behalf by the undersigned, thereunto duly authorized.
Putnam Global Income Trust
By (Signature and Title):
/s/Janet C. Smith
Janet C. Smith
Principal Accounting Officer
Date: June 26, 2009
Pursuant to the requirements of the Securities Exchange Act of 1934 and the Investment Company Act of 1940, this report has been signed below by the following persons on behalf of the registrant and in the capacities and on the dates indicated.
By (Signature and Title):
/s/Charles E. Porter
Charles E. Porter
Principal Executive Officer
Date: June 26, 2009
By (Signature and Title):
/s/Steven D. Krichmar
Steven D. Krichmar
Principal Financial Officer
Date: June 26, 2009