CERTIFIED SHAREHOLDER REPORT OF REGISTERED MANAGEMENT INVESTMENT COMPANIES
Investment Company Act file number:
(811-04524)
Exact name of registrant as specified in charter:
Putnam Global Income Trust
Address of principal executive offices:
One Post Office Square, Boston, Massachusetts 02109
Name and address of agent for service:
Robert T. Burns, Vice President One Post Office Square Boston, Massachusetts 02109
Copy to:
Bryan Chegwidden, Esq. Ropes & Gray LLP 1211 Avenue of the Americas New York, New York 10036
Registrant’s telephone number, including area code:
(617) 292-1000
Date of fiscal year end:
October 31, 2014
Date of reporting period :
November 1, 2013 — October 31, 2014
Item 1. Report to Stockholders:
The following is a copy of the report transmitted to stockholders pursuant to Rule 30e-1 under the Investment Company Act of 1940:
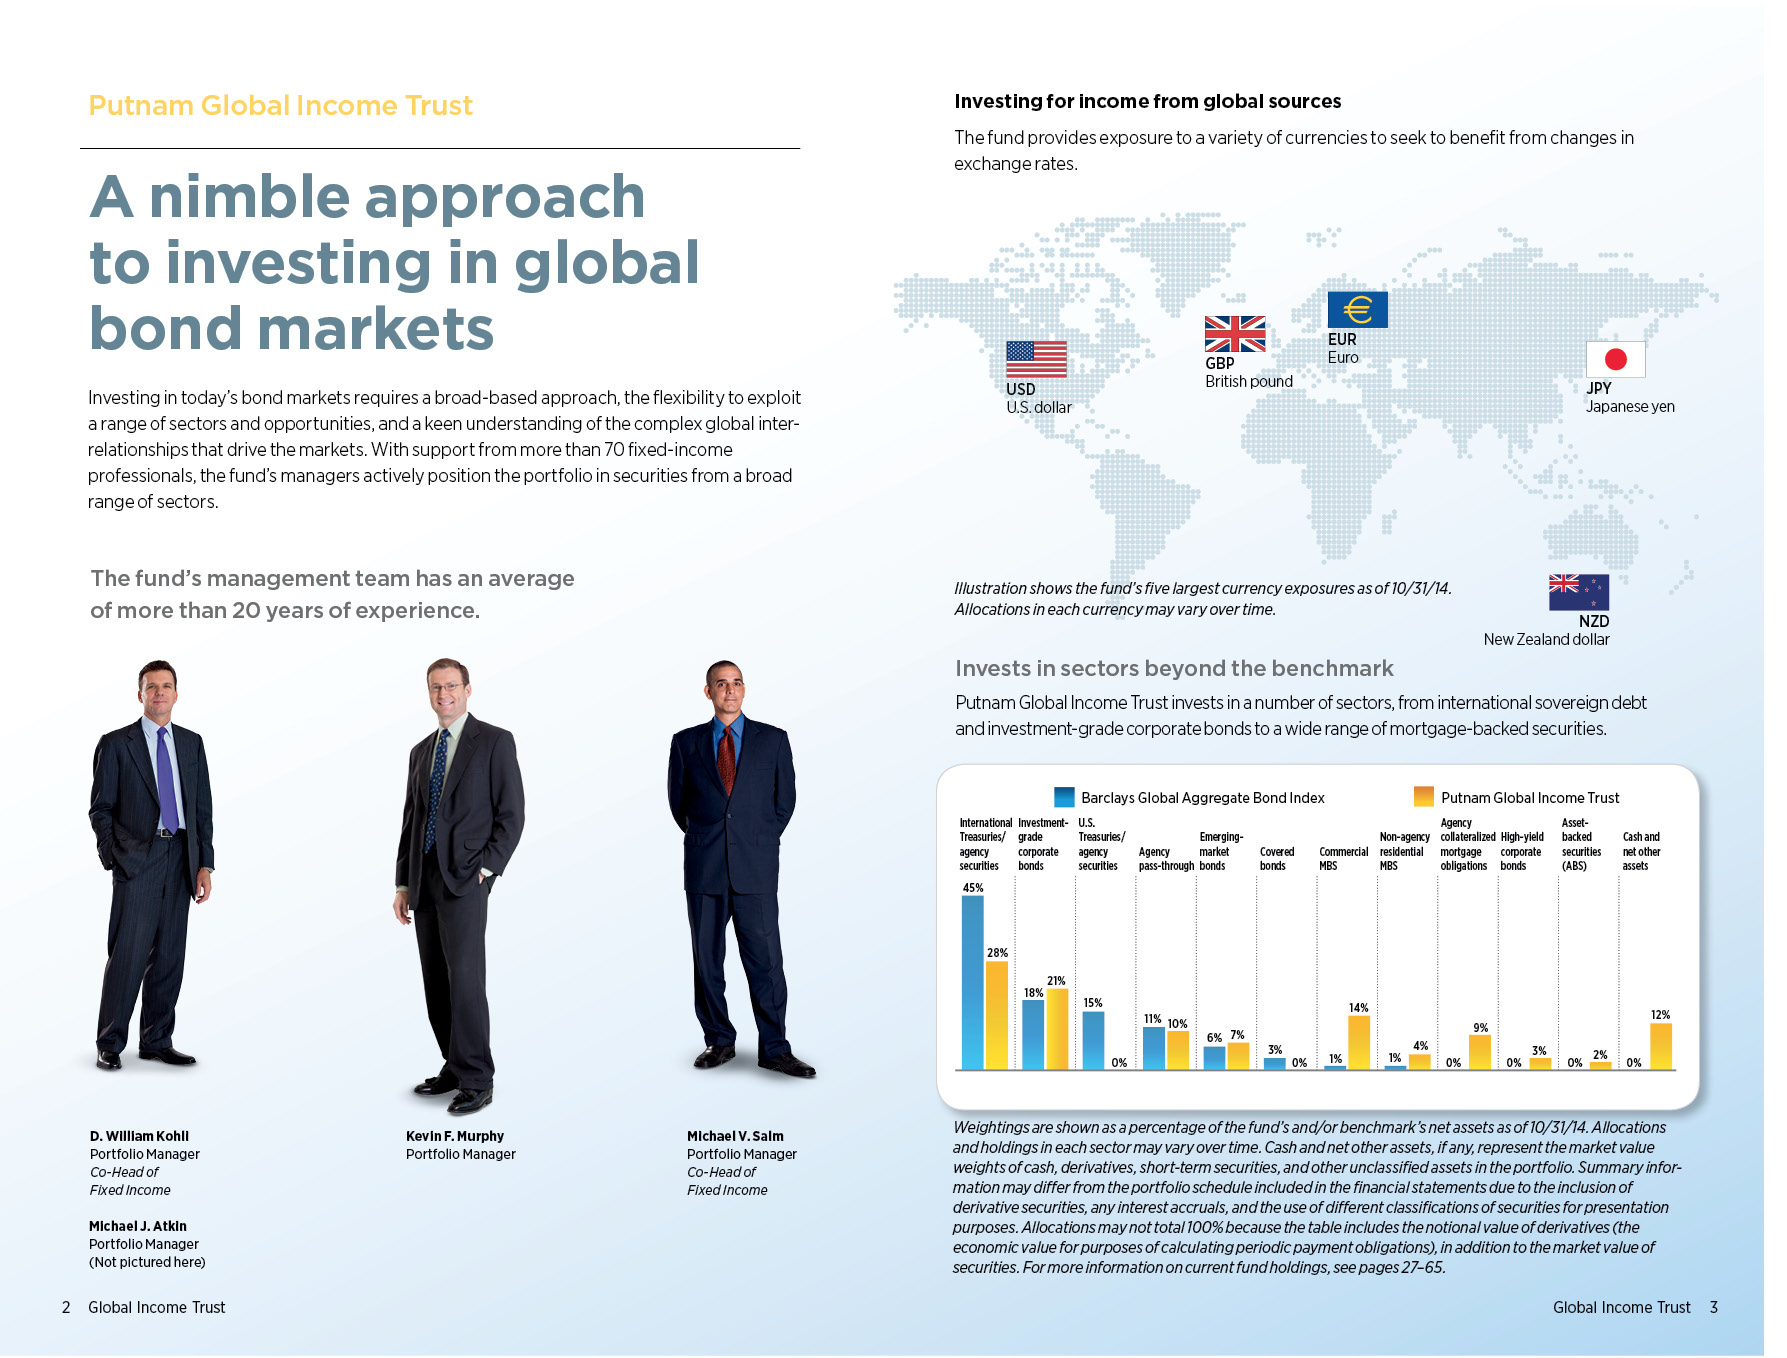
Putnam Global Income Trust
Putnam Global Income Trust
Annual report 10 | 31 | 14
Message from the Trustees
1
About the fund
2
Performance snapshot
4
Interview with your fund’s portfolio manager
5
Your fund’s performance
12
Your fund’s expenses
15
Terms and definitions
17
Other information for shareholders
18
Important notice regarding Putnam’s privacy policy
19
Trustee approval of management contract
20
Financial statements
25
Federal tax information
88
Shareholder meeting results
89
About the Trustees
90
Officers
92
Consider these risks before investing: International investing involves currency, economic, and political risks. Emerging-market securities carry illiquidity and volatility risks. Lower-rated bonds may offer higher yields in return for more risk. Funds that invest in government securities are not guaranteed. Mortgage-backed securities are subject to prepayment risk and the risk that they may increase in value less when interest rates decline and decline in value more when interest rates rise. The fund invests in fewer issuers or concentrates its investments by region or sector, and involves more risk than a more broadly invested fund. The fund’s policy of concentrating on a limited group of industries and the fund’s non-diversified status, which means the fund may invest in fewer issuers, can increase the fund’s vulnerability to common economic forces and may result in greater losses and volatility. Bond investments are subject to interest-rate risk (the risk of bond prices falling if interest rates rise) and credit risk (the risk of an issuer defaulting on interest or principal payments). Interest-rate risk is greater for longer-term bonds, and credit risk is greater for below-investment-grade bonds. Risks associated with derivatives include increased investment exposure (which may be considered leverage) and, in the case of over-the-counter instruments, the potential inability to terminate or sell derivatives positions and the potential failure of the other party to the instrument to meet its obligations. Unlike bonds, funds that invest in bonds have fees and expenses. The value of bonds in the fund’s portfolio may fall or fail to rise over extended periods of time for a variety of reasons, including general financial market conditions, changing market perceptions of the risk of default, changes in government intervention, and factors related to a specific issuer or industry. These factors may also lead to periods of high volatility and reduced liquidity in the bond markets. You can lose money by investing in the fund.
Message from the Trustees
Dear Fellow Shareholder:
The U.S. economic recovery has been steadily gaining momentum all year, thanks to positive developments in the key areas of employment, corporate earnings, consumer spending, and energy costs. With the U.S. midterm elections behind us, major stock market indexes achieved record highs in early November.
In October, the nation’s unemployment rate dropped to the lowest level since July 2008. Moreover, third-quarter earnings left investors feeling more confident about equity values and the overall health of corporations. For fixed-income markets, the outlook is more muted. The U.S. Federal Reserve ended its record bond-buying stimulus program in October, and appears to be on track to raise short-term interest rates in mid-2015.
While hardly booming, the U.S. economy has nevertheless emerged as a pillar of strength in the global economy. Meanwhile, the rest of the world may need to do more to nurture growth. Central banks in Europe, Japan, and China have recently augmented their stimulus policies, intending to shore up faltering recoveries. While risks have emerged, it is important to note that markets encountering adversity can still harbor investment potential.
As we head into the new year, it may be an appropriate time for you to meet with your financial advisor to ensure that your portfolio is properly diversified and aligned with your objectives and risk tolerance. Putnam offers a wide range of strategies for all environments, as well as new ways of thinking about building portfolios for today’s markets.
As always, thank you for investing with Putnam.
Respectfully yours,
Robert L. Reynolds President and Chief Executive Officer Putnam Investments
Jameson A. Baxter Chair, Board of Trustees
December 10, 2014
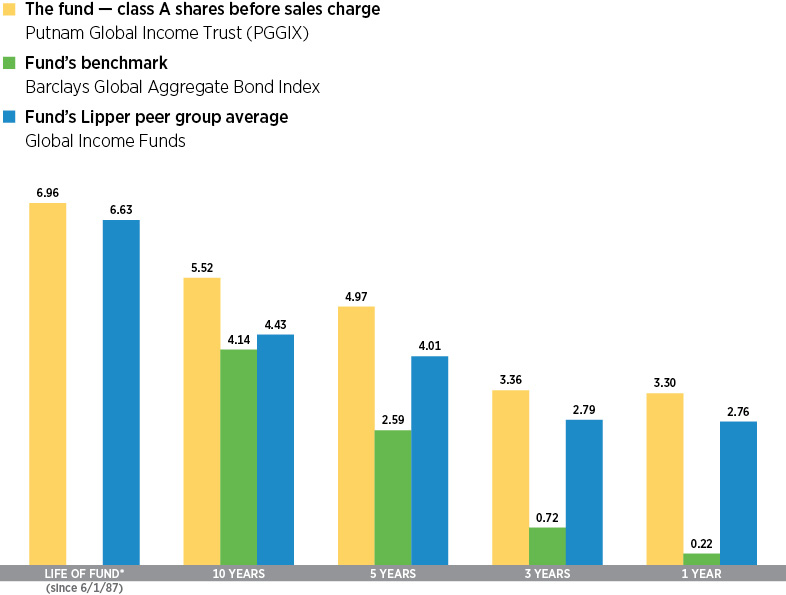
Performance snapshot
Annualized total return (%) comparison as of 10/31/14
Current performance may be lower or higher than the quoted past performance, which cannot guarantee future results. Share price, principal value, and return will fluctuate, and you may have a gain or a loss when you sell your shares. Performance of class A shares assumes reinvestment of distributions and does not account for taxes. Fund returns in the bar chart do not reflect a sales charge of 4.00%; had they, returns would have been lower. See pages 5 and 12–14 for additional performance information. For a portion of the periods, the fund had expense limitations, without which returns would have been lower. To obtain the most recent month-end performance, visit putnam.com.
*The fund’s benchmark, the Barclays Global Aggregate Bond Index, was introduced on 12/31/89, which post-dates the inception of the fund’s class A shares.
4 Global Income Trust
Interview with your fund’s portfolio manager
D. William Kohli
Bill, what was the environment like in global bond markets during the 12 months ended October 31, 2014?
Overall, it was a favorable environment for taking credit and prepayment risk, but there were periods of volatility. The major event marking the early months of the period was the Federal Reserve beginning the process of winding down its bond-buying program, which was announced in December 2013 and launched in January. The Fed concluded its bond purchases in October 2014.
The central bank’s initial $10 billion reduction in bond purchases coincided with lackluster fourth-quarter economic data and an upheaval in emerging markets [EM], which caused investors to assume a more risk-averse posture. As a result, asset flows shifted toward the relative safety of U.S. Treasuries, and pushed the yield on the 10-year note down to 2.61% at the beginning of February. Soon after, however, with EM stress abating, credit markets were buoyed by investors largely dismissing weak economic data, which to a great extent was a function of severe winter weather affecting some of the country’s most densely populated regions.
As we moved into spring, concern about capital flight from Russia due to the Ukraine crisis, along with unrest in the Middle East, prompted investors to once again seek the safety of Treasuries. Demand for Treasuries also received a boost in June when the European Central Bank [ECB] implemented
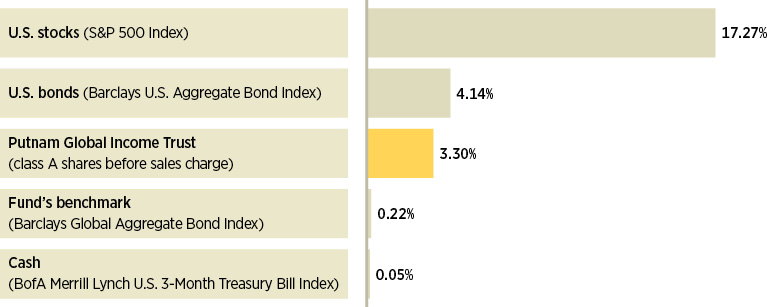
Broad market index and fund performance
This comparison shows your fund’s performance in the context of broad market indexes for the 12 months ended 10/31/14. See pages 4 and 12–14 for additional fund performance information. Index descriptions can be found on page 18.
Global Income Trust 5
a negative deposit rate of –0.10% in the hope of stimulating bank lending to help stave off deflation and bolster eurozone economic growth. Sharply lower yields on sovereign bonds issued by peripheral European countries also indirectly dampened Treasury yields.
Fixed-income markets experienced several bouts of volatility during the latter months of the period. Yields on intermediate- to longer-dated bonds fell globally and most bond market sectors underperformed Treasuries. The high-yield sector saw record outflows in July based on technical factors related to supply and demand. Meanwhile, several unusual events affected EM debt that disrupted that market, including the Russia/Ukraine situation and a technical default by Argentina on its restructured debt.
In mid-October, 10- and 30-year Treasury yields reached 2.15% and 2.92%, respectively — their lows for the reporting period — as geopolitical anxieties and concern about global economic growth once again bolstered demand for Treasuries. Longer-dated bonds also benefited from reduced concern about inflation, as the price index for personal consumption expenditures — the Fed’s preferred inflation
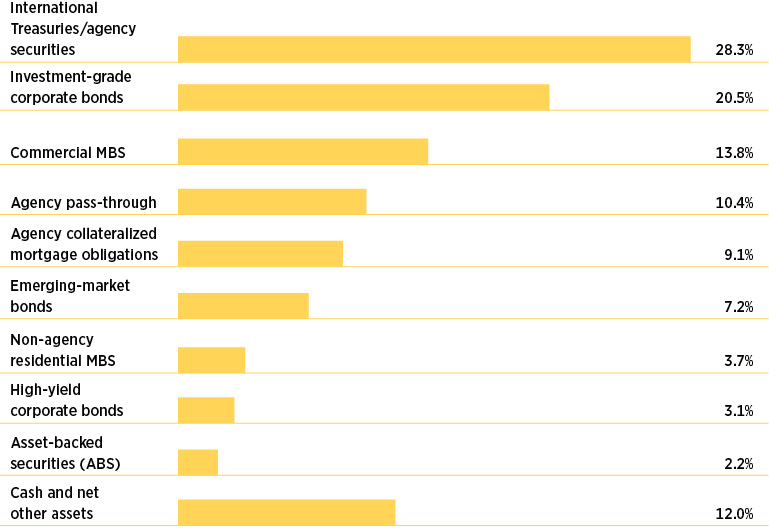
Portfolio composition
Allocations are shown as a percentage of the fund’s net assets as of 10/31/14. Cash and net other assets, if any, represent the market value weights of cash, derivatives, short-term securities, and other unclassified assets in the portfolio. Summary information may differ from the portfolio schedule included in the financial statements due to the inclusion of derivative securities, any interest accruals, and the use of different classifications of securities for presentation purposes. Allocations may not total 100% because the table includes the notional value of derivatives (the economic value for purposes of calculating period payment obligations), in addition to the market value of securities. Holdings and allocations may vary over time.
6 Global Income Trust
“Strategies that attempt to benefit from prepayment risk have historically done well during periods of rising interest rates.”
Bill Kohli
gauge — stayed below the central bank’s 2% target rate.
The U.S. dollar rose sharply and, in September, traded at its highest level versus the euro since 2008. The greenback advanced as a strengthening U.S. economy prompted investors to conclude that the Fed was likely to begin raising the federal funds rate — its target for short-term interest rates — sometime during 2015. Additionally, divergent policy stances among the Fed, the ECB, and the Bank of Japan [BOJ] — with the U.S. central bank preparing to tighten monetary policy while the ECB and BOJ appear likely to continue easing policy — also fueled dollar strength.
Oil prices fell steadily from midsummer through period-end on concerns that the global market was oversupplied, and on signs that the Organization of Petroleum Exporting Countries [OPEC] wasn’t likely to cut output. U.S. dollar strength also put pressure on oil,
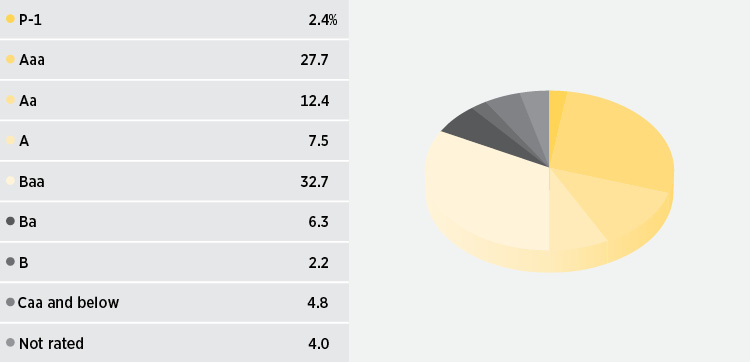
Credit quality overview
Credit qualities are shown as a percentage of the fund’s net assets as of 10/31/14. A bond rated Baa or higher (Prime-3 or higher, for short-term debt) is considered investment grade. The chart reflects Moody’s ratings; percentages may include bonds or derivatives not rated by Moody’s but rated by Standard & Poor’s (S&P) or, if unrated by S&P, by Fitch ratings, and then included in the closest equivalent Moody’s rating based on analysis of these agencies’ respective ratings criteria. Moody’s ratings are used in recognition of its prominence among rating agencies and breadth of coverage of rated securities. To be announced (TBA) mortgage commitments, if any, are included based on their issuer ratings. Ratings and portfolio credit quality may vary over time.
Derivative instruments, including forward currency contracts, are only included to the extent of any unrealized gain or loss on such instruments and are shown in the not-rated category. Cash is also shown in the not-rated category. Derivative offset values are included in the not-rated category and may result in negative weights. The fund itself has not been rated by an independent rating agency.
Global Income Trust 7
because oil is priced in dollars and becomes more expensive for buyers using foreign currencies when the dollar strengthens.
The fund outpaced its benchmark by a sizable margin and also outperformed the average return of its Lipper peer group during the period. What factors fueled this solid relative performance?
Relative to the benchmark, our active currency strategy was a major contributor, primarily during the last four months of the period when the U.S. dollar outpaced every other major currency. During that time, our long-dollar strategy, coupled with short positions in the euro and the Japanese yen — both of which weakened relative to the dollar — bolstered the fund’s performance.
Our prepayment and mortgage credit strategies also meaningfully aided the fund’s relative results. Within prepayment, we implemented our strategies with securities such as interest-only and inverse interest-only collateralized mortgage obligations [CMOs]. Although rates fell during the period, the decline wasn’t severe enough to trigger substantial refinancing of the mortgages underlying our CMO holdings. As a result,
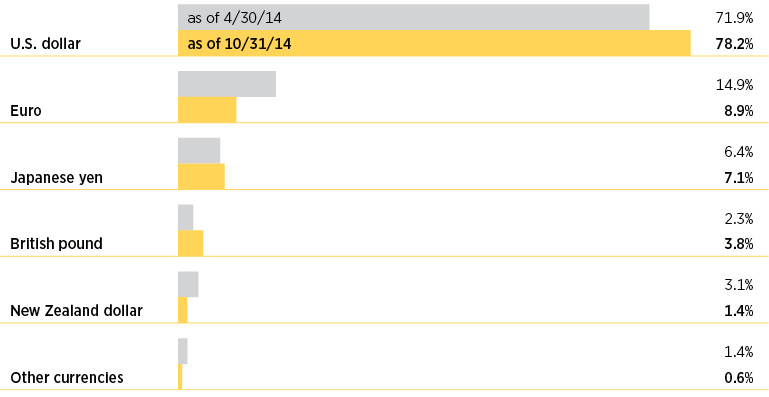
Comparison of currency exposures
This chart shows how the fund’s top currency holdings have changed over the last six months. Allocations are shown as a percentage of the fund’s net assets. Holdings and allocations may vary over time.
8 Global Income Trust
prepayment speeds that were slower than expected provided a tailwind to our interest-only CMO positions.
In mortgage credit, our investments in subordinated mezzanine commercial mortgage-backed securities [CMBS] and non-agency residential mortgage-backed securities [RMBS] were the most additive. Our CMBS holdings benefited from supportive commercial real estate fundamentals amid an improving U.S. economy, along with persistent investor demand for higher-yielding bonds. Our non-agency RMBS positions also attracted investors due to their relatively high yields. Within this sector, our holdings of pay-option adjustable-rate mortgage-backed securities [pay-option ARMs] were the main contributors to performance.
Elsewhere, an overweight in investment-grade corporate bonds provided a further boost to the fund’s relative performance. For the period as a whole, investment-grade corporates outperformed Treasuries with comparable maturities, supported by consistent investor demand, solid corporate fundamentals, and an improving domestic economy.
Overseas, our investments in EM debt modestly contributed, despite some late-period volatility. The fund benefited most from U.S.-dollar-denominated holdings in Argentina. The performance of these positions took a modest hit in August, however, due to Argentina’s failure to reach a settlement with holdout creditors. This development blocked coupon payments on the country’s restructured debt, resulting in a technical default.
Which strategies didn’t work as well during the reporting period?
Our interest-rate and yield-curve positioning dampened the fund’s relative return. The fund was defensively positioned for a rising-rate environment in the United States, resulting
ABOUT DERIVATIVES
Derivatives are an increasingly common type of investment instrument, the performance of which is derived from an underlying security, index, currency, or other area of the capital markets. Derivatives employed by the fund’s managers generally serve one of two main purposes: to implement a strategy that may be difficult or more expensive to invest in through traditional securities, or to hedge unwanted risk associated with a particular position.
For example, the fund’s managers might use currency forward contracts to capitalize on an anticipated change in exchange rates between two currencies. This approach would require a significantly smaller outlay of capital than purchasing traditional bonds denominated in the underlying currencies. In another example, the managers may identify a bond that they believe is undervalued relative to its risk of default, but may seek to reduce the interest-rate risk of that bond by using interest-rate swaps, a derivative through which two parties “swap” payments based on the movement of certain rates.
Like any other investment, derivatives may not appreciate in value and may lose money. Derivatives may amplify traditional investment risks through the creation of leverage and may be less liquid than traditional securities. And because derivatives typically represent contractual agreements between two financial institutions, derivatives entail “counterparty risk,” which is the risk that the other party is unable or unwilling to pay. Putnam monitors the counterparty risks we assume. For example, Putnam often enters into collateral agreements that require the counterparties to post collateral on a regular basis to cover their obligations to the fund. Counterparty risk for exchange-traded futures and centrally cleared swaps is mitigated by the daily exchange of margin and other safeguards against default through their respective clearinghouses.
Global Income Trust 9
in an overall duration — a key measure of interest-rate sensitivity — that was shorter than that of the benchmark. Additionally, the portfolio was positioned to benefit from an anticipated steepening in the slope of the Treasury yield curve. Unfortunately, because rates generally fell and the yield curve flattened during the period, this positioning worked against the fund’s performance.
Outside the United States, our long Europe versus short U.S. spread trade on the short-term portion of the yield curve aided results as monetary policy between the Fed and ECB diverged further. The net result of our non-U.S. duration strategies was positive, partially offsetting the negative impact of our U.S. duration positioning.
How did you use derivatives during the period?
We used bond futures and interest-rate swaps to take tactical positions at various points along the yield curve. We also employed interest-rate swaps and “swaptions” — which give us the option to enter into a swap contract — to hedge the interest-rate risk associated with our CMO holdings. Additionally, we used options to hedge the fund’s duration positioning and to help manage downside risk. Lastly, we utilized currency forward contracts to hedge the foreign-exchange risk associated with non-U.S. bonds and to efficiently gain exposure to foreign currencies.
What is your outlook for the coming months, and how are you positioning the fund?
We believe U.S. economic growth may accelerate as we move into 2015, given improving trends in employment, and a pickup in consumer and business spending. If this occurs, we think it sets the stage for the Fed to begin raising the federal funds rate sometime next year. That said, with U.S. inflation still running below the central bank’s 2% target, we believe lower oil prices may cause the Fed to take a more dovish stance and defer the first rate increase until later in 2015. We’ll be monitoring these factors closely in the weeks to come.
Globally, we think the outlook for European rates is more favorable than the outlook for U.S. rates because the ECB is likely to keep rates low for some time while the Fed is preparing to begin raising rates. So, in our view, European duration looks comparatively more appealing over the balance of this year and into 2015.
Given this backdrop, we have slightly increased the fund’s interest-rate sensitivity by bringing its duration closer to the benchmark’s duration. We plan to maintain our diversified mortgage, corporate, and sovereign credit exposure primarily through allocations to mezzanine CMBS, investment-grade corporate bonds, and European sovereign bonds, respectively. As for prepayment risk, we expect to continue our efforts to capitalize on anticipated slower prepayment speeds through allocations to agency interest-only CMOs. Strategies that attempt to benefit from prepayment risk have historically done well during periods of rising interest rates. Lastly, as of period-end, we believe yields remained reasonably attractive among specific subsectors of the non-agency RMBS market. We remain positive on several of these subsectors, particularly pay-option ARMs.
Thanks for bringing us up to date, Bill.
The views expressed in this report are exclusively those of Putnam Management and are subject to change. They are not meant as investment advice.
Please note that the holdings discussed in this report may not have been held by the fund for the entire period. Portfolio composition is subject to review in accordance with the fund’s investment strategy and may vary in the future. Current and future portfolio holdings are subject to risk.
10 Global Income Trust
Portfolio Manager D. William Kohli is Co-Head of Fixed Income at Putnam. He has an M.B.A. from the Haas School of Business at the University of California, Berkeley, and a B.A. from the University of California, San Diego. Bill joined Putnam in 1994 and has been in the investment industry since 1986.
In addition to Bill, your fund’s portfolio managers are Michael J. Atkin, Kevin F. Murphy, and Michael V. Salm.
IN THE NEWS
In the aftermath of November’s U.S. elections, it’s worth noting that U.S. stocks have gained during every six-month period following midterm votes since 1940. During the past 74 years, 18 midterm elections have been held. In every instance, stocks, as measured by the S&P 500 Index*, have delivered a positive return for the November 1–April 30 period. Gains have often been significant, with stocks delivering an average 17.91% return. The biggest advance of 26.88% took place in 1970–1971. The second biggest return — 26.57% — occurred in 1942–1943. The lowest return was 0.75% in 1946–1947. Why has the market consistently advanced following every midterm election, despite varying economic conditions across these periods? Many market observers believe that it comes down to clarity — in other words, each instance might be considered a “relief rally,” as election-related uncertainty tends to diminish.
*Returns for 1966 and earlier based on Ibbotson U.S. Large Stock Total Return Extended Index.
Global Income Trust 11
Your fund’s performance
This section shows your fund’s performance, price, and distribution information for periods ended October 31, 2014, the end of its most recent fiscal year. In accordance with regulatory requirements for mutual funds, we also include performance information as of the most recent calendar quarter-end and expense information taken from the fund’s current prospectus. Performance should always be considered in light of a fund’s investment strategy. Data represent past performance. Past performance does not guarantee future results. More recent returns may be less or more than those shown. Investment return and principal value will fluctuate, and you may have a gain or a loss when you sell your shares. Performance information does not reflect any deduction for taxes a shareholder may owe on fund distributions or on the redemption of fund shares. For the most recent month-end performance, please visit the Individual Investors section at putnam.com or call Putnam at 1-800-225-1581. Class R, R5, R6, and Y shares are not available to all investors. See the Terms and Definitions section in this report for definitions of the share classes offered by your fund.
Fund performance Total return for periods ended 10/31/14
Class A
Class B
Class C
Class M
Class R
Class R5
Class R6
Class Y
(inception dates)
(6/1/87)
(2/1/94)
(7/26/99)
(3/17/95)
(12/1/03)
(7/2/12)
(7/2/12)
(10/4/05)
Before sales charge
After sales charge
Before CDSC
After CDSC
Before CDSC
After CDSC
Before sales charge
After sales charge
Net asset value
Net asset value
Net asset value
Net asset value
Annual average
(life of fund)
6.96%
6.80%
6.70%
6.70%
6.17%
6.17%
6.67%
6.54%
6.70%
7.05%
7.06%
7.05%
10 years
71.15
64.30
61.25
61.25
58.97
58.97
66.86
61.44
66.87
75.21
75.50
75.17
Annual average
5.52
5.09
4.89
4.89
4.74
4.74
5.25
4.91
5.25
5.77
5.79
5.77
5 years
27.42
22.32
22.63
20.73
22.81
22.81
25.82
21.73
25.82
29.05
29.26
29.02
Annual average
4.97
4.11
4.16
3.84
4.20
4.20
4.70
4.01
4.70
5.23
5.27
5.23
3 years
10.42
6.00
7.90
4.90
7.98
7.98
9.58
6.02
9.60
11.33
11.52
11.31
Annual average
3.36
1.96
2.57
1.61
2.59
2.59
3.10
1.97
3.10
3.64
3.70
3.64
1 year
3.30
–0.84
2.54
–2.46
2.61
1.61
3.07
–0.28
3.12
3.67
3.64
3.58
Current performance may be lower or higher than the quoted past performance, which cannot guarantee future results. After-sales-charge returns for class A and M shares reflect the deduction of the maximum 4.00% and 3.25% sales charge, respectively, levied at the time of purchase. Class B share returns after contingent deferred sales charge (CDSC) reflect the applicable CDSC, which is 5% in the first year, declining over time to 1% in the sixth year, and is eliminated thereafter. Class C share returns after CDSC reflect a 1% CDSC for the first year that is eliminated thereafter. Class R, R5, R6, and Y shares have no initial sales charge or CDSC. Performance for class B, C, M, R, and Y shares before their inception is derived from the historical performance of class A shares, adjusted for the applicable sales charge (or CDSC) and the higher operating expenses for such shares, except for class Y shares, for which 12b-1 fees are not applicable. Performance for class R5 and R6 shares prior to their inception is derived from the historical performance of class Y shares and has not been adjusted for the lower investor servicing fees applicable to class R5 and R6 shares; had it, returns would have been higher.
For a portion of the periods, the fund had expense limitations, without which returns would have been lower.
Class B share performance reflects conversion to class A shares after eight years.
12 Global Income Trust
Comparative index returns For periods ended 10/31/14
Barclays Global Aggregate Bond Index
Lipper Global Income Funds category average*
Annual average (life of fund)
—†
6.63%
10 years
49.98%
54.78
Annual average
4.14
4.43
5 years
13.66
22.07
Annual average
2.59
4.01
3 years
2.17
8.74
Annual average
0.72
2.79
1 year
0.22
2.76
Index and Lipper results should be compared with fund performance before sales charge, before CDSC, or at net asset value.
*Over the 1-year, 3-year, 5-year, 10-year, and life-of-fund periods ended 10/31/14, there were 225, 156, 120, 77, and 2 funds, respectively, in this Lipper category.
†The fund’s benchmark, the Barclays Global Aggregate Bond Index, was introduced on 12/31/89, which post-dates the inception of the fund’s class A shares.
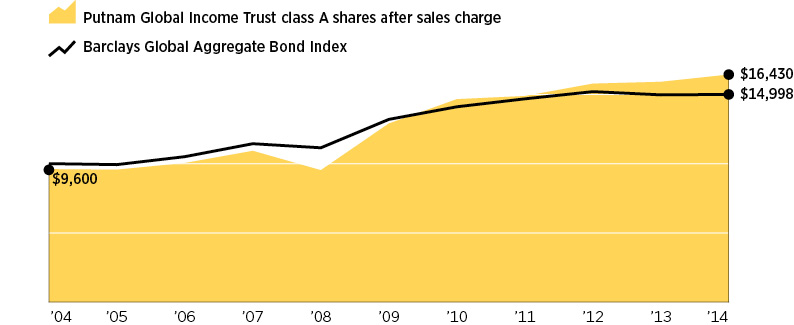
Change in the value of a $10,000 investment ($9,600 after sales charge)
Cumulative total return from 10/31/04 to 10/31/14
Past performance does not indicate future results. At the end of the same time period, a $10,000 investment in the fund’s class B and class C shares would have been valued at $16,125 and $15,897, respectively, and no contingent deferred sales charges would apply. A $10,000 investment in the fund’s class M shares ($9,675 after sales charge) would have been valued at $16,144. A $10,000 investment in the fund’s class R, R5, R6, and Y shares would have been valued at $16,687, $17,521, $17,550, and $17,517, respectively, and no contingent deferred sales charges would apply.
Global Income Trust 13
Fund price and distribution information For the 12-month period ended 10/31/14
Distributions
Class A
Class B
Class C
Class M
Class R
Class R5
Class R6
Class Y
Number
12
12
12
12
12
12
12
12
Income
$0.384
$0.288
$0.287
$0.352
$0.351
$0.420
$0.427
$0.419
Capital gains
—
—
—
—
—
—
—
—
Total
$0.384
$0.288
$0.287
$0.352
$0.351
$0.420
$0.427
$0.419
Share value
Before sales charge
After sales charge
Net asset value
Net asset value
Before sales charge
After sales charge
Net asset value
Net asset value
Net asset value
Net asset value
10/31/13
$12.57
$13.09
$12.51
$12.51
$12.45
$12.87
$12.54
$12.56
$12.57
$12.57
10/31/14
12.60
13.13
12.54
12.55
12.48
12.90
12.58
12.60
12.60
12.60
Current rate (end of period)
Before sales charge
After sales charge
Net asset value
Net asset value
Before sales charge
After sales charge
Net asset value
Net asset value
Net asset value
Net asset value
Current dividend rate 1
3.05%
2.92%
2.30%
2.29%
2.79%
2.70%
2.77%
3.33%
3.33%
3.33%
Current 30-day SEC yield 2
N/A
2.11
1.45
1.45
N/A
1.89
1.95
2.38
2.54
2.45
The classification of distributions, if any, is an estimate. Before-sales-charge share value and current dividend rate for class A and M shares, if applicable, do not take into account any sales charge levied at the time of purchase. After-sales-charge share value, current dividend rate, and current 30-day SEC yield, if applicable, are calculated assuming that the maximum sales charge (4.00% for class A shares and 3.25% for class M shares) was levied at the time of purchase. Final distribution information will appear on your year-end tax forms.
1Most recent distribution, including any return of capital and excluding capital gains, annualized and divided by share price before or after sales charge at period-end.
2Based only on investment income and calculated using the maximum offering price for each share class, in accordance with SEC guidelines.
Fund performance as of most recent calendar quarter Total return for periods ended 9/30/14
Class A
Class B
Class C
Class M
Class R
Class R5
Class R6
Class Y
(inception dates)
(6/1/87)
(2/1/94)
(7/26/99)
(3/17/95)
(12/1/03)
(7/2/12)
(7/2/12)
(10/4/05)
Before sales charge
After sales charge
Before CDSC
After CDSC
Before CDSC
After CDSC
Before sales charge
After sales charge
Net asset value
Net asset value
Net asset value
Net asset value
Annual average
(life of fund)
7.03%
6.87%
6.78%
6.78%
6.23%
6.23%
6.74%
6.61%
6.77%
7.12%
7.13%
7.12%
10 years
77.44
70.34
67.07
67.07
64.56
64.56
72.90
67.28
73.02
81.46
81.76
81.42
Annual average
5.90
5.47
5.27
5.27
5.11
5.11
5.63
5.28
5.64
6.14
6.16
6.14
5 years
32.47
27.17
27.61
25.64
27.60
27.60
30.75
26.50
30.82
34.06
34.28
34.02
Annual average
5.78
4.92
5.00
4.67
5.00
5.00
5.51
4.81
5.52
6.04
6.07
6.03
3 years
12.42
7.93
9.96
6.96
9.87
9.87
11.51
7.89
11.52
13.26
13.45
13.23
Annual average
3.98
2.57
3.22
2.27
3.19
3.19
3.70
2.56
3.70
4.24
4.30
4.23
1 year
5.95
1.71
5.18
0.18
5.09
4.09
5.66
2.22
5.60
6.17
6.23
6.16
See the discussion following the fund performance table on page 12 for information about the calculation of fund performance.
14 Global Income Trust
Your fund’s expenses
As a mutual fund investor, you pay ongoing expenses, such as management fees, distribution fees (12b-1 fees), and other expenses. Using the following information, you can estimate how these expenses affect your investment and compare them with the expenses of other funds. You may also pay one-time transaction expenses, including sales charges (loads) and redemption fees, which are not shown in this section and would have resulted in higher total expenses. For more information, see your fund’s prospectus or talk to your financial representative.
Expense ratios
Class A
Class B
Class C
Class M
Class R
Class R5
Class R6
Class Y
Total annual operating expenses for the fiscal year ended 10/31/13
1.10%
1.85%
1.85%
1.35%
1.35%
0.82%
0.75%
0.85%
Annualized expense ratio for the six-month period ended 10/31/14*
1.06%
1.81%
1.81%
1.31%
1.31%
0.80%
0.73%
0.81%
Fiscal-year expense information in this table is taken from the most recent prospectus, is subject to change, and may differ from that shown for the annualized expense ratio and in the financial highlights of this report.
Expenses are shown as a percentage of average net assets.
*For the fund’s most recent fiscal half year; may differ from expense ratios based on one-year data in the financial highlights.
Expenses per $1,000
The following table shows the expenses you would have paid on a $1,000 investment in the fund from May 1, 2014, to October 31, 2014. It also shows how much a $1,000 investment would be worth at the close of the period, assuming actual returns and expenses.
Class A
Class B
Class C
Class M
Class R
Class R5
Class R6
Class Y
Expenses paid per $1,000*†
$5.32
$9.06
$9.07
$6.57
$6.57
$4.02
$3.67
$4.07
Ending value (after expenses)
$990.70
$986.80
$987.70
$990.00
$990.10
$992.80
$993.10
$992.80
*Expenses for each share class are calculated using the fund’s annualized expense ratio for each class, which represents the ongoing expenses as a percentage of average net assets for the six months ended 10/31/14. The expense ratio may differ for each share class.
†Expenses are calculated by multiplying the expense ratio by the average account value for the period; then multiplying the result by the number of days in the period; and then dividing that result by the number of days in the year.
Global Income Trust 15
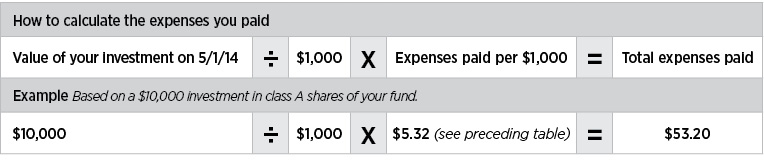
Estimate the expenses you paid
To estimate the ongoing expenses you paid for the six months ended October 31, 2014, use the following calculation method. To find the value of your investment on May 1, 2014, call Putnam at 1-800-225-1581.
Compare expenses using the SEC’s method
The Securities and Exchange Commission (SEC) has established guidelines to help investors assess fund expenses. Per these guidelines, the following table shows your fund’s expenses based on a $1,000 investment, assuming a hypothetical 5% annualized return. You can use this information to compare the ongoing expenses (but not transaction expenses or total costs) of investing in the fund with those of other funds. All mutual fund shareholder reports will provide this information to help you make this comparison. Please note that you cannot use this information to estimate your actual ending account balance and expenses paid during the period.
Class A
Class B
Class C
Class M
Class R
Class R5
Class R6
Class Y
Expenses paid per $1,000*†
$5.40
$9.20
$9.20
$6.67
$6.67
$4.08
$3.72
$4.13
Ending value (after expenses)
$1,019.86
$1,016.08
$1,016.08
$1,018.60
$1,018.60
$1,021.17
$1,021.53
$1,021.12
*Expenses for each share class are calculated using the fund’s annualized expense ratio for each class, which represents the ongoing expenses as a percentage of average net assets for the six months ended 10/31/14. The expense ratio may differ for each share class.
†Expenses are calculated by multiplying the expense ratio by the average account value for the six-month period; then multiplying the result by the number of days in the six-month period; and then dividing that result by the number of days in the year.
16 Global Income Trust
Terms and definitions
Important terms
Total return shows how the value of the fund’s shares changed over time, assuming you held the shares through the entire period and reinvested all distributions in the fund.
Before sales charge, or net asset value, is the price, or value, of one share of a mutual fund, without a sales charge. Before-sales-charge figures fluctuate with market conditions, and are calculated by dividing the net assets of each class of shares by the number of outstanding shares in the class.
After sales charge is the price of a mutual fund share plus the maximum sales charge levied at the time of purchase. After-sales-charge performance figures shown here assume the 4.00% maximum sales charge for class A shares and 3.25% for class M shares.
Contingent deferred sales charge (CDSC) is generally a charge applied at the time of the redemption of class B or C shares and assumes redemption at the end of the period. Your fund’s class B CDSC declines over time from a 5% maximum during the first year to 1% during the sixth year. After the sixth year, the CDSC no longer applies. The CDSC for class C shares is 1% for one year after purchase.
Share classes
Class A shares are generally subject to an initial sales charge and no CDSC (except on certain redemptions of shares bought without an initial sales charge).
Class B shares are not subject to an initial sales charge and may be subject to a CDSC.
Class C shares are not subject to an initial sales charge and are subject to a CDSC only if the shares are redeemed during the first year.
Class M shares have a lower initial sales charge and a higher 12b-1 fee than class A shares and no CDSC (except on certain redemptions of shares bought without an initial sales charge).
Class R shares are not subject to an initial sales charge or CDSC and are available only to certain employer-sponsored retirement plans.
Class R5 and R6 shares are not subject to an initial sales charge or CDSC, and carry no 12b-1 fee. They are only available to employer-sponsored retirement plans.
Class Y shares are not subject to an initial sales charge or CDSC, and carry no 12b-1 fee. They are generally only available to corporate and institutional clients and clients in other approved programs.
Fixed-income terms
Current rate is the annual rate of return earned from dividends or interest of an investment. Current rate is expressed as a percentage of the price of a security, fund share, or principal investment.
Mortgage-backed security (MBS), also known as a mortgage “pass-through,” is a type of asset-backed security that is secured by a mortgage or collection of mortgages. The following are types of MBSs::
•Agency “pass-through” has its principal and interest backed by a U.S. government agency, such as the Federal National Mortgage Association (Fannie Mae), Government National Mortgage Association (Ginnie Mae), and Federal Home Loan Mortgage Corporation (Freddie Mac).
•Collateralized mortgage obligation (CMO) represents claims to specific cash flows from pools of home mortgages. The streams of principal and interest payments on the mortgages are distributed to the different classes of CMO interests in “tranches.” Each tranche may have different principal balances, coupon rates, prepayment risks, and maturity dates. A CMO is highly sensitive to changes in interest rates and any resulting change in the rate at which homeowners sell their properties, refinance, or otherwise prepay loans. CMOs are subject to prepayment, market, and liquidity risks.
•Interest-only (IO) security is a type of CMO in which the underlying asset is the interest portion of mortgage, Treasury, or bond payments.
•Non-agency residential mortgage-backed security (RMBS) is an MBS not backed by Fannie Mae, Ginnie Mae, or Freddie Mac. One type of RMBS is an Alt-A mortgage-backed security.
•Commercial mortgage-backed security (CMBS) is secured by the loan on a commercial property.
Yield curve is a graph that plots the yields of bonds with equal credit quality against their
Global Income Trust 17
differing maturity dates, ranging from shortest to longest. It is used as a benchmark for other debt, such as mortgage or bank lending rates.
Comparative indexes
Barclays Global Aggregate Bond Index is an unmanaged index of global investment-grade fixed-income securities.
Barclays U.S. Aggregate Bond Index is an unmanaged index of U.S. investment-grade fixed-income securities.
BofA Merrill Lynch U.S. 3-Month Treasury Bill Index is an unmanaged index that seeks to measure the performance of U.S. Treasury bills available in the marketplace.
S&P 500 Index is an unmanaged index of common stock performance.
Indexes assume reinvestment of all distributions and do not account for fees. Securities and performance of a fund and an index will differ. You cannot invest directly in an index.
Lipper is a third-party industry-ranking entity that ranks mutual funds. Its rankings do not reflect sales charges. Lipper rankings are based on total return at net asset value relative to other funds that have similar current investment styles or objectives as determined by Lipper. Lipper may change a fund’s category assignment at its discretion. Lipper category averages reflect performance trends for funds within a category.
Other information for shareholders
Proxy voting
Putnam is committed to managing our mutual funds in the best interests of our shareholders. The Putnam funds’ proxy voting guidelines and procedures, as well as information regarding how your fund voted proxies relating to portfolio securities during the 12-month period ended June 30, 2014, are available in the Individual Investors section of putnam.com, and on the Securities and Exchange Commission (SEC) website, www.sec.gov. If you have questions about finding forms on the SEC’s website, you may call the SEC at 1-800-SEC-0330. You may also obtain the Putnam funds’ proxy voting guidelines and procedures at no charge by calling Putnam’s Shareholder Services at 1-800-225-1581.
Fund portfolio holdings
The fund will file a complete schedule of its portfolio holdings with the SEC for the first and third quarters of each fiscal year on Form N-Q. Shareholders may obtain the fund’s Form N-Q on the SEC’s website at www.sec.gov. In addition, the fund’s Form N-Q may be reviewed and copied at the SEC’s Public Reference Room in Washington, D.C. You may call the SEC at 1-800-SEC-0330 for information about the SEC’s website or the operation of the Public Reference Room.
Trustee and employee fund ownership
Putnam employees and members of the Board of Trustees place their faith, confidence, and, most importantly, investment dollars in Putnam mutual funds. As of October 31, 2014, Putnam employees had approximately $494,000,000 and the Trustees had approximately $139,000,000 invested in Putnam mutual funds. These amounts include investments by the Trustees’ and employees’ immediate family members as well as investments through retirement and deferred compensation plans.
18 Global Income Trust
Important notice regarding Putnam’s privacy policy
In order to conduct business with our shareholders, we must obtain certain personal information such as account holders’ names, addresses, Social Security numbers, and dates of birth. Using this information, we are able to maintain accurate records of accounts and transactions.
It is our policy to protect the confidentiality of our shareholder information, whether or not a shareholder currently owns shares of our funds. In particular, it is our policy not to sell information about you or your accounts to outside marketing firms. We have safeguards in place designed to prevent unauthorized access to our computer systems and procedures to protect personal information from unauthorized use.
Under certain circumstances, we must share account information with outside vendors who provide services to us, such as mailings and proxy solicitations. In these cases, the service providers enter into confidentiality agreements with us, and we provide only the information necessary to process transactions and perform other services related to your account. Finally, it is our policy to share account information with your financial representative, if you’ve listed one on your Putnam account.
Global Income Trust 19
Trustee approval of management contract
General conclusions
The Board of Trustees of the Putnam funds oversees the management of each fund and, as required by law, determines annually whether to approve the continuance of your fund’s management contract with Putnam Investment Management, LLC (“Putnam Management”) and the sub-management contract with respect to your fund between Putnam Management and its affiliate, Putnam Investments Limited (“PIL”). The Board of Trustees, with the assistance of its Contract Committee, requests and evaluates all information it deems reasonably necessary under the circumstances in connection with its annual contract review. The Contract Committee consists solely of Trustees who are not “interested persons” (as this term is defined in the Investment Company Act of 1940, as amended (the “1940 Act”)) of the Putnam funds (“Independent Trustees”).
At the outset of the review process, members of the Board’s independent staff and independent legal counsel met with representatives of Putnam Management to review the annual contract review materials furnished to the Contract Committee during the course of the previous year’s review and to discuss possible changes in these materials that might be necessary or desirable for the coming year. Following these discussions and in consultation with the Contract Committee, the Independent Trustees’ independent legal counsel requested that Putnam Management furnish specified information, together with any additional information that Putnam Management considered relevant, to the Contract Committee. Over the course of several months ending in June 2014, the Contract Committee met on a number of occasions with representatives of Putnam Management, and separately in executive session, to consider the information that Putnam Management provided, as well as supplemental information provided in response to additional requests made by the Contract Committee. Throughout this process, the Contract Committee was assisted by the members of the Board’s independent staff and by independent legal counsel for the Putnam funds and the Independent Trustees.
In May 2014, the Contract Committee met in executive session to discuss and consider its preliminary recommendations with respect to the continuance of the contracts. At the Trustees’ June 20, 2014 meeting, the Contract Committee met in executive session with the other Independent Trustees to review a summary of the key financial, performance and other data that the Contract Committee considered in the course of its review. The Contract Committee then presented its written report, which summarized the key factors that the Committee had considered and set forth its final recommendations. The Contract Committee then recommended, and the Independent Trustees approved, the continuance of your fund’s management and sub-management contracts, effective July 1, 2014. (Because PIL is an affiliate of Putnam Management and Putnam Management remains fully responsible for all services provided by PIL, the Trustees have not attempted to evaluate PIL as a separate entity, and all subsequent references to Putnam Management below should be deemed to include reference to PIL as necessary or appropriate in the context.)
The Independent Trustees’ approval was based on the following conclusions:
•That the fee schedule in effect for your fund represented reasonable compensation in light of the nature and quality of the services being provided to the fund, the fees paid by competitive funds, and the costs incurred by Putnam Management in providing services to the fund; and
20 Global Income Trust
•That the fee schedule in effect for your fund represented an appropriate sharing between fund shareholders and Putnam Management of such economies of scale as may exist in the management of the fund at current asset levels.
These conclusions were based on a comprehensive consideration of all information provided to the Trustees and were not the result of any single factor. Some of the factors that figured particularly in the Trustees’ deliberations and how the Trustees considered these factors are described below, although individual Trustees may have evaluated the information presented differently, giving different weights to various factors. It is also important to recognize that the management arrangements for your fund and the other Putnam funds are the result of many years of review and discussion between the Independent Trustees and Putnam Management, that some aspects of the arrangements may receive greater scrutiny in some years than others, and that the Trustees’ conclusions may be based, in part, on their consideration of fee arrangements in previous years. For example, with some minor exceptions, the current fee arrangements under the management contracts for the Putnam funds were implemented at the beginning of 2010 following extensive review by the Contract Committee and discussions with representatives of Putnam Management, as well as approval by shareholders. Shareholders also voted overwhelmingly to approve these fee arrangements in early 2014, when they were asked to approve new management contracts (with the same fees and substantially identical other provisions) following the possible termination of the previous management contracts as a result of the death of the Honorable Paul G. Desmarais. (Mr. Desmarais, both directly and through holding companies, controlled a majority of the voting shares of Power Corporation of Canada, which (directly and indirectly) is the majority owner of Putnam Management. Mr. Desmarais’ voting control of shares of Power Corporation of Canada was transferred to The Desmarais Family Residuary Trust upon his death and this transfer, as a technical matter, may have constituted an “assignment” within the meaning of the 1940 Act, causing the Putnam funds’ management contracts to terminate automatically.)
Management fee schedules and total expenses
The Trustees reviewed the management fee schedules in effect for all Putnam funds, including fee levels and breakpoints. The Trustees also reviewed the total expenses of each Putnam fund, recognizing that in most cases management fees represented the major, but not the sole, determinant of total costs to shareholders.
In reviewing fees and expenses, the Trustees generally focus their attention on material changes in circumstances — for example, changes in assets under management, changes in a fund’s investment style, changes in Putnam Management’s operating costs or profitability, or changes in competitive practices in the mutual fund industry — that suggest that consideration of fee changes might be warranted. The Trustees concluded that the circumstances did not warrant changes to the management fee structure of your fund.
Under its management contract, your fund has the benefit of breakpoints in its management fee schedule that provide shareholders with economies of scale in the form of reduced fee levels as assets under management in the Putnam family of funds increase. The Trustees concluded that the fee schedule in effect for your fund represented an appropriate sharing of economies of scale between fund shareholders and Putnam Management.
As in the past, the Trustees also focused on the competitiveness of each fund’s total expense ratio. In order to ensure that expenses of the Putnam funds continue to meet competitive standards, the Trustees and Putnam
Global Income Trust 21
Management have implemented certain expense limitations. These expense limitations were: (i) a contractual expense limitation applicable to all retail open-end funds of 32 basis points on investor servicing fees and expenses and (ii) a contractual expense limitation applicable to all open-end funds of 20 basis points on so-called “other expenses” (i.e., all expenses exclusive of management fees, investor servicing fees, distribution fees, investment-related expenses, interest, taxes, brokerage commissions, extraordinary expenses and acquired fund fees and expenses). These expense limitations serve in particular to maintain competitive expense levels for funds with large numbers of small shareholder accounts and funds with relatively small net assets. Most funds, including your fund, had sufficiently low expenses that these expense limitations did not apply. Putnam Management’s support for these expense limitation arrangements was an important factor in the Trustees’ decision to approve the continuance of your fund’s management and sub-management contracts.
The Trustees reviewed comparative fee and expense information for a custom group of competitive funds selected by Lipper Inc. (“Lipper”). This comparative information included your fund’s percentile ranking for effective management fees and total expenses (excluding any applicable 12b-1 fee), which provides a general indication of your fund’s relative standing. In the custom peer group, your fund ranked in the second quintile in effective management fees (determined for your fund and the other funds in the custom peer group based on fund asset size and the applicable contractual management fee schedule) and in the third quintile in total expenses (excluding any applicable 12b-1 fees) as of December 31, 2013 (the first quintile representing the least expensive funds and the fifth quintile the most expensive funds). The fee and expense data reported by Lipper as of December 31, 2013 reflected the most recent fiscal year-end data available in Lipper’s database at that time.
In connection with their review of the management fees and total expenses of the Putnam funds, the Trustees also reviewed the costs of the services provided and the profits realized by Putnam Management and its affiliates from their contractual relationships with the funds. This information included trends in revenues, expenses and profitability of Putnam Management and its affiliates relating to the investment management, investor servicing and distribution services provided to the funds. In this regard, the Trustees also reviewed an analysis of Putnam Management’s revenues, expenses and profitability, allocated on a fund-by-fund basis, with respect to the funds’ management, distribution, and investor servicing contracts. For each fund, the analysis presented information about revenues, expenses and profitability for each of the agreements separately and for the agreements taken together on a combined basis. The Trustees concluded that, at current asset levels, the fee schedules in place represented reasonable compensation for the services being provided and represented an appropriate sharing of such economies of scale as may exist in the management of the Putnam funds at that time.
The information examined by the Trustees as part of their annual contract review for the Putnam funds has included for many years information regarding fees charged by Putnam Management and its affiliates to institutional clients such as defined benefit pension plans, college endowments, and the like. This information included comparisons of those fees with fees charged to the Putnam funds, as well as an assessment of the differences in the services provided to these different types of clients. The Trustees observed that the differences in fee rates between institutional clients and mutual funds are by no means uniform when examined by individual asset sectors, suggesting that
22 Global Income Trust
differences in the pricing of investment management services to these types of clients may reflect historical competitive forces operating in separate markets. The Trustees considered the fact that in many cases fee rates across different asset classes are higher on average for mutual funds than for institutional clients, as well as the differences between the services that Putnam Management provides to the Putnam funds and those that it provides to its institutional clients. The Trustees did not rely on these comparisons to any significant extent in concluding that the management fees paid by your fund are reasonable.
Investment performance
The quality of the investment process provided by Putnam Management represented a major factor in the Trustees’ evaluation of the quality of services provided by Putnam Management under your fund’s management contract. The Trustees were assisted in their review of the Putnam funds’ investment process and performance by the work of the investment oversight committees of the Trustees, which meet on a regular basis with the funds’ portfolio teams and with the Chief Investment Officer and other senior members of Putnam Management’s Investment Division throughout the year. The Trustees concluded that Putnam Management generally provides a high-quality investment process — based on the experience and skills of the individuals assigned to the management of fund portfolios, the resources made available to them, and in general Putnam Management’s ability to attract and retain high-quality personnel — but also recognized that this does not guarantee favorable investment results for every fund in every time period.
The Trustees considered that 2013 was a year of strong competitive performance for many of the Putnam funds, with only a relatively small number of exceptions. They noted that this strong performance was exemplified by the fact that the Putnam funds were recognized by Barron’s as the second-best performing mutual fund complex for both 2013 and the five-year period ended December 31, 2013. They also noted, however, the disappointing investment performance of some funds for periods ended December 31, 2013 and considered information provided by Putnam Management regarding the factors contributing to the underperformance and actions being taken to improve the performance of these particular funds. The Trustees indicated their intention to continue to monitor performance trends to assess the effectiveness of these efforts and to evaluate whether additional actions to address areas of underperformance are warranted. For purposes of evaluating investment performance, the Trustees generally focus on competitive industry rankings for the one-year, three-year and five-year periods. For a number of Putnam funds with relatively unique investment mandates for which meaningful competitive performance rankings are not considered available, the Trustees evaluated performance based on comparisons of fund returns with the returns of selected investment benchmarks. In the case of your fund, the Trustees considered that its class A share cumulative total return performance at net asset value was in the following quartiles of its Lipper peer group (Lipper Global Income Funds) for the one-year, three-year and five-year periods ended December 31, 2013 (the first quartile representing the best-performing funds and the fourth quartile the worst-performing funds):
One-year period
1st
Three-year period
2nd
Five-year period
1st
Over the one-year, three-year and five-year periods ended December 31, 2013, there were 208, 152 and 115 funds, respectively, in your fund’s Lipper peer group. (When considering performance information, shareholders should be mindful that past performance is not a guarantee of future results.)
Global Income Trust 23
Brokerage and soft-dollar allocations; investor servicing
The Trustees considered various potential benefits that Putnam Management may receive in connection with the services it provides under the management contract with your fund. These include benefits related to brokerage allocation and the use of soft dollars, whereby a portion of the commissions paid by a fund for brokerage may be used to acquire research services that are expected to be useful to Putnam Management in managing the assets of the fund and of other clients. Subject to policies established by the Trustees, soft dollars generated by these means are used primarily to acquire brokerage and research services that enhance Putnam Management’s investment capabilities and supplement Putnam Management’s internal research efforts. However, the Trustees noted that a portion of available soft dollars continues to be used to pay fund expenses. The Trustees indicated their continued intent to monitor regulatory and industry developments in this area with the assistance of their Brokerage Committee and also indicated their continued intent to monitor the allocation of the Putnam funds’ brokerage in order to ensure that the principle of seeking best price and execution remains paramount in the portfolio trading process.
Putnam Management may also receive benefits from payments that the funds make to Putnam Management’s affiliates for investor or distribution services. In conjunction with the annual review of your fund’s management and sub-management contracts, the Trustees reviewed your fund’s investor servicing agreement with Putnam Investor Services, Inc. (“PSERV”) and its distributor’s contracts and distribution plans with Putnam Retail Management Limited Partnership (“PRM”), both of which are affiliates of Putnam Management. The Trustees concluded that the fees payable by the funds to PSERV and PRM, as applicable, for such services are reasonable in relation to the nature and quality of such services, the fees paid by competitive funds, and the costs incurred by PSERV and PRM, as applicable, in providing such services.
24 Global Income Trust
Financial statements
A note about your fund’s auditors
Between July 18, 2013 and December 16, 2013, which included a portion of your fund’s fiscal year, a non-U.S. member firm in PricewaterhouseCoopers LLP’s (“PwC”) global network of firms had an investment in certain non-U.S. funds that became affiliated with Putnam Investments as a result of the acquisition of the funds’ advisor by Putnam’s parent company, Great-West Lifeco Inc. The investment consisted of pension plan assets for the benefit of the member firm’s personnel. This investment is inconsistent with the SEC’s independence rules applicable to auditors. Although upon the disposition of the investment by the member firm on December 16, 2013, PwC and its affiliates took all necessary steps to eliminate this issue, the requirements of the SEC’s independence rules were not met for your fund’s fiscal year because the SEC’s rules require an audit firm to be independent for the entire fiscal year under audit. Based on its knowledge of the facts and its experience with PwC, the Audit and Compliance Committee of your fund’s Board of Trustees concluded that the investment by the PwC member firm would not affect PwC’s ability to render an objective audit opinion to your fund. Based on this conclusion and consideration of the potential risks that the disruption of a change of auditor could present, the Audit and Compliance Committee determined that PwC should continue to act as auditor for your fund.
These sections of the report, as well as the accompanying Notes, preceded by the Report of Independent Registered Public Accounting Firm, constitute the fund’s financial statements.
The fund’s portfolio lists all the fund’s investments and their values as of the last day of the reporting period. Holdings are organized by asset type and industry sector, country, or state to show areas of concentration and diversification.
Statement of assets and liabilities shows how the fund’s net assets and share price are determined. All investment and non-investment assets are added together. Any unpaid expenses and other liabilities are subtracted from this total. The result is divided by the number of shares to determine the net asset value per share, which is calculated separately for each class of shares. (For funds with preferred shares, the amount subtracted from total assets includes the liquidation preference of preferred shares.)
Statement of operations shows the fund’s net investment gain or loss. This is done by first adding up all the fund’s earnings — from dividends and interest income — and subtracting its operating expenses to determine net investment income (or loss). Then, any net gain or loss the fund realized on the sales of its holdings — as well as any unrealized gains or losses over the period — is added to or subtracted from the net investment result to determine the fund’s net gain or loss for the fiscal year.
Statement of changes in net assets shows how the fund’s net assets were affected by the fund’s net investment gain or loss, by distributions to shareholders, and by changes in the number of the fund’s shares. It lists distributions and their sources (net investment income or realized capital gains) over the current reporting period and the most recent fiscal year-end. The distributions listed here may not match the sources listed in the Statement of operations because the distributions are determined on a tax basis and may be paid in a different period from the one in which they were earned.
Financial highlights provide an overview of the fund’s investment results, per-share distributions, expense ratios, net investment income ratios, and portfolio turnover in one summary table, reflecting the five most recent reporting periods. In a semiannual report, the highlights table also includes the current reporting period.
Global Income Trust 25
Report of Independent Registered Public Accounting Firm
To the Trustees and Shareholders of Putnam Global Income Trust:
In our opinion, the accompanying statement of assets and liabilities, including the portfolio, and the related statements of operations and of changes in net assets and the financial highlights present fairly, in all material respects, the financial position of Putnam Global Income Trust (the “fund”) at October 31, 2014, and the results of its operations, the changes in its net assets and the financial highlights for each of the periods indicated, in conformity with accounting principles generally accepted in the United States of America. These financial statements and financial highlights (hereafter referred to as “financial statements”) are the responsibility of the fund’s management. Our responsibility is to express an opinion on these financial statements based on our audits. We conducted our audits of these financial statements in accordance with the standards of the Public Company Accounting Oversight Board (United States). Those standards require that we plan and perform the audit to obtain reasonable assurance about whether the financial statements are free of material misstatement. An audit includes examining, on a test basis, evidence supporting the amounts and disclosures in the financial statements, assessing the accounting principles used and significant estimates made by management, and evaluating the overall financial statement presentation. We believe that our audits, which included confirmation of investments owned at October 31, 2014 by correspondence with the custodian, brokers, and transfer agent, provide a reasonable basis for our opinion.
PricewaterhouseCoopers LLP Boston, Massachusetts December 10, 2014
26 Global Income Trust
The fund’s portfolio 10/31/14
FOREIGN GOVERNMENT AND AGENCY BONDS AND NOTES (31.0%)*
Principal amount
Value
Argentina (Republic of) sr. unsec. bonds 8.28s, 2033 (Argentina) (In default) †
$399,581
$331,652
Argentina (Republic of) sr. unsec. bonds 7s, 2017 (Argentina)
25,000
22,000
Argentina (Republic of) sr. unsec. unsub. bonds 7s, 2015 (Argentina)
Total mortgage-backed securities (cost $80,182,764)
$84,281,197
U.S. GOVERNMENT AND AGENCY MORTGAGE OBLIGATIONS (14.3%)*
Principal amount
Value
U.S. Government Guaranteed Mortgage Obligations (1.0%)
Government National Mortgage Association Pass-Through Certificates
4 1/2s, TBA, November 1, 2044
$3,000,000
$3,275,859
4s, March 20, 2044
97,999
106,418
3,382,277
U.S. Government Agency Mortgage Obligations (13.3%)
Federal Home Loan Mortgage Corporation Pass-Through Certificates
6s, with due dates from July 1, 2021 to September 1, 2021
14,964
16,368
5 1/2s, June 1, 2035
17,125
19,205
5 1/2s, April 1, 2020
6,227
6,716
4 1/2s, May 1, 2044
584,015
645,358
Global Income Trust 43
U.S. GOVERNMENT AND AGENCY MORTGAGE OBLIGATIONS (14.3%)* cont.
Principal amount
Value
U.S. Government Agency Mortgage Obligations cont.
Federal Home Loan Mortgage Corporation Pass-Through Certificates
4s, June 1, 2043
$177,244
$189,734
3 1/2s, with due dates from October 1, 2042 to August 1, 2043 ##
2,739,942
2,833,433
Federal National Mortgage Association Pass-Through Certificates
7s, with due dates from March 1, 2033 to April 1, 2035
98,534
115,219
6 1/2s, with due dates from September 1, 2036 to November 1, 2037
35,991
40,740
6s, July 1, 2037
1,710
1,932
6s, with due dates from May 1, 2021 to October 1, 2021
53,763
58,701
5 1/2s, with due dates from February 1, 2018 to March 1, 2021
38,422
41,308
5 1/2s, TBA, November 1, 2044
1,000,000
1,116,406
5s, May 1, 2037
86,906
96,320
5s, with due dates from May 1, 2020 to March 1, 2021
6,809
7,346
4 1/2s, May 1, 2041
914,330
992,976
4 1/2s, TBA, December 1, 2044
5,000,000
5,409,375
4 1/2s, TBA, November 1, 2044
5,000,000
5,420,703
4s, with due dates from July 1, 2043 to June 1, 2044 ##
1,926,565
2,056,928
4s, with due dates from May 1, 2019 to September 1, 2020
69,898
74,161
4s, TBA, January 1, 2045
3,000,000
3,167,930
4s, TBA, November 1, 2044
4,000,000
4,247,188
3 1/2s, TBA, November 1, 2044
5,000,000
5,169,531
3s, February 1, 2043
911,246
913,631
3s, TBA, November 1, 2044
14,000,000
14,004,375
46,645,584
Total U.S. government and agency mortgage obligations (cost $49,714,913)
$50,027,861
ASSET-BACKED SECURITIES (2.2%)*
Principal amount
Value
Station Place Securitization Trust 144A FRB Ser. 14-2, Class A, 1.054s, 2016
$7,687,000
$7,687,000
Total asset-backed securities (cost $7,687,000)
$7,687,000
MUNICIPAL BONDS AND NOTES (0.1%)*
Principal amount
Value
CA State G.O. Bonds (Build America Bonds), 7 1/2s, 4/1/34
$100,000
$144,305
IL State G.O. Bonds, 4.421s, 1/1/15
45,000
45,284
North TX, Tollway Auth. Rev. Bonds (Build America Bonds), 6.718s, 1/1/49
95,000
132,233
OH State U. Rev. Bonds (Build America Bonds), 4.91s, 6/1/40
115,000
133,393
Total municipal bonds and notes (cost $355,657)
$455,215
PURCHASED SWAP OPTIONS OUTSTANDING (0.1%)* Counterparty Fixed right % to receive or (pay)/ Floating rate index/Maturity date
Expiration date/strike
Contract amount
Value
Bank of America N.A.
2.7175/3 month USD-LIBOR-BBA/Nov-24
Nov-14/2.7175
$10,733,000
$224,856
Credit Suisse International
(2.52875)/3 month USD-LIBOR-BBA/Nov-24
Nov-14/2.52875
18,039,000
91,458
2.27125/3 month USD-LIBOR-BBA/Nov-24
Nov-14/2.27125
18,039,000
12,267
Total purchased swap options outstanding (cost $254,393)
$328,581
44 Global Income Trust
PURCHASED OPTIONS OUTSTANDING (—%)*
Expiration date/strike price
Contract amount
Value
Federal National Mortgage Association 30 yr 3.5s TBA commitments (Put)
Jan-15/$102.63
$5,000,000
$36,100
Federal National Mortgage Association 30 yr 3.5s TBA commitments (Put)
Jan-15/102.38
5,000,000
30,900
Federal National Mortgage Association 30 yr 3.5s TBA commitments (Put)
Jan-15/103.13
1,000,000
9,660
Federal National Mortgage Association 30 yr 3.5s TBA commitments (Put)
Jan-15/102.94
1,000,000
8,690
Federal National Mortgage Association 30 yr 3.5s TBA commitments (Put)
Dec-14/101.69
8,000,000
8,240
Total purchased options outstanding (cost $170,156)
$93,590
SHORT-TERM INVESTMENTS (12.2%)*
Principal amount/shares
Value
Putnam Short Term Investment Fund 0.09% L
Shares 33,891,737
$33,891,737
SSgA Prime Money Market Fund Class N zero % P
Shares 339,000
339,000
U.S. Treasury Bills with an effective yield of 0.10%, July 23, 2015 Δ §
$2,337,000
2,335,640
U.S. Treasury Bills with an effective yield of 0.05%, November 20, 2014 # Δ §
2,938,000
2,937,926
U.S. Treasury Bills with an effective yield of 0.03%, December 18, 2014 Δ §
413,000
412,981
U.S. Treasury Bills with an effective yield of 0.03%, November 28, 2014 Δ
110,000
109,997
U.S. Treasury Bills with an effective yield of 0.03%, November 13, 2014
10,000
10,000
U.S. Treasury Bills with an effective yield of 0.02%, January 15, 2015 Δ §
666,000
665,980
U.S. Treasury Bills with an effective yield of 0.01%, January 8, 2015 Δ §
1,130,000
1,129,980
U.S. Treasury Bills with an effective yield of 0.01%, November 6, 2014 Δ §
653,000
652,999
U.S. Treasury Bills with effective yields ranging from 0.01% to 0.02%, December 4, 2014 Δ
235,000
234,997
Total short-term investments (cost $42,720,819)
$42,721,237
TOTAL INVESTMENTS
Total investments (cost $382,445,928)
$389,819,985
Key to holding’s currency abbreviations
AUD
Australian Dollar
BRL
Brazilian Real
CAD
Canadian Dollar
CHF
Swiss Franc
EUR
Euro
GBP
British Pound
JPY
Japanese Yen
KRW
South Korean Won
MXN
Mexican Peso
MYR
Malaysian Ringgit
NZD
New Zealand Dollar
Global Income Trust 45
PLN
Polish Zloty
SEK
Swedish Krona
USD/$
United States Dollar
ZAR
South African Rand
Key to holding’s abbreviations
bp
Basis Points
EMTN
Euro Medium Term Notes
FRB
Floating Rate Bonds: the rate shown is the current interest rate at the close of the reporting period
FRN
Floating Rate Notes: the rate shown is the current interest rate at the close of the reporting period
G.O. Bonds
General Obligation Bonds
IFB
Inverse Floating Rate Bonds, which are securities that pay interest rates that vary inversely to changes in the market interest rates. As interest rates rise, inverse floaters produce less current income. The rate shown is the current interest rate at the close of the reporting period.
IO
Interest Only
MTN
Medium Term Notes
OJSC
Open Joint Stock Company
OTC
Over-the-counter
PO
Principal Only
REGS
Securities sold under Regulation S may not be offered, sold or delivered within the United States except pursuant to an exemption from, or in a transaction not subject to, the registration requirements of the Securities Act of 1933.
TBA
To Be Announced Commitments
Notes to the fund’s portfolio
Unless noted otherwise, the notes to the fund’s portfolio are for the close of the fund’s reporting period, which ran from November 1, 2013 through October 31, 2014 (the reporting period). Within the following notes to the portfolio, references to “ASC 820” represent Accounting Standards Codification 820 Fair Value Measurements and Disclosures and references to “OTC”, if any, represent over-the-counter.
*
Percentages indicated are based on net assets of $349,229,892.
†
Non-income-producing security.
††
The interest rate and date shown parenthetically represent the new interest rate to be paid and the date the fund will begin accruing interest at this rate.
#
This security, in part or in entirety, was pledged and segregated with the broker to cover margin requirements for futures contracts at the close of the reporting period.
Δ
This security, in part or in entirety, was pledged and segregated with the custodian for collateral on certain derivative contracts at the close of the reporting period.
§
This security, in part or in entirety, was pledged and segregated with the custodian for collateral on the initial margin on certain centrally cleared derivative contracts at the close of the reporting period.
##
Forward commitment, in part or in entirety (Note 1).
F
Security is valued at fair value following procedures approved by the Trustees. Securities may be classified as Level 2 or Level 3 for ASC 820 based on the securities’ valuation inputs (Note 1).
L
Affiliated company (Note 5). The rate quoted in the security description is the annualized 7-day yield of the fund at the close of the reporting period.
P
Security was pledged, or purchased with cash that was pledged, to the fund for collateral on certain derivative contracts. The rate quoted in the security description is the annualized 7-day yield of the fund at the close of the reporting period (Note 1).
R
Real Estate Investment Trust.
At the close of the reporting period, the fund maintained liquid assets totaling $147,826,626 to cover certain derivatives contracts and delayed delivery securities.
Debt obligations are considered secured unless otherwise indicated.
46 Global Income Trust
144A after the name of an issuer represents securities exempt from registration under Rule 144A under the Securities Act of 1933, as amended. These securities may be resold in transactions exempt from registration, normally to qualified institutional buyers.
See Note 1 to the financial statements regarding TBA commitments.
The dates shown on debt obligations are the original maturity dates.
DIVERSIFICATION BY COUNTRY ⌂
Distribution of investments by country of risk at the close of the reporting period, excluding collateral received, if any (as a percentage of Portfolio Value):
United States
61.7%
Italy
5.7
Japan
4.5
Germany
3.4
France
3.1
Spain
2.8
United Kingdom
2.7
Belgium
2.2
Greece
1.7
Argentina
1.5
Luxembourg
1.2
Mexico
1.2
Netherlands
0.9
Russia
0.9
Canada
0.8
South Africa
0.8
Austria
0.8
Poland
0.6
Ireland
0.5
Supra-Nation
0.5
Brazil
0.5
Other
2.0
Total
100.0%
⌂ Methodology differs from that used for purposes of complying with the fund’s policy regarding investments in securities of foreign issuers, as discussed further in the fund’s prospectus.
FORWARD CURRENCY CONTRACTS at 10/31/14 (aggregate face value $176,631,352)
Counterparty
Currency
Contract type
Delivery date
Value
Aggregate face value
Unrealized appreciation/ (depreciation)
Bank of America N.A.
Australian Dollar
Sell
1/21/15
$293,447
$286,262
$(7,185)
British Pound
Buy
12/17/14
427,453
439,909
(12,456)
British Pound
Sell
12/17/14
427,453
436,140
8,687
Euro
Sell
12/17/14
6,260,960
6,542,977
282,017
Japanese Yen
Buy
11/19/14
423,432
444,333
(20,901)
Swiss Franc
Buy
12/17/14
754,438
766,027
(11,589)
Barclays Bank PLC
Australian Dollar
Buy
1/21/15
8,576
6,159
2,417
British Pound
Buy
12/17/14
3,905,928
3,910,002
(4,074)
Canadian Dollar
Sell
1/21/15
1,473,330
1,473,913
583
Chinese Yuan (Offshore)
Buy
11/19/14
878,712
867,865
10,847
Czech Koruna
Buy
12/17/14
157,344
155,844
1,500
Euro
Buy
12/17/14
3,411,012
3,585,677
(174,665)
Japanese Yen
Buy
11/19/14
2,832,378
3,138,210
(305,832)
Mexican Peso
Sell
1/21/15
25,369
25,560
191
New Zealand Dollar
Buy
1/21/15
20,423
24,404
(3,981)
Norwegian Krone
Sell
12/17/14
346,861
329,335
(17,526)
Polish Zloty
Sell
12/17/14
1,687,374
1,775,746
88,372
Global Income Trust 47
FORWARD CURRENCY CONTRACTS at 10/31/14 (aggregate face value $176,631,352) cont.
Counterparty
Currency
Contract type
Delivery date
Value
Aggregate face value
Unrealized appreciation/ (depreciation)
Barclays Bank PLC cont.
Singapore Dollar
Sell
11/19/14
$115,660
$117,416
$1,756
South African Rand
Sell
1/21/15
969,734
990,618
20,884
South Korean Won
Sell
11/19/14
147,011
149,385
2,374
Swedish Krona
Sell
12/17/14
883,676
923,673
39,997
Swiss Franc
Buy
12/17/14
111,045
110,278
767
Turkish Lira
Buy
12/17/14
284,265
283,892
373
Citibank, N.A.
Australian Dollar
Sell
1/21/15
715,281
719,576
4,295
Brazilian Real
Sell
1/5/15
107,612
73,374
(34,238)
British Pound
Buy
12/17/14
343,498
353,212
(9,714)
Danish Krone
Buy
12/17/14
444,348
466,744
(22,396)
Euro
Sell
12/17/14
11,573,150
12,329,730
756,580
Japanese Yen
Buy
11/19/14
3,607,304
3,959,325
(352,021)
New Zealand Dollar
Buy
1/21/15
1,299,488
1,313,022
(13,534)
Norwegian Krone
Sell
12/17/14
856,081
875,723
19,642
Swiss Franc
Buy
12/17/14
163,344
151,850
11,494
Thai Baht
Buy
11/19/14
351,798
354,127
(2,329)
Credit Suisse International
Australian Dollar
Buy
1/21/15
1,784,920
1,775,948
8,972
Australian Dollar
Sell
1/21/15
1,784,920
1,774,317
(10,603)
British Pound
Sell
12/17/14
2,188,279
2,264,973
76,694
Canadian Dollar
Buy
1/21/15
882,421
888,263
(5,842)
Canadian Dollar
Sell
1/21/15
882,421
880,266
(2,155)
Euro
Sell
12/17/14
6,671,607
6,724,619
53,012
Indian Rupee
Buy
11/19/14
879,800
879,979
(179)
Japanese Yen
Sell
11/19/14
1,633,967
1,954,799
320,832
Mexican Peso
Buy
1/21/15
5,145
5,159
(14)
Mexican Peso
Sell
1/21/15
5,145
5,132
(13)
New Zealand Dollar
Buy
1/21/15
596,520
605,227
(8,707)
Norwegian Krone
Sell
12/17/14
689,475
703,479
14,004
Singapore Dollar
Buy
11/19/14
388,619
400,207
(11,588)
South African Rand
Buy
1/21/15
1,258,809
1,275,808
(16,999)
South African Rand
Sell
1/21/15
1,258,809
1,231,570
(27,239)
South Korean Won
Buy
11/19/14
2,821,836
2,882,026
(60,190)
Swedish Krona
Buy
12/17/14
1,268,007
1,317,720
(49,713)
Swedish Krona
Sell
12/17/14
1,268,007
1,311,537
43,530
Swiss Franc
Sell
12/17/14
356,839
414,825
57,986
Turkish Lira
Buy
12/17/14
887,632
870,103
17,529
Turkish Lira
Sell
12/17/14
887,632
877,840
(9,792)
Deutsche Bank AG
Australian Dollar
Sell
1/21/15
487,472
491,504
4,032
British Pound
Buy
12/17/14
788,862
812,989
(24,127)
48 Global Income Trust
FORWARD CURRENCY CONTRACTS at 10/31/14 (aggregate face value $176,631,352) cont.
Counterparty
Currency
Contract type
Delivery date
Value
Aggregate face value
Unrealized appreciation/ (depreciation)
Deutsche Bank AG cont.
Czech Koruna
Buy
12/17/14
$8,364
$8,828
$(464)
Czech Koruna
Sell
12/17/14
8,364
8,541
177
Euro
Sell
12/17/14
1,905,064
1,943,377
38,313
Japanese Yen
Sell
11/19/14
4,093,417
4,270,205
176,788
New Zealand Dollar
Buy
1/21/15
866,583
877,382
(10,799)
Norwegian Krone
Buy
12/17/14
2,476,930
2,659,410
(182,480)
Norwegian Krone
Sell
12/17/14
2,480,320
2,613,108
132,788
Polish Zloty
Buy
12/17/14
454,578
478,022
(23,444)
Swedish Krona
Buy
12/17/14
1,703,100
1,736,977
(33,877)
Swedish Krona
Sell
12/17/14
1,703,100
1,792,227
89,127
Swiss Franc
Buy
12/17/14
50,116
29,493
20,623
Goldman Sachs International
Australian Dollar
Sell
1/21/15
1,495,675
1,483,181
(12,494)
British Pound
Buy
12/17/14
907,999
936,734
(28,735)
Canadian Dollar
Buy
1/21/15
441,078
441,950
(872)
Canadian Dollar
Sell
1/21/15
441,078
446,342
5,264
Euro
Sell
12/17/14
9,397,959
10,059,464
661,505
Japanese Yen
Sell
11/19/14
165,279
162,189
(3,090)
New Zealand Dollar
Buy
1/21/15
427,025
429,495
(2,470)
Norwegian Krone
Buy
12/17/14
1,557,428
1,690,424
(132,996)
Norwegian Krone
Sell
12/17/14
1,557,428
1,626,534
69,106
Swedish Krona
Buy
12/17/14
348,806
350,732
(1,926)
HSBC Bank USA, National Association
Australian Dollar
Buy
1/21/15
1,512,828
1,491,404
21,424
British Pound
Sell
12/17/14
4,266,218
4,372,211
105,993
Canadian Dollar
Sell
1/21/15
2,497,257
2,514,264
17,007
Euro
Sell
12/17/14
7,149,438
7,324,508
175,070
Japanese Yen
Buy
11/19/14
332,976
662,333
(329,357)
Norwegian Krone
Sell
12/17/14
117,249
123,383
6,134
Swedish Krona
Buy
12/17/14
854,489
864,614
(10,125)
JPMorgan Chase Bank N.A.
Australian Dollar
Buy
1/21/15
266,578
261,901
4,677
Brazilian Real
Buy
1/5/15
1,775,138
1,791,912
(16,774)
Brazilian Real
Sell
1/5/15
1,775,138
1,749,475
(25,663)
British Pound
Buy
12/17/14
662,209
682,309
(20,100)
Canadian Dollar
Sell
1/21/15
143,099
147,643
4,544
Czech Koruna
Buy
12/17/14
429,322
441,655
(12,333)
Czech Koruna
Sell
12/17/14
429,322
452,162
22,840
Euro
Buy
12/17/14
2,397,436
2,447,062
(49,626)
Euro
Sell
12/17/14
2,398,689
2,442,658
43,969
Hungarian Forint
Buy
12/17/14
597,691
601,497
(3,806)
Hungarian Forint
Sell
12/17/14
597,691
614,559
16,868
Global Income Trust 49
FORWARD CURRENCY CONTRACTS at 10/31/14 (aggregate face value $176,631,352) cont.
Counterparty
Currency
Contract type
Delivery date
Value
Aggregate face value
Unrealized appreciation/ (depreciation)
JPMorgan Chase Bank N.A. cont.
Indian Rupee
Sell
11/19/14
$76,031
$75,424
$(607)
Japanese Yen
Sell
11/19/14
568,952
609,747
40,795
Malaysian Ringgit
Sell
11/19/14
543,638
543,566
(72)
Mexican Peso
Sell
1/21/15
1,302,331
1,304,071
1,740
New Taiwan Dollar
Sell
11/19/14
799,105
811,310
12,205
New Zealand Dollar
Sell
1/21/15
578,805
555,880
(22,925)
Norwegian Krone
Sell
12/17/14
790,068
815,956
25,888
Russian Ruble
Buy
12/17/14
203,650
235,291
(31,641)
South Korean Won
Sell
11/19/14
764,022
785,566
21,544
Swedish Krona
Buy
12/17/14
436,082
445,225
(9,143)
Swiss Franc
Sell
12/17/14
932,338
1,007,589
75,251
Thai Baht
Buy
11/19/14
12,300
12,408
(108)
Thai Baht
Sell
11/19/14
12,300
12,340
40
Royal Bank of Scotland PLC (The)
Australian Dollar
Buy
1/21/15
431,724
424,856
6,868
British Pound
Buy
12/17/14
780,706
782,255
(1,549)
Canadian Dollar
Buy
1/21/15
878,525
889,022
(10,497)
Canadian Dollar
Sell
1/21/15
878,525
882,208
3,683
Euro
Sell
12/17/14
870,803
868,799
(2,004)
New Zealand Dollar
Buy
1/21/15
865,423
874,653
(9,230)
Norwegian Krone
Sell
12/17/14
852,631
880,940
28,309
State Street Bank and Trust Co.
Australian Dollar
Buy
1/21/15
103,883
94,640
9,243
Brazilian Real
Sell
1/5/15
154,218
87,547
(66,671)
British Pound
Buy
12/17/14
1,348,885
1,358,138
(9,253)
Canadian Dollar
Sell
1/21/15
434,880
435,105
225
Euro
Sell
12/17/14
1,081,014
1,151,171
70,157
Israeli Shekel
Sell
1/21/15
768,241
778,322
10,081
Japanese Yen
Buy
11/19/14
3,214,998
3,407,494
(192,496)
New Taiwan Dollar
Buy
11/19/14
46,363
47,104
(741)
New Zealand Dollar
Buy
1/21/15
215,911
225,801
(9,890)
Norwegian Krone
Sell
12/17/14
430,920
439,346
8,426
Singapore Dollar
Buy
11/19/14
175,357
180,582
(5,225)
Singapore Dollar
Sell
11/19/14
175,357
180,536
5,179
Swedish Krona
Buy
12/17/14
1,708,436
1,709,038
(602)
Swiss Franc
Buy
12/17/14
78,085
38,150
39,935
UBS AG
British Pound
Buy
12/17/14
1,109,971
1,145,087
(35,116)
Euro
Sell
12/17/14
870,803
868,793
(2,010)
Japanese Yen
Sell
11/19/14
554,552
606,538
51,986
Singapore Dollar
Buy
11/19/14
249,221
256,581
(7,360)
Singapore Dollar
Sell
11/19/14
249,221
256,649
7,428
50 Global Income Trust
FORWARD CURRENCY CONTRACTS at 10/31/14 (aggregate face value $176,631,352) cont.
Counterparty
Currency
Contract type
Delivery date
Value
Aggregate face value
Unrealized appreciation/ (depreciation)
WestPac Banking Corp.
Australian Dollar
Buy
1/21/15
$259,491
$256,384
$3,107
British Pound
Buy
12/17/14
1,962,960
2,024,909
(61,949)
Canadian Dollar
Sell
1/21/15
983,371
1,008,883
25,512
Euro
Buy
12/17/14
905,651
930,395
(24,744)
Japanese Yen
Buy
11/19/14
4,036,478
4,255,902
(219,424)
New Zealand Dollar
Buy
1/21/15
1,286,646
1,312,388
(25,742)
Total
$1,039,154
FUTURES CONTRACTS OUTSTANDING at 10/31/14
Number of contracts
Value
Expiration date
Unrealized appreciation/ (depreciation)
Australian Government Treasury Bond 10 yr (Long)
15
$1,620,836
Dec-14
$48,938
Canadian Government Bond 10 yr (Long)
20
2,431,658
Dec-14
11,464
Euro-Bobl 5 yr (Short)
38
6,097,703
Dec-14
(20,367)
Euro-Bund 10 yr (Short)
79
14,939,918
Dec-14
(200,225)
Euro-Buxl 30 yr (Short)
11
2,003,186
Dec-14
(48,682)
Euro-Schatz 2 yr (Long)
62
8,621,848
Dec-14
5,244
Japanese Government Bond 10 yr Mini (Long)
25
3,264,189
Dec-14
22,613
Japanese Government Bond 10 yr (Long)
20
26,090,363
Dec-14
154,828
Japanese Government Bond 10 yr (Short)
12
15,654,218
Dec-14
(92,993)
U.K. Gilt 10 yr (Long)
46
8,469,774
Dec-14
177,225
U.S. Treasury Bond 30 yr (Short)
22
3,104,063
Dec-14
1,177
U.S. Treasury Bond Ultra 30 yr (Long)
57
8,938,313
Dec-14
337,735
U.S. Treasury Note 2 yr (Long)
54
11,856,375
Dec-14
37,022
U.S. Treasury Note 5 yr (Short)
27
3,224,602
Dec-14
(6,840)
U.S. Treasury Note 10 yr (Long)
163
20,596,578
Dec-14
(153,122)
U.S. Treasury Note 10 yr (Short)
119
15,036,766
Dec-14
(109,929)
Total
$164,088
Global Income Trust 51
WRITTEN SWAP OPTIONS OUTSTANDING at 10/31/14 (premiums $1,249,373)
Counterparty Fixed Obligation % to receive or (pay)/ Floating rate index/Maturity date
Expiration date/strike
Contract amount
Value
Bank of America N.A.
(2.557)/3 month USD-LIBOR-BBA/Nov-24
Nov-14/2.557
$10,733,000
$87,581
(2.60)/3 month USD-LIBOR-BBA/Jan-25
Jan-15/2.60
11,826,600
175,270
Credit Suisse International
(2.40)/3 month USD-LIBOR-BBA/Nov-24
Nov-14/2.40
9,019,500
24,623
2.40/3 month USD-LIBOR-BBA/Nov-24
Nov-14/2.40
9,019,500
106,971
(2.51)/3 month USD-LIBOR-BBA/Aug-25
Aug-15/2.51
8,819,300
139,257
(2.51)/3 month USD-LIBOR-BBA/Aug-25
Aug-15/2.51
8,819,300
139,257
JPMorgan Chase Bank N.A.
(2.60)/3 month USD-LIBOR-BBA/Feb-25
Feb-15/2.60
5,913,300
89,232
(6.00 Floor)/3 month USD-LIBOR-BBA/Mar-18
Mar-18/6.00
3,723,000
659,821
Total
$1,422,012
WRITTEN OPTIONS OUTSTANDING at 10/31/14 (premiums $148,750)
Expiration date/strike price
Contract amount
Value
Federal National Mortgage Association 30 yr 3.5s TBA commitments (Put)
Jan-15/$101.75
$5,000,000
$20,450
Federal National Mortgage Association 30 yr 3.5s TBA commitments (Put)
Jan-15/101.50
5,000,000
17,150
Federal National Mortgage Association 30 yr 3.5s TBA commitments (Put)
Jan-15/100.88
5,000,000
10,800
Federal National Mortgage Association 30 yr 3.5s TBA commitments (Put)
Jan-15/100.63
5,000,000
8,900
Federal National Mortgage Association 30 yr 3.5s TBA commitments (Put)
Jan-15/102.13
1,000,000
5,260
Federal National Mortgage Association 30 yr 3.5s TBA commitments (Put)
Jan-15/101.94
1,000,000
4,650
Federal National Mortgage Association 30 yr 3.5s TBA commitments (Put)
Jan-15/101.13
1,000,000
2,610
Federal National Mortgage Association 30 yr 3.5s TBA commitments (Put)
Jan-15/100.94
1,000,000
2,270
Federal National Mortgage Association 30 yr 3.5s TBA commitments (Put)
Dec-14/100.81
8,000,000
2,400
Federal National Mortgage Association 30 yr 3.5s TBA commitments (Put)
Dec-14/99.94
8,000,000
640
Total
$75,130
52 Global Income Trust
FORWARD PREMIUM SWAP OPTION CONTRACTS OUTSTANDING at 10/31/14
Counterparty Fixed right or obligation % to receive or (pay)/Floating rate index/ Maturity date
Expiration date/strike
Contract amount
Premium receivable/ (payable)
Unrealized appreciation/ (depreciation)
JPMorgan Chase Bank N.A.
2.75/3 month USD-LIBOR-BBA/Dec-24 (Purchased)
Dec-14/2.75
$10,344,800
$(97,190)
$141,620
2.75/3 month USD-LIBOR-BBA/Dec-24 (Purchased)
Dec-14/2.75
10,344,800
(99,310)
139,965
(2.40)/3 month USD-LIBOR-BBA/Mar-25 (Written)
Mar-15/2.40
10,344,800
34,500
(55,138)
(2.40)/3 month USD-LIBOR-BBA/Mar-25 (Written)
Mar-15/2.40
10,344,800
34,655
(55,552)
(2.65)/3 month USD-LIBOR-BBA/Dec-24 (Written)
Dec-14/2.65
10,344,800
61,448
(104,689)
(2.65)/3 month USD-LIBOR-BBA/Dec-24 (Written)
Dec-14/2.65
10,344,800
62,069
(104,896)
Total
$(3,828)
$(38,690)
TBA SALE COMMITMENTS OUTSTANDING at 10/31/14 (proceeds receivable $13,795,742)
Agency
Principal amount
Settlement date
Value
Federal National Mortgage Association, 4 1/2s, November 1, 2044
$5,000,000
11/13/14
$5,420,702
Federal National Mortgage Association, 4s, November 1, 2044
4,000,000
11/13/14
4,247,188
Federal National Mortgage Association, 3 1/2s, November 1, 2044
4,000,000
11/13/14
4,135,625
Total
$13,803,515
OTC INTEREST RATE SWAP CONTRACTS OUTSTANDING at 10/31/14
Swap counterparty/ Notional amount
Upfront premium received (paid)
Termination date
Payments made by fund per annum
Payments received by fund per annum
Unrealized appreciation/ (depreciation)
Bank of America N.A.
MYR
5,495,000
$—
3/19/19
4.0275%
3 month MYR-KLIBOR-BNM
$(10,068)
Citibank, N.A.
AUD
4,597,000 E
—
7/31/24
4.5175%
6 month AUD-BBR-BBSW
(29,046)
AUD
862,000 E
—
8/6/24
4.63%
6 month AUD-BBR-BBSW
(8,723)
AUD
6,333,000 E
—
10/16/24
6 month AUD-BBR-BBSW
4.232%
(28,478)
NZD
2,867,000
—
10/29/24
3 month NZD-BBR-FRA
4.42025%
4,954
Credit Suisse International
AUD
795,000
—
10/10/23
6 month AUD-BBR-BBSW
4.49%
47,019
AUD
2,596,000 E
—
10/16/24
6 month AUD-BBR-BBSW
4.1975%
(14,758)
Global Income Trust 53
OTC INTEREST RATE SWAP CONTRACTS OUTSTANDING at 10/31/14 cont.
Swap counterparty/ Notional amount
Upfront premium received (paid)
Termination date
Payments made by fund per annum
Payments received by fund per annum
Unrealized appreciation/ (depreciation)
Credit Suisse International cont.
CAD
2,218,000
$—
10/30/24
3 month CAD-BA-CDOR
2.495%
$(1,646)
CHF
2,202,000
—
10/27/24
6 month CHF-LIBOR-BBA
0.785%
3,364
CHF
2,057,000
—
10/28/24
6 month CHF-LIBOR-BBA
0.765%
(1,073)
Deutsche Bank AG
MYR
5,495,000
—
3/19/19
4.035%
3 month MYR-KLIBOR-BNM
(10,586)
PLN
5,586,000
—
3/17/24
4.1072%
6 month PLN-WIBOR-WIBO
(292,828)
PLN
2,785,000
—
3/18/24
4.12875%
6 month PLN-WIBOR-WIBO
(147,603)
PLN
2,458,000
—
3/27/24
4.045%
6 month PLN-WIBOR-WIBO
(128,546)
PLN
27,672,000
—
7/14/16
6 month PLN-WIBOR-WIBO
2.48%
96,580
Goldman Sachs International
AUD
1,246,000 E
—
8/6/24
4.525%
6 month AUD-BBR-BBSW
(8,081)
CHF
938,000
—
2/24/24
6 month CHF-LIBOR-BBA
1.36%
67,428
JPY
411,000,000
—
9/15/41
6 month JPY-LIBOR-BBA
1.768%
247,922
KRW
8,034,000,000
—
11/18/18
3 month KRW-CD-KSDA-BLOOMBERG
3.105%
283,768
KRW
1,998,000,000
—
10/30/19
3 month KRW-CD-KSDA-BLOOMBERG
2.2875%
6,714
NZD
581,000
—
10/31/24
3 month NZD-BBR-FRA
4.425%
1,183
NZD
726,000
—
10/31/24
3 month NZD-BBR-FRA
4.42%
1,252
NZD
726,000
—
11/3/24
3 month NZD-BBR-FRA
4.415%
928
SEK
14,005,000
—
10/27/24
3 month SEK-STIBOR-SIDE
1.6025%
21,258
SEK
11,693,000
—
10/29/24
3 month SEK-STIBOR-SIDE
1.58%
14,392
JPMorgan Chase Bank N.A.
AUD
2,313,000 E
—
8/6/24
4.5175%
6 month AUD-BBR-BBSW
(14,391)
CAD
1,100,000
—
9/21/41
3 month CAD-BA-CDOR
2.78311%
(36,164)
CAD
2,887,000
—
10/9/23
3 month CAD-BA-CDOR
3.055%
139,212
54 Global Income Trust
OTC INTEREST RATE SWAP CONTRACTS OUTSTANDING at 10/31/14 cont.
Swap counterparty/ Notional amount
Upfront premium received (paid)
Termination date
Payments made by fund per annum
Payments received by fund per annum
Unrealized appreciation/ (depreciation)
JPMorgan Chase Bank N.A. cont.
CAD
2,277,000
$—
10/30/24
3 month CAD-BA-CDOR
2.5025%
$(316)
JPY
901,000,000
—
2/19/15
6 month JPY-LIBOR-BBA
0.705%
21,800
JPY
149,300,000
—
2/19/20
6 month JPY-LIBOR-BBA
1.3975%
84,154
KRW
981,000,000
—
11/3/19
3 month KRW-CD-KSDA-BLOOMBERG
2.245%
1,406
MXN
10,836,000
—
7/24/29
1 month MXN-TIIE-BANXICO
6.565%
(7,584)
NZD
853,000
—
11/4/24
3 month NZD-BBR-FRA
4.38%
(805)
Total
$—
$302,638
E Extended effective date.
CENTRALLY CLEARED INTEREST RATE SWAP CONTRACTS OUTSTANDING at 10/31/14
Notional amount
Upfront premium received (paid)
Termination date
Payments made by fund per annum
Payments received by fund per annum
Unrealized appreciation/ (depreciation)
JPY
328,100,000
$(59)
11/19/43
1.75625%
6 month JPY-LIBOR-BBA
$(191,204)
$56,525,100 E
1,762
12/17/16
3 month USD-LIBOR-BBA
1.00%
(227,560)
38,469,300 E
929,038
12/17/19
3 month USD-LIBOR-BBA
2.25%
129,033
59,293,300 E
2,159,221
12/17/24
3 month USD-LIBOR-BBA
3.00%
(472,035)
8,235,500 E
553,279
12/17/44
3 month USD-LIBOR-BBA
3.50%
(183,766)
7,152,000 E
(40)
12/16/17
3 month USD-LIBOR-BBA
1.835%
(23,977)
32,318,000 E
(179)
12/16/17
3 month USD-LIBOR-BBA
1.897%
(147,840)
16,207,000 E
(90)
12/16/17
3 month USD-LIBOR-BBA
1.86625%
(64,318)
21,415,000 E
(119)
12/16/17
3 month USD-LIBOR-BBA
1.905%
(101,348)
5,212,000 E
(29)
12/16/17
3 month USD-LIBOR-BBA
1.8625%
(20,298)
35,508,000 E
(50,505)
12/16/17
3 month USD-LIBOR-BBA
1.882%
(202,266)
1,082,000 E
40,245
12/17/24
3 month USD-LIBOR-BBA
2.90%
2,074
17,670,000 E
(98)
12/16/17
3 month USD-LIBOR-BBA
1.80%
46,869
Global Income Trust 55
CENTRALLY CLEARED INTEREST RATE SWAP CONTRACTS OUTSTANDING at 10/31/14 cont.
Notional amount
Upfront premium received (paid)
Termination date
Payments made by fund per annum
Payments received by fund per annum
Unrealized appreciation/ (depreciation)
$12,499,000 E
$(101)
12/16/18
3 month USD-LIBOR-BBA
2.34%
$(136,352)
9,375,000 E
(75)
12/16/18
3 month USD-LIBOR-BBA
2.3795%
(113,082)
34,000,000 E
76,334
12/17/21
3 month USD-LIBOR-BBA
2.50%
(623,766)
17,802,000 E
(99)
12/16/17
3 month USD-LIBOR-BBA
1.924%
90,709
3,125,000 E
(25)
12/16/18
3 month USD-LIBOR-BBA
2.337%
(33,816)
5,715,000 E
(46)
12/16/18
3 month USD-LIBOR-BBA
2.0025%
(6,018)
10,002,000 E
(4,397)
12/16/18
3 month USD-LIBOR-BBA
1.9525%
(246)
7,439,600 E
(105)
11/5/24
3 month USD-LIBOR-BBA
2.3375%
(92,899)
11,520,000 E
(129)
10/22/24
3 month USD-LIBOR-BBA
3.14875%
(68,385)
11,520,000 E
(129)
10/22/24
3 month USD-LIBOR-BBA
3.145%
(70,228)
EUR
22,053,000 E
(164,456)
12/17/16
6 month EUR-EURIBOR-REUTERS
0.50%
(14,643)
EUR
3,400,000 E
(102,493)
12/17/19
6 month EUR-EURIBOR-REUTERS
1.00%
11,673
EUR
15,515,500 E
(1,696,533)
12/17/24
6 month EUR-EURIBOR-REUTERS
2.00%
22,970
EUR
1,365,000 E
(195,647)
12/17/34
6 month EUR-EURIBOR-REUTERS
2.50%
49,582
EUR
2,509,000 E
(395,575)
12/17/44
6 month EUR-EURIBOR-REUTERS
2.50%
123,899
EUR
8,624,000 E
(123)
10/22/24
6 month EUR-EURIBOR-REUTERS
1.75%
(18,106)
EUR
8,624,000 E
(123)
10/22/24
6 month EUR-EURIBOR-REUTERS
1.757%
(21,727)
GBP
8,518,000 E
(86,212)
12/17/19
6 month GBP-LIBOR-BBA
2.25%
191,437
GBP
9,036,000 E
580,305
12/17/24
6 month GBP-LIBOR-BBA
3.00%
(282,175)
GBP
1,995,000 E
(150,175)
12/17/44
6 month GBP-LIBOR-BBA
3.25%
177,779
JPY
18,345,000
(6)
3/24/44
6 month JPY-LIBOR-BBA
1.80%
11,401
JPY
35,921,000
(12)
3/24/44
6 month JPY-LIBOR-BBA
1.79625%
22,015
JPY
996,900,000
(39)
3/14/19
6 month JPY-LIBOR-BBA
0.3175%
45,774
56 Global Income Trust
CENTRALLY CLEARED INTEREST RATE SWAP CONTRACTS OUTSTANDING at 10/31/14 cont.
Notional amount
Upfront premium received (paid)
Termination date
Payments made by fund per annum
Payments received by fund per annum
Unrealized appreciation/ (depreciation)
JPY
218,100,000
$(38)
3/14/44
6 month JPY-LIBOR-BBA
1.795%
$(133,957)
JPY
17,784,000
(3)
3/24/44
6 month JPY-LIBOR-BBA
1.80125%
11,106
$5,879,500
41,079
9/16/24
3 month USD-LIBOR-BBA
2.68%
175,944
JPY
97,000,000
(34)
9/2/43
1.87875%
6 month JPY-LIBOR-BBA
(79,534)
$27,022,900
197,811
9/18/24
3 month USD-LIBOR-BBA
2.665%
776,012
Total
$1,731,380
$(1,441,269)
E Extended effective date.
OTC TOTAL RETURN SWAP CONTRACTS OUTSTANDING at 10/31/14
Swap counterparty/ Notional amount
Upfront premium received (paid)
Termination date
Payments received (paid) by fund per annum
Total return received by or paid by fund
Unrealized appreciation/ (depreciation)
Bank of America N.A.
$608,047
$—
1/12/41
4.00% (1 month USD-LIBOR)
Synthetic TRS Index 4.00% 30 year Fannie Mae pools
$1,082
1,768,000 E
—
6/24/24
(2.865%)
USA Non Revised Consumer Price Index-Urban (CPI-U)
(23,115)
2,298,000 E
—
6/24/24
(2.865%)
USA Non Revised Consumer Price Index-Urban (CPI-U)
(30,044)
Barclays Bank PLC
112,556
—
1/12/40
5.00% (1 month USD-LIBOR)
Synthetic MBX Index 5.00% 30 year Fannie Mae pools
286
201,163
—
1/12/42
4.00% (1 month USD-LIBOR)
Synthetic TRS Index 4.00% 30 year Fannie Mae pools
295
6,576,080
—
1/12/41
4.00% (1 month USD-LIBOR)
Synthetic TRS Index 4.00% 30 year Fannie Mae pools
11,702
8,069,052
—
1/12/41
5.00% (1 month USD-LIBOR)
Synthetic MBX Index 5.00% 30 year Fannie Mae pools
23,050
4,722
—
1/12/38
6.50% (1 month USD-LIBOR)
Synthetic TRS Index 6.50% 30 year Fannie Mae pools
4
124,049
—
1/12/41
5.00% (1 month USD-LIBOR)
Synthetic MBX Index 5.00% 30 year Fannie Mae pools
354
Global Income Trust 57
OTC TOTAL RETURN SWAP CONTRACTS OUTSTANDING at 10/31/14 cont.
Swap counterparty/ Notional amount
Upfront premium received (paid)
Termination date
Payments received (paid) by fund per annum
Total return received by or paid by fund
Unrealized appreciation/ (depreciation)
Barclays Bank PLC cont.
$530,282
$—
1/12/40
4.50% (1 month USD-LIBOR)
Synthetic MBX Index 4.50% 30 year Fannie Mae pools
$2,039
68,784
—
1/12/40
5.00% (1 month USD-LIBOR)
Synthetic MBX Index 5.00% 30 year Fannie Mae pools
175
1,057,767
—
1/12/40
4.50% (1 month USD-LIBOR)
Synthetic MBX Index 4.50% 30 year Fannie Mae pools
4,067
2,869,890
—
1/12/41
5.00% (1 month USD-LIBOR)
Synthetic MBX Index 5.00% 30 year Fannie Mae pools
8,198
576,241
—
1/12/41
5.00% (1 month USD-LIBOR)
Synthetic MBX Index 5.00% 30 year Fannie Mae pools
1,646
98,629
—
1/12/40
5.00% (1 month USD-LIBOR)
Synthetic MBX Index 5.00% 30 year Fannie Mae pools
251
319,762
—
1/12/40
5.00% (1 month USD-LIBOR)
Synthetic MBX Index 5.00% 30 year Fannie Mae pools
814
231,934
—
1/12/40
5.00% (1 month USD-LIBOR)
Synthetic MBX Index 5.00% 30 year Fannie Mae pools
590
1,756,490
—
1/12/38
(6.50%) 1 month USD-LIBOR
Synthetic MBX Index 6.50% 30 year Fannie Mae pools
(5,031)
89,738
—
1/12/39
(6.00%) 1 month USD-LIBOR
Synthetic MBX Index 6.00% 30 year Fannie Mae pools
(346)
289,589
—
1/12/39
(5.50%) 1 month USD-LIBOR
Synthetic MBX Index 5.50% 30 year Fannie Mae pools
(723)
144,794
—
1/12/39
(5.50%) 1 month USD-LIBOR
Synthetic MBX Index 5.50% 30 year Fannie Mae pools
(361)
144,794
—
1/12/39
(5.50%) 1 month USD-LIBOR
Synthetic MBX Index 5.50% 30 year Fannie Mae pools
(361)
290,594
—
1/12/39
(5.50%) 1 month USD-LIBOR
Synthetic MBX Index 5.50% 30 year Fannie Mae pools
(725)
754,622
—
1/12/39
(5.50%) 1 month USD-LIBOR
Synthetic MBX Index 5.50% 30 year Fannie Mae pools
(1,883)
290,594
—
1/12/39
(5.50%) 1 month USD-LIBOR
Synthetic MBX Index 5.50% 30 year Fannie Mae pools
(725)
58 Global Income Trust
OTC TOTAL RETURN SWAP CONTRACTS OUTSTANDING at 10/31/14 cont.
Swap counterparty/ Notional amount
Upfront premium received (paid)
Termination date
Payments received (paid) by fund per annum
Total return received by or paid by fund
Unrealized appreciation/ (depreciation)
Barclays Bank PLC cont.
$1,178,903
$—
1/12/41
4.00% (1 month USD-LIBOR)
Synthetic TRS Index 4.00% 30 year Fannie Mae pools
$2,098
836,649
—
1/12/41
5.00% (1 month USD-LIBOR)
Synthetic TRS Index 5.00% 30 year Ginnie Mae II pools
(292)
272,405
—
1/12/41
5.00% (1 month USD-LIBOR)
Synthetic MBX Index 5.00% 30 year Fannie Mae pools
778
353,574
—
1/12/41
5.00% (1 month USD-LIBOR)
Synthetic TRS Index 5.00% 30 year Ginnie Mae II pools
(123)
450,244
—
1/12/38
6.50% (1 month USD-LIBOR)
Synthetic TRS Index 6.50% 30 year Fannie Mae pools
340
580,099
—
1/12/39
(5.50%) 1 month USD-LIBOR
Synthetic MBX Index 5.50% 30 year Fannie Mae pools
(1,448)
784,107
—
1/12/41
(5.00%) 1 month USD-LIBOR
Synthetic TRS Index 5.00% 30 year Fannie Mae pools
519
2,350,000
—
3/20/24
(2.505%)
USA Non Revised Consumer Price Index-Urban (CPI-U)
(68,749)
1,831,000
—
3/21/24
(2.505%)
USA Non Revised Consumer Price Index-Urban (CPI-U)
(53,562)
3,272,000
—
9/17/19
2.138%
USA Non Revised Consumer Price Index-Urban (CPI-U)
47,624
217,086
814
1/12/41
5.00% (1 month USD-LIBOR)
Synthetic MBX Index 5.00% 30 year Fannie Mae pools
968
Citibank, N.A.
212,476
—
1/12/41
5.00% (1 month USD-LIBOR)
Synthetic MBX Index 5.00% 30 year Fannie Mae pools
607
2,363,000
—
3/27/24
(2.4825%)
USA Non Revised Consumer Price Index-Urban (CPI-U)
(64,179)
2,153,000
—
10/3/16
1.631%
USA Non Revised Consumer Price Index-Urban (CPI-U)
10,868
EUR
4,580,000
—
2/21/19
(1.235%)
Eurostat Eurozone HICP excluding tobacco
(129,022)
EUR
2,380,000
—
2/21/24
1.69%
Eurostat Eurozone HICP excluding tobacco
132,008
Global Income Trust 59
OTC TOTAL RETURN SWAP CONTRACTS OUTSTANDING at 10/31/14 cont.
Swap counterparty/ Notional amount
Upfront premium received (paid)
Termination date
Payments received (paid) by fund per annum
Total return received by or paid by fund
Unrealized appreciation/ (depreciation)
Credit Suisse International
$946,181
$—
1/12/41
4.50% (1 month USD-LIBOR)
Synthetic MBX Index 4.50% 30 year Ginnie Mae II pools
$3,490
572,050
—
1/12/41
(5.00%) 1 month USD-LIBOR
Synthetic TRS Index 5.00% 30 year Fannie Mae pools
379
EUR
1,340,000
—
3/27/19
(1.1913%)
Eurostat Eurozone HICP excluding tobacco
(34,777)
EUR
4,580,000
—
2/20/19
(1.2225%)
Eurostat Eurozone HICP excluding tobacco
(125,269)
EUR
2,380,000
—
2/20/24
1.68%
Eurostat Eurozone HICP excluding tobacco
128,754
EUR
1,340,000
—
3/24/19
(1.1925%)
Eurostat Eurozone HICP excluding tobacco
(34,894)
GBP
1,130,000
—
3/20/19
3.05%
GBP Non-revised UK Retail Price Index
33,082
GBP
1,130,000
—
3/25/19
3.0413%
GBP Non-revised UK Retail Price Index
32,240
Deutsche Bank AG
$2,153,000
—
10/3/16
1.6475%
USA Non Revised Consumer Price Index-Urban (CPI-U)
11,583
Goldman Sachs International
188,945
—
1/12/39
6.00% (1 month USD-LIBOR)
Synthetic TRS Index 6.00% 30 year Fannie Mae pools
(25)
32,060
—
1/12/38
6.50% (1 month USD-LIBOR)
Synthetic TRS Index 6.50% 30 year Fannie Mae pools
24
499,401
—
1/12/42
4.00% (1 month USD-LIBOR)
Synthetic TRS Index 4.00% 30 year Fannie Mae pools
732
499,401
—
1/12/42
4.00% (1 month USD-LIBOR)
Synthetic TRS Index 4.00% 30 year Fannie Mae pools
732
1,652,886
—
1/12/41
4.00% (1 month USD-LIBOR)
Synthetic TRS Index 4.00% 30 year Fannie Mae pools
2,941
637,568
—
1/12/40
4.00% (1 month USD-LIBOR)
Synthetic TRS Index 4.00% 30 year Fannie Mae pools
39
46,060
—
1/12/38
(6.50%) 1 month USD-LIBOR
Synthetic MBX Index 6.50% 30 year Fannie Mae pools
(132)
60 Global Income Trust
OTC TOTAL RETURN SWAP CONTRACTS OUTSTANDING at 10/31/14 cont.
Swap counterparty/ Notional amount
Upfront premium received (paid)
Termination date
Payments received (paid) by fund per annum
Total return received by or paid by fund
Unrealized appreciation/ (depreciation)
Goldman Sachs International cont.
$55,255
$—
1/12/38
(6.50%) 1 month USD-LIBOR
Synthetic MBX Index 6.50% 30 year Fannie Mae pools
$(158)
1,043,638
—
1/12/38
(6.50%) 1 month USD-LIBOR
Synthetic MBX Index 6.50% 30 year Fannie Mae pools
(2,989)
1,410,297
—
1/12/42
4.00% (1 month USD-LIBOR)
Synthetic TRS Index 4.00% 30 year Fannie Mae pools
2,068
742,630
—
1/12/42
4.00% (1 month USD-LIBOR)
Synthetic TRS Index 4.00% 30 year Fannie Mae pools
1,089
707,000
—
7/14/44
(2.83%)
USA Non Revised Consumer Price Index-Urban (CPI-U)
(59,749)
4,066,000 E
—
6/19/24
(2.83%)
USA Non Revised Consumer Price Index-Urban (CPI-U)
(47,027)
484,000
—
7/29/44
(2.7975%)
USA Non Revised Consumer Price Index-Urban (CPI-U)
(36,789)
941,046
18,674
1/12/41
4.00% (1 month USD-LIBOR)
Synthetic TRS Index 4.00% 30 year Fannie Mae pools
20,037
943,359
(20,045)
1/12/41
(5.00%) 1 month USD-LIBOR
Synthetic TRS Index 5.00% 30 year Fannie Mae pools
(19,031)
JPMorgan Chase Bank N.A.
940,614
18,371
1/12/41
4.00% (1 month USD-LIBOR)
Synthetic TRS Index 4.00% 30 year Fannie Mae pools
19,734
943,359
(19,162)
1/12/41
(5.00%) 1 month USD-LIBOR
Synthetic TRS Index 5.00% 30 year Fannie Mae pools
(18,147)
EUR
1,722,000
—
10/3/16
(0.7275%)
Eurostat Eurozone HICP excluding tobacco
(5,438)
EUR
1,722,000
—
10/3/16
(0.7325%)
Eurostat Eurozone HICP excluding tobacco
(5,654)
Total
$(1,348)
$(263,481)
E Extended effective date.
Global Income Trust 61
OTC CREDIT DEFAULT CONTRACTS OUTSTANDING at 10/31/14
Swap counterparty/ Referenced debt*
Rating***
Upfront premium received (paid)**
Notional amount
Termi- nation date
Payments received (paid) by fund per annum
Unrealized appreciation/ (depreciation)
Bank of America N.A.
CMBX NA BBB– Index
BBB–/P
$10,317
$181,000
5/11/63
300 bp
$10,730
CMBX NA BBB– Index
BBB–/P
10,865
176,000
5/11/63
300 bp
11,267
CMBX NA BBB– Index
BBB–/P
5,303
88,000
5/11/63
300 bp
5,504
CMBX NA BBB– Index
BBB–/P
2,666
39,000
5/11/63
300 bp
2,755
Barclays Bank PLC
CMBX NA BBB– Index
BBB–/P
13,525
122,000
5/11/63
300 bp
13,804
Credit Suisse International
CMBX NA BBB– Index
BBB–/P
12,926
315,000
5/11/63
300 bp
13,646
CMBX NA BBB– Index
BBB–/P
19,849
259,000
5/11/63
300 bp
20,441
CMBX NA BBB– Index
BBB–/P
13,039
179,000
5/11/63
300 bp
13,448
CMBX NA BBB– Index
BBB–/P
2,397
156,000
5/11/63
300 bp
2,753
CMBX NA BBB– Index
BBB–/P
4,625
152,000
5/11/63
300 bp
4,972
CMBX NA BBB– Index
BBB–/P
2,678
152,000
5/11/63
300 bp
3,025
CMBX NA BBB– Index
BBB–/P
11,968
150,000
5/11/63
300 bp
12,310
CMBX NA BBB– Index
BBB–/P
9,867
150,000
5/11/63
300 bp
10,210
CMBX NA BBB– Index
BBB–/P
11,537
149,000
5/11/63
300 bp
11,877
CMBX NA BBB– Index
BBB–/P
15,707
139,000
5/11/63
300 bp
16,023
CMBX NA BBB– Index
BBB–/P
1,382
119,000
5/11/63
300 bp
1,653
CMBX NA BBB– Index
BBB–/P
8,994
113,000
5/11/63
300 bp
9,252
CMBX NA BBB– Index
BBB–/P
690
89,000
5/11/63
300 bp
894
CMBX NA BB Index
—
(846)
162,000
5/11/63
(500 bp)
(761)
CMBX NA BB Index
—
(2,096)
120,000
5/11/63
(500 bp)
(2,032)
CMBX NA BB Index
—
2,826
107,000
5/11/63
(500 bp)
2,882
CMBX NA BB Index
—
1,624
105,000
5/11/63
(500 bp)
1,679
CMBX NA BB Index
—
941
91,000
5/11/63
(500 bp)
989
CMBX NA BB Index
—
(415)
54,000
5/11/63
(500 bp)
(386)
CMBX NA BB Index
—
(517)
54,000
5/11/63
(500 bp)
(489)
62 Global Income Trust
OTC CREDIT DEFAULT CONTRACTS OUTSTANDING at 10/31/14 cont.
Swap counterparty/ Referenced debt*
Rating***
Upfront premium received (paid)**
Notional amount
Termi- nation date
Payments received (paid) by fund per annum
Unrealized appreciation/ (depreciation)
Credit Suisse International cont.
CMBX NA BB Index
—
$(493)
$54,000
5/11/63
(500 bp)
$(464)
CMBX NA BB Index
—
1,060
53,000
5/11/63
(500 bp)
1,088
CMBX NA BB Index
—
(2,308)
119,000
5/11/63
(500 bp)
(2,245)
CMBX NA BBB– Index
BBB–/P
(4,569)
236,000
5/11/63
300 bp
(4,030)
CMBX NA BBB– Index
BBB–/P
(1,627)
162,000
5/11/63
300 bp
(1,257)
CMBX NA BBB– Index
BBB–/P
746
161,000
5/11/63
300 bp
1,113
CMBX NA BBB– Index
BBB–/P
602
130,000
5/11/63
300 bp
899
CMBX NA BBB– Index
BBB–/P
(2,114)
117,000
5/11/63
300 bp
(1,847)
CMBX NA BBB– Index
BBB–/P
81
116,000
5/11/63
300 bp
345
CMBX NA BBB– Index
BBB–/P
402
116,000
5/11/63
300 bp
667
CMBX NA BBB– Index
BBB–/P
1,323
111,000
5/11/63
300 bp
1,576
CMBX NA BBB– Index
BBB–/P
1,104
111,000
5/11/63
300 bp
1,357
CMBX NA BBB– Index
BBB–/P
2,617
110,000
5/11/63
300 bp
2,869
CMBX NA BBB– Index
BBB–/P
(1,020)
109,000
5/11/63
300 bp
(772)
CMBX NA BBB– Index
BBB–/P
(364)
109,000
5/11/63
300 bp
(115)
CMBX NA BBB– Index
BBB–/P
(364)
109,000
5/11/63
300 bp
(115)
CMBX NA BBB– Index
BBB–/P
(912)
109,000
5/11/63
300 bp
(663)
CMBX NA BBB– Index
BBB–/P
(1,082)
108,000
5/11/63
300 bp
(835)
CMBX NA BBB– Index
BBB–/P
67
101,000
5/11/63
300 bp
298
CMBX NA BBB– Index
BBB–/P
589
97,000
5/11/63
300 bp
810
CMBX NA BBB– Index
BBB–/P
(332)
55,000
5/11/63
300 bp
(206)
CMBX NA BBB– Index
BBB–/P
(525)
55,000
5/11/63
300 bp
(399)
CMBX NA BBB– Index
BBB–/P
94
35,000
5/11/63
300 bp
174
CMBX NA BBB– Index
BBB–/P
48
1,000
5/11/63
300 bp
50
Global Income Trust 63
OTC CREDIT DEFAULT CONTRACTS OUTSTANDING at 10/31/14 cont.
Swap counterparty/ Referenced debt*
Rating***
Upfront premium received (paid)**
Notional amount
Termi- nation date
Payments received (paid) by fund per annum
Unrealized appreciation/ (depreciation)
Credit Suisse International cont.
CMBX NA BBB– Index
—
$(7,683)
$136,000
1/17/47
(300 bp)
$(5,111)
CMBX NA BBB– Index
—
(6,289)
134,000
1/17/47
(300 bp)
(3,754)
Goldman Sachs International
CMBX NA BB Index
—
(1,315)
124,000
5/11/63
(500 bp)
(1,249)
CMBX NA BB Index
—
(519)
54,000
5/11/63
(500 bp)
(490)
CMBX NA BB Index
—
1,198
53,000
5/11/63
(500 bp)
1,226
CMBX NA BBB– Index
BBB–/P
(1,950)
117,000
5/11/63
300 bp
(1,682)
CMBX NA BBB– Index
BBB–/P
(875)
109,000
5/11/63
300 bp
(627)
CMBX NA BBB– Index
BBB–/P
(437)
109,000
5/11/63
300 bp
(189)
CMBX NA BBB– Index
BBB–/P
(1,011)
108,000
5/11/63
300 bp
(764)
CMBX NA BBB– Index
BBB–/P
(1,083)
108,000
5/11/63
300 bp
(837)
CMBX NA BBB– Index
BBB–/P
(1,083)
108,000
5/11/63
300 bp
(837)
CMBX NA BBB– Index
BBB–/P
1,188
104,000
5/11/63
300 bp
1,426
CMBX NA BBB– Index
BBB–/P
614
103,000
5/11/63
300 bp
850
CMBX NA BBB– Index
BBB–/P
(600)
55,000
5/11/63
300 bp
(474)
Total
$133,030
$152,232
*Payments related to the referenced debt are made upon a credit default event.
**Upfront premium is based on the difference between the original spread on issue and the market spread on day of execution.
***Ratings are presented for credit default contracts in which the fund has sold protection on the underlying referenced debt. Ratings for an underlying index represent the average of the ratings of all the securities included in that index. The Moody’s, Standard & Poor’s or Fitch ratings are believed to be the most recent ratings available at October 31, 2014. Securities rated by Putnam are indicated by “/P.”
64 Global Income Trust
ASC 820 establishes a three-level hierarchy for disclosure of fair value measurements. The valuation hierarchy is based upon the transparency of inputs to the valuation of the fund’s investments. The three levels are defined as follows:
Level 1: Valuations based on quoted prices for identical securities in active markets.
Level 2: Valuations based on quoted prices in markets that are not active or for which all significant inputs are observable, either directly or indirectly.
Level 3: Valuations based on inputs that are unobservable and significant to the fair value measurement.
The following is a summary of the inputs used to value the fund’s net assets as of the close of the reporting period:
Valuation inputs
Investments in securities:
Level 1
Level 2
Level 3
Asset-backed securities
$—
$7,687,000
$—
Corporate bonds and notes
—
95,885,872
—
Foreign government and agency bonds and notes
—
108,339,432
—
Mortgage-backed securities
—
84,281,197
—
Municipal bonds and notes
—
455,215
—
Purchased options outstanding
—
93,590
—
Purchased swap options outstanding
—
328,581
—
U.S. government and agency mortgage obligations
—
50,027,861
—
Short-term investments
34,230,737
8,490,500
—
Totals by level
$34,230,737
$355,589,248
$—
Valuation inputs
Other financial instruments:
Level 1
Level 2
Level 3
Forward currency contracts
$—
$1,039,154
$—
Futures contracts
164,088
—
—
Written options outstanding
—
(75,130)
—
Written swap options outstanding
—
(1,422,012)
—
Forward premium swap option contracts
—
(38,690)
—
TBA sale commitments
—
(13,803,515)
—
Interest rate swap contracts
—
(2,870,011)
—
Total return swap contracts
—
(262,133)
—
Credit default contracts
—
19,202
—
Totals by level
$164,088
$(17,413,135)
$—
During the reporting period, transfers within the fair value hierarchy, if any, did not represent, in the aggregate, more than 1% of the fund’s net assets measured as of the end of the period.
The accompanying notes are an integral part of these financial statements.
Receivable for sales of delayed delivery securities (Note 1)
11,420,905
Receivable for variation margin (Note 1)
1,084,113
Unrealized appreciation on forward premium swap option contracts (Note 1)
281,585
Unrealized appreciation on forward currency contracts (Note 1)
3,909,186
Unrealized appreciation on OTC swap contracts (Note 1)
1,735,483
Premium paid on OTC swap contracts (Note 1)
81,636
Prepaid assets
37,943
Total assets
414,015,100
LIABILITIES
Payable for investments purchased
1,249,332
Payable for purchases of delayed delivery securities (Note 1)
40,281,699
Payable for shares of the fund repurchased
988,528
Payable for compensation of Manager (Note 2)
160,877
Payable for custodian fees (Note 2)
29,639
Payable for investor servicing fees (Note 2)
76,390
Payable for Trustee compensation and expenses (Note 2)
127,397
Payable for administrative services (Note 2)
952
Payable for distribution fees (Note 2)
76,539
Payable for variation margin (Note 1)
1,009,212
Unrealized depreciation on OTC swap contracts (Note 1)
1,544,094
Premium received on OTC swap contracts (Note 1)
213,318
Unrealized depreciation on forward currency contracts (Note 1)
2,870,032
Unrealized depreciation on forward premium swap option contracts (Note 1)
320,275
Written options outstanding, at value (premiums $1,398,123) (Notes 1 and 3)
1,497,142
TBA sale commitments, at value (proceeds receivable $13,795,742) (Note 1)
13,803,515
Collateral on certain derivative contracts, at value (Note 1)
339,000
Other accrued expenses
197,267
Total liabilities
64,785,208
Net assets
$349,229,892
(Continued on next page)
The accompanying notes are an integral part of these financial statements.
66 Global Income Trust
Statement of assets and liabilities (Continued)
REPRESENTED BY
Paid-in capital (Unlimited shares authorized) (Notes 1 and 4)
$349,700,299
Undistributed net investment income (Note 1)
3,249,894
Accumulated net realized loss on investments and foreign currency transactions (Note 1)
(10,849,200)
Net unrealized appreciation of investments and assets and liabilities in foreign currencies
7,128,899
Total — Representing net assets applicable to capital shares outstanding
$349,229,892
COMPUTATION OF NET ASSET VALUE AND OFFERING PRICE
Net asset value and redemption price per class A share ($171,481,106 divided by 13,607,822 shares)
$12.60
Offering price per class A share (100/96.00 of $12.60)*
$13.13
Net asset value and offering price per class B share ($7,884,095 divided by 628,568 shares)**
$12.54
Net asset value and offering price per class C share ($30,175,246 divided by 2,404,788 shares)**
$12.55
Net asset value and redemption price per class M share ($10,910,604 divided by 874,211 shares)
$12.48
Offering price per class M share (100/96.75 of $12.48)†
$12.90
Net asset value, offering price and redemption price per class R share ($6,072,316 divided by 482,755 shares)
$12.58
Net asset value, offering price and redemption price per class R5 share ($23,956 divided by 1,901 shares)
$12.60
Net asset value, offering price and redemption price per class R6 share ($4,735,889 divided by 375,839 shares)
$12.60
Net asset value, offering price and redemption price per class Y share ($117,946,680 divided by 9,363,278 shares)
$12.60
*
On single retail sales of less than $100,000. On sales of $100,000 or more the offering price is reduced.
**
Redemption price per share is equal to net asset value less any applicable contingent deferred sales charge.
†
On single retail sales of less than $50,000. On sales of $50,000 or more the offering price is reduced.
The accompanying notes are an integral part of these financial statements.
Global Income Trust 67
Statement of operations Year ended 10/31/14
INVESTMENT INCOME
Interest (including interest income of $15,657 from investments in affiliated issuers) (Note 5)
$12,815,224
EXPENSES
Compensation of Manager (Note 2)
1,775,127
Investor servicing fees (Note 2)
446,178
Custodian fees (Note 2)
95,504
Trustee compensation and expenses (Note 2)
18,506
Distribution fees (Note 2)
969,916
Administrative services (Note 2)
7,884
Other
417,420
Total expenses
3,730,535
Expense reduction (Note 2)
(889)
Net expenses
3,729,646
Net investment income
9,085,578
Net realized gain on investments (Notes 1 and 3)
6,755,413
Net realized loss on swap contracts (Note 1)
(3,881,912)
Net realized loss on futures contracts (Note 1)
(5,772,444)
Net realized loss on foreign currency transactions (Note 1)
(763,992)
Net realized gain on written options (Notes 1 and 3)
1,931,390
Net unrealized appreciation of assets and liabilities in foreign currencies during the year
2,444,968
Net unrealized depreciation of investments, futures contracts, swap contracts, written options and TBA sale commitments during the year
(159,350)
Net gain on investments
554,073
Net increase in net assets resulting from operations
$9,639,651
The accompanying notes are an integral part of these financial statements.
68 Global Income Trust
Statement of changes in net assets
INCREASE (DECREASE) IN NET ASSETS
Year ended 10/31/14
Year ended 10/31/13
Operations:
Net investment income
$9,085,578
$9,988,638
Net realized gain (loss) on investments and foreign currency transactions
(1,731,545)
7,986,115
Net unrealized appreciation (depreciation) of investments and assets and liabilities in foreign currencies
2,285,618
(15,823,667)
Net increase in net assets resulting from operations
9,639,651
2,151,086
Distributions to shareholders (Note 1):
From ordinary income
Net investment income
Class A
(5,908,621)
(6,033,372)
Class B
(191,793)
(212,458)
Class C
(678,804)
(740,318)
Class M
(321,934)
(340,470)
Class R
(165,487)
(136,973)
Class R5
(513)
(311)
Class R6
(152,391)
(77,428)
Class Y
(2,318,525)
(1,615,804)
From return of capital
Class A
—
(653,480)
Class B
—
(23,011)
Class C
—
(80,185)
Class M
—
(36,876)
Class R
—
(14,836)
Class R5
—
(34)
Class R6
—
(8,386)
Class Y
—
(175,009)
Increase (decrease) from capital share transactions (Note 4)
47,123,695
(52,950,579)
Total increase (decrease) in net assets
47,025,278
(60,948,444)
NET ASSETS
Beginning of year
302,204,614
363,153,058
End of year (including undistributed net investment income of $3,249,894 and $1,708,698, respectively)
$349,229,892
$302,204,614
The accompanying notes are an integral part of these financial statements.
Global Income Trust 69
Financial highlights (For a common share outstanding throughout the period)
INVESTMENT OPERATIONS:
LESS DISTRIBUTIONS:
RATIOS AND SUPPLEMENTAL DATA:
Period ended
Net asset value, beginning of period
Net investment income (loss)a
Net realized and unrealized gain (loss) on investments
Total from investment operations
From net investment income
From return of capital
Total distributions
Redemption fees
Non-recurring reimbursements
Net asset value, end of period
Total return at net asset value (%)b
Net assets, end of period (in thousands)
Ratio of expenses to average net assets (%)c
Ratio of net investment income (loss) to average net assets (%)
Portfolio turnover (%)
Class A
October 31, 2014
$12.57
.36
.05
.41
(.38)
—
(.38)
—
—
$12.60
3.30
$171,481
1.09
2.84
295d
October 31, 2013
12.85
.38
(.27)
.11
(.35)
(.04)
(.39)
—
—
12.57
.82
199,284
1.10
2.96
335e
October 31, 2012
12.58
.36
.38
.74
(.36)
(.11)
(.47)
—
—
12.85
6.02
229,240
1.10
2.85
162e
October 31, 2011
13.15
.47
(.27)
.20
(.77)
—
(.77)
—f
—f,g
12.58
1.55
215,202
1.13
3.67
116e
October 31, 2010
13.24
.80
.82
1.62
(1.71)
—
(1.71)
—f
—f,h
13.15
13.63
157,631
1.14i
6.35i
79e
Class B
October 31, 2014
$12.51
.26
.06
.32
(.29)
—
(.29)
—
—
$12.54
2.54
$7,884
1.84
2.08
295d
October 31, 2013
12.80
.28
(.28)
—f
(.26)
(.03)
(.29)
—
—
12.51
(.01)
9,002
1.85
2.21
335e
October 31, 2012
12.53
.26
.38
.64
(.28)
(.09)
(.37)
—
—
12.80
5.24
11,109
1.85
2.10
162e
October 31, 2011
13.10
.38
(.28)
.10
(.67)
—
(.67)
—f
—f,g
12.53
.81
11,499
1.88
2.94
116e
October 31, 2010
13.20
.72
.80
1.52
(1.62)
—
(1.62)
—f
—f,h
13.10
12.74
9,453
1.89i
5.67i
79e
Class C
October 31, 2014
$12.51
.26
.07
.33
(.29)
—
(.29)
—
—
$12.55
2.61
$30,175
1.84
2.08
295d
October 31, 2013
12.80
.28
(.28)
—f
(.26)
(.03)
(.29)
—
—
12.51
(.01)
31,771
1.85
2.22
335e
October 31, 2012
12.53
.26
.38
.64
(.28)
(.09)
(.37)
—
—
12.80
5.25
39,316
1.85
2.10
162e
October 31, 2011
13.10
.35
(.24)
.11
(.68)
—
(.68)
—f
—f,g
12.53
.83
36,264
1.88
2.70
116e
October 31, 2010
13.20
.68
.85
1.53
(1.63)
—
(1.63)
—f
—f,h
13.10
12.80
13,700
1.89i
5.39i
79e
Class M
October 31, 2014
$12.45
.33
.05
.38
(.35)
—
(.35)
—
—
$12.48
3.07
$10,911
1.34
2.58
295d
October 31, 2013
12.74
.34
(.28)
.06
(.32)
(.03)
(.35)
—
—
12.45
.50
12,457
1.35
2.71
335e
October 31, 2012
12.47
.32
.38
.70
(.33)
(.10)
(.43)
—
—
12.74
5.80
14,969
1.35
2.60
162e
October 31, 2011
13.04
.45
(.28)
.17
(.74)
—
(.74)
—f
—f,g
12.47
1.30
16,403
1.38
3.51
116e
October 31, 2010
13.14
.78
.80
1.58
(1.68)
—
(1.68)
—f
—f,h
13.04
13.35
17,170
1.39i
6.21i
79e
Class R
October 31, 2014
$12.54
.33
.06
.39
(.35)
—
(.35)
—
—
$12.58
3.12
$6,072
1.34
2.58
295d
October 31, 2013
12.83
.34
(.28)
.06
(.32)
(.03)
(.35)
—
—
12.54
.50
5,586
1.35
2.70
335e
October 31, 2012
12.56
.33
.37
.70
(.33)
(.10)
(.43)
—
—
12.83
5.76
4,142
1.35
2.61
162e
October 31, 2011
13.14
.44
(.28)
.16
(.74)
—
(.74)
—f
—f,g
12.56
1.25
3,658
1.38
3.43
116e
October 31, 2010
13.23
.75
.84
1.59
(1.68)
—
(1.68)
—f
—f,h
13.14
13.39
2,264
1.39i
5.92i
79e
Class R5
October 31, 2014
$12.56
.39
.07
.46
(.42)
—
(.42)
—
—
$12.60
3.67
$24
.82
3.02
295d
October 31, 2013
12.85
.42
(.29)
.13
(.38)
(.04)
(.42)
—
—
12.56
1.02
11
.82
3.27
335e
October 31, 2012†
12.45
.13
.41
.54
(.11)
(.03)
(.14)
—
—
12.85
4.34*
10
.27*
.99*
162e
Class R6
October 31, 2014
$12.57
.40
.06
.46
(.43)
—
(.43)
—
—
$12.60
3.64
$4,736
.75
3.15
295d
October 31, 2013
12.85
.38j
(.23)
.15
(.39)
(.04)
(.43)
—
—
12.57
1.19
4,025
.75
3.00j
335e
October 31, 2012†
12.45
.13
.41
.54
(.11)
(.03)
(.14)
—
—
12.85
4.37*
10
.25*
1.01*
162e
Class Y
October 31, 2014
$12.57
.38
.07
.45
(.42)
—
(.42)
—
—
$12.60
3.58
$117,947
.84
2.97
295d
October 31, 2013
12.86
.41
(.28)
.13
(.38)
(.04)
(.42)
—
—
12.57
1.00
40,069
.85
3.22
335e
October 31, 2012
12.58
.39
.39
.78
(.38)
(.12)
(.50)
—
—
12.86
6.40
64,357
.85
3.11
162e
October 31, 2011
13.16
.46
(.24)
.22
(.80)
—
(.80)
—f
—f,g
12.58
1.74
72,631
.88
3.53
116e
October 31, 2010
13.25
.83
.83
1.66
(1.75)
—
(1.75)
—f
—f,h
13.16
13.93
13,371
.89i
6.54i
79e
See notes to financial highlights at the end of this section.
The accompanying notes are an integral part of these financial statements.
70
Global Income Trust
Global Income Trust
71
Financial highlights (Continued)
* Not annualized.
† For the period July 3, 2012 (commencement of operations) to October 31, 2012.
a Per share net investment income (loss) has been determined on the basis of the weighted average number of shares outstanding during the period.
b Total return assumes dividend reinvestment and does not reflect the effect of sales charges.
c Includes amounts paid through expense offset and/or brokerage/service arrangements, if any (Note 2). Also excludes acquired fund fees and expenses, if any.
d Portfolio turnover includes TBA purchase and sale commitments.
e Portfolio turnover excludes TBA purchase and sale commitments. Including TBA purchase and sale commitments to conform with current year presentation, the portfolio turnover would have been the following:
Portfolio turnover %
October 31, 2013
673%
October 31, 2012
328
October 31, 2011
319
October 31, 2010
161
f Amount represents less than $0.01 per share.
g Reflects a non-recurring reimbursement related to restitution amounts in connection with a distribution plan approved by the Securities and Exchange Commission (the SEC) which amounted to less than $0.01 per share outstanding on July 21, 2011. Also reflects a non-recurring reimbursement related to short-term trading related lawsuits, which amounted to less than $0.01 per share outstanding on May 11, 2011.
h Reflects a non-recurring reimbursement pursuant to a settlement between the SEC and Prudential Securities, Inc. which amounted to less than $0.01 per share outstanding on March 30, 2010.
i Reflects an involuntary contractual expense limitation in effect during the period. As a result of such limitation, the expenses of each class reflect a reduction of 0.02% of average net assets.
j The net investment income ratio and per share amount shown for the period ending October 31, 2013 may not correspond with the expected class specific differences for the period due to the timing of subscriptions into the class.
The accompanying notes are an integral part of these financial statements.
72 Global Income Trust
Notes to financial statements 10/31/14
Within the following Notes to financial statements, references to “State Street” represent State Street Bank and Trust Company, references to “the SEC” represent the Securities and Exchange Commission, references to “Putnam Management” represent Putnam Investment Management, LLC, the fund’s manager, an indirect wholly-owned subsidiary of Putnam Investments, LLC and references to “OTC”, if any, represent over-the-counter. Unless otherwise noted, the “reporting period” represents the period from November 1, 2013 through October 31, 2014.
Putnam Global Income Trust (the fund) is a Massachusetts business trust, which is registered under the Investment Company Act of 1940, as amended, as a non-diversified open-end management investment company. The goal of the fund is to seek high current income. Preservation of capital and long-term total return are secondary objectives, but only to the extent consistent with the objective of seeking high current income. The fund invests mainly in bonds and securitized debt instruments (such as mortgage-backed investments) that are obligations of companies and governments worldwide; that are investment-grade in quality; and that have intermediate- to long-term maturities (three years or longer). The fund may also invest in bonds that are below-investment-grade in quality (sometimes referred to as “junk bonds”). Putnam Management may consider, among other factors, credit, interest rate and prepayment risks, as well as general market conditions, when deciding whether to buy or sell investments.
The fund offers class A, class B, class C, class M, class R, class R5, class R6 and class Y shares. Class A and class M shares are sold with a maximum front-end sales charge of 4.00% and 3.25%, respectively, and generally do not pay a contingent deferred sales charge. Class B shares, which convert to class A shares after approximately eight years, do not pay a front-end sales charge and are subject to a contingent deferred sales charge if those shares are redeemed within six years of purchase. Class C shares have a one-year 1.00% contingent deferred sales charge and do not convert to class A shares. Class R shares, which are not available to all investors, are sold at net asset value. The expenses for class A, class B, class C, class M and class R shares may differ based on the distribution fee of each class, which is identified in Note 2. Class R5, class R6 and class Y shares, which are sold at net asset value, are generally subject to the same expenses as class A, class B, class C, class M and class R shares, but do not bear a distribution fee and in the case of class R5 and class R6 shares, bear a lower investor servicing fee, which is identified in Note 2. Class R5, class R6 and class Y shares are not available to all investors.
In the normal course of business, the fund enters into contracts that may include agreements to indemnify another party under given circumstances. The fund’s maximum exposure under these arrangements is unknown as this would involve future claims that may be, but have not yet been, made against the fund. However, the fund’s management team expects the risk of material loss to be remote.
Note 1: Significant accounting policies
The following is a summary of significant accounting policies consistently followed by the fund in the preparation of its financial statements. The preparation of financial statements is in conformity with accounting principles generally accepted in the United States of America and requires management to make estimates and assumptions that affect the reported amounts of assets and liabilities in the financial statements and the reported amounts of increases and decreases in net assets from operations. Actual results could differ from those estimates. Subsequent events after the Statement of assets and liabilities date through the date that the financial statements were issued have been evaluated in the preparation of the financial statements.
Investment income, realized and unrealized gains and losses and expenses of the fund are borne pro-rata based on the relative net assets of each class to the total net assets of the fund, except that each class bears expenses unique to that class (including the distribution fees applicable to such classes). Each class votes as a class only with respect to its own distribution plan or other matters on which a class vote is required by law or determined by the Trustees. If the fund were liquidated, shares of each class would receive their pro-rata share of the net assets of the fund. In addition, the Trustees declare separate dividends on each class of shares.
Security valuation Market quotations are not considered to be readily available for certain debt obligations and other investments; such investments are valued on the basis of valuations furnished by an independent pricing service approved by the Trustees or dealers selected by Putnam Management. Such services or dealers determine valuations for normal institutional-size trading units of such securities using methods based on market transactions for comparable securities and various relationships, generally recognized by institutional traders, between securities (which consider such factors as security prices, yields, maturities and ratings). These securities will generally be categorized as Level 2. Securities quoted in foreign currencies, if any, are translated into U.S. dollars at the current
Global Income Trust 73
exchange rate. Short-term securities with remaining maturities of 60 days or less may be valued at amortized cost, which approximates fair value and are classified as Level 2 securities.
Investments in open-end investment companies (excluding exchange traded funds), if any, which can be classified as Level 1 or Level 2 securities, are valued based on their net asset value. The net asset value of such investment companies equals the total value of their assets less their liabilities and divided by the number of their outstanding shares.
To the extent a pricing service or dealer is unable to value a security or provides a valuation that Putnam Management does not believe accurately reflects the security’s fair value, the security will be valued at fair value by Putnam Management in accordance with policies and procedures approved by the Trustees. Certain investments, including certain restricted and illiquid securities and derivatives, are also valued at fair value following procedures approved by the Trustees. These valuations consider such factors as significant market or specific security events such as interest rate or credit quality changes, various relationships with other securities, discount rates, U.S. Treasury, U.S. swap and credit yields, index levels, convexity exposures and recovery rates. These securities are classified as Level 2 or as Level 3 depending on the priority of the significant inputs.
Such valuations and procedures are reviewed periodically by the Trustees. Certain securities may be valued on the basis of a price provided by a single source. The fair value of securities is generally determined as the amount that the fund could reasonably expect to realize from an orderly disposition of such securities over a reasonable period of time. By its nature, a fair value price is a good faith estimate of the value of a security in a current sale and does not reflect an actual market price, which may be different by a material amount.
Security transactions and related investment income Security transactions are recorded on the trade date (the date the order to buy or sell is executed). Gains or losses on securities sold are determined on the identified cost basis.
Interest income, net of any applicable withholding taxes, is recorded on the accrual basis.
All premiums/discounts are amortized/accreted on a yield-to-maturity basis.
The fund earned certain fees in connection with its senior loan purchasing activities. These fees are treated as market discount and are amortized into income in the Statement of operations.
Securities purchased or sold on a forward commitment or delayed delivery basis may be settled at a future date beyond customary settlement time; interest income is accrued based on the terms of the securities. Losses may arise due to changes in the fair value of the underlying securities or if the counterparty does not perform under the contract.
Stripped securities The fund may invest in stripped securities which represent a participation in securities that may be structured in classes with rights to receive different portions of the interest and principal. Interest-only securities receive all of the interest and principal-only securities receive all of the principal. If the interest-only securities experience greater than anticipated prepayments of principal, the fund may fail to recoup fully its initial investment in these securities. Conversely, principal-only securities increase in value if prepayments are greater than anticipated and decline if prepayments are slower than anticipated. The fair value of these securities is highly sensitive to changes in interest rates.
Foreign currency translation The accounting records of the fund are maintained in U.S. dollars. The fair value of foreign securities, currency holdings, and other assets and liabilities is recorded in the books and records of the fund after translation to U.S. dollars based on the exchange rates on that day. The cost of each security is determined using historical exchange rates. Income and withholding taxes are translated at prevailing exchange rates when earned or incurred. The fund does not isolate that portion of realized or unrealized gains or losses resulting from changes in the foreign exchange rate on investments from fluctuations arising from changes in the market prices of the securities. Such gains and losses are included with the net realized and unrealized gain or loss on investments. Net realized gains and losses on foreign currency transactions represent net realized exchange gains or losses on closed forward currency contracts, disposition of foreign currencies, currency gains and losses realized between the trade and settlement dates on securities transactions and the difference between the amount of investment income and foreign withholding taxes recorded on the fund’s books and the U.S. dollar equivalent amounts actually received or paid. Net unrealized appreciation and depreciation of assets and liabilities in foreign currencies arise from changes in the value of open forward currency contracts and assets and liabilities other than investments at the period end, resulting from changes in the exchange rate.
Options contracts The fund uses options contracts to hedge duration and convexity, to isolate prepayment risk and to manage downside risks.
74 Global Income Trust
The potential risk to the fund is that the change in value of options contracts may not correspond to the change in value of the hedged instruments. In addition, losses may arise from changes in the value of the underlying instruments if there is an illiquid secondary market for the contracts, if interest or exchange rates move unexpectedly or if the counterparty to the contract is unable to perform. Realized gains and losses on purchased options are included in realized gains and losses on investment securities. If a written call option is exercised, the premium originally received is recorded as an addition to sales proceeds. If a written put option is exercised, the premium originally received is recorded as a reduction to the cost of investments.
Exchange traded options are valued at the last sale price or, if no sales are reported, the last bid price for purchased options and the last ask price for written options. OTC traded options are valued using prices supplied by dealers.
Options on swaps are similar to options on securities except that the premium paid or received is to buy or grant the right to enter into a previously agreed upon interest rate or credit default contract. Forward premium swap option contracts include premiums that have extended settlement dates. The delayed settlement of the premiums is factored into the daily valuation of the option contracts. In the case of interest rate cap and floor contracts, in return for a premium, ongoing payments between two parties are based on interest rates exceeding a specified rate, in the case of a cap contract, or falling below a specified rate in the case of a floor contract.
Written option contracts outstanding at period end, if any, are listed after the fund’s portfolio.
Futures contracts The fund uses futures contracts to hedge interest rate risk and to gain exposure to interest rates.
The potential risk to the fund is that the change in value of futures contracts may not correspond to the change in value of the hedged instruments. In addition, losses may arise from changes in the value of the underlying instruments, if there is an illiquid secondary market for the contracts, if interest or exchange rates move unexpectedly or if the counterparty to the contract is unable to perform. With futures, there is minimal counterparty credit risk to the fund since futures are exchange traded and the exchange’s clearinghouse, as counterparty to all exchange traded futures, guarantees the futures against default. Risks may exceed amounts recognized on the Statement of assets and liabilities. When the contract is closed, the fund records a realized gain or loss equal to the difference between the value of the contract at the time it was opened and the value at the time it was closed.
Futures contracts are valued at the quoted daily settlement prices established by the exchange on which they trade. The fund and the broker agree to exchange an amount of cash equal to the daily fluctuation in the value of the futures contract. Such receipts or payments are known as “variation margin.”
Futures contracts outstanding at period end, if any, are listed after the fund’s portfolio.
Forward currency contracts The fund buys and sells forward currency contracts, which are agreements between two parties to buy and sell currencies at a set price on a future date. These contracts are used to hedge foreign exchange risk and to gain exposure on currency.
The U.S. dollar value of forward currency contracts is determined using current forward currency exchange rates supplied by a quotation service. The fair value of the contract will fluctuate with changes in currency exchange rates. The contract is marked to market daily and the change in fair value is recorded as an unrealized gain or loss. The fund records a realized gain or loss equal to the difference between the value of the contract at the time it was opened and the value at the time it was closed when the contract matures or by delivery of the currency. The fund could be exposed to risk if the value of the currency changes unfavorably, if the counterparties to the contracts are unable to meet the terms of their contracts or if the fund is unable to enter into a closing position. Risks may exceed amounts recognized on the Statement of assets and liabilities.
Forward currency contracts outstanding at period end, if any, are listed after the fund’s portfolio.
Interest rate swap contracts The fund entered into OTC and/or centrally cleared interest rate swap contracts, which are arrangements between two parties to exchange cash flows based on a notional principal amount, to hedge interest rate risk and to gain exposure on interest rates.
An OTC and centrally cleared interest rate swap can be purchased or sold with an upfront premium. For OTC interest rate swap contracts, an upfront payment received by the fund is recorded as a liability on the fund’s books. An upfront payment made by the fund is recorded as an asset on the fund’s books. OTC and centrally cleared interest rate swap contracts are marked to market daily based upon quotations from an independent pricing service or market makers. Any change is recorded as an unrealized gain or loss on OTC interest rate swaps. Daily fluctuations in the value of centrally cleared interest rate swaps are settled through a central clearing agent and are recorded in variation margin on the Statement of assets and liabilities and recorded as unrealized gain or loss. Payments, including upfront premiums, received or made are recorded as realized gains or losses at the reset date
Global Income Trust 75
or the closing of the contract. Certain OTC and centrally cleared interest rate swap contracts may include extended effective dates. Payments related to these swap contracts are accrued based on the terms of the contract.
The fund could be exposed to credit or market risk due to unfavorable changes in the fluctuation of interest rates or if the counterparty defaults, in the case of OTC interest rate contracts, or the central clearing agency or a clearing member defaults, in the case of centrally cleared interest rate swap contracts, on its respective obligation to perform under the contract. The fund’s maximum risk of loss from counterparty risk or central clearing risk is the fair value of the contract. This risk may be mitigated for OTC interest rate swap contracts by having a master netting arrangement between the fund and the counterparty and for centrally cleared interest rate swap contracts through the daily exchange of variation margin. There is minimal counterparty risk with respect to centrally cleared interest rate swap contracts due to the clearinghouse guarantee fund and other resources that are available in the event of a clearing member default. Risk of loss may exceed amounts recognized on the Statement of assets and liabilities.
OTC and centrally cleared interest rate swap contracts outstanding, including their respective notional amounts at period end, if any, are listed after the fund’s portfolio.
Total return swap contracts The fund entered into OTC total return swap contracts, which are arrangements to exchange a market linked return for a periodic payment, both based on a notional principal amount, to hedge sector exposure, to manage exposure to specific sectors or industries, to gain exposure to a basket of securities, to gain exposure to specific sectors or industries and to gain exposure to rates of inflation in specific regions or countries.
To the extent that the total return of the security, index or other financial measure underlying the transaction exceeds or falls short of the offsetting interest rate obligation, the fund will receive a payment from or make a payment to the counterparty. OTC total return swap contracts are marked to market daily based upon quotations from an independent pricing service or market makers and the change, if any, is recorded as an unrealized gain or loss. Payments received or made are recorded as realized gains or losses. Certain OTC total return swap contracts may include extended effective dates. Payments related to these swap contracts are accrued based on the terms of the contract. The fund could be exposed to credit or market risk due to unfavorable changes in the fluctuation of interest rates or in the price of the underlying security or index, the possibility that there is no liquid market for these agreements or that the counterparty may default on its obligation to perform. The fund’s maximum risk of loss from counterparty risk is the fair value of the contract. This risk may be mitigated by having a master netting arrangement between the fund and the counterparty. Risk of loss may exceed amounts recognized on the Statement of assets and liabilities.
OTC total return swap contracts outstanding, including their respective notional amounts at period end, if any, are listed after the fund’s portfolio.
Credit default contracts The fund entered into OTC and/or centrally cleared credit default contracts to hedge credit risk, to hedge market risk and to gain exposure on individual names and/or baskets of securities.
In OTC and centrally cleared credit default contracts, the protection buyer typically makes a periodic stream of payments to a counterparty, the protection seller, in exchange for the right to receive a contingent payment upon the occurrence of a credit event on the reference obligation or all other equally ranked obligations of the reference entity. Credit events are contract specific but may include bankruptcy, failure to pay, restructuring and obligation acceleration. For OTC credit default contracts, an upfront payment received by the fund is recorded as a liability on the fund’s books. An upfront payment made by the fund is recorded as an asset on the fund’s books. Centrally cleared credit default contracts provide the same rights to the protection buyer and seller except the payments between parties, including upfront premiums, are settled through a central clearing agent through variation margin payments. Upfront and periodic payments received or paid by the fund for OTC and centrally cleared credit default contracts are recorded as realized gains or losses at the reset date or close of the contract. The OTC and centrally cleared credit default contracts are marked to market daily based upon quotations from an independent pricing service or market makers. Any change in value of OTC credit default contracts is recorded as an unrealized gain or loss. Daily fluctuations in the value of centrally cleared credit default contracts are recorded in variation margin on the Statement of assets and liabilities and recorded as unrealized gain or loss. Upon the occurrence of a credit event, the difference between the par value and fair value of the reference obligation, net of any proportional amount of the upfront payment, is recorded as a realized gain or loss.
In addition to bearing the risk that the credit event will occur, the fund could be exposed to market risk due to unfavorable changes in interest rates or in the price of the underlying security or index or the possibility that the fund may be unable to close out its position at the same time or at the same price as if it had purchased the underlying reference obligations. In certain circumstances, the fund may enter into offsetting OTC and centrally cleared credit
76 Global Income Trust
default contracts which would mitigate its risk of loss. Risks of loss may exceed amounts recognized on the Statement of assets and liabilities. The fund’s maximum risk of loss from counterparty risk, either as the protection seller or as the protection buyer, is the fair value of the contract. This risk may be mitigated for OTC credit default contracts by having a master netting arrangement between the fund and the counterparty and for centrally cleared credit default contracts through the daily exchange of variation margin. Counterparty risk is further mitigated with respect to centrally cleared credit default swap contracts due to the clearinghouse guarantee fund and other resources that are available in the event of a clearing member default. Where the fund is a seller of protection, the maximum potential amount of future payments the fund may be required to make is equal to the notional amount.
OTC and centrally cleared credit default contracts outstanding, including their respective notional amounts at period end, if any, are listed after the fund’s portfolio.
TBA commitments The fund may enter into TBA (to be announced) commitments to purchase securities for a fixed unit price at a future date beyond customary settlement time. Although the unit price and par amount have been established, the actual securities have not been specified. However, it is anticipated that the amount of the commitments will not significantly differ from the principal amount. The fund holds, and maintains until settlement date, cash or high-grade debt obligations in an amount sufficient to meet the purchase price, or the fund may enter into offsetting contracts for the forward sale of other securities it owns. Income on the securities will not be earned until settlement date.
The fund may also enter into TBA sale commitments to hedge its portfolio positions or to sell mortgage-backed securities it owns under delayed delivery arrangements. Proceeds of TBA sale commitments are not received until the contractual settlement date. During the time a TBA sale commitment is outstanding, equivalent deliverable securities, or an offsetting TBA purchase commitment deliverable on or before the sale commitment date, are held as “cover” for the transaction. If the TBA sale commitment is closed through the acquisition of an offsetting TBA purchase commitment, the fund realizes a gain or loss. If the fund delivers securities under the commitment, the fund realizes a gain or a loss from the sale of the securities based upon the unit price established at the date the commitment was entered into.
TBA commitments, which are accounted for as purchase and sale transactions, may be considered securities themselves, and involve a risk of loss due to changes in the value of the security prior to the settlement date as well as the risk that the counterparty to the transaction will not perform. Counterparty risk is mitigated by having a master agreement between the fund and the counterparty.
Unsettled TBA commitments are valued at their fair value according to the procedures described under “Security valuation” above. The contract is marked to market daily and the change in fair value is recorded by the fund as an unrealized gain or loss. Based on market circumstances, Putnam Management will determine whether to take delivery of the underlying securities or to dispose of the TBA commitments prior to settlement.
TBA purchase commitments outstanding at period end, if any, are listed within the fund’s portfolio and TBA sale commitments outstanding at period end, if any, are listed after the fund’s portfolio.
Master agreements The fund is a party to ISDA (International Swaps and Derivatives Association, Inc.) Master Agreements that govern OTC derivative and foreign exchange contracts and Master Securities Forward Transaction Agreements that govern transactions involving mortgage backed and other asset backed securities that may result in delayed delivery (Master Agreements) with certain counterparties entered into from time to time. The Master Agreements may contain provisions regarding, among other things, the parties’ general obligations, representations, agreements, collateral requirements, events of default and early termination. With respect to certain counterparties, in accordance with the terms of the Master Agreements, collateral posted to the fund is held in a segregated account by the fund’s custodian and with respect to those amounts which can be sold or repledged, are presented in the fund’s portfolio. Collateral posted to the fund which cannot be sold or repledged totaled $964,905 at the close of the reporting period.
Collateral pledged by the fund is segregated by the fund’s custodian and identified in the fund’s portfolio. Collateral can be in the form of cash or debt securities issued by the U.S. Government or related agencies or other securities as agreed to by the fund and the applicable counterparty. Collateral requirements are determined based on the fund’s net position with each counterparty.
With respect to ISDA Master Agreements, termination events applicable to the fund may occur upon a decline in the fund’s net assets below a specified threshold over a certain period of time. Termination events applicable to counterparties may occur upon a decline in the counterparty’s long-term or short-term credit ratings below a specified level. In each case, upon occurrence, the other party may elect to terminate early and cause settlement of
Global Income Trust 77
all derivative and foreign exchange contracts outstanding, including the payment of any losses and costs resulting from such early termination, as reasonably determined by the terminating party. Any decision by one or more of the fund’s counterparties to elect early termination could impact the fund’s future derivative activity.
At the close of the reporting period, the fund had a net liability position of $1,621,674 on open derivative contracts subject to the Master Agreements. Collateral posted by the fund at period end for these agreements totaled $1,751,944 and may include amounts related to unsettled agreements.
Interfund lending The fund, along with other Putnam funds, may participate in an interfund lending program pursuant to an exemptive order issued by the SEC. This program allows the fund to borrow from or lend to other Putnam funds that permit such transactions. Interfund lending transactions are subject to each fund’s investment policies and borrowing and lending limits. Interest earned or paid on the interfund lending transaction will be based on the average of certain current market rates. During the reporting period, the fund did not utilize the program.
Lines of credit The fund participates, along with other Putnam funds, in a $392.5 million unsecured committed line of credit and a $235.5 million unsecured uncommitted line of credit, both provided by State Street. Borrowings may be made for temporary or emergency purposes, including the funding of shareholder redemption requests and trade settlements. Interest is charged to the fund based on the fund’s borrowing at a rate equal to the Federal Funds rate plus 1.25% for the committed line of credit and the Federal Funds rate plus 1.30% for the uncommitted line of credit. A closing fee equal to 0.04% of the committed line of credit and 0.04% of the uncommitted line of credit has been paid by the participating funds. In addition, a commitment fee of 0.11% per annum on any unutilized portion of the committed line of credit is allocated to the participating funds based on their relative net assets and paid quarterly. During the reporting period, the fund had no borrowings against these arrangements.
Federal taxes It is the policy of the fund to distribute all of its taxable income within the prescribed time period and otherwise comply with the provisions of the Internal Revenue Code of 1986, as amended (the Code), applicable to regulated investment companies. It is also the intention of the fund to distribute an amount sufficient to avoid imposition of any excise tax under Section 4982 of the Code.
The fund is subject to the provisions of Accounting Standards Codification 740 Income Taxes (ASC 740). ASC 740 sets forth a minimum threshold for financial statement recognition of the benefit of a tax position taken or expected to be taken in a tax return. The fund did not have a liability to record for any unrecognized tax benefits in the accompanying financial statements. No provision has been made for federal taxes on income, capital gains or unrealized appreciation on securities held nor for excise tax on income and capital gains. Each of the fund’s federal tax returns for the prior three fiscal years remains subject to examination by the Internal Revenue Service.
The fund may also be subject to taxes imposed by governments of countries in which it invests. Such taxes are generally based on either income or gains earned or repatriated. The fund accrues and applies such taxes to net investment income, net realized gains and net unrealized gains as income and/or capital gains are earned. In some cases, the fund may be entitled to reclaim all or a portion of such taxes, and such reclaim amounts, if any, are reflected as an asset on the fund’s books. In many cases, however, the fund may not receive such amounts for an extended period of time, depending on the country of investment.
At October 31, 2014, the fund had a capital loss carryover of $9,743,836 available to the extent allowed by the Code to offset future net capital gain, if any. The amounts of the carryovers and the expiration dates are:
Loss carryover
Short-term
Long-term
Total
Expiration
$6,736,225
$528,189
$7,264,414
*
2,479,422
N/A
2,479,422
October 31, 2017
*Under the Regulated Investment Company Modernization Act of 2010, the fund will be permitted to carry forward capital losses incurred in taxable years beginning after December 22, 2010 for an unlimited period. However, any losses incurred will be required to be utilized prior to the losses incurred in pre-enactment tax years. As a result of this ordering rule, pre-enactment capital loss carryforwards may be more likely to expire unused. Additionally, post-enactment capital losses that are carried forward will retain their character as either short-term or long-term capital losses rather than being considered all short-term as under previous law.
Distributions to shareholders Distributions to shareholders from net investment income are recorded by the fund on the ex-dividend date. Distributions from capital gains, if any, are recorded on the ex-dividend date and paid at least annually. The amount and character of income and gains to be distributed are determined in accordance
78 Global Income Trust
with income tax regulations, which may differ from generally accepted accounting principles. These differences include temporary and/or permanent differences from foreign currency gains and losses, from realized gains and losses on certain futures contracts, from income on swap contracts, from interest-only securities and from receivable purchase agreement. Reclassifications are made to the fund’s capital accounts to reflect income and gains available for distribution (or available capital loss carryovers) under income tax regulations. At the close of the reporting period, the fund reclassified $2,193,686 to increase undistributed net investment income and $2,193,686 to increase accumulated net realized loss.
The tax basis components of distributable earnings and the federal tax cost as of the close of the reporting period were as follows:
Unrealized appreciation
$15,759,223
Unrealized depreciation
(9,353,612)
Net unrealized appreciation
6,405,611
Undistributed ordinary income
4,766,970
Capital loss carryforward
(9,743,836)
Cost for federal income tax purposes
$383,363,661
Note 2: Management fee, administrative services and other transactions
The fund pays Putnam Management a management fee (based on the fund’s average net assets and computed and paid monthly) at annual rates that may vary based on the average of the aggregate net assets of most open-end funds, as defined in the fund’s management contract, sponsored by Putnam Management. Such annual rates may vary as follows:
0.700%
of the first $5 billion,
0.650%
of the next $5 billion,
0.600%
of the next $10 billion,
0.550%
of the next $10 billion,
0.500%
of the next $50 billion,
0.480%
of the next $50 billion,
0.470%
of the next $100 billion and
0.465%
of any excess thereafter.
The fund’s shareholders approved the fund’s current management contract with Putnam Management effective February 27, 2014. Shareholders were asked to approve the fund’s management contract following the death on October 8, 2013 of The Honourable Paul G. Desmarais, who had controlled directly and indirectly a majority of the voting shares of Power Corporation of Canada, the ultimate parent company of Putnam Management. The substantive terms of the management contract, including terms relating to fees, are identical to the terms of the fund’s previous management contract and reflect the rates provided in the table above.
Putnam Management has contractually agreed, through June 30, 2015, to waive fees or reimburse the fund’s expenses to the extent necessary to limit the cumulative expenses of the fund, exclusive of brokerage, interest, taxes, investment-related expenses, extraordinary expenses, acquired fund fees and expenses and payments under the fund’s investor servicing contract, investment management contract and distribution plans, on a fiscal year-to-date basis to an annual rate of 0.20% of the fund’s average net assets over such fiscal year-to-date period. During the reporting period, the fund’s expenses were not reduced as a result of this limit.
Putnam Investments Limited (PIL), an affiliate of Putnam Management, is authorized by the Trustees to manage a separate portion of the assets of the fund as determined by Putnam Management from time to time. Putnam Management pays a quarterly sub-management fee to PIL for its services at an annual rate of 0.40% of the average net assets of the portion of the fund managed by PIL.
The fund reimburses Putnam Management an allocated amount for the compensation and related expenses of certain officers of the fund and their staff who provide administrative services to the fund. The aggregate amount of all such reimbursements is determined annually by the Trustees.
Custodial functions for the fund’s assets are provided by State Street. Custody fees are based on the fund’s asset level, the number of its security holdings and transaction volumes.
Putnam Investor Services, Inc., an affiliate of Putnam Management, provides investor servicing agent functions to the fund. Putnam Investor Services, Inc. received fees for investor servicing (except for class R5 and R6 shares) based on the fund’s retail asset level, the number of shareholder accounts in the fund and the level of defined contribution plan assets in the fund. Class R5 shares pay a monthly fee based on the average net assets of class R5 shares at an annual rate of 0.12%. Class R6 shares pay a monthly fee based on the average net assets of class R6
Global Income Trust 79
shares at an annual rate of 0.05%. Investor servicing fees will not exceed an annual rate of 0.32% of the fund’s average net assets. During the reporting period, the expenses for each class of shares related to investor servicing fees were as follows:
Class A
$272,810
Class B
11,707
Class C
41,512
Class M
15,995
Class R
8,271
Class R5
18
Class R6
2,273
Class Y
93,592
Total
$446,178
The fund has entered into expense offset arrangements with Putnam Investor Services, Inc. and State Street whereby Putnam Investor Services, Inc.’s and State Street’s fees are reduced by credits allowed on cash balances. For the reporting period, the fund’s expenses were reduced by $889 under the expense offset arrangements.
Each Independent Trustee of the fund receives an annual Trustee fee, of which $202, as a quarterly retainer, has been allocated to the fund, and an additional fee for each Trustees meeting attended. Trustees also are reimbursed for expenses they incur relating to their services as Trustees.
The fund has adopted a Trustee Fee Deferral Plan (the Deferral Plan) which allows the Trustees to defer the receipt of all or a portion of Trustees fees payable on or after July 1, 1995. The deferred fees remain invested in certain Putnam funds until distribution in accordance with the Deferral Plan.
The fund has adopted an unfunded noncontributory defined benefit pension plan (the Pension Plan) covering all Trustees of the fund who have served as a Trustee for at least five years and were first elected prior to 2004. Benefits under the Pension Plan are equal to 50% of the Trustee’s average annual attendance and retainer fees for the three years ended December 31, 2005. The retirement benefit is payable during a Trustee’s lifetime, beginning the year following retirement, for the number of years of service through December 31, 2006. Pension expense for the fund is included in Trustee compensation and expenses in the Statement of operations. Accrued pension liability is included in Payable for Trustee compensation and expenses in the Statement of assets and liabilities. The Trustees have terminated the Pension Plan with respect to any Trustee first elected after 2003.
The fund has adopted distribution plans (the Plans) with respect to its class A, class B, class C, class M and class R shares pursuant to Rule 12b–1 under the Investment Company Act of 1940. The purpose of the Plans is to compensate Putnam Retail Management Limited Partnership, an indirect wholly-owned subsidiary of Putnam Investments, LLC, for services provided and expenses incurred in distributing shares of the fund. The Plans provide for payments by the fund to Putnam Retail Management Limited Partnership at an annual rate of up to 0.35%, 1.00%, 1.00%, 1.00% and 1.00% of the average net assets attributable to class A, class B, class C, class M and class R shares, respectively. The Trustees have approved payment by the fund at an annual rate of 0.25%, 1.00%, 1.00%, 0.50% and 0.50% of the average net assets attributable to class A, class B, class C, class M and class R shares, respectively. During the reporting period, the class specific expenses related to distribution fees were as follows:
Class A
$495,159
Class B
84,959
Class C
301,655
Class M
58,043
Class R
30,100
Total
$969,916
For the reporting period, Putnam Retail Management Limited Partnership, acting as underwriter, received net commissions of $22,637 and $142 from the sale of class A and class M shares, respectively, and received $3,478 and $939 in contingent deferred sales charges from redemptions of class B and class C shares, respectively.
A deferred sales charge of up to 1.00% and 0.40% is assessed on certain redemptions of class A and class M shares, respectively. For the reporting period, Putnam Retail Management Limited Partnership, acting as underwriter, received $54 and no monies on class A and class M redemptions, respectively.
80 Global Income Trust
Note 3: Purchases and sales of securities
During the reporting period, cost of purchases and proceeds from sales, excluding short-term investments were as follows:
Cost of purchases
Proceeds from sales
Investments in securities, including TBA commitments (Long-term)
$976,703,460
$949,332,419
U.S. government securities (Long-term)
—
—
Total
$976,703,460
$949,332,419
Written option transactions during the reporting period are summarized as follows:
Written swap option contract amounts
Written swap option premiums
Written option contract amounts
Written option premiums
Written options outstanding at the beginning of the reporting period
USD
EUR
$45,960,000
—
$496,444
$—
$—
—
$—
$—
Options opened
USD
EUR
573,847,129
122,462,000
3,564,831
71,636
360,000,000
—
1,680,781
—
Options exercised
USD
EUR
(66,829,000)
—
(454,165)
—
—
—
—
—
Options expired
USD
EUR
(4,990,000)
—
(48,839)
—
(100,000,000)
—
(359,844)
—
Options closed
USD
EUR
(438,735,429)
(122,462,000)
(2,308,898)
(71,636)
(220,000,000)
—
(1,172,187)
—
Written options outstanding at the end of the reporting period
USD
EUR
$109,252,700
—
$1,249,373
$—
$40,000,000
—
$148,750
$—
Note 4: Capital shares
At the close of the reporting period, there was an unlimited number of shares of beneficial interest authorized. Transactions in capital shares were as follows:
Year ended 10/31/14
Year ended 10/31/13
Class A
Shares
Amount
Shares
Amount
Shares sold
4,413,251
$56,303,781
4,261,894
$54,357,290
Shares issued in connection with reinvestment of distributions
425,621
5,434,427
475,017
6,026,644
4,838,872
61,738,208
4,736,911
60,383,934
Shares repurchased
(7,088,766)
(90,985,210)
(6,712,131)
(85,179,431)
Net decrease
(2,249,894)
$(29,247,002)
(1,975,220)
$(24,795,497)
Year ended 10/31/14
Year ended 10/31/13
Class B
Shares
Amount
Shares
Amount
Shares sold
58,465
$746,113
122,001
$1,551,555
Shares issued in connection with reinvestment of distributions
13,829
175,668
16,871
213,146
72,294
921,781
138,872
1,764,701
Shares repurchased
(163,376)
(2,076,157)
(287,294)
(3,627,673)
Net decrease
(91,082)
$(1,154,376)
(148,422)
$(1,862,972)
Global Income Trust 81
Year ended 10/31/14
Year ended 10/31/13
Class C
Shares
Amount
Shares
Amount
Shares sold
549,979
$7,026,458
610,133
$7,754,780
Shares issued in connection with reinvestment of distributions
44,636
567,273
54,454
688,048
594,615
7,593,731
664,587
8,442,828
Shares repurchased
(728,810)
(9,239,646)
(1,196,791)
(15,147,669)
Net decrease
(134,195)
$(1,645,915)
(532,204)
$(6,704,841)
Year ended 10/31/14
Year ended 10/31/13
Class M
Shares
Amount
Shares
Amount
Shares sold
15,894
$201,452
28,068
$354,011
Shares issued in connection with reinvestment of distributions
5,630
71,168
6,607
83,029
21,524
272,620
34,675
437,040
Shares repurchased
(147,960)
(1,862,433)
(209,081)
(2,641,557)
Net decrease
(126,436)
$(1,589,813)
(174,406)
$(2,204,517)
Year ended 10/31/14
Year ended 10/31/13
Class R
Shares
Amount
Shares
Amount
Shares sold
173,435
$2,212,315
262,354
$3,348,411
Shares issued in connection with reinvestment of distributions
9,059
115,473
8,211
103,915
182,494
2,327,788
270,565
3,452,326
Shares repurchased
(145,076)
(1,848,656)
(147,965)
(1,878,387)
Net increase
37,418
$479,132
122,600
$1,573,939
Year ended 10/31/14
Year ended 10/31/13
Class R5
Shares
Amount
Shares
Amount
Shares sold
1,022
$13,188
—
$—
Shares issued in connection with reinvestment of distributions
40
513
27
345
1,062
13,701
27
345
Shares repurchased
—
—
—
—
Net increase
1,062
$13,701
27
$345
Year ended 10/31/14
Year ended 10/31/13
Class R6
Shares
Amount
Shares
Amount
Shares sold
83,736
$1,063,103
378,940
$4,867,378
Shares issued in connection with reinvestment of distributions
11,931
152,362
6,827
85,814
95,667
1,215,465
385,767
4,953,192
Shares repurchased
(40,109)
(510,565)
(66,298)
(828,879)
Net increase
55,558
$704,900
319,469
$4,124,313
82 Global Income Trust
Year ended 10/31/14
Year ended 10/31/13
Class Y
Shares
Amount
Shares
Amount
Shares sold
7,420,058
$95,484,059
1,919,287
$24,558,955
Shares issued in connection with reinvestment of distributions
119,124
1,521,931
93,944
1,194,335
7,539,182
97,005,990
2,013,231
25,753,290
Shares repurchased
(1,364,769)
(17,442,922)
(3,830,680)
(48,834,639)
Net increase (decrease)
6,174,413
$79,563,068
(1,817,449)
$(23,081,349)
At the close of the reporting period, Putnam Investments, LLC owned the following shares of the fund:
Shares owned
Percentage of ownership
Value
Class R5
867
45.61%
$10,924
Class R6
869
0.23
10,949
Note 5: Affiliated transactions
Transactions during the reporting period with Putnam Short Term Investment Fund, which is under common ownership and control, were as follows:
Name of affiliate
Fair value at the beginning of the reporting period
Purchase cost
Sale proceeds
Investment income
Fair value at the end of the reporting period
Putnam Short Term Investment Fund*
$3,129,550
$146,197,378
$115,435,191
$15,657
$33,891,737
*Management fees charged to Putnam Short Term Investment Fund have been waived by Putnam Management.
Note 6: Senior loan commitments
Senior loans are purchased or sold on a when-issued or delayed delivery basis and may be settled a month or more after the trade date, which from time to time can delay the actual investment of available cash balances; interest income is accrued based on the terms of the securities. Senior loans can be acquired through an agent, by assignment from another holder of the loan, or as a participation interest in another holder’s portion of the loan. When the fund invests in a loan or participation, the fund is subject to the risk that an intermediate participant between the fund and the borrower will fail to meet its obligations to the fund, in addition to the risk that the borrower under the loan may default on its obligations.
Note 7: Market, credit and other risks
In the normal course of business, the fund trades financial instruments and enters into financial transactions where risk of potential loss exists due to changes in the market (market risk) or failure of the contracting party to the transaction to perform (credit risk). The fund may be exposed to additional credit risk that an institution or other entity with which the fund has unsettled or open transactions will default. Investments in foreign securities involve certain risks, including those related to economic instability, unfavorable political developments, and currency fluctuations. The fund may invest in higher yielding, lower rated bonds that may have a higher rate of default. The fund may invest a significant portion of its assets in securitized debt instruments, including mortgage-backed and asset-backed investments. The yields and values of these investments are sensitive to changes in interest rates, the rate of principal payments on the underlying assets and the market’s perception of the issuers. The market for these investments may be volatile and limited, which may make them difficult to buy or sell.
Global Income Trust 83
Note 8: Summary of derivative activity
The volume of activity for the reporting period for any derivative type that was held during the period is listed below and was as follows based on an average of the holdings at the end of each fiscal quarter:
The following is a summary of the fair value of derivative instruments as of the close of the reporting period:
Fair value of derivative instruments as of the close of the reporting period
Asset derivatives
Liability derivatives
Derivatives not accounted for as hedging instruments under ASC 815
Statement of assets and liabilities location
Fair value
Statement of assets and liabilities location
Fair value
Credit contracts
Receivables
$19,202
Payables
$—
Foreign exchange contracts
Receivables
3,909,186
Payables
2,870,032
Interest rate contracts
Investments, Receivables, Net assets — Unrealized appreciation
7,313,929*
Payables, Net assets — Unrealized depreciation
11,395,646*
Total
$11,242,317
$14,265,678
*Includes cumulative appreciation/depreciation of futures contracts and centrally cleared swaps as reported in the fund’s portfolio. Only current day’s variation margin is reported within the Statement of assets and liabilities.
The following is a summary of realized and change in unrealized gains or losses of derivative instruments on the Statement of operations for the reporting period (see Note 1):
Amount of realized gain or (loss) on derivatives recognized in net gain or (loss) on investments
Derivatives not accounted for as hedging instruments under ASC 815
Options
Futures
Forward currency contracts
Swaps
Total
Credit contracts
$—
$—
$—
$(11,460)
$(11,460)
Foreign exchange contracts
—
—
(715,081)
—
$(715,081)
Interest rate contracts
(1,059,744)
(5,772,444)
—
(3,870,452)
$(10,702,640)
Total
$(1,059,744)
$(5,772,444)
$(715,081)
$(3,881,912)
$(11,429,181)
84 Global Income Trust
Change in unrealized appreciation or (depreciation) on derivatives recognized in net gain or (loss) on investments
Derivatives not accounted for as hedging instruments under ASC 815
Options
Futures
Forward currency contracts
Swaps
Total
Credit contracts
$—
$—
$—
$191,181
$191,181
Foreign exchange contracts
—
—
2,518,587
—
$2,518,587
Interest rate contracts
(102,733)
1,097,579
—
2,230,639
$3,225,485
Total
$(102,733)
$1,097,579
$2,518,587
$2,421,820
$5,935,253
Global Income Trust 85
Note 9: Offsetting of financial and derivative assets and liabilities
The following table summarizes any derivatives, repurchase agreements and reverse repurchase agreements, at the end of the reporting period, that are subject to an enforceable master netting agreement or similar agreement. For securities lending transactions or borrowing transactions associated with securities sold short, if any, see Note 1. For financial reporting purposes, the fund does not offset financial assets and financial liabilities that are subject to the master netting agreements in the Statement of assets and liabilities.
Bank of America N.A.
Barclays Bank PLC
Barclays Capital Inc. (clearing broker)
Citibank, N.A.
Credit Suisse International
Deutsche Bank AG
Goldman Sachs International
HSBC Bank USA, National Association
JPMorgan Chase Bank N.A.
Merrill Lynch, Pierce, Fenner & Smith, Inc.
Royal Bank of Scotland PLC (The)
State Street Bank and Trust Co.
UBS AG
WestPac Banking Corp.
Total
Assets:
OTC Interest rate swap contracts*#
$—
$—
$—
$4,954
$50,383
$96,580
$644,845
$—
$246,572
$—
$—
$—
$—
$—
$1,043,334
Centrally cleared interest rate swap contracts§
—
—
1,039,960
—
—
—
—
—
—
—
—
—
—
—
1,039,960
OTC Total return swap contracts*#
1,082
104,984
—
143,483
197,945
11,583
10,002
—
2,378
—
—
—
—
—
471,457
OTC Credit default contracts*#
1,105
279
—
—
15,592
—
2,226
—
—
—
—
—
—
—
19,202
Futures contracts§
—
—
—
—
—
—
—
—
—
44,153
—
—
—
—
44,153
Forward currency contracts#
290,704
170,061
—
792,011
592,559
461,848
735,875
325,628
270,361
—
38,860
143,246
59,414
28,619
3,909,186
Forward premium swap option contracts#
—
—
—
—
—
—
—
—
281,585
—
—
—
—
—
281,585
Purchased swap options**#
224,856
—
—
—
103,725
—
—
—
—
—
—
—
—
—
328,581
Purchased options**#
—
—
—
—
—
—
—
—
93,590
—
—
—
—
—
93,590
Total Assets
$517,747
$275,324
$1,039,960
$940,448
$960,204
$570,011
$1,392,948
$325,628
$894,486
$44,153
$38,860
$143,246
$59,414
$28,619
$7,231,048
Liabilities:
OTC Interest rate swap contracts*#
$10,068
$—
$—
$66,247
$17,477
$579,563
$8,081
$—
$59,260
$—
$—
$—
$—
$—
$740,696
Centrally cleared interest rate swap contracts§
—
—
907,568
—
—
—
—
—
—
—
—
—
—
—
907,568
OTC Total return swap contracts*#
53,159
134,329
—
193,201
194,940
—
146,869
—
11,092
—
—
—
—
—
733,590
OTC Credit default contracts*#
—
—
—
—
—
—
—
—
—
—
—
—
—
—
—
Futures contracts§
—
—
—
—
—
—
—
—
—
101,644
—
—
—
—
101,644
Forward currency contracts#
52,131
506,078
—
434,232
203,034
275,191
182,583
339,482
192,798
—
23,280
284,878
44,486
331,859
2,870,032
Forward premium swap option contracts#
—
—
—
—
—
—
—
—
320,275
—
—
—
—
—
320,275
Written swap options#
262,851
—
—
—
410,108
—
—
—
749,053
—
—
—
—
—
1,422,012
Written options#
—
—
—
—
—
—
—
—
75,130
—
—
—
—
—
75,130
Total Liabilities
$378,209
$640,407
$907,568
$693,680
$825,559
$854,754
$337,533
$339,482
$1,407,608
$101,644
$23,280
$284,878
$44,486
$331,859
$7,170,947
Total Financial and Derivative Net Assets
$139,538
$(365,083)
$132,392
$246,768
$134,645
$(284,743)
$1,055,415
$(13,854)
$(513,122)
$(57,491)
$15,580
$(141,632)
$14,928
$(303,240)
$60,101
Total collateral received (pledged)†##
$(380,000)
$(222,000)
$—
$246,768
$39,645
$(284,743)
$925,260
$(13,854)
$(513,122)
$—
$—
$—
$—
$—
Net amount
$519,538
$(143,083)
$132,392
$—
$95,000
$—
$130,155
$—
$—
$(57,491)
$15,580
$(141,632)
$14,928
$(303,240)
*
Excludes premiums, if any. Included in unrealized appreciation and depreciation on OTC swap contracts on the Statement of assets and liabilities.
**
Included with Investments in securities on the Statement of assets and liabilities.
†
Additional collateral may be required from certain brokers based on individual agreements.
#
Covered by master netting agreement (Note 1).
##
Any over-collateralization of total financial and derivative net assets is not shown. Collateral may include amounts related to unsettled agreements.
§
Includes current day’s variation margin only as reported on the Statement of assets and liabilities, which is not collateralized. Cumulative appreciation/(depreciation) for futures contracts and centrally cleared swap contracts is represented in the tables listed after the fund’s portfolio.
86
Global Income Trust
Global Income Trust
87
Federal tax information (Unaudited)
For the reporting period, pursuant to §871(k) of the Internal Revenue Code, the fund hereby designates $6,444,759 of distributions paid as qualifying to be taxed as interest-related dividends, and no monies to be taxed as short-term capital gain dividends for nonresident alien shareholders.
The Form 1099 that will be mailed to you in January 2015 will show the tax status of all distributions paid to your account in calendar 2014.
88 Global Income Trust
Shareholder meeting results (Unaudited)
February 27, 2014 special meeting
At the meeting, each of the nominees for Trustees was elected as follows:
Votes for
Votes withheld
Liaquat Ahamed
15,617,405
576,121
Ravi Akhoury
15,613,510
580,016
Barbara M. Baumann
15,690,242
503,284
Jameson A. Baxter
15,637,895
555,631
Charles B. Curtis
15,606,957
586,569
Robert J. Darretta
15,641,288
552,238
Katinka Domotorffy
15,629,258
564,268
John A. Hill
15,623,229
570,296
Paul L. Joskow
15,631,179
562,347
Kenneth R. Leibler
15,638,251
555,275
Robert E. Patterson
15,635,755
557,771
George Putnam, III
15,638,327
555,198
Robert L. Reynolds
15,634,472
559,054
W. Thomas Stephens
15,620,299
573,227
A proposal to approve a new management contract between the fund and Putnam Management was approved as follows:
Votes for
Votes against
Abstentions
Broker non-votes
12,343,174
329,809
547,464
2,973,079
March 27, 2014 special meeting
A proposal to adopt an Amended and Restated Declaration of Trust, with respect to which the February 27, 2014 meeting had been adjourned, was approved as follows:
Votes for
Votes against
Abstentions
Broker non-votes
12,532,580
1,234,191
656,273
2,674,337
All tabulations are rounded to the nearest whole number.
Global Income Trust 89
About the Trustees
Independent Trustees
Liaquat Ahamed
Born 1952, Trustee since 2012
Principal occupations during past five years: Pulitzer Prize-winning author of Lords of Finance: The Bankers Who Broke the World, whose articles on economics have appeared in such publications as the New York Times, Foreign Affairs, and the Financial Times. Director of Aspen Insurance Co., a New York Stock Exchange company, and Chair of the Aspen Board’s Investment Committee. Trustee of the Brookings Institution and Chair of its Investment Committee.
Other directorships: The Rohatyn Group, an emerging-market fund complex that manages money for institutions
Ravi Akhoury
Born 1947, Trustee since 2009
Principal occupations during past five years: Trustee of American India Foundation and of the Rubin Museum. From 1992 to 2007, was Chairman and CEO of MacKay Shields, a multi-product investment management firm.
Other directorships: RAGE Frameworks, Inc., a private software company; English Helper, Inc., a private software company
Barbara M. Baumann
Born 1955, Trustee since 2010
Principal occupations during past five years: President and Owner of Cross Creek Energy Corporation, a strategic consultant to domestic energy firms and direct investor in energy projects. Current Board member of The Denver Foundation. Former Chair and current Board member of Girls Incorporated of Metro Denver. Member of the Finance Committee, the Children’s Hospital of Colorado.
Other directorships: Buckeye Partners, L.P., a publicly traded master limited partnership focused on pipeline transport, storage, and distribution of petroleum products; Devon Energy Corporation, a leading independent natural gas and oil exploration and production company
Jameson A. Baxter
Born 1943, Trustee since 1994, Vice Chair from 2005 to 2011, and Chair since 2011
Principal occupations during past five years: President of Baxter Associates, Inc., a private investment firm. Chair of Mutual Fund Directors Forum. Chair Emeritus of the Board of Trustees of Mount Holyoke College. Director of the Adirondack Land Trust and Trustee of the Nature Conservancy’s Adirondack Chapter.
Charles B. Curtis
Born 1940, Trustee since 2001
Principal occupations during past five years: Senior Advisor to the Center for Strategic and International Studies. President Emeritus and former President and Chief Operating Officer of the Nuclear Threat Initiative, a private foundation dealing with national security issues. Member of the Council on Foreign Relations and U.S. State Department International Security Advisory Board.
Robert J. Darretta
Born 1946, Trustee since 2007
Principal occupations during past five years: From 2009 until 2012, served as Health Care Industry Advisor to Permira, a global private equity firm. Until April 2007, was Vice Chairman of the Board of Directors of Johnson & Johnson. Served as Johnson & Johnson’s Chief Financial Officer for a decade.
Other directorships: UnitedHealth Group, a diversified health-care company
Katinka Domotorffy
Born 1975, Trustee since 2012
Principal occupations during past five years: Voting member of the Investment Committees of the Anne Ray Charitable Trust and Margaret A. Cargill Foundation, part of the Margaret A. Cargill Philanthropies. Until 2011, Partner, Chief Investment Officer, and Global Head of Quantitative Investment Strategies at Goldman Sachs Asset Management.
Other directorships: Reach Out and Read of Greater New York, an organization dedicated to promoting childhood literacy
John A. Hill
Born 1942, Trustee since 1985 and Chairman from 2000 to 2011
Principal occupations during past five years: Founder and Vice-Chairman of First Reserve Corporation, the leading private equity buyout firm focused on the worldwide energy industry. Trustee and Chairman of the Board of Trustees of Sarah Lawrence College. Member of the Advisory Board of the Millstein Center for Global Markets and Corporate Ownership at The Columbia University Law School.
Other directorships: Devon Energy Corporation, a leading independent natural gas and oil exploration and production company
90 Global Income Trust
Paul L. Joskow
Born 1947, Trustee since 1997
Principal occupations during past five years: Economist and President of the Alfred P. Sloan Foundation, a philanthropic institution focused primarily on research and education on issues related to science, technology, and economic performance. Elizabeth and James Killian Professor of Economics, Emeritus at the Massachusetts Institute of Technology (MIT). Prior to 2007, served as the Director of the Center for Energy and Environmental Policy Research at MIT.
Other directorships: Yale University; Exelon Corporation, an energy company focused on power services; Boston Symphony Orchestra; Prior to April 2013, served as Director of TransCanada Corporation and TransCanada Pipelines Ltd., energy companies focused on natural gas transmission, oil pipelines and power services
Kenneth R. Leibler
Born 1949, Trustee since 2006
Principal occupations during past five years: Founder and former Chairman of Boston Options Exchange, an electronic marketplace for the trading of derivative securities. Serves on the Board of Trustees of Beth Israel Deaconess Hospital in Boston, Massachusetts. Director of Beth Israel Deaconess Care Organization. Until November 2010, director of Ruder Finn Group, a global communications and advertising firm.
Other directorships: Northeast Utilities, which operates New England’s largest energy delivery system
Robert E. Patterson
Born 1945, Trustee since 1984
Principal occupations during past five years: Co-Chairman of Cabot Properties, Inc., a private equity firm investing in commercial real estate, and Chairman of its Investment Committee. Past Chairman and Trustee of the Joslin Diabetes Center.
George Putnam, III
Born 1951, Trustee since 1984
Principal occupations during past five years: Chairman of New Generation Research, Inc., a publisher of financial advisory and other research services. Founder and President of New Generation Advisors, LLC, a registered investment advisor to private funds. Director of The Boston Family Office, LLC, a registered investment advisor.
W. Thomas Stephens
Born 1942, Trustee from 1997 to 2008 and since 2009
Principal occupations during past five years: Retired as Chairman and Chief Executive Officer of Boise Cascade, LLC, a paper, forest products, and timberland assets company, in December 2008. Prior to 2010, Director of Boise Inc., a manufacturer of paper and packaging products.
Other directorships: TransCanada Pipelines Ltd., an energy infrastructure company
Interested Trustee
Robert L. Reynolds*
Born 1952, Trustee since 2008 and President of the Putnam Funds since 2009
Principal occupations during past five years: President and Chief Executive Officer of Putnam Investments since 2008 and, since 2014, President and Chief Executive Officer of Great-West Financial, a financial services company that provides retirement savings plans, life insurance, and annuity and executive benefits products, and of Great-West Lifeco U.S. Inc., a holding company that owns Putnam Investments and Great-West Financial. Prior to joining Putnam Investments, served as Vice Chairman and Chief Operating Officer of Fidelity Investments from 2000 to 2007.
*Mr. Reynolds is an “interested person” (as defined in the Investment Company Act of 1940) of the fund and Putnam Investments. He is President and Chief Executive Officer of Putnam Investments, as well as the President of your fund and each of the other Putnam funds.
The address of each Trustee is One Post Office Square, Boston, MA 02109.
As of October 31, 2014, there were 116 Putnam funds. All Trustees serve as Trustees of all Putnam funds.
Each Trustee serves for an indefinite term, until his or her resignation, retirement at age 75, removal, or death.
Global Income Trust 91
Officers
In addition to Robert L. Reynolds, the other officers of the fund are shown below:
Jonathan S. Horwitz (Born 1955)
Executive Vice President, Principal Executive Officer, and Compliance Liaison
Since 2004
Steven D. Krichmar (Born 1958)
Vice President and Principal Financial Officer
Since 2002
Chief of Operations, Putnam Investments and Putnam Management
Robert T. Burns (Born 1961)
Vice President and Chief Legal Officer
Since 2011
General Counsel, Putnam Investments, Putnam Management, and Putnam Retail Management
Manager of Finance, Dunkin’ Brands (2008–2010); Senior Financial Analyst, Old Mutual Asset Management (2007–2008); Senior Financial Analyst, Putnam Investments (1999–2007)
Janet C. Smith (Born 1965)
Vice President, Principal Accounting Officer, and Assistant Treasurer
Since 2007
Director of Fund Administration Services, Putnam Investments and Putnam Management
Susan G. Malloy (Born 1957)
Vice President and Assistant Treasurer
Since 2007
Director of Accounting & Control Services, Putnam Investments and Putnam Management
James P. Pappas (Born 1953)
Vice President
Since 2004
Director of Trustee Relations, Putnam Investments and Putnam Management
Mark C. Trenchard (Born 1962)
Vice President and BSA Compliance Officer
Since 2002
Director of Operational Compliance, Putnam Investments and Putnam Retail Management
Nancy E. Florek (Born 1957)
Vice President, Director of Proxy Voting and Corporate Governance, Assistant Clerk, and Associate Treasurer
Since 2000
The principal occupations of the officers for the past five years have been with the employers as shown above, although in some cases they have held different positions with such employers. The address of each officer is One Post Office Square, Boston, MA 02109.
92 Global Income Trust
Fund information
Founded over 75 years ago, Putnam Investments was built around the concept that a balance between risk and reward is the hallmark of a well-rounded financial program. We manage over 100 funds across income, value, blend, growth, asset allocation, absolute return, and global sector categories.
Investment Manager
Putnam Investment Management, LLC One Post Office Square Boston, MA 02109
Investment Sub-Manager
Putnam Investments Limited 57–59 St James’s Street London, England SW1A 1LD
Marketing Services
Putnam Retail Management One Post Office Square Boston, MA 02109
Custodian
State Street Bank and Trust Company
Legal Counsel
Ropes & Gray LLP
Auditor
PricewaterhouseCoopers LLP
Trustees
Jameson A. Baxter, Chair Liaquat Ahamed Ravi Akhoury Barbara M. Baumann Charles B. Curtis Robert J. Darretta Katinka Domotorffy John A. Hill Paul L. Joskow Kenneth R. Leibler Robert E. Patterson George Putnam, III Robert L. Reynolds W. Thomas Stephens
Officers
Robert L. Reynolds President
Jonathan S. Horwitz Executive Vice President, Principal Executive Officer, and Compliance Liaison
Steven D. Krichmar Vice President and Principal Financial Officer
Robert T. Burns Vice President and Chief Legal Officer
Robert R. Leveille Vice President and Chief Compliance Officer
Michael J. Higgins Vice President, Treasurer, and Clerk
Janet C. Smith Vice President, Principal Accounting Officer, and Assistant Treasurer
Susan G. Malloy Vice President and Assistant Treasurer
James P. Pappas Vice President
Mark C. Trenchard Vice President and BSA Compliance Officer
Nancy E. Florek Vice President, Director of Proxy Voting and Corporate Governance, Assistant Clerk, and Associate Treasurer
This report is for the information of shareholders of Putnam Global Income Trust. It may also be used as sales literature when preceded or accompanied by the current prospectus, the most recent copy of Putnam’s Quarterly Performance Summary, and Putnam’s Quarterly Ranking Summary. For more recent performance, please visit putnam.com. Investors should carefully consider the investment objectives, risks, charges, and expenses of a fund, which are described in its prospectus. For this and other information or to request a prospectus or summary prospectus, call 1-800-225-1581 toll free. Please read the prospectus carefully before investing. The fund’s Statement of Additional Information contains additional information about the fund’s Trustees and is available without charge upon request by calling 1-800-225-1581.
Item 2. Code of Ethics:
(a) The fund’s principal executive, financial and accounting officers are employees of Putnam Investment Management, LLC, the Fund’s investment manager. As such they are subject to a comprehensive Code of Ethics adopted and administered by Putnam Investments which is designed to protect the interests of the firm and its clients. The Fund has adopted a Code of Ethics which incorporates the Code of Ethics of Putnam Investments with respect to all of its officers and Trustees who are employees of Putnam Investment Management, LLC. For this reason, the Fund has not adopted a separate code of ethics governing its principal executive, financial and accounting officers.
(c) In July 2013, the Code of Ethics of Putnam Investment Management, LLC was amended. The changes to the Code of Ethics were as follows: (i) eliminating the requirement for employees to hold their shares of Putnam mutual funds for specified periods of time, (ii) removing the requirement to preclear transactions in certain kinds of exchange-traded funds and exchange-traded notes, although reporting of all such instruments remains required; (iii) eliminating the excessive trading rule related to employee transactions in securities requiring preclearance under the Code; (iv) adding provisions related to monitoring of employee trading; (v) changing from a set number of shares to a set dollar value of stock of mid- and large-cap companies on the Restricted List that can be purchased or sold; (vi) adding a requirement starting in March 2014 for employees to generally use certain approved brokers that provide Putnam with an electronic feed of transactions and statements for their personal brokerage accounts; and (vii) certain other changes.
Item 3. Audit Committee Financial Expert:
The Funds’ Audit and Compliance Committee is comprised solely of Trustees who are “independent” (as such term has been defined by the Securities and Exchange Commission (“SEC”) in regulations implementing Section 407 of the Sarbanes-Oxley Act (the “Regulations”)). The Trustees believe that each of the members of the Audit and Compliance Committee also possess a combination of knowledge and experience with respect to financial accounting matters, as well as other attributes, that qualify them for service on the Committee. In addition, the Trustees have determined that each of Mr. Leibler, Mr. Hill, Mr. Darretta, and Ms. Baumann qualifies as an “audit committee financial expert” (as such term has been defined by the Regulations) based on their review of his or her pertinent experience and education. The SEC has stated, and the funds’ amended and restated agreement and Declaration of Trust provides, that the designation or identification of a person as an audit committee financial expert pursuant to this Item 3 of Form N-CSR does not impose on such person any duties, obligations or liability that are greater than the duties, obligations and liability imposed on such person as a member of the Audit and Compliance Committee and the Board of Trustees in the absence of such designation or identification.
Item 4. Principal Accountant Fees and Services:
The following table presents fees billed in each of the last two fiscal years for services rendered to the fund by the fund’s independent auditor:
Fiscal year ended
Audit Fees
Audit-Related Fees
Tax Fees
All Other Fees
October 31, 2014
$128,142
$ —
$17,878
$ —
October 31, 2013
$122,049
$ —
$17,823
$ —
For the fiscal years ended October 31, 2014 and October 31, 2013, the fund’s independent auditor billed aggregate non-audit fees in the amounts of $594,052 and $167,823 respectively, to the fund, Putnam Management and any entity controlling, controlled by or under common control with Putnam Management that provides ongoing services to the fund.
Audit Fees represent fees billed for the fund’s last two fiscal years relating to the audit and review of the financial statements included in annual reports and registration statements, and other services that are normally provided in connection with statutory and regulatory filings or engagements.
Audit-Related Fees represent fees billed in the fund’s last two fiscal years for services traditionally performed by the fund’s auditor, including accounting consultation for proposed transactions or concerning financial accounting and reporting standards and other audit or attest services not required by statute or regulation.
Tax Fees represent fees billed in the fund’s last two fiscal years for tax compliance, tax planning and tax advice services. Tax planning and tax advice services include assistance with tax audits, employee benefit plans and requests for rulings or technical advice from taxing authorities.
Pre-Approval Policies of the Audit and Compliance Committee. The Audit and Compliance Committee of the Putnam funds has determined that, as a matter of policy, all work performed for the funds by the funds’ independent auditors will be pre-approved by the Committee itself and thus will generally not be subject to pre-approval procedures.
The Audit and Compliance Committee also has adopted a policy to pre-approve the engagement by Putnam Management and certain of its affiliates of the funds’ independent auditors, even in circumstances where pre-approval is not required by applicable law. Any such requests by Putnam Management or certain of its affiliates are typically submitted in writing to the Committee and explain, among other things, the nature of the proposed engagement, the estimated fees, and why this work should be performed by that particular audit firm as opposed to another one. In reviewing such requests, the Committee considers, among other things, whether the provision of such services by the audit firm are compatible with the independence of the audit firm.
The following table presents fees billed by the fund’s independent auditor for services required to be approved pursuant to paragraph (c)(7)(ii) of Rule 2-01 of Regulation S-X.
Fiscal year ended
Audit-Related Fees
Tax Fees
All Other Fees
Total Non-Audit Fees
October 31, 2014
$ —
$576,174
$ —
$ —
October 31, 2013
$ —
$150,000
$ —
$ —
Item 5. Audit Committee of Listed Registrants
Not applicable
Item 6. Schedule of Investments:
The registrant’s schedule of investments in unaffiliated issuers is included in the report to shareholders in Item 1 above.
Item 7. Disclosure of Proxy Voting Policies and Procedures For Closed-End Management Investment Companies:
Not applicable
Item 8. Portfolio Managers of Closed-End Investment Companies
Not Applicable
Item 9. Purchases of Equity Securities by Closed-End Management Investment Companies and Affiliated Purchasers:
Not applicable
Item 10. Submission of Matters to a Vote of Security Holders:
Not applicable
Item 11. Controls and Procedures:
(a) The registrant’s principal executive officer and principal financial officer have concluded, based on their evaluation of the effectiveness of the design and operation of the registrant’s disclosure controls and procedures as of a date within 90 days of the filing date of this report, that the design and operation of such procedures are generally effective to provide reasonable assurance that information required to be disclosed by the registrant in this report is recorded, processed, summarized and reported within the time periods specified in the Commission’s rules and forms.
(b) Changes in internal control over financial reporting: Not applicable
Item 12. Exhibits:
(a)(1) The Code of Ethics of The Putnam Funds, which incorporates the Code of Ethics of Putnam Investments, is filed herewith.
(a)(2) Separate certifications for the principal executive officer and principal financial officer of the registrant as required by Rule 30a-2(a) under the Investment Company Act of 1940, as amended, are filed herewith.
(b) The certifications required by Rule 30a-2(b) under the Investment Company Act of 1940, as amended, are filed herewith.
SIGNATURES
Pursuant to the requirements of the Securities Exchange Act of 1934 and the Investment Company Act of 1940, the registrant has duly caused this report to be signed on its behalf by the undersigned, thereunto duly authorized.
Putnam Global Income Trust
By (Signature and Title):
/s/ Janet C. Smith Janet C. Smith Principal Accounting Officer
Date: December 29, 2014
Pursuant to the requirements of the Securities Exchange Act of 1934 and the Investment Company Act of 1940, this report has been signed below by the following persons on behalf of the registrant and in the capacities and on the dates indicated.
By (Signature and Title):
/s/ Jonathan S. Horwitz Jonathan S. Horwitz Principal Executive Officer
Date: December 29, 2014
By (Signature and Title):
/s/ Steven D. Krichmar Steven D. Krichmar Principal Financial Officer
Date: December 29, 2014
We use cookies on this site to provide a more responsive and personalized service. Continuing to browse, clicking I Agree, or closing this banner indicates agreement. See our Cookie Policy for more information.