| | |
| UNITED STATES
SECURITIES AND EXCHANGE COMMISSION |
| | |
| CERTIFIED SHAREHOLDER REPORT OF REGISTERED
MANAGEMENT INVESTMENT COMPANIES
|
| | |
| Investment Company Act file number: | (811-04524) |
| | |
| Exact name of registrant as specified in charter: | Putnam Global Income Trust |
| | |
| Address of principal executive offices: | 100 Federal Street, Boston, Massachusetts 02110 |
| | |
| Name and address of agent for service: | Robert T. Burns, Vice President
100 Federal Street
Boston, Massachusetts 02110 |
| | |
| Copy to: | Bryan Chegwidden, Esq.
Ropes & Gray LLP
1211 Avenue of the Americas
New York, New York 10036 |
| | |
| Registrant's telephone number, including area code: | (617) 292-1000 |
| | |
| Date of fiscal year end: | October 31, 2021 |
| | |
| Date of reporting period: | November 1, 2020 — April 30, 2021 |
| | |
|
Item 1. Report to Stockholders: | |
| | |
| The following is a copy of the report transmitted to stockholders pursuant to Rule 30e-1 under the Investment Company Act of 1940: | |
Putnam
Global Income
Trust
Semiannual report
4 | 30 | 21
Message from the Trustees
June 7, 2021
Dear Fellow Shareholder:
With summer at hand, it’s worth asking whether the economy has returned to normal. More than half of the 50 states have lifted pandemic-related restrictions. First-quarter growth in U.S. gross domestic product was 6%, reflecting a return nearly to pre-pandemic levels of economic output. The global economy is a different story. Beyond our shores, many nations lag the United States in vaccination rates and business activity.
While there are reasons to feel some relief, it’s important to recognize what may be a new normal. The pandemic is not in the past, and many of the changes precipitated by it could last. During this time, dynamic, well-managed companies have adapted to seize new, more sustainable growth opportunities.
Putnam’s active philosophy is well suited to this time. Putnam’s investment teams are analyzing companies, industries, consumers, and even governments. They try to understand the fundamentals of what has stayed the same and what has changed to uncover valuable investment insights or potential risks.
Thank you for investing with Putnam.


Investing in today’s bond markets requires a broad-based approach, the flexibility to exploit a range of sectors and opportunities, and a keen understanding of the complex global interrelationships that drive the markets. With support from more than 90 fixed-income professionals, the fund’s managers actively position the portfolio in securities from a broad range of sectors.
The fund’s management team has an average of more than 25 years of experience.
Putnam Global Income Trust invests in a number of sectors, from international sovereign debt and investment-grade corporate bonds to a wide range of mortgage-backed securities.

Investing for income from global sources
The fund provides exposure to a variety of currencies to seek to benefit from changes in exchange rates.
Illustration shows the fund’s five largest currency exposures as of 4/30/21.
Allocations in each currency may vary over time.

Fund allocations are shown as a percentage of the fund’s net assets as of 4/30/21. Cash and net other assets, if any, represent the market value weights of cash, derivatives, short-term securities, and other unclassified assets in the portfolio. Summary information may differ from the portfolio schedule included in the financial statements due to the inclusion of derivative securities, any interest accruals, the use of different classifications of securities for presentation purposes, and rounding. Allocations may not total 100% because the table includes the notional value of certain derivatives (the economic value for purposes of calculating periodic payment obligations), in addition to the market value of securities. Holdings and allocations may vary over time. For more information on current fund holdings, see pages 19–76.
All Bloomberg Barclays indices provided by Bloomberg Index Services Limited.
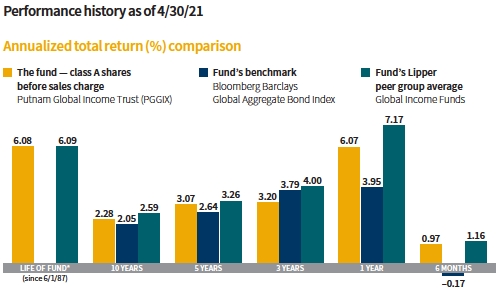
Current performance may be lower or higher than the quoted past performance, which cannot guarantee future results. Share price, principal value, and return will fluctuate, and you may have a gain or a loss when you sell your shares. Performance of class A shares assumes reinvestment of distributions and does not account for taxes. Fund returns in the bar chart do not reflect a sales charge of 4.00%; had they, returns would have been lower. See below and pages 10–12 for additional performance information. For a portion of the periods, the fund had expense limitations, without which returns would have been lower. To obtain the most recent month-end performance, visit putnam.com.
Returns for periods less than one year are cumulative.
All Bloomberg Barclays indices provided by Bloomberg Index Services Limited.
Lipper peer group average provided by Lipper, a Refinitiv company.
* The fund’s benchmark, the Bloomberg Barclays Global Aggregate Bond Index, was introduced on 12/31/89, which post-dates the inception of the fund’s class A shares.
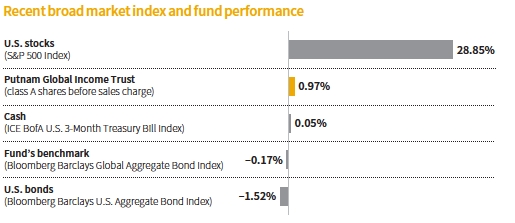
This comparison shows your fund’s performance in the context of broad market indexes for the six months ended 4/30/21. See above and pages 10–12 for additional fund performance information. Index descriptions can be found on page 16.
All Bloomberg Barclays indices provided by Bloomberg Index Services Limited.


Please describe the investing environment during the period.
Financial markets proved to be surprisingly resilient during the six-month reporting period ended April 30, 2021. Encouraging vaccine news bolstered investor optimism about the strength of the economic recovery in 2021. President Biden’s $1.9 trillion American Rescue Plan in early March and the gradual easing of mobility restrictions provided a further boost to market sentiment. Rising prices for stocks and commodities also helped lift the overall market environment. However, concerns about the potential inflationary impact of additional stimulus on top of a recovering economy led to an exodus from government bonds. This moved longer-term interest rates higher and pressured the credit market.
The yield on the benchmark 10-year U.S. Treasury note rose to 1.65% on April 30, 2021, from 0.88% at the beginning of the reporting period. Similarly, the 30-year U.S. Treasury note yield rose to 2.30% from 1.65%. Outside the United States, interest rates moved higher as well. Within this environment, ascending bond yields weighed on investment-grade [IG] debt despite marginal spread tightening. [Spreads

Allocations are shown as a percentage of the fund’s net assets as of 4/30/21. Cash and net other assets, if any, represent the market value weights of cash, derivatives, short-term securities, and other unclassified assets in the portfolio. Summary information may differ from the portfolio schedule included in the financial statements due to the inclusion of derivative securities, any interest accruals, the use of different classifications of securities for presentation purposes, and rounding. Allocations may not total 100% because the table includes the notional value of certain derivatives (the economic value for purposes of calculating periodic payment obligations), in addition to the market value of securities. Holdings and allocations may vary over time.

are the yield advantage credit-sensitive bonds offer over comparable-maturity U.S. Treasuries. Bond prices rise as yield spreads tighten and decline as spreads widen.] High-yield credit, meanwhile, posted a modest gain, aided by better-than-expected corporate earnings and higher oil prices.
How did the fund perform for the six months ended April 30, 2021?
The fund returned 0.97%, outperforming the benchmark Bloomberg Barclays Global Aggregate Bond Index. Bloomberg Barclays Global Aggregate Bond Index declined 0.17% during the period.
Which holdings and strategies aided the fund’s relative outperformance?
Within our mortgage-credit holdings, commercial mortgage-backed securities [CMBS] provided the greatest boost to relative performance during the period. Our positions in cash [as opposed to synthetic] CMBS increased in value as spreads tightened. An overweight allocation to investment-grade corporate bonds also contributed. IG corporate spreads tightened marginally, resulting in a slight increase in bond prices.
What about detractors?
The fund’s interest-rate and yield-curve positioning was the only material relative detractor during the period. We maintain structural duration positions in the portfolio. We believe duration has been a very good risk diversifier and normally benefits during risk-off periods
when interest rates decline. During the first few months of this year, however, these positions suffered amid rising interest rates.
How did the fund use derivatives?
The fund used futures to hedge treasury term-structure risk and for yield-curve positioning. Forwards were used to hedge currency exposures and gain exposure to currencies. Interest-rate swaps were used to hedge term-structure risk, for yield-curve positioning, and to gain exposure to rates in various countries. Options [swaptions] were used to help hedge duration and convexity, isolate prepayment risk, and manage downside risks. Credit default swaps were used to hedge credit and market risks, gain liquid exposure to individual names, and gain exposure to specific sectors. Total return swaps were used to hedge sector exposure and inflation, as well as to gain exposure to specific sectors and inflation.

What are your current views on the various sectors in which the fund invests?
For corporate credit, we have a positive view of fundamentals and the market’s supply-and-demand backdrop. However, we are more neutral toward valuation. From a supply-and-demand standpoint, new issuance of investment-grade corporate bonds in calendar 2020 reached a record level of $1.7 trillion. We think new issuance is likely to decline this year, and lower supply could lift existing bond prices higher. Overall, we believe reduced bond issuance should be positive for the market’s technical backdrop. Investment-grade corporate spreads have tightened, and valuations in this sector appear to be less
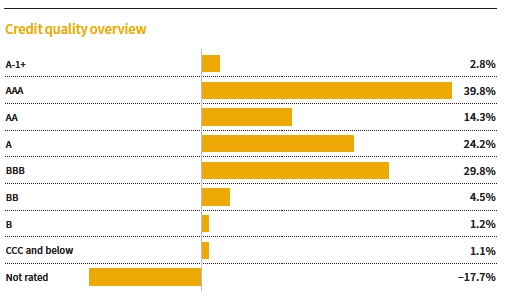
Credit qualities are shown as a percentage of the fund’s net assets as of 4/30/21. A bond rated BBB or higher (A-3 or higher, for short-term debt) is considered investment grade. This chart reflects the highest security rating provided by one or more of Standard & Poor’s, Moody’s, and Fitch. To-be-announced (TBA) mortgage commitments, if any, are included based on their issuer ratings. Ratings may vary over time.
Cash, derivative instruments, and net other assets are shown in the not-rated category. Payables and receivables for TBA mortgage commitments are included in the not-rated category and may result in negative weights. The fund itself has not been rated by an independent rating agency.
attractive. Therefore, security selection and sector rotation will be important as we navigate this market. We believe investment-grade corporate debt is more attractive to non-U.S. investors as rates rise in the United States.
Within the CMBS market, while there continues to be a degree of negative sentiment toward certain property types, the availability of Covid-19 vaccines has sparked optimism that social-distancing measures could be meaningfully eased by the middle of 2021. As a result, we continue to have conviction in the fund’s CMBX exposure. [CMBX Index is an unmanaged index that tracks the performance of a basket of CMBS issued in a particular year.] We believe current valuations fairly compensate investors for existing risk levels and provide an attractive risk premium.
Within residential mortgage credit, against the backdrop of robust home sales and a rebound in mortgage originations, we continue to find value across numerous market segments. In prepayment-sensitive areas of the market, we continue to find value in agency interest-only [IO] collateralized mortgage obligations as well as inverse IOs backed by jumbo loans and more seasoned collateral. Overall, we view prepayment-related opportunities as attractive sources of diversification for the fund.
As for non-U.S. sovereign debt in developed and emerging markets, we think the economic recovery will be strongest in countries with large service sectors and effective vaccine distribution. We also prefer countries that can contain government expenditures despite political pressures to raise them.
What is your near-term outlook for the economy?
As the economy reopens amid widespread distribution of Covid-19 vaccines, we believe gross domestic product growth will be robust, particularly in the second and third quarters of 2021. We’re also anticipating a strong recovery in corporate earnings growth. Since growth expectations are already built into asset market pricing, we are cautiously watching the coming months for economic data surprises. We believe U.S. Treasury yields could rise further this year as growth trends higher. That said, we think the trend toward higher rates will be more gradual, as bond investors adjust their growth and inflation outlooks, leading to periods of market volatility.
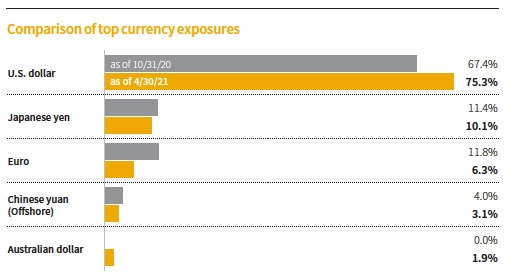
This chart shows how the fund’s top currency holdings have changed over the past six months. Allocations are shown as a percentage of the fund’s net assets. Holdings and allocations may vary over time.
In addition to interest rates and Covid-19 vaccine progress, we will also watch inflation metrics. Given base effects from the prior year and the expected demand surge upon re-opening, we believe the inflation surge will be temporary. However, we have few instances in the past 20 years when monetary and fiscal policies were aligned strongly toward an easing bias. Over the next few months, we will be monitoring components of the inflation basket for signs that may prompt the Federal Reserve to shift its dovish posture sooner than currently expected.
Thank you, Mike, for your time and insights today.
The views expressed in this report are exclusively those of Putnam Management and are subject to change. They are not meant as investment advice.
Please note that the holdings discussed in this report may not have been held by the fund for the entire period. Portfolio composition is subject to review in accordance with the fund’s investment strategy and may vary in the future. Current and future portfolio holdings are subject to risk.
ABOUT DERIVATIVES
Derivatives are an increasingly common type of investment instrument, the performance of which is derived from an underlying security, index, currency, or other area of the capital markets. Derivatives employed by the fund’s managers generally serve one of two main purposes: to implement a strategy that may be difficult or more expensive to invest in through traditional securities, or to hedge unwanted risk associated with a particular position.
For example, the fund’s managers might use currency forward contracts to capitalize on an anticipated change in exchange rates between two currencies. This approach would require a significantly smaller outlay of capital than purchasing traditional bonds denominated in the underlying currencies. In another example, the managers may identify a bond that they believe is undervalued relative to its risk of default, but may seek to reduce the interest-rate risk of that bond by using interest-rate swaps, a derivative through which two parties “swap” payments based on the movement of certain rates. In other examples, the managers may use options and futures contracts to hedge against a variety of risks.
Like any other investment, derivatives may not appreciate in value and may lose money. Derivatives may amplify traditional investment risks through the creation of leverage and may be less liquid than traditional securities. And because derivatives typically represent contractual agreements between two financial institutions, derivatives entail “counterparty risk,” which is the risk that the other party is unable or unwilling to pay. Putnam monitors the counterparty risks we assume. For example, Putnam often enters into collateral agreements that require the counterparties to post collateral on a regular basis to cover their obligations to the fund. Counterparty risk for exchange-traded futures and centrally cleared swaps is mitigated by the daily exchange of margin and other safeguards against default through their respective clearinghouses.
Your fund’s performance
This section shows your fund’s performance, price, and distribution information for periods ended April 30, 2021, the end of the first half of its current fiscal year. In accordance with regulatory requirements for mutual funds, we also include performance information as of the most recent calendar quarter-end and expense information taken from the fund’s current prospectus. Performance should always be considered in light of a fund’s investment strategy. Data represent past performance. Past performance does not guarantee future results. More recent returns may be less or more than those shown. Investment return and principal value will fluctuate, and you may have a gain or a loss when you sell your shares. Performance information does not reflect any deduction for taxes a shareholder may owe on fund distributions or on the redemption of fund shares. For the most recent month-end performance, please visit the Individual Investors section at putnam.com or call Putnam at 1-800-225-1581. Class R, R5, R6, and Y shares are not available to all investors. See the Terms and definitions section in this report for definitions of the share classes offered by your fund.
Fund performance Total return for periods ended 4/30/21
| | | | | | | | | |
| | Annual | | | | | | | | |
| | average | | Annual | | Annual | | Annual | | |
| | (life of fund) | 10 years | average | 5 years | average | 3 years | average | 1 year | 6 months |
| Class A (6/1/87) | | | | | | | | | |
| Before sales charge | 6.08% | 25.35% | 2.28% | 16.33% | 3.07% | 9.92% | 3.20% | 6.07% | 0.97% |
| After sales charge | 5.96 | 20.33 | 1.87 | 11.68 | 2.23 | 5.52 | 1.81 | 1.83 | –3.07 |
| Class B (2/1/94) | | | | | | | | | |
| Before CDSC | 5.88 | 17.97 | 1.67 | 12.03 | 2.30 | 7.44 | 2.42 | 5.28 | 0.59 |
| After CDSC | 5.88 | 17.97 | 1.67 | 10.03 | 1.93 | 4.44 | 1.46 | 0.28 | –4.41 |
| Class C (7/26/99) | | | | | | | | | |
| Before CDSC | 5.90 | 18.11 | 1.68 | 12.16 | 2.32 | 7.47 | 2.43 | 5.37 | 0.67 |
| After CDSC | 5.90 | 18.11 | 1.68 | 12.16 | 2.32 | 7.47 | 2.43 | 4.37 | –0.33 |
| Class R (12/1/03) | | | | | | | | | |
| Net asset value | 5.82 | 22.32 | 2.04 | 15.01 | 2.84 | 9.11 | 2.95 | 5.90 | 0.85 |
| Class R5 (7/2/12) | | | | | | | | | |
| Net asset value | 6.23 | 29.25 | 2.60 | 18.47 | 3.45 | 11.06 | 3.56 | 6.51 | 1.21 |
| Class R6 (7/2/12) | | | | | | | | | |
| Net asset value | 6.24 | 30.00 | 2.66 | 18.75 | 3.50 | 11.29 | 3.63 | 6.49 | 1.17 |
| Class Y (10/4/05) | | | | | | | | | |
| Net asset value | 6.21 | 28.55 | 2.54 | 17.94 | 3.35 | 10.77 | 3.47 | 6.43 | 1.18 |
Current performance may be lower or higher than the quoted past performance, which cannot guarantee future results. After-sales-charge returns for class A shares reflect the deduction of the maximum 4.00% sales charge levied at the time of purchase. Class B share returns after contingent deferred sales charge (CDSC) reflect the applicable CDSC, which is 5% in the first year, declining over time to 1% in the sixth year, and is eliminated thereafter. Class C share returns after CDSC reflect a 1% CDSC for the first year that is eliminated thereafter. Class R, R5, R6, and Y shares have no initial sales charge or CDSC. Performance for class B, C, R, and Y shares before their inception is derived from the historical performance of class A shares, adjusted for the applicable sales charge (or CDSC) and the higher operating expenses for such shares, except for class Y shares, for which 12b-1 fees are not applicable. Performance for class R5 and R6 shares prior to their inception is derived from the historical performance of class Y shares and has not been adjusted for the lower investor servicing fees applicable to class R5 and R6 shares; had it, returns would have been higher.
For a portion of the periods, the fund had expense limitations, without which returns would have been lower.
Class B and C share performance reflects conversion to class A shares after eight years.
Comparative index returns For periods ended 4/30/21
| | | | | | | | | |
| | Annual | | | | | | | | |
| | average | | Annual | | Annual | | Annual | | |
| | (life of fund) | 10 years | average | 5 years | average | 3 years | average | 1 year | 6 months |
| Bloomberg Barclays | | | | | | | | | |
| Global Aggregate | —* | 22.47% | 2.05% | 13.93% | 2.64% | 11.81% | 3.79% | 3.95% | –0.17% |
| Bond Index | | | | | | | | | |
| Lipper Global Income | | | | | | | | | |
| Funds category | 6.09% | 29.97 | 2.59 | 17.52 | 3.26 | 12.52 | 4.00 | 7.17 | 1.16 |
| average† | | | | | | | | | |
Index and Lipper results should be compared with fund performance before sales charge, before CDSC, or at net asset value.
All Bloomberg Barclays indices provided by Bloomberg Index Services Limited.
* The fund’s benchmark, the Bloomberg Barclays Global Aggregate Bond Index, was introduced on 12/31/89, which post-dates the inception of the fund’s class A shares.
† Over the 6-month, 1-year, 3-year, 5-year, 10-year, and life-of-fund periods ended 4/30/21, there were 211, 208, 188, 166, 109, and 1 fund(s), respectively, in this Lipper category.
Fund price and distribution information For the six-month period ended 4/30/21
| | | | | | | | |
| Distributions | Class A | Class B | Class C | Class R | Class R5 | Class R6 | Class Y |
| Number | 6 | 6 | 6 | 6 | 6 | 6 | 6 |
| Income | $0.102 | $0.054 | $0.053 | $0.087 | $0.122 | $0.127 | $0.118 |
| Capital gains | — | — | — | — | — | — | — |
| Total | $0.102 | $0.054 | $0.053 | $0.087 | $0.122 | $0.127 | $0.118 |
| | Before | After | Net | Net | Net | Net | Net | Net |
| | sales | sales | asset | asset | asset | asset | asset | asset |
| Share value | charge | charge | value | value | value | value | value | value |
| 10/31/20 | $12.45 | $12.97 | $12.39 | $12.39 | $12.45 | $12.44 | $12.45 | $12.44 |
| 4/30/21 | 12.47 | 12.99 | 12.41 | 12.42 | 12.47 | 12.47 | 12.47 | 12.47 |
| | Before | After | Net | Net | Net | Net | Net | Net |
| Current rate | sales | sales | asset | asset | asset | asset | asset | asset |
| (end of period) | charge | charge | value | value | value | value | value | value |
| Current dividend rate1 | 1.64% | 1.57% | 0.77% | 0.87% | 1.44% | 2.02% | 2.12% | 1.92% |
| Current 30-day | | | | | | | | |
| SEC yield | | | | | | | | |
| (with expense | | | | | | | | |
| limitation)2,3 | N/A | 1.65 | 0.97 | 0.99 | 1.47 | 2.04 | 2.12 | 1.96 |
| Current 30-day | | | | | | | | |
| SEC yield | | | | | | | | |
| (without expense | | | | | | | | |
| limitation)3 | N/A | 1.37 | 0.68 | 0.70 | 1.19 | 1.75 | 1.83 | 1.68 |
The classification of distributions, if any, is an estimate. Before-sales-charge share value and current dividend rate for class A shares, if applicable, do not take into account any sales charge levied at the time of purchase. After-sales-charge share value, current dividend rate, and current 30-day SEC yield, if applicable, are calculated assuming that the maximum sales charge (4.00% for class A shares) was levied at the time of purchase. Final distribution information will appear on your year-end tax forms.
1 Most recent distribution, including any return of capital and excluding capital gains, annualized and divided by share price before or after sales charge at period-end.
2 For a portion of the period, the fund had expense limitations, without which yields would have been lower.
3 Based only on investment income and calculated using the maximum offering price for each share class, in accordance with SEC guidelines.
Fund performance as of most recent calendar quarter Total return for periods ended 3/31/21
| | | | | | | | | |
| | Annual | | | | | | | | |
| | average | | Annual | | Annual | | Annual | | |
| | (life of fund) | 10 years | average | 5 years | average | 3 years | average | 1 year | 6 months |
| Class A (6/1/87) | | | | | | | | | |
| Before sales charge | 6.09% | 29.47% | 2.62% | 18.46% | 3.45% | 8.34% | 2.71% | 8.45% | 0.89% |
| After sales charge | 5.96 | 24.29 | 2.20 | 13.72 | 2.61 | 4.01 | 1.32 | 4.12 | –3.14 |
| Class B (2/1/94) | | | | | | | | | |
| Before CDSC | 5.88 | 21.87 | 2.00 | 14.09 | 2.67 | 5.90 | 1.93 | 7.67 | 0.52 |
| After CDSC | 5.88 | 21.87 | 2.00 | 12.09 | 2.31 | 2.90 | 0.96 | 2.67 | –4.48 |
| Class C (7/26/99) | | | | | | | | | |
| Before CDSC | 5.90 | 22.03 | 2.01 | 14.14 | 2.68 | 5.84 | 1.91 | 7.66 | 0.50 |
| After CDSC | 5.90 | 22.03 | 2.01 | 14.14 | 2.68 | 5.84 | 1.91 | 6.66 | –0.50 |
| Class R (12/1/03) | | | | | | | | | |
| Net asset value | 5.82 | 26.25 | 2.36 | 17.02 | 3.19 | 7.45 | 2.42 | 8.18 | 0.76 |
| Class R5 (7/2/12) | | | | | | | | | |
| Net asset value | 6.23 | 33.38 | 2.92 | 20.53 | 3.81 | 9.38 | 3.03 | 8.82 | 1.05 |
| Class R6 (7/2/12) | | | | | | | | | |
| Net asset value | 6.25 | 34.26 | 2.99 | 21.01 | 3.89 | 9.69 | 3.13 | 8.87 | 1.08 |
| Class Y (10/4/05) | | | | | | | | | |
| Net asset value | 6.21 | 32.66 | 2.87 | 20.00 | 3.71 | 9.10 | 2.95 | 8.74 | 1.02 |
See the discussion following the fund performance table on page 10 for information about the calculation of fund performance.
Your fund’s expenses
As a mutual fund investor, you pay ongoing expenses, such as management fees, distribution fees (12b-1 fees), and other expenses. In the most recent six-month period, your fund’s expenses were limited; had expenses not been limited, they would have been higher. Using the following information, you can estimate how these expenses affect your investment and compare them with the expenses of other funds. You may also pay one-time transaction expenses, including sales charges (loads) and redemption fees, which are not shown in this section and would have resulted in higher total expenses. For more information, see your fund’s prospectus or talk to your financial representative.
Expense ratios
| | | | | | | |
| | Class A | Class B | Class C | Class R | Class R5 | Class R6 | Class Y |
| Net expenses for the fiscal year | | | | | | | |
| ended 10/31/20* | 0.89% | 1.64% | 1.64% | 1.14% | 0.55% | 0.48% | 0.64% |
| Total annual operating expenses for the | | | | | | | |
| fiscal year ended 10/31/20 | 1.20% | 1.95% | 1.95% | 1.45% | 0.86% | 0.79% | 0.95% |
| Annualized expense ratio for the | | | | | | | |
| six-month period ended 4/30/21 | 0.88% | 1.63% | 1.63% | 1.13% | 0.55% | 0.48% | 0.63% |
Fiscal year expense information in this table is taken from the most recent prospectus, is subject to change, and may differ from that shown for the annualized expense ratio and in the financial highlights of this report.
Expenses are shown as a percentage of average net assets.
* Reflects Putnam Management’s contractual obligation to limit certain fund expenses through 2/28/22.
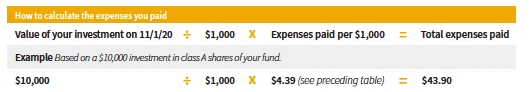
Expenses per $1,000
The following table shows the expenses you would have paid on a $1,000 investment in each class of the fund from 11/1/20 to 4/30/21. It also shows how much a $1,000 investment would be worth at the close of the period, assuming actual returns and expenses.
| | | | | | | |
| | Class A | Class B | Class C | Class R | Class R5 | Class R6 | Class Y |
| Expenses paid per $1,000*† | $4.39 | $8.11 | $8.11 | $5.63 | $2.74 | $2.39 | $3.14 |
| Ending value (after expenses) | $1,009.70 | $1,005.90 | $1,006.70 | $1,008.50 | $1,012.10 | $1,011.70 | $1,011.80 |
* Expenses for each share class are calculated using the fund’s annualized expense ratio for each class, which represents the ongoing expenses as a percentage of average net assets for the six months ended 4/30/21. The expense ratio may differ for each share class.
† Expenses are calculated by multiplying the expense ratio by the average account value for the period; then multiplying the result by the number of days in the period; and then dividing that result by the number of days in the year.
Estimate the expenses you paid
To estimate the ongoing expenses you paid for the six months ended 4/30/21, use the following calculation method. To find the value of your investment on 11/1/20, call Putnam at 1-800-225-1581.
Compare expenses using the SEC’s method
The Securities and Exchange Commission (SEC) has established guidelines to help investors assess fund expenses. Per these guidelines, the following table shows your fund’s expenses based on a $1,000 investment, assuming a hypothetical 5% annualized return. You can use this information to compare the ongoing expenses (but not transaction expenses or total costs) of investing in the fund with those of other funds. All mutual fund shareholder reports will provide this information to help you make this comparison. Please note that you cannot use this information to estimate your actual ending account balance and expenses paid during the period.
| | | | | | | |
| | Class A | Class B | Class C | Class R | Class R5 | Class R6 | Class Y |
| Expenses paid per $1,000*† | $4.41 | $8.15 | $8.15 | $5.66 | $2.76 | $2.41 | $3.16 |
| Ending value (after expenses) | $1,020.43 | $1,016.71 | $1,016.71 | $1,019.19 | $1,022.07 | $1,022.41 | $1,021.67 |
* Expenses for each share class are calculated using the fund’s annualized expense ratio for each class, which represents the ongoing expenses as a percentage of average net assets for the six months ended 4/30/21. The expense ratio may differ for each share class.
† Expenses are calculated by multiplying the expense ratio by the average account value for the six-month period; then multiplying the result by the number of days in the six-month period; and then dividing that result by the number of days in the year.
Consider these risks before investing
International investing involves currency, economic, and political risks. Emerging-market securities carry illiquidity and volatility risks. Lower-rated bonds may offer higher yields in return for more risk. Funds that invest in government securities are not guaranteed. Mortgage-backed investments, unlike traditional debt investments, are subject to prepayment risk, which means that they may increase in value less than other bonds when interest rates decline and decline in value more than other bonds when interest rates rise. The fund concentrates on a limited group of industries and is non-diversified. Because the fund may invest in fewer issuers than a diversified fund, it is vulnerable to common economic forces and may result in greater losses and volatility. Bond investments are subject to interest-rate risk (the risk of bond prices falling if interest rates rise) and credit risk (the risk of an issuer defaulting on interest or principal payments). Interest-rate risk is generally greater for longer-term bonds, and credit risk is generally greater for below-investment-grade bonds. Risks associated with derivatives include increased investment exposure (which may be considered leverage) and, in the case of over-the-counter instruments, the potential inability to terminate or sell derivatives positions and the potential failure of the other party to the instrument to meet its obligations. Unlike bonds, funds that invest in bonds have fees and expenses. The value of investments in the fund’s portfolio may fall or fail to rise over extended periods of time for a variety of reasons, including general economic, political, or financial market conditions; investor sentiment and market perceptions; government actions; geopolitical events or changes; and factors related to a specific issuer, geography, industry, or sector. These and other factors may lead to increased volatility and reduced liquidity in the fund’s portfolio holdings. Our investment techniques, analyses, and judgments may not produce the outcome we intend. The investments we select for the fund may not perform as well as other securities that we do not select for the fund. We, or the fund’s other service providers, may experience disruptions or operating errors that could have a negative effect on the fund. You can lose money by investing in the fund.
Terms and definitions
Important terms
Total return shows how the value of the fund’s shares changed over time, assuming you held the shares through the entire period and reinvested all distributions in the fund.
Before sales charge, or net asset value, is the price, or value, of one share of a mutual fund, without a sales charge. Before-sales-charge figures fluctuate with market conditions, and are calculated by dividing the net assets of each class of shares by the number of outstanding shares in the class.
After sales charge is the price of a mutual fund share plus the maximum sales charge levied at the time of purchase. After-sales-charge performance figures shown here assume the 4.00% maximum sales charge for class A shares.
Contingent deferred sales charge (CDSC) is generally a charge applied at the time of the redemption of class B or C shares and assumes redemption at the end of the period. Your fund’s class B CDSC declines over time from a 5% maximum during the first year to 1% during the sixth year. After the sixth year, the CDSC no longer applies. The CDSC for class C shares is 1% for one year after purchase.
Share classes
Class A shares are generally subject to an initial sales charge and no CDSC (except on certain redemptions of shares bought without an initial sales charge).
Class B shares are closed to new investments and are only available by exchange from another Putnam fund or through dividend and/or capital gains reinvestment. They are not subject to an initial sales charge and may be subject to a CDSC.
Class C shares are not subject to an initial sales charge and are subject to a CDSC only if the shares are redeemed during the first year.
Class R shares are not subject to an initial sales charge or CDSC and are only available to employer-sponsored retirement plans.
Class R5 shares are not subject to an initial sales charge or CDSC and carry no 12b-1 fee. They are only available to employer-sponsored retirement plans.
Class R6 shares are not subject to an initial sales charge or CDSC and carry no 12b-1 fee. They are generally only available to employer-sponsored retirement plans, corporate and institutional clients, and clients in other approved programs.
Class Y shares are not subject to an initial sales charge or CDSC and carry no 12b-1 fee. They are generally only available to corporate and institutional clients and clients in other approved programs.
Fixed-income terms
Current rate is the annual rate of return earned from dividends or interest of an investment. Current rate is expressed as a percentage of the price of a security, fund share, or principal investment.
Mortgage-backed security (MBS), also known as a mortgage “pass-through,” is a type of asset-backed security that is secured by a mortgage or collection of mortgages. The following are types of MBSs:
• Agency credit-risk transfer security (CRT) is backed by a reference pool of agency mortgages. Unlike a regular agency pass-through, the principal invested in a CRT is not backed by a U.S. government agency. To compensate investors for this risk, a CRT typically offers a higher yield than conventional pass-through securities. Similar to a CMBS, a CRT is structured into various tranches for investors, offering different levels of risk and yield based on the underlying reference pool.
• Agency “pass-through” has its principal and interest backed by a U.S. government agency, such as the Federal National Mortgage Association (Fannie Mae), Government National Mortgage Association (Ginnie Mae), and Federal Home Loan Mortgage Corporation (Freddie Mac).
• Collateralized mortgage obligation (CMO) represents claims to specific cash flows from pools of home mortgages. The streams of principal and interest payments on the mortgages are distributed to the different classes of CMO interests in “tranches.” Each tranche may have different principal balances, coupon rates, prepayment risks, and maturity dates. A CMO is highly sensitive to changes in interest rates and any resulting change in the rate at which homeowners sell their properties, refinance, or otherwise prepay loans. CMOs are subject to prepayment, market, and liquidity risks.
° Interest-only (IO) security is a type of CMO in which the underlying asset is the interest portion of mortgage, Treasury, or bond payments.
• Non-agency residential mortgage-backed security (RMBS) is an MBS not backed by Fannie Mae, Ginnie Mae, or Freddie Mac. One type of RMBS is an Alt-A mortgage-backed security.
• Commercial mortgage-backed security (CMBS) is secured by the loan on a commercial property.
Yield curve is a graph that plots the yields of bonds with equal credit quality against their differing maturity dates, ranging from shortest to longest. It is used as a benchmark for other debt, such as mortgage or bank lending rates.
Comparative indexes
Bloomberg Barclays Global Aggregate Bond Index is an unmanaged index of global investment-grade fixed-income securities.
Bloomberg Barclays U.S. Aggregate Bond Index is an unmanaged index of U.S. investment-grade fixed-income securities.
CMBX Index is an unmanaged index that tracks the performance of a basket of CMBS issued in a particular year.
ICE BofA (Intercontinental Exchange Bank of America) U.S. 3-Month Treasury Bill Index is an unmanaged index that seeks to measure the performance of U.S. Treasury bills available in the marketplace.
S&P 500 Index is an unmanaged index of common stock performance.
Indexes assume reinvestment of all distributions and do not account for fees. Securities and performance of a fund and an index will differ. You cannot invest directly in an index.
BLOOMBERG® is a trademark and service mark of Bloomberg Finance L.P. and its affiliates (collectively “Bloomberg”). BARCLAYS® is a trademark and service mark of Barclays Bank Plc (collectively with its affiliates, “Barclays”), used under license. Bloomberg or Bloomberg’s licensors, including Barclays, own all proprietary rights in the Bloomberg Barclays Indices. Neither Bloomberg nor Barclays approves or endorses this material, or guarantees the accuracy or completeness of any information herein, or makes any warranty, express or limited, as to the results to be obtained therefrom, and to the maximum extent allowed by law, neither shall have any liability or responsibility for injury or damages arising in connection therewith.
ICE Data Indices, LLC (“ICE BofA”), used with permission. ICE BofA permits use of the ICE BofA indices and related data on an “as is” basis; makes no warranties regarding same; does not guarantee the suitability, quality, accuracy, timeliness, and/or completeness of the ICE BofA indices or any data included in, related to, or derived therefrom; assumes no liability in connection with the use of the foregoing; and does not sponsor, endorse, or recommend Putnam Investments, or any of its products or services.
Lipper, a Refinitiv company, is a third-party industry-ranking entity that ranks mutual funds. Its rankings do not reflect sales charges. Lipper rankings are based on total return at net asset value relative to other funds that have similar current investment styles or objectives as determined by Lipper. Lipper may change a fund’s category assignment at its discretion. Lipper category averages reflect performance trends for funds within a category.
Other information for shareholders
Important notice regarding delivery of shareholder documents
In accordance with Securities and Exchange Commission (SEC) regulations, Putnam sends a single notice of internet availability, or a single printed copy, of annual and semiannual shareholder reports, prospectuses, and proxy statements to Putnam shareholders who share the same address, unless a shareholder requests otherwise. If you prefer to receive your own copy of these documents, please call Putnam at 1-800-225-1581, and Putnam will begin sending individual copies within 30 days.
Proxy voting
Putnam is committed to managing our mutual funds in the best interests of our shareholders. The Putnam funds’ proxy voting guidelines and procedures, as well as information regarding how your fund voted proxies relating to portfolio securities during the 12-month period ended June 30, 2020, are available in the Individual Investors section of putnam.com and on the SEC’s website, www.sec.gov. If you have questions about finding forms on the SEC’s website, you may call the SEC at 1-800-SEC-0330. You may also obtain the Putnam funds’ proxy voting guidelines and procedures at no charge by calling Putnam’s Shareholder Services at 1-800-225-1581.
Fund portfolio holdings
The fund will file a complete schedule of its portfolio holdings with the SEC for the first and third quarters of each fiscal year on Form N-PORT within 60 days of the end of such fiscal quarter. Shareholders may obtain the fund’s Form N-PORT on the SEC’s website at www.sec.gov.
Prior to its use of Form N-PORT, the fund filed its complete schedule of its portfolio holdings with the SEC on Form N-Q, which is available online at www.sec.gov.
Trustee and employee fund ownership
Putnam employees and members of the Board of Trustees place their faith, confidence, and, most importantly, investment dollars in Putnam mutual funds. As of April 30, 2021, Putnam employees had approximately $580,000,000 and the Trustees had approximately $81,000,000 invested in Putnam mutual funds. These amounts include investments by the Trustees’ and employees’ immediate family members as well as investments through retirement and deferred compensation plans.
Liquidity risk management program
Putnam, as the administrator of the fund’s liquidity risk management program (appointed by the Board of Trustees), presented the most recent annual report on the program to the Trustees in April 2021. The report covered the structure of the program, including the program documents and related policies and procedures adopted to comply with Rule 22e-4 under the Investment Company Act of 1940, and reviewed the operation of the program from January 2020 through December 2020. The report included a description of the annual liquidity assessment of the fund that Putnam performed in November 2020. The report noted that there were no material compliance exceptions identified under Rule 22e-4 during the period. The report included a review of the governance of the program and the methodology for classification of the fund’s investments. The report also included a discussion of liquidity monitoring during the period, including during the market liquidity challenges caused by the Covid-19 pandemic, and the impact those challenges had on the liquidity of the fund’s investments. Putnam concluded that the program has been operating effectively and adequately to ensure compliance with Rule 22e-4.
Financial statements
These sections of the report, as well as the accompanying Notes, constitute the fund’s financial statements.
The fund’s portfolio lists all the fund’s investments and their values as of the last day of the reporting period. Holdings are organized by asset type and industry sector, country, or state to show areas of concentration and diversification.
Statement of assets and liabilities shows how the fund’s net assets and share price are determined. All investment and non-investment assets are added together. Any unpaid expenses and other liabilities are subtracted from this total. The result is divided by the number of shares to determine the net asset value per share, which is calculated separately for each class of shares. (For funds with preferred shares, the amount subtracted from total assets includes the liquidation preference of preferred shares.)
Statement of operations shows the fund’s net investment gain or loss. This is done by first adding up all the fund’s earnings — from dividends and interest income — and subtracting its operating expenses to determine net investment income (or loss). Then, any net gain or loss the fund realized on the sales of its holdings — as well as any unrealized gains or losses over the period — is added to or subtracted from the net investment result to determine the fund’s net gain or loss for the fiscal period.
Statement of changes in net assets shows how the fund’s net assets were affected by the fund’s net investment gain or loss, by distributions to shareholders, and by changes in the number of the fund’s shares. It lists distributions and their sources (net investment income or realized capital gains) over the current reporting period and the most recent fiscal year-end. The distributions listed here may not match the sources listed in the Statement of operations because the distributions are determined on a tax basis and may be paid in a different period from the one in which they were earned. Dividend sources are estimated at the time of declaration. Actual results may vary. Any non-taxable return of capital cannot be determined until final tax calculations are completed after the end of the fund’s fiscal year.
Financial highlights provide an overview of the fund’s investment results, per-share distributions, expense ratios, net investment income ratios, and portfolio turnover in one summary table, reflecting the five most recent reporting periods. In a semiannual report, the highlights table also includes the current reporting period.
The fund’s portfolio 4/30/21 (Unaudited)
| | |
| U.S. GOVERNMENT AND AGENCY | Principal | |
| MORTGAGE OBLIGATIONS (62.7%)* | amount | Value |
| U.S. Government Guaranteed Mortgage Obligations (2.5%) | | |
| Government National Mortgage Association Pass-Through Certificates | | |
| 4.50%, TBA, 5/1/51 | $1,000,000 | $1,081,563 |
| 4.00%, TBA, 5/1/51 | 2,000,000 | 2,135,000 |
| 3.50%, TBA, 5/1/51 | 1,000,000 | 1,060,156 |
| 3.00%, TBA, 5/1/51 | 2,000,000 | 2,092,344 |
| | | 6,369,063 |
| U.S. Government Agency Mortgage Obligations (60.2%) | | |
| Uniform Mortgage-Backed Securities | | |
| 4.00%, TBA, 5/1/51 | 5,000,000 | 5,371,875 |
| 3.50%, TBA, 6/1/51 | 6,000,000 | 6,376,172 |
| 3.50%, TBA, 5/1/51 | 8,000,000 | 8,513,750 |
| 3.00%, TBA, 6/1/51 | 2,000,000 | 2,092,812 |
| 3.00%, TBA, 5/1/51 | 5,000,000 | 5,235,547 |
| 2.50%, TBA, 6/1/51 | 29,000,000 | 30,005,938 |
| 2.50%, TBA, 5/1/51 | 77,000,000 | 79,857,424 |
| 2.00%, TBA, 5/1/51 | 14,000,000 | 14,136,718 |
| | | 151,590,236 |
| Total U.S. government and agency mortgage obligations (cost $156,714,923) | $157,959,299 |
| |
| | Principal | |
| U.S. TREASURY OBLIGATIONS (0.1%)* | amount | Value |
| U.S. Treasury Notes 0.25%, 9/30/25 i | $247,000 | $242,090 |
| Total U.S. treasury obligations (cost $242,090) | | $242,090 |
| |
| | Principal | |
| MORTGAGE-BACKED SECURITIES (35.5%)* | amount | Value |
| Agency collateralized mortgage obligations (3.7%) | | |
| Federal Home Loan Mortgage Corporation | | |
| REMICs IFB Ser. 4076, Class MS, IO, ((-1 x 1 Month US LIBOR) | | |
| + 6.70%), 6.585%, 7/15/40 | $514,617 | $42,483 |
| REMICs IFB Ser. 4979, Class SN, IO, ((-1 x 1 Month US LIBOR) | | |
| + 6.05%), 5.944%, 6/25/50 | 1,886,939 | 354,765 |
| REMICs Ser. 4355, Class DI, IO, 4.00%, 3/15/44 | 451,866 | 17,724 |
| REMICs Ser. 4193, Class PI, IO, 4.00%, 3/15/43 | 518,846 | 71,745 |
| REMICs Ser. 4369, Class IA, IO, 3.50%, 7/15/44 | 540,534 | 60,362 |
| REMICs Ser. 4141, Class PI, IO, 3.00%, 12/15/42 | 1,055,180 | 107,644 |
| REMICs Ser. 4165, Class TI, IO, 3.00%, 12/15/42 | 2,352,584 | 229,231 |
| REMICs Ser. 4206, Class IP, IO, 3.00%, 12/15/41 | 774,303 | 52,919 |
| Federal National Mortgage Association | | |
| REMICs IFB Ser. 12-116, Class SA, IO, ((-1 x 1 Month US LIBOR) | | |
| + 7.20%), 7.094%, 10/25/42 | 868,069 | 189,838 |
| REMICs IFB Ser. 10-46, Class SB, IO, ((-1 x 1 Month US LIBOR) | | |
| + 6.45%), 6.344%, 5/25/40 | 170,268 | 29,191 |
| REMICs IFB Ser. 12-103, Class LS, IO, ((-1 x 1 Month US LIBOR) | | |
| + 6.00%), 5.894%, 9/25/42 | 870,504 | 147,986 |
| REMICs Ser. 15-28, IO, 5.50%, 5/25/45 | 1,220,826 | 241,113 |
| REMICs Ser. 17-113, IO, 5.00%, 1/25/38 | 666,614 | 75,491 |
| REMICs Ser. 12-124, Class JI, IO, 3.50%, 11/25/42 | 431,150 | 35,501 |
| | |
| | Principal | |
| MORTGAGE-BACKED SECURITIES (35.5%)* cont. | amount | Value |
| Agency collateralized mortgage obligations cont. | | |
| Federal National Mortgage Association | | |
| REMICs Ser. 13-55, Class IK, IO, 3.00%, 4/25/43 | $564,804 | $59,098 |
| REMICs Ser. 13-35, Class IP, IO, 3.00%, 6/25/42 | 907,811 | 47,673 |
| REMICs Ser. 13-55, Class PI, IO, 3.00%, 5/25/42 | 805,310 | 32,282 |
| REMICs Ser. 13-23, Class PI, IO, 3.00%, 10/25/41 | 696,604 | 14,189 |
| REMICs Ser. 14-28, Class AI, IO, 3.00%, 3/25/40 | 808,686 | 28,105 |
| Government National Mortgage Association | | |
| IFB Ser. 10-171, Class SB, IO, ((-1 x 1 Month US LIBOR) + 6.45%), | | |
| 6.334%, 12/16/40 | 579,598 | 116,575 |
| IFB Ser. 16-77, Class SL, IO, ((-1 x 1 Month US LIBOR) + 6.15%), | | |
| 6.034%, 3/20/43 | 819,558 | 83,210 |
| Ser. 16-75, Class LI, IO, 6.00%, 1/20/40 | 811,882 | 170,408 |
| IFB Ser. 20-32, Class GS, IO, ((-1 x 1 Month US LIBOR) + 6.10%), | | |
| 5.984%, 3/20/50 | 1,343,141 | 222,308 |
| Ser. 18-21, Class IN, IO, 5.00%, 2/20/48 | 378,432 | 66,578 |
| Ser. 14-76, IO, 5.00%, 5/20/44 | 363,845 | 64,441 |
| Ser. 14-25, Class QI, IO, 5.00%, 1/20/44 | 691,745 | 116,926 |
| Ser. 10-35, Class UI, IO, 5.00%, 3/20/40 | 118,063 | 23,207 |
| Ser. 10-9, Class UI, IO, 5.00%, 1/20/40 | 249,058 | 48,878 |
| Ser. 09-121, Class UI, IO, 5.00%, 12/20/39 | 79,031 | 15,411 |
| Ser. 18-153, Class AI, IO, 4.50%, 9/16/45 | 6,751,908 | 1,175,237 |
| Ser. 15-80, Class IA, IO, 4.50%, 6/20/45 | 888,461 | 158,380 |
| Ser. 18-127, Class IB, IO, 4.50%, 6/20/45 | 202,187 | 20,983 |
| Ser. 13-182, Class IQ, IO, 4.50%, 12/16/43 | 705,496 | 127,197 |
| Ser. 12-91, Class IN, IO, 4.50%, 5/20/42 | 1,178,777 | 211,057 |
| Ser. 10-35, Class AI, IO, 4.50%, 3/20/40 | 541,933 | 49,379 |
| Ser. 10-35, Class QI, IO, 4.50%, 3/20/40 | 401,905 | 70,027 |
| Ser. 16-138, Class GI, IO, 4.00%, 10/20/46 | 4,006,930 | 535,831 |
| Ser. 16-47, Class CI, IO, 4.00%, 9/20/45 | 1,348,041 | 149,498 |
| Ser. 14-116, Class IL, IO, 4.00%, 8/20/44 | 814,169 | 106,549 |
| Ser. 13-24, Class PI, IO, 4.00%, 11/20/42 | 219,381 | 28,241 |
| Ser. 16-83, Class PI, IO, 3.50%, 6/20/45 | 1,773,735 | 247,554 |
| Ser. 13-27, Class PI, IO, 3.50%, 12/20/42 | 191,425 | 21,258 |
| Ser. 12-136, Class BI, IO, 3.50%, 11/20/42 | 789,642 | 127,451 |
| Ser. 14-102, Class IG, IO, 3.50%, 3/16/41 | 525,084 | 34,240 |
| Ser. 15-124, Class NI, IO, 3.50%, 6/20/39 | 343,546 | 9,894 |
| Ser. 16-H16, Class EI, IO, 2.484%, 6/20/66 W | 2,952,738 | 245,373 |
| Ser. 17-H04, Class BI, IO, 2.472%, 2/20/67 W | 2,738,036 | 262,068 |
| Ser. 17-H02, Class BI, IO, 2.457%, 1/20/67 W | 2,976,958 | 272,850 |
| Ser. 16-H20, Class NI, IO, 2.40%, 9/20/66 W | 2,567,413 | 194,482 |
| Ser. 16-H23, Class NI, IO, 2.385%, 10/20/66 W | 3,734,395 | 314,809 |
| Ser. 17-H19, Class MI, IO, 2.065%, 4/20/67 W | 1,766,018 | 156,116 |
| Ser. 16-H13, Class EI, IO, 1.929%, 4/20/66 W | 2,133,949 | 182,698 |
| Ser. 15-H26, Class DI, IO, 1.911%, 10/20/65 W | 2,141,659 | 172,305 |
| Ser. 15-H09, Class AI, IO, 1.758%, 4/20/65 W | 4,382,544 | 298,399 |
| Ser. 15-H26, Class EI, IO, 1.717%, 10/20/65 W | 2,230,867 | 145,453 |
| Ser. 15-H03, Class DI, IO, 1.665%, 1/20/65 W | 3,816,824 | 273,285 |
| Ser. 14-H21, Class AI, IO, 1.659%, 10/20/64 W | 2,360,389 | 168,305 |
| Ser. 16-H01, Class AI, IO, 1.653%, 1/20/66 W | 1,779,212 | 115,247 |
| | |
| | Principal | |
| MORTGAGE-BACKED SECURITIES (35.5%)* cont. | amount | Value |
| Agency collateralized mortgage obligations cont. | | |
| Government National Mortgage Association | | |
| Ser. 15-H25, Class AI, IO, 1.617%, 9/20/65 W | $2,359,302 | $149,580 |
| Ser. 14-H12, Class BI, IO, 1.573%, 5/20/64 W | 2,972,805 | 183,826 |
| Ser. 16-H07, Class HI, IO, 1.495%, 2/20/66 W | 3,004,387 | 240,351 |
| | | 9,213,205 |
| Commercial mortgage-backed securities (19.3%) | | |
| BANK | | |
| Ser. 19-BN24, Class AS, 3.283%, 11/15/62 W | 425,000 | 459,000 |
| Ser. 19-BN23, Class AS, 3.203%, 12/15/52 | 268,000 | 284,640 |
| FRB Ser. 20-BN30, Class XA, IO, 1.446%, 12/15/53 W | 4,992,702 | 483,774 |
| FRB Ser. 19-BN20, Class XA, IO, 0.96%, 9/15/62 W | 9,971,727 | 598,304 |
| Barclays Commercial Mortgage Trust | | |
| Ser. 19-C3, Class B, 4.096%, 5/15/52 | 290,000 | 308,385 |
| Ser. 19-C5, Class AS, 3.366%, 11/15/52 W | 835,000 | 896,119 |
| FRB Ser. 20-C8, Class XA, IO, 1.973%, 10/15/53 W | 4,720,285 | 638,897 |
| Bear Stearns Commercial Mortgage Securities Trust 144A FRB | | |
| Ser. 06-PW14, Class X1, IO, 0.76%, 12/11/38 W | 67,860 | 699 |
| Benchmark Mortgage Trust | | |
| Ser. 18-B8, Class AS, 4.532%, 1/15/52 W | 634,000 | 729,596 |
| Ser. 19-B13, Class AM, 3.183%, 8/15/57 | 242,000 | 257,101 |
| BXMT, Ltd. 144A FRB Ser. 21-FL4, Class A, 1.17%, 5/15/38 | | |
| (Cayman Islands) | 612,000 | 612,379 |
| CD Commercial Mortgage Trust Ser. 17-CD3, Class A4, | | |
| 3.631%, 2/10/50 | 267,000 | 294,061 |
| CFCRE Commercial Mortgage Trust FRB Ser. 17-C8, Class B, | | |
| 4.199%, 6/15/50 W | 427,000 | 463,454 |
| CFCRE Commercial Mortgage Trust 144A FRB Ser. 11-C2, Class E, | | |
| 5.935%, 12/15/47 W | 1,053,000 | 1,029,977 |
| Citigroup Commercial Mortgage Trust | | |
| FRB Ser. 13-GC17, Class C, 5.26%, 11/10/46 W | 256,000 | 262,830 |
| FRB Ser. 18-C6, Class B, 4.907%, 11/10/51 W | 251,000 | 291,173 |
| Ser. 14-GC21, Class AS, 4.026%, 5/10/47 | 694,000 | 748,944 |
| Citigroup Commercial Mortgage Trust 144A | | |
| FRB Ser. 14-GC19, Class D, 5.262%, 3/10/47 W | 185,000 | 194,840 |
| FRB Ser. 06-C5, Class XC, IO, 0.715%, 10/15/49 W | 2,299,318 | 31 |
| COMM Mortgage Trust | | |
| FRB Ser. 13-CR13, Class C, 5.046%, 11/10/46 W | 417,000 | 454,530 |
| FRB Ser. 14-CR17, Class C, 4.944%, 5/10/47 W | 692,000 | 737,923 |
| FRB Ser. 14-CR18, Class C, 4.901%, 7/15/47 W | 393,000 | 403,252 |
| FRB Ser. 14-UBS6, Class C, 4.593%, 12/10/47 W | 110,000 | 115,340 |
| FRB Ser. 15-CR24, Class B, 4.525%, 8/10/48 W | 501,000 | 550,987 |
| FRB Ser. 15-LC19, Class C, 4.376%, 2/10/48 W | 420,000 | 447,768 |
| Ser. 14-CR21, Class B, 4.339%, 12/10/47 W | 433,000 | 466,438 |
| Ser. 14-LC15, Class AM, 4.198%, 4/10/47 | 451,000 | 488,035 |
| Ser. 14-CR19, Class AM, 4.08%, 8/10/47 | 574,000 | 622,459 |
| Ser. 15-CR27, Class AM, 3.984%, 10/10/48 | 284,000 | 312,325 |
| Ser. 17-COR2, Class AM, 3.803%, 9/10/50 | 353,000 | 389,843 |
| Ser. 16-COR1, Class AM, 3.494%, 10/10/49 | 439,000 | 475,322 |
| FRB Ser. 14-UBS6, Class XA, IO, 1.034%, 12/10/47 W | 8,774,405 | 211,946 |
| FRB Ser. 15-LC21, Class XA, IO, 0.83%, 7/10/48 W | 10,509,202 | 260,664 |
| | |
| | Principal | |
| MORTGAGE-BACKED SECURITIES (35.5%)* cont. | amount | Value |
| Commercial mortgage-backed securities cont. | | |
| COMM Mortgage Trust 144A | | |
| FRB Ser. 13-CR11, Class C, 5.285%, 8/10/50 W | $525,000 | $538,443 |
| FRB Ser. 12-CR2, Class D, 4.992%, 8/15/45 W | 400,000 | 375,586 |
| Credit Suisse Commercial Mortgage Trust 144A | | |
| FRB Ser. 06-C4, Class AX, IO, 1.002%, 9/15/39 W | 7,248 | — |
| FRB Ser. 07-C2, Class AX, IO, 0.049%, 1/15/49 W | 653,633 | — |
| Credit Suisse First Boston Mortgage Securities Corp. 144A FRB | | |
| Ser. 03-C3, Class AX, IO, 2.267%, 5/15/38 W | 5,498 | 42 |
| CSAIL Commercial Mortgage Trust | | |
| FRB Ser. 15-C1, Class C, 4.405%, 4/15/50 W | 819,000 | 790,941 |
| Ser. 19-C15, Class A4, 4.053%, 3/15/52 | 819,000 | 927,150 |
| Ser. 19-C17, Class AS, 3.278%, 9/15/52 | 596,000 | 631,743 |
| CSMC Trust FRB Ser. 16-NXSR, Class C, 4.506%, 12/15/49 W | 822,000 | 710,136 |
| DBUBS Mortgage Trust 144A | | |
| FRB Ser. 11-LC3A, Class D, 5.517%, 8/10/44 W | 1,164,000 | 1,141,133 |
| Ser. 11-LC2A, Class B, 4.998%, 7/10/44 W | 329,000 | 328,802 |
| Federal Home Loan Mortgage Corporation | | |
| Multifamily Structured Pass-Through Certificates FRB Ser. K113, | | |
| Class XAM, IO, 1.693%, 6/25/30 W | 2,243,000 | 280,137 |
| Multifamily Structured Pass-Through Certificates FRB Ser. K111, | | |
| Class X1, IO, 1.681%, 5/25/30 W | 2,252,615 | 274,796 |
| Multifamily Structured Pass-Through Certificates FRB Ser. K105, | | |
| Class X1, IO, 1.645%, 1/25/30 W | 2,316,318 | 267,007 |
| Multifamily Structured Pass-Through Certificates FRB Ser. K104, | | |
| Class XAM, IO, 1.505%, 1/25/30 W | 3,017,000 | 330,249 |
| Multifamily Structured Pass-Through Certificates FRB Ser. K113, | | |
| Class X1, IO, 1.49%, 6/25/30 W | 3,028,889 | 321,574 |
| Multifamily Structured Pass-Through Certificates FRB Ser. K098, | | |
| Class X1, IO, 1.269%, 8/25/29 W | 2,803,221 | 233,483 |
| Multifamily Structured Pass-Through Certificates FRB Ser. K118, | | |
| Class X1, IO, 1.055%, 9/25/30 W | 4,597,483 | 354,868 |
| Multifamily Structured Pass-Through Certificates FRB Ser. K123, | | |
| Class X1, IO, 0.866%, 12/25/30 W | 4,692,534 | 297,244 |
| Multifamily Structured Pass-Through Certificates FRB Ser. K125, | | |
| Class X1, IO, 0.678%, 1/25/31 W | 6,259,021 | 292,515 |
| Multifamily Structured Pass-Through Certificates FRB Ser. K087, | | |
| Class X1, IO, 0.51%, 12/25/28 W | 13,534,840 | 362,279 |
| GS Mortgage Securities Corp., II FRB Ser. 13-GC10, Class XA, IO, | | |
| 1.631%, 2/10/46 W | 6,977,110 | 149,422 |
| GS Mortgage Securities Trust | | |
| FRB Ser. 12-GCJ7, Class C, 5.806%, 5/10/45 W | 273,000 | 283,920 |
| Ser. 17-GS7, Class AS, 3.663%, 8/10/50 | 354,000 | 383,028 |
| FRB Ser. 20-GC47, Class C, 3.57%, 5/12/53 W | 418,000 | 428,169 |
| Ser. 19-GC40, Class AS, 3.412%, 7/10/52 | 542,000 | 582,921 |
| Ser. 19-GC42, Class AS, 3.212%, 9/1/52 | 368,000 | 389,822 |
| Ser. 16-GS3, Class A4, 2.85%, 10/10/49 | 452,000 | 484,408 |
| GS Mortgage Securities Trust 144A | | |
| FRB Ser. 10-C1, Class D, 6.183%, 8/10/43 W | 428,000 | 212,115 |
| FRB Ser. 11-GC3, Class D, 5.558%, 3/10/44 W | 180,000 | 180,195 |
| Ser. 12-GC6, Class AS, 4.948%, 1/12/45 | 236,000 | 240,264 |
| FRB Ser. 13-GC14, Class B, 4.90%, 8/10/46 W | 282,000 | 301,632 |
| | |
| | Principal | |
| MORTGAGE-BACKED SECURITIES (35.5%)* cont. | amount | Value |
| Commercial mortgage-backed securities cont. | | |
| JPMBB Commercial Mortgage Securities Trust | | |
| FRB Ser. 14-C19, Class C, 4.831%, 4/15/47 W | $777,000 | $819,894 |
| FRB Ser. 14-C22, Class C, 4.705%, 9/15/47 W | 225,000 | 211,139 |
| FRB Ser. 13-C12, Class B, 4.236%, 7/15/45 W | 285,000 | 295,054 |
| Ser. 15-C29, Class B, 4.118%, 5/15/48 W | 586,000 | 629,095 |
| FRB Ser. 15-C33, Class XA, IO, 1.06%, 12/15/48 W | 3,406,636 | 124,140 |
| FRB Ser. 14-C22, Class XA, IO, 0.98%, 9/15/47 W | 9,496,833 | 224,620 |
| FRB Ser. 13-C12, Class XA, IO, 0.574%, 7/15/45 W | 19,995,427 | 145,867 |
| JPMBB Commercial Mortgage Securities Trust 144A | | |
| FRB Ser. 13-C17, Class D, 5.051%, 1/15/47 W | 505,000 | 505,935 |
| FRB Ser. 14-C23, Class D, 4.12%, 9/15/47 W | 437,000 | 440,011 |
| JPMorgan Chase Commercial Mortgage Securities Trust | | |
| Ser. 12-C6, Class AS, 4.117%, 5/15/45 | 264,000 | 270,706 |
| Ser. 19-COR5, Class AS, 3.669%, 6/13/52 | 804,000 | 876,962 |
| Ser. 13-C10, Class AS, 3.372%, 12/15/47 | 259,000 | 265,801 |
| Ser. 13-LC11, Class AS, 3.216%, 4/15/46 | 339,000 | 352,458 |
| FRB Ser. 19-COR5, Class XA, IO, 1.655%, 6/13/52 W | 8,389,198 | 771,937 |
| FRB Ser. 06-CB17, Class X, IO, 1.144%, 12/12/43 W | 256,841 | 5,017 |
| FRB Ser. 13-C16, Class XA, IO, 1.081%, 12/15/46 W | 8,662,229 | 170,317 |
| FRB Ser. 07-LDPX, Class X, IO, 0.581%, 1/15/49 W | 57,866 | 1 |
| FRB Ser. 06-LDP8, Class X, IO, 0.284%, 5/15/45 W | 358,260 | 3 |
| JPMorgan Chase Commercial Mortgage Securities Trust 144A | | |
| FRB Ser. 10-C2, Class C2, 5.874%, 11/15/43 W | 237,000 | 228,705 |
| FRB Ser. 12-C6, Class E, 5.313%, 5/15/45 W | 1,313,000 | 643,370 |
| FRB Ser. 12-C8, Class D, 4.825%, 10/15/45 W | 747,000 | 657,332 |
| LB-UBS Commercial Mortgage Trust FRB Ser. 07-C2, Class XW, IO, | | |
| 0.336%, 2/15/40 W | 17,869 | 1 |
| LB-UBS Commercial Mortgage Trust 144A | | |
| FRB Ser. 06-C6, Class XCL, IO, 0.777%, 9/15/39 W | 1,162,626 | 2,149 |
| FRB Ser. 07-C2, Class XCL, IO, 0.336%, 2/15/40 W | 114,523 | 5 |
| Mezz Cap Commercial Mortgage Trust 144A FRB Ser. 07-C5, Class X, | | |
| IO, 7.004%, 12/15/49 W | 1,175 | — |
| Morgan Stanley Bank of America Merrill Lynch Trust | | |
| FRB Ser. 14-C14, Class C, 5.218%, 2/15/47 W | 220,000 | 236,365 |
| Ser. 14-C18, Class C, 4.676%, 10/15/47 W | 289,000 | 308,363 |
| FRB Ser. 14-C17, Class C, 4.636%, 8/15/47 W | 591,000 | 590,918 |
| FRB Ser. 15-C24, Class B, 4.487%, 5/15/48 W | 253,000 | 276,970 |
| Ser. 13-C8, Class B, 3.694%, 12/15/48 W | 389,000 | 401,402 |
| Morgan Stanley Bank of America Merrill Lynch Trust 144A | | |
| FRB Ser. 12-C5, Class E, 4.819%, 8/15/45 W | 687,000 | 696,380 |
| FRB Ser. 12-C6, Class D, 4.759%, 11/15/45 W | 278,000 | 275,738 |
| FRB Ser. 13-C9, Class D, 4.248%, 5/15/46 W | 274,000 | 249,340 |
| Morgan Stanley Capital I Trust | | |
| Ser. 07-HQ11, Class C, 5.558%, 2/12/44 W | 74,034 | 7,403 |
| Ser. 16-BNK2, Class AS, 3.282%, 11/15/49 | 464,000 | 496,002 |
| Morgan Stanley Capital I Trust 144A | | |
| FRB Ser. 11-C3, Class B, 5.434%, 7/15/49 W | 541,000 | 543,244 |
| FRB Ser. 11-C3, Class D, 5.434%, 7/15/49 W | 185,000 | 178,732 |
| | |
| | Principal | |
| MORTGAGE-BACKED SECURITIES (35.5%)* cont. | amount | Value |
| Commercial mortgage-backed securities cont. | | |
| Multifamily Connecticut Avenue Securities Trust 144A FRB | | |
| Ser. 19-01, Class M7, 1.806%, 10/15/49 | $442,179 | $440,029 |
| UBS Commercial Mortgage Trust FRB Ser. 17-C7, Class XA, IO, | | |
| 1.18%, 12/15/50 W | 4,766,831 | 240,712 |
| UBS Commercial Mortgage Trust 144A FRB Ser. 12-C1, Class C, | | |
| 5.754%, 5/10/45 W | 285,000 | 289,418 |
| UBS-Barclays Commercial Mortgage Trust 144A FRB Ser. 12-C4, | | |
| Class XA, IO, 1.746%, 12/10/45 W | 2,403,038 | 39,140 |
| Wells Fargo Commercial Mortgage Trust | | |
| FRB Ser. 15-C30, Class C, 4.648%, 9/15/58 W | 432,000 | 471,842 |
| Ser. 18-C46, Class B, 4.633%, 8/15/51 | 226,000 | 258,661 |
| Ser. 17-RC1, Class C, 4.591%, 1/15/60 | 383,000 | 422,529 |
| FRB Ser. 13-LC12, Class C, 4.405%, 7/15/46 W | 363,000 | 316,166 |
| FRB Ser. 15-C29, Class C, 4.354%, 6/15/48 W | 287,000 | 312,830 |
| Ser. 19-C49, Class AS, 4.244%, 3/15/52 | 354,000 | 403,544 |
| Ser. 18-C45, Class A4, 4.184%, 6/15/51 | 366,000 | 416,703 |
| FRB Ser. 20-C57, Class C, 4.158%, 8/15/53 W | 481,000 | 516,572 |
| FRB Ser. 16-LC25, Class AS, 4.094%, 12/15/59 W | 504,000 | 556,563 |
| Ser. 16-BNK1, Class AS, 2.814%, 8/15/49 | 663,000 | 682,338 |
| FRB Ser. 19-C52, Class XA, IO, 1.762%, 8/15/52 W | 3,635,845 | 373,550 |
| FRB Ser. 16-LC25, Class XA, IO, 1.111%, 12/15/59 W | 4,747,030 | 180,368 |
| WF-RBS Commercial Mortgage Trust | | |
| Ser. 14-C19, Class B, 4.723%, 3/15/47 W | 899,000 | 948,993 |
| Ser. 13-C18, Class AS, 4.387%, 12/15/46 W | 826,000 | 885,274 |
| Ser. 13-UBS1, Class AS, 4.306%, 3/15/46 W | 525,000 | 555,571 |
| Ser. 14-C22, Class AS, 4.069%, 9/15/57 W | 397,000 | 431,597 |
| Ser. 13-C12, Class AS, 3.56%, 3/15/48 | 348,000 | 363,719 |
| Ser. 13-C11, Class AS, 3.311%, 3/15/45 | 386,000 | 399,113 |
| FRB Ser. 13-C14, Class XA, IO, 0.848%, 6/15/46 W | 11,899,383 | 129,019 |
| WF-RBS Commercial Mortgage Trust 144A | | |
| Ser. 11-C4, Class E, 5.317%, 6/15/44 W | 163,000 | 114,237 |
| FRB Ser. 11-C4, Class C, 5.317%, 6/15/44 W | 292,000 | 290,521 |
| FRB Ser. 12-C10, Class D, 4.574%, 12/15/45 W | 298,000 | 165,983 |
| FRB Ser. 12-C10, Class XA, IO, 1.665%, 12/15/45 W | 3,486,205 | 60,329 |
| | | 48,751,757 |
| Residential mortgage-backed securities (non-agency) (12.5%) | | |
| American Home Mortgage Investment Trust FRB Ser. 07-1, | | |
| Class GA1C, (1 Month US LIBOR + 0.19%), 0.296%, 5/25/47 | 295,637 | 165,636 |
| Arroyo Mortgage Trust 144A Ser. 19-3, Class A3, 3.416%, 10/25/48 W | 226,135 | 230,382 |
| BankUnited Trust FRB Ser. 05-1, Class 1A1, (1 Month US LIBOR | | |
| + 0.60%), 0.706%, 9/25/45 | 151,116 | 144,261 |
| Bellemeade Re, Ltd. 144A | | |
| FRB Ser. 19-4A, Class M1C, (1 Month US LIBOR + 2.50%), 2.606%, | | |
| 10/25/29 (Bermuda) | 190,000 | 190,394 |
| FRB Ser. 20-2A, Class M1A, (1 Month US LIBOR + 2.30%), 2.406%, | | |
| 8/26/30 (Bermuda) | 90,990 | 91,254 |
| BRAVO Residential Funding Trust 144A | | |
| Ser. 19-NQM1, Class A3, 2.996%, 7/25/59 W | 136,017 | 138,131 |
| Ser. 21-A, Class A1, 1.991%, 10/25/59 | 287,333 | 287,333 |
| | |
| | Principal | |
| MORTGAGE-BACKED SECURITIES (35.5%)* cont. | amount | Value |
| Residential mortgage-backed securities (non-agency) cont. | | |
| Carrington Mortgage Loan Trust FRB Ser. 06-NC2, Class A4, | | |
| (1 Month US LIBOR + 0.24%), 0.346%, 6/25/36 | $180,000 | $174,208 |
| Chevy Chase Funding, LLC Mortgage-Backed Certificates | | |
| 144A FRB Ser. 06-4A, Class A2, (1 Month US LIBOR + 0.18%), | | |
| 0.286%, 11/25/47 | 277,409 | 220,082 |
| Citigroup Mortgage Loan Trust, Inc. FRB Ser. 05-2, Class 1A2A, | | |
| 2.80%, 5/25/35 W | 191,231 | 198,629 |
| COLT Mortgage Loan Trust 144A Ser. 20-2, Class A2, | | |
| 3.094%, 3/25/65 W | 665,000 | 686,147 |
| Countrywide Alternative Loan Trust | | |
| FRB Ser. 06-OA10, Class 1A1, (1 Month US LIBOR + 0.96%), | | |
| 1.102%, 8/25/46 | 151,048 | 145,115 |
| FRB Ser. 06-OA7, Class 1A2, (1 Month US LIBOR + 0.94%), | | |
| 1.082%, 6/25/46 | 343,031 | 313,015 |
| FRB Ser. 06-OA10, Class 4A1, (1 Month US LIBOR + 0.38%), | | |
| 0.486%, 8/25/46 | 351,108 | 310,963 |
| FRB Ser. 06-OA19, Class A1, (1 Month US LIBOR + 0.18%), | | |
| 0.296%, 2/20/47 | 210,663 | 164,662 |
| Eagle Re, Ltd. 144A FRB Ser. 18-1, Class M1, (1 Month US LIBOR | | |
| + 1.70%), 1.806%, 11/25/28 (Bermuda) | 258,096 | 258,930 |
| Federal Home Loan Mortgage Corporation | | |
| Structured Agency Credit Risk Debt FRN Ser. 16-DNA3, Class M3, | | |
| (1 Month US LIBOR + 5.00%), 5.106%, 12/25/28 | 848,421 | 898,297 |
| Structured Agency Credit Risk Debt FRN Ser. 15-HQA2, Class M3, | | |
| (1 Month US LIBOR + 4.80%), 4.906%, 5/25/28 | 263,356 | 273,272 |
| Structured Agency Credit Risk Debt FRN Ser. 14-HQ3, Class M3, | | |
| (1 Month US LIBOR + 4.75%), 4.856%, 10/25/24 | 74,360 | 75,138 |
| Structured Agency Credit Risk Debt FRN Ser. 15-DNA3, Class M3, | | |
| (1 Month US LIBOR + 4.70%), 4.806%, 4/25/28 | 949,823 | 984,555 |
| Structured Agency Credit Risk Debt FRN Ser. 16-DNA2, Class M3, | | |
| (1 Month US LIBOR + 4.65%), 4.756%, 10/25/28 | 1,416,539 | 1,484,475 |
| Structured Agency Credit Risk Debt FRN Ser. 16-HQA3, Class M3, | | |
| (1 Month US LIBOR + 3.85%), 3.956%, 3/25/29 | 500,000 | 518,945 |
| Structured Agency Credit Risk Debt FRN Ser. 16-DNA4, Class M3, | | |
| (1 Month US LIBOR + 3.80%), 3.906%, 3/25/29 | 235,623 | 245,270 |
| Structured Agency Credit Risk Debt FRN Ser. 14-HQ2, Class M3, | | |
| (1 Month US LIBOR + 3.75%), 3.856%, 9/25/24 | 196,177 | 201,483 |
| Structured Agency Credit Risk Debt FRN Ser. 17-DNA2, Class M2, | | |
| (1 Month US LIBOR + 3.45%), 3.556%, 10/25/29 | 282,000 | 292,784 |
| Structured Agency Credit Risk Debt FRN Ser. 17-DNA3, Class M2, | | |
| (1 Month US LIBOR + 2.50%), 2.606%, 3/25/30 | 250,000 | 255,580 |
| Structured Agency Credit Risk Debt FRN Ser. 17-DNA3, Class M2B, | | |
| (1 Month US LIBOR + 2.50%), 2.606%, 3/25/30 | 639,000 | 652,574 |
| Structured Agency Credit Risk Debt FRN Ser. 17-DNA2, Class M1, | | |
| (1 Month US LIBOR + 1.20%), 1.306%, 10/25/29 | 70,289 | 70,384 |
| Federal Home Loan Mortgage Corporation 144A | | |
| Structured Agency Credit Risk Trust FRB Ser. 19-DNA1, Class M2, | | |
| (1 Month US LIBOR + 2.65%), 2.756%, 1/25/49 | 56,748 | 57,854 |
| Structured Agency Credit Risk Trust FRB Ser. 19-DNA2, Class M2, | | |
| (1 Month US LIBOR + 2.45%), 2.556%, 3/25/49 | 5,574 | 5,668 |
| Structured Agency Credit Risk Trust FRB Ser. 18-HRP2, Class M3, | | |
| (1 Month US LIBOR + 2.40%), 2.506%, 2/25/47 | 130,000 | 131,851 |
| | |
| | Principal | |
| MORTGAGE-BACKED SECURITIES (35.5%)* cont. | amount | Value |
| Residential mortgage-backed securities (non-agency) cont. | | |
| Federal Home Loan Mortgage Corporation 144A | | |
| Structured Agency Credit Risk Trust FRB Ser. 19-HQA1, Class M2, | | |
| (1 Month US LIBOR + 2.35%), 2.456%, 2/25/49 | $10,859 | $10,990 |
| Structured Agency Credit Risk Trust FRB Ser. 18-HQA2, Class M2, | | |
| (1 Month US LIBOR + 2.30%), 2.406%, 10/25/48 | 11,800 | 11,970 |
| Structured Agency Credit Risk Trust REMICs FRB Ser. 20-HQA1, | | |
| Class M2, (1 Month US LIBOR + 1.90%), 2.006%, 1/25/50 | 201,066 | 201,967 |
| Structured Agency Credit Risk Trust REMICs FRB Ser. 20-HQA4, | | |
| Class M1, (1 Month US LIBOR + 1.30%), 1.406%, 9/25/50 | 7,865 | 7,865 |
| Structured Agency Credit Risk Trust REMICs FRB Ser. 20-DNA5, | | |
| Class M1, (US 30 Day Average SOFR + 1.30%), 1.31%, 10/25/50 | 15,212 | 15,212 |
| Federal National Mortgage Association | | |
| Connecticut Avenue Securities FRB Ser. 16-C01, Class 1M2, | | |
| (1 Month US LIBOR + 6.75%), 6.856%, 8/25/28 | 74,368 | 78,935 |
| Connecticut Avenue Securities FRB Ser. 16-C02, Class 1M2, | | |
| (1 Month US LIBOR + 6.00%), 6.106%, 9/25/28 | 467,337 | 493,541 |
| Connecticut Avenue Securities FRB Ser. 16-C03, Class 2M2, | | |
| (1 Month US LIBOR + 5.90%), 6.006%, 10/25/28 | 60,559 | 63,824 |
| Connecticut Avenue Securities FRB Ser. 15-C04, Class 1M2, | | |
| (1 Month US LIBOR + 5.70%), 5.806%, 4/25/28 | 278,388 | 295,151 |
| Connecticut Avenue Securities FRB Ser. 15-C04, Class 2M2, | | |
| (1 Month US LIBOR + 5.55%), 5.656%, 4/25/28 | 683,970 | 721,133 |
| Connecticut Avenue Securities FRB Ser. 16-C03, Class 1M2, | | |
| (1 Month US LIBOR + 5.30%), 5.406%, 10/25/28 | 339,206 | 356,885 |
| Connecticut Avenue Securities FRB Ser. 15-C03, Class 2M2, | | |
| (1 Month US LIBOR + 5.00%), 5.106%, 7/25/25 | 1,996,154 | 2,021,432 |
| Connecticut Avenue Securities FRB Ser. 14-C04, Class 2M2, | | |
| (1 Month US LIBOR + 5.00%), 5.106%, 11/25/24 | 64,843 | 66,389 |
| Connecticut Avenue Securities FRB Ser. 16-C05, Class 2M2, | | |
| (1 Month US LIBOR + 4.45%), 4.556%, 1/25/29 | 549,551 | 573,372 |
| Connecticut Avenue Securities FRB Ser. 16-C07, Class 2M2, | | |
| (1 Month US LIBOR + 4.35%), 4.456%, 5/25/29 | 692,557 | 720,939 |
| Connecticut Avenue Securities FRB Ser. 15-C01, Class 1M2, | | |
| (1 Month US LIBOR + 4.30%), 4.406%, 2/25/25 | 134,833 | 137,921 |
| Connecticut Avenue Securities FRB Ser. 16-C06, Class 1M2, | | |
| (1 Month US LIBOR + 4.25%), 4.356%, 4/25/29 | 1,896,912 | 1,976,109 |
| Connecticut Avenue Securities FRB Ser. 16-C04, Class 1M2, | | |
| (1 Month US LIBOR + 4.25%), 4.356%, 1/25/29 | 2,462,681 | 2,580,827 |
| Connecticut Avenue Securities FRB Ser. 15-C02, Class 1M2, | | |
| (1 Month US LIBOR + 4.00%), 4.106%, 5/25/25 | 58,618 | 59,564 |
| Connecticut Avenue Securities FRB Ser. 15-C02, Class 2M2, | | |
| (1 Month US LIBOR + 4.00%), 4.106%, 5/25/25 | 98,622 | 99,872 |
| Connecticut Avenue Securities FRB Ser. 17-C01, Class 1M2, | | |
| (1 Month US LIBOR + 3.55%), 3.656%, 7/25/29 | 1,175,904 | 1,215,393 |
| Connecticut Avenue Securities FRB Ser. 14-C03, Class 2M2, | | |
| (1 Month US LIBOR + 2.90%), 3.006%, 7/25/24 | 799,376 | 809,292 |
| Connecticut Avenue Securities FRB Ser. 18-C05, Class 1M2, | | |
| (1 Month US LIBOR + 2.35%), 2.456%, 1/25/31 | 60,768 | 61,604 |
| Connecticut Avenue Securities FRB Ser. 17-C05, Class 1M2A, | | |
| (1 Month US LIBOR + 2.20%), 2.306%, 1/25/30 | 82,071 | 82,327 |
| Connecticut Avenue Securities FRB Ser. 17-C02, Class 2ED3, | | |
| (1 Month US LIBOR + 1.35%), 1.456%, 9/25/29 | 243,727 | 244,794 |
| | |
| | Principal | |
| MORTGAGE-BACKED SECURITIES (35.5%)* cont. | amount | Value |
| Residential mortgage-backed securities (non-agency) cont. | | |
| Federal National Mortgage Association | | |
| Connecticut Avenue Securities FRB Ser. 17-C01, Class 1EB1, | | |
| (1 Month US LIBOR + 1.25%), 1.356%, 7/25/29 | $230,000 | $230,036 |
| Connecticut Avenue Securities FRB Ser. 17-C07, Class 1EB2, | | |
| (1 Month US LIBOR + 1.00%), 1.106%, 5/25/30 | 603,000 | 602,117 |
| Federal National Mortgage Association 144A | | |
| Connecticut Avenue Securities Trust FRB Ser. 19-R01, Class 2M2, | | |
| (1 Month US LIBOR + 2.45%), 2.556%, 7/25/31 | 43,963 | 44,211 |
| Connecticut Avenue Securities Trust FRB Ser. 19-HRP1, Class M2, | | |
| (1 Month US LIBOR + 2.15%), 2.256%, 11/25/39 | 61,093 | 60,194 |
| Connecticut Avenue Securities Trust FRB Ser. 20-R01, Class 1M2, | | |
| (1 Month US LIBOR + 2.05%), 2.156%, 1/25/40 | 1,646,072 | 1,656,586 |
| GCAT Trust 144A Ser. 20-NQM2, Class A2, 2.272%, 4/25/65 | 162,998 | 165,540 |
| GSAA Home Equity Trust Ser. 06-15, Class AF3A, 5.882%, 9/25/36 W | 1,018,873 | 468,002 |
| Home Re, Ltd. 144A FRB Ser. 18-1, Class M1, (1 Month US LIBOR | | |
| + 1.60%), 1.706%, 10/25/28 (Bermuda) | 87,005 | 87,004 |
| Homeward Opportunities Fund I Trust 144A Ser. 20-2, Class A2, | | |
| 2.635%, 5/25/65 W | 200,000 | 206,202 |
| JP Morgan Alternative Loan Trust FRB Ser. 07-S1, Class A1, (1 Month | | |
| US LIBOR + 0.28%), 0.386%, 4/25/47 | 258,472 | 252,657 |
| Legacy Mortgage Asset Trust 144A | | |
| Ser. 20-GS5, Class A1, 3.25%, 6/25/60 | 278,365 | 283,236 |
| FRB Ser. 19-GS7, Class A1, 3.25%, 11/25/59 | 361,649 | 364,181 |
| FRB Ser. 20-GS1, Class A1, 2.882%, 10/25/59 | 693,391 | 698,938 |
| Merrill Lynch Mortgage Investors Trust FRB Ser. 05-A2, Class A2, | | |
| 2.783%, 2/25/35 W | 105,882 | 109,754 |
| Morgan Stanley Resecuritization Trust 144A Ser. 15-R4, Class CB1, | | |
| 0.934%, 8/26/47 W | 170,000 | 163,532 |
| New Residential Mortgage Loan Trust 144A FRB Ser. 18-4A, | | |
| Class A1M, (1 Month US LIBOR + 0.90%), 1.006%, 1/25/48 | 93,836 | 94,625 |
| OSW Structured Asset Trust 144A FRB Ser. 20-RPL1, Class A1, | | |
| 3.199%, 12/26/59 | 303,942 | 305,935 |
| Pretium Mortgage Credit Partners, LLC 144A Ser. 20-RPL2, | | |
| Class A1, 3.179%, 6/27/69 | 239,342 | 240,047 |
| Renaissance Home Equity Loan Trust FRB Ser. 03-4, Class A1, | | |
| (1 Month US LIBOR + 1.04%), 1.146%, 3/25/34 | 177,367 | 175,088 |
| Structured Asset Mortgage Investments II Trust | | |
| FRB Ser. 07-AR7, Class 1A1, (1 Month US LIBOR + 0.85%), | | |
| 0.956%, 5/25/47 | 360,726 | 301,306 |
| FRB Ser. 07-AR1, Class 2A1, (1 Month US LIBOR + 0.18%), | | |
| 0.286%, 1/25/37 | 188,022 | 179,183 |
| Triangle Re, Ltd. 144A FRB Ser. 21-1, Class M1B, (1 Month US LIBOR | | |
| + 3.00%), 3.106%, 8/25/33 (Bermuda) | 250,000 | 250,339 |
| Vista Point Securitization Trust 144A FRB Ser. 20-2, Class A2, | | |
| 1.986%, 4/25/65 W | 217,741 | 220,470 |
| WaMu Mortgage Pass-Through Certificates Trust | | |
| FRB Ser. 05-AR10, Class 1A3, 3.09%, 9/25/35 W | 126,686 | 127,660 |
| FRB Ser. 05-AR12, Class 1A8, 2.896%, 10/25/35 W | 400,806 | 397,218 |
| FRB Ser. 05-AR13, Class A1C3, (1 Month US LIBOR + 0.98%), | | |
| 1.086%, 10/25/45 | 186,768 | 185,684 |
| | |
| | Principal | |
| MORTGAGE-BACKED SECURITIES (35.5%)* cont. | amount | Value |
| Residential mortgage-backed securities (non-agency) cont. | | |
| WaMu Mortgage Pass-Through Certificates Trust | | |
| FRB Ser. 05-AR9, Class A1C3, (1 Month US LIBOR + 0.96%), | | |
| 1.066%, 7/25/45 | $281,094 | $267,489 |
| FRB Ser. 05-AR1, Class A1B, (1 Month US LIBOR + 0.78%), | | |
| 0.886%, 1/25/45 | 163,162 | 157,956 |
| FRB Ser. 05-AR2, Class 2A1B, (1 Month US LIBOR + 0.74%), | | |
| 0.846%, 1/25/45 | 257,030 | 249,165 |
| Wells Fargo Mortgage Backed Securities Trust FRB Ser. 06-AR5, | | |
| Class 1A1, 2.62%, 4/25/36 W | 97,801 | 98,268 |
| | | 31,417,203 |
| Total mortgage-backed securities (cost $92,579,513) | | $89,382,165 |
| | | |
| FOREIGN GOVERNMENT AND AGENCY | | Principal | |
| BONDS AND NOTES (34.3%)* | | amount | Value |
| Australia (Government of) sr. unsec. bonds 3.00%, | | | |
| 3/21/47 (Australia) | AUD | 120,000 | $99,139 |
| Australia (Government of) sr. unsec. bonds Ser. 133, 5.50%, | | | |
| 4/21/23 (Australia) | AUD | 50,000 | 42,614 |
| Australia (Government of) sr. unsec. bonds Ser. 144, 3.75%, | | | |
| 4/21/37 (Australia) | AUD | 350,000 | 325,966 |
| Australia (Government of) sr. unsec. bonds Ser. 149, 2.25%, | | | |
| 5/21/28 (Australia) | AUD | 1,440,000 | 1,188,387 |
| Austria (Republic of) sr. unsec. bonds 1.50%, 2/20/47 (Austria) | EUR | 290,000 | 424,711 |
| Austria (Republic of) sr. unsec. notes 0.50%, 4/20/27 (Austria) | EUR | 570,000 | 720,861 |
| Bahrain (Kingdom of) sr. unsec. bonds Ser. REGS, 5.25%, | | | |
| 1/25/33 (Bahrain) | | $460,000 | 447,332 |
| Belgium (Kingdom of) sr. unsec. bonds Ser. 77, 1.00%, | | | |
| 6/22/26 (Belgium) | EUR | 900,000 | 1,162,203 |
| Belgium (Kingdom of) unsec. bonds Ser. 60, 4.25%, | | | |
| 3/28/41 (Belgium) | EUR | 470,000 | 944,041 |
| Canada (Government of) sr. unsec. bonds 3.50%, 12/1/45 (Canada) | CAD | 260,000 | 271,987 |
| Canada (Government of) unsec. notes 1.50%, 6/1/26 (Canada) | CAD | 90,000 | 75,157 |
| Chile (Republic of) sr. unsec. bonds 2.45%, 1/31/31 (Chile) | | $750,000 | 763,125 |
| China (Republic of) unsec. notes Ser. 1913, 2.94%, 10/17/24 (China) | CNY | 6,000,000 | 929,954 |
| Colombia (Republic of) sr. unsec. notes 3.875%, | | | |
| 4/25/27 (Colombia) | | $940,000 | 1,001,455 |
| Denmark (Kingdom of) unsec. bonds 4.50%, 11/15/39 (Denmark) | DKK | 750,000 | 212,761 |
| Denmark (Kingdom of) unsec. bonds 1.75%, 11/15/25 (Denmark) | DKK | 1,470,000 | 260,994 |
| Dominican (Republic of) sr. unsec. unsub. bonds Ser. REGS, 6.50%, | | | |
| 2/15/48 (Dominican Republic) | | $189,000 | 207,900 |
| Dominican (Republic of) sr. unsec. unsub. notes Ser. REGS, 8.625%, | | | |
| 4/20/27 (Dominican Republic) | | 218,000 | 266,505 |
| Dominican (Republic of) sr. unsec. unsub. notes Ser. REGS, 6.875%, | | | |
| 1/29/26 (Dominican Republic) | | 255,000 | 296,756 |
| Dominican (Republic of) sr. unsec. unsub. notes Ser. REGS, 5.95%, | | | |
| 1/25/27 (Dominican Republic) | | 459,000 | 519,818 |
| Finland (Government of) sr. unsec. bonds Ser. REGS, 1.125%, | | | |
| 4/15/34 (Finland) | EUR | 260,000 | 349,417 |
| France (Government of) unsec. bonds 4.50%, 4/25/41 (France) | EUR | 830,000 | 1,729,952 |
| France (Government of) unsec. bonds 4.00%, 4/25/55 (France) | EUR | 240,000 | 543,436 |
| France (Government of) unsec. bonds 3.25%, 5/25/45 (France) | EUR | 200,000 | 373,010 |
| | | |
| FOREIGN GOVERNMENT AND AGENCY | | Principal | |
| BONDS AND NOTES (34.3%)* cont. | | amount | Value |
| France (Government of) unsec. bonds 3.25%, 10/25/21 (France) | EUR | 5,300,000 | $6,489,613 |
| France (Government of) unsec. bonds 2.75%, 10/25/27 (France) | EUR | 1,430,000 | 2,060,138 |
| France (Government of) unsec. bonds 0.50%, 5/25/25 (France) | EUR | 1,780,000 | 2,228,173 |
| France (Government of) unsec. notes zero %, 2/25/23 (France) | EUR | 710,000 | 863,755 |
| France (Government of) unsec. notes Ser. REGS, 0.50%, | | | |
| 5/25/29 (France) | EUR | 470,000 | 591,898 |
| Indonesia (Republic of) sr. unsec. unsub. bonds 2.85%, | | | |
| 2/14/30 (Indonesia) | | $200,000 | 205,966 |
| Indonesia (Republic of) sr. unsec. unsub. notes 3.85%, | | | |
| 10/15/30 (Indonesia) | | 710,000 | 786,651 |
| Indonesia (Republic of) 144A sr. unsec. unsub. notes 3.375%, | | | |
| 4/15/23 (Indonesia) | | 1,235,000 | 1,298,286 |
| Ireland (Republic of) unsec. bonds 2.00%, 2/18/45 (Ireland) | EUR | 90,000 | 138,077 |
| Ireland (Republic of) unsec. notes 0.20%, 5/15/27 (Ireland) | EUR | 410,000 | 507,119 |
| Italy (Republic of) sr. unsec. bonds 6.50%, 11/1/27 (Italy) | EUR | 850,000 | 1,417,646 |
| Italy (Republic of) sr. unsec. bonds 4.75%, 9/1/44 (Italy) | EUR | 700,000 | 1,330,078 |
| Italy (Republic of) sr. unsec. bonds 4.00%, 2/1/37 (Italy) | EUR | 190,000 | 312,547 |
| Italy (Republic of) sr. unsec. bonds 2.50%, 12/1/24 (Italy) | EUR | 1,060,000 | 1,390,386 |
| Italy (Republic of) sr. unsec. bonds 1.70%, 9/1/51 (Italy) | EUR | 60,000 | 68,534 |
| Italy (Republic of) sr. unsec. bonds 1.65%, 3/1/32 (Italy) | EUR | 1,070,000 | 1,376,765 |
| Italy (Republic of) sr. unsec. notes zero %, 1/15/24 (Italy) | EUR | 130,000 | 157,058 |
| Italy (Republic of) sr. unsec. notes Ser. REGS, 0.90%, 8/1/22 (Italy) | EUR | 430,000 | 525,030 |
| Italy (Republic of) sr. unsec. unsub. bonds 4.75%, 8/1/23 (Italy) | EUR | 1,120,000 | 1,498,790 |
| Ivory Coast (Republic of) sr. unsec. unsub. bonds Ser. REGS, | | | |
| 6.125%, 6/15/33 (Ivory Coast) | | $335,000 | 355,100 |
| Ivory Coast (Republic of) sr. unsec. unsub. bonds Ser. REGS, 5.25%, | | | |
| 3/22/30 (Ivory Coast) | EUR | 100,000 | 126,213 |
| Ivory Coast (Republic of) sr. unsec. unsub. notes Ser. REGS, 5.375%, | | | |
| 7/23/24 (Ivory Coast) | | $300,000 | 322,875 |
| Ivory Coast (Republic of) sr. unsec. unsub. notes Ser. REGS, 4.75%, | | | |
| 3/13/28 (Senegal) | EUR | 100,000 | 124,356 |
| Japan (Government of) sr. unsec. bonds Ser. 95, 2.30%, | | | |
| 6/20/27 (Japan) | JPY | 280,000,000 | 2,934,889 |
| Japan (Government of) sr. unsec. unsub. bonds Ser. 32, 2.30%, | | | |
| 3/20/40 (Japan) | JPY | 407,000,000 | 4,985,721 |
| Japan (Government of) sr. unsec. unsub. bonds Ser. 125, 2.20%, | | | |
| 3/20/31 (Japan) | JPY | 265,000,000 | 2,926,898 |
| Japan (Government of) sr. unsec. unsub. bonds 0.80%, | | | |
| 3/20/47 (Japan) | JPY | 38,000,000 | 366,016 |
| Japan (Government of) sr. unsec. unsub. bonds Ser. 156, 0.40%, | | | |
| 3/20/36 (Japan) | JPY | 267,000,000 | 2,484,549 |
| Japan (Government of) sr. unsec. unsub. notes Ser. 330, 0.80%, | | | |
| 9/20/23 (Japan) | JPY | 904,000,000 | 8,456,027 |
| Japan (Government of) 30 yr sr. unsec. unsub. bonds Ser. 51, | | | |
| 0.30%, 6/20/46 (Japan) | JPY | 47,000,000 | 403,510 |
| Japan (Government of) 40 yr sr. unsec. unsub. bonds Ser. 4, 2.20%, | | | |
| 3/20/51 (Japan) | JPY | 215,000,000 | 2,781,111 |
| Kazakhstan (Republic of) sr. unsec. unsub. bonds Ser. REGS, | | | |
| 4.875%, 10/14/44 (Kazakhstan) | | $670,000 | 821,634 |
| Kazakhstan (Republic of) sr. unsec. unsub. notes Ser. REGS, | | | |
| 5.125%, 7/21/25 (Kazakhstan) | | 390,000 | 455,047 |
| | | |
| FOREIGN GOVERNMENT AND AGENCY | | Principal | |
| BONDS AND NOTES (34.3%)* cont. | | amount | Value |
| Malaysia (Federation of) sr. unsec. notes Ser. 417, 3.899%, | | | |
| 11/16/27 (Malaysia) | MYR | 2,710,000 | $697,446 |
| Mexico (Government of) sr. unsec. bonds 5.55%, 1/21/45 (Mexico) | | $1,021,000 | 1,188,281 |
| Mexico (Government of) sr. unsec. notes 7.50%, 6/3/27 (Mexico) | MXN | 12,510,000 | 674,205 |
| Netherlands (Government of) unsec. bonds 3.75%, | | | |
| 1/15/42 (Netherlands) | EUR | 270,000 | 553,521 |
| Netherlands (Government of) unsec. notes Ser. REGS, 0.50%, | | | |
| 7/15/26 (Netherlands) | EUR | 730,000 | 923,104 |
| New Zealand (Government of) sr. unsec. notes 3.00%, 4/20/29 | | | |
| (New Zealand) | NZD | 380,000 | 304,676 |
| Norway (Kingdom of) sr. unsec. notes 1.75%, 2/17/27 (Norway) | NOK | 1,880,000 | 233,690 |
| Ontario (Province of) unsec. bonds 6.50%, 3/8/29 (Canada) | CAD | 850,000 | 921,848 |
| Ontario (Province of) unsec. bonds 2.90%, 12/2/46 (Canada) | CAD | 410,000 | 336,306 |
| Ontario (Province of) unsec. notes 2.60%, 6/2/25 (Canada) | CAD | 1,690,000 | 1,458,846 |
| Paraguay (Republic of) sr. unsec. unsub. notes Ser. REGS, 4.70%, | | | |
| 3/27/27 (Paraguay) | | $570,000 | 633,840 |
| Paraguay (Republic of) 144A sr. unsec. bonds 2.739%, | | | |
| 1/29/33 (Paraguay) | | 220,000 | 209,550 |
| Poland (Government of) unsec. notes 0.75%, 4/25/25 (Poland) | PLN | 1,850,000 | 489,941 |
| Portugal (Republic of) sr. unsec. notes 1.95%, 6/15/29 (Portugal) | EUR | 510,000 | 699,545 |
| Romania (Government of) 144A sr. unsec. bonds 3.00%, | | | |
| 2/14/31 (Romania) | | $540,000 | 548,649 |
| Saudi Arabia (Kingdom of) sr. unsec. notes Ser. REGS, 2.90%, | | | |
| 10/22/25 (Saudi Arabia) | | 514,000 | 546,094 |
| Senegal (Republic of) sr. unsec. unsub. bonds Ser. REGS, 6.75%, | | | |
| 3/13/48 (Senegal) | | 250,000 | 251,250 |
| Senegal (Republic of) sr. unsec. unsub. notes Ser. REGS, 6.25%, | | | |
| 7/30/24 (Senegal) | | 200,000 | 217,000 |
| Senegal (Republic of) unsec. bonds Ser. REGS, 6.25%, | | | |
| 5/23/33 (Senegal) | | 525,000 | 547,969 |
| Spain (Kingdom of) sr. unsec. bonds 5.15%, 10/31/44 (Spain) | EUR | 350,000 | 755,338 |
| Spain (Kingdom of) sr. unsec. bonds 5.15%, 10/31/28 (Spain) | EUR | 770,000 | 1,269,308 |
| Spain (Kingdom of) sr. unsec. bonds 4.20%, 1/31/37 (Spain) | EUR | 150,000 | 267,902 |
| Spain (Kingdom of) sr. unsec. bonds 1.00%, 10/31/50 (Spain) | EUR | 20,000 | 21,477 |
| Spain (Kingdom of) sr. unsec. notes 1.60%, 4/30/25 (Spain) | EUR | 420,000 | 543,661 |
| Spain (Kingdom of) sr. unsec. notes 1.50%, 4/30/27 (Spain) | EUR | 520,000 | 683,285 |
| Spain (Kingdom of) sr. unsec. notes 1.25%, 10/31/30 (Spain) | EUR | 200,000 | 258,844 |
| Spain (Kingdom of) sr. unsec. unsub. bonds 4.65%, 7/30/25 (Spain) | EUR | 240,000 | 349,369 |
| Spain (Kingdom of) sr. unsec. unsub. bonds 2.90%, | | | |
| 10/31/46 (Spain) | EUR | 170,000 | 273,867 |
| Sweden (Government of) notes 1.00%, 11/12/26 (Sweden) | SEK | 6,110,000 | 761,214 |
| Sweden (Government of) unsec. bonds Ser. 1053, 3.50%, | | | |
| 3/30/39 (Sweden) | SEK | 140,000 | 24,128 |
| Switzerland (Government of) unsec. bonds 4.00%, | | | |
| 4/8/28 (Switzerland) | CHF | 620,000 | 890,200 |
| Switzerland (Government of) unsec. bonds 1.50%, | | | |
| 4/30/42 (Switzerland) | CHF | 170,000 | 242,961 |
| United Kingdom Treasury unsec. bonds 3.50%, 7/22/68 | | | |
| (United Kingdom) | GBP | 60,000 | 152,000 |
| United Kingdom Treasury unsec. notes 4.00%, 1/22/60 | | | |
| (United Kingdom) | GBP | 1,090,000 | 2,782,132 |
| | | |
| FOREIGN GOVERNMENT AND AGENCY | | Principal | |
| BONDS AND NOTES (34.3%)* cont. | | amount | Value |
| United Kingdom Treasury unsec. notes 2.75%, 9/7/24 | | | |
| (United Kingdom) | GBP | 50,000 | $74,936 |
| Uruguay (Oriental Republic of) sr. unsec. unsub. bonds 4.375%, | | | |
| 1/23/31 (Uruguay) | | $1,170,000 | 1,360,125 |
| Uruguay (Oriental Republic of) sr. unsec. unsub. notes 4.375%, | | | |
| 10/27/27 (Uruguay) | | 225,000 | 256,781 |
| Venezuela (Republic of) sr. unsec. notes 7.65%, 4/21/25 | | | |
| (Venezuela) (In default) † | | 3,000 | 308 |
| Total foreign government and agency bonds and notes (cost $80,653,506) | | $86,351,534 |
| | |
| | Principal | |
| CORPORATE BONDS AND NOTES (22.1%)* | amount | Value |
| Basic materials (1.0%) | | |
| Glencore Finance Canada, Ltd. 144A company guaranty sr. unsec. | | |
| unsub. notes 6.00%, 11/15/41 (Canada) | $187,000 | $235,672 |
| Glencore Funding, LLC 144A company guaranty sr. unsec. notes | | |
| 2.50%, 9/1/30 | 116,000 | 112,295 |
| Huntsman International, LLC sr. unsec. notes 4.50%, 5/1/29 | 660,000 | 740,124 |
| International Flavors & Fragrances, Inc. sr. unsec. notes | | |
| 4.45%, 9/26/28 | 270,000 | 308,214 |
| International Paper Co. sr. unsec. notes 8.70%, 6/15/38 | 6,000 | 9,657 |
| Nutrien, Ltd. sr. unsec. notes 2.95%, 5/13/30 (Canada) | 65,000 | 67,861 |
| Nutrien, Ltd. sr. unsec. sub. bonds 4.20%, 4/1/29 (Canada) | 216,000 | 245,222 |
| Nutrition & Biosciences, Inc. 144A sr. unsec. bonds | | |
| 3.468%, 12/1/50 | 89,000 | 87,893 |
| Nutrition & Biosciences, Inc. 144A sr. unsec. bonds 2.30%, 11/1/30 | 156,000 | 151,851 |
| WestRock MWV, LLC company guaranty sr. unsec. unsub. notes | | |
| 8.20%, 1/15/30 | 204,000 | 283,611 |
| WestRock MWV, LLC company guaranty sr. unsec. unsub. notes | | |
| 7.95%, 2/15/31 | 53,000 | 74,578 |
| Weyerhaeuser Co. sr. unsec. unsub. notes 7.375%, 3/15/32 R | 136,000 | 194,225 |
| | | 2,511,203 |
| Capital goods (1.2%) | | |
| Berry Global Escrow Corp. 144A sr. notes 4.875%, 7/15/26 | 386,000 | 408,793 |
| Berry Global, Inc. 144A company guaranty sr. unsub. notes | | |
| 1.57%, 1/15/26 | 480,000 | 475,718 |
| Boeing Co. (The) sr. unsec. bonds 5.93%, 5/1/60 | 165,000 | 215,050 |
| Boeing Co. (The) sr. unsec. notes 4.875%, 5/1/25 | 267,000 | 299,707 |
| Johnson Controls International PLC sr. unsec. unsub. bonds | | |
| 4.50%, 2/15/47 | 386,000 | 459,117 |
| L3Harris Technologies, Inc. sr. unsec. bonds 1.80%, 1/15/31 | 386,000 | 366,202 |
| L3Harris Technologies, Inc. sr. unsec. sub. notes 4.40%, 6/15/28 | 72,000 | 82,447 |
| Oshkosh Corp. sr. unsec. sub. notes 4.60%, 5/15/28 | 391,000 | 442,355 |
| Oshkosh Corp. sr. unsec. unsub. notes 3.10%, 3/1/30 | 69,000 | 71,498 |
| Waste Connections, Inc. sr. unsec. sub. bonds 3.50%, 5/1/29 | 246,000 | 267,595 |
| | | 3,088,482 |
| Communication services (4.4%) | | |
| American Tower Corp. sr. unsec. bonds 2.70%, 4/15/31 R | 822,000 | 831,195 |
| American Tower Corp. sr. unsec. notes 2.90%, 1/15/30 R | 345,000 | 355,964 |
| American Tower Corp. sr. unsec. sub. notes 2.75%, 1/15/27 R | 118,000 | 123,772 |
| AT&T, Inc. sr. unsec. bonds 4.30%, 2/15/30 | 410,000 | 462,307 |
| | |
| | Principal | |
| CORPORATE BONDS AND NOTES (22.1%)* cont. | amount | Value |
| Communication services cont. | | |
| AT&T, Inc. 144A sr. unsec. bonds 3.55%, 9/15/55 | $694,000 | $638,378 |
| AT&T, Inc. 144A sr. unsec. unsub. bonds 2.55%, 12/1/33 | 355,000 | 338,091 |
| Charter Communications Operating, LLC/Charter | | |
| Communications Operating Capital Corp. company guaranty sr. | | |
| sub. bonds 6.484%, 10/23/45 | 484,000 | 639,618 |
| Charter Communications Operating, LLC/Charter | | |
| Communications Operating Capital Corp. company guaranty sr. | | |
| sub. bonds 5.375%, 5/1/47 | 158,000 | 185,823 |
| Comcast Corp. company guaranty sr. unsec. unsub. bonds | | |
| 3.999%, 11/1/49 | 259,000 | 293,739 |
| Comcast Corp. company guaranty sr. unsec. unsub. notes | | |
| 6.50%, 11/15/35 | 55,000 | 78,596 |
| Comcast Corp. sr. unsec. bonds 3.45%, 2/1/50 | 1,525,000 | 1,583,575 |
| Cox Communications, Inc. 144A company guaranty sr. unsec. | | |
| bonds 2.95%, 10/1/50 | 336,000 | 305,722 |
| Cox Communications, Inc. 144A sr. unsec. notes 3.35%, 9/15/26 | 147,000 | 159,039 |
| Crown Castle International Corp. sr. unsec. bonds 3.80%, 2/15/28 R | 255,000 | 279,921 |
| Crown Castle International Corp. sr. unsec. notes 4.75%, 5/15/47 R | 296,000 | 346,544 |
| Equinix, Inc. sr. unsec. sub. notes 3.20%, 11/18/29 R | 478,000 | 504,042 |
| Rogers Communications, Inc. company guaranty sr. unsec. unsub. | | |
| notes 4.50%, 3/15/43 (Canada) | 135,000 | 149,160 |
| T-Mobile USA, Inc. 144A company guaranty sr. notes | | |
| 3.875%, 4/15/30 | 345,000 | 375,809 |
| T-Mobile USA, Inc. 144A company guaranty sr. notes | | |
| 3.75%, 4/15/27 | 820,000 | 903,246 |
| Telefonica Emisiones SA company guaranty sr. unsec. bonds | | |
| 4.895%, 3/6/48 (Spain) | 630,000 | 721,105 |
| Verizon Communications, Inc. sr. unsec. bonds 3.70%, 3/22/61 | 377,000 | 380,773 |
| Verizon Communications, Inc. sr. unsec. notes 2.55%, 3/21/31 | 188,000 | 188,605 |
| Verizon Communications, Inc. sr. unsec. unsub. bonds | | |
| 4.672%, 3/15/55 | 270,000 | 329,419 |
| Verizon Communications, Inc. sr. unsec. unsub. notes | | |
| 4.329%, 9/21/28 | 433,000 | 498,965 |
| Videotron, Ltd./Videotron Ltee. 144A sr. unsec. notes 5.125%, | | |
| 4/15/27 (Canada) | 345,000 | 364,406 |
| | | 11,037,814 |
| Consumer cyclicals (1.7%) | | |
| Alimentation Couche-Tard, Inc. 144A company guaranty sr. unsec. | | |
| notes 3.55%, 7/26/27 (Canada) | 284,000 | 309,915 |
| Alimentation Couche-Tard, Inc. 144A sr. unsec. notes 2.95%, | | |
| 1/25/30 (Canada) | 317,000 | 325,295 |
| Amazon.com, Inc. sr. unsec. notes 4.05%, 8/22/47 | 308,000 | 363,627 |
| General Motors Co. sr. unsec. bonds 5.95%, 4/1/49 | 126,000 | 162,884 |
| General Motors Financial Co., Inc. company guaranty sr. unsec. | | |
| notes 4.00%, 10/6/26 | 217,000 | 239,337 |
| Global Payments, Inc. sr. unsec. notes 2.90%, 5/15/30 | 403,000 | 413,149 |
| IHS Markit, Ltd. 144A company guaranty notes 4.75%, 2/15/25 | | |
| (United Kingdom) | 344,000 | 386,140 |
| IHS Markit, Ltd. 144A company guaranty sr. unsec. notes 4.00%, | | |
| 3/1/26 (United Kingdom) | 164,000 | 181,630 |
| | |
| | Principal | |
| CORPORATE BONDS AND NOTES (22.1%)* cont. | amount | Value |
| Consumer cyclicals cont. | | |
| Interpublic Group of Cos., Inc. (The) sr. unsec. sub. bonds | | |
| 4.65%, 10/1/28 | $729,000 | $839,923 |
| Lennar Corp. company guaranty sr. unsec. unsub. notes | | |
| 4.75%, 11/29/27 | 305,000 | 352,909 |
| Moody’s Corp. sr. unsec. bonds 2.55%, 8/18/60 | 220,000 | 179,713 |
| Sirius XM Radio, Inc. 144A sr. unsec. bonds 5.00%, 8/1/27 | 560,000 | 585,900 |
| ViacomCBS, Inc. sr. unsec. notes 4.20%, 5/19/32 | 4,000 | 4,458 |
| | | 4,344,880 |
| Consumer staples (1.5%) | | |
| Anheuser-Busch InBev Worldwide, Inc. company guaranty sr. | | |
| unsec. unsub. bonds 5.55%, 1/23/49 | 92,000 | 118,815 |
| Ashtead Capital, Inc. 144A notes 4.375%, 8/15/27 | 635,000 | 665,163 |
| CVS Pass-Through Trust sr. notes 6.036%, 12/10/28 | 34,421 | 39,590 |
| ERAC USA Finance, LLC 144A company guaranty sr. unsec. bonds | | |
| 4.50%, 2/15/45 | 12,000 | 14,028 |
| ERAC USA Finance, LLC 144A company guaranty sr. unsec. notes | | |
| 7.00%, 10/15/37 | 68,000 | 99,413 |
| ERAC USA Finance, LLC 144A company guaranty sr. unsec. notes | | |
| 5.625%, 3/15/42 | 333,000 | 438,017 |
| Keurig Dr Pepper, Inc. company guaranty sr. unsec. notes | | |
| 2.25%, 3/15/31 | 500,000 | 491,098 |
| Keurig Dr Pepper, Inc. company guaranty sr. unsec. unsub. notes | | |
| 4.597%, 5/25/28 | 159,000 | 184,849 |
| Kraft Heinz Foods Co. company guaranty sr. unsec. bonds | | |
| 4.375%, 6/1/46 | 415,000 | 442,576 |
| Kraft Heinz Foods Co. company guaranty sr. unsec. sub. notes | | |
| 3.875%, 5/15/27 | 100,000 | 108,987 |
| Lamb Weston Holdings, Inc. 144A company guaranty sr. unsec. | | |
| unsub. notes 4.875%, 11/1/26 | 426,000 | 441,975 |
| Netflix, Inc. sr. unsec. unsub. notes 4.375%, 11/15/26 | 655,000 | 738,971 |
| | | 3,783,482 |
| Energy (1.4%) | | |
| Cheniere Corpus Christi Holdings, LLC company guaranty sr. notes | | |
| 5.125%, 6/30/27 | 528,000 | 608,420 |
| Diamondback Energy, Inc. company guaranty sr. unsec. notes | | |
| 3.25%, 12/1/26 | 350,000 | 370,970 |
| Petrobras Global Finance BV company guaranty sr. unsec. unsub. | | |
| notes 6.25%, 3/17/24 (Brazil) | 534,000 | 598,748 |
| Petrobras Global Finance BV company guaranty sr. unsec. unsub. | | |
| notes 5.60%, 1/3/31 (Brazil) | 174,000 | 187,833 |
| Petrobras Global Finance BV company guaranty sr. unsec. unsub. | | |
| notes 5.299%, 1/27/25 (Brazil) | 189,000 | 209,556 |
| Petroleos de Venezuela SA company guaranty sr. unsec. bonds | | |
| Ser. REGS, 6.00%, 11/15/26 (Venezuela) (In default) † | 155,000 | 6,781 |
| Petroleos de Venezuela SA company guaranty sr. unsec. unsub. | | |
| notes 5.375%, 4/12/27 (Venezuela) (In default) † | 6,000 | 263 |
| Petroleos Mexicanos company guaranty sr. unsec. unsub. FRB | | |
| 5.95%, 1/28/31 (Mexico) | 428,000 | 413,191 |
| Petroleos Mexicanos company guaranty sr. unsec. unsub. notes | | |
| 6.50%, 3/13/27 (Mexico) | 117,000 | 123,518 |
| Sabine Pass Liquefaction, LLC sr. bonds 4.20%, 3/15/28 | 20,000 | 22,143 |
| | |
| | Principal | |
| CORPORATE BONDS AND NOTES (22.1%)* cont. | amount | Value |
| Energy cont. | | |
| Sabine Pass Liquefaction, LLC sr. notes 5.00%, 3/15/27 | $436,000 | $501,093 |
| Spectra Energy Partners LP sr. unsec. notes 3.375%, 10/15/26 | 2,000 | 2,157 |
| Transcanada Trust company guaranty jr. unsec. sub. FRB 5.30%, | | |
| 3/15/77 (Canada) | 421,000 | 447,355 |
| | | 3,492,028 |
| Financials (6.6%) | | |
| Air Lease Corp. sr. unsec. sub. bonds 4.625%, 10/1/28 | 450,000 | 499,924 |
| Air Lease Corp. sr. unsec. sub. notes 3.25%, 10/1/29 | 265,000 | 270,349 |
| American International Group, Inc. jr. unsec. sub. FRB | | |
| 8.175%, 5/15/58 | 46,000 | 64,961 |
| Aon PLC company guaranty sr. unsec. unsub. notes | | |
| 4.25%, 12/12/42 | 386,000 | 430,255 |
| Ares Capital Corp. sr. unsec. sub. notes 3.875%, 1/15/26 | 650,000 | 693,378 |
| Banco Santander SA sr. unsec. unsub. notes 4.379%, | | |
| 4/12/28 (Spain) | 400,000 | 449,440 |
| Bank of America Corp. jr. unsec. sub. bonds Ser. JJ, 5.125%, | | |
| perpetual maturity | 15,000 | 16,172 |
| Bank of America Corp. jr. unsec. sub. FRN Ser. Z, 6.50%, | | |
| perpetual maturity | 410,000 | 472,607 |
| Bank of America Corp. sr. unsec. FRN Ser. MTN, 2.496%, 2/13/31 | 550,000 | 551,285 |
| Bank of Montreal unsec. sub. FRN 3.803%, 12/15/32 (Canada) | 134,000 | 147,631 |
| BNP Paribas SA 144A unsec. sub. FRB 2.588%, 8/12/35 (France) | 630,000 | 602,618 |
| BPCE SA 144A unsec. sub. notes 4.50%, 3/15/25 (France) | 740,000 | 818,154 |
| CIT Group, Inc. sr. unsec. unsub. notes 5.25%, 3/7/25 | 830,000 | 937,900 |
| Citigroup, Inc. jr. unsec. sub. FRN 3.875%, 2/18/51 | 625,000 | 627,344 |
| Citigroup, Inc. sr. unsec. FRB 3.668%, 7/24/28 | 90,000 | 98,886 |
| Commonwealth Bank of Australia 144A unsec. sub. notes 2.688%, | | |
| 3/11/31 (Australia) | 290,000 | 283,374 |
| Credit Agricole SA 144A unsec. sub. FRN 4.00%, 1/10/33 (France) | 400,000 | 429,500 |
| Credit Suisse Group AG 144A jr. unsec. sub. FRN 6.25%, perpetual | | |
| maturity (Switzerland) | 200,000 | 216,500 |
| Credit Suisse Group AG 144A sr. unsec. bonds 3.869%, | | |
| 1/12/29 (Switzerland) | 250,000 | 269,959 |
| Credit Suisse Group AG 144A sr. unsec. FRN 2.193%, | | |
| 6/5/26 (Switzerland) | 250,000 | 255,226 |
| Deutsche Bank AG unsec. sub. FRB 3.729%, 1/14/32 (Germany) | 705,000 | 697,932 |
| Digital Realty Trust LP company guaranty sr. unsec. bonds | | |
| 4.45%, 7/15/28 R | 458,000 | 525,136 |
| Fairfax Financial Holdings, Ltd. sr. unsec. notes 4.85%, | | |
| 4/17/28 (Canada) | 730,000 | 821,618 |
| Fifth Third Bancorp jr. unsec. sub. FRB 5.10%, perpetual maturity | 61,000 | 62,906 |
| Goldman Sachs Group, Inc. (The) sr. unsec. FRB 4.223%, 5/1/29 | 360,000 | 406,780 |
| Goldman Sachs Group, Inc. (The) sr. unsec. unsub. notes | | |
| 2.60%, 2/7/30 | 204,000 | 208,089 |
| Goldman Sachs Group, Inc. (The) unsec. sub. notes 6.75%, 10/1/37 | 9,000 | 12,803 |
| Intercontinental Exchange, Inc. sr. unsec. bonds 2.65%, 9/15/40 | 377,000 | 349,948 |
| Intercontinental Exchange, Inc. sr. unsec. bonds 1.85%, 9/15/32 | 104,000 | 96,003 |
| JPMorgan Chase & Co. unsec. sub. FRB 2.956%, 5/13/31 | 227,000 | 233,162 |
| Massachusetts Mutual Life Insurance Co. 144A unsec. sub. bonds | | |
| 3.729%, 10/15/70 | 509,000 | 513,071 |
| | |
| | Principal | |
| CORPORATE BONDS AND NOTES (22.1%)* cont. | amount | Value |
| Financials cont. | | |
| MetLife Capital Trust IV 144A jr. unsec. sub. notes 7.875%, 12/15/37 | $230,000 | $318,550 |
| NatWest Group PLC sr. unsec. unsub. FRB 4.892%, 5/18/29 | | |
| (United Kingdom) | 585,000 | 671,636 |
| Prologis LP sr. unsec. unsub. notes 2.25%, 4/15/30 R | 116,000 | 116,082 |
| Prudential Financial, Inc. jr. unsec. sub. FRN 5.625%, 6/15/43 | 27,000 | 29,261 |
| Prudential Financial, Inc. jr. unsec. sub. FRN 5.20%, 3/15/44 | 162,000 | 173,340 |
| Prudential Financial, Inc. sr. unsec. notes 6.625%, 6/21/40 | 58,000 | 84,610 |
| Societe Generale SA 144A jr. unsec. sub. notes 5.375%, | | |
| 11/18/50 (France) | 643,000 | 669,394 |
| Teachers Insurance & Annuity Association of America 144A unsec. | | |
| sub. notes 6.85%, 12/16/39 | 120,000 | 175,016 |
| Truist Financial Corp. jr. unsec. sub. FRB Ser. N, 4.80%, 9/1/24 | 270,000 | 285,795 |
| UBS Group AG 144A jr. unsec. sub. FRN 4.375%, | | |
| 2/10/31 (Switzerland) | 225,000 | 222,355 |
| UBS Group Funding Jersey, Ltd. 144A company guaranty sr. unsec. | | |
| notes 4.125%, 4/15/26 (Switzerland) | 379,000 | 424,142 |
| UBS Group Funding Switzerland AG company guaranty jr. unsec. | | |
| sub. FRN Ser. REGS, 6.875%, perpetual maturity (Switzerland) | 300,000 | 341,500 |
| Wells Fargo & Co. jr. unsec. sub. FRN 3.90%, 3/15/26 | 240,000 | 245,376 |
| Wells Fargo Bank, NA unsec. sub. notes Ser. BKNT, 6.60%, 1/15/38 | 276,000 | 395,373 |
| Westpac Banking Corp. unsec. sub. bonds 4.421%, | | |
| 7/24/39 (Australia) | 260,000 | 296,856 |
| Westpac Banking Corp. unsec. sub. bonds 2.963%, | | |
| 11/16/40 (Australia) | 224,000 | 210,547 |
| | | 16,722,744 |
| Health care (1.1%) | | |
| Amgen, Inc. sr. unsec. bonds 4.663%, 6/15/51 | 223,000 | 270,385 |
| Becton Dickinson and Co. sr. unsec. notes 2.823%, 5/20/30 | 247,000 | 255,234 |
| Bristol-Myers Squibb Co. sr. unsec. sub. bonds 2.55%, 11/13/50 | 106,000 | 94,955 |
| CVS Health Corp. sr. unsec. unsub. notes 4.78%, 3/25/38 | 400,000 | 476,348 |
| DH Europe Finance II Sarl company guaranty sr. unsec. bonds | | |
| 3.40%, 11/15/49 (Luxembourg) | 335,000 | 345,892 |
| HCA, Inc. company guaranty sr. bonds 5.25%, 6/15/26 | 58,000 | 67,288 |
| HCA, Inc. company guaranty sr. notes 4.125%, 6/15/29 | 85,000 | 94,429 |
| HCA, Inc. company guaranty sr. sub. bonds 5.50%, 6/15/47 | 275,000 | 344,491 |
| Service Corp. International sr. unsec. notes 4.625%, 12/15/27 | 125,000 | 132,813 |
| Service Corp. International sr. unsec. notes 3.375%, 8/15/30 | 70,000 | 67,725 |
| UnitedHealth Group, Inc. sr. unsec. unsub. notes 2.00%, 5/15/30 | 148,000 | 146,312 |
| Viatris, Inc. 144A company guaranty sr. unsec. notes | | |
| 2.30%, 6/22/27 | 159,000 | 160,996 |
| Zoetis, Inc. sr. unsec. notes 3.90%, 8/20/28 | 240,000 | 269,425 |
| Zoetis, Inc. sr. unsec. sub. notes 2.00%, 5/15/30 | 108,000 | 104,734 |
| | | 2,831,027 |
| Technology (1.4%) | | |
| Broadcom, Inc. company guaranty sr. unsec. bonds | | |
| 4.15%, 11/15/30 | 1,007,000 | 1,100,166 |
| Broadcom, Inc. 144A company guaranty sr. unsec. bonds | | |
| 3.75%, 2/15/51 | 169,000 | 163,043 |
| Diamond 1 Finance Corp./Diamond 2 Finance Corp. 144A sr. bonds | | |
| 8.35%, 7/15/46 | 102,000 | 159,701 |
| | |
| | Principal | |
| CORPORATE BONDS AND NOTES (22.1%)* cont. | amount | Value |
| Technology cont. | | |
| Fidelity National Information Services, Inc. sr. unsec. bonds | | |
| 2.25%, 3/1/31 | $535,000 | $525,500 |
| Fiserv, Inc. sr. unsec. bonds 3.50%, 7/1/29 | 90,000 | 97,527 |
| Fiserv, Inc. sr. unsec. sub. bonds 4.20%, 10/1/28 | 334,000 | 379,021 |
| Oracle Corp. sr. unsec. bonds 3.65%, 3/25/41 | 245,000 | 249,902 |
| Sensata Technologies, Inc. 144A company guaranty sr. unsec. | | |
| notes 3.75%, 2/15/31 | 505,000 | 501,485 |
| ServiceNow, Inc. sr. unsec. notes 1.40%, 9/1/30 | 362,000 | 330,405 |
| | | 3,506,750 |
| Transportation (0.1%) | | |
| Penske Truck Leasing Co. LP/PTL Finance Corp. 144A sr. unsec. | | |
| bonds 3.40%, 11/15/26 | 191,000 | 207,012 |
| | | 207,012 |
| Utilities and power (1.7%) | | |
| AES Corp. (The) 144A sr. unsec. bonds 2.45%, 1/15/31 | 425,000 | 410,438 |
| El Paso Natural Gas Co., LLC company guaranty sr. unsec. unsub. | | |
| notes 8.375%, 6/15/32 | 74,000 | 106,645 |
| Energy Transfer LP jr. unsec. sub. FRN 6.625%, perpetual maturity | 392,000 | 368,970 |
| Energy Transfer Operating LP company guaranty sr. unsec. notes | | |
| 5.875%, 1/15/24 | 400,000 | 445,004 |
| Energy Transfer Operating LP company guaranty sr. unsec. notes | | |
| 2.90%, 5/15/25 | 178,000 | 186,763 |
| Energy Transfer Operating LP sr. unsec. unsub. notes 6.50%, 2/1/42 | 57,000 | 69,041 |
| Enterprise Products Operating, LLC company guaranty sr. unsec. | | |
| notes 2.80%, 1/31/30 | 531,000 | 546,971 |
| Enterprise Products Operating, LLC company guaranty sr. unsec. | | |
| unsub. bonds 4.25%, 2/15/48 | 95,000 | 101,575 |
| IPALCO Enterprises, Inc. sr. sub. notes 3.70%, 9/1/24 | 117,000 | 126,274 |
| IPALCO Enterprises, Inc. 144A sr. bonds 4.25%, 5/1/30 | 415,000 | 460,276 |
| Kinder Morgan Energy Partners LP company guaranty sr. unsec. | | |
| notes 5.40%, 9/1/44 | 220,000 | 262,682 |
| Pacific Gas and Electric Co. notes 2.10%, 8/1/27 | 105,000 | 102,302 |
| Pacific Gas and Electric Co. sr. notes 3.30%, 3/15/27 | 190,000 | 195,273 |
| Vistra Operations Co., LLC 144A company guaranty sr. notes | | |
| 4.30%, 7/15/29 | 204,000 | 214,494 |
| Vistra Operations Co., LLC 144A company guaranty sr. notes | | |
| 3.55%, 7/15/24 | 160,000 | 166,142 |
| WEC Energy Group, Inc. jr. unsec. sub. FRN Ser. A, (BBA LIBOR USD | | |
| 3 Month + 2.11%), 2.306%, 5/15/67 | 589,000 | 534,518 |
| | | 4,297,368 |
| Total corporate bonds and notes (cost $52,717,460) | | $55,822,790 |
| |
| | Principal | |
| COLLATERALIZED LOAN OBLIGATIONS (1.6%)* | amount | Value |
| Bain Capital Credit CLO, Ltd. 144A FRB Ser. 19-3A, Class A, (BBA | | |
| LIBOR USD 3 Month + 1.34%), 1.526%, 10/21/32 | $250,000 | $250,481 |
| Benefit Street Partners CLO V-B, Ltd. 144A FRB Ser. 18-5BA, | | |
| Class A1A, (BBA LIBOR USD 3 Month + 1.09%), 1.278%, 4/20/31 | 250,000 | 249,580 |
| CBAM, Ltd. 144A FRB Ser. 19-9A, Class A, (BBA LIBOR USD 3 Month | | |
| + 1.28%), 1.464%, 2/12/30 | 250,000 | 250,031 |
| | |
| | Principal | |
| COLLATERALIZED LOAN OBLIGATIONS (1.6%)* cont. | amount | Value |
| Madison Park Funding, Ltd. 144A FRB Ser. 18-30A, Class A, | | |
| (BBA LIBOR USD 3 Month + 0.75%), 0.934%, 4/15/29 | $413,000 | $411,899 |
| Magnetite VII, Ltd. 144A FRB Ser. 18-7A, Class A1R2, (BBA LIBOR | | |
| USD 3 Month + 0.80%), 0.984%, 1/15/28 | 248,216 | 248,138 |
| Mountain View CLO, LLC 144A FRB Ser. 17-2A, Class A, (BBA LIBOR | | |
| USD 3 Month + 1.21%), 1.394%, 1/16/31 | 250,000 | 250,080 |
| MP CLO III, Ltd. 144A FRB Ser. 13-1A, Class AR, (BBA LIBOR USD | | |
| 3 Month + 1.25%), 1.438%, 10/20/30 | 573,000 | 573,115 |
| OZLM XI, Ltd. 144A FRB Ser. 17-11A, Class A1R, (BBA LIBOR USD | | |
| 3 Month + 1.25%), 1.436%, 10/30/30 | 247,297 | 246,621 |
| Palmer Square CLO, Ltd. 144A FRB Ser. 18-2A, Class A1A, | | |
| (BBA LIBOR USD 3 Month + 1.10%), 1.284%, 7/16/31 | 250,000 | 250,384 |
| RR, Ltd. 144A FRB Ser. 20-12A, Class AAR2, (BBA LIBOR USD | | |
| 3 Month + 1.36%), 1.544%, 1/15/36 | 437,000 | 438,576 |
| Signal Peak CLO 4, Ltd. 144A FRB Ser. 17-4A, Class A, (BBA LIBOR | | |
| USD 3 Month + 1.21%), 1.386%, 10/26/29 | 250,000 | 250,349 |
| THL Credit Wind River CLO, Ltd. 144A FRB Ser. 18-2A, Class AR, | | |
| (BBA LIBOR USD 3 Month + 1.14%), 1.324%, 1/15/31 | 250,000 | 250,008 |
| Voya CLO, Ltd. 144A FRB Ser. 13-2A, Class A1R, (BBA LIBOR USD | | |
| 3 Month + 0.97%), 1.146%, 4/25/31 | 456,000 | 455,219 |
| Total collateralized loan obligations (cost $4,129,488) | | $4,124,481 |
| |
| | Principal | |
| ASSET-BACKED SECURITIES (1.5%)* | amount | Value |
| 1Sharpe Mortgage Trust 144A FRB Ser. 20-1, Class NOTE, | | |
| (BBA LIBOR USD 3 Month + 2.90%), 3.076%, 7/25/24 | $568,000 | $568,341 |
| Cascade Funding Mortgage Trust, LLC 144A Ser. 20-HB4, Class M3, | | |
| 2.72%, 12/26/30 W | 498,000 | 501,785 |
| LHOME Mortgage Trust 144A Ser. 19-RTL2, Class A1, | | |
| 3.844%, 3/25/24 | 190,000 | 191,596 |
| RMF Buyout Issuance Trust 144A Ser. 20-2, Class M1, | | |
| 2.149%, 6/25/30 W | 980,000 | 993,230 |
| Station Place Securitization Trust 144A FRB Ser. 21-6, Class A, | | |
| (1 Month US LIBOR + 0.80%), 0.91%, 4/25/22 | 762,000 | 762,000 |
| Toorak Mortgage Corp., Ltd. 144A | | |
| Ser. 19-1, Class A1, 4.535%, 3/25/22 W | 354,450 | 365,083 |
| Ser. 20-1, Class A1, 3.25%, 3/25/23 W | 350,000 | 353,961 |
| Total asset-backed securities (cost $3,702,446) | | $3,735,996 |
| | | |
| PURCHASED SWAP OPTIONS OUTSTANDING (0.8%)* | | | |
| Counterparty | | Notional/ | |
| Fixed right % to receive or (pay)/ | Expiration | contract | |
| Floating rate index/Maturity date | date/strike | amount | Value |
| Bank of America N.A. | | | |
| (1.185)/3 month USD-LIBOR-BBA/Dec-25 | Dec-23/1.185 | $14,042,100 | $172,999 |
| 0.485/3 month USD-LIBOR-BBA/Jan-25 | Jan-24/0.485 | 14,042,100 | 16,289 |
| Citibank, N.A. | | | |
| (2.023)/3 month USD-LIBOR-BBA/Jun-51 | Jun-21/2.023 | 188,900 | 4,689 |
| (0.271)/3 month USD-LIBOR-BBA/Jun-23 | Jun-21/0.271 | 2,267,400 | 1,950 |
| Goldman Sachs International | | | |
| 1.869/3 month USD-LIBOR-BBA/Sep-31 | Sep-21/1.869 | 11,606,000 | 303,613 |
| (1.62)/3 month USD-LIBOR-BBA/Aug-31 | Aug-21/1.62 | 3,395,200 | 64,067 |
| | | | |
| PURCHASED SWAP OPTIONS OUTSTANDING (0.8%)* cont. | | | |
| Counterparty | | | Notional/ | |
| Fixed right % to receive or (pay)/ | Expiration | | contract | |
| Floating rate index/Maturity date | date/strike | | amount | Value |
| Goldman Sachs International cont. | | | | |
| 2.988/3 month USD-LIBOR-BBA/Feb-39 | Feb-29/2.988 | | $372,600 | $32,286 |
| (2.988)/3 month USD-LIBOR-BBA/Feb-39 | Feb-29/2.988 | | 372,600 | 16,689 |
| (2.983)/3 month USD-LIBOR-BBA/May-52 | May-22/2.983 | | 650,200 | 9,864 |
| JPMorgan Chase Bank N.A. | | | | |
| 2.795/3 month USD-LIBOR-BBA/Dec-37 | Dec-27/2.795 | | 1,593,600 | 120,651 |
| 2.7575/3 month USD-LIBOR-BBA/Dec-37 | Dec-27/2.7575 | | 1,593,600 | 117,687 |
| (2.7575)/3 month USD-LIBOR-BBA/Dec-37 | Dec-27/2.7575 | | 1,593,600 | 79,823 |
| (2.795)/3 month USD-LIBOR-BBA/Dec-37 | Dec-27/2.795 | | 1,593,600 | 77,831 |
| Morgan Stanley & Co. International PLC | | | | |
| 3.00/3 month USD-LIBOR-BBA/Apr-72 | Apr-47/3.00 | | 1,590,200 | 316,641 |
| 3.00/3 month USD-LIBOR-BBA/Feb-73 | Feb-48/3.00 | | 1,590,200 | 311,647 |
| 2.75/3 month USD-LIBOR-BBA/May-73 | May-48/2.75 | | 1,590,200 | 261,461 |
| (1.613)/3 month USD-LIBOR-BBA/Aug-34 | Aug-24/1.613 | | 1,059,500 | 90,577 |
| 1.613/3 month USD-LIBOR-BBA/Aug-34 | Aug-24/1.613 | | 1,059,500 | 25,460 |
| (2.904)/3 month USD-LIBOR-BBA/May-51 | May-21/2.904 | | 278,700 | — |
| Toronto-Dominion Bank | | | | |
| (1.04)/3 month USD-LIBOR-BBA/Mar-55 (Canada) | Mar-25/1.04 | | 84,000 | 25,137 |
| UBS AG | | | | |
| (0.153)/6 month EUR-EURIBOR-Reuters/Sep-29 | Sep-24/0.153 | EUR | 698,900 | 19,662 |
| 0.153/6 month EUR-EURIBOR-Reuters/Sep-29 | Sep-24/0.153 | EUR | 698,900 | 13,561 |
| Total purchased swap options outstanding (cost $1,508,615) | | | $2,082,584 |
| | | | |
| PURCHASED OPTIONS | Expiration | | | |
| OUTSTANDING (—%)* | date/strike | Notional | Contract | |
| Counterparty | price | amount | amount | Value |
| JPMorgan Chase Bank N.A. | | | | |
| Uniform Mortgage-Backed | | | | |
| Securities 30 yr 4.00% TBA | | | | |
| commitments (Call) | May-21/$107.44 | $5,000,000 | $5,000,000 | $2,650 |
| Uniform Mortgage-Backed | | | | |
| Securities 30 yr 3.00% TBA | | | | |
| commitments (Call) | May-21/104.45 | 17,000,000 | 17,000,000 | 49,096 |
| Total purchased options outstanding (cost $34,375) | | | $51,746 |
| | | |
| | Principal amount/ | |
| SHORT-TERM INVESTMENTS (5.3%)* | | shares | Value |
| Putnam Short Term Investment Fund Class P 0.10% L | Shares | 4,510,140 | $4,510,140 |
| State Street Institutional U.S. Government Money Market Fund, | | | |
| Premier Class 0.03% P | Shares | 1,636,000 | 1,636,000 |
| U.S. Treasury Bills 0.083%, 5/13/21 # ∆ | | $800,000 | 799,999 |
| U.S. Treasury Bills 0.065%, 5/25/21 ∆ Φ | | 400,000 | 399,999 |
| U.S. Treasury Bills 0.058%, 6/3/21 # ∆ § | | 300,000 | 299,999 |
| U.S. Treasury Bills 0.042%, 6/10/21 # ∆ § | | 1,500,000 | 1,499,984 |
| U.S. Treasury Bills 0.036%, 6/1/21 ∆ § | | 900,000 | 899,993 |
| U.S. Treasury Bills 0.011%, 6/29/21 # ∆ § | | 1,800,000 | 1,799,957 |
| U.S. Treasury Cash Management Bills 0.023%, 7/20/21 § | | 600,000 | 599,990 |
| | |
| | Principal | |
| SHORT-TERM INVESTMENTS (5.3%)* cont. | amount | Value |
| U.S. Treasury Cash Management Bills 0.020%, 8/3/21 ∆ § Φ | $700,000 | $699,986 |
| U.S. Treasury Cash Management Bills 0.008%, 7/6/21 ∆ | 100,000 | 99,998 |
| Total short-term investments (cost $13,245,889) | | $13,246,045 |
| |
| TOTAL INVESTMENTS | | |
| Total investments (cost $405,528,305) | | $412,998,730 |
Key to holding’s currency abbreviations
| |
| AUD | Australian Dollar |
| CAD | Canadian Dollar |
| CHF | Swiss Franc |
| CNY | Chinese Yuan (Onshore) |
| DKK | Danish Krone |
| EUR | Euro |
| GBP | British Pound |
| JPY | Japanese Yen |
| KRW | South Korean Won |
| MXN | Mexican Peso |
| MYR | Malaysian Ringgit |
| NOK | Norwegian Krone |
| NZD | New Zealand Dollar |
| PLN | Polish Zloty |
| SEK | Swedish Krona |
| THB | Thai Baht |
| USD/$ | United States Dollar |
Key to holding’s abbreviations
| |
| BKNT | Bank Note |
| bp | Basis Points |
| FRB | Floating Rate Bonds: the rate shown is the current interest rate at the close of the reporting period. Rates may |
| | be subject to a cap or floor. For certain securities, the rate may represent a fixed rate currently in place at the |
| | close of the reporting period. |
| FRN | Floating Rate Notes: the rate shown is the current interest rate or yield at the close of the reporting period. |
| | Rates may be subject to a cap or floor. For certain securities, the rate may represent a fixed rate currently in |
| | place at the close of the reporting period. |
| IFB | Inverse Floating Rate Bonds, which are securities that pay interest rates that vary inversely to changes in the |
| | market interest rates. As interest rates rise, inverse floaters produce less current income. The rate shown is |
| | the current interest rate at the close of the reporting period. Rates may be subject to a cap or floor. |
| IO | Interest Only |
| MTN | Medium Term Notes |
| OTC | Over-the-counter |
| REGS | Securities sold under Regulation S may not be offered, sold or delivered within the United States except |
| | pursuant to an exemption from, or in a transaction not subject to, the registration requirements of the |
| | Securities Act of 1933. |
| TBA | To Be Announced Commitments |
Notes to the fund’s portfolio
Unless noted otherwise, the notes to the fund’s portfolio are for the close of the fund’s reporting period, which ran from November 1, 2020 through April 30, 2021 (the reporting period). Within the following notes to the portfolio, references to “Putnam Management” represent Putnam Investment Management, LLC, the fund’s manager, an indirect wholly-owned subsidiary of Putnam Investments, LLC and references to “ASC 820” represent Accounting Standards Codification 820 Fair Value Measurements and Disclosures.
* Percentages indicated are based on net assets of $252,069,231.
† This security is non-income-producing.
# This security, in part or in entirety, was pledged and segregated with the broker to cover margin requirements for futures contracts at the close of the reporting period. Collateral at period end totaled $478,000 and is included in Investments in securities on the Statement of assets and liabilities (Notes 1 and 8).
∆ This security, in part or in entirety, was pledged and segregated with the custodian for collateral on certain derivative contracts at the close of the reporting period. Collateral at period end totaled $2,558,000 and is included in Investments in securities on the Statement of assets and liabilities (Notes 1 and 8).
Φ This security, in part or in entirety, was pledged and segregated with the custodian for collateral on certain TBA commitments at the close of the reporting period. Collateral at period end totaled $478,000 and is included in Investments in securities on the Statement of assets and liabilities (Notes 1 and 8).
§ This security, in part or in entirety, was pledged and segregated with the custodian for collateral on the initial margin on certain centrally cleared derivative contracts at the close of the reporting period. Collateral at period end totaled $3,350,000 and is included in Investments in securities on the Statement of assets and liabilities (Notes 1 and 8).
i This security was pledged, or purchased with cash that was pledged, to the fund for collateral on certain derivative contracts (Note 1).
L Affiliated company (Note 5). The rate quoted in the security description is the annualized 7-day yield of the fund at the close of the reporting period.
P This security was pledged, or purchased with cash that was pledged, to the fund for collateral on certain derivative contracts and TBA commitments. The rate quoted in the security description is the annualized 7-day yield of the fund at the close of the reporting period.
R Real Estate Investment Trust.
W The rate shown represents the weighted average coupon associated with the underlying mortgage pools. Rates may be subject to a cap or floor.
At the close of the reporting period, the fund maintained liquid assets totaling $67,324,636 to cover certain derivative contracts and delayed delivery securities.
Unless otherwise noted, the rates quoted in Short-term investments security descriptions represent the weighted average yield to maturity.
Debt obligations are considered secured unless otherwise indicated.
144A after the name of an issuer represents securities exempt from registration under Rule 144A of the Securities Act of 1933, as amended. These securities may be resold in transactions exempt from registration, normally to qualified institutional buyers.
See Note 1 to the financial statements regarding TBA commitments.
The dates shown on debt obligations are the original maturity dates.
|
| DIVERSIFICATION BY COUNTRY ⌂ |
Distribution of investments by country of risk at the close of the reporting period, excluding collateral received, if any (as a percentage of Portfolio Value):
| | | | |
| United States | 75.4% | | Switzerland | 0.7% |
| Japan | 6.2 | | Australia | 0.6 |
| France | 4.2 | | Mexico | 0.6 |
| Italy | 2.0 | | Indonesia | 0.6 |
| Canada | 1.5 | | Belgium | 0.5 |
| Spain | 1.4 | | Other | 5.3 |
| United Kingdom | 1.0 | | Total | 100.0% |
⌂Methodology differs from that used for purposes of complying with the fund’s policy regarding investments in securities of foreign issuers, as discussed further in the fund’s prospectus.
| | | | | | |
| FORWARD CURRENCY CONTRACTS at 4/30/21 (aggregate face value $183,750,957) (Unaudited) |
| | | | | | | Unrealized |
| | | Contract | Delivery | | Aggregate | appreciation/ |
| Counterparty | Currency | type* | date | Value | face value | (depreciation) |
| Bank of America N.A. | | | | | |
| | Canadian Dollar | Sell | 7/21/21 | $2,363,474 | $2,309,871 | $(53,603) |
| | Chinese Yuan (Offshore) | Sell | 5/20/21 | 343,616 | 342,156 | (1,460) |
| | Czech Koruna | Buy | 6/16/21 | 174,309 | 173,235 | 1,074 |
| | Euro | Sell | 6/16/21 | 330,544 | 326,921 | (3,623) |
| | Hong Kong Dollar | Sell | 5/20/21 | 122,191 | 125,178 | 2,987 |
| | Japanese Yen | Sell | 5/19/21 | 7,552,588 | 7,868,978 | 316,390 |
| | Mexican Peso | Sell | 7/21/21 | 359,661 | 359,566 | (95) |
| | Norwegian Krone | Buy | 6/16/21 | 264,264 | 258,704 | 5,560 |
| | Russian Ruble | Buy | 6/16/21 | 256,661 | 259,172 | (2,511) |
| | Swiss Franc | Buy | 6/16/21 | 895,509 | 886,120 | 9,389 |
| Barclays Bank PLC | | | | | |
| | Australian Dollar | Buy | 7/21/21 | 125,687 | 126,030 | (343) |
| | British Pound | Sell | 6/16/21 | 839,763 | 844,359 | 4,596 |
| | Canadian Dollar | Sell | 7/21/21 | 628,746 | 614,609 | (14,137) |
| | Euro | Buy | 6/16/21 | 1,825,753 | 1,820,178 | 5,575 |
| | Indonesian Rupiah | Buy | 5/20/21 | 139,602 | 142,583 | (2,981) |
| | Japanese Yen | Buy | 5/19/21 | 3,005,401 | 3,130,679 | (125,278) |
| | Peruvian New Sol | Buy | 7/21/21 | 74,355 | 77,562 | (3,207) |
| | Swiss Franc | Buy | 6/16/21 | 436,297 | 436,000 | 297 |
| Citibank, N.A. | | | | | | |
| | Australian Dollar | Buy | 7/21/21 | 565,089 | 569,724 | (4,635) |
| | British Pound | Sell | 6/16/21 | 1,446,658 | 1,465,503 | 18,845 |
| | Canadian Dollar | Buy | 7/21/21 | 537,856 | 525,539 | 12,317 |
| | Chilean Peso | Buy | 7/21/21 | 153,449 | 152,458 | 991 |
| | Danish Krone | Sell | 6/16/21 | 261,287 | 262,251 | 964 |
| | Euro | Sell | 6/16/21 | 2,649,286 | 2,620,735 | (28,551) |
| | Japanese Yen | Buy | 5/19/21 | 303,866 | 331,452 | (27,586) |
| | New Zealand Dollar | Sell | 7/21/21 | 244,232 | 240,666 | (3,566) |
| | Romanian Leu | Buy | 6/16/21 | 84,010 | 84,797 | (787) |
| | Thai Baht | Buy | 5/19/21 | 401,601 | 416,034 | (14,433) |
| | | | | | |
| FORWARD CURRENCY CONTRACTS at 4/30/21 (aggregate face value $183,750,957) (Unaudited) cont. |
| | | | | | | Unrealized |
| | | Contract | Delivery | | Aggregate | appreciation/ |
| Counterparty | Currency | type* | date | Value | face value | (depreciation) |
| Credit Suisse International | | | | | |
| | British Pound | Sell | 6/16/21 | $1,070,283 | $1,083,179 | $12,896 |
| | Canadian Dollar | Sell | 7/21/21 | 606,125 | 592,337 | (13,788) |
| | Euro | Buy | 6/16/21 | 181,335 | 178,132 | 3,203 |
| Goldman Sachs International | | | | | |
| | Australian Dollar | Buy | 7/21/21 | 1,442,893 | 1,444,510 | (1,617) |
| | British Pound | Sell | 6/16/21 | 893,630 | 898,635 | 5,005 |
| | Canadian Dollar | Buy | 7/21/21 | 3,906,004 | 3,809,324 | 96,680 |
| | Chinese Yuan (Offshore) | Buy | 5/20/21 | 3,000,243 | 2,987,370 | 12,873 |
| | Euro | Buy | 6/16/21 | 4,911,352 | 4,850,787 | 60,565 |
| | Hong Kong Dollar | Sell | 5/20/21 | 201,381 | 201,824 | 443 |
| | Indonesian Rupiah | Buy | 5/20/21 | 384,429 | 393,020 | (8,591) |
| | Japanese Yen | Sell | 5/19/21 | 4,067,325 | 4,297,658 | 230,333 |
| | New Zealand Dollar | Sell | 7/21/21 | 2,898,876 | 2,855,233 | (43,643) |
| | Norwegian Krone | Buy | 6/16/21 | 2,516,505 | 2,474,478 | 42,027 |
| | Polish Zloty | Sell | 6/16/21 | 235,452 | 237,839 | 2,387 |
| | Russian Ruble | Sell | 6/16/21 | 31,058 | 31,363 | 305 |
| | South African Rand | Sell | 7/21/21 | 21,833 | 21,711 | (122) |
| | Swedish Krona | Buy | 6/16/21 | 221,513 | 238,593 | (17,080) |
| | Swiss Franc | Buy | 6/16/21 | 934,211 | 931,268 | 2,943 |
| HSBC Bank USA, National Association | | | | | |
| | Australian Dollar | Sell | 7/21/21 | 397,096 | 392,864 | (4,232) |
| | British Pound | Sell | 6/16/21 | 334,386 | 335,388 | 1,002 |
| | Canadian Dollar | Buy | 7/21/21 | 207,900 | 203,187 | 4,713 |
| | Chinese Yuan (Offshore) | Buy | 5/20/21 | 6,475,660 | 6,447,859 | 27,801 |
| | Euro | Sell | 6/16/21 | 14,906,245 | 14,748,139 | (158,106) |
| | Hong Kong Dollar | Sell | 5/20/21 | 473,558 | 477,820 | 4,262 |
| | Japanese Yen | Buy | 5/19/21 | 160,900 | 167,635 | (6,735) |
| | New Zealand Dollar | Buy | 7/21/21 | 375,648 | 378,526 | (2,878) |
| | Swiss Franc | Buy | 6/16/21 | 436,297 | 436,002 | 295 |
| JPMorgan Chase Bank N.A. | | | | | |
| | Australian Dollar | Buy | 7/21/21 | 1,516,564 | 1,521,362 | (4,798) |
| | British Pound | Sell | 6/16/21 | 764,074 | 772,154 | 8,080 |
| | Canadian Dollar | Sell | 7/21/21 | 1,397,204 | 1,369,393 | (27,811) |
| | Chinese Yuan (Offshore) | Buy | 5/20/21 | 2,052 | 2,043 | 9 |
| | Euro | Buy | 6/16/21 | 9,554,731 | 9,388,331 | 166,400 |
| | Japanese Yen | Sell | 5/19/21 | 1,478,689 | 1,547,702 | 69,013 |
| | New Zealand Dollar | Sell | 7/21/21 | 1,005,972 | 991,062 | (14,910) |
| | Norwegian Krone | Buy | 6/16/21 | 43,468 | 40,887 | 2,581 |
| | Singapore Dollar | Buy | 5/19/21 | 225,274 | 224,861 | 413 |
| | South Korean Won | Buy | 5/20/21 | 1,431,429 | 1,427,542 | 3,887 |
| | Swedish Krona | Sell | 6/16/21 | 748,454 | 745,286 | (3,168) |
| | Swiss Franc | Sell | 6/16/21 | 400,348 | 398,418 | (1,930) |
| | | | | | |
| FORWARD CURRENCY CONTRACTS at 4/30/21 (aggregate face value $183,750,957) (Unaudited) cont. |
| | | | | | | Unrealized |
| | | Contract | Delivery | | Aggregate | appreciation/ |
| Counterparty | Currency | type* | date | Value | face value | (depreciation) |
| Morgan Stanley & Co. International PLC | | | | |
| | Australian Dollar | Buy | 7/21/21 | $125,609 | $122,984 | $2,625 |
| | British Pound | Buy | 6/16/21 | 6,271,704 | 6,329,971 | (58,267) |
| | Canadian Dollar | Buy | 7/21/21 | 1,321,775 | 1,282,025 | 39,750 |
| | Danish Krone | Sell | 6/16/21 | 938 | 936 | (2) |
| | Euro | Buy | 6/16/21 | 2,595,378 | 2,560,579 | 34,799 |
| | Japanese Yen | Buy | 5/19/21 | 4,132,449 | 4,262,461 | (130,012) |
| | New Zealand Dollar | Sell | 7/21/21 | 259,183 | 255,727 | (3,456) |
| | Norwegian Krone | Buy | 6/16/21 | 441,029 | 446,135 | (5,106) |
| | Swedish Krona | Sell | 6/16/21 | 93,970 | 112,116 | 18,146 |
| | Swiss Franc | Buy | 6/16/21 | 37,928 | 37,805 | 123 |
| NatWest Markets PLC | | | | | |
| | Australian Dollar | Sell | 7/21/21 | 844,590 | 835,634 | (8,956) |
| | British Pound | Buy | 6/16/21 | 901,087 | 912,929 | (11,842) |
| | Canadian Dollar | Sell | 7/21/21 | 486,348 | 473,303 | (13,045) |
| | Chinese Yuan (Offshore) | Buy | 5/20/21 | 104,324 | 103,718 | 606 |
| | Euro | Sell | 6/16/21 | 8,354,689 | 8,276,048 | (78,641) |
| | Japanese Yen | Buy | 5/19/21 | 1,307,636 | 1,357,523 | (49,887) |
| | New Zealand Dollar | Sell | 7/21/21 | 2,120,253 | 2,088,501 | (31,752) |
| | Swedish Krona | Buy | 6/16/21 | 505,139 | 506,024 | (885) |
| State Street Bank and Trust Co. | | | | | |
| | Australian Dollar | Buy | 7/21/21 | 143,719 | 195,898 | (52,179) |
| | British Pound | Sell | 6/16/21 | 2,709,203 | 2,762,846 | 53,643 |
| | Canadian Dollar | Sell | 7/21/21 | 2,219,449 | 2,191,246 | (28,203) |
| | Chinese Yuan (Offshore) | Buy | 5/20/21 | 1,402,934 | 1,403,710 | (776) |
| | Euro | Sell | 6/16/21 | 10,702,549 | 10,612,550 | (89,999) |
| | Hong Kong Dollar | Sell | 5/20/21 | 2,507,426 | 2,512,814 | 5,388 |
| | Hungarian Forint | Buy | 6/16/21 | 138,187 | 137,132 | 1,055 |
| | Israeli Shekel | Buy | 7/21/21 | 169,146 | 166,740 | 2,406 |
| | Japanese Yen | Sell | 5/19/21 | 1,003,128 | 1,030,308 | 27,180 |
| | New Zealand Dollar | Sell | 7/21/21 | 1,768,857 | 1,708,459 | (60,398) |
| | Norwegian Krone | Sell | 6/16/21 | 467,725 | 449,838 | (17,887) |
| | Swedish Krona | Sell | 6/16/21 | 211,268 | 179,149 | (32,119) |
| | Swiss Franc | Buy | 6/16/21 | 962,815 | 985,552 | (22,737) |
| Toronto-Dominion Bank | | | | | |
| | Australian Dollar | Buy | 7/21/21 | 507,448 | 504,098 | 3,350 |
| | British Pound | Buy | 6/16/21 | 322,093 | 327,792 | (5,699) |
| | Canadian Dollar | Buy | 7/21/21 | 200,171 | 200,398 | (227) |
| | Chinese Yuan (Offshore) | Sell | 5/20/21 | 2,981,542 | 2,968,071 | (13,471) |
| | Euro | Sell | 6/16/21 | 3,850,892 | 3,818,255 | (32,637) |
| | Hong Kong Dollar | Sell | 5/20/21 | 291,798 | 292,427 | 629 |
| | Japanese Yen | Buy | 5/19/21 | 696,689 | 702,930 | (6,241) |
| | New Zealand Dollar | Buy | 7/21/21 | 356,476 | 357,215 | (739) |
| | Norwegian Krone | Buy | 6/16/21 | 786,425 | 767,521 | 18,904 |
| | | | | | |
| FORWARD CURRENCY CONTRACTS at 4/30/21 (aggregate face value $183,750,957) (Unaudited) cont. |
| | | | | | | Unrealized |
| | | Contract | Delivery | | Aggregate | appreciation/ |
| Counterparty | Currency | type* | date | Value | face value | (depreciation) |
| Toronto-Dominion Bank cont. | | | | | |
| | Swedish Krona | Sell | 6/16/21 | $14,003 | $13,785 | $(218) |
| | Swiss Franc | Sell | 6/16/21 | 677,688 | 672,429 | (5,259) |
| UBS AG | | | | | | |
| | British Pound | Sell | 6/16/21 | 2,661,828 | 2,698,255 | 36,427 |
| | Canadian Dollar | Buy | 7/21/21 | 1,284,263 | 1,242,946 | 41,317 |
| | Chinese Yuan (Offshore) | Buy | 5/20/21 | 201,102 | 198,183 | 2,919 |
| | Euro | Buy | 6/16/21 | 5,429,609 | 5,345,877 | 83,732 |
| | Hong Kong Dollar | Sell | 5/20/21 | 124,328 | 127,287 | 2,959 |
| | Japanese Yen | Buy | 5/19/21 | 4,705,719 | 4,748,135 | (42,416) |
| | New Zealand Dollar | Sell | 7/21/21 | 1,651,463 | 1,622,017 | (29,446) |
| | Norwegian Krone | Buy | 6/16/21 | 155,212 | 153,149 | 2,063 |
| | Swedish Krona | Buy | 6/16/21 | 3,389,555 | 3,395,153 | (5,598) |
| | Swiss Franc | Buy | 6/16/21 | 203,241 | 215,482 | (12,241) |
| WestPac Banking Corp. | | | | | |
| | British Pound | Buy | 6/16/21 | 382,176 | 392,565 | (10,389) |
| | Canadian Dollar | Buy | 7/21/21 | 1,024,611 | 1,001,379 | 23,232 |
| | Euro | Sell | 6/16/21 | 71,114 | 52,853 | (18,261) |
| | Japanese Yen | Sell | 5/19/21 | 121,191 | 129,202 | 8,011 |
| | New Zealand Dollar | Sell | 7/21/21 | 1,206,209 | 1,188,110 | (18,099) |
| Unrealized appreciation | | | | | 1,546,365 |
| Unrealized (depreciation) | | | | | (1,493,295) |
| Total | | | | | | $53,070 |
* The exchange currency for all contracts listed is the United States Dollar.
| | | | | |
| FUTURES CONTRACTS OUTSTANDING at 4/30/21 (Unaudited) | | | |
| | | | | | Unrealized |
| | Number of | Notional | | Expiration | appreciation/ |
| | contracts | amount | Value | date | (depreciation) |
| Australian Government Treasury | | | | | |
| Bond 3 yr (Long) | 7 | $631,593 | $631,594 | Jun-21 | $1,618 |
| Canadian Government Bond | | | | | |
| 10 yr (Long) | 7 | 793,654 | 793,654 | Jun-21 | (17,962) |
| Euro-Bobl 5 yr (Long) | 21 | 3,401,562 | 3,401,561 | Jun-21 | (7,127) |
| Euro-Bund 10 yr (Long) | 16 | 3,270,120 | 3,270,119 | Jun-21 | (32,375) |
| Euro-Buxl 30 yr (Long) | 7 | 1,699,140 | 1,699,139 | Jun-21 | (57,314) |
| Euro-Schatz 2 yr (Short) | 7 | 943,237 | 943,237 | Jun-21 | 153 |
| Japanese Government Bond | | | | | |
| 10 yr (Long) | 5 | 6,923,781 | 6,923,781 | Jun-21 | 27,880 |
| Japanese Government Bond | | | | | |
| 10 yr (Short) | 10 | 13,847,562 | 13,847,562 | Jun-21 | (55,869) |
| Japanese Government Bond | | | | | |
| 10 yr Mini (Long) | 4 | 553,719 | 553,719 | Jun-21 | 2,143 |
| U.K. Gilt 10 yr (Long) | 28 | 4,936,922 | 4,936,921 | Jun-21 | (42,372) |
| U.S. Treasury Bond 30 yr (Long) | 17 | 2,673,250 | 2,673,250 | Jun-21 | (57,148) |
| U.S. Treasury Bond Ultra 30 yr (Long) | 14 | 2,602,688 | 2,602,688 | Jun-21 | (57,672) |
| | | | | |
| FUTURES CONTRACTS OUTSTANDING at 4/30/21 (Unaudited) cont. | | |
| | | | | | Unrealized |
| | Number of | Notional | | Expiration | appreciation/ |
| | contracts | amount | Value | date | (depreciation) |
| U.S. Treasury Note 2 yr (Short) | 198 | $43,710,047 | $43,710,047 | Jun-21 | $35,211 |
| U.S. Treasury Note 5 yr (Short) | 92 | 11,402,250 | 11,402,250 | Jun-21 | (37,355) |
| U.S. Treasury Note 10 yr (Long) | 41 | 5,413,281 | 5,413,281 | Jun-21 | (97,467) |
| U.S. Treasury Note Ultra 10 yr (Long) | 15 | 2,183,203 | 2,183,203 | Jun-21 | (50,893) |
| Unrealized appreciation | | | | | 67,005 |
| Unrealized (depreciation) | | | | | (513,554) |
| Total | | | | | $(446,549) |
| | | | |
| WRITTEN SWAP OPTIONS OUTSTANDING at 4/30/21 (premiums $2,788,126) (Unaudited) | |
| Counterparty | | | Notional/ | |
| Fixed Obligation % to receive or (pay)/ | Expiration | | contract | |
| Floating rate index/Maturity date | date/strike | | amount | Value |
| Bank of America N.A. | | | | |
| 0.985/3 month USD-LIBOR-BBA/Jan-25 | Jan-24/0.985 | | $14,042,100 | $90,010 |
| 2.074/3 month USD-LIBOR-BBA/Dec-53 | Dec-23/2.074 | | 1,123,400 | 134,752 |
| Citibank, N.A. | | | | |
| 1.722/3 month USD-LIBOR-BBA/Jun-31 | Jun-21/1.722 | | 944,700 | 5,470 |
| (1.865)/3 month USD-LIBOR-BBA/Oct-39 | Oct-29/1.865 | | 448,600 | 18,491 |
| 1.865/3 month USD-LIBOR-BBA/Oct-39 | Oct-29/1.865 | | 448,600 | 40,127 |
| Goldman Sachs International | | | | |
| 2.823/3 month USD-LIBOR-BBA/May-27 | May-22/2.823 | | 2,601,000 | 4,552 |
| 1.722/6 month GBP-LIBOR-BBA/Feb-39 | Feb-29/1.722 | GBP | 242,000 | 17,209 |
| (1.722)/6 month GBP-LIBOR-BBA/Feb-39 | Feb-29/1.722 | GBP | 242,000 | 23,836 |
| 1.564/3 month USD-LIBOR-BBA/May-31 | May-21/1.564 | | $5,432,300 | 49,760 |
| 2.317/3 month USD-LIBOR-BBA/Dec-31 | Dec-21/2.317 | | 11,606,000 | 92,268 |
| (1.519)/3 month USD-LIBOR-BBA/Sep-31 | Sep-21/1.519 | | 11,606,000 | 113,971 |
| JPMorgan Chase Bank N.A. | | | | |
| 1.333/3 month USD-LIBOR-BBA/Jan-24 | Jan-23/1.333 | | 504,100 | 620 |
| (1.333)/3 month USD-LIBOR-BBA/Jan-24 | Jan-23/1.333 | | 504,100 | 3,710 |
| (0.968)/3 month USD-LIBOR-BBA/Mar-35 | Mar-25/0.968 | | 1,046,200 | 12,575 |
| 1.667/6 month EUR-EURIBOR-Reuters/Feb-36 | Feb-26/1.667 | EUR | 532,300 | 13,324 |
| (1.07)/3 month USD-LIBOR-BBA/Mar-32 | Mar-27/1.07 | | $1,657,100 | 16,256 |
| (1.667)/6 month EUR-EURIBOR-Reuters/Feb-36 | Feb-26/1.667 | EUR | 532,300 | 73,058 |
| 3.229/3 month USD-LIBOR-BBA/Nov-33 | Nov-23/3.229 | | $6,153,900 | 95,570 |
| 1.07/3 month USD-LIBOR-BBA/Mar-32 | Mar-27/1.07 | | 1,657,100 | 117,107 |
| 0.968/3 month USD-LIBOR-BBA/Mar-35 | Mar-25/0.968 | | 1,046,200 | 141,174 |
| (3.229)/3 month USD-LIBOR-BBA/Nov-33 | Nov-23/3.229 | | 6,153,900 | 672,006 |
| Morgan Stanley & Co. International PLC | | | | |
| 2.664/3 month USD-LIBOR-BBA/May-26 | May-21/2.664 | | 1,114,700 | 1 |
| 3.01/3 month USD-LIBOR-BBA/Feb-36 | Feb-26/3.01 | | 191,400 | 6,919 |
| 2.97/3 month USD-LIBOR-BBA/Feb-36 | Feb-26/2.97 | | 191,400 | 7,097 |
| (2.97)/3 month USD-LIBOR-BBA/Feb-36 | Feb-26/2.97 | | 191,400 | 16,196 |
| (3.01)/3 month USD-LIBOR-BBA/Feb-36 | Feb-26/3.01 | | 191,400 | 16,631 |
| (1.512)/3 month USD-LIBOR-BBA/Aug-32 | Aug-22/1.512 | | 1,059,500 | 17,111 |
| 1.512/3 month USD-LIBOR-BBA/Aug-32 | Aug-22/1.512 | | 1,059,500 | 59,396 |
| | | |
| WRITTEN SWAP OPTIONS OUTSTANDING at 4/30/21 (premiums $2,788,126) (Unaudited) cont. | |
| Counterparty | | Notional/ | |
| Fixed Obligation % to receive or (pay)/ | Expiration�� | contract | |
| Floating rate index/Maturity date | date/strike | amount | Value |
| Morgan Stanley & Co. International PLC cont. | | | |
| (2.75)/3 month USD-LIBOR-BBA/May-49 | May-25/2.75 | $1,590,200 | $232,694 |
| (3.00)/3 month USD-LIBOR-BBA/Jan-49 | Jan-24/3.00 | 1,590,200 | 290,386 |
| (3.00)/3 month USD-LIBOR-BBA/Apr-48 | Apr-23/3.00 | 1,590,200 | 292,851 |
| Toronto-Dominion Bank | | | |
| (1.17)/3 month USD-LIBOR-BBA/Mar-55 | Mar-25/1.17 | 145,700 | 5,285 |
| 1.05/3 month USD-LIBOR-BBA/Mar-27 | Mar-25/1.05 | 1,108,000 | 24,498 |
| 1.17/3 month USD-LIBOR-BBA/Mar-55 | Mar-25/1.17 | 291,400 | 80,412 |
| UBS AG | | | |
| (1.9875)/3 month USD-LIBOR-BBA/Oct-36 | Oct-26/1.9875 | 520,300 | 20,729 |
| 1.9875/3 month USD-LIBOR-BBA/Oct-36 | Oct-26/1.9875 | 520,300 | 41,223 |
| Total | | | $2,847,275 |
| | | | |
| WRITTEN OPTIONS OUTSTANDING at 4/30/21 (premiums $34,375) (Unaudited) | |
| | Expiration | Notional | Contract | |
| Counterparty | date/strike price | amount | amount | Value |
| JPMorgan Chase Bank N.A. | | | | |
| Uniform Mortgage-Backed | | | | |
| Securities 30 yr 4.00% TBA | | | | |
| commitments (Put) | May-21/$107.44 | $5,000,000 | $5,000,000 | $1,870 |
| Uniform Mortgage-Backed | | | | |
| Securities 30 yr 3.00% TBA | | | | |
| commitments (Put) | May-21/104.45 | 17,000,000 | 17,000,000 | 2,618 |
| Total | | | | $4,488 |
| | | | | |
| FORWARD PREMIUM SWAP OPTION CONTRACTS OUTSTANDING at 4/30/21 (Unaudited) | |
| Counterparty | | | | | |
| Fixed right or obligation % to receive | | | Notional/ | Premium | Unrealized |
| or (pay)/Floating rate index/ | Expiration | | contract | receivable/ | appreciation/ |
| Maturity date | date/strike | | amount | (payable) | (depreciation) |
| Bank of America N.A. | | | | | |
| (0.765)/3 month USD-LIBOR-BBA/ | | | | | |
| Sep-31 (Purchased) | Sep-21/0.765 | | $1,825,500 | $(43,264) | $122,345 |
| (1.275)/3 month USD-LIBOR-BBA/ | | | | | |
| Mar-50 (Purchased) | Mar-30/1.275 | | 1,070,200 | (139,394) | 91,352 |
| 2.2275/3 month USD-LIBOR-BBA/ | | | | | |
| May-24 (Purchased) | May-22/2.2275 | 2,989,900 | (27,582) | 68,170 |
| (1.76)/3 month USD-LIBOR-BBA/ | | | | | |
| Jan-29 (Purchased) | Jan-28/1.76 | | 13,537,300 | (87,485) | 59,699 |
| (0.925)/3 month USD-LIBOR-BBA/ | | | | | |
| Mar-40 (Purchased) | Mar-30/0.925 | | 564,100 | (40,390) | 44,400 |
| 1.304/6 month EUR-EURIBOR- | | | | | |
| Reuters/Jun-54 (Purchased) | Jun-24/1.304 | EUR | 252,800 | (40,969) | 27,499 |
| (2.3075)/3 month USD-LIBOR-BBA/ | | | | | |
| Jun-52 (Purchased) | Jun-22/2.3075 | $802,700 | (18,160) | 25,133 |
| (0.85)/3 month USD-LIBOR-BBA/ | | | | | |
| Mar-40 (Purchased) | Mar-30/0.85 | | 287,300 | (20,973) | 23,613 |
| | | | | |
| FORWARD PREMIUM SWAP OPTION CONTRACTS OUTSTANDING at 4/30/21 (Unaudited) cont. | |
| Counterparty | | | | | |
| Fixed right or obligation % to receive | | | Notional/ | Premium | Unrealized |
| or (pay)/Floating rate index/ | Expiration | | contract | receivable/ | appreciation/ |
| Maturity date | date/strike | | amount | (payable) | (depreciation) |
| Bank of America N.A. cont. | | | | | |
| 1.053/6 month EUR-EURIBOR- | | | | | |
| Reuters/Jun-54 (Purchased) | Jun-24/1.053 | EUR | 133,700 | $(30,493) | $13,099 |
| 2.29/3 month USD-LIBOR-BBA/ | | | | | |
| Mar-34 (Purchased) | Mar-24/2.29 | | $678,400 | (33,368) | 88 |
| (1.053)/6 month EUR-EURIBOR- | | | | | |
| Reuters/Jun-54 (Purchased) | Jun-24/1.053 | EUR | 133,700 | (30,493) | (5,650) |
| (1.304)/6 month EUR-EURIBOR- | | | | | |
| Reuters/Jun-54 (Purchased) | Jun-24/1.304 | EUR | 252,800 | (20,484) | (7,264) |
| 2.17/3 month USD-LIBOR-BBA/ | | | | | |
| Apr-34 (Purchased) | Apr-24/2.17 | | $1,938,200 | (93,615) | (8,703) |
| 0.85/3 month USD-LIBOR-BBA/ | | | | | |
| Mar-40 (Purchased) | Mar-30/0.85 | | 287,300 | (20,973) | (13,043) |
| 1.76/3 month USD-LIBOR-BBA/ | | | | | |
| Jan-29 (Purchased) | Jan-28/1.76 | | 13,537,300 | (87,485) | (19,900) |
| 0.925/3 month USD-LIBOR-BBA/ | | | | | |
| Mar-40 (Purchased) | Mar-30/0.925 | | 564,100 | (40,390) | (24,245) |
| (2.2275)/3 month USD-LIBOR-BBA/ | | | | | |
| May-24 (Purchased) | May-22/2.2275 | | 2,989,900 | (27,582) | (27,088) |
| 0.765/3 month USD-LIBOR-BBA/ | | | | | |
| Sep-31 (Purchased) | Sep-21/0.765 | | 1,825,500 | (43,264) | (42,571) |
| 1.275/3 month USD-LIBOR-BBA/ | | | | | |
| Mar-50 (Purchased) | Mar-30/1.275 | | 1,070,200 | (139,394) | (73,715) |
| 2.3075/3 month USD-LIBOR-BBA/ | | | | | |
| Jun-52 (Purchased) | Jun-22/2.3075 | | 802,700 | (377,410) | (301,446) |
| (1.115)/3 month USD-LIBOR-BBA/ | | | | | |
| Jan-26 (Written) | Jan-25/1.115 | | 13,537,300 | 57,026 | 19,088 |
| 2.525/3 month USD-LIBOR-BBA/ | | | | | |
| Apr-41 (Written) | Apr-31/2.525 | | 7,780,200 | 564,065 | 11,904 |
| (1.085)/3 month USD-LIBOR-BBA/ | | | | | |
| Apr-34 (Written) | Apr-24/1.085 | | 3,876,400 | 53,204 | 6,590 |
| (1.29)/3 month USD-LIBOR-BBA/ | | | | | |
| Mar-34 (Written) | Mar-24/1.29 | | 969,100 | 15,118 | 165 |
| (2.525)/3 month USD-LIBOR-BBA/ | | | | | |
| Apr-41 (Written) | Apr-31/2.525 | | 7,780,200 | 564,065 | (31,899) |
| 1.115/3 month USD-LIBOR-BBA/ | | | | | |
| Jan-26 (Written) | Jan-25/1.115 | | 13,537,300 | 57,026 | (67,822) |
| Barclays Bank PLC | | | | | |
| 1.11125/6 month JPY-LIBOR-BBA/ | | | | | |
| Aug-43 (Purchased) | Aug-23/1.11125 | JPY | 54,505,300 | (27,570) | 33,235 |
| (1.11125)/6 month JPY-LIBOR-BBA/ | | | | | |
| Aug-43 (Purchased) | Aug-23/1.11125 | JPY | 54,505,300 | (27,570) | (26,163) |
| Citibank, N.A. | | | | | |
| (0.462)/3 month USD-LIBOR-BBA/ | | | | | |
| Jun-26 (Purchased) | Jun-21/0.462 | | $3,847,500 | (37,273) | 66,408 |
| (1.007)/3 month USD-LIBOR-BBA/ | | | | | |
| Jun-31 (Purchased) | Jun-21/1.007 | | 1,404,200 | (22,713) | 64,017 |
| | | | |
| FORWARD PREMIUM SWAP OPTION CONTRACTS OUTSTANDING at 4/30/21 (Unaudited) cont. | |
| Counterparty | | | | |
| Fixed right or obligation % to receive | | Notional/ | Premium | Unrealized |
| or (pay)/Floating rate index/ | Expiration | contract | receivable/ | appreciation/ |
| Maturity date | date/strike | amount | (payable) | (depreciation) |
| Citibank, N.A. cont. | | | | |
| (1.102)/3 month USD-LIBOR-BBA/ | | | | |
| Nov-32 (Purchased) | Nov-22/1.102 | $674,000 | $(21,416) | $39,820 |
| (1.625)/3 month USD-LIBOR-BBA/ | | | | |
| Jan-61 (Purchased) | Jan-41/1.625 | 933,600 | (137,706) | 20,651 |
| 2.689/3 month USD-LIBOR-BBA/ | | | | |
| Nov-49 (Purchased) | Nov-24/2.689 | 377,000 | (48,539) | 5,772 |
| (1.583)/3 month USD-LIBOR-BBA/ | | | | |
| May-31 (Purchased) | May-21/1.583 | 783,500 | (7,012) | 321 |
| (0.962)/3 month USD-LIBOR-BBA/ | | | | |
| May-26 (Purchased) | May-21/0.962 | 1,518,400 | (5,618) | (304) |
| 0.962/3 month USD-LIBOR-BBA/ | | | | |
| May-26 (Purchased) | May-21/0.962 | 1,518,400 | (5,618) | (1,275) |
| 1.583/3 month USD-LIBOR-BBA/ | | | | |
| May-31 (Purchased) | May-21/1.583 | 783,500 | (7,012) | (4,074) |
| 1.102/3 month USD-LIBOR-BBA/ | | | | |
| Nov-32 (Purchased) | Nov-22/1.102 | 674,000 | (21,416) | (15,893) |
| 1.625/3 month USD-LIBOR-BBA/ | | | | |
| Jan-61 (Purchased) | Jan-41/1.625 | 933,600 | (137,706) | (18,289) |
| (2.689)/3 month USD-LIBOR-BBA/ | | | | |
| Nov-49 (Purchased) | Nov-24/2.689 | 377,000 | (48,539) | (21,685) |
| 1.007/3 month USD-LIBOR-BBA/ | | | | |
| Jun-31 (Purchased) | Jun-21/1.007 | 1,404,200 | (22,713) | (22,678) |
| 0.462/3 month USD-LIBOR-BBA/ | | | | |
| Jun-26 (Purchased) | Jun-21/0.462 | 3,847,500 | (37,273) | (37,090) |
| (1.918)/3 month USD-LIBOR-BBA/ | | | | |
| Jan-51 (Written) | Jan-31/1.918 | 1,123,800 | 134,406 | 27,106 |
| 1.245/3 month USD-LIBOR-BBA/ | | | | |
| Aug-24 (Written) | Aug-22/1.245 | 2,092,900 | 19,150 | 14,588 |
| (1.177)/3 month USD-LIBOR-BBA/ | | | | |
| Jul-40 (Written) | Jul-30/1.177 | 110,100 | 8,346 | 4,565 |
| (1.245)/3 month USD-LIBOR-BBA/ | | | | |
| Aug-24 (Written) | Aug-22/1.245 | 2,092,900 | 19,150 | (4,856) |
| 1.177/3 month USD-LIBOR-BBA/ | | | | |
| Jul-40 (Written) | Jul-30/1.177 | 110,100 | 8,346 | (6,509) |
| 1.918/3 month USD-LIBOR-BBA/ | | | | |
| Jan-51 (Written) | Jan-31/1.918 | 1,123,800 | 134,406 | (38,423) |
| Goldman Sachs International | | | | |
| (1.727)/3 month USD-LIBOR-BBA/ | | | | |
| Jan-55 (Purchased) | Jan-25/1.727 | 609,000 | (91,046) | 22,844 |
| 2.8175/3 month USD-LIBOR-BBA/ | | | | |
| Mar-47 (Purchased) | Mar-27/2.8175 | 371,900 | (46,952) | 6,404 |
| 1.727/3 month USD-LIBOR-BBA/ | | | | |
| Jan-55 (Purchased) | Jan-25/1.727 | 609,000 | (55,845) | (14,305) |
| (2.8175)/3 month USD-LIBOR-BBA/ | | | | |
| Mar-47 (Purchased) | Mar-27/2.8175 | 371,900 | (46,952) | (18,071) |
| | | | | |
| FORWARD PREMIUM SWAP OPTION CONTRACTS OUTSTANDING at 4/30/21 (Unaudited) cont. | |
| Counterparty | | | | | |
| Fixed right or obligation % to receive | | | Notional/ | Premium | Unrealized |
| or (pay)/Floating rate index/ | Expiration | | contract | receivable/ | appreciation/ |
| Maturity date | date/strike | | amount | (payable) | (depreciation) |
| Goldman Sachs International cont. | | | | | |
| (0.555)/6 month EUR-EURIBOR- | | | | | |
| Reuters/Mar-40 (Written) | Mar-30/0.555 | EUR | 235,050 | $35,495 | $5,937 |
| 0.555/6 month EUR-EURIBOR- | | | | | |
| Reuters/Mar-40 (Written) | Mar-30/0.555 | EUR | 235,050 | 35,495 | (5,007) |
| JPMorgan Chase Bank N.A. | | | | | |
| 1.921/6 month EUR-EURIBOR- | | | | | |
| Reuters/Oct-48 (Purchased) | Oct-28/1.921 | EUR | 759,100 | (97,077) | 130,707 |
| 2.8325/3 month USD-LIBOR-BBA/ | | | | | |
| Feb-52 (Purchased) | Feb-22/2.8325 | | $1,859,600 | (259,647) | 78,661 |
| (1.445)/6 month AUD-BBR-BBSW/ | | | | | |
| Mar-40 (Purchased) | Mar-30/1.445 | AUD | 261,200 | (9,791) | 14,534 |
| (1.441)/6 month AUD-BBR-BBSW/ | | | | | |
| Jul-45 (Purchased) | Jul-25/1.441 | AUD | 125,100 | (7,399) | 12,153 |
| 2.50/3 month USD-LIBOR-BBA/ | | | | | |
| Nov-39 (Purchased) | Nov-29/2.50 | | $628,600 | (36,333) | 7,763 |
| (1.692)/6 month AUD-BBR-BBSW/ | | | | | |
| Jan-35 (Purchased) | Jan-25/1.692 | AUD | 163,800 | (5,110) | 7,452 |
| 2.902/3 month USD-LIBOR-BBA/ | | | | | |
| Nov-49 (Purchased) | Nov-24/2.902 | | $377,000 | (58,284) | 5,926 |
| (2.032)/3 month USD-LIBOR-BBA/ | | | | | |
| Jan-55 (Purchased) | Jan-25/2.032 | | 187,600 | (21,668) | 5,427 |
| 1.692/6 month AUD-BBR-BBSW/ | | | | | |
| Jan-35 (Purchased) | Jan-25/1.692 | AUD | 163,800 | (5,110) | (3,837) |
| 2.032/3 month USD-LIBOR-BBA/ | | | | | |
| Jan-55 (Purchased) | Jan-25/2.032 | | $187,600 | (21,668) | (4,107) |
| 1.441/6 month AUD-BBR-BBSW/ | | | | | |
| Jul-45 (Purchased) | Jul-25/1.441 | AUD | 125,100 | (7,399) | (6,254) |
| 1.445/6 month AUD-BBR-BBSW/ | | | | | |
| Mar-40 (Purchased) | Mar-30/1.445 | AUD | 261,200 | (9,791) | (7,620) |
| (2.902)/3 month USD-LIBOR-BBA/ | | | | | |
| Nov-49 (Purchased) | Nov-24/2.902 | | $377,000 | (40,452) | (18,997) |
| (2.50)/3 month USD-LIBOR-BBA/ | | | | | |
| Nov-39 (Purchased) | Nov-29/2.50 | | 628,600 | (65,374) | (19,700) |
| (1.921)/6 month EUR-EURIBOR- | | | | | |
| Reuters/Oct-48 (Purchased) | Oct-28/1.921 | EUR | 759,100 | (97,077) | (64,276) |
| (2.8325)/3 month USD-LIBOR-BBA/ | | | | | |
| Feb-52 (Purchased) | Feb-22/2.8325 | | $1,859,600 | (259,647) | (234,737) |
| (1.168)/3 month USD-LIBOR-BBA/ | | | | | |
| Jun-37 (Written) | Jun-27/1.168 | | 1,539,000 | 99,035 | 62,376 |
| (1.232)/3 month USD-LIBOR-BBA/ | | | | | |
| Jun-37 (Written) | Jun-27/1.232 | | 333,100 | 21,402 | 13,084 |
| (1.204)/3 month USD-LIBOR-BBA/ | | | | | |
| Jun-40 (Written) | Jun-30/1.204 | | 264,200 | 19,696 | 10,550 |
| 1.204/3 month USD-LIBOR-BBA/ | | | | | |
| Jun-40 (Written) | Jun-30/1.204 | | 264,200 | 19,696 | (15,493) |
| | | | | |
| FORWARD PREMIUM SWAP OPTION CONTRACTS OUTSTANDING at 4/30/21 (Unaudited) cont. | |
| Counterparty | | | | | |
| Fixed right or obligation % to receive | | | Notional/ | Premium | Unrealized |
| or (pay)/Floating rate index/ | Expiration | | contract | receivable/ | appreciation/ |
| Maturity date | date/strike | | amount | (payable) | (depreciation) |
| JPMorgan Chase Bank N.A. cont. | | | | | |
| 1.232/3 month USD-LIBOR-BBA/ | | | | | |
| Jun-37 (Written) | Jun-27/1.232 | | $333,100 | $21,402 | $(21,315) |
| 1.168/3 month USD-LIBOR-BBA/ | | | | | |
| Jun-37 (Written) | Jun-27/1.168 | | 1,539,000 | 99,035 | (104,775) |
| Morgan Stanley & Co. International PLC | | | | | |
| 3.27/3 month USD-LIBOR-BBA/ | | | | | |
| Oct-53 (Purchased) | Oct-23/3.27 | | 734,900 | (83,852) | 110,448 |
| 2.505/3 month USD-LIBOR-BBA/ | | | | | |
| Nov-49 (Purchased) | Nov-24/2.505 | | 377,000 | (40,565) | 5,142 |
| (2.505)/3 month USD-LIBOR-BBA/ | | | | | |
| Nov-49 (Purchased) | Nov-24/2.505 | | 377,000 | (57,756) | (25,775) |
| (3.27)/3 month USD-LIBOR-BBA/ | | | | | |
| Oct-53 (Purchased) | Oct-23/3.27 | | 734,900 | (83,852) | (62,790) |
| 2.39/3 month USD-LIBOR-BBA/ | | | | | |
| Jun-34 (Written) | Jun-24/2.39 | | 972,300 | 51,192 | 8,644 |
| (2.39)/3 month USD-LIBOR-BBA/ | | | | | |
| Jun-34 (Written) | Jun-24/2.39 | | 972,300 | 51,192 | (1,595) |
| Toronto-Dominion Bank | | | | | |
| (1.50)/3 month USD-LIBOR-BBA/ | | | | | |
| Feb-33 (Purchased) | Feb-23/1.50 | | 5,006,300 | (172,092) | 162,304 |
| (1.937)/3 month USD-LIBOR-BBA/ | | | | | |
| Feb-36 (Purchased) | Feb-26/1.937 | | 2,002,500 | (104,731) | 56,190 |
| (2.405)/3 month USD-LIBOR-BBA/ | | | | | |
| Mar-41 (Purchased) | Mar-31/2.405 | | 94,500 | (6,591) | 489 |
| 2.405/3 month USD-LIBOR-BBA/ | | | | | |
| Mar-41 (Purchased) | Mar-31/2.405 | | 94,500 | (6,591) | 129 |
| 1.937/3 month USD-LIBOR-BBA/ | | | | | |
| Feb-36 (Purchased) | Feb-26/1.937 | | 2,002,500 | (104,731) | (27,494) |
| 1.50/3 month USD-LIBOR-BBA/ | | | | | |
| Feb-33 (Purchased) | Feb-23/1.50 | | 5,006,300 | (172,092) | (85,758) |
| (2.095)/3 month USD-LIBOR-BBA/ | | | | | |
| Feb-56 (Written) | Feb-26/2.095 | | 864,900 | 113,734 | 17,869 |
| (1.775)/3 month USD-LIBOR-BBA/ | | | | | |
| Mar-32 (Written) | Mar-22/1.775 | | 245,600 | 6,693 | 899 |
| 1.775/3 month USD-LIBOR-BBA/ | | | | | |
| Mar-32 (Written) | Mar-22/1.775 | | 245,600 | 6,693 | (314) |
| 2.095/3 month USD-LIBOR-BBA/ | | | | | |
| Feb-56 (Written) | Feb-26/2.095 | | 864,900 | 113,734 | (15,188) |
| UBS AG | | | | | |
| (0.271)/6 month EUR-EURIBOR- | | | | | |
| Reuters/Jan-36 (Purchased) | Jan-26/0.271 | EUR | 3,206,200 | (167,689) | 128,129 |
| (0.44)/6 month EUR-EURIBOR- | | | | | |
| Reuters/Feb-41 (Purchased) | Feb-31/0.44 | EUR | 2,404,600 | (188,646) | 94,331 |
| (0.45)/6 month EUR-EURIBOR- | | | | | |
| Reuters/Jan-41 (Purchased) | Jan-31/0.45 | EUR | 1,923,700 | (151,327) | 73,639 |
| (0.902)/3 month USD-LIBOR-BBA/ | | | | | |
| Apr-35 (Purchased) | Apr-25/0.902 | | $860,100 | (48,123) | 73,272 |
| | | | | |
| FORWARD PREMIUM SWAP OPTION CONTRACTS OUTSTANDING at 4/30/21 (Unaudited) cont. | |
| Counterparty | | | | | |
| Fixed right or obligation % to receive | | | Notional/ | Premium | Unrealized |
| or (pay)/Floating rate index/ | Expiration | | contract | receivable/ | appreciation/ |
| Maturity date | date/strike | | amount | (payable) | (depreciation) |
| UBS AG cont. | | | | | |
| (0.87)/3 month USD-LIBOR-BBA/ | | | | | |
| Apr-28 (Purchased) | Apr-27/0.87 | | $7,167,200 | $(48,343) | $65,938 |
| (1.715)/3 month USD-LIBOR-BBA/ | | | | | |
| Feb-53 (Purchased) | Feb-23/1.715 | | 1,001,300 | (90,367) | 61,219 |
| (0.296)/6 month EUR-EURIBOR- | | | | | |
| Reuters/Jan-51 (Purchased) | Jan-31/0.296 | EUR | 801,500 | (121,280) | 51,225 |
| (0.8925)/3 month USD-LIBOR-BBA/ | | | | | |
| Apr-28 (Purchased) | Apr-23/0.8925 | | $2,150,100 | (45,582) | 51,043 |
| (0.983)/3 month USD-LIBOR-BBA/ | | | | | |
| Apr-32 (Purchased) | Apr-30/0.983 | | 2,866,900 | (45,440) | 49,167 |
| (1.6125)/3 month USD-LIBOR-BBA/ | | | | | |
| Aug-34 (Purchased) | Aug-24/1.6125 | | 1,059,500 | (77,476) | 13,148 |
| (1.175)/6 month GBP-LIBOR-BBA/ | | | | | |
| Jan-40 (Purchased) | Jan-30/1.175 | GBP | 234,000 | (21,272) | 3,859 |
| (0.762)/6 month GBP-LIBOR-BBA/ | | | | | |
| Aug-39 (Purchased) | Aug-29/0.762 | GBP | 100,200 | (9,241) | 3,514 |
| 1.6125/3 month USD-LIBOR-BBA/ | | | | | |
| Aug-34 (Purchased) | Aug-24/1.6125 | | $1,059,500 | (29,062) | (3,613) |
| 1.175/6 month GBP-LIBOR-BBA/ | | | | | |
| Jan-40 (Purchased) | Jan-30/1.175 | GBP | 234,000 | (21,272) | (4,744) |
| 0.762/6 month GBP-LIBOR-BBA/ | | | | | |
| Aug-39 (Purchased) | Aug-29/0.762 | GBP | 100,200 | (9,241) | (5,263) |
| 0.983/3 month USD-LIBOR-BBA/ | | | | | |
| Apr-32 (Purchased) | Apr-30/0.983 | | $2,866,900 | (45,440) | (25,601) |
| 0.87/3 month USD-LIBOR-BBA/ | | | | | |
| Apr-28 (Purchased) | Apr-27/0.87 | | 7,167,200 | (48,343) | (32,539) |
| 0.8925/3 month USD-LIBOR-BBA/ | | | | | |
| Apr-28 (Purchased) | Apr-23/0.8925 | | 2,150,100 | (45,582) | (34,531) |
| 0.296/6 month EUR-EURIBOR- | | | | | |
| Reuters/Jan-51 (Purchased) | Jan-31/0.296 | EUR | 801,500 | (121,280) | (36,945) |
| 0.902/3 month USD-LIBOR-BBA/ | | | | | |
| Apr-35 (Purchased) | Apr-25/0.902 | | $860,100 | (48,123) | (37,518) |
| 0.45/6 month EUR-EURIBOR-Reuters/ | | | | | |
| Jan-41 (Purchased) | Jan-31/0.45 | EUR | 1,923,700 | (151,327) | (40,612) |
| 1.715/3 month USD-LIBOR-BBA/ | | | | | |
| Feb-53 (Purchased) | Feb-23/1.715 | | $1,001,300 | (90,367) | (44,668) |
| 0.44/6 month EUR-EURIBOR-Reuters/ | | | | | |
| Feb-41 (Purchased) | Feb-31/0.44 | EUR | 2,404,600 | (188,646) | (51,314) |
| 0.271/6 month EUR-EURIBOR- | | | | | |
| Reuters/Jan-36 (Purchased) | Jan-26/0.271 | EUR | 3,206,200 | (167,689) | (51,961) |
| 1.30/3 month USD-LIBOR-BBA/ | | | | | |
| Aug-26 (Written) | Aug-21/1.30 | | $2,251,500 | 66,883 | 58,809 |
| (0.958)/3 month USD-LIBOR-BBA/ | | | | | |
| May-30 (Written) | May-25/0.958 | | 1,720,100 | 45,712 | 32,802 |
| (0.43)/6 month EUR-EURIBOR- | | | | | |
| Reuters/Aug-39 (Written) | Aug-29/0.43 | EUR | 93,200 | 7,472 | 3,402 |
| | | | | |
| FORWARD PREMIUM SWAP OPTION CONTRACTS OUTSTANDING at 4/30/21 (Unaudited) cont. | |
| Counterparty | | | | | |
| Fixed right or obligation % to receive | | | Notional/ | Premium | Unrealized |
| or (pay)/Floating rate index/ | Expiration | | contract | receivable/ | appreciation/ |
| Maturity date | date/strike | | amount | (payable) | (depreciation) |
| UBS AG cont. | | | | | |
| 0.43/6 month EUR-EURIBOR-Reuters/ | | | | | |
| Aug-39 (Written) | Aug-29/0.43 | EUR | 93,200 | $7,472 | $(2,204) |
| (1.30)/3 month USD-LIBOR-BBA/ | | | | | |
| Aug-26 (Written) | Aug-21/1.30 | | $2,251,500 | 17,999 | (15,018) |
| 0.958/3 month USD-LIBOR-BBA/ | | | | | |
| May-30 (Written) | May-25/0.958 | | 1,720,100 | 45,712 | (70,352) |
| Wells Fargo Bank, N.A. | | | | | |
| (1.405)/3 month USD-LIBOR-BBA/ | | | | | |
| Feb-29 (Purchased) | Feb-24/1.405 | | 7,008,800 | (143,505) | 134,849 |
| (1.3875)/3 month USD-LIBOR-BBA/ | | | | | |
| Feb-29 (Purchased) | Feb-24/1.3875 | | 5,006,300 | (102,754) | 98,774 |
| (1.96)/3 month USD-LIBOR-BBA/ | | | | | |
| Jan-41 (Purchased) | Jan-31/1.96 | | 1,770,600 | (119,870) | 45,380 |
| (2.16)/3 month USD-LIBOR-BBA/ | | | | | |
| Feb-35 (Purchased) | Feb-25/2.16 | | 2,961,800 | (147,720) | 34,001 |
| 2.16/3 month USD-LIBOR-BBA/ | | | | | |
| Feb-35 (Purchased) | Feb-25/2.16 | | 2,961,800 | (147,720) | (15,964) |
| 1.96/3 month USD-LIBOR-BBA/ | | | | | |
| Jan-41 (Purchased) | Jan-31/1.96 | | 1,770,600 | (119,870) | (22,735) |
| 1.3875/3 month USD-LIBOR-BBA/ | | | | | |
| Feb-29 (Purchased) | Feb-24/1.3875 | | 5,006,300 | (102,754) | (43,655) |
| 1.405/3 month USD-LIBOR-BBA/ | | | | | |
| Feb-29 (Purchased) | Feb-24/1.405 | | 7,008,800 | (143,505) | (58,730) |
| Unrealized appreciation | | | | | 2,612,061 |
| Unrealized (depreciation) | | | | | (2,175,960) |
| Total | | | | | $436,101 |
| | | |
| TBA SALE COMMITMENTS OUTSTANDING at 4/30/21 (proceeds receivable $101,702,520) (Unaudited) |
| | Principal | Settlement | |
| Agency | amount | date | Value |
| Uniform Mortgage-Backed Securities, 3.50%, 5/1/51 | $6,000,000 | 5/13/21 | $6,385,313 |
| Uniform Mortgage-Backed Securities, 3.00%, 5/1/51 | 2,000,000 | 5/13/21 | 2,094,219 |
| Uniform Mortgage-Backed Securities, 2.50%, 5/1/51 | 77,000,000 | 5/13/21 | 79,857,424 |
| Uniform Mortgage-Backed Securities, 2.00%, 5/1/51 | 14,000,000 | 5/13/21 | 14,136,718 |
| Total | | | $102,473,674 |
| | | | | | | |
| OTC INTEREST RATE SWAP CONTRACTS OUTSTANDING at 4/30/21 (Unaudited) | |
| | | | Upfront | | | | |
| | | | premium | Termina- | | | Unrealized |
| Swap counterparty/ | | received | tion | Payments | Payments | appreciation/ |
| Notional amount | Value | (paid) | date | made by fund | received by fund | (depreciation) |
| Goldman Sachs International | | | | | |
| KRW | 6,086,000,000 | $31,077 | $— | 12/9/21 | 3 month KRW- | 1.67% — Quarterly | $38,832 |
| | | | | | CD-KSDA- | | |
| | | | | | BLOOMBERG — | | |
| | | | | | Quarterly | | |
| JPMorgan Chase Bank N.A. | | | | | |
| THB | 42,200,000 | 12,658 | — | 11/16/21 | 6 month THB- | 2.07% — | 22,376 |
| | | | | | SIBOR-THFX6M — | Semiannually | |
| | | | | | Semiannually | | |
| Upfront premium received | — | | Unrealized appreciation | | 61,208 |
| Upfront premium (paid) | — | | Unrealized (depreciation) | | — |
| Total | | $— | | Total | | $61,208 |
| | | | | | |
| CENTRALLY CLEARED INTEREST RATE SWAP CONTRACTS OUTSTANDING at 4/30/21 (Unaudited) | |
| | | Upfront | | | | |
| | | premium | | | | Unrealized |
| | | received | Termination | Payments | Payments | appreciation/ |
| Notional amount | Value | (paid) | date | made by fund | received by fund | (depreciation) |
| $119,400 | $4,961 E | $(1) | 2/2/24 | 3 month USD- | 2.5725% — | $4,960 |
| | | | | LIBOR-BBA — | Semiannually | |
| | | | | Quarterly | | |
| 308,900 | 12,560 E | (2) | 2/2/24 | 2.528% — | 3 month USD- | (12,562) |
| | | | | Semiannually | LIBOR-BBA — | |
| | | | | | Quarterly | |
| 223,600 | 9,279 E | (38) | 2/2/24 | 3 month USD- | 2.57% — | 9,241 |
| | | | | LIBOR-BBA — | Semiannually | |
| | | | | Quarterly | | |
| 402,800 | 14,608 E | (2) | 2/2/24 | 3 month USD- | 2.3075% — | 14,606 |
| | | | | LIBOR-BBA — | Semiannually | |
| | | | | Quarterly | | |
| 591,300 | 21,501 E | (3) | 2/9/24 | 3 month USD- | 2.32% — | 21,498 |
| | | | | LIBOR-BBA — | Semiannually | |
| | | | | Quarterly | | |
| 869,200 | 15,638 | 19,111 | 1/19/31 | 1.805% — | 3 month USD- | (917) |
| | | | | Semiannually | LIBOR-BBA — | |
| | | | | | Quarterly | |
| 869,200 | 29,927 | (9,786) | 1/19/26 | 3 month USD- | 1.629% — | 24,099 |
| | | | | LIBOR-BBA — | Semiannually | |
| | | | | Quarterly | | |
| 869,200 | 13,819 E | (9,788) | 1/20/31 | 3 month USD- | 1.996% — | (23,608) |
| | | | | LIBOR-BBA — | Semiannually | |
| | | | | Quarterly | | |
| 3,476,800 | 11,286 | 1,904 | 11/3/21 | 0.83% — | 3 month USD- | (22,008) |
| | | | | Semiannually | LIBOR-BBA — | |
| | | | | | Quarterly | |
| 3,476,800 | 20,072 | (6,458) | 11/3/21 | 3 month USD- | 1.331% — | 34,835 |
| | | | | LIBOR-BBA — | Semiannually | |
| | | | | Quarterly | | |
| | | | | | |
| CENTRALLY CLEARED INTEREST RATE SWAP CONTRACTS OUTSTANDING at 4/30/21 (Unaudited) cont. |
| | | Upfront | | | | |
| | | premium | | | | Unrealized |
| | | received | Termination | Payments | Payments | appreciation/ |
| Notional amount | Value | (paid) | date | made by fund | received by fund | (depreciation) |
| $748,500 | $36,338 | $(11) | 3/4/31 | 3 month USD- | 1.101% — | $(35,265) |
| | | | | LIBOR-BBA — | Semiannually | |
| | | | | Quarterly | | |
| 1,400,300 | 267,862 | (58,475) | 1/29/51 | 1.232% — | 3 month USD- | 204,992 |
| | | | | Semiannually | LIBOR-BBA — | |
| | | | | | Quarterly | |
| 980,200 | 186,245 | 51,917 | 4/29/51 | 3 month USD- | 1.242% — | (134,270) |
| | | | | LIBOR-BBA — | Semiannually | |
| | | | | Quarterly | | |
| 521,000 | 62,200 | (18) | 1/8/51 | 3 month USD- | 1.539% — | (59,767) |
| | | | | LIBOR-BBA — | Semiannually | |
| | | | | Quarterly | | |
| 700,000 | 74,351 | (24) | 1/19/51 | 3 month USD- | 1.5955% — | (71,254) |
| | | | | LIBOR-BBA — | Semiannually | |
| | | | | Quarterly | | |
| 217,300 | 6,830 E | (3) | 8/16/31 | 1.37% — | 3 month USD- | 6,826 |
| | | | | Semiannually | LIBOR-BBA — | |
| | | | | | Quarterly | |
| 8,832,000 | 318 E | (714) | 6/16/23 | 3 month USD- | 0.30% — | (396) |
| | | | | LIBOR-BBA — | Semiannually | |
| | | | | Quarterly | | |
| 37,363,000 | 88,364 E | (132,043) | 6/16/26 | 0.95% — | 3 month USD- | (43,680) |
| | | | | Semiannually | LIBOR-BBA — | |
| | | | | | Quarterly | |
| 40,632,000 | 47,377 E | (244,433) | 6/16/31 | 1.65% — | 3 month USD- | (197,056) |
| | | | | Semiannually | LIBOR-BBA — | |
| | | | | | Quarterly | |
| 384,000 | 5,278 E | (7,732) | 6/16/51 | 2.00% — | 3 month USD- | (2,454) |
| | | | | Semiannually | LIBOR-BBA — | |
| | | | | | Quarterly | |
| 2,112,000 | 10,832 E | (1,748) | 6/16/31 | 1.35% — | Secured | 9,085 |
| | | | | Annually | Overnight | |
| | | | | | Financing Rate — | |
| | | | | | Annually | |
| 1,621,000 | 1,974 | (4,555) | 3/16/31 | 3 month USD- | 1.6355% — | 210 |
| | | | | LIBOR-BBA — | Semiannually | |
| | | | | Quarterly | | |
| 5,269,000 | 374 | (43) | 3/16/26 | 0.9255% — | 3 month USD- | (5,236) |
| | | | | Semiannually | LIBOR-BBA — | |
| | | | | | Quarterly | |
| 3,266,000 | 31,703 | (111) | 3/16/51 | 2.09% — | 3 month USD- | (39,556) |
| | | | | Semiannually | LIBOR-BBA — | |
| | | | | | Quarterly | |
| 2,471,000 | 235 | 3,914 | 3/16/26 | 0.926% — | 3 month USD- | 1,519 |
| | | | | Semiannually | LIBOR-BBA — | |
| | | | | | Quarterly | |
| 7,485,000 | 15,793 | (99) | 3/16/31 | 3 month USD- | 1.645% — | 29,273 |
| | | | | LIBOR-BBA — | Semiannually | |
| | | | | Quarterly | | |
| | | | | | |
| CENTRALLY CLEARED INTEREST RATE SWAP CONTRACTS OUTSTANDING at 4/30/21 (Unaudited) cont. |
| | | Upfront | | | | |
| | | premium | | | | Unrealized |
| | | received | Termination | Payments | Payments | appreciation/ |
| Notional amount | Value | (paid) | date | made by fund | received by fund | (depreciation) |
| $162,800 | $567 E | $(2) | 3/20/34 | 2.29% — | 3 month USD- | $(569) |
| | | | | Semiannually | LIBOR-BBA — | |
| | | | | | Quarterly | |
| 783,500 | 7,813 | (7,747) | 4/21/31 | 3 month USD- | 1.736% — | 403 |
| | | | | LIBOR-BBA — | Semiannually | |
| | | | | Quarterly | | |
| 3,585,000 | 46,551 | (48) | 4/7/31 | 1.7655% — | 3 month USD- | (50,341) |
| | | | | Semiannually | LIBOR-BBA — | |
| | | | | | Quarterly | |
| 2,209,000 | 8,365 | (18) | 4/8/26 | 3 month USD- | 1.0161% — | 9,503 |
| | | | | LIBOR-BBA — | Semiannually | |
| | | | | Quarterly | | |
| 2,209,000 | 9,229 | (18) | 4/8/26 | 3 month USD- | 1.0241% — | 10,378 |
| | | | | LIBOR-BBA — | Semiannually | |
| | | | | Quarterly | | |
| 3,129,400 | 30,975 | (42) | 4/15/31 | 3 month USD- | 1.734% — | 33,089 |
| | | | | LIBOR-BBA — | Semiannually | |
| | | | | Quarterly | | |
| 1,173,500 | 21,639 | (40) | 4/15/51 | 2.127% — | 3 month USD- | (22,693) |
| | | | | Semiannually | LIBOR-BBA — | |
| | | | | | Quarterly | |
| 3,282,000 | 8,737 | (27) | 4/9/26 | 3 month USD- | 0.9935% — | 10,314 |
| | | | | LIBOR-BBA — | Semiannually | |
| | | | | Quarterly | | |
| 304,000 | 6,965 | (10) | 4/19/51 | 3 month USD- | 1.9515% — | (6,797) |
| | | | | LIBOR-BBA — | Semiannually | |
| | | | | Quarterly | | |
| 517,000 | 8,798 | (18) | 4/20/51 | 3 month USD- | 1.9765% — | (8,533) |
| | | | | LIBOR-BBA — | Semiannually | |
| | | | | Quarterly | | |
| 759,200 | 3,217 E | (10) | 5/5/31 | 3 month USD- | 1.591% — | (3,227) |
| | | | | LIBOR-BBA — | Semiannually | |
| | | | | Quarterly | | |
| 728,000 | 98 | (3) | 4/28/23 | 3 month USD- | 0.2825% — | 101 |
| | | | | LIBOR-BBA — | Semiannually | |
| | | | | Quarterly | | |
| 2,218,000 | 14,674 | (29) | 4/28/31 | 3 month USD- | 1.5625% — | (14,449) |
| | | | | LIBOR-BBA — | Semiannually | |
| | | | | Quarterly | | |
| 728,000 | 90 | (3) | 4/28/23 | 3 month USD- | 0.282% — | 93 |
| | | | | LIBOR-BBA — | Semiannually | |
| | | | | Quarterly | | |
| 2,218,000 | 14,907 | (29) | 4/28/31 | 3 month USD- | 1.5614% — | (14,682) |
| | | | | LIBOR-BBA — | Semiannually | |
| | | | | Quarterly | | |
| 8,372,000 | 48,206 | 9,946 | 4/20/31 | 1.57% — | 3 month USD- | 57,185 |
| | | | | Semiannually | LIBOR-BBA — | |
| | | | | | Quarterly | |
| 1,352,000 | 3,308 | (18) | 5/4/31 | 1.66091% — | 3 month USD- | (3,326) |
| | | | | Semiannually | LIBOR-BBA — | |
| | | | | | Quarterly | |
| | | | | | | |
| CENTRALLY CLEARED INTEREST RATE SWAP CONTRACTS OUTSTANDING at 4/30/21 (Unaudited) cont. |
| | | | Upfront | | | | |
| | | | premium | | | | Unrealized |
| | | | received | Termination | Payments | Payments | appreciation/ |
| Notional amount | Value | (paid) | date | made by fund | received by fund | (depreciation) |
| AUD | 9,400 | $658 E | $— | 1/30/35 | 1.692% — | 6 month AUD- | $658 |
| | | | | | Semiannually | BBR-BBSW — | |
| | | | | | | Semiannually | |
| AUD | 32,200 | 2,764 E | — | 3/5/35 | 1.47% — | 6 month AUD- | 2,764 |
| | | | | | Semiannually | BBR-BBSW — | |
| | | | | | | Semiannually | |
| AUD | 12,000 | 1,091 E | — | 3/25/35 | 1.4025% — | 6 month AUD- | 1,091 |
| | | | | | Semiannually | BBR-BBSW — | |
| | | | | | | Semiannually | |
| AUD | 20,900 | 1,876 E | — | 3/28/40 | 1.445% — | 6 month AUD- | 1,876 |
| | | | | | Semiannually | BBR-BBSW — | |
| | | | | | | Semiannually | |
| AUD | 76,000 | 8,063 E | (1) | 4/1/40 | 1.1685% — | 6 month AUD- | 8,062 |
| | | | | | Semiannually | BBR-BBSW — | |
| | | | | | | Semiannually | |
| AUD | 5,000 | 763 E | — | 7/2/45 | 1.441% — | 6 month AUD- | 763 |
| | | | | | Semiannually | BBR-BBSW — | |
| | | | | | | Semiannually | |
| AUD | 200,000 | 1,845 | (2) | 4/6/31 | 6 month AUD- | 1.87% — | 2,031 |
| | | | | | BBR-BBSW — | Semiannually | |
| | | | | | Semiannually | | |
| AUD | 2,446,000 | 4,969 E | 12,283 | 6/16/31 | 6 month AUD- | 1.76% — | 7,314 |
| | | | | | BBR-BBSW — | Semiannually | |
| | | | | | Semiannually | | |
| AUD | 710,000 | 4,495 E | 1,544 | 6/16/31 | 6 month AUD- | 1.701% — | (2,951) |
| | | | | | BBR-BBSW — | Semiannually | |
| | | | | | Semiannually | | |
| AUD | 1,100,000 | 2,174 E | 1,727 | 6/16/26 | 6 month AUD- | 0.851% — | (446) |
| | | | | | BBR-BBSW — | Semiannually | |
| | | | | | Semiannually | | |
| CAD | 3,147,000 | 28,686 E | 13,063 | 6/16/31 | 3 month CAD- | 1.91% — | (15,623) |
| | | | | | BA-CDOR — | Semiannually | |
| | | | | | Semiannually | | |
| CAD | 930,000 | 3,154 E | 3,648 | 6/16/51 | 3 month CAD- | 2.501% — | 494 |
| | | | | | BA-CDOR — | Semiannually | |
| | | | | | Semiannually | | |
| CAD | 890,000 | 1,976 E | 1,624 | 6/16/31 | 3 month CAD- | 2.001% — | (352) |
| | | | | | BA-CDOR — | Semiannually | |
| | | | | | Semiannually | | |
| CAD | 570,000 | 850 E | 1,408 | 6/16/26 | 3 month CAD- | 1.401% — | 558 |
| | | | | | BA-CDOR — | Semiannually | |
| | | | | | Semiannually | | |
| CHF | 608,000 | 16,261 E | (14,110) | 6/16/31 | — | 0.16% plus | 2,151 |
| | | | | | | 6 month CHF- | |
| | | | | | | LIBOR-BBA — | |
| | | | | | | Semiannually | |
| CNY | 49,400,000 | 52,511 E | (464) | 9/15/26 | China 7 Day | 2.9445% — | 52,046 |
| | | | | | Reverse Repo | Quarterly | |
| | | | | | Rate — Quarterly | | |
| | | | | | | |
| CENTRALLY CLEARED INTEREST RATE SWAP CONTRACTS OUTSTANDING at 4/30/21 (Unaudited) cont. |
| | | | Upfront | | | | |
| | | | premium | | | | Unrealized |
| | | | received | Termination | Payments | Payments | appreciation/ |
| Notional amount | Value | (paid) | date | made by fund | received by fund | (depreciation) |
| CNY | 95,540,000 | $33,572 E | $(898) | 9/15/26 | China 7 Day | 2.845% — | $32,673 |
| | | | | | Reverse Repo | Quarterly | |
| | | | | | Rate — Quarterly | | |
| EUR | 60,400 | 16,305 E | (2) | 11/29/58 | 1.484% — | 6 month | (16,307) |
| | | | | | Annually | EUR-EURIBOR- | |
| | | | | | | REUTERS — | |
| | | | | | | Semiannually | |
| EUR | 82,300 | 21,919 | (3) | 2/19/50 | 6 month | 1.354% — | 22,284 |
| | | | | | EUR-EURIBOR- | Annually | |
| | | | | | REUTERS — | | |
| | | | | | Semiannually | | |
| EUR | 91,000 | 21,652 | (3) | 3/11/50 | 1.267% — | 6 month | (21,926) |
| | | | | | Annually | EUR-EURIBOR- | |
| | | | | | | REUTERS — | |
| | | | | | | Semiannually | |
| EUR | 91,800 | 20,153 | (4) | 3/12/50 | 1.2115% — | 6 month | (20,416) |
| | | | | | Annually | EUR-EURIBOR- | |
| | | | | | | REUTERS — | |
| | | | | | | Semiannually | |
| EUR | 260,300 | 48,674 | (10) | 3/26/50 | 1.113% — | 6 month | (49,180) |
| | | | | | Annually | EUR-EURIBOR- | |
| | | | | | | REUTERS — | |
| | | | | | | Semiannually | |
| EUR | 420,000 | 93,744 E | (16) | 11/29/58 | 6 month | 1.343% — | 93,728 |
| | | | | | EUR-EURIBOR- | Annually | |
| | | | | | REUTERS — | | |
| | | | | | Semiannually | | |
| EUR | 283,000 | 46,875 | (11) | 2/19/50 | 1.051% — | 6 month | (47,946) |
| | | | | | Annually | EUR-EURIBOR- | |
| | | | | | | REUTERS — | |
| | | | | | | Semiannually | |
| EUR | 87,500 | 12,328 E | (3) | 6/7/54 | 1.054% — | 6 month | (12,332) |
| | | | | | Annually | EUR-EURIBOR- | |
| | | | | | | REUTERS — | |
| | | | | | | Semiannually | |
| EUR | 79,600 | 9,283 | (3) | 2/19/50 | 0.9035% — | 6 month | (9,556) |
| | | | | | Annually | EUR-EURIBOR- | |
| | | | | | | REUTERS — | |
| | | | | | | Semiannually | |
| EUR | 211,200 | 17,362 | (8) | 2/21/50 | 0.80% — | 6 month | (18,005) |
| | | | | | Annually | EUR-EURIBOR- | |
| | | | | | | REUTERS — | |
| | | | | | | Semiannually | |
| EUR | 258,600 | 13,442 E | (10) | 8/8/54 | 0.49% — | 6 month | 13,433 |
| | | | | | Annually | EUR-EURIBOR- | |
| | | | | | | REUTERS — | |
| | | | | | | Semiannually | |
| EUR | 107,000 | 15,728 E | (4) | 6/6/54 | 6 month | 0.207% — | (15,732) |
| | | | | | EUR-EURIBOR- | Annually | |
| | | | | | REUTERS — | | |
| | | | | | Semiannually | | |
| | | | | | | |
| CENTRALLY CLEARED INTEREST RATE SWAP CONTRACTS OUTSTANDING at 4/30/21 (Unaudited) cont. |
| | | | Upfront | | | | |
| | | | premium | | | | Unrealized |
| | | | received | Termination | Payments | Payments | appreciation/ |
| Notional amount | Value | (paid) | date | made by fund | received by fund | (depreciation) |
| EUR | 312,300 | $33,170 | $(12) | 2/19/50 | 0.233% — | 6 month | $32,600 |
| | | | | | Annually | EUR-EURIBOR- | |
| | | | | | | REUTERS — | |
| | | | | | | Semiannually | |
| EUR | 585,500 | 8,251 | (22) | 2/19/50 | 6 month | 0.595% — | 9,783 |
| | | | | | EUR-EURIBOR- | Annually | |
| | | | | | REUTERS — | | |
| | | | | | Semiannually | | |
| EUR | 115,200 | 19,591 E | (4) | 3/4/54 | 0.134% — | 6 month | 19,587 |
| | | | | | Annually | EUR-EURIBOR- | |
| | | | | | | REUTERS — | |
| | | | | | | Semiannually | |
| EUR | 81,200 | 23,812 E | (3) | 3/13/54 | — | 0.2275% | 23,809 |
| | | | | | | plus 6 month | |
| | | | | | | EUR-EURIBOR- | |
| | | | | | | REUTERS — | |
| | | | | | | Semiannually | |
| EUR | 302,300 | 23,609 E | (6) | 5/13/40 | 6 month | 0.276% — | (23,615) |
| | | | | | EUR-EURIBOR- | Annually | |
| | | | | | REUTERS — | | |
| | | | | | Semiannually | | |
| EUR | 55,900 | 4,116 E | (1) | 6/24/40 | 0.315% — | 6 month | 4,115 |
| | | | | | Annually | EUR-EURIBOR- | |
| | | | | | | REUTERS — | |
| | | | | | | Semiannually | |
| EUR | 133,400 | 9,763 E | (3) | 1/16/40 | 0.315% — | 6 month | 9,759 |
| | | | | | Annually | EUR-EURIBOR- | |
| | | | | | | REUTERS — | |
| | | | | | | Semiannually | |
| EUR | 52,200 | 3,819 E | (1) | 3/28/40 | 0.3175% — | 6 month | 3,817 |
| | | | | | Annually | EUR-EURIBOR- | |
| | | | | | | REUTERS — | |
| | | | | | | Semiannually | |
| EUR | 8,063,000 | 104,595 E | 5,025 | 6/16/31 | 0.05% — | 6 month | 109,621 |
| | | | | | Annually | EUR-EURIBOR- | |
| | | | | | | REUTERS — | |
| | | | | | | Semiannually | |
| EUR | 238,200 | 2,777 E | (10) | 5/21/51 | 6 month | 0.516% — | (2,787) |
| | | | | | EUR-EURIBOR- | Annually | |
| | | | | | REUTERS — | | |
| | | | | | Semiannually | | |
| EUR | 5,470,000 | 4,209 E | 2,675 | 6/16/23 | 0.501% plus | — | (1,533) |
| | | | | | 6 month | | |
| | | | | | EUR-EURIBOR- | | |
| | | | | | REUTERS — | | |
| | | | | | Semiannually | | |
| EUR | 4,180,000 | 14,544 E | 6,380 | 6/16/26 | 0.301% plus | — | (8,163) |
| | | | | | 6 month | | |
| | | | | | EUR-EURIBOR- | | |
| | | | | | REUTERS — | | |
| | | | | | Semiannually | | |
| | | | | | | |
| CENTRALLY CLEARED INTEREST RATE SWAP CONTRACTS OUTSTANDING at 4/30/21 (Unaudited) cont. |
| | | | Upfront | | | | |
| | | | premium | | | | Unrealized |
| | | | received | Termination | Payments | Payments | appreciation/ |
| Notional amount | Value | (paid) | date | made by fund | received by fund | (depreciation) |
| EUR | 5,370,000 | $36,283 E | $(627) | 6/16/31 | 6 month | 0.101% — | $(36,910) |
| | | | | | EUR-EURIBOR- | Annually | |
| | | | | | REUTERS — | | |
| | | | | | Semiannually | | |
| EUR | 650,000 | 11,473 E | (5,911) | 6/16/51 | 6 month | 0.501% — | (17,385) |
| | | | | | EUR-EURIBOR- | Annually | |
| | | | | | REUTERS — | | |
| | | | | | Semiannually | | |
| GBP | 17,000 | 228 E | (246) | 6/16/31 | Sterling | 0.93% — | (19) |
| | | | | | Overnight | Annually | |
| | | | | | Index Average — | | |
| | | | | | Annually | | |
| GBP | 83,100 | 736 E | (2) | 5/19/31 | Sterling | 0.754% — | (738) |
| | | | | | Overnight | Annually | |
| | | | | | Index Average — | | |
| | | | | | Annually | | |
| GBP | 230,000 | 4,697 E | (2,249) | 6/16/51 | Sterling | 0.901% — | (6,946) |
| | | | | | Overnight | Annually | |
| | | | | | Index Average — | | |
| | | | | | Annually | | |
| GBP | 980,000 | 16,824 E | 3,027 | 6/16/31 | Sterling | 0.701% — | (13,797) |
| | | | | | Overnight | Annually | |
| | | | | | Index Average — | | |
| | | | | | Annually | | |
| GBP | 920,000 | 7,475 E | 1,219 | 6/16/26 | Sterling | 0.401% — | (6,256) |
| | | | | | Overnight | Annually | |
| | | | | | Index Average — | | |
| | | | | | Annually | | |
| JPY | 22,710,500 | 10,025 E | (7) | 8/29/43 | 0.7495% — | 6 month JPY- | (10,031) |
| | | | | | Semiannually | LIBOR-BBA — | |
| | | | | | | Semiannually | |
| JPY | 14,130,600 | 1,536 | (1,114) | 2/25/31 | 0.003% — | 6 month JPY- | 411 |
| | | | | | Semiannually | LIBOR-BBA — | |
| | | | | | | Semiannually | |
| JPY | 26,213,100 | 14,359 E | (8) | 8/29/43 | 0.194% — | 6 month JPY- | 14,351 |
| | | | | | Semiannually | LIBOR-BBA — | |
| | | | | | | Semiannually | |
| NOK | 7,179,000 | 1,360 E | 2,028 | 6/16/31 | 6 month NOK- | 1.82% — | 3,388 |
| | | | | | NIBOR-NIBR — | Annually | |
| | | | | | Semiannually | | |
| NZD | 869,000 | 5,643 E | 4,169 | 6/16/31 | 3 month NZD- | 1.96% — | 9,812 |
| | | | | | BBR-FRA — | Semiannually | |
| | | | | | Quarterly | | |
| SEK | 18,866,000 | 14,031 E | (8,556) | 6/16/31 | 0.77% — | 3 month SEK- | 5,477 |
| | | | | | Annually | STIBOR-SIDE — | |
| | | | | | | Quarterly | |
| Total | | | $(371,871) | | | | $(160,932) |
E Extended effective date.
| | | | | | |
| OTC TOTAL RETURN SWAP CONTRACTS OUTSTANDING at 4/30/21 (Unaudited) | |
| | | Upfront | | | | |
| | | premium | Termina- | Payments | Total return | Unrealized |
| Swap counterparty/ | | received | tion | received (paid) | received by | appreciation/ |
| Notional amount | Value | (paid) | date | by fund | or paid by fund | (depreciation) |
| Bank of America N.A. | | | | | | |
| $23,361 | $22,659 | $— | 1/12/41 | 4.00% (1 month | Synthetic TRS | $(407) |
| | | | | USD-LIBOR) — | Index 4.00% 30 year | |
| | | | | Monthly | Fannie Mae pools — | |
| | | | | | Monthly | |
| Barclays Bank PLC | | | | | | |
| 2,641,643 | 2,642,364 | — | 1/12/41 | 5.00% (1 month | Synthetic MBX | 6,648 |
| | | | | USD-LIBOR) — | Index 5.00% 30 year | |
| | | | | Monthly | Fannie Mae pools — | |
| | | | | | Monthly | |
| 138,816 | 138,835 | — | 1/12/40 | 5.00% (1 month | Synthetic MBX | 334 |
| | | | | USD-LIBOR) — | Index 5.00% 30 year | |
| | | | | Monthly | Fannie Mae pools — | |
| | | | | | Monthly | |
| 21,945 | 21,936 | — | 1/12/39 | (6.00%) 1 month | Synthetic MBX | (49) |
| | | | | USD-LIBOR — | Index 6.00% 30 year | |
| | | | | Monthly | Fannie Mae pools — | |
| | | | | | Monthly | |
| 577,928 | 576,684 | — | 1/12/38 | (6.50%) 1 month | Synthetic MBX | (329) |
| | | | | USD-LIBOR — | Index 6.50% 30 year | |
| | | | | Monthly | Fannie Mae pools — | |
| | | | | | Monthly | |
| 13,034 | 12,639 | — | 1/12/43 | (3.50%) 1 month | Synthetic TRS | 245 |
| | | | | USD-LIBOR — | Index 3.50% 30 year | |
| | | | | Monthly | Fannie Mae pools — | |
| | | | | | Monthly | |
| 23,311 | 22,610 | — | 1/12/41 | 4.00% (1 month | Synthetic TRS | (406) |
| | | | | USD-LIBOR) — | Index 4.00% 30 year | |
| | | | | Monthly | Fannie Mae pools — | |
| | | | | | Monthly | |
| 8,111 | 7,914 | — | 1/12/42 | 4.00% (1 month | Synthetic TRS | (95) |
| | | | | USD-LIBOR) — | Index 4.00% 30 year | |
| | | | | Monthly | Fannie Mae pools — | |
| | | | | | Monthly | |
| 29,093 | 28,260 | — | 1/12/41 | (5.00%) 1 month | Synthetic TRS | 408 |
| | | | | USD-LIBOR — | Index 5.00% 30 year | |
| | | | | Monthly | Fannie Mae pools — | |
| | | | | | Monthly | |
| 33,039 | 32,638 | — | 1/12/41 | 5.00% (1 month | Synthetic TRS Index | 20 |
| | | | | USD-LIBOR) — | 5.00% 30 year Ginnie | |
| | | | | Monthly | Mae II pools — | |
| | | | | | Monthly | |
| 13,962 | 13,793 | — | 1/12/41 | 5.00% (1 month | Synthetic TRS Index | 9 |
| | | | | USD-LIBOR) — | 5.00% 30 year Ginnie | |
| | | | | Monthly | Mae II pools — | |
| | | | | | Monthly | |
| | | | | | |
| OTC TOTAL RETURN SWAP CONTRACTS OUTSTANDING at 4/30/21 (Unaudited) cont. | |
| | | Upfront | | | | |
| | | premium | Termina- | Payments | Total return | Unrealized |
| Swap counterparty/ | | received | tion | received (paid) | received by | appreciation/ |
| Notional amount | Value | (paid) | date | by fund | or paid by fund | (depreciation) |
| Barclays Bank PLC cont. | | | | | | |
| $28,375 | $27,858 | $— | 1/12/38 | 6.50% (1 month | Synthetic TRS | $(175) |
| | | | | USD-LIBOR) — | Index 6.50% 30 year | |
| | | | | Monthly | Fannie Mae pools — | |
| | | | | | Monthly | |
| 298 | 292 | — | 1/12/38 | 6.50% (1 month | Synthetic TRS | (2) |
| | | | | USD-LIBOR) — | Index 6.50% 30 year | |
| | | | | Monthly | Fannie Mae pools — | |
| | | | | | Monthly | |
| Citibank, N.A. | | | | | | |
| 50,160 | 50,173 | — | 1/12/41 | 5.00% (1 month | Synthetic MBX | 126 |
| | | | | USD-LIBOR) — | Index 5.00% 30 year | |
| | | | | Monthly | Fannie Mae pools — | |
| | | | | | Monthly | |
| Credit Suisse International | | | | | |
| 5,277 | 5,117 | — | 1/12/43 | 3.50% (1 month | Synthetic TRS | (99) |
| | | | | USD-LIBOR) — | Index 3.50% 30 year | |
| | | | | Monthly | Fannie Mae pools — | |
| | | | | | Monthly | |
| 36,890 | 35,897 | — | 1/12/45 | 4.00% (1 month | Synthetic TRS | (498) |
| | | | | USD-LIBOR) — | Index 4.00% 30 year | |
| | | | | Monthly | Fannie Mae pools — | |
| | | | | | Monthly | |
| 32,397 | 31,525 | — | 1/12/45 | 4.00% (1 month | Synthetic TRS | (438) |
| | | | | USD-LIBOR) — | Index 4.00% 30 year | |
| | | | | Monthly | Fannie Mae pools — | |
| | | | | | Monthly | |
| 46,672 | 45,269 | — | 1/12/41 | (4.00%) 1 month | Synthetic TRS | 813 |
| | | | | USD-LIBOR — | Index 4.00% 30 year | |
| | | | | Monthly | Fannie Mae pools — | |
| | | | | | Monthly | |
| 21,225 | 20,618 | — | 1/12/41 | (5.00%) 1 month | Synthetic TRS | 298 |
| | | | | USD-LIBOR — | Index 5.00% 30 year | |
| | | | | Monthly | Fannie Mae pools — | |
| | | | | | Monthly | |
| Goldman Sachs International | | | | | |
| 12,673 | 12,645 | — | 1/12/38 | (6.50%) 1 month | Synthetic MBX | (7) |
| | | | | USD-LIBOR — | Index 6.50% 30 year | |
| | | | | Monthly | Fannie Mae pools — | |
| | | | | | Monthly | |
| 15,203 | 15,170 | — | 1/12/38 | (6.50%) 1 month | Synthetic MBX | (9) |
| | | | | USD-LIBOR — | Index 6.50% 30 year | |
| | | | | Monthly | Fannie Mae pools — | |
| | | | | | Monthly | |
| 287,140 | 286,523 | — | 1/12/38 | (6.50%) 1 month | Synthetic MBX | (163) |
| | | | | USD-LIBOR — | Index 6.50% 30 year | |
| | | | | Monthly | Fannie Mae pools — | |
| | | | | | Monthly | |
| | | | | | |
| OTC TOTAL RETURN SWAP CONTRACTS OUTSTANDING at 4/30/21 (Unaudited) cont. | |
| | | Upfront | | | | |
| | | premium | Termina- | Payments | Total return | Unrealized |
| Swap counterparty/ | | received | tion | received (paid) | received by | appreciation/ |
| Notional amount | Value | (paid) | date | by fund | or paid by fund | (depreciation) |
| Goldman Sachs International cont. | | | | | |
| $22,951 | $22,255 | $— | 1/12/43 | 3.50% (1 month | Synthetic TRS | $(432) |
| | | | | USD-LIBOR) — | Index 3.50% 30 year | |
| | | | | Monthly | Fannie Mae pools — | |
| | | | | | Monthly | |
| 56,863 | 55,484 | — | 1/12/42 | 4.00% (1 month | Synthetic TRS | (666) |
| | | | | USD-LIBOR) — | Index 4.00% 30 year | |
| | | | | Monthly | Fannie Mae pools — | |
| | | | | | Monthly | |
| 32,153 | 31,287 | — | 1/12/45 | 4.00% (1 month | Synthetic TRS | (434) |
| | | | | USD-LIBOR) — | Index 4.00% 30 year | |
| | | | | Monthly | Fannie Mae pools — | |
| | | | | | Monthly | |
| 29,943 | 29,217 | — | 1/12/42 | 4.00% (1 month | Synthetic TRS | (351) |
| | | | | USD-LIBOR) — | Index 4.00% 30 year | |
| | | | | Monthly | Fannie Mae pools — | |
| | | | | | Monthly | |
| 20,136 | 19,648 | — | 1/12/42 | 4.00% (1 month | Synthetic TRS | (236) |
| | | | | USD-LIBOR) — | Index 4.00% 30 year | |
| | | | | Monthly | Fannie Mae pools — | |
| | | | | | Monthly | |
| 20,136 | 19,648 | — | 1/12/42 | 4.00% (1 month | Synthetic TRS | (236) |
| | | | | USD-LIBOR) — | Index 4.00% 30 year | |
| | | | | Monthly | Fannie Mae pools — | |
| | | | | | Monthly | |
| 35,002 | 34,000 | — | 1/12/41 | (5.00%) 1 month | Synthetic TRS | 491 |
| | | | | USD-LIBOR — | Index 5.00% 30 year | |
| | | | | Monthly | Fannie Mae pools — | |
| | | | | | Monthly | |
| 9,870 | 9,802 | — | 1/12/39 | 6.00% (1 month | Synthetic TRS | 56 |
| | | | | USD-LIBOR) — | Index 6.00% 30 year | |
| | | | | Monthly | Fannie Mae pools — | |
| | | | | | Monthly | |
| 2,020 | 1,984 | — | 1/12/38 | 6.50% (1 month | Synthetic TRS | (12) |
| | | | | USD-LIBOR) — | Index 6.50% 30 year | |
| | | | | Monthly | Fannie Mae pools — | |
| | | | | | Monthly | |
| JPMorgan Chase Bank N. A. | | | | | |
| 35,002 | 34,000 | — | 1/12/41 | (5.00%) 1 month | Synthetic TRS | 491 |
| | | | | USD-LIBOR — | Index 5.00% 30 year | |
| | | | | Monthly | Fannie Mae pools — | |
| | | | | | Monthly | |
| JPMorgan Securities LLC | | | | | | |
| 30,621 | 30,250 | — | 1/12/41 | (5.00%) 1 month | Synthetic MBX Index | (19) |
| | | | | USD-LIBOR — | 5.00% 30 year Ginnie | |
| | | | | Monthly | Mae II pools — | |
| | | | | | Monthly | |
| 15,194 | 14,734 | — | 1/12/43 | (3.50%) 1 month | Synthetic TRS | 286 |
| | | | | USD-LIBOR — | Index 3.50% 30 year | |
| | | | | Monthly | Fannie Mae pools — | |
| | | | | | Monthly | |
| | | | | | |
| OTC TOTAL RETURN SWAP CONTRACTS OUTSTANDING at 4/30/21 (Unaudited) cont. | |
| | | Upfront | | | | |
| | | premium | Termina- | Payments | Total return | Unrealized |
| Swap counterparty/ | | received | tion | received (paid) | received by | appreciation/ |
| Notional amount | Value | (paid) | date | by fund | or paid by fund | (depreciation) |
| JPMorgan Securities LLC cont. | | | | | |
| $135,189 | $131,910 | $— | 1/12/42 | (4.00%) 1 month | Synthetic TRS | $1,583 |
| | | | | USD-LIBOR — | Index 4.00% 30 year | |
| | | | | Monthly | Fannie Mae pools — | |
| | | | | | Monthly | |
| Morgan Stanley & Co. International PLC | | | | |
| 469,326 | 465,482 | — | 7/17/24 | 3.825% (3 month | Pera Funding DAC, | (2,241) |
| | | | | USD-LIBOR-BBA | 3.825%, Series | |
| | | | | minus 0.12%) — | 2019–01, 7/10/24 — | |
| | | | | Quarterly | Quarterly | |
| Upfront premium received | — | | Unrealized appreciation | 11,808 |
| Upfront premium (paid) | — | | Unrealized (depreciation) | (7,304) |
| Total | | $— | | Total | | $4,504 |
| | | | | | | |
| CENTRALLY CLEARED TOTAL RETURN SWAP CONTRACTS OUTSTANDING at 4/30/21 (Unaudited) | |
| | | | Upfront | | | | |
| | | | premium | Termina- | Payments | Total return | Unrealized |
| | | | received | tion | received (paid) | received by | appreciation/ |
| Notional amount | Value | (paid) | date | by fund | or paid by fund | (depreciation) |
| EUR | 3,160,000 | $300,096 | $(58) | 5/15/30 | (.655%) — At | Eurostat Eurozone | $300,037 |
| | | | | | maturity | HICP excluding | |
| | | | | | | tobacco — At | |
| | | | | | | maturity | |
| EUR | 3,160,000 | 297,049 | (58) | 5/15/30 | (.6625%) — At | Eurostat Eurozone | 296,990 |
| | | | | | maturity | HICP excluding | |
| | | | | | | tobacco — At | |
| | | | | | | maturity | |
| EUR | 1,578,000 | 280,382 | (56) | 5/15/40 | (.961%) — At | Eurostat Eurozone | 280,325 |
| | | | | | maturity | HICP excluding | |
| | | | | | | tobacco — At | |
| | | | | | | maturity | |
| EUR | 894,000 | 60,538 | — | 7/15/37 | 1.71% — At | Eurostat Eurozone | 60,538 |
| | | | | | maturity | HICP excluding | |
| | | | | | | tobacco — At | |
| | | | | | | maturity | |
| EUR | 894,000 | 16,113 | — | 7/15/27 | (1.40%) — At | Eurostat Eurozone | (16,113) |
| | | | | | maturity | HICP excluding | |
| | | | | | | tobacco — At | |
| | | | | | | maturity | |
| EUR | 3,435,000 | 75,698 | (40) | 9/15/23 | (1.4375%) — At | Eurostat Eurozone | (75,738) |
| | | | | | maturity | HICP excluding | |
| | | | | | | tobacco — At | |
| | | | | | | maturity | |
| EUR | 3,435,000 | 76,528 | (40) | 9/15/23 | (1.44125%) — At | Eurostat Eurozone | (76,568) |
| | | | | | maturity | HICP excluding | |
| | | | | | | tobacco — At | |
| | | | | | | maturity | |
| EUR | 3,435,000 | 76,805 | (41) | 9/15/23 | (1.4425%) — At | Eurostat Eurozone | (76,845) |
| | | | | | maturity | HICP excluding | |
| | | | | | | tobacco — At | |
| | | | | | | maturity | |
| | | | | | | |
| CENTRALLY CLEARED TOTAL RETURN SWAP CONTRACTS OUTSTANDING at 4/30/21 (Unaudited) cont. |
| | | | Upfront | | | | |
| | | | premium | Termina- | Payments | Total return | Unrealized |
| | | | received | tion | received (paid) | received by | appreciation/ |
| Notional amount | Value | (paid) | date | by fund | or paid by fund | (depreciation) |
| EUR | 3,435,000 | $77,081 | $(41) | 9/15/23 | (1.44375%) — At | Eurostat Eurozone | $(77,122) |
| | | | | | maturity | HICP excluding | |
| | | | | | | tobacco — At | |
| | | | | | | maturity | |
| EUR | 1,578,000 | 414,046 | (74) | 5/15/50 | 1.13% — At | Eurostat Eurozone | (414,120) |
| | | | | | maturity | HICP excluding | |
| | | | | | | tobacco — At | |
| | | | | | | maturity | |
| EUR | 3,160,000 | 583,456 | (112) | 5/15/40 | 0.935% — At | Eurostat Eurozone | (583,568) |
| | | | | | maturity | HICP excluding | |
| | | | | | | tobacco — At | |
| | | | | | | maturity | |
| EUR | 3,160,000 | 587,673 | (112) | 5/15/40 | 0.93% — At | Eurostat Eurozone | (587,785) |
| | | | | | maturity | HICP excluding | |
| | | | | | | tobacco — At | |
| | | | | | | maturity | |
| GBP | 1,807,000 | 135,077 | (39) | 12/15/28 | 3.665% — At | GBP Non-revised UK | 135,038 |
| | | | | | maturity | Retail Price Index — | |
| | | | | | | At maturity | |
| GBP | 2,319,000 | 77,222 | (30) | 11/15/24 | 3.385% — At | GBP Non-revised UK | 77,192 |
| | | | | | maturity | Retail Price Index — | |
| | | | | | | At maturity | |
| GBP | 1,409,000 | 50,407 | (33) | 3/15/28 | 3.4025% — At | GBP Non-revised UK | 50,374 |
| | | | | | maturity | Retail Price Index — | |
| | | | | | | At maturity | |
| GBP | 2,024,000 | 49,890 | (48) | 3/15/28 | 3.34% — At | GBP Non-revised UK | 49,842 |
| | | | | | maturity | Retail Price Index — | |
| | | | | | | At maturity | |
| GBP | 1,084,000 | 31,489 | (25) | 2/15/28 | 3.34% — At | GBP Non-revised UK | 31,464 |
| | | | | | maturity | Retail Price Index — | |
| | | | | | | At maturity | |
| GBP | 506,000 | 16,748 | (12) | 3/15/28 | 3.3875% — At | GBP Non-revised UK | 16,737 |
| | | | | | maturity | Retail Price Index — | |
| | | | | | | At maturity | |
| GBP | 543,000 | 59,274 | (29) | 7/15/49 | (3.4425%) — At | GBP Non-revised UK | (59,303) |
| | | | | | maturity | Retail Price Index — | |
| | | | | | | At maturity | |
| | $1,895,000 | 27,189 | (32) | 3/23/31 | (2.4275%) — At | USA Non Revised | 27,158 |
| | | | | | maturity | Consumer Price | |
| | | | | | | Index-Urban | |
| | | | | | | (CPI-U) — At | |
| | | | | | | maturity | |
| | 1,918,000 | 22,855 | (32) | 3/23/31 | (2.45%) — At | USA Non Revised | 22,823 |
| | | | | | maturity | Consumer Price | |
| | | | | | | Index-Urban | |
| | | | | | | (CPI-U) — At | |
| | | | | | | maturity | |
| | | | | | |
| CENTRALLY CLEARED TOTAL RETURN SWAP CONTRACTS OUTSTANDING at 4/30/21 (Unaudited) cont. |
| | | Upfront | | | | |
| | | premium | Termina- | Payments | Total return | Unrealized |
| | | received | tion | received (paid) | received by | appreciation/ |
| Notional amount | Value | (paid) | date | by fund | or paid by fund | (depreciation) |
| $1,637,000 | $8,512 | $(28) | 4/1/31 | (2.51%) — At | USA Non Revised | $8,485 |
| | | | | maturity | Consumer Price | |
| | | | | | Index-Urban | |
| | | | | | (CPI-U) — At | |
| | | | | | maturity | |
| 1,637,000 | 7,624 | (28) | 4/1/31 | (2.515%) — At | USA Non Revised | 7,596 |
| | | | | maturity | Consumer Price | |
| | | | | | Index-Urban | |
| | | | | | (CPI-U) — At | |
| | | | | | maturity | |
| 539,000 | 5,375 | (9) | 4/1/31 | (2.466%) — At | USA Non Revised | 5,366 |
| | | | | maturity | Consumer Price | |
| | | | | | Index-Urban | |
| | | | | | (CPI-U) — At | |
| | | | | | maturity | |
| 1,086,000 | 11,517 | (11) | 4/1/26 | 2.496% — At | USA Non Revised | (11,528) |
| | | | | maturity | Consumer Price | |
| | | | | | Index-Urban | |
| | | | | | (CPI-U) — At | |
| | | | | | maturity | |
| 3,834,000 | 38,482 | (39) | 3/23/26 | 2.51% — At | USA Non Revised | (38,521) |
| | | | | maturity | Consumer Price | |
| | | | | | Index-Urban | |
| | | | | | (CPI-U) — At | |
| | | | | | maturity | |
| 1,284,000 | 39,750 | (22) | 2/25/31 | 2.28% — At | USA Non Revised | (39,772) |
| | | | | maturity | Consumer Price | |
| | | | | | Index-Urban | |
| | | | | | (CPI-U) — At | |
| | | | | | maturity | |
| 1,614,000 | 49,890 | (27) | 2/24/31 | 2.281% — At | USA Non Revised | (49,917) |
| | | | | maturity | Consumer Price | |
| | | | | | Index-Urban | |
| | | | | | (CPI-U) — At | |
| | | | | | maturity | |
| 1,614,000 | 50,310 | (27) | 2/25/31 | 2.278% — At | USA Non Revised | (50,337) |
| | | | | maturity | Consumer Price | |
| | | | | | Index-Urban | |
| | | | | | (CPI-U) — At | |
| | | | | | maturity | |
| 3,792,000 | 51,184 | — | 3/23/26 | 2.445% — At | USA Non Revised | (51,184) |
| | | | | maturity | Consumer Price | |
| | | | | | Index-Urban | |
| | | | | | (CPI-U) — At | |
| | | | | | maturity | |
| 1,614,000 | 52,118 | (27) | 2/25/31 | 2.2675% — At | USA Non Revised | (52,145) |
| | | | | maturity | Consumer Price | |
| | | | | | Index-Urban | |
| | | | | | (CPI-U) — At | |
| | | | | | maturity | |
| | | | | | |
| CENTRALLY CLEARED TOTAL RETURN SWAP CONTRACTS OUTSTANDING at 4/30/21 (Unaudited) cont. |
| | | Upfront | | | | |
| | | premium | Termina- | Payments | Total return | Unrealized |
| | | received | tion | received (paid) | received by | appreciation/ |
| Notional amount | Value | (paid) | date | by fund | or paid by fund | (depreciation) |
| $6,540,000 | $57,500 | $(66) | 4/1/26 | 2.53% — At | USA Non Revised | $(57,566) |
| | | | | maturity | Consumer Price | |
| | | | | | Index-Urban | |
| | | | | | (CPI-U) — At | |
| | | | | | maturity | |
| 2,933,000 | 67,518 | (49) | 3/5/31 | 2.351% — At | USA Non Revised | (67,567) |
| | | | | maturity | Consumer Price | |
| | | | | | Index-Urban | |
| | | | | | (CPI-U) — At | |
| | | | | | maturity | |
| 2,965,000 | 68,572 | (50) | 3/5/31 | 2.35% — At | USA Non Revised | (68,621) |
| | | | | maturity | Consumer Price | |
| | | | | | Index-Urban | |
| | | | | | (CPI-U) — At | |
| | | | | | maturity | |
| 3,228,000 | 98,057 | (54) | 2/24/31 | 2.286% — At | USA Non Revised | (98,111) |
| | | | | maturity | Consumer Price | |
| | | | | | Index-Urban | |
| | | | | | (CPI-U) — At | |
| | | | | | maturity | |
| 2,958,000 | 333,405 | (50) | 6/30/30 | 1.586% — At | USA Non Revised | (333,455) |
| | | | | maturity | Consumer Price | |
| | | | | | Index-Urban | |
| | | | | | (CPI-U) — At | |
| | | | | | maturity | |
| 5,770,000 | 612,134 | 44,398 | 7/10/30 | 1.6625% — At | USA Non Revised | (567,737) |
| | | | | maturity | Consumer Price | |
| | | | | | Index-Urban | |
| | | | | | (CPI-U) — At | |
| | | | | | maturity | |
| Total | | $42,999 | | | | $(2,083,658) |
| | | | | | | |
| OTC CREDIT DEFAULT CONTRACTS OUTSTANDING — PROTECTION SOLD at 4/30/21 (Unaudited) |
| | | Upfront | | | | | |
| | | premium | | | Termi- | Payments | Unrealized |
| Swap counterparty/ | | received | Notional | | nation | received | appreciation/ |
| Referenced debt* | Rating*** | (paid)** | amount | Value | date | by fund | (depreciation) |
| Bank of America N.A. | | | | | | |
| CMBX NA BBB–.6 | BB–/P | $2,666 | $39,000 | $11,041 | 5/11/63 | 300 bp — | $(8,356) |
| Index | | | | | | Monthly | |
| CMBX NA BBB–.6 | BB–/P | 5,303 | 88,000 | 24,913 | 5/11/63 | 300 bp — | (19,566) |
| Index | | | | | | Monthly | |
| CMBX NA BBB–.6 | BB–/P | 10,865 | 176,000 | 49,826 | 5/11/63 | 300 bp — | (38,872) |
| Index | | | | | | Monthly | |
| Citigroup Global Markets, Inc. | | | | | | |
| CMBX NA A.6 | A-/P | 2,345 | 14,000 | 1,191 | 5/11/63 | 200 bp — | 1,158 |
| Index | | | | | | Monthly | |
| CMBX NA A.6 | A-/P | 6,014 | 34,000 | 2,893 | 5/11/63 | 200 bp — | 3,132 |
| Index | | | | | | Monthly | |
| | | | | | | |
| OTC CREDIT DEFAULT CONTRACTS OUTSTANDING — PROTECTION SOLD at 4/30/21 (Unaudited) cont. |
| | | Upfront | | | | | |
| | | premium | | | Termi- | Payments | Unrealized |
| Swap counterparty/ | | received | Notional | | nation | received | appreciation/ |
| Referenced debt* | Rating*** | (paid)** | amount | Value | date | by fund | (depreciation) |
| Citigroup Global Markets, Inc. cont. | | | | | |
| CMBX NA BB.11 | BB–/P | $40,115 | $71,000 | $9,266 | 11/18/54 | 500 bp — | $30,909 |
| Index | | | | | | Monthly | |
| CMBX NA BB.13 | BB–/P | 2,999 | 30,000 | 2,913 | 12/16/72 | 500 bp — | 111 |
| Index | | | | | | Monthly | |
| CMBX NA BB.13 | BB–/P | 8,965 | 95,000 | 9,225 | 12/16/72 | 500 bp — | (180) |
| Index | | | | | | Monthly | |
| CMBX NA BB.6 | B-/P | 30,268 | 211,000 | 100,457 | 5/11/63 | 500 bp — | (70,013) |
| Index | | | | | | Monthly | |
| CMBX NA BB.7 | B+/P | 15,922 | 312,000 | 112,975 | 1/17/47 | 500 bp — | (96,793) |
| Index | | | | | | Monthly | |
| CMBX NA BBB– .14 | BBB–/P | 1,496 | 48,000 | 2,088 | 12/16/72 | 300 bp — | (568) |
| Index | | | | | | Monthly | |
| CMBX NA BBB–.12 | BBB–/P | 7,366 | 125,000 | 7,100 | 8/17/61 | 300 bp — | 329 |
| Index | | | | | | Monthly | |
| CMBX NA BBB–.14 | BBB–/P | 1,350 | 27,000 | 1,175 | 12/16/72 | 300 bp — | 189 |
| Index | | | | | | Monthly | |
| CMBX NA BBB–.6 | BB–/P | 131,815 | 2,070,000 | 586,017 | 5/11/63 | 300 bp — | (453,167) |
| Index | | | | | | Monthly | |
| Credit Suisse International | | | | | | |
| CMBX NA BB.7 | B+/P | 8,159 | 61,000 | 22,088 | 1/17/47 | 500 bp — | (13,878) |
| Index | | | | | | Monthly | |
| CMBX NA BBB–.6 | BB–/P | 180,220 | 1,918,000 | 542,986 | 5/11/63 | 300 bp — | (361,807) |
| Index | | | | | | Monthly | |
| Goldman Sachs International | | | | | | |
| CMBX NA A.13 | A-/P | (228) | 43,000 | 267 | 12/16/72 | 200 bp — | 53 |
| Index | | | | | | Monthly | |
| CMBX NA A.6 | A-/P | 99 | 2,000 | 170 | 5/11/63 | 200 bp — | (71) |
| Index | | | | | | Monthly | |
| CMBX NA A.6 | A-/P | 790 | 16,000 | 1,362 | 5/11/63 | 200 bp — | (566) |
| Index | | | | | | Monthly | |
| CMBX NA A.6 | A-/P | (15) | 25,000 | 2,128 | 5/11/63 | 200 bp — | (2,134) |
| Index | | | | | | Monthly | |
| CMBX NA A.6 | A-/P | 1,158 | 38,000 | 3,234 | 5/11/63 | 200 bp — | (2,063) |
| Index | | | | | | Monthly | |
| CMBX NA A.6 | A-/P | 4,172 | 81,000 | 6,893 | 5/11/63 | 200 bp — | (2,694) |
| Index | | | | | | Monthly | |
| CMBX NA BB.13 | BB–/P | 3,943 | 41,000 | 3,981 | 12/16/72 | 500 bp — | (4) |
| Index | | | | | | Monthly | |
| CMBX NA BBB– .13 | BBB–/P | 296 | 5,000 | 313 | 12/16/72 | 300 bp — | (14) |
| Index | | | | | | Monthly | |
| CMBX NA BBB– .13 | BBB–/P | 298 | 5,000 | 313 | 12/16/72 | 300 bp — | (13) |
| Index | | | | | | Monthly | |
| CMBX NA BBB–.11 | BBB–/P | 64 | 1,000 | 52 | 11/18/54 | 300 bp — | 12 |
| Index | | | | | | Monthly | |
| CMBX NA BBB–.6 | BB–/P | 1,407 | 13,000 | 3,680 | 5/11/63 | 300 bp — | (2,266) |
| Index | | | | | | Monthly | |
| | | | | | | |
| OTC CREDIT DEFAULT CONTRACTS OUTSTANDING — PROTECTION SOLD at 4/30/21 (Unaudited) cont. |
| | | Upfront | | | | | |
| | | premium | | | Termi- | Payments | Unrealized |
| Swap counterparty/ | | received | Notional | | nation | received | appreciation/ |
| Referenced debt* | Rating*** | (paid)** | amount | Value | date | by fund | (depreciation) |
| Goldman Sachs International cont. | | | | | |
| CMBX NA BBB–.6 | BB–/P | $1,906 | $14,000 | $3,963 | 5/11/63 | 300 bp — | $(2,050) |
| Index | | | | | | Monthly | |
| CMBX NA BBB–.6 | BB–/P | 2,976 | 27,000 | 7,644 | 5/11/63 | 300 bp — | (4,654) |
| Index | | | | | | Monthly | |
| CMBX NA BBB–.6 | BB–/P | 4,248 | 38,000 | 10,758 | 5/11/63 | 300 bp — | (6,491) |
| Index | | | | | | Monthly | |
| CMBX NA BBB–.6 | BB–/P | 4,273 | 54,000 | 15,287 | 5/11/63 | 300 bp — | (10,988) |
| Index | | | | | | Monthly | |
| CMBX NA BBB–.6 | BB–/P | 7,899 | 73,000 | 20,666 | 5/11/63 | 300 bp — | (12,731) |
| Index | | | | | | Monthly | |
| CMBX NA BBB–.6 | BB–/P | 7,929 | 73,000 | 20,666 | 5/11/63 | 300 bp — | (12,700) |
| Index | | | | | | Monthly | |
| CMBX NA BBB–.6 | BB–/P | 11,382 | 97,000 | 27,461 | 5/11/63 | 300 bp — | (16,030) |
| Index | | | | | | Monthly | |
| CMBX NA BBB–.6 | BB–/P | 17,898 | 147,000 | 41,616 | 5/11/63 | 300 bp — | (23,644) |
| Index | | | | | | Monthly | |
| CMBX NA BBB–.6 | BB–/P | 10,491 | 154,000 | 43,597 | 5/11/63 | 300 bp — | (33,029) |
| Index | | | | | | Monthly | |
| CMBX NA BBB–.6 | BB–/P | 29,016 | 386,000 | 109,277 | 5/11/63 | 300 bp — | (80,068) |
| Index | | | | | | Monthly | |
| CMBX NA BBB–.6 | BB–/P | 48,302 | 515,000 | 145,797 | 5/11/63 | 300 bp — | (97,237) |
| Index | | | | | | Monthly | |
| JPMorgan Securities LLC | | | | | | |
| CMBX NA BB.10 | B+/P | 2,648 | 33,000 | 9,923 | 5/11/63 | 500 bp — | (7,248) |
| Index | | | | | | Monthly | |
| CMBX NA BB.6 | B-/P | 51,480 | 100,000 | 47,610 | 5/11/63 | 500 bp — | 3,953 |
| Index | | | | | | Monthly | |
| CMBX NA BBB–.13 | BBB–/P | 4,077 | 59,000 | 3,693 | 12/16/72 | 300 bp — | 413 |
| Index | | | | | | Monthly | |
| CMBX NA BBB–.6 | BB–/P | 95,911 | 300,000 | 84,930 | 5/11/63 | 300 bp — | 11,131 |
| Index | | | | | | Monthly | |
| CMBX NA BBB–.7 | BB/P | 4,695 | 20,000 | 3,984 | 1/17/47 | 300 bp — | 721 |
| Index | | | | | | Monthly | |
| Merrill Lynch International | | | | | | |
| CMBX NA BBB– .6 | BB–/P | 74,907 | 278,000 | 78,702 | 5/11/63 | 300 bp — | (3,656) |
| Index | | | | | | Monthly | |
| Morgan Stanley & Co. International PLC | | | | | |
| CMBX NA A .6 | A-/P | 818 | 12,000 | 1,021 | 5/11/63 | 200 bp — | (200) |
| Index | | | | | | Monthly | |
| CMBX NA A .6 | A-/P | 6,188 | 90,000 | 7,659 | 5/11/63 | 200 bp — | (1,442) |
| Index | | | | | | Monthly | |
| CMBX NA A.13 | A-/P | 8,447 | 722,000 | 4,476 | 12/16/72 | 200 bp — | 13,164 |
| Index | | | | | | Monthly | |
| CMBX NA BB.13 | BB–/P | 192 | 2,000 | 194 | 12/16/72 | 500 bp — | (1) |
| Index | | | | | | Monthly | |
| CMBX NA BB.13 | BB–/P | 2,789 | 29,000 | 2,816 | 12/16/72 | 500 bp — | (3) |
| Index | | | | | | Monthly | |
| | | | | | | |
| OTC CREDIT DEFAULT CONTRACTS OUTSTANDING — PROTECTION SOLD at 4/30/21 (Unaudited) cont. |
| | | Upfront | | | | | |
| | | premium | | | Termi- | Payments | Unrealized |
| Swap counterparty/ | | received | Notional | | nation | received | appreciation/ |
| Referenced debt* | Rating*** | (paid)** | amount | Value | date | by fund | (depreciation) |
| Morgan Stanley & Co. International PLC cont. | | | | | |
| CMBX NA BB.13 | BB–/P | $6,417 | $68,000 | $6,603 | 12/16/72 | 500 bp — | $(129) |
| Index | | | | | | Monthly | |
| CMBX NA BB.13 | BB–/P | 6,466 | 70,000 | 6,797 | 12/16/72 | 500 bp — | (273) |
| Index | | | | | | Monthly | |
| CMBX NA BB.6 | B-/P | 11,787 | 48,000 | 22,853 | 5/11/63 | 500 bp — | (11,025) |
| Index | | | | | | Monthly | |
| CMBX NA BB.6 | B-/P | 23,902 | 97,000 | 46,182 | 5/11/63 | 500 bp — | (22,199) |
| Index | | | | | | Monthly | |
| CMBX NA BBB– .13 | BBB–/P | 296 | 5,000 | 313 | 12/16/72 | 300 bp — | (15) |
| Index | | | | | | Monthly | |
| CMBX NA BBB– .13 | BBB–/P | 15,616 | 210,000 | 13,146 | 12/16/72 | 300 bp — | 2,575 |
| Index | | | | | | Monthly | |
| CMBX NA BBB– .14 | BBB–/P | 851 | 28,000 | 1,218 | 12/16/72 | 300 bp — | (353) |
| Index | | | | | | Monthly | |
| CMBX NA BBB–.12 | BBB–/P | 3,064 | 52,000 | 2,954 | 8/17/61 | 300 bp — | 138 |
| Index | | | | | | Monthly | |
| Upfront premium received | 934,966 | Unrealized appreciation | | 67,988 |
| Upfront premium (paid) | (243) | Unrealized (depreciation) | | (1,419,191) |
| Total | | $934,723 | Total | | | | $(1,351,203) |
* Payments related to the referenced debt are made upon a credit default event.
** Upfront premium is based on the difference between the original spread on issue and the market spread on day of execution.
*** Ratings for an underlying index represent the average of the ratings of all the securities included in that index. The Moody’s, Standard & Poor’s or Fitch ratings are believed to be the most recent ratings available at April 30, 2021. Securities rated by Putnam are indicated by “/P.” The Putnam rating categories are comparable to the Standard & Poor’s classifications.
| | | | | | |
| OTC CREDIT DEFAULT CONTRACTS OUTSTANDING — PROTECTION PURCHASED at 4/30/21 (Unaudited) |
| | Upfront | | | | | |
| | premium | | | Termi- | Payments | Unrealized |
| Swap counterparty/ | received | Notional | | nation | (paid) | appreciation/ |
| Referenced debt* | (paid)** | amount | Value | date | by fund | (depreciation) |
| Citigroup Global Markets, Inc. | | | | | | |
| CMBX NA A.6 Index | $(101) | $1,000 | $85 | 5/11/63 | (200 bp) — | $(16) |
| | | | | | Monthly | |
| CMBX NA BB.10 Index | (3,861) | 37,000 | 11,126 | 11/17/59 | (500 bp) — | 7,234 |
| | | | | | Monthly | |
| CMBX NA BB.10 Index | (3,399) | 31,000 | 9,322 | 11/17/59 | (500 bp) — | 5,897 |
| | | | | | Monthly | |
| CMBX NA BB.11 Index | (8,232) | 114,000 | 14,877 | 11/18/54 | (500 bp) — | 6,550 |
| | | | | | Monthly | |
| CMBX NA BB.11 Index | (8,292) | 64,000 | 8,352 | 11/18/54 | (500 bp) — | 7 |
| | | | | | Monthly | |
| CMBX NA BB.11 Index | (3,582) | 38,000 | 4,959 | 11/18/54 | (500 bp) — | 1,345 |
| | | | | | Monthly | |
| CMBX NA BB.11 Index | (1,650) | 24,000 | 3,132 | 11/18/54 | (500 bp) — | 1,462 |
| | | | | | Monthly | |
| | | | | | |
| OTC CREDIT DEFAULT CONTRACTS OUTSTANDING — PROTECTION PURCHASED at 4/30/21 (Unaudited) cont. |
| | Upfront | | | | | |
| | premium | | | Termi- | Payments | Unrealized |
| Swap counterparty/ | received | Notional | | nation | (paid) | appreciation/ |
| Referenced debt* | (paid)** | amount | Value | date | by fund | (depreciation) |
| Citigroup Global Markets, Inc. cont. | | | | | |
| CMBX NA BB.11 Index | $(830) | $16,000 | $2,088 | 11/18/54 | (500 bp) — | $1,245 |
| | | | | | Monthly | |
| CMBX NA BB.11 Index | (816) | 16,000 | 2,088 | 11/18/54 | (500 bp) — | 1,259 |
| | | | | | Monthly | |
| CMBX NA BB.12 Index | (1,030) | 12,000 | 1,595 | 8/17/61 | (500 bp) — | 555 |
| | | | | | Monthly | |
| CMBX NA BB.8 Index | (6,581) | 51,161 | 18,740 | 10/17/57 | (500 bp) — | 12,117 |
| | | | | | Monthly | |
| CMBX NA BB.8 Index | (527) | 2,896 | 1,061 | 10/17/57 | (500 bp) — | 532 |
| | | | | | Monthly | |
| CMBX NA BB.9 Index | (9,496) | 92,000 | 24,306 | 9/17/58 | (500 bp) — | 14,734 |
| | | | | | Monthly | |
| CMBX NA BB.9 Index | (5,033) | 78,000 | 20,608 | 9/17/58 | (500 bp) — | 15,510 |
| | | | | | Monthly | |
| CMBX NA BB.9 Index | (906) | 25,000 | 6,605 | 9/17/58 | (500 bp) — | 5,678 |
| | | | | | Monthly | |
| CMBX NA BB.9 Index | (707) | 18,000 | 4,756 | 9/17/58 | (500 bp) — | 4,034 |
| | | | | | Monthly | |
| CMBX NA BB.9 Index | (645) | 16,000 | 4,227 | 9/17/58 | (500 bp) — | 3,569 |
| | | | | | Monthly | |
| CMBX NA BBB– .10 Index | (5,249) | 22,000 | 2,523 | 11/17/59 | (300 bp) — | (2,736) |
| | | | | | Monthly | |
| CMBX NA BBB– .10 Index | (4,875) | 21,000 | 2,409 | 11/17/59 | (300 bp) — | (2,477) |
| | | | | | Monthly | |
| CMBX NA BBB– .10 Index | (4,675) | 19,000 | 2,179 | 11/17/59 | (300 bp) — | (2,505) |
| | | | | | Monthly | |
| CMBX NA BBB– .10 Index | (789) | 5,000 | 574 | 11/17/59 | (300 bp) — | (218) |
| | | | | | Monthly | |
| CMBX NA BBB– .12 Index | (3,276) | 48,000 | 2,726 | 8/17/61 | (300 bp) — | (573) |
| | | | | | Monthly | |
| CMBX NA BBB– .12 Index | (5,641) | 25,000 | 1,420 | 8/17/61 | (300 bp) — | (4,234) |
| | | | | | Monthly | |
| CMBX NA BBB–.10 Index | (48,562) | 163,000 | 18,696 | 11/17/59 | (300 bp) — | (29,947) |
| | | | | | Monthly | |
| CMBX NA BBB–.10 Index | (5,609) | 44,000 | 5,047 | 11/17/59 | (300 bp) — | (584) |
| | | | | | Monthly | |
| CMBX NA BBB–.10 Index | (4,334) | 34,000 | 3,900 | 11/17/59 | (300 bp) — | (451) |
| | | | | | Monthly | |
| CMBX NA BBB–.11 Index | (17,604) | 55,000 | 2,838 | 11/18/54 | (300 bp) — | (14,793) |
| | | | | | Monthly | |
| CMBX NA BBB–.11 Index | (5,028) | 35,000 | 1,806 | 11/18/54 | (300 bp) — | (3,240) |
| | | | | | Monthly | |
| CMBX NA BBB–.11 Index | (7,188) | 22,000 | 1,135 | 11/18/54 | (300 bp) — | (6,064) |
| | | | | | Monthly | |
| CMBX NA BBB–.11 Index | (147) | 1,000 | 52 | 11/18/54 | (300 bp) — | (96) |
| | | | | | Monthly | |
| | | | | | |
| OTC CREDIT DEFAULT CONTRACTS OUTSTANDING — PROTECTION PURCHASED at 4/30/21 (Unaudited) cont. |
| | Upfront | | | | | |
| | premium | | | Termi- | Payments | Unrealized |
| Swap counterparty/ | received | Notional | | nation | (paid) | appreciation/ |
| Referenced debt* | (paid)** | amount | Value | date | by fund | (depreciation) |
| Citigroup Global Markets, Inc. cont. | | | | | |
| CMBX NA BBB–.12 Index | $(38,795) | $123,000 | $6,986 | 8/17/61 | (300 bp) — | $(31,870) |
| | | | | | Monthly | |
| CMBX NA BBB–.12 Index | (31,283) | 90,000 | 5,112 | 8/17/61 | (300 bp) — | (26,216) |
| | | | | | Monthly | |
| CMBX NA BBB–.12 Index | (22,054) | 66,000 | 3,749 | 8/17/61 | (300 bp) — | (18,338) |
| | | | | | Monthly | |
| CMBX NA BBB–.12 Index | (22,555) | 64,000 | 3,635 | 8/17/61 | (300 bp) — | (18,951) |
| | | | | | Monthly | |
| CMBX NA BBB–.12 Index | (15,365) | 46,000 | 2,613 | 8/17/61 | (300 bp) — | (12,775) |
| | | | | | Monthly | |
| CMBX NA BBB–.12 Index | (15,466) | 44,000 | 2,499 | 8/17/61 | (300 bp) — | (12,989) |
| | | | | | Monthly | |
| CMBX NA BBB–.12 Index | (4,065) | 24,000 | 1,363 | 8/17/61 | (300 bp) — | (2,714) |
| | | | | | Monthly | |
| CMBX NA BBB–.12 Index | (8,199) | 24,000 | 1,363 | 8/17/61 | (300 bp) — | (6,848) |
| | | | | | Monthly | |
| CMBX NA BBB–.13 Index | (7,199) | 95,000 | 5,947 | 12/16/72 | (300 bp) — | (1,299) |
| | | | | | Monthly | |
| CMBX NA BBB–.7 Index | (656) | 3,000 | 598 | 1/17/47 | (300 bp) — | (60) |
| | | | | | Monthly | |
| CMBX NA BBB–.8 Index | (19,531) | 125,000 | 19,013 | 10/17/57 | (300 bp) — | (581) |
| | | | | | Monthly | |
| CMBX NA BBB–.8 Index | (8,219) | 52,000 | 7,909 | 10/17/57 | (300 bp) — | (336) |
| | | | | | Monthly | |
| CMBX NA BBB–.8 Index | (8,252) | 52,000 | 7,909 | 10/17/57 | (300 bp) — | (369) |
| | | | | | Monthly | |
| CMBX NA BBB–.9 Index | (10,410) | 44,000 | 4,448 | 9/17/58 | (300 bp) — | (5,984) |
| | | | | | Monthly | |
| Credit Suisse International | | | | | | |
| CMBX NA BB.10 Index | (9,157) | 77,000 | 23,154 | 11/17/59 | (500 bp) — | 13,933 |
| | | | | | Monthly | |
| CMBX NA BB.10 Index | (10,274) | 77,000 | 23,154 | 11/17/59 | (500 bp) — | 12,816 |
| | | | | | Monthly | |
| CMBX NA BB.10 Index | (5,096) | 41,000 | 12,329 | 11/17/59 | (500 bp) — | 7,198 |
| | | | | | Monthly | |
| CMBX NA BB.7 Index | (8,049) | 456,000 | 217,102 | 5/11/63 | (500 bp) — | 208,673 |
| | | | | | Monthly | |
| CMBX NA BB.7 Index | (29,146) | 158,000 | 57,212 | 1/17/47 | (500 bp) — | 27,935 |
| | | | | | Monthly | |
| CMBX NA BB.7 Index | (2,467) | 15,000 | 5,432 | 1/17/47 | (500 bp) — | 2,952 |
| | | | | | Monthly | |
| CMBX NA BB.8 Index | (1,051) | 5,792 | 2,122 | 10/17/57 | (500 bp) — | 1,065 |
| | | | | | Monthly | |
| CMBX NA BB.9 Index | (22,455) | 224,000 | 59,181 | 9/17/58 | (500 bp) — | 36,539 |
| | | | | | Monthly | |
| | | | | | |
| OTC CREDIT DEFAULT CONTRACTS OUTSTANDING — PROTECTION PURCHASED at 4/30/21 (Unaudited) cont. |
| | Upfront | | | | | |
| | premium | | | Termi- | Payments | Unrealized |
| Swap counterparty/ | received | Notional | | nation | (paid) | appreciation/ |
| Referenced debt* | (paid)** | amount | Value | date | by fund | (depreciation) |
| Goldman Sachs International | | | | | | |
| CMBX NA BB.7 Index | $(6,053) | $40,000 | $14,484 | 1/17/47 | (500 bp) — | $8,398 |
| | | | | | Monthly | |
| CMBX NA BB.7 Index | (45,077) | 222,000 | 80,386 | 1/17/47 | (500 bp) — | 35,124 |
| | | | | | Monthly | |
| CMBX NA BB.7 Index | (16,057) | 98,000 | 35,486 | 1/17/47 | (500 bp) — | 19,347 |
| | | | | | Monthly | |
| CMBX NA BB.8 Index | (2,266) | 19,306 | 7,072 | 10/17/57 | (500 bp) — | 4,790 |
| | | | | | Monthly | |
| CMBX NA BB.9 Index | (602) | 5,000 | 1,321 | 9/17/58 | (500 bp) — | 715 |
| | | | | | Monthly | |
| CMBX NA BB.9 Index | (595) | 5,000 | 1,321 | 9/17/58 | (500 bp) — | 722 |
| | | | | | Monthly | |
| CMBX NA BB.9 Index | (478) | 3,000 | 793 | 9/17/58 | (500 bp) — | 313 |
| | | | | | Monthly | |
| CMBX NA BB.9 Index | (313) | 3,000 | 793 | 9/17/58 | (500 bp) — | 477 |
| | | | | | Monthly | |
| CMBX NA BB.9 Index | (320) | 2,000 | 528 | 9/17/58 | (500 bp) — | 206 |
| | | | | | Monthly | |
| CMBX NA BB.9 Index | (319) | 2,000 | 528 | 9/17/58 | (500 bp) — | 208 |
| | | | | | Monthly | |
| CMBX NA BB.9 Index | (158) | 1,000 | 264 | 9/17/58 | (500 bp) — | 105 |
| | | | | | Monthly | |
| CMBX NA BBB– .10 Index | (312) | 2,000 | 229 | 11/17/59 | (300 bp) — | (83) |
| | | | | | Monthly | |
| CMBX NA BBB–.12 Index | (11,145) | 33,000 | 1,874 | 8/17/61 | (300 bp) — | (9,287) |
| | | | | | Monthly | |
| CMBX NA BBB–.13 Index | (3,107) | 41,000 | 2,567 | 12/16/72 | (300 bp) — | (561) |
| | | | | | Monthly | |
| CMBX NA BBB–.6 Index | (3,452) | 69,000 | 19,534 | 5/11/63 | (300 bp) — | 16,047 |
| | | | | | Monthly | |
| CMBX NA BBB–.6 Index | (6,386) | 26,000 | 7,361 | 5/11/63 | (300 bp) — | 961 |
| | | | | | Monthly | |
| CMBX NA BBB–.8 Index | (31,635) | 205,000 | 31,181 | 10/17/57 | (300 bp) — | (557) |
| | | | | | Monthly | |
| CMBX NA BBB–.8 Index | (8,311) | 53,000 | 8,061 | 10/17/57 | (300 bp) — | (276) |
| | | | | | Monthly | |
| JPMorgan Securities LLC | | | | | | |
| CMBX NA BB.11 Index | (178,341) | 327,000 | 42,674 | 11/18/54 | (500 bp) — | (135,940) |
| | | | | | Monthly | |
| CMBX NA BB.12 Index | (31,305) | 57,000 | 7,575 | 8/17/61 | (500 bp) — | (23,778) |
| | | | | | Monthly | |
| CMBX NA BB.17 Index | (13,221) | 27,000 | 9,777 | 1/17/47 | (500 bp) — | (3,466) |
| | | | | | Monthly | |
| CMBX NA BB.8 Index | (4,461) | 8,688 | 3,182 | 10/17/57 | (500 bp) — | (1,286) |
| | | | | | Monthly | |
| CMBX NA BB.9 Index | (4,942) | 10,000 | 2,642 | 9/17/58 | (500 bp) — | (2,308) |
| | | | | | Monthly | |
| | | | | | |
| OTC CREDIT DEFAULT CONTRACTS OUTSTANDING — PROTECTION PURCHASED at 4/30/21 (Unaudited) cont. |
| | Upfront | | | | | |
| | premium | | | Termi- | Payments | Unrealized |
| Swap counterparty/ | received | Notional | | nation | (paid) | appreciation/ |
| Referenced debt* | (paid)** | amount | Value | date | by fund | (depreciation) |
| JPMorgan Securities LLC cont. | | | | | | |
| CMBX NA BBB– .10 Index | $(6,762) | $41,000 | $4,703 | 11/17/59 | (300 bp) — | $(2,080) |
| | | | | | Monthly | |
| CMBX NA BBB–.10 Index | (22,269) | 196,000 | 22,481 | 11/17/59 | (300 bp) — | 131 |
| | | | | | Monthly | |
| CMBX NA BBB–.10 Index | (17,466) | 62,000 | 7,111 | 11/17/59 | (300 bp) — | (10,386) |
| | | | | | Monthly | |
| CMBX NA BBB–.10 Index | (15,790) | 53,000 | 6,079 | 11/17/59 | (300 bp) — | (9,737) |
| | | | | | Monthly | |
| CMBX NA BBB–.11 Index | (24,830) | 79,000 | 4,076 | 11/18/54 | (300 bp) — | (20,793) |
| | | | | | Monthly | |
| CMBX NA BBB–.11 Index | (12,572) | 40,000 | 2,064 | 11/18/54 | (300 bp) — | (10,528) |
| | | | | | Monthly | |
| CMBX NA BBB–.11 Index | (11,928) | 37,000 | 1,909 | 11/18/54 | (300 bp) — | (10,038) |
| | | | | | Monthly | |
| CMBX NA BBB–.12 Index | (15,595) | 47,000 | 2,670 | 8/17/61 | (300 bp) — | (12,949) |
| | | | | | Monthly | |
| CMBX NA BBB–.6 Index | (66,380) | 245,000 | 69,360 | 5/11/63 | (300 bp) — | 2,857 |
| | | | | | Monthly | |
| Merrill Lynch International | | | | | | |
| CMBX NA BB.10 Index | (4,211) | 74,000 | 22,252 | 11/17/59 | (500 bp) — | 17,980 |
| | | | | | Monthly | |
| CMBX NA BB.11 Index | (41,022) | 83,000 | 10,832 | 11/18/54 | (500 bp) — | (30,259) |
| | | | | | Monthly | |
| CMBX NA BB.7 Index | (5,378) | 31,000 | 11,225 | 1/17/47 | (500 bp) — | 5,821 |
| | | | | | Monthly | |
| CMBX NA BB.9 Index | (9,700) | 249,000 | 65,786 | 9/17/58 | (500 bp) — | 55,878 |
| | | | | | Monthly | |
| CMBX NA BBB– .10 Index | (13,217) | 61,000 | 6,997 | 11/17/59 | (300 bp) — | (6,251) |
| | | | | | Monthly | |
| CMBX NA BBB–.7 Index | (1,311) | 16,000 | 3,187 | 1/17/47 | (300 bp) — | 1,868 |
| | | | | | Monthly | |
| CMBX NA BBB–.9 Index | (7,225) | 39,000 | 3,943 | 9/17/58 | (300 bp) — | (3,301) |
| | | | | | Monthly | |
| CMBX NA BBB–.9 Index | (4,261) | 23,000 | 2,325 | 9/17/58 | (300 bp) — | (1,947) |
| | | | | | Monthly | |
| Morgan Stanley & Co. International PLC | | | | | |
| CMBX NA BB.10 Index | (3,880) | 37,000 | 11,126 | 11/17/59 | (500 bp) — | 7,215 |
| | | | | | Monthly | |
| CMBX NA BB.12 Index | (2,502) | 35,000 | 4,652 | 8/17/61 | (500 bp) — | 2,120 |
| | | | | | Monthly | |
| CMBX NA BB.12 Index | (1,825) | 25,000 | 3,323 | 8/17/61 | (500 bp) — | 1,476 |
| | | | | | Monthly | |
| CMBX NA BB.12 Index | (1,144) | 14,000 | 1,861 | 9/17/58 | (500 bp) — | 705 |
| | | | | | Monthly | |
| CMBX NA BB.12 Index | (3,000) | 5,000 | 665 | 8/17/61 | (500 bp) — | (2,340) |
| | | | | | Monthly | |
| | | | | | |
| OTC CREDIT DEFAULT CONTRACTS OUTSTANDING — PROTECTION PURCHASED at 4/30/21 (Unaudited) cont. |
| | Upfront | | | | | |
| | premium | | | Termi- | Payments | Unrealized |
| Swap counterparty/ | received | Notional | | nation | (paid) | appreciation/ |
| Referenced debt* | (paid)** | amount | Value | date | by fund | (depreciation) |
| Morgan Stanley & Co. International PLC cont. | | | | | |
| CMBX NA BB.7 Index | $(12,267) | $61,000 | $22,088 | 1/17/47 | (500 bp) — | $9,770 |
| | | | | | Monthly | |
| CMBX NA BB.7 Index | (4,844) | 24,000 | 8,690 | 1/17/47 | (500 bp) — | 3,827 |
| | | | | | Monthly | |
| CMBX NA BB.7 Index | (3,471) | 18,000 | 6,518 | 1/17/47 | (500 bp) — | 3,032 |
| | | | | | Monthly | |
| CMBX NA BB.8 Index | (4,944) | 9,653 | 3,536 | 10/17/57 | (500 bp) — | (1,416) |
| | | | | | Monthly | |
| CMBX NA BB.9 Index | (3,693) | 42,000 | 11,096 | 9/17/58 | (500 bp) — | 7,369 |
| | | | | | Monthly | |
| CMBX NA BB.9 Index | (2,276) | 37,000 | 9,775 | 9/17/58 | (500 bp) — | 7,469 |
| | | | | | Monthly | |
| CMBX NA BB.9 Index | (2,179) | 29,000 | 7,662 | 9/17/58 | (500 bp) — | 5,459 |
| | | | | | Monthly | |
| CMBX NA BB.9 Index | (1,642) | 27,000 | 7,133 | 9/17/58 | (500 bp) — | 5,469 |
| | | | | | Monthly | |
| CMBX NA BB.9 Index | (843) | 17,000 | 4,491 | 9/17/58 | (500 bp) — | 3,635 |
| | | | | | Monthly | |
| CMBX NA BB.9 Index | (508) | 13,000 | 3,435 | 9/17/58 | (500 bp) — | 2,916 |
| | | | | | Monthly | |
| CMBX NA BB.9 Index | (1,334) | 11,000 | 2,906 | 9/17/58 | (500 bp) — | 1,563 |
| | | | | | Monthly | |
| CMBX NA BB.9 Index | (369) | 6,000 | 1,585 | 9/17/58 | (500 bp) — | 1,211 |
| | | | | | Monthly | |
| CMBX NA BB.9 Index | (606) | 5,000 | 1,321 | 9/17/58 | (500 bp) — | 711 |
| | | | | | Monthly | |
| CMBX NA BBB– .10 Index | (3,954) | 33,000 | 3,785 | 11/17/59 | (300 bp) — | (185) |
| | | | | | Monthly | |
| CMBX NA BBB– .10 Index | (7,314) | 30,000 | 3,441 | 11/17/59 | (300 bp) — | (3,888) |
| | | | | | Monthly | |
| CMBX NA BBB– .10 Index | (4,553) | 21,000 | 2,409 | 11/17/59 | (300 bp) — | (2,155) |
| | | | | | Monthly | |
| CMBX NA BBB– .10 Index | (4,109) | 19,000 | 2,179 | 11/17/59 | (300 bp) — | (1,939) |
| | | | | | Monthly | |
| CMBX NA BBB– .10 Index | (2,435) | 17,000 | 1,950 | 11/17/59 | (300 bp) — | (493) |
| | | | | | Monthly | |
| CMBX NA BBB– .10 Index | (3,784) | 16,000 | 1,835 | 11/17/59 | (300 bp) — | (1,957) |
| | | | | | Monthly | |
| CMBX NA BBB– .10 Index | (2,296) | 10,000 | 1,147 | 11/17/59 | (300 bp) — | (1,154) |
| | | | | | Monthly | |
| CMBX NA BBB– .12 Index | (4,382) | 21,000 | 1,193 | 8/17/61 | (300 bp) — | (3,200) |
| | | | | | Monthly | |
| CMBX NA BBB–.10 Index | (17,397) | 141,000 | 16,173 | 11/17/59 | (300 bp) — | (1,295) |
| | | | | | Monthly | |
| CMBX NA BBB–.10 Index | (9,639) | 76,000 | 8,717 | 11/17/59 | (300 bp) — | (960) |
| | | | | | Monthly | |
| | | | | | |
| OTC CREDIT DEFAULT CONTRACTS OUTSTANDING — PROTECTION PURCHASED at 4/30/21 (Unaudited) cont. |
| | Upfront | | | | | |
| | premium | | | Termi- | Payments | Unrealized |
| Swap counterparty/ | received | Notional | | nation | (paid) | appreciation/ |
| Referenced debt* | (paid)** | amount | Value | date | by fund | (depreciation) |
| Morgan Stanley & Co. International PLC cont. | | | | | |
| CMBX NA BBB–.10 Index | $(8,117) | $64,000 | $7,341 | 11/17/59 | (300 bp) — | $(808) |
| | | | | | Monthly | |
| CMBX NA BBB–.11 Index | (27,206) | 85,000 | 4,386 | 11/18/54 | (300 bp) — | (22,863) |
| | | | | | Monthly | |
| CMBX NA BBB–.12 Index | (4,320) | 13,000 | 738 | 8/17/61 | (300 bp) — | (3,588) |
| | | | | | Monthly | |
| CMBX NA BBB–.13 Index | (11,833) | 192,000 | 12,019 | 12/16/72 | (300 bp) — | 90 |
| | | | | | Monthly | |
| CMBX NA BBB–.7 Index | (41) | 1,000 | 199 | 1/17/47 | (300 bp) — | 158 |
| | | | | | Monthly | |
| CMBX NA BBB–.8 Index | (53,474) | 349,000 | 53,083 | 10/17/57 | (300 bp) — | (566) |
| | | | | | Monthly | |
| CMBX NA BBB–.8 Index | (29,904) | 193,000 | 29,355 | 10/17/57 | (300 bp) — | (645) |
| | | | | | Monthly | |
| CMBX NA BBB–.8 Index | (8,125) | 52,000 | 7,909 | 10/17/57 | (300 bp) — | (242) |
| | | | | | Monthly | |
| CMBX NA BBB–.8 Index | (7,902) | 51,000 | 7,757 | 10/17/57 | (300 bp) — | (170) |
| | | | | | Monthly | |
| CMBX NA BBB–.8 Index | (6,852) | 44,000 | 6,692 | 10/17/57 | (300 bp) — | (191) |
| | | | | | Monthly | |
| Upfront premium received | — | Unrealized appreciation | | 628,982 |
| Upfront premium (paid) | (1,386,146) | Unrealized (depreciation) | | (553,130) |
| Total | $(1,386,146) | Total | | | | $75,852 |
* Payments related to the referenced debt are made upon a credit default event.
** Upfront premium is based on the difference between the original spread on issue and the market spread on day of execution.
ASC 820 establishes a three-level hierarchy for disclosure of fair value measurements. The valuation hierarchy is based upon the transparency of inputs to the valuation of the fund’s investments. The three levels are defined as follows:
Level 1: Valuations based on quoted prices for identical securities in active markets.
Level 2: Valuations based on quoted prices in markets that are not active or for which all significant inputs are observable, either directly or indirectly.
Level 3: Valuations based on inputs that are unobservable and significant to the fair value measurement.
The following is a summary of the inputs used to value the fund’s net assets as of the close of the reporting period:
| | | |
| | | | Valuation inputs | |
| Investments in securities: | Level 1 | Level 2 | Level 3 |
| Asset-backed securities | $— | $3,735,996 | $— |
| Collateralized loan obligations | — | 4,124,481 | — |
| Corporate bonds and notes | — | 55,822,790 | — |
| Foreign government and agency bonds and notes | — | 86,351,534 | — |
| Mortgage-backed securities | — | 89,382,165 | — |
| Purchased options outstanding | — | 51,746 | — |
| Purchased swap options outstanding | — | 2,082,584 | — |
| U.S. government and agency mortgage obligations | — | 157,959,299 | — |
| U.S. treasury obligations | — | 242,090 | — |
| Short-term investments | 1,636,000 | 11,610,045 | — |
| Totals by level | $1,636,000 | $411,362,730 | $— |
| | | | |
| | | | Valuation inputs | |
| Other financial instruments: | Level 1 | Level 2 | Level 3 |
| Forward currency contracts | $— | $53,070 | $— |
| Futures contracts | (446,549) | — | — |
| Written options outstanding | — | (4,488) | — |
| Written swap options outstanding | — | (2,847,275) | — |
| Forward premium swap option contracts | — | 436,101 | — |
| TBA sale commitments | — | (102,473,674) | — |
| Interest rate swap contracts | — | 272,147 | — |
| Total return swap contracts | — | (2,122,153) | — |
| Credit default contracts | — | (823,928) | — |
| Totals by level | $(446,549) | $(107,510,200) | $— |
The accompanying notes are an integral part of these financial statements.
Statement of assets and liabilities 4/30/21 (Unaudited)
| |
| ASSETS | |
| Investment in securities, at value (Notes 1 and 8): | |
| Unaffiliated issuers (identified cost $401,018,165) | $408,488,590 |
| Affiliated issuers (identified cost $4,510,140) (Note 5) | 4,510,140 |
| Cash | 135,560 |
| Foreign currency (cost $21,446) (Note 1) | 21,509 |
| Interest and other receivables | 1,779,931 |
| Receivable for shares of the fund sold | 295,631 |
| Receivable for investments sold | 275 |
| Receivable for sales of TBA securities (Note 1) | 74,136,751 |
| Receivable from Manager (Note 2) | 76,249 |
| Receivable for variation margin on futures contracts (Note 1) | 20,157 |
| Receivable for variation margin on centrally cleared swap contracts (Note 1) | 289,698 |
| Unrealized appreciation on forward currency contracts (Note 1) | 1,546,365 |
| Unrealized appreciation on forward premium swap option contracts (Note 1) | 2,612,061 |
| Unrealized appreciation on OTC swap contracts (Note 1) | 769,986 |
| Premium paid on OTC swap contracts (Note 1) | 1,386,389 |
| Prepaid assets | 53,887 |
| Total assets | 496,123,179 |
| |
| LIABILITIES | |
| Payable for investments purchased | 145,993 |
| Payable for purchases of TBA securities (Note 1) | 129,208,695 |
| Payable for shares of the fund repurchased | 201,961 |
| Payable for custodian fees (Note 2) | 55,327 |
| Payable for investor servicing fees (Note 2) | 75,858 |
| Payable for Trustee compensation and expenses (Note 2) | 151,126 |
| Payable for administrative services (Note 2) | 777 |
| Payable for distribution fees (Note 2) | 29,371 |
| Payable for variation margin on futures contracts (Note 1) | 2,405 |
| Payable for variation margin on centrally cleared swap contracts (Note 1) | 285,488 |
| Unrealized depreciation on forward currency contracts (Note 1) | 1,493,295 |
| Unrealized depreciation on forward premium swap option contracts (Note 1) | 2,175,960 |
| Written options outstanding, at value (premiums $2,822,501) (Note 1) | 2,851,763 |
| TBA sale commitments, at value (proceeds receivable $101,702,520) (Note 1) | 102,473,674 |
| Unrealized depreciation on OTC swap contracts (Note 1) | 1,979,625 |
| Premium received on OTC swap contracts (Note 1) | 934,966 |
| Collateral on certain derivative contracts and TBA commitments, at value (Notes 1 and 8) | 1,878,090 |
| Other accrued expenses | 109,574 |
| Total liabilities | 244,053,948 |
| | |
| Net assets | $252,069,231 |
(Continued on next page)
Statement of assets and liabilities cont.
| |
| REPRESENTED BY | |
| Paid-in capital (Unlimited shares authorized) (Notes 1 and 4) | $251,316,820 |
| Total distributable earnings (Note 1) | 752,411 |
| Total — Representing net assets applicable to capital shares outstanding | $252,069,231 |
| |
| COMPUTATION OF NET ASSET VALUE AND OFFERING PRICE | |
| Net asset value and redemption price per class A share | |
| ($116,323,885 divided by 9,324,572 shares) | $12.47 |
| Offering price per class A share (100/96.00 of $12.47)* | $12.99 |
| Net asset value and offering price per class B share ($643,646 divided by 51,848 shares)** | $12.41 |
| Net asset value and offering price per class C share ($4,668,958 divided by 376,064 shares)** | $12.42 |
| Net asset value, offering price and redemption price per class R share | |
| ($2,466,853 divided by 197,852 shares) | $12.47 |
| Net asset value, offering price and redemption price per class R5 share | |
| ($39,394 divided by 3,160 shares) | $12.47 |
| Net asset value, offering price and redemption price per class R6 share | |
| ($33,498,844 divided by 2,685,333 shares) | $12.47 |
| Net asset value, offering price and redemption price per class Y share | |
| ($94,427,651 divided by 7,574,397 shares) | $12.47 |
*On single retail sales of less than $100,000. On sales of $100,000 or more the offering price is reduced.
**Redemption price per share is equal to net asset value less any applicable contingent deferred sales charge.
The accompanying notes are an integral part of these financial statements.
Statement of operations Six months ended 4/30/21 (Unaudited)
| |
| INVESTMENT INCOME | |
| Interest (including interest income of $5,068 from investments in affiliated issuers) (Note 5) | $3,629,935 |
| Total investment income | 3,629,935 |
| |
| EXPENSES | |
| Compensation of Manager (Note 2) | 678,389 |
| Investor servicing fees (Note 2) | 227,590 |
| Custodian fees (Note 2) | 61,717 |
| Trustee compensation and expenses (Note 2) | 6,027 |
| Distribution fees (Note 2) | 184,541 |
| Administrative services (Note 2) | 4,401 |
| Auditing and tax fees | 89,550 |
| Other | 102,287 |
| Fees waived and reimbursed by Manager (Note 2) | (394,169) |
| Total expenses | 960,333 |
| Expense reduction (Note 2) | (344) |
| Net expenses | 959,989 |
| | |
| Net investment income | 2,669,946 |
| |
| REALIZED AND UNREALIZED GAIN (LOSS) | |
| Net realized gain (loss) on: | |
| Securities from unaffiliated issuers (Notes 1 and 3) | 2,851,952 |
| Net increase from payments by affiliates (Note 2) | 1,016 |
| Foreign currency transactions (Note 1) | 15,721 |
| Forward currency contracts (Note 1) | 1,301,280 |
| Futures contracts (Note 1) | (1,606,178) |
| Swap contracts (Note 1) | 2,067,335 |
| Written options (Note 1) | 435,142 |
| Total net realized gain | 5,066,268 |
| Change in net unrealized appreciation (depreciation) on: | |
| Securities from unaffiliated issuers and TBA sale commitments | (3,948,037) |
| Assets and liabilities in foreign currencies | (6,648) |
| Forward currency contracts | (613,639) |
| Futures contracts | (112,027) |
| Swap contracts | (730,901) |
| Written options | 253,050 |
| Total change in net unrealized depreciation | (5,158,202) |
| | |
| Net loss on investments | (91,934) |
| |
| Net increase in net assets resulting from operations | $2,578,012 |
The accompanying notes are an integral part of these financial statements.
Statement of changes in net assets
| | |
| INCREASE IN NET ASSETS | Six months ended 4/30/21* | Year ended 10/31/20 |
| Operations | | |
| Net investment income | $2,669,946 | $4,501,833 |
| Net realized gain on investments | | |
| and foreign currency transactions | 5,066,268 | 550,009 |
| Change in net unrealized appreciation (depreciation) | | |
| of investments and assets and liabilities | | |
| in foreign currencies | (5,158,202) | 1,583,049 |
| Net increase in net assets resulting from operations | 2,578,012 | 6,634,891 |
| Distributions to shareholders (Note 1): | | |
| From ordinary income | | |
| Net investment income | | |
| Class A | (943,966) | (621,119) |
| Class B | (3,441) | (3,522) |
| Class C | (25,216) | (26,706) |
| Class M | — | (2,197) |
| Class R | (16,588) | (11,650) |
| Class R5 | (354) | (181) |
| Class R6 | (343,880) | (211,982) |
| Class Y | (896,693) | (530,702) |
| From return of capital | | |
| Class A | — | (1,415,559) |
| Class B | — | (8,027) |
| Class C | — | (60,865) |
| Class M | — | (5,006) |
| Class R | — | (26,551) |
| Class R5 | — | (411) |
| Class R6 | — | (483,118) |
| Class Y | — | (1,209,494) |
| Increase from capital share transactions (Note 4) | 888,550 | 17,989,743 |
| Total increase in net assets | 1,236,424 | 20,007,544 |
| |
| NET ASSETS | | |
| Beginning of period | 250,832,807 | 230,825,263 |
| End of period | $252,069,231 | $250,832,807 |
*Unaudited.
The accompanying notes are an integral part of these financial statements.
|
| This page left blank intentionally. |
Financial highlights (For a common share outstanding throughout the period)
| | | | | | | | | | | | | |
| | INVESTMENT OPERATIONS | LESS DISTRIBUTIONS | RATIOS AND SUPPLEMENTAL DATA |
| | | | | | | | | | | | | Ratio of net | |
| | Net asset | | Net realized | | | | | | | | Ratio | investment | |
| | value, | | and unrealized | Total from | From net | | | Net asset | Total return | Net assets, | of expenses | income (loss) | Portfolio |
| | beginning | Net investment | gain (loss) | investment | investment | From return | Total | value, end | at net asset | end of period | to average | to average | turnover |
| Period ended | of period | income (loss)a | on investments | operations | income | of capital | distributions | of period | value (%)b | (in thousands) | net assets (%)c | net assets (%) | (%)d |
| Class A | | | | | | | | | | | | | |
| April 30, 2021** | $12.45 | .12 | —g,h | .12 | (.10) | — | (.10) | $12.47 | .97* | $116,324 | .44*e | .98*e | 400* |
| October 31, 2020 | 12.35 | .22 | .10 | .32 | (.07) | (.15) | (.22) | 12.45 | 2.64 | 114,466 | 1.09e | 1.76e | 590 |
| October 31, 2019 | 11.50 | .26 | .84 | 1.10 | (.19) | (.06) | (.25) | 12.35 | 9.68 | 114,345 | 1.22e | 2.19e | 408 |
| October 31, 2018 | 12.05 | .27 | (.52) | (.25) | (.19) | (.11) | (.30) | 11.50 | (2.14) | 116,014 | 1.22e | 2.25e | 451 |
| October 31, 2017 | 11.93 | .27 | .23 | .50 | (.38) | — | (.38) | 12.05 | 4.32 | 121,661 | 1.22e | 2.28e | 660 |
| October 31, 2016 | 11.93 | .30 | .08 | .38 | (.38) | — | (.38) | 11.93 | 3.27 | 148,868 | 1.16f | 2.50f | 551 |
| Class B | | | | | | | | | | | | | |
| April 30, 2021** | $12.39 | .06i | .01h | .07 | (.05) | — | (.05) | $12.41 | .59* | $644 | .81*e | .49*e,i | 400* |
| October 31, 2020 | 12.29 | .12 | .11 | .23 | (.04) | (.09) | (.13) | 12.39 | 1.84 | 934 | 1.84e | .97e | 590 |
| October 31, 2019 | 11.45 | .17 | .83 | 1.00 | (.12) | (.04) | (.16) | 12.29 | 8.80 | 1,508 | 1.97e | 1.42e | 408 |
| October 31, 2018 | 12.00 | .18 | (.53) | (.35) | (.13) | (.07) | (.20) | 11.45 | (2.90) | 2,362 | 1.97e | 1.48e | 451 |
| October 31, 2017 | 11.87 | .18 | .24 | .42 | (.29) | — | (.29) | 12.00 | 3.63 | 3,633 | 1.97e | 1.51e | 660 |
| October 31, 2016 | 11.87 | .21 | .08 | .29 | (.29) | — | (.29) | 11.87 | 2.51 | 4,916 | 1.91f | 1.74f | 551 |
| Class C | | | | | | | | | | | | | |
| April 30, 2021** | $12.39 | .07 | .01h | .08 | (.05) | — | (.05) | $12.42 | .67* | $4,669 | .81*e | .58*e | 400* |
| October 31, 2020 | 12.29 | .12 | .11 | .23 | (.04) | (.09) | (.13) | 12.39 | 1.88 | 6,508 | 1.84e | 1.03e | 590 |
| October 31, 2019 | 11.45 | .17 | .83 | 1.00 | (.12) | (.04) | (.16) | 12.29 | 8.81 | 9,591 | 1.97e | 1.44e | 408 |
| October 31, 2018 | 12.00 | .18 | (.52) | (.34) | (.14) | (.07) | (.21) | 11.45 | (2.89) | 12,444 | 1.97e | 1.49e | 451 |
| October 31, 2017 | 11.87 | .18 | .24 | .42 | (.29) | — | (.29) | 12.00 | 3.63 | 17,763 | 1.97e | 1.53e | 660 |
| October 31, 2016 | 11.88 | .21 | .08 | .29 | (.30) | — | (.30) | 11.87 | 2.43 | 21,570 | 1.91f | 1.74f | 551 |
| Class R | | | | | | | | | | | | | |
| April 30, 2021** | $12.45 | .11 | —g,h | .11 | (.09) | — | (.09) | $12.47 | .85* | $2,467 | .56*e | .88*e | 400* |
| October 31, 2020 | 12.35 | .19 | .10 | .29 | (.06) | (.13) | (.19) | 12.45 | 2.39 | 2,475 | 1.34e | 1.52e | 590 |
| October 31, 2019 | 11.50 | .23 | .84 | 1.07 | (.16) | (.06) | (.22) | 12.35 | 9.40 | 1,955 | 1.47e | 1.97e | 408 |
| October 31, 2018 | 12.05 | .24 | (.52) | (.28) | (.17) | (.10) | (.27) | 11.50 | (2.39) | 2,014 | 1.47e | 2.02e | 451 |
| October 31, 2017 | 11.90 | .24 | .24 | .48 | (.33) | — | (.33) | 12.05 | 4.14 | 3,040 | 1.47e | 2.02e | 660 |
| October 31, 2016 | 11.91 | .27 | .08 | .35 | (.36) | — | (.36) | 11.90 | 2.98 | 13,875 | 1.41f | 2.26f | 551 |
| Class R5 | | | | | | | | | | | | | |
| April 30, 2021** | $12.44 | .15 | —g,h | .15 | (.12) | — | (.12) | $12.47 | 1.21* | $39 | .27*e | 1.17*e | 400* |
| October 31, 2020 | 12.35 | .26 | .09 | .35 | (.08) | (.18) | (.26) | 12.44 | 2.91 | 33 | .75e | 2.10e | 590 |
| October 31, 2019 | 11.50 | .31 | .83 | 1.14 | (.22) | (.07) | (.29) | 12.35 | 10.06 | 24 | .86e | 2.60e | 408 |
| October 31, 2018 | 12.05 | .31 | (.52) | (.21) | (.22) | (.12) | (.34) | 11.50 | (1.77) | 31 | .86e | 2.63e | 451 |
| October 31, 2017 | 11.93 | .32 | .23 | .55 | (.43) | — | (.43) | 12.05 | 4.70 | 29 | .87e | 2.68e | 660 |
| October 31, 2016 | 11.94 | .34 | .07 | .41 | (.42) | — | (.42) | 11.93 | 3.50 | 24 | .86f | 2.82f | 551 |
See notes to financial highlights at the end of this section.
The accompanying notes are an integral part of these financial statements.
| |
| 82 Global Income Trust | Global Income Trust 83 |
Financial highlights cont.
| | | | | | | | | | | | | |
| | INVESTMENT OPERATIONS | LESS DISTRIBUTIONS | RATIOS AND SUPPLEMENTAL DATA |
| | | | | | | | | | | | | Ratio of net | |
| | Net asset | | Net realized | | | | | | | | Ratio | investment | |
| | value, | | and unrealized | Total from | From net | | | Net asset | Total return | Net assets, | of expenses | income (loss) | Portfolio |
| | beginning | Net investment | gain (loss) | investment | investment | From return | Total | value, end | at net asset | end of period | to average | to average | turnover |
| Period ended | of period | income (loss)a | on investments | operations | income | of capital | distributions | of period | value (%)b | (in thousands) | net assets (%)c | net assets (%) | (%)d |
| Class R6 | | | | | | | | | | | | | |
| April 30, 2021** | $12.45 | .15 | —g,h | .15 | (.13) | — | (.13) | $12.47 | 1.17* | $33,499 | .24*e | 1.18*e | 400* |
| October 31, 2020 | 12.35 | .26 | .11 | .37 | (.08) | (.19) | (.27) | 12.45 | 3.05 | 35,357 | .68e | 2.14e | 590 |
| October 31, 2019 | 11.50 | .31 | .84 | 1.15 | (.22) | (.08) | (.30) | 12.35 | 10.15 | 25,712 | .79e | 2.61e | 408 |
| October 31, 2018 | 12.05 | .32 | (.51) | (.19) | (.23) | (.13) | (.36) | 11.50 | (1.72) | 24,177 | .80e | 2.65e | 451 |
| October 31, 2017 | 11.92 | .33 | .23 | .56 | (.43) | — | (.43) | 12.05 | 4.83 | 6,607 | .80e | 2.73e | 660 |
| October 31, 2016 | 11.93 | .34 | .08 | .42 | (.43) | — | (.43) | 11.92 | 3.59 | 6,445 | .79f | 2.88f | 551 |
| Class Y | | | | | | | | | | | | | |
| April 30, 2021** | $12.44 | .14 | .01h | .15 | (.12) | — | (.12) | $12.47 | 1.18* | $94,428 | .31*e | 1.11*e | 400* |
| October 31, 2020 | 12.35 | .24 | .11 | .35 | (.08) | (.18) | (.26) | 12.44 | 2.83 | 91,059 | .84e | 1.99e | 590 |
| October 31, 2019 | 11.50 | .29 | .84 | 1.13 | (.21) | (.07) | (.28) | 12.35 | 9.96 | 71,288 | .97e | 2.43e | 408 |
| October 31, 2018 | 12.05 | .30 | (.52) | (.22) | (.21) | (.12) | (.33) | 11.50 | (1.90) | 62,181 | .97e | 2.50e | 451 |
| October 31, 2017 | 11.92 | .31 | .24 | .55 | (.42) | — | (.42) | 12.05 | 4.68 | 80,266 | .97e | 2.56e | 660 |
| October 31, 2016 | 11.93 | .33 | .07 | .40 | (.41) | — | (.41) | 11.92 | 3.44 | 66,913 | .91f | 2.75f | 551 |
* Not annualized.
** Unaudited.
a Per share net investment income (loss) has been determined on the basis of the weighted average number of shares outstanding during the period.
b Total return assumes dividend reinvestment and does not reflect the effect of sales charges.
c Includes amounts paid through expense offset and/or brokerage/service arrangements, if any (Note 2). Also excludes acquired fund fees and expenses, if any.
d Portfolio turnover includes TBA purchase and sale commitments.
e Reflects an involuntary contractual expense limitation in effect during the period. As a result of such limitation, the expenses of each class reflect a reduction of the following amounts (Note 2):
| | | |
| | Percentage of average net assets | | |
| April 30, 2021 | 0.15% | | |
| October 31, 2020 | 0.11 | | |
| October 31, 2019 | 0.02 | | |
| October 31, 2018 | 0.02 | | |
| October 31, 2017 | <0.01 | | |
f Reflects a voluntary waiver of certain fund expenses in effect during the period . As a result of such waiver, the expenses of each class reflect a reduction of less than 0.01% as a percentage of average net assets.
g Amount represents less than $0.01 per share.
h The Net realized and unrealized gain (loss) on investments shown for the period noted may not correspond with the amounts shown on the Statement of operations as a result of timing of share activity.
i The net investment income ratio and per share amount shown for the period ending may not correspond with expected class specific differences for the period due to the timing of subscriptions into the class or redemptions out of the class.
The accompanying notes are an integral part of these financial statements.
| |
| 84 Global Income Trust | Global Income Trust 85 |
Notes to financial statements 4/30/21 (Unaudited)
Within the following Notes to financial statements, references to “State Street” represent State Street Bank and Trust Company, references to “the SEC” represent the Securities and Exchange Commission, references to “Putnam Management” represent Putnam Investment Management, LLC, the fund’s manager, an indirect wholly-owned subsidiary of Putnam Investments, LLC and references to “OTC”, if any, represent over-the-counter. Unless otherwise noted, the “reporting period” represents the period from November 1, 2020 through April 30, 2021.
Putnam Global Income Trust (the fund) is a Massachusetts business trust, which is registered under the Investment Company Act of 1940, as amended, as a non-diversified open-end management investment company. The goal of the fund is to seek high current income. Preservation of capital and long-term total return are secondary objectives, but only to the extent consistent with the objective of seeking high current income. The fund invests mainly in bonds and securitized debt instruments (such as mortgage-backed investments) that are obligations of companies and governments worldwide; that are investment-grade in quality; and that have intermediate-to long-term maturities (three years or longer). Under normal circumstances, Putnam Management invests at least 80% of the fund’s net assets in investment-grade securities. This policy may be changed only after 60 days’ notice to shareholders. The fund may also invest in bonds that are below-investment-grade in quality (sometimes referred to as “junk bonds”). Putnam Management may consider, among other factors, credit, interest rate and prepayment risks, as well as general market conditions, when deciding whether to buy or sell investments. The fund typically uses to a significant extent derivatives, such as futures, options, certain foreign currency transactions and swap contracts, for both hedging and non-hedging purposes.
The fund offers class A, class B, class C, class R, class R5, class R6 and class Y shares. Purchases of class B shares are closed to new and existing investors except by exchange from class B shares of another Putnam fund or through dividend and/or capital gains reinvestment. Class A shares are sold with a maximum front-end sales charge of 4.00%. Class A shares generally are not subject to a contingent deferred sales charge, and class R, class R5, class R6 and class Y shares are not subject to a contingent deferred sales charge. Class B shares, which convert to class A shares after approximately eight years, are not subject to a front-end sales charge and are subject to a contingent deferred sales charge if those shares are redeemed within six years of purchase. Class C shares are subject to a one-year 1.00% contingent deferred sales charge and generally convert to class A shares after approximately eight years. Prior to March 1, 2021, class C shares generally converted to class A shares after approximately ten years. Class R shares, which are not available to all investors, are sold at net asset value. The expenses for class A, class B, class C and class R shares may differ based on the distribution fee of each class, which is identified in Note 2. Class R5, class R6 and class Y shares, which are sold at net asset value, are generally subject to the same expenses as class A, class B, class C and class R shares, but do not bear a distribution fee, and in the case of class R5 and class R6 shares, bear a lower investor servicing fee, which is identified in Note 2. Class R5, class R6 and class Y shares are not available to all investors.
In the normal course of business, the fund enters into contracts that may include agreements to indemnify another party under given circumstances. The fund’s maximum exposure under these arrangements is unknown as this would involve future claims that may be, but have not yet been, made against the fund. However, the fund’s management team expects the risk of material loss to be remote.
The fund has entered into contractual arrangements with an investment adviser, administrator, distributor, shareholder servicing agent and custodian, who each provide services to the fund. Unless expressly stated otherwise, shareholders are not parties to, or intended beneficiaries of these contractual arrangements, and these contractual arrangements are not intended to create any shareholder right to enforce them against the service providers or to seek any remedy under them against the service providers, either directly or on behalf of the fund.
Under the fund’s Amended and Restated Agreement and Declaration of Trust, any claims asserted against or on behalf of the Putnam Funds, including claims against Trustees and Officers, must be brought in state and federal courts located within the Commonwealth of Massachusetts.
Note 1: Significant accounting policies
The following is a summary of significant accounting policies consistently followed by the fund in the preparation of its financial statements. The preparation of financial statements is in conformity with accounting principles generally accepted in the United States of America and requires management to make estimates and assumptions that affect the reported amounts of assets and liabilities in the financial statements and the reported amounts of increases and decreases in net assets from operations. Actual results could differ from those estimates. Subsequent events after the Statement of assets and liabilities date through the date that the financial statements were issued have been evaluated in the preparation of the financial statements.
Investment income, realized and unrealized gains and losses and expenses of the fund are borne pro-rata based on the relative net assets of each class to the total net assets of the fund, except that each class bears expenses unique to that class (including the distribution fees applicable to such classes). Each class votes as a class only with respect to its own distribution plan or other matters on which a class vote is required by law or determined by the Trustees. If the fund were liquidated, shares of each class would receive their pro-rata share of the net assets of the fund. In addition, the Trustees declare separate dividends on each class of shares.
Security valuation Portfolio securities and other investments are valued using policies and procedures adopted by the Board of Trustees. The Trustees have formed a Pricing Committee to oversee the implementation of these procedures and have delegated responsibility for valuing the fund’s assets in accordance with these procedures to Putnam Management. Putnam Management has established an internal Valuation Committee that is responsible for making fair value determinations, evaluating the effectiveness of the pricing policies of the fund and reporting to the Pricing Committee.
Market quotations are not considered to be readily available for certain debt obligations (including short-term investments with remaining maturities of 60 days or less) and other investments; such investments are valued on the basis of valuations furnished by an independent pricing service approved by the Trustees or dealers selected by Putnam Management. Such services or dealers determine valuations for normal institutional-size trading units of such securities using methods based on market transactions for comparable securities and various relationships, generally recognized by institutional traders, between securities (which consider such factors as security prices, yields, maturities and ratings). These securities will generally be categorized as Level 2. Securities quoted in foreign currencies, if any, are translated into U.S. dollars at the current exchange rate.
Investments in open-end investment companies (excluding exchange-traded funds), if any, which can be classified as Level 1 or Level 2 securities, are valued based on their net asset value. The net asset value of such investment companies equals the total value of their assets less their liabilities and divided by the number of their outstanding shares.
To the extent a pricing service or dealer is unable to value a security or provides a valuation that Putnam Management does not believe accurately reflects the security’s fair value, the security will be valued at fair value by Putnam Management in accordance with policies and procedures approved by the Trustees. Certain investments, including certain restricted and illiquid securities and derivatives, are also valued at fair value following procedures approved by the Trustees. These valuations consider such factors as significant market or specific security events such as interest rate or credit quality changes, various relationships with other securities, discount rates, U.S. Treasury, U.S. swap and credit yields, index levels, convexity exposures, recovery rates, sales and other multiples and resale restrictions. These securities are classified as Level 2 or as Level 3 depending on the priority of the significant inputs.
To assess the continuing appropriateness of fair valuations, the Valuation Committee reviews and affirms the reasonableness of such valuations on a regular basis after considering all relevant information that is reasonably available. Such valuations and procedures are reviewed periodically by the Trustees. Certain securities may be valued on the basis of a price provided by a single source. The fair value of securities is generally determined as the amount that the fund could reasonably expect to realize from an orderly disposition of such securities over a reasonable period of time. By its nature, a fair value price is a good faith estimate of the value of a security in a current sale and does not reflect an actual market price, which may be different by a material amount.
Security transactions and related investment income Security transactions are recorded on the trade date (the date the order to buy or sell is executed). Gains or losses on securities sold are determined on the identified cost basis.
Interest income, net of any applicable withholding taxes, if any, and including amortization and accretion of premiums and discounts on debt securities, is recorded on the accrual basis.
Stripped securities The fund may invest in stripped securities which represent a participation in securities that may be structured in classes with rights to receive different portions of the interest and principal. Interest-only securities receive all of the interest and principal-only securities receive all of the principal. If the interest-only securities experience greater than anticipated prepayments of principal, the fund may fail to recoup fully its initial investment in these securities. Conversely, principal-only securities increase in value if prepayments are greater than anticipated and decline if prepayments are slower than anticipated. The fair value of these securities is highly sensitive to changes in interest rates.
Foreign currency translation The accounting records of the fund are maintained in U.S. dollars. The fair value of foreign securities, currency holdings, and other assets and liabilities is recorded in the books and records of the
fund after translation to U.S. dollars based on the exchange rates on that day. The cost of each security is determined using historical exchange rates. Income and withholding taxes are translated at prevailing exchange rates when earned or incurred. The fund does not isolate that portion of realized or unrealized gains or losses resulting from changes in the foreign exchange rate on investments from fluctuations arising from changes in the market prices of the securities. Such gains and losses are included with the net realized and unrealized gain or loss on investments. Net realized gains and losses on foreign currency transactions represent net realized exchange gains or losses on disposition of foreign currencies, currency gains and losses realized between the trade and settlement dates on securities transactions and the difference between the amount of investment income and foreign withholding taxes recorded on the fund’s books and the U.S. dollar equivalent amounts actually received or paid. Net unrealized appreciation and depreciation of assets and liabilities in foreign currencies arise from changes in the value of assets and liabilities other than investments at the period end, resulting from changes in the exchange rate.
Options contracts The fund uses options contracts to hedge duration and convexity, to isolate prepayment risk and to manage downside risks.
The potential risk to the fund is that the change in value of options contracts may not correspond to the change in value of the hedged instruments. In addition, losses may arise from changes in the value of the underlying instruments if there is an illiquid secondary market for the contracts, if interest or exchange rates move unexpectedly or if the counterparty to the contract is unable to perform. Realized gains and losses on purchased options are included in realized gains and losses on investment securities. If a written call option is exercised, the premium originally received is recorded as an addition to sales proceeds. If a written put option is exercised, the premium originally received is recorded as a reduction to the cost of investments.
Exchange-traded options are valued at the last sale price or, if no sales are reported, the last bid price for purchased options and the last ask price for written options. OTC traded options are valued using prices supplied by dealers.
Options on swaps are similar to options on securities except that the premium paid or received is to buy or grant the right to enter into a previously agreed upon interest rate or credit default contract. Forward premium swap option contracts include premiums that have extended settlement dates. The delayed settlement of the premiums is factored into the daily valuation of the option contracts. In the case of interest rate cap and floor contracts, in return for a premium, ongoing payments between two parties are based on interest rates exceeding a specified rate, in the case of a cap contract, or falling below a specified rate in the case of a floor contract.
Written option contracts outstanding at period end, if any, are listed after the fund’s portfolio.
Futures contracts The fund uses futures contracts for hedging treasury term structure risk and for yield curve positioning.
The potential risk to the fund is that the change in value of futures contracts may not correspond to the change in value of the hedged instruments. In addition, losses may arise from changes in the value of the underlying instruments, if there is an illiquid secondary market for the contracts, if interest or exchange rates move unexpectedly or if the counterparty to the contract is unable to perform. With futures, there is minimal counterparty credit risk to the fund since futures are exchange traded and the exchange’s clearinghouse, as counterparty to all exchange traded futures, guarantees the futures against default. Risks may exceed amounts recognized on the Statement of assets and liabilities. When the contract is closed, the fund records a realized gain or loss equal to the difference between the value of the contract at the time it was opened and the value at the time it was closed.
Futures contracts are valued at the quoted daily settlement prices established by the exchange on which they trade. The fund and the broker agree to exchange an amount of cash equal to the daily fluctuation in the value of the futures contract. Such receipts or payments are known as “variation margin.”
Futures contracts outstanding at period end, if any, are listed after the fund’s portfolio.
Forward currency contracts The fund buys and sells forward currency contracts, which are agreements between two parties to buy and sell currencies at a set price on a future date. These contracts are used for hedging currency exposures and to gain exposure to currencies.
The U.S. dollar value of forward currency contracts is determined using current forward currency exchange rates supplied by a quotation service. The fair value of the contract will fluctuate with changes in currency exchange rates. The contract is marked to market daily and the change in fair value is recorded as an unrealized gain or loss. The fund records a realized gain or loss equal to the difference between the value of the contract at the time it was opened and the value at the time it was closed when the contract matures or by delivery of the currency. The fund
could be exposed to risk if the value of the currency changes unfavorably, if the counterparties to the contracts are unable to meet the terms of their contracts or if the fund is unable to enter into a closing position. Risks may exceed amounts recognized on the Statement of assets and liabilities.
Forward currency contracts outstanding at period end, if any, are listed after the fund’s portfolio.
Interest rate swap contracts The fund entered into OTC and/or centrally cleared interest rate swap contracts, which are arrangements between two parties to exchange cash flows based on a notional principal amount, for hedging term structure risk, for yield curve positioning and for gaining exposure to rates in various countries.
An OTC and centrally cleared interest rate swap can be purchased or sold with an upfront premium. For OTC interest rate swap contracts, an upfront payment received by the fund is recorded as a liability on the fund’s books. An upfront payment made by the fund is recorded as an asset on the fund’s books. OTC and centrally cleared interest rate swap contracts are marked to market daily based upon quotations from an independent pricing service or market makers. Any change is recorded as an unrealized gain or loss on OTC interest rate swaps. Daily fluctuations in the value of centrally cleared interest rate swaps are settled through a central clearing agent and are recorded in variation margin on the Statement of assets and liabilities and recorded as unrealized gain or loss. Payments, including upfront premiums, received or made are recorded as realized gains or losses at the reset date or the closing of the contract. Certain OTC and centrally cleared interest rate swap contracts may include extended effective dates. Payments related to these swap contracts are accrued based on the terms of the contract.
The fund could be exposed to credit or market risk due to unfavorable changes in the fluctuation of interest rates or if the counterparty defaults, in the case of OTC interest rate contracts, or the central clearing agency or a clearing member defaults, in the case of centrally cleared interest rate swap contracts, on its respective obligation to perform under the contract. The fund’s maximum risk of loss from counterparty risk or central clearing risk is the fair value of the contract. This risk may be mitigated for OTC interest rate swap contracts by having a master netting arrangement between the fund and the counterparty and for centrally cleared interest rate swap contracts through the daily exchange of variation margin. There is minimal counterparty risk with respect to centrally cleared interest rate swap contracts due to the clearinghouse guarantee fund and other resources that are available in the event of a clearing member default. Risk of loss may exceed amounts recognized on the Statement of assets and liabilities.
OTC and centrally cleared interest rate swap contracts outstanding, including their respective notional amounts at period end, if any, are listed after the fund’s portfolio.
Total return swap contracts The fund entered into OTC and/or centrally cleared total return swap contracts, which are arrangements to exchange a market-linked return for a periodic payment, both based on a notional principal amount, to hedge sector exposure, for gaining exposure to specific sectors, for hedging inflation and for gaining exposure to inflation.
To the extent that the total return of the security, index or other financial measure underlying the transaction exceeds or falls short of the offsetting interest rate obligation, the fund will receive a payment from or make a payment to the counterparty. OTC and/or centrally cleared total return swap contracts are marked to market daily based upon quotations from an independent pricing service or market maker. Any change is recorded as an unrealized gain or loss on OTC total return swaps. Daily fluctuations in the value of centrally cleared total return swaps are settled through a central clearing agent and are recorded in variation margin on the Statement of assets and liabilities and recorded as unrealized gain or loss. Payments received or made are recorded as realized gains or losses. Certain OTC and/or centrally cleared total return swap contracts may include extended effective dates. Payments related to these swap contracts are accrued based on the terms of the contract. The fund could be exposed to credit or market risk due to unfavorable changes in the fluctuation of interest rates or in the price of the underlying security or index, the possibility that there is no liquid market for these agreements or that the counterparty may default on its obligation to perform. The fund’s maximum risk of loss from counterparty risk or central clearing risk is the fair value of the contract. This risk may be mitigated for OTC total return swap contracts by having a master netting arrangement between the fund and the counterparty and for centrally cleared total return swap contracts through the daily exchange of variation margin. There is minimal counterparty risk with respect to centrally cleared total return swap contracts due to the clearinghouse guarantee fund and other resources that are available in the event of a clearing member default. Risk of loss may exceed amounts recognized on the Statement of assets and liabilities.
OTC and/or centrally cleared total return swap contracts outstanding, including their respective notional amounts at period end, if any, are listed after the fund’s portfolio.
Credit default contracts The fund entered into OTC and/or centrally cleared credit default contracts to hedge credit risk, for gaining liquid exposure to individual names, to hedge market risk and for gaining exposure to specific sectors.
In OTC and centrally cleared credit default contracts, the protection buyer typically makes a periodic stream of payments to a counterparty, the protection seller, in exchange for the right to receive a contingent payment upon the occurrence of a credit event on the reference obligation or all other equally ranked obligations of the reference entity. Credit events are contract specific but may include bankruptcy, failure to pay, restructuring and obligation acceleration. For OTC credit default contracts, an upfront payment received by the fund is recorded as a liability on the fund’s books. An upfront payment made by the fund is recorded as an asset on the fund’s books. Centrally cleared credit default contracts provide the same rights to the protection buyer and seller except the payments between parties, including upfront premiums, are settled through a central clearing agent through variation margin payments. Upfront and periodic payments received or paid by the fund for OTC and centrally cleared credit default contracts are recorded as realized gains or losses at the reset date or close of the contract. The OTC and centrally cleared credit default contracts are marked to market daily based upon quotations from an independent pricing service or market makers. Any change in value of OTC credit default contracts is recorded as an unrealized gain or loss. Daily fluctuations in the value of centrally cleared credit default contracts are recorded in variation margin on the Statement of assets and liabilities and recorded as unrealized gain or loss. Upon the occurrence of a credit event, the difference between the par value and fair value of the reference obligation, net of any proportional amount of the upfront payment, is recorded as a realized gain or loss.
In addition to bearing the risk that the credit event will occur, the fund could be exposed to market risk due to unfavorable changes in interest rates or in the price of the underlying security or index or the possibility that the fund may be unable to close out its position at the same time or at the same price as if it had purchased the underlying reference obligations. In certain circumstances, the fund may enter into offsetting OTC and centrally cleared credit default contracts which would mitigate its risk of loss. Risks of loss may exceed amounts recognized on the Statement of assets and liabilities. The fund’s maximum risk of loss from counterparty risk, either as the protection seller or as the protection buyer, is the fair value of the contract. This risk may be mitigated for OTC credit default contracts by having a master netting arrangement between the fund and the counterparty and for centrally cleared credit default contracts through the daily exchange of variation margin. Counterparty risk is further mitigated with respect to centrally cleared credit default swap contracts due to the clearinghouse guarantee fund and other resources that are available in the event of a clearing member default. Where the fund is a seller of protection, the maximum potential amount of future payments the fund may be required to make is equal to the notional amount.
OTC and centrally cleared credit default contracts outstanding, including their respective notional amounts at period end, if any, are listed after the fund’s portfolio.
TBA commitments The fund may enter into TBA (to be announced) commitments to purchase securities for a fixed unit price at a future date beyond customary settlement time. Although the unit price and par amount have been established, the actual securities have not been specified. However, it is anticipated that the amount of the commitments will not significantly differ from the principal amount. The fund holds, and maintains until settlement date, cash or high-grade debt obligations in an amount sufficient to meet the purchase price, or the fund may enter into offsetting contracts for the forward sale of other securities it owns. Income on the securities will not be earned until settlement date.
The fund may also enter into TBA sale commitments to hedge its portfolio positions, to sell mortgage-backed securities it owns under delayed delivery arrangements or to take a short position in mortgage-backed securities. Proceeds of TBA sale commitments are not received until the contractual settlement date. During the time a TBA sale commitment is outstanding, either equivalent deliverable securities or an offsetting TBA purchase commitment deliverable on or before the sale commitment date are held as “cover” for the transaction, or other liquid assets in an amount equal to the notional value of the TBA sale commitment are segregated. If the TBA sale commitment is closed through the acquisition of an offsetting TBA purchase commitment, the fund realizes a gain or loss. If the fund delivers securities under the commitment, the fund realizes a gain or a loss from the sale of the securities based upon the unit price established at the date the commitment was entered into.
TBA commitments, which are accounted for as purchase and sale transactions, may be considered securities themselves, and involve a risk of loss due to changes in the value of the security prior to the settlement date as well as the risk that the counterparty to the transaction will not perform its obligations. Counterparty risk is mitigated by having a master agreement between the fund and the counterparty.
Unsettled TBA commitments are valued at their fair value according to the procedures described under “Security valuation” above. The contract is marked to market daily and the change in fair value is recorded by the fund as an unrealized gain or loss. Based on market circumstances, Putnam Management will determine whether to take delivery of the underlying securities or to dispose of the TBA commitments prior to settlement.
TBA purchase commitments outstanding at period end, if any, are listed within the fund’s portfolio and TBA sale commitments outstanding at period end, if any, are listed after the fund’s portfolio.
Master agreements The fund is a party to ISDA (International Swaps and Derivatives Association, Inc.) Master Agreements that govern OTC derivative and foreign exchange contracts and Master Securities Forward Transaction Agreements that govern transactions involving mortgage-backed and other asset-backed securities that may result in delayed delivery (Master Agreements) with certain counterparties entered into from time to time. The Master Agreements may contain provisions regarding, among other things, the parties’ general obligations, representations, agreements, collateral requirements, events of default and early termination. With respect to certain counterparties, in accordance with the terms of the Master Agreements, collateral pledged to the fund is held in a segregated account by the fund’s custodian and, with respect to those amounts which can be sold or repledged, are presented in the fund’s portfolio.
Collateral pledged by the fund is segregated by the fund’s custodian and identified in the fund’s portfolio. Collateral can be in the form of cash or debt securities issued by the U.S. Government or related agencies or other securities as agreed to by the fund and the applicable counterparty. Collateral requirements are determined based on the fund’s net position with each counterparty.
With respect to ISDA Master Agreements, termination events applicable to the fund may occur upon a decline in the fund’s net assets below a specified threshold over a certain period of time. Termination events applicable to counterparties may occur upon a decline in the counterparty’s long-term or short-term credit ratings below a specified level. In each case, upon occurrence, the other party may elect to terminate early and cause settlement of all derivative and foreign exchange contracts outstanding, including the payment of any losses and costs resulting from such early termination, as reasonably determined by the terminating party. Any decision by one or more of the fund’s counterparties to elect early termination could impact the fund’s future derivative activity.
At the close of the reporting period, the fund had a net liability position of $2,104,578 on open derivative contracts subject to the Master Agreements. Collateral pledged by the fund at period end for these agreements totaled $2,558,000 and may include amounts related to unsettled agreements.
Interfund lending The fund, along with other Putnam funds, may participate in an interfund lending program pursuant to an exemptive order issued by the SEC. This program allows the fund to borrow from or lend to other Putnam funds that permit such transactions. Interfund lending transactions are subject to each fund’s investment policies and borrowing and lending limits. Interest earned or paid on the interfund lending transaction will be based on the average of certain current market rates. During the reporting period, the fund did not utilize the program.
Lines of credit The fund participates, along with other Putnam funds, in a $317.5 million unsecured committed line of credit and a $235.5 million unsecured uncommitted line of credit, both provided by State Street. Borrowings may be made for temporary or emergency purposes, including the funding of shareholder redemption requests and trade settlements. Interest is charged to the fund based on the fund’s borrowing at a rate equal to 1.25% plus the higher of (1) the Federal Funds rate and (2) the Overnight Bank Funding Rate for the committed line of credit and 1.30% plus the higher of (1) the Federal Funds rate and (2) the Overnight Bank Funding Rate for the uncommitted line of credit. A closing fee equal to 0.04% of the committed line of credit and 0.04% of the uncommitted line of credit has been paid by the participating funds. In addition, a commitment fee of 0.21% per annum on any unutilized portion of the committed line of credit is allocated to the participating funds based on their relative net assets and paid quarterly. During the reporting period, the fund had no borrowings against these arrangements.
Federal taxes It is the policy of the fund to distribute all of its taxable income within the prescribed time period and otherwise comply with the provisions of the Internal Revenue Code of 1986, as amended (the Code), applicable to regulated investment companies. It is also the intention of the fund to distribute an amount sufficient to avoid imposition of any excise tax under Section 4982 of the Code.
The fund is subject to the provisions of Accounting Standards Codification 740 Income Taxes (ASC 740). ASC 740 sets forth a minimum threshold for financial statement recognition of the benefit of a tax position taken or expected to be taken in a tax return. The fund did not have a liability to record for any unrecognized tax benefits in the accompanying financial statements. No provision has been made for federal taxes on income, capital gains
or unrealized appreciation on securities held nor for excise tax on income and capital gains. Each of the fund’s federal tax returns for the prior three fiscal years remains subject to examination by the Internal Revenue Service.
The fund may also be subject to taxes imposed by governments of countries in which it invests. Such taxes are generally based on either income or gains earned or repatriated. The fund accrues and applies such taxes to net investment income, net realized gains and net unrealized gains as income and/or capital gains are earned. In some cases, the fund may be entitled to reclaim all or a portion of such taxes, and such reclaim amounts, if any, are reflected as an asset on the fund’s books. In many cases, however, the fund may not receive such amounts for an extended period of time, depending on the country of investment.
Under the Regulated Investment Company Modernization Act of 2010, the fund will be permitted to carry forward capital losses incurred for an unlimited period and the carry forwards will retain their character as either short-term or long-term capital losses. At October 31, 2020, the fund had the following capital loss carryover available, to the extent allowed by the Code, to offset future net capital gain, if any:
| | |
| | Loss carryover | |
| Short-term | Long-term | Total |
| $6,067,704 | $— | $6,067,704 |
Tax cost of investments includes adjustments to net unrealized appreciation (depreciation) which may not necessarily be final tax cost basis adjustments, but closely approximate the tax basis unrealized gains and losses that may be realized and distributed to shareholders. The aggregate identified cost on a tax basis is $303,694,590, resulting in gross unrealized appreciation and depreciation of $19,584,828 and $18,237,437, respectively, or net unrealized appreciation of $1,347,391.
Distributions to shareholders Distributions to shareholders from net investment income are recorded by the fund on the ex-dividend date. Distributions from capital gains, if any, are recorded on the ex-dividend date and paid at least annually. The amount and character of income and gains to be distributed are determined in accordance with income tax regulations, which may differ from generally accepted accounting principles. Dividend sources are estimated at the time of declaration. Actual results may vary. Any non-taxable return of capital cannot be determined until final tax calculations are completed after the end of the fund’s fiscal year. Reclassifications are made to the fund’s capital accounts to reflect income and gains available for distribution (or available capital loss carryovers) under income tax regulations.
Note 2: Management fee, administrative services and other transactions
The fund pays Putnam Management a management fee (based on the fund’s average net assets and computed and paid monthly) at annual rates that may vary based on the average of the aggregate net assets of all open-end mutual funds sponsored by Putnam Management (excluding net assets of funds that are invested in, or that are invested in by, other Putnam funds to the extent necessary to avoid “double counting” of those assets). Such annual rates may vary as follows:
| | | | |
| 0.700% | of the first $5 billion, | | 0.500% | of the next $50 billion, |
| 0.650% | of the next $5 billion, | | 0.480% | of the next $50 billion, |
| 0.600% | of the next $10 billion, | | 0.470% | of the next $100 billion and |
| 0.550% | of the next $10 billion, | | 0.465% | of any excess thereafter. |
For the reporting period, the management fee represented an effective rate (excluding the impact from any expense waivers in effect) of 0.264% of the fund’s average net assets.
Putnam Management has contractually agreed, through February 28, 2022, to waive fees and/or reimburse the fund’s expenses to the extent necessary to limit the cumulative expenses of the fund, exclusive of brokerage, interest, taxes, investment-related expenses, extraordinary expenses, acquired fund fees and expenses and payments under the fund’s investor servicing contract, investment management contract and distribution plans, on a fiscal year-to-date basis to an annual rate of 0.20% of the fund’s average net assets over such fiscal year-to-date period. During the reporting period, the fund’s expenses were reduced by $8,520 as a result of this limit.
Putnam Management has also contractually agreed to waive fees (and, to the extent necessary, bear other expenses) of the fund through February 28, 2022, to the extent that total expenses of the fund (excluding
brokerage, interest, taxes, investment-related expenses, payments under distribution plans, extraordinary expenses, payments under the fund’s investor servicing contract and acquired fund fees and expenses, but including payments under the fund’s investment management contract) would exceed an annual rate of 0.43% of the fund’s average net assets. During the reporting period, the fund’s expenses were reduced by $385,649 as a result of this limit.
Putnam Investments Limited (PIL), an affiliate of Putnam Management, is authorized by the Trustees to manage a separate portion of the assets of the fund as determined by Putnam Management from time to time. PIL did not manage any portion of the assets of the fund during the reporting period. If Putnam Management were to engage the services of PIL, Putnam Management would pay a quarterly sub-management fee to PIL for its services at an annual rate of 0.40% of the average net assets of the portion of the fund managed by PIL.
Putnam Management voluntarily reimbursed the fund $1,016 for a trading error which occurred during the reporting period. The effect of the loss incurred and the reimbursement by Putnam Management of such amounts had no material impact on total return.
The fund reimburses Putnam Management an allocated amount for the compensation and related expenses of certain officers of the fund and their staff who provide administrative services to the fund. The aggregate amount of all such reimbursements is determined annually by the Trustees.
Custodial functions for the fund’s assets are provided by State Street. Custody fees are based on the fund’s asset level, the number of its security holdings and transaction volumes.
Putnam Investor Services, Inc., an affiliate of Putnam Management, provides investor servicing agent functions to the fund. Putnam Investor Services, Inc. received fees for investor servicing for class A, class B, class C, class R and class Y shares that included (1) a per account fee for each direct and underlying non-defined contribution account (retail account) of the fund; (2) a specified rate of the fund’s assets attributable to defined contribution plan accounts; and (3) a specified rate based on the average net assets in retail accounts. Putnam Investor Services, Inc. has agreed that the aggregate investor servicing fees for each fund’s retail and defined contribution accounts for these share classes will not exceed an annual rate of 0.25% of the fund’s average assets attributable to such accounts.
Class R5 shares paid a monthly fee based on the average net assets of class R5 shares at an annual rate of 0.12%.
Class R6 shares paid a monthly fee based on the average net assets of class R6 shares at an annual rate of 0.05%.
During the reporting period, the expenses for each class of shares related to investor servicing fees were as follows:
| | | | |
| Class A | $115,250 | | Class R5 | 22 |
| Class B | 798 | | Class R6 | 8,635 |
| Class C | 5,913 | | Class Y | 94,600 |
| Class R | 2,372 | | Total | $227,590 |
The fund has entered into expense offset arrangements with Putnam Investor Services, Inc. and State Street whereby Putnam Investor Services, Inc.’s and State Street’s fees are reduced by credits allowed on cash balances. For the reporting period, the fund’s expenses were reduced by $344 under the expense offset arrangements.
Each Independent Trustee of the fund receives an annual Trustee fee, of which $171, as a quarterly retainer, has been allocated to the fund, and an additional fee for each Trustees meeting attended. Trustees also are reimbursed for expenses they incur relating to their services as Trustees.
The fund has adopted a Trustee Fee Deferral Plan (the Deferral Plan) which allows the Trustees to defer the receipt of all or a portion of Trustees fees payable on or after July 1, 1995. The deferred fees remain invested in certain Putnam funds until distribution in accordance with the Deferral Plan.
The fund has adopted an unfunded noncontributory defined benefit pension plan (the Pension Plan) covering all Trustees of the fund who have served as a Trustee for at least five years and were first elected prior to 2004. Benefits under the Pension Plan are equal to 50% of the Trustee’s average annual attendance and retainer fees for the three years ended December 31, 2005. The retirement benefit is payable during a Trustee’s lifetime, beginning the year following retirement, for the number of years of service through December 31, 2006. Pension expense for the fund is included in Trustee compensation and expenses in the Statement of operations. Accrued pension liability is included in Payable for Trustee compensation and expenses in the Statement of assets and liabilities. The Trustees have terminated the Pension Plan with respect to any Trustee first elected after 2003.
The fund has adopted distribution plans (the Plans) with respect to the following share classes pursuant to Rule 12b–1 under the Investment Company Act of 1940. The purpose of the Plans is to compensate Putnam Retail Management Limited Partnership, an indirect wholly-owned subsidiary of Putnam Investments, LLC, for services provided and expenses incurred in distributing shares of the fund. The Plans provide payments by the fund to Putnam Retail Management Limited Partnership at an annual rate of up to the following amounts (Maximum %) of the average net assets attributable to each class. The Trustees have approved payment by the fund at the following annual rate (Approved %) of the average net assets attributable to each class. During the reporting period, the class-specific expenses related to distribution fees were as follows:
| | | |
| | Maximum % | Approved % | Amount |
| Class A | 0.35% | 0.25% | $144,843 |
| Class B | 1.00% | 1.00% | 4,013 |
| Class C | 1.00% | 1.00% | 29,726 |
| Class R | 1.00% | 0.50% | 5,959 |
| Total | | | $184,541 |
For the reporting period, Putnam Retail Management Limited Partnership, acting as underwriter, received net commissions of $6,165 from the sale of class A shares and received no monies and $10 in contingent deferred sales charges from redemptions of class B and class C shares, respectively.
A deferred sales charge of up to 1.00% is assessed on certain redemptions of class A shares. For the reporting period, Putnam Retail Management Limited Partnership, acting as underwriter, received $14 on class A redemptions.
Note 3: Purchases and sales of securities
During the reporting period, the cost of purchases and the proceeds from sales, excluding short-term investments, were as follows:
| | |
| | Cost of purchases | Proceeds from sales |
| Investments in securities, including TBA commitments (Long-term) | $1,242,279,892 | $1,271,052,795 |
| U.S. government securities (Long-term) | — | — |
| Total | $1,242,279,892 | $1,271,052,795 |
The fund may purchase or sell investments from or to other Putnam funds in the ordinary course of business, which can reduce the fund’s transaction costs, at prices determined in accordance with SEC requirements and policies approved by the Trustees. During the reporting period, purchases or sales of long-term securities from or to other Putnam funds, if any, did not represent more than 5% of the fund’s total cost of purchases and/or total proceeds from sales.
Note 4: Capital shares
At the close of the reporting period, there were an unlimited number of shares of beneficial interest authorized. Transactions, including, if applicable, direct exchanges pursuant to share conversions, in capital shares were as follows:
| | | | |
| | SIX MONTHS ENDED 4/30/21 | YEAR ENDED 10/31/20 |
| Class A | Shares | Amount | Shares | Amount |
| Shares sold | 1,043,707 | $13,182,067 | 2,187,702 | $26,915,453 |
| Shares issued in connection with | | | | |
| reinvestment of distributions | 70,464 | 889,932 | 157,774 | 1,931,454 |
| | 1,114,171 | 14,071,999 | 2,345,476 | 28,846,907 |
| Shares repurchased | (981,906) | (12,414,189) | (2,410,135) | (29,478,451) |
| Net increase (decrease) | 132,265 | $1,657,810 | (64,659) | $(631,544) |
| | | | |
| | SIX MONTHS ENDED 4/30/21 | YEAR ENDED 10/31/20 |
| Class B | Shares | Amount | Shares | Amount |
| Shares sold | 497 | $6,304 | 8,727 | $105,048 |
| Shares issued in connection with | | | | |
| reinvestment of distributions | 253 | 3,179 | 908 | 11,059 |
| | 750 | 9,483 | 9,635 | 116,107 |
| Shares repurchased | (24,312) | (305,472) | (56,925) | (693,913) |
| Net decrease | (23,562) | $(295,989) | (47,290) | $(577,806) |
| |
| | SIX MONTHS ENDED 4/30/21 | YEAR ENDED 10/31/20 |
| Class C | Shares | Amount | Shares | Amount |
| Shares sold | 45,794 | $579,815 | 76,097 | $934,692 |
| Shares issued in connection with | | | | |
| reinvestment of distributions | 1,947 | 24,517 | 6,398 | 77,942 |
| | 47,741 | 604,332 | 82,495 | 1,012,634 |
| Shares repurchased | (196,843) | (2,461,524) | (337,567) | (4,122,016) |
| Net decrease | (149,102) | $(1,857,192) | (255,072) | $(3,109,382) |
| |
| | | | YEAR ENDED 10/31/20* |
| Class M | | | Shares | Amount |
| Shares sold | | | 21 | $242 |
| Shares issued in connection with reinvestment of distributions | | — | — |
| | | | 21 | 242 |
| Shares repurchased | | | (524,351) | (6,386,524) |
| Net decrease | | | (524,330) | $(6,386,282) |
| |
| | SIX MONTHS ENDED 4/30/21 | YEAR ENDED 10/31/20 |
| Class R | Shares | Amount | Shares | Amount |
| Shares sold | 30,245 | $380,441 | 115,292 | $1,417,730 |
| Shares issued in connection with | | | | |
| reinvestment of distributions | 1,312 | 16,563 | 2,860 | 34,960 |
| | 31,557 | 397,004 | 118,152 | 1,452,690 |
| Shares repurchased | (32,580) | (415,650) | (77,609) | (945,613) |
| Net increase (decrease) | (1,023) | $(18,646) | 40,543 | $507,077 |
| |
| | SIX MONTHS ENDED 4/30/21 | YEAR ENDED 10/31/20 |
| Class R5 | Shares | Amount | Shares | Amount |
| Shares sold | 519 | $6,541 | 608 | $7,432 |
| Shares issued in connection with | | | | |
| reinvestment of distributions | 28 | 354 | 48 | 592 |
| | 547 | 6,895 | 656 | 8,024 |
| Shares repurchased | (11) | (138) | (16) | (195) |
| Net increase | 536 | $6,757 | 640 | $7,829 |
| | | | |
| | SIX MONTHS ENDED 4/30/21 | YEAR ENDED 10/31/20 |
| Class R6 | Shares | Amount | Shares | Amount |
| Shares sold | 363,888 | $4,604,453 | 1,254,583 | $15,373,826 |
| Shares issued in connection with | | | | |
| reinvestment of distributions | 26,584 | 335,749 | 55,600 | 680,739 |
| | 390,472 | 4,940,202 | 1,310,183 | 16,054,565 |
| Shares repurchased | (544,598) | (6,917,451) | (552,550) | (6,743,872) |
| Net increase (decrease) | (154,126) | $(1,977,249) | 757,633 | $9,310,693 |
| |
| | SIX MONTHS ENDED 4/30/21 | YEAR ENDED 10/31/20 |
| Class Y | Shares | Amount | Shares | Amount |
| Shares sold | 1,526,928 | $19,402,058 | 4,229,766 | $51,864,638 |
| Shares issued in connection with | | | | |
| reinvestment of distributions | 61,183 | 772,174 | 116,588 | 1,427,018 |
| | 1,588,111 | 20,174,232 | 4,346,354 | 53,291,656 |
| Shares repurchased | (1,331,205) | (16,801,173) | (2,802,773) | (34,422,498) |
| Net increase | 256,906 | $3,373,059 | 1,543,581 | $18,869,158 |
* Effective November 25, 2019, all class M shares were converted to class A shares and were no longer available for purchase, excluding those shares that had been purchased from Japan distributors, which were liquidated on December 9, 2019.
At the close of the reporting period, Putnam Investments, LLC owned 1,048 class R5 shares of the fund (33.16% of class R5 shares outstanding), valued at $13,069.
Note 5: Affiliated transactions
Transactions during the reporting period with any company which is under common ownership or control were as follows:
| | | | | |
| | | | | | Shares |
| | | | | | outstanding |
| | | | | | and fair |
| | Fair value as | Purchase | Sale | Investment | value as |
| Name of affiliate | of 10/31/20 | cost | proceeds | income | of 4/30/21 |
| Short-term investments | | | | | |
| Putnam Short Term | | | | | |
| Investment Fund** | $7,237,903 | $50,432,532 | $53,160,295 | $5,068 | $4,510,140 |
| Total Short-term | | | | | |
| investments | $7,237,903 | $50,432,532 | $53,160,295 | $5,068 | $4,510,140 |
** Management fees charged to Putnam Short Term Investment Fund have been waived by Putnam Management. There were no realized or unrealized gains or losses during the period.
Note 6: Market, credit and other risks
In the normal course of business, the fund trades financial instruments and enters into financial transactions where risk of potential loss exists due to changes in the market (market risk) or failure of the contracting party to the transaction to perform (credit risk). The fund may be exposed to additional credit risk that an institution or other entity with which the fund has unsettled or open transactions will default. Investments in foreign securities involve certain risks, including those related to economic instability, unfavorable political developments, and currency fluctuations. The fund may invest in higher-yielding, lower-rated bonds that may have a higher rate of default. The fund may invest a significant portion of its assets in securitized debt instruments, including mortgage-backed and asset-backed investments. The yields and values of these investments are sensitive to changes in interest rates, the rate of principal payments on the underlying assets and the market’s perception of the issuers. The market for these investments may be volatile and limited, which may make them difficult to buy or sell.
On July 27, 2017, the United Kingdom’s Financial Conduct Authority (“FCA”), which regulates LIBOR, announced a desire to phase out the use of LIBOR by the end of 2021. In November 2020, this date was extended until June 30, 2023 for certain widely followed tenors (overnight and 1-, 3-, 6-, and 12-month U.S. dollar LIBOR). LIBOR has historically been a common benchmark interest rate index used to make adjustments to variable-rate loans. It is used throughout global banking and financial industries to determine interest rates for a variety of financial instruments and borrowing arrangements. The transition process might lead to increased volatility and illiquidity in markets that currently rely on LIBOR to determine interest rates. It could also lead to a reduction in the value of some LIBOR-based investments and reduce the effectiveness of new hedges placed against existing LIBOR-based investments. While some LIBOR-based instruments may contemplate a scenario where LIBOR is no longer available by providing for an alternative rate-setting methodology, not all may have such provisions and there may be significant uncertainty regarding the effectiveness of any such alternative methodologies. Since the usefulness of LIBOR as a benchmark could deteriorate during the transition period, these effects could occur prior to June 30, 2023.
Beginning in January 2020, global financial markets have experienced, and may continue to experience, significant volatility resulting from the spread of a virus known as Covid–19. The outbreak of Covid–19 has resulted in travel and border restrictions, quarantines, supply chain disruptions, lower consumer demand, and general market uncertainty. The effects of Covid–19 have adversely affected, and may continue to adversely affect, the global economy, the economies of certain nations, and individual issuers, all of which may negatively impact the fund’s performance.
Note 7: Summary of derivative activity
The volume of activity for the reporting period for any derivative type that was held during the period is listed below and was based on an average of the holdings at the end of each fiscal quarter:
| |
| Purchased TBA commitment option contracts (contract amount) | $22,000,000 |
| Purchased currency option contracts (contract amount) | $38,100,000 |
| Purchased swap option contracts (contract amount) | $202,200,000 |
| Written TBA commitment option contracts (contract amount) | $22,000,000 |
| Written currency option contracts (contract amount) | $37,100,000 |
| Written swap option contracts (contract amount) | $152,800,000 |
| Futures contracts (number of contracts) | 500 |
| Forward currency contracts (contract amount) | $342,500,000 |
| OTC interest rate swap contracts (notional) | $6,800,000 |
| Centrally cleared interest rate swap contracts (notional) | $289,200,000 |
| OTC total return swap contracts (notional) | $5,200,000 |
| Centrally cleared total return swap contracts (notional) | $80,900,000 |
| OTC credit default contracts (notional) | $18,100,000 |
The following is a summary of the fair value of derivative instruments as of the close of the reporting period:
| | | | |
| Fair value of derivative instruments as of the close of the reporting period | |
| | ASSET DERIVATIVES | LIABILITY DERIVATIVES |
| Derivatives not | | | | |
| accounted for as | Statement of | | Statement of | |
| hedging instruments | assets and | | assets and | |
| under ASC 815 | liabilities location | Fair value | liabilities location | Fair value |
| Credit contracts | Receivables | $1,466,996 | Payables | $2,293,165 |
| Foreign exchange | | | | |
| contracts | Receivables | 1,546,365 | Payables | 1,493,295 |
| | Investments, | | | |
| | Receivables, Net | | | |
| | assets — Unrealized | | Payables, Net assets — | |
| Interest rate contracts | appreciation | 7,452,295* | Unrealized depreciation | 10,027,941* |
| Total | | $10,465,656 | | $13,814,401 |
* Includes cumulative appreciation/depreciation of futures contracts and/or centrally cleared swaps as reported in the fund’s portfolio. Only current day’s variation margin is reported within the Statement of assets and liabilities.
The following is a summary of realized and change in unrealized gains or losses of derivative instruments in the Statement of operations for the reporting period (Note 1):
| | | | | |
| Amount of realized gain or (loss) on derivatives recognized in net gain or (loss) on investments | |
| Derivatives not accounted | | | Forward | | |
| for as hedging instruments | | | currency | | |
| under ASC 815 | Options | Futures | contracts | Swaps | Total |
| Credit contracts | $— | $— | $— | $(781,413) | $(781,413) |
| Foreign exchange contracts | 706,194 | — | 1,301,280 | — | $2,007,474 |
| Interest rate contracts | (540,662) | (1,606,178) | — | 2,848,748 | $701,908 |
| Total | $165,532 | $(1,606,178) | $1,301,280 | $2,067,335 | $1,927,969 |
| |
| Change in unrealized appreciation or (depreciation) on derivatives recognized in net gain or (loss) |
| on investments | | | | | |
| Derivatives not accounted | | | Forward | | |
| for as hedging instruments | | | currency | | |
| under ASC 815 | Options | Futures | contracts | Swaps | Total |
| Credit contracts | $— | $— | $— | $400,108 | $400,108 |
| Foreign exchange contracts | 330,906 | — | (613,639) | — | $(282,733) |
| Interest rate contracts | (324,745) | (112,027) | — | (1,131,009) | $(1,567,781) |
| Total | $6,161 | $(112,027) | $(613,639) | $(730,901) | $(1,450,406) |
|
| This page left blank intentionally. |
Note 8: Offsetting of financial and derivative assets and liabilities
The following table summarizes any derivatives, repurchase agreements and reverse repurchase agreements, at the end of the reporting period, that are subject to an enforceable master netting agreement or similar agreement. For securities lending transactions or borrowing transactions associated with securities sold short, if any, see Note 1. For financial reporting purposes, the fund does not offset financial assets and financial liabilities that are subject to the master netting agreements in the Statement of assets and liabilities.
| | | | | | | | | | | | | | | | | | | | |
| | Bank of
America N.A. | Barclays Bank
PLC | Barclays
Capital, Inc.
(clearing
broker) | BofA
Securities,
Inc. | Citibank, N.A. | Citigroup
Global
Markets, Inc. | Credit Suisse
International | Goldman
Sachs
International | HSBC Bank
USA, National
Association | JPMorgan
Chase Bank
N.A. | JPMorgan
Securities LLC | Merrill Lynch
International | Morgan
Stanley & Co.
International
PLC | NatWest
Markets PLC | State Street
Bank and
Trust Co. | Toronto-
Dominion
Bank | UBS AG | Wells Fargo
Bank, N.A. | WestPac
Banking Corp. | Total |
| Assets: | | | | | | | | | | | | | | | | | | | | |
| OTC Interest rate | | | | | | | | | | | | | | | | | | | | |
| swap contracts*# | $— | $— | $— | $— | $— | $— | $— | $38,832 | $— | $22,376 | $— | $— | $— | $— | $— | $— | $— | $— | $— | $61,208 |
| Centrally cleared | | | | | | | | | | | | | | | | | | | | |
| interest rate | | | | | | | | | | | | | | | | | | | | |
| swap contracts§ | — | — | 76,231 | — | — | — | — | — | — | — | — | — | — | — | — | — | — | — | — | 76,231 |
| OTC Total return | | | | | | | | | | | | | | | | | | | | |
| swap contracts*# | — | 7,664 | — | — | 126 | — | 1,111 | 547 | — | 491 | 1,869 | — | — | — | — | — | — | — | — | 11,808 |
| Centrally cleared | | | | | | | | | | | | | | | | | | | | |
| total return | | | | | | | | | | | | | | | | | | | | |
| swap contracts§ | — | — | 213,467 | — | — | — | — | — | — | — | — | — | — | — | — | — | — | — | — | 213,467 |
| OTC Credit default | | | | | | | | | | | | | | | | | | | | |
| contracts — | | | | | | | | | | | | | | | | | | | | |
| protection sold*# | — | — | — | — | — | — | — | 281 | — | — | — | — | 4,717 | — | — | — | — | — | — | 4,998 |
| OTC Credit default | | | | | | | | | | | | | | | | | | | | |
| contracts — | | | | | | | | | | | | | | | | | | | | |
| protection | | | | | | | | | | | | | | | | | | | | |
| purchased*# | — | — | — | — | — | 255,178 | 398,806 | 213,235 | — | — | 185,561 | 126,114 | 283,104 | — | — | — | — | — | — | 1,461,998 |
| Futures contracts§ | — | — | — | — | — | — | — | — | — | — | 20,157 | — | — | — | — | — | — | — | — | 20,157 |
| Forward currency | | | | | | | | | | | | | | | | | | | | |
| contracts# | 335,400 | 10,468 | — | — | 33,117 | — | 16,099 | 453,561 | 38,073 | 250,383 | — | — | 95,443 | 606 | 89,672 | 22,883 | 169,417 | — | 31,243 | 1,546,365 |
| Forward premium | | | | | | | | | | | | | | | | | | | | |
| swap option | | | | | | | | | | | | | | | | | | | | |
| contracts# | 513,145 | 33,235 | — | — | 243,248 | — | — | 35,185 | — | 348,633 | — | — | 124,234�� | — | — | 237,880 | 763,497 | 313,004 | — | 2,612,061 |
| Purchased swap | | | | | | | | | | | | | | | | | | | | |
| options**# | 189,288 | — | — | — | 6,639 | — | — | 426,519 | — | 395,992 | — | — | 1,005,786 | — | — | 25,137 | 33,223 | — | — | 2,082,584 |
| Purchased | | | | | | | | | | | | | | | | | | | | |
| options**# | — | — | — | — | — | — | — | — | — | 51,746 | — | — | — | — | — | — | — | — | — | 51,746 |
| Total Assets | $1,037,833 | $51,367 | $289,698 | $— | $283,130 | $255,178 | $416,016 | $1,168,160 | $38,073 | $1,069,621 | $207,587 | $126,114 | $1,513,284 | $606 | $89,672 | $285,900 | $966,137 | $313,004 | $31,243 | $8,142,623 |
| Liabilities: | | | | | | | | | | | | | | | | | | | | |
| OTC Interest rate | | | | | | | | | | | | | | | | | | | | |
| swap contracts*# | $— | $— | $— | $— | $— | $— | $— | $— | $— | $— | $— | $— | $— | $— | $— | $— | $— | $— | $— | $— |
| Centrally cleared | | | | | | | | | | | | | | | | | | | | |
| interest rate | | | | | | | | | | | | | | | | | | | | |
| swap contracts§ | — | — | 100,560 | — | — | — | — | — | — | — | — | — | — | — | — | — | — | — | — | 100,560 |
| OTC Total return | | | | | | | | | | | | | | | | | | | | |
| swap contracts*# | 407 | 1,056 | — | — | — | — | 1,035 | 2,546 | — | — | 19 | — | 2,241 | — | — | — | — | — | — | 7,304 |
| Centrally cleared | | | | | | | | | | | | | | | | | | | | |
| total return | | | | | | | | | | | | | | | | | | | | |
| swap contracts§ | — | — | 184,928 | — | — | — | — | — | — | — | — | — | — | — | — | — | — | — | — | 184,928 |
| |
| 100 Global Income Trust | Global Income Trust 101 |
| | | | | | | | | | | | | | | | | | | | |
| | Bank of
America N.A. | Barclays Bank
PLC | Barclays
Capital, Inc.
(clearing
broker) | BofA
Securities,
Inc. | Citibank, N.A. | Citigroup
Global
Markets, Inc. | Credit Suisse
International | Goldman
Sachs
International | HSBC Bank
USA, National
Association | JPMorgan
Chase Bank
N.A. | JPMorgan
Securities LLC | Merrill Lynch
International | Morgan
Stanley & Co.
International
PLC | NatWest
Markets PLC | State Street
Bank and
Trust Co. | Toronto-
Dominion
Bank | UBS AG | Wells Fargo
Bank, N.A. | WestPac
Banking Corp. | Total |
| OTC Credit default | | | | | | | | | | | | | | | | | | | | |
| contracts — | | | | | | | | | | | | | | | | | | | | |
| protection sold*# | $85,628 | $— | $— | $— | $— | $833,548 | $564,064 | $467,967 | $— | $— | $149,841 | $78,563 | $111,313 | $— | $— | $— | $— | $— | $— | $2,290,924 |
| OTC Credit default | | | | | | | | | | | | | | | | | | | | |
| contracts — | | | | | | | | | | | | | | | | | | | | |
| protection | | | | | | | | | | | | | | | | | | | | |
| purchased*# | — | — | — | — | — | — | — | — | — | — | — | — | — | — | — | — | — | — | — | — |
| Futures contracts§ | — | — | — | — | — | — | — | — | — | — | 2,405 | — | — | — | — | — | — | — | — | 2,405 |
| Forward currency | | | | | | | | | | | | | | | | | | | | |
| contracts# | 61,292 | 145,946 | — | — | 79,558 | — | 13,788 | 71,053 | 171,951 | 52,617 | — | — | 196,843 | 195,008 | 304,298 | 64,491 | 89,701 | — | 46,749 | 1,493,295 |
| Forward premium | | | | | | | | | | | | | | | | | | | | |
| swap option | | | | | | | | | | | | | | | | | | | | |
| contracts# | 623,346 | 26,163 | — | — | 171,076 | — | — | 37,383 | — | 501,111 | — | — | 90,160 | — | — | 128,754 | 456,883 | 141,084 | — | 2,175,960 |
| Written swap | | | | | | | | | | | | | | | | | | | | |
| options# | 224,762 | — | — | — | 64,088 | — | — | 301,596 | — | 1,145,400 | — | — | 939,282 | — | — | 110,195 | 61,952 | — | — | 2,847,275 |
| Written options# | — | — | — | — | — | — | — | — | — | 4,488 | — | — | — | — | — | — | — | — | — | 4,488 |
| Total Liabilities | $995,435 | $173,165 | $285,488 | $— | $314,722 | $833,548 | $578,887 | $880,545 | $171,951 | $1,703,616 | $152,265 | $78,563 | $1,339,839 | $195,008 | $304,298 | $303,440 | $608,536 | $141,084 | $46,749 | $9,107,139 |
| Total Financial | | | | | | | | | | | | | | | | | | | | |
| and Derivative | | | | | | | | | | | | | | | | | | | | |
| Net Assets | $42,398 | $(121,798) | $4,210 | $— | $(31,592) | $(578,370) | $(162,871) | $287,615 | $(133,878) | $(633,995) | $55,322 | $47,551 | $173,445 | $(194,402) | $(214,626) | $(17,540) | $357,601 | $171,920 | $(15,506) | $(964,516) |
| Total collateral | | | | | | | | | | | | | | | | | | | | |
| received | | | | | | | | | | | | | | | | | | | | |
| (pledged)†## | $— | $(111,000) | $— | $— | $(31,592) | $(578,370) | $(162,871) | $260,000 | $(133,878) | $(604,000) | $— | $— | $173,445 | $(194,402) | $(214,626) | $— | $357,601 | $171,920 | $— | |
| Net amount | $42,398 | $(10,798) | $4,210 | $— | $— | $— | $— | $27,615 | $— | $(29,995) | $55,322 | $47,551 | $— | $— | $— | $(17,540) | $— | $— | $(15,506) | |
| Controlled collateral | | | | | | | | | | | | | | | | | | | | |
| received (including | | | | | | | | | | | | | | | | | | | | |
| TBA commitments)** | $— | $— | $— | $— | $— | $— | $— | $260,000 | $— | $— | $796,000 | $— | $200,000 | $— | $— | $— | $380,000 | $242,090 | $— | $1,878,090 |
| Uncontrolled | | | | | | | | | | | | | | | | | | | | |
| collateral received | $— | $— | $— | $— | $— | $— | $— | $— | $— | $— | $— | $— | $— | $— | $— | $— | $— | $— | $— | $— |
| Collateral (pledged) | | | | | | | | | | | | | | | | | | | | |
| (including TBA | | | | | | | | | | | | | | | | | | | | |
| commitments)** | $— | $(111,000) | $— | $(478,000) | $(71,000) | $(646,000) | $(277,000) | $— | $(244,000) | $(604,000) | $— | $— | $— | $(262,000) | $(343,000) | $— | $— | $— | $— | $(3,036,000) |
* Excludes premiums, if any. Included in unrealized appreciation and depreciation on OTC swap contracts on the Statement of assets and liabilities.
** Included with Investments in securities on the Statement of assets and liabilities.
† Additional collateral may be required from certain brokers based on individual agreements.
# Covered by master netting agreement (Note 1).
##Any over-collateralization of total financial and derivative net assets is not shown. Collateral may include amounts related to unsettled agreements.
§ Includes current day’s variation margin only as reported on the Statement of assets and liabilities, which is not collateralized. Cumulative appreciation/(depreciation) for futures contracts and centrally cleared swap contracts is represented in the tables listed after the fund’s portfolio. Collateral pledged for initial margin on futures contracts and centrally cleared swap contracts, which is not included in the table above, amounted to $478,000 and $3,350,000, respectively.
| |
| 102 Global Income Trust | Global Income Trust 103 |
Note 9: New accounting pronouncements
In March 2020, the Financial Accounting Standards Board (FASB) issued Accounting Standards Update (ASU) 2020–04, Reference Rate Reform (Topic 848) — Facilitation of the Effects of Reference Rate Reform on Financial Reporting. The amendments in ASU 2020–04 provide optional temporary financial reporting relief from the effect of certain types of contract modifications due to the planned discontinuation of LIBOR and other interbank-offered based reference rates as of the end of 2021. The discontinuation of LIBOR was subsequently extended to June 30, 2023. ASU 2020–04 is effective for certain reference rate-related contract modifications that occur during the period March 12, 2020 through December 31, 2022. Management is currently evaluating the impact, if any, of applying this provision.
Fund information
Founded over 80 years ago, Putnam Investments was built around the concept that a balance between risk and reward is the hallmark of a well-rounded financial program. We manage funds across income, value, blend, growth, sustainable, asset allocation, absolute return, and global sector categories.
| | |
| Investment Manager | Trustees | Michael J. Higgins |
| Putnam Investment | Kenneth R. Leibler, Chair | Vice President, Treasurer, |
| Management, LLC | Liaquat Ahamed | and Clerk |
| 100 Federal Street | Ravi Akhoury | |
| Boston, MA 02110 | Barbara M. Baumann | Jonathan S. Horwitz |
| | Katinka Domotorffy | Executive Vice President, |
| Investment Sub-Advisor | Catharine Bond Hill | Principal Executive Officer, |
| Putnam Investments Limited | Paul L. Joskow | and Compliance Liaison |
| 16 St James’s Street | George Putnam, III | |
| London, England SW1A 1ER | Robert L. Reynolds | Richard T. Kircher |
| | Manoj P. Singh | Vice President and BSA |
| Marketing Services | Mona K. Sutphen | Compliance Officer |
| Putnam Retail Management | | |
| 100 Federal Street | Officers | Susan G. Malloy |
| Boston, MA 02110 | Robert L. Reynolds | Vice President and |
| | President | Assistant Treasurer |
| Custodian | | |
| State Street Bank | Robert T. Burns | Denere P. Poulack |
| and Trust Company | Vice President and | Assistant Vice President, Assistant |
| | Chief Legal Officer | Clerk, and Assistant Treasurer |
| Legal Counsel | | |
| Ropes & Gray LLP | James F. Clark | Janet C. Smith |
| | Vice President, Chief Compliance | Vice President, |
| | Officer, and Chief Risk Officer | Principal Financial Officer, |
| | | Principal Accounting Officer, |
| | Nancy E. Florek | and Assistant Treasurer |
| | Vice President, Director of | |
| | Proxy Voting and Corporate | Mark C. Trenchard |
| | Governance, Assistant Clerk, | Vice President |
| | and Assistant Treasurer | |
This report is for the information of shareholders of Putnam Global Income Trust. It may also be used as sales literature when preceded or accompanied by the current prospectus, the most recent copy of Putnam’s Quarterly Performance Summary, and Putnam’s Quarterly Ranking Summary. For more recent performance, please visit putnam.com. Investors should carefully consider the investment objectives, risks, charges, and expenses of a fund, which are described in its prospectus. For this and other information or to request a prospectus or summary prospectus, call 1-800-225-1581 toll free. Please read the prospectus carefully before investing. The fund’s Statement of Additional Information contains additional information about the fund’s Trustees and is available without charge upon request by calling 1-800-225-1581.

| |
| Item 3. Audit Committee Financial Expert: |
| |
| Item 4. Principal Accountant Fees and Services: |
| |
| Item 5. Audit Committee of Listed Registrants |
| |
| Item 6. Schedule of Investments: |
| |
| The registrant's schedule of investments in unaffiliated issuers is included in the report to shareholders in Item 1 above. |
| |
| Item 7. Disclosure of Proxy Voting Policies and Procedures For Closed-End Management Investment Companies: |
| |
| Item 8. Portfolio Managers of Closed-End Investment Companies |
| |
| Item 9. Purchases of Equity Securities by Closed-End Management Investment Companies and Affiliated Purchasers: |
| |
| Item 10. Submission of Matters to a Vote of Security Holders: |
| |
| Item 11. Controls and Procedures: |
| |
| (a) The registrant's principal executive officer and principal financial officer have concluded, based on their evaluation of the effectiveness of the design and operation of the registrant's disclosure controls and procedures as of a date within 180 days of the filing date of this report, that the design and operation of such procedures are generally effective to provide reasonable assurance that information required to be disclosed by the registrant in this report is recorded, processed, summarized and reported within the time periods specified in the Commission's rules and forms. |
| |
| (b) Changes in internal control over financial reporting: Not applicable |
| |
| Item 12. Disclosures of Securities Lending Activities for Closed-End Investment Companies: |
| |
| Pursuant to the requirements of the Securities Exchange Act of 1934 and the Investment Company Act of 1940, the registrant has duly caused this report to be signed on its behalf by the undersigned, thereunto duly authorized. |
| |
| Putnam Global Income Trust |
| |
| By (Signature and Title): |
| |
| /s/ Janet C. Smith
Janet C. Smith
Principal Accounting Officer
|
| |
| Pursuant to the requirements of the Securities Exchange Act of 1934 and the Investment Company Act of 1940, this report has been signed below by the following persons on behalf of the registrant and in the capacities and on the dates indicated. |
| |
| By (Signature and Title): |
| |
| /s/ Jonathan S. Horwitz
Jonathan S. Horwitz
Principal Executive Officer
|
| |
| By (Signature and Title): |
| |
| /s/ Janet C. Smith
Janet C. Smith
Principal Financial Officer
|