| | |
| UNITED STATES
SECURITIES AND EXCHANGE COMMISSION |
| | |
| CERTIFIED SHAREHOLDER REPORT OF REGISTERED
MANAGEMENT INVESTMENT COMPANIES
|
| | |
| Investment Company Act file number: | (811-04524) |
| | |
| Exact name of registrant as specified in charter: | Putnam Global Income Trust |
| | |
| Address of principal executive offices: | 100 Federal Street, Boston, Massachusetts 02110 |
| | |
| Name and address of agent for service: | Stephen Tate, Vice President
100 Federal Street
Boston, Massachusetts 02110 |
| | |
| Copy to: | Bryan Chegwidden, Esq.
Ropes & Gray LLP
1211 Avenue of the Americas
New York, New York 10036 |
| | |
| Registrant’s telephone number, including area code: | (617) 292-1000 |
| | |
| Date of fiscal year end: | October 31, 2022 |
| | |
| Date of reporting period: | November 1, 2021 – October 31, 2022 |
| | |
|
Item 1. Report to Stockholders: | |
| | |
| The following is a copy of the report transmitted to stockholders pursuant to Rule 30e-1 under the Investment Company Act of 1940: | |
Putnam
Global Income
Trust
Annual report
10 | 31 | 22
Message from the Trustees
December 7, 2022
Dear Fellow Shareholder:
Financial markets are reminding us that the journey to long-term returns often involves weathering periods of heightened volatility. This year, stocks and bonds have experienced losses, and U.S. gross domestic product has declined slightly. Persistent inflation has caused the U.S. Federal Reserve to raise interest rates, and it may maintain high interest rates in 2023 until inflation indicators move meaningfully lower.
While this environment is challenging, you can be confident that Putnam portfolio managers are working for you. Our teams are actively researching new and attractive investment opportunities for your fund while assessing risks.
We also would like to announce changes to the Board of Trustees. In July 2022, we welcomed Jennifer Williams Murphy and Marie Pillai as new Trustees. Both have a wealth of investment advisory and executive management experience. We also want to thank our Trustees who retired from the Board on June 30, 2022. Paul Joskow served with us since 1997, and Ravi Akhoury joined the Board in 2009. We wish them well.
Thank you for investing with Putnam.


Investing in today’s bond markets requires a broad-based approach, the flexibility to exploit a range of sectors and opportunities, and a keen understanding of the complex global interrelationships that drive the markets. With support from more than 90 fixed income professionals, the fund’s managers actively position the portfolio in securities from a broad range of sectors.
The fund’s management team has an average of more than 25 years of experience.
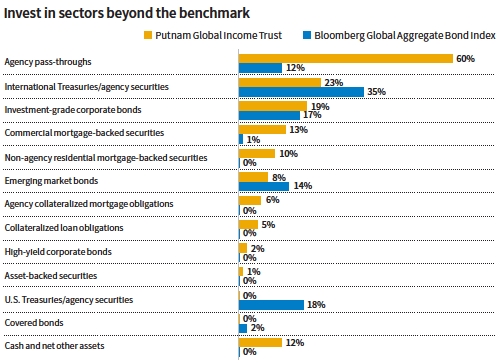
Putnam Global Income Trust invests in a number of sectors, from international sovereign debt and investment-grade corporate bonds to a wide range of mortgage-backed securities.
Investing for income from global sources
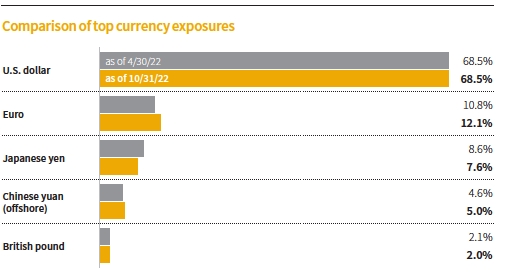
The fund provides exposure to a variety of currencies to seek to benefit from changes in exchange rates.
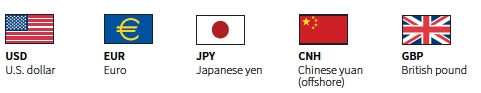
Illustration shows the fund’s five largest currency exposures as of 10/31/22. Allocations in each currency may vary over time.
Fund allocations are shown as a percentage of the fund’s net assets as of 10/31/22. Cash and net other assets, if any, represent the market value weights of cash, derivatives, short-term securities, and other unclassified assets in the portfolio. Summary information may differ from the portfolio schedule included in the financial statements due to the inclusion of derivative securities, any interest accruals, the use of different classifications of securities for presentation purposes, and rounding. Allocations may not total 100% because the chart includes the notional value of certain derivatives (the economic value for purposes of calculating periodic payment obligations), in addition to the market value of securities. Holdings and allocations may vary over time. For more information on current fund holdings, see pages 28–73.
All Bloomberg indices are provided by Bloomberg Index Services Limited.
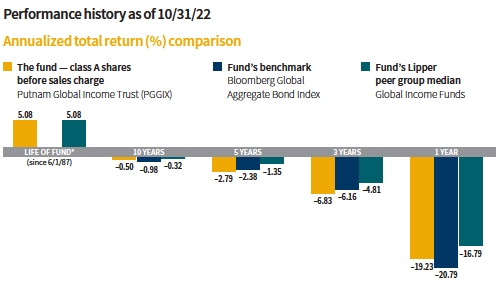
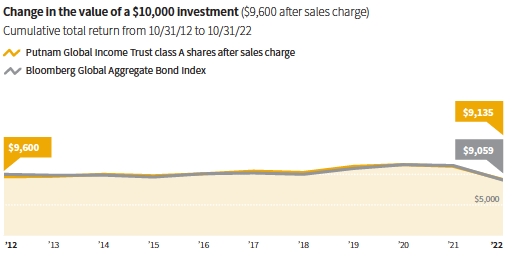
Current performance may be lower or higher than the quoted past performance, which cannot guarantee future results. Share price, principal value, and return will fluctuate, and you may have a gain or a loss when you sell your shares. Performance of class A shares assumes reinvestment of distributions and does not account for taxes. Fund returns in the bar chart do not reflect a sales charge of 4.00%; had they, returns would have been lower. See below and pages 10–13 for additional performance information. For a portion of the periods, the fund had expense limitations, without which returns would have been lower. To obtain the most recent month-end performance, visit putnam.com.
All Bloomberg indices are provided by Bloomberg Index Services Limited.
Lipper peer group median is provided by Lipper, a Refinitiv company.
* The fund’s benchmark, the Bloomberg Global Aggregate Bond Index, was introduced on 12/31/89, which post-dates the inception of the fund.
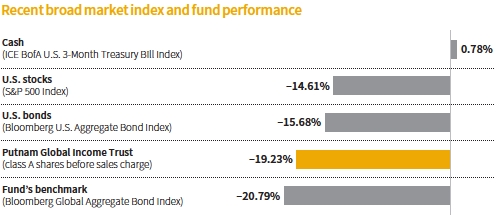
This comparison shows your fund’s performance in the context of broad market indexes for the 12 months ended 10/31/22. See above and pages 10–13 for additional fund performance information. Index descriptions can be found on page 18.
All Bloomberg indices are provided by Bloomberg Index Services Limited.


Mike, what was the fund’s investment environment like during the 12-month reporting period ended October 31, 2022?
After a relatively quiet period during the fourth quarter of calendar 2021, the market environment changed dramatically as the new year began, with several headwinds stoking investor anxiety and market volatility. Chief among these was the U.S. Federal Reserve’s accelerated plan to hike interest rates and aggressively reduce its asset portfolio to rein in historically high inflation. In addition, geopolitical unrest rose as Russia invaded Ukraine in February and escalated its attack in the ensuing months.
Within this environment, credit spreads widened and interest rates rose. [Spreads are the yield advantage credit-sensitive bonds offer over comparable-maturity U.S. Treasuries. Bond prices rise as yield spreads tighten and decline as spreads widen.] The yield on the benchmark 10-year U.S. Treasury more than doubled, rising from 1.55% at the beginning of the period to 4.10% at the end. In anticipation of Fed policy changes, short-term yields rose even more, causing the yield curve to flatten and then invert.
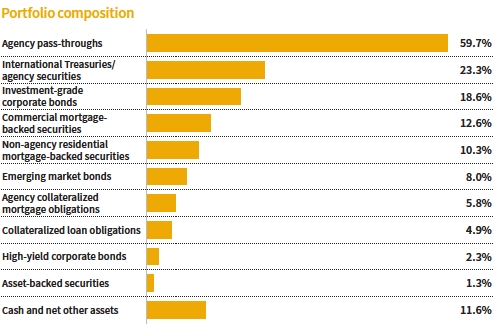
Allocations are shown as a percentage of the fund’s net assets as of 10/31/22. Cash and net other assets, if any, represent the market value weights of cash, derivatives, short-term securities, and other unclassified assets in the portfolio. Summary information may differ from the portfolio schedule included in the financial statements due to the inclusion of derivative securities, any interest accruals, the use of different classifications of securities for presentation purposes, and rounding. Allocations may not total 100% because the chart includes the notional value of certain derivatives (the economic value for purposes of calculating periodic payment obligations), in addition to the market value of securities. Holdings and allocations may vary over time.
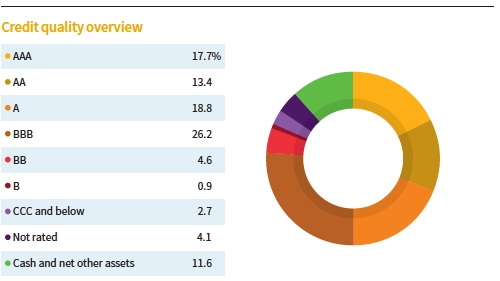
Credit qualities are shown as a percentage of the fund’s net assets as of 10/31/22. A bond rated BBB or higher (A-3 or higher, for short-term debt) is considered investment grade. This chart reflects the highest security rating provided by one or more of Standard & Poor’s, Moody’s, and Fitch. Ratings and portfolio credit quality will vary over time.
Cash and net other assets, if any, represent the market value weights of cash, derivatives, and short-term securities in the portfolio. The fund itself has not been rated by an independent rating agency. Data in the chart reflect a new calculation methodology put into effect on 6/30/22.
In March, the Fed approved a 0.25% hike in its target for short-term interest rates, its first increase since 2018. The central bank implemented five more increases during 2022 — including one shortly after the period ended — to a range of 3.75% to 4.00% and signaled at least one more hike this year.
Later in the period, investors took the view that inflation had peaked, and markets began to price in the probability of interest-rate cuts in 2023. However, sentiment began to shift following Fed Chair Jerome Powell’s comments at the Jackson Hole symposium in August. Risk assets fell once again and U.S. Treasury yields rose across the curve as concern about a recession intensified.
From a sector perspective, all fixed income categories except for short-term U.S. Treasury bills posted losses. High-yield corporate credit, leveraged loans, securitized categories — such as commercial mortgage-backed bonds — and government agency securities held up better than the broad fixed income market. Non-U.S. government bonds, emerging market debt, and investment-grade [IG] corporate credit were among the weakest performers, given rising interest rates and a strengthening U.S. dollar.
Which holdings and strategies aided the fund’s performance versus the benchmark during the period?
Our active currency positioning added the most value on a relative basis. The portfolio’s exposure to the U.S. dollar was much greater compared with that of its benchmark. This provided a substantial boost to performance because the dollar strengthened against all other major currencies during the period.
Strategies targeting prepayment risk slightly aided the fund’s relative return, driven by our mortgage basis positioning. Our strategy benefited early in calendar 2022, following the release of the minutes from the Fed’s December policy meeting. The minutes indicated the central bank might sell its holdings of government agency mortgage-backed securities more rapidly than investors originally anticipated. By way of explanation, our mortgage basis strategy seeks to capitalize on the difference between longer-term U.S. Treasury yields and the interest rates on 30-year home mortgages.
What about relative detractors during the period?
The fund’s interest-rate and yield curve positioning were the biggest detractors versus the benchmark for the year. During the third quarter of calendar 2022, the portfolio’s interest-rate sensitivity was greater than that of the benchmark in the United States and the United Kingdom. This strategy weighed on returns as interest rates rose sharply in both markets in light of aggressive central bank policies.
Holdings of IG corporate bonds further dampened the fund’s relative results, as spreads in the sector widened considerably during the period amid various risk factors.
What are your current views on the major sectors in which the fund invests?
As we move through the final months of calendar 2022 and into 2023, we have a more cautious outlook for U.S. corporate credit. To be sure, we think valuations are more attractive than at the start of the year. Corporate fundamentals remain solid overall, but will likely weaken in the face of slower growth and margin pressure, in our view. However, we believe the supply/demand backdrop is less favorable than it was last year. High inflation, central bank tightening, and the impact of geopolitical developments add complexity to the outlook for global economic growth, in our view.
We believe the fundamental environment in the commercial mortgage-backed securities [CMBS] market will be mixed. While travel, office use, and retail spending have rebounded, we believe current Fed policy will likely result in a recession. Broadly, we think property categories that can effectively pass along higher costs, such as hotels and apartments, will maintain their value. At the same time, we believe property types that have struggled to gain new tenants without rent reductions will be exposed to rising capital costs. As a result, we believe they will be pressured to refinance loans to maintain property values. Consistent with risk markets generally, CMBS spreads have widened during calendar 2022. From our perspective, the increased liquidity premium has enhanced the appeal of select market segments.
U.S. home prices soared to record highs during the Covid-19 pandemic. Looking ahead, we believe home prices will decline modestly next year, followed by tepid growth in subsequent years. Our view is based on affordability constraints for many buyers and a gradual increase in housing supply. Within residential mortgage credit, wider spreads have created better value across all credit tiers. As of period-end, we were finding attractive investment opportunities in higher-quality areas of the market, as well as among seasoned collateral that we believe can withstand declining home prices.
We believe many prepayment-sensitive securities offer attractive risk-adjusted returns at current price levels and prepayment speeds. Many of these securities may also offer meaningful upside potential if mortgage prepayment speeds continue to slow, which we believe is likely. We think the fund’s prepayment-related strategies provide an important source of diversification in the portfolio. In light of last year’s repricing of the sector, we are finding what we consider to be compelling investment opportunities across a variety of collateral types.
In our view, risks are high in emerging markets. The near-term outlook is deteriorating as the threat of recession increases. Although we expect a challenging global economic environment, we believe certain countries are better positioned to meet these difficulties than others. Against this backdrop, we are focusing on opportunities in countries that are less directly affected by geopolitical turmoil and global policy risk.
This chart shows how the fund’s top currency holdings have changed over the past six months. Allocations are shown as a percentage of the fund’s net assets. Holdings and allocations may vary over time.
How did you use derivatives during the period?
We used bond futures to take tactical positions at various points along the yield curve and to hedge the risk associated with the fund’s curve positioning. We utilized options to hedge the fund’s interest-rate risk, to isolate the prepayment risk associated with our holdings of collateralized mortgage obligations, and to help manage overall downside risk. Lastly, we used currency forward contracts to hedge the foreign exchange risk associated with non-U.S. bonds and to efficiently gain exposure to foreign currencies.
Thanks for your time and for bringing us up to date, Mike.
The views expressed in this report are exclusively those of Putnam Management and are subject to change. They are not meant as investment advice.
Please note that the holdings discussed in this report may not have been held by the fund for the entire period. Portfolio composition is subject to review in accordance with the fund’s investment strategy and may vary in the future. Current and future portfolio holdings are subject to risk.
ABOUT DERIVATIVES
Derivatives are an increasingly common type of investment instrument, the performance of which is derived from an underlying security, index, currency, or other area of the capital markets. Derivatives employed by the fund’s managers generally serve one of two main purposes: to implement a strategy that may be difficult or more expensive to invest in through traditional securities, or to hedge unwanted risk associated with a particular position.
For example, the fund’s managers might use currency forward contracts to capitalize on an anticipated change in exchange rates between two currencies. This approach would require a significantly smaller outlay of capital than purchasing traditional bonds denominated in the underlying currencies. In another example, the managers may identify a bond that they believe is undervalued relative to its risk of default, but may seek to reduce the interest-rate risk of that bond by using interest-rate swaps, a derivative through which two parties “swap” payments based on the movement of certain rates. In other examples, the managers may use options and futures contracts to hedge against a variety of risks.
Like any other investment, derivatives may not appreciate in value and may lose money. Derivatives may amplify traditional investment risks through the creation of leverage and may be less liquid than traditional securities. And because derivatives typically represent contractual agreements between two financial institutions, derivatives entail “counterparty risk,” which is the risk that the other party is unable or unwilling to pay. Putnam monitors the counterparty risks we assume. For example, Putnam often enters into collateral agreements that require the counterparties to post collateral on a regular basis to cover their obligations to the fund. Counterparty risk for exchange-traded futures and centrally cleared swaps is mitigated by the daily exchange of margin and other safeguards against default through their respective clearinghouses.
Your fund’s performance
This section shows your fund’s performance, price, and distribution information for periods ended October 31, 2022, the end of its most recent fiscal year. In accordance with regulatory requirements for mutual funds, we also include performance information as of the most recent calendar quarter-end and expense information taken from the fund’s current prospectus. Performance should always be considered in light of a fund’s investment strategy. Data represent past performance. Past performance does not guarantee future results. More recent returns may be less or more than those shown. Investment return and principal value will fluctuate, and you may have a gain or a loss when you sell your shares. Performance information does not reflect any deduction for taxes a shareholder may owe on fund distributions or on the redemption of fund shares. For the most recent month-end performance, please visit the Individual Investors section at putnam.com or call Putnam at 1-800-225-1581. Class R, R5, R6, and Y shares are not available to all investors. See the Terms and definitions section in this report for definitions of the share classes offered by your fund.
Annualized fund performance Total return for periods ended 10/31/22
| | | | | |
| | Life of fund | 10 years | 5 years | 3 years | 1 year |
| Class A (6/1/87) | | | | | |
| Before sales charge | 5.08% | –0.50% | –2.79% | –6.83% | –19.23% |
| After sales charge | 4.96 | –0.90 | –3.58 | –8.09 | –22.46 |
| Class B (2/1/94) | | | | | |
| Before CDSC | 4.88 | –1.10 | –3.53 | –7.52 | –19.78 |
| After CDSC | 4.88 | –1.10 | –3.89 | –8.42 | –23.75 |
| Class C (7/26/99) | | | | | |
| Before CDSC | 4.90 | –1.09 | –3.52 | –7.50 | –19.77 |
| After CDSC | 4.90 | –1.09 | –3.52 | –7.50 | –20.56 |
| Class R (12/1/03) | | | | | |
| Net asset value | 4.82 | –0.74 | –3.03 | –7.06 | –19.35 |
| Class R5 (7/2/12) | | | | | |
| Net asset value | 5.23 | –0.17 | –2.45 | –6.51 | –18.88 |
| Class R6 (7/2/12) | | | | | |
| Net asset value | 5.25 | –0.10 | –2.38 | –6.45 | –18.88 |
| Class Y (10/4/05) | | | | | |
| Net asset value | 5.21 | –0.25 | –2.55 | –6.59 | –18.98 |
Current performance may be lower or higher than the quoted past performance, which cannot guarantee future results. After-sales-charge returns for class A shares reflect the deduction of the maximum 4.00% sales charge levied at the time of purchase. Class B share returns after contingent deferred sales charge (CDSC) reflect the applicable CDSC, which is 5% in the first year, declining over time to 1% in the sixth year, and is eliminated thereafter. Class C share returns after CDSC reflect a 1% CDSC for the first year that is eliminated thereafter. Class R, R5, R6, and Y shares have no initial sales charge or CDSC. Performance for class B, C, R, and Y shares before their inception is derived from the historical performance of class A shares, adjusted for the applicable sales charge (or CDSC) and the higher operating expenses for such shares, except for class Y shares, for which 12b-1 fees are not applicable. Performance for class R5 and R6 shares prior to their inception is derived from the historical performance of class Y shares and has not been adjusted for the lower investor servicing fees applicable to class R5 and R6 shares; had it, returns would have been higher.
For a portion of the periods, the fund had expense limitations, without which returns would have been lower.
Class B and C share performance reflects conversion to class A shares after eight years.
Comparative annualized index returns For periods ended 10/31/22
| | | | | |
| | Life of fund | 10 years | 5 years | 3 years | 1 year |
| Bloomberg Global | | | | | |
| Aggregate Bond Index | —* | –0.98% | –2.38% | –6.16% | –20.79% |
| Lipper Global Income | | | | | |
| Funds category median† | 5.08% | –0.32 | –1.35 | –4.81 | –16.79 |
Index and Lipper results should be compared with fund performance before sales charge, before CDSC, or at net asset value.
All Bloomberg indices are provided by Bloomberg Index Services Limited.
Lipper peer group median is provided by Lipper, a Refinitiv company.
* The fund’s benchmark, the Bloomberg Global Aggregate Bond Index, was introduced on 12/31/89, which post-dates the inception of the fund.
† Over the 1-year, 3-year, 5-year, 10-year, and life-of-fund periods ended 10/31/22, there were 236, 214, 181, 144, and 2 funds, respectively, in this Lipper category.
Past performance does not indicate future results. At the end of the same time period, a $10,000 investment in the fund’s class B and C shares would have been valued at $8,953 and $8,958, respectively, and no contingent deferred sales charges would apply. A $10,000 investment in the fund’s class R, R5, R6, and Y shares would have been valued at $9,285, $9,830, $9,897, and $9,753, respectively.
All Bloomberg indices are provided by Bloomberg Index Services Limited.
Fund price and distribution information For the 12-month period ended 10/31/22
| | | | | | | | |
| Distributions | Class A | Class B | Class C | Class R | Class R5 | Class R6 | Class Y |
| Number | 12 | 12 | 12 | 12 | 12 | 12 | 12 |
| Income | $0.061731 | $0.036615 | $0.037220 | $0.054166 | $0.073230 | $0.075954 | $0.069297 |
| Capital gains | — | — | — | — | — | — | — |
| Return of capital* | 0.142269 | 0.084385 | 0.085780 | 0.124834 | 0.168770 | 0.175046 | 0.159703 |
| Total | $0.204000 | $0.121000 | $0.123000 | $0.179000 | $0.242000 | $0.251000 | $0.229000 |
| | Before | After | Net | Net | Net | Net | Net | Net |
| | sales | sales | asset | asset | asset | asset | asset | asset |
| Share value | charge | charge | value | value | value | value | value | value |
| 10/31/21 | $11.95 | $12.45 | $11.89 | $11.89 | $11.94 | $11.94 | $11.95 | $11.94 |
| 10/31/22 | 9.47 | 9.86 | 9.43 | 9.43 | 9.47 | 9.47 | 9.47 | 9.47 |
| | Before | After | Net | Net | Net | Net | Net | Net |
| Current rate | sales | sales | asset | asset | asset | asset | asset | asset |
| (end of period) | charge | charge | value | value | value | value | value | value |
| Current dividend rate1 | 2.15% | 2.07% | 1.53% | 1.40% | 1.90% | 2.53% | 2.53% | 2.41% |
| Current 30-day | | | | | | | | |
| SEC yield | | | | | | | | |
| (with expense | | | | | | | | |
| limitation)2,3 | N/A | 4.16 | 3.61 | 3.58 | 4.08 | 4.72 | 4.79 | 4.58 |
| Current 30-day | | | | | | | | |
| SEC yield | | | | | | | | |
| (without expense | | | | | | | | |
| limitation)3 | N/A | 3.76 | 3.19 | 3.17 | 3.66 | 4.30 | 4.37 | 4.16 |
The classification of distributions, if any, is an estimate. Before-sales-charge share value and current dividend rate for class A shares, if applicable, do not take into account any sales charge levied at the time of purchase. After-sales-charge share value, current dividend rate, and current 30-day SEC yield, if applicable, are calculated assuming that the maximum sales charge (4.00% for class A shares) was levied at the time of purchase. Final distribution information will appear on your year-end tax forms.
* See page 100.
1 Most recent distribution, including any return of capital and excluding capital gains, annualized and divided by share price before or after sales charge at period-end.
2 For a portion of the period, the fund had expense limitations, without which yields would have been lower.
3 Based only on investment income and calculated using the maximum offering price for each share class, in accordance with SEC guidelines.
Annualized fund performance as of most recent calendar quarter
Total return for periods ended 9/30/22
| | | | | |
| | Life of fund | 10 years | 5 years | 3 years | 1 year |
| Class A (6/1/87) | | | | | |
| Before sales charge | 5.11% | –0.38% | –2.74% | –6.60% | –19.67% |
| After sales charge | 4.99 | –0.78 | –3.53 | –7.86 | –22.89 |
| Class B (2/1/94) | | | | | |
| Before CDSC | 4.91 | –0.97 | –3.47 | –7.30 | –20.23 |
| After CDSC | 4.91 | –0.97 | –3.83 | –8.20 | –24.17 |
| Class C (7/26/99) | | | | | |
| Before CDSC | 4.93 | –0.97 | –3.49 | –7.31 | –20.29 |
| After CDSC | 4.93 | –0.97 | –3.49 | –7.31 | –21.08 |
| Class R (12/1/03) | | | | | |
| Net asset value | 4.85 | –0.61 | –2.98 | –6.81 | –19.80 |
| Class R5 (7/2/12) | | | | | |
| Net asset value | 5.26 | –0.05 | –2.40 | –6.26 | –19.33 |
| Class R6 (7/2/12) | | | | | |
| Net asset value | 5.28 | 0.02 | –2.33 | –6.22 | –19.32 |
| Class Y (10/4/05) | | | | | |
| Net asset value | 5.24 | –0.12 | –2.50 | –6.37 | –19.42 |
See the discussion following the fund performance table on page 10 for information about the calculation of fund performance.
Your fund’s expenses
As a mutual fund investor, you pay ongoing expenses, such as management fees, distribution fees (12b-1 fees), and other expenses. In the most recent six-month period, your fund’s expenses were limited; had expenses not been limited, they would have been higher. Using the following information, you can estimate how these expenses affect your investment and compare them with the expenses of other funds. You may also pay one-time transaction expenses, including sales charges (loads) and redemption fees, which are not shown in this section and would have resulted in higher total expenses. For more information, see your fund’s prospectus or talk to your financial representative.
Expense ratios
| | | | | | | |
| | Class A | Class B | Class C | Class R | Class R5 | Class R6 | Class Y |
| Net expenses for the fiscal year | | | | | | | |
| ended 10/31/21* | 0.88% | 1.63% | 1.63% | 1.13% | 0.55% | 0.48% | 0.63% |
| Total annual operating expenses for the | | | | | | | |
| fiscal year ended 10/31/21 | 1.18% | 1.93% | 1.93% | 1.43% | 0.85% | 0.78% | 0.93% |
| Annualized expense ratio for the | | | | | | | |
| six-month period ended 10/31/22† | 0.92% | 1.67% | 1.67% | 1.17% | 0.55% | 0.48% | 0.67% |
Fiscal year expense information in this table is taken from the most recent prospectus, is subject to change, and may differ from that shown for the annualized expense ratio and in the financial highlights of this report.
Expenses are shown as a percentage of average net assets.
* Reflects Putnam Management’s contractual obligation to limit certain fund expenses through 2/28/23.
† Expense ratios for each class are for the fund’s most recent fiscal half year. As a result of this, ratios may differ from expense ratios based on one-year data in the financial highlights.
Expenses per $1,000
The following table shows the expenses you would have paid on a $1,000 investment in each class of the fund from 5/1/22 to 10/31/22. It also shows how much a $1,000 investment would be worth at the close of the period, assuming actual returns and expenses.
| | | | | | | |
| | Class A | Class B | Class C | Class R | Class R5 | Class R6 | Class Y |
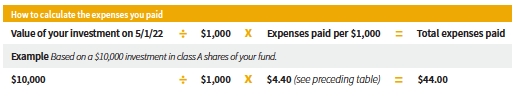
| Expenses paid per $1,000*† | $4.40 | $7.97 | $7.97 | $5.59 | $2.63 | $2.30 | $3.20 |
| Ending value (after expenses) | $895.70 | $892.80 | $892.80 | $894.60 | $897.40 | $897.70 | $896.80 |
* Expenses for each share class are calculated using the fund’s annualized expense ratio for each class, which represents the ongoing expenses as a percentage of average net assets for the six months ended 10/31/22. The expense ratio may differ for each share class.
† Expenses are calculated by multiplying the expense ratio by the average account value for the period; then multiplying the result by the number of days in the period (184); and then dividing that result by the number of days in the year (365).
Estimate the expenses you paid
To estimate the ongoing expenses you paid for the six months ended 10/31/22, use the following calculation method. To find the value of your investment on 5/1/22, call Putnam at 1-800-225-1581.
Compare expenses using the SEC’s method
The Securities and Exchange Commission (SEC) has established guidelines to help investors assess fund expenses. Per these guidelines, the following table shows your fund’s expenses based on a $1,000 investment, assuming a hypothetical 5% annualized return. You can use this information to compare the ongoing expenses (but not transaction expenses or total costs) of investing in the fund with those of other funds. All mutual fund shareholder reports will provide this information to help you make this comparison. Please note that you cannot use this information to estimate your actual ending account balance and expenses paid during the period.
| | | | | | | |
| | Class A | Class B | Class C | Class R | Class R5 | Class R6 | Class Y |
| Expenses paid per $1,000*† | $4.69 | $8.49 | $8.49 | $5.96 | $2.80 | $2.45 | $3.41 |
| Ending value (after expenses) | $1,020.57 | $1,016.79 | $1,016.79 | $1,019.31 | $1,022.43 | $1,022.79 | $1,021.83 |
* Expenses for each share class are calculated using the fund’s annualized expense ratio for each class, which represents the ongoing expenses as a percentage of average net assets for the six months ended 10/31/22. The expense ratio may differ for each share class.
† Expenses are calculated by multiplying the expense ratio by the average account value for the six-month period; then multiplying the result by the number of days in the six-month period (184); and then dividing that result by the number of days in the year (365).
Consider these risks before investing
International investing involves currency, economic, and political risks. Emerging market securities carry illiquidity and volatility risks. Lower-rated bonds may offer higher yields in return for more risk. Funds that invest in government securities are not guaranteed. Mortgage-backed investments, unlike traditional debt investments, are subject to prepayment risk, which means that they may increase in value less than other bonds when interest rates decline and decline in value more than other bonds when interest rates rise.
The fund concentrates on a limited group of industries and is non-diversified. Because the fund may invest in fewer issuers than a diversified fund, it is vulnerable to common economic forces and may result in greater losses and volatility. Bond investments are subject to interest-rate risk (the risk of bond prices falling if interest rates rise) and credit risk (the risk of an issuer defaulting on interest or principal payments). Interest-rate risk is generally greater for longer-term bonds, and credit risk is generally greater for below-investment-grade bonds. Risks associated with derivatives include increased investment exposure (which may be considered leverage) and, in the case of over-the-counter instruments, the potential inability to terminate or sell derivatives positions and the potential failure of the other party to the instrument to meet its obligations. Unlike bonds, funds that invest in bonds have fees and expenses. The value of investments in the fund’s portfolio may fall or fail to rise over extended periods of time for a variety of reasons, including general economic, political, or financial market conditions; investor sentiment and market perceptions; government actions; geopolitical events or changes; and factors related to a specific issuer, geography, industry, or sector. These and other factors may lead to increased volatility and reduced liquidity in the fund’s portfolio holdings.
Our investment techniques, analyses, and judgments may not produce the outcome we intend. The investments we select for the fund may not perform as well as other securities that we do not select for the fund. We, or the fund’s other service providers, may experience disruptions or operating errors that could have a negative effect on the fund. You can lose money by investing in the fund.
Terms and definitions
Important terms
Total return shows how the value of the fund’s shares changed over time, assuming you held the shares through the entire period and reinvested all distributions in the fund.
Before sales charge, or net asset value, is the price, or value, of one share of a mutual fund, without a sales charge. Before-sales-charge figures fluctuate with market conditions. They are calculated by dividing the net assets of each class of shares by the number of outstanding shares in the class.
After sales charge is the price of a mutual fund share plus the maximum sales charge levied at the time of purchase. After-sales-charge performance figures shown here assume the 4.00% maximum sales charge for class A shares.
Contingent deferred sales charge (CDSC) is generally a charge applied at the time of the redemption of class B or C shares and assumes redemption at the end of the period. Your fund’s class B CDSC declines over time from a 5% maximum during the first year to 1% during the sixth year. After the sixth year, the CDSC no longer applies. The CDSC for class C shares is 1% for one year after purchase.
Share classes
Class A shares are generally subject to an initial sales charge and no CDSC (except on certain redemptions of shares bought without an initial sales charge).
Class B shares are closed to new investments and are only available by exchange from class B shares of another Putnam fund or through dividend and/or capital gains reinvestment. They are not subject to an initial sales charge and may be subject to a CDSC.
Class C shares are not subject to an initial sales charge and are subject to a CDSC only if the shares are redeemed during the first year.
Class R shares are not subject to an initial sales charge or CDSC and are only available to employer-sponsored retirement plans.
Class R5 shares are not subject to an initial sales charge or CDSC and carry no 12b-1 fee. They are only available to employer-sponsored retirement plans.
Class R6 shares are not subject to an initial sales charge or CDSC and carry no 12b-1 fee. They are generally only available to employer-sponsored retirement plans, corporate and institutional clients, and clients in other approved programs.
Class Y shares are not subject to an initial sales charge or CDSC and carry no 12b-1 fee. They are generally only available to corporate and institutional clients and clients in other approved programs.
Fixed income terms
Current rate is the annual rate of return earned from dividends or interest of an investment. Current rate is expressed as a percentage of the price of a security, fund share, or principal investment.
Mortgage-backed security (MBS), also known as a mortgage “pass-through,” is a type of asset-backed security that is secured by a mortgage or collection of mortgages. The following are types of MBSs:
• Agency credit risk transfer (CRT) security is backed by a reference pool of agency mortgages. Unlike a regular agency pass-through, the principal invested in a CRT is not backed by a U.S. government agency. To compensate investors for this risk, a CRT typically offers a higher yield than conventional pass-through securities. Similar to a CMBS, a CRT is structured into various tranches for investors, offering different levels of risk and yield based on the underlying reference pool.
• Agency “pass-through” has its principal and interest backed by a U.S. government agency, such as the Federal National Mortgage Association (Fannie Mae), Government National Mortgage Association (Ginnie Mae), and Federal Home Loan Mortgage Corporation (Freddie Mac).
• Collateralized mortgage obligation (CMO) represents claims to specific cash flows from pools of home mortgages. The streams of principal and interest payments on the mortgages are distributed to the different classes of CMO interests in “tranches.” Each tranche may have different principal balances, coupon rates, prepayment risks, and maturity dates. A CMO is highly sensitive to changes in interest rates and any resulting change in the rate at which homeowners sell their properties, refinance, or otherwise prepay loans. CMOs are subject to prepayment, market, and liquidity risks.
°Interest-only (IO) security is a type of CMO in which the underlying asset is the interest portion of mortgage, Treasury, or bond payments.
• Non-agency residential mortgage-backed security (RMBS) is an MBS not backed by Fannie Mae, Ginnie Mae, or Freddie Mac. One type of RMBS is an Alt-A mortgage-backed security.
• Commercial mortgage-backed security (CMBS) is secured by the loan on a commercial property.
Yield curve is a graph that plots the yields of bonds with equal credit quality against their differing maturity dates, ranging from shortest to longest. It is used as a benchmark for other debt, such as mortgage or bank lending rates.
Comparative indexes
Bloomberg Global Aggregate Bond Index is an unmanaged index of global investment-grade fixed income securities.
Bloomberg U.S. Aggregate Bond Index is an unmanaged index of U.S. investment-grade fixed income securities.
ICE BofA (Intercontinental Exchange Bank of America) U.S. 3-Month Treasury Bill Index is an unmanaged index that seeks to measure the performance of U.S. Treasury bills available in the marketplace.
S&P 500® Index is an unmanaged index of common stock performance.
Indexes assume reinvestment of all distributions and do not account for fees. Securities and performance of a fund and an index will differ. You cannot invest directly in an index.
BLOOMBERG® is a trademark and service mark of Bloomberg Finance L.P. and its affiliates (collectively “Bloomberg”). Bloomberg or Bloomberg’s licensors own all proprietary rights in the Bloomberg Indices. Neither Bloomberg nor Bloomberg’s licensors approve or endorse this material, or guarantee the accuracy or completeness of any information herein, or make any warranty, express or implied, as to the results to be obtained therefrom, and to the maximum extent allowed by law, neither shall have any liability or responsibility for injury or damages arising in connection therewith.
ICE Data Indices, LLC (“ICE BofA”), used with permission. ICE BofA permits use of the ICE BofA indices and related data on an “as is” basis; makes no warranties regarding same; does not guarantee the suitability, quality, accuracy, timeliness, and/or completeness of the ICE BofA indices or any data included in, related to, or derived therefrom; assumes no liability in connection with the use of the foregoing; and does not sponsor, endorse, or recommend Putnam Investments, or any of its products or services.
Lipper, a Refinitiv company, is a third-party industry-ranking entity that ranks mutual funds. Its rankings do not reflect sales charges. Lipper rankings are based on total return at net asset value relative to other funds that have similar current investment styles or objectives as determined by Lipper. Lipper may change a fund’s category assignment at its discretion. Lipper category medians reflect performance trends for funds within a category.
Other information for shareholders
Proxy voting
Putnam is committed to managing our mutual funds in the best interests of our shareholders. The Putnam funds’ proxy voting guidelines and procedures, as well as information regarding how your fund voted proxies relating to portfolio securities during the 12-month period ended June 30, 2022, are available in the Individual Investors section of putnam.com and on the Securities and Exchange Commission (SEC) website, www.sec.gov. If you have questions about finding forms on the SEC’s website, you may call the SEC at 1-800-SEC-0330. You may also obtain the Putnam funds’ proxy voting guidelines and procedures at no charge by calling Putnam’s Shareholder Services at 1-800-225-1581.
Fund portfolio holdings
The fund will file a complete schedule of its portfolio holdings with the SEC for the first and third quarters of each fiscal year on Form N-PORT within 60 days of the end of such fiscal quarter. Shareholders may obtain the fund’s Form N-PORT on the SEC’s website at www.sec.gov.
Prior to its use of Form N-PORT, the fund filed its complete schedule of its portfolio holdings with the SEC on Form N-Q, which is available online at www.sec.gov.
Trustee and employee fund ownership
Putnam employees and members of the Board of Trustees place their faith, confidence, and, most importantly, investment dollars in Putnam mutual funds. As of October 31, 2022, Putnam employees had approximately $449,000,000 and the Trustees had approximately $60,000,000 invested in Putnam mutual funds. These amounts include investments by the Trustees’ and employees’ immediate family members as well as investments through retirement and deferred compensation plans.
Important notice regarding Putnam’s privacy policy
In order to conduct business with our shareholders, we must obtain certain personal information such as account holders’ names, addresses, Social Security numbers, and dates of birth. Using this information, we are able to maintain accurate records of accounts and transactions.
It is our policy to protect the confidentiality of our shareholder information, whether or not a shareholder currently owns shares of our funds. In particular, it is our policy not to sell information about you or your accounts to outside marketing firms. We have safeguards in place designed to prevent unauthorized access to our computer systems and procedures to protect personal information from unauthorized use.
Under certain circumstances, we must share account information with outside vendors who provide services to us, such as mailings and proxy solicitations. In these cases, the service providers enter into confidentiality agreements with us, and we provide only the information necessary to process transactions and perform other services related to your account. Finally, it is our policy to share account information with your financial representative, if you’ve listed one on your Putnam account.
Trustee approval of management contract
General conclusions
The Board of Trustees of The Putnam Funds oversees the management of each fund and, as required by law, determines annually whether to approve the continuance of your fund’s management contract with Putnam Investment Management, LLC (“Putnam Management”) and the sub-management contract with respect to your fund between Putnam Management and its affiliate, Putnam Investments Limited (“PIL”). The Board, with the assistance of its Contract Committee, requests and evaluates all information it deems reasonably necessary under the circumstances in connection with its annual contract review. The Contract Committee consists solely of Trustees who are not “interested persons” (as this term is defined in the Investment Company Act of 1940, as amended (the “1940 Act”)) of The Putnam Funds (“Independent Trustees”).
At the outset of the review process, members of the Board’s independent staff and independent legal counsel considered any possible changes to the annual contract review materials furnished to the Contract Committee during the course of the previous year’s review and, as applicable, identified those changes to Putnam Management. Following these discussions and in consultation with the Contract Committee, the Independent Trustees’ independent legal counsel requested that Putnam Management and its affiliates furnish specified information, together with any additional information that Putnam Management considered relevant, to the Contract Committee. Over the course of several months ending in June 2022, the Contract Committee met on a number of occasions with representatives of Putnam Management, and separately in executive session, to consider the information that Putnam Management provided. Throughout this process, the Contract Committee was assisted by the members of the Board’s independent staff and by independent legal counsel for The Putnam Funds and the Independent Trustees.
In May 2022, the Contract Committee met in executive session to discuss and consider its recommendations with respect to the continuance of the contracts. At the Trustees’ June 2022 meeting, the Contract Committee met in executive session with the other Independent Trustees to review a summary of the key financial, performance and other data that the Contract Committee considered in the course of its review. The Contract Committee then presented its written report, which summarized the key factors that the Committee had considered and set forth its recommendations. The Contract Committee recommended, and the Independent Trustees approved, the continuance of your fund’s management contract and the approval of your fund’s amended and restated sub-management contract, effective July 1, 2022. (Because PIL is an affiliate of Putnam Management and Putnam Management remains fully responsible for all services provided by PIL, the Trustees have not attempted to evaluate PIL as a separate entity, and all subsequent references to Putnam Management below should be deemed to include reference to PIL as necessary or appropriate in the context.)
The Independent Trustees’ approval was based on the following conclusions:
• That the fee schedule in effect for your fund represented reasonable compensation in light of the nature and quality of the services being provided to the fund, the fees paid by competitive funds, the costs incurred by Putnam Management in providing services to the fund and the application of certain reductions and waivers noted below; and
• That the fee schedule in effect for your fund represented an appropriate sharing between fund shareholders and Putnam Management of any economies of scale as may exist in the management of the fund at current asset levels.
These conclusions were based on a comprehensive consideration of all information provided to the Trustees and were not the result of any single factor. Some of the factors that figured particularly in the Trustees’ deliberations and how the Trustees considered these factors are described below, although individual Trustees may have evaluated the information presented differently, giving different weights to various factors. It is also important to recognize that the management arrangements for your fund and the other Putnam funds are the result of many years of review and discussion between the Independent Trustees and Putnam Management, that some aspects of the arrangements may receive greater scrutiny in some years than others and that the Trustees’ conclusions may be based, in part, on their consideration of fee arrangements in previous years. For example,
with certain exceptions primarily involving newer or repositioned funds, the current fee arrangements under the vast majority of the funds’ management contracts were first implemented at the beginning of 2010 following extensive review by the Contract Committee and discussions with representatives of Putnam Management, as well as approval by shareholders.
Management fee schedules and total expenses
The Trustees reviewed the management fee schedules in effect for all Putnam funds, including fee levels and breakpoints. Under its management contract, your fund has the benefit of breakpoints in its management fee schedule that provide shareholders with reduced fee levels as assets under management in the Putnam family of funds increase. The Trustees also reviewed the total expenses of each Putnam fund, recognizing that in most cases management fees represented the major, but not the sole, determinant of total costs to fund shareholders. (Two funds have implemented so-called “all-in” management fees covering substantially all routine fund operating costs.) The Trustees considered that the proposed amended and restated sub-management contract would lower the sub-management fees paid by Putnam Management to PIL.
In reviewing fees and expenses, the Trustees generally focus their attention on material changes in circumstances — for example, changes in assets under management, changes in a fund’s investment strategy, changes in Putnam Management’s operating costs or profitability, or changes in competitive practices in the mutual fund industry — that suggest that consideration of fee changes might be warranted. The Trustees concluded that the circumstances did not indicate that changes to the management fee schedule for your fund would be appropriate at this time.
As in the past, the Trustees also focused on the competitiveness of each fund’s total expense ratio. The Trustees and Putnam Management and the funds’ investor servicing agent, Putnam Investor Services, Inc. (“PSERV”), have implemented expense limitations that were in effect during your fund’s fiscal year ending in 2021. These expense limitations were: (i) a contractual expense limitation applicable to specified open-end funds, including your fund, of 25 basis points on investor servicing fees and expenses and (ii) a contractual expense limitation applicable to specified open-end funds, including your fund, of 20 basis points on so-called “other expenses” (i.e., all expenses exclusive of management fees, distribution fees, investor servicing fees, investment-related expenses, interest, taxes, brokerage commissions, acquired fund fees and expenses and extraordinary expenses). These expense limitations attempt to maintain competitive expense levels for the funds. Most funds, including your fund, had sufficiently low expenses that these expense limitations were not operative during their fiscal years ending in 2021. Putnam Management and PSERV have agreed to maintain these expense limitations until at least February 28, 2024. In addition, Putnam Management contractually agreed to waive fees and/or reimburse expenses of your fund to the extent that expenses of the fund (excluding payments under the fund’s distribution plans, investor servicing fees, brokerage, interest, taxes, investment-related expenses, extraordinary expenses, and acquired fund fees and expenses) would exceed an annual rate of 0.43% of its average net assets through at least February 28, 2024. During its fiscal year ending in 2021, your fund’s expenses were reduced as a result of this expense limitation. Putnam Management and PSERV’s commitment to these expense limitation arrangements, which were intended to support an effort to have fund expenses meet competitive standards, was an important factor in the Trustees’ decision to approve the continuance of your fund’s management contract and to approve your fund’s amended and restated sub-management contract.
The Trustees reviewed comparative fee and expense information for a custom group of competitive funds selected by Broadridge Financial Solutions, Inc. (“Broadridge”). This comparative information included your fund’s percentile ranking for effective management fees and total expenses (excluding any applicable 12b-1 fees), which provides a general indication of your fund’s relative standing. In the custom peer group, your fund ranked in the third quintile in effective management fees (determined for your fund and the other funds in the custom peer group based on fund asset size and the applicable contractual management fee schedule) and in the first quintile in total expenses (excluding any applicable 12b-1 fees) as of December 31, 2021. The first quintile represents the least expensive funds and the fifth quintile the most expensive funds. The fee and expense data reported by Broadridge as of December 31, 2021 reflected the most recent fiscal
year-end data available in Broadridge’s database at that time.
In connection with their review of fund management fees and total expenses, the Trustees also reviewed the costs of the services provided and the profits realized by Putnam Management and its affiliates from their contractual relationships with the funds. This information included trends in revenues, expenses and profitability of Putnam Management and its affiliates relating to the investment management, investor servicing and distribution services provided to the funds. In this regard, the Trustees also reviewed an analysis of the revenues, expenses and profitability of Putnam Management and its affiliates, allocated on a fund-by-fund basis, with respect to the funds’ management, distribution and investor servicing contracts. For each fund, the analysis presented information about revenues, expenses and profitability for each of the agreements separately and for the agreements taken together on a combined basis. The Trustees concluded that, at current asset levels, the fee schedules in place for the Putnam funds, including the fee schedule for your fund, represented reasonable compensation for the services being provided and represented an appropriate sharing between fund shareholders and Putnam Management of any economies of scale as may exist in the management of the Putnam funds at that time.
The information examined by the Trustees in connection with their annual contract review for the Putnam funds included information regarding services provided and fees charged by Putnam Management and its affiliates to other clients, including collective investment trusts offered in the defined contribution and defined benefit retirement plan markets, sub-advised mutual funds, private funds sponsored by affiliates of Putnam Management, model-only separately managed accounts and Putnam Management’s exchange-traded funds. This information included, in cases where a product’s investment strategy corresponds with a fund’s strategy, comparisons of those fees with fees charged to the Putnam funds, as well as an assessment of the differences in the services provided to these clients as compared to the services provided to the Putnam funds. The Trustees observed that the differences in fee rates between these clients and the Putnam funds are by no means uniform when examined by individual asset sectors, suggesting that differences in the pricing of investment management services to these types of clients may reflect, among other things, historical competitive forces operating in separate marketplaces. The Trustees considered the fact that in many cases fee rates across different asset classes are higher on average for mutual funds than for other clients, and the Trustees also considered the differences between the services that Putnam Management provides to the Putnam funds and those that it provides to its other clients. The Trustees did not rely on these comparisons to any significant extent in concluding that the management fees paid by your fund are reasonable.
Investment performance
The quality of the investment process provided by Putnam Management represented a major factor in the Trustees’ evaluation of the quality of services provided by Putnam Management under your fund’s management contract. The Trustees were assisted in their review of Putnam Management’s investment process and performance by the work of the investment oversight committees of the Trustees and the full Board of Trustees, which meet on a regular basis with individual portfolio managers and with senior management of Putnam Management’s Investment Division throughout the year. The Trustees concluded that Putnam Management generally provides a high-quality investment process — based on the experience and skills of the individuals assigned to the management of fund portfolios, the resources made available to them and in general Putnam Management’s ability to attract and retain high-quality personnel — but also recognized that this does not guarantee favorable investment results for every fund in every time period.
The Trustees considered that, in the aggregate, the Putnam funds’ performance was generally solid in 2021 against a backdrop of strong U.S. economic and financial market growth. The Trustees considered Putnam Management’s observation that, despite an environment of generally strong growth, there had been various headwinds experienced in 2021. For the one-year period ended December 31, 2021, the Trustees noted that the Putnam funds, on an asset-weighted basis, ranked in the 52nd percentile of their peers as determined by Lipper Inc. (“Lipper”) and, on an asset-weighted-basis, delivered a gross return that trailed their benchmarks by 0.1%. Over the longer-term, the Committee noted that, on an asset-weighted basis, the Putnam funds delivered strong aggregate performance relative to their
Lipper peers over the three-, five- and ten-year periods ended December 31, 2021, ranking in the 31st, 29th and 21st percentiles, respectively, and that the funds, in the aggregate, outperformed their benchmarks on a gross basis for each of those periods.
In addition to the performance of the individual Putnam funds, the Trustees considered, as they had in prior years, the performance of The Putnam Fund complex versus competitor fund complexes. In particular, the Trustees considered The Putnam Fund complex’s performance as reported in the Barron’s/Lipper Fund Families survey (the “Survey”), which ranks mutual fund companies based on their performance across a variety of asset types. The Trustees noted that The Putnam Fund complex continued to rank highly in the Survey, especially over the longer-term, with The Putnam Funds ranking as the 6th best performing mutual fund complex out of 45 complexes for the ten-year period and 13th out of 49 complexes for the five-year period. The Trustees noted that 2021 marked the fifth consecutive year that The Putnam Funds have ranked in the top ten fund complexes for the ten-year period. The Trustees also considered that The Putnam Fund complex’s Survey performance over the one-year period was solid, with The Putnam Funds ranking 27th out of 51 complexes. In addition to the Survey, the Trustees also considered the Putnam funds’ ratings assigned by Morningstar Inc., noting that 25 of the funds were four- or five-star rated at the end of 2021 (representing a decrease of one fund year-over-year) and that this included nine funds that had achieved a five-star rating (representing an increase of two funds year-over-year). They also noted, however, the disappointing investment performance of some Putnam funds for periods ended December 31, 2021 and considered information provided by Putnam Management regarding the factors contributing to the underperformance and actions being taken to improve the performance of these particular funds. The Trustees indicated their intention to continue to monitor closely the performance of those funds and evaluate whether additional actions to address areas of underperformance may be warranted.
For purposes of the Trustees’ evaluation of the Putnam funds’ investment performance, the Trustees generally focus on a competitive industry ranking of each fund’s total net return over a one-year, three-year and five-year period. For a number of Putnam funds with relatively unique investment mandates for which Putnam Management informed the Trustees that meaningful competitive performance rankings are not considered to be available, the Trustees evaluated performance based on their total gross and net returns and comparisons of those returns to the returns of selected investment benchmarks. In the case of your fund, the Trustees considered that its class A share cumulative total return performance at net asset value was in the following quartiles of its Lipper peer group (Lipper Global Income Funds) for the one-year, three-year and five-year periods ended December 31, 2021 (the first quartile representing the best-performing funds and the fourth quartile the worst-performing funds):
| |
| One-year period | 4th |
| Three-year period | 4th |
| Five-year period | 4th |
Over the one-year, three-year and five-year periods ended December 31, 2021, there were 207, 198 and 162 funds, respectively, in your fund’s Lipper peer group. (When considering performance information, shareholders should be mindful that past performance is not a guarantee of future results.)
The Trustees expressed concern about your fund’s fourth quartile performance over the one-year, three-year and five-year periods ended December 31, 2021 and considered the circumstances that may have contributed to this disappointing performance. The Trustees considered Putnam Management’s observation that the fund’s underperformance over those periods was driven by disappointing performance in 2021 and, to a lesser extent, in 2020. The Trustees observed that significant underperformance in the securitized products sector in 2021 had contributed to the fund’s disappointing results, noting that prepayment strategies had suffered as a result of significantly elevated refinancing (given strong home price appreciation and low interest rates) relative to expectations. The Trustees considered that the fund’s underperformance was also driven by significant underperformance in the securitized products sector in 2020, which resulted from the outsized impact of the COVID-19 pandemic on the commercial mortgage sector. In addition, the Trustees considered the negative impact that the fund’s term structure strategies had on performance in 2020 and 2021.
The Trustees considered Putnam Management’s view that the fund’s active quantitative currency
model had underperformed due to the Federal Reserve’s quantitative easing policy, and noted that the fund had halted its use of the model due to Putnam Management’s expectations with respect to the Federal Reserve’s monetary policy. The Trustees also considered Putnam Management’s observation that a number of the investment strategies that had detracted from the fund’s performance had begun to recover as of March 31, 2022 and that the fund had near-median performance year to date relative to its peers, as of March 31, 2022. In addition, the Trustees considered the retirement of two of the fund’s portfolio managers over the previous year and the addition of a portfolio manager. The Trustees noted that Putnam Management remained confident in the fund’s portfolio managers. The Trustees also considered Putnam Management’s continued efforts to support fund performance through certain initiatives, including structuring compensation for portfolio managers to enhance accountability for fund performance, emphasizing accountability in the portfolio management process and affirming its commitment to a fundamental-driven approach to investing. The Trustees noted further that Putnam Management had made selective hires and internal promotions in 2021 to strengthen its investment team.
As a general matter, the Trustees believe that cooperative efforts between the Trustees and Putnam Management represent the most effective way to address investment performance concerns that may arise from time to time. The Trustees noted that investors in the Putnam funds have, in effect, placed their trust in the Putnam organization, under the oversight of the funds’ Trustees, to make appropriate decisions regarding the management of the funds. The Trustees also considered that Putnam Management has made changes in light of subpar investment performance when warranted. Based on Putnam Management’s willingness to take appropriate measures to address fund performance issues, the Trustees concluded that it continued to be advisable to seek change within Putnam Management to address performance shortcomings. In the Trustees’ view, the alternative of engaging a new investment adviser for an underperforming fund, with all the attendant risks and disruptions, would not likely provide any greater assurance of improved investment performance.
Brokerage and soft-dollar allocations; investor servicing
The Trustees considered various potential benefits that Putnam Management may receive in connection with the services it provides under the management contract with your fund. These include benefits related to brokerage allocation and the use of soft dollars, whereby a portion of the commissions paid by a fund for brokerage may be used to acquire research services that are expected to be useful to Putnam Management in managing the assets of the fund and of other clients. Subject to policies established by the Trustees, soft dollars generated by these means are used predominantly to acquire brokerage and research services (including third-party research and market data) that enhance Putnam Management’s investment capabilities and supplement Putnam Management’s internal research efforts. The Trustees indicated their continued intent to monitor regulatory and industry developments in this area with the assistance of their Brokerage Committee. In addition, with the assistance of their Brokerage Committee, the Trustees indicated their continued intent to monitor the allocation of the Putnam funds’ brokerage in order to ensure that the principle of seeking best price and execution remains paramount in the portfolio trading process.
Putnam Management may also receive benefits from payments that the funds make to Putnam Management’s affiliates for investor or distribution services. In conjunction with the annual review of your fund’s management and sub-management contracts, the Trustees reviewed your fund’s investor servicing agreement with PSERV and its distributor’s contract and distribution plans with Putnam Retail Management Limited Partnership (“PRM”), both of which are affiliates of Putnam Management. The Trustees concluded that the fees payable by the funds to PSERV and PRM, as applicable, for such services are fair and reasonable in relation to the nature and quality of such services, the fees paid by competitive funds and the costs incurred by PSERV and PRM, as applicable, in providing such services. Furthermore, the Trustees were of the view that the investor services provided by PSERV were required for the operation of the funds, and that they were of a quality at least equal to those provided by other providers.
Audited financial statements
These sections of the report, as well as the accompanying Notes, preceded by the Report of Independent Registered Public Accounting Firm, constitute the fund’s audited financial statements.
The fund’s portfolio lists all the fund’s investments and their values as of the last day of the reporting period. Holdings are organized by asset type and industry sector, country, or state to show areas of concentration and diversification.
Statement of assets and liabilities shows how the fund’s net assets and share price are determined. All investment and non-investment assets are added together. Any unpaid expenses and other liabilities are subtracted from this total. The result is divided by the number of shares to determine the net asset value per share, which is calculated separately for each class of shares. (For funds with preferred shares, the amount subtracted from total assets includes the liquidation preference of preferred shares.)
Statement of operations shows the fund’s net investment gain or loss. This is done by first adding up all the fund’s earnings — from dividends and interest income — and subtracting its operating expenses to determine net investment income (or loss). Then, any net gain or loss the fund realized on the sales of its holdings — as well as any unrealized gains or losses over the period — is added to or subtracted from the net investment result to determine the fund’s net gain or loss for the fiscal period.
Statement of changes in net assets shows how the fund’s net assets were affected by the fund’s net investment gain or loss, by distributions to shareholders, and by changes in the number of the fund’s shares. It lists distributions and their sources (net investment income or realized capital gains) over the current reporting period and the most recent fiscal year-end. The distributions listed here may not match the sources listed in the Statement of operations because the distributions are determined on a tax basis and may be paid in a different period from the one in which they were earned.
Financial highlights provide an overview of the fund’s investment results, per-share distributions, expense ratios, net investment income ratios, and portfolio turnover in one summary table, reflecting the five most recent reporting periods. In a semiannual report, the highlights table also includes the current reporting period.
Report of Independent Registered Public Accounting Firm
To the Board of Trustees and Shareholders of
Putnam Global Income Trust:
Opinion on the Financial Statements
We have audited the accompanying statement of assets and liabilities, including the fund’s portfolio, of Putnam Global Income Trust (the “Fund”) as of October 31, 2022, the related statement of operations for the year ended October 31, 2022, the statement of changes in net assets for each of the two years in the period ended October 31, 2022, including the related notes, and the financial highlights for each of the five years in the period ended October 31, 2022 (collectively referred to as the “financial statements”). In our opinion, the financial statements present fairly, in all material respects, the financial position of the Fund as of October 31, 2022, the results of its operations for the year then ended, the changes in its net assets for each of the two years in the period ended October 31, 2022 and the financial highlights for each of the five years in the period ended October 31, 2022 in conformity with accounting principles generally accepted in the United States of America.
Basis for Opinion
These financial statements are the responsibility of the Fund’s management. Our responsibility is to express an opinion on the Fund’s financial statements based on our audits. We are a public accounting firm registered with the Public Company Accounting Oversight Board (United States) (“PCAOB”) and are required to be independent with respect to the Fund in accordance with the U.S. federal securities laws and the applicable rules and regulations of the Securities and Exchange Commission and the PCAOB.
We conducted our audits of these financial statements in accordance with the standards of the PCAOB. Those standards require that we plan and perform the audit to obtain reasonable assurance about whether the financial statements are free of material misstatement, whether due to error or fraud.
Our audits included performing procedures to assess the risks of material misstatement of the financial statements, whether due to error or fraud, and performing procedures that respond to those risks. Such procedures included examining, on a test basis, evidence regarding the amounts and disclosures in the financial statements. Our audits also included evaluating the accounting principles used and significant estimates made by management, as well as evaluating the overall presentation of the financial statements. Our procedures included confirmation of securities owned as of October 31, 2022 by correspondence with the custodian, transfer agent and brokers; when replies were not received from brokers, we performed other auditing procedures. We believe that our audits provide a reasonable basis for our opinion.
PricewaterhouseCoopers LLP
Boston, Massachusetts
December 7, 2022
We have served as the auditor of one or more investment companies in the Putnam Investments family of funds since at least 1957. We have not been able to determine the specific year we began serving as auditor.
| | |
| The fund’s portfolio 10/31/22 | | |
|
| | |
U.S. GOVERNMENT AND AGENCY
MORTGAGE OBLIGATIONS (99.7%)* | Principal
amount | Value |
| U.S. Government Guaranteed Mortgage Obligations (9.3%) | | |
| Government National Mortgage Association Pass-Through Certificates | | |
| 4.50%, TBA, 11/1/52 | $5,000,000 | $4,736,404 |
| 4.00%, TBA, 11/1/52 | 4,000,000 | 3,684,122 |
| 3.50%, TBA, 11/1/52 | 1,000,000 | 894,703 |
| 3.00%, TBA, 11/1/52 | 5,000,000 | 4,345,778 |
| | 13,661,007 |
| U.S. Government Agency Mortgage Obligations (90.4%) | | |
| Uniform Mortgage-Backed Securities | | |
| 5.50%, TBA, 12/1/52 | 15,000,000 | 14,765,964 |
| 5.50%, TBA, 11/1/52 | 15,000,000 | 14,790,575 |
| 5.00%, TBA, 12/1/52 | 31,000,000 | 29,844,773 |
| 5.00%, TBA, 11/1/52 | 49,000,000 | 47,227,592 |
| 4.50%, TBA, 11/1/52 | 16,000,000 | 15,003,742 |
| 4.00%, TBA, 12/1/52 | 2,000,000 | 1,817,890 |
| 4.00%, TBA, 11/1/52 | 2,000,000 | 1,819,062 |
| 3.50%, TBA, 11/1/52 | 4,000,000 | 3,517,498 |
| 2.50%, TBA, 11/1/52 | 3,000,000 | 2,456,017 |
| 2.00%, TBA, 11/1/52 | 3,000,000 | 2,362,874 |
| | 133,605,987 |
| Total U.S. government and agency mortgage obligations (cost $149,430,528) | $147,266,994 |
|
| | |
| U.S. TREASURY OBLIGATIONS (0.8%)* | Principal
amount | Value |
| U.S. Treasury Inflation Index Notes 0.125%, 10/15/24 i | $80,809 | $90,592 |
| U.S. Treasury Notes | | |
| 1.75%, 5/15/23 i | 416,000 | 413,276 |
| 1.625%, 8/15/29 i | 862,000 | 737,648 |
| Total U.S. treasury obligations (cost $1,241,516) | $1,241,516 |
|
| | | |
FOREIGN GOVERNMENT AND AGENCY
BONDS AND NOTES (30.5%)* | Principal
amount | Value |
| Australia (Government of) sr. unsec. bonds 3.00%, 3/21/47 (Australia) | AUD | 120,000 | $63,534 |
| Australia (Government of) sr. unsec. bonds Ser. 144, 3.75%, 4/21/37 (Australia) | AUD | 350,000 | 217,978 |
| Australia (Government of) sr. unsec. bonds Ser. 149, 2.25%, 5/21/28 (Australia) | AUD | 1,060,000 | 635,842 |
| Australia (Government of) sr. unsec. notes 3.25%, 4/21/25 (Australia) | AUD | 630,000 | 402,996 |
| Austria (Republic of) sr. unsec. bonds 1.50%, 2/20/47 (Austria) | EUR | 290,000 | 214,380 |
| Austria (Republic of) sr. unsec. notes 0.50%, 4/20/27 (Austria) | EUR | 570,000 | 516,774 |
| Belgium (Kingdom of) sr. unsec. bonds Ser. 77, 1.00%, 6/22/26 (Belgium) | EUR | 560,000 | 531,338 |
| Belgium (Kingdom of) unsec. bonds Ser. 60, 4.25%, 3/28/41 (Belgium) | EUR | 440,000 | 496,750 |
| Canada (Government of) sr. unsec. bonds 3.50%, 12/1/45 (Canada) | CAD | 80,000 | 59,465 |
| Canada (Government of) unsec. notes 1.50%, 6/1/26 (Canada) | CAD | 90,000 | 61,477 |
| China (Republic of) unsec. notes Ser. 1913, 2.94%, 10/17/24 (China) | CNY | 6,000,000 | 837,059 |
| | | |
FOREIGN GOVERNMENT AND AGENCY
BONDS AND NOTES (30.5%)* cont. | Principal
amount | Value |
| Colombia (Republic of) sr. unsec. notes 3.875%, 4/25/27 (Colombia) | | $460,000 | $387,086 |
| Cote d’lvoire (Republic of) sr. unsec. unsub. bonds Ser. REGS, 6.125%, 6/15/33 (Cote d’lvoire) | | 335,000 | 261,719 |
| Cote d’lvoire (Republic of) sr. unsec. unsub. bonds Ser. REGS, 5.25%, 3/22/30 (Cote d’lvoire) | EUR | 100,000 | 75,422 |
| Cote d’lvoire (Republic of) sr. unsec. unsub. notes Ser. REGS, 5.375%, 7/23/24 (Cote d’lvoire) | | $300,000 | 275,625 |
| Denmark (Kingdom of) unsec. bonds 4.50%, 11/15/39 (Denmark) | DKK | 750,000 | 123,786 |
| Denmark (Kingdom of) unsec. bonds 1.75%, 11/15/25 (Denmark) | DKK | 1,470,000 | 192,337 |
| Dominican (Republic of) sr. unsec. bonds Ser. REGS, 4.875%, 9/23/32 (Dominican Republic) | | $218,000 | 167,979 |
| Dominican (Republic of) sr. unsec. unsub. notes Ser. REGS, 8.625%, 4/20/27 (Dominican Republic) | | 100,000 | 101,750 |
| Dominican (Republic of) sr. unsec. unsub. notes Ser. REGS, 6.875%, 1/29/26 (Dominican Republic) | | 255,000 | 249,937 |
| Dominican (Republic of) sr. unsec. unsub. notes Ser. REGS, 5.95%, 1/25/27 (Dominican Republic) | | 241,000 | 225,093 |
| Finland (Government of) sr. unsec. bonds Ser. REGS, 1.125%, 4/15/34 (Finland) | EUR | 260,000 | 212,768 |
| France (Government of) unsec. bonds 4.50%, 4/25/41 (France) | EUR | 830,000 | 979,703 |
| France (Government of) unsec. bonds 4.00%, 4/25/55 (France) | EUR | 190,000 | 221,979 |
| France (Government of) unsec. bonds 3.25%, 5/25/45 (France) | EUR | 200,000 | 202,295 |
| France (Government of) unsec. bonds 2.75%, 10/25/27 (France) | EUR | 1,300,000 | 1,311,704 |
| France (Government of) unsec. bonds 0.50%, 5/25/25 (France) | EUR | 710,000 | 672,679 |
| France (Government of) unsec. notes zero %, 11/25/30 (France) | EUR | 330,000 | 267,844 |
| France (Government of) unsec. notes Ser. REGS, 0.50%, 5/25/29 (France) | EUR | 470,000 | 412,688 |
| Indonesia (Republic of) sr. unsec. unsub. bonds 2.85%, 2/14/30 (Indonesia) | | $200,000 | 169,505 |
| Indonesia (Republic of) sr. unsec. unsub. notes 3.85%, 10/15/30 (Indonesia) | | 710,000 | 635,463 |
| Indonesia (Republic of) 144A sr. unsec. unsub. notes 3.375%, 4/15/23 (Indonesia) | | 1,235,000 | 1,225,740 |
| Ireland (Republic of) unsec. bonds 2.00%, 2/18/45 (Ireland) | EUR | 90,000 | 73,778 |
| Ireland (Republic of) unsec. notes 0.20%, 5/15/27 (Ireland) | EUR | 410,000 | 370,296 |
| Italy (Republic of) sr. unsec. bonds 6.50%, 11/1/27 (Italy) | EUR | 850,000 | 957,337 |
| Italy (Republic of) sr. unsec. bonds 4.75%, 9/1/44 (Italy) | EUR | 630,000 | 647,439 |
| Italy (Republic of) sr. unsec. bonds 4.00%, 2/1/37 (Italy) | EUR | 190,000 | 180,931 |
| Italy (Republic of) sr. unsec. bonds 2.50%, 12/1/24 (Italy) | EUR | 920,000 | 902,244 |
| Italy (Republic of) sr. unsec. bonds 1.70%, 9/1/51 (Italy) | EUR | 80,000 | 46,074 |
| Italy (Republic of) sr. unsec. bonds 1.65%, 3/1/32 (Italy) | EUR | 1,150,000 | 921,930 |
| Italy (Republic of) sr. unsec. notes zero %, 1/15/24 (Italy) | EUR | 360,000 | 344,851 |
| Japan (Government of) sr. unsec. bonds Ser. 95, 2.30%, 6/20/27 (Japan) | JPY | 60,000,000 | 445,597 |
| Japan (Government of) sr. unsec. unsub. bonds 0.80%, 3/20/47 (Japan) | JPY | 93,000,000 | 567,782 |
| Japan (Government of) sr. unsec. unsub. bonds 0.50%, 3/20/60 (Japan) | JPY | 18,000,000 | 88,090 |
| Japan (Government of) sr. unsec. unsub. bonds Ser. 32, 2.30%, 3/20/40 (Japan) | JPY | 260,000,000 | 2,132,107 |
| | | |
FOREIGN GOVERNMENT AND AGENCY
BONDS AND NOTES (30.5%)* cont. | Principal
amount | Value |
| Japan (Government of) sr. unsec. unsub. bonds Ser. 125, 2.20%, 3/20/31 (Japan) | JPY | 105,000,000 | $820,263 |
| Japan (Government of) sr. unsec. unsub. bonds Ser. 156, 0.40%, 3/20/36 (Japan) | JPY | 239,000,000 | 1,563,116 |
| Japan (Government of) sr. unsec. unsub. notes Ser. 346, 0.10%, 3/20/27 (Japan) | JPY | 645,000,000 | 4,350,925 |
| Japan (Government of) 30 yr sr. unsec. unsub. bonds Ser. 51, 0.30%, 6/20/46 (Japan) | JPY | 47,000,000 | 257,273 |
| Japan (Government of) 40 yr sr. unsec. unsub. bonds Ser. 4, 2.20%, 3/20/51 (Japan) | JPY | 184,000,000 | 1,478,521 |
| Kazakhstan (Republic of) sr. unsec. unsub. bonds Ser. REGS, 4.875%, 10/14/44 (Kazakhstan) | | $670,000 | 513,408 |
| Kazakhstan (Republic of) sr. unsec. unsub. notes Ser. REGS, 5.125%, 7/21/25 (Kazakhstan) | | 390,000 | 398,288 |
| Malaysia (Government of) sr. unsec. notes 3.885%, 8/15/29 (Malaysia) | MYR | 2,650,000 | 541,602 |
| Mexico (Government of) sr. unsec. notes 7.50%, 6/3/27 (Mexico) | MXN | 12,510,000 | 597,472 |
| Netherlands (Government of) unsec. bonds 3.75%, 1/15/42 (Netherlands) | EUR | 280,000 | 324,581 |
| Netherlands (Government of) unsec. notes 0.25%, 7/15/29 (Netherlands) | EUR | 110,000 | 95,195 |
| Netherlands (Government of) unsec. notes Ser. REGS, 0.50%, 7/15/26 (Netherlands) | EUR | 430,000 | 401,278 |
| New Zealand (Government of) sr. unsec. notes 3.00%, 4/20/29 (New Zealand) | NZD | 380,000 | 206,059 |
| Norway (Kingdom of) sr. unsec. notes 1.75%, 2/17/27 (Norway) | NOK | 1,880,000 | 168,087 |
| Ontario (Province of) unsec. bonds 6.50%, 3/8/29 (Canada) | CAD | 850,000 | 711,726 |
| Ontario (Province of) unsec. bonds 2.90%, 12/2/46 (Canada) | CAD | 410,000 | 233,345 |
| Ontario (Province of) unsec. notes 2.60%, 6/2/25 (Canada) | CAD | 1,560,000 | 1,104,899 |
| Paraguay (Republic of) sr. unsec. notes Ser. REGS, 4.95%, 4/28/31 (Paraguay) | | $370,000 | 340,400 |
| Paraguay (Republic of) sr. unsec. unsub. notes Ser. REGS, 4.70%, 3/27/27 (Paraguay) | | 200,000 | 191,750 |
| Paraguay (Republic of) 144A sr. unsec. bonds 2.739%, 1/29/33 (Paraguay) | | 220,000 | 165,550 |
| Poland (Government of) unsec. notes 0.75%, 4/25/25 (Poland) | PLN | 1,850,000 | 320,004 |
| Portugal (Republic of) sr. unsec. notes 1.95%, 6/15/29 (Portugal) | EUR | 510,000 | 481,729 |
| Romania (Government of) 144A sr. unsec. bonds 3.00%, 2/14/31 (Romania) | | $540,000 | 398,866 |
| Senegal (Republic of) unsec. bonds Ser. REGS, 6.25%, 5/23/33 (Senegal) | | 225,000 | 168,750 |
| Spain (Kingdom of) sr. unsec. bonds 5.15%, 10/31/44 (Spain) | EUR | 350,000 | 426,645 |
| Spain (Kingdom of) sr. unsec. bonds 5.15%, 10/31/28 (Spain) | EUR | 640,000 | 713,064 |
| Spain (Kingdom of) sr. unsec. bonds 4.20%, 1/31/37 (Spain) | EUR | 150,000 | 161,032 |
| Spain (Kingdom of) sr. unsec. bonds 1.00%, 10/31/50 (Spain) | EUR | 20,000 | 10,708 |
| Spain (Kingdom of) sr. unsec. notes 1.60%, 4/30/25 (Spain) | EUR | 560,000 | 544,194 |
| Spain (Kingdom of) sr. unsec. notes 1.50%, 4/30/27 (Spain) | EUR | 430,000 | 405,587 |
| Spain (Kingdom of) sr. unsec. notes 1.25%, 10/31/30 (Spain) | EUR | 200,000 | 173,649 |
| Spain (Kingdom of) sr. unsec. unsub. bonds 2.90%, 10/31/46 (Spain) | EUR | 170,000 | 149,499 |
| Sweden (Government of) notes 1.00%, 11/12/26 (Sweden) | SEK | 6,110,000 | 524,053 |
| | | |
FOREIGN GOVERNMENT AND AGENCY
BONDS AND NOTES (30.5%)* cont. | Principal
amount | Value |
| Sweden (Government of) unsec. bonds Ser. 1053, 3.50%, 3/30/39 (Sweden) | SEK | 140,000 | $15,087 |
| Switzerland (Government of) unsec. bonds 4.00%, 4/8/28 (Switzerland) | CHF | 500,000 | 579,682 |
| Switzerland (Government of) unsec. bonds 1.50%, 4/30/42 (Switzerland) | CHF | 170,000 | 179,923 |
| Thailand (Government of) sr. unsec. bonds 2.00%, 12/17/31 (Thailand) | THB | 19,600,000 | 470,868 |
| United Kingdom Treasury unsec. bonds 3.50%, 7/22/68 (United Kingdom) | GBP | 120,000 | 141,428 |
| United Kingdom Treasury unsec. notes 4.00%, 1/22/60 (United Kingdom) | GBP | 880,000 | 1,124,029 |
| United Kingdom Treasury unsec. notes Ser. REGS, 2.00%, 9/7/25 (United Kingdom) | GBP | 1,330,000 | 1,470,792 |
| United Mexican States sr. unsec. bonds 2.659%, 5/24/31 (Mexico) | | $964,000 | 746,272 |
| Uruguay (Oriental Republic of) sr. unsec. unsub. bonds 4.375%, 1/23/31 (Uruguay) | | 1,170,000 | 1,113,169 |
| Uruguay (Oriental Republic of) sr. unsec. unsub. notes 4.375%, 10/27/27 (Uruguay) | | 225,000 | 221,956 |
| Total foreign government and agency bonds and notes (cost $56,677,787) | $45,093,875 |
|
| | | |
| MORTGAGE-BACKED SECURITIES (29.8%)* | Principal
amount | Value |
| Agency collateralized mortgage obligations (5.7%) |
| Federal Home Loan Mortgage Corporation | | | |
| REMICs Ser. 4972, IO, 6.00%, 5/25/50 | | $2,697,104 | $589,275 |
| REMICs Ser. 5160, Class IA, IO, 4.00%, 11/25/51 | | 4,547,351 | 883,837 |
| REMICs Ser. 4973, Class LI, IO, 4.00%, 4/25/50 | | 4,271,606 | 834,136 |
| REMICs Ser. 4355, Class DI, IO, 4.00%, 3/15/44 | | 55,688 | 1,188 |
| REMICs Ser. 4193, Class PI, IO, 4.00%, 3/15/43 | | 363,954 | 51,558 |
| REMICs Ser. 5077, Class GI, IO, 3.50%, 2/25/51 | | 3,913,041 | 704,818 |
| REMICs IFB Ser. 4076, Class MS, IO, ((-1 x ICE LIBOR USD 1 Month) + 6.70%), 3.288%, 7/15/40 | | 63,709 | 509 |
| REMICs Ser. 4141, Class PI, IO, 3.00%, 12/15/42 | | 782,621 | 98,361 |
| REMICs Ser. 4165, Class TI, IO, 3.00%, 12/15/42 | | 1,565,214 | 123,541 |
| REMICs IFB Ser. 4979, Class SN, IO, ((-1 x ICE LIBOR USD 1 Month) + 6.05%), 2.464%, 6/25/50 | | 1,079,761 | 119,231 |
| Federal National Mortgage Association | | | |
| REMICs Ser. 15-28, IO, 5.50%, 5/25/45 | | 824,430 | 153,261 |
| REMICs Ser. 17-113, IO, 5.00%, 1/25/38 | | 409,764 | 41,134 |
| REMICs IFB Ser. 12-116, Class SA, IO, ((-1 x ICE LIBOR USD 1 Month) + 7.20%), 3.614%, 10/25/42 | | 535,603 | 67,482 |
| REMICs Ser. 13-55, Class IK, IO, 3.00%, 4/25/43 | | 330,739 | 42,218 |
| REMICs Ser. 13-55, Class PI, IO, 3.00%, 5/25/42 | | 363,836 | 16,040 |
| REMICs Ser. 13-23, Class PI, IO, 3.00%, 10/25/41 | | 92,520 | 277 |
| REMICs Ser. 14-28, Class AI, IO, 3.00%, 3/25/40 | | 249,968 | 4,923 |
| REMICs IFB Ser. 19-42, Class SA, IO, ((-1 x ICE LIBOR USD 1 Month) + 6.05%), 2.464%, 8/25/49 | | 3,318,155 | 330,591 |
| Government National Mortgage Association | | | |
| Ser. 16-75, Class LI, IO, 6.00%, 1/20/40 | | 565,183 | 99,116 |
| Ser. 18-21, Class IN, IO, 5.00%, 2/20/48 | | 219,033 | 45,806 |
| | | |
| MORTGAGE-BACKED SECURITIES (29.8%)* cont. | Principal
amount | Value |
| Agency collateralized mortgage obligations cont. |
| Government National Mortgage Association | | | |
| Ser. 14-76, IO, 5.00%, 5/20/44 | | $240,394 | $48,718 |
| Ser. 10-35, Class UI, IO, 5.00%, 3/20/40 | | 78,579 | 16,135 |
| Ser. 10-9, Class UI, IO, 5.00%, 1/20/40 | | 164,554 | 35,206 |
| Ser. 09-121, Class UI, IO, 5.00%, 12/20/39 | | 52,207 | 10,833 |
| Ser. 21-122, Class GI, IO, 4.50%, 11/20/47 | | 6,608,450 | 1,202,119 |
| Ser. 18-153, Class AI, IO, 4.50%, 9/16/45 | | 3,977,554 | 736,166 |
| Ser. 10-35, Class AI, IO, 4.50%, 3/20/40 | | 359,498 | 65,232 |
| Ser. 10-35, Class QI, IO, 4.50%, 3/20/40 | | 254,646 | 48,601 |
| Ser. 16-138, Class GI, IO, 4.00%, 10/20/46 | | 2,323,129 | 404,282 |
| Ser. 13-24, Class PI, IO, 4.00%, 11/20/42 | | 129,804 | 16,871 |
| Ser. 21-117, Class MI, IO, 3.50%, 5/20/42 | | 3,858,413 | 575,289 |
| Ser. 14-102, Class IG, IO, 3.50%, 3/16/41 | | 247,154 | 13,166 |
| IFB Ser. 10-171, Class SB, IO, ((-1 x ICE LIBOR USD 1 Month) + 6.45%), 3.038%, 12/16/40 | | 399,213 | 28,835 |
| IFB Ser. 16-77, Class SL, IO, ((-1 x ICE LIBOR USD 1 Month) + 6.15%), 2.661%, 3/20/43 | | 320,995 | 5,457 |
| IFB Ser. 20-32, Class GS, IO, ((-1 x ICE LIBOR USD 1 Month) + 6.10%), 2.611%, 3/20/50 | | 678,221 | 67,105 |
| Ser. 17-H02, Class BI, IO, 2.451%, 1/20/67 W | | 2,215,453 | 69,122 |
| Ser. 17-H04, Class BI, IO, 2.363%, 2/20/67 W | | 1,925,234 | 79,641 |
| Ser. 17-H19, Class MI, IO, 2.068%, 4/20/67 W | | 1,158,330 | 69,036 |
| Ser. 15-H26, Class EI, IO, 1.75%, 10/20/65 W | | 1,668,731 | 71,255 |
| Ser. 16-H16, Class EI, IO, 1.639%, 6/20/66 W | | 2,143,724 | 91,966 |
| Ser. 15-H25, Class AI, IO, 1.616%, 9/20/65 W | | 1,892,436 | 69,452 |
| Ser. 14-H12, Class BI, IO, 1.591%, 5/20/64 W | | 2,197,911 | 88,044 |
| Ser. 16-H23, Class NI, IO, 1.506%, 10/20/66 W | | 2,626,120 | 83,511 |
| Ser. 14-H21, Class AI, IO, 0.423%, 10/20/64 W | | 1,789,091 | 52,753 |
| Ser. 16-H13, Class EI, IO, 0.375%, 4/20/66 W | | 1,494,849 | 63,712 |
| Ser. 15-H26, Class DI, IO, 0.244%, 10/20/65 W | | 1,702,117 | 58,806 |
| Ser. 15-H03, Class DI, IO, 0.041%, 1/20/65 W | | 2,979,431 | 95,342 |
| Ser. 16-H01, Class AI, IO, 0.014%, 1/20/66 W | | 1,295,819 | 33,954 |
| Ser. 15-H09, Class AI, IO, 0.013%, 4/20/65 W | | 3,306,480 | 78,393 |
| | | 8,486,304 |
| Commercial mortgage-backed securities (13.8%) |
| BANK | | | |
| FRB Ser. 20-BN30, Class XA, IO, 1.319%, 12/15/53 W | | 4,908,598 | 347,281 |
| FRB Ser. 19-BN20, Class XA, IO, 0.814%, 9/15/62 W | | 9,073,079 | 381,396 |
| Barclays Commercial Mortgage Trust | | | |
| Ser. 19-C3, Class B, 4.096%, 5/15/52 | | 201,000 | 174,205 |
| FRB Ser. 20-C8, Class XA, IO, 1.841%, 10/15/53 W | | 4,690,718 | 454,870 |
| CFCRE Commercial Mortgage Trust FRB Ser. 17-C8, Class B, 4.199%, 6/15/50 W | | 210,000 | 185,985 |
| CFCRE Commercial Mortgage Trust 144A FRB Ser. 11-C2, Class E, 5.08%, 12/15/47 W | | 1,053,000 | 884,520 |
| Citigroup Commercial Mortgage Trust FRB Ser. 13-GC17, Class C, 5.101%, 11/10/46 W | | 256,000 | 241,859 |
| Citigroup Commercial Mortgage Trust 144A | | | |
| FRB Ser. 14-GC19, Class D, 5.088%, 3/10/47 W | | 268,000 | 256,286 |
| FRB Ser. 06-C5, Class XC, IO, 0.345%, 10/15/49 W | | 1,703,307 | 485 |
| | | |
| MORTGAGE-BACKED SECURITIES (29.8%)* cont. | Principal
amount | Value |
| Commercial mortgage-backed securities cont. |
| COMM Mortgage Trust | | | |
| FRB Ser. 13-CR11, Class B, 5.111%, 8/10/50 W | | $243,000 | $236,221 |
| FRB Ser. 13-CR13, Class C, 4.877%, 11/10/46 W | | 492,000 | 464,527 |
| FRB Ser. 14-CR17, Class C, 4.781%, 5/10/47 W | | 942,000 | 858,489 |
| FRB Ser. 14-CR18, Class C, 4.747%, 7/15/47 W | | 393,000 | 363,333 |
| FRB Ser. 14-UBS6, Class C, 4.439%, 12/10/47 W | | 110,000 | 100,604 |
| Ser. 14-CR21, Class B, 4.339%, 12/10/47 W | | 433,000 | 407,948 |
| FRB Ser. 15-LC19, Class C, 4.216%, 2/10/48 W | | 430,000 | 394,925 |
| FRB Ser. 14-UBS6, Class XA, IO, 0.85%, 12/10/47 W | | 7,532,468 | 96,996 |
| FRB Ser. 15-LC21, Class XA, IO, 0.656%, 7/10/48 W | | 9,603,702 | 130,785 |
| COMM Mortgage Trust 144A | | | |
| FRB Ser. 12-CR2, Class D, 4.905%, 8/15/45 W | | 400,000 | 370,600 |
| FRB Ser. 13-CR13, Class D, 4.877%, 11/10/46 W | | 280,000 | 245,974 |
| Credit Suisse Commercial Mortgage Trust 144A | | | |
| FRB Ser. 06-C4, Class AX, IO, 0.846%, 9/15/39 W | | 2,240 | 19 |
| FRB Ser. 07-C2, Class AX, IO, 0.014%, 1/15/49 W | | 645,540 | 6 |
| CSAIL Commercial Mortgage Trust FRB Ser. 15-C1, Class C, 4.259%, 4/15/50 W | | 819,000 | 706,196 |
| CSMC Trust FRB Ser. 16-NXSR, Class C, 4.448%, 12/15/49 W | | 822,000 | 614,415 |
| DBUBS Mortgage Trust 144A FRB Ser. 11-LC3A, Class D, 5.362%, 8/10/44 W | | 773,165 | 706,596 |
| Federal Home Loan Mortgage Corporation | | | |
| Multifamily Structured Pass-Through Certificates FRB Ser. K113, Class XAM, IO, 1.585%, 6/25/30 W | | 2,243,000 | 214,998 |
| Multifamily Structured Pass-Through Certificates FRB Ser. K098, Class X1, IO, 1.144%, 8/25/29 W | | 2,790,603 | 175,853 |
| GS Mortgage Securities Corp., II FRB Ser. 13-GC10, Class XA, IO, 1.395%, 2/10/46 W | | 2,122,924 | 182 |
| GS Mortgage Securities Trust FRB Ser. 15-GC30, Class C, 4.069%, 5/10/50 W | | 286,000 | 255,663 |
| GS Mortgage Securities Trust 144A | | | |
| FRB Ser. 10-C1, Class D, 6.355%, 8/10/43 W | | 328,000 | 243,589 |
| FRB Ser. 13-GC14, Class B, 4.719%, 8/10/46 W | | 296,000 | 286,327 |
| JPMBB Commercial Mortgage Securities Trust | | | |
| FRB Ser. 14-C22, Class C, 4.547%, 9/15/47 W | | 225,000 | 202,882 |
| FRB Ser. 13-C12, Class B, 4.087%, 7/15/45 W | | 285,000 | 280,036 |
| FRB Ser. 15-C33, Class XA, IO, 0.902%, 12/15/48 W | | 3,186,189 | 70,938 |
| FRB Ser. 14-C22, Class XA, IO, 0.802%, 9/15/47 W | | 8,569,317 | 90,825 |
| FRB Ser. 13-C12, Class XA, IO, 0.402%, 7/15/45 W | | 17,123,043 | 10,154 |
| JPMBB Commercial Mortgage Securities Trust 144A | | | |
| FRB Ser. 13-C17, Class D, 4.883%, 1/15/47 W | | 505,000 | 468,386 |
| FRB Ser. 14-C23, Class D, 3.982%, 9/15/47 W | | 437,000 | 375,089 |
| JPMorgan Chase Commercial Mortgage Securities Trust | | | |
| Ser. 13-LC11, Class AS, 3.216%, 4/15/46 | | 339,000 | 330,964 |
| FRB Ser. 19-COR5, Class XA, IO, 1.468%, 6/13/52 W | | 8,125,411 | 522,622 |
| FRB Ser. 06-CB17, Class X, IO, 0.93%, 12/12/43 W | | 256,841 | 4,951 |
| FRB Ser. 13-C16, Class XA, IO, 0.844%, 12/15/46 W | | 7,347,885 | 37,628 |
| JPMorgan Chase Commercial Mortgage Securities Trust 144A | | | |
| FRB Ser. 12-C6, Class E, 4.964%, 5/15/45 W | | 777,000 | 586,635 |
| FRB Ser. 21-1MEM, Class D, 2.654%, 10/9/42 W | | 915,000 | 596,499 |
| | | |
| MORTGAGE-BACKED SECURITIES (29.8%)* cont. | Principal
amount | Value |
| Commercial mortgage-backed securities cont. |
| LB-UBS Commercial Mortgage Trust 144A FRB Ser. 06-C6, Class XCL, IO, 0.435%, 9/15/39 W | | $686,987 | $82 |
| Mezz Cap Commercial Mortgage Trust 144A FRB Ser. 07-C5, Class X, IO, 6.571%, 12/15/49 W | | 1,175 | — |
| Morgan Stanley Bank of America Merrill Lynch Trust | | | |
| FRB Ser. 14-C14, Class C, 5.059%, 2/15/47 W | | 207,000 | 200,578 |
| FRB Ser. 14-C17, Class C, 4.48%, 8/15/47 W | | 591,000 | 550,560 |
| Ser. 14-C18, Class C, 4.473%, 10/15/47 W | | 310,000 | 287,035 |
| FRB Ser. 15-C24, Class B, 4.332%, 5/15/48 W | | 253,000 | 236,185 |
| Ser. 13-C8, Class B, 3.641%, 12/15/48 W | | 389,000 | 384,429 |
| Morgan Stanley Bank of America Merrill Lynch Trust 144A | | | |
| FRB Ser. 12-C6, Class D, 4.537%, 11/15/45 W | | 278,000 | 255,760 |
| FRB Ser. 13-C9, Class D, 4.104%, 5/15/46 W | | 274,000 | 245,573 |
| Morgan Stanley Capital I Trust 144A FRB Ser. 11-C3, Class D, 5.083%, 7/15/49 W | | 185,000 | 185,185 |
| Multifamily Connecticut Avenue Securities Trust 144A FRB Ser. 19-01, Class M10, 6.836%, 10/25/49 | | 672,849 | 619,841 |
| UBS Commercial Mortgage Trust FRB Ser. 17-C7, Class XA, IO, 1.033%, 12/15/50 W | | 4,364,098 | 155,944 |
| Wells Fargo Commercial Mortgage Trust | | | |
| Ser. 17-RC1, Class C, 4.591%, 1/15/60 | | 225,000 | 196,976 |
| FRB Ser. 15-C30, Class C, 4.498%, 9/15/58 W | | 432,000 | 394,967 |
| FRB Ser. 13-LC12, Class C, 4.296%, 7/15/46 W | | 363,000 | 332,054 |
| FRB Ser. 20-C57, Class C, 4.023%, 8/15/53 W | | 314,000 | 258,937 |
| Ser. 16-BNK1, Class AS, 2.814%, 8/15/49 | | 707,000 | 618,486 |
| FRB Ser. 19-C52, Class XA, IO, 1.604%, 8/15/52 W | | 3,441,102 | 256,190 |
| FRB Ser. 16-LC25, Class XA, IO, 0.83%, 12/15/59 W | | 4,137,233 | 110,890 |
| WF-RBS Commercial Mortgage Trust | | | |
| Ser. 14-C19, Class B, 4.723%, 3/15/47 W | | 930,000 | 878,231 |
| Ser. 14-C22, Class AS, 4.069%, 9/15/57 W | | 397,000 | 378,306 |
| FRB Ser. 13-C14, Class XA, IO, 0.651%, 6/15/46 W | | 9,876,414 | 16,760 |
| WF-RBS Commercial Mortgage Trust 144A | | | |
| Ser. 11-C4, Class E, 4.843%, 6/15/44 W | | 163,000 | 122,587 |
| FRB Ser. 11-C4, Class C, 4.843%, 6/15/44 W | | 122,240 | 112,597 |
| FRB Ser. 12-C10, Class D, 4.363%, 12/15/45 W | | 180,000 | 130,116 |
| FRB Ser. 12-C10, Class XA, IO, 1.341%, 12/15/45 W | | 839,975 | 816 |
| | | 20,307,827 |
| Residential mortgage-backed securities (non-agency) (10.3%) |
| Arroyo Mortgage Trust 144A Ser. 19-3, Class A3, 3.416%, 10/25/48 W | | 94,333 | 86,526 |
| BankUnited Trust FRB Ser. 05-1, Class 1A1, (ICE LIBOR USD 1 Month + 0.60%), 4.186%, 9/25/45 | | 104,668 | 97,220 |
| Bellemeade Re, Ltd. 144A FRB Ser. 19-4A, Class M1C, (ICE LIBOR USD 1 Month + 2.50%), 6.086%, 10/25/29 (Bermuda) | | 182,554 | 181,047 |
| BRAVO Residential Funding Trust 144A | | | |
| Ser. 21-A, Class A1, 1.991%, 10/25/59 | | 398,854 | 375,134 |
| Ser. 21-C, Class A1, 1.62%, 3/1/61 | | 287,463 | 243,422 |
Carrington Mortgage Loan Trust FRB Ser. 06-NC2, Class A4,
(ICE LIBOR USD 1 Month + 0.24%), 4.066%, 6/25/36 | | 171,035 | 163,183 |
| | | |
| MORTGAGE-BACKED SECURITIES (29.8%)* cont. | Principal
amount | Value |
| Residential mortgage-backed securities (non-agency) cont. |
| Chevy Chase Funding, LLC Mortgage-Backed Certificates 144A FRB Ser. 06-4A, Class A2, (ICE LIBOR USD 1 Month + 0.18%), 3.766%, 11/25/47 | | $188,432 | $162,638 |
| COLT Mortgage Loan Trust 144A Ser. 20-2, Class A2, 3.094%, 3/25/65 W | | 665,000 | 611,800 |
| Countrywide Alternative Loan Trust | | | |
| FRB Ser. 06-OA10, Class 4A1, (ICE LIBOR USD 1 Month + 0.38%), 3.966%, 8/25/46 | | 278,484 | 227,436 |
| FRB Ser. 06-OA19, Class A1, (ICE LIBOR USD 1 Month + 0.18%), 3.669%, 2/20/47 | | 159,295 | 119,654 |
| FRB Ser. 06-OA10, Class 1A1, (Federal Reserve US 12 Month Cumulative Avg 1 yr CMT + 0.96%), 2.331%, 8/25/46 | | 113,355 | 98,623 |
| FRB Ser. 06-OA7, Class 1A2, (Federal Reserve US 12 Month Cumulative Avg 1 yr CMT + 0.94%), 2.311%, 6/25/46 | | 245,097 | 200,979 |
| Eagle Re, Ltd. 144A FRB Ser. 18-1, Class M1, (ICE LIBOR USD 1 Month + 1.70%), 5.286%, 11/25/28 (Bermuda) | | 258,096 | 253,146 |
| Federal Home Loan Mortgage Corporation | | | |
| Structured Agency Credit Risk Debt FRN Ser. 16-HQA1, Class M3, (ICE LIBOR USD 1 Month + 6.35%), 9.936%, 9/25/28 | | 419,339 | 442,994 |
| Structured Agency Credit Risk Debt FRN Ser. 16-DNA3, Class M3, (ICE LIBOR USD 1 Month + 5.00%), 8.586%, 12/25/28 | | 471,031 | 491,558 |
| Structured Agency Credit Risk Debt FRN Ser. 15-DNA3, Class M3, (ICE LIBOR USD 1 Month + 4.70%), 8.286%, 4/25/28 | | 513,197 | 530,517 |
| Structured Agency Credit Risk Debt FRN Ser. 16-DNA4, Class M3, (ICE LIBOR USD 1 Month + 3.80%), 7.386%, 3/25/29 | | 134,462 | 137,516 |
| Structured Agency Credit Risk Debt FRN Ser. 17-HQA1, Class M2, (ICE LIBOR USD 1 Month + 3.55%), 7.136%, 8/25/29 | | 366,898 | 375,268 |
| Federal Home Loan Mortgage Corporation 144A | | | |
| Structured Agency Credit Risk Trust FRB Ser. 18-HRP2, Class M3, (ICE LIBOR USD 1 Month + 2.40%), 5.986%, 2/25/47 | | 121,044 | 116,947 |
| Structured Agency Credit Risk Debt FRN Ser. 22-DNA5, Class M1A, (US 30 Day Average SOFR + 2.95%), 5.947%, 6/25/42 | | 91,778 | 91,604 |
| Structured Agency Credit Risk Debt FRN Ser. 22-HQA2, Class M1A, (US 30 Day Average SOFR + 2.65%), 5.647%, 7/25/42 | | 229,466 | 227,745 |
| Structured Agency Credit Risk Trust REMICs FRB Ser. 20-HQA1, Class M2, (ICE LIBOR USD 1 Month + 1.90%), 5.486%, 1/25/50 | | 41,292 | 40,470 |
| Structured Agency Credit Risk Trust REMICs FRB Ser. 22-DNA1, Class M1B, (US 30 Day Average SOFR + 1.85%), 4.847%, 1/25/42 | | 212,000 | 190,331 |
| Structured Agency Credit Risk Trust FRB Ser. 18-HRP2, Class M3AS, (ICE LIBOR USD 1 Month + 1.00%), 4.586%, 2/25/47 | | 682,259 | 657,890 |
| Structured Agency Credit Risk Debt FRN Ser. 22-DNA2, Class M1A, (US 30 Day Average SOFR + 1.30%), 4.297%, 2/25/42 | | 210,095 | 204,679 |
| Seasoned Credit Risk Transfer Trust FRB Ser. 17-2, Class 2, 4.00%, 8/25/56 W | | 556,926 | 537,139 |
| Structured Agency Credit Risk Trust REMICs FRB Ser. 22-DNA1, Class M1A, (US 30 Day Average SOFR + 1.00%), 3.997%, 1/25/42 | | 52,166 | 50,278 |
| Structured Agency Credit Risk Trust REMICs FRB Ser. 21-HQA3, Class M1, (US 30 Day Average SOFR + 0.85%), 3.847%, 9/25/41 | | 14,492 | 13,717 |
| Structured Agency Credit Risk Trust REMICs FRB Ser. 21-DNA6, Class M1, (US 30 Day Average SOFR + 0.80%), 3.797%, 10/25/41 | | 261,000 | 255,161 |
| | | |
| MORTGAGE-BACKED SECURITIES (29.8%)* cont. | Principal
amount | Value |
| Residential mortgage-backed securities (non-agency) cont. |
| Federal National Mortgage Association | | | |
Connecticut Avenue Securities FRB Ser. 16-C01, Class 2M2,
(ICE LIBOR USD 1 Month + 6.95%), 10.536%, 8/25/28 | | $135,515 | $141,113 |
Connecticut Avenue Securities FRB Ser. 16-C01, Class 1M2,
(ICE LIBOR USD 1 Month + 6.75%), 10.336%, 8/25/28 | | 251,759 | 265,772 |
Connecticut Avenue Securities FRB Ser. 16-C02, Class 1M2,
(ICE LIBOR USD 1 Month + 6.00%), 9.586%, 9/25/28 | | 156,628 | 163,030 |
Connecticut Avenue Securities FRB Ser. 16-C03, Class 2M2,
(ICE LIBOR USD 1 Month + 5.90%), 9.486%, 10/25/28 | | 60,828 | 63,414 |
Connecticut Avenue Securities FRB Ser. 15-C04, Class 1M2,
(ICE LIBOR USD 1 Month + 5.70%), 9.286%, 4/25/28 | | 308,899 | 325,408 |
Connecticut Avenue Securities FRB Ser. 15-C04, Class 2M2,
(ICE LIBOR USD 1 Month + 5.55%), 9.136%, 4/25/28 | | 529,136 | 546,151 |
Connecticut Avenue Securities FRB Ser. 16-C03, Class 1M2,
(ICE LIBOR USD 1 Month + 5.30%), 8.886%, 10/25/28 | | 76,484 | 78,874 |
Connecticut Avenue Securities FRB Ser. 13-C01, Class M2,
(ICE LIBOR USD 1 Month + 5.25%), 8.836%, 10/25/23 | | 69,335 | 70,743 |
Connecticut Avenue Securities FRB Ser. 14-C04, Class 2M2,
(ICE LIBOR USD 1 Month + 5.00%), 8.586%, 11/25/24 | | 8,947 | 9,050 |
Connecticut Avenue Securities FRB Ser. 15-C01, Class 1M2,
(ICE LIBOR USD 1 Month + 4.30%), 7.886%, 2/25/25 | | 52,814 | 53,870 |
Connecticut Avenue Securities FRB Ser. 15-C02, Class 1M2,
(ICE LIBOR USD 1 Month + 4.00%), 7.586%, 5/25/25 | | 27,016 | 27,274 |
Connecticut Avenue Securities FRB Ser. 17-C02, Class 2M2C,
(ICE LIBOR USD 1 Month + 3.65%), 7.236%, 9/25/29 | | 72,000 | 73,734 |
Connecticut Avenue Securities FRB Ser. 14-C03, Class 1M2,
(ICE LIBOR USD 1 Month + 3.00%), 6.586%, 7/25/24 | | 3,151 | 3,166 |
Connecticut Avenue Securities FRB Ser. 14-C03, Class 2M2,
(ICE LIBOR USD 1 Month + 2.90%), 6.486%, 7/25/24 | | 296,412 | 296,783 |
Connecticut Avenue Securities FRB Ser. 17-C02, Class 2ED3,
(ICE LIBOR USD 1 Month + 1.35%), 4.936%, 9/25/29 | | 132,116 | 130,354 |
Connecticut Avenue Securities FRB Ser. 17-C01, Class 1EB1,
(ICE LIBOR USD 1 Month + 1.25%), 4.836%, 7/25/29 | | 66,793 | 66,193 |
Connecticut Avenue Securities FRB Ser. 17-C07, Class 1EB2,
(ICE LIBOR USD 1 Month + 1.00%), 4.586%, 5/25/30 | | 314,789 | 310,388 |
Connecticut Avenue Securities FRB Ser. 18-C05, Class 1ED1,
(ICE LIBOR USD 1 Month + 0.65%), 4.236%, 1/25/31 | | 9,271 | 9,081 |
Connecticut Avenue Securities FRB Ser. 17-C04, Class 2ED1,
(ICE LIBOR USD 1 Month + 0.60%), 4.186%, 11/25/29 | | 9,012 | 8,796 |
| Federal National Mortgage Association 144A | | | |
| Connecticut Avenue Securities Trust FRB Ser. 19-R01, Class 2M2, (ICE LIBOR USD 1 Month + 2.45%), 6.036%, 7/25/31 | | 8,187 | 8,153 |
| Connecticut Avenue Securities Trust FRB Ser. 22-R02, Class 2M2, (US 30 Day Average SOFR + 3.00%), 5.997%, 1/25/42 | | 427,000 | 381,098 |
| Connecticut Avenue Securities Trust FRB Ser. 19-HRP1, Class M2, (ICE LIBOR USD 1 Month + 2.15%), 5.736%, 11/25/39 | | 38,903 | 37,066 |
| Connecticut Avenue Securities Trust FRB Ser. 20-R01, Class 1M2, (ICE LIBOR USD 1 Month + 2.05%), 5.636%, 1/25/40 | | 530,809 | 522,211 |
| Connecticut Avenue Securities Trust FRB Ser. 22-R09, Class 2M1, (US 30 Day Average SOFR + 2.50%), 5.525%, 9/25/42 | | 137,624 | 136,728 |
| Connecticut Avenue Securities Trust FRB Ser. 22-R02, Class 2M1, (US 30 Day Average SOFR + 1.10%), 4.197%, 1/25/42 | | 106,542 | 103,479 |
| | | |
| MORTGAGE-BACKED SECURITIES (29.8%)* cont. | Principal
amount | Value |
| Residential mortgage-backed securities (non-agency) cont. |
| Federal National Mortgage Association 144A | | | |
| Connecticut Avenue Securities Trust FRB Ser. 22-R01, Class 1M1, (US 30 Day Average SOFR + 1.00%), 3.997%, 12/25/41 | | $119,587 | $115,925 |
| Connecticut Avenue Securities Trust FRB Ser. 21-R01, Class 1M1, (US 30 Day Average SOFR + 0.75%), 3.747%, 10/25/41 | | 4,069 | 4,026 |
| GSAA Home Equity Trust Ser. 06-15, Class AF3A, 5.882%, 9/25/36 W | | 932,013 | 328,638 |
JP Morgan Alternative Loan Trust FRB Ser. 07-S1, Class A1,
(ICE LIBOR USD 1 Month + 0.28%), 4.146%, 4/25/47 | | 162,224 | 152,976 |
| Legacy Mortgage Asset Trust 144A | | | |
| Ser. 20-GS5, Class A1, 3.25%, 6/25/60 | | 219,138 | 210,752 |
| Ser. 21-GS3, Class A1, 1.75%, 7/25/61 | | 273,194 | 247,567 |
| LHOME Mortgage Trust 144A Ser. 21-RTL2, Class A1, 2.09%, 6/25/26 | | 365,000 | 342,195 |
| Morgan Stanley Resecuritization Trust 144A Ser. 15-R4, Class CB1, 3.196%, 8/26/47 W | | 121,124 | 117,243 |
| New Residential Mortgage Loan Trust 144A FRB Ser. 18-4A, Class A1M, (ICE LIBOR USD 1 Month + 0.90%), 4.486%, 1/25/48 | | 54,973 | 53,438 |
| New York Mortgage Trust 144A Ser. 21-BPL1, Class A1, 2.239%, 5/25/26 | | 300,000 | 280,974 |
NovaStar Mortgage Funding Trust FRB Ser. 06-5, Class A2C,
(ICE LIBOR USD 1 Month + 0.34%), 3.926%, 11/25/36 | | 1,052,553 | 326,609 |
Renaissance Home Equity Loan Trust FRB Ser. 03-4, Class A1,
(ICE LIBOR USD 1 Month + 1.04%), 4.626%, 3/25/34 | | 147,730 | 134,801 |
| Structured Asset Mortgage Investments II Trust FRB Ser. 07-AR7, Class 1A1, (ICE LIBOR USD 1 Month + 0.85%), 4.436%, 5/25/47 | | 299,293 | 235,418 |
| Toorak Mortgage Corp., Ltd. 144A | | | |
| Ser. 20-1, Class A1, 2.734%, 3/25/23 W | | 191,325 | 188,745 |
| Ser. 21-1, Class A1, 2.24%, 6/25/24 | | 120,000 | 114,309 |
| Vista Point Securitization Trust 144A FRB Ser. 20-2, Class A2, 1.986%, 4/25/65 W | | 78,257 | 63,441 |
| WaMu Mortgage Pass-Through Certificates Trust | | | |
| FRB Ser. 05-AR13, Class A1C3, (ICE LIBOR USD 1 Month + 0.98%), 4.566%, 10/25/45 | | 119,617 | 111,056 |
| FRB Ser. 05-AR9, Class A1C3, (ICE LIBOR USD 1 Month + 0.96%), 4.546%, 7/25/45 | | 204,755 | 182,683 |
| FRB Ser. 05-AR1, Class A1B, (ICE LIBOR USD 1 Month + 0.78%), 4.366%, 1/25/45 | | 118,872 | 107,630 |
| FRB Ser. 05-AR2, Class 2A1B, (ICE LIBOR USD 1 Month + 0.74%), 4.326%, 1/25/45 | | 135,731 | 128,266 |
| FRB Ser. 05-AR10, Class 1A3, 3.835%, 9/25/35 W | | 94,813 | 82,859 |
| FRB Ser. 05-AR12, Class 1A8, 3.814%, 10/25/35 W | | 270,507 | 236,699 |
| Washington Mutual Asset-Backed Certificates Trust FRB Ser. 06-HE2, Class A3, (ICE LIBOR USD 1 Month + 0.30%), 3.886%, 5/25/36 | | 540,647 | 425,272 |
| | | 15,208,073 |
| Total mortgage-backed securities (cost $48,629,872) | $44,002,204 |
|
| | | |
| CORPORATE BONDS AND NOTES (21.3%)* | Principal
amount | Value |
| Basic materials (1.5%) |
| Cabot Corp. sr. unsec. bonds 5.00%, 6/30/32 | | $275,000 | $245,479 |
| Celanese US Holdings, LLC company guaranty sr. unsec. notes 6.165%, 7/15/27 (Germany) | | 450,000 | 424,570 |
| Glencore Finance Canada, Ltd. 144A company guaranty sr. unsec. unsub. notes 6.00%, 11/15/41 (Canada) | | 157,000 | 136,835 |
| Huntsman International, LLC sr. unsec. notes 4.50%, 5/1/29 | | 278,000 | 242,135 |
| IHS Holding, Ltd. company guaranty sr. unsec. notes Ser. REGS, 6.25%, 11/29/28 (Nigeria) | | 260,000 | 193,700 |
| International Flavors & Fragrances, Inc. 144A sr. unsec. notes 2.30%, 11/1/30 | | 132,000 | 99,203 |
| Westlake Corp. sr. unsec. unsub. notes 3.60%, 8/15/26 | | 632,000 | 581,951 |
| WestRock MWV, LLC company guaranty sr. unsec. unsub. notes 8.20%, 1/15/30 | | 172,000 | 188,971 |
| Weyerhaeuser Co. sr. unsec. unsub. notes 7.375%, 3/15/32 R | | 33,000 | 35,113 |
| | | 2,147,957 |
| Capital goods (0.7%) |
| Berry Global, Inc. 144A company guaranty sr. notes 1.65%, 1/15/27 | | 351,000 | 289,238 |
| Berry Global, Inc. 144A company guaranty sr. notes 1.57%, 1/15/26 | | 324,000 | 280,824 |
| Boeing Co. (The) sr. unsec. notes 4.875%, 5/1/25 | | 179,000 | 174,668 |
| L3Harris Technologies, Inc. sr. unsec. notes 3.85%, 12/15/26 | | 176,000 | 164,443 |
| Waste Connections, Inc. sr. unsec. bonds 4.20%, 1/15/33 | | 110,000 | 99,476 |
| | | 1,008,649 |
| Communication services (2.2%) |
| American Tower Corp. sr. unsec. notes 2.90%, 1/15/30 R | | 291,000 | 237,235 |
| American Tower Corp. sr. unsec. unsub. notes 3.55%, 7/15/27 R | | 406,000 | 362,813 |
| AT&T, Inc. company guaranty sr. unsec. unsub. notes 2.30%, 6/1/27 | | 487,000 | 424,736 |
| AT&T, Inc. sr. unsec. unsub. notes 4.25%, 3/1/27 | | 355,000 | 338,985 |
| Charter Communications Operating, LLC/Charter Communications Operating Capital Corp. company guaranty sr. sub. notes 4.908%, 7/23/25 | | 464,000 | 450,462 |
| Cox Communications, Inc. 144A sr. unsec. bonds 3.50%, 8/15/27 | | 178,000 | 161,428 |
| Crown Castle International Corp. sr. unsec. bonds 3.80%, 2/15/28 R | | 137,000 | 123,497 |
| Crown Castle International Corp. sr. unsec. bonds 3.65%, 9/1/27 R | | 192,000 | 173,627 |
| Equinix, Inc. sr. unsec. sub. notes 3.20%, 11/18/29 R | | 404,000 | 338,383 |
| T-Mobile USA, Inc. company guaranty sr. notes 3.875%, 4/15/30 | | 18,000 | 15,923 |
| T-Mobile USA, Inc. company guaranty sr. notes 3.75%, 4/15/27 | | 440,000 | 405,925 |
| Verizon Communications, Inc. sr. unsec. unsub. notes 2.10%, 3/22/28 | | 312,000 | 262,200 |
| | | 3,295,214 |
| Conglomerates (0.1%) |
| General Electric Co. jr. unsec. sub. FRN (ICE LIBOR USD 3 Month + 3.33%), 6.623%, perpetual maturity | | 214,000 | 206,243 |
| | | 206,243 |
| Consumer cyclicals (1.7%) |
| Alimentation Couche-Tard, Inc. 144A company guaranty sr. unsec. notes 3.55%, 7/26/27 (Canada) | | 344,000 | 307,880 |
| Autonation, Inc. sr. unsec. bonds 2.40%, 8/1/31 | | 193,000 | 133,648 |
| Block, Inc. sr. unsec. notes 3.50%, 6/1/31 | | 354,000 | 284,970 |
| Booking Holdings, Inc. sr. unsec. sub. notes 4.625%, 4/13/30 | | 385,000 | 362,272 |
| Ford Motor Co. sr. unsec. unsub. notes 3.625%, 6/17/31 | | 300,000 | 233,303 |
| | | |
| CORPORATE BONDS AND NOTES (21.3%)* cont. | Principal
amount | Value |
| Consumer cyclicals cont. |
| General Motors Financial Co., Inc. company guaranty sr. unsec. notes 4.00%, 10/6/26 | | $147,000 | $135,088 |
| General Motors Financial Co., Inc. sr. unsec. notes 2.35%, 2/26/27 | | 100,000 | 84,639 |
| Global Payments, Inc. sr. unsec. notes 2.15%, 1/15/27 | | 76,000 | 64,860 |
| Lennar Corp. company guaranty sr. unsec. unsub. notes 4.75%, 11/29/27 | | 163,000 | 150,738 |
| Stellantis Finance US, Inc. 144A company guaranty sr. unsec. notes 1.711%, 1/29/27 | | 400,000 | 330,826 |
| Warnermedia Holdings, Inc. 144A company guaranty sr. unsec. bonds 4.279%, 3/15/32 | | 463,000 | 373,987 |
| | | 2,462,211 |
| Consumer staples (1.7%) |
| Ashtead Capital, Inc. 144A notes 4.375%, 8/15/27 | | 435,000 | 392,814 |
| ERAC USA Finance, LLC 144A company guaranty sr. unsec. notes 5.625%, 3/15/42 | | 281,000 | 245,160 |
| GSK Consumer Healthcare Capital US, LLC company guaranty sr. unsec. unsub. notes 3.375%, 3/24/27 | | 330,000 | 298,454 |
| Keurig Dr Pepper, Inc. company guaranty sr. unsec. unsub. notes 3.43%, 6/15/27 | | 240,000 | 219,118 |
| Kraft Heinz Foods Co. company guaranty sr. unsec. sub. notes 3.875%, 5/15/27 | | 584,000 | 547,180 |
| Netflix, Inc. sr. unsec. bonds Ser. REGS, 3.875%, 11/15/29 | EUR | 435,000 | 398,735 |
| Netflix, Inc. sr. unsec. unsub. notes 4.375%, 11/15/26 | | $441,000 | 419,900 |
| | | 2,521,361 |
| Energy (1.7%) |
| Cheniere Corpus Christi Holdings, LLC company guaranty sr. notes 5.125%, 6/30/27 | | 231,000 | 225,371 |
| Cheniere Energy Partners LP company guaranty sr. unsec. unsub. notes 3.25%, 1/31/32 | | 183,000 | 142,405 |
| Continental Resources, Inc. company guaranty sr. unsec. notes 4.375%, 1/15/28 | | 418,000 | 374,787 |
| EQT Corp. sr. unsec. notes 5.678%, 10/1/25 | | 128,000 | 126,530 |
| Occidental Petroleum Corp. sr. unsec. sub. notes 8.50%, 7/15/27 | | 318,000 | 345,746 |
| Petrobras Global Finance BV company guaranty sr. unsec. unsub. notes 6.25%, 3/17/24 (Brazil) | | 267,000 | 267,935 |
| Petrobras Global Finance BV company guaranty sr. unsec. unsub. notes 5.60%, 1/3/31 (Brazil) | | 44,000 | 39,963 |
| Petroleos Mexicanos company guaranty sr. unsec. unsub. FRB 5.95%, 1/28/31 (Mexico) | | 246,000 | 177,287 |
| Petroleos Mexicanos company guaranty sr. unsec. unsub. notes 6.70%, 2/16/32 (Mexico) | | 261,000 | 197,381 |
| Sabine Pass Liquefaction, LLC sr. notes 5.00%, 3/15/27 | | 294,000 | 283,327 |
| Transcanada Trust company guaranty jr. unsec. sub. FRB 5.30%, 3/15/77 (Canada) | | 355,000 | 287,639 |
| | | 2,468,371 |
| Financials (8.3%) |
| ABN AMRO Bank NV 144A unsec. sub. notes 4.75%, 7/28/25 (Netherlands) | | 400,000 | 377,515 |
| AerCap Ireland Capital DAC/AerCap Global Aviation Trust company guaranty sr. unsec. bonds 3.30%, 1/30/32 (Ireland) | | 660,000 | 495,364 |
| Air Lease Corp. sr. unsec. sub. bonds 4.625%, 10/1/28 | | 380,000 | 336,731 |
| | | |
| CORPORATE BONDS AND NOTES (21.3%)* cont. | Principal
amount | Value |
| Financials cont. |
| Ally Financial, Inc. company guaranty sr. unsec. notes 8.00%, 11/1/31 | | $180,000 | $184,610 |
| Aon PLC company guaranty sr. unsec. unsub. notes 4.25%, 12/12/42 | | 386,000 | 286,395 |
| Ares Capital Corp. sr. unsec. sub. notes 3.875%, 1/15/26 | | 524,000 | 469,788 |
| Banco Santander SA sr. unsec. unsub. notes 4.379%, 4/12/28 (Spain) | | 200,000 | 174,804 |
| Banco Santander SA unsec. sub. notes 5.179%, 11/19/25 (Spain) | | 400,000 | 379,822 |
| Bank of America Corp. jr. unsec. sub. FRN Ser. Z, 6.50%, perpetual maturity | | 346,000 | 343,405 |
| Bank of America Corp. unsec. sub. FRB 3.846%, 3/8/37 | | 525,000 | 420,627 |
| BNP Paribas SA 144A unsec. sub. notes 4.375%, 5/12/26 (France) | | 400,000 | 366,681 |
| BPCE SA 144A sr. unsec. notes 3.50%, 10/23/27 (France) | | 250,000 | 215,117 |
| BPCE SA 144A unsec. sub. notes 4.50%, 3/15/25 (France) | | 540,000 | 506,885 |
| Capital One Financial Corp. sr. unsec. unsub. FRN 1.878%, 11/2/27 | | 264,000 | 219,589 |
| Citigroup, Inc. jr. unsec. sub. FRN 3.875%, perpetual maturity | | 622,000 | 510,662 |
| Commonwealth Bank of Australia 144A sr. unsec. notes 2.552%, 3/14/27 (Australia) | | 212,000 | 190,408 |
| Corebridge Financial, Inc. 144A sr. unsec. notes 3.85%, 4/5/29 | | 200,000 | 174,719 |
| Credit Agricole SA 144A unsec. sub. FRN 4.00%, 1/10/33 (France) | | 400,000 | 335,296 |
| Credit Suisse Group AG 144A jr. unsec. sub. FRN 7.50%, perpetual maturity (Switzerland) | | 200,000 | 180,996 |
| Credit Suisse Group AG 144A sr. unsec. FRN 2.193%, 6/5/26 (Switzerland) | | 250,000 | 210,687 |
| Deutsche Bank AG unsec. sub. notes 4.50%, 4/1/25 (Germany) | | 400,000 | 372,190 |
| Digital Realty Trust LP company guaranty sr. unsec. bonds 4.45%, 7/15/28 R | | 160,000 | 147,570 |
| Fidelity National Financial, Inc. sr. unsec. bonds 3.20%, 9/17/51 | | 160,000 | 85,590 |
| First-Citizens Bank & Trust Co. unsec. sub. notes 6.125%, 3/9/28 | | 306,000 | 302,207 |
| GLP Capital LP/GLP Financing II, Inc. company guaranty sr. unsec. unsub. notes 5.375%, 4/15/26 | | 88,000 | 84,001 |
| Goldman Sachs Group, Inc. (The) jr. unsec. sub. FRN 3.65%, 7/28/51 | | 188,000 | 142,866 |
| Goldman Sachs Group, Inc. (The) sr. unsec. unsub. notes 2.60%, 2/7/30 | | 138,000 | 109,748 |
| Goldman Sachs Group, Inc. (The) unsec. sub. notes 5.95%, 1/15/27 | | 192,000 | 193,696 |
| Intesa Sanpaolo SpA 144A unsec. sub. bonds 4.198%, 6/1/32 (Italy) | | 505,000 | 341,851 |
| iStar, Inc. sr. unsec. notes 4.25%, 8/1/25 R | | 280,000 | 270,914 |
| JPMorgan Chase & Co. unsec. sub. notes 4.125%, 12/15/26 | | 138,000 | 130,720 |
| Massachusetts Mutual Life Insurance Co. 144A unsec. sub. bonds 3.729%, 10/15/70 | | 429,000 | 267,231 |
| MetLife Capital Trust IV 144A jr. unsec. sub. notes 7.875%, 12/15/37 | | 230,000 | 240,879 |
| NatWest Group PLC sr. unsec. unsub. FRN 1.642%, 6/14/27 (United Kingdom) | | 595,000 | 494,355 |
| Prudential Financial, Inc. jr. unsec. sub. FRN 5.20%, 3/15/44 | | 136,000 | 126,484 |
| Societe Generale SA 144A jr. unsec. sub. notes 5.375%, perpetual maturity (France) | | 643,000 | 465,758 |
| Teachers Insurance & Annuity Association of America 144A unsec. sub. notes 6.85%, 12/16/39 | | 102,000 | 106,718 |
| Truist Financial Corp. jr. unsec. sub. FRB Ser. N, 4.80%, 9/1/24 | | 181,000 | 162,493 |
| UBS Group AG 144A jr. unsec. sub. FRN 4.375%, perpetual maturity (Switzerland) | | 225,000 | 156,296 |
| | | |
| CORPORATE BONDS AND NOTES (21.3%)* cont. | Principal
amount | Value |
| Financials cont. |
| UBS Group AG 144A sr. unsec. FRN 4.703%, 8/5/27 (Switzerland) | | $379,000 | $352,222 |
| UBS Group Funding Switzerland AG company guaranty jr. unsec. sub. FRN Ser. REGS, 6.875%, perpetual maturity (Switzerland) | | 300,000 | 284,625 |
| US Bancorp unsec. sub. FRB 2.491%, 11/3/36 | | 500,000 | 366,376 |
| VICI Properties LP sr. unsec. unsub. notes 4.75%, 2/15/28 R | | 183,000 | 166,765 |
| VICI Properties LP/VICI Note Co., Inc. 144A company guaranty sr. unsec. notes 3.75%, 2/15/27 R | | 68,000 | 59,575 |
| Wells Fargo & Co. jr. unsec. sub. FRN 3.90%, perpetual maturity | | 163,000 | 138,387 |
| Wells Fargo & Co. unsec. sub. notes Ser. GMTN, 4.30%, 7/22/27 | | 267,000 | 249,739 |
| Westpac Banking Corp. sr. unsec. unsub. notes 3.35%, 3/8/27 (Australia) | | 126,000 | 116,588 |
| | | 12,315,945 |
| Health care (0.2%) |
| Danaher Corp. sr. unsec. unsub. notes 3.35%, 9/15/25 | | 203,000 | 194,014 |
| Service Corp. International sr. unsec. notes 4.625%, 12/15/27 | | 105,000 | 97,285 |
| | | 291,299 |
| Technology (1.4%) |
| Broadcom Corp./Broadcom Cayman Finance, Ltd. company guaranty sr. unsec. unsub. notes 3.875%, 1/15/27 | | 461,000 | 423,646 |
| Broadcom, Inc. company guaranty sr. unsec. bonds 4.15%, 11/15/30 | | 361,000 | 310,486 |
| Broadcom, Inc. 144A sr. unsec. bonds 4.926%, 5/15/37 | | 489,000 | 403,186 |
| Meta Platforms, Inc. 144A sr. unsec. unsub. bonds 4.45%, 8/15/52 | | 244,000 | 181,081 |
| Meta Platforms, Inc. 144A sr. unsec. unsub. notes 3.50%, 8/15/27 | | 108,000 | 99,140 |
| Oracle Corp. sr. unsec. bonds 3.95%, 3/25/51 | | 75,000 | 49,066 |
| Oracle Corp. sr. unsec. bonds 3.65%, 3/25/41 | | 207,000 | 140,180 |
| Oracle Corp. sr. unsec. notes 1.65%, 3/25/26 | | 91,000 | 79,885 |
| Sensata Technologies, Inc. 144A company guaranty sr. unsec. notes 3.75%, 2/15/31 | | 426,000 | 339,203 |
| | | 2,025,873 |
| Transportation (0.4%) |
| Penske Truck Leasing Co. LP/PTL Finance Corp. 144A sr. unsec. bonds 3.40%, 11/15/26 | | 103,000 | 93,139 |
| Penske Truck Leasing Co. LP/PTL Finance Corp. 144A sr. unsec. notes 4.40%, 7/1/27 | | 529,000 | 493,454 |
| | | 586,593 |
| Utilities and power (1.4%) |
| AES Corp. (The) sr. unsec. notes 1.375%, 1/15/26 | | 276,000 | 238,368 |
| Boardwalk Pipelines LP company guaranty sr. unsec. notes 3.60%, 9/1/32 | | 77,000 | 61,033 |
| Energy Transfer LP jr. unsec. sub. FRN 6.625%, perpetual maturity | | 330,000 | 236,363 |
| IPALCO Enterprises, Inc. sr. notes 4.25%, 5/1/30 | | 351,000 | 301,723 |
| Kinder Morgan Energy Partners LP company guaranty sr. unsec. notes 5.40%, 9/1/44 | | 220,000 | 184,017 |
| NRG Energy, Inc. 144A company guaranty sr. unsec. bonds 3.875%, 2/15/32 | | 300,000 | 236,535 |
| Pacific Gas and Electric Co. sr. bonds 5.90%, 6/15/32 | | 129,000 | 120,037 |
| Pacific Gas and Electric Co. sr. bonds 4.95%, 7/1/50 | | 100,000 | 74,545 |
| Vistra Operations Co., LLC 144A company guaranty sr. notes 4.30%, 7/15/29 | | 204,000 | 177,967 |
| | | |
| CORPORATE BONDS AND NOTES (21.3%)* cont. | Principal
amount | Value |
| Utilities and power cont. |
| Vistra Operations Co., LLC 144A company guaranty sr. notes 3.55%, 7/15/24 | | $108,000 | $102,872 |
| WEC Energy Group, Inc. jr. unsec. sub. FRN Ser. A, (ICE LIBOR USD 3 Month + 2.11%), 5.018%, 5/15/67 | | 498,000 | 410,850 |
| | | 2,144,310 |
| Total corporate bonds and notes (cost $36,525,861) | $31,474,026 |
|
| | | |
| COLLATERALIZED LOAN OBLIGATIONS (4.9%)* | Principal
amount | Value |
| AB BSL CLO 2, Ltd. 144A FRB Ser. 21-2A, Class A, (ICE LIBOR USD 3 Month + 1.10%), 5.179%, 4/15/34 (Cayman Islands) | | $250,000 | $239,118 |
| AGL CLO 6, Ltd. 144A FRB Ser. 21-6A, Class AR, (ICE LIBOR USD 3 Month + 1.20%), 5.443%, 7/20/34 (Cayman Islands) | | 263,000 | 253,216 |
| Apex Credit CLO, Ltd. 144A FRB Ser. 21-2A, Class A1R, (ICE LIBOR USD 3 Month + 1.15%), 5.508%, 10/25/32 (Cayman Islands) | | 250,000 | 241,100 |
| Ares XLI CLO, Ltd. 144A FRB Ser. 21-41A, Class AR2, (ICE LIBOR USD 3 Month + 1.07%), 5.149%, 4/15/34 (Cayman Islands) | | 500,000 | 477,179 |
| Benefit Street Partners CLO V-B, Ltd. 144A FRB Ser. 18-5BA, Class A1A, (ICE LIBOR USD 3 Month + 1.09%), 5.333%, 4/20/31 | | 250,000 | 244,119 |
| Black Diamond CLO, Ltd. 144A FRB Ser. 21-1A, Class A1A, (ICE LIBOR USD 3 Month + 1.25%), 5.575%, 11/22/34 (Cayman Islands) | | 323,000 | 307,811 |
| BlueMountain CLO XXXII, Ltd. 144A FRB Ser. 21-32A, Class A, (ICE LIBOR USD 3 Month + 1.17%), 5.249%, 10/15/34 (Cayman Islands) | | 250,000 | 239,116 |
| CarVal CLO II, Ltd. 144A FRB Ser. 21-1A, Class ANR, (ICE LIBOR USD 3 Month + 1.11%), 5.353%, 4/20/32 (Cayman Islands) | | 313,000 | 303,792 |
| Cent CLO 21, Ltd. 144A FRB Ser. 21-21A, Class A1R3, (ICE LIBOR USD 3 Month + 0.97%), 5.328%, 7/27/30 (Cayman Islands) | | 367,506 | 359,583 |
Columbia Cent CLO 29, Ltd. 144A FRB Ser. 21-29A, Class AR,
(ICE LIBOR USD 3 Month + 1.17%), 5.413%, 10/20/34 | | 159,000 | 150,857 |
| Galaxy XXII CLO, Ltd. 144A FRB Ser. 21-22A, Class ARR, (ICE LIBOR USD 3 Month + 1.20%), 5.279%, 4/16/34 (Cayman Islands) | | 405,000 | 389,449 |
| Guggenheim 1828 CLO, Ltd. 144A FRB Ser. 18-1A, Class A1S1, (ICE LIBOR USD 3 Month + 1.23%), 5.309%, 10/15/31 (Cayman Islands) | | 398,485 | 389,640 |
| Gulf Stream Meridian 1, Ltd. 144A FRB Ser. 20-IA, Class A1, (ICE LIBOR USD 3 Month + 1.37%), 5.449%, 4/15/33 (Cayman Islands) | | 250,000 | 241,234 |
| LCM XXI LP 144A FRB Ser. 21A, Class AR, (ICE LIBOR USD 3 Month + 0.88%), 5.123%, 4/20/28 (Cayman Islands) | | 126,903 | 125,534 |
| Madison Park Funding XIV, Ltd. 144A FRB Ser. 18-14A, Class A2RR, (ICE LIBOR USD 3 Month + 1.40%), 5.725%, 10/22/30 (Cayman Islands) | | 250,000 | 239,405 |
Madison Park Funding XXX, Ltd. 144A FRB Ser. 18-30A, Class A,
(ICE LIBOR USD 3 Month + 0.75%), 4.829%, 4/15/29 | | 239,243 | 233,568 |
| Magnetite CLO XXXIII, Ltd. 144A FRB Ser. 22-33A, Class A, (CME TERM SOFR 3 Month + 1.50%), 4.207%, 7/20/35 (Cayman Islands) | | 250,000 | 240,047 |
| OZLM XVIII, Ltd. 144A FRB Ser. 18-18A, Class A, (ICE LIBOR USD 3 Month + 1.02%), 5.099%, 4/15/31 (Cayman Islands) | | 250,000 | 241,710 |
| Palmer Square CLO, Ltd. 144A FRB Ser. 21-1A, Class A1R, (ICE LIBOR USD 3 Month + 1.15%), 4.055%, 11/14/34 (Cayman Islands) | | 250,000 | 239,298 |
| Park Avenue Institutional Advisers CLO, Ltd. 144A FRB Ser. 19-1A, Class A2A, (ICE LIBOR USD 3 Month + 2.00%), 4.905%, 5/15/32 (Cayman Islands) | | 250,000 | 234,169 |
| | | |
| COLLATERALIZED LOAN OBLIGATIONS (4.9%)* cont. | Principal
amount | Value |
| Park Avenue Institutional Advisers CLO, Ltd. 144A FRB Ser. 21-1A, Class A1AR, (ICE LIBOR USD 3 Month + 1.00%), 5.243%, 10/20/31 (Cayman Islands) | | $250,000 | $241,955 |
| Rockford Tower CLO, Ltd. 144A FRB Ser. 21-1A, Class A1, (ICE LIBOR USD 3 Month + 1.17%), 5.413%, 7/20/34 (Cayman Islands) | | 250,000 | 239,381 |
| RR 14, Ltd. 144A FRB Ser. 21-14A, Class A1, (ICE LIBOR USD 3 Month + 1.12%), 5.199%, 4/15/36 (Cayman Islands) | | 342,000 | 327,219 |
| Sound Point CLO XXIII, Ltd. 144A FRB Ser. 21-2A, Class AR, (ICE LIBOR USD 3 Month + 1.17%), 5.249%, 7/15/34 (Cayman Islands) | | 500,000 | 475,372 |
| Venture XXVI CLO, Ltd. 144A FRB Ser. 21-26A, Class BR, (ICE LIBOR USD 3 Month + 1.70%), 5.943%, 1/20/29 (Cayman Islands) | | 200,000 | 190,329 |
| Zais CLO, Ltd. 144A FRB Ser. 19-13A, Class A1A, (ICE LIBOR USD 3 Month + 1.49%), 5.569%, 7/15/32 | | 364,000 | 353,356 |
| Total collateralized loan obligations (cost $7,424,347) | $7,217,557 |
|
| | | |
| ASSET-BACKED SECURITIES (1.3%)* | Principal
amount | Value |
1Sharpe Mortgage Trust 144A FRB Ser. 20-1, Class NOTE,
(ICE LIBOR USD 3 Month + 2.90%), 3.025%, 7/25/24 | | $447,561 | $446,442 |
| MRA Issuance Trust 144A FRB Ser. 22-2, Class A3, (US SOFR + 1.25%), 4.21%, 1/17/23 | | 500,000 | 500,000 |
| Station Place Securitization Trust 144A | | | |
| FRB Ser. 22-3, Class A1, (CME Term SOFR 1 Month + 1.25%), 4.828%, 5/29/23 | | 693,000 | 693,000 |
| FRB Ser. 21-14, Class A1, (ICE LIBOR USD 1 Month + 0.70%), 4.272%, 12/8/22 | | 263,000 | 263,000 |
| Total asset-backed securities (cost $1,903,561) | $1,902,442 |
|
| | | |
| SHORT-TERM INVESTMENTS (10.4%)* | Principal amount/
shares | Value |
| Putnam Short Term Investment Fund Class P 3.21% L | Shares | 6,603,751 | $6,603,751 |
| State Street Institutional U.S. Government Money Market Fund, Premier Class 3.01% P | Shares | 1,777,000 | 1,777,000 |
| U.S. Treasury Bills 3.400%, 12/6/22 # ∆ § Φ | | $3,100,000 | 3,089,395 |
| U.S. Treasury Bills 3.297%, 12/1/22 # ∆ § Φ | | 1,000,000 | 997,131 |
| U.S. Treasury Bills 2.911%, 11/25/22 # § Φ | | 1,200,000 | 1,197,382 |
| U.S. Treasury Bills 2.793%, 11/8/22 # ∆ § Φ | | 900,000 | 899,533 |
| U.S. Treasury Bills 2.659%, 11/1/22 Φ | | 800,000 | 800,000 |
| Total short-term investments (cost $15,365,221) | $15,364,192 |
|
| |
| TOTAL INVESTMENTS |
| Total investments (cost $317,198,693) | $293,562,806 |
|
| |
| Key to holding’s currency abbreviations |
| AUD | Australian Dollar |
| CAD | Canadian Dollar |
| CHF | Swiss Franc |
| CNY | Chinese Yuan (Onshore) |
| DKK | Danish Krone |
| EUR | Euro |
| GBP | British Pound |
| |
| JPY | Japanese Yen |
| MXN | Mexican Peso |
| MYR | Malaysian Ringgit |
| NOK | Norwegian Krone |
| NZD | New Zealand Dollar |
| PLN | Polish Zloty |
| SEK | Swedish Krona |
| THB | Thai Baht |
| USD /$ | United States Dollar |
|
| |
| Key to holding’s abbreviations |
| bp | Basis Points |
| DAC | Designated Activity Company |
| FRB | Floating Rate Bonds: The rate shown is the current interest rate at the close of the reporting period. Rates may be subject to a cap or floor. For certain securities, the rate may represent a fixed rate currently in place at the close of the reporting period. |
| FRN | Floating Rate Notes: The rate shown is the current interest rate or yield at the close of the reporting period. Rates may be subject to a cap or floor. For certain securities, the rate may represent a fixed rate currently in place at the close of the reporting period. |
| GMTN | Global Medium Term Notes |
| IFB | Inverse Floating Rate Bonds, which are securities that pay interest rates that vary inversely to changes in the market interest rates. As interest rates rise, inverse floaters produce less current income. The rate shown is the current interest rate at the close of the reporting period. Rates may be subject to a cap or floor. |
| IO | Interest Only |
| LIBOR | London Interbank Offered Rate |
| OTC | Over-the-counter |
| REGS | Securities sold under Regulation S may not be offered, sold or delivered within the United States except pursuant to an exemption from, or in a transaction not subject to, the registration requirements of the Securities Act of 1933. |
| SOFR | Secured Overnight Financing Rate |
| TBA | To Be Announced Commitments |
|
| | | |
| Notes to the fund’s portfolio |
| Unless noted otherwise, the notes to the fund’s portfolio are for the close of the fund’s reporting period, which ran from November 1, 2021 through October 31, 2022 (the reporting period). Within the following notes to the portfolio, references to “Putnam Management” represent Putnam Investment Management, LLC, the fund’s manager, an indirect wholly-owned subsidiary of Putnam Investments, LLC and references to “ASC 820” represent Accounting Standards Codification 820 Fair Value Measurements and Disclosures. |
| * | Percentages indicated are based on net assets of $147,729,985. |
| # | This security, in part or in entirety, was pledged and segregated with the broker to cover margin requirements for futures contracts at the close of the reporting period. Collateral at period end totaled $722,858 and is included in Investments in securities on the Statement of assets and liabilities (Notes 1 and 8). |
| ∆ | This security, in part or in entirety, was pledged and segregated with the custodian for collateral on certain derivative contracts at the close of the reporting period. Collateral at period end totaled $616,045 and is included in Investments in securities on the Statement of assets and liabilities (Notes 1 and 8). |
| Φ | This security, in part or in entirety, was pledged and segregated with the custodian for collateral on certain TBA commitments at the close of the reporting period. Collateral at period end totaled $1,044,117 and is included in Investments in securities on the Statement of assets and liabilities (Notes 1 and 8). |
| § | This security, in part or in entirety, was pledged and segregated with the custodian for collateral on the initial margin on certain centrally cleared derivative contracts at the close of the reporting period. Collateral at period end totaled $1,740,280 and is included in Investments in securities on the Statement of assets and liabilities (Notes 1 and 8). |
| | | |
| i | This security was pledged, or purchased with cash that was pledged, to the fund for collateral on certain derivative contracts (Note 1). |
| L | Affiliated company (Note 5). The rate quoted in the security description is the annualized 7-day yield of the fund at the close of the reporting period. |
| P | This security was pledged, or purchased with cash that was pledged, to the fund for collateral on certain derivative contracts. The rate quoted in the security description is the annualized 7-day yield of the fund at the close of the reporting period. |
| R | Real Estate Investment Trust. |
| W | The rate shown represents the weighted average coupon associated with the underlying mortgage pools. Rates may be subject to a cap or floor. |
| Unless otherwise noted, the rates quoted in Short-term investments security descriptions represent the weighted average yield to maturity. |
| Debt obligations are considered secured unless otherwise indicated. |
| 144A after the name of an issuer represents securities exempt from registration under Rule 144A of the Securities Act of 1933, as amended. These securities may be resold in transactions exempt from registration, normally to qualified institutional buyers. |
| See Note 1 to the financial statements regarding TBA commitments. |
| The dates shown on debt obligations are the original maturity dates. |
|
| | | | |
| DIVERSIFICATION BY COUNTRY ⌂ | | | | |
| Distribution of investments by country of risk at the close of the reporting period, excluding collateral received, if any (as a percentage of Portfolio Value): |
| United States | 79.4% | | Indonesia | 0.7% |
| Japan | 4.0 | | Switzerland | 0.7 |
| Cayman Islands | 2.1 | | Mexico | 0.6 |
| France | 2.1 | | Australia | 0.6 |
| Italy | 1.5 | | Uruguay | 0.5 |
| United Kingdom | 1.1 | | Other | 4.6 |
| Spain | 1.1 | | Total | 100.0% |
| Canada | 1.0 | | | |
⌂ Methodology differs from that used for purposes of complying with the fund’s policy regarding investments in securities of foreign issuers, as discussed further in the fund’s prospectus.
|
| | | | | | |
| FORWARD CURRENCY CONTRACTS at 10/31/22 (aggregate face value $77,661,684) |
| Counterparty | Currency | Contract
type* | Delivery
date | Value | Aggregate
face value | Unrealized
appreciation/
(depreciation) |
| Bank of America N.A. |
| Australian Dollar | Buy | 1/18/23 | $3,848 | $3,754 | $94 |
| Canadian Dollar | Sell | 1/18/23 | 1,391,498 | 1,387,123 | (4,375) |
| Czech Koruna | Buy | 12/21/22 | 83,066 | 84,420 | (1,354) |
| Euro | Sell | 12/21/22 | 145,668 | 146,898 | 1,230 |
| Japanese Yen | Sell | 11/16/22 | 3,876,332 | 4,398,102 | 521,770 |
| Mexican Peso | Sell | 1/18/23 | 314,604 | 308,897 | (5,707) |
| New Zealand Dollar | Sell | 1/18/23 | 2,852 | 2,781 | (71) |
| Swedish Krona | Sell | 12/21/22 | 2,136 | 2,328 | 192 |
| Barclays Bank PLC |
| Euro | Buy | 12/21/22 | 51,301 | 52,330 | (1,029) |
| Indonesian Rupiah | Buy | 11/16/22 | 129,445 | 134,703 | (5,258) |
| Indonesian Rupiah | Sell | 11/16/22 | 129,445 | 129,622 | 177 |
| | | | | | |
| FORWARD CURRENCY CONTRACTS at 10/31/22 (aggregate face value $77,661,684) cont. |
| Counterparty | Currency | Contract
type* | Delivery
date | Value | Aggregate
face value | Unrealized
appreciation/
(depreciation) |
| Barclays Bank PLC cont. |
| Peruvian New Sol | Buy | 1/18/23 | $70,043 | $67,629 | $2,414 |
| Singapore Dollar | Buy | 11/16/22 | 93,608 | 93,656 | (48) |
| Swiss Franc | Sell | 12/21/22 | 352,631 | 368,146 | 15,515 |
| Citibank, N.A. |
| Australian Dollar | Sell | 1/18/23 | 4,553 | 4,601 | 48 |
| Canadian Dollar | Buy | 1/18/23 | 161,730 | 161,525 | 205 |
| Chilean Peso | Buy | 1/18/23 | 114,120 | 113,693 | 427 |
| Danish Krone | Sell | 12/21/22 | 77,328 | 79,556 | 2,228 |
| Romanian Leu | Buy | 12/21/22 | 69,067 | 70,039 | (972) |
| Goldman Sachs International |
| Chinese Yuan (Offshore) | Sell | 11/16/22 | 864,285 | 939,373 | 75,088 |
| Euro | Buy | 12/21/22 | 59,339 | 58,715 | 624 |
| Indonesian Rupiah | Buy | 11/16/22 | 321,435 | 334,476 | (13,041) |
| Japanese Yen | Sell | 11/16/22 | 587,727 | 660,167 | 72,440 |
| Norwegian Krone | Sell | 12/21/22 | 3,748 | 3,961 | 213 |
| Polish Zloty | Sell | 12/21/22 | 178,214 | 182,759 | 4,545 |
| South African Rand | Sell | 1/18/23 | 17,320 | 17,830 | 510 |
| Swedish Krona | Sell | 12/21/22 | 125,687 | 132,363 | 6,676 |
| Swiss Franc | Buy | 12/21/22 | 245,938 | 256,670 | (10,732) |
| HSBC Bank USA, National Association |
| British Pound | Sell | 12/21/22 | 584,948 | 569,155 | (15,793) |
| Canadian Dollar | Sell | 1/18/23 | 3,748 | 3,718 | (30) |
| Chinese Yuan (Offshore) | Buy | 11/16/22 | 5,843,736 | 6,352,011 | (508,275) |
| Euro | Sell | 12/21/22 | 10,651,529 | 10,863,931 | 212,402 |
| Japanese Yen | Buy | 11/16/22 | 2,115,015 | 2,209,961 | (94,946) |
| Norwegian Krone | Buy | 12/21/22 | 15,291 | 15,689 | (398) |
| Polish Zloty | Sell | 12/21/22 | 75,980 | 77,944 | 1,964 |
| Swedish Krona | Buy | 12/21/22 | 1,009 | 1,387 | (378) |
| Swiss Franc | Buy | 12/21/22 | 129,503 | 135,517 | (6,014) |
| JPMorgan Chase Bank N.A. |
| Australian Dollar | Buy | 1/18/23 | 256,018 | 258,737 | (2,719) |
| British Pound | Sell | 12/21/22 | 1,689,480 | 1,705,857 | 16,377 |
| Canadian Dollar | Buy | 1/18/23 | 13,888 | 13,715 | 173 |
| Chinese Yuan (Offshore) | Buy | 11/16/22 | 94,113 | 95,307 | (1,194) |
| Euro | Buy | 12/21/22 | 8,628,351 | 8,790,259 | (161,908) |
| Japanese Yen | Sell | 11/16/22 | 2,285,782 | 2,601,251 | 315,469 |
| Norwegian Krone | Sell | 12/21/22 | 21,776 | 23,108 | 1,332 |
| Singapore Dollar | Buy | 11/16/22 | 157,049 | 161,321 | (4,272) |
| South Korean Won | Buy | 11/16/22 | 815,834 | 910,975 | (95,141) |
| Swedish Krona | Buy | 12/21/22 | 3,511 | 3,489 | 22 |
| Swiss Franc | Buy | 12/21/22 | 4,419 | 4,597 | (178) |
| Morgan Stanley & Co. International PLC |
| Australian Dollar | Buy | 1/18/23 | 84,720 | 85,672 | (952) |
| British Pound | Buy | 12/21/22 | 3,839,844 | 3,861,392 | (21,548) |
| | | | | | |
| FORWARD CURRENCY CONTRACTS at 10/31/22 (aggregate face value $77,661,684) cont. |
| Counterparty | Currency | Contract
type* | Delivery
date | Value | Aggregate
face value | Unrealized
appreciation/
(depreciation) |
| Morgan Stanley & Co. International PLC cont. |
| Canadian Dollar | Buy | 1/18/23 | $473,507 | $472,075 | $1,432 |
| Euro | Sell | 12/21/22 | 1,246,910 | 1,261,491 | 14,581 |
| Japanese Yen | Buy | 11/16/22 | 1,009,234 | 1,184,406 | (175,172) |
| New Zealand Dollar | Sell | 1/18/23 | 481,736 | 469,698 | (12,038) |
| Norwegian Krone | Sell | 12/21/22 | 76,332 | 77,367 | 1,035 |
| Swedish Krona | Sell | 12/21/22 | 8,130 | 15,491 | 7,361 |
| Swiss Franc | Sell | 12/21/22 | 1,511 | 1,545 | 34 |
| NatWest Markets PLC |
| Australian Dollar | Sell | 1/18/23 | 111,334 | 109,306 | (2,028) |
| British Pound | Sell | 12/21/22 | 198,046 | 196,458 | (1,588) |
| Euro | Sell | 12/21/22 | 2,354,801 | 2,391,403 | 36,602 |
| Japanese Yen | Sell | 11/16/22 | 1,154,113 | 1,210,132 | 56,019 |
| State Street Bank and Trust Co. |
| Australian Dollar | Sell | 1/18/23 | 748,816 | 758,554 | 9,738 |
| British Pound | Sell | 12/21/22 | 32,510 | 31,964 | (546) |
| Canadian Dollar | Buy | 1/18/23 | 313,687 | 313,266 | 421 |
| Chinese Yuan (Offshore) | Buy | 11/16/22 | 2,386,364 | 2,593,897 | (207,533) |
| Euro | Buy | 12/21/22 | 233,089 | 246,701 | (13,612) |
| Hong Kong Dollar | Buy | 11/16/22 | 25,384 | 25,428 | (44) |
| Hungarian Forint | Buy | 12/21/22 | 113,953 | 119,826 | (5,873) |
| Israeli Shekel | Buy | 1/18/23 | 119,531 | 119,905 | (374) |
| Japanese Yen | Sell | 11/16/22 | 88,827 | 106,515 | 17,688 |
| New Zealand Dollar | Sell | 1/18/23 | 140,690 | 137,216 | (3,474) |
| Norwegian Krone | Sell | 12/21/22 | 127,014 | 134,141 | 7,127 |
| Swedish Krona | Sell | 12/21/22 | 194,997 | 205,216 | 10,219 |
| Swiss Franc | Buy | 12/21/22 | 780,612 | 815,570 | (34,958) |
| Toronto-Dominion Bank |
| British Pound | Sell | 12/21/22 | 12,636 | 12,713 | 77 |
| Canadian Dollar | Sell | 1/18/23 | 232,859 | 234,440 | 1,581 |
| Japanese Yen | Buy | 11/16/22 | 1,007,572 | 1,139,399 | (131,827) |
| Norwegian Krone | Sell | 12/21/22 | 167,521 | 178,434 | 10,913 |
| Swiss Franc | Sell | 12/21/22 | 38,880 | 40,603 | 1,723 |
| UBS AG |
| Australian Dollar | Buy | 1/18/23 | 2,694 | 2,722 | (28) |
| British Pound | Sell | 12/21/22 | 666,051 | 671,354 | 5,303 |
| Chinese Yuan (Offshore) | Sell | 11/16/22 | 115,134 | 125,633 | 10,499 |
| Euro | Buy | 12/21/22 | 6,429,637 | 6,548,284 | (118,647) |
| Japanese Yen | Buy | 11/16/22 | 3,381,115 | 3,872,110 | (490,995) |
| New Zealand Dollar | Sell | 1/18/23 | 6,287 | 6,276 | (11) |
| Norwegian Krone | Buy | 12/21/22 | 154 | 157 | (3) |
| Swedish Krona | Sell | 12/21/22 | 308,570 | 324,868 | 16,298 |
| Swiss Franc | Sell | 12/21/22 | 402 | 385 | (17) |
| | | | | | |
| FORWARD CURRENCY CONTRACTS at 10/31/22 (aggregate face value $77,661,684) cont. |
| Counterparty | Currency | Contract
type* | Delivery
date | Value | Aggregate
face value | Unrealized
appreciation/
(depreciation) |
| WestPac Banking Corp. |
| British Pound | Buy | 12/21/22 | $12,407 | $12,469 | $(62) |
| Euro | Buy | 12/21/22 | 2,532,520 | 2,516,871 | 15,649 |
| New Zealand Dollar | Sell | 1/18/23 | 33,354 | 32,514 | (840) |
| Swiss Franc | Buy | 12/21/22 | 3,617 | 3,771 | (154) |
| Unrealized appreciation | 1,476,435 |
| Unrealized (depreciation) | (2,156,157) |
| Total | $(679,722) |
| * The exchange currency for all contracts listed is the United States Dollar. |
|
| | | | | |
| FUTURES CONTRACTS OUTSTANDING at 10/31/22 |
| Number of
contracts | Notional
amount | Value | Expiration
date | Unrealized
appreciation/
(depreciation) |
| Canadian Government Bond 10 yr (Long) | 4 | $361,229 | $361,229 | Dec-22 | $(6,383) |
| Euro-Bobl 5 yr (Long) | 20 | 2,365,278 | 2,365,277 | Dec-22 | (58,540) |
| Euro-Bund 10 yr (Long) | 15 | 2,052,200 | 2,052,199 | Dec-22 | (95,195) |
| Euro-Buxl 30 yr (Long) | 6 | 855,152 | 855,152 | Dec-22 | (89,902) |
| Euro-Schatz 2 yr (Short) | 6 | 634,071 | 634,071 | Dec-22 | 6,601 |
| Japanese Government Bond 10 yr (Long) | 4 | 4,002,018 | 4,002,018 | Dec-22 | 2,473 |
| Japanese Government Bond 10 yr (Short) | 10 | 10,005,044 | 10,005,044 | Dec-22 | (1,386) |
| U.K. Gilt 10 yr (Long) | 12 | 1,405,472 | 1,405,472 | Dec-22 | (106,952) |
| U.S. Treasury Bond 30 yr (Long) | 17 | 2,048,500 | 2,048,500 | Dec-22 | (284,124) |
| U.S. Treasury Bond Ultra 30 yr (Long) | 14 | 1,787,188 | 1,787,188 | Dec-22 | (325,532) |
| U.S. Treasury Note 2 yr (Short) | 107 | 21,868,961 | 21,868,961 | Dec-22 | 445,994 |
| U.S. Treasury Note 5 yr (Long) | 63 | 6,715,406 | 6,715,406 | Dec-22 | (272,829) |
| U.S. Treasury Note 10 yr (Long) | 42 | 4,644,938 | 4,644,938 | Dec-22 | (272,407) |
| U.S. Treasury Note Ultra 10 yr (Long) | 8 | 927,875 | 927,875 | Dec-22 | (81,800) |
| Unrealized appreciation | | | | 455,068 |
| Unrealized (depreciation) | | | | (1,595,050) |
| Total | $(1,139,982) |
|
| | | | | |
| FORWARD PREMIUM SWAP OPTION CONTRACTS OUTSTANDING at 10/31/22 |
Counterparty
Fixed right or obligation % to receive or (pay)/Floating rate index/
Maturity date | Expiration
date/strike | | Notional/contract
amount | Premium
receivable/
(payable) | Unrealized
appreciation/
(depreciation) |
| Bank of America N.A. |
| (1.39)/US SOFR/Dec-26 (Purchased) | Dec-24/1.39 | | $20,479,800 | $(235,518) | $635,079 |
| 1.39/US SOFR/Dec-26 (Purchased) | Dec-24/1.39 | | 20,479,800 | (235,518) | (164,862) |
| (3.073)/US SOFR/Jun-37 (Written) | Jun-27/3.073 | | 5,748,900 | 418,232 | 103,538 |
| 3.073/US SOFR/Jun-37 (Written) | Jun-27/3.073 | | 5,748,900 | 418,232 | (117,278) |
| (1.085)/3 month USD-LIBOR-ICE/Apr-34 (Written) | Apr-24/1.085 | | 3,876,400 | 53,204 | 42,795 |
| | | | | |
| FORWARD PREMIUM SWAP OPTION CONTRACTS OUTSTANDING at 10/31/22 cont. |
Counterparty
Fixed right or obligation % to receive or (pay)/Floating rate index/
Maturity date | Expiration
date/strike | | Notional/
contract
amount | Premium
receivable/
(payable) | Unrealized
appreciation/
(depreciation) |
| Bank of America N.A. cont. |
| (3.101)/US SOFR/Jun-39 (Written) | Jun-29/3.101 | | $2,276,600 | $177,802 | $35,401 |
| 3.101/US SOFR/Jun-39 (Written) | Jun-29/3.101 | | 2,276,600 | 177,802 | (42,914) |
| 2.17/3 month USD-LIBOR-ICE/Apr-34 (Purchased) | Apr-24/2.17 | | 1,938,200 | (93,615) | (73,419) |
| (1.405)/US SOFR/Dec-58 (Purchased) | Dec-28/1.405 | | 1,573,300 | (241,305) | 245,089 |
| 1.405/US SOFR/Dec-58 (Purchased) | Dec-28/1.405 | | 1,573,300 | (241,305) | (136,405) |
| (1.275)/3 month USD-LIBOR-ICE/Mar-50 (Purchased) | Mar-30/1.275 | | 1,070,200 | (139,394) | 176,594 |
| 1.275/3 month USD-LIBOR-ICE/Mar-50 (Purchased) | Mar-30/1.275 | | 1,070,200 | (139,394) | (86,568) |
| (1.29)/3 month USD-LIBOR-ICE/Mar-34 (Written) | Mar-24/1.29 | | 969,100 | 15,118 | 12,230 |
| 2.29/3 month USD-LIBOR-ICE/Mar-34 (Purchased) | Mar-24/2.29 | | 678,400 | (33,368) | (26,200) |
| (0.925)/3 month USD-LIBOR-ICE/Mar-40 (Purchased) | Mar-30/0.925 | | 564,100 | (40,390) | 79,826 |
| 0.925/3 month USD-LIBOR-ICE/Mar-40 (Purchased) | Mar-30/0.925 | | 564,100 | (40,390) | (25,729) |
| (0.85)/3 month USD-LIBOR-ICE/Mar-40 (Purchased) | Mar-30/0.85 | | 287,300 | (20,973) | 41,567 |
| 0.85/3 month USD-LIBOR-ICE/Mar-40 (Purchased) | Mar-30/0.85 | | 287,300 | (20,973) | (13,532) |
| Citibank, N.A. |
| 4.108/US SOFR/Jan-28 (Purchased) | Jan-23/4.108 | | 14,015,900 | (201,128) | 18,501 |
| (4.108)/US SOFR/Jan-28 (Purchased) | Jan-23/4.108 | | 14,015,900 | (201,128) | (56,064) |
| 2.394/US SOFR/Sep-33 (Purchased) | Sep-23/2.394 | | 3,465,600 | (41,934) | (13,932) |
| (1.826)/US SOFR/Jan-42 (Purchased) | Jan-32/1.826 | | 2,979,400 | (220,029) | 215,202 |
| 1.826/US SOFR/Jan-42 (Purchased) | Jan-32/1.826 | | 2,979,400 | (220,029) | (94,328) |
| (1.90)/3 month USD-LIBOR-ICE/Jun-28 (Purchased) | Jun-26/1.90 | | 2,731,200 | (36,407) | 67,515 |
| 1.90/3 month USD-LIBOR-ICE/Jun-28 (Purchased) | Jun-26/1.90 | | 2,731,200 | (36,407) | (19,310) |
| (1.75)/US SOFR/Mar-53 (Purchased) | Mar-23/1.75 | | 1,665,400 | (124,655) | 371,284 |
| 1.75/US SOFR/Mar-53 (Purchased) | Mar-23/1.75 | | 1,665,400 | (124,655) | (121,791) |
| (1.724)/US SOFR/Mar-53 (Purchased) | Mar-23/1.724 | | 1,604,100 | (121,029) | 364,115 |
| 1.724/US SOFR/Mar-53 (Purchased) | Mar-23/1.724 | | 1,604,100 | (121,029) | (118,334) |
| (1.752)/3 month USD-LIBOR-ICE/Dec-31 (Purchased) | Dec-26/1.752 | | 1,591,200 | (51,873) | 95,822 |
| 1.752/3 month USD-LIBOR-ICE/Dec-31 (Purchased) | Dec-26/1.752 | | 1,591,200 | (51,873) | (30,678) |
| (1.735)/US SOFR/Mar-53 (Purchased) | Mar-23/1.735 | | 1,523,800 | (112,647) | 345,110 |
| 1.735/US SOFR/Mar-53 (Purchased) | Mar-23/1.735 | | 1,523,800 | (112,647) | (110,034) |
| (1.625)/3 month USD-LIBOR-ICE/Jan-61 (Purchased) | Jan-41/1.625 | | 933,600 | (137,706) | 45,644 |
| 1.625/3 month USD-LIBOR-ICE/Jan-61 (Purchased) | Jan-41/1.625 | | 933,600 | (137,706) | (29,184) |
| | | | | |
| FORWARD PREMIUM SWAP OPTION CONTRACTS OUTSTANDING at 10/31/22 cont. |
Counterparty
Fixed right or obligation % to receive or (pay)/Floating rate index/
Maturity date | Expiration
date/strike | | Notional/
contract
amount | Premium
receivable/
(payable) | Unrealized
appreciation/
(depreciation) |
| Citibank, N.A. cont. |
| (1.102)/3 month USD-LIBOR-ICE/Nov-32 (Purchased) | Nov-22/1.102 | | $674,000 | $(21,416) | $143,704 |
| 1.102/3 month USD-LIBOR-ICE/Nov-32 (Purchased) | Nov-22/1.102 | | 674,000 | (21,416) | (21,757) |
| (2.427)/3 month USD-LIBOR-ICE/Jun-41 (Purchased) | Jun-31/2.427 | | 577,800 | (42,093) | 34,564 |
| 2.427/3 month USD-LIBOR-ICE/Jun-41 (Purchased) | Jun-31/2.427 | | 577,800 | (42,093) | (16,311) |
| (2.689)/3 month USD-LIBOR-ICE/Nov-49 (Purchased) | Nov-24/2.689 | | 377,000 | (48,539) | 22,835 |
| 2.689/3 month USD-LIBOR-ICE/Nov-49 (Purchased) | Nov-24/2.689 | | 377,000 | (48,539) | (31,581) |
| (0.055)/3 month EUR-EURIBOR/Mar-25 (Written) | Mar-24/0.055 | EUR | 43,551,100 | 139,730 | 117,497 |
| 0.555/3 month EUR-EURIBOR/Mar-25 (Purchased) | Mar-24/0.555 | EUR | 21,775,600 | (137,362) | (115,346) |
| Goldman Sachs International |
| (2.40)/US SOFR/May-57 (Purchased) | May-27/2.40 | | $5,415,500 | (698,600) | 378,002 |
| 2.40/US SOFR/May-57 (Purchased) | May-27/2.40 | | 5,415,500 | (698,600) | (221,819) |
| (2.8175)/3 month USD-LIBOR-ICE/Mar-47 (Purchased) | Mar-27/2.8175 | | 371,900 | (46,952) | 16,345 |
| 2.8175/3 month USD-LIBOR-ICE/Mar-47 (Purchased) | Mar-27/2.8175 | | 371,900 | (46,952) | (22,184) |
| JPMorgan Chase Bank N.A. |
| (1.70)/US SOFR/Jan-29 (Written) | Jan-24/1.70 | | 3,884,900 | 82,894 | 66,781 |
| 1.70/US SOFR/Jan-29 (Written) | Jan-24/1.70 | | 3,884,900 | 82,894 | (266,815) |
| (2.317)/US SOFR/Apr-42 (Written) | Apr-32/2.317 | | 2,442,700 | 206,897 | 76,090 |
| 2.317/US SOFR/Apr-42 (Written) | Apr-32/2.317 | | 2,442,700 | 206,897 | (103,790) |
| (1.81)/US SOFR/Jan-37 (Written) | Jan-27/1.81 | | 723,500 | 42,759 | 24,946 |
| 1.81/US SOFR/Jan-37 (Written) | Jan-27/1.81 | | 723,500 | 42,759 | (67,510) |
| (2.495)/6 month AUD-BBR-BBSW/Nov-46 (Purchased) | Nov-26/2.495 | AUD | 1,458,600 | (90,707) | 153,496 |
| 2.495/6 month AUD-BBR-BBSW/Nov-46 (Purchased) | Nov-26/2.495 | AUD | 1,458,600 | (90,707) | (54,347) |
| (1.445)/6 month AUD-BBR-BBSW/Mar-40 (Purchased) | Mar-30/1.445 | AUD | 261,200 | (9,791) | 25,118 |
| 1.445/6 month AUD-BBR-BBSW/Mar-40 (Purchased) | Mar-30/1.445 | AUD | 261,200 | (9,791) | (6,733) |
| (1.692)/6 month AUD-BBR-BBSW/Jan-35 (Purchased) | Jan-25/1.692 | AUD | 163,800 | (5,110) | 19,635 |
| 1.692/6 month AUD-BBR-BBSW/Jan-35 (Purchased) | Jan-25/1.692 | AUD | 163,800 | (5,110) | (4,278) |
| (1.441)/6 month AUD-BBR-BBSW/Jul-45 (Purchased) | Jul-25/1.441 | AUD | 125,100 | (7,399) | 22,885 |
| 1.441/6 month AUD-BBR-BBSW/Jul-45 (Purchased) | Jul-25/1.441 | AUD | 125,100 | (7,399) | (6,010) |
| | | | | |
| FORWARD PREMIUM SWAP OPTION CONTRACTS OUTSTANDING at 10/31/22 cont. |
Counterparty
Fixed right or obligation % to receive or (pay)/Floating rate index/
Maturity date | Expiration
date/strike | | Notional/
contract
amount | Premium
receivable/
(payable) | Unrealized
appreciation/
(depreciation) |
| Morgan Stanley & Co. International PLC |
| (2.5375)/US SOFR/Nov-32 (Purchased) | Nov-22/2.5375 | | $4,980,300 | $(105,333) | $414,959 |
| 2.5375/US SOFR/Nov-32 (Purchased) | Nov-22/2.5375 | | 4,980,300 | (105,333) | (105,184) |
| (3.27)/3 month USD-LIBOR-ICE/Oct-53 (Purchased) | Oct-23/3.27 | | 734,900 | (83,852) | (1,022) |
| 3.27/3 month USD-LIBOR-ICE/Oct-53 (Purchased) | Oct-23/3.27 | | 734,900 | (83,852) | (44,741) |
| (2.3825)/US SOFR/Jul-56 (Purchased) | Jul-26/2.3825 | | 413,900 | (52,462) | 30,463 |
| 2.3825/US SOFR/Jul-56 (Purchased) | Jul-26/2.3825 | | 413,900 | (52,462) | (20,654) |
| (2.505)/3 month USD-LIBOR-ICE/Nov-49 (Purchased) | Nov-24/2.505 | | 377,000 | (57,756) | 22,481 |
| 2.505/3 month USD-LIBOR-ICE/Nov-49 (Purchased) | Nov-24/2.505 | | 377,000 | (40,565) | (26,688) |
| Toronto-Dominion Bank |
| (1.937)/3 month USD-LIBOR-ICE/Feb-36 (Purchased) | Feb-26/1.937 | | 2,002,500 | (104,731) | 214,868 |
| 1.937/3 month USD-LIBOR-ICE/Feb-36 (Purchased) | Feb-26/1.937 | | 2,002,500 | (104,731) | (69,066) |
| (2.405)/3 month USD-LIBOR-ICE/Mar-41 (Purchased) | Mar-31/2.405 | | 94,500 | (6,591) | 6,016 |
| 2.405/3 month USD-LIBOR-ICE/Mar-41 (Purchased) | Mar-31/2.405 | | 94,500 | (6,591) | (2,544) |
| UBS AG |
| (2.70)/6 month AUD-BBR-BBSW/Apr-47 (Purchased) | Apr-37/2.70 | AUD | 1,140,000 | (69,219) | 19,499 |
| 2.70/6 month AUD-BBR-BBSW/Apr-47 (Purchased) | Apr-37/2.70 | AUD | 1,140,000 | (69,219) | (13,731) |
| (2.00)/6 month AUD-BBR-BBSW/Sep-46 (Purchased) | Sep-36/2.00 | AUD | 975,900 | (51,942) | 36,312 |
| 2.00/6 month AUD-BBR-BBSW/Sep-46 (Purchased) | Sep-36/2.00 | AUD | 975,900 | (51,942) | (15,213) |
| 3.292/6 month EUR-EURIBOR/Oct-24 (Purchased) | Oct-23/3.292 | EUR | 8,776,300 | (50,617) | 3,469 |
| (3.292)/6 month EUR-EURIBOR/Oct-24 (Purchased) | Oct-23/3.292 | EUR | 8,776,300 | (50,617) | (16,132) |
| (2.60)/6 month EUR-EURIBOR/Jun-30 (Written) | Jun-25/2.60 | EUR | 3,814,900 | 133,852 | 19,340 |
| (2.65)/6 month EUR-EURIBOR/Jun-30 (Written) | Jun-25/2.65 | EUR | 3,814,900 | 134,338 | 15,495 |
| (2.675)/6 month EUR-EURIBOR/Jun-30 (Written) | Jun-25/2.675 | EUR | 3,814,900 | 133,852 | 13,535 |
| 2.675/6 month EUR-EURIBOR/Jun-30 (Written) | Jun-25/2.675 | EUR | 3,814,900 | 133,852 | (45,015) |
| 2.65/6 month EUR-EURIBOR/Jun-30 (Written) | Jun-25/2.65 | EUR | 3,814,900 | 134,338 | (47,126) |
| 2.60/6 month EUR-EURIBOR/Jun-30 (Written) | Jun-25/2.60 | EUR | 3,814,900 | 133,852 | (51,462) |
| | | | | |
| FORWARD PREMIUM SWAP OPTION CONTRACTS OUTSTANDING at 10/31/22 cont. |
Counterparty
Fixed right or obligation % to receive or (pay)/Floating rate index/
Maturity date | Expiration
date/strike | | Notional/
contract
amount | Premium
receivable/
(payable) | Unrealized
appreciation/
(depreciation) |
| UBS AG cont. |
| (0.44)/6 month EUR-EURIBOR/Feb-41 (Purchased) | Feb-31/0.44 | EUR | 2,404,600 | $(188,646) | $328,910 |
| 0.44/6 month EUR-EURIBOR/Feb-41 (Purchased) | Feb-31/0.44 | EUR | 2,404,600 | (188,646) | (84,337) |
| (1.325)/6 month EUR-EURIBOR/Apr-49 (Purchased) | Apr-29/1.325 | EUR | 1,628,600 | (225,795) | 160,689 |
| 1.325/6 month EUR-EURIBOR/Apr-49 (Purchased) | Apr-29/1.325 | EUR | 1,628,600 | (225,795) | (76,610) |
| (0.296)/6 month EUR-EURIBOR/Jan-51 (Purchased) | Jan-31/0.296 | EUR | 801,500 | (121,280) | 145,981 |
| 0.296/6 month EUR-EURIBOR/Jan-51 (Purchased) | Jan-31/0.296 | EUR | 801,500 | (121,280) | (51,588) |
| Wells Fargo Bank, N.A. |
| 3.0575/US SOFR/Jan-33 (Purchased) | Jan-23/3.0575 | | $3,842,100 | (29,008) | (14,866) |
| Unrealized appreciation | 5,429,227 |
| Unrealized (depreciation) | (2,905,022) |
| Total | $2,524,205 |
|
| | | |
| TBA SALE COMMITMENTS OUTSTANDING at 10/31/22 (proceeds receivable $59,596,426) |
| Agency | Principal
amount | Settlement
date | Value |
| Uniform Mortgage-Backed Securities, 5.50%, 11/1/52 | $15,000,000 | 11/14/22 | $14,790,575 |
| Uniform Mortgage-Backed Securities, 5.00%, 11/1/52 | 32,000,000 | 11/14/22 | 30,842,509 |
| Uniform Mortgage-Backed Securities, 4.00%, 11/1/52 | 2,000,000 | 11/14/22 | 1,819,062 |
| Uniform Mortgage-Backed Securities, 3.00%, 11/1/52 | 5,000,000 | 11/14/22 | 4,244,918 |
| Uniform Mortgage-Backed Securities, 2.50%, 11/1/52 | 2,000,000 | 11/14/22 | 1,637,345 |
| Uniform Mortgage-Backed Securities, 2.00%, 11/1/52 | 7,000,000 | 11/14/22 | 5,513,372 |
| Total | $58,847,781 |
|
| | | | | | | |
| CENTRALLY CLEARED INTEREST RATE SWAP CONTRACTS OUTSTANDING at 10/31/22 |
| Notional amount | Value | Upfront
premium
received
(paid) | Termination
date | Payments
made by fund | Payments
received by fund | Unrealized
appreciation/
(depreciation) |
| | $1,059,500 | $220,863 | $44,379 | 9/1/32 | 3 month USD-LIBOR-ICE — Quarterly | 1.512% — Semiannually | $(179,348) |
| | 670,000 | 30,284 | (54) | 12/23/23 | US SOFR — Annually | 0.695% — Annually | (32,902) |
| | 10,276,000 | 1,170,642 | 883 | 12/23/26 | 1.085% — Annually | US SOFR — Annually | 1,171,970 |
| | 3,190,000 | 616,627 | 385 | 12/23/31 | 1.285% — Annually | US SOFR — Annually | 611,603 |
| | 1,262,000 | 452,755 | (2,247) | 12/23/51 | US SOFR — Annually | 1.437% — Annually | (451,193) |
| | 8,457,000 | 382,087 | (861) | 12/24/23 | 0.697% — Annually | US SOFR — Annually | 410,718 |
| | | | | | | |
| CENTRALLY CLEARED INTEREST RATE SWAP CONTRACTS OUTSTANDING at 10/31/22 cont. |
| Notional amount | Value | Upfront
premium
received
(paid) | Termination
date | Payments
made by fund | Payments
received by fund | Unrealized
appreciation/
(depreciation) |
| | $5,228,000 | $593,692 | $333 | 12/24/26 | US SOFR — Annually | 1.096% — Annually | $(587,771) |
| | 1,358,000 | 262,556 | (606) | 12/24/31 | 1.285% — Annually | US SOFR — Annually | 260,407 |
| | 4,264,000 | 1,531,245 | (2,304) | 12/24/51 | 1.435% — Annually | US SOFR — Annually | 1,514,897 |
| | 252,000 | 86,436 | (41) | 12/31/51 | US SOFR — Annually | 1.525% — Annually | (85,413) |
| | 1,711,000 | 192,419 | (227) | 12/31/26 | US SOFR — Annually | 1.135% — Annually | (190,836) |
| | 1,865,000 | 351,161 | 7,257 | 12/31/31 | US SOFR — Annually | 1.355% — Annually | (338,682) |
| | 446,900 | 30,930 E | (10) | 1/15/47 | 1.724% — Annually | US SOFR — Annually | 30,920 |
| | 769,000 | 242,727 | (26) | 1/21/52 | 1.679% — Annually | US SOFR — Annually | 238,705 |
| | 1,051,000 | 341,701 | (36) | 1/19/52 | US SOFR — Annually | 1.626% — Annually | (338,606) |
| | 300,000 | 96,030 | (10) | 2/1/52 | 1.6545% — Annually | US SOFR — Annually | 94,577 |
| | 2,024,000 | 573,521 | (69) | 2/24/52 | US SOFR — Annually | 1.86% — Annually | (563,079) |
| | 1,338,000 | 401,387 | (46) | 2/29/52 | 1.7674% — Annually | US SOFR — Annually | 396,327 |
| | 1,801,000 | 288,628 | (24) | 2/29/32 | US SOFR — Annually | 1.75% — Annually | (280,955) |
| | 5,321,000 | 502,835 | (43) | 2/28/27 | 1.675% — Annually | US SOFR — Annually | 494,481 |
| | 12,331,000 | 514,819 | (47) | 2/29/24 | US SOFR — Annually | 1.47709% — Annually | (511,990) |
| | 245,600 | 40,691 | (3) | 3/7/32 | 3 month USD-LIBOR-ICE — Quarterly | 1.9575% — Semiannually | (41,153) |
| | 3,539,800 | 624,562 | (47) | 3/9/32 | 1.5475% — Annually | US SOFR — Annually | 617,906 |
| | 3,670,200 | 649,258 | (49) | 3/9/32 | 1.5415% — Annually | US SOFR — Annually | 642,953 |
| | 1,935,000 | 313,044 | (26) | 3/11/32 | 1.737% — Annually | US SOFR — Annually | 306,829 |
| | 1,901,000 | 59,672 | (7) | 4/7/24 | 2.45% — Annually | US SOFR — Annually | 51,295 |
| | 558,000 | 36,030 | (5) | 4/7/27 | US SOFR — Annually | 2.465% — Annually | (33,533) |
| | 2,074,000 | 241,227 | (28) | 4/7/23 | 2.3305% — Annually | US SOFR — Annually | 230,323 |
| | 1,751,000 | 420,660 | (60) | 4/7/52 | US SOFR — Annually | 2.1005% — Annually | (413,608) |
| | 442,000 | 45,698 | (6) | 4/14/32 | 2.4975% — Annually | US SOFR — Annually | 42,344 |
| | | | | | | |
| CENTRALLY CLEARED INTEREST RATE SWAP CONTRACTS OUTSTANDING at 10/31/22 cont. |
| Notional amount | Value | Upfront
premium
received
(paid) | Termination
date | Payments
made by fund | Payments
received by fund | Unrealized
appreciation/
(depreciation) |
| | $1,966,000 | $387,695 | $(67) | 4/14/52 | US SOFR — Annually | 2.3395% — Annually | $(374,951) |
| | 1,816,000 | 116,260 | (15) | 4/14/27 | 2.483% — Annually | US SOFR — Annually | 104,948 |
| | 4,526,000 | 146,507 | (17) | 4/14/24 | 2.405% — Annually | US SOFR — Annually | 129,621 |
| | 4,420,200 | 248,680 | (42) | 5/2/27 | US SOFR — Annually | 2.685% — Annually | (230,652) |
| | 2,960,500 | 93,552 | (11) | 5/25/24 | 2.5945% — Annually | US SOFR — Annually | 86,367 |
| | 81,000 | 13,606 | (3) | 5/25/52 | US SOFR — Annually | 2.501% — Annually | (13,311) |
| | 722,100 | 81,402 E | (25) | 5/28/57 | 2.40% — Annually | US SOFR — Annually | 81,378 |
| | 1,905,000 | 160,039 | (25) | 6/7/32 | 2.7565% — Annually | US SOFR — Annually | 151,245 |
| | 14,111,300 | 1,109,007 | (187) | 6/8/32 | US SOFR — Annually | 2.825% — Annually | (1,063,078) |
| | 802,700 | 203,348 | (100,750) | 6/22/52 | 2.3075% — Semiannually | 3 month USD-LIBOR-ICE — Quarterly | 99,209 |
| | 11,780,500 | 246,330 | (44) | 6/15/24 | US SOFR — Annually | 3.3385% — Annually | (196,454) |
| | 7,874,500 | 285,608 | (64) | 6/15/27 | 3.185% — Annually | US SOFR — Annually | 256,843 |
| | 918,800 | 55,211 | (13) | 9/8/32 | US SOFR — Annually | 3.07% — Annually | (54,733) |
| | 4,255,600 | 327,979 E | (60) | 2/3/33 | 3.13% — Semiannually | 3 month USD-LIBOR-ICE — Quarterly | 327,919 |
| | 803,000 | 123,823 | (27) | 7/8/52 | US SOFR — Annually | 2.5765% — Annually | (122,542) |
| | 3,107,200 | 316,002 E | (44) | 1/31/33 | 2.545% — Annually | US SOFR — Annually | 315,958 |
| | 3,107,200 | 314,759 E | (44) | 1/31/33 | 2.55% — Annually | US SOFR — Annually | 314,715 |
| | 2,926,500 | 309,477 E | (41) | 2/1/33 | 2.495% — Annually | US SOFR — Annually | 309,436 |
| | 4,033,000 | 449,518 | (53) | 8/2/32 | US SOFR — Annually | 2.4275% — Annually | (450,028) |
| | 2,861,500 | 323,006 E | (41) | 2/1/33 | 2.4075% — Annually | US SOFR — Annually | 322,966 |
| | 178,500 | 9,830 E | (3) | 4/1/42 | US SOFR — Annually | 2.63% — Annually | (9,833) |
| | 660,100 | 60,003 E | (10) | 3/24/35 | US SOFR — Annually | 2.39% — Annually | (60,013) |
| | 851,800 | 124,738 | (25) | 8/10/42 | 2.645% — Annually | US SOFR — Annually | 124,700 |
| | | | | | | |
| CENTRALLY CLEARED INTEREST RATE SWAP CONTRACTS OUTSTANDING at 10/31/22 cont. |
| Notional amount | Value | Upfront
premium
received
(paid) | Termination
date | Payments
made by fund | Payments
received by fund | Unrealized
appreciation/
(depreciation) |
| | $1,443,800 | $219,429 | $(3,219) | 8/10/42 | US SOFR — Annually | 2.605% — Annually | $(222,567) |
| | 592,100 | 91,095 | (17) | 8/10/42 | 2.5915% — Annually | US SOFR — Annually | 91,025 |
| | 7,294,000 | 402,556 E | (69) | 2/6/29 | 2.40% — Annually | US SOFR — Annually | 402,487 |
| | 4,794,000 | 464,011 | (63) | 8/16/32 | US SOFR — Annually | 2.613% — Annually | (463,693) |
| | 662,500 | 20,504 E | (15) | 1/15/47 | 2.49% — Annually | US SOFR — Annually | 20,490 |
| | 113,000 | 8,865 | (1) | 8/25/32 | US SOFR — Annually | 2.8415% — Annually | (8,818) |
| | 1,070,000 | 65,602 E | (16) | 2/21/35 | 2.785% — Annually | US SOFR — Annually | 65,586 |
| | 1,761,700 | 37,154 | (7) | 9/6/24 | US SOFR — Annually | 3.413% — Annually | (35,257) |
| | 3,297,600 | 50,750 E | (18) | 1/15/27 | US SOFR — Annually | 2.73% — Annually | (50,768) |
| | 1,670,900 | 104,164 | (22) | 9/13/32 | 3.043% — Annually | US SOFR — Annually | 103,351 |
| | 635,800 | 21,916 E | (12) | 1/15/41 | 3.0500% — Annually | US SOFR — Annually | 21,904 |
| | 337,300 | 11,907 E | (7) | 1/15/42 | 2.9825% — Annually | US SOFR — Annually | 11,900 |
| | 2,917,000 | 128,552 E | (1,440) | 12/21/32 | US SOFR — Annually | 3.265% — Annually | (129,991) |
| | 1,205,000 | 113,366 | (41) | 9/26/52 | 2.905% — Annually | US SOFR — Annually | 113,169 |
| | 6,264,000 | 154,408 | (59) | 9/26/27 | US SOFR — Annually | 3.465% — Annually | (150,144) |
| | 422,000 | 19,564 | (6) | 9/19/32 | 3.24% — Annually | US SOFR — Annually | 19,336 |
| | 57,237,000 | 393,791 E | (58,572) | 12/21/24 | 4.20% — Annually | US SOFR — Annually | 335,219 |
| | 18,039,000 | 165,418 E | 38,118 | 12/21/27 | 3.80% — Annually | US SOFR — Annually | 203,536 |
| | 11,424,000 | 377,220 E | (53,668) | 12/21/32 | 3.40% — Annually | US SOFR — Annually | 323,553 |
| | 6,056,000 | 452,807 E | (50,533) | 12/21/52 | US SOFR — Annually | 3.00% — Annually | (503,340) |
| | 720,000 | 28,260 | (10) | 9/23/32 | 3.3275% — Annually | US SOFR — Annually | 27,925 |
| | 517,000 | 34,282 | (18) | 9/29/52 | 3.0575% — Annually | US SOFR — Annually | 34,036 |
| | 517,000 | 33,998 | (18) | 9/29/52 | 3.0605% — Annually | US SOFR — Annually | 33,750 |
| | 1,967,750 | 28,591 | (26) | 9/29/32 | 3.6305% — Annually | US SOFR — Annually | 26,660 |
| | | | | | | |
| CENTRALLY CLEARED INTEREST RATE SWAP CONTRACTS OUTSTANDING at 10/31/22 cont. |
| Notional amount | Value | Upfront
premium
received
(paid) | Termination
date | Payments
made by fund | Payments
received by fund | Unrealized
appreciation/
(depreciation) |
| | $2,760,500 | $17,088 | $(22) | 9/29/27 | US SOFR — Annually | 3.884% — Annually | $(13,796) |
| | 1,967,750 | 27,076 | (26) | 9/29/32 | 3.64% — Annually | US SOFR — Annually | 25,128 |
| | 2,760,500 | 15,569 | (22) | 9/29/27 | US SOFR — Annually | 3.8965% — Annually | (12,246) |
| | 395,000 | 1,943 | (1) | 9/29/24 | 4.321% — Annually | US SOFR — Annually | 1,309 |
| | 3,974,000 | 44,747 | (52) | 9/29/32 | 3.67061% — Annually | US SOFR — Annually | 40,701 |
| | 1,999,000 | 29,745 | (16) | 9/30/27 | US SOFR — Annually | 3.6865% — Annually | (27,762) |
| | 1,999,000 | 29,925 | (16) | 9/30/27 | US SOFR — Annually | 3.6845% — Annually | (27,946) |
| | 3,943,000 | 33,397 | (15) | 9/30/24 | 4.1255% — Annually | US SOFR — Annually | 29,536 |
| | 2,842,000 | 75,654 | (38) | 9/30/32 | 3.4825% — Annually | US SOFR — Annually | 74,469 |
| | 175,000 | 1,369 | (1) | 10/3/24 | US SOFR — Annually | 4.16% — Annually | (1,167) |
| | 1,327,000 | 33,002 | (18) | 10/3/32 | US SOFR — Annually | 3.504% — Annually | (32,186) |
| | 693,100 | 16,385 E | (10) | 10/3/33 | 3.394% — Annually | US SOFR — Annually | 16,375 |
| | 1,196,000 | 14,424 | (10) | 10/4/27 | 3.75% — Annually | US SOFR — Annually | 13,451 |
| | 5,692,000 | 159,262 | (75) | 10/5/32 | US SOFR — Annually | 3.466% — Annually | (156,559) |
| | 1,579,000 | 125,215 | (54) | 10/6/52 | US SOFR — Annually | 2.9857% — Annually | (124,530) |
| | 192,000 | 6,797 E | (3) | 10/21/36 | US SOFR — Annually | 3.116% — Annually | (6,800) |
| | 245,000 | 9,165 E | (3) | 1/11/33 | US SOFR — Annually | 3.34% — Annually | (9,169) |
| | 867,000 | 32,209 E | (12) | 1/31/33 | US SOFR — Annually | 3.337% — Annually | (32,221) |
| | 867,000 | 32,495 E | (12) | 1/31/33 | US SOFR — Annually | 3.333% — Annually | (32,507) |
| | 2,030,000 | 76,308 E | (29) | 8/23/33 | US SOFR — Annually | 3.237% — Annually | (76,336) |
| | 809,000 | 30,799 E | (11) | 2/1/33 | US SOFR — Annually | 3.3255% — Annually | (30,810) |
| | 1,952,000 | 74,605 E | (28) | 9/1/33 | US SOFR — Annually | 3.225% — Annually | (74,633) |
| | 242,000 | 9,143 E | (3) | 11/14/32 | 3.347% — Annually | US SOFR — Annually | 9,139 |
| | 779,000 | 66,799 E | (26) | 2/3/53 | 2.9275% — Annually | US SOFR — Annually | 66,773 |
| | | | | | | |
| CENTRALLY CLEARED INTEREST RATE SWAP CONTRACTS OUTSTANDING at 10/31/22 cont. |
| Notional amount | Value | Upfront
premium
received
(paid) | Termination
date | Payments
made by fund | Payments
received by fund | Unrealized
appreciation/
(depreciation) |
| | $679,000 | $26,814 E | $(10) | 2/1/33 | US SOFR — Annually | 3.308% — Annually | $(26,823) |
| | 1,411,000 | 10,371 | (5) | 10/7/24 | US SOFR — Annually | 4.1845% — Annually | (9,256) |
| | 4,284,000 | 107,828 | (57) | 10/7/32 | 3.5005% — Annually | US SOFR — Annually | 104,229 |
| | 2,822,000 | 20,460 | 646 | 10/7/24 | 4.19% — Annually | US SOFR — Annually | 18,853 |
| | 8,096,000 | 104,681 | (1,914) | 10/7/27 | US SOFR — Annually | 3.73% — Annually | (102,720) |
| | 25,213,000 | 635,620 | (9,912) | 10/7/32 | 3.50% — Annually | US SOFR — Annually | 617,663 |
| | 8,568,000 | 208,974 | (8,205) | 10/7/32 | US SOFR — Annually | 3.51% — Annually | (214,385) |
| | 7,869,000 | 531,944 | 5,271 | 10/7/52 | US SOFR — Annually | 3.05% — Annually | (526,623) |
| | 5,030,000 | 29,878 E | (10,738) | 12/21/24 | 4.25% — Annually | US SOFR — Annually | 19,140 |
| | 1,786,000 | 35,166 | (24) | 10/11/32 | 3.5675% — Annually | US SOFR — Annually | 34,591 |
| | 4,790,000 | 3,736 E | (33) | 4/8/28 | 3.44% — Annually | US SOFR — Annually | 3,703 |
| | 13,125,000 | 13,125 E | (49) | 1/31/25 | US SOFR — Annually | 4.035% — Annually | (13,174) |
| | 817,000 | 35,899 | (28) | 10/13/52 | 3.1795% — Annually | US SOFR — Annually | 35,464 |
| | 768,400 | 8,721 E | (11) | 1/17/33 | 3.6575% — Annually | US SOFR — Annually | 8,711 |
| | 81,000 | 3,540 E | (3) | 1/16/55 | 2.97% — Annually | US SOFR — Annually | 3,537 |
| | 9,901,000 | 5,149 E | (55) | 1/16/26 | US SOFR — Annually | 3.605% — Annually | (5,203) |
| | 1,928,000 | 22,268 E | (38) | 4/17/41 | US SOFR — Annually | 3.417% — Annually | (22,306) |
| | 1,240,000 | 9,449 | (16) | 10/19/32 | 3.7145% — Annually | US SOFR — Annually | 8,918 |
| | 1,344,000 | 39,957 | (46) | 10/20/52 | US SOFR — Annually | 3.2571% — Annually | (39,334) |
| | 758,800 | 16,709 E | (26) | 10/9/54 | 3.115% — Annually | US SOFR — Annually | 16,683 |
| | 3,085,700 | 23,204 E | (44) | 10/10/33 | US SOFR — Annually | 3.594% — Annually | (23,248) |
| | 228,000 | 3,441 | (8) | 10/20/52 | US SOFR — Annually | 3.3375% — Annually | (3,329) |
| | 1,744,000 | 3,976 | (14) | 10/21/27 | US SOFR — Annually | 4.069% — Annually | 5,252 |
| | 345,600 | 5,364 E | (12) | 1/24/55 | 3.135% — Annually | US SOFR — Annually | 5,352 |
| | | | | | | |
| CENTRALLY CLEARED INTEREST RATE SWAP CONTRACTS OUTSTANDING at 10/31/22 cont. |
| Notional amount | Value | Upfront
premium
received
(paid) | Termination
date | Payments
made by fund | Payments
received by fund | Unrealized
appreciation/
(depreciation) |
| | $1,871,800 | $3,201 E | $(18) | 4/13/28 | 3.965% — Annually | US SOFR — Annually | $(3,218) |
| | 619,100 | 1,721 E | (9) | 4/4/35 | 3.5575% — Annually | US SOFR — Annually | 1,712 |
| | 1,238,100 | 1,288 E | (14) | 5/8/30 | US SOFR — Annually | 3.52% — Annually | (1,301) |
| | 1,695,000 | 1,509 E | (15) | 4/4/32 | 3.515% — Annually | US SOFR — Annually | 1,494 |
| | 9,316,300 | 26,272 E | (131) | 11/24/33 | US SOFR — Annually | 3.708% — Annually | 26,141 |
| | 581,800 | 1,094 E | (8) | 6/6/34 | US SOFR — Annually | 3.645% — Annually | 1,086 |
| | 809,000 | 7,087 | (28) | 10/24/52 | 3.372% — Annually | US SOFR — Annually | 6,793 |
| | 44,400 | 39 E | (1) | 2/19/36 | US SOFR — Annually | 3.6145% — Annually | 38 |
| | 32,900 | 26 E | (1) | 3/3/36 | US SOFR — Annually | 3.614% — Annually | 26 |
| | 6,579,300 | 42,305 | (87) | 10/31/32 | 3.885% — Annually | US SOFR — Annually | (43,102) |
| | 1,238,000 | 33,723 | (42) | 10/25/52 | 3.5695% — Annually | US SOFR — Annually | (33,895) |
| | 2,486,700 | 1,492 E | (9) | 6/26/25 | US SOFR — Annually | 4.31% — Annually | 1,483 |
| | 973,000 | 17,349 | (33) | 10/27/32 | 3.5176% — Annually | US SOFR — Annually | (17,857) |
| | 2,297,700 | 18,359 E | (32) | 12/4/33 | US SOFR — Annually | 3.77% — Annually | 18,326 |
| | 922,000 | 3,476 E | (10) | 3/24/32 | US SOFR — Annually | 3.64% — Annually | 3,466 |
| | 422,600 | 2,303 E | (6) | 6/28/37 | US SOFR — Annually | 3.70% — Annually | 2,297 |
| | 96,100 | 761 E | (2) | 6/20/40 | US SOFR — Annually | 3.75% — Annually | 759 |
| | 1,254,000 | 2,345 | (43) | 10/28/52 | US SOFR — Annually | 3.43% — Annually | 2,780 |
| | 2,233,000 | 3,149 | (8) | 10/28/24 | 4.4905% — Annually | US SOFR — Annually | 2,026 |
| | 1,541,000 | 4,176 | (20) | 10/28/32 | 3.774% — Annually | US SOFR — Annually | 3,510 |
| | 4,753,000 | 808 | (18) | 11/2/24 | US SOFR — Annually | 4.5545% — Annually | (826) |
| | 4,189,000 | 11,310 | (55) | 11/2/32 | 3.84% — Annually | US SOFR — Annually | (11,366) |
| | 29,000 | 12 | — | 11/2/24 | US SOFR — Annually | 4.585% — Annually | 12 |
| AUD | 9,400 | 1,373 E | — | 1/30/35 | 1.692% — Semiannually | 6 month AUD-BBR-BBSW — Semiannually | 1,373 |
| | | | | | | |
| CENTRALLY CLEARED INTEREST RATE SWAP CONTRACTS OUTSTANDING at 10/31/22 cont. |
| Notional amount | Value | Upfront
premium
received
(paid) | Termination
date | Payments
made by fund | Payments
received by fund | Unrealized
appreciation/
(depreciation) |
| AUD | 32,200 | $5,035 E | $— | 3/5/35 | 1.47% — Semiannually | 6 month AUD-BBR-BBSW — Semiannually | $5,034 |
| AUD | 12,000 | 1,914 E | — | 3/25/35 | 1.4025% — Semiannually | 6 month AUD-BBR-BBSW — Semiannually | 1,914 |
| AUD | 20,900 | 2,680 E | — | 3/28/40 | 1.445% — Semiannually | 6 month AUD-BBR-BBSW — Semiannually | 2,680 |
| AUD | 76,000 | 10,540 E | (1) | 4/1/40 | 1.1685% — Semiannually | 6 month AUD-BBR-BBSW — Semiannually | 10,539 |
| AUD | 5,000 | 1,190 E | — | 7/2/45 | 1.441% — Semiannually | 6 month AUD-BBR-BBSW — Semiannually | 1,190 |
| AUD | 200,000 | 24,060 | (2) | 4/6/31 | 6 month AUD-BBR-BBSW — Semiannually | 1.87% — Semiannually | (24,199) |
| AUD | 57,000 | 1,186 E | 1,043 | 12/21/32 | 6 month AUD-BBR-BBSW — Semiannually | 4.21% — Semiannually | (143) |
| AUD | 900,000 | 19,147 E | 531 | 12/21/32 | 6 month AUD-BBR-BBSW — Semiannually | 4.201% — Semiannually | (18,616) |
| AUD | 750,000 | 7,594 E | 743 | 12/21/27 | 6 month AUD-BBR-BBSW — Semiannually | 4.001% — Semiannually | (6,851) |
| AUD | 3,224,000 | 13,240 E | (10,104) | 12/21/24 | 3.78% — Quarterly | 6 month AUD-BBR-BBSW — Quarterly | 3,135 |
| AUD | 904,300 | 161,725 E | 157,344 | 11/24/42 | 6 month AUD-BBR-BBSW — Semiannually | 2.50% — Semiannually | (4,381) |
| CAD | 49,000 | 265 E | (574) | 12/21/32 | 3.69% — Semiannually | 3 month CAD-BA-CDOR — Semiannually | (308) |
| CAD | 640,000 | 5,468 E | 2,222 | 12/21/27 | 3 month CAD-BA-CDOR — Semiannually | 3.501% — Semiannually | (3,247) |
| CAD | 730,000 | 10,170 E | 1,853 | 12/21/32 | 3 month CAD-BA-CDOR — Semiannually | 3.551% — Semiannually | (8,317) |
| CAD | 780,000 | 5,473 E | (16,522) | 12/21/52 | 3 month CAD-BA-CDOR — Semiannually | 3.601% — Semiannually | (21,996) |
| CAD | 4,834,000 | 4,506 E | (4,053) | 12/21/24 | 4.425% — Semiannually | 3 month CAD-BA-CDOR — Semiannually | (8,559) |
| | | | | | | |
| CENTRALLY CLEARED INTEREST RATE SWAP CONTRACTS OUTSTANDING at 10/31/22 cont. |
| Notional amount | Value | Upfront
premium
received
(paid) | Termination
date | Payments
made by fund | Payments
received by fund | Unrealized
appreciation/
(depreciation) |
| CHF | 658,000 | $545 E | $2 | 12/21/32 | Swiss Average Rate Overnight — Annually | 2.01% — Annually | $547 |
| CNY | 119,892,000 | 2,628 E | — | 12/21/27 | China Fixing Repo Rates 7 day — Quarterly | 2.41% — Quarterly | (2,628) |
| EUR | 60,400 | 6,530 E | (2) | 11/29/58 | 1.484% — Annually | 6 month EUR-EURIBOR — Semiannually | 6,528 |
| EUR | 82,300 | 18,790 | (3) | 2/19/50 | 6 month EUR-EURIBOR — Semiannually | 1.354% — Annually | (18,138) |
| EUR | 91,000 | 22,380 | (3) | 3/11/50 | 1.267% — Annually | 6 month EUR-EURIBOR — Semiannually | 21,803 |
| EUR | 91,800 | 23,540 | (4) | 3/12/50 | 1.2115% — Annually | 6 month EUR-EURIBOR — Semiannually | 23,000 |
| EUR | 260,300 | 71,894 | (10) | 3/26/50 | 1.113% — Annually | 6 month EUR-EURIBOR — Semiannually | 70,608 |
| EUR | 420,000 | 55,851 E | (16) | 11/29/58 | 6 month EUR-EURIBOR — Semiannually | 1.343% — Annually | (55,867) |
| EUR | 283,000 | 80,812 | (11) | 2/19/50 | 1.051% — Annually | 6 month EUR-EURIBOR — Semiannually | 79,152 |
| EUR | 87,500 | 22,954 E | (3) | 6/7/54 | 1.054% — Annually | 6 month EUR-EURIBOR — Semiannually | 22,951 |
| EUR | 79,600 | 24,949 | (3) | 2/19/50 | 0.9035% — Annually | 6 month EUR-EURIBOR — Semiannually | 24,565 |
| EUR | 211,200 | 70,365 | (9) | 2/21/50 | 0.80% — Annually | 6 month EUR-EURIBOR — Semiannually | 69,515 |
| EUR | 258,600 | 95,332 E | (10) | 8/8/54 | 0.49% — Annually | 6 month EUR-EURIBOR — Semiannually | 95,322 |
| EUR | 107,000 | 45,744 E | (4) | 6/6/54 | 6 month EUR-EURIBOR — Semiannually | 0.207% — Annually | (45,748) |
| EUR | 312,300 | 137,452 | (11) | 2/19/50 | 0.233% — Annually | 6 month EUR-EURIBOR — Semiannually | 137,409 |
| EUR | 585,500 | 217,642 | (22) | 2/19/50 | 6 month EUR-EURIBOR — Semiannually | 0.595% — Annually | (216,122) |
| | | | | | | |
| CENTRALLY CLEARED INTEREST RATE SWAP CONTRACTS OUTSTANDING at 10/31/22 cont. |
| Notional amount | Value | Upfront
premium
received
(paid) | Termination
date | Payments
made by fund | Payments
received by fund | Unrealized
appreciation/
(depreciation) |
| EUR | 115,200 | $51,587 E | $(4) | 3/4/54 | 0.134% — Annually | 6 month EUR-EURIBOR — Semiannually | $51,583 |
| EUR | 81,200 | 42,067 E | (3) | 3/13/54 | — | 0.2275% plus 6 month EUR-EURIBOR — Semiannually | 42,064 |
| EUR | 302,300 | 56,801 E | (6) | 5/13/40 | 6 month EUR-EURIBOR — Semiannually | 0.276% — Annually | (56,807) |
| EUR | 55,900 | 10,276 E | (1) | 6/24/40 | 0.315% — Annually | 6 month EUR-EURIBOR — Semiannually | 10,275 |
| EUR | 133,400 | 25,197 E | (3) | 1/16/40 | 0.315% — Annually | 6 month EUR-EURIBOR — Semiannually | 25,194 |
| EUR | 52,200 | 9,735 E | (1) | 3/28/40 | 0.3175% — Annually | 6 month EUR-EURIBOR — Semiannually | 9,734 |
| EUR | 238,200 | 93,654 | (10) | 5/21/51 | 6 month EUR-EURIBOR — Semiannually | 0.516% — Annually | (93,019) |
| EUR | 51,000 | 10,794 | (1) | 6/14/31 | 0.171% — Annually | 6 month EUR-EURIBOR — Semiannually | 10,776 |
| EUR | 377,200 | 83,045 | (6) | 7/15/31 | 0.0675% — Annually | 6 month EUR-EURIBOR — Semiannually | 83,378 |
| EUR | 146,400 | 62,246 | (6) | 9/14/52 | 6 month EUR-EURIBOR — Semiannually | 0.374% — Annually | (62,468) |
| EUR | 446,000 | 86,310 | (7) | 3/7/32 | 6 month EUR-EURIBOR — Semiannually | 0.60% — Annually | (85,436) |
| EUR | 2,262,200 | 48,938 E | (36) | 2/2/36 | 2.875% — Annually | 6 month EUR-EURIBOR — Semiannually | 48,902 |
| EUR | 1,286,300 | 43,284 | (19) | 9/8/32 | 2.615% — Annually | 6 month EUR-EURIBOR — Semiannually | 40,926 |
| EUR | 3,113,800 | 79,269 E | (12) | 6/28/25 | 1.718% — Annually | 6 month EUR-EURIBOR — Semiannually | 79,257 |
| EUR | 2,251,000 | 380,665 | (78) | 8/29/52 | 6 month EUR-EURIBOR — Semiannually | 1.636% — Annually | (378,369) |
| EUR | 475,600 | 26,875 E | (5) | 9/12/29 | 1.71% — Annually | 6 month EUR-EURIBOR — Semiannually | 26,870 |
| | | | | | | |
| CENTRALLY CLEARED INTEREST RATE SWAP CONTRACTS OUTSTANDING at 10/31/22 cont. |
| Notional amount | Value | Upfront
premium
received
(paid) | Termination
date | Payments
made by fund | Payments
received by fund | Unrealized
appreciation/
(depreciation) |
| EUR | 4,691,000 | $314,313 | $(45) | 9/2/27 | 6 month EUR-EURIBOR — Semiannually | 1.372% — Annually | $(313,232) |
| EUR | 55,700 | 4,288 E | (2) | 6/6/54 | 2.005% — Annually | 6 month EUR-EURIBOR — Semiannually | 4,286 |
| EUR | 82,000 | 5,350 E | (3) | 6/7/54 | 2.065% — Annually | 6 month EUR-EURIBOR — Semiannually | 5,347 |
| EUR | 309,000 | 11,751 E | 19,219 | 12/21/32 | 6 month EUR-EURIBOR — Semiannually | 2.624% — Annually | 7,468 |
| EUR | 2,850,000 | 43,262 E | 38,464 | 12/21/24 | 6 month EUR-EURIBOR — Semiannually | 2.201% — Annually | (4,797) |
| EUR | 4,180,000 | 274,002 E | 164,751 | 12/21/32 | 6 month EUR-EURIBOR — Semiannually | 2.301% — Annually | (109,250) |
| EUR | 470,000 | 12,912 E | (13,303) | 12/21/52 | 6 month EUR-EURIBOR — Semiannually | 2.351% — Annually | (26,216) |
| EUR | 2,960,000 | 99,428 E | 68,570 | 12/21/27 | 6 month EUR-EURIBOR — Semiannually | 2.251% — Annually | (30,859) |
| EUR | 10,846,000 | 3,966 | (40) | 10/10/24 | 2.7975% — Annually | 6 month EUR-EURIBOR — Semiannually | (1,491) |
| EUR | 6,207,000 | 10,612 E | (30,999) | 12/21/24 | 2.91% — Annually | 6 month EUR-EURIBOR — Semiannually | (20,387) |
| EUR | 217,500 | 2,229 E | (3) | 2/18/36 | 6 month EUR-EURIBOR — Semiannually | 3.285% — Annually | 2,226 |
| EUR | 55,700 | 271 E | (1) | 8/22/39 | 6 month EUR-EURIBOR — Semiannually | 3.14% — Annually | 270 |
| EUR | 2,766,100 | 11,536 E | (19) | 6/26/28 | 6 month EUR-EURIBOR — Semiannually | 3.26% — Annually | 11,517 |
| EUR | 116,500 | 545 E | (2) | 3/28/40 | 6 month EUR-EURIBOR — Semiannually | 3.09% — Annually | 542 |
| GBP | 83,100 | 21,171 | (2) | 5/19/31 | Sterling Overnight Index Average — Annually | 0.754% — Annually | (21,117) |
| GBP | 19,660,400 | 642,126 | 16,286 | 9/15/23 | Sterling Overnight Index Average — Annually | 0.84% — Annually | (659,436) |
| | | | | | | |
| CENTRALLY CLEARED INTEREST RATE SWAP CONTRACTS OUTSTANDING at 10/31/22 cont. |
| Notional amount | Value | Upfront
premium
received
(paid) | Termination
date | Payments
made by fund | Payments
received by fund | Unrealized
appreciation/
(depreciation) |
| GBP | 19,660,400 | $672,338 | $24,456 | 9/15/23 | Sterling Overnight Index Average — Annually | 0.68% — Annually | $(686,036) |
| GBP | 19,660,400 | 702,550 | (38,182) | 9/15/23 | 0.52% — Annually | Sterling Overnight Index Average — Annually | 707,080 |
| GBP | 7,864,200 | 239,896 | (41) | 9/15/23 | 1.065% — Annually | Sterling Overnight Index Average — Annually | 245,413 |
| GBP | 104,000 | 4,554 E | 12,729 | 12/21/32 | Sterling Overnight Index Average — Annually | 3.34% — Annually | 8,175 |
| GBP | 40,000 | 1,078 E | (2,060) | 12/21/52 | Sterling Overnight Index Average — Annually | 3.401% — Annually | (983) |
| GBP | 710,000 | 30,363 E | 8,223 | 12/21/32 | Sterling Overnight Index Average — Annually | 3.351% — Annually | (22,140) |
| GBP | 700,000 | 34,671 E | 20,554 | 12/21/27 | Sterling Overnight Index Average — Annually | 3.301% — Annually | (14,117) |
| GBP | 2,874,000 | 75,872 | (43) | 9/21/32 | 3.522% — Annually | Sterling Overnight Index Average — Annually | 70,618 |
| GBP | 89,000 | 909 E | (2) | 1/14/40 | 3.306% — Annually | Sterling Overnight Index Average — Annually | (911) |
| GBP | 46,000 | 427 E | (1) | 8/20/39 | 3.299% — Annually | Sterling Overnight Index Average — Annually | (428) |
| GBP | 1,124,000 | 15,842 E | (7,063) | 12/21/24 | 5.34% — Annually | Sterling Overnight Index Average — Annually | (22,905) |
| GBP | 9,694,000 | 192,437 E | (41) | 11/7/24 | 5.495% — Annually | Sterling Overnight Index Average — Annually | (192,477) |
| GBP | 3,665,000 | 185,479 E | (58) | 11/9/32 | Sterling Overnight Index Average — Annually | 4.35% — Annually | 185,421 |
| | | | | | | |
| CENTRALLY CLEARED INTEREST RATE SWAP CONTRACTS OUTSTANDING at 10/31/22 cont. |
| Notional amount | Value | Upfront
premium
received
(paid) | Termination
date | Payments
made by fund | Payments
received by fund | Unrealized
appreciation/
(depreciation) |
| GBP | 65,300 | $2,924 E | $(1) | 2/26/39 | Sterling Overnight Index Average — Annually | 3.778% — Annually | $2,923 |
| JPY | 55,972,700 | 52,926 E | (16) | 8/29/43 | Bank of Japan Unsecured Overnight Call Rate Expected Index — Annually | 0.343% — Annually | (52,941) |
| JPY | 14,130,600 | 3,689 | (3,140) | 2/25/31 | 0.003% — Annually | Tokyo Overnight Average Rate — Annually | 530 |
| JPY | 22,710,500 | 9,364 E | (3,706) | 8/29/43 | 0.7495% — Annually | Tokyo Overnight Average Rate — Annually | 5,658 |
| JPY | 26,213,100 | 28,844 E | (25,288) | 8/29/43 | 0.194% — Annually | Tokyo Overnight Average Rate — Annually | 3,556 |
| NOK | 1,979,000 | 3,636 E | 193 | 12/21/32 | 3.48% — Annually | 6 month NOK-NIBOR-NIBR — Semiannually | 3,829 |
| NZD | 873,000 | 20,348 E | (1,163) | 12/21/32 | 3 month NZD-BBR-FRA — Quarterly | 4.175% — Semiannually | (21,511) |
| SEK | 12,206,000 | 18,738 E | (6,305) | 12/21/32 | 2.925% — Annually | 3 month SEK-STIBOR-SIDE — Quarterly | 12,434 |
| Total | $162,670 | $1,831,601 |
| E Extended effective date. |
|
| | | | | | | |
| OTC TOTAL RETURN SWAP CONTRACTS OUTSTANDING at 10/31/22 |
Swap counterparty/
Notional amount | Value | Upfront
premium
received
(paid) | Termination
date | Payments
received (paid)
by fund | Total return
received by
or paid by fund | Unrealized
appreciation/
(depreciation) |
| Morgan Stanley & Co. International PLC |
| | $492,994 | $431,680 | $— | 9/29/25 | (0.165%) — Annually | Ephesus Funding DAC, 3.80%, Series 2020−01, 9/22/25 — Annually | $(61,248) |
| | 469,326 | 451,870 | — | 7/17/24 | 3.825% (3 month USD-LIBOR-ICE minus 0.12%) — Quarterly | Pera Funding DAC, 3.825%, Series 2019−01, 7/10/24 — Quarterly | (16,088) |
| Upfront premium received | — | | Unrealized appreciation | — |
| Upfront premium (paid) | — | | Unrealized (depreciation) | (77,336) |
| Total | $— | | Total | $(77,336) |
|
| | | | | | | | |
| OTC CREDIT DEFAULT CONTRACTS OUTSTANDING — PROTECTION SOLD at 10/31/22 |
Swap counterparty/
Referenced debt* | Rating*** | Upfront
premium
received
(paid)** | | Notional
amount | Value | Termi-
nation
date | Payments
received
by fund | Unrealized
appreciation/
(depreciation) |
| Bank of America N.A. |
| CMBX NA BBB−.6 Index | B+/P | $2,666 | | $27,300 | $6,197 | 5/11/63 | 300 bp — Monthly | $(3,516) |
| CMBX NA BBB−.6 Index | B+/P | 5,303 | | 61,601 | 13,983 | 5/11/63 | 300 bp — Monthly | (8,644) |
| CMBX NA BBB−.6 Index | B+/P | 10,865 | | 123,202 | 27,967 | 5/11/63 | 300 bp — Monthly | (17,030) |
| Citigroup Global Markets, Inc. |
| CMBX NA BB.11 Index | BB−/P | 40,115 | | 71,000 | 15,279 | 11/18/54 | 500 bp — Monthly | 24,905 |
| CMBX NA BB.13 Index | BB−/P | 5,002 | | 53,000 | 13,870 | 12/16/72 | 500 bp — Monthly | (8,817) |
| CMBX NA BB.14 Index | BB/P | 6,250 | | 57,000 | 13,315 | 12/16/72 | 500 bp — Monthly | (7,010) |
| CMBX NA BB.6 Index | B-/P | 30,268 | | 151,920 | 58,018 | 5/11/63 | 500 bp — Monthly | (27,602) |
| CMBX NA BB.7 Index | B-/P | 15,922 | | 312,000 | 103,740 | 1/17/47 | 500 bp — Monthly | (87,514) |
| CMBX NA BB.9 Index | B/P | 407 | | 2,000 | 633 | 9/17/58 | 500 bp — Monthly | (223) |
| CMBX NA BB.9 Index | B/P | 14,500 | | 71,000 | 22,457 | 9/17/58 | 500 bp — Monthly | (7,888) |
| CMBX NA BBB−.10 Index | BB+/P | 3,722 | | 30,000 | 5,316 | 11/17/59 | 300 bp — Monthly | (1,576) |
| CMBX NA BBB−.10 Index | BB+/P | 5,782 | | 53,000 | 9,392 | 11/17/59 | 300 bp — Monthly | (3,579) |
| CMBX NA BBB−.14 Index | BBB−/P | 592 | | 19,000 | 3,506 | 12/16/72 | 300 bp — Monthly | (2,902) |
| CMBX NA BBB−.14 Index | BBB−/P | 1,050 | | 21,000 | 3,875 | 12/16/72 | 300 bp — Monthly | (2,812) |
| CMBX NA BBB−.15 Index | BBB−/P | 104 | | 1,000 | 188 | 11/18/64 | 300 bp — Monthly | (83) |
| Credit Suisse International |
| CMBX NA BB.7 Index | B-/P | 8,159 | | 61,000 | 20,283 | 1/17/47 | 500 bp — Monthly | (12,064) |
| Goldman Sachs International |
| CMBX NA A.13 Index | A-/P | (228) | | 43,000 | 3,530 | 12/16/72 | 200 bp — Monthly | (3,741) |
| CMBX NA A.6 Index | A-/P | 99 | | 1,163 | 128 | 5/11/63 | 200 bp — Monthly | (29) |
| CMBX NA A.6 Index | A-/P | 721 | | 8,138 | 895 | 5/11/63 | 200 bp — Monthly | (171) |
| CMBX NA BB.13 Index | BB−/P | 1,250 | | 13,000 | 3,402 | 12/16/72 | 500 bp — Monthly | (2,139) |
| CMBX NA BBB−.11 Index | BBB−/P | 64 | | 1,000 | 156 | 11/18/54 | 300 bp — Monthly | (92) |
| CMBX NA BBB−.13 Index | BBB−/P | 298 | | 5,000 | 973 | 12/16/72 | 300 bp — Monthly | (672) |
| CMBX NA BBB−.13 Index | BBB−/P | 296 | | 5,000 | 973 | 12/16/72 | 300 bp — Monthly | (674) |
| | | | | | | | |
| OTC CREDIT DEFAULT CONTRACTS OUTSTANDING — PROTECTION SOLD at 10/31/22 cont. |
Swap counterparty/
Referenced debt* | Rating*** | Upfront
premium
received
(paid)** | | Notional
amount | Value | Termi-
nation
date | Payments
received
by fund | Unrealized
appreciation/
(depreciation) |
| Goldman Sachs International cont. |
| CMBX NA BBB−.13 Index | BBB−/P | $2,325 | | $37,000 | $7,200 | 12/16/72 | 300 bp — Monthly | $(4,853) |
| CMBX NA BBB−.15 Index | BBB−/P | 267 | | 3,000 | 563 | 11/18/64 | 300 bp — Monthly | (294) |
| CMBX NA BBB−.15 Index | BBB−/P | 277 | | 3,000 | 563 | 11/18/64 | 300 bp — Monthly | (284) |
| JPMorgan Securities LLC |
| CMBX NA BB.10 Index | B+/P | 2,648 | | 33,000 | 10,732 | 5/11/63 | 500 bp — Monthly | (8,052) |
| CMBX NA BB.6 Index | B-/P | 51,480 | | 72,000 | 27,497 | 5/11/63 | 500 bp — Monthly | 24,053 |
| CMBX NA BBB−.11 Index | BBB−/P | 10,133 | | 92,000 | 14,315 | 11/18/54 | 300 bp — Monthly | (4,129) |
| CMBX NA BBB−.13 Index | BBB−/P | 7,799 | | 59,000 | 11,481 | 12/16/72 | 300 bp — Monthly | (3,648) |
| CMBX NA BBB−.7 Index | BB−/P | 4,695 | | 20,000 | 4,162 | 1/17/47 | 300 bp — Monthly | 545 |
| CMBX NA BBB−.8 Index | BB/P | 4,054 | | 26,000 | 4,371 | 10/17/57 | 300 bp — Monthly | (301) |
| Morgan Stanley & Co. International PLC |
| CMBX NA A.13 Index | A-/P | (251) | | 30,000 | 2,463 | 12/16/72 | 200 bp — Monthly | (2,702) |
| CMBX NA A.13 Index | A-/P | (276) | | 46,000 | 3,777 | 12/16/72 | 200 bp — Monthly | (4,035) |
| CMBX NA A.13 Index | A-/P | (1,551) | | 104,000 | 8,538 | 12/16/72 | 200 bp — Monthly | (10,049) |
| CMBX NA A.13 Index | A-/P | 8,447 | | 722,000 | 59,276 | 12/16/72 | 200 bp — Monthly | (50,683) |
| CMBX NA BB.13 Index | BB−/P | 377 | | 4,000 | 1,047 | 12/16/72 | 500 bp — Monthly | (665) |
| CMBX NA BB.13 Index | BB−/P | 554 | | 6,000 | 1,570 | 12/16/72 | 500 bp — Monthly | (1,010) |
| CMBX NA BB.6 Index | B-/P | 11,787 | | 34,560 | 13,198 | 5/11/63 | 500 bp — Monthly | (1,377) |
| CMBX NA BB.6 Index | B-/P | 23,902 | | 69,840 | 26,672 | 5/11/63 | 500 bp — Monthly | (2,702) |
| CMBX NA BBB−.13 Index | BBB−/P | 296 | | 5,000 | 973 | 12/16/72 | 300 bp — Monthly | (674) |
| CMBX NA BBB−.13 Index | BBB−/P | 15,619 | | 210,000 | 40,866 | 12/16/72 | 300 bp — Monthly | (25,131) |
| Upfront premium received | 298,095 | | | Unrealized appreciation | 49,503 |
| Upfront premium (paid) | (2,306) | | | Unrealized (depreciation) | (319,367) |
| Total | $295,789 | | | Total | $(269,864) |
| * Payments related to the referenced debt are made upon a credit default event. |
| ** Upfront premium is based on the difference between the original spread on issue and the market spread on day of execution. |
| *** Ratings for an underlying index represent the average of the ratings of all the securities included in that index. The Moody’s, Standard & Poor’s or Fitch ratings are believed to be the most recent ratings available at October 31, 2022. Securities rated by Putnam are indicated by “/P.” The Putnam rating categories are comparable to the Standard & Poor’s classifications. |
|
| | | | | | | | |
| OTC CREDIT DEFAULT CONTRACTS OUTSTANDING — PROTECTION PURCHASED at 10/31/22 |
Swap counterparty/
Referenced debt* | | Upfront
premium
received
(paid)** | | Notional
amount | Value | Termi-
nation
date | Payments
(paid)
by fund | Unrealized
appreciation/
(depreciation) |
| Citigroup Global Markets, Inc. |
| CMBX NA A.6 Index | | $(664) | | $4,651 | $512 | 5/11/63 | (200 bp) — Monthly | $(155) |
| CMBX NA A.6 Index | | (164) | | 1,163 | 128 | 5/11/63 | (200 bp) — Monthly | (37) |
| CMBX NA A.6 Index | | (162) | | 1,163 | 128 | 5/11/63 | (200 bp) — Monthly | (35) |
| CMBX NA A.6 Index | | (101) | | 581 | 64 | 5/11/63 | (200 bp) — Monthly | (37) |
| CMBX NA A.6 Index | | (81) | | 581 | 64 | 5/11/63 | (200 bp) — Monthly | (17) |
| CMBX NA A.6 Index | | (82) | | 581 | 64 | 5/11/63 | (200 bp) — Monthly | (18) |
| CMBX NA A.6 Index | | (82) | | 581 | 64 | 5/11/63 | (200 bp) — Monthly | (18) |
| CMBX NA BB.10 Index | | (20,735) | | 86,000 | 27,967 | 11/17/59 | (500 bp) — Monthly | 7,149 |
| CMBX NA BB.10 Index | | (18,870) | | 74,000 | 24,065 | 11/17/59 | (500 bp) — Monthly | 5,123 |
| CMBX NA BB.10 Index | | (3,861) | | 37,000 | 12,032 | 11/17/59 | (500 bp) — Monthly | 8,135 |
| CMBX NA BB.10 Index | | (3,399) | | 31,000 | 10,081 | 11/17/59 | (500 bp) — Monthly | 6,652 |
| CMBX NA BB.11 Index | | (5,127) | | 71,000 | 15,279 | 11/18/54 | (500 bp) — Monthly | 10,083 |
| CMBX NA BB.8 Index | | (2,607) | | 20,293 | 7,468 | 10/17/57 | (500 bp) — Monthly | 4,841 |
| CMBX NA BB.8 Index | | (5,168) | | 14,495 | 5,334 | 10/17/57 | (500 bp) — Monthly | 152 |
| CMBX NA BB.8 Index | | (527) | | 2,899 | 1,067 | 10/17/57 | (500 bp) — Monthly | 537 |
| CMBX NA BBB−.10 Index | | (17,578) | | 59,000 | 10,455 | 11/17/59 | (300 bp) — Monthly | (7,157) |
| CMBX NA BBB−.10 Index | | (4,334) | | 34,000 | 6,025 | 11/17/59 | (300 bp) — Monthly | 1,671 |
| CMBX NA BBB−.10 Index | | (4,875) | | 21,000 | 3,721 | 11/17/59 | (300 bp) — Monthly | (1,166) |
| CMBX NA BBB−.10 Index | | (2,953) | | 12,000 | 2,126 | 11/17/59 | (300 bp) — Monthly | (833) |
| CMBX NA BBB−.10 Index | | (1,431) | | 6,000 | 1,063 | 11/17/59 | (300 bp) — Monthly | (372) |
| CMBX NA BBB−.10 Index | | (789) | | 5,000 | 886 | 11/17/59 | (300 bp) — Monthly | 94 |
| CMBX NA BBB−.11 Index | | (5,028) | | 35,000 | 5,446 | 11/18/54 | (300 bp) — Monthly | 397 |
| CMBX NA BBB−.11 Index | | (2,881) | | 9,000 | 1,400 | 11/18/54 | (300 bp) — Monthly | (1,485) |
| | | | | | | | |
| OTC CREDIT DEFAULT CONTRACTS OUTSTANDING — PROTECTION PURCHASED at 10/31/22 cont. |
Swap counterparty/
Referenced debt* | | Upfront
premium
received
(paid)** | | Notional
amount | Value | Termi-
nation
date | Payments
(paid)
by fund | Unrealized
appreciation/
(depreciation) |
| Citigroup Global Markets, Inc. cont. |
| CMBX NA BBB−.11 Index | | $(147) | | $1,000 | $156 | 11/18/54 | (300 bp) — Monthly | $8 |
| CMBX NA BBB−.12 Index | | (20,212) | | 115,000 | 20,171 | 8/17/61 | (300 bp) — Monthly | (89) |
| CMBX NA BBB−.12 Index | | (31,283) | | 90,000 | 15,786 | 8/17/61 | (300 bp) — Monthly | (15,550) |
| CMBX NA BBB−.12 Index | | (3,276) | | 48,000 | 8,419 | 8/17/61 | (300 bp) — Monthly | 5,116 |
| CMBX NA BBB−.12 Index | | (15,365) | | 46,000 | 8,068 | 8/17/61 | (300 bp) — Monthly | (7,323) |
| CMBX NA BBB−.12 Index | | (15,466) | | 44,000 | 7,718 | 8/17/61 | (300 bp) — Monthly | (7,774) |
| CMBX NA BBB−.12 Index | | (14,368) | | 43,000 | 7,542 | 8/17/61 | (300 bp) — Monthly | (6,851) |
| CMBX NA BBB−.12 Index | | (5,641) | | 25,000 | 4,385 | 8/17/61 | (300 bp) — Monthly | (1,271) |
| CMBX NA BBB−.12 Index | | (4,065) | | 24,000 | 4,210 | 8/17/61 | (300 bp) — Monthly | 131 |
| CMBX NA BBB−.12 Index | | (5,639) | | 16,000 | 2,806 | 8/17/61 | (300 bp) — Monthly | (2,842) |
| CMBX NA BBB−.13 Index | | (7,199) | | 95,000 | 18,487 | 12/16/72 | (300 bp) — Monthly | 11,233 |
| CMBX NA BBB−.14 Index | | (336) | | 3,000 | 554 | 12/16/72 | (300 bp) — Monthly | 215 |
| CMBX NA BBB−.7 Index | | (656) | | 3,000 | 624 | 1/17/47 | (300 bp) — Monthly | (34) |
| CMBX NA BBB−.8 Index | | (19,531) | | 125,000 | 21,013 | 10/17/57 | (300 bp) — Monthly | 1,408 |
| CMBX NA BBB−.8 Index | | (15,300) | | 102,000 | 17,146 | 10/17/57 | (300 bp) — Monthly | 1,787 |
| CMBX NA BBB−.8 Index | | (8,325) | | 60,000 | 10,086 | 10/17/57 | (300 bp) — Monthly | 1,726 |
| CMBX NA BBB−.8 Index | | (6,523) | | 49,000 | 8,237 | 10/17/57 | (300 bp) — Monthly | 1,685 |
| CMBX NA BBB−.8 Index | | (4,163) | | 30,000 | 5,043 | 10/17/57 | (300 bp) — Monthly | 863 |
| CMBX NA BBB−.8 Index | | (4,151) | | 29,000 | 4,875 | 10/17/57 | (300 bp) — Monthly | 707 |
| CMBX NA BBB−.9 Index | | (946) | | 4,000 | 809 | 9/17/58 | (300 bp) — Monthly | (140) |
| Credit Suisse International |
| CMBX NA BB.10 Index | | (10,274) | | 77,000 | 25,040 | 11/17/59 | (500 bp) — Monthly | 14,692 |
| CMBX NA BB.10 Index | | (9,157) | | 77,000 | 25,040 | 11/17/59 | (500 bp) — Monthly | 15,809 |
| | | | | | | | |
| OTC CREDIT DEFAULT CONTRACTS OUTSTANDING — PROTECTION PURCHASED at 10/31/22 cont. |
Swap counterparty/
Referenced debt* | | Upfront
premium
received
(paid)** | | Notional
amount | Value | Termi-
nation
date | Payments
(paid)
by fund | Unrealized
appreciation/
(depreciation) |
| Credit Suisse International cont. |
| CMBX NA BB.10 Index | | $(5,096) | | $41,000 | $13,333 | 11/17/59 | (500 bp) — Monthly | $8,197 |
| CMBX NA BB.7 Index | | (8,049) | | 328,320 | 125,385 | 5/11/63 | (500 bp) — Monthly | 117,018 |
| CMBX NA BB.7 Index | | (29,146) | | 158,000 | 52,535 | 1/17/47 | (500 bp) — Monthly | 23,236 |
| CMBX NA BB.7 Index | | (2,467) | | 15,000 | 4,988 | 1/17/47 | (500 bp) — Monthly | 2,506 |
| Goldman Sachs International |
| CMBX NA BB.7 Index | | (16,057) | | 98,000 | 32,585 | 1/17/47 | (500 bp) — Monthly | 16,433 |
| CMBX NA BB.7 Index | | (19,290) | | 95,000 | 31,588 | 1/17/47 | (500 bp) — Monthly | 12,205 |
| CMBX NA BB.8 Index | | (14,021) | | 38,653 | 14,224 | 10/17/57 | (500 bp) — Monthly | 166 |
| CMBX NA BB.8 Index | | (2,880) | | 7,731 | 2,845 | 10/17/57 | (500 bp) — Monthly | (42) |
| CMBX NA BB.9 Index | | (602) | | 5,000 | 1,582 | 9/17/58 | (500 bp) — Monthly | 975 |
| CMBX NA BB.9 Index | | (313) | | 3,000 | 949 | 9/17/58 | (500 bp) — Monthly | 633 |
| CMBX NA BB.9 Index | | (319) | | 2,000 | 633 | 9/17/58 | (500 bp) — Monthly | 312 |
| CMBX NA BB.9 Index | | (158) | | 1,000 | 316 | 9/17/58 | (500 bp) — Monthly | 157 |
| CMBX NA BBB−.12 Index | | (40,540) | | 227,000 | 39,816 | 8/17/61 | (300 bp) — Monthly | (857) |
| CMBX NA BBB−.12 Index | | (34,234) | | 191,000 | 33,501 | 8/17/61 | (300 bp) — Monthly | (844) |
| CMBX NA BBB−.12 Index | | (11,145) | | 33,000 | 5,788 | 8/17/61 | (300 bp) — Monthly | (5,376) |
| CMBX NA BBB−.13 Index | | (3,107) | | 41,000 | 7,979 | 12/16/72 | (300 bp) — Monthly | 4,848 |
| CMBX NA BBB−.14 Index | | (284) | | 3,000 | 554 | 12/16/72 | (300 bp) — Monthly | 268 |
| CMBX NA BBB−.14 Index | | (276) | | 3,000 | 554 | 12/16/72 | (300 bp) — Monthly | 275 |
| CMBX NA BBB−.14 Index | | (206) | | 2,000 | 369 | 12/16/72 | (300 bp) — Monthly | 162 |
| CMBX NA BBB−.14 Index | | (217) | | 2,000 | 369 | 12/16/72 | (300 bp) — Monthly | 151 |
| CMBX NA BBB−.14 Index | | (126) | | 2,000 | 369 | 12/16/72 | (300 bp) — Monthly | 242 |
| CMBX NA BBB−.6 Index | | (68,943) | | 177,103 | 40,202 | 5/11/63 | (300 bp) — Monthly | (28,843) |
| | | | | | | | |
| OTC CREDIT DEFAULT CONTRACTS OUTSTANDING — PROTECTION PURCHASED at 10/31/22 cont. |
Swap counterparty/
Referenced debt* | | Upfront
premium
received
(paid)** | | Notional
amount | Value | Termi-
nation
date | Payments
(paid)
by fund | Unrealized
appreciation/
(depreciation) |
| Goldman Sachs International cont. |
| CMBX NA BBB−.6 Index | | $(13,531) | | $35,001 | $7,945 | 5/11/63 | (300 bp) — Monthly | $(5,607) |
| CMBX NA BBB−.8 Index | | (24,690) | | 160,000 | 26,896 | 10/17/57 | (300 bp) — Monthly | 2,112 |
| CMBX NA BBB−.8 Index | | (3,105) | | 24,000 | 4,034 | 10/17/57 | (300 bp) — Monthly | 915 |
| JPMorgan Securities LLC |
| CMBX NA BBB−.10 Index | | (4,413) | | 35,000 | 6,202 | 11/17/59 | (300 bp) — Monthly | 1,768 |
| CMBX NA BBB−.14 Index | | (1,138) | | 13,000 | 2,399 | 12/16/72 | (300 bp) — Monthly | 1,253 |
| CMBX NA BBB−.14 Index | | (305) | | 5,000 | 923 | 12/16/72 | (300 bp) — Monthly | 615 |
| Merrill Lynch International |
| CMBX NA BB.10 Index | | (4,211) | | 74,000 | 24,065 | 11/17/59 | (500 bp) — Monthly | 19,782 |
| CMBX NA BB.7 Index | | (5,378) | | 31,000 | 10,308 | 1/17/47 | (500 bp) — Monthly | 4,899 |
| CMBX NA BBB−.10 Index | | (13,217) | | 61,000 | 10,809 | 11/17/59 | (300 bp) — Monthly | (2,443) |
| CMBX NA BBB−.7 Index | | (1,311) | | 16,000 | 3,330 | 1/17/47 | (300 bp) — Monthly | 2,009 |
| CMBX NA BBB−.9 Index | | (4,261) | | 23,000 | 4,651 | 9/17/58 | (300 bp) — Monthly | 376 |
| CMBX NA BBB−.9 Index | | (1,667) | | 9,000 | 1,820 | 9/17/58 | (300 bp) — Monthly | 147 |
| Morgan Stanley & Co. International PLC |
| CMBX NA BB.10 Index | | (3,880) | | 37,000 | 12,032 | 11/17/59 | (500 bp) — Monthly | 8,116 |
| CMBX NA BB.10 Index | | (10,024) | | 33,000 | 10,732 | 11/17/59 | (500 bp) — Monthly | 676 |
| CMBX NA BB.10 Index | | (7,515) | | 32,000 | 10,406 | 11/17/59 | (500 bp) — Monthly | 2,860 |
| CMBX NA BB.7 Index | | (3,278) | | 17,000 | 5,653 | 1/17/47 | (500 bp) — Monthly | 2,358 |
| CMBX NA BB.9 Index | | (352) | | 4,000 | 1,265 | 9/17/58 | (500 bp) — Monthly | 910 |
| CMBX NA BB.9 Index | | (123) | | 2,000 | 633 | 9/17/58 | (500 bp) — Monthly | 508 |
| CMBX NA BBB−.10 Index | | (7,621) | | 88,000 | 15,594 | 11/17/59 | (300 bp) — Monthly | 7,921 |
| CMBX NA BBB−.10 Index | | (9,639) | | 76,000 | 13,467 | 11/17/59 | (300 bp) — Monthly | 3,784 |
| CMBX NA BBB−.10 Index | | (8,117) | | 64,000 | 11,341 | 11/17/59 | (300 bp) — Monthly | 3,187 |
| | | | | | | | |
| OTC CREDIT DEFAULT CONTRACTS OUTSTANDING — PROTECTION PURCHASED at 10/31/22 cont. |
Swap counterparty/
Referenced debt* | | Upfront
premium
received
(paid)** | | Notional
amount | Value | Termi-
nation
date | Payments
(paid)
by fund | Unrealized
appreciation/
(depreciation) |
| Morgan Stanley & Co. International PLC cont. |
| CMBX NA BBB−.10 Index | | $(3,954) | | $33,000 | $5,848 | 11/17/59 | (300 bp) — Monthly | $1,874 |
| CMBX NA BBB−.10 Index | | (7,314) | | 30,000 | 5,316 | 11/17/59 | (300 bp) — Monthly | (2,015) |
| CMBX NA BBB−.10 Index | | (4,553) | | 21,000 | 3,721 | 11/17/59 | (300 bp) — Monthly | (844) |
| CMBX NA BBB−.10 Index | | (4,109) | | 19,000 | 3,367 | 11/17/59 | (300 bp) — Monthly | (753) |
| CMBX NA BBB−.10 Index | | (2,435) | | 17,000 | 3,012 | 11/17/59 | (300 bp) — Monthly | 568 |
| CMBX NA BBB−.10 Index | | (3,784) | | 16,000 | 2,835 | 11/17/59 | (300 bp) — Monthly | (958) |
| CMBX NA BBB−.10 Index | | (1,727) | | 14,000 | 2,481 | 11/17/59 | (300 bp) — Monthly | 745 |
| CMBX NA BBB−.10 Index | | (2,296) | | 10,000 | 1,772 | 11/17/59 | (300 bp) — Monthly | (530) |
| CMBX NA BBB−.11 Index | | (15,363) | | 48,000 | 7,469 | 11/18/54 | (300 bp) — Monthly | (7,923) |
| CMBX NA BBB−.12 Index | | (10,287) | | 79,000 | 13,857 | 8/17/61 | (300 bp) — Monthly | 3,523 |
| CMBX NA BBB−.12 Index | | (1,649) | | 40,000 | 7,016 | 8/17/61 | (300 bp) — Monthly | 5,344 |
| CMBX NA BBB−.12 Index | | (4,382) | | 21,000 | 3,683 | 8/17/61 | (300 bp) — Monthly | (711) |
| CMBX NA BBB−.12 Index | | (4,320) | | 13,000 | 2,280 | 8/17/61 | (300 bp) — Monthly | (2,048) |
| CMBX NA BBB−.13 Index | | (11,402) | | 185,000 | 36,001 | 12/16/72 | (300 bp) — Monthly | 24,491 |
| CMBX NA BBB−.14 Index | | (962) | | 6,000 | 1,107 | 12/16/72 | (300 bp) — Monthly | 142 |
| CMBX NA BBB−.14 Index | | (158) | | 1,000 | 185 | 12/16/72 | (300 bp) — Monthly | 26 |
| CMBX NA BBB−.7 Index | | (41) | | 1,000 | 208 | 1/17/47 | (300 bp) — Monthly | 167 |
| CMBX NA BBB−.8 Index | | (44,741) | | 292,000 | 49,085 | 10/17/57 | (300 bp) — Monthly | 4,174 |
| CMBX NA BBB−.8 Index | | (25,875) | | 167,000 | 28,073 | 10/17/57 | (300 bp) — Monthly | 2,100 |
| CMBX NA BBB−.8 Index | | (7,504) | | 59,000 | 9,918 | 10/17/57 | (300 bp) — Monthly | 2,379 |
| CMBX NA BBB−.8 Index | | (5,963) | | 47,000 | 7,901 | 10/17/57 | (300 bp) — Monthly | 1,910 |
| CMBX NA BBB−.8 Index | | (6,859) | | 44,000 | 7,396 | 10/17/57 | (300 bp) — Monthly | 512 |
| CMBX NA BBB−.8 Index | | (4,531) | | 29,000 | 4,875 | 10/17/57 | (300 bp) — Monthly | 327 |
| | | | | | | | |
| OTC CREDIT DEFAULT CONTRACTS OUTSTANDING — PROTECTION PURCHASED at 10/31/22 cont. |
Swap counterparty/
Referenced debt* | | Upfront
premium
received
(paid)** | | Notional
amount | Value | Termi-
nation
date | Payments
(paid)
by fund | Unrealized
appreciation/
(depreciation) |
| Morgan Stanley & Co. International PLC cont. |
| CMBX NA BBB−.8 Index | | $(3,119) | | $23,000 | $3,866 | 10/17/57 | (300 bp) — Monthly | $734 |
| CMBX NA BBB−.8 Index | | (3,149) | | 22,000 | 3,698 | 10/17/57 | (300 bp) — Monthly | 537 |
| CMBX NA BBB−.8 Index | | (2,042) | | 15,000 | 2,522 | 10/17/57 | (300 bp) — Monthly | 468 |
| Upfront premium received | — | | | Unrealized appreciation | 402,215 |
| Upfront premium (paid) | (871,293) | | | Unrealized (depreciation) | (112,998) |
| Total | $(871,293) | | | Total | $289,217 |
| * Payments related to the referenced debt are made upon a credit default event. |
| ** Upfront premium is based on the difference between the original spread on issue and the market spread on day of execution. |
|
| ASC 820 establishes a three-level hierarchy for disclosure of fair value measurements. The valuation hierarchy is based upon the transparency of inputs to the valuation of the fund’s investments. The three levels are defined as follows: |
Level 1: Valuations based on quoted prices for identical securities in active markets.
Level 2: Valuations based on quoted prices in markets that are not active or for which all significant inputs are observable, either directly or indirectly.
Level 3: Valuations based on inputs that are unobservable and significant to the fair value measurement.
| The following is a summary of the inputs used to value the fund’s net assets as of the close of the reporting period: |
|
| | | |
| | Valuation inputs |
| Investments in securities: | Level 1 | Level 2 | Level 3 |
| Asset-backed securities | $— | $1,902,442 | $— |
| Collateralized loan obligations | — | 7,217,557 | — |
| Corporate bonds and notes | — | 31,474,026 | — |
| Foreign government and agency bonds and notes | — | 45,093,875 | — |
| Mortgage-backed securities | — | 44,002,204 | — |
| U.S. government and agency mortgage obligations | — | 147,266,994 | — |
| U.S. treasury obligations | — | 1,241,516 | — |
| Short-term investments | 1,777,000 | 13,587,192 | — |
| Totals by level | $1,777,000 | $291,785,806 | $— |
|
| | | |
| | Valuation inputs |
| Other financial instruments: | Level 1 | Level 2 | Level 3 |
| Forward currency contracts | $— | $(679,722) | $— |
| Futures contracts | (1,139,982) | — | — |
| Forward premium swap option contracts | — | 2,524,205 | — |
| TBA sale commitments | — | (58,847,781) | — |
| Interest rate swap contracts | — | 1,668,931 | — |
| Total return swap contracts | — | (77,336) | — |
| Credit default contracts | — | 594,857 | — |
| Totals by level | $(1,139,982) | $(54,816,846) | $— |
| At the start and close of the reporting period, Level 3 investments in securities represented less than 1% of the fund’s net assets and were not considered a significant portion of the fund’s portfolio. |
The accompanying notes are an integral part of these financial statements.
Statement of assets and liabilities 10/31/22
| |
| ASSETS | |
| Investment in securities, at value (Notes 1 and 8): | |
| Unaffiliated issuers (identified cost $310,594,942) | $286,959,055 |
| Affiliated issuers (identified cost $6,603,751) (Note 5) | 6,603,751 |
| Foreign currency (cost $26,181) (Note 1) | 35,231 |
| Interest and other receivables | 1,428,551 |
| Receivable for shares of the fund sold | 56,044 |
| Receivable for investments sold | 3,670,959 |
| Receivable for sales of TBA securities (Note 1) | 29,185,622 |
| Receivable from Manager (Note 2) | 82,057 |
| Receivable for variation margin on futures contracts (Note 1) | 53,573 |
| Receivable for variation margin on centrally cleared swap contracts (Note 1) | 1,218,598 |
| Unrealized appreciation on forward currency contracts (Note 1) | 1,476,435 |
| Unrealized appreciation on forward premium swap option contracts (Note 1) | 5,429,227 |
| Unrealized appreciation on OTC swap contracts (Note 1) | 451,718 |
| Premium paid on OTC swap contracts (Note 1) | 873,599 |
| Prepaid assets | 41,221 |
| Total assets | 337,565,641 |
| |
| LIABILITIES | |
| Payable for investments purchased | 786,586 |
| Payable for purchases of TBA securities (Note 1) | 119,187,571 |
| Payable for shares of the fund repurchased | 417,126 |
| Payable for custodian fees (Note 2) | 45,211 |
| Payable for investor servicing fees (Note 2) | 57,167 |
| Payable for Trustee compensation and expenses (Note 2) | 134,059 |
| Payable for administrative services (Note 2) | 324 |
| Payable for distribution fees (Note 2) | 19,450 |
| Payable for variation margin on futures contracts (Note 1) | 152,427 |
| Payable for variation margin on centrally cleared swap contracts (Note 1) | 1,123,634 |
| Unrealized depreciation on forward currency contracts (Note 1) | 2,156,157 |
| Unrealized depreciation on forward premium swap option contracts (Note 1) | 2,905,022 |
| TBA sale commitments, at value (proceeds receivable $59,596,426) (Note 1) | 58,847,781 |
| Unrealized depreciation on OTC swap contracts (Note 1) | 509,701 |
| Premium received on OTC swap contracts (Note 1) | 298,095 |
| Collateral on certain derivative contracts, at value (Notes 1 and 8) | 3,018,516 |
| Other accrued expenses | 176,829 |
| Total liabilities | 189,835,656 |
| | |
| Net assets | $147,729,985 |
| |
| REPRESENTED BY | |
| Paid-in capital (Unlimited shares authorized) (Notes 1 and 4) | $195,555,621 |
| Total distributable earnings (Note 1) | (47,825,636) |
| Total — Representing net assets applicable to capital shares outstanding | $147,729,985 |
(Continued on next page)
Statement of assets and liabilities cont.
| |
| COMPUTATION OF NET ASSET VALUE AND OFFERING PRICE | |
| Net asset value and redemption price per class A share ($78,618,745 divided by 8,299,287 shares) | $9.47 |
| Offering price per class A share (100/96.00 of $9.47)* | $9.86 |
| Net asset value and offering price per class B share ($148,453 divided by 15,745 shares)** | $9.43 |
| Net asset value and offering price per class C share ($2,142,649 divided by 227,299 shares)** | $9.43 |
| Net asset value, offering price and redemption price per class R share | |
| ($1,459,523 divided by 154,158 shares) | $9.47 |
| Net asset value, offering price and redemption price per class R5 share | |
| ($31,630 divided by 3,341 shares) | $9.47 |
| Net asset value, offering price and redemption price per class R6 share | |
| ($20,821,603 divided by 2,198,258 shares) | $9.47 |
| Net asset value, offering price and redemption price per class Y share | |
| ($44,507,382 divided by 4,700,856 shares) | $9.47 |
* On single retail sales of less than $100,000. On sales of $100,000 or more the offering price is reduced.
** Redemption price per share is equal to net asset value less any applicable contingent deferred sales charge.
The accompanying notes are an integral part of these financial statements.
Statement of operations Year ended 10/31/22
| |
| INVESTMENT INCOME | |
| Interest (including interest income of $57,061 from investments in affiliated issuers) (Note 5) | $6,416,044 |
| Total investment income | 6,416,044 |
| |
| EXPENSES | |
| Compensation of Manager (Note 2) | 1,051,830 |
| Investor servicing fees (Note 2) | 393,912 |
| Custodian fees (Note 2) | 102,603 |
| Trustee compensation and expenses (Note 2) | 8,171 |
| Distribution fees (Note 2) | 281,804 |
| Administrative services (Note 2) | 5,887 |
| Auditing and tax fees | 154,939 |
| Other | 212,826 |
| Fees waived and reimbursed by Manager (Note 2) | (690,628) |
| Total expenses | 1,521,344 |
| Expense reduction (Note 2) | (991) |
| Net expenses | 1,520,353 |
| | |
| Net investment income | 4,895,691 |
| |
| REALIZED AND UNREALIZED GAIN (LOSS) | |
| Net realized gain (loss) on: | |
| Securities from unaffiliated issuers (Notes 1 and 3) | (9,224,043) |
| Foreign currency transactions (Note 1) | (83,283) |
| Forward currency contracts (Note 1) | (1,628,725) |
| Futures contracts (Note 1) | (2,222,914) |
| Swap contracts (Note 1) | (3,623,743) |
| Written options (Note 1) | (7,645,232) |
| Total net realized loss | (24,427,940) |
| Change in net unrealized appreciation (depreciation) on: | |
| Securities from unaffiliated issuers and TBA sale commitments | (24,305,775) |
| Assets and liabilities in foreign currencies | 1,405 |
| Forward currency contracts | (148,944) |
| Futures contracts | (934,435) |
| Swap contracts | 3,366,433 |
| Written options | 1,472,886 |
| Total change in net unrealized depreciation | (20,548,430) |
| | |
| Net loss on investments | (44,976,370) |
| |
| Net decrease in net assets resulting from operations | $(40,080,679) |
The accompanying notes are an integral part of these financial statements.
Statement of changes in net assets
| | |
| DECREASE IN NET ASSETS | Year ended 10/31/22 | Year ended 10/31/21 |
| Operations | | |
| Net investment income | $4,895,691 | $5,145,077 |
| Net realized loss on investments | | |
| and foreign currency transactions | (24,427,940) | (2,674,897) |
| Change in net unrealized depreciation of investments | | |
| and assets and liabilities in foreign currencies | (20,548,430) | (8,283,714) |
| Net decrease in net assets resulting from operations | (40,080,679) | (5,813,534) |
| Distributions to shareholders (Note 1): | | |
| From ordinary income | | |
| Net investment income | | |
| Class A | (541,529) | (1,897,242) |
| Class B | (985) | (6,079) |
| Class C | (10,132) | (45,011) |
| Class R | (9,055) | (31,724) |
| Class R5 | (245) | (777) |
| Class R6 | (185,764) | (674,342) |
| Class Y | (425,059) | (1,782,140) |
| From return of capital | | |
| Class A | (1,248,030) | — |
| Class B | (2,271) | — |
| Class C | (23,350) | — |
| Class R | (20,870) | — |
| Class R5 | (564) | — |
| Class R6 | (428,118) | — |
| Class Y | (979,606) | — |
| Decrease from capital share transactions (Note 4) | (45,207,557) | (3,688,159) |
| Total decrease in net assets | (89,163,814) | (13,939,008) |
| |
| NET ASSETS | | |
| Beginning of year | 236,893,799 | 250,832,807 |
| End of year | $147,729,985 | $236,893,799 |
The accompanying notes are an integral part of these financial statements.
Financial highlights
(For a common share outstanding throughout the period)
| | | | | | | | | | | | | |
| | INVESTMENT OPERATIONS | | | LESS DISTRIBUTIONS | | | | RATIOS AND SUPPLEMENTAL DATA | |
| | | | | | | | | | | | Ratio | Ratio of net | |
| | Net asset | | Net realized | | | | | | | | of expenses | investment | |
| | value, | | and unrealized | Total from | From net | | | Net asset | Total return | Net assets, | to average | income (loss) | Portfolio |
| | beginning | Net investment | gain (loss) | investment | investment | From return | Total | value, end | at net asset | end of period | net assets | to average | turnover |
| Period ended | of period | income (loss)a | on investments | operations | income | of capital | distributions | of period | value (%)b | (in thousands) | (%)c,d | net assets (%)d | (%)e |
| Class A | | | | | | | | | | | | | |
| October 31, 2022 | $11.95 | .26 | (2.54) | (2.28) | (.06) | (.14) | (.20) | $9.47 | (19.23) | $78,619 | .91 | 2.38 | 989 |
| October 31, 2021 | 12.45 | .24 | (.54) | (.30) | (.20) | — | (.20) | 11.95 | (2.43) | 110,713 | .88 | 1.91 | 838 |
| October 31, 2020 | 12.35 | .22 | .10 | .32 | (.07) | (.15) | (.22) | 12.45 | 2.64 | 114,466 | 1.09 | 1.76 | 590 |
| October 31, 2019 | 11.50 | .26 | .84 | 1.10 | (.19) | (.06) | (.25) | 12.35 | 9.68 | 114,345 | 1.22 | 2.19 | 408 |
| October 31, 2018 | 12.05 | .27 | (.52) | (.25) | (.19) | (.11) | (.30) | 11.50 | (2.14) | 116,014 | 1.22 | 2.25 | 451 |
| Class B | | | | | | | | | | | | | |
| October 31, 2022 | $11.89 | .14f | (2.48) | (2.34) | (.04) | (.08) | (.12) | $9.43 | (19.78) | $148 | 1.66 | 1.23f | 989 |
| October 31, 2021 | 12.39 | .13 | (.52) | (.39) | (.11) | — | (.11) | 11.89 | (3.18) | 516 | 1.63 | 1.04 | 838 |
| October 31, 2020 | 12.29 | .12 | .11 | .23 | (.04) | (.09) | (.13) | 12.39 | 1.84 | 934 | 1.84 | .97 | 590 |
| October 31, 2019 | 11.45 | .17 | .83 | 1.00 | (.12) | (.04) | (.16) | 12.29 | 8.80 | 1,508 | 1.97 | 1.42 | 408 |
| October 31, 2018 | 12.00 | .18 | (.53) | (.35) | (.13) | (.07) | (.20) | 11.45 | (2.90) | 2,362 | 1.97 | 1.48 | 451 |
| Class C | | | | | | | | | | | | | |
| October 31, 2022 | $11.89 | .17 | (2.50) | (2.33) | (.04) | (.09) | (.13) | $9.43 | (19.77) | $2,143 | 1.66 | 1.55 | 989 |
| October 31, 2021 | 12.39 | .14 | (.53) | (.39) | (.11) | — | (.11) | 11.89 | (3.19) | 3,833 | 1.63 | 1.14 | 838 |
| October 31, 2020 | 12.29 | .12 | .11 | .23 | (.04) | (.09) | (.13) | 12.39 | 1.88 | 6,508 | 1.84 | 1.03 | 590 |
| October 31, 2019 | 11.45 | .17 | .83 | 1.00 | (.12) | (.04) | (.16) | 12.29 | 8.81 | 9,591 | 1.97 | 1.44 | 408 |
| October 31, 2018 | 12.00 | .18 | (.52) | (.34) | (.14) | (.07) | (.21) | 11.45 | (2.89) | 12,444 | 1.97 | 1.49 | 451 |
| Class R | | | | | | | | | | | | | |
| October 31, 2022 | $11.94 | .24 | (2.54) | (2.30) | (.05) | (.12) | (.17) | $9.47 | (19.35) | $1,460 | 1.16 | 2.18 | 989 |
| October 31, 2021 | 12.45 | .21 | (.55) | (.34) | (.17) | — | (.17) | 11.94 | (2.76) | 1,963 | 1.13 | 1.69 | 838 |
| October 31, 2020 | 12.35 | .19 | .10 | .29 | (.06) | (.13) | (.19) | 12.45 | 2.39 | 2,475 | 1.34 | 1.52 | 590 |
| October 31, 2019 | 11.50 | .23 | .84 | 1.07 | (.16) | (.06) | (.22) | 12.35 | 9.40 | 1,955 | 1.47 | 1.97 | 408 |
| October 31, 2018 | 12.05 | .24 | (.52) | (.28) | (.17) | (.10) | (.27) | 11.50 | (2.39) | 2,014 | 1.47 | 2.02 | 451 |
| Class R5 | | | | | | | | | | | | | |
| October 31, 2022 | $11.94 | .30 | (2.53) | (2.23) | (.07) | (.17) | (.24) | $9.47 | (18.88) | $32 | .55 | 2.76 | 989 |
| October 31, 2021 | 12.44 | .28 | (.54) | (.26) | (.24) | — | (.24) | 11.94 | (2.12) | 44 | .55 | 2.25 | 838 |
| October 31, 2020 | 12.35 | .26 | .09 | .35 | (.08) | (.18) | (.26) | 12.44 | 2.91 | 33 | .75 | 2.10 | 590 |
| October 31, 2019 | 11.50 | .31 | .83 | 1.14 | (.22) | (.07) | (.29) | 12.35 | 10.06 | 24 | .86 | 2.60 | 408 |
| October 31, 2018 | 12.05 | .31 | (.52) | (.21) | (.22) | (.12) | (.34) | 11.50 | (1.77) | 31 | .86 | 2.63 | 451 |
| Class R6 | | | | | | | | | | | | | |
| October 31, 2022 | $11.95 | .31 | (2.53) | (2.22) | (.08) | (.18) | (.26) | $9.47 | (18.88) | $20,822 | .48 | 2.80 | 989 |
| October 31, 2021 | 12.45 | .29 | (.54) | (.25) | (.25) | — | (.25) | 11.95 | (2.05) | 30,989 | .48 | 2.31 | 838 |
| October 31, 2020 | 12.35 | .26 | .11 | .37 | (.08) | (.19) | (.27) | 12.45 | 3.05 | 35,357 | .68 | 2.14 | 590 |
| October 31, 2019 | 11.50 | .31 | .84 | 1.15 | (.22) | (.08) | (.30) | 12.35 | 10.15 | 25,712 | .79 | 2.61 | 408 |
| October 31, 2018 | 12.05 | .32 | (.51) | (.19) | (.23) | (.13) | (.36) | 11.50 | (1.72) | 24,177 | .80 | 2.65 | 451 |
See notes to financial highlights at the end of this section.
The accompanying notes are an integral part of these financial statements.
| |
| 78 Global Income Trust | Global Income Trust 79 |
Financial highlights cont.
| | | | | | | | | | | | | |
| | INVESTMENT OPERATIONS | | | LESS DISTRIBUTIONS | | | | RATIOS AND SUPPLEMENTAL DATA | |
| | | | | | | | | | | | Ratio | Ratio of net | |
| | Net asset | | Net realized | | | | | | | | of expenses | investment | |
| | value, | | and unrealized | Total from | From net | | | Net asset | Total return | Net assets, | to average | income (loss) | Portfolio |
| | beginning | Net investment | gain (loss) | investment | investment | From return | Total | value, end | at net asset | end of period | net assets | to average | turnover |
| Period ended | of period | income (loss)a | on investments | operations | income | of capital | distributions | of period | value (%)b | (in thousands) | (%)c,d | net assets (%)d | (%)e |
| Class Y | | | | | | | | | | | | | |
| October 31, 2022 | $11.94 | .28 | (2.52) | (2.24) | (.07) | (.16) | (.23) | $9.47 | (18.98) | $44,507 | .66 | 2.59 | 989 |
| October 31, 2021 | 12.44 | .27 | (.53) | (.26) | (.24) | — | (.24) | 11.94 | (2.19) | 88,836 | .63 | 2.17 | 838 |
| October 31, 2020 | 12.35 | .24 | .11 | .35 | (.08) | (.18) | (.26) | 12.44 | 2.83 | 91,059 | .84 | 1.99 | 590 |
| October 31, 2019 | 11.50 | .29 | .84 | 1.13 | (.21) | (.07) | (.28) | 12.35 | 9.96 | 71,288 | .97 | 2.43 | 408 |
| October 31, 2018 | 12.05 | .30 | (.52) | (.22) | (.21) | (.12) | (.33) | 11.50 | (1.90) | 62,181 | .97 | 2.50 | 451 |
a Per share net investment income (loss) has been determined on the basis of the weighted average number of shares outstanding during the period.
b Total return assumes dividend reinvestment and does not reflect the effect of sales charges.
c Includes amounts paid through expense offset and/or brokerage/service arrangements, if any (Note 2). Also excludes acquired fund fees and expenses, if any.
d Reflects an involuntary contractual expense limitation in effect during the period. As a result of such limitation, the expenses of each class reflect a reduction of the following amounts (Note 2):
| | |
| | Percentage of average net assets | |
| October 31, 2022 | 0.35% | |
| October 31, 2021 | 0.30 | |
| October 31, 2020 | 0.11 | |
| October 31, 2019 | 0.02 | |
| October 31, 2018 | 0.02 | |
e Portfolio turnover includes TBA purchase and sale commitments.
f The net investment income ratio and per share amount shown for the period ending may not correspond with the expected class differences for the period due to the timing of subscriptions into the class or redemptions out of the class.
The accompanying notes are an integral part of these financial statements.
| |
| 80 Global Income Trust | Global Income Trust 81 |
Notes to financial statements 10/31/22
Within the following Notes to financial statements, references to “State Street” represent State Street Bank and Trust Company, references to “the SEC” represent the Securities and Exchange Commission, references to “Putnam Management” represent Putnam Investment Management, LLC, the fund’s manager, an indirect wholly-owned subsidiary of Putnam Investments, LLC and references to “OTC”, if any, represent over-the-counter. Unless otherwise noted, the “reporting period” represents the period from November 1, 2021 through October 31, 2022.
Putnam Global Income Trust (the fund) is a Massachusetts business trust, which is registered under the Investment Company Act of 1940, as amended, as a non-diversified open-end management investment company. The goal of the fund is to seek high current income. Preservation of capital and long-term total return are secondary objectives, but only to the extent consistent with the objective of seeking high current income. The fund invests mainly in bonds and securitized debt instruments (such as mortgage-backed investments) that are obligations of companies and governments worldwide; that are investment-grade in quality; and that have intermediate-to long-term maturities (three years or longer). Under normal circumstances, Putnam Management invests at least 80% of the fund’s net assets in investment-grade securities. This policy may be changed only after 60 days’ notice to shareholders. The fund may also invest in bonds that are below investment-grade in quality (sometimes referred to as “junk bonds”). Putnam Management may consider, among other factors, credit, interest rate and prepayment risks, as well as general market conditions, when deciding whether to buy or sell investments. The fund typically uses to a significant extent derivatives, such as futures, options, certain foreign currency transactions and swap contracts, for both hedging and non-hedging purposes.
The fund offers the following share classes. The expenses for each class of shares may differ based on the distribution and investor servicing fees of each class, which are identified in Note 2.
| | | |
| Share class | Sales charge | Contingent deferred sales charge | Conversion feature |
| | | 1.00% on certain redemptions of shares | |
| Class A | Up to 4.00% | bought with no initial sales charge | None |
| | | | Converts to class A shares |
| Class B* | None | 5.00% phased out over six years | after 8 years |
| | | | Converts to class A shares |
| Class C | None | 1.00% eliminated after one year | after 8 years |
| Class R† | None | None | None |
| Class R5† | None | None | None |
| Class R6† | None | None | None |
| Class Y† | None | None | None |
* Purchases of class B shares are closed to new and existing investors except by exchange from class B shares of another Putnam fund or through dividend and/or capital gains reinvestment.
† Not available to all investors.
In the normal course of business, the fund enters into contracts that may include agreements to indemnify another party under given circumstances. The fund’s maximum exposure under these arrangements is unknown as this would involve future claims that may be, but have not yet been, made against the fund. However, the fund’s management team expects the risk of material loss to be remote.
The fund has entered into contractual arrangements with an investment adviser, administrator, distributor, shareholder servicing agent and custodian, who each provide services to the fund. Unless expressly stated otherwise, shareholders are not parties to, or intended beneficiaries of these contractual arrangements, and these contractual arrangements are not intended to create any shareholder right to enforce them against the service providers or to seek any remedy under them against the service providers, either directly or on behalf of the fund.
Under the fund’s Amended and Restated Agreement and Declaration of Trust, any claims asserted against or on behalf of the Putnam Funds, including claims against Trustees and Officers, must be brought in state and federal courts located within the Commonwealth of Massachusetts.
Note 1: Significant accounting policies
The following is a summary of significant accounting policies consistently followed by the fund in the preparation of its financial statements. The preparation of financial statements is in conformity with accounting principles generally accepted in the United States of America and requires management to make estimates and assumptions that affect the reported amounts of assets and liabilities in the financial statements and the reported amounts of increases and decreases in net assets from operations. Actual results could differ from those estimates. Subsequent events after the Statement of assets and liabilities date through the date that the financial statements were issued have been evaluated in the preparation of the financial statements.
Investment income, realized and unrealized gains and losses and expenses of the fund are borne pro-rata based on the relative net assets of each class to the total net assets of the fund, except that each class bears expenses unique to that class (including the distribution fees applicable to such classes). Each class votes as a class only with respect to its own distribution plan or other matters on which a class vote is required by law or determined by the Trustees. If the fund were liquidated, shares of each class would receive their pro-rata share of the net assets of the fund. In addition, the Trustees declare separate dividends on each class of shares.
Security valuation Portfolio securities and other investments are valued using policies and procedures adopted by the Board of Trustees. The Trustees have formed a Pricing Committee to oversee the implementation of these procedures and have delegated responsibility for valuing the fund’s assets in accordance with these procedures to Putnam Management. Putnam Management has established an internal Valuation Committee that is responsible for making fair value determinations, evaluating the effectiveness of the pricing policies of the fund and reporting to the Pricing Committee.
Market quotations are not considered to be readily available for certain debt obligations (including short-term investments with remaining maturities of 60 days or less) and other investments; such investments are valued on the basis of valuations furnished by an independent pricing service approved by the Trustees or dealers selected by Putnam Management. Such services or dealers determine valuations for normal institutional-size trading units of such securities using methods based on market transactions for comparable securities and various relationships, generally recognized by institutional traders, between securities (which consider such factors as security prices, yields, maturities and ratings). These securities will generally be categorized as Level 2. Securities quoted in foreign currencies, if any, are translated into U.S. dollars at the current exchange rate.
Investments in open-end investment companies (excluding exchange-traded funds), if any, which can be classified as Level 1 or Level 2 securities, are valued based on their net asset value. The net asset value of such investment companies equals the total value of their assets less their liabilities and divided by the number of their outstanding shares.
To the extent a pricing service or dealer is unable to value a security or provides a valuation that Putnam Management does not believe accurately reflects the security’s fair value, the security will be valued at fair value by Putnam Management in accordance with policies and procedures approved by the Trustees. Certain investments, including certain restricted and illiquid securities and derivatives, are also valued at fair value following procedures approved by the Trustees. These valuations consider such factors as significant market or specific security events such as interest rate or credit quality changes, various relationships with other securities, discount rates, U.S. Treasury, U.S. swap and credit yields, index levels, convexity exposures, recovery rates, sales and other multiples and resale restrictions. These securities are classified as Level 2 or as Level 3 depending on the priority of the significant inputs.
To assess the continuing appropriateness of fair valuations, the Valuation Committee reviews and affirms the reasonableness of such valuations on a regular basis after considering all relevant information that is reasonably available. Such valuations and procedures are reviewed periodically by the Trustees. Certain securities may be valued on the basis of a price provided by a single source. The fair value of securities is generally determined as the amount that the fund could reasonably expect to realize from an orderly disposition of such securities over a reasonable period of time. By its nature, a fair value price is a good faith estimate of the value of a security in a current sale and does not reflect an actual market price, which may be different by a material amount.
Security transactions and related investment income Security transactions are recorded on the trade date (the date the order to buy or sell is executed). Gains or losses on securities sold are determined on the identified cost basis.
Interest income, net of any applicable withholding taxes, if any, and including amortization and accretion of premiums and discounts on debt securities, is recorded on the accrual basis.
Stripped securities The fund may invest in stripped securities which represent a participation in securities that may be structured in classes with rights to receive different portions of the interest and principal. Interest-only securities receive all of the interest and principal-only securities receive all of the principal. If the interest-only securities experience greater than anticipated prepayments of principal, the fund may fail to recoup fully its initial investment in these securities. Conversely, principal-only securities increase in value if prepayments are greater than anticipated and decline if prepayments are slower than anticipated. The fair value of these securities is highly sensitive to changes in interest rates.
Foreign currency translation The accounting records of the fund are maintained in U.S. dollars. The fair value of foreign securities, currency holdings, and other assets and liabilities is recorded in the books and records of the fund after translation to U.S. dollars based on the exchange rates on that day. The cost of each security is determined using historical exchange rates. Income and withholding taxes are translated at prevailing exchange rates when earned or incurred. The fund does not isolate that portion of realized or unrealized gains or losses resulting from changes in the foreign exchange rate on investments from fluctuations arising from changes in the market prices of the securities. Such gains and losses are included with the net realized and unrealized gain or loss on investments. Net realized gains and losses on foreign currency transactions represent net realized exchange gains or losses on disposition of foreign currencies, currency gains and losses realized between the trade and settlement dates on securities transactions and the difference between the amount of investment income and foreign withholding taxes recorded on the fund’s books and the U.S. dollar equivalent amounts actually received or paid. Net unrealized appreciation and depreciation of assets and liabilities in foreign currencies arise from changes in the value of assets and liabilities other than investments at the period end, resulting from changes in the exchange rate.
Options contracts The fund uses options contracts to hedge duration and convexity, to isolate prepayment risk and to manage downside risks.
The potential risk to the fund is that the change in value of options contracts may not correspond to the change in value of the hedged instruments. In addition, losses may arise from changes in the value of the underlying instruments if there is an illiquid secondary market for the contracts, if interest or exchange rates move unexpectedly or if the counterparty to the contract is unable to perform. Realized gains and losses on purchased options are included in realized gains and losses on investment securities. If a written call option is exercised, the premium originally received is recorded as an addition to sales proceeds. If a written put option is exercised, the premium originally received is recorded as a reduction to the cost of investments.
Exchange-traded options are valued at the last sale price or, if no sales are reported, the last bid price for purchased options and the last ask price for written options. OTC traded options are valued using prices supplied by dealers.
Options on swaps are similar to options on securities except that the premium paid or received is to buy or grant the right to enter into a previously agreed upon interest rate or credit default contract. Forward premium swap option contracts include premiums that have extended settlement dates. The delayed settlement of the premiums is factored into the daily valuation of the option contracts. In the case of interest rate cap and floor contracts, in return for a premium, ongoing payments between two parties are based on interest rates exceeding a specified rate, in the case of a cap contract, or falling below a specified rate in the case of a floor contract.
Written option contracts outstanding at period end, if any, are listed after the fund’s portfolio.
Futures contracts The fund uses futures contracts for hedging treasury term structure risk and for yield curve positioning.
The potential risk to the fund is that the change in value of futures contracts may not correspond to the change in value of the hedged instruments. In addition, losses may arise from changes in the value of the underlying instruments, if there is an illiquid secondary market for the contracts, if interest or exchange rates move unexpectedly or if the counterparty to the contract is unable to perform. With futures, there is minimal counterparty credit risk to the fund since futures are exchange traded and the exchange’s clearinghouse, as counterparty to all exchange traded futures, guarantees the futures against default. Risks may exceed amounts recognized on the Statement of assets and liabilities. When the contract is closed, the fund records a realized gain or loss equal to the difference between the value of the contract at the time it was opened and the value at the time it was closed.
Futures contracts are valued at the quoted daily settlement prices established by the exchange on which they trade. The fund and the broker agree to exchange an amount of cash equal to the daily fluctuation in the value of the futures contract. Such receipts or payments are known as “variation margin.”
Futures contracts outstanding at period end, if any, are listed after the fund’s portfolio.
Forward currency contracts The fund buys and sells forward currency contracts, which are agreements between two parties to buy and sell currencies at a set price on a future date. These contracts are used for hedging currency exposures and to gain exposure to currencies.
The U.S. dollar value of forward currency contracts is determined using current forward currency exchange rates supplied by a quotation service. The fair value of the contract will fluctuate with changes in currency exchange rates. The contract is marked to market daily and the change in fair value is recorded as an unrealized gain or loss. The fund records a realized gain or loss equal to the difference between the value of the contract at the time it was opened and the value at the time it was closed when the contract matures or by delivery of the currency. The fund could be exposed to risk if the value of the currency changes unfavorably, if the counterparties to the contracts are unable to meet the terms of their contracts or if the fund is unable to enter into a closing position. Risks may exceed amounts recognized on the Statement of assets and liabilities.
Forward currency contracts outstanding at period end, if any, are listed after the fund’s portfolio.
Interest rate swap contracts The fund entered into OTC and/or centrally cleared interest rate swap contracts, which are arrangements between two parties to exchange cash flows based on a notional principal amount, for hedging term structure risk, for yield curve positioning and for gaining exposure to rates in various countries.
An OTC and centrally cleared interest rate swap can be purchased or sold with an upfront premium. For OTC interest rate swap contracts, an upfront payment received by the fund is recorded as a liability on the fund’s books. An upfront payment made by the fund is recorded as an asset on the fund’s books. OTC and centrally cleared interest rate swap contracts are marked to market daily based upon quotations from an independent pricing service or market makers. Any change is recorded as an unrealized gain or loss on OTC interest rate swaps. Daily fluctuations in the value of centrally cleared interest rate swaps are settled through a central clearing agent and are recorded in variation margin on the Statement of assets and liabilities and recorded as unrealized gain or loss. Payments, including upfront premiums, received or made are recorded as realized gains or losses at the reset date or the closing of the contract. Certain OTC and centrally cleared interest rate swap contracts may include extended effective dates. Payments related to these swap contracts are accrued based on the terms of the contract.
The fund could be exposed to credit or market risk due to unfavorable changes in the fluctuation of interest rates or if the counterparty defaults, in the case of OTC interest rate contracts, or the central clearing agency or a clearing member defaults, in the case of centrally cleared interest rate swap contracts, on its respective obligation to perform under the contract. The fund’s maximum risk of loss from counterparty risk or central clearing risk is the fair value of the contract. This risk may be mitigated for OTC interest rate swap contracts by having a master netting arrangement between the fund and the counterparty and for centrally cleared interest rate swap contracts through the daily exchange of variation margin. There is minimal counterparty risk with respect to centrally cleared interest rate swap contracts due to the clearinghouse guarantee fund and other resources that are available in the event of a clearing member default. Risk of loss may exceed amounts recognized on the Statement of assets and liabilities.
OTC and centrally cleared interest rate swap contracts outstanding, including their respective notional amounts at period end, if any, are listed after the fund’s portfolio.
Total return swap contracts The fund entered into OTC and/or centrally cleared total return swap contracts, which are arrangements to exchange a market-linked return for a periodic payment, both based on a notional principal amount, to hedge sector exposure, for gaining exposure to specific sectors, for hedging inflation and for gaining exposure to inflation.
To the extent that the total return of the security, index or other financial measure underlying the transaction exceeds or falls short of the offsetting interest rate obligation, the fund will receive a payment from or make a payment to the counterparty. OTC and/or centrally cleared total return swap contracts are marked to market daily based upon quotations from an independent pricing service or market maker. Any change is recorded as an unrealized gain or loss on OTC total return swaps. Daily fluctuations in the value of centrally cleared total return swaps are settled through a central clearing agent and are recorded in variation margin on the Statement of assets and liabilities and recorded as unrealized gain or loss. Payments received or made are recorded as realized gains or losses. Certain OTC and/or centrally cleared total return swap contracts may include extended effective dates. Payments related to these swap contracts are accrued based on the terms of the contract. The fund could be exposed to credit or market risk due to unfavorable changes in the fluctuation of interest rates or in the price of the underlying security or index, the possibility that there is no liquid market for these agreements or that
the counterparty may default on its obligation to perform. The fund’s maximum risk of loss from counterparty risk or central clearing risk is the fair value of the contract. This risk may be mitigated for OTC total return swap contracts by having a master netting arrangement between the fund and the counterparty and for centrally cleared total return swap contracts through the daily exchange of variation margin. There is minimal counterparty risk with respect to centrally cleared total return swap contracts due to the clearinghouse guarantee fund and other resources that are available in the event of a clearing member default. Risk of loss may exceed amounts recognized on the Statement of assets and liabilities.
OTC and/or centrally cleared total return swap contracts outstanding, including their respective notional amounts at period end, if any, are listed after the fund’s portfolio.
Credit default contracts The fund entered into OTC and/or centrally cleared credit default contracts to hedge credit risk, for gaining liquid exposure to individual names, to hedge market risk and for gaining exposure to specific sectors.
In OTC and centrally cleared credit default contracts, the protection buyer typically makes a periodic stream of payments to a counterparty, the protection seller, in exchange for the right to receive a contingent payment upon the occurrence of a credit event on the reference obligation or all other equally ranked obligations of the reference entity. Credit events are contract specific but may include bankruptcy, failure to pay, restructuring and obligation acceleration. For OTC credit default contracts, an upfront payment received by the fund is recorded as a liability on the fund’s books. An upfront payment made by the fund is recorded as an asset on the fund’s books. Centrally cleared credit default contracts provide the same rights to the protection buyer and seller except the payments between parties, including upfront premiums, are settled through a central clearing agent through variation margin payments. Upfront and periodic payments received or paid by the fund for OTC and centrally cleared credit default contracts are recorded as realized gains or losses at the reset date or close of the contract. The OTC and centrally cleared credit default contracts are marked to market daily based upon quotations from an independent pricing service or market makers. Any change in value of OTC credit default contracts is recorded as an unrealized gain or loss. Daily fluctuations in the value of centrally cleared credit default contracts are recorded in variation margin on the Statement of assets and liabilities and recorded as unrealized gain or loss. Upon the occurrence of a credit event, the difference between the par value and fair value of the reference obligation, net of any proportional amount of the upfront payment, is recorded as a realized gain or loss.
In addition to bearing the risk that the credit event will occur, the fund could be exposed to market risk due to unfavorable changes in interest rates or in the price of the underlying security or index or the possibility that the fund may be unable to close out its position at the same time or at the same price as if it had purchased the underlying reference obligations. In certain circumstances, the fund may enter into offsetting OTC and centrally cleared credit default contracts which would mitigate its risk of loss. Risks of loss may exceed amounts recognized on the Statement of assets and liabilities. The fund’s maximum risk of loss from counterparty risk, either as the protection seller or as the protection buyer, is the fair value of the contract. This risk may be mitigated for OTC credit default contracts by having a master netting arrangement between the fund and the counterparty and for centrally cleared credit default contracts through the daily exchange of variation margin. Counterparty risk is further mitigated with respect to centrally cleared credit default swap contracts due to the clearinghouse guarantee fund and other resources that are available in the event of a clearing member default. Where the fund is a seller of protection, the maximum potential amount of future payments the fund may be required to make is equal to the notional amount.
OTC and centrally cleared credit default contracts outstanding, including their respective notional amounts at period end, if any, are listed after the fund’s portfolio.
TBA commitments The fund may enter into TBA (to be announced) commitments to purchase securities for a fixed unit price at a future date beyond customary settlement time. Although the unit price and par amount have been established, the actual securities have not been specified. However, it is anticipated that the amount of the commitments will not significantly differ from the principal amount. The fund holds, and maintains until settlement date, cash or high-grade debt obligations in an amount sufficient to meet the purchase price, or the fund may enter into offsetting contracts for the forward sale of other securities it owns. Income on the securities will not be earned until settlement date.
The fund may also enter into TBA sale commitments to hedge its portfolio positions, to sell mortgage-backed securities it owns under delayed delivery arrangements or to take a short position in mortgage-backed securities. Proceeds of TBA sale commitments are not received until the contractual settlement date. During the time a TBA sale commitment is outstanding, either equivalent deliverable securities or an offsetting TBA purchase commitment deliverable on or before the sale commitment date are held as “cover” for the transaction, or other
liquid assets in an amount equal to the notional value of the TBA sale commitment are segregated. If the TBA sale commitment is closed through the acquisition of an offsetting TBA purchase commitment, the fund realizes a gain or loss. If the fund delivers securities under the commitment, the fund realizes a gain or a loss from the sale of the securities based upon the unit price established at the date the commitment was entered into.
TBA commitments, which are accounted for as purchase and sale transactions, may be considered securities themselves, and involve a risk of loss due to changes in the value of the security prior to the settlement date as well as the risk that the counterparty to the transaction will not perform its obligations. Counterparty risk is mitigated by having a master agreement between the fund and the counterparty.
Unsettled TBA commitments are valued at their fair value according to the procedures described under “Security valuation” above. The contract is marked to market daily and the change in fair value is recorded by the fund as an unrealized gain or loss. Based on market circumstances, Putnam Management will determine whether to take delivery of the underlying securities or to dispose of the TBA commitments prior to settlement.
TBA purchase commitments outstanding at period end, if any, are listed within the fund’s portfolio and TBA sale commitments outstanding at period end, if any, are listed after the fund’s portfolio.
Master agreements The fund is a party to ISDA (International Swaps and Derivatives Association, Inc.) Master Agreements that govern OTC derivative and foreign exchange contracts and Master Securities Forward Transaction Agreements that govern transactions involving mortgage-backed and other asset-backed securities that may result in delayed delivery (Master Agreements) with certain counterparties entered into from time to time. The Master Agreements may contain provisions regarding, among other things, the parties’ general obligations, representations, agreements, collateral requirements, events of default and early termination. With respect to certain counterparties, in accordance with the terms of the Master Agreements, collateral pledged to the fund is held in a segregated account by the fund’s custodian and, with respect to those amounts which can be sold or repledged, are presented in the fund’s portfolio.
Collateral pledged by the fund is segregated by the fund’s custodian and identified in the fund’s portfolio. Collateral can be in the form of cash or debt securities issued by the U.S. Government or related agencies or other securities as agreed to by the fund and the applicable counterparty. Collateral requirements are determined based on the fund’s net position with each counterparty.
With respect to ISDA Master Agreements, termination events applicable to the fund may occur upon a decline in the fund’s net assets below a specified threshold over a certain period of time. Termination events applicable to counterparties may occur upon a decline in the counterparty’s long-term or short-term credit ratings below a specified level. In each case, upon occurrence, the other party may elect to terminate early and cause settlement of all derivative and foreign exchange contracts outstanding, including the payment of any losses and costs resulting from such early termination, as reasonably determined by the terminating party. Any decision by one or more of the fund’s counterparties to elect early termination could impact the fund’s future derivative activity.
At the close of the reporting period, the fund had a net liability position of $998,560 on open derivative contracts subject to the Master Agreements. Collateral pledged by the fund at period end for these agreements totaled $616,045 and may include amounts related to unsettled agreements.
Interfund lending The fund, along with other Putnam funds, may participate in an interfund lending program pursuant to an exemptive order issued by the SEC. This program allows the fund to borrow from or lend to other Putnam funds that permit such transactions. Interfund lending transactions are subject to each fund’s investment policies and borrowing and lending limits. Interest earned or paid on the interfund lending transaction will be based on the average of certain current market rates. During the reporting period, the fund did not utilize the program.
Lines of credit The fund participates, along with other Putnam funds, in a $100 million ($317.5 million prior to October 14, 2022) unsecured committed line of credit and a $235.5 million unsecured uncommitted line of credit, both provided by State Street. Borrowings may be made for temporary or emergency purposes, including the funding of shareholder redemption requests and trade settlements. Interest is charged to the fund based on the fund’s borrowing at a rate equal to 1.25% plus the higher of (1) the Federal Funds rate and (2) the Overnight Bank Funding Rate for the committed line of credit and 1.30% plus the higher of (1) the Federal Funds rate and (2) the Overnight Bank Funding Rate for the uncommitted line of credit. A closing fee equal to 0.04% of the committed line of credit and 0.04% of the uncommitted line of credit has been paid by the participating funds. In addition, a commitment fee of 0.21% per annum on any unutilized portion of the committed line of credit is allocated to the participating funds based on their relative net assets and paid quarterly. During the reporting period, the fund had no borrowings against these arrangements.
Federal taxes It is the policy of the fund to distribute all of its taxable income within the prescribed time period and otherwise comply with the provisions of the Internal Revenue Code of 1986, as amended (the Code), applicable to regulated investment companies. It is also the intention of the fund to distribute an amount sufficient to avoid imposition of any excise tax under Section 4982 of the Code.
The fund is subject to the provisions of Accounting Standards Codification 740 Income Taxes (ASC 740). ASC 740 sets forth a minimum threshold for financial statement recognition of the benefit of a tax position taken or expected to be taken in a tax return. The fund did not have a liability to record for any unrecognized tax benefits in the accompanying financial statements. No provision has been made for federal taxes on income, capital gains or unrealized appreciation on securities held nor for excise tax on income and capital gains. Each of the fund’s federal tax returns for the prior three fiscal years remains subject to examination by the Internal Revenue Service.
The fund may also be subject to taxes imposed by governments of countries in which it invests. Such taxes are generally based on either income or gains earned or repatriated. The fund accrues and applies such taxes to net investment income, net realized gains and net unrealized gains as income and/or capital gains are earned. In some cases, the fund may be entitled to reclaim all or a portion of such taxes, and such reclaim amounts, if any, are reflected as an asset on the fund’s books. In many cases, however, the fund may not receive such amounts for an extended period of time, depending on the country of investment.
Under the Regulated Investment Company Modernization Act of 2010, the fund will be permitted to carry forward capital losses incurred for an unlimited period and the carry forwards will retain their character as either short-term or long-term capital losses. At October 31, 2022, the fund had the following capital loss carryovers available, to the extent allowed by the Code, to offset future net capital gain, if any:
| | |
| | Loss carryover | |
| Short-term | Long-term | Total |
| $15,138,567 | $8,630,793 | $23,769,360 |
Distributions to shareholders Distributions to shareholders from net investment income are recorded by the fund on the ex-dividend date. Distributions from capital gains, if any, are recorded on the ex-dividend date and paid at least annually. The amount and character of income and gains to be distributed are determined in accordance with income tax regulations, which may differ from generally accepted accounting principles. These differences include temporary and/or permanent differences from losses on wash sale transactions, from foreign currency gains and losses, from unrealized and realized gains and losses on certain futures contracts, from net operating loss, from income on swap contracts, from interest-only securities and from litigation and/or restitution payments. Reclassifications are made to the fund’s capital accounts to reflect income and gains available for distribution (or available capital loss carryovers) under income tax regulations. At the close of the reporting period, the fund reclassified $5,006,127 to decrease undistributed net investment income, $3,274,124 to decrease paid-in capital and $8,280,251 to decrease accumulated net realized loss.
Tax cost of investments includes adjustments to net unrealized appreciation (depreciation) which may not necessarily be final tax cost basis adjustments, but closely approximate the tax basis unrealized gains and losses that may be realized and distributed to shareholders. The tax basis components of distributable earnings and the federal tax cost as of the close of the reporting period were as follows:
| |
| Unrealized appreciation | $205,708,657 |
| Unrealized depreciation | (229,760,379) |
| Net unrealized depreciation | (24,051,722) |
| Capital loss carryforward | (23,769,360) |
| Cost for federal income tax purposes | $261,657,700 |
Note 2: Management fee, administrative services and other transactions
The fund pays Putnam Management a management fee (based on the fund’s average net assets and computed and paid monthly) at annual rates that may vary based on the average of the aggregate net assets of all open-end mutual funds sponsored by Putnam Management (excluding net assets of funds that are invested in, or that are
invested in by, other Putnam funds to the extent necessary to avoid “double counting” of those assets). Such annual rates may vary as follows:
| | | | |
| 0.700% | of the first $5 billion, | | 0.500% | of the next $50 billion, |
| 0.650% | of the next $5 billion, | | 0.480% | of the next $50 billion, |
| 0.600% | of the next $10 billion, | | 0.470% | of the next $100 billion and |
| 0.550% | of the next $10 billion, | | 0.465% | of any excess thereafter. |
For the reporting period, the management fee represented an effective rate (excluding the impact from any expense waivers in effect) of 0.536% of the fund’s average net assets.
Putnam Management has contractually agreed, through February 28, 2024, to waive fees and/or reimburse the fund’s expenses to the extent necessary to limit the cumulative expenses of the fund, exclusive of brokerage, interest, taxes, investment-related expenses, extraordinary expenses, acquired fund fees and expenses and payments under the fund’s investor servicing contract, investment management contract and distribution plans, on a fiscal year-to-date basis to an annual rate of 0.20% of the fund’s average net assets over such fiscal year-to-date period. During the reporting period, the fund’s expenses were reduced by $90,195 as a result of this limit.
Putnam Management has also contractually agreed to waive fees (and, to the extent necessary, bear other expenses) of the fund through February 28, 2024, to the extent that total expenses of the fund (excluding brokerage, interest, taxes, investment-related expenses, payments under distribution plans, extraordinary expenses, payments under the fund’s investor servicing contract and acquired fund fees and expenses, but including payments under the fund’s investment management contract) would exceed an annual rate of 0.43% of the fund’s average net assets. During the reporting period, the fund’s expenses were reduced by $600,433 as a result of this limit.
Putnam Investments Limited (PIL), an affiliate of Putnam Management, is authorized by the Trustees to manage a separate portion of the assets of the fund as determined by Putnam Management from time to time. PIL did not manage any portion of the assets of the fund during the reporting period. If Putnam Management were to engage the services of PIL, Putnam Management would pay a quarterly sub-management fee to PIL for its services at an annual rate of 0.20% (prior to July 1, 2022, the annual rate was 0.40%) of the average net assets of the portion of the fund managed by PIL.
The fund reimburses Putnam Management an allocated amount for the compensation and related expenses of certain officers of the fund and their staff who provide administrative services to the fund. The aggregate amount of all such reimbursements is determined annually by the Trustees.
Custodial functions for the fund’s assets are provided by State Street. Custody fees are based on the fund’s asset level, the number of its security holdings and transaction volumes.
Putnam Investor Services, Inc., an affiliate of Putnam Management, provides investor servicing agent functions to the fund. Putnam Investor Services, Inc. received fees for investor servicing for class A, class B, class C, class R and class Y shares that included (1) a per account fee for each direct and underlying non-defined contribution account (retail account) of the fund; (2) a specified rate of the fund’s assets attributable to defined contribution plan accounts; and (3) a specified rate based on the average net assets in retail accounts. Putnam Investor Services, Inc. has agreed that the aggregate investor servicing fees for each fund’s retail and defined contribution accounts for these share classes will not exceed an annual rate of 0.25% of the fund’s average assets attributable to such accounts.
Class R5 shares paid a monthly fee based on the average net assets of class R5 shares at an annual rate of 0.12%.
Class R6 shares paid a monthly fee based on the average net assets of class R6 shares at an annual rate of 0.05%.
During the reporting period, the expenses for each class of shares related to investor servicing fees were as follows:
| | | | |
| Class A | $216,050 | | Class R5 | 43 |
| Class B | 678 | | Class R6 | 13,420 |
| Class C | 6,720 | | Class Y | 152,910 |
| Class R | 4,091 | | Total | $393,912 |
The fund has entered into expense offset arrangements with Putnam Investor Services, Inc. and State Street whereby Putnam Investor Services, Inc.’s and State Street’s fees are reduced by credits allowed on cash balances. For the reporting period, the fund’s expenses were reduced by $991 under the expense offset arrangements.
Each Independent Trustee of the fund receives an annual Trustee fee, of which $135, as a quarterly retainer, has been allocated to the fund, and an additional fee for each Trustees meeting attended. Trustees also are reimbursed for expenses they incur relating to their services as Trustees.
The fund has adopted a Trustee Fee Deferral Plan (the Deferral Plan) which allows the Trustees to defer the receipt of all or a portion of Trustees fees payable on or after July 1, 1995. The deferred fees remain invested in certain Putnam funds until distribution in accordance with the Deferral Plan.
The fund has adopted an unfunded noncontributory defined benefit pension plan (the Pension Plan) covering all Trustees of the fund who have served as a Trustee for at least five years and were first elected prior to 2004. Benefits under the Pension Plan are equal to 50% of the Trustee’s average annual attendance and retainer fees for the three years ended December 31, 2005. The retirement benefit is payable during a Trustee’s lifetime, beginning the year following retirement, for the number of years of service through December 31, 2006. Pension expense for the fund is included in Trustee compensation and expenses in the Statement of operations. Accrued pension liability is included in Payable for Trustee compensation and expenses in the Statement of assets and liabilities. The Trustees have terminated the Pension Plan with respect to any Trustee first elected after 2003.
The fund has adopted distribution plans (the Plans) with respect to the following share classes pursuant to Rule 12b–1 under the Investment Company Act of 1940. The purpose of the Plans is to compensate Putnam Retail Management Limited Partnership, an indirect wholly-owned subsidiary of Putnam Investments, LLC, for services provided and expenses incurred in distributing shares of the fund. The Plans provide payments by the fund to Putnam Retail Management Limited Partnership at an annual rate of up to the following amounts (Maximum %) of the average net assets attributable to each class. The Trustees have approved payment by the fund at the following annual rate (Approved %) of the average net assets attributable to each class. During the reporting period, the class-specific expenses related to distribution fees were as follows:
| | | |
| | Maximum % | Approved % | Amount |
| Class A | 0.35% | 0.25% | $239,705 |
| Class B | 1.00% | 1.00% | 3,061 |
| Class C | 1.00% | 1.00% | 29,989 |
| Class R | 1.00% | 0.50% | 9,049 |
| Total | | | $281,804 |
For the reporting period, Putnam Retail Management Limited Partnership, acting as underwriter, received net commissions of $3,915 from the sale of class A shares and received no monies and $9 in contingent deferred sales charges from redemptions of class B and class C shares, respectively.
A deferred sales charge of up to 1.00% is assessed on certain redemptions of class A shares. For the reporting period, Putnam Retail Management Limited Partnership, acting as underwriter, received $2,497 on class A redemptions.
Note 3: Purchases and sales of securities
During the reporting period, the cost of purchases and the proceeds from sales, excluding short-term investments, were as follows:
| | |
| | Cost of purchases | Proceeds from sales |
| Investments in securities, including TBA commitments (Long-term) | $2,207,014,048 | $2,186,959,210 |
| U.S. government securities (Long-term) | — | — |
| Total | $2,207,014,048 | $2,186,959,210 |
The fund may purchase or sell investments from or to other Putnam funds in the ordinary course of business, which can reduce the fund’s transaction costs, at prices determined in accordance with SEC requirements and policies approved by the Trustees. During the reporting period, purchases or sales of long-term securities from or to other Putnam funds, if any, did not represent more than 5% of the fund’s total cost of purchases and/or total proceeds from sales.
Note 4: Capital shares
At the close of the reporting period, there were an unlimited number of shares of beneficial interest authorized. Transactions, including, if applicable, direct exchanges pursuant to share conversions, in capital shares were as follows:
| | | | |
| | YEAR ENDED 10/31/22 | YEAR ENDED 10/31/21 |
| Class A | Shares | Amount | Shares | Amount |
| Shares sold | 596,605 | $6,703,654 | 1,700,188 | $21,290,922 |
| Shares issued in connection with | | | | |
| reinvestment of distributions | 155,305 | 1,668,265 | 142,168 | 1,770,116 |
| | 751,910 | 8,371,919 | 1,842,356 | 23,061,038 |
| Shares repurchased | (1,720,306) | (18,796,560) | (1,766,980) | (22,083,550) |
| Net increase (decrease) | (968,396) | $(10,424,641) | 75,376 | $977,488 |
| |
| | YEAR ENDED 10/31/22 | YEAR ENDED 10/31/21 |
| Class B | Shares | Amount | Shares | Amount |
| Shares sold | 10 | $119 | 559 | $7,058 |
| Shares issued in connection with | | | | |
| reinvestment of distributions | 283 | 3,072 | 452 | 5,610 |
| | 293 | 3,191 | 1,011 | 12,668 |
| Shares repurchased | (27,939) | (307,679) | (33,030) | (412,689) |
| Net decrease | (27,646) | $(304,488) | (32,019) | $(400,021) |
| |
| | YEAR ENDED 10/31/22 | YEAR ENDED 10/31/21 |
| Class C | Shares | Amount | Shares | Amount |
| Shares sold | 3,870 | $42,398 | 61,988 | $780,364 |
| Shares issued in connection with | | | | |
| reinvestment of distributions | 3,042 | 32,652 | 3,522 | 43,759 |
| | 6,912 | 75,050 | 65,510 | 824,123 |
| Shares repurchased | (102,061) | (1,100,049) | (268,228) | (3,334,465) |
| Net decrease | (95,149) | $(1,024,999) | (202,718) | $(2,510,342) |
| |
| | YEAR ENDED 10/31/22 | YEAR ENDED 10/31/21 |
| Class R | Shares | Amount | Shares | Amount |
| Shares sold | 19,411 | $215,165 | 53,998 | $673,937 |
| Shares issued in connection with | | | | |
| reinvestment of distributions | 2,798 | 29,925 | 2,544 | 31,680 |
| | 22,209 | 245,090 | 56,542 | 705,617 |
| Shares repurchased | (32,423) | (333,900) | (91,045) | (1,135,538) |
| Net decrease | (10,214) | $(88,810) | (34,503) | $(429,921) |
| | | | |
| | YEAR ENDED 10/31/22 | YEAR ENDED 10/31/21 |
| Class R5 | Shares | Amount | Shares | Amount |
| Shares sold | 873 | $9,725 | 1,074 | $13,370 |
| Shares issued in connection with | | | | |
| reinvestment of distributions | 75 | 809 | 63 | 777 |
| | 948 | 10,534 | 1,137 | 14,147 |
| Shares repurchased | (1,334) | (15,476) | (34) | (413) |
| Net increase (decrease) | (386) | $(4,942) | 1,103 | $13,734 |
| |
| | YEAR ENDED 10/31/22 | YEAR ENDED 10/31/21 |
| Class R6 | Shares | Amount | Shares | Amount |
| Shares sold | 499,948 | $5,612,390 | 619,853 | $7,756,398 |
| Shares issued in connection with | | | | |
| reinvestment of distributions | 56,119 | 604,571 | 53,218 | 662,697 |
| | 556,067 | 6,216,961 | 673,071 | 8,419,095 |
| Shares repurchased | (951,785) | (10,360,107) | (918,554) | (11,531,565) |
| Net decrease | (395,718) | $(4,143,146) | (245,483) | $(3,112,470) |
| |
| | YEAR ENDED 10/31/22 | YEAR ENDED 10/31/21 |
| Class Y | Shares | Amount | Shares | Amount |
| Shares sold | 1,389,065 | $15,818,242 | 2,379,344 | $29,894,907 |
| Shares issued in connection with | | | | |
| reinvestment of distributions | 117,978 | 1,277,039 | 124,875 | 1,553,592 |
| | 1,507,043 | 17,095,281 | 2,504,219 | 31,448,499 |
| Shares repurchased | (4,247,288) | (46,311,812) | (2,380,609) | (29,675,126) |
| Net increase (decrease) | (2,740,245) | $(29,216,531) | 123,610 | $1,773,373 |
At the close of the reporting period, Putnam Investments, LLC owned 1,083 class R5 shares of the fund (32.42% of class R5 shares outstanding), valued at $10,256.
Note 5: Affiliated transactions
Transactions during the reporting period with any company which is under common ownership or control were as follows:
| | | | | |
| | | | | | Shares |
| | | | | | outstanding |
| | | | | | and fair |
| | Fair value as | Purchase | Sale | Investment | value as |
| Name of affiliate | of 10/31/21 | cost | proceeds | income | of 10/31/22 |
| Short-term investments | | | | | |
| Putnam Short Term | | | | | |
| Investment Fund** | $7,750,186 | $103,831,211 | $104,977,646 | $57,061 | $6,603,751 |
| Total Short-term | | | | | |
| investments | $7,750,186 | $103,831,211 | $104,977,646 | $57,061 | $6,603,751 |
** Management fees charged to Putnam Short Term Investment Fund have been waived by Putnam Management. There were no realized or unrealized gains or losses during the period.
Note 6: Market, credit and other risks
In the normal course of business, the fund trades financial instruments and enters into financial transactions where risk of potential loss exists due to changes in the market (market risk) or failure of the contracting party to the transaction to perform (credit risk). The fund may be exposed to additional credit risk that an institution or other entity with which the fund has unsettled or open transactions will default. Investments in foreign securities involve certain risks, including those related to economic instability, unfavorable political developments, and currency fluctuations. The fund may invest in higher-yielding, lower-rated bonds that may have a higher rate of default. The fund may invest a significant portion of its assets in securitized debt instruments, including mortgage-backed and asset-backed investments. The yields and values of these investments are sensitive to changes in interest rates, the rate of principal payments on the underlying assets and the market’s perception of the issuers. The market for these investments may be volatile and limited, which may make them difficult to buy or sell.
On July 27, 2017, the United Kingdom’s Financial Conduct Authority (“FCA”), which regulates LIBOR, announced its intention to cease compelling banks to provide the quotations needed to sustain LIBOR after 2021. ICE Benchmark Administration, the administrator of LIBOR, ceased publication of most LIBOR settings on a representative basis at the end of 2021 and is expected to cease publication of a majority of U.S. dollar LIBOR settings on a representative basis after June 30, 2023. In addition, global regulators have announced that, with limited exceptions, no new LIBOR-based contracts should be entered into after 2021. LIBOR has historically been a common benchmark interest rate index used to make adjustments to variable-rate loans. It is used throughout global banking and financial industries to determine interest rates for a variety of financial instruments and borrowing arrangements. Actions by regulators have resulted in the establishment of alternative reference rates to LIBOR in most major currencies. Various financial industry groups have been planning for the transition away from LIBOR, but there are obstacles to converting certain longer-term securities and transactions to new reference rates. Markets are developing slowly and questions around liquidity in these rates and how to appropriately adjust these rates to mitigate any economic value transfer at the time of transition remain a significant concern. Neither the effect of the transition process nor its ultimate success can yet be known. The transition process might lead to increased volatility and illiquidity in markets that rely on LIBOR to determine interest rates. It could also lead to a reduction in the value of some LIBOR-based investments and reduce the effectiveness of related transactions, such as hedges. While some LIBOR-based instruments may contemplate a scenario where LIBOR is no longer available by providing for an alternative rate-setting methodology, not all may have such provisions and there may be significant uncertainty regarding the effectiveness of any such alternative methodologies. Since the usefulness of LIBOR as a benchmark could deteriorate during the transition period, these effects could occur at any time.
Beginning in January 2020, global financial markets have experienced, and may continue to experience, significant volatility resulting from the spread of a virus known as Covid–19. The outbreak of Covid–19 has resulted in travel and border restrictions, quarantines, supply chain disruptions, lower consumer demand, and general market uncertainty. The effects of Covid–19 have adversely affected, and may continue to adversely affect, the global economy, the economies of certain nations, and individual issuers, all of which may negatively impact the fund’s performance.
Note 7: Summary of derivative activity
The volume of activity for the reporting period for any derivative type that was held during the period is listed below and was based on an average of the holdings at the end of each fiscal quarter:
| |
| Purchased currency option contracts (contract amount) | $10,200,000 |
| Purchased swap option contracts (contract amount) | $345,800,000 |
| Written currency option contracts (contract amount) | $770,000 |
| Written swap option contracts (contract amount) | $302,300,000 |
| Futures contracts (number of contracts) | 400 |
| Forward currency contracts (contract amount) | $185,600,000 |
| OTC interest rate swap contracts (notional) | $500,000 |
| Centrally cleared interest rate swap contracts (notional) | $386,700,000 |
| OTC total return swap contracts (notional) | $960,000 |
| Centrally cleared total return swap contracts (notional) | $2,500,000 |
| OTC credit default contracts (notional) | $10,200,000 |
The following is a summary of the fair value of derivative instruments as of the close of the reporting period:
| | | | |
| Fair value of derivative instruments as of the close of the reporting period | |
| | ASSET DERIVATIVES | LIABILITY DERIVATIVES |
| Derivatives not | | | | |
| accounted for as | Statement of | | Statement of | |
| hedging instruments | assets and | | assets and | |
| under ASC 815 | liabilities location | Fair value | liabilities location | Fair value |
| Credit contracts | Receivables | $1,160,510 | Payables | $642,989 |
| Foreign exchange | | | | |
| contracts | Receivables | 1,476,435 | Payables | 2,156,157 |
| | Investments, | | | |
| | Receivables, Net | | | |
| | assets — Unrealized | | Payables, Net assets — | |
| Interest rate contracts | appreciation | 21,256,492* | Unrealized depreciation | 18,203,338* |
| Total | | $23,893,437 | | $21,002,484 |
* Includes cumulative appreciation/depreciation of futures contracts and/or centrally cleared swaps as reported in the fund’s portfolio. Only current day’s variation margin is reported within the Statement of assets and liabilities.
The following is a summary of realized and change in unrealized gains or losses of derivative instruments in the Statement of operations for the reporting period (Note 1):
| | | | | |
| Amount of realized gain or (loss) on derivatives recognized in net gain or (loss) on investments |
| Derivatives not accounted | | | Forward | | |
| for as hedging instruments | | | currency | | |
| under ASC 815 | Options | Futures | contracts | Swaps | Total |
| Credit contracts | $— | $— | $— | $(293,660) | $(293,660) |
| Foreign exchange contracts | (548,869) | — | (1,628,725) | — | $(2,177,594) |
| Interest rate contracts | (4,399,764) | (2,222,914) | — | (3,330,083) | $(9,952,761) |
| Total | $(4,948,633) | $(2,222,914) | $(1,628,725) | $(3,623,743) | $(12,424,015) |
| | | | | |
| Change in unrealized appreciation or (depreciation) on derivatives recognized in net gain or (loss) |
| on investments | | | | | |
| Derivatives not accounted | | | Forward | | |
| for as hedging instruments | | | currency | | |
| under ASC 815 | Options | Futures | contracts | Swaps | Total |
| Credit contracts | $— | $— | $— | $266,482 | $266,482 |
| Foreign exchange contracts | 570,036 | — | (148,944) | — | $421,092 |
| Interest rate contracts | 2,328,679 | (934,435) | — | 3,099,951 | $4,494,195 |
| Total | $2,898,715 | $(934,435) | $(148,944) | $3,366,433 | $5,181,769 |
|
| This page left blank intentionally. |
Note 8: Offsetting of financial and derivative assets and liabilities
The following table summarizes any derivatives, repurchase agreements and reverse repurchase agreements, at the end of the reporting period, that are subject to an enforceable master netting agreement or similar agreement. For securities lending transactions or borrowing transactions associated with securities sold short, if any, see Note 1. For financial reporting purposes, the fund does not offset financial assets and financial liabilities that are subject to the master netting agreements in the Statement of assets and liabilities.
| | | | | | | | | | | | | | | | | | | | |
| | Bank of
America N.A. | Barclays Bank
PLC | Barclays
Capital, Inc.
(clearing
broker) | BofA
Securities,
Inc. | Citibank, N.A. | Citigroup
Global
Markets, Inc. | Credit Suisse
International | Goldman
Sachs
International | HSBC Bank
USA, National
Association | JPMorgan
Chase Bank
N.A. | JPMorgan
Securities LLC | Merrill Lynch
International | Morgan
Stanley & Co.
International
PLC | NatWest
Markets PLC | State Street
Bank and
Trust Co. | Toronto-
Dominion
Bank | UBS AG | Wells Fargo
Bank, N.A. | WestPac
Banking Corp. | Total |
| Assets: | | | | | | | | | | | | | | | | | | | | |
| Centrally cleared | | | | | | | | | | | | | | | | | | | | |
| interest rate | | | | | | | | | | | | | | | | | | | | |
| swap contracts§ | $— | $— | $1,218,598 | $— | $— | $— | $— | $— | $— | $— | $— | $— | $— | $— | $— | $— | $— | $— | $— | $1,218,598 |
| OTC Total return | | | | | | | | | | | | | | | | | | | | |
| swap contracts*# | — | — | — | — | — | — | — | — | — | — | — | — | — | — | — | — | — | — | — | — |
| OTC Credit default | | | | | | | | | | | | | | | | | | | | |
| contracts — | | | | | | | | | | | | | | | | | | | | |
| protection sold *# | — | — | — | — | — | — | — | — | — | — | — | — | — | — | — | — | — | — | — | — |
| OTC Credit default | | | | | | | | | | | | | | | | | | | | |
| contracts — | | | | | | | | | | | | | | | | | | | | |
| protection | | | | | | | | | | | | | | | | | | | | |
| purchased*# | — | — | — | — | — | 300,600 | 245,647 | 252,329 | — | — | 9,492 | 54,815 | 297,627 | — | — | — | — | — | — | 1,160,510 |
| Futures contracts§ | — | — | — | — | — | — | — | — | — | — | 53,573 | — | — | — | — | — | — | — | — | 53,573 |
| Forward currency | | | | | | | | | | | | | | | | | | | | |
| contracts# | 523,286 | 18,106 | — | — | 2,908 | — | — | 160,096 | 214,366 | 333,373 | — | — | 24,443 | 92,621 | 45,193 | 14,294 | 32,100 | — | 15,649 | 1,476,435 |
| Forward premium | | | | | | | | | | | | | | | | | | | | |
| swap option | | | | | | | | | | | | | | | | | | | | |
| contracts# | 1,372,119 | — | — | — | 1,841,793 | — | — | 394,347 | — | 388,951 | — | — | 467,903 | — | — | 220,884 | 743,230 | — | — | 5,429,227 |
| Total Assets | $1,895,405 | $18,106 | $1,218,598 | $— | $1,844,701 | $300,600 | $245,647 | $806,772 | $214,366 | $722,324 | $63,065 | $54,815 | $789,973 | $92,621 | $45,193 | $235,178 | $775,330 | $— | $15,649 | $9,338,343 |
| Liabilities: | | | | | | | | | | | | | | | | | | | | |
| Centrally cleared | | | | | | | | | | | | | | | | | | | | |
| interest rate | | | | | | | | | | | | | | | | | | | | |
| swap contracts§ | $— | $— | $ 1,123,634 | $— | $— | $— | $— | $— | $— | $— | $— | $— | $— | $— | $— | $— | $— | $— | $— | $ 1,123,634 |
| OTC Total return | | | | | | | | | | | | | | | | | | | | |
| swap contracts*# | — | — | — | — | — | — | — | — | — | — | — | — | 77,336 | — | — | — | — | — | — | 77,336 |
| OTC Credit default | | | | | | | | | | | | | | | | | | | | |
| contracts — | | | | | | | | | | | | | | | | | | | | |
| protection sold*# | 48,024 | — | — | — | — | 248,815 | 20,223 | 18,318 | — | — | 72,341 | — | 157,932 | — | — | — | — | — | — | 565,653 |
| OTC Credit default | | | | | | | | | | | | | | | | | | | | |
| contracts — | | | | | | | | | | | | | | | | | | | | |
| protection | | | | | | | | | | | | | | | | | | | | |
| purchased*# | — | — | — | — | — | — | — | — | — | — | — | — | — | — | — | — | — | — | — | — |
| Futures contracts§ | — | — | — | — | — | — | — | — | — | — | 152,427 | — | — | — | — | — | — | — | — | 152,427 |
| Forward currency | | | | | | | | | | | | | | | | | | | | |
| contracts# | 11,507 | 6,335 | — | — | 972 | — | — | 23,773 | 625,834 | 265,412 | — | — | 209,710 | 3,616 | 266,414 | 131,827 | 609,701 | — | 1,056 | 2,156,157 |
| Forward premium | | | | | | | | | | | | | | | | | | | | |
| swap option | | | | | | | | | | | | | | | | | | | | |
| contracts# | 686,907 | — | — | — | 778,650 | — | — | 244,003 | — | 509,483 | — | — | 198,289 | — | — | 71,610 | 401,214 | 14,866 | — | 2,905,022 |
| Total Liabilities | $746,438 | $6,335 | $1,123,634 | $— | $779,622 | $248,815 | $20,223 | $286,094 | $625,834 | $774,895 | $224,768 | $— | $643,267 | $3,616 | $266,414 | $203,437 | $1,010,915 | $14,866 | $1,056 | $6,980,229 |
| |
| 96 Global Income Trust | Global Income Trust 97 |
| | | | | | | | | | | | | | | | | | | | |
| | Bank of
America N.A. | Barclays Bank
PLC | Barclays
Capital, Inc.
(clearing
broker) | BofA
Securities,
Inc. | Citibank, N.A. | Citigroup
Global
Markets, Inc. | Credit Suisse
International | Goldman
Sachs
International | HSBC Bank
USA, National
Association | JPMorgan
Chase Bank
N.A. | JPMorgan
Securities LLC | Merrill Lynch
International | Morgan
Stanley & Co.
International
PLC | NatWest
Markets PLC | State Street
Bank and
Trust Co. | Toronto-
Dominion
Bank | UBS AG | Wells Fargo
Bank, N.A. | WestPac
Banking Corp. | Total |
| Total Financial | | | | | | | | | | | | | | | | | | | | |
| and Derivative | | | | | | | | | | | | | | | | | | | | |
| Net Assets | $1,148,967 | $11,771 | $94,964 | $— | $1,065,079 | $51,785 | $225,424 | $520,678 | $(411,468) | $(52,571) | $(161,703) | $54,815 | $146,706 | $89,005 | $(221,221) | $31,741 | $(235,585) | $(14,866) | $14,593 | $2,358,114 |
| Total collateral | | | | | | | | | | | | | | | | | | | | |
| received | | | | | | | | | | | | | | | | | | | | |
| (pledged)†## | $1,148,967 | $— | $— | $— | $1,065,079 | $— | $225,424 | $340,000 | $(383,715) | $— | $— | $— | $110,000 | $89,005 | $(120,677) | $— | $(111,653) | $— | $— | |
| Net amount | $— | $11,771 | $94,964 | $— | $— | $51,785 | $— | $180,678 | $(27,753) | $(52,571) | $(161,703) | $54,815 | $36,706 | $— | $(100,544) | $31,741 | $(123,932) | $(14,866) | $14,593 | |
| Controlled | | | | | | | | | | | | | | | | | | | | |
| collateral received | | | | | | | | | | | | | | | | | | | | |
| (including TBA | | | | | | | | | | | | | | | | | | | | |
| commitments)** | $1,150,924 | $— | $— | $— | $1,067,000 | $— | $260,000 | $340,000 | $— | $— | $— | $— | $110,000 | $90,592 | $— | $— | $— | $— | $— | $3,018,516 |
| Uncontrolled | | | | | | | | | | | | | | | | | | | | |
| collateral received | $— | $— | $— | $— | $— | $— | $— | $— | $— | $— | $— | $— | $— | $— | $— | $— | $— | $— | $— | $— |
| Collateral | | | | | | | | | | | | | | | | | | | | |
| (pledged) | | | | | | | | | | | | | | | | | | | | |
| (including TBA | | | | | | | | | | | | | | | | | | | | |
| commitments)** | $— | $— | $— | $(138,500) | $— | $(414,161) | $— | $— | $(383,715) | $— | $(491,456) | $— | $— | $— | $(120,677) | $— | $(111,653) | $— | $— | $(1,660,162) |
* Excludes premiums, if any. Included in unrealized appreciation and depreciation on OTC swap contracts on the Statement of assets and liabilities.
** Included with Investments in securities on the Statement of assets and liabilities.
† Additional collateral may be required from certain brokers based on individual agreements.
# Covered by master netting agreement (Note 1).
## Any over-collateralization of total financial and derivative net assets is not shown. Collateral may include amounts related to unsettled agreements.
§ Includes current day’s variation margin only as reported on the Statement of assets and liabilities, which is not collateralized. Cumulative appreciation/(depreciation) for futures contracts and centrally cleared swap contracts is represented in the tables listed after the fund’s portfolio. Collateral pledged for initial margin on futures contracts and centrally cleared swap contracts, which is not included in the table above, amounted to $722,858 and $1,740,280, respectively.
Note 9: New accounting pronouncements
In March 2020, the Financial Accounting Standards Board (FASB) issued Accounting Standards Update (ASU) 2020–04, Reference Rate Reform (Topic 848) — Facilitation of the Effects of Reference Rate Reform on Financial Reporting. The amendments in ASU 2020–04 provide optional temporary financial reporting relief from the effect of certain types of contract modifications due to the planned discontinuation of LIBOR and other interbank-offered based reference rates as of the end of 2021. The discontinuation of LIBOR was subsequently extended to June 30, 2023. ASU 2020–04 is effective for certain reference rate-related contract modifications that occur during the period March 12, 2020 through December 31, 2022. The adoption of the guidance will not have a material impact on the fund’s financial statements.
| |
| 98 Global Income Trust | Global Income Trust 99 |
Federal tax information (Unaudited)
For the reporting period, a portion of the fund’s distribution represents a return of capital and is therefore not taxable to shareholders. The return of capital is entirely due to foreign currency losses and/or losses on swaps.
The Form 1099 that will be mailed to you in January 2023 will show the tax status of all distributions paid to your account in calendar 2022.
Shareholder meeting results (Unaudited)
June 29, 2022 special meeting
At the meeting, each of the nominees for Trustees was elected, as follows:
| | |
| | Votes for | Votes withheld |
| Liaquat Ahamed | 12,874,465 | 226,542 |
| Barbara M. Baumann | 12,939,109 | 161,898 |
| Katinka Domotorffy | 12,923,480 | 177,527 |
| Catharine Bond Hill | 12,936,554 | 164,452 |
| Kenneth R. Leibler | 12,925,051 | 175,956 |
| Jennifer Williams Murphy | 12,941,498 | 159,509 |
| Marie Pillai | 12,918,583 | 182,423 |
| George Putnam, III | 12,950,800 | 150,207 |
| Robert L. Reynolds | 12,961,942 | 139,065 |
| Manoj P. Singh | 12,875,092 | 225,914 |
| Mona K. Sutphen | 12,922,591 | 178,416 |
All tabulations are rounded to the nearest whole number.


* Mr. Reynolds is an “interested person” (as defined in the Investment Company Act of 1940) of the fund and Putnam Investments. He is President and Chief Executive Officer of Putnam Investments, as well as the President of your fund and each of the other Putnam funds.
The address of each Trustee is 100 Federal Street, Boston, MA 02110.
As of October 31, 2022, there were 102 funds in the Putnam fund complex, including 96 Putnam Funds and six funds in Putnam ETF Trust. Each Trustee serves as Trustee of all Putnam Funds. In addition to serving as Trustees of the Putnam Funds, Dr. Hill, Mses. Domotorffy and Sutphen, and Mr. Ahamed serve as Trustees of Putnam ETF Trust.
Each Trustee serves for an indefinite term, until his or her resignation, retirement at age 75, removal, or death.
Officers
In addition to Robert L. Reynolds, the other officers of the fund are shown below:
| |
| James F. Clark (Born 1974) | Alan G. McCormack (Born 1964) |
| Vice President and Chief Compliance Officer | Vice President and Derivatives Risk Manager |
| Since 2016 | Since 2022 |
| Chief Compliance Officer and Chief Risk Officer, | Head of Quantitative Equities and Risk, |
| Putnam Investments, and Chief Compliance Officer, | Putnam Investments |
| Putnam Management | |
| | Denere P. Poulack (Born 1968) |
| Nancy E. Florek (Born 1957) | Assistant Vice President, Assistant Clerk, |
| Vice President, Director of Proxy Voting and Corporate | and Assistant Treasurer |
| Governance, Assistant Clerk, and Assistant Treasurer | Since 2004 |
| Since 2000 | |
| | Janet C. Smith (Born 1965) |
| Michael J. Higgins (Born 1976) | Vice President, Principal Financial Officer, Principal |
| Vice President, Treasurer, and Clerk | Accounting Officer, and Assistant Treasurer |
| Since 2010 | Since 2007 |
| | Head of Fund Administration Services, |
| Jonathan S. Horwitz (Born 1955) | Putnam Investments and Putnam Management |
| Executive Vice President, Principal Executive Officer, | |
| and Compliance Liaison | Stephen J. Tate (Born 1974) |
| Since 2004 | Vice President and Chief Legal Officer |
| | Since 2021 |
| Richard T. Kircher (Born 1962) | General Counsel, Putnam Investments, |
| Vice President and BSA Compliance Officer | Putnam Management, and Putnam Retail Management |
| Since 2019 | |
| Assistant Director, Operational Compliance, Putnam | Mark C. Trenchard (Born 1962) |
| Investments and Putnam Retail Management | Vice President |
| | Since 2002 |
| Martin Lemaire (Born 1984) | Director of Operational Compliance, Putnam |
| Vice President and Derivatives Risk Manager | Investments and Putnam Retail Management |
| Since 2022 | |
| Risk Manager and Risk Analyst, Putnam Investments | |
| | |
| Susan G. Malloy (Born 1957) | |
| Vice President and Assistant Treasurer | |
| Since 2007 | |
| Head of Accounting and Middle Office Services, | |
| Putnam Investments and Putnam Management | |
The principal occupations of the officers for the past five years have been with the employers as shown above, although in some cases they have held different positions with such employers. The address of each officer is 100 Federal Street, Boston, MA 02110.
Fund information
Founded over 80 years ago, Putnam Investments was built around the concept that a balance between risk and reward is the hallmark of a well-rounded financial program. We manage funds across income, value, blend, growth, sustainable, asset allocation, absolute return, and global sector categories.
| | |
| Investment Manager | Trustees | Richard T. Kircher |
| Putnam Investment | Kenneth R. Leibler, Chair | Vice President and |
| Management, LLC | Barbara M. Baumann, Vice Chair | BSA Compliance Officer |
| 100 Federal Street | Liaquat Ahamed | |
| Boston, MA 02110 | Katinka Domotorffy | Martin Lemaire |
| | Catharine Bond Hill | Vice President and |
| Investment Sub-Advisor | Jennifer Williams Murphy | Derivatives Risk Manager |
| Putnam Investments Limited | Marie Pillai | |
| 16 St James’s Street | George Putnam, III | Susan G. Malloy |
| London, England SW1A 1ER | Robert L. Reynolds | Vice President and |
| | Manoj P. Singh | Assistant Treasurer |
| Marketing Services | Mona K. Sutphen | |
| Putnam Retail Management | | Alan G. McCormack |
| Limited Partnership | Officers | Vice President and |
| 100 Federal Street | Robert L. Reynolds | Derivatives Risk Manager |
| Boston, MA 02110 | President | |
| | | Denere P. Poulack |
| Custodian | James F. Clark | Assistant Vice President, |
| State Street Bank | Vice President, Chief Compliance | Assistant Clerk, and |
| and Trust Company | Officer, and Chief Risk Officer | Assistant Treasurer |
| | | |
| Legal Counsel | Nancy E. Florek | Janet C. Smith |
| Ropes & Gray LLP | Vice President, Director of | Vice President, |
| Proxy Voting and Corporate | Principal Financial Officer, |
| Independent Registered | Governance, Assistant Clerk, | Principal Accounting Officer, |
| Public Accounting Firm | and Assistant Treasurer | and Assistant Treasurer |
| PricewaterhouseCoopers LLP | | |
| | Michael J. Higgins | Stephen J. Tate |
| | Vice President, Treasurer, | Vice President and |
| | and Clerk | Chief Legal Officer |
| | | |
| | Jonathan S. Horwitz | Mark C. Trenchard |
| | Executive Vice President, | Vice President |
| Principal Executive Officer, | |
| | and Compliance Liaison | |
This report is for the information of shareholders of Putnam Global Income Trust. It may also be used as sales literature when preceded or accompanied by the current prospectus, the most recent copy of Putnam’s Quarterly Performance Summary, and Putnam’s Quarterly Ranking Summary. For more recent performance, please visit putnam.com. Investors should carefully consider the investment objectives, risks, charges, and expenses of a fund, which are described in its prospectus. For this and other information or to request a prospectus or summary prospectus, call 1-800-225-1581 toll free. Please read the prospectus carefully before investing. The fund’s Statement of Additional Information contains additional information about the fund’s Trustees and is available without charge upon request by calling 1-800-225-1581.

| |
| (a) The fund’s principal executive, financial and accounting officers are employees of Putnam Investment Management, LLC, the Fund’s investment manager. As such they are subject to a comprehensive Code of Ethics adopted and administered by Putnam Investments which is designed to protect the interests of the firm and its clients. The Fund has adopted a Code of Ethics which incorporates the Code of Ethics of Putnam Investments with respect to all of its officers and Trustees who are employees of Putnam Investment Management, LLC. For this reason, the Fund has not adopted a separate code of ethics governing its principal executive, financial and accounting officers. |
| |
| Item 3. Audit Committee Financial Expert: |
| |
| The Funds’ Audit, Compliance and Risk Committee is comprised solely of Trustees who are “independent” (as such term has been defined by the Securities and Exchange Commission (“SEC”) in regulations implementing Section 407 of the Sarbanes-Oxley Act (the “Regulations”)). The Trustees believe that each member of the Audit, Compliance and Risk Committee also possesses a combination of knowledge and experience with respect to financial accounting matters, as well as other attributes, that qualifies him or her for service on the Committee. In addition, the Trustees have determined that each of Dr. Hill and Mr. Singh qualifies as an “audit committee financial expert” (as such term has been defined by the Regulations) based on their review of his or her pertinent experience and education.The SEC has stated, and the funds’ amended and restated agreement and Declaration of Trust provides, that the designation or identification of a person as an audit committee financial expert pursuant to this Item 3 of Form N-CSR does not impose on such person any duties, obligations or liability that are greater than the duties, obligations and liability imposed on such person as a member of the Audit, Compliance and Risk Committee and the Board of Trustees in the absence of such designation or identification. |
| |
| Item 4. Principal Accountant Fees and Services: |
| |
| The following table presents fees billed in each of the last two fiscal years for services rendered to the fund by the fund’s independent auditor: |
| | | | | |
| Fiscal year ended | Audit Fees | Audit-Related Fees | Tax Fees | All Other Fees |
|
|
| | | | | |
| October 31, 2022 | $139,609 | $ — | $12,920 | $ — |
| October 31, 2021 | $143,128 | $ — | $12,318 | $ — |
| |
| For the fiscal years ended October 31, 2022 and October 31, 2021, the fund’s independent auditor billed aggregate non-audit fees in the amounts of $311,203 and $277,217 respectively, to the fund, Putnam Management and any entity controlling, controlled by or under common control with Putnam Management that provides ongoing services to the fund. |
| |
| Audit Fees represent fees billed for the fund’s last two fiscal years relating to the audit and review of the financial statements included in annual reports and registration statements, and other services that are normally provided in connection with statutory and regulatory filings or engagements. |
| |
| Audit-Related Fees represent fees billed in the fund’s last two fiscal years for services traditionally performed by the fund’s auditor, including accounting consultation for proposed transactions or concerning financial accounting and reporting standards and other audit or attest services not required by statute or regulation. |
| |
| Tax Fees represent fees billed in the fund’s last two fiscal years for tax compliance, tax planning and tax advice services. Tax planning and tax advice services include assistance with tax audits, employee benefit plans and requests for rulings or technical advice from taxing authorities. |
| |
| Pre-Approval Policies of the Audit, Compliance and Risk Committee. The Audit, Compliance and Risk Committee of the Putnam funds has determined that, as a matter of policy, all work performed for the funds by the funds’ independent auditors will be pre-approved by the Committee itself and thus will generally not be subject to pre-approval procedures. |
| |
| The Audit, Compliance and Risk Committee also has adopted a policy to pre-approve the engagement by Putnam Management and certain of its affiliates of the funds’ independent auditors, even in circumstances where pre-approval is not required by applicable law. Any such requests by Putnam Management or certain of its affiliates are typically submitted in writing to the Committee and explain, among other things, the nature of the proposed engagement, the estimated fees, and why this work should be performed by that particular audit firm as opposed to another one. In reviewing such requests, the Committee considers, among other things, whether the provision of such services by the audit firm are compatible with the independence of the audit firm. |
| |
| The following table presents fees billed by the fund’s independent auditor for services required to be approved pursuant to paragraph (c)(7)(ii) of Rule 2–01 of Regulation S-X. |
| | | | | |
| Fiscal year ended | Audit-Related Fees | Tax Fees | All Other Fees | Total Non-Audit Fees |
|
|
| October 31, 2022 | $ — | $298,283 | $ — | $ — |
| October 31, 2021 | $ — | $264,899 | $ — | $ — |
| |
| Item 5. Audit Committee of Listed Registrants |
| |
| Item 6. Schedule of Investments: |
| |
| The registrant’s schedule of investments in unaffiliated issuers is included in the report to shareholders in Item 1 above. |
| |
| Item 7. Disclosure of Proxy Voting Policies and Procedures For Closed-End Management Investment Companies: |
| |
| Item 8. Portfolio Managers of Closed-End Investment Companies |
| |
| Item 9. Purchases of Equity Securities by Closed-End Management Investment Companies and Affiliated Purchasers: |
| |
| Item 10. Submission of Matters to a Vote of Security Holders: |
| |
| Item 11. Controls and Procedures: |
| |
| (a) The registrant’s principal executive officer and principal financial officer have concluded, based on their evaluation of the effectiveness of the design and operation of the registrant’s disclosure controls and procedures as of a date within 90 days of the filing date of this report, that the design and operation of such procedures are generally effective to provide reasonable assurance that information required to be disclosed by the registrant in this report is recorded, processed, summarized and reported within the time periods specified in the Commission’s rules and forms. |
| |
| (b) Changes in internal control over financial reporting: Not applicable |
| |
| Item 12. Disclosures of Securities Lending Activities for Closed-End Management Investment Companies: |
| |
| (a)(1) The Code of Ethics of The Putnam Funds, which incorporates the Code of Ethics of Putnam Investments, is filed herewith. |
| |
| Pursuant to the requirements of the Securities Exchange Act of 1934 and the Investment Company Act of 1940, the registrant has duly caused this report to be signed on its behalf by the undersigned, thereunto duly authorized. |
| |
| Putnam Global Income Trust |
| |
| By (Signature and Title): |
| |
| /s/ Janet C. Smith
Janet C. Smith
Principal Accounting Officer
|
| |
| Pursuant to the requirements of the Securities Exchange Act of 1934 and the Investment Company Act of 1940, this report has been signed below by the following persons on behalf of the registrant and in the capacities and on the dates indicated. |
| |
| By (Signature and Title): |
| |
| /s/ Jonathan S. Horwitz
Jonathan S. Horwitz
Principal Executive Officer
|
| |
| By (Signature and Title): |
| |
| /s/ Janet C. Smith
Janet C. Smith
Principal Financial Officer
|