| | |
| UNITED STATES
SECURITIES AND EXCHANGE COMMISSION |
| | |
| CERTIFIED SHAREHOLDER REPORT OF REGISTERED
MANAGEMENT INVESTMENT COMPANIES
|
| | |
| Investment Company Act file number: | (811-05802) |
| | |
| Exact name of registrant as specified in charter: | Putnam Pennsylvania Tax Exempt Income Fund |
| | |
| Address of principal executive offices: | One Post Office Square, Boston, Massachusetts 02109 |
| | |
| Name and address of agent for service: | Robert T. Burns, Vice President
One Post Office Square
Boston, Massachusetts 02109 |
| | |
| Copy to: | John W. Gerstmayr, Esq.
Ropes & Gray LLP
800 Boylston Street
Boston, Massachusetts 02199-3600 |
| | |
| Registrant’s telephone number, including area code: | (617) 292-1000 |
| | |
| Date of fiscal year end: | May 31, 2012 |
| | |
| Date of reporting period: | June 1, 2011 — November 30, 2011 |
| | |
|
Item 1. Report to Stockholders: | |
| | |
| The following is a copy of the report transmitted to stockholders pursuant to Rule 30e-1 under the Investment Company Act of 1940: | |
Putnam Pennsylvania
Tax Exempt
Income Fund
Semiannual report
11 | 30 | 11
| | | |
| Message from the Trustees | 1 | | |
| | |
| About the fund | 2 | | |
| | |
| Performance snapshot | 4 | | |
| | |
| Interview with your fund’s portfolio manager | 5 | | |
| | |
| Your fund’s performance | 10 | | |
| | |
| Your fund’s expenses | 12 | | |
| | |
| Terms and definitions | 14 | | |
| | |
| Other information for shareholders | 15 | | |
| | |
| Trustee approval of management contract | 16 | | |
| | |
| Financial statements | 20 | | |
| | |
Message from the Trustees
Dear Fellow Shareholder:
For all the volatility and economic uncertainty investors experienced in recent months, U.S. equity markets ended the year more or less where they started; some fixed-income sectors posted modest gains, while others struggled. This period of heightened volatility is likely to persist, given the unresolved European debt crisis and tepid growth here in the United States. However, not all the news is bad. Corporate earnings and balance sheets remain solid, unemployment has trended down, inflation pressures have eased globally, and state budgets show early signs of improvement.
The counsel of your financial advisor can be an invaluable resource during periods of market uncertainty, as can a long-term focus and a balanced investment approach. Moreover, Putnam’s portfolio managers and analysts are trained to uncover the opportunities that often emerge in this kind of environment, while also seeking to guard against downside risk.
We would like to thank John A. Hill, who has served as Chairman of the Trustees since 2000 and who continues on as a Trustee, for his service. We are pleased to announce that Jameson A. Baxter is the new Chair, having served as Vice Chair since 2005 and a Trustee since 1994.
Ms. Baxter is President of Baxter Associates, Inc., a private investment firm, and Chair of the Mutual Fund Directors Forum. In addition, she serves as Chair Emeritus of the Board of Trustees of Mount Holyoke College, Director of the Adirondack Land Trust, and Trustee of the Nature Conservancy’s Adirondack Chapter.
We would also like to take this opportunity to welcome new shareholders to the fund and to thank all of our investors for your continued confidence in Putnam.

About the fund
Seeking a high level of tax-free income for Pennsylvania investors

Municipal bonds can help investors keep more of their investment income while also financing important public projects such as schools, roads, and hospitals. Municipal bonds are typically issued by states and local municipalities to raise funds for building and maintaining public facilities, and they offer income that is generally exempt from federal, state, and local income tax.
Putnam Pennsylvania Tax Exempt Income Fund seeks to capitalize on investment opportunities by investing in bonds across a range of sectors. The fund also combines bonds of differing credit quality to increase income potential. In addition to investing in high-quality bonds, the fund’s managers allocate a smaller portion of the portfolio to lower-rated bonds, which may offer higher income in return for more risk.
When deciding whether to invest in a bond, the fund’s managers consider the risks involved, including credit risk, interest-rate risk, and the risk that the bond will be prepaid.
The managers are backed by the resources of Putnam’s fixed-income organization, in which municipal bond analysts are grouped into sector teams and conduct ongoing, rigorous research. Once a bond has been purchased, the managers continue to monitor developments that may affect the bond market, the sector, and the issuer of the bond.
The goal of this in-depth research and active management is to stay a step ahead of the industry and pinpoint opportunities for investors.
Consider these risks before investing: Investments in a single state carry risks of vulnerability to common economic forces and other factors affecting the state’s tax-exempt investments, which may result in greater losses and volatility. Capital gains, if any, are taxable for federal and, in most cases, state purposes. For some investors, investment income may be subject to the federal alternative minimum tax. Funds that invest in bonds are subject to certain risks including interest-rate risk, credit risk, and inflation risk. As interest rates rise, the prices of bonds fall. Long-term bonds are more exposed to interest-rate risk than short-term bonds. Unlike bonds, bond funds have ongoing fees and expenses. Since the fund invests in tax-exempt bonds, which, to be treated as tax exempt under the Internal Revenue Code, may be issued only by limited types of issuers for limited types of projects, the fund’s investments may be focused in certain market segments. Consequently, the fund may be more vulnerable to fluctuations in the values of the securities it holds than a fund that invests more broadly.
Understanding tax-equivalent yield
To understand the value of tax-free income, it is helpful to compare a municipal bond’s yield with the “tax-equivalent yield” — the before-tax yield that must be offered by a taxable bond in order to equal the municipal bond’s yield after taxes.
How to calculate tax-equivalent yield: The tax-equivalent yield equals the municipal bond’s yield divided by “one minus the tax rate.” For example, if a municipal bond’s yield is 5%, then its tax-equivalent yield is 7.7%, assuming the maximum 35% federal tax rate for 2011.
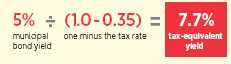
Results for investors subject to lower tax rates would not be as advantageous.

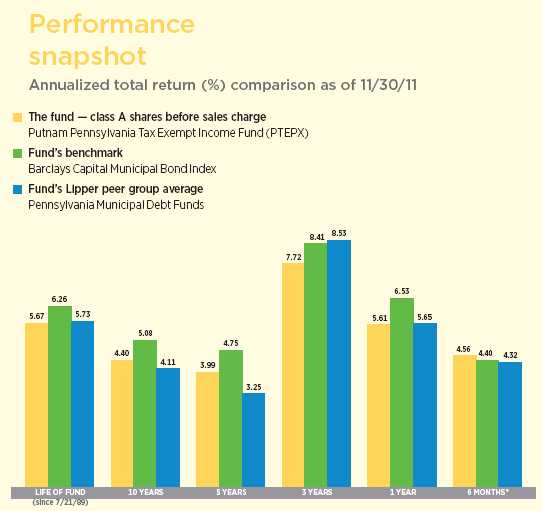
Current performance may be lower or higher than the quoted past performance, which cannot guarantee future results. Share price, principal value, and return will fluctuate, and you may have a gain or a loss when you sell your shares. Performance of class A shares assumes reinvestment of distributions and does not account for taxes. Fund returns in the bar chart do not reflect a sales charge of 4.00%; had they, returns would have been lower. See pages 5 and 10–12 for additional performance information. For a portion of the periods, the fund had expense limitations, without which returns would have been lower. To obtain the most recent month-end performance, visit putnam.com.
* Returns for the six-month period are not annualized, but cumulative.
4
Interview with your fund’s portfolio manager

How would you describe the environment in the municipal bond market during the six months ended November 30, 2011?
The municipal bond market gained back a good deal of what it had lost in the broad sell-off that occurred in early 2011. Despite predictions of widespread defaults resulting from state budget challenges, defaults through the end of November were in line with their historical average and remained isolated within the most volatile sectors of the municipal bond market.
States continued to face challenges in balancing their budgets, but by late in the period all state legislatures that were slated to enact budgets had done so, including Pennsylvania. Income tax receipts also began to modestly improve versus last year. All told, as investors ultimately realized that municipal credit conditions were not nearly as bleak as some feared, they re-entered the municipal bond market.
Against this backdrop, tax-exempt bonds posted solid returns and outpaced the broad taxable bond market, as measured by the Barclays Capital U.S. Aggregate Bond Index. Moreover, I am pleased to report that the fund outperformed its benchmark and also beat the average return of its Lipper peer group.
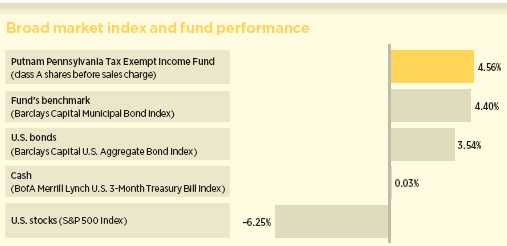
This comparison shows your fund’s performance in the context of broad market indexes for the six months ended 11/30/11. See pages 4 and 10–12 for additional fund performance information. Index descriptions can be found on page 14.
5
In August, Standard & Poor’s [S&P] downgraded its credit rating for U.S. Treasuries and a number of municipal bonds. What impact did that have on the market?
On the heels of its August 5 downgrade of U.S. sovereign debt, S&P lowered its ratings from AAA to AA+ for more than 11,000 municipal securities, including taxable and tax-exempt securities. While this number does seem large, it covers less than 1% of the $3.7 trillion municipal bond market. These securities all had links to the federal government, and according to S&P, the affected issues fall into four broad categories: municipal housing bonds backed by the federal government or invested in U.S. government securities; bonds of certain government-related entities in the housing and public power sectors; bonds backed by federal leases; and defeased bonds secured by U.S. Treasury and government agency securities held in escrow.
The downgrade was not surprising given the interdependence of state and federal finances, and S&P had been suggesting such a move was imminent for some time. To date, state general obligation, or “G.O.,” bond ratings were unchanged, and 13 states continue to hold AAA ratings from S&P. Nonetheless, we believe S&P’s downgrades underscore the importance of performing intensive fundamental research when investing in the municipal bond market. At Putnam, we independently research every bond we hold and assess the credit risk it represents before we add it to the portfolio.
What effect did recent policy developments have on the tax-exempt bond market?
Prior to the period, the popular Build America Bonds, or “BABs,” program expired. The anticipated expiration of this program initially caused a spike in municipal bond supply, as many states accelerated issuance scheduled
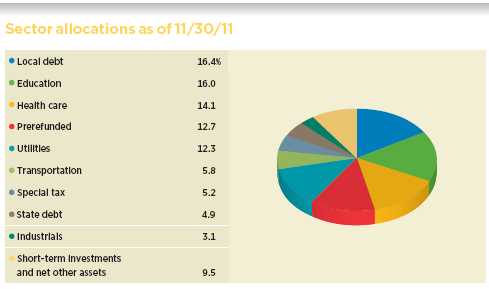
Allocations are represented as a percentage of the fund’s net assets. Summary information may differ from the portfolio schedule included in the financial statements due to the inclusion of derivative securities, any interest accruals, the exclusion of as-of trades, if any, and the use of different classifications of securities for presentation purposes. Holdings and allocations may vary over time.
6
for early 2011 into the fourth quarter of 2010 to lock in the federal subsidy that BABs offered. However, tax-free issuance quickly normalized and thus far in 2011 has been lower than expected, which has helped to keep prices stable.

More recently, the 12-member “super committee” — created through August’s debt ceiling legislation and tasked with reducing the deficit by at least $1.2 trillion — announced that it was unable to reach an agreement for a debt-reduction plan before its November 23, 2011 deadline. As a result, automatic, across-the-board cuts are slated to be implemented over 10 years, beginning in January 2013. Overall, we believe that this sequestration of funding is not necessarily a negative for municipal bonds, particularly given the recommendations that the super committee might have made. Some speculation arose that the committee, in an effort to raise revenue, would have recommended limiting the amount of municipal-bond interest that top income earners could exclude from their taxable income. This could have had the dual effect of reducing the demand for municipal bonds and increasing the costs to municipal issuers. Although such a move does not appear imminent, it is likely that a more wide-ranging debate over taxes will continue into the upcoming election year.
We should also point out that the failure of the super committee to come to an agreement has left a number of other issues unresolved, including the future of the annual alternative minimum tax [AMT] “patch,” which sets the income threshold associated with the
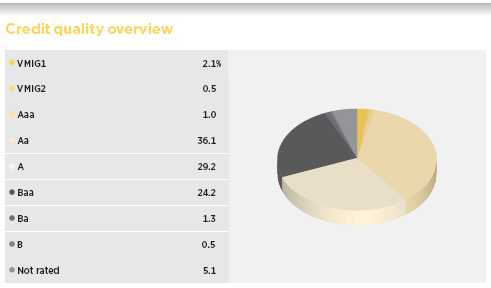
Credit qualities are shown as a percentage of portfolio market value as of 11/30/11. A bond rated Baa or higher (MIG3/VMIG3 or higher, for short-term debt) is considered investment grade. The chart reflects Moody’s ratings; percentages may include bonds or derivatives not rated by Moody’s but rated by Standard & Poor’s or, if unrated by S&P, by Fitch, and then included in the closest equivalent Moody’s rating. Ratings will vary over time. Credit qualities are included for portfolio securities and are not included for derivative instruments and cash. The fund itself has not been rated by an independent rating agency.
7
AMT, and the fate of the Bush-era tax cuts. We believe these issues and others will be debated in Congress in 2012, and we will be closely monitoring developments.
How did you position the portfolio during the past six months?
We positioned the portfolio to benefit from improving fundamentals in the municipal bond market. While we felt that the budget challenges faced by many states, including Pennsylvania, were significant, we were confident that conditions would improve as long as the broad economy did not stall. Against this backdrop, we believed that essential service revenue bonds remained attractive, while we remained highly selective regarding the fund’s positioning in local G.O.s, which are securities issued at the city or county level. We believe that as the federal government looks to reduce transfer payments to the states — and as states, in turn, seek to close their deficits by reducing spending — these types of bonds are at risk for downgrades or other headline-driven price volatility. And unlike state general obligation bonds, local G.O.s rely more on property tax revenue than on income or sales taxes. With real estate prices still under pressure in many markets, property taxes have been slower to recover than other tax sources.
From a credit perspective, we held an overweight position in A- and Baa-rated securities versus the fund’s benchmark. In terms of sectors, we favored higher-education, utility, and health-care bonds, particularly those of hospitals and continuing-care retirement communities.
What is your outlook for the months ahead?
While technical factors in the market have been positive — specifically, lighter supply and stable demand — uncertainty remains.
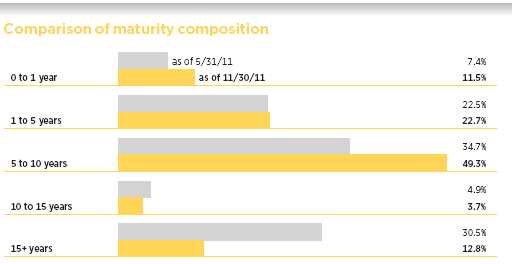
This chart illustrates the fund’s composition by maturity, showing the percentage of holdings in different maturity ranges and how the composition has changed over the past six months. Holdings and maturity ranges will vary over time. The effective maturity dates of bonds with call features may change as a result of market conditions.
8
We believe that states will continue to face financial challenges as the economy struggles to find its footing. For the most part, however, we believe that the fiscal conditions of states and municipalities are showing signs of improvement. Tax receipts are beginning to improve, albeit slowly, and we believe defaults will remain relatively low. Our primary concerns remain focused on the economy and Congress’s plans to reduce the deficit. Higher federal income tax rates, a change in the tax status of municipal bonds, or significant cuts in state funding all would have consequences for the municipal bond market. But for investors with longer time horizons, we believe that our actively managed approach remains a prudent way to diversify holdings and generate tax-exempt income in the municipal bond market.
Thank you, Thalia, for your time and insights today.
The views expressed in this report are exclusively those of Putnam Management and are subject to change. They are not meant as investment advice.
Please note that the holdings discussed in this report may not have been held by the fund for the entire period. Portfolio composition is subject to review in accordance with the fund’s investment strategy and may vary in the future. Current and future portfolio holdings are subject to risk.
Portfolio Manager Thalia Meehan holds a B.A. from Williams College. A CFA charterholder, Thalia joined Putnam in 1989 and has been in the investment industry since 1983.
In addition to Thalia, your fund’s portfolio managers are Paul Drury and Susan McCormack.
IN THE NEWS
Across the country, evidence is emerging that state budgets are on the mend, with fewer states reporting budget shortfalls, according to a report from the National Conference of State Legislatures (NCSL). Since the start of fiscal year 2012 on October 1, 2011, only four states have reported a budget gap, compared with 15 states in 2010. In addition, the NCSL reports that the cumulative budget gap of all 50 states is $4.4 billion, down from $26.7 billion last year. The NCSL also found that the majority of states expect to meet or exceed their general fund revenue targets, although the combined projected revenue increase in the current fiscal year remains low, at 1.9%.
9
Your fund’s performance
This section shows your fund’s performance, price, and distribution information for periods ended November 30, 2011, the end of the first half of its current fiscal year. In accordance with regulatory requirements for mutual funds, we also include performance as of the most recent calendar quarter-end and expense information taken from the fund’s current prospectus. Performance should always be considered in light of a fund’s investment strategy. Data represent past performance. Past performance does not guarantee future results. More recent returns may be less or more than those shown. Investment return and principal value will fluctuate, and you may have a gain or a loss when you sell your shares. Performance information does not reflect any deduction for taxes a shareholder may owe on fund distributions or on the redemption of fund shares. For the most recent month-end performance, please visit the Individual Investors section at putnam.com or call Putnam at 1-800-225-1581. Class Y shares are not available to all investors. See the Terms and Definitions section in this report for definitions of the share classes offered by your fund.
Fund performance Total return for periods ended 11/30/11
| | | | | | | | | |
| | Class A | Class B | Class C | Class M | Class Y |
| (inception dates) | (7/21/89) | (7/15/93) | (10/3/06) | (7/3/95) | (1/2/08) |
|
| | Before | After | | | | | Before | After | Net |
| | sales | sales | Before | After | Before | After | sales | sales | asset |
| | charge | charge | CDSC | CDSC | CDSC | CDSC | charge | charge | value |
|
| Annual average | | | | | | | | | |
| (life of fund) | 5.67% | 5.48% | 4.93% | 4.93% | 4.87% | 4.87% | 5.32% | 5.16% | 5.71% |
|
| 10 years | 53.75 | 47.74 | 44.20 | 44.20 | 42.55 | 42.55 | 49.72 | 44.69 | 55.27 |
| Annual average | 4.40 | 3.98 | 3.73 | 3.73 | 3.61 | 3.61 | 4.12 | 3.76 | 4.50 |
|
| 5 years | 21.59 | 16.72 | 17.66 | 15.68 | 17.03 | 17.03 | 19.91 | 15.93 | 22.74 |
| Annual average | 3.99 | 3.14 | 3.31 | 2.96 | 3.20 | 3.20 | 3.70 | 3.00 | 4.18 |
|
| 3 years | 25.01 | 20.05 | 22.70 | 19.70 | 22.12 | 22.12 | 24.09 | 20.06 | 26.01 |
| Annual average | 7.72 | 6.28 | 7.06 | 6.18 | 6.89 | 6.89 | 7.46 | 6.28 | 8.01 |
|
| 1 year | 5.61 | 1.46 | 4.95 | –0.05 | 4.70 | 3.70 | 5.31 | 1.93 | 5.75 |
|
| 6 months | 4.56 | 0.37 | 4.24 | –0.76 | 4.17 | 3.17 | 4.41 | 1.00 | 4.67 |
|
Current performance may be lower or higher than the quoted past performance, which cannot guarantee future results. After-sales-charge returns for class A and M shares reflect the deduction of the maximum 4.00% and 3.25% sales charge, respectively, levied at the time of purchase. Class B share returns after contingent deferred sales charge (CDSC) reflect the applicable CDSC, which is 5% in the first year, declining over time to 1% in the sixth year, and is eliminated thereafter. Class C share returns after CDSC reflect a 1% CDSC for the first year that is eliminated thereafter. Class Y shares have no initial sales charge or CDSC. Performance for class B, C, M, and Y shares before their inception is derived from the historical performance of class A shares, adjusted for the applicable sales charge (or CDSC) and the higher operating expenses for such shares, except for class Y shares, for which 12b-1 fees are not applicable.
For a portion of the periods, the fund had expense limitations, without which returns would have been lower.
Class B share performance does not reflect conversion to class A shares.
10
Comparative index returns For periods ended 11/30/11
| | |
| | Barclays Capital Municipal | Lipper Pennsylvania Municipal Debt |
| | Bond Index | Funds category average* |
|
| Annual average (life of fund) | 6.26% | 5.73% |
|
| 10 years | 64.11 | 49.81 |
| Annual average | 5.08 | 4.11 |
|
| 5 years | 26.14 | 17.44 |
| Annual average | 4.75 | 3.25 |
|
| 3 years | 27.41 | 27.92 |
| Annual average | 8.41 | 8.53 |
|
| 1 year | 6.53 | 5.65 |
|
| 6 months | 4.40 | 4.32 |
|
Index and Lipper results should be compared with fund performance before sales charge, before CDSC, or at net asset value.
* Over the 6-month, 1-year, 3-year, 5-year, 10-year, and life-of-fund periods ended 11/30/11, there were 60, 60, 57, 53, 47, and 8 funds, respectively, in this Lipper category.
Fund price and distribution information For the six-month period ended 11/30/11
| | | | | | | |
| Distributions | Class A | Class B | Class C | Class M | Class Y |
|
| Number | 6 | 6 | 6 | 6 | 6 |
|
| Income 1 | $0.181874 | $0.153778 | $0.146993 | $0.169624 | $0.192242 |
|
| Capital gains 2 | — | — | — | — | — |
|
| Total | $0.181874 | $0.153778 | $0.146993 | $0.169624 | $0.192242 |
|
| | Before | After | Net | Net | Before | After | Net |
| | sales | sales | asset | asset | sales | sales | asset |
| Share value | charge | charge | value | value | charge | charge | value |
|
| 5/31/11 | $8.88 | $9.25 | $8.87 | $8.88 | $8.89 | $9.19 | $8.89 |
|
| 11/30/11 | 9.10 | 9.48 | 9.09 | 9.10 | 9.11 | 9.42 | 9.11 |
|
| | Before | After | Net | Net | Before | After | Net |
| | sales | sales | asset | asset | sales | sales | asset |
| Current yield (end of period) | charge | charge | value | value | charge | charge | value |
|
| Current dividend rate 3 | 4.04% | 3.88% | 3.42% | 3.27% | 3.76% | 3.64% | 4.26% |
|
| Taxable equivalent 4 | 6.41 | 6.16 | 5.43 | 5.19 | 5.97 | 5.78 | 6.76 |
|
| Current 30-day SEC yield 5 | N/A | 3.07 | 2.58 | 2.43 | N/A | 2.83 | 3.43 |
|
| Taxable equivalent 4 | N/A | 4.87 | 4.10 | 3.86 | N/A | 4.49 | 5.44 |
|
The classification of distributions, if any, is an estimate. Before-sales-charge share value and current dividend rate for class A and M shares, if applicable, do not take into account any sales charge levied at the time of purchase. After-sales-charge share value, current dividend rate, and current 30-day SEC yield, if applicable, are calculated assuming that the maximum sales charge (4.00% for class A shares and 3.25% for class M shares) was levied at the time of purchase. Final distribution information will appear on your year-end tax forms.
1 For some investors, investment income may be subject to the federal alternative minimum tax.
2 Capital gains, if any, are taxable for federal and, in most cases, state purposes.
3 Most recent distribution, excluding capital gains, annualized and divided by share price before or after sales charge at period-end.
4 Assumes maximum 37.00% federal and state combined tax rate for 2011. Results for investors subject to lower tax rates would not be as advantageous.
5 Based only on investment income and calculated using the maximum offering price for each share class, in accordance with SEC guidelines.
11
Fund performance as of most recent calendar quarter
Total return for periods ended 12/31/11
| | | | | | | | | |
| | Class A | Class B | Class C | Class M | Class Y |
| (inception dates) | (7/21/89) | (7/15/93) | (10/3/06) | (7/3/95) | (1/2/08) |
|
| | Before | After | | | | | Before | After | Net |
| | sales | sales | Before | After | Before | After | sales | sales | asset |
| | charge | charge | CDSC | CDSC | CDSC | CDSC | charge | charge | value |
|
| Annual average | | | | | | | | | |
| (life of fund) | 5.72% | 5.53% | 4.99% | 4.99% | 4.92% | 4.92% | 5.37% | 5.22% | 5.77% |
|
| 10 years | 58.30 | 51.99 | 48.51 | 48.51 | 46.79 | 46.79 | 54.08 | 48.88 | 59.91 |
| Annual average | 4.70 | 4.28 | 4.03 | 4.03 | 3.91 | 3.91 | 4.42 | 4.06 | 4.81 |
|
| 5 years | 23.89 | 18.91 | 20.00 | 18.00 | 19.25 | 19.25 | 22.17 | 18.10 | 25.09 |
| Annual average | 4.38 | 3.52 | 3.71 | 3.37 | 3.58 | 3.58 | 4.09 | 3.38 | 4.58 |
|
| 3 years | 27.93 | 22.84 | 25.58 | 22.58 | 25.14 | 25.14 | 27.01 | 22.98 | 28.97 |
| Annual average | 8.56 | 7.10 | 7.89 | 7.02 | 7.76 | 7.76 | 8.30 | 7.14 | 8.85 |
|
| 1 year | 9.55 | 5.13 | 8.88 | 3.88 | 8.71 | 7.71 | 9.26 | 5.73 | 9.79 |
|
| 6 months | 5.81 | 1.60 | 5.50 | 0.50 | 5.42 | 4.42 | 5.78 | 2.33 | 5.94 |
|
Your fund’s expenses
As a mutual fund investor, you pay ongoing expenses, such as management fees, distribution fees (12b-1 fees), and other expenses. Using the following information, you can estimate how these expenses affect your investment and compare them with the expenses of other funds. You may also pay one-time transaction expenses, including sales charges (loads) and redemption fees, which are not shown in this section and would have resulted in higher total expenses. For more information, see your fund’s prospectus or talk to your financial representative.
Expense ratios
| | | | | |
| | Class A | Class B | Class C | Class M | Class Y |
|
| Total annual operating expenses for the fiscal year | | | | | |
| ended 5/31/11 | 0.79% | 1.41% | 1.56% | 1.06% | 0.56% |
|
| Annualized expense ratio for the six-month period | | | | | |
| ended 11/30/11 | 0.80% | 1.42% | 1.57% | 1.07% | 0.57% |
|
Fiscal-year expense information in this table is taken from the most recent prospectus, is subject to change, and may differ from that shown for the annualized expense ratio and in the financial highlights of this report. Expenses are shown as a percentage of average net assets.
12
Expenses per $1,000
The following table shows the expenses you would have paid on a $1,000 investment in the fund from June 1, 2011, to November 30, 2011. It also shows how much a $1,000 investment would be worth at the close of the period, assuming actual returns and expenses.
| | | | | |
| | Class A | Class B | Class C | Class M | Class Y |
|
| Expenses paid per $1,000*† | $4.09 | $7.25 | $8.01 | $5.47 | $2.92 |
|
| Ending value (after expenses) | $1,045.60 | $1,042.40 | $1,041.70 | $1,044.10 | $1,046.70 |
|
* Expenses for each share class are calculated using the fund’s annualized expense ratio for each class, which represents the ongoing expenses as a percentage of average net assets for the six months ended 11/30/11. The expense ratio may differ for each share class.
† Expenses are calculated by multiplying the expense ratio by the average account value for the period; then multiplying the result by the number of days in the period; and then dividing that result by the number of days in the year.
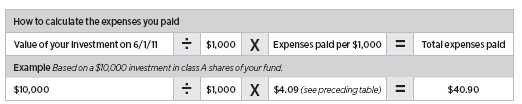
Estimate the expenses you paid
To estimate the ongoing expenses you paid for the six months ended November 30, 2011, use the following calculation method. To find the value of your investment on June 1, 2011, call Putnam at 1-800-225-1581.
Compare expenses using the SEC’s method
The Securities and Exchange Commission (SEC) has established guidelines to help investors assess fund expenses. Per these guidelines, the following table shows your fund’s expenses based on a $1,000 investment, assuming a hypothetical 5% annualized return. You can use this information to compare the ongoing expenses (but not transaction expenses or total costs) of investing in the fund with those of other funds. All mutual fund shareholder reports will provide this information to help you make this comparison. Please note that you cannot use this information to estimate your actual ending account balance and expenses paid during the period.
| | | | | |
| | Class A | Class B | Class C | Class M | Class Y |
|
| Expenses paid per $1,000*† | $4.04 | $7.16 | $7.92 | $5.40 | $2.88 |
|
| Ending value (after expenses) | $1,021.00 | $1,017.90 | $1,017.15 | $1,019.65 | $1,022.15 |
|
* Expenses for each share class are calculated using the fund’s annualized expense ratio for each class, which represents the ongoing expenses as a percentage of average net assets for the six months ended 11/30/11. The expense ratio may differ for each share class.
† Expenses are calculated by multiplying the expense ratio by the average account value for the period; then multiplying the result by the number of days in the period; and then dividing that result by the number of days in the year.
13
Terms and definitions
Important terms
Total return shows how the value of the fund’s shares changed over time, assuming you held the shares through the entire period and reinvested all distributions in the fund.
Before sales charge, or net asset value, is the price, or value, of one share of a mutual fund, without a sales charge. Before-sales-charge figures fluctuate with market conditions, and are calculated by dividing the net assets of each class of shares by the number of outstanding shares in the class.
After sales charge is the price of a mutual fund share plus the maximum sales charge levied at the time of purchase. After-sales-charge performance figures shown here assume the 4.00% maximum sales charge for class A shares and 3.25% for class M shares.
Contingent deferred sales charge (CDSC) is generally a charge applied at the time of the redemption of class B or C shares and assumes redemption at the end of the period. Your fund’s class B CDSC declines over time from a 5% maximum during the first year to 1% during the sixth year. After the sixth year, the CDSC no longer applies. The CDSC for class C shares is 1% for one year after purchase.
Share classes
Class A shares are generally subject to an initial sales charge and no CDSC (except on certain redemptions of shares bought without an initial sales charge).
Class B shares are not subject to an initial sales charge. They may be subject to a CDSC.
Class C shares are not subject to an initial sales charge and are subject to a CDSC only if the shares are redeemed during the first year.
Class M shares have a lower initial sales charge and a higher 12b-1 fee than class A shares and no CDSC.
Class Y shares are not subject to an initial sales charge or CDSC, and carry no 12b-1 fee. They are generally only available to corporate and institutional clients and clients in other approved programs.
Fixed-income terms
Current yield is the annual rate of return earned from dividends or interest of an investment. Current yield is expressed as a percentage of the price of a security, fund share, or principal investment.
Yield curve is a graph that plots the yields of bonds with equal credit quality against their differing maturity dates, ranging from shortest to longest. It is used as a benchmark for other debt, such as mortgage or bank lending rates.
Comparative indexes
Barclays Capital Municipal Bond Index is an unmanaged index of long-term fixed-rate investment-grade tax-exempt bonds.
Barclays Capital U.S. Aggregate Bond Index is an unmanaged index of U.S. investment-grade fixed-income securities.
BofA (Bank of America) Merrill Lynch U.S. 3-Month Treasury Bill Index is an unmanaged index that seeks to measure the performance of U.S. Treasury bills available in the marketplace.
S&P 500 Index is an unmanaged index of common stock performance.
Indexes assume reinvestment of all distributions and do not account for fees. Securities and performance of a fund and an index will differ. You cannot invest directly in an index.
Lipper is a third-party industry-ranking entity that ranks mutual funds. Its rankings do not reflect sales charges. Lipper rankings are based on total return at net asset value relative to other funds that have similar current investment styles or objectives as determined by Lipper. Lipper may change a fund’s category assignment at its discretion. Lipper category averages reflect performance trends for funds within a category.
14
Other information for shareholders
Important notice regarding delivery of shareholder documents
In accordance with SEC regulations, Putnam sends a single copy of annual and semiannual shareholder reports, prospectuses, and proxy statements to Putnam shareholders who share the same address, unless a shareholder requests otherwise. If you prefer to receive your own copy of these documents, please call Putnam at 1-800-225-1581, and Putnam will begin sending individual copies within 30 days.
Proxy voting
Putnam is committed to managing our mutual funds in the best interests of our shareholders. The Putnam funds’ proxy voting guidelines and procedures, as well as information regarding how your fund voted proxies relating to portfolio securities during the 12-month period ended June 30, 2011, are available in the Individual Investors section of putnam.com, and on the SEC’s website, www.sec.gov. If you have questions about finding forms on the SEC’s website, you may call the SEC at 1-800-SEC-0330. You may also obtain the Putnam funds’ proxy voting guidelines and procedures at no charge by calling Putnam’s Shareholder Services at 1-800-225-1581.
Fund portfolio holdings
The fund will file a complete schedule of its portfolio holdings with the SEC for the first and third quarters of each fiscal year on Form N-Q. Shareholders may obtain the fund’s Forms N-Q on the SEC’s website at www.sec.gov. In addition, the fund’s Forms N-Q may be reviewed and copied at the SEC’s Public Reference Room in Washington, D.C. You may call the SEC at 1-800-SEC-0330 for information about the SEC’s website or the operation of the Public Reference Room.
Trustee and employee fund ownership
Putnam employees and members of the Board of Trustees place their faith, confidence, and, most importantly, investment dollars in Putnam mutual funds. As of November 30, 2011, Putnam employees had approximately $322,000,000 and the Trustees had approximately $70,000,000 invested in Putnam mutual funds. These amounts include investments by the Trustees’ and employees’ immediate family members as well as investments through retirement and deferred compensation plans.
15
Trustee approval of management contract
General conclusions
The Board of Trustees of the Putnam funds oversees the management of each fund and, as required by law, determines annually whether to approve the continuance of your fund’s management contract with Putnam Investment Management (“Putnam Management”) and the sub-management contract with respect to your fund between Putnam Management and its affiliate, Putnam Investments Limited (“PIL”).
The Board of Trustees, with the assistance of its Contract Committee, which consists solely of Trustees who are not “interested persons” (as this term is defined in the Investment Company Act of 1940, as amended) of the Putnam funds (“Independent Trustees”), requests and evaluates all information it deems reasonably necessary under the circumstances in connection with its annual contract review. Over the course of several months ending in June 2011, the Contract Committee met on a number of occasions with representatives of Putnam Management, and separately in executive session, to consider the information that Putnam Management provided and other information developed with the assistance of the Board’s independent counsel and independent staff. The Contract Committee reviewed and discussed key aspects of this information with all of the Independent Trustees on a number of occasions. At the Trustees’ June 17, 2011 meeting, the Contract Committee recommended, and the Independent Trustees approved, the continuance of your fund’s management and sub-management contracts, effective July 1, 2011. (Because PIL is an affiliate of Putnam Management and Putnam Management remains fully responsible for all services provided by PIL, the Trustees have not evaluated PIL as a separate entity, and all subsequent references to Putnam Management below should be deemed to include reference to PIL as necessary or appropriate in the context.)
The Independent Trustees’ approval was based on the following conclusions:
• That the fee schedule in effect for your fund represented reasonable compensation in light of the nature and quality of the services being provided to the fund, the fees paid by competitive funds, and the costs incurred by Putnam Management in providing services, and
• That the fee schedule represented an appropriate sharing between fund shareholders and Putnam Management of such economies of scale as may exist in the management of the fund at current asset levels.
These conclusions were based on a comprehensive consideration of all information provided to the Trustees and were not the result of any single factor. Some of the factors that figured particularly in the Trustees’ deliberations and how the Trustees considered these factors are described below, although individual Trustees may have evaluated the information presented differently, giving different weights to various factors. It is also important to recognize that the management arrangements for your fund and the other Putnam funds are the result of many years of review and discussion between the Independent Trustees and Putnam Management, that some aspects of the arrangements may receive greater scrutiny in some years than others, and that the Trustees’ conclusions may be based, in part, on their consideration of fee arrangements in previous years.
Management fee schedules and total expenses
The Trustees reviewed the management fee schedules in effect for all Putnam funds, including fee levels and breakpoints. In reviewing management fees, the Trustees
16
generally focus their attention on material changes in circumstances — for example, changes in assets under management or investment style, changes in Putnam Management’s operating costs, or changes in competitive practices in the mutual fund industry — that suggest that consideration of fee changes might be warranted. The Trustees concluded that the circumstances did not warrant changes to the management fee structure of your fund.
Most of the open-end Putnam funds have new management contracts, with new fee schedules reflecting the implementation of more competitive fee levels for many funds, complex-wide breakpoints for the open-end funds, and performance fees for some funds. These new management contracts have been in effect for a little over a year — since January or, for a few funds, February, 2010. The Trustees approved the new management contracts on July 10, 2009, and fund shareholders subsequently approved the contracts by overwhelming majorities of the shares voted.
Because these management contracts had been implemented only recently, the Contract Committee had limited practical experience with the operation of the new fee structures. Under its new management contract, your fund has the benefit of breakpoints in its management fee that provide shareholders with significant economies of scale in the form of reduced fee levels as assets under management in the Putnam family of funds increase. The Contract Committee observed that the complex-wide breakpoints of the open-end funds had only been in place for a short while, and the Trustees will examine the operation of this new breakpoint structure in future years in light of further experience.
As in the past, the Trustees also focused on the competitiveness of each fund’s total expense ratio. In order to ensure that expenses of the Putnam funds continue to meet evolving competitive standards, the Trustees and Putnam Management agreed in 2009 to implement certain expense limitations. These expense limitations serve in particular to maintain competitive expense levels for funds with large numbers of small shareholder accounts and funds with relatively small net assets. Most funds, including your fund, had sufficiently low expenses that these expense limitations did not apply. The expense limitations were: (i) a contractual expense limitation applicable to all retail open-end funds of 37.5 basis points on investor servicing fees and expenses and (ii) a contractual expense limitation applicable to all open-end funds of 20 basis points on so-called “other expenses” (i.e., all expenses exclusive of management fees, investor servicing fees, distribution fees, investment-related expenses, interest, taxes, brokerage commissions and extraordinary expenses). Putnam Management’s support for these expense limitations was an important factor in the Trustees’ decision to approve the continuance of your fund’s management and sub-management contracts.
The Trustees reviewed comparative fee and expense information for a custom group of competitive funds selected by Lipper Inc. This comparative information included your fund’s percentile ranking for effective management fees and total expenses (excluding any applicable 12b-1 fee), which provides a general indication of your fund’s relative standing. In the custom peer group, your fund ranked in the 1st quintile in effective management fees (determined for your fund and the other funds in the custom peer group based on fund asset size and the applicable contractual management fee schedule) and in the 3rd quintile in total expenses (excluding any applicable 12b-1 fees) as of December 31, 2010 (the first quintile representing the least expensive funds and the fifth quintile the most expensive funds). The fee and expense data reported by Lipper as of December 31, 2010 reflected the most
17
recent fiscal year-end data available in Lipper’s database at that time.
In connection with their review of the management fees and total expenses of the Putnam funds, the Trustees also reviewed the costs of the services provided and the profits realized by Putnam Management and its affiliates from their contractual relationships with the funds. This information included trends in revenues, expenses and profitability of Putnam Management and its affiliates relating to the investment management, investor servicing and distribution services provided to the funds. In this regard, the Trustees also reviewed an analysis of Putnam Management’s revenues, expenses and profitability, allocated on a fund-by-fund basis, with respect to the funds’ management, distribution, and investor servicing contracts. For each fund, the analysis presented information about revenues, expenses and profitability for each of the agreements separately and for the agreements taken together on a combined basis. The Trustees concluded that, at current asset levels, the fee schedules in place represented reasonable compensation for the services being provided and represented an appropriate sharing of such economies of scale as may exist in the management of the funds at that time.
The information examined by the Trustees as part of their annual contract review for the Putnam funds has included for many years information regarding fees charged by Putnam Management and its affiliates to institutional clients such as defined benefit pension plans, college endowments, and the like. This information included comparisons of those fees with fees charged to the funds, as well as an assessment of the differences in the services provided to these different types of clients. The Trustees observed that the differences in fee rates between institutional clients and mutual funds are by no means uniform when examined by individual asset sectors, suggesting that differences in the pricing of investment management services to these types of clients may reflect historical competitive forces operating in separate markets. The Trustees considered the fact that in many cases fee rates across different asset classes are higher on average for mutual funds than for institutional clients, as well as the differences between the services that Putnam Management provides to the Putnam funds and those that it provides to its institutional clients. The Trustees did not rely on these comparisons to any significant extent in concluding that the management fees paid by your fund are reasonable.
Investment performance
The quality of the investment process provided by Putnam Management represented a major factor in the Trustees’ evaluation of the quality of services provided by Putnam Management under your fund’s management contract. The Trustees were assisted in their review of the Putnam funds’ investment process and performance by the work of several investment oversight committees of the Trustees, which met on a regular basis with the funds’ portfolio teams and with the Chief Investment Officer and other members of Putnam Management’s Investment Division throughout the year. The Trustees concluded that Putnam Management generally provides a high-quality investment process — based on the experience and skills of the individuals assigned to the management of fund portfolios, the resources made available to them, and in general Putnam Management’s ability to attract and retain high-quality personnel — but also recognized that this does not guarantee favorable investment results for every fund in every time period. The Trustees considered the investment performance of each fund over multiple time periods and considered information comparing each fund’s performance with various benchmarks and with the performance of competitive funds.
18
The Committee noted the substantial improvement in the performance of most Putnam funds during the 2009–2010 period and Putnam Management’s ongoing efforts to strengthen its investment personnel and processes. The Committee also noted the disappointing investment performance of some funds for periods ended December 31, 2010 and considered information provided by Putnam Management regarding the factors contributing to the underperformance and actions being taken to improve the performance of these particular funds. The Trustees indicated their intention to continue to monitor performance trends to assess the effectiveness of these efforts and to evaluate whether additional actions to address areas of underperformance are warranted.
In the case of your fund, the Trustees considered that its class A share cumulative total return performance at net asset value was in the following quartiles of its Lipper Inc. peer group (Lipper Pennsylvania Municipal Debt Funds) for the one-year, three-year and five-year periods ended December 31, 2010 (the first quartile representing the best-performing funds and the fourth quartile the worst-performing funds):
| | | |
| One-year period | 2nd | | |
| | |
| Three-year period | 1st | | |
| | |
| Five-year period | 2nd | | |
| | |
Over the one-year, three-year and five-year periods ended December 31, 2010, there were 58, 54 and 47 funds, respectively, in your fund’s Lipper peer group. (When considering performance information, shareholders should be mindful that past performance is not a guarantee of future results.)
Brokerage and soft-dollar allocations; investor servicing
The Trustees considered various potential benefits that Putnam Management may receive in connection with the services it provides under the management contract with your fund. These include benefits related to brokerage allocation and the use of soft dollars, whereby a portion of the commissions paid by a fund for brokerage may be used to acquire research services that are expected to be useful to Putnam Management in managing the assets of the fund and of other clients. Subject to policies established by the Trustees, soft-dollar credits acquired through these means are used primarily to supplement Putnam Management’s internal research efforts. However, the Trustees noted that a portion of available soft-dollar credits continues to be allocated to the payment of fund expenses. The Trustees indicated their continued intent to monitor regulatory developments in this area with the assistance of their Brokerage Committee and also indicated their continued intent to monitor the potential benefits associated with fund brokerage and soft-dollar allocations and trends in industry practices to ensure that the principle of seeking best price and execution remains paramount in the portfolio trading process.
Putnam Management may also receive benefits from payments that the funds make to Putnam Management’s affiliates for investor or distribution services. In conjunction with the annual review of your fund’s management contract, the Trustees reviewed your fund’s investor servicing agreement with Putnam Investor Services, Inc. (“PSERV”) and its distributor’s contracts and distribution plans with Putnam Retail Management Limited Partnership (“PRM”), both of which are affiliates of Putnam Management. The Trustees concluded that the fees payable by the funds to PSERV and PRM, as applicable, for such services are reasonable in relation to the nature and quality of such services.
19
Financial statements
A guide to financial statements
These sections of the report, as well as the accompanying Notes, constitute the fund’s financial statements.
The fund’s portfolio lists all the fund’s investments and their values as of the last day of the reporting period. Holdings are organized by asset type and industry sector, country, or state to show areas of concentration and diversification.
Statement of assets and liabilities shows how the fund’s net assets and share price are determined. All investment and non-investment assets are added together. Any unpaid expenses and other liabilities are subtracted from this total. The result is divided by the number of shares to determine the net asset value per share, which is calculated separately for each class of shares. (For funds with preferred shares, the amount subtracted from total assets includes the liquidation preference of preferred shares.)
Statement of operations shows the fund’s net investment gain or loss. This is done by first adding up all the fund’s earnings — from dividends and interest income — and subtracting its operating expenses to determine net investment income (or loss). Then, any net gain or loss the fund realized on the sales of its holdings — as well as any unrealized gains or losses over the period — is added to or subtracted from the net investment result to determine the fund’s net gain or loss for the fiscal period.
Statement of changes in net assets shows how the fund’s net assets were affected by the fund’s net investment gain or loss, by distributions to shareholders, and by changes in the number of the fund’s shares. It lists distributions and their sources (net investment income or realized capital gains) over the current reporting period and the most recent fiscal year-end. The distributions listed here may not match the sources listed in the Statement of operations because the distributions are determined on a tax basis and may be paid in a different period from the one in which they were earned. Dividend sources are estimated at the time of declaration. Actual results may vary. Any non-taxable return of capital cannot be determined until final tax calculations are completed after the end of the fund’s fiscal year.
Financial highlights provide an overview of the fund’s investment results, per-share distributions, expense ratios, net investment income ratios, and portfolio turnover in one summary table, reflecting the five most recent reporting periods. In a semiannual report, the highlights table also includes the current reporting period.
20
The fund’s portfolio 11/30/11 (Unaudited)
| |
| Key to holding’s abbreviations | |
| AGM Assured Guaranty Municipal Corporation | FGIC Financial Guaranty Insurance Company |
| AGO Assured Guaranty, Ltd. | G.O. Bonds General Obligation Bonds |
| AMBAC AMBAC Indemnity Corporation | NATL National Public Finance Guarantee Corp. |
| CIFG CIFG Assurance North America, Inc. | Radian Insd. Radian Group Insured |
| Cmnwlth. of PR Gtd. Commonwealth of | SGI Syncora Guarantee, Inc. |
| Puerto Rico Guaranteed | VRDN Variable Rate Demand Notes |
| | | |
| MUNICIPAL BONDS AND NOTES (97.9%)* | Rating** | Principal amount | Value |
|
| Guam (0.8%) | | | |
| Territory of GU, Govt. Ltd. Oblig. Rev. Bonds | | | |
| (Section 30), Ser. A, 5 3/4s, 12/1/34 | BBB– | $1,000,000 | $1,009,550 |
|
| Territory of GU, Govt. Wtr. Wks. Auth. Wtr. & | | | |
| Waste Wtr. Syst. Rev. Bonds, 5 5/8s, 7/1/40 | Ba2 | 450,000 | 423,540 |
|
| Territory of GU, Pwr. Auth. Rev. Bonds, Ser. A, | | | |
| 5 1/2s, 10/1/40 | BBB | 350,000 | 332,535 |
|
| | | | 1,765,625 |
| Pennsylvania (86.4%) | | | |
| Allegheny Cnty., Higher Ed. Bldg. Auth. Rev. Bonds | | | |
| (Robert Morris U.), Ser. A, 6s, 10/15/38 | Baa3 | 945,000 | 963,522 |
| (Robert Morris U.), Ser. A, 5 3/4s, 10/15/40 | Baa3 | 500,000 | 502,025 |
| (Duquesne U.), Ser. A, 5 1/2s, 3/1/31 | A2 | 1,000,000 | 1,070,930 |
| (Duquesne U.), 5s, 3/1/33 | A2 | 1,000,000 | 1,016,530 |
|
| Allegheny Cnty., Hosp. Dev. Auth. Rev. Bonds | | | |
| (U. of Pittsburgh Med.), 5 5/8s, 8/15/39 | Aa3 | 2,000,000 | 2,110,220 |
| (Children’s Hosp.), NATL, 5 3/8s, 7/1/17 | | | |
| (Escrowed to maturity) | Baa1 | 2,450,000 | 2,710,484 |
|
| Allegheny Cnty., Indl. Dev. Auth. Rev. Bonds | | | |
| (Env. Impt. — USX Corp.), 6 7/8s, 5/1/30 | BB | 600,000 | 618,918 |
|
| Allegheny Cnty., Sanitation Auth. Swr. Rev. | | | |
| Bonds, FGIC, NATL, 5s, 12/1/37 | A1 | 1,000,000 | 1,020,180 |
|
| Beaver Cnty., Indl. Dev. Auth. VRDN (First Energy | | | |
| Generation), 0.08s, 4/1/41 | VMIG1 | 2,000,000 | 2,000,000 |
|
| Berks Cnty., Muni. Auth. Rev. Bonds | | | |
| (Reading Hosp. & Med. Ctr.), Ser. A-3, 5 1/2s, | | | |
| 11/1/31 | AA | 2,000,000 | 2,124,880 |
| (Albright College), 5 3/8s, 10/1/28 | Ba1 | 735,000 | 672,863 |
|
| Bethel Park, School Dist. G.O. Bonds, 5.1s, 8/1/33 | Aa2 | 1,000,000 | 1,102,360 |
|
| Bucks Cnty., Indl. Dev. Auth. Rev. Bonds | | | |
| (US Steel Corp.), 6 3/4s, 6/1/26 | BB | 500,000 | 516,115 |
| (Pennswood Village), 6s, 10/1/34 | | | |
| (Prerefunded 10/1/12) | AAA/P | 1,000,000 | 1,053,310 |
|
| Bucks Cnty., Indl. Dev. Auth. Retirement Cmnty. | | | |
| Rev. Bonds (Ann’s Choice, Inc.), Ser. A, 5.4s, 1/1/15 | BB/P | 240,000 | 244,126 |
|
| Bucks Cnty., Indl. Dev. Auth. Solid Waste Mandatory | | | |
| Put Bonds (2/1/13) (Waste Management, Inc.), | | | |
| 2 7/8s, 12/1/22 | BBB | 1,000,000 | 1,012,690 |
|
| Burrell, PA School Dist. G.O. Bonds, Ser. A, AGM, | | | |
| 5s, 7/15/25 | Aa3 | 1,000,000 | 1,053,020 |
|
21
| | | |
| MUNICIPAL BONDS AND NOTES (97.9%)* cont. | Rating** | Principal amount | Value |
|
| Pennsylvania cont. | | | |
| Butler, Area School Dist. G.O. Bonds, 5 1/4s, 10/1/26 | A+ | $1,500,000 | $1,633,305 |
|
| Catasauqua, Area School Dist. G.O. Bonds, AGM, | | | |
| 5s, 2/15/26 | Aa3 | 1,000,000 | 1,055,600 |
|
| Centennial, School Dist., Bucks Cnty. G.O. Bonds, | | | |
| Ser. A, 5s, 12/15/37 | Aa2 | 2,000,000 | 2,134,660 |
|
| Chester Cnty., Hlth. & Ed. Fac. Auth. Rev. Bonds | | | |
| (Jenners Pond, Inc.), 7 5/8s, 7/1/34 | | | |
| (Prerefunded 7/1/12) | AAA/P | 500,000 | 530,905 |
|
| Crawford Cnty., Indl. Dev. Auth. Rev. Bonds | | | |
| (Allegheny College), Ser. A, 6s, 11/1/31 | A3 | 1,000,000 | 1,090,250 |
|
| Cumberland Cnty., Muni. Auth. Rev. Bonds | | | |
| (Presbyterian Homes Oblig.), Ser. A, 5.45s, 1/1/21 | BBB+ | 335,000 | 336,993 |
| (Presbyterian Homes Oblig.), Ser. A, 5.15s, 1/1/18 | BBB+ | 730,000 | 770,011 |
| (Diakon Lutheran Ministries), 5s, 1/1/36 | BBB+/F | 1,860,000 | 1,639,441 |
| (Diakon Lutheran Ministries), 5s, 1/1/27 | BBB+/F | 750,000 | 713,355 |
|
| Dauphin Cnty., Gen. Auth. Hlth. Syst. Rev. Bonds | | | |
| (Pinnacle Hlth. Syst.), Ser. A, 6s, 6/1/29 | A2 | 1,500,000 | 1,561,380 |
|
| Dauphin Cnty., Indl. Dev. Auth. Wtr. Rev. Bonds�� | | | |
| (Dauphin Cons. Wtr. Supply), Ser. A, 6.9s, 6/1/24 | Baa1 | 1,000,000 | 1,174,910 |
|
| Delaware Cnty., Indl. Dev. Auth. Resource Recvy. | | | |
| Rev. Bonds, Ser. A, 6.1s, 7/1/13 | Ba1 | 560,000 | 560,560 |
|
| Delaware River Joint Toll Bridge Comm. Rev. Bonds | | | |
| 5 1/4s, 7/1/20 (Prerefunded 7/1/13) | A2 | 1,130,000 | 1,215,620 |
| Ser. A, NATL, 5s, 7/1/27 | A2 | 1,000,000 | 1,051,010 |
|
| Delaware River Port Auth. PA & NJ Rev. Bonds, | | | |
| Ser. D, 5s, 1/1/40 | A3 | 800,000 | 806,840 |
|
| Delaware Valley, Regl. Fin. Auth. Rev. Bonds, Ser. B, | | | |
| AMBAC, 5.7s, 7/1/27 | A2 | 3,030,000 | 3,267,704 |
|
| Downingtown, Area School Dist. G.O. Bonds, Ser. AA, | | | |
| 5s, 11/1/28 | Aaa | 1,875,000 | 2,082,844 |
|
| East Stroudsburg, Area School Dist. G.O. Bonds, AGM, | | | |
| 5s, 9/1/27 | Aa3 | 1,500,000 | 1,597,350 |
|
| Economy, Muni. Auth. Swr. Rev. Bonds, AGM, | | | |
| 5s, 12/15/28 | Aa3 | 2,665,000 | 2,761,020 |
|
| Erie, Higher Ed. Bldg. Auth. Rev. Bonds | | | |
| (Gannon U.), Ser. A, 5 3/8s, 5/1/30 | Baa2 | 1,000,000 | 1,002,290 |
| (Mercyhurst College), 5.35s, 3/15/28 | BBB | 1,000,000 | 1,029,090 |
|
| Exeter Twp., School Dist. G.O. Bonds, FGIC, NATL, | | | |
| 5s, 5/15/23 | Aa2 | 1,000,000 | 1,048,510 |
|
| Franklin Cnty., Indl. Dev. Auth. Rev. Bonds | | | |
| (Chambersburg Hosp.), 5 3/8s, 7/1/42 | A2 | 2,000,000 | 2,003,320 |
|
| Geisinger, Auth. Hlth. Syst. VRDN | | | |
| Ser. C, 0.05s, 6/1/41 | A–1+ | 2,000,000 | 2,000,000 |
| Ser. A, 0.04s, 5/15/35 | VMIG1 | 2,600,000 | 2,600,000 |
|
| Gen. Auth. of South Central Rev. Bonds (York College | | | |
| of PA), 5 1/2s, 11/1/31 | A | 750,000 | 795,158 |
|
| Harrisburg, Wtr. Auth. Rev. Bonds, 5 1/8s, 7/15/28 | B–/P | 1,000,000 | 829,500 |
|
22
| | | |
| MUNICIPAL BONDS AND NOTES (97.9%)* cont. | Rating** | Principal amount | Value |
|
| Pennsylvania cont. | | | |
| Lancaster Cnty., Hosp. Auth. Rev. Bonds | | | |
| (Gen. Hosp.), 5 1/2s, 3/15/26 | | | |
| (Prerefunded 9/15/13) | AAA/P | $1,500,000 | $1,629,480 |
| (Lancaster Gen. Hosp.), Ser. A, 5s, 3/15/26 | Aa3 | 1,000,000 | 1,038,890 |
|
| Lancaster, Higher Ed. Auth. College Rev. Bonds | | | |
| (Franklin & Marshall College), 5s, 4/15/29 | AA– | 1,000,000 | 1,060,240 |
|
| Langhorne Manor Boro., Higher Edl. & Hlth. Auth. Rev. | | | |
| Bonds (Woods Svcs.), Radian Insd., 5.1s, 11/15/21 | A– | 1,285,000 | 1,285,129 |
|
| Latrobe, Indl. Dev. Auth. Rev. Bonds (St. Vincent | | | |
| College), 5.7s, 5/1/31 | Baa1 | 1,500,000 | 1,508,550 |
|
| Lehigh Cnty., Gen. Purpose Auth. Rev. Bonds | | | |
| (Lehigh Valley Hosp. Hlth. Network) | | | |
| Ser. A, 5 1/4s, 7/1/32 | A1 | 2,750,000 | 2,779,288 |
| AGM, 5 1/4s, 7/1/16 | Aa3 | 1,950,000 | 1,973,907 |
|
| Lehigh Cnty., Gen. Purpose Hosp. Rev. Bonds (Lehigh | | | |
| Valley Hlth. Network), Ser. A, AGM, 5s, 7/1/25 | Aa3 | 1,360,000 | 1,433,862 |
|
| Luzerne Cnty., Indl. Dev. Auth. Wtr. Fac. Rev. Bonds | | | |
| (American Wtr. Co.), 5 1/2s, 12/1/39 | A2 | 1,250,000 | 1,320,225 |
|
| Lycoming Cnty., Auth. Hlth. Syst. Rev. Bonds | | | |
| (Susquehanna Hlth. Syst.), Ser. A, 5 3/4s, 7/1/39 | BBB+ | 2,000,000 | 1,997,160 |
|
| McKeesport, Muni. Auth. Swr. Rev. Bonds, | | | |
| 5 3/4s, 12/15/39 | A– | 1,750,000 | 1,791,720 |
|
| Monroe Cnty., Hosp. Auth. Rev. Bonds (Pocono Med. | | | |
| Ctr.), 5 1/8s, 1/1/37 | A– | 2,000,000 | 1,954,380 |
|
| Montgomery Cnty., Higher Ed. & Hlth. Auth. Rev. Bonds | | | |
| (Arcadia U.) | | | |
| 5 5/8s, 4/1/40 | BBB+ | 1,000,000 | 1,010,830 |
| 5 1/4s, 4/1/30 | BBB+ | 1,060,000 | 1,069,879 |
|
| Montgomery Cnty., Indl. Dev. Auth. Rev. Bonds | | | |
| (Montenay Resource Recvy.), Ser. A, NATL, | | | |
| 5 1/4s, 11/1/14 | A2 | 2,145,000 | 2,303,022 |
|
| Montgomery Cnty., Indl. Dev. Auth. Retirement | | | |
| Cmnty. Rev. Bonds (Acts Retirement-Life Cmnty.), | | | |
| Ser. A-1, 6 1/4s, 11/15/29 | BBB+ | 1,125,000 | 1,171,328 |
|
| Montgomery Cnty., Indl. Dev. Auth. Wtr. Fac. Rev. | | | |
| Bonds (Aqua PA, Inc.), Ser. A, 5 1/4s, 7/1/42 | AA– | 2,250,000 | 2,258,595 |
|
| Nazareth, Area School Dist. G.O. Bonds, Ser. A, | | | |
| AGM, 5s, 2/15/28 (Prerefunded 8/15/14) | Aa3 | 1,525,000 | 1,702,327 |
|
| New Wilmington, Muni. Auth. Rev. Bonds | | | |
| (Westminster College), Ser. GG4, Radian Insd., | | | |
| 5 1/8s, 5/1/33 | A–/P | 1,000,000 | 966,530 |
|
| Northampton Cnty., Gen. Purpose Auth. Rev. Bonds | | | |
| (Lehigh U.), 5 1/2s, 11/15/33 | Aa2 | 1,500,000 | 1,642,590 |
|
| Northampton Cnty., Hosp. Auth. Rev. Bonds | | | |
| (St. Luke’s Hosp. — Bethlehem), Ser. A, 5 1/2s, | | | |
| 8/15/40 | A3 | 1,000,000 | 987,120 |
| (St. Luke’s Hosp. — Bethlehem), Ser. A, 5 1/2s, | | | |
| 8/15/35 | A3 | 2,000,000 | 1,991,960 |
|
| Northeastern York, School Dist. G.O. Bonds, SGI, | | | |
| 5s, 3/1/21 | A+ | 1,035,000 | 1,128,626 |
|
23
| | | |
| MUNICIPAL BONDS AND NOTES (97.9%)* cont. | Rating** | Principal amount | Value |
|
| Pennsylvania cont. | | | |
| PA Rev. Bonds (Philadelphia Biosolids Fac.), | | | |
| 6 1/4s, 1/1/32 | BBB+/F | $500,000 | $525,485 |
|
| PA Cmnwlth. Fin. Auth. Rev. Bonds, Ser. B, AGO, | | | |
| 5s, 6/1/31 | AA+ | 1,500,000 | 1,581,345 |
|
| PA Econ. Dev. Fin. Auth. Rev. Bonds (Amtrak), | | | |
| Ser. A , 6 1/4s, 11/1/31 | A1 | 1,000,000 | 1,008,250 |
|
| PA Econ. Dev. Fin. Auth. Exempt Fac. Rev. Bonds | | | |
| (Allegheny Energy Supply Co.), 7s, 7/15/39 | Baa3 | 2,000,000 | 2,186,960 |
|
| PA Econ. Dev. Fin. Auth. Poll. Control Rev. Bonds | | | |
| (PPL Elec. Util. Corp ), 4s, 10/1/23 | A3 | 1,000,000 | 979,640 |
|
| PA Econ. Dev. Fin. Auth. Solid Waste Disp. Rev. | | | |
| Bonds (Procter & Gamble Paper), 5 3/8s, 3/1/31 | AA– | 1,000,000 | 1,095,470 |
|
| PA Econ. Dev. Fin. Auth. Wtr. Fac. Rev. Bonds | | | |
| (American Wtr. Co.), 6.2s, 4/1/39 | A2 | 1,100,000 | 1,226,357 |
|
| PA Fin., Auth. Rev. Bonds (Penn Hills), Ser. B, | | | |
| AMBAC, zero %, 12/1/27 | A/P | 1,000,000 | 432,600 |
|
| PA Hsg. Fin. Agcy. Rev. Bonds | | | |
| Ser. 103C, 5.2s, 10/1/28 | AA+ | 820,000 | 838,942 |
| (Single Fam. Mtge.), Ser. 108B, 4 3/4s, 10/1/28 | AA+ | 2,000,000 | 2,012,860 |
| Ser. 110A, 4 3/4s, 10/1/25 | AA+ | 1,000,000 | 1,010,350 |
|
| PA State G.O. Bonds, Ser. 1 | | | |
| 5s, 11/15/30 | Aa1 | 1,500,000 | 1,670,220 |
| 5s, 11/15/19 | Aa1 | 1,500,000 | 1,833,945 |
|
| PA State Econ. Dev. Fin. Auth. Resource Recvy. | | | |
| Rev. Bonds (Colver), Ser. F, AMBAC, 5s, 12/1/15 | BBB– | 850,000 | 865,666 |
|
| PA State Higher Edl. Fac. Auth. Rev. Bonds | | | |
| (Edinboro U. Foundation), 6s, 7/1/43 | Baa3 | 600,000 | 602,760 |
| (Edinboro U.), 5 7/8s, 7/1/38 | Baa3 | 1,000,000 | 999,280 |
| (Widener U.), 5.4s, 7/15/36 | BBB+ | 1,000,000 | 1,005,600 |
| (Widener U.), 5 1/4s, 7/15/24 | BBB+ | 1,000,000 | 1,008,080 |
| (Drexel U.), Ser. A, 5 1/8s, 5/1/36 | A | 1,000,000 | 1,025,850 |
| (Assn. Indpt. Colleges & U. — Gwynedd Mercy), | | | |
| Ser. GG5, Radian Insd., 5 1/8s, 5/1/32 | BBB– | 1,020,000 | 970,979 |
| (St. Joseph’s U.), Ser. A, 5s, 11/1/40 | A– | 1,000,000 | 1,009,260 |
| (Thomas Jefferson U.), 5s, 3/1/40 | AA– | 1,000,000 | 1,029,180 |
| (Philadelphia U.), 5s, 6/1/30 | Baa2 | 200,000 | 188,264 |
| (U. of PA), Ser. B, 5s, 9/1/25 | AA+ | 1,150,000 | 1,301,800 |
| (Philadelphia U.), 5s, 6/1/22 | Baa2 | 330,000 | 332,831 |
|
| PA State Higher Edl. Fac. Auth. Student Hsg. Rev. | | | |
| Bonds (East Stroudsburg U.), 5s, 7/1/42 | Baa3 | 700,000 | 611,240 |
|
| PA State Indl. Dev. Auth. Rev. Bonds, 5 1/2s, 7/1/23 | A1 | 2,000,000 | 2,219,340 |
|
| PA State Pub. School Bldg. Auth. Rev. Bonds | | | |
| (Philadelphia School Dist.), AGM, 5 1/4s, 6/1/25 | | | |
| (Prerefunded 6/1/13) | AA+ | 3,000,000 | 3,215,310 |
| (Richland School Dist.), FGIC, 5s, 11/15/29 | | | |
| (Prerefunded 11/15/14) | A | 5,000,000 | 5,603,650 |
| (Career Inst. of Tech.), FGIC, NATL, 5s, 11/15/28 | Aa3 | 1,000,000 | 1,035,760 |
| (Delaware Cnty. Cmnty. College), AGM, 5s, 10/1/27 | Aa3 | 1,250,000 | 1,332,088 |
24
| | | |
| MUNICIPAL BONDS AND NOTES (97.9%)* cont. | Rating** | Principal amount | Value |
|
| Pennsylvania cont. | | | |
| PA State Pub. School Bldg. Auth. Rev. Bonds | | | |
| (Northampton Cnty.), Ser. B, AMBAC, 5s, 9/1/24 | A/P | $3,280,000 | $3,335,957 |
| (School Dist. Philadelphia), Ser. B, AGM, | | | |
| 4 3/4s, 6/1/30 | Aa2 | 2,000,000 | 2,032,840 |
|
| PA State Tpk. Comm. Rev. Bonds | | | |
| (Motor License), Ser. FD-A1, 5s, 12/1/38 | Aa3 | 2,000,000 | 2,073,260 |
| Ser. A, AMBAC, 5s, 12/1/34 | Aa3 | 2,055,000 | 2,118,191 |
| Ser. B, 5s, 12/1/22 | Aa3 | 2,075,000 | 2,331,781 |
|
| PA State Tpk. Comm. Oil Franchise Tax Rev. Bonds | | | |
| (2003 PA Tpk.), Ser. C, NATL, 5s, 12/1/28 | AA | 1,290,000 | 1,369,580 |
| Ser. C, zero %, 12/1/38 | AA | 3,000,000 | 629,490 |
|
| PA State U. Rev. Bonds | | | |
| 5s, 3/1/35 | Aa1 | 1,000,000 | 1,054,460 |
| 5s, 9/1/29 | Aa1 | 1,400,000 | 1,488,578 |
|
| Pennsbury, School Dist. G.O. Bonds, AGM, 5s, 8/1/25 | Aa2 | 2,000,000 | 2,100,240 |
|
| Philadelphia, G.O. Bonds | | | |
| Ser. B, AGO, 7 1/8s, 7/15/38 | AA+ | 500,000 | 563,155 |
| CIFG, 5s, 8/1/23 | A2 | 1,980,000 | 2,053,874 |
|
| Philadelphia, Arpt. Rev. Bonds, Ser. D, | | | |
| 5 1/4s, 6/15/25 | A+ | 2,000,000 | 2,070,840 |
|
| Philadelphia, Auth. for Indl. Dev. Rev. Bonds | | | |
| (Global Leadership Academy), 6 3/8s, 11/15/40 | BBB– | 945,000 | 869,910 |
| (Master Charter School), 6s, 8/1/35 | BBB+ | 500,000 | 512,840 |
|
| Philadelphia, Gas Wks. Rev. Bonds | | | |
| Ser. 9, 5 1/4s, 8/1/40 | BBB+ | 1,250,000 | 1,250,775 |
| Ser. A-1, AGM, 5s, 9/1/26 | AA+ | 2,000,000 | 2,040,340 |
|
| Philadelphia, Hosp. & Higher Ed. Fac. Auth. Rev. | | | |
| Bonds (Graduate Hlth. Syst. Oblig. Group) | | | |
| 7 1/4s, 7/1/18 (In default) † | D/P | 2,409,932 | 241 |
| 6 5/8s, 7/1/21 (In default) † | D/P | 712,148 | 71 |
|
| Philadelphia, School Dist. G.O. Bonds | | | |
| Ser. B, FGIC, 5 5/8s, 8/1/21 (Prerefunded 8/1/12) | Aa2 | 3,000,000 | 3,105,540 |
| Ser. A, AMBAC, 5s, 8/1/22 | Aa2 | 1,000,000 | 1,044,720 |
|
| Pocono Mountain, School Dist. G.O. Bonds, Ser. C, | | | |
| AGM, 5s, 9/1/34 | Aa3 | 2,000,000 | 2,032,080 |
|
| Reading, G.O. Bonds, AGM, 5s, 11/1/29 | Aa3 | 2,000,000 | 2,076,600 |
|
| Sayre, Hlth. Care Fac. Auth. Rev. Bonds (Guthrie Hlth.), | | | |
| Ser. A, 5 7/8s, 12/1/31 (Prerefunded 12/1/11) | AA– | 1,885,000 | 1,903,850 |
|
| Snyder Cnty., Higher Ed. Auth. Rev. Bonds | | | |
| (Susquehanna U.), 5s, 1/1/38 | A2 | 1,000,000 | 1,014,500 |
|
| Susquehanna, Area Regl. Arpt. Syst. Auth. Rev. | | | |
| Bonds, Ser. A, 6 1/2s, 1/1/38 | Baa3 | 575,000 | 566,939 |
|
| U. of Pittsburgh of the Cmnwlth. Sys. of Higher | | | |
| Ed. Rev. Bonds, Ser. B, 5s, 9/15/28 | Aa1 | 1,600,000 | 1,780,096 |
|
| Upper Moreland Twp., School Dist. G.O. Bonds, AGO, | | | |
| 5s, 9/1/28 | Aa2 | 1,635,000 | 1,735,226 |
|
| Washington Cnty., Hosp. Auth. Rev. Bonds | | | |
| (Monongahela Valley Hosp.), 6 1/4s, 6/1/22 | | | |
| (Prerefunded 6/1/12) | Baa1 | 1,250,000 | 1,298,788 |
| (WA Hosp.), AMBAC, 5 1/2s, 7/1/17 | Baa2 | 1,200,000 | 1,283,508 |
|
25
| | | |
| MUNICIPAL BONDS AND NOTES (97.9%)* cont. | Rating** | Principal amount | Value |
|
| Pennsylvania cont. | | | |
| Washington Cnty., Indl. Dev. Auth. Hlth. Care | | | |
| Fac. Rev. Bonds (First Mtge. AHF/Central), | | | |
| 8 1/2s, 1/1/29 | B/P | $263,000 | $259,484 |
|
| West Cornwall, Tpk. Muni. Auth. Rev. Bonds | | | |
| (Elizabethtown College), 6s, 12/15/27 | | | |
| (Prerefunded 12/15/11) | AAA/P | 1,500,000 | 1,502,400 |
|
| West Mifflin, Area School Dist. G.O. Bonds, AGM, | | | |
| 5 1/8s, 4/1/31 | Aa3 | 1,500,000 | 1,581,480 |
|
| West Shore, Area Hosp. Auth. Rev. Bonds (Holy | | | |
| Spirit Hosp.), 6 1/4s, 1/1/32 | BBB+ | 1,750,000 | 1,750,543 |
|
| Wilkes-Barre, Fin. Auth. Rev. Bonds | | | |
| (U. of Scranton) 5s, 11/1/40 | A | 1,000,000 | 1,023,780 |
| (U. of Scranton) 5s, 11/1/35 | A | 1,000,000 | 1,028,920 |
| (Wilkes U.) 5s, 3/1/22 | BBB | 625,000 | 646,469 |
|
| York Cnty., Indl. Dev. Auth. Rev. Bonds (PSEG | | | |
| Power, LLC), Ser. A, 5 1/2s, 9/1/20 | Baa1 | 750,000 | 760,358 |
|
| | | | 188,140,503 |
| Puerto Rico (10.1%) | | | |
| Children’s Trust Fund Tobacco Settlement Rev. Bonds | | | |
| 5 1/2s, 5/15/39 | BBB | 1,760,000 | 1,484,789 |
| 5 3/8s, 5/15/33 | BBB | 1,405,000 | 1,323,988 |
|
| Cmnwlth. of PR, G.O. Bonds | | | |
| Ser. A, FGIC, 5 1/2s, 7/1/21 | Baa1 | 1,000,000 | 1,081,890 |
| (Pub. Impt.), Ser. E, 5 3/8s, 7/1/30 | Baa1 | 500,000 | 507,640 |
| Ser. A, 5 1/4s, 7/1/34 | Baa1 | 1,250,000 | 1,202,013 |
|
| Cmnwlth. of PR, Aqueduct & Swr. Auth. Rev. Bonds, | | | |
| Ser. A, 6s, 7/1/44 | Baa2 | 2,250,000 | 2,313,743 |
|
| Cmnwlth. of PR, Elec. Pwr. Auth. Rev. Bonds | | | |
| Ser. WW, 5s, 7/1/28 | A3 | 500,000 | 505,000 |
| Ser. TT, 5s, 7/1/27 | A3 | 650,000 | 659,757 |
|
| Cmnwlth. of PR, Govt. Dev. Bank Rev. Bonds, Ser. B, | | | |
| 5s, 12/1/15 | Baa1 | 750,000 | 803,663 |
|
| Cmnwlth. of PR, Hwy. & Trans. Auth. Rev. Bonds | | | |
| Ser. N, 5 1/2s, 7/1/25 | Baa1 | 2,000,000 | 2,111,760 |
| Ser. AA, NATL, 5 1/2s, 7/1/18 (Escrowed | | | |
| to maturity) | A3 | 1,435,000 | 1,790,923 |
| Ser. AA, NATL, 5 1/2s, 7/1/18 | A3 | 65,000 | 71,609 |
| Ser. AA-2, 5.3s, 7/1/35 | A3 | 350,000 | 348,121 |
|
| Cmnwlth. of PR, Indl. Tourist Edl. Med. & Env. Control | | | |
| Facs. Rev. Bonds (Cogen. Fac.-AES), 6 5/8s, 6/1/26 | Baa3 | 1,500,000 | 1,493,775 |
|
| Cmnwlth. of PR, Pub. Bldg. Auth. Rev. Bonds | | | |
| Ser. Q, Cmnwlth. of PR Gtd., 5 5/8s, 7/1/39 | Baa1 | 1,000,000 | 1,007,610 |
| (Govt. Fac.), Ser. I, Cmnwlth. of PR Gtd., | | | |
| 5 1/4s, 7/1/29 | Baa1 | 685,000 | 689,384 |
|
| Cmnwlth. of PR, Sales Tax Fin. Corp. Rev. Bonds | | | |
| Ser. A, 6s, 8/1/42 | A1 | 3,250,000 | 3,501,485 |
| Ser. C, 5 1/4s, 8/1/41 | A1 | 1,000,000 | 1,011,720 |
| Ser. A, NATL, zero %, 8/1/43 | Aa2 | 1,000,000 | 134,870 |
|
| | | | 22,043,740 |
26
| | | |
| MUNICIPAL BONDS AND NOTES (97.9%)* cont. | Rating** | Principal amount | Value |
|
| Virgin Islands (0.6%) | | | |
| VI Pub. Fin. Auth. Rev. Bonds | | | |
| Ser. A, 6s, 10/1/39 | Baa3 | $400,000 | $411,260 |
| Ser. A-1, 5s, 10/1/39 | Baa2 | 600,000 | 553,458 |
| Ser. A, 5s, 10/1/25 | Baa2 | 450,000 | 456,049 |
|
| | | | 1,420,767 |
|
| |
| TOTAL INVESTMENTS | | | |
|
| Total investments (cost $207,909,607) | | | $213,370,635 |
Notes to the fund’s portfolio
Unless noted otherwise, the notes to the fund’s portfolio are for the close of the fund’s reporting period, which ran from June 1, 2011 through November 30, 2011 (the reporting period).
* Percentages indicated are based on net assets of $217,853,228.
** The Moody’s, Standard & Poor’s or Fitch ratings indicated are believed to be the most recent ratings available at the close of the reporting period for the securities listed. Ratings are generally ascribed to securities at the time of issuance. While the agencies may from time to time revise such ratings, they undertake no obligation to do so, and the ratings do not necessarily represent what the agencies would ascribe to these securities at the close of the reporting period. Securities rated by Putnam are indicated by “/P.” Securities rated by Fitch are indicated by “/F.” The rating of an insured security represents what is believed to be the most recent rating of the insurer’s claims-paying ability available at the close of the reporting period and does not reflect any subsequent changes. Security ratings are defined in the Statement of Additional Information.
† Non-income-producing security.
The rates shown on Mandatory Put Bonds are the current interest rates at the close of the reporting period.
VRDN are floating-rate securities with a long-term maturity, that carry a coupon that resets every one or seven days. The rates shown are the current interest rates at the close of the reporting period.
The dates shown parenthetically on Mandatory Put Bonds represent the next mandatory put dates.
The dates shown parenthetically on prerefunded bonds represent the next prerefunding dates.
The dates shown on debt obligations are the original maturity dates.
The fund had the following sector concentrations greater than 10% at the close of the reporting period (as a percentage of net assets):
| | | |
| Local government | 16.1% | | |
| Health care | 15.9 | | |
| Education | 15.9 | | |
| Utilities | 12.9 | | |
| Prerefunded | 12.5 | | |
The fund had the following insurance concentration greater than 10% at the close of the reporting period (as a percentage of net assets):
27
Accounting Standards Codification ASC 820 Fair Value Measurements and Disclosures (ASC 820) establishes a three-level hierarchy for disclosure of fair value measurements. The valuation hierarchy is based upon the transparency of inputs to the valuation of the fund’s investments. The three levels are defined as follows:
Level 1 — Valuations based on quoted prices for identical securities in active markets.
Level 2 — Valuations based on quoted prices in markets that are not active or for which all significant inputs are observable, either directly or indirectly.
Level 3 — Valuations based on inputs that are unobservable and significant to the fair value measurement.
The following is a summary of the inputs used to value the fund’s net assets as of the close of the reporting period:
| | | |
| | | Valuation inputs | |
|
| Investments in securities: | Level 1 | Level 2 | Level 3 |
|
| Municipal bonds and notes | $— | $213,370,635 | $— |
|
| Totals by level | $— | $213,370,635 | $— |
The accompanying notes are an integral part of these financial statements.
28
Statement of assets and liabilities 11/30/11 (Unaudited)
| |
| ASSETS | |
|
| Investment in securities, at value (Note 1): | |
| Unaffiliated issuers (identified cost $207,909,607) | $213,370,635 |
|
| Cash | 834,896 |
|
| Interest and other receivables | 3,277,332 |
|
| Receivable for shares of the fund sold | 1,161,883 |
|
| Total assets | 218,644,746 |
| |
| LIABILITIES | |
|
| Distributions payable to shareholders | 164,539 |
|
| Payable for shares of the fund repurchased | 327,705 |
|
| Payable for compensation of Manager (Note 2) | 79,548 |
|
| Payable for investor servicing fees (Note 2) | 9,342 |
|
| Payable for custodian fees (Note 2) | 2,511 |
|
| Payable for Trustee compensation and expenses (Note 2) | 67,138 |
|
| Payable for administrative services (Note 2) | 1,198 |
|
| Payable for distribution fees (Note 2) | 95,400 |
|
| Other accrued expenses | 44,137 |
|
| Total liabilities | 791,518 |
| | |
| Net assets | $217,853,228 |
|
| |
| REPRESENTED BY | |
|
| Paid-in capital (Unlimited shares authorized) (Notes 1, 4 and 5) | $214,787,248 |
|
| Distributions in excess of net investment income (Note 1) | (106,084) |
|
| Accumulated net realized loss on investments (Note 1) | (2,288,964) |
|
| Net unrealized appreciation of investments | 5,461,028 |
|
| Total — Representing net assets applicable to capital shares outstanding | $217,853,228 |
| |
| COMPUTATION OF NET ASSET VALUE AND OFFERING PRICE | |
|
| Net asset value and redemption price per class A share | |
| ($179,394,420 divided by 19,714,923 shares) | $9.10 |
|
| Offering price per class A share (100/96.00 of $9.10)* | $9.48 |
|
| Net asset value and offering price per class B share ($6,943,961 divided by 763,977 shares)** | $9.09 |
|
| Net asset value and offering price per class C share ($25,214,714 divided by 2,770,352 shares)** | $9.10 |
|
| Net asset value and redemption price per class M share ($3,589,333 divided by 394,171 shares) | $9.11 |
|
| Offering price per class M share (100/96.75 of $9.11)† | $9.42 |
|
| Net asset value, offering price and redemption price per class Y share | |
| ($2,710,800 divided by 297,630 shares) | $9.11 |
|
* On single retail sales of less than $100,000. On sales of $100,000 or more the offering price is reduced.
** Redemption price per share is equal to net asset value less any applicable contingent deferred sales charge.
† On single retail sales of less than $50,000. On sales of $50,000 or more the offering price is reduced.
The accompanying notes are an integral part of these financial statements.
29
Statement of operations Six months ended 11/30/11 (Unaudited)
| |
| INTEREST INCOME | $5,154,463 |
|
| EXPENSES | |
|
| Compensation of Manager (Note 2) | 473,652 |
|
| Investor servicing fees (Note 2) | 56,062 |
|
| Custodian fees (Note 2) | 3,817 |
|
| Trustee compensation and expenses (Note 2) | 7,486 |
|
| Administrative services (Note 2) | 3,028 |
|
| Distribution fees — Class A (Note 2) | 202,718 |
|
| Distribution fees — Class B (Note 2) | 30,817 |
|
| Distribution fees — Class C (Note 2) | 119,001 |
|
| Distribution fees — Class M (Note 2) | 8,989 |
|
| Other | 62,436 |
|
| Total expenses | 968,006 |
| | |
| Expense reduction (Note 2) | (857) |
|
| Net expenses | 967,149 |
| | |
| Net investment income | 4,187,314 |
|
| |
| Net realized loss on investments (Notes 1 and 3) | (19,464) |
|
| Net unrealized appreciation of investments during the period | 5,102,518 |
|
| Net gain on investments | 5,083,054 |
| | |
| Net increase in net assets resulting from operations | $9,270,368 |
|
The accompanying notes are an integral part of these financial statements.
30
Statement of changes in net assets
| | |
| INCREASE (DECREASE) IN NET ASSETS | Six months ended 11/30/11* | Year ended 5/31/11 |
|
| Operations: | | |
| Net investment income | $4,187,314 | $8,719,978 |
|
| Net realized loss on investments | (19,464) | (172,924) |
|
| Net unrealized appreciation (depreciation) of investments | 5,102,518 | (6,215,842) |
|
| Net increase in net assets resulting from operations | 9,270,368 | 2,331,212 |
|
| Distributions to shareholders (Note 1): | | |
| From ordinary income | | |
| From tax-exempt net investment income | | |
| Class A | (3,567,371) | (7,301,009) |
|
| Class B | (123,985) | (333,833) |
|
| Class C | (387,943) | (798,253) |
|
| Class M | (67,692) | (155,879) |
|
| Class Y | (46,886) | (96,268) |
|
| Increase in capital from settlement payments (Note 5) | 20,342 | 426 |
|
| Increase from capital share transactions (Note 4) | 5,287,771 | 3,490,003 |
|
| Total increase (decrease) in net assets | 10,384,604 | (2,863,601) |
| |
| NET ASSETS | | |
|
| Beginning of period | 207,468,624 | 210,332,225 |
|
| End of period (including distributions in excess | | |
| of net investment income of $106,084 and | | |
| $99,521, respectively) | $217,853,228 | $207,468,624 |
|
* Unaudited
The accompanying notes are an integral part of these financial statements.
31
Financial highlights (For a common share outstanding throughout the period)
| | | | | | | | | | | | | | |
| INVESTMENT OPERATIONS: | | LESS DISTRIBUTIONS: | | RATIOS AND SUPPLEMENTAL DATA: |
|
| | | | | | | | | | | | | Ratio | Ratio | |
| | | | Net realized | | | | | | | | | of expenses | of net investment | |
| | Net asset value, | | and unrealized | Total from | From | | | | | Total return | Net assets, | to average | income (loss) | Portfolio |
| | beginning | Net investment | gain (loss) | investment | net investment | Total | Redemption | Non-recurring | Net asset value, | at net asset | end of period | net assets | to average | turnover |
| Period ended | of period | income (loss) | on investments | operations | income | distributions | fees | reimbursements | end of period | value (%) a | (in thousands) | (%) b | net assets (%) | (%) |
|
| Class A | | | | | | | | | | | | | | |
| November 30, 2011** | $8.88 | .18 | .22 | .40 | (.18) | (.18) | — | — c,d | $9.10 | 4.56 * | $179,394 | .40* | 2.02* | 1* |
| May 31, 2011 | 9.10 | .37 | (.22) | .15 | (.37) | (.37) | — | — c,e | 8.88 | 1.67 | 171,516 | .79 | 4.11 | 13 |
| May 31, 2010 | 8.73 | .37 | .37 | .74 | (.37) | (.37) | — c | — | 9.10 | 8.61 | 171,708 | .82 f | 4.10 f | 8 |
| May 31, 2009 | 9.00 | .36 | (.27) | .09 | (.36) | (.36) | — | — | 8.73 | 1.23 | 147,104 | .88 f | 4.15 f | 18 |
| May 31, 2008 | 9.03 | .36 | (.03) | .33 | (.36) | (.36) | — | — | 9.00 | 3.69 | 143,667 | .89 f | 3.97 f | 29 |
| May 31, 2007 | 9.01 | .35 | .02 | .37 | (.35) | (.35) | — | — | 9.03 | 4.15 | 137,594 | .91 f | 3.84 f | 15 |
|
| Class B | | | | | | | | | | | | | | |
| November 30, 2011** | $8.87 | .15 | .22 | .37 | (.15) | (.15) | — | — c,d | $9.09 | 4.24 * | $6,944 | .71* | 1.71* | 1* |
| May 31, 2011 | 9.09 | .31 | (.22) | .09 | (.31) | (.31) | — | — c,e | 8.87 | 1.02 | 7,827 | 1.41 | 3.47 | 13 |
| May 31, 2010 | 8.72 | .31 | .37 | .68 | (.31) | (.31) | — c | — | 9.09 | 7.94 | 11,283 | 1.45 f | 3.47 f | 8 |
| May 31, 2009 | 8.99 | .31 | (.27) | .04 | (.31) | (.31) | — | — | 8.72 | .59 | 13,175 | 1.51 f | 3.51 f | 18 |
| May 31, 2008 | 9.02 | .30 | (.03) | .27 | (.30) | (.30) | — | — | 8.99 | 3.02 | 17,776 | 1.53 f | 3.32 f | 29 |
| May 31, 2007 | 9.00 | .29 | .02 | .31 | (.29) | (.29) | — | — | 9.02 | 3.49 | 22,889 | 1.55 f | 3.19 f | 15 |
|
| Class C | | | | | | | | | | | | | | |
| November 30, 2011** | $8.88 | .15 | .22 | .37 | (.15) | (.15) | — | — c,d | $9.10 | 4.17 * | $25,215 | .78* | 1.63* | 1* |
| May 31, 2011 | 9.10 | .30 | (.22) | .08 | (.30) | (.30) | — | — c,e | 8.88 | .88 | 22,934 | 1.56 | 3.34 | 13 |
| May 31, 2010 | 8.73 | .30 | .37 | .67 | (.30) | (.30) | — c | — | 9.10 | 7.77 | 20,917 | 1.60 f | 3.33 f | 8 |
| May 31, 2009 | 9.00 | .29 | (.26) | .03 | (.30) | (.30) | — | — | 8.73 | .45 | 7,574 | 1.66 f | 3.41 f | 18 |
| May 31, 2008 | 9.02 | .29 | (.03) | .26 | (.28) | (.28) | — | — | 9.00 | 3.01 | 2,049 | 1.68 f | 3.20 f | 29 |
| May 31, 2007† | 9.12 | .19 | (.10) | .09 | (.19) | (.19) | — | — | 9.02 | .92 * | 340 | 1.12*f | 2.06*f | 15 |
|
| Class M | | | | | | | | | | | | | | |
| November 30, 2011** | $8.89 | .17 | .22 | .39 | (.17) | (.17) | — | — c,d | $9.11 | 4.41 * | $3,589 | .53* | 1.88* | 1* |
| May 31, 2011 | 9.11 | .35 | (.23) | .12 | (.34) | (.34) | — | — c,e | 8.89 | 1.38 | 3,641 | 1.06 | 3.82 | 13 |
| May 31, 2010 | 8.73 | .34 | .38 | .72 | (.34) | (.34) | — c | — | 9.11 | 8.42 | 4,133 | 1.10 f | 3.83 f | 8 |
| May 31, 2009 | 9.01 | .34 | (.28) | .06 | (.34) | (.34) | — | — | 8.73 | .82 | 2,291 | 1.16 f | 3.87 f | 18 |
| May 31, 2008 | 9.03 | .33 | (.02) | .31 | (.33) | (.33) | — | — | 9.01 | 3.50 | 2,257 | 1.18 f | 3.67 f | 29 |
| May 31, 2007 | 9.02 | .32 | .01 | .33 | (.32) | (.32) | — | — | 9.03 | 3.73 | 2,350 | 1.20 f | 3.55 f | 15 |
|
| Class Y | | | | | | | | | | | | | | |
| November 30, 2011** | $8.89 | .19 | .22 | .41 | (.19) | (.19) | — | — c,d | $9.11 | 4.67 * | $2,711 | .28* | 2.14* | 1* |
| May 31, 2011 | 9.11 | .39 | (.22) | .17 | (.39) | (.39) | — | — c,e | 8.89 | 1.90 | 1,550 | .56 | 4.31 | 13 |
| May 31, 2010 | 8.73 | .39 | .38 | .77 | (.39) | (.39) | — c | — | 9.11 | 9.01 | 2,290 | .60 f | 4.34 f | 8 |
| May 31, 2009 | 9.00 | .38 | (.27) | .11 | (.38) | (.38) | — | — | 8.73 | 1.46 | 174 | .66 f | 4.46 f | 18 |
| May 31, 2008†† | 9.03 | .16 | (.03) | .13 | (.16) | (.16) | — | — | 9.00 | 1.44 * | 10 | .28*f | 1.75*f | 29 |
|
See notes to financial highlights at the end of this section.
The accompanying notes are an integral part of these financial statements.
Financial highlights (Continued)
* Not annualized
** Unaudited.
† For the period October 3, 2006 (commencement of operations) to May 31, 2007.
†† For the period January 2, 2008 (commencement of operations) to May 31, 2008.
a Total return assumes dividend reinvestment and does not reflect the effect of sales charges.
b Includes amounts paid through expense offset arrangements (Note 2).
c Amount represents less than $0.01 per share.
d Reflects a non-recurring reimbursement related to restitution amounts in connection with a distribution plan approved by the Securities and Exchange Commission (the SEC) which amounted to less than $0.01 per share outstanding on July 21, 2011 (Note 5).
e Reflects a non-recurring reimbursement related to short-term trading related lawsuits, which amounted to less than $0.01 per share outstanding on May 11, 2011 (Note 5).
f Reflects an involuntary contractual expense limitation in effect during the period. As a result of such limitation, the expenses of each class reflect a reduction of the following amounts:
| |
| | Percentage of |
| | average net assets |
|
| May 31, 2010 | 0.02% |
|
| May 31, 2009 | 0.02 |
|
| May 31, 2008 | 0.01 |
|
| May 31, 2007 | <0.01 |
|
The accompanying notes are an integral part of these financial statements.
34
Notes to financial statements 11/30/11 (Unaudited)
Note 1: Significant accounting policies
Putnam Pennsylvania Tax Exempt Income Fund (the fund) is a Massachusetts business trust registered under the Investment Company Act of 1940, as amended, as a diversified open-end management investment company. The fund seeks as high a level of current income exempt from federal income tax and Pennsylvania personal income tax as Putnam Investment Management, LLC (Putnam Management), the fund’s manager, an indirect wholly-owned subsidiary of Putnam Investments, LLC, believes is consistent with preservation of capital. The fund invests mainly in bonds that pay interest that is exempt from federal income tax and Pennsylvania personal income tax (but that may be subject to federal alternative minimum tax (AMT)), are investment-grade in quality, and have intermediate- to long-term maturities (three years or longer). The fund may be affected by economic and political developments in the state of Pennsylvania.
The fund offers class A, class B, class C, class M and class Y shares. Class A and class M shares are sold with a maximum front-end sales charge of 4.00% and 3.25%, respectively, and generally do not pay a contingent deferred sales charge. Class B shares, which convert to class A shares after approximately eight years, do not pay a front-end sales charge and are subject to a contingent deferred sales charge if those shares are redeemed within six years of purchase. Class C shares have a one-year 1.00% contingent deferred sales charge and do not convert to class A shares. The expenses for class A, class B, class C, and class M shares may differ based on the distribution fee of each class, which is identified in Note 2. Class Y shares, which are sold at net asset value, are generally subject to the same expenses as class A, class B, class C, and class M shares, but do not bear a distribution fee. Class Y shares are not available to all investors.
Prior to August 2, 2010, a 1.00% redemption fee applied to certain shares that were redeemed (either by selling or exchanging into another fund) within 7 days of purchase. The redemption fee was accounted for as an addition to paid-in-capital. Effective August 2, 2010, this redemption fee no longer applies to shares redeemed.
Investment income, realized and unrealized gains and losses and expenses of the fund are borne pro-rata based on the relative net assets of each class to the total net assets of the fund, except that each class bears expenses unique to that class (including the distribution fees applicable to such classes). Each class votes as a class only with respect to its own distribution plan or other matters on which a class vote is required by law or determined by the Trustees. If the fund were liquidated, shares of each class would receive their pro-rata share of the net assets of the fund. In addition, the Trustees declare separate dividends on each class of shares.
In the normal course of business, the fund enters into contracts that may include agreements to indemnify another party under given circumstances. The fund’s maximum exposure under these arrangements is unknown as this would involve future claims that may be, but have not yet been, made against the fund. However, the fund’s management team expects the risk of material loss to be remote.
The following is a summary of significant accounting policies consistently followed by the fund in the preparation of its financial statements. The preparation of financial statements is in conformity with accounting principles generally accepted in the United States of America and requires management to make estimates and assumptions that affect the reported amounts of assets and liabilities in the financial statements and the reported amounts of increases and decreases in net assets from operations. Actual results could differ from those estimates. Subsequent events after the Statement of assets and liabilities date through the date that the financial statements were issued have been evaluated in the preparation of the financial statements. Unless otherwise noted, the “reporting period” represents the period from June 1, 2011 through November 30, 2011.
A) Security valuation Tax-exempt bonds and notes are generally valued on the basis of valuations provided by an independent pricing service approved by the Trustees. Such services use information with respect to transactions in bonds, quotations from bond dealers, market transactions in comparable securities and various relationships between securities in determining value. These securities will generally be categorized as Level 2.
Certain investments, including certain restricted and illiquid securities and derivatives, are also valued at fair value following procedures approved by the Trustees. Such valuations and procedures are reviewed periodically by the Trustees. These valuations consider such factors as significant market or specific security events such as interest rate or credit quality changes, various relationships with other securities, discount rates, U.S. Treasury, U.S. swap and credit yields, index levels, convexity exposures and recovery rates. These securities are classified as Level 2 or as Level 3 depending on the priority of the significant inputs. The fair value of securities is generally determined as the amount that the fund could reasonably expect to realize from an orderly disposition of such securities over
35
a reasonable period of time. By its nature, a fair value price is a good faith estimate of the value of a security in a current sale and does not reflect an actual market price, which may be different by a material amount.
B) Security transactions and related investment income Security transactions are recorded on the trade date (the date the order to buy or sell is executed). Gains or losses on securities sold are determined on the identified cost basis.
Interest income is recorded on the accrual basis. All premiums/discounts are amortized/accreted on a yield-to-maturity basis. The premium in excess of the call price, if any, is amortized to the call date; thereafter, any remaining premium is amortized to maturity.
C) Interfund lending The fund, along with other Putnam funds, may participate in an interfund lending program pursuant to an exemptive order issued by the Securities and Exchange Commission (the SEC). This program allows the fund to borrow from other Putnam funds that permit such transactions. Interfund lending transactions are subject to each fund’s investment policies and borrowing and lending limits. Interest earned or paid on the interfund lending transaction will be based on the average of certain current market rates. During the reporting period, the fund did not utilize the program.
D) Line of credit The fund participates, along with other Putnam funds, in a $325 million unsecured committed line of credit and a $185 million unsecured uncommitted line of credit, both provided by State Street Bank and Trust Company (State Street). Borrowings may be made for temporary or emergency purposes, including the funding of shareholder redemption requests and trade settlements. Interest is charged to the fund based on the fund’s borrowing at a rate equal to the Federal Funds rate plus 1.25% for the committed line of credit and the Federal Funds rate plus 1.30% for the uncommitted line of credit. A closing fee equal to 0.02% of the committed line of credit and $50,000 for the uncommitted line of credit has been paid by the participating funds. In addition, a commitment fee of 0.13% per annum on any unutilized portion of the committed line of credit is allocated to the participating funds based on their relative net assets and paid quarterly. During the reporting period, the fund had no borrowings against these arrangements.
E) Federal taxes It is the policy of the fund to distribute all of its income within the prescribed time period and otherwise comply with the provisions of the Internal Revenue Code of 1986, as amended (the Code), applicable to regulated investment companies. It is also the intention of the fund to distribute an amount sufficient to avoid imposition of any excise tax under Section 4982 of the Code. The fund is subject to the provisions of Accounting Standards Codification ASC 740 Income Taxes (ASC 740). ASC 740 sets forth a minimum threshold for financial statement recognition of the benefit of a tax position taken or expected to be taken in a tax return. The fund did not have a liability to record for any unrecognized tax benefits in the accompanying financial statements. No provision has been made for federal taxes on income, capital gains or unrealized appreciation on securities held nor for excise tax on income and capital gains. Each of the fund’s federal tax returns for the prior three fiscal years remains subject to examination by the Internal Revenue Service.
At May 31, 2011, the fund had a capital loss carryover of $1,666,975 available to the extent allowed by the Code to offset future net capital gain, if any. The amounts of the carryovers and the expiration dates are:
| | |
| Loss carryover | | Expiration |
|
| $290,574 | | May 31, 2012 |
|
| 761,850 | | May 31, 2017 |
|
| 410,182 | | May 31, 2018 |
|
| 204,369 | | May 31, 2019 |
|
Under the recently enacted Regulated Investment Company Modernization Act of 2010, the fund will be permitted to carry forward capital losses incurred in taxable years beginning after December 22, 2010 for an unlimited period. However, any losses incurred during those future years will be required to be utilized prior to the losses incurred in pre-enactment tax years. As a result of this ordering rule, pre-enactment capital loss carryforwards may be more likely to expire unused. Additionally, post-enactment capital losses that are carried forward will retain their character as either short-term or long-term capital losses rather than being considered all short-term as under previous law.
Pursuant to federal income tax regulations applicable to regulated investment companies, the fund has elected to defer $330,837 of losses recognized during the period from November 1, 2010 to May 31, 2011 to its fiscal year ending May 31, 2012.
36
The aggregate identified cost on a tax basis is $207,909,607, resulting in gross unrealized appreciation and depreciation of $9,461,137 and $4,000,109, respectively, or net unrealized appreciation of $5,461,028.
F) Distributions to shareholders Income dividends are recorded daily by the fund and are paid monthly. Distributions from capital gains, if any, are recorded on the ex-dividend date and paid at least annually. The amount and character of income and gains to be distributed are determined in accordance with income tax regulations which may differ from generally accepted accounting principles. Dividend sources are estimated at the time of declaration. Actual results may vary. Any non-taxable return of capital cannot be determined until final tax calculations are completed after the end of the fund’s fiscal year. Reclassifications are made to the fund’s capital accounts to reflect income and gains available for distribution (or available capital loss carryovers) under income tax regulations.
Note 2: Management fee, administrative services and other transactions
The fund pays Putnam Management a management fee (based on the fund’s average net assets and computed and paid monthly) at annual rates that may vary based on the average of the aggregate net assets of most open-end funds, as defined in the fund’s management contract, sponsored by Putnam Management. Such annual rates may vary as follows:
| |
| 0.590% | of the first $5 billion, |
| 0.540% | of the next $5 billion, |
| 0.490% | of the next $10 billion, |
| 0.440% | of the next $10 billion, |
| 0.390% | of the next $50 billion, |
| 0.370% | of the next $50 billion, |
| 0.360% | of the next $100 billion, |
| 0.355% | of any excess thereafter. |
Putnam Management has contractually agreed, through June 30, 2012, to waive fees or reimburse the fund’s expenses to the extent necessary to limit the cumulative expenses of the fund, exclusive of brokerage, interest, taxes, investment-related expenses, extraordinary expenses and payments under the fund’s investor servicing contract, investment management contract and distribution plans, on a fiscal year-to-date basis to an annual rate of 0.20% of the fund’s average net assets over such fiscal year-to-date period. During the reporting period, the fund’s expenses were not reduced as a result of this limit.
Putnam Investments Limited (PIL), an affiliate of Putnam Management, is authorized by the Trustees to manage a separate portion of the assets of the fund as determined by Putnam Management from time to time. Putnam Management pays a quarterly sub-management fee to PIL for its services at an annual rate of 0.40% of the average net assets of the portion of the fund managed by PIL.
The fund reimburses Putnam Management an allocated amount for the compensation and related expenses of certain officers of the fund and their staff who provide administrative services to the fund. The aggregate amount of all such reimbursements is determined annually by the Trustees.
Custodial functions for the fund’s assets are provided by State Street. Custody fees are based on the fund’s asset level, the number of its security holdings and transaction volumes.
Putnam Investor Services, Inc., an affiliate of Putnam Management, provides investor servicing agent functions to the fund. Putnam Investor Services, Inc. received fees for investor servicing based on the fund’s retail asset level, the number of shareholder accounts in the fund and the level of defined contribution plan assets in the fund. Investor servicing fees will not exceed an annual rate of 0.375% of the fund’s average net assets. The amounts incurred for investor servicing agent functions during the reporting period are included in Investor servicing fees in the Statement of operations.
The fund has entered into expense offset arrangements with Putnam Investor Services, Inc. and State Street whereby Putnam Investor Services, Inc.’s and State Street’s fees are reduced by credits allowed on cash balances. For the reporting period, the fund’s expenses were reduced by $857 under the expense offset arrangements.
Each independent Trustee of the fund receives an annual Trustee fee, of which $173, as a quarterly retainer, has been allocated to the fund, and an additional fee for each Trustees meeting attended. Trustees also are reimbursed for expenses they incur relating to their services as Trustees.
37
The fund has adopted a Trustee Fee Deferral Plan (the Deferral Plan) which allows the Trustees to defer the receipt of all or a portion of Trustees fees payable on or after July 1, 1995. The deferred fees remain invested in certain Putnam funds until distribution in accordance with the Deferral Plan.
The fund has adopted an unfunded noncontributory defined benefit pension plan (the Pension Plan) covering all Trustees of the fund who have served as a Trustee for at least five years and were first elected prior to 2004. Benefits under the Pension Plan are equal to 50% of the Trustee’s average annual attendance and retainer fees for the three years ended December 31, 2005. The retirement benefit is payable during a Trustee’s lifetime, beginning the year following retirement, for the number of years of service through December 31, 2006. Pension expense for the fund is included in Trustee compensation and expenses in the Statement of operations. Accrued pension liability is included in Payable for Trustee compensation and expenses in the Statement of assets and liabilities. The Trustees have terminated the Pension Plan with respect to any Trustee first elected after 2003.
The fund has adopted distribution plans (the Plans) with respect to its class A, class B, class C and class M shares pursuant to Rule 12b–1 under the Investment Company Act of 1940. The purpose of the Plans is to compensate Putnam Retail Management Limited Partnership, a wholly-owned subsidiary of Putnam Investments, LLC and Putnam Retail Management GP, Inc., for services provided and expenses incurred in distributing shares of the fund. The Plans provide for payments by the fund to Putnam Retail Management Limited Partnership at an annual rate of up to 0.35%, 1.00%, 1.00% and 1.00% of the average net assets attributable to class A, class B, class C and class M shares, respectively. The Trustees have approved payment by the fund at the annual rate of 0.85%, 1.00% and 0.50% of the average net assets for class B, class C and class M shares, respectively. For class A shares, the annual payment rate will equal the weighted average of (i) 0.20% on the net assets of the fund attributable to class A shares purchased and paid for prior to April 1, 2005 and (ii) 0.25% on all other net assets of the fund attributable to class A shares.
For the reporting period, Putnam Retail Management Limited Partnership, acting as underwriter, received net commissions of $21,628 and $148 from the sale of class A and class M shares, respectively, and received $3,063 and $429 in contingent deferred sales charges from redemptions of class B and class C shares, respectively.
A deferred sales charge of up to 1.00% is assessed on certain redemptions of class A shares. For the reporting period, Putnam Retail Management Limited Partnership, acting as underwriter, received no monies on class A redemptions.
Note 3: Purchases and sales of securities
During the reporting period, cost of purchases and proceeds from sales of investment securities other than short-term investments aggregated $5,539,595 and $1,479,980, respectively. There were no purchases or proceeds from sales of long-term U.S. government securities.
Note 4: Capital shares
At the close of the reporting period, there was an unlimited number of shares of beneficial interest authorized. Transactions in capital shares were as follows:
| | | | |
| | Six months ended 11/30/11 | Year ended 5/31/11 |
|
| Class A | Shares | Amount | Shares | Amount |
|
| Shares sold | 1,237,845 | $11,177,174 | 3,644,653 | $33,032,874 |
|
| Shares issued in connection with | | | | |
| reinvestment of distributions | 306,453 | 2,769,833 | 570,007 | 5,098,075 |
|
| | 1,544,298 | 13,947,007 | 4,214,660 | 38,130,949 |
|
| Shares repurchased | (1,140,887) | (10,304,132) | (3,766,923) | (33,250,192) |
|
| Net increase | 403,411 | $3,642,875 | 447,737 | $4,880,757 |
|
38
| | | | |
| | Six months ended 11/30/11 | Year ended 5/31/11 |
|
| Class B | Shares | Amount | Shares | Amount |
|
| Shares sold | 52,854 | $480,749 | 163,868 | $1,491,891 |
|
| Shares issued in connection with | | | | |
| reinvestment of distributions | 10,988 | 99,175 | 26,602 | 237,934 |
|
| | 63,842 | 579,924 | 190,470 | 1,729,825 |
|
| Shares repurchased | (182,043) | (1,638,332) | (549,258) | (4,916,047) |
|
| Net decrease | (118,201) | $(1,058,408) | (358,788) | $(3,186,222) |
|
| |
| | Six months ended 11/30/11 | Year ended 5/31/11 |
|
| Class C | Shares | Amount | Shares | Amount |
|
| Shares sold | 400,967 | $3,634,064 | 955,329 | $8,689,635 |
|
| Shares issued in connection with | | | | |
| reinvestment of distributions | 36,256 | 327,852 | 70,292 | 628,174 |
|
| | 437,223 | 3,961,916 | 1,025,621 | 9,317,809 |
|
| Shares repurchased | (248,475) | (2,233,483) | (741,457) | (6,525,656) |
|
| Net increase | 188,748 | $1,728,433 | 284,164 | $2,792,153 |
|
| |
| | Six months ended 11/30/11 | Year ended 5/31/11 |
|
| Class M | Shares | Amount | Shares | Amount |
|
| Shares sold | 7,034 | $63,865 | 82,074 | $749,413 |
|
| Shares issued in connection with | | | | |
| reinvestment of distributions | 6,486 | 58,636 | 14,830 | 132,863 |
|
| | 13,520 | 122,501 | 96,904 | 882,276 |
|
| Shares repurchased | (29,027) | (261,546) | (140,962) | (1,248,289) |
|
| Net decrease | (15,507) | $(139,045) | (44,058) | $(366,013) |
|
| |
| | Six months ended 11/30/11 | Year ended 5/31/11 |
|
| Class Y | Shares | Amount | Shares | Amount |
|
| Shares sold | 168,876 | $1,528,801 | 151,092 | $1,343,541 |
|
| Shares issued in connection with | | | | |
| reinvestment of distributions | 4,327 | 39,188 | 9,078 | 81,807 |
|
| | 173,203 | 1,567,989 | 160,170 | 1,425,348 |
|
| Shares repurchased | (49,965) | (454,073) | (237,101) | (2,056,020) |
|
| Net increase (decrease) | 123,238 | $1,113,916 | (76,931) | $(630,672) |
|
Note 5: Regulatory matters and litigation
In late 2003 and 2004, Putnam Management settled charges brought by the SEC and the Massachusetts Securities Division in connection with excessive short-term trading in Putnam funds. In July 2011, the fund recorded a receivable of $20,342 related to restitution amounts in connection with a distribution plan approved by the SEC. This amount, which was received by the fund in December 2011, is reported as part of Increase in capital from settlement payments on the Statement of changes in net assets. These allegations and related matters have served as the general basis for certain lawsuits, including purported class action lawsuits against Putnam Management and, in a limited number of cases, some Putnam funds. In May 2011, the fund received a payment of $426 related to settlement of those lawsuits. This amount is reported as a part of Increase in capital from settlement payments on the Statement of changes in net assets. Putnam Management has agreed to bear any costs incurred by the Putnam funds as a result of these matters.
39
Note 6: New accounting pronouncement
In May 2011, the Financial Accounting Standards Board (FASB) issued Accounting Standards Update (ASU) 2011–04 “Fair Value Measurements and Disclosures (Topic 820) — Amendments to Achieve Common Fair Value Measurement and Disclosure Requirements in U.S. GAAP and IFRS”. ASU 2011–04 amends FASB Topic 820 “Fair Value Measurement” and seeks to develop common requirements for measuring fair value and for disclosing information about fair value measurements in accordance with GAAP. ASU 2011–04 is effective for fiscal years and interim periods beginning after December 15, 2011. Putnam Management is currently evaluating the application of ASU 2011–04 and its impact, if any, on the fund’s financial statements.
Note 7: Market and credit risk
In the normal course of business, the fund trades financial instruments and enters into financial transactions where risk of potential loss exists due to changes in the market (market risk) or failure of the contracting party to the transaction to perform (credit risk). The fund may be exposed to additional credit risk that an institution or other entity with which the fund has unsettled or open transactions will default.
40
Services for shareholders
Investor services
Systematic investment plan Tell us how much you wish to invest regularly — weekly, semimonthly, or monthly — and the amount you choose will be transferred automatically from your checking or savings account. There’s no additional fee for this service, and you can suspend it at any time. This plan may be a great way to save for college expenses or to plan for your retirement.
Please note that regular investing does not guarantee a profit or protect against loss in a declining market. Before arranging a systematic investment plan, consider your financial ability to continue making purchases in periods when prices are low.
Systematic exchange You can make regular transfers from one Putnam fund to another Putnam fund. There are no additional fees for this service, and you can cancel or change your options at any time.
Dividends PLUS You can choose to have the dividend distributions from one of your Putnam funds automatically reinvested in another Putnam fund at no additional charge.
Free exchange privilege You can exchange money between Putnam funds free of charge, as long as they are the same class of shares. A signature guarantee is required if you are exchanging more than $500,000. The fund reserves the right to revise or terminate the exchange privilege.
Reinstatement privilege If you’ve sold Putnam shares or received a check for a dividend or capital gain, you may reinvest the proceeds with Putnam within 90 days of the transaction and they will be reinvested at the fund’s current net asset value — with no sales charge. However, reinstatement of class B shares may have special tax consequences. Ask your financial or tax representative for details.
Check-writing service You have ready access to many Putnam accounts. It’s as simple as writing a check, and there are no special fees or service charges. For more information about the check-writing service, call Putnam or visit our website.
Dollar cost averaging When you’re investing for long-term goals, it’s time, not timing, that counts. Investing on a systematic basis is a better strategy than trying to figure out when the markets will go up or down. This means investing the same amount of money regularly over a long period. This method of investing is called dollar cost averaging. When a fund’s share price declines, your investment dollars buy more shares at lower prices. When it increases, they buy fewer shares. Over time, you will pay a lower average price per share.
For more information
Visit the Individual Investors section at putnam.com A secure section of our website contains complete information on your account, including balances and transactions, updated daily. You may also conduct transactions, such as exchanges, additional investments, and address changes. Log on today to get your password.
Call us toll free at 1-800-225-1581 Ask a helpful Putnam representative or your financial advisor for details about any of these or other services, or see your prospectus.
41
The Putnam family of funds
The following is a list of Putnam’s open-end mutual funds offered to the public. Investors should carefully consider the investment objective, risks, charges, and expenses of a fund before investing. For a prospectus, or a summary prospectus if available, containing this and other information for any Putnam fund or product, call your financial advisor at 1-800-225-1581 and ask for a prospectus. Please read the prospectus carefully before investing.
| |
| Growth | Income |
| Growth Opportunities Fund | American Government Income Fund |
| International Growth Fund | Diversified Income Trust |
| Multi-Cap Growth Fund | Floating Rate Income Fund |
| Small Cap Growth Fund | Global Income Trust |
| Voyager Fund | High Yield Advantage Fund |
| | High Yield Trust |
| Blend | Income Fund |
| Asia Pacific Equity Fund | Money Market Fund* |
| Capital Opportunities Fund | Short Duration Income Fund |
| Capital Spectrum Fund | U.S. Government Income Trust |
| Emerging Markets Equity Fund | |
| Equity Spectrum Fund | Tax-free income |
| Europe Equity Fund | AMT-Free Municipal Fund |
| Global Equity Fund | Tax Exempt Income Fund |
| International Capital Opportunities Fund | Tax Exempt Money Market Fund* |
| International Equity Fund | Tax-Free High Yield Fund |
| Investors Fund | |
| Multi-Cap Core Fund | State tax-free income funds: |
| Research Fund | Arizona, California, Massachusetts, Michigan, |
| | Minnesota, New Jersey, New York, Ohio, |
| Value | and Pennsylvania. |
| Convertible Securities Fund | |
| Equity Income Fund | Absolute Return |
| George Putnam Balanced Fund | Absolute Return 100 Fund |
| The Putnam Fund for Growth and Income | Absolute Return 300 Fund |
| International Value Fund | Absolute Return 500 Fund |
| Multi-Cap Value Fund | Absolute Return 700 Fund |
| Small Cap Value Fund | |
| |
* An investment in a money market fund is not insured or guaranteed by the Federal Deposit Insurance Corporation or any other government agency. Although the fund seeks to preserve the value of your investment at $1.00 per share, it is possible to lose money by investing in the fund.
42
| |
| Global Sector | Putnam RetirementReady Funds — portfolios |
| Global Consumer Fund | with automatically adjusting allocations to |
| Global Energy Fund | stocks, bonds, and money market instruments, |
| Global Financials Fund | becoming more conservative over time. |
| Global Health Care Fund | |
| Global Industrials Fund | RetirementReady 2055 Fund |
| Global Natural Resources Fund | RetirementReady 2050 Fund |
| Global Sector Fund | RetirementReady 2045 Fund |
| Global Technology Fund | RetirementReady 2040 Fund |
| Global Telecommunications Fund | RetirementReady 2035 Fund |
| Global Utilities Fund | RetirementReady 2030 Fund |
| | RetirementReady 2025 Fund |
| Asset Allocation | RetirementReady 2020 Fund |
| Putnam Global Asset Allocation Funds — | RetirementReady 2015 Fund |
| portfolios with allocations to stocks, bonds, | |
| and money market instruments that are | Putnam Retirement Income Lifestyle |
| adjusted dynamically within specified ranges | Funds — portfolios with managed |
| as market conditions change. | allocations to stocks, bonds, and money |
| | market investments to generate |
| Dynamic Asset Allocation Balanced Fund | retirement income. |
| Prior to November 30, 2011, this fund was known as | |
| Putnam Asset Allocation: Balanced Portfolio. | Retirement Income Fund Lifestyle 1 |
| Dynamic Asset Allocation | Prior to June 16, 2011, this fund was known as |
| Conservative Fund | Putnam RetirementReady Maturity Fund. |
| Prior to November 30, 2011, this fund was known as | Retirement Income Fund Lifestyle 2 |
| Putnam Asset Allocation: Conservative Portfolio. | Retirement Income Fund Lifestyle 3 |
| Dynamic Asset Allocation Growth Fund | Prior to June 16, 2011, this fund was known as |
| Prior to November 30, 2011, this fund was known as | Putnam Income Strategies Fund. |
| Putnam Asset Allocation: Growth Portfolio. | |
| Dynamic Risk Allocation Fund | |
A short-term trading fee of 1% may apply to redemptions or exchanges from certain funds within the time period specified in the fund's prospectus.
Check your account balances and the most recent month-end performance in the Individual Investors section at putnam.com.
43
Fund information
Founded over 70 years ago, Putnam Investments was built around the concept that a balance between risk and reward is the hallmark of a well-rounded financial program. We manage over 100 funds across income, value, blend, growth, asset allocation, absolute return, and global sector categories.
| | |
| Investment Manager | George Putnam, III | Robert T. Burns |
| Putnam Investment | Robert L. Reynolds | Vice President and |
| Management, LLC | W. Thomas Stephens | Chief Legal Officer |
| One Post Office Square | | |
| Boston, MA 02109 | Officers | James P. Pappas |
| | Robert L. Reynolds | Vice President |
| Investment Sub-Manager | President | |
| Putnam Investments Limited | | Judith Cohen |
| 57–59 St James’s Street | Jonathan S. Horwitz | Vice President, Clerk and |
| London, England SW1A 1LD | Executive Vice President, | Assistant Treasurer |
| | Principal Executive | |
| Marketing Services | Officer, Treasurer and | Michael Higgins |
| Putnam Retail Management | Compliance Liaison | Vice President, Senior Associate |
| One Post Office Square | | Treasurer and Assistant Clerk |
| Boston, MA 02109 | Steven D. Krichmar | |
| | Vice President and | Nancy E. Florek |
| Custodian | Principal Financial Officer | Vice President, Assistant Clerk, |
| State Street Bank | | Assistant Treasurer and |
| and Trust Company | Janet C. Smith | Proxy Manager |
| | Vice President, Assistant | |
| Legal Counsel | Treasurer and Principal | Susan G. Malloy |
| Ropes & Gray LLP | Accounting Officer | Vice President and |
| | | Assistant Treasurer |
| Trustees | Beth S. Mazor | |
| Jameson A. Baxter, Chair | Vice President | |
| Ravi Akhoury | | |
| Barbara M. Baumann | Robert R. Leveille | |
| Charles B. Curtis | Vice President and | |
| Robert J. Darretta | Chief Compliance Officer | |
| John A. Hill | | |
| Paul L. Joskow | Mark C. Trenchard | |
| Kenneth R. Leibler | Vice President and | |
| Robert E. Patterson | BSA Compliance Officer | |
This report is for the information of shareholders of Putnam Pennsylvania Tax Exempt Income Fund. It may also be used as sales literature when preceded or accompanied by the current prospectus, the most recent copy of Putnam’s Quarterly Performance Summary, and Putnam’s Quarterly Ranking Summary. For more recent performance, please visit putnam.com. Investors should carefully consider the investment objectives, risks, charges, and expenses of a fund, which are described in its prospectus. For this and other information or to request a prospectus or summary prospectus, call 1-800-225-1581 toll free. Please read the prospectus carefully before investing. The fund’s Statement of Additional Information contains additional information about the fund’s Trustees and is available without charge upon request by calling 1-800-225-1581.
44
| |
| Item 3. Audit Committee Financial Expert: |
| |
| Item 4. Principal Accountant Fees and Services: |
| |
| Item 5. Audit Committee of Listed Registrants |
| |
| Item 6. Schedule of Investments: |
| |
| The registrant’s schedule of investments in unaffiliated issuers is included in the report to shareholders in Item 1 above. |
| |
| Item 7. Disclosure of Proxy Voting Policies and Procedures For Closed-End Management Investment Companies: |
| |
| Item 8. Portfolio Managers of Closed-End Investment Companies |
| |
| Item 9. Purchases of Equity Securities by Closed-End Management Investment Companies and Affiliated Purchasers: |
| |
| Item 10. Submission of Matters to a Vote of Security Holders: |
| |
| Item 11. Controls and Procedures: |
| |
| (a) The registrant’s principal executive officer and principal financial officer have concluded, based on their evaluation of the effectiveness of the design and operation of the registrant’s disclosure controls and procedures as of a date within 90 days of the filing date of this report, that the design and operation of such procedures are generally effective to provide reasonable assurance that information required to be disclosed by the registrant in this report is recorded, processed, summarized and reported within the time periods specified in the Commission’s rules and forms. |
| |
| (b) Changes in internal control over financial reporting: Not applicable |
| |
| (a)(2) Separate certifications for the principal executive officer and principal financial officer of the registrant as required by Rule 30a-2(a) under the Investment Company Act of 1940, as amended, are filed herewith. |
| |
| (b) The certifications required by Rule 30a-2(b) under the Investment Company Act of 1940, as amended, are filed herewith. |
| |
| Putnam Pennsylvania Tax Exempt Income Fund |
| |
| By (Signature and Title): |
| |
| /s/Janet C. Smith
Janet C. Smith
Principal Accounting Officer
|
| |
| Pursuant to the requirements of the Securities Exchange Act of 1934 and the Investment Company Act of 1940, this report has been signed below by the following persons on behalf of the registrant and in the capacities and on the dates indicated. |
| |
| By (Signature and Title): |
| |
| /s/Jonathan S. Horwitz
Jonathan S. Horwitz
Principal Executive Officer
|
| |
| By (Signature and Title): |
| |
| /s/Steven D. Krichmar
Steven D. Krichmar
Principal Financial Officer
|