| | |
| UNITED STATES
SECURITIES AND EXCHANGE COMMISSION |
| | |
| CERTIFIED SHAREHOLDER REPORT OF REGISTERED
MANAGEMENT INVESTMENT COMPANIES
|
| | |
| Investment Company Act file number: | (811-05802) |
| | |
| Exact name of registrant as specified in charter: | Putnam Pennsylvania Tax Exempt Income Fund |
| | |
| Address of principal executive offices: | 100 Federal Street, Boston, Massachusetts 02110 |
| | |
| Name and address of agent for service: | Robert T. Burns, Vice President
100 Federal Street
Boston, Massachusetts 02110 |
| | |
| Copy to: | Bryan Chegwidden, Esq.
Ropes & Gray LLP
1211 Avenue of the Americas
New York, New York 10036 |
| | |
| Registrant’s telephone number, including area code: | (617) 292-1000 |
| | |
| Date of fiscal year end: | May 31, 2019 |
| | |
| Date of reporting period: | June 1, 2018 — November 30, 2018 |
| | |
|
Item 1. Report to Stockholders: | |
| | |
| The following is a copy of the report transmitted to stockholders pursuant to Rule 30e-1 under the Investment Company Act of 1940: | |
Putnam Pennsylvania
Tax Exempt
Income Fund
Semiannual report
11|30|18
IMPORTANT NOTICE: Delivery of paper fund reports
In accordance with regulations adopted by the Securities and Exchange Commission, beginning on January 1, 2021, reports like this one will no longer be sent by mail unless you specifically request it. Instead, they will be on Putnam’s website, and you will be notified by mail whenever a new one is available, and provided with a website link to access the report.
If you wish to stop receiving paper reports sooner, or if you wish to continue to receive paper reports after January 1, 2021 free of charge, please see the back cover or insert for instructions. If you invest through a bank or broker, your choice will apply to all funds held in your account. If you invest directly with Putnam, your choice will apply to all Putnam funds in your account.
If you already receive these reports electronically, no action is required.
Message from the Trustees
January 11, 2019
Dear Fellow Shareholder:
Global financial markets dealt with some challenges as we entered the final months of 2018. After rising to record highs in the summer, U.S. stocks experienced increased turbulence with concerns mounting over rising interest rates and the escalating U.S.–China trade conflict. International stock markets, which have lagged U.S. markets all year, took another leg down during a selloff in October. Fixed-income markets, while generally less volatile than stocks, have also encountered headwinds as the Federal Reserve has continued its path of normalizing monetary policy. Against this backdrop, the U.S. economy continues to grow, but markets may remain choppy.
Although no one can predict the direction of the markets in the months ahead, Putnam’s experienced investment professionals actively seek to position their fund portfolios for all types of conditions. They take a research-intensive approach to investing that includes risk management strategies designed to serve investors through changing markets. In all environments, we believe investors should remain focused on time-tested strategies: maintain a well-diversified portfolio, think about long-term goals, and speak regularly with your financial advisor.
Thank you for investing with Putnam.


Municipal bonds finance important public projects, such as schools, roads, and hospitals. The bonds are backed by either the issuing city, town, or other government entity or by revenues collected from usage fees.
However, unlike U.S. Treasuries or corporate bonds, the interest paid on municipal bonds is generally free from federal income taxes. Moreover, Pennsylvania residents generally pay no state income taxes on distributions paid from municipal bonds issued in the Keystone State. That can make municipal bonds particularly attractive to investors subject to higher personal income tax rates.
Putnam Pennsylvania Tax Exempt Income Fund offers an active, research-intensive investment approach.

|
| 2 Pennsylvania Tax Exempt Income Fund |
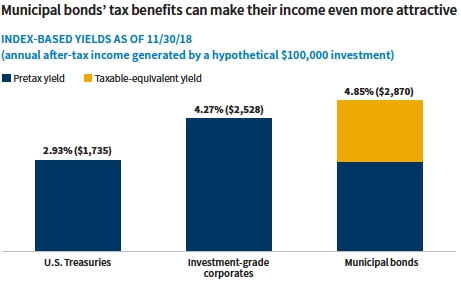
Source: Putnam, as of 11/30/18. Past performance is no guarantee of future results. Yields for U.S. Treasuries, investment-grade corporates, and municipal bonds are represented by the average “yield to worst” — a calculation of the lowest possible yield generated without defaulting — of the Bloomberg Barclays U.S. Treasury Index, the Bloomberg Barclays U.S. Credit Index, and the Bloomberg Barclays Municipal Bond Index, respectively. You cannot invest directly in an index. Bond investments are subject to interest-rate risk (the risk of bond prices falling if interest rates rise) and credit risk (the risk of an issuer defaulting on interest or principal payments). Interest-rate risk is greater for longer-term bonds, and credit risk is greater for below-investment-grade bonds. Income from municipal bonds may be subject to the alternative minimum tax. Taxable equivalent yield and annual after-tax income are based on a 40.80% federal income tax rate. This rate reflects the Tax Cuts and Jobs Act of 2017 and includes the 3.80% Medicare surtax.
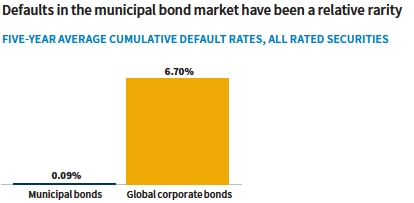
Source: Moody’s Investor Services, U.S. Municipal Bond Defaults and Recoveries, 1970–2017 (July 2018).Most recent data available.
|
| Pennsylvania Tax Exempt Income Fund 3 |
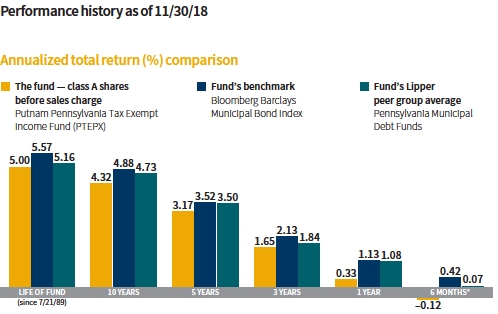
Current performance may be lower or higher than the quoted past performance, which cannot guarantee future results. Share price, principal value, and return will fluctuate, and you may have a gain or a loss when you sell your shares. Performance of class A shares assumes reinvestment of distributions and does not account for taxes. Fund returns in the bar chart do not reflect a sales charge of 4.00%; had they, returns would have been lower. See below and pages 10–12 for additional performance information. For a portion of the periods, the fund had expense limitations, without which returns would have been lower. To obtain the most recent month-end performance, visit putnam.com.
*Returns for the six-month period are not annualized, but cumulative.
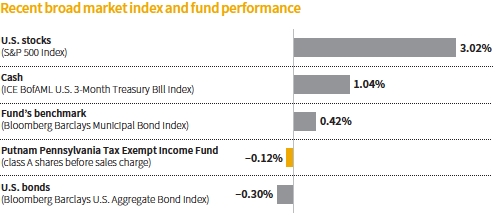
This comparison shows your fund’s performance in the context of broad market indexes for the six months ended 11/30/18. See above and pages 10–12 for additional fund performance information. Index descriptions can be found on pages 15–16.
|
| 4 Pennsylvania Tax Exempt Income Fund |


Paul has a B.A. from Suffolk University. He has been in the investment industry since he joined Putnam in 1989.
In addition to Paul, Garrett L. Hamilton, CFA, is a Portfolio Manager of the fund.
Paul, how was the market for municipal bonds during the reporting period?
In an increasingly challenging market environment, municipal bonds netted positive performance. While the Tax Cuts and Jobs Act [TCJA] enacted in December 2017 retained the tax-exempt status of municipal bonds and kept the highest individual tax rate nearly intact, it reduced the corporate income tax rate from 35% to 21%. The tax rate deduction made municipal bonds a less compelling investment for corporate buyers — thereby reducing demand for the asset class. Consequently, municipal assets held by banks declined $39.5 billion on a year-to-date basis through September 30, 2018, according to JPMorgan Research. [Most recent data available.]
Additionally, with U.S. economic growth continuing to surprise to the upside, municipal bond yields moved higher in tandem with rising Treasury rates and expectations for higher interest rates. [Bond prices generally fall as rates rise.] During the course of the six-month reporting period, the Federal Reserve raised its benchmark rate two times in June and September 2018, as it continued down the path of normalizing interest rates. At period-end,
|
| Pennsylvania Tax Exempt Income Fund 5 |
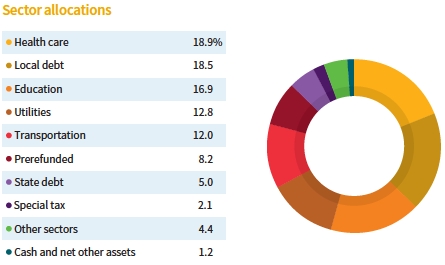
Allocations are shown as a percentage of the fund’s net assets as of 11/30/18. Cash and net other assets, if any, represent the market value weights of cash, derivatives, short-term securities, and other unclassified assets in the portfolio. Summary information may differ from the information in the portfolio schedule notes included in the financial statements due to the inclusion of derivative securities, any interest accruals, the timing of matured security transactions, the use of different classifications of securities for presentation purposes, and rounding. Holdings and allocations may vary over time.
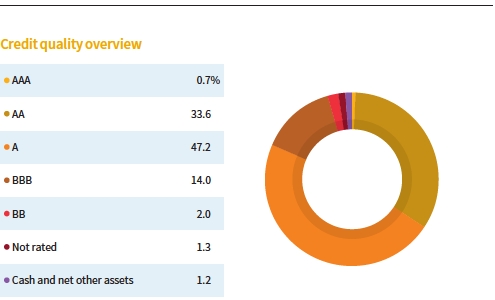
Credit qualities are shown as a percentage of the fund’s net assets as of 11/30/18. A bond rated BBB or higher (SP-3 or higher, for short-term debt) is considered investment grade. This chart reflects the highest security rating provided by one or more of Standard & Poor’s, Moody’s, and Fitch. Ratings may vary over time.
Cash and net other assets, if any, represent the market value weights of cash, derivatives, and short-term securities in the portfolio. The fund itself has not been rated by an independent rating agency.
|
| 6 Pennsylvania Tax Exempt Income Fund |
the federal funds rate stood at a target range of 2.00% to 2.25%.
One positive factor counteracting these demand dynamics was the tax law’s elimination of a number of deductions traditionally taken by high-income earners, which made the tax-exempt status of municipal bonds more attractive to retail buyers. As a result, municipals saw positive net fund inflows during the period.
The municipal bond market also continued to adjust to fluctuating supply dynamics created by the TCJA. With the legislation’s elimination of tax-exempt advanced refundings, new-issue supply fell. An advanced refunding occurs when an issuer refinances a bond before its call date by issuing a second bond at a lower interest rate to pay off the original, older higher-yielding bond, thereby reducing interest cost. On a year-to-date basis through November 30, 2018, new municipal bond issuance totaled $312.3 billion, representing a 17.5% drop from the same period a year earlier, according to theBond Buyer. A decline in available supply typically helps to support prices. In this reporting period, it also provided a counterweight to weaker demand from banks.
Against a backdrop of rising interest rates, municipal bonds outperformed the broader U.S. fixed-income markets for the period. The Bloomberg Barclays Municipal Bond Index [the fund’s benchmark] returned 0.42% for the reporting period and the Bloomberg Barclays U.S. Aggregate Bond Index returned –0.30%
How did the fund perform during the reporting period?
For the six months ended November 30, 2018, the fund underperformed its benchmark and the average return of its Lipper peer group, Pennsylvania Municipal Debt Funds.
What was your investment approach in this environment?
With the flattening of the yield curve, we saw better relative value in bonds with maturities of 15 to 20 years. As such, wefavored an overweight position in bonds with longer intermediate maturities while underweighting shorter intermediate and long maturity holdings.

Consequently, the fund’s yield-curve positioning had more of a bulleted portfolio structure focused on the middle of the curve at period-end. This positioning resulted in an average maturity of approximately 15 years. Duration positioning, which affects the portfolio’s sensitivity to interest rates, moved from a generally neutral stance to being slightly short relative to the benchmark by the end of the period.
From a credit-quality standpoint, the fund held an overweight exposure to higher-quality bonds rated A and BBB. We continued to look for what we view as attractively priced opportunities to move higher up the credit-quality spectrum. This defensive positioning was a small headwind for the fund’s performance as higher-yielding, lower-quality bonds outperformed lower-yielding, higher-quality bonds. With municipal credit fundamentals stable, credit spreads remained at or near post-2008-crisis lows — resulting in the relative outperformance of lower-rated, non-investment-grade municipal bonds. From a sector-positioning perspective, we favored higher education, health-care, and utility bonds relative to the fund’s Lipper group.
The fund continued to hold an underweight position in Puerto Rico-based issuers relative to its Lipper peers. In our view, Puerto Rico’s current economic and financial conditions remain extremely difficult, especially after the catastrophic damage inflicted by Hurricane
|
| Pennsylvania Tax Exempt Income Fund 7 |
Maria. The majority of Puerto Rico’s bonds are in default and are not currently making coupon payments. We believe that the eventual recovery value and economic return of investing in such debt will be determined by the ongoing negotiations between the Commonwealth, the federal control board, and creditors, as well as the long-term economic growth of the island. The uncertainty and volatility of these factors cause us to remain cautious and prefer an underweight position. That said, many Puerto Rico bond prices have risen dramatically during 2018 to date as the market appears to be pricing in the potential of higher recoveries.
What is your outlook for interest rates and the municipal bond market in 2019?
Following the close of the reporting period, the Fed introduced its fourth rate hike of 2018 in December as expected. The Fed increased its benchmark rate a quarter of a percentage point to a target range of 2.25% to 2.50%. In his comments, Fed Chair Jerome Powell sees growth and inflation moderating in the futureand signaled a more patient approach to future rate increases. Powell added that there were a number of “cross-currents emerging” that warranted a reduction in hikes in 2019 from three to two.
In our view, the Fed is not on a preset course and remains pragmatic and data dependent. Tighter monetary policy, the trade war, and the winding down of the stimulus provided by the TCJA could dampen U.S. growth in 2019, in our view. As such, we believe slower growth and stable inflation may contribute to a moderation in the Fed’s pace of tightening.
We are constructive in our outlook for municipals in 2019. As to the general health of the municipal bond market, we believe credit fundamentals are stable. Employment conditions remain favorable, in our view, as the unemployment rate is close to or at a generational low. Income and sales tax receipts at the state level, as well as local property taxes, continue to grow, albeit somewhat slower than over the past few years. The number of municipal borrowers defaulting year to date
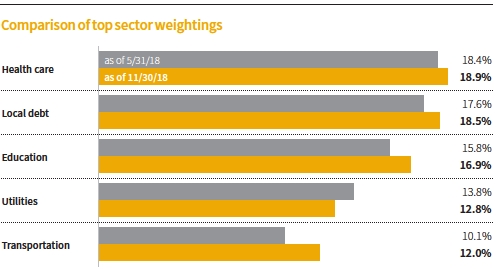
This chart shows how the fund’s top weightings have changed over the past six months. Allocations are shown as a percentage of the fund’s net assets. Current period summary information may differ from the information in the portfolio schedule notes included in the financial statements due to the inclusion of derivative securities, any interest accruals, the timing of matured security transactions, the use of different classifications of securities for presentation purposes, and rounding. Holdings and allocations may vary over time.
|
| 8 Pennsylvania Tax Exempt Income Fund |
through November 2018 represented the lowest level that we have seen in the past five years.
There will always be pockets of weakness and select issues in the municipal market that make headlines from time to time, such as pension challenges. However, while 2019 is apt to be another volatile year, we believe municipals could perform relatively well. We’ll continue to monitor municipal technicals on a daily basis to capture opportunities that arise from supply and/or demand imbalances.
Thank you, Paul, for your time and insights today.
The views expressed in this report are exclusively those of Putnam Management and are subject to change. They are not meant as investment advice.
Please note that the holdings discussed in this report may not have been held by the fund for the entire period. Portfolio composition is subject to review in accordance with the fund’s investment strategy and may vary in the future. Current and future portfolio holdings are subject to risk. Statements in the Q&A concerning the fund’s performance or portfolio composition relative to those of the fund’s Lipper peer group may reference information produced by Lipper Inc. or through a third party.
|
| Pennsylvania Tax Exempt Income Fund 9 |
Your fund’s performance
This section shows your fund’s performance, price, and distribution information for periods ended November 30, 2018, the end of the first half of its current fiscal year. In accordance with regulatory requirements for mutual funds, we also include performance information as of the most recent calendar quarter-end and expense information taken from the fund’s current prospectus. Performance should always be considered in light of a fund’s investment strategy. Data represent past performance. Past performance does not guarantee future results. More recent returns may be less or more than those shown. Investment return and principal value will fluctuate, and you may have a gain or a loss when you sell your shares. Performance information does not reflect any deduction for taxes a shareholder may owe on fund distributions or on the redemption of fund shares. For the most recent month-end performance, please visit the Individual Investors section at putnam.com or call Putnam at 1-800-225-1581. Class R6 and Y shares are not available to all investors. See the Terms and definitions section in this report for definitions of the share classes offered by your fund.
Fund performanceTotal return for periods ended 11/30/18
| | | | | | | | | |
| | Annual | | | | | | | | |
| | average | | Annual | | Annual | | Annual | | |
| | (life of fund) | 10 years | average | 5 years | average | 3 years | average | 1 year | 6 months |
| Class A(7/21/89) | | | | | | | | | |
| Before sales charge | 5.00% | 52.62% | 4.32% | 16.91% | 3.17% | 5.04% | 1.65% | 0.33% | –0.12% |
| After sales charge | 4.85 | 46.51 | 3.89 | 12.23 | 2.34 | 0.84 | 0.28 | –3.69 | –4.12 |
| Class B(7/15/93) | | | | | | | | | |
| Before CDSC | 4.77 | 45.27 | 3.80 | 13.35 | 2.54 | 3.20 | 1.06 | –0.21 | –0.45 |
| After CDSC | 4.77 | 45.27 | 3.80 | 11.35 | 2.17 | 0.32 | 0.11 | –5.09 | –5.37 |
| Class C(10/3/06) | | | | | | | | | |
| Before CDSC | 4.73 | 41.28 | 3.52 | 12.49 | 2.38 | 2.63 | 0.87 | –0.45 | –0.62 |
| After CDSC | 4.73 | 41.28 | 3.52 | 12.49 | 2.38 | 2.63 | 0.87 | –1.43 | –1.61 |
| Class M(7/3/95) | | | | | | | | | |
| Before sales charge | 4.67 | 48.68 | 4.05 | 15.33 | 2.89 | 4.30 | 1.41 | 0.05 | –0.26 |
| After sales charge | 4.55 | 43.84 | 3.70 | 11.58 | 2.22 | 0.91 | 0.30 | –3.20 | –3.50 |
| Class R6(5/22/18) | | | | | | | | | |
| Net asset value | 5.09 | 56.30 | 4.57 | 18.26 | 3.41 | 5.77 | 1.89 | 0.56 | –0.08 |
| Class Y(1/2/08) | | | | | | | | | |
| Net asset value | 5.09 | 56.29 | 4.57 | 18.25 | 3.41 | 5.76 | 1.89 | 0.56 | –0.12 |
Current performance may be lower or higher than the quoted past performance, which cannot guarantee future results. After-sales-charge returns for class A and M shares reflect the deduction of the maximum 4.00% and 3.25% sales charge, respectively, levied at the time of purchase. Class B share returns after contingent deferred sales charge (CDSC) reflect the applicable CDSC, which is 5% in the first year, declining over time to 1% in the sixth year, and is eliminated thereafter. Class C share returns after CDSC reflect a 1% CDSC for the first year that is eliminated thereafter.Class R6 and Y shares have no initial sales charge or CDSC. Performance for class B, C, M, and Y shares before their inception is derived from the historical performance of class A shares, adjusted for the applicable sales charge (or CDSC) and the higher operating expenses for such shares, except for class Y shares, for which 12b-1 fees are not applicable. Performance for class R6 shares prior to their inception is derived from the historical performance of class Y shares and has not been adjusted for the lower investor servicing fees applicable to class R6 shares; had it, returns would have been higher.
For a portion of the periods, the fund had expense limitations, without which returns would have been lower.
Class B share performance reflects conversion to class A shares after eight years.
Class C share performance reflects conversion to class A shares after 10 years.
|
| 10 Pennsylvania Tax Exempt Income Fund |
Comparative index returnsFor periods ended 11/30/18
| | | | | | | | | |
| | Annual | | | | | | | | |
| | average | | Annual | | Annual | | Annual | | |
| | (life of fund) | 10 years | average | 5 years | average | 3 years | average | 1 year | 6 months |
| Bloomberg Barclays | | | | | | | | | |
| Municipal Bond Index | 5.57% | 61.01% | 4.88% | 18.88% | 3.52% | 6.54% | 2.13% | 1.13% | 0.42% |
| Lipper Pennsylvania | | | | | | | | | |
| Municipal Debt Funds | 5.16 | 59.36 | 4.73 | 18.85 | 3.50 | 5.65 | 1.84 | 1.08 | 0.07 |
| category average* | | | | | | | | | |
Index and Lipper results should be compared with fund performance before sales charge, before CDSC, or at net asset value.
*Over the 6-month, 1-year, 3-year, 5-year, 10-year, and life-of-fund periods ended 11/30/18, there were 60, 58, 54, 51, 46, and 8 funds, respectively, in this Lipper category.
Fund price and distribution informationFor the six-month period ended 11/30/18
| | | | | | | | |
| Distributions | Class A | Class B | Class C | Class M | Class R6 | Class Y |
| Number | 6 | 6 | 6 | 6 | 6 | 6 |
| Income1 | $0.128776 | $0.100005 | $0.094064 | $0.116537 | $0.142662 | $0.139071 |
| Capital gains2 | — | — | — | — | — | — |
| Total | $0.128776 | $0.100005 | $0.094064 | $0.116537 | $0.142662 | $0.139071 |
| | Before | After | Net | Net | Before | After | Net | Net |
| | sales | sales | asset | asset | sales | sales | asset | asset |
| Share value | charge | charge | value | value | charge | charge | value | value |
| 5/31/18 | $8.97 | $9.34 | $8.96 | $8.98 | $8.98 | $9.28 | $8.99 | $8.99 |
| 11/30/18 | 8.83 | 9.20 | 8.82 | 8.83 | 8.84 | 9.14 | 8.84 | 8.84 |
| | Before | After | Net | Net | Before | After | Net | Net |
| Current rate | sales | sales | asset | asset | sales | sales | asset | asset |
| (end of period) | charge | charge | value | value | charge | charge | value | value |
| Current dividend rate3 | 2.94% | 2.82% | 2.34% | 2.18% | 2.67% | 2.58% | 3.21% | 3.17% |
| Taxable equivalent4 | 5.24 | 5.02 | 4.17 | 3.88 | 4.76 | 4.60 | 5.72 | 5.65 |
| Current 30-day | | | | | | | | |
| SEC yield5 | N/A | 2.31 | 1.79 | 1.64 | N/A | 2.07 | 2.66 | 2.63 |
| Taxable equivalent4 | N/A | 4.12 | 3.19 | 2.92 | N/A | 3.69 | 4.74 | 4.69 |
The classification of distributions, if any, is an estimate. Before-sales-charge share value and current dividend rate for class A and M shares, if applicable, do not take into account any sales charge levied at the time of purchase.After-sales-charge share value, current dividend rate, and current 30-day SEC yield, if applicable, are calculated assuming that the maximum sales charge (4.00% for class A shares and 3.25% for class M shares) was levied at the time of purchase. Final distribution information will appear on your year-end tax forms.
1For some investors, investment income may be subject to the federal alternative minimum tax.
2Capital gains, if any, are taxable for federal and, in most cases, state purposes.
3Most recent distribution, including any return of capital and excluding capital gains, annualized and divided by share price before or after sales charge at period-end.
4Assumes maximum 43.87% federal and state combined tax rate for 2018. Results for investors subject to lower tax rates would not be as advantageous.
5Based only on investment income and calculated using the maximum offering price for each share class, in accordance with SEC guidelines.
|
| Pennsylvania Tax Exempt Income Fund 11 |
Fund performance as of most recent calendar quarterTotal return for periods ended 12/31/18
| | | | | | | | | |
| | Annual | | | | | | | | |
| | average | | Annual | | Annual | | Annual | | |
| | (life of fund) | 10 years | average | 5 years | average | 3 years | average | 1 year | 6 months |
| Class A(7/21/89) | | | | | | | | | |
| Before sales charge | 5.02% | 55.36% | 4.50% | 18.65% | 3.48% | 5.71% | 1.87% | 0.54% | 0.96% |
| After sales charge | 4.88 | 49.15 | 4.08 | 13.91 | 2.64 | 1.48 | 0.49 | –3.48 | –3.07 |
| Class B(7/15/93) | | | | | | | | | |
| Before CDSC | 4.80 | 47.72 | 3.98 | 15.05 | 2.84 | 3.75 | 1.23 | –0.10 | 0.54 |
| After CDSC | 4.80 | 47.72 | 3.98 | 13.05 | 2.48 | 0.85 | 0.28 | –4.98 | –4.43 |
| Class C(10/3/06) | | | | | | | | | |
| Before CDSC | 4.75 | 44.00 | 3.71 | 14.17 | 2.69 | 3.29 | 1.08 | –0.23 | 0.46 |
| After CDSC | 4.75 | 44.00 | 3.71 | 14.17 | 2.69 | 3.29 | 1.08 | –1.21 | –0.53 |
| Class M(7/3/95) | | | | | | | | | |
| Before sales charge | 4.69 | 51.18 | 4.22 | 17.05 | 3.20 | 4.85 | 1.59 | 0.15 | 0.71 |
| After sales charge | 4.57 | 46.27 | 3.88 | 13.25 | 2.52 | 1.44 | 0.48 | –3.10 | –2.56 |
| Class R6(5/22/18) | | | | | | | | | |
| Net asset value | 5.12 | 59.11 | 4.75 | 20.02 | 3.72 | 6.44 | 2.10 | 0.78 | 1.00 |
| Class Y(1/2/08) | | | | | | | | | |
| Net asset value | 5.12 | 59.09 | 4.75 | 20.00 | 3.71 | 6.43 | 2.10 | 0.77 | 0.97 |
See the discussion following the fund performance table on page 10 for information about the calculation of fund performance.
Your fund’s expenses
As a mutual fund investor, you pay ongoing expenses, such as management fees, distribution fees (12b-1 fees), and other expenses. Using the following information, you can estimate how these expenses affect your investment and compare them with the expenses of other funds. You may also pay one-time transaction expenses, including sales charges (loads) and redemption fees, which are not shown in this section and would have resulted in higher total expenses. For more information, see your fund’s prospectus or talk to your financial representative.
Expense ratios
| | | | | | |
| | Class A | Class B | Class C | Class M | Class R6 | Class Y |
| Total annual operating expenses for the | | | | | | |
| fiscal year ended 5/31/18 | 0.82% | 1.44% | 1.59% | 1.09% | 0.57%* | 0.59% |
| Annualized expense ratio for the | | | | | | |
| six-month period ended 11/30/18 | 0.82% | 1.44% | 1.59% | 1.09% | 0.57% | 0.59% |
Fiscal-year expense information in this table is taken from the most recent prospectus, is subject to change, and may differ from that shown for the annualized expense ratio and in the financial highlights of this report.
Expenses are shown as a percentage of average net assets.
*Other expenses are based on the expenses of class A shares for the fund’s last fiscal year, restated to reflect the lower investor servicing fees applicable to class R6 shares.
|
| 12 Pennsylvania Tax Exempt Income Fund |
Expenses per $1,000
The following table shows the expenses you would have paid on a $1,000 investment in each class of the fund from 6/1/18 to 11/30/18. It also shows how much a $1,000 investment would be worth at the close of the period, assumingactual returnsand expenses.
| | | | | | |
| | Class A | Class B | Class C | Class M | Class R6 | Class Y |
| Expenses paid per $1,000*† | $4.11 | $7.20 | $7.95 | $5.46 | $2.86 | $2.96 |
| Ending value (after expenses) | $998.80 | $995.50 | $993.80 | $997.40 | $999.20 | $998.80 |
*Expenses for each share class are calculated using the fund’s annualized expense ratio for each class, which represents the ongoing expenses as a percentage of average net assets for the six months ended 11/30/18. The expense ratio may differ for each share class.
†Expenses are calculated by multiplying the expense ratio by the average account value for the period; then multiplying the result by the number of days in the period; and then dividing that result by the number of days in the year.
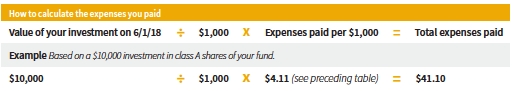
Estimate the expenses you paid
To estimate the ongoing expenses you paid for the six months ended 11/30/18, use the following calculation method. To find the value of your investment on 6/1/18, call Putnam at 1-800-225-1581.
Compare expenses using the SEC’s method
The Securities and Exchange Commission (SEC) has established guidelines to help investors assess fund expenses. Per these guidelines, the following table shows your fund’s expenses based on a $1,000 investment, assuming ahypothetical 5% annualized return. You can use this information to compare the ongoing expenses (but not transaction expenses or total costs) of investing in the fund with those of other funds. All mutual fund shareholder reports will provide this information to help you make this comparison. Please note that you cannot use this information to estimate your actual ending account balance and expenses paid during the period.
| | | | | | |
| | Class A | Class B | Class C | Class M | Class R6 | Class Y |
| Expenses paid per $1,000*† | $4.15 | $7.28 | $8.04 | $5.52 | $2.89 | $2.99 |
| Ending value (after expenses) | $1,020.96 | $1,017.85 | $1,017.10 | $1,019.60 | $1,022.21 | $1,022.11 |
*Expenses for each share class are calculated using the fund’s annualized expense ratio for each class, which represents the ongoing expenses as a percentage of average net assets for the six months ended 11/30/18. The expense ratio may differ for each share class.
†Expenses are calculated by multiplying the expense ratio by the average account value for the six-month period; then multiplying the result by the number of days in the six-month period; and then dividing that result by the number of days in the year.
|
| Pennsylvania Tax Exempt Income Fund 13 |
Consider these risks before investing
Bond prices may fall or fail to rise over time for several reasons, including general financial market conditions, changing market perceptions (including perceptions about the risk of default and expectations about monetary policy or interest rates), changes in government intervention in the financial markets, and factors related to a specific issuer. These and other factors may lead to increased volatility and reduced liquidity in the fund’s portfolio holdings. The fund’s performance will be closely tied to the economic and political conditions in Pennsylvania and can be more volatile than the performance of a more geographically diversified fund. Capital gains, if any, are taxed at the federal and, in most cases, state levels. For some investors, investment income may be subject to the federal alternative minimum tax. Bond investments are subject to interest-rate risk (the risk of bond prices falling if interest rates rise) and credit risk (the risk of an issuer defaulting on interest or principal payments). Interest-rate risk is greater for longer-term bonds, and credit risk is greater for below-investment-grade bonds. Unlike bonds, funds that invest in bonds have fees and expenses. Tax-exempt bonds may be issued under the Internal Revenue Code only by limited types of issuers for limited types of projects. As a result, the fund’s investments may be focused in certain market segments and be more vulnerable to fluctuations in the values of the securities it holds than a more broadly invested fund. Interest the fund receives might be taxable. You can lose money by investing in the fund.
|
| 14 Pennsylvania Tax Exempt Income Fund |
Terms and definitions
Important terms
Total returnshows how the value of the fund’s shares changed over time, assuming you held the shares through the entire period and reinvested all distributions in the fund.
Before sales charge, or net asset value, is the price, or value, of one share of a mutual fund, without a sales charge. Before-sales-charge figures fluctuate with market conditions, and are calculated by dividing the net assets of each class of shares by the number of outstanding shares in the class.
After sales chargeis the price of a mutual fund share plus the maximum sales charge levied at the time of purchase. After-sales-charge performance figures shown here assume the 4.00% maximum sales charge for class A shares and 3.25% for class M shares.
Contingent deferred sales charge (CDSC)is generally a charge applied at the time of the redemption of class B or C shares and assumes redemption at the end of the period. Your fund’s class B CDSC declines over time from a 5% maximum during the first year to 1% during the sixth year. After the sixth year, the CDSC no longer applies. The CDSC for class C shares is 1% for one year after purchase.
Share classes
Class A sharesare generally subject to an initial sales charge and no CDSC (except on certain redemptions of shares bought without an initial sales charge).
Class B sharesare closed to new investments and are only available by exchange from another Putnam fund or through dividend and/or capital gains reinvestment. They are not subject to an initial sales charge and may be subject to a CDSC.
Class C sharesare not subject to an initial sales charge and are subject to a CDSC only if the shares are redeemed during the first year.
Class M shareshave a lower initial sales charge and a higher 12b-1 fee than class A shares and no CDSC.
Class R6 sharesare not subject to an initial sales charge or CDSC and carry no 12b-1 fee. They are generally only available to employer-sponsored retirement plans, corporate and institutional clients, and clients in other approved programs.
Class Y sharesare not subject to an initial sales charge or CDSC and carry no 12b-1 fee. They are generally only available to corporate and institutional clients and clients in other approved programs.
Fixed-income terms
Current rateis the annual rate of return earned from dividends or interest of an investment. Current rate is expressed as a percentage of the price of a security, fund share, or principal investment.
Yield curveis a graph that plots the yields of bonds with equal credit quality against their differing maturity dates, ranging from shortest to longest. It is used as a benchmark for other debt, such as mortgage or bank lending rates.
Comparative indexes
Bloomberg Barclays Municipal Bond Indexis an unmanaged index of long-term fixed-rate investment-grade tax-exempt bonds.
Bloomberg Barclays U.S. Aggregate Bond Indexis an unmanaged index of U.S. investment-grade fixed-income securities.
ICE BofAML (Intercontinental Exchange Bank of America Merrill Lynch) U.S. 3-Month Treasury Bill Indexis an unmanaged index that seeks to measure the performance of U.S.Treasury bills available in the marketplace.
S&P 500 Indexis an unmanaged index of common stock performance.
|
| Pennsylvania Tax Exempt Income Fund 15 |
Indexes assume reinvestment of all distributions and do not account for fees. Securities and performance of a fund and an index will differ. You cannot invest directly in an index.
ICE Data Indices, LLC (“ICE BofAML”), used with permission. ICE BofAML permits use of the ICE BofAML indices and related data on an “as is” basis; makes no warranties regarding same; does not guarantee the suitability, quality, accuracy, timeliness, and/or completeness of the ICE BofAML indices or any data included in, related to, or derived therefrom; assumes no liability in connection with the use of the foregoing; and does not sponsor, endorse, or recommend Putnam Investments, or any of its products or services.
Lipperis a third-party industry-ranking entity that ranks mutual funds. Its rankings do not reflect sales charges. Lipper rankings are based on total return at net asset value relative to other funds that have similar current investment styles or objectives as determined by Lipper. Lipper may change a fund’s category assignment at its discretion. Lipper category averages reflect performance trends for funds within a category.
Other information for shareholders
Important notice regarding delivery of shareholder documents
In accordance with Securities and Exchange Commission (SEC) regulations, Putnam sends a single copy of annual and semiannual shareholder reports, prospectuses, and proxy statements to Putnam shareholders who share the same address, unless a shareholder requests otherwise. If you prefer to receive your own copy of these documents, please call Putnam at 1-800-225-1581, and Putnam will begin sending individual copies within 30 days.
Proxy voting
Putnam is committed to managing our mutual funds in the best interests of our shareholders. The Putnam funds’ proxy voting guidelines and procedures, as well as information regarding how your fund voted proxies relating to portfolio securities during the 12-month period ended June 30, 2018, are available in the Individual Investors section of putnam.com and on the SEC’s website, www.sec.gov. If you have questions about finding forms on the SEC’s website, you may call the SEC at1-800-SEC-0330. You may also obtain the Putnam funds’ proxy voting guidelines and procedures at no charge by calling Putnam’s Shareholder Services at 1-800-225-1581.
Fund portfolio holdings
The fund will file a complete schedule of its portfolio holdings with the SEC for the first and third quarters of each fiscal year on Form N-Q. Shareholders may obtain the fund’s Form N-Q on the SEC’s website at www.sec.gov.
Trustee and employee fund ownership
Putnam employees and members of the Board of Trustees place their faith, confidence, and, most importantly, investment dollars in Putnam mutual funds. As of November 30, 2018, Putnam employees had approximately $477,000,000 and the Trustees had approximately $66,000,000 invested in Putnam mutual funds. These amounts include investments by the Trustees’ and employees’ immediate family members as well as investments through retirement and deferred compensation plans.
|
| 16 Pennsylvania Tax Exempt Income Fund |
Trustee approval of management contract
General conclusions
The Board of Trustees of The Putnam Funds oversees the management of each fund and, as required by law, determines annually whether to approve the continuance of your fund’s management contract with Putnam Investment Management, LLC (“Putnam Management”) and the sub-management contract with respect to your fund between Putnam Management and its affiliate, Putnam Investments Limited (“PIL”). The Board, with the assistance of its Contract Committee, requests and evaluates all information it deems reasonably necessary under the circumstances in connection with its annual contract review. The Contract Committee consists solely of Trustees who are not “interested persons” (as this term is defined in the Investment Company Act of 1940, as amended (the “1940 Act”)) of The Putnam Funds (“Independent Trustees”).
At the outset of the review process, members of the Board’s independent staff and independent legal counsel discussed with representatives of Putnam Management the annual contract review materials furnished to the Contract Committee during the course of the previous year’s review, identifying possible changes in these materials that might be necessary or desirable for the coming year. Following these discussions and in consultation with the Contract Committee, the Independent Trustees’ independent legal counsel requested that Putnam Management and its affiliates furnish specified information, together with any additional information that Putnam Management considered relevant, to the Contract Committee. Over the course of several months ending in June 2018, the Contract Committee met on a number of occasions with representatives of Putnam Management, and separately in executive session, to consider the information that Putnam Management provided. Throughout this process, the Contract Committee was assisted by the members of the Board’s independent staff and by independent legal counsel for The Putnam Funds and the Independent Trustees.
In May 2018, the Contract Committee met in executive session to discuss and consider its recommendations with respect to the continuance of the contracts. At the Trustees’ June 2018 meeting, the Contract Committee met in executive session with the other Independent Trustees to review a summary of the key financial,performance and other data that the Contract Committee considered in the course of its review. The Contract Committee then presented its written report, which summarized the key factors that the Committee had considered and set forth its recommendations. The Contract Committee recommended, and the Independent Trustees approved, the continuance of your fund’s management and sub-management contracts, effective July 1, 2018. (Because PIL is an affiliate of Putnam Management and Putnam Management remains fully responsible for all services provided by PIL, the Trustees have not attempted to evaluate PIL as a separate entity, and all subsequent references to Putnam Management below should be deemed to include reference to PIL as necessary or appropriate in the context.)
The Independent Trustees’ approval was based on the following conclusions:
• That the fee schedule in effect for your fund represented reasonable compensation in light of the nature and quality of the services being provided to the fund, the fees paid by competitive funds, the costs incurred by Putnam Management in providing services to the fund, and the application of certain reductions and waivers noted below; and
• That the fee schedule in effect for your fund represented an appropriate sharing between fund shareholders and Putnam Management of such economies of scale as may exist in the management of the fund at current asset levels.
These conclusions were based on a comprehensive consideration of all information provided to the Trustees and were not the result of any single factor. Some of the factors that figured particularly in the Trustees’ deliberations and how the Trustees considered these factors are described below, although individual Trustees may have evaluated the information presented differently, giving different weights to various factors. It is also important to recognize that the management arrangements for your fund and the other Putnam funds are the result of many years of review and discussion between the Independent Trustees and Putnam Management, that some aspects of the arrangements may receive greater scrutiny in some years than others, and that the Trustees’ conclusions may be based, in part, on their consideration of fee arrangements in previous
|
| Pennsylvania Tax Exempt Income Fund 17 |
years. For example, with some minor exceptions, the funds’ current fee arrangements under the management contracts were first implemented at the beginning of 2010 following extensive review by the Contract Committee and discussions with representatives of Putnam Management, as well as approval by shareholders.
Management fee schedules and total expenses
The Trustees reviewed the management fee schedules in effect for all Putnam funds, including fee levels and breakpoints. The Trustees also reviewed the total expenses of each Putnam fund, recognizing that in most cases management fees represented the major, but not the sole, determinant of total costs to fund shareholders. (In a few instances, funds have implemented so-called “all-in” management fees covering substantially all routine fund operating costs.)
In reviewing fees and expenses, the Trustees generally focus their attention on material changes in circumstances — for example, changes in assets under management, changes in a fund’s investment strategy, changes in Putnam Management’s operating costs or profitability, or changes in competitive practices in the mutual fund industry — that suggest that consideration of fee changes might be warranted. The Trustees concluded that the circumstances did not indicate that changes to the management fee structure for your fund would be appropriate at this time.
Under its management contract, your fund has the benefit of breakpoints in its management fee schedule that provide shareholders with economies of scale in the form of reduced fee rates as assets under management in the Putnam family of funds increase. The Trustees concluded that the fee schedule in effect for your fund represented an appropriate sharing of economies of scale between fund shareholders and Putnam Management.
As in the past, the Trustees also focused on the competitiveness of each fund’s total expense ratio. In order to support the effort to have fund expenses meet competitive standards, the Trustees and Putnam Management have implemented expense limitations that were in effect during your fund’s fiscal year ending in 2017. These expense limitations were: (i) a contractual expense limitation applicable to all open-end funds of 25 basis points on investor servicing fees and expenses and (ii) a contractual expense limitationapplicable to specified open-end funds, including your fund, of 20 basis points on so-called “other expenses” (i.e., all expenses exclusive of management fees, distribution fees, investor servicing fees, investment-related expenses, interest, taxes, brokerage commissions, acquired fund fees and expenses and extraordinary expenses). These expense limitations attempt to maintain competitive expense levels for the funds. Most funds, including your fund, had sufficiently low expenses that these expense limitations were not operative during their fiscal years ending in 2017. Putnam Management has agreed to maintain these expense limitations until at least September 30, 2019. Putnam Management’s support for these expense limitation arrangements was an important factor in the Trustees’ decision to approve the continuance of your fund’s management and sub-management contracts.
The Trustees reviewed comparative fee and expense information for a custom group of competitive funds selected by Broadridge Financial Solutions, Inc. (“Broadridge”). This comparative information included your fund’s percentile ranking for effective management fees and total expenses (excluding any applicable 12b-1 fee), which provides a general indication of your fund’s relative standing. In the custom peer group, your fund ranked in the first quintile in effective management fees (determined for your fund and the other funds in the custom peer group based on fund asset size and the applicable contractual management fee schedule) and in the second quintile in total expenses (excluding any applicable 12b-1 fees) as of December 31, 2017. The first quintile represents the least expensive funds and the fifth quintile the most expensive funds. The fee and expense data reported by Broadridge as of December 31, 2017 reflected the most recent fiscal year-end data available in Broadridge’s database at that time.
In connection with their review of fund management fees and total expenses, the Trustees also reviewed the costs of the services provided and the profits realized by Putnam Management and its affiliates from their contractual relationships with the funds. This information included trends in revenues, expenses and profitability of Putnam Management and its affiliates relating to the investment management, investor servicing and distribution services provided to the funds. In this regard, the Trustees also reviewed an analysis of Putnam Management’s revenues, expenses and profitability, allocated on a fund-by-fund basis,
|
| 18 Pennsylvania Tax Exempt Income Fund |
with respect to the funds’ management, distribution, and investor servicing contracts. For each fund, the analysis presented information about revenues, expenses and profitability for each of the agreements separately and for the agreements taken together on a combined basis. The Trustees concluded that, at current asset levels, the fee schedules in place represented reasonable compensation for the services being provided and represented an appropriate sharing between fund shareholders and Putnam Management of such economies of scale as may exist in the management of the Putnam funds at that time.
The information examined by the Trustees in connection with their annual contract review for the Putnam funds included information regarding fees charged by Putnam Management and its affiliates to institutional clients, including defined benefit pension and profit-sharing plans and sub-advised mutual funds. This information included, in cases where an institutional product’s investment strategy corresponds with a fund’s strategy, comparisons of those fees with fees charged to the Putnam funds, as well as an assessment of the differences in the services provided to these different types of clients as compared to the services provided to the Putnam funds.The Trustees observed that the differences in fee rates between these clients and the Putnam funds are by no means uniform when examined by individual asset sectors, suggesting that differences in the pricing of investment management services to these types of clients may reflect, among other things, historical competitive forces operating in separate markets. The Trustees considered the fact that in many cases fee rates across different asset classes are higher on average for mutual funds than for institutional clients, as well as the differences between the services that Putnam Management provides to the Putnam funds and those that it provides to its other clients. The Trustees did not rely on these comparisons to any significant extent in concluding that the management fees paid by your fund are reasonable.
Investment performance
The quality of the investment process provided by Putnam Management represented a major factor in the Trustees’ evaluation of the quality of services provided by Putnam Management under your fund’s management contract. The Trustees were assisted in their review of the Putnam funds’ investment process and performance by the workof the investment oversight committees of the Trustees and the full Board of Trustees, which meet on a regular basis with the funds’ portfolio teams and with the Chief Investment Officers and other senior members of Putnam Management’s Investment Division throughout the year. The Trustees concluded that Putnam Management generally provides a high-quality investment process — based on the experience and skills of the individuals assigned to the management of fund portfolios, the resources made available to them, and in general Putnam Management’s ability to attract and retain high-quality personnel — but also recognized that this does not guarantee favorable investment results for every fund in every time period.
The Trustees considered that 2017 was a strong year for the performance of the Putnam funds, with generally favorable results for most asset classes, including U.S. equity, international and global equity, taxable and tax exempt fixed income, and global asset allocation Funds. In this regard, the Trustees considered that, for the one-year period ended December 31, 2017, the Putnam open-end Funds’ performance, on an asset-weighted basis, ranked in the 32nd percentile of their Lipper peers (excluding those Putnam funds that are evaluated based on their total returns and/or comparisons of those returns versus selected investment benchmarks or targeted annual returns). The Trustees observed that this strong performance has continued a positive trend that began in mid-year 2016 across most Putnam funds. They noted that the longer-term performance of the Putnam funds continued to be strong, exemplified by the fact that the Putnam funds were ranked by the Barron’s/Lipper Fund Families survey as the 7th-best performing mutual fund complex out of 55 complexes for the five-year period ended December 31, 2017 and the 9th-best performing mutual fund complex out of 50 complexes for the ten-year period ended 2017. In addition, the survey ranked the Putnam funds 7th out of 59 mutual fund complexes for the one-year period ended 2017; the Putnam funds have ranked 1st or 2nd in the survey for the one-year period three times since 2009 (most recently in 2013). They also noted, however, the disappointing investment performance of some funds for periods ended December 31, 2017 and considered information provided by Putnam Management regarding the factors contributing to the underperformance and actions being taken to improve the performance
|
| Pennsylvania Tax Exempt Income Fund 19 |
of these particular funds. The Trustees indicated their intention to continue to monitor closely the performance of those funds, including the effectiveness of any efforts Putnam Management has undertaken to address underperformance and whether additional actions to address areas of underperformance are warranted.
For purposes of the Trustees’ evaluation of the Putnam Funds’ investment performance, the Trustees generally focus on a competitive industry ranking of each fund’s total net return over a one-year, three-year and five-year period. For a number of Putnam funds with relatively unique investment mandates for which Putnam Management informed the Trustees that meaningful competitive performance rankings are not considered to be available, the Trustees evaluated performance based on their total gross and net returns and, in most cases, comparisons of those returns with the returns of selected investment benchmarks. In the case of your fund, the Trustees considered that its class A share cumulative total return performance at net asset value was in the following quartiles of its Lipper Inc. (“Lipper”) peer group (Lipper Pennsylvania Municipal Debt Funds) for the one-year, three-year and five-year periods ended December 31, 2017 (the first quartile representing the best-performing funds and the fourth quartile the worst-performing funds):
| |
| One-year period | 2nd |
| Three-year period | 2nd |
| Five-year period | 3rd |
Over the one-year, three-year and five-year periods ended December 31, 2017, there were 59, 57 and 53 funds, respectively, in your fund’s Lipper peer group. (When considering performance information, shareholders should be mindful that past performance is not a guarantee of future results.)
The Trustees considered Putnam Management’s continued efforts to support fund performance through initiatives including structuring compensation for portfolio managers and research analysts to enhance accountability for fund performance, emphasizing accountability in the portfolio management process, and affirming its commitment to a fundamental-driven approach to investing. The Trustees noted further that Putnam Management continued to strengthen its fundamental research capabilities by adding new investment personnel.
Brokerage and soft-dollar allocations; investor servicing
The Trustees considered various potential benefits that Putnam Management may receive in connection with the services it provides under the management contract with your fund. These include benefits related to brokerage allocation and the use of soft dollars, whereby a portion of the commissions paid by a fund for brokerage may be used to acquire research services that are expected to be useful to Putnam Management in managing the assets of the fund and of other clients. Subject to policies established by the Trustees, soft dollars generated by these means are used predominantly to acquire brokerage and research services (including third-party research and market data) that enhance Putnam Management’s investment capabilities and supplement Putnam Management’s internal research efforts. However, the Trustees noted that a portion of available soft dollars continues to be used to pay fund expenses. The Trustees indicated their continued intent to monitor regulatory and industry developments in this area with the assistance of their Brokerage Committee. The Trustees also indicated their continued intent to monitor the allocation of the Putnam funds’ brokerage in order to ensure that the principle of seeking best price and execution remains paramount in the portfolio trading process.
Putnam Management may also receive benefits from payments that the funds make to Putnam Management’s affiliates for investor or distribution services. In conjunction with the annual review of your fund’s management and sub-management contracts, the Trustees reviewed your fund’s investor servicing agreement with Putnam Investor Services, Inc. (“PSERV”) and its distributor’s contracts and distribution plans with Putnam Retail Management Limited Partnership (“PRM”), both of which are affiliates of Putnam Management. The Trustees concluded that the fees payable by the funds to PSERV and PRM, as applicable, for such services are fair and reasonable in relation to the nature and quality of such services, the fees paid by competitive funds, and the costs incurred by PSERV and PRM, as applicable, in providing such services. Furthermore, the Trustees were of the view that the services provided were required for the operation of the funds, and that they were of a quality at least equal to those provided by other providers.
|
| 20 Pennsylvania Tax Exempt Income Fund |
Financial statements
These sections of the report, as well as the accompanying Notes, constitute the fund’s financial statements.
The fund’s portfoliolists all the fund’s investments and their values as of the last day of the reporting period. Holdings are organized by asset type and industry sector, country, or state to show areas of concentration and diversification.
Statement of assets and liabilitiesshows how the fund’s net assets and share price are determined. All investment and non-investment assets are added together. Any unpaid expenses and other liabilities are subtracted from this total. The result is divided by the number of shares to determine the net asset value per share, which is calculated separately for each class of shares. (For funds with preferred shares, the amount subtracted from total assets includes the liquidation preference of preferred shares.)
Statement of operationsshows the fund’s net investment gain or loss. This is done by first adding up all the fund’s earnings — from dividends and interest income — and subtracting its operating expenses to determine net investment income (or loss). Then, any net gain or loss the fund realized on the sales of its holdings — as well as any unrealized gains or losses over the period — is added toor subtracted from the net investment result to determine the fund’s net gain or loss for the fiscal period.
Statement of changes in net assetsshows how the fund’s net assets were affected by the fund’s net investment gain or loss, by distributions to shareholders, and by changes in the number of the fund’s shares. It lists distributions and their sources (net investment income or realized capital gains) over the current reporting period and the most recent fiscal year-end. The distributions listed here may not match the sources listed in the Statement of operations because the distributions are determined on a tax basis and may be paid in a different period from the one in which they were earned. Dividend sources are estimated at the time of declaration. Actual results may vary. Any non-taxable return of capital cannot be determined until final tax calculations are completed after the end of the fund’s fiscal year.
Financial highlightsprovide an overview of the fund’s investment results, per-share distributions, expense ratios, net investment income ratios, and portfolio turnover in one summary table, reflecting the five most recent reporting periods. In a semiannual report, the highlights table also includes the current reporting period.
|
| Pennsylvania Tax Exempt Income Fund 21 |
The fund’s portfolio11/30/18 (Unaudited)
Key to holding’s abbreviations
| |
| AGCAssured Guaranty Corp. | NATLNational Public Finance Guarantee Corp. |
| AGMAssured Guaranty Municipal Corporation | U.S. Govt. Coll.U.S. Government Collateralized |
| AMBACAMBAC Indemnity Corporation | VRDNVariable Rate Demand Notes, which are floating- |
| BAMBuild America Mutual | rate securities with long-term maturities that carry |
| COP Certificates of Participation | coupons that reset and are payable upon demand |
| FRN Floating Rate Notes: the rate shown is the current | either daily, weekly or monthly. The rate shown is the |
| interest rate or yield at the close of the reporting period. | current interest rate at the close of the reporting |
| Rates may be subject to a cap or floor. For certain | period. Rates are set by remarketing agents and may |
| securities, the rate may represent a fixed rate currently | take into consideration market supply and demand, |
| in place at the close of the reporting period. | credit quality and the current SIFMA Municipal Swap |
| G.O. Bonds General Obligation Bonds | Index rate, which was 1.69% as of the close of the |
| | reporting period. |
| | | |
| MUNICIPAL BONDS AND NOTES (100.0%)* | Rating** | Principal amount | Value |
| Guam (1.2%) | | | |
| Territory of GU, Govt. Ltd. Oblig. Rev. | | | |
| Bonds, (Section 30), Ser. A, 5.75%, 12/1/34 | | | |
| (Prerefunded 12/1/19) | BBB+ | $1,000,000 | $1,037,740 |
| Territory of GU, Govt. Wtr. Wks. Auth. Wtr. & | | | |
| Waste Wtr. Syst. Rev. Bonds, 5.625%, 7/1/40 | | | |
| (Prerefunded 7/1/20) | A– | 450,000 | 475,232 |
| Territory of GU, Pwr. Auth. Rev. Bonds, Ser. A, U.S. | | | |
| Govt. Coll., 5.50%, 10/1/40 (Prerefunded 10/1/20) | Baa2 | 350,000 | 371,900 |
| | | | 1,884,872 |
| New Mexico (0.8%) | | | |
| NM State Muni. Energy Acquisition Auth. Gas | | | |
| Supply FRN Mandatory Put Bonds (8/1/19), Ser. B, | | | |
| 2.291%, 11/1/39 | Aa2 | 1,175,000 | 1,175,270 |
| | | | 1,175,270 |
| Pennsylvania (97.2%) | | | |
| Allegheny Cnty., G.O. Bonds | | | |
| Ser. C-72, 5.25%, 12/1/33 | Aa3 | 2,230,000 | 2,486,160 |
| Ser. C-77, 4.00%, 11/1/34 | Aa3 | 900,000 | 937,377 |
| Allegheny Cnty., Arpt. Auth. Rev. Bonds, (Pittsburgh | | | |
| Intl. Arpt.), Ser. A-1, 5.00%, 1/1/28 | A | 1,000,000 | 1,055,390 |
| Allegheny Cnty., Higher Ed. Bldg. Auth. Rev. Bonds | | | |
| (Robert Morris U.), Ser. A, 5.75%, 10/15/40 | Baa3 | 500,000 | 520,015 |
| (Chatham U.), Ser. A, 5.00%, 9/1/20 | BBB– | 1,180,000 | 1,221,536 |
| Allegheny Cnty., Hosp. Dev. Auth. Rev. Bonds | | | |
| (U. of Pittsburgh Med.), 5.625%, 8/15/39 | A1 | 2,000,000 | 2,044,460 |
| Ser. A, 5.00%, 10/15/31 | A1 | 1,000,000 | 1,063,770 |
| Allegheny Cnty., Sanitation Auth. Rev. Bond, AGM, | | | |
| 5.00%, 12/1/25 | AA | 250,000 | 290,038 |
| Beaver Cnty., Hosp. Auth. Rev. Bonds, (Heritage | | | |
| Valley Hlth. Syst., Inc.), 5.00%, 5/15/26 | A2 | 1,000,000 | 1,059,300 |
| Berks Cnty., Muni. Auth. Rev. Bonds, (Reading Hosp. | | | |
| & Med. Ctr.), Ser. A-3 | | | |
| 5.50%, 11/1/31 | A | 1,000,000 | 1,030,180 |
| U.S. Govt. Coll., 5.50%, 11/1/31 | | | |
| (Prerefunded 11/1/19) | AAA/P | 1,000,000 | 1,031,510 |
|
| 22 Pennsylvania Tax Exempt Income Fund |
| | | |
| MUNICIPAL BONDS AND NOTES (100.0%)*cont. | Rating** | Principal amount | Value |
| Pennsylvaniacont. | | | |
| Cap. Region Wtr. Rev. Bonds | | | |
| (Swr. Syst.), 5.00%, 7/15/42 | A+ | $2,000,000 | $2,193,300 |
| Ser. A, BAM, 5.00%, 7/15/29 | AA | 1,235,000 | 1,401,972 |
| Central Dauphin School Dist. G.O. Bonds, | | | |
| 5.00%, 2/1/30 | AA | 1,000,000 | 1,142,520 |
| Centre Ctny., Hosp. Auth. Rev. Bonds, (Mount | | | |
| Nittany Med. Ctr.), Ser. A | | | |
| 5.00%, 11/15/46 | A | 500,000 | 537,165 |
| 5.00%, 11/15/41 | A | 800,000 | 863,536 |
| Chester Cnty., G.O. Bonds, 5.00%, 7/15/36 | Aaa | 750,000 | 851,948 |
| Chester Cnty., Indl. Dev. Auth. Rev. Bonds | | | |
| (Collegium Charter School), Ser. A, | | | |
| 5.125%, 10/15/37 | BB+ | 225,000 | 226,125 |
| (Renaissance Academy Charter School), | | | |
| 5.00%, 10/1/34 | BBB– | 150,000 | 157,241 |
| Chester Cnty., Indl. Dev. Auth. Student Hsg. Rev. | | | |
| Bonds, (West Chester U. Student Hsg., LLC), Ser. A, | | | |
| 5.00%, 8/1/45 | Baa3 | 1,000,000 | 1,026,240 |
| Cmnwlth. Fin. Auth. Rev. Bonds, (Tobacco Master | | | |
| Settlement Payment Bonds) | | | |
| 5.00%, 6/1/34 | A1 | 1,000,000 | 1,108,320 |
| 5.00%, 6/1/33 | A1 | 1,000,000 | 1,112,570 |
| Crawford Cnty., Indl. Dev. Auth. Rev. Bonds, | | | |
| (Allegheny College), Ser. A, 6.00%, 11/1/31 | | | |
| (Prerefunded 5/1/19) | A– | 1,000,000 | 1,016,780 |
| Cumberland Cnty., Muni. Auth. Rev. Bonds | | | |
| (Dickinson College), 5.00%, 11/1/32 | A+ | 1,000,000 | 1,077,810 |
| (Diakon Lutheran Social Ministries), 5.00%, 1/1/32 | BBB+/F | 700,000 | 748,083 |
| Dallas, Area Muni. Auth. U. Rev. Bonds, (Misericordia | | | |
| U.), 5.00%, 5/1/29 | Baa3 | 1,500,000 | 1,586,445 |
| Dauphin Cnty., Gen. Auth. Hlth. Syst. Rev. Bonds, | | | |
| (Pinnacle Hlth. Syst.), Ser. A | | | |
| 6.00%, 6/1/29 | A1 | 785,000 | 799,216 |
| 5.00%, 6/1/35 | A1 | 475,000 | 521,360 |
| Dauphin Cnty., Indl. Dev. Auth. Wtr. Rev. Bonds, | | | |
| (Dauphin Cons. Wtr. Supply), Ser. A, 6.90%, 6/1/24 | A– | 1,000,000 | 1,189,980 |
| Delaware River Port Auth. PA & NJ Rev. Bonds, Ser. D, | | | |
| 5.00%, 1/1/40 (Prerefunded 1/1/20) | A+ | 800,000 | 826,256 |
| Doylestown, Hosp. Auth. Rev. Bonds, (Doylestown | | | |
| Hosp.), Ser. A | | | |
| 5.00%, 7/1/41 | Baa2 | 600,000 | 630,732 |
| 5.00%, 7/1/25 | Baa3 | 500,000 | 537,035 |
| East Hempfield Twp., Indl. Dev. Auth. Rev. Bonds, | | | |
| (Millersville U. Student Hsg. & Svcs., Inc.) | | | |
| 5.00%, 7/1/34 | Baa3 | 200,000 | 208,580 |
| 5.00%, 7/1/30 | Baa3 | 410,000 | 430,471 |
| Erie, Higher Ed. Bldg. Auth. Rev. Bonds, (Gannon U.) | | | |
| Ser. A, 5.375%, 5/1/30 | BBB+ | 1,000,000 | 1,031,080 |
| 5.00%, 5/1/34 | BBB+ | 750,000 | 802,493 |
|
| Pennsylvania Tax Exempt Income Fund 23 |
| | | |
| MUNICIPAL BONDS AND NOTES (100.0%)*cont. | Rating** | Principal amount | Value |
| Pennsylvaniacont. | | | |
| Erie, Wtr. Auth. Rev. Bonds | | | |
| 5.00%, 12/1/43 | A2 | $1,000,000 | $1,085,630 |
| Ser. A, AGM, 5.00%, 12/1/43 | AA | 1,000,000 | 1,112,180 |
| Franklin Cnty., Indl. Dev. Auth. Rev. Bonds, | | | |
| (Chambersburg Hosp.), 5.375%, 7/1/42 | A2 | 2,000,000 | 2,087,080 |
| Geisinger, Auth. Rev. Bonds, (Geisinger Hlth. Syst.), | | | |
| Ser. A-2, 5.00%, 2/15/39 | Aa2 | 2,155,000 | 2,382,482 |
| Indiana Cnty., Indl. Dev. Auth. Rev. Bonds, (Student | | | |
| Co-op Assn., Inc.), 5.00%, 5/1/33 | A– | 1,000,000 | 1,044,820 |
| Lackawanna Cnty., Indl. Dev. Auth. Rev. Bonds, | | | |
| (Scranton U.), 4.00%, 11/1/40 | A– | 1,500,000 | 1,473,090 |
| Lancaster Cnty., Hosp. & Hlth. Ctr. Auth. Rev. | | | |
| Bonds, (Landis Homes Retirement Cmnty.), Ser. A, | | | |
| 5.00%, 7/1/45 | BBB–/F | 1,000,000 | 1,020,730 |
| Lancaster Cnty., Hosp. Auth. Rev. Bonds | | | |
| (Brethren Village), 5.125%, 7/1/37 | BB+/F | 300,000 | 309,759 |
| (Masonic Villages of the Grand Lodge of PA), | | | |
| 5.00%, 11/1/35 | A | 1,000,000 | 1,072,350 |
| Lancaster Cnty., Hosp. Auth. VRDN, (Masonic | | | |
| Homes), Ser. D, 1.71%, 7/1/34 | A-1 | 1,515,000 | 1,515,000 |
| Lancaster Cnty., Hosp. Auth. Hlth. Facs. Rev. | | | |
| Bonds, (Saint Anne’s Retirement Cmnty., Inc.), | | | |
| 5.00%, 4/1/27 | BB+/F | 1,000,000 | 1,023,280 |
| Lancaster, G.O. Bonds, AGM, 4.00%, 11/1/46 | AA | 1,000,000 | 1,005,710 |
| Lancaster, Indl. Dev. Auth. Rev. Bonds, (Garden Spot | | | |
| Village Obligated Group), 5.375%, 5/1/28 | BBB | 500,000 | 537,130 |
| Langhorne Manor Boro., Higher Edl. & Hlth. Auth. | | | |
| Rev. Bonds, (Woods Svcs.), 5.00%, 11/15/22 | A– | 1,015,000 | 1,097,093 |
| Lehigh Cnty., Gen. Purpose Hosp. Rev. Bonds, | | | |
| (Lehigh Valley Hlth. Network), Ser. A, 5.00%, 7/1/30 | A+ | 350,000 | 391,731 |
| Lehigh Cnty., Indl. Dev. Auth. | | | |
| Mandatory Put Bonds (9/1/22), (Elec. Util. Corp.) | | | |
| Ser. A, 1.80%, 9/1/29 | A1 | 1,000,000 | 961,930 |
| Mandatory Put Bonds (8/15/22), (Elec. Util. Corp.) | | | |
| Ser. B, 1.80%, 2/15/27 | A1 | 1,000,000 | 962,360 |
| Luzerne Cnty., Indl. Dev. Auth. Wtr. Fac. Rev. Bonds, | | | |
| (American Wtr. Co.), 5.50%, 12/1/39 | A1 | 1,250,000 | 1,287,625 |
| Lycoming Cnty., Auth. Rev. Bonds, 5.00%, 5/1/26 | A | 1,000,000 | 1,062,310 |
| Lycoming Cnty., Auth. Hlth. Syst. Rev. Bonds, | | | |
| (Susquehanna Hlth. Syst.), Ser. A, 5.75%, 7/1/39 | A+ | 2,000,000 | 2,044,320 |
| Manheim Twp. School Dist. FRN Mandatory Put | | | |
| Bonds (11/1/21), (Libor Index), Ser. A, 2.034%, 5/1/25 | Aa2 | 1,000,000 | 1,005,290 |
| McKeesport, Muni. Auth. Swr. Rev. Bonds, U.S. Govt. | | | |
| Coll., 5.75%, 12/15/39 (Prerefunded 12/15/19) | A– | 1,750,000 | 1,818,600 |
| Monroe Cnty., Hosp. Auth. Rev. Bonds, (Pocono | | | |
| Med. Ctr.), 5.00%, 7/1/41 | A+ | 1,000,000 | 1,082,220 |
| Montgomery Cnty., Higher Ed. & Hlth. Auth. Rev. | | | |
| Bonds, (Arcadia U.) | | | |
| 5.625%, 4/1/40 | BBB | 1,000,000 | 1,025,660 |
| 5.25%, 4/1/30 | BBB | 1,060,000 | 1,087,369 |
|
| 24 Pennsylvania Tax Exempt Income Fund |
| | | |
| MUNICIPAL BONDS AND NOTES (100.0%)*cont. | Rating** | Principal amount | Value |
| Pennsylvaniacont. | | | |
| Montgomery Cnty., Indl. Auth. Resource Recvy. Rev. | | | |
| Bonds, (Germantown Academy), 4.00%, 10/1/22 | BBB+ | $965,000 | $1,003,137 |
| Montgomery Cnty., Indl. Dev. Auth. Rev. Bonds | | | |
| (Foulkeways at Gwynedd), 5.00%, 12/1/46 | BBB | 1,000,000 | 1,027,020 |
| (Acts Retirement-Life Cmnty.), 5.00%, 11/15/36 | A–/F | 1,500,000 | 1,609,680 |
| (Acts Retirement-Life Cmnty.), 5.00%, 11/15/28 | A–/F | 1,250,000 | 1,320,350 |
| Nazareth Area School Dist. G.O. Bonds, Ser. E | | | |
| 5.00%, 11/15/39 | AA | 500,000 | 552,050 |
| 5.00%, 11/15/38 | AA | 700,000 | 774,242 |
| Northampton Cnty., Gen. Purpose Auth. Rev. Bonds, | | | |
| (Moravian College), 5.00%, 7/1/31 | BBB+ | 500,000 | 529,470 |
| PA Rev. Bonds, (Philadelphia Biosolids Fac.), | | | |
| 6.25%, 1/1/32 | Baa3 | 250,000 | 257,613 |
| PA Cmnwlth. Fin. Auth. Rev. Bonds, Ser. B, AGC, | | | |
| 5.00%, 6/1/31 | AA | 1,500,000 | 1,519,380 |
| PA Econ. Dev. Fin. Auth. Wtr. Fac. Rev. Bonds, | | | |
| (American Wtr. Co.), 6.20%, 4/1/39 | A1 | 1,100,000 | 1,113,937 |
| PA State COP, Ser. A, 5.00%, 7/1/37 | A2 | 1,600,000 | 1,756,304 |
| PA State Econ. Dev. Fin. Auth. Rev. Bonds | | | |
| 5.00%, 12/31/38 | BBB | 1,000,000 | 1,053,390 |
| (PA Bridges Finco LP), 5.00%, 12/31/34 | BBB | 250,000 | 267,365 |
| (Forum PL), 5.00%, 3/1/34 | A2 | 2,000,000 | 2,077,380 |
| (UPMC Oblig. Group), Ser. A, 5.00%, 2/1/34 | A1 | 1,000,000 | 1,094,510 |
| (Unemployment Compensation), Ser. B, | | | |
| 5.00%, 7/1/21 | Aaa | 180,000 | 181,494 |
| PA State Econ. Dev. Fin. Auth. Exempt Fac. Rev. | | | |
| Bonds, (Amtrak), Ser. A, 5.00%, 11/1/32 | A1 | 500,000 | 531,290 |
| PA State Econ. Dev. Fin. Auth. Solid Waste Disp. | | | |
| Mandatory Put Bonds (7/1/19), (Waste Mgt., Inc.), | | | |
| 2.25%, 7/1/41 | A– | 750,000 | 749,018 |
| PA State Econ. Dev. Fin. Auth. Solid Waste | | | |
| Disp. Rev. Bonds | | | |
| (Procter & Gamble Paper), 5.375%, 3/1/31 | AA– | 1,155,000 | 1,365,268 |
| (Waste Mgmt., Inc.), Ser. A, 2.625%, 11/1/21 | A– | 750,000 | 744,690 |
| PA State Fin., Auth. Rev. Bonds, (Penn Hills), Ser. B, | | | |
| AMBAC, zero %, 12/1/27 | AA–/P | 1,000,000 | 719,810 |
| PA State Higher Edl. Fac. Auth. Rev. Bonds | | | |
| (Drexel U.), Ser. A, 5.125%, 5/1/36 | A | 60,000 | 63,263 |
| (Delaware Valley College of Science & Agriculture), | | | |
| Ser. LL1, 5.00%, 11/1/42 | Ba1 | 500,000 | 472,020 |
| (East Stroudsburg U.), 5.00%, 7/1/42 | Baa3 | 700,000 | 705,453 |
| (St. Joseph’s U.), Ser. A, 5.00%, 11/1/40 | A– | 1,000,000 | 1,038,110 |
| (Shippensburg U. Student Svcs.), 5.00%, 10/1/35 | | | |
| (Prerefunded 10/1/22) | BBB– | 250,000 | 275,730 |
| (Temple U.), Ser. 1, 5.00%, 4/1/32 | Aa3 | 500,000 | 535,770 |
| (Thomas Jefferson U.), 5.00%, 3/1/32 | A+ | 500,000 | 538,785 |
| (Temple U.), Ser. 1, 5.00%, 4/1/31 | Aa3 | 1,000,000 | 1,072,200 |
| (Drexel U.), 4.00%, 5/1/34 | A | 2,000,000 | 2,027,800 |
| PA State Hsg. Fin. Agcy. Rev. Bonds | | | |
| Ser. A, 3.95%, 10/1/33 | AA+ | 1,000,000 | 1,003,580 |
| Ser. 15-117A, 3.95%, 10/1/30 | AA+ | 240,000 | 242,354 |
|
| Pennsylvania Tax Exempt Income Fund 25 |
| | | |
| MUNICIPAL BONDS AND NOTES (100.0%)*cont. | Rating** | Principal amount | Value |
| Pennsylvaniacont. | | | |
| PA State Pub. School Bldg. Auth. Rev. Bonds, | | | |
| (Northampton Cnty. Area Cmnty. College | | | |
| Foundation), Ser. A, BAM, 5.00%, 6/15/34 | AA | $1,220,000 | $1,308,767 |
| PA State Tpk. Comm. Rev. Bonds | | | |
| Ser. C, 5.00%, 12/1/44 | A1 | 500,000 | 533,535 |
| (Motor License Fund Enhanced Tpk.), Ser. A, | | | |
| 5.00%, 12/1/42 | A2 | 825,000 | 862,727 |
| (Motor License Fund Enhanced Tpk.), Ser. A, U.S. | | | |
| Govt. Coll., 5.00%, 12/1/42 (Prerefunded 12/1/21) | AAA/P | 175,000 | 189,800 |
| Ser. B-1, 5.00%, 6/1/42 | A3 | 675,000 | 719,192 |
| (Motor License Fund), Ser. A1, U.S. Govt. Coll., | | | |
| 5.00%, 12/1/38 (Prerefunded 12/1/19) | A2 | 2,000,000 | 2,060,820 |
| Ser. 2nd, 5.00%, 12/1/37 | A3 | 1,295,000 | 1,395,039 |
| 5.00%, 6/1/36 | A3 | 2,000,000 | 2,157,900 |
| 5.00%, 12/1/23 ## | A1 | 1,300,000 | 1,410,045 |
| 5.00%, 12/1/22 ## | A1 | 250,000 | 266,880 |
| zero %, 12/1/37 | A2 | 1,000,000 | 935,950 |
| zero %, 12/1/34 | A2 | 2,250,000 | 2,111,040 |
| PA State Tpk. Comm. Oil Franchise Tax Rev. Bonds | | | |
| Ser. B, 5.00%, 12/1/39 | A2 | 1,000,000 | 1,105,120 |
| Ser. B, 5.00%, 12/1/26 | A2 | 500,000 | 576,730 |
| Ser. C, zero %, 12/1/38 | Aa3 | 3,000,000 | 1,296,690 |
| PA State U. Rev. Bonds, Ser. A, 5.00%, 9/1/34 | Aa1 | 1,750,000 | 1,987,860 |
| Philadelphia, G.O. Bonds, Ser. A, 5.00%, 8/1/37 | A2 | 500,000 | 545,435 |
| Philadelphia, Arpt. Rev. Bonds, Ser. D, | | | |
| 5.25%, 6/15/25 | A2 | 1,500,000 | 1,564,050 |
| Philadelphia, Auth for Indl. Dev. City Agreement Rev. | | | |
| Bonds, (Cultural & Coml. Corridors Program), Ser. A, | | | |
| 5.00%, 12/1/31 | A2 | 1,500,000 | 1,663,980 |
| Philadelphia, Auth. for Indl. Dev. Rev. Bonds, (Global | | | |
| Leadership Academy), 6.375%, 11/15/40 | BB | 945,000 | 962,303 |
| Philadelphia, Auth. for Indl. Dev. Hosp. Rev. Bonds, | | | |
| (Children’s Hosp. of Philadelphia), 4.00%, 7/1/35 | Aa2 | 750,000 | 771,323 |
| Philadelphia, Gas Wks. Rev. Bonds | | | |
| Ser. 9th, 5.25%, 8/1/40 | A | 765,000 | 801,230 |
| (1998 Gen. Ordinance), Ser. 15th, 5.00%, 8/1/42 | A | 1,000,000 | 1,089,320 |
| 5.00%, 8/1/33 | A | 1,645,000 | 1,818,120 |
| (1999 Gen. Ordinance), Ser. 14, 5.00%, 10/1/32 | A | 1,300,000 | 1,449,357 |
| Philadelphia, Hosp. & Higher Edl. Fac. Auth. | | | |
| VRDN, (Children’s Hosp. of Philadelphia), Ser. B, | | | |
| 1.72%, 7/1/25 | VMIG 1 | 1,805,000 | 1,805,000 |
| Philadelphia, Redev. Auth. Rev. Bonds, | | | |
| (Transformation Initiative), 5.00%, 4/15/26 | A2 | 1,000,000 | 1,068,130 |
| Philadelphia, School Dist. G.O. Bonds | | | |
| Ser. F, 5.00%, 9/1/36 | A2 | 1,000,000 | 1,088,170 |
| Ser. A, 5.00%, 9/1/34 | A2 | 1,000,000 | 1,093,100 |
| Ser. A, 5.00%, 9/1/33 | A2 | 1,575,000 | 1,754,739 |
| Ser. A, 5.00%, 9/1/32 | A2 | 1,000,000 | 1,119,360 |
| Philadelphia, Wtr. & Waste Wtr. Rev. Bonds | | | |
| Ser. A, 5.00%, 7/1/40 | A1 | 1,500,000 | 1,628,850 |
| 5.00%, 10/1/30 | A1 | 530,000 | 604,608 |
|
| 26 Pennsylvania Tax Exempt Income Fund |
| | | |
| MUNICIPAL BONDS AND NOTES (100.0%)*cont. | Rating** | Principal amount | Value |
| Pennsylvaniacont. | | | |
| Pittsburgh & Allegheny Cnty., Sports & Exhibition | | | |
| Auth. Rev. Bonds, (Pkg. Syst.) | | | |
| 5.00%, 12/15/37 | A– | $1,000,000 | $1,095,000 |
| 5.00%, 12/15/35 | A– | 625,000 | 688,900 |
| 5.00%, 12/15/33 | A– | 1,000,000 | 1,111,180 |
| Pittsburgh, G.O. Bonds | | | |
| 5.00%, 9/1/35 | A1 | 300,000 | 338,196 |
| 5.00%, 9/1/34 | A1 | 550,000 | 622,259 |
| BAM, 5.00%, 9/1/25 | AA | 1,000,000 | 1,132,330 |
| Ser. B, 5.00%, 9/1/25 | A1 | 1,250,000 | 1,365,125 |
| Reading, G.O. Bonds, AGM, U.S. Govt. Coll., 5.00%, | | | |
| 11/1/29 (Prerefunded 11/1/19) | A2 | 2,000,000 | 2,055,900 |
| Reading, School Dist. G.O. Bonds | | | |
| AGM, 5.00%, 3/1/38 | AA | 1,250,000 | 1,382,225 |
| Ser. A, AGM, 5.00%, 2/1/33 | AA | 1,000,000 | 1,103,370 |
| Scranton, School Dist. G.O. Bonds, Ser. E, BAM, | | | |
| 4.00%, 12/1/37 | AA | 1,925,000 | 1,917,377 |
| State College, Area School Dist. G.O. Bonds, | | | |
| 5.00%, 3/15/40 | Aa1 | 750,000 | 826,673 |
| State Pub. School Bldg. Auth. Rev. Bonds, | | | |
| (Harrisburg School Dist.), Ser. A, AGM, | | | |
| 5.00%, 12/1/33 | AA | 750,000 | 837,248 |
| Susquehanna, Area Regl. Arpt. Syst. Auth. Rev. | | | |
| Bonds, Ser. A, 5.00%, 1/1/27 | Baa3 | 350,000 | 376,376 |
| Upper Merion Area School Dist. G.O. Bonds, | | | |
| 5.00%, 1/15/33 | Aa1 | 600,000 | 671,892 |
| West Shore Area Auth. Rev. Bonds, (Lifeways | | | |
| at Messiah Village), Ser. A, 5.00%, 7/1/35 | BBB–/F | 500,000 | 518,685 |
| Westmoreland Cnty., Muni. Auth. Rev. Bonds, BAM, | | | |
| 5.00%, 8/15/27 | AA | 250,000 | 284,020 |
| | | | 148,557,132 |
| Puerto Rico (0.8%) | | | |
| Cmnwlth. of PR, Hwy. & Trans. Auth. Rev. Bonds, | | | |
| Ser. AA, NATL, U.S. Govt. Coll., 5.50%, 7/1/19 | | | |
| (Escrowed to maturity) | Baa2 | 1,200,000 | 1,224,428 |
| | | | 1,224,428 |
| |
| TOTAL INVESTMENTS | |
| Total investments (cost $150,900,117) | $152,841,702 |
Notes to the fund’s portfolio
Unless noted otherwise, the notes to the fund’s portfolio are for the close of the fund’s reporting period, which ran from June 1, 2018 through November 30, 2018 (the reporting period). Within the following notes to the portfolio, references to “Putnam Management” represent Putnam Investment Management, LLC, the fund’s manager, an indirect wholly-owned subsidiary of Putnam Investments, LLC and references to “ASC 820” represent Accounting Standards Codification 820Fair Value Measurements and Disclosures.
*Percentages indicated are based on net assets of $152,869,066.
|
| Pennsylvania Tax Exempt Income Fund 27 |
**The Moody’s, Standard & Poor’s or Fitch ratings indicated are believed to be the most recent ratings available at the close of the reporting period for the securities listed. Ratings are generally ascribed to securities at the time of issuance. While the agencies may from time to time revise such ratings, they undertake no obligation to do so, and the ratings do not necessarily represent what the agencies would ascribe to these securities at the close of the reporting period. Securities rated by Fitch are indicated by “/F.” Securities rated by Putnam are indicated by “/P.” The Putnam rating categories are comparable to the Standard & Poor’s classifications. If a security is insured, it will usually be rated by the ratings organizations based on the financial strength of the insurer. For further details regarding security ratings, please see the Statement of Additional Information.
##Forward commitment, in part or in entirety (Note 1).
On Mandatory Put Bonds, the rates shown are the current interest rates at the close of the reporting period and the dates shown represent the next mandatory put dates. Rates are set by remarketing agents and may take into consideration market supply and demand, credit quality and the current SIFMA Municipal Swap Index, 1 Month US LIBOR or 3 Month US LIBOR rates, which were 1.69%, 2.35% and 2.74%, respectively, as of the close of the reporting period.
The dates shown parenthetically on prerefunded bonds represent the next prerefunding dates.
The dates shown on debt obligations are the original maturity dates.
The fund had the following sector concentrations greater than 10% at the close of the reporting period (as a percentage of net assets):
| | | | | | |
| Health care | 20.9% | | | | | |
| Local debt | 18.3 | | | | | |
| Education | 16.8 | | | | | |
| Utilities | 12.6 | | | | | |
| Transportation | 11.9 | | | | | |
ASC 820 establishes a three-level hierarchy for disclosure of fair value measurements. The valuation hierarchy is based upon the transparency of inputs to the valuation of the fund’s investments. The three levels are defined as follows:
Level 1: Valuations based on quoted prices for identical securities in active markets.
Level 2: Valuations based on quoted prices in markets that are not active or for which all significant inputs are observable, either directly or indirectly.
Level 3: Valuations based on inputs that are unobservable and significant to the fair value measurement.
The following is a summary of the inputs used to value the fund’s net assets as of the close of the reporting period:
| | | |
| | | | Valuation inputs | |
| Investments in securities: | Level 1 | Level 2 | Level 3 |
| Municipal bonds and notes | $— | $152,841,702 | $— |
| Totals by level | $— | $152,841,702 | $— |
The accompanying notes are an integral part of these financial statements.
|
| 28 Pennsylvania Tax Exempt Income Fund |
Statement of assets and liabilities11/30/18 (Unaudited)
| |
| ASSETS | |
| Investment in securities, at value (Note 1): | |
| Unaffiliated issuers (identified cost $150,900,117) | $152,841,702 |
| Cash | 61,582 |
| Interest and other receivables | 2,043,870 |
| Receivable for shares of the fund sold | 73,612 |
| Prepaid assets | 12,120 |
| Total assets | 155,032,886 |
| |
| LIABILITIES | |
| Payable for purchases of delayed delivery securities (Note 1) | 1,672,786 |
| Payable for shares of the fund repurchased | 211,748 |
| Payable for compensation of Manager (Note 2) | 54,462 |
| Payable for custodian fees (Note 2) | 1,949 |
| Payable for investor servicing fees (Note 2) | 19,243 |
| Payable for Trustee compensation and expenses (Note 2) | 80,206 |
| Payable for administrative services (Note 2) | 610 |
| Payable for distribution fees (Note 2) | 62,316 |
| Distributions payable to shareholders | 18,036 |
| Other accrued expenses | 42,464 |
| Total liabilities | 2,163,820 |
| | |
| Net assets | $152,869,066 |
| |
| REPRESENTED BY | |
| Paid-in capital (Unlimited shares authorized) (Notes 1 and 4) | $154,784,079 |
| Total distributable earnings (Note 1) | (1,915,013) |
| Total — Representing net assets applicable to capital shares outstanding | $152,869,066 |
| |
| COMPUTATION OF NET ASSET VALUE AND OFFERING PRICE | |
| Net asset value and redemption price per class A share | |
| ($121,592,489 divided by 13,770,345 shares) | $8.83 |
| Offering price per class A share(100/96.00 of $8.83)* | $9.20 |
| Net asset value and offering price per class B share($1,415,574 divided by 160,586 shares)** | $8.82 |
| Net asset value and offering price per class C share($15,548,602 divided by 1,760,160 shares)** | $8.83 |
| Net asset value and redemption price per class M share($3,537,637 divided by 400,213 shares) | $8.84 |
| Offering price per class M share(100/96.75 of $8.84)† | $9.14 |
| Net asset value, offering price and redemption price per class R6 share | |
| ($203,366 divided by 23,003 shares) | $8.84 |
| Net asset value, offering price and redemption price per class Y share | |
| ($10,571,398 divided by 1,195,714 shares) | $8.84 |
*On single retail sales of less than $100,000. On sales of $100,000 or more the offering price is reduced.
**Redemption price per share is equal to net asset value less any applicable contingent deferred sales charge.
†On single retail sales of less than $50,000. On sales of $50,000 or more the offering price is reduced.
The accompanying notes are an integral part of these financial statements.
|
| Pennsylvania Tax Exempt Income Fund 29 |
Statement of operationsSix months ended 11/30/18 (Unaudited)
| |
| INVESTMENT INCOME | |
| Interest income | $2,962,254 |
| Total investment income | 2,962,254 |
| |
| EXPENSES | |
| Compensation of Manager (Note 2) | 347,572 |
| Investor servicing fees (Note 2) | 59,635 |
| Custodian fees (Note 2) | 3,899 |
| Trustee compensation and expenses (Note 2) | 3,795 |
| Distribution fees (Note 2) | 247,751 |
| Administrative services (Note 2) | 1,842 |
| Other | 63,562 |
| Total expenses | 728,056 |
| Expense reduction (Note 2) | (20,290) |
| Net expenses | 707,766 |
| | |
| Net investment income | 2,254,488 |
| |
| REALIZED AND UNREALIZED GAIN (LOSS) | |
| Net realized gain (loss) on: | |
| Securities from unaffiliated issuers (Notes 1 and 3) | 4,916 |
| Total net realized gain | 4,916 |
| Change in net unrealized appreciation (depreciation) on: | |
| Securities from unaffiliated issuers | (2,664,138) |
| Total change in net unrealized depreciation | (2,664,138) |
| | |
| Net loss on investments | (2,659,222) |
| |
| Net decrease in net assets resulting from operations | $(404,734) |
The accompanying notes are an integral part of these financial statements.
|
| 30 Pennsylvania Tax Exempt Income Fund |
Statement of changes in net assets
| | |
| DECREASE IN NET ASSETS | Six months ended 11/30/18* | Year ended 5/31/18 |
| Operations | | |
| Net investment income | $2,254,488 | $5,092,105 |
| Net realized gain on investments | 4,916 | 2,706,711 |
| Net unrealized depreciation of investments | (2,664,138) | (5,204,193) |
| Net increase (decrease) in net assets resulting | | |
| from operations | (404,734) | 2,594,623 |
| Distributions to shareholders (Note 1): | | |
| From ordinary income | | |
| Taxable net investment income | | |
| Class A | — | (124,493) |
| Class B | — | (2,802) |
| Class C | — | (19,528) |
| Class M | — | (3,519) |
| Class R6 | — | — |
| Class Y | — | (9,079) |
| From tax-exempt net investment income | | |
| Class A | (1,821,790) | (3,942,514) |
| Class B | (19,327) | (61,877) |
| Class C | (178,624) | (440,380) |
| Class M | (46,886) | (102,622) |
| Class R6 | (1,313) | (9) |
| Class Y | (175,033) | (353,592) |
| Decrease from capital share transactions (Note 4) | (12,848,266) | (21,276,204) |
| Total decrease in net assets | (15,495,973) | (23,741,996) |
| |
| NET ASSETS | | |
| Beginning of period | 168,365,039 | 192,107,035 |
| End of period(Note 1) | $152,869,066 | $168,365,039 |
*Unaudited.
The accompanying notes are an integral part of these financial statements.
|
| Pennsylvania Tax Exempt Income Fund 31 |
Financial highlights(For a common share outstanding throughout the period)
| | | | | | | | | | | | | |
| | INVESTMENT OPERATIONS | | | LESS DISTRIBUTIONS | | | | RATIOS AND SUPPLEMENTAL DATA | |
| | | | | | | | | | | | | Ratio of net | |
| | Net asset | | Net realized | | From | | | | | | Ratio | investment | |
| | value, | | and unrealized | Total from | net | | | Net asset | Total return | Net assets, | of expenses | income | Portfolio |
| | beginning | Net investment | gain (loss) | investment | investment | From | Total | value, end | at net asset | end of period | to average | to average | turnover |
| Period ended | of period | income | on investments | operations | income | return of capital | distributions | of period | value (%)a | (in thousands) | net assets (%)b | net assets (%) | (%) |
| Class A | | | | | | | | | | | | | |
| November 30, 2018** | $8.97 | .13 | (.14) | (.01) | (.13) | — | (.13) | $8.83 | (.12)* | $121,592 | .41* | 1.44* | 2* |
| May 31, 2018 | 9.10 | .27 | (.14) | .13 | (.26) | — | (.26) | 8.97 | 1.49 | 132,244 | .82 | 2.94 | 24 |
| May 31, 2017 | 9.34 | .28 | (.24) | .04 | (.28) | — | (.28) | 9.10 | .47 | 149,844 | .83 | 3.10 | 19 |
| May 31, 2016 | 9.20 | .30 | .13 | .43 | (.29) | —c | (.29) | 9.34 | 4.85 | 161,612 | .81d | 3.24d | 12 |
| May 31, 2015 | 9.17 | .31 | .02 | .33 | (.30) | — | (.30) | 9.20 | 3.67 | 161,367 | .78 | 3.32 | 22 |
| May 31, 2014 | 9.44 | .33 | (.27) | .06 | (.33) | — | (.33) | 9.17 | .74 | 164,823 | .79 | 3.67 | 7 |
| Class B | | | | | | | | | | | | | |
| November 30, 2018** | $8.96 | .10 | (.14) | (.04) | (.10) | — | (.10) | $8.82 | (.45)* | $1,416 | .72* | 1.13* | 2* |
| May 31, 2018 | 9.08 | .21 | (.12) | .09 | (.21) | — | (.21) | 8.96 | .97 | 2,111 | 1.44 | 2.32 | 24 |
| May 31, 2017 | 9.32 | .23 | (.24) | (.01) | (.23) | — | (.23) | 9.08 | (.15) | 3,413 | 1.45 | 2.48 | 19 |
| May 31, 2016 | 9.19 | .24 | .13 | .37 | (.24) | —c | (.24) | 9.32 | 4.09 | 4,198 | 1.43d | 2.62d | 12 |
| May 31, 2015 | 9.16 | .25 | .03 | .28 | (.25) | — | (.25) | 9.19 | 3.04 | 4,769 | 1.40 | 2.70 | 22 |
| May 31, 2014 | 9.42 | .27 | (.26) | .01 | (.27) | — | (.27) | 9.16 | .23 | 5,148 | 1.41 | 3.05 | 7 |
| Class C | | | | | | | | | | | | | |
| November 30, 2018** | $8.98 | .09 | (.15) | (.06) | (.09) | — | (.09) | $8.83 | (.62)* | $15,549 | .80* | 1.06* | 2* |
| May 31, 2018 | 9.10 | .20 | (.13) | .07 | (.19) | — | (.19) | 8.98 | .83 | 18,524 | 1.59 | 2.17 | 24 |
| May 31, 2017 | 9.34 | .21 | (.24) | (.03) | (.21) | — | (.21) | 9.10 | (.30) | 23,712 | 1.60 | 2.33 | 19 |
| May 31, 2016 | 9.21 | .23 | .12 | .35 | (.22) | —c | (.22) | 9.34 | 3.93 | 24,531 | 1.58d | 2.47d | 12 |
| May 31, 2015 | 9.17 | .23 | .04 | .27 | (.23) | — | (.23) | 9.21 | 2.99 | 24,676 | 1.55 | 2.55 | 22 |
| May 31, 2014 | 9.44 | .26 | (.27) | (.01) | (.26) | — | (.26) | 9.17 | (.03) | 24,972 | 1.56 | 2.90 | 7 |
| Class M | | | | | | | | | | | | | |
| November 30, 2018** | $8.98 | .12 | (.14) | (.02) | (.12) | — | (.12) | $8.84 | (.26)* | $3,538 | .55* | 1.31* | 2* |
| May 31, 2018 | 9.11 | .24 | (.13) | .11 | (.24) | — | (.24) | 8.98 | 1.22 | 3,815 | 1.09 | 2.67 | 24 |
| May 31, 2017 | 9.35 | .26 | (.24) | .02 | (.26) | — | (.26) | 9.11 | .21 | 4,235 | 1.10 | 2.83 | 19 |
| May 31, 2016 | 9.21 | .27 | .14 | .41 | (.27) | —c | (.27) | 9.35 | 4.56 | 4,181 | 1.08d | 2.97d | 12 |
| May 31, 2015 | 9.18 | .28 | .03 | .31 | (.28) | — | (.28) | 9.21 | 3.39 | 3,816 | 1.05 | 3.05 | 22 |
| May 31, 2014 | 9.44 | .30 | (.26) | .04 | (.30) | — | (.30) | 9.18 | .57 | 3,965 | 1.06 | 3.40 | 7 |
| Class R6 | | | | | | | | | | | | | |
| November 30, 2018** | $8.99 | .14 | (.15) | (.01) | (.14) | — | (.14) | $8.84 | (.08)* | $203 | .29* | 1.57* | 2* |
| May 31, 2018† | 8.93 | .01 | .06 | .07 | (.01) | — | (.01) | 8.99 | .76* | 10 | .02* | .08* | 24 |
| Class Y | | | | | | | | | | | | | |
| November 30, 2018** | $8.99 | .14 | (.15) | (.01) | (.14) | — | (.14) | $8.84 | (.12)* | $10,571 | .30* | 1.56* | 2* |
| May 31, 2018 | 9.11 | .29 | (.13) | .16 | (.28) | — | (.28) | 8.99 | 1.84 | 11,662 | .59 | 3.16 | 24 |
| May 31, 2017 | 9.35 | .31 | (.25) | .06 | (.30) | — | (.30) | 9.11 | .71 | 10,903 | .60 | 3.33 | 19 |
| May 31, 2016 | 9.21 | .32 | .14 | .46 | (.31) | (.01) | (.32) | 9.35 | 5.08 | 8,541 | .58d | 3.47d | 12 |
| May 31, 2015 | 9.18 | .33 | .02 | .35 | (.32) | — | (.32) | 9.21 | 3.90 | 7,859 | .55 | 3.54 | 22 |
| May 31, 2014 | 9.45 | .35 | (.27) | .08 | (.35) | — | (.35) | 9.18 | .97 | 6,744 | .56 | 3.90 | 7 |
See notes to financial highlights at the end of this section.
The accompanying notes are an integral part of these financial statements.
| |
| 32 Pennsylvania Tax Exempt Income Fund | Pennsylvania Tax Exempt Income Fund 33 |
Financial highlightscont.
*Not annualized.
**Unaudited.
†For the period May 22, 2018 (commencement of operations) to May 31, 2018.
aTotal return assumes dividend reinvestment and does not reflect the effect of sales charges.
bIncludes amounts paid through expense offset arrangements, if any (Note 2). Also excludes acquired fund fees and expenses, if any.
cAmount represents less than $0.01 per share.
dReflects a voluntary waiver of certain fund expenses in effect during the period. As a result of such waiver, the expenses of each class reflect a reduction of less than 0.01% as a percentage of average net assets.
The accompanying notes are an integral part of these financial statements.
|
| 34 Pennsylvania Tax Exempt Income Fund |
Notes to financial statements11/30/18 (Unaudited)
Within the following Notes to financial statements, references to “State Street” represent State Street Bank and Trust Company, references to “the SEC” represent the Securities and Exchange Commission, references to “Putnam Management” represent Putnam Investment Management, LLC, the fund’s manager, an indirect wholly-owned subsidiary of Putnam Investments, LLC and references to “OTC”, if any, represent over-the-counter. Unless otherwise noted, the “reporting period” represents the period from June 1, 2018 through November 30, 2018.
Putnam Pennsylvania Tax Exempt Income Fund (the fund) is a Massachusetts business trust, which is registered under the Investment Company Act of 1940, as amended, as a diversified open-end management investment company. The goal of the fund is to seek as high a level of current income exempt from federal income tax and Pennsylvania personal income tax as Putnam Management believes is consistent with preservation of capital. The fund invests mainly in bonds that pay interest that is exempt from federal income tax and Pennsylvania personal income tax (but that may be subject to federal alternative minimum tax (AMT)), are investment-grade in quality, and have intermediate-to long-term maturities (i.e., three years or longer). Under normal circumstances, Putnam Management invests at least 80% of the fund’s net assets in tax-exempt investments. Tax-exempt investments are issued by or for states, territories or possessions of the United States or by their political subdivisions, agencies, authorities or other government entities, and the income from these investments is exempt from both federal and Pennsylvania personal income tax. This investment policy cannot be changed without the approval of the fund’s shareholders. Putnam Management may consider, among other factors, credit, interest rate and prepayment risks, as well as general market conditions, when deciding whether to buy or sell investments.
The fund offers class A, class B, class C, class M, class R6 and class Y shares. Purchases of class B shares are closed to new and existing investors except by exchange from class B shares of another Putnam fund or through dividend and/or capital gains reinvestment. Class A and class M shares are sold with a maximum front-end sales charge of 4.00% and 3.25%, respectively. Class A shares generally are not subject to a contingent deferred sales charge, and class M, class R6 and class Y shares are not subject to a contingent deferred sales charge. Class B shares, which convert to class A shares after approximately eight years, are not subject to a front-end sales charge and are subject to a contingent deferred sales charge if those shares are redeemed within six years of purchase. Class C shares are subject to a one-year 1.00% contingent deferred sales charge and generally convert to class A shares after approximately ten years. The expenses for class A, class B, class C and class M shares may differ based on the distribution fee of each class, which is identified in Note 2. Class R6 and class Y shares, which are sold at net asset value, are generally subject to the same expenses as class A, class B, class C and class M shares, but do not bear a distribution fee, and in the case of class R6 shares, bear a lower investor servicing fee, which is identified in Note 2. Class R6 and class Y shares are not available to all investors.
In the normal course of business, the fund enters into contracts that may include agreements to indemnify another party under given circumstances. The fund’s maximum exposure under these arrangements is unknown as this would involve future claims that may be, but have not yet been, made against the fund. However, the fund’s management team expects the risk of material loss to be remote.
The fund has entered into contractual arrangements with an investment adviser, administrator, distributor, shareholder servicing agent and custodian, who each provide services to the fund. Unless expressly stated otherwise, shareholders are not parties to, or intended beneficiaries of these contractual arrangements, and these contractual arrangements are not intended to create any shareholder right to enforce them against the service providers or to seek any remedy under them against the service providers, either directly or on behalf of the fund.
Under the fund’s Amended and Restated Agreement and Declaration of Trust, any claims asserted against or on behalf of the Putnam Funds, including claims against Trustees and Officers, must be brought in state and federal courts located within the Commonwealth of Massachusetts.
Note 1: Significant accounting policies
The following is a summary of significant accounting policies consistently followed by the fund in the preparation of its financial statements. The preparation of financial statements is in conformity with accounting principles generally accepted in the United States of America and requires management to make estimates and assumptions that affect the reported amounts of assets and liabilities in the financial statements and the reported amounts of increases and decreases in net assets from operations. Actual results could differ from those estimates. Subsequent events after the Statement of assets and liabilities date through the date that the financial statements were issued have been evaluated in the preparation of the financial statements.
|
| Pennsylvania Tax Exempt Income Fund 35 |
Investment income, realized and unrealized gains and losses and expenses of the fund are borne pro-rata based on the relative net assets of each class to the total net assets of the fund, except that each class bears expenses unique to that class (including the distribution fees applicable to such classes). Each class votes as a class only with respect to its own distribution plan or other matters on which a class vote is required by law or determined by the Trustees. If the fund were liquidated, shares of each class would receive their pro-rata share of the net assets of the fund. In addition, the Trustees declare separate dividends on each class of shares.
Security valuationPortfolio securities and other investments are valued using policies and procedures adopted by the Board of Trustees. The Trustees have formed a Pricing Committee to oversee the implementation of these procedures and have delegated responsibility for valuing the fund’s assets in accordance with these procedures to Putnam Management. Putnam Management has established an internal Valuation Committee that is responsible for making fair value determinations, evaluating the effectiveness of the pricing policies of the fund and reporting to the Pricing Committee.
Tax-exempt bonds and notes are generally valued on the basis of valuations provided by an independent pricing service approved by the Trustees. Such services use information with respect to transactions in bonds, quotations from bond dealers, market transactions in comparable securities and various relationships between securities in determining value. These securities will generally be categorized as Level 2.
Certain investments, including certain restricted and illiquid securities and derivatives, are also valued at fair value following procedures approved by the Trustees. To assess the continuing appropriateness of fair valuations, the Valuation Committee reviews and affirms the reasonableness of such valuations on a regular basis after considering all relevant information that is reasonably available. Such valuations and procedures are reviewed periodically by the Trustees. These valuations consider such factors as significant market or specific security events such as interest rate or credit quality changes, various relationships with other securities, discount rates, U.S. Treasury, U.S. swap and credit yields, index levels, convexity exposures, recovery rates, sales and other multiples and resale restrictions. These securities are classified as Level 2 or as Level 3 depending on the priority of the significant inputs. The fair value of securities is generally determined as the amount that the fund could reasonably expect to realize from an orderly disposition of such securities over a reasonable period of time. By its nature, a fair value price is a good faith estimate of the value of a security in a current sale and does not reflect an actual market price, which may be different by a material amount.
Security transactions and related investment incomeSecurity transactions are recorded on the trade date (the date the order to buy or sell is executed). Gains or losses on securities sold are determined on the identified cost basis.
Interest income is recorded on the accrual basis. All premiums/discounts are amortized/accreted on a yield-to-maturity basis. The premium in excess of the call price, if any, is amortized to the call date; thereafter, any remaining premium is amortized to maturity.
Securities purchased or sold on a forward commitment basis may be settled at a future date beyond customary settlement time; interest income is accrued based on the terms of the securities. Losses may arise due to changes in the fair value of the underlying securities or if the counterparty does not perform under the contract.
Interfund lendingThe fund, along with other Putnam funds, may participate in an interfund lending program pursuant to an exemptive order issued by the SEC. This program allows the fund to borrow from other Putnam funds that permit such transactions. Interfund lending transactions are subject to each fund’s investment policies and borrowing and lending limits. Interest earned or paid on the interfund lending transaction will be based on the average of certain current market rates. During the reporting period, the fund did not utilize the program.
Lines of creditThe fund participates, along with other Putnam funds, in a $317.5 million unsecured committed line of credit and a $235.5 million unsecured uncommitted line of credit, both provided by State Street. Borrowings may be made for temporary or emergency purposes, including the funding of shareholder redemption requests and trade settlements. Interest is charged to the fund based on the fund’s borrowing at a rate equal to 1.25% plus the higher of (1) the Federal Funds rate and (2) the overnight LIBOR for the committed line of credit and the Federal Funds rate plus 1.30% for the uncommitted line of credit. A closing fee equal to 0.04% of the committed line of credit and 0.04% of the uncommitted line of credit has been paid by the participating funds. In addition, a commitment fee of 0.21% per annum on any unutilized portion of the committed line of credit is allocated to the participating funds based on their relative net assets and paid quarterly. During the reporting period, the fund had no borrowings against these arrangements.
|
| 36 Pennsylvania Tax Exempt Income Fund |
Federal taxesIt is the policy of the fund to distribute all of its income within the prescribed time period and otherwise comply with the provisions of the Internal Revenue Code of 1986, as amended (the Code), applicable to regulated investment companies. It is also the intention of the fund to distribute an amount sufficient to avoid imposition of any excise tax under Section 4982 of the Code.
The fund is subject to the provisions of Accounting Standards Codification 740Income Taxes(ASC 740). ASC 740 sets forth a minimum threshold for financial statement recognition of the benefit of a tax position taken or expected to be taken in a tax return. The fund did not have a liability to record for any unrecognized tax benefits in the accompanying financial statements. No provision has been made for federal taxes on income, capital gains or unrealized appreciation on securities held nor for excise tax on income and capital gains. Each of the fund’s federal tax returns for the prior three fiscal years remains subject to examination by the Internal Revenue Service.
At May 31, 2018, the fund had a capital loss carryover of $4,235,497 available to the extent allowed by the Code to offset future net capital gain, if any. For any carryover, the amount of the carryover and that carryover’s expiration date is:
| | | |
| | Loss carryover | |
| Short-term | Long-term | Total | Expiration |
| $635,786 | $3,395,342 | $4,031,128 | * |
| 204,369 | N/A | 204,369 | May 31, 2019 |
*Under the Regulated Investment Company Modernization Act of 2010, the fund will be permitted to carry forward capital losses incurred in taxable years beginning after December 22, 2010 for an unlimited period. However, any losses incurred will be required to be utilized prior to the losses incurred in pre-enactment tax years. As a result of this ordering rule, pre-enactment capital loss carryforwards may be more likely to expire unused. Additionally, post-enactment capital losses that are carried forward will retain their character as either short-term or long-term capital losses rather than being considered all short-term as under previous law.
Tax cost of investments includes adjustments to net unrealized appreciation (depreciation) which may not necessarily be final tax cost basis adjustments, but closely approximate the tax basis unrealized gains and losses that may be realized and distributed to shareholders. The aggregate identified cost on a tax basis is $150,859,194, resulting in gross unrealized appreciation and depreciation of $3,610,397 and $1,627,889, respectively, or net unrealized appreciation of $1,982,508.
Distributions to shareholdersIncome dividends are recorded daily by the fund and are paid monthly. Distributions from capital gains, if any, are recorded on the ex-dividend date and paid at least annually. The amount and character of income and gains to be distributed are determined in accordance with income tax regulations which may differ from generally accepted accounting principles. Dividend sources are estimated at the time of declaration. Actual results may vary. Any non-taxable return of capital cannot be determined until final tax calculations are completed after the end of the fund’s fiscal year. Reclassifications are made to the fund’s capital accounts to reflect income and gains available for distribution (or available capital loss carryovers) under income tax regulations.
For the fiscal year ended May 31, 2018, the fund had undistributed net investment income of $321,545.
Note 2: Management fee, administrative services and other transactions
The fund pays Putnam Management a management fee (based on the fund’s average net assets and computed and paid monthly) at annual rates that may vary based on the average of the aggregate net assets of all open-end mutual funds sponsored by Putnam Management (excluding net assets of funds that are invested in, or that are invested in by, other Putnam funds to the extent necessary to avoid “double counting” of those assets). Such annual rates may vary as follows:
| | | | |
| 0.590% | of the first $5 billion, | | 0.390% | of the next $50 billion, |
| 0.540% | of the next $5 billion, | | 0.370% | of the next $50 billion, |
| 0.490% | of the next $10 billion, | | 0.360% | of the next $100 billion and |
| 0.440% | of the next $10 billion, | | 0.355% | of any excess thereafter. |
For the reporting period, the management fee represented an effective rate (excluding the impact from any expense waivers in effect) of 0.216% of the fund’s average net assets.
|
| Pennsylvania Tax Exempt Income Fund 37 |
Putnam Management has contractually agreed, through September 30, 2019, to waive fees and/or reimburse the fund’s expenses to the extent necessary to limit the cumulative expenses of the fund, exclusive of brokerage, interest, taxes, investment-related expenses, extraordinary expenses, acquired fund fees and expenses and payments under the fund’s investor servicing contract, investment management contract and distribution plans, on a fiscal year-to-date basis to an annual rate of 0.20% of the fund’s average net assets over such fiscal year-to-date period. During the reporting period, the fund’s expenses were not reduced as a result of this limit.
Putnam Investments Limited (PIL), an affiliate of Putnam Management, is authorized by the Trustees to manage a separate portion of the assets of the fund as determined by Putnam Management from time to time. PIL did not manage any portion of the assets of the fund during the reporting period. If Putnam Management were to engage the services of PIL, Putnam Management would pay a quarterly sub-management fee to PIL for its services at an annual rate of 0.40% of the average net assets of the portion of the fund managed by PIL.
The fund reimburses Putnam Management an allocated amount for the compensation and related expenses of certain officers of the fund and their staff who provide administrative services to the fund. The aggregate amount of all such reimbursements is determined annually by the Trustees.
Custodial functions for the fund’s assets are provided by State Street. Custody fees are based on the fund’s asset level, the number of its security holdings and transaction volumes.
Putnam Investor Services, Inc., an affiliate of Putnam Management, provides investor servicing agent functions to the fund. Putnam Investor Services, Inc. received fees for investor servicing for class A, class B, class C, class M and class Y shares that included (1) a per account fee for each direct and underlying non-defined contribution account (retail account) of the fund; (2) a specified rate of the fund’s assets attributable to defined contribution plan accounts; and (3) a specified rate based on the average net assets in retail accounts. Putnam Investor Services, Inc. has agreed that the aggregate investor servicing fees for each fund’s retail and defined contribution accounts for these share classes will not exceed an annual rate of 0.25% of the fund’s average assets attributable to such accounts.
Class R6 shares paid a monthly fee based on the average net assets of class R6 shares at an annual rate of 0.05%.
| | | | |
| Class A | $47,111 | | Class R6 | 21 |
| Class B | 642 | | Class Y | 4,196 |
| Class C | 6,323 | | Total | $59,635 |
| Class M | 1,342 | | | |
The fund has entered into expense offset arrangements with Putnam Investor Services, Inc. and State Street whereby Putnam Investor Services, Inc.’s and State Street’s fees are reduced by credits allowed on cash balances. For the reporting period, the fund’s expenses were reduced by $20,290 under the expense offset arrangements.
Each Independent Trustee of the fund receives an annual Trustee fee, of which $111, as a quarterly retainer, has been allocated to the fund, and an additional fee for each Trustees meeting attended. Trustees also are reimbursed for expenses they incur relating to their services as Trustees.
The fund has adopted a Trustee Fee Deferral Plan (the Deferral Plan) which allows the Trustees to defer the receipt of all or a portion of Trustees fees payable on or after July 1, 1995. The deferred fees remain invested in certain Putnam funds until distribution in accordance with the Deferral Plan.
The fund has adopted an unfunded noncontributory defined benefit pension plan (the Pension Plan) covering all Trustees of the fund who have served as a Trustee for at least five years and were first elected prior to 2004. Benefits under the Pension Plan are equal to 50% of the Trustee’s average annual attendance and retainer fees for the three years ended December 31, 2005. The retirement benefit is payable during a Trustee’s lifetime, beginning the year following retirement, for the number of years of service through December 31, 2006. Pension expense for the fund is included in Trustee compensation and expenses in the Statement of operations. Accrued pension liability is included in Payable for Trustee compensation and expenses in the Statement of assets and liabilities. The Trustees have terminated the Pension Plan with respect to any Trustee first elected after 2003.
The fund has adopted distribution plans (the Plans) with respect to the following share classes pursuant to Rule 12b–1 under the Investment Company Act of 1940. The purpose of the Plans is to compensate Putnam Retail Management Limited Partnership, an indirect wholly-owned subsidiary of Putnam Investments, LLC, for services provided and expenses incurred in distributing shares of the fund. The Plans provide payments by the fund to Putnam Retail Management Limited Partnership at an annual rate of up to the following amounts (Maximum %)
|
| 38 Pennsylvania Tax Exempt Income Fund |
of the average net assets attributable to each class. The Trustees have approved payment by the fund at the following annual rate (Approved %) of the average net assets attributable to each class. During the reporting period, the class-specific expenses related to distribution fees were as follows:
| | | |
| | Maximum % | Approved % | Amount |
| Class A | 0.35% | * | $145,826 |
| Class B | 1.00% | 0.85% | 7,383 |
| Class C | 1.00% | 1.00% | 85,477 |
| Class M | 1.00% | 0.50% | 9,065 |
| Total | | | $247,751 |
*Equals the weighted average of (i) 0.20% of the net assets of the fund attributable to class A shares purchased and paid for prior to April 1, 2005 and (ii) 0.25% of all other net assets of the fund attributable to class A shares.
For the reporting period, Putnam Retail Management Limited Partnership, acting as underwriter, received net commissions of $2,173 and $88 from the sale of class A and class M shares, respectively, and received $29 and $59 in contingent deferred sales charges from redemptions of class B and class C shares, respectively.
A deferred sales charge of up to 1.00% is assessed on certain redemptions of class A shares. For the reporting period, Putnam Retail Management Limited Partnership, acting as underwriter, received no monies on class A redemptions.
Note 3: Purchases and sales of securities
During the reporting period, the cost of purchases and the proceeds from sales, excluding short-term investments, were as follows:
| | |
| | Cost of purchases | Proceeds from sales |
| Investments in securities (Long-term) | $3,019,226 | $12,785,350 |
| U.S. government securities (Long-term) | — | — |
| Total | $3,019,226 | $12,785,350 |
The fund may purchase or sell investments from or to other Putnam funds in the ordinary course of business, which can reduce the fund’s transaction costs, at prices determined in accordance with SEC requirements and policies approved by the Trustees. During the reporting period, purchases or sales of long-term securities from or to other Putnam funds, if any, did not represent more than 5% of the fund’s total cost of purchases and/or total proceeds from sales.
Note 4: Capital shares
At the close of the reporting period, there were an unlimited number of shares of beneficial interest authorized. Transactions, including, if applicable, direct exchanges pursuant to share conversions, in capital shares were as follows:
| | | | |
| | SIX MONTHS ENDED 11/30/18 | YEAR ENDED 5/31/18 |
| Class A | Shares | Amount | Shares | Amount |
| Shares sold | 419,288 | $3,723,757 | 624,474 | $5,649,445 |
| Shares issued in connection with | | | | |
| reinvestment of distributions | 184,428 | 1,637,691 | 397,149 | 3,588,874 |
| | 603,716 | 5,361,448 | 1,021,623 | 9,238,319 |
| Shares repurchased | (1,569,129) | (13,923,330) | (2,753,602) | (24,917,934) |
| Net decrease | (965,413) | $(8,561,882) | (1,731,979) | $(15,679,615) |
|
| Pennsylvania Tax Exempt Income Fund 39 |
| | | | |
| | SIX MONTHS ENDED 11/30/18 | YEAR ENDED 5/31/18 |
| Class B | Shares | Amount | Shares | Amount |
| Shares sold | 219 | $1,938 | 3,023 | $26,981 |
| Shares issued in connection with | | | | |
| reinvestment of distributions | 1,863 | 16,533 | 6,806 | 61,453 |
| | 2,082 | 18,471 | 9,829 | 88,434 |
| Shares repurchased | (77,106) | (684,097) | (149,971) | (1,354,219) |
| Net decrease | (75,024) | $(665,626) | (140,142) | $(1,265,785) |
| |
| | SIX MONTHS ENDED 11/30/18 | YEAR ENDED 5/31/18 |
| Class C | Shares | Amount | Shares | Amount |
| Shares sold | 28,006 | $249,312 | 85,108 | $771,548 |
| Shares issued in connection with | | | | |
| reinvestment of distributions | 18,936 | 168,262 | 47,376 | 428,320 |
| | 46,942 | 417,574 | 132,484 | 1,199,868 |
| Shares repurchased | (350,013) | (3,113,068) | (674,158) | (6,097,989) |
| Net decrease | (303,071) | $(2,695,494) | (541,674) | $(4,898,121) |
| |
| | SIX MONTHS ENDED 11/30/18 | YEAR ENDED 5/31/18 |
| Class M | Shares | Amount | Shares | Amount |
| Shares sold | 5,036 | $44,420 | 4,404 | $40,047 |
| Shares issued in connection with | | | | |
| reinvestment of distributions | 3,245 | 28,841 | 7,334 | 66,355 |
| | 8,281 | 73,261 | 11,738 | 106,402 |
| Shares repurchased | (32,736) | (291,697) | (52,082) | (473,324) |
| Net decrease | (24,455) | $(218,436) | (40,344) | $(366,922) |
| |
| | | | FOR THE PERIOD 5/22/18 |
| | | | (COMMENCEMENT OF OPERATIONS) |
| | SIX MONTHS ENDED 11/30/18 | TO 5/31/18 |
| Class R6 | Shares | Amount | Shares | Amount |
| Shares sold | 31,234 | $274,860 | 1,120 | $10,000 |
| Shares issued in connection with | | | | |
| reinvestment of distributions | 154 | 1,363 | 1 | 9 |
| | 31,388 | 276,223 | 1,121 | 10,009 |
| Shares repurchased | (9,506) | (84,021) | — | — |
| Net increase | 21,882 | $192,202 | 1,121 | $10,009 |
| |
| | SIX MONTHS ENDED 11/30/18 | YEAR ENDED 5/31/18 |
| Class Y | Shares | Amount | Shares | Amount |
| Shares sold | 151,403 | $1,352,832 | 408,760 | $3,708,053 |
| Shares issued in connection with | | | | |
| reinvestment of distributions | 16,825 | 149,568 | 33,225 | 300,583 |
| | 168,228 | 1,502,400 | 441,985 | 4,008,636 |
| Shares repurchased | (270,425) | (2,401,430) | (340,843) | (3,084,406) |
| Net increase (decrease) | (102,197) | $(899,030) | 101,142 | $924,230 |
|
| 40 Pennsylvania Tax Exempt Income Fund |
At the close of the reporting period, Putnam Investments, LLC owned the following shares of the fund:
| | | |
| | Shares owned | Percentage of ownership | Value |
| Class R6 | 1,139 | 5% | $10,069 |
Note 5: Market, credit and other risks
In the normal course of business, the fund trades financial instruments and enters into financial transactions where risk of potential loss exists due to changes in the market (market risk) or failure of the contracting party to the transaction to perform (credit risk). The fund may be exposed to additional credit risk that an institution or other entity with which the fund has unsettled or open transactions will default. The fund focuses a majority of its investments in the state of Pennsylvania and may be affected by economic and political developments in that state.
|
| Pennsylvania Tax Exempt Income Fund 41 |
Putnam family of funds
The following is a list of Putnam’s open-end mutual funds offered to the public.Investors should carefully consider the investment objective, risks, charges, and expenses of a fund before investing. For a prospectus, or a summary prospectus if available, containing this and other information for any Putnam fund or product, contact your financial advisor or call Putnam Investor Services at 1-800-225-1581. Please read the prospectus carefully before investing.
| |
| Blend | Value |
| Capital Spectrum Fund | Convertible Securities Fund |
| Emerging Markets Equity Fund | Equity Income Fund |
| Equity Spectrum Fund | International Value Fund |
| Europe Equity Fund | Small Cap Value Fund |
| Global Equity Fund | |
| International Capital Opportunities Fund | Income |
| International Equity Fund | Diversified Income Trust |
| Multi-Cap Core Fund | Floating Rate Income Fund |
| Research Fund | Global Income Trust |
| | Government Money Market Fund* |
| Global Sector | High Yield Fund |
| Global Communications Fund | Income Fund |
| Global Consumer Fund | Money Market Fund† |
| Global Financials Fund | Mortgage Securities Fund |
| Global Health Care Fund | Short Duration Bond Fund |
| Global Industrials Fund | Short Duration Income Fund |
| Global Natural Resources Fund | |
| Global Sector Fund | Tax-free Income |
| Global Technology Fund | AMT-Free Municipal Fund |
| Global Utilities Fund | Intermediate-Term Municipal Income Fund |
| | Short-Term Municipal Income Fund |
| Growth | Tax Exempt Income Fund |
| Growth Opportunities Fund | Tax-Free High Yield Fund |
| International Growth Fund | |
| Small Cap Growth Fund | State tax-free income funds‡: |
| Sustainable Future Fund | California, Massachusetts, Minnesota, |
| Sustainable Leaders Fund | New Jersey, New York, Ohio, and Pennsylvania. |
| | |
|
| 42 Pennsylvania Tax Exempt Income Fund |
| |
| Absolute Return | Asset Allocation |
| Fixed Income Absolute Return Fund | Dynamic Risk Allocation Fund |
| Multi-Asset Absolute Return Fund | George Putnam Balanced Fund |
| | |
| Putnam PanAgora** | Dynamic Asset Allocation Balanced Fund |
| Putnam PanAgora Managed Futures Strategy | Dynamic Asset Allocation Conservative Fund |
| Putnam PanAgora Market Neutral Fund | Dynamic Asset Allocation Growth Fund |
| Putnam PanAgora Risk Parity Fund | |
| | Retirement Income Fund Lifestyle 1 |
| | |
| | RetirementReady® 2060 Fund |
| | RetirementReady® 2055 Fund |
| | RetirementReady® 2050 Fund |
| | RetirementReady® 2045 Fund |
| | RetirementReady® 2040 Fund |
| | RetirementReady® 2035 Fund |
| | RetirementReady® 2030 Fund |
| | RetirementReady® 2025 Fund |
| | RetirementReady® 2020 Fund |
*You could lose money by investing in the fund. Although the fund seeks to preserve the value of your investment at $1.00 per share, it cannot guarantee it will do so. An investment in the fund is not insured or guaranteed by the Federal Deposit Insurance Corporation or any other government agency. The fund’s sponsor has no legal obligation to provide financial support to the fund, and you should not expect that the sponsor will provide financial support to the fund at any time.
†You could lose money by investing in the fund. Although the fund seeks to preserve the value of your investment at $1.00 per share, it cannot guarantee it will do so. The fund may impose a fee upon sale of your shares or may temporarily suspend your ability to sell shares if the fund’s liquidity falls below required minimums because of market conditions or other factors.An investment in the fund is not insured or guaranteed by the Federal Deposit Insurance Corporation or any other government agency. The fund’s sponsor has no legal obligation to provide financial support to the fund, and you should not expect that the sponsor will provide financial support to the fund at any time.
‡Not available in all states.
**Sub-advised by PanAgora Asset Management.
Check your account balances and the most recent month-end performance in the Individual Investors section at putnam.com.
|
| Pennsylvania Tax Exempt Income Fund 43 |
Services for shareholders
Investor services
Systematic investment planTell us how much you wish to invest regularly — weekly, semimonthly, or monthly — and the amount you choose will be transferred automatically from your checking or savings account. There’s no additional fee for this service, and you can suspend it at any time. This plan may be a great way to save for college expenses or to plan for your retirement.
Please note that regular investing does not guarantee a profit or protect against loss in a declining market. Before arranging a systematic investment plan, consider your financial ability to continue making purchases in periods when prices are low.
Systematic exchangeYou can make regular transfers from one Putnam fund to another Putnam fund. There are no additional fees for this service, and you can cancel or change your options at any time.
Dividends PLUSYou can choose to have the dividend distributions from one of your Putnam funds automatically reinvested in another Putnam fund at no additional charge.
Free exchange privilegeYou can exchange money between Putnam funds free of charge, as long as they are the same class of shares. A signature guarantee is required if you are exchanging more than $500,000. The fund reserves the right to revise or terminate the exchange privilege.
Reinstatement privilegeIf you’ve sold Putnam shares or received a check for a dividend or capital gain, you may reinvest the proceeds with Putnam within 90 days of thetransaction and they will be reinvested at the fund’s current net asset value — with no sales charge. However, reinstatement of class B shares may have special tax consequences. Ask your financial or tax representative for details.
Check-writing serviceYou have ready access to many Putnam accounts. It’s as simple as writing a check, and there are no special fees or service charges. For more information about the check-writing service, call Putnam or visit our website.
Dollar cost averagingWhen you’re investing for long-term goals, it’s time, not timing, that counts. Investing on a systematic basis is a better strategy than trying to figure out when the markets will go up or down. This means investing the same amount of money regularly over a long period. This method of investing is called dollar cost averaging. When a fund’s share price declines, your investment dollars buy more shares at lower prices. When it increases, they buy fewer shares. Over time, you will pay a lower average price per share.
For more information
Visit the Individual Investors section at putnam.comA secure section of our website contains complete information on your account, including balances and transactions, updated daily. You may also conduct transactions, such as exchanges, additional investments, and address changes. Log on today to get your password.
Call us toll free at 1-800-225-1581Ask a helpful Putnam representative or your financial advisor for details about any of these or other services, or see your prospectus.
|
| 44 Pennsylvania Tax Exempt Income Fund |
Fund information
Founded over 80 years ago, Putnam Investments was built around the concept that a balance between risk and reward is the hallmark of a well-rounded financial program. We manage funds across income, value, blend, growth, sustainable, asset allocation, absolute return, and global sector categories.
| | |
| Investment Manager | Trustees | Michael J. Higgins |
| Putnam Investment | Kenneth R. Leibler,Chair | Vice President, Treasurer, |
| Management, LLC | Liaquat Ahamed | and Clerk |
| 100 Federal Street | Ravi Akhoury | |
| Boston, MA 02110 | Barbara M. Baumann | Janet C. Smith |
| | Katinka Domotorffy | Vice President, |
| Investment Sub-Advisor | Catharine Bond Hill | Principal Financial Officer, |
| Putnam Investments Limited | Paul L. Joskow | Principal Accounting Officer, |
| 16 St James’s Street | Robert E. Patterson | and Assistant Treasurer |
| London, England SW1A 1ER | George Putnam, III | |
| | Robert L. Reynolds | Susan G. Malloy |
| Marketing Services | Manoj P. Singh | Vice President and |
| Putnam Retail Management | | Assistant Treasurer |
| 100 Federal Street | Officers | |
| Boston, MA 02110 | Robert L. Reynolds | Mark C. Trenchard |
| | President | Vice President and |
| Custodian | | BSA Compliance Officer |
| State Street Bank | Jonathan S. Horwitz | |
| and Trust Company | Executive Vice President, | Nancy E. Florek |
| | Principal Executive Officer, | Vice President, Director of |
| Legal Counsel | and Compliance Liaison | Proxy Voting and Corporate |
| Ropes & Gray LLP | | Governance, Assistant Clerk, |
| | Robert T. Burns | and Assistant Treasurer |
| | Vice President and | |
| | Chief Legal Officer | Denere P. Poulack |
| | | Assistant Vice President, Assistant |
| | James F. Clark | Clerk, and Assistant Treasurer |
| | Vice President and | |
| | Chief Compliance Officer | |
This report is for the information of shareholders of Putnam Pennsylvania Tax Exempt Income Fund. It may also be used as sales literature when preceded or accompanied by the current prospectus, the most recent copy of Putnam’s Quarterly Performance Summary, and Putnam’s Quarterly Ranking Summary. For more recent performance, please visit putnam.com. Investors should carefully consider the investment objectives, risks, charges, and expenses of a fund, which are described in its prospectus. For this and other information or to request a prospectus or summary prospectus, call 1-800-225-1581 toll free. Please read the prospectus carefully before investing. The fund’s Statement of Additional Information contains additional information about the fund’s Trustees and is available without charge upon request by calling 1-800-225-1581.

| |
| Item 3. Audit Committee Financial Expert: |
| |
| Item 4. Principal Accountant Fees and Services: |
| |
| Item 5. Audit Committee of Listed Registrants |
| |
| Item 6. Schedule of Investments: |
| |
| The registrant’s schedule of investments in unaffiliated issuers is included in the report to shareholders in Item 1 above. |
| |
| Item 7. Disclosure of Proxy Voting Policies and Procedures For Closed-End Management Investment Companies: |
| |
| Item 8. Portfolio Managers of Closed-End Investment Companies |
| |
| Item 9. Purchases of Equity Securities by Closed-End Management Investment Companies and Affiliated Purchasers: |
| |
| Item 10. Submission of Matters to a Vote of Security Holders: |
| |
| Item 11. Controls and Procedures: |
| |
| (a) The registrant’s principal executive officer and principal financial officer have concluded, based on their evaluation of the effectiveness of the design and operation of the registrant’s disclosure controls and procedures as of a date within 90 days of the filing date of this report, that the design and operation of such procedures are generally effective to provide reasonable assurance that information required to be disclosed by the registrant in this report is recorded, processed, summarized and reported within the time periods specified in the Commission’s rules and forms. |
| |
| (b) Changes in internal control over financial reporting: Not applicable |
| |
| (a)(2) Separate certifications for the principal executive officer and principal financial officer of the registrant as required by Rule 30a-2(a) under the Investment Company Act of 1940, as amended, are filed herewith. |
| |
| (b) The certifications required by Rule 30a-2(b) under the Investment Company Act of 1940, as amended, are filed herewith. |
| |
| Pursuant to the requirements of the Securities Exchange Act of 1934 and the Investment Company Act of 1940, the registrant has duly caused this report to be signed on its behalf by the undersigned, thereunto duly authorized. |
| |
| Putnam Pennsylvania Tax Exempt Income Fund |
| |
| By (Signature and Title): |
| |
| /s/ Janet C. Smith
Janet C. Smith
Principal Accounting Officer
|
| |
| Pursuant to the requirements of the Securities Exchange Act of 1934 and the Investment Company Act of 1940, this report has been signed below by the following persons on behalf of the registrant and in the capacities and on the dates indicated. |
| |
| By (Signature and Title): |
| |
| /s/ Jonathan S. Horwitz
Jonathan S. Horwitz
Principal Executive Officer
|
| |
| By (Signature and Title): |
| |
| /s/ Janet C. Smith
Janet C. Smith
Principal Financial Officer
|