| | |
| UNITED STATES
SECURITIES AND EXCHANGE COMMISSION |
| | |
| CERTIFIED SHAREHOLDER REPORT OF REGISTERED
MANAGEMENT INVESTMENT COMPANIES
|
| | |
| Investment Company Act file number: | (811-04528) |
| | |
| Exact name of registrant as specified in charter: | Putnam Ohio Tax Exempt Income Fund |
| | |
| Address of principal executive offices: | One Post Office Square, Boston, Massachusetts 02109 |
| | |
| Name and address of agent for service: | Robert T. Burns, Vice President
One Post Office Square
Boston, Massachusetts 02109 |
| | |
| Copy to: | Bryan Chegwidden, Esq.
Ropes & Gray LLP
1211 Avenue of the Americas
New York, New York 10036 |
| | |
| Registrant’s telephone number, including area code: | (617) 292-1000 |
| | |
| Date of fiscal year end: | May 31, 2016 |
| | |
| Date of reporting period: | June 1, 2015 – November 30, 2015 |
| | |
|
Item 1. Report to Stockholders: | |
| | |
| The following is a copy of the report transmitted to stockholders pursuant to Rule 30e-1 under the Investment Company Act of 1940: | |

Putnam Ohio
Tax Exempt
Income Fund
Semiannual report
11 | 30 | 15
| | | |
| Message from the Trustees | 1 | | |
| | |
| About the fund | 2 | | |
| | |
| Performance snapshot | 4 | | |
| | |
| Interview with your fund’s portfolio manager | 5 | | |
| | |
| Your fund’s performance | 12 | | |
| | |
| Your fund’s expenses | 15 | | |
| | |
| Terms and definitions | 17 | | |
| | |
| Other information for shareholders | 18 | | |
| | |
| Trustee approval of management contract | 19 | | |
| | |
| Financial statements | 24 | | |
| | |
Consider these risks before investing: Bond prices may fall or fail to rise over time for several reasons, including general financial market conditions, changing market perceptions of the risk of default, changes in government intervention, and factors related to a specific issuer or industry. These factors may also lead to periods of high volatility and reduced liquidity in the bond markets. Single-state investments are at risk of common economic forces and other factors affecting a state’s tax-exempt investments. This may result in greater losses and volatility. Capital gains, if any, are taxed at the federal and, in most cases, state levels. For some investors, investment income may be subject to the federal alternative minimum tax. Bond investments are subject to interest-rate risk (the risk of bond prices falling if interest rates rise) and credit risk (the risk of an issuer defaulting on interest or principal payments). Interest-rate risk is greater for longer-term bonds, and credit risk is greater for below-investment-grade bonds. Unlike bonds, funds that invest in bonds have fees and expenses. Tax-exempt bonds may be issued under the Internal Revenue Code only by limited types of issuers for limited types of projects. As a result, the fund’s investments may be focused in certain market segments and be more vulnerable to fluctuations in the values of the securities it holds than a more broadly invested fund. Interest the fund receives might be taxable. You can lose money by investing in the fund.
Message from the Trustees
Dear Fellow Shareholder:
Now that the U.S. Federal Reserve has raised interest rates, some degree of uncertainty has lifted. Recent volatility in the markets, however, tells us that the way forward in 2016 will not likely be a straight ascending path.
There are divergent economic conditions around the world. Oil prices continue to drop, putting pressure on the energy sector while helping consumers. U.S. growth appears stable but modest, and Europe continues to be in stimulative mode as it tries to accelerate its recovery. On the other hand, China is decelerating, as emerging markets that are tied to its fortune have experienced losses. Still, these markets may present potential opportunities.
In this changing environment, Putnam’s portfolio managers are persistently working to achieve gains and manage downside risk, relying on a proprietary global research framework to guide their investment decisions. The interview in the following pages provides an overview of your fund’s performance for the reporting period ended November 30, 2015, as well as an outlook for the coming months.
With a new year beginning, it may be time to consult your financial advisor to ensure that your portfolio is aligned with your investment goals, time horizon, and tolerance for risk.
In closing, we would like to recognize Charles Curtis, who recently retired as a Putnam Trustee, for his 14 years of dedicated service. And, as always, thank you for investing with Putnam.


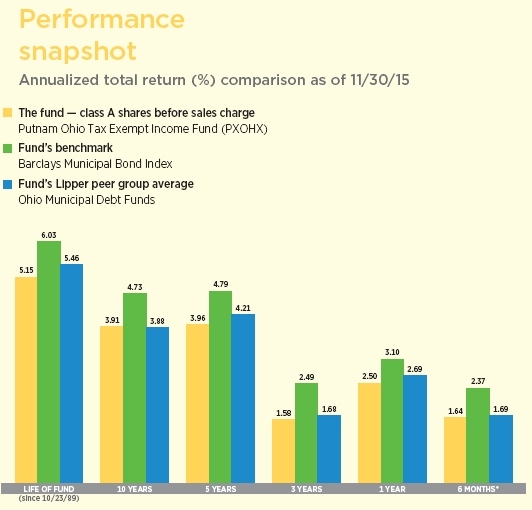
Current performance may be lower or higher than the quoted past performance, which cannot guarantee future results. Share price, principal value, and return will fluctuate, and you may have a gain or a loss when you sell your shares. Performance of class A shares assumes reinvestment of distributions and does not account for taxes. Fund returns in the bar chart do not reflect a sales charge of 4.00%; had they, returns would have been lower. See pages 5 and 12–14 for additional performance information. For a portion of the periods, the fund had expense limitations, without which returns would have been lower. To obtain the most recent month-end performance, visit putnam.com.
* Returns for the six-month period are not annualized, but cumulative.
| |
| 4 | Ohio Tax Exempt Income Fund |
Interview with your fund’s portfolio manager

Thalia, what was the market environment like for municipal bonds during the six-month reporting period ended November 30, 2015?
The market environment proved to be challenging for most asset classes, but municipal bonds performed well on an absolute and a relative basis ��� generally outperforming widely followed benchmarks for U.S. and international fixed-income markets. While expectations for the Federal Reserve’s first interest-rate hike since June 2006 weighed on most bond markets throughout the reporting period, the tax-free, income-producing benefits of municipal bond investing proved to be a strong draw for U.S. income-oriented investors.
The Fed’s intention to begin normalizing U.S. interest rates was complicated by a convergence of global factors — notably, overlapping concerns of economic slowdowns in Europe and China and low commodity prices. Historically low commodity prices were especially noteworthy, as falling oil prices have eased inflationary pressures on the U.S. economy — keeping inflation well below the Fed’s 2% target for price stability. With a nod to those concerns and the stronger U.S. dollar, the central bank left its benchmark rate unchanged during the period.
Favorable supply/demand dynamics [technicals] were generally supportive of municipal bond prices and helped to offset negative
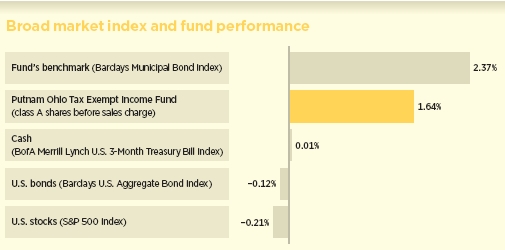
This comparison shows your fund’s performance in the context of broad market indexes for the six months ended 11/30/15. See pages 4 and 12–14 for additional fund performance information. Index descriptions can be found on page 17.
| |
| Ohio Tax Exempt Income Fund | 5 |
pressure from the heightened market volatility and the trend toward slightly higher interest rates in anticipation of Fed action. The supply of municipal bond issuance has been relatively heavy, 24.3% higher on a year-to-date basis through November 2015 compared with the same period in 2014. The bulk of new issuance was earmarked for refinancing activity as municipal issuers took advantage of the low-interest-rate environment to replace their older, higher-coupon bonds with lower-cost debt. Demand held up relatively well despite the heightened volatility, which we believe was largely due to investors’ penchant for attractive income alternatives. Thus, the generally positive technicals combined with the flight to quality that we saw during periods of market uncertainty helped to push interest rates lower and municipal bond prices higher during the period.
Municipal bond flows did turn modestly negative in the third quarter of 2015. We believe this development was more a result of broader market factors rather than fundamentals within the municipal bond market. Credit spreads [the difference in yield between higher- and lower-quality municipal bonds] narrowed a bit during the six-month reporting period, contributing to slightly better returns for lower-quality investments than for higher-quality investments during the reporting period.
How did Putnam Ohio Tax Exempt Income Fund perform in this environment?
The fund delivered positive absolute performance that was roughly in line with the average return of its Lipper peer group but underperformed its benchmark, the Barclays Municipal Bond Index, for the six months ended November 30, 2015.
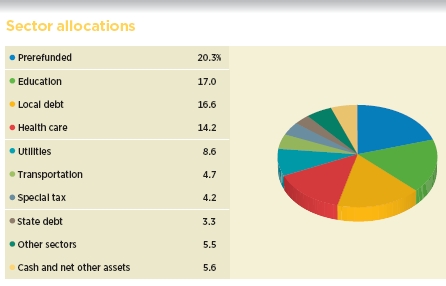
Allocations are shown as a percentage of the fund’s net assets as of 11/30/15. Cash and net other assets, if any, represent the market value weights of cash, derivatives, short-term securities, and other unclassified assets in the portfolio. Summary information may differ from the information in the portfolio schedule notes included in the financial statements due to the inclusion of derivative securities, any interest accruals, and the use of different classifications of securities for presentation purposes. Holdings and allocations may vary over time.
| |
| 6 | Ohio Tax Exempt Income Fund |

What investment strategies influenced the fund’s performance during the reporting period?
We kept the fund’s duration positioning, or interest-rate sensitivity, below the median of its Lipper peer group. We accomplished this posture in part by holding a slightly higher cash position to help shelter the portfolio from price pressures while also providing some liquidity to act swiftly should timely investment opportunities present themselves.
The portfolio retained its overweight exposure to municipal bonds rated Baa relative to the benchmark throughout the period, which was beneficial. We continued to emphasize essential service revenue bonds, which are typically issued by state and local government entities to finance specific revenue-generating projects, and underweighted local general obligation [G.O.] bonds relative to the benchmark. G.O. bonds rely on the taxing power of the issuer and the health of the local economy to make payments from property taxes or sales and income taxes.
We also maintained our underweight exposure to issuers in Puerto Rico relative to the fund’s Lipper peer group, given the Commonwealth’s weak credit fundamentals. However, the fund’s investments in bonds issued by the Commonwealth of Puerto Rico Sales Tax Financing Corporation [COFINA]
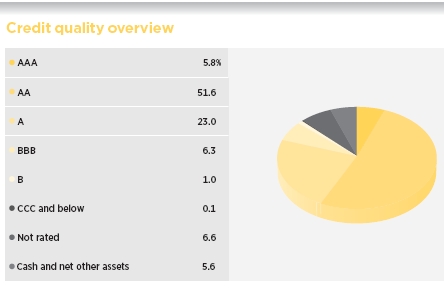
Credit qualities are shown as a percentage of net assets as of 11/30/15. A bond rated BBB or higher (SP-3 or higher, for short-term debt) is considered investment grade. This chart reflects the highest security rating provided by one or more of Standard & Poor’s, Moody’s, and Fitch. Ratings may vary over time.
Cash and net other assets, if any, represent the market value weights of cash, derivatives, and short-term securities in the portfolio. The fund itself has not been rated by an independent rating agency.
| |
| Ohio Tax Exempt Income Fund | 7 |
detracted from results following the governor’s comments in June 2015 that the U.S. island territory was struggling to meet its $72 billion debt burden and that he would seek a moratorium with creditors.
At the sector level, we favored essential service utilities, continuing-care retirement communities, airlines, and higher education bonds relative to the fund’s Lipper peers. Overall, this positioning contributed positively to performance.
The fund’s shorter-duration positioning was a modest detractor to relative performance versus its Lipper peers, as interest rates moved slightly lower during the six-month reporting period. An underweight position in high-yield municipal bonds versus the fund’s Lipper peers also was a headwind for performance, as demand for these bonds helped push prices higher.
The State of Illinois and City of Chicago, as well as Puerto Rico, have been confronting fiscal challenges recently. What does this mean for the municipal bond market?
The overall fiscal health and creditworthiness of the municipal bond market remains sound, in our opinion. High-profile outliers, such as Illinois, Chicago, and Puerto Rico have garnered much media attention, but we still expect overall defaults to remain low. According to Municipal Market Analytics, the default rate stood at approximately 0.1% through November 2015, a fraction of the $3.7 trillion municipal bond market.
Illinois and Chicago are confronting significant pension-funding obligations. As a result of Illinois’s weakening financial position during 2015 and concerns about a prolonged budget stalemate, Moody’s Investors Service downgraded the state’s credit rating from A3 to Baa1 on October 22. We
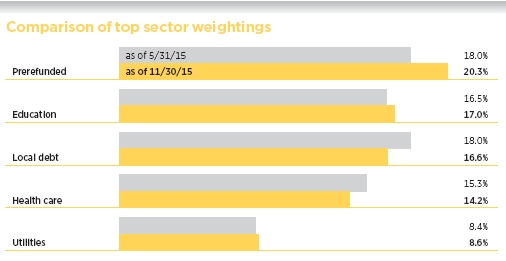
This chart shows how the fund’s top weightings have changed over the past six months. Allocations are shown as a percentage of the fund’s net assets. Current period summary information may differ from the information in the portfolio schedule notes included in the financial statements due to the inclusion of derivative securities, any interest accruals, and the use of different classifications of securities for presentation purposes. Holdings and allocations may vary over time.
| |
| 8 | Ohio Tax Exempt Income Fund |
believe Illinois is facing a growing structural imbalance, but as the fifth most-populous state, it is comparatively wealthy and economically diverse.
In our view, the credit agencies will be looking for state legislators to implement a realistic plan to fund long-term pension obligations and address a buildup of unpaid bills to achieve a sustainable, structurally balanced budget. This past May, Chicago’s bond rating was downgraded to below investment grade by Moody’s, which cited a 2015 Illinois court ruling rejecting state pension reforms — ultimately driving up borrowing costs for the city. However, we believe investors should bear in mind that the various rating agencies have differing views about Chicago’s credit quality. [Chicago still holds investment-grade ratings of A- from Kroll Bond Rating Agency and BBB+ from Standard & Poor’s and Fitch Ratings.] Also, we would suggest that comparisons with Detroit, which filed the largest municipal bankruptcy in U.S. history in 2013, were overstated. In our opinion, the scale of Chicago’s challenges is different, as are the economic and demographic profiles of the two cities. On a positive note, the City of Chicago passed its 2016 budget in late October, which included $170 million in savings and reforms, along with $588 million in increased property taxes.
Puerto Rico’s bonds are widely held for their triple [federal, state, and local] tax-exempt status. After years of crippling government deficits, these bonds have traded at distressed levels for the past two years. This past June, the governor of Puerto Rico announced that the U.S. territory’s outstanding debt was unpayable and called for the Commonwealth to be allowed to restructure. Puerto Rico subsequently defaulted on an August 1 debt payment for the first time in its history. In early September, the governor released a restructuring plan for the Commonwealth to help address the need to close a shortfall of more than an estimated $13 billion over the next five years. Puerto Rico avoided a default on its $355 million Government Development Bank payment on December 1. The next major debt service payment to a number of its creditors is due on January 1. We currently expect negotiations between the various Puerto Rico issuers and individual creditors to continue. [See “In the News” on page 11.]
What should municipal bond investors keep in mind during the coming months?
For much of 2015, investors reacted to the Fed’s long-communicated plans to raise the federal funds rate off its very accommodative near-zero level — adding to the year’s noteworthy market volatility. As the calendar year came to a close, and with the Fed expressing more confidence in the U.S. economy, the central bank raised its benchmark short-term interest rate by 25 basis points, or a quarter of a percentage point, at its December policy meeting. With liftoff finally under way, the Fed communicated that its accommodative monetary policy will remain in place and that the pace of future rate increases is likely to focus on relevant data for the foreseeable future. We believe the Fed is likely to take an approach that is different than in past economic recoveries, introducing gradual rate increases that are dependent on evolving economic conditions that warrant a higher rate environment. With that said, analysts and Fed policymakers held very different views of where the central bank’s benchmark rate will be at the end of 2016.
Yields on fixed-income securities respond to a range of factors, most notably monetary policy and interest-rate expectations, as well as views about inflation, employment, and economic growth. Furthermore, changes in interest rates do not affect all bonds equally. Assuming the Fed tightens interest rates at a reasonable pace and the U.S. economy
| |
| Ohio Tax Exempt Income Fund | 9 |
expands at a measured pace, we believe municipal bond yields are likely to rise accordingly. Since bond yields and bond prices move inversely, we can also reasonably expect to see some commensurate decline in the bonds’ underlying value. In this scenario, we currently do not foresee widespread credit challenges in 2016. On the other hand, should economic growth slow, we believe troubled issuers could face more headwinds.
With the 2016 campaign season in full swing and the presidential candidates more clearly defining their policy agendas, some candidates have discussed individual and corporate tax reform and the elimination of some loopholes and tax deductions. We would caution municipal bond investors from overreacting to discussions about changes to the tax code until after the 2016 election, when it will be clearer if reform is to become a bona fide priority. As we have seen in previous instances, headlines about isolated municipal issuers can lead to investor overreaction and temporary price dislocation. Such price action often results in investment opportunities for Putnam’s Tax Exempt team.
Thank you, Thalia, for your time and insights today.
The views expressed in this report are exclusively those of Putnam Management and are subject to change. They are not meant as investment advice.
Please note that the holdings discussed in this report may not have been held by the fund for the entire period. Portfolio composition is subject to review in accordance with the fund’s investment strategy and may vary in the future. Current and future portfolio holdings are subject to risk. Statements in the Q&A concerning the fund’s performance or portfolio composition relative to those of the fund’s Lipper peer group may reference information produced by Lipper Inc. or through a third party.
Portfolio Manager Thalia Meehan holds a B.A. from Williams College. She joined Putnam in 1989 and has been in the investment industry since 1983.
In addition to Thalia, your fund’s portfolio manager is Paul M. Drury, CFA. Susan A. McCormack, CFA, was part of the management team but left Putnam after the close of your fund’s reporting period.
| |
| 10 | Ohio Tax Exempt Income Fund |
IN THE NEWS
The U.S. Supreme Court has agreed to review a Puerto Rico debt-restructuring law that would allow some public agencies to ask bondholders to accept losses on the securities in the form of lower payments. Puerto Rico finds itself in a nine-year economic slump, struggling with ways to address its fiscal troubles, which include $72 billion in public debt. The Supreme Court may hear arguments as soon as late March of 2016, with a ruling possible by June. For years, Puerto Rico has borrowed heavily despite lackluster economic growth. The high court said in early December that it would hear an appeal by the Commonwealth to reinstate a law that would allow some public agencies to accept lower payments. The law, called the Recovery Act, would affect about $22 billion of Puerto Rico’s $72 billion in debt. A U.S. federal court in Puerto Rico ruled against the law in February 2015, and a U.S. appeals court in July affirmed the decision.
| |
| Ohio Tax Exempt Income Fund | 11 |
Your fund’s performance
This section shows your fund’s performance, price, and distribution information for periods ended November 30, 2015, the end of the first half of its current fiscal year. In accordance with regulatory requirements for mutual funds, we also include performance information as of the most recent calendar quarter-end and expense information taken from the fund’s current prospectus. Performance should always be considered in light of a fund’s investment strategy. Data represent past performance. Past performance does not guarantee future results. More recent returns may be less or more than those shown. Investment return and principal value will fluctuate, and you may have a gain or a loss when you sell your shares. Performance information does not reflect any deduction for taxes a shareholder may owe on fund distributions or on the redemption of fund shares. For the most recent month-end performance, please visit the Individual Investors section at putnam.com or call Putnam at 1-800-225-1581. Class Y shares are not available to all investors. See the Terms and Definitions section in this report for definitions of the share classes offered by your fund.
Fund performance Total return for periods ended 11/30/15
| | | | | | | | | |
| | Class A | Class B | Class C | Class M | Class Y |
| (inception dates) | (10/23/89) | (7/15/93) | (10/3/06) | (4/3/95) | (1/2/08) |
|
| | Before | After | | | | | Before | After | Net |
| | sales | sales | Before | After | Before | After | sales | sales | asset |
| | charge | charge | CDSC | CDSC | CDSC | CDSC | charge | charge | value |
|
| Annual average | | | | | | | | | |
| (life of fund) | 5.15% | 4.98% | 4.90% | 4.90% | 4.35% | 4.35% | 4.81% | 4.68% | 5.22% |
|
| 10 years | 46.71 | 40.84 | 39.46 | 39.46 | 35.87 | 35.87 | 42.52 | 37.89 | 49.46 |
| Annual average | 3.91 | 3.48 | 3.38 | 3.38 | 3.11 | 3.11 | 3.61 | 3.27 | 4.10 |
|
| 5 years | 21.46 | 16.60 | 17.61 | 15.61 | 16.71 | 16.71 | 19.66 | 15.77 | 22.81 |
| Annual average | 3.96 | 3.12 | 3.30 | 2.94 | 3.14 | 3.14 | 3.65 | 2.97 | 4.19 |
|
| 3 years | 4.81 | 0.62 | 2.87 | 0.02 | 2.40 | 2.40 | 3.95 | 0.57 | 5.52 |
| Annual average | 1.58 | 0.21 | 0.95 | 0.01 | 0.79 | 0.79 | 1.30 | 0.19 | 1.81 |
|
| 1 year | 2.50 | –1.60 | 1.86 | –3.10 | 1.70 | 0.71 | 2.10 | –1.22 | 2.73 |
|
| 6 months | 1.64 | –2.43 | 1.32 | –3.68 | 1.24 | 0.24 | 1.38 | –1.91 | 1.75 |
|
Current performance may be lower or higher than the quoted past performance, which cannot guarantee future results. After-sales-charge returns for class A and M shares reflect the deduction of the maximum 4.00% and 3.25% sales charge, respectively, levied at the time of purchase. Class B share returns after contingent deferred sales charge (CDSC) reflect the applicable CDSC, which is 5% in the first year, declining over time to 1% in the sixth year, and is eliminated thereafter. Class C share returns after CDSC reflect a 1% CDSC for the first year that is eliminated thereafter. Class Y shares have no initial sales charge or CDSC. Performance for class B, C, M, and Y shares before their inception is derived from the historical performance of class A shares, adjusted for the applicable sales charge (or CDSC) and the higher operating expenses for such shares, except for class Y shares, for which 12b-1 fees are not applicable.
For a portion of the periods, the fund had expense limitations, without which returns would have been lower.
Class B share performance reflects conversion to class A shares after eight years.
| |
| 12 | Ohio Tax Exempt Income Fund |
Fund price and distribution information For the six-month period ended 11/30/15
| | | | | | | |
| Distributions | Class A | Class B | Class C | Class M | Class Y |
|
| Number | 6 | 6 | 6 | 6 | 6 |
|
| Income 1 | $0.146983 | $0.118411 | $0.111518 | $0.134392 | $0.157263 |
|
| Capital gains 2 | — | — | — | — | — |
|
| Total | $0.146983 | $0.118411 | $0.111518 | $0.134392 | $0.157263 |
|
| | Before | After | Net | Net | Before | After | Net |
| | sales | sales | asset | asset | sales | sales | asset |
| Share value | charge | charge | value | value | charge | charge | value |
|
| 5/31/15 | $9.07 | $9.45 | $9.06 | $9.07 | $9.08 | $9.39 | $9.08 |
|
| 11/30/15 | 9.07 | 9.45 | 9.06 | 9.07 | 9.07 | 9.37 | 9.08 |
|
| | Before | After | Net | Net | Before | After | Net |
| | sales | sales | asset | asset | sales | sales | asset |
| Current rate (end of period) | charge | charge | value | value | charge | charge | value |
|
| Current dividend rate 3 | 3.20% | 3.07% | 2.58% | 2.42% | 2.92% | 2.83% | 3.42% |
|
| Taxable equivalent 4 | 5.97 | 5.73 | 4.82 | 4.52 | 5.45 | 5.28 | 6.38 |
|
| Current 30-day SEC yield 5 | N/A | 1.46 | 0.90 | 0.76 | N/A | 1.21 | 1.75 |
|
| Taxable equivalent 4 | N/A | 2.72 | 1.68 | 1.42 | N/A | 2.26 | 3.27 |
|
The classification of distributions, if any, is an estimate. Before-sales-charge share value and current dividend rate for class A and M shares, if applicable, do not take into account any sales charge levied at the time of purchase. After-sales-charge share value, current dividend rate, and current 30-day SEC yield, if applicable, are calculated assuming that the maximum sales charge (4.00% for class A shares and 3.25% for class M shares) was levied at the time of purchase. Final distribution information will appear on your year-end tax forms.
1 For some investors, investment income may be subject to the federal alternative minimum tax.
2 Capital gains, if any, are taxable for federal and, in most cases, state purposes.
3 Most recent distribution, including any return of capital and excluding capital gains, annualized and divided by share price before or after sales charge at period-end.
4 Assumes maximum 46.42% federal and state combined tax rate for 2015. Results for investors subject to lower tax rates would not be as advantageous.
5 Based only on investment income and calculated using the maximum offering price for each share class, in accordance with SEC guidelines.
| |
| Ohio Tax Exempt Income Fund | 13 |
Comparative index returns For periods ended 11/30/15
| | |
| | Barclays Municipal | Lipper Ohio Municipal Debt |
| | Bond Index | Funds category average* |
|
| Annual average (life of fund) | 6.03% | 5.46% |
|
| 10 years | 58.75 | 46.47 |
| Annual average | 4.73 | 3.88 |
|
| 5 years | 26.36 | 23.00 |
| Annual average | 4.79 | 4.21 |
|
| 3 years | 7.66 | 5.14 |
| Annual average | 2.49 | 1.68 |
|
| 1 year | 3.10 | 2.69 |
|
| 6 months | 2.37 | 1.69 |
|
Index and Lipper results should be compared with fund performance before sales charge, before CDSC, or at net asset value.
* Over the 6-month, 1-year, 3-year, 5-year, 10-year, and life-of-fund periods ended 11/30/15, there were 33, 33, 30, 29, 20, and 6 funds, respectively, in this Lipper category.
Fund performance as of most recent calendar quarter
Total return for periods ended 12/31/15
| | | | | | | | | |
| | Class A | Class B | Class C | Class M | Class Y |
| (inception dates) | (10/23/89) | (7/15/93) | (10/3/06) | (4/3/95) | (1/2/08) |
|
| | Before | After | | | | | Before | After | Net |
| | sales | sales | Before | After | Before | After | sales | sales | asset |
| | charge | charge | CDSC | CDSC | CDSC | CDSC | charge | charge | value |
|
| Annual average | | | | | | | | | |
| (life of fund) | 5.16% | 4.99% | 4.91% | 4.91% | 4.36% | 4.36% | 4.82% | 4.69% | 5.23% |
|
| 10 years | 46.59 | 40.72 | 39.35 | 39.35 | 35.75 | 35.75 | 42.41 | 37.78 | 49.36 |
| Annual average | 3.90 | 3.48 | 3.37 | 3.37 | 3.10 | 3.10 | 3.60 | 3.26 | 4.09 |
|
| 5 years | 24.81 | 19.82 | 21.00 | 19.00 | 20.07 | 20.07 | 22.96 | 18.96 | 26.19 |
| Annual average | 4.53 | 3.68 | 3.89 | 3.54 | 3.73 | 3.73 | 4.22 | 3.53 | 4.76 |
|
| 3 years | 6.71 | 2.44 | 4.74 | 1.84 | 4.26 | 4.26 | 5.83 | 2.39 | 7.54 |
| Annual average | 2.19 | 0.81 | 1.55 | 0.61 | 1.40 | 1.40 | 1.91 | 0.79 | 2.45 |
|
| 1 year | 2.47 | –1.63 | 1.83 | –3.13 | 1.68 | 0.68 | 2.18 | –1.14 | 2.69 |
|
| 6 months | 2.50 | –1.60 | 2.29 | –2.71 | 2.10 | 1.10 | 2.36 | –0.97 | 2.73 |
|
See the discussion following the fund performance table on page 12 for information about the calculation of fund performance.
| |
| 14 | Ohio Tax Exempt Income Fund |
Your fund’s expenses
As a mutual fund investor, you pay ongoing expenses, such as management fees, distribution fees (12b-1 fees), and other expenses. Using the following information, you can estimate how these expenses affect your investment and compare them with the expenses of other funds. You may also pay one-time transaction expenses, including sales charges (loads) and redemption fees, which are not shown in this section and would have resulted in higher total expenses. For more information, see your fund’s prospectus or talk to your financial representative.
Expense ratios
| | | | | |
| | Class A | Class B | Class C | Class M | Class Y |
|
| Total annual operating expenses for the fiscal | | | | | |
| year ended 5/31/15 | 0.80% | 1.42% | 1.57% | 1.07% | 0.57% |
|
| Annualized expense ratio for the six-month | | | | | |
| period ended 11/30/15 | 0.82% | 1.44% | 1.59% | 1.09% | 0.59% |
|
Fiscal-year expense information in this table is taken from the most recent prospectus, is subject to change, and may differ from that shown for the annualized expense ratio and in the financial highlights of this report.
Expenses are shown as a percentage of average net assets.
Expenses per $1,000
The following table shows the expenses you would have paid on a $1,000 investment in each class of the fund from 6/1/15 to 11/30/15. It also shows how much a $1,000 investment would be worth at the close of the period, assuming actual returns and expenses.
| | | | | |
| | Class A | Class B | Class C | Class M | Class Y |
|
| Expenses paid per $1,000*† | $4.13 | $7.25 | $8.00 | $5.49 | $2.98 |
|
| Ending value (after expenses) | $1,016.40 | $1,013.20 | $1,012.40 | $1,013.80 | $1,017.50 |
|
* Expenses for each share class are calculated using the fund’s annualized expense ratio for each class, which represents the ongoing expenses as a percentage of average net assets for the six months ended 11/30/15. The expense ratio may differ for each share class.
† Expenses are calculated by multiplying the expense ratio by the average account value for the period; then multiplying the result by the number of days in the period; and then dividing that result by the number of days in the year.
| |
| Ohio Tax Exempt Income Fund | 15 |
Estimate the expenses you paid
To estimate the ongoing expenses you paid for the six months ended 11/30/15, use the following calculation method. To find the value of your investment on 6/1/15, call Putnam at 1-800-225-1581.

Compare expenses using the SEC’s method
The Securities and Exchange Commission (SEC) has established guidelines to help investors assess fund expenses. Per these guidelines, the following table shows your fund’s expenses based on a $1,000 investment, assuming a hypothetical 5% annualized return. You can use this information to compare the ongoing expenses (but not transaction expenses or total costs) of investing in the fund with those of other funds. All mutual fund shareholder reports will provide this information to help you make this comparison. Please note that you cannot use this information to estimate your actual ending account balance and expenses paid during the period.
| | | | | |
| | Class A | Class B | Class C | Class M | Class Y |
|
| Expenses paid per $1,000*† | $4.14 | $7.26 | $8.02 | $5.50 | $2.98 |
|
| Ending value (after expenses) | $1,020.90 | $1,017.80 | $1,017.05 | $1,019.55 | $1,022.05 |
|
* Expenses for each share class are calculated using the fund’s annualized expense ratio for each class, which represents the ongoing expenses as a percentage of average net assets for the six months ended 11/30/15. The expense ratio may differ for each share class.
† Expenses are calculated by multiplying the expense ratio by the average account value for the six-month period; then multiplying the result by the number of days in the six-month period; and then dividing that result by the number of days in the year.
| |
| 16 | Ohio Tax Exempt Income Fund |
Terms and definitions
Important terms
Total return shows how the value of the fund’s shares changed over time, assuming you held the shares through the entire period and reinvested all distributions in the fund.
Before sales charge, or net asset value, is the price, or value, of one share of a mutual fund, without a sales charge. Before-sales-charge figures fluctuate with market conditions, and are calculated by dividing the net assets of each class of shares by the number of outstanding shares in the class.
After sales charge is the price of a mutual fund share plus the maximum sales charge levied at the time of purchase. After-sales-charge performance figures shown here assume the 4.00% maximum sales charge for class A shares and 3.25% for class M shares.
Contingent deferred sales charge (CDSC) is generally a charge applied at the time of the redemption of class B or C shares and assumes redemption at the end of the period. Your fund’s class B CDSC declines over time from a 5% maximum during the first year to 1% during the sixth year. After the sixth year, the CDSC no longer applies. The CDSC for class C shares is 1% for one year after purchase.
Share classes
Class A shares are generally subject to an initial sales charge and no CDSC (except on certain redemptions of shares bought without an initial sales charge).
Class B shares are not subject to an initial sales charge and may be subject to a CDSC.
Class C shares are not subject to an initial sales charge and are subject to a CDSC only if the shares are redeemed during the first year.
Class M shares have a lower initial sales charge and a higher 12b-1 fee than class A shares and no CDSC.
Class Y shares are not subject to an initial sales charge or CDSC, and carry no 12b-1 fee. They are generally only available to corporate and institutional clients and clients in other approved programs.
Fixed-income terms
Current rate is the annual rate of return earned from dividends or interest of an investment. Current rate is expressed as a percentage of the price of a security, fund share, or principal investment.
Yield curve is a graph that plots the yields of bonds with equal credit quality against their differing maturity dates, ranging from shortest to longest. It is used as a benchmark for other debt, such as mortgage or bank lending rates.
Comparative indexes
Barclays Municipal Bond Index is an unmanaged index of long-term fixed-rate investment-grade tax-exempt bonds.
Barclays U.S. Aggregate Bond Index is an unmanaged index of U.S. investment-grade fixed-income securities.
BofA Merrill Lynch U.S. 3-Month Treasury Bill Index is an unmanaged index that seeks to measure the performance of U.S. Treasury bills available in the marketplace.
S&P 500 Index is an unmanaged index of common stock performance.
Indexes assume reinvestment of all distributions and do not account for fees. Securities and performance of a fund and an index will differ. You cannot invest directly in an index.
Lipper is a third-party industry-ranking entity that ranks mutual funds. Its rankings
| |
| Ohio Tax Exempt Income Fund | 17 |
do not reflect sales charges. Lipper rankings are based on total return at net asset value relative to other funds that have similar current investment styles or objectives as determined by Lipper. Lipper may change a fund’s category assignment at its discretion. Lipper category averages reflect performance trends for funds within a category.
Other information for shareholders
Important notice regarding delivery of shareholder documents
In accordance with Securities and Exchange Commission (SEC) regulations, Putnam sends a single copy of annual and semiannual shareholder reports, prospectuses, and proxy statements to Putnam shareholders who share the same address, unless a shareholder requests otherwise. If you prefer to receive your own copy of these documents, please call Putnam at 1-800-225-1581, and Putnam will begin sending individual copies within 30 days.
Proxy voting
Putnam is committed to managing our mutual funds in the best interests of our shareholders. The Putnam funds’ proxy voting guidelines and procedures, as well as information regarding how your fund voted proxies relating to portfolio securities during the 12-month period ended June 30, 2015, are available in the Individual Investors section of putnam.com, and on the SEC’s website, www.sec.gov. If you have questions about finding forms on the SEC’s website, you may call the SEC at 1-800-SEC-0330. You may also obtain the Putnam funds’ proxy voting guidelines and procedures at no charge by calling Putnam’s Shareholder Services at 1-800-225-1581.
Fund portfolio holdings
The fund will file a complete schedule of its portfolio holdings with the SEC for the first and third quarters of each fiscal year on Form N-Q. Shareholders may obtain the fund’s Form N-Q on the SEC’s website at www.sec.gov. In addition, the fund’s Form N-Q may be reviewed and copied at the SEC’s Public Reference Room in Washington, D.C. You may call the SEC at 1-800-SEC-0330 for information about the SEC’s website or the operation of the Public Reference Room.
Trustee and employee fund ownership
Putnam employees and members of the Board of Trustees place their faith, confidence, and, most importantly, investment dollars in Putnam mutual funds. As of November 30, 2015, Putnam employees had approximately $500,000,000 and the Trustees had approximately $137,000,000 invested in Putnam mutual funds. These amounts include investments by the Trustees’ and employees’ immediate family members as well as investments through retirement and deferred compensation plans.
| |
| 18 | Ohio Tax Exempt Income Fund |
Trustee approval of management contract
General conclusions
The Board of Trustees of The Putnam Funds oversees the management of each fund and, as required by law, determines annually whether to approve the continuance of your fund’s management contract with Putnam Investment Management, LLC (“Putnam Management”) and the sub-management contract with respect to your fund between Putnam Management and its affiliate, Putnam Investments Limited (“PIL”). The Board, with the assistance of its Contract Committee, requests and evaluates all information it deems reasonably necessary under the circumstances in connection with its annual contract review. The Contract Committee consists solely of Trustees who are not “interested persons” (as this term is defined in the Investment Company Act of 1940, as amended (the “1940 Act”)) of The Putnam Funds (“Independent Trustees”).
At the outset of the review process, members of the Board’s independent staff and independent legal counsel met with representatives of Putnam Management to review the annual contract review materials furnished to the Contract Committee during the course of the previous year’s review and to discuss possible changes in these materials that might be necessary or desirable for the coming year. Following these discussions and in consultation with the Contract Committee, the Independent Trustees’ independent legal counsel requested that Putnam Management and its affiliates furnish specified information, together with any additional information that Putnam Management considered relevant, to the Contract Committee. Over the course of several months ending in June 2015, the Contract Committee met on a number of occasions with representatives of Putnam Management, and separately in executive session, to consider the information that Putnam Management provided, as well as supplemental information provided in response to additional requests made by the Contract Committee. Throughout this process, the Contract Committee was assisted by the members of the Board’s independent staff and by independent legal counsel for The Putnam Funds and the Independent Trustees.
In May 2015, the Contract Committee met in executive session to discuss and consider its recommendations with respect to the continuance of the contracts. At the Trustees’ June 19, 2015 meeting, the Contract Committee met in executive session with the other Independent Trustees to review a summary of the key financial, performance and other data that the Contract Committee considered in the course of its review. The Contract Committee then presented its written report, which summarized the key factors that the Committee had considered and set forth its recommendations. The Contract Committee then recommended, and the Independent Trustees approved, the continuance of your fund’s management and sub-management contracts, effective July 1, 2015. (Because PIL is an affiliate of Putnam Management and Putnam Management remains fully responsible for all services provided by PIL, the Trustees have not attempted to evaluate PIL as a separate entity, and all subsequent references to Putnam Management below should be deemed to include reference to PIL as necessary or appropriate in the context.)
The Independent Trustees’ approval was based on the following conclusions:
• That the fee schedule in effect for your fund represented reasonable compensation in light of the nature and quality of the services being provided to the fund, the fees paid by competitive funds, the costs incurred by Putnam Management in providing services to the
| |
| Ohio Tax Exempt Income Fund | 19 |
fund, and the continued application of certain reductions and waivers noted below; and
• That the fee schedule in effect for your fund represented an appropriate sharing between fund shareholders and Putnam Management of such economies of scale as may exist in the management of the fund at current asset levels.
These conclusions were based on a comprehensive consideration of all information provided to the Trustees and were not the result of any single factor. Some of the factors that figured particularly in the Trustees’ deliberations and how the Trustees considered these factors are described below, although individual Trustees may have evaluated the information presented differently, giving different weights to various factors. It is also important to recognize that the management arrangements for your fund and the other Putnam funds are the result of many years of review and discussion between the Independent Trustees and Putnam Management, that some aspects of the arrangements may receive greater scrutiny in some years than others, and that the Trustees’ conclusions may be based, in part, on their consideration of fee arrangements in previous years. For example, with some minor exceptions, the funds’ current fee arrangements were implemented at the beginning of 2010 following extensive review by the Contract Committee and discussions with representatives of Putnam Management, as well as approval by shareholders.
Management fee schedules and total expenses
The Trustees reviewed the management fee schedules in effect for all Putnam funds, including fee levels and breakpoints. The Trustees also reviewed the total expenses of each Putnam fund, recognizing that in most cases management fees represented the major, but not the sole, determinant of total costs to shareholders. In reviewing fees and expenses, the Trustees generally focus their attention on material changes in circumstances — for example, changes in assets under management, changes in a fund’s investment style, changes in Putnam Management’s operating costs or profitability, or changes in competitive practices in the mutual fund industry — that suggest that consideration of fee changes might be warranted. The Trustees concluded that the circumstances did not warrant changes to the management fee structure of your fund.
Under its management contract, your fund has the benefit of breakpoints in its management fee schedule that provide shareholders with economies of scale in the form of reduced fee levels as assets under management in the Putnam family of funds increase. The Trustees concluded that the fee schedule in effect for your fund represented an appropriate sharing of economies of scale between fund shareholders and Putnam Management.
As in the past, the Trustees also focused on the competitiveness of each fund’s total expense ratio. In order to support the effort to have fund expenses meet competitive standards, the Trustees and Putnam Management have implemented certain expense limitations. These expense limitations were: (i) a contractual expense limitation applicable to all retail open-end funds of 32 basis points on investor servicing fees and expenses and (ii) a contractual expense limitation applicable to your fund and all but two of the other open-end funds of 20 basis points on so-called “other expenses” (i.e., all expenses exclusive of management fees, distribution fees, investor servicing fees, investment-related expenses, interest, taxes, brokerage commissions, acquired fund fees and expenses and extraordinary expenses). These expense limitations attempt to maintain competitive expense levels for funds with large numbers of small shareholder accounts and funds with relatively small net assets. Most
| |
| 20 | Ohio Tax Exempt Income Fund |
funds, including your fund, had sufficiently low expenses that these expense limitations were not operative. Putnam Management’s support for these expense limitation arrangements was an important factor in the Trustees’ decision to approve the continuance of your fund’s management and sub-management contracts.
The Trustees reviewed comparative fee and expense information for a custom group of competitive funds selected by Lipper Inc. (“Lipper”). This comparative information included your fund’s percentile ranking for effective management fees and total expenses (excluding any applicable 12b-1 fee), which provides a general indication of your fund’s relative standing. In the custom peer group, your fund ranked in the first quintile in effective management fees (determined for your fund and the other funds in the custom peer group based on fund asset size and the applicable contractual management fee schedule) and in the third quintile in total expenses (excluding any applicable 12b-1 fees) as of December 31, 2014 (the first quintile representing the least expensive funds and the fifth quintile the most expensive funds). The fee and expense data reported by Lipper as of December 31, 2014 reflected the most recent fiscal year-end data available in Lipper’s database at that time.
In connection with their review of fund management fees and total expenses, the Trustees also reviewed the costs of the services provided and the profits realized by Putnam Management and its affiliates from their contractual relationships with the funds. This information included trends in revenues, expenses and profitability of Putnam Management and its affiliates relating to the investment management, investor servicing and distribution services provided to the funds. In this regard, the Trustees also reviewed an analysis of Putnam Management’s revenues, expenses and profitability, allocated on a fund-by-fund basis, with respect to the funds’ management, distribution, and investor servicing contracts. For each fund, the analysis presented information about revenues, expenses and profitability for each of the agreements separately and for the agreements taken together on a combined basis. The Trustees concluded that, at current asset levels, the fee schedules in place represented reasonable compensation for the services being provided and represented an appropriate sharing of such economies of scale as may exist in the management of the Putnam funds at that time.
The information examined by the Trustees as part of their annual contract review for the Putnam funds has included for many years information regarding fees charged by Putnam Management and its affiliates to institutional clients such as defined benefit pension plans, college endowments, and the like. This information included comparisons of those fees with fees charged to the Putnam funds, as well as an assessment of the differences in the services provided to these different types of clients. The Trustees observed that the differences in fee rates between institutional clients and mutual funds are by no means uniform when examined by individual asset sectors, suggesting that differences in the pricing of investment management services to these types of clients may reflect historical competitive forces operating in separate markets. The Trustees considered the fact that in many cases fee rates across different asset classes are higher on average for mutual funds than for institutional clients, as well as the differences between the services that Putnam Management provides to the Putnam funds and those that it provides to its institutional clients. The Trustees did not rely on these comparisons to any significant extent in concluding that the management fees paid by your fund are reasonable.
Investment performance
The quality of the investment process provided by Putnam Management represented a major factor in the Trustees’ evaluation of the quality
| |
| Ohio Tax Exempt Income Fund | 21 |
of services provided by Putnam Management under your fund’s management contract. The Trustees were assisted in their review of the Putnam funds’ investment process and performance by the work of the investment oversight committees of the Trustees, which meet on a regular basis with the funds’ portfolio teams and with the Chief Investment Officer and other senior members of Putnam Management’s Investment Division throughout the year. The Trustees concluded that Putnam Management generally provides a high-quality investment process — based on the experience and skills of the individuals assigned to the management of fund portfolios, the resources made available to them, and in general Putnam Management’s ability to attract and retain high-quality personnel — but also recognized that this does not guarantee favorable investment results for every fund in every time period.
The Trustees considered that 2014 was a year of strong competitive performance for many of the Putnam funds, with generally strong results for the U.S. equity, money market and global asset allocation funds, but relatively mixed results for the international and global equity and fixed income funds. They noted that the longer-term performance of the Putnam funds continued to be strong, exemplified by the fact that the Putnam funds were recognized by Barron’s as the sixth-best performing mutual fund complex for the five-year period ended December 31, 2014. They also noted, however, the disappointing investment performance of some funds for periods ended December 31, 2014 and considered information provided by Putnam Management regarding the factors contributing to the underperformance and actions being taken to improve the performance of these particular funds. The Trustees indicated their intention to continue to monitor performance trends to assess the effectiveness of these efforts and to evaluate whether additional actions to address areas of underperformance are warranted.
For purposes of evaluating investment performance, the Trustees generally focus on competitive industry rankings for the one-year, three-year and five-year periods. For a number of Putnam funds with relatively unique investment mandates for which meaningful competitive performance rankings are not considered to be available, the Trustees evaluated performance based on comparisons of fund returns with the returns of selected investment benchmarks. In the case of your fund, the Trustees considered that its class A share cumulative total return performance at net asset value was in the following quartiles of its Lipper peer group (Lipper Ohio Municipal Debt Funds) for the one-year, three-year and five-year periods ended December 31, 2014 (the first quartile representing the best-performing funds and the fourth quartile the worst-performing funds):
| | | |
| One-year period | 3rd | | |
| | |
| Three-year period | 3rd | | |
| | |
| Five-year period | 3rd | | |
| | |
Over the one-year, three-year and five-year periods ended December 31, 2014, there were 32, 30 and 28 funds, respectively, in your fund’s Lipper peer group. The Trustees did not find any evidence that would suggest a need for concern regarding the investment process for your fund. (When considering performance information, shareholders should be mindful that past performance is not a guarantee of future results.)
The Trustees also considered Putnam Management’s continued efforts to support fund performance through initiatives including structuring compensation for portfolio managers and research analysts to enhance accountability for fund performance, emphasizing accountability in the portfolio management process, and affirming its commitment to a fundamental-driven approach to investing. The Trustees noted further that Putnam Management continued to strengthen
| |
| 22 | Ohio Tax Exempt Income Fund |
its fundamental research capabilities by adding new investment personnel.
Brokerage and soft-dollar allocations; investor servicing
The Trustees considered various potential benefits that Putnam Management may receive in connection with the services it provides under the management contract with your fund. These include benefits related to brokerage allocation and the use of soft dollars, whereby a portion of the commissions paid by a fund for brokerage may be used to acquire research services that are expected to be useful to Putnam Management in managing the assets of the fund and of other clients. Subject to policies established by the Trustees, soft dollars generated by these means are used primarily to acquire brokerage and research services that enhance Putnam Management’s investment capabilities and supplement Putnam Management’s internal research efforts. However, the Trustees noted that a portion of available soft dollars continues to be used to pay fund expenses. The Trustees indicated their continued intent to monitor regulatory and industry developments in this area with the assistance of their Brokerage Committee and also indicated their continued intent to monitor the allocation of the Putnam funds’ brokerage in order to ensure that the principle of seeking best price and execution remains paramount in the portfolio trading process.
Putnam Management may also receive benefits from payments that the funds make to Putnam Management’s affiliates for investor or distribution services. In conjunction with the annual review of your fund’s management and sub-management contracts, the Trustees reviewed your fund’s investor servicing agreement with Putnam Investor Services, Inc. (“PSERV”) and its distributor’s contracts and distribution plans with Putnam Retail Management Limited Partnership (“PRM”), both of which are affiliates of Putnam Management. The Trustees concluded that the fees payable by the funds to PSERV and PRM, as applicable, for such services are reasonable in relation to the nature and quality of such services, the fees paid by competitive funds, and the costs incurred by PSERV and PRM, as applicable, in providing such services.
| |
| Ohio Tax Exempt Income Fund | 23 |
Financial statements
A guide to financial statements
These sections of the report, as well as the accompanying Notes, constitute the fund’s financial statements.
The fund’s portfolio lists all the fund’s investments and their values as of the last day of the reporting period. Holdings are organized by asset type and industry sector, country, or state to show areas of concentration and diversification.
Statement of assets and liabilities shows how the fund’s net assets and share price are determined. All investment and non-investment assets are added together. Any unpaid expenses and other liabilities are subtracted from this total. The result is divided by the number of shares to determine the net asset value per share, which is calculated separately for each class of shares. (For funds with preferred shares, the amount subtracted from total assets includes the liquidation preference of preferred shares.)
Statement of operations shows the fund’s net investment gain or loss. This is done by first adding up all the fund’s earnings — from dividends and interest income — and subtracting its operating expenses to determine net investment income (or loss). Then, any net gain or loss the fund realized on the sales of its holdings — as well as any unrealized gains or losses over the period — is added to or subtracted from the net investment result to determine the fund’s net gain or loss for the fiscal period.
Statement of changes in net assets shows how the fund’s net assets were affected by the fund’s net investment gain or loss, by distributions to shareholders, and by changes in the number of the fund’s shares. It lists distributions and their sources (net investment income or realized capital gains) over the current reporting period and the most recent fiscal year-end. The distributions listed here may not match the sources listed in the Statement of operations because the distributions are determined on a tax basis and may be paid in a different period from the one in which they were earned. Dividend sources are estimated at the time of declaration. Actual results may vary. Any non-taxable return of capital cannot be determined until final tax calculations are completed after the end of the fund’s fiscal year.
Financial highlights provide an overview of the fund’s investment results, per-share distributions, expense ratios, net investment income ratios, and portfolio turnover in one summary table, reflecting the five most recent reporting periods. In a semiannual report, the highlights table also includes the current reporting period.
| |
| 24 | Ohio Tax Exempt Income Fund |
The fund’s portfolio 11/30/15 (Unaudited)
| |
| Key to holding’s abbreviations | |
| AGM Assured Guaranty Municipal Corporation | G.O. Bonds General Obligation Bonds |
| AGO Assured Guaranty, Ltd. | GNMA Coll. Government National Mortgage |
| AMBAC AMBAC Indemnity Corporation | Association Collateralized |
| COP Certificates of Participation | NATL National Public Finance Guarantee Corp. |
| FHLMC Coll. Federal Home Loan Mortgage | SGI Syncora Guarantee, Inc. |
| Corporation Collateralized | U.S. Govt. Coll. U.S. Government Collateralized |
| FNMA Coll. Federal National Mortgage | VRDN Variable Rate Demand Notes, which are |
| Association Collateralized | floating-rate securities with long-term maturities |
| FRB Floating Rate Bonds: the rate shown | that carry coupons that reset and are payable upon |
| is the current interest rate at the close of the | demand either daily, weekly or monthly. The rate |
| reporting period | shown is the current interest rate at the close of the |
| | reporting period. |
| | | |
| MUNICIPAL BONDS AND NOTES (96.7%)* | Rating** | Principal amount | Value |
|
| Guam (0.9%) | | | |
| Territory of GU, Govt. Ltd. Oblig. Rev. Bonds | | | |
| (Section 30), Ser. A, 5 3/4s, 12/1/34 | BBB+ | $500,000 | $559,590 |
|
| Territory of GU, Govt. Wtr. Wks. Auth. Wtr. & | | | |
| Waste Wtr. Syst. Rev. Bonds, 5 5/8s, 7/1/40 | A– | 350,000 | 387,356 |
|
| Territory of GU, Pwr. Auth. Rev. Bonds, Ser. A, | | | |
| 5 1/2s, 10/1/40 | Baa2 | 250,000 | 274,523 |
|
| | 1,221,469 |
| Ohio (93.3%) | | | |
| Akron, G.O. Bonds, AGM, 5s, 12/1/25 | | | |
| (Prerefunded 12/1/17) | AA | 1,005,000 | 1,088,556 |
|
| Allen Cnty., Hosp. Fac. Rev. Bonds (Catholic Hlth. | | | |
| Care), Ser. A, 5 1/4s, 6/1/38 | AA– | 1,000,000 | 1,113,970 |
|
| American Muni. Pwr., Inc. Rev. Bonds | | | |
| (Prairie State Energy Campus), | | | |
| Ser. A, AGO, U.S. Govt. Coll., 5 3/4s, 2/15/39 | | | |
| (Prerefunded 2/15/19) | AA | 1,500,000 | 1,724,325 |
| Ser. A, 5 1/4s, 2/15/33 | A1 | 250,000 | 286,005 |
| 5s, 2/15/39 | A1 | 1,000,000 | 1,115,130 |
| (Prairie State Energy Campus), 5s, 2/15/38 | A1 | 90,000 | 95,300 |
| (Prairie State Energy Campus), U.S. Govt. Coll., | | | |
| 5s, 2/15/38 (Prerefunded 2/15/18) | AAA/P | 1,410,000 | 1,538,874 |
|
| Barberton, City School Dist. G.O. Bonds (School | | | |
| Impt.), U.S. Govt. Coll., 5 1/4s, 12/1/28 | | | |
| (Prerefunded 6/1/18) | AA | 1,390,000 | 1,539,536 |
|
| Brookfield, Local School Dist. G.O. Bonds (School | | | |
| Fac. Impt.), AGM, 5s, 1/15/26 | Aa2 | 1,000,000 | 1,081,800 |
|
| Buckeye, Tobacco Settlement Fin. Auth. Rev. | | | |
| Bonds, Ser. A-2, 5 3/4s, 6/1/34 | B– | 1,500,000 | 1,293,270 |
|
| Cincinnati, G.O. Bonds, Ser. D, 4s, 12/1/32 | Aa2 | 500,000 | 520,430 |
|
| Cincinnati, City School Dist. COP, AGM | | | |
| 5s, 12/15/28 (Prerefunded 12/15/16) | AA | 1,840,000 | 1,924,640 |
| 5s, 12/15/28 (Prerefunded 12/15/16) | AA | 660,000 | 690,360 |
|
| Cleveland, G.O. Bonds, Ser. A, AGO, U.S. Govt. | | | |
| Coll., 5s, 12/1/29 (Prerefunded 6/1/17) | AA | 2,000,000 | 2,126,400 |
|
| |
| Ohio Tax Exempt Income Fund | 25 |
| | | |
| MUNICIPAL BONDS AND NOTES (96.7%)* cont. | Rating** | Principal amount | Value |
|
| Ohio cont. | | | |
| Cleveland, Arpt. Syst. Rev. Bonds, Ser. C, | | | |
| AGM, 5s, 1/1/23 | AA | $1,500,000 | $1,568,790 |
|
| Cleveland, Income Tax Rev. Bonds (Bridges & | | | |
| Roadways), Ser. B, AGO, U.S. Govt. Coll., 5s, | | | |
| 10/1/29 (Prerefunded 4/1/18) | AA | 1,000,000 | 1,094,220 |
|
| Cleveland, Pkg. Fac. Rev. Bonds, AGM | | | |
| 5 1/4s, 9/15/22 | AA | 1,630,000 | 1,891,468 |
| 5 1/4s, 9/15/22 (Escrowed to maturity) | AA | 770,000 | 947,739 |
|
| Cleveland, Pub. Pwr. Syst. Rev. Bonds, Ser. B-1, | | | |
| NATL, zero %, 11/15/25 | AA– | 3,000,000 | 2,117,940 |
|
| Cleveland, State U. Rev. Bonds, 5s, 6/1/37 | A1 | 1,500,000 | 1,659,135 |
|
| Cleveland, Urban Renewal Increment Rev. Bonds | | | |
| (Rock & Roll Hall of Fame), 6 3/4s, 3/15/18 | B/P | 555,000 | 557,481 |
|
| Cleveland, Wtr. Rev. Bonds (2nd Lien) | | | |
| Ser. X, 5s, 1/1/42 | Aa1 | 1,000,000 | 1,119,180 |
| Ser. A, 5s, 1/1/26 | Aa2 | 500,000 | 581,395 |
|
| Cleveland-Cuyahoga Cnty., Rev. Bonds (Euclid | | | |
| Ave. Dev., Corp.), 5s, 8/1/39 | A2 | 1,000,000 | 1,095,540 |
|
| Columbus, G.O. Bonds, Ser. A | | | |
| 5s, 2/15/25 | Aaa | 1,500,000 | 1,801,650 |
| 5s, 8/15/24 | Aaa | 1,000,000 | 1,226,680 |
|
| Columbus, Swr. VRDN, Ser. B, 0.01s, 6/1/32 | VMIG1 | 1,430,000 | 1,430,000 |
|
| Cuyahoga Cmnty., College Dist. Rev. Bonds | | | |
| Ser. C, 5 1/4s, 2/1/29 | Aa2 | 995,000 | 1,138,459 |
| Ser. D, 5s, 8/1/32 | Aa2 | 750,000 | 847,658 |
| Ser. C, 5s, 8/1/25 | Aa2 | 1,500,000 | 1,716,210 |
|
| Cuyahoga Cnty., COP (Convention Hotel), | | | |
| 5s, 12/1/27 | Aa3 | 1,250,000 | 1,454,563 |
|
| Dayton, City School Dist. G.O. Bonds, 5s, 11/1/23 | Aa2 | 750,000 | 895,695 |
|
| Elyria, OH City School Dist. G.O. Bonds | | | |
| (Classroom Fac. & School Impt.) | | | |
| SGI, 5s, 12/1/35 (Prerefunded 6/1/17) | A1 | 110,000 | 116,952 |
| U.S. Govt. Coll., SGI, 5s, 12/1/35 | | | |
| (Prerefunded 6/1/17) | A1 | 390,000 | 414,648 |
|
| Erie Cnty., OH Hosp. Fac. Rev. Bonds (Firelands | | | |
| Regl. Med. Ctr.), Ser. A, 5 1/4s, 8/15/46 | A3 | 590,000 | 593,988 |
|
| Franklin Cnty., Hlth. Care Fac. Rev. Bonds | | | |
| (Presbyterian Svcs.), Ser. A, 5 5/8s, 7/1/26 | BBB– | 1,100,000 | 1,174,063 |
| 5s, 11/15/44 | A–/F | 1,000,000 | 1,064,520 |
|
| Gallia Cnty., Local School Impt. Dist. G.O. Bonds, | | | |
| 5s, 11/1/27 | Aa2 | 815,000 | 967,535 |
|
| Greene Cnty., Hosp. Facs. Rev. Bonds (Kettering | | | |
| Hlth. Network), 5 1/2s, 4/1/39 | A2 | 1,000,000 | 1,099,560 |
|
| Hamilton Cnty., Econ. Dev. Rev. Bonds (King | | | |
| Highland Cmnty. Urban), Ser. A, NATL, U.S. Govt. | | | |
| Coll., 5s, 6/1/22 (Prerefunded 6/1/16) | AA– | 1,745,000 | 1,785,571 |
|
| Hamilton Cnty., Hlth. Care Rev. Bonds (Life | | | |
| Enriching Cmntys.), 6 5/8s, 1/1/46 | BBB | 590,000 | 666,871 |
|
| |
| 26 | Ohio Tax Exempt Income Fund |
| | | |
| MUNICIPAL BONDS AND NOTES (96.7%)* cont. | Rating** | Principal amount | Value |
|
| Ohio cont. | | | |
| Hamilton Cnty., Sales Tax Rev. Bonds, | | | |
| Ser. B, AMBAC | | | |
| zero %, 12/1/24 | A2 | $3,000,000 | $2,264,820 |
| zero %, 12/1/22 | A2 | 500,000 | 414,480 |
|
| Hamilton Cnty., Swr. Syst. Rev. Rev. Bonds | | | |
| (Metro. Swr. Dist.), Ser. A, NATL, U.S. Govt. Coll., | | | |
| 5s, 12/1/28 (Prerefunded 12/1/16) | AA+ | 1,500,000 | 1,567,950 |
| Ser. A, 5s, 12/1/22 | AA+ | 750,000 | 908,160 |
|
| Huran Cnty., Human Svcs. G.O. Bonds, NATL, | | | |
| 6.55s, 12/1/20 | Aa3 | 1,315,000 | 1,479,217 |
|
| JobsOhio Beverage Syst. Rev. Bonds (Statewide | | | |
| Sr. Lien Liquor Profits), Ser. A, 5s, 1/1/38 | AA | 700,000 | 782,978 |
|
| Lake Cnty., Hosp. Fac. Rev. Bonds (Lake Hosp. | | | |
| Syst., Inc.), Ser. C | | | |
| 6s, 8/15/43 | A3 | 180,000 | 198,576 |
| U.S. Govt. Coll., 6s, 8/15/43 | | | |
| (Prerefunded 8/15/18) | AAA/P | 935,000 | 1,061,094 |
|
| Lakewood, City School Dist. G.O. Bonds | | | |
| NATL, zero %, 12/1/17 | Aa2 | 1,190,000 | 1,157,346 |
| AGM, zero %, 12/1/16 | Aa2 | 1,250,000 | 1,237,050 |
|
| Lancaster, City Fac. Construction & Impt. School | | | |
| Dist. G.O. Bonds, 5s, 10/1/37 | AA | 1,000,000 | 1,121,950 |
|
| Lorain Cnty., Hosp. Rev. Bonds (Catholic), Ser. H, | | | |
| AGO, 5s, 2/1/29 | AA | 2,000,000 | 2,154,360 |
|
| Lorain Cnty., Port Auth. Econ. Dev. Facs. Rev. | | | |
| Bonds (Kendal at Oberlin), 5s, 11/15/30 | A– | 750,000 | 805,913 |
|
| Lucas Cnty., Hlth. Care Fac. Rev. Bonds | | | |
| (Lutheran Homes), Ser. A, 7s, 11/1/45 | BB+/P | 700,000 | 761,530 |
| (Sunset Retirement Cmntys.), 5 1/2s, 8/15/30 | A–/F | 650,000 | 713,447 |
|
| Miami Cnty., Hosp. Fac. Rev. Bonds (Upper Valley | | | |
| Med. Ctr.), 5 1/4s, 5/15/17 | A2 | 1,250,000 | 1,276,025 |
|
| Milford, Exempt Village School Dist. G.O. Bonds, | | | |
| 5s, 12/1/19 | Aa2 | 200,000 | 226,958 |
|
| Montgomery Cnty., Rev. Bonds (Catholic Hlth. | | | |
| Initiatives), Ser. D, 6 1/4s, 10/1/33 | A2 | 1,000,000 | 1,123,600 |
|
| Montgomery Cnty., VRDN (Miami Valley Hosp.), | | | |
| Ser. C, 0.01s, 11/15/39 | VMIG1 | 1,100,000 | 1,100,000 |
|
| Mount Healthy City School Dist. G.O. Bonds | | | |
| (School Impt.), AGM, 5 1/4s, 12/1/22 | | | |
| (Prerefunded 6/1/18) | A1 | 1,105,000 | 1,223,876 |
| 5s, 12/1/21 | Aa2 | 500,000 | 584,955 |
|
| Napoleon, City Fac. Construction & Impt. School | | | |
| Dist. G.O. Bonds, 5s, 12/1/36 | Aa3 | 500,000 | 547,795 |
|
| New Albany, Plain Local School Dist. G.O. Bonds | | | |
| (School Impt.), 4s, 12/1/29 | Aa1 | 1,410,000 | 1,503,864 |
|
| OH Hsg. Fin. Agcy. Rev. Bonds (Single Fam. | | | |
| Mtge.), Ser. 1, GNMA Coll., FNMA Coll., FHLMC | | | |
| Coll., 5s, 11/1/28 | Aaa | 500,000 | 530,415 |
|
| |
| Ohio Tax Exempt Income Fund | 27 |
| | | |
| MUNICIPAL BONDS AND NOTES (96.7%)* cont. | Rating** | Principal amount | Value |
|
| Ohio cont. | | | |
| OH State G.O. Bonds | | | |
| (Hwy. Cap. Impts.), Ser. Q, 5s, 5/1/27 | AAA | $1,500,000 | $1,788,390 |
| Ser. R, 5s, 5/1/24 | AAA | 1,000,000 | 1,231,170 |
| (Infrastructure Impt.), Ser. B, 5s, 8/1/23 | Aa1 | 1,250,000 | 1,531,025 |
|
| OH State Rev. Bonds | | | |
| (Regl. Swr. Dist.), 5s, 11/15/49 | Aa1 | 1,250,000 | 1,418,675 |
| (Northeast OH Regl. Swr. Dist.), 5s, 11/15/44 | Aa1 | 250,000 | 285,403 |
| Ser. A, U.S. Govt. Coll., 5s, 10/1/22 | | | |
| (Prerefunded 4/1/18) | AA– | 3,090,000 | 3,388,679 |
| (Revitalization), Ser. A, AMBAC, U.S. Govt. Coll., | | | |
| 5s, 4/1/19 (Prerefunded 4/1/16) | AA– | 750,000 | 761,813 |
|
| OH State Air Quality Dev. Auth. FRB (Columbus | | | |
| Southern Pwr. Co.), Ser. B, 5.8s, 12/1/38 | Baa1 | 1,000,000 | 1,101,500 |
|
| OH State Air Quality Dev. Auth. Rev. Bonds | | | |
| (Buckeye Pwr. Recvy. Zone Fac.), 6s, 12/1/40 | A2 | 1,000,000 | 1,171,570 |
|
| OH State Air Quality Dev. Auth., Poll. Control | | | |
| Mandatory Put Bonds (5/1/20) (FirstEnergy | | | |
| Nuclear), Ser. C, 3.95s, 11/1/32 | Baa3 | 300,000 | 309,930 |
|
| OH State Higher Edl. Fac. Rev. Bonds | | | |
| (Case Western Reserve U.), 6 1/4s, 10/1/18 | AA– | 1,000,000 | 1,141,180 |
| (U. of Dayton), Ser. A, 5 5/8s, 12/1/41 | A2 | 1,200,000 | 1,373,832 |
| (U. of Dayton), 5 1/2s, 12/1/36 | A2 | 1,000,000 | 1,112,960 |
|
| OH State Higher Edl. Fac. Comm. Rev. Bonds | | | |
| (Summa Hlth. Syst. — 2010), 5 3/4s, 11/15/40 | Baa1 | 1,000,000 | 1,091,520 |
| (Kenyon College), 5s, 7/1/44 | A1 | 2,000,000 | 2,168,960 |
| (Xavier U.), 5s, 5/1/40 | A3 | 750,000 | 811,200 |
| (Oberlin Coll.), 5s, 10/1/31 | Aa3 | 650,000 | 752,837 |
| (Cleveland Clinic Hlth.), 5s, 1/1/31 | Aa2 | 1,500,000 | 1,713,840 |
| (Cleveland Clinic Hlth.), 5s, 1/1/25 | Aa2 | 1,145,000 | 1,337,074 |
| (U. of Dayton), Ser. A, 5s, 12/1/24 | A2 | 285,000 | 340,806 |
|
| OH State Poll. Control Rev. Bonds (Standard Oil | | | |
| Co.), 6 3/4s, 12/1/15 | A2 | 1,700,000 | 1,700,000 |
|
| OH State Private Activity Rev. Bonds (Portsmouth | | | |
| Bypass Gateway Group, LLC), AGM, 5s, 12/31/39 | AA | 750,000 | 817,253 |
|
| OH State Tpk. Comm. Rev. Bonds | | | |
| (Infrastructure), Ser. A-1, 5 1/4s, 2/15/32 | A1 | 350,000 | 402,840 |
| 5s, 2/15/48 | A1 | 1,250,000 | 1,374,200 |
|
| OH State U. Rev. Bonds | | | |
| Ser. A, 5s, 12/1/39 | Aa1 | 1,000,000 | 1,148,990 |
| (Gen. Receipts Special Purpose), | | | |
| Ser. A, 5s, 6/1/38 | Aa2 | 1,000,000 | 1,128,330 |
|
| OH State Wtr. Dev. Auth. Poll. Control | | | |
| Mandatory Put Bonds (6/3/19) (FirstEnergy | | | |
| Nuclear Generation, LLC), 4s, 12/1/33 Man Put | | | |
| date is 6/3/19 | Baa3 | 750,000 | 770,723 |
|
| OH U. Gen. Recipients Athens Rev. Bonds | | | |
| 5s, 12/1/43 | Aa3 | 1,035,000 | 1,146,138 |
| 5s, 12/1/42 | Aa3 | 500,000 | 550,550 |
|
| Penta Career Ctr. COP, 5s, 4/1/20 | Aa3 | 1,500,000 | 1,685,625 |
|
| |
| 28 | Ohio Tax Exempt Income Fund |
| | | |
| MUNICIPAL BONDS AND NOTES (96.7%)* cont. | Rating** | Principal amount | Value |
|
| Ohio cont. | | | |
| Princeton, City School Dist. G.O. Bonds, | | | |
| 5s, 12/1/36 | AA | $500,000 | $574,495 |
|
| Rickenbacker, Port Auth. Rev. Bonds (OASBO | | | |
| Expanded Asset Pooled), Ser. A, 5 3/8s, 1/1/32 | A2 | 1,780,000 | 1,861,115 |
|
| River Valley, Local School Dist. G.O. Bonds (School | | | |
| Fac. Construction & Impt.), AGM, 5 1/4s, 11/1/23 | Aa2 | 300,000 | 363,189 |
|
| Scioto Cnty., Hosp. Rev. Bonds (Southern Med. | | | |
| Ctr.), 5 1/2s, 2/15/28 | A2 | 1,250,000 | 1,355,788 |
|
| South Western City, School Dist. G.O. Bonds | | | |
| (Franklin & Pickway Cnty.), AGM, 4 3/4s, 12/1/23 | Aa2 | 2,000,000 | 2,084,000 |
|
| Steubenville Hosp. Rev. Bonds (Trinity Hlth. Syst.), | | | |
| 5s, 10/1/30 | A3 | 500,000 | 543,315 |
|
| Sylvania, City School Dist. G.O. Bonds (School | | | |
| Impt.), AGO, U.S. Govt. Coll., 5s, 12/1/27 | | | |
| (Prerefunded 6/1/17) | AA | 1,500,000 | 1,595,955 |
|
| Toledo, City School Facs Impt. Dist. G.O. Bonds, | | | |
| 5s, 12/1/26 | Aa2 | 1,000,000 | 1,184,910 |
|
| Toledo-Lucas Cnty., Port Auth. Rev. Bonds (CSX | | | |
| Transn, Inc.), 6.45s, 12/15/21 | Baa1 | 1,900,000 | 2,316,233 |
|
| U. of Akron Rev. Bonds, Ser. A | | | |
| 5s, 1/1/31 | A1 | 500,000 | 574,230 |
| 5s, 1/1/28 | A1 | 1,000,000 | 1,160,390 |
|
| U. of Cincinnati Rev. Bonds | | | |
| Ser. F, 5s, 6/1/34 | Aa3 | 1,500,000 | 1,670,565 |
| Ser. A, 5s, 6/1/31 | Aa3 | 500,000 | 570,640 |
| Ser. A, 5s, 6/1/30 | Aa3 | 1,000,000 | 1,145,140 |
|
| Warren Cnty., Hlth. Care Fac. Rev. Bonds | | | |
| (Otterbein Homes Oblig. Group) | | | |
| Ser. A, 5 3/4s, 7/1/33 | A | 500,000 | 567,535 |
| 5s, 7/1/39 | A | 1,000,000 | 1,078,000 |
|
| Westerville, G.O. Bonds | | | |
| AMBAC, 5s, 12/1/26 | Aaa | 105,000 | 113,709 |
| AMBAC, U.S. Govt Coll., 5s, 12/1/26 | | | |
| (Prerefunded 12/1/17) | Aaa | 1,215,000 | 1,317,279 |
|
| Westlake, Rev. Bonds (American Greetings- | | | |
| Crocker Park Pub. Impt.), 5s, 12/1/33 | Aa1 | 1,000,000 | 1,144,760 |
|
| Youngstown State U. Rev. Bonds | | | |
| AGO, 5 1/4s, 12/15/29 | AA | 500,000 | 561,530 |
| 5s, 12/15/25 | A2 | 500,000 | 566,980 |
|
| Zanesville, Hsg. Dev. Corp. Mtge. Rev. Bonds, U.S. | | | |
| Govt. Coll. | | | |
| 7 3/8s, 10/1/21 (Escrowed to maturity) | AAA/P | 220,000 | 225,139 |
| 7 3/8s, 10/1/20 (Escrowed to maturity) | AAA/P | 205,000 | 209,789 |
| 7 3/8s, 10/1/19 (Escrowed to maturity) | AAA/P | 185,000 | 189,322 |
| 7 3/8s, 10/1/18 (Escrowed to maturity) | AAA/P | 180,000 | 184,205 |
| 7 3/8s, 10/1/17 (Escrowed to maturity) | AAA/P | 160,000 | 163,738 |
| 7 3/8s, 10/1/16 (Escrowed to maturity) | AAA/P | 155,000 | 158,621 |
|
| | | | 130,950,051 |
| |
| Ohio Tax Exempt Income Fund | 29 |
| | | |
| MUNICIPAL BONDS AND NOTES (96.7%)* cont. | Rating** | Principal amount | Value |
|
| Oklahoma (1.0%) | | | |
| OK State Tpk. Auth. VRDN, Ser. F, 0.01s, 1/1/28 | VMIG1 | $1,345,000 | $1,345,000 |
|
| | 1,345,000 |
| Puerto Rico (0.7%) | | | |
| Children’s Trust Fund Tobacco Settlement (The) | | | |
| Rev. Bonds, 5 3/8s, 5/15/33 | BBB | 360,000 | 364,115 |
|
| Cmnwlth. of PR, Sales Tax Fin. Corp. Rev. Bonds | | | |
| Ser. C, 5 1/4s, 8/1/41 | Ca | 370,000 | 153,550 |
| Ser. A, NATL, zero %, 8/1/43 | AA– | 3,000,000 | 533,730 |
|
| | 1,051,395 |
| Virgin Islands (0.8%) | | | |
| VI Pub. Fin. Auth. Rev. Bonds | | | |
| Ser. A, 6s, 10/1/39 | Baa3 | 300,000 | 328,152 |
| Ser. A-1, 5s, 10/1/39 | Baa2 | 375,000 | 404,231 |
| Ser. A, 5s, 10/1/25 | Baa2 | 350,000 | 390,310 |
|
| | | | 1,122,693 |
| |
| TOTAL INVESTMENTS | | | |
|
| Total investments (cost $127,643,619) | | | $135,690,608 |
Notes to the fund’s portfolio
Unless noted otherwise, the notes to the fund’s portfolio are for the close of the fund’s reporting period, which ran from June 1, 2015 through November 30, 2015 (the reporting period). Within the following notes to the portfolio, references to “ASC 820” represent Accounting Standards Codification 820 Fair Value Measurements and Disclosures and references to “OTC”, if any, represent over-the-counter.
* Percentages indicated are based on net assets of $140,318,270.
** The Moody’s, Standard & Poor’s or Fitch ratings indicated are believed to be the most recent ratings available at the close of the reporting period for the securities listed. Ratings are generally ascribed to securities at the time of issuance. While the agencies may from time to time revise such ratings, they undertake no obligation to do so, and the ratings do not necessarily represent what the agencies would ascribe to these securities at the close of the reporting period. Securities rated by Putnam are indicated by “/P.” Securities rated by Fitch are indicated by “/F.” If a security is insured, it will usually be rated by the ratings organizations based on the financial strength of the insurer. For further details regarding security ratings, please see the Statement of Additional Information.
On Mandatory Put Bonds, the rates shown are the current interest rates at the close of the reporting period and the dates shown represent the next mandatory put dates.
The dates shown parenthetically on prerefunded bonds represent the next prerefunding dates.
The dates shown on debt obligations are the original maturity dates.
The fund had the following sector concentrations greater than 10% at the close of the reporting period (as a percentage of net assets):
| |
| Prerefunded | 19.3% |
| Education | 16.6 |
| Local debt | 16.4 |
| Health care | 15.3 |
The fund had the following insurance concentration greater than 10% at the close of the reporting period (as a percentage of net assets):
| |
| 30 | Ohio Tax Exempt Income Fund |
ASC 820 establishes a three-level hierarchy for disclosure of fair value measurements. The valuation hierarchy is based upon the transparency of inputs to the valuation of the fund’s investments. The three levels are defined as follows:
Level 1: Valuations based on quoted prices for identical securities in active markets.
Level 2: Valuations based on quoted prices in markets that are not active or for which all significant inputs are observable, either directly or indirectly.
Level 3: Valuations based on inputs that are unobservable and significant to the fair value measurement.
The following is a summary of the inputs used to value the fund’s net assets as of the close of the reporting period:
| | | |
| | | Valuation inputs | |
|
| Investments in securities: | Level 1 | Level 2 | Level 3 |
|
| Municipal bonds and notes | $— | $135,690,608 | $— |
|
| Totals by level | $— | $135,690,608 | $— |
During the reporting period, transfers within the fair value hierarchy, if any, did not represent, in the aggregate, more than 1% of the fund’s net assets measured as of the end of the period. Transfers are accounted for using the end of period pricing valuation method.
The accompanying notes are an integral part of these financial statements.
| |
| Ohio Tax Exempt Income Fund | 31 |
Statement of assets and liabilities 11/30/15 (Unaudited)
| |
| ASSETS | |
|
| Investment in securities, at value, (Note 1): | |
| Unaffiliated issuers (identified cost $127,643,619) | $135,690,608 |
|
| Cash | 2,570,681 |
|
| Interest and other receivables | 2,124,069 |
|
| Receivable for shares of the fund sold | 62,511 |
|
| Receivable for investments sold | 280,000 |
|
| Prepaid assets | 5,979 |
|
| Total assets | 140,733,848 |
| |
| LIABILITIES | |
|
| Payable for shares of the fund repurchased | 127,003 |
|
| Payable for compensation of Manager (Note 2) | 49,378 |
|
| Payable for custodian fees (Note 2) | 3,571 |
|
| Payable for investor servicing fees (Note 2) | 15,974 |
|
| Payable for Trustee compensation and expenses (Note 2) | 73,365 |
|
| Payable for administrative services (Note 2) | 469 |
|
| Payable for distribution fees (Note 2) | 53,382 |
|
| Payable for auditing and tax fees | 28,698 |
|
| Distributions payable to shareholders | 48,841 |
|
| Other accrued expenses | 14,897 |
|
| Total liabilities | 415,578 |
| | |
| Net assets | $140,318,270 |
|
| |
| REPRESENTED BY | |
|
| Paid-in capital (Unlimited shares authorized) (Notes 1 and 4) | $135,577,812 |
|
| Distributions in excess of net investment income (Note 1) | (30,190) |
|
| Accumulated net realized loss on investments (Note 1) | (3,276,341) |
|
| Net unrealized appreciation of investments | 8,046,989 |
|
| Total — Representing net assets applicable to capital shares outstanding | $140,318,270 |
| |
| COMPUTATION OF NET ASSET VALUE AND OFFERING PRICE | |
|
| Net asset value and redemption price per class A share | |
| ($115,466,362 divided by 12,733,079 shares) | $9.07 |
|
| Offering price per class A share (100/96.00 of $9.07)* | $9.45 |
|
| Net asset value and offering price per class B share ($1,657,554 divided by 183,018 shares)** | $9.06 |
|
| Net asset value and offering price per class C share ($10,622,070 divided by 1,171,304 shares)** | $9.07 |
|
| Net asset value and redemption price per class M share ($539,871 divided by 59,516 shares) | $9.07 |
|
| Offering price per class M share (100/96.75 of $9.07)† | $9.37 |
|
| Net asset value, offering price and redemption price per class Y share | |
| ($12,032,413 divided by 1,325,634 shares) | $9.08 |
|
* On single retail sales of less than $100,000. On sales of $100,000 or more the offering price is reduced.
** Redemption price per share is equal to net asset value less any applicable contingent deferred sales charge.
† On single retail sales of less than $50,000. On sales of $50,000 or more the offering price is reduced.
The accompanying notes are an integral part of these financial statements.
| |
| 32 | Ohio Tax Exempt Income Fund |
Statement of operations Six months ended 11/30/15 (Unaudited)
| |
| INTEREST INCOME | $2,849,534 |
|
| EXPENSES | |
|
| Compensation of Manager (Note 2) | 302,491 |
|
| Investor servicing fees (Note 2) | 48,338 |
|
| Custodian fees (Note 2) | 3,449 |
|
| Trustee compensation and expenses (Note 2) | 4,989 |
|
| Distribution fees (Note 2) | 193,455 |
|
| Administrative services (Note 2) | 1,373 |
|
| Other | 53,864 |
|
| Total expenses | 607,959 |
| | |
| Expense reduction (Note 2) | (81) |
|
| Net expenses | 607,878 |
| | |
| Net investment income | 2,241,656 |
|
| |
| Net realized loss on investments (Notes 1 and 3) | (197,597) |
|
| Net unrealized appreciation of investments during the period | 103,954 |
|
| Net loss on investments | (93,643) |
| | |
| Net increase in net assets resulting from operations | $2,148,013 |
|
The accompanying notes are an integral part of these financial statements.
| |
| Ohio Tax Exempt Income Fund | 33 |
Statement of changes in net assets
| | |
| INCREASE (DECREASE) IN NET ASSETS | Six months ended 11/30/15* | Year ended 5/31/15 |
|
| Operations: | | |
| Net investment income | $2,241,656 | $4,656,667 |
|
| Net realized loss on investments | (197,597) | (600,664) |
|
| Net unrealized appreciation (depreciation) of investments | 103,954 | (128,114) |
|
| Net increase in net assets resulting from operations | 2,148,013 | 3,927,889 |
|
| Distributions to shareholders (Note 1): | | |
| From ordinary income | | |
| Taxable net investment income | | |
|
| Class A | — | (285) |
|
| Class B | — | (4) |
|
| Class C | — | (25) |
|
| Class M | — | (1) |
|
| Class Y | — | (13) |
|
| From tax-exempt net investment income | | |
| Class A | (1,861,420) | (3,946,316) |
|
| Class B | (22,278) | (47,332) |
|
| Class C | (132,085) | (270,839) |
|
| Class M | (7,921) | (15,339) |
|
| Class Y | (205,886) | (344,848) |
|
| Increase (decrease) from capital share transactions (Note 4) | (2,701,961) | 1,958,749 |
|
| Total increase (decrease) in net assets | (2,783,538) | 1,261,636 |
| |
| NET ASSETS | | |
|
| Beginning of period | 143,101,808 | 141,840,172 |
|
| End of period (including distributions in excess of net | | |
| investment income of $30,190 and $42,256, respectively) | $140,318,270 | $143,101,808 |
|
* Unaudited.
The accompanying notes are an integral part of these financial statements.
| |
| 34 | Ohio Tax Exempt Income Fund |
|
| This page left blank intentionally. |
| |
| Ohio Tax Exempt Income Fund | 35 |
Financial highlights (For a common share outstanding throughout the period)
| | | | | | | | | | | | | | |
| INVESTMENT OPERATIONS: | LESS DISTRIBUTIONS: | RATIOS AND SUPPLEMENTAL DATA: |
|
| | | | | | | | | | | | | Ratio | Ratio | |
| | | | Net realized | | | | | | | | | of expenses | of net investment | |
| | Net asset value, | | and unrealized | Total from | From | | | | | Total return | Net assets, | to average | income (loss) | Portfolio |
| | beginning | Net investment | gain (loss) | investment | net investment | Total | Redemption | Non-recurring | Net asset value, | at net asset | end of period | net assets | to average | turnover |
| Period ended | of period | income (loss) | on investments | operations | income | distributions | fees | reimbursements | end of period | value (%)a | (in thousands) | (%)b | net assets (%) | (%) |
|
| Class A | | | | | | | | | | | | | | |
| November 30, 2015** | $9.07 | .15 | —c | .15 | (.15) | (.15) | — | — | $9.07 | 1.64* | $115,466 | .41* | 1.61* | — |
| May 31, 2015 | 9.12 | .30 | (.05) | .25 | (.30) | (.30) | — | — | 9.07 | 2.74 | 117,935 | .80 | 3.28 | 16 |
| May 31, 2014 | 9.31 | .31 | (.19) | .12 | (.31) | (.31) | — | — | 9.12 | 1.40 | 123,335 | .81 | 3.48 | 9 |
| May 31, 2013 | 9.35 | .32 | (.05) | .27 | (.31) | (.31) | — | — | 9.31 | 2.96 | 138,049 | .80 | 3.36 | 10 |
| May 31, 2012 | 8.84 | .34 | .51 | .85 | (.34) | (.34) | —c | —c,d | 9.35 | 9.81 | 135,448 | .80 | 3.79 | 12 |
| May 31, 2011 | 9.05 | .36 | (.21) | .15 | (.36) | (.36) | — | —c,e | 8.84 | 1.74 | 132,617 | .79 | 4.14 | 11 |
|
| Class B | | | | | | | | | | | | | | |
| November 30, 2015** | $9.06 | .12 | —c | .12 | (.12) | (.12) | — | — | $9.06 | 1.32* | $1,658 | .72* | 1.30* | — |
| May 31, 2015 | 9.11 | .24 | (.05) | .19 | (.24) | (.24) | — | — | 9.06 | 2.11 | 1,791 | 1.42 | 2.66 | 16 |
| May 31, 2014 | 9.30 | .25 | (.19) | .06 | (.25) | (.25) | — | — | 9.11 | .78 | 1,807 | 1.43 | 2.86 | 9 |
| May 31, 2013 | 9.33 | .26 | (.03) | .23 | (.26) | (.26) | — | — | 9.30 | 2.43 | 2,179 | 1.42 | 2.73 | 10 |
| May 31, 2012 | 8.83 | .29 | .50 | .79 | (.29) | (.29) | —c | —c,d | 9.33 | 9.01 | 1,676 | 1.43 | 3.16 | 12 |
| May 31, 2011 | 9.04 | .31 | (.21) | .10 | (.31) | (.31) | — | —c,e | 8.83 | 1.10 | 1,852 | 1.42 | 3.49 | 11 |
|
| Class C | | | | | | | | | | | | | | |
| November 30, 2015** | $9.07 | .11 | —c | .11 | (.11) | (.11) | — | — | $9.07 | 1.24* | $10,622 | .79* | 1.23* | — |
| May 31, 2015 | 9.12 | .23 | (.05) | .18 | (.23) | (.23) | — | — | 9.07 | 1.95 | 10,798 | 1.57 | 2.51 | 16 |
| May 31, 2014 | 9.31 | .24 | (.19) | .05 | (.24) | (.24) | — | — | 9.12 | .62 | 10,681 | 1.58 | 2.71 | 9 |
| May 31, 2013 | 9.35 | .24 | (.04) | .20 | (.24) | (.24) | — | — | 9.31 | 2.17 | 14,421 | 1.57 | 2.59 | 10 |
| May 31, 2012 | 8.84 | .27 | .51 | .78 | (.27) | (.27) | —c | —c,d | 9.35 | 9.00 | 11,574 | 1.58 | 3.00 | 12 |
| May 31, 2011 | 9.05 | .30 | (.22) | .08 | (.29) | (.29) | — | —c,e | 8.84 | .97 | 8,487 | 1.57 | 3.36 | 11 |
|
| Class M | | | | | | | | | | | | | | |
| November 30, 2015** | $9.08 | .14 | (.02) | .12 | (.13) | (.13) | — | — | $9.07 | 1.38* | $540 | .54* | 1.48* | — |
| May 31, 2015 | 9.12 | .27 | (.04) | .23 | (.27) | (.27) | — | — | 9.08 | 2.57 | 546 | 1.07 | 3.01 | 16 |
| May 31, 2014 | 9.31 | .29 | (.20) | .09 | (.28) | (.28) | — | — | 9.12 | 1.13 | 498 | 1.08 | 3.21 | 9 |
| May 31, 2013 | 9.35 | .29 | (.04) | .25 | (.29) | (.29) | — | — | 9.31 | 2.68 | 586 | 1.07 | 3.08 | 10 |
| May 31, 2012 | 8.84 | .32 | .51 | .83 | (.32) | (.32) | —c | —c,d | 9.35 | 9.50 | 490 | 1.08 | 3.47 | 12 |
| May 31, 2011 | 9.06 | .34 | (.22) | .12 | (.34) | (.34) | — | —c,e | 8.84 | 1.35 | 852 | 1.07 | 3.85 | 11 |
|
| Class Y | | | | | | | | | | | | | | |
| November 30, 2015** | $9.08 | .16 | —c | .16 | (.16) | (.16) | — | — | $9.08 | 1.75* | $12,032 | .29* | 1.73* | — |
| May 31, 2015 | 9.12 | .32 | (.04) | .28 | (.32) | (.32) | — | — | 9.08 | 3.08 | 12,031 | .57 | 3.52 | 16 |
| May 31, 2014 | 9.32 | .33 | (.20) | .13 | (.33) | (.33) | — | — | 9.12 | 1.52 | 5,519 | .58 | 3.71 | 9 |
| May 31, 2013 | 9.35 | .34 | (.03) | .31 | (.34) | (.34) | — | — | 9.32 | 3.30 | 7,738 | .57 | 3.59 | 10 |
| May 31, 2012 | 8.84 | .36 | .51 | .87 | (.36) | (.36) | —c | —c,d | 9.35 | 10.07 | 6,650 | .58 | 3.98 | 12 |
| May 31, 2011 | 9.06 | .38 | (.22) | .16 | (.38) | (.38) | — | —c,e | 8.84 | 1.87 | 3,650 | .57 | 4.38 | 11 |
|
See notes to financial highlights at the end of this section.
The accompanying notes are an integral part of these financial statements.
| | | |
| 36 | Ohio Tax Exempt Income Fund | Ohio Tax Exempt Income Fund | 37 |
Financial highlights (Continued)
* Not annualized.
** Unaudited.
a Total return assumes dividend reinvestment and does not reflect the effect of sales charges.
b Includes amounts paid through expense offset arrangements, if any (Note 2). Also excludes acquired fund fees and expenses, if any.
c Amount represents less than $0.01 per share.
d Reflects a non-recurring reimbursement related to restitution amounts in connection with a distribution plan approved by the Securities and Exchange Commission (the SEC) which amounted to less than $0.01 per share outstanding on July 21, 2011.
e Reflects a non-recurring reimbursement related to short-term trading related lawsuits, which amounted to less than $0.01 per share outstanding on May 11, 2011.
The accompanying notes are an integral part of these financial statements.
| |
| 38 | Ohio Tax Exempt Income Fund |
Notes to financial statements 11/30/15 (Unaudited)
Within the following Notes to financial statements, references to “State Street” represent State Street Bank and Trust Company, references to “the SEC” represent the Securities and Exchange Commission, references to “Putnam Management” represent Putnam Investment Management, LLC, the fund’s manager, an indirect wholly-owned subsidiary of Putnam Investments, LLC and references to “OTC”, if any, represent over-the-counter. Unless otherwise noted, the “reporting period” represents the period from June 1, 2015 through November 30, 2015.
Putnam Ohio Tax Exempt Income Fund (the fund) is a Massachusetts business trust, which is registered under the Investment Company Act of 1940, as amended, as a diversified open-end management investment company. The goal of the fund is to seek as high a level of current income exempt from federal income tax and Ohio personal income tax as Putnam Management believes is consistent with preservation of capital. The fund invests mainly in bonds that pay interest that is exempt from federal income tax and Ohio personal income tax (but that may be subject to federal alternative minimum tax (AMT)), are investment-grade in quality, and have intermediate- to long-term maturities (three years or longer). Under normal circumstances, the fund invests at least 80% of the fund’s net assets in tax-exempt investments. This investment policy cannot be changed without the approval of the fund’s shareholders. Putnam Management may consider, among other factors, credit, interest rate and prepayment risks, as well as general market conditions, when deciding whether to buy or sell investments.
The fund offers class A, class B, class C, class M and class Y shares. Class A and class M shares are sold with a maximum front-end sales charge of 4.00% and 3.25%, respectively. Class A shares generally do not pay a contingent deferred sales charge and class M shares do not pay a contingent deferred sales charge. Class B shares, which convert to class A shares after approximately eight years, do not pay a front-end sales charge and are subject to a contingent deferred sales charge if those shares are redeemed within six years of purchase. Class C shares have a one-year 1.00% contingent deferred sales charge and do not convert to class A shares. The expenses for class A, class B, class C, and class M shares may differ based on the distribution fee of each class, which is identified in Note 2. Class Y shares, which are sold at net asset value, are generally subject to the same expenses as class A, class B, class C, and class M shares, but do not bear a distribution fee. Class Y shares are not available to all investors.
In the normal course of business, the fund enters into contracts that may include agreements to indemnify another party under given circumstances. The fund’s maximum exposure under these arrangements is unknown as this would involve future claims that may be, but have not yet been, made against the fund. However, the fund’s management team expects the risk of material loss to be remote.
Note 1: Significant accounting policies
The following is a summary of significant accounting policies consistently followed by the fund in the preparation of its financial statements. The preparation of financial statements is in conformity with accounting principles generally accepted in the United States of America and requires management to make estimates and assumptions that affect the reported amounts of assets and liabilities in the financial statements and the reported amounts of increases and decreases in net assets from operations. Actual results could differ from those estimates. Subsequent events after the Statement of assets and liabilities date through the date that the financial statements were issued have been evaluated in the preparation of the financial statements.
Investment income, realized and unrealized gains and losses and expenses of the fund are borne pro-rata based on the relative net assets of each class to the total net assets of the fund, except that each class bears expenses unique to that class (including the distribution fees applicable to such classes). Each class votes as a class only with respect to its own distribution plan or other matters on which a class vote is required by law or determined by the Trustees. If the fund were liquidated, shares of each class would receive their pro-rata share of the net assets of the fund. In addition, the Trustees declare separate dividends on each class of shares.
Security valuation Portfolio securities and other investments are valued using policies and procedures adopted by the Board of Trustees. The Trustees have formed a Pricing Committee to oversee the implementation of these procedures and have delegated responsibility for valuing the fund’s assets in accordance with these procedures to Putnam Management. Putnam Management has established an internal Valuation Committee that is responsible for making fair value determinations, evaluating the effectiveness of the pricing policies of the fund and reporting to the Pricing Committee.
Tax-exempt bonds and notes are generally valued on the basis of valuations provided by an independent pricing service approved by the Trustees. Such services use information with respect to transactions in bonds, quotations
| |
| Ohio Tax Exempt Income Fund | 39 |
from bond dealers, market transactions in comparable securities and various relationships between securities in determining value. These securities will generally be categorized as Level 2.
Certain investments, including certain restricted and illiquid securities and derivatives, are also valued at fair value following procedures approved by the Trustees. To assess the continuing appropriateness of fair valuations, the Valuation Committee reviews and affirms the reasonableness of such valuations on a regular basis after considering all relevant information that is reasonably available. Such valuations and procedures are reviewed periodically by the Trustees. These valuations consider such factors as significant market or specific security events such as interest rate or credit quality changes, various relationships with other securities, discount rates, U.S. Treasury, U.S. swap and credit yields, index levels, convexity exposures, recovery rates, sales and other multiples and resale restrictions. These securities are classified as Level 2 or as Level 3 depending on the priority of the significant inputs. The fair value of securities is generally determined as the amount that the fund could reasonably expect to realize from an orderly disposition of such securities over a reasonable period of time. By its nature, a fair value price is a good faith estimate of the value of a security in a current sale and does not reflect an actual market price, which may be different by a material amount.
Security transactions and related investment income Security transactions are recorded on the trade date (the date the order to buy or sell is executed). Gains or losses on securities sold are determined on the identified cost basis.
Interest income is recorded on the accrual basis. All premiums/discounts are amortized/accreted on a yield-to-maturity basis. The premium in excess of the call price, if any, is amortized to the call date; thereafter, any remaining premium is amortized to maturity.
Interfund lending The fund, along with other Putnam funds, may participate in an interfund lending program pursuant to an exemptive order issued by the SEC. This program allows the fund to borrow from other Putnam funds that permit such transactions. Interfund lending transactions are subject to each fund’s investment policies and borrowing and lending limits. Interest earned or paid on the interfund lending transaction will be based on the average of certain current market rates. During the reporting period, the fund did not utilize the program.
Lines of credit The fund participates, along with other Putnam funds, in a $392.5 million syndicated unsecured committed line of credit provided by State Street ($292.5 million) and Northern Trust Company ($100 million) and a $235.5 million unsecured uncommitted line of credit provided by State Street. Borrowings may be made for temporary or emergency purposes, including the funding of shareholder redemption requests and trade settlements. Interest is charged to the fund based on the fund’s borrowing at a rate equal to the higher of (1) the Federal Funds rate and (2) the overnight LIBOR plus 1.25% for the committed line of credit and the Federal Funds rate plus 1.30% for the uncommitted line of credit. A closing fee equal to 0.04% of the committed line of credit and 0.04% of the uncommitted line of credit has been paid by the participating funds. In addition, a commitment fee of 0.16% per annum on any unutilized portion of the committed line of credit is allocated to the participating funds based on their relative net assets and paid quarterly. During the reporting period, the fund had no borrowings against these arrangements.
Federal taxes It is the policy of the fund to distribute all of its income within the prescribed time period and otherwise comply with the provisions of the Internal Revenue Code of 1986, as amended (the Code), applicable to regulated investment companies. It is also the intention of the fund to distribute an amount sufficient to avoid imposition of any excise tax under Section 4982 of the Code.
The fund is subject to the provisions of Accounting Standards Codification 740 Income Taxes (ASC 740). ASC 740 sets forth a minimum threshold for financial statement recognition of the benefit of a tax position taken or expected to be taken in a tax return. The fund did not have a liability to record for any unrecognized tax benefits in the accompanying financial statements. No provision has been made for federal taxes on income, capital gains or unrealized appreciation on securities held nor for excise tax on income and capital gains. Each of the fund’s federal tax returns for the prior three fiscal years remains subject to examination by the Internal Revenue Service.
| |
| 40 | Ohio Tax Exempt Income Fund |
At May 31, 2015, the fund had a capital loss carryover of $2,957,608 available to the extent allowed by the Code to offset future net capital gain, if any. The amounts of the carryovers and the expiration dates are:
| | | |
| Loss carryover |
|
| Short-term | Long-term | Total | Expiration |
|
| $609,393 | $1,623,623 | $2,233,016 | * |
|
| 413,222 | N/A | 413,222 | May 31, 2017 |
|
| 97,718 | N/A | 97,718 | May 31, 2018 |
|
| 213,652 | N/A | 213,652 | May 31, 2019 |
|
* Under the Regulated Investment Company Modernization Act of 2010, the fund will be permitted to carry forward capital losses incurred in taxable years beginning after December 22, 2010 for an unlimited period. However, any losses incurred will be required to be utilized prior to the losses incurred in pre-enactment tax years. As a result of this ordering rule, pre-enactment capital loss carryforwards may be more likely to expire unused. Additionally, post-enactment capital losses that are carried forward will retain their character as either short-term or long-term capital losses rather than being considered all short-term as under previous law.
Pursuant to federal income tax regulations applicable to regulated investment companies, the fund has elected to defer certain capital losses of $55,393 recognized during the period between November 1, 2014 and May 31, 2015 to its fiscal year ending May 31, 2016.
The aggregate identified cost on a tax basis is $127,611,970, resulting in gross unrealized appreciation and depreciation of $8,512,367 and $433,729, respectively, or net unrealized appreciation of $8,078,638.
Distributions to shareholders Income dividends are recorded daily by the fund and are paid monthly. Distributions from capital gains, if any, are recorded on the ex-dividend date and paid at least annually. The amount and character of income and gains to be distributed are determined in accordance with income tax regulations which may differ from generally accepted accounting principles. Dividend sources are estimated at the time of declaration. Actual results may vary. Any non-taxable return of capital cannot be determined until final tax calculations are completed after the end of the fund’s fiscal year. Reclassifications are made to the fund’s capital accounts to reflect income and gains available for distribution (or available capital loss carryovers) under income tax regulations.
Note 2: Management fee, administrative services and other transactions
The fund pays Putnam Management a management fee (based on the fund’s average net assets and computed and paid monthly) at annual rates that may vary based on the average of the aggregate net assets of most open-end funds, as defined in the fund’s management contract, sponsored by Putnam Management. Such annual rates may vary as follows:
| | | | |
| 0.590% | of the first $5 billion, | | 0.390% | of the next $50 billion, |
| |
|
| 0.540% | of the next $5 billion, | | 0.370% | of the next $50 billion, |
| |
|
| 0.490% | of the next $10 billion, | | 0.360% | of the next $100 billion and |
| |
|
| 0.440% | of the next $10 billion, | | 0.355% | of any excess thereafter. |
| |
|
Putnam Management has contractually agreed, through September 30, 2016, to waive fees or reimburse the fund’s expenses to the extent necessary to limit the cumulative expenses of the fund, exclusive of brokerage, interest, taxes, investment-related expenses, extraordinary expenses, acquired fund fees and expenses and payments under the fund’s investor servicing contract, investment management contract and distribution plans, on a fiscal year-to-date basis to an annual rate of 0.20% of the fund’s average net assets over such fiscal year-to-date period. During the reporting period, the fund’s expenses were not reduced as a result of this limit.
Putnam Investments Limited (PIL), an affiliate of Putnam Management, is authorized by the Trustees to manage a separate portion of the assets of the fund as determined by Putnam Management from time to time. Putnam Management pays a quarterly sub-management fee to PIL for its services at an annual rate of 0.40% of the average net assets of the portion of the fund managed by PIL.
The fund reimburses Putnam Management an allocated amount for the compensation and related expenses of certain officers of the fund and their staff who provide administrative services to the fund. The aggregate amount of all such reimbursements is determined annually by the Trustees.
| |
| Ohio Tax Exempt Income Fund | 41 |
Custodial functions for the fund’s assets are provided by State Street. Custody fees are based on the fund’s asset level, the number of its security holdings and transaction volumes.
Putnam Investor Services, Inc., an affiliate of Putnam Management, provides investor servicing agent functions to the fund. Putnam Investor Services, Inc. received fees for investor servicing that included (1) a per account fee for each direct and underlying non-defined contribution account (“retail account”) of the fund and each of the other funds in its specified category, which was totaled and then allocated to each fund in the category based on its average daily net assets; (2) a specified rate of the fund’s assets attributable to defined contribution plan accounts; and (3) a specified rate based on the average net assets in retail accounts. Putnam Investor Services has agreed that the aggregate investor servicing fees for each fund’s retail and defined contribution accounts will not exceed an annual rate of 0.320% of the fund’s average assets attributable to such accounts. During the reporting period, the expenses for each class of shares related to investor servicing fees were as follows:
| | | | |
| Class A | $39,732 | | Class M | 185 |
| |
|
| Class B | 590 | | Class Y | 4,113 |
| |
|
| Class C | 3,718 | | Total | $48,338 |
| |
|
The fund has entered into expense offset arrangements with Putnam Investor Services, Inc. and State Street whereby Putnam Investor Services, Inc.’s and State Street’s fees are reduced by credits allowed on cash balances. For the reporting period, the fund’s expenses were reduced by $81 under the expense offset arrangements.
Each Independent Trustee of the fund receives an annual Trustee fee, of which $90, as a quarterly retainer, has been allocated to the fund, and an additional fee for each Trustees meeting attended. Trustees also are reimbursed for expenses they incur relating to their services as Trustees.
The fund has adopted a Trustee Fee Deferral Plan (the Deferral Plan) which allows the Trustees to defer the receipt of all or a portion of Trustees fees payable on or after July 1, 1995. The deferred fees remain invested in certain Putnam funds until distribution in accordance with the Deferral Plan.
The fund has adopted an unfunded noncontributory defined benefit pension plan (the Pension Plan) covering all Trustees of the fund who have served as a Trustee for at least five years and were first elected prior to 2004. Benefits under the Pension Plan are equal to 50% of the Trustee’s average annual attendance and retainer fees for the three years ended December 31, 2005. The retirement benefit is payable during a Trustee’s lifetime, beginning the year following retirement, for the number of years of service through December 31, 2006. Pension expense for the fund is included in Trustee compensation and expenses in the Statement of operations. Accrued pension liability is included in Payable for Trustee compensation and expenses in the Statement of assets and liabilities. The Trustees have terminated the Pension Plan with respect to any Trustee first elected after 2003.
The fund has adopted distribution plans (the Plans) with respect to its class A, class B, class C and class M shares pursuant to Rule 12b–1 under the Investment Company Act of 1940. The purpose of the Plans is to compensate Putnam Retail Management Limited Partnership, an indirect wholly-owned subsidiary of Putnam Investments, LLC, for services provided and expenses incurred in distributing shares of the fund. The Plans provide for payments by the fund to Putnam Retail Management Limited Partnership at an annual rate of up to 0.35%, 1.00%, 1.00% and 1.00% of the average net assets attributable to class A, class B, class C and class M shares, respectively. The Trustees have approved payment by the fund at the annual rate of 0.85%, 1.00% and 0.50% of the average net assets for class B, class C and class M shares, respectively. For class A shares, the annual payment rate will equal the weighted average of (i) 0.20% on the net assets of the fund attributable to class A shares purchased and paid for prior to April 1, 2005 and (ii) 0.25% on all other net assets of the fund attributable to class A shares. During the reporting period, the class specific expenses related to distribution fees were as follows:
| | | | |
| Class A | $130,461 | | Class M | 1,351 |
| |
|
| Class B | 7,320 | | Total | $193,455 |
| |
|
| Class C | 54,323 | | | |
| | |
For the reporting period, Putnam Retail Management Limited Partnership, acting as underwriter, received net commissions of $5,602 and no monies from the sale of class A and class M shares, respectively, and received $12 and $19 in contingent deferred sales charges from redemptions of class B and class C shares, respectively.
A deferred sales charge of up to 1.00% is assessed on certain redemptions of class A shares. For the reporting period, Putnam Retail Management Limited Partnership, acting as underwriter, received no monies on class A redemptions.
| |
| 42 | Ohio Tax Exempt Income Fund |
Note 3: Purchases and sales of securities
During the reporting period, the cost of purchases and proceeds from sales, excluding short-term investments, were as follows:
| | |
| | Cost of purchases | Proceeds from sales |
|
| Investments in securities (Long-term) | $— | $3,994,284 |
|
| U.S. government securities (Long-term) | — | — |
|
| Total | $— | $3,994,284 |
|
Note 4: Capital shares
At the close of the reporting period, there were an unlimited number of shares of beneficial interest authorized. Transactions in capital shares were as follows:
| | | | |
| | Six months ended 11/30/15 | Year ended 5/31/15 |
|
| Class A | Shares | Amount | Shares | Amount |
|
| Shares sold | 196,620 | $1,777,938 | 1,101,449 | $10,053,272 |
|
| Shares issued in connection with | | | | |
| reinvestment of distributions | 184,118 | 1,667,697 | 381,818 | 3,491,038 |
|
| | 380,738 | 3,445,635 | 1,483,267 | 13,544,310 |
|
| Shares repurchased | (646,654) | (5,846,383) | (2,012,144) | (18,367,642) |
|
| Net decrease | (265,916) | $(2,400,748) | (528,877) | $(4,823,332) |
|
| |
| | Six months ended 11/30/15 | Year ended 5/31/15 |
|
| Class B | Shares | Amount | Shares | Amount |
|
| Shares sold | 785 | $7,093 | 19,141 | $174,468 |
|
| Shares issued in connection with | | | | |
| reinvestment of distributions | 2,341 | 21,177 | 4,864 | 44,424 |
|
| | 3,126 | 28,270 | 24,005 | 218,892 |
|
| Shares repurchased | (17,781) | (160,659) | (24,812) | (225,636) |
|
| Net decrease | (14,655) | $(132,389) | (807) | $(6,744) |
|
| |
| | Six months ended 11/30/15 | Year ended 5/31/15 |
|
| Class C | Shares | Amount | Shares | Amount�� |
|
| Shares sold | 68,619 | $620,228 | 231,536 | $2,111,596 |
|
| Shares issued in connection with | | | | |
| reinvestment of distributions | 13,290 | 120,401 | 26,880 | 245,793 |
|
| | 81,909 | 740,629 | 258,416 | 2,357,389 |
|
| Shares repurchased | (100,685) | (911,623) | (239,783) | (2,188,333) |
|
| Net increase (decrease) | (18,776) | $(170,994) | 18,633 | $169,056 |
|
| |
| | Six months ended 11/30/15 | Year ended 5/31/15 |
|
| Class M | Shares | Amount | Shares | Amount |
|
| Shares sold | 22 | $194 | 4,289 | $39,171 |
|
| Shares issued in connection with | | | | |
| reinvestment of distributions | 716 | 6,488 | 1,344 | 12,290 |
|
| | 738 | 6,682 | 5,633 | 51,461 |
|
| Shares repurchased | (1,416) | (12,802) | (33) | (300) |
|
| Net increase (decrease) | (678) | $(6,120) | 5,600 | $51,161 |
|
| |
| Ohio Tax Exempt Income Fund | 43 |
| | | | |
| | Six months ended 11/30/15 | Year ended 5/31/15 |
|
| Class Y | Shares | Amount | Shares | Amount |
|
| Shares sold | 81,626 | $739,426 | 836,244 | $7,634,241 |
|
| Shares issued in connection with | | | | |
| reinvestment of distributions | 15,698 | 142,322 | 24,133 | 221,081 |
|
| | 97,324 | 881,748 | 860,377 | 7,855,322 |
|
| Shares repurchased | (96,598) | (873,458) | (140,347) | (1,286,714) |
|
| Net increase | 726 | $8,290 | 720,030 | $6,568,608 |
|
Note 5: Market, credit and other risks
In the normal course of business, the fund trades financial instruments and enters into financial transactions where risk of potential loss exists due to changes in the market (market risk) or failure of the contracting party to the transaction to perform (credit risk). The fund may be exposed to additional credit risk that an institution or other entity with which the fund has unsettled or open transactions will default. The fund focuses a majority of its investments in the state of Ohio and may be affected by economic and political developments in that state.
| |
| 44 | Ohio Tax Exempt Income Fund |
Fund information
Founded over 75 years ago, Putnam Investments was built around the concept that a balance between risk and reward is the hallmark of a well-rounded financial program. We manage over 100 funds across income, value, blend, growth, asset allocation, absolute return, and global sector categories.
| | |
| Investment Manager | Trustees | Robert R. Leveille |
| Putnam Investment | Jameson A. Baxter, Chair | Vice President and |
| Management, LLC | Liaquat Ahamed | Chief Compliance Officer |
| One Post Office Square | Ravi Akhoury | |
| Boston, MA 02109 | Barbara M. Baumann | Michael J. Higgins |
| | Robert J. Darretta | Vice President, Treasurer, |
| Investment Sub-Manager | Katinka Domotorffy | and Clerk |
| Putnam Investments Limited | John A. Hill | |
| 57–59 St James’s Street | Paul L. Joskow | Janet C. Smith |
| London, England SW1A 1LD | Kenneth R. Leibler | Vice President, |
| Robert E. Patterson | Principal Accounting Officer, |
| Marketing Services | George Putnam, III | and Assistant Treasurer |
| Putnam Retail Management | Robert L. Reynolds | |
| One Post Office Square | W. Thomas Stephens | Susan G. Malloy |
| Boston, MA 02109 | | Vice President and |
| | Officers | Assistant Treasurer |
| Custodian | Robert L. Reynolds | |
| State Street Bank | President | James P. Pappas |
| and Trust Company | | Vice President |
| | Jonathan S. Horwitz | |
| Legal Counsel | Executive Vice President, | Mark C. Trenchard |
| Ropes & Gray LLP | Principal Executive Officer, and | Vice President and |
| Compliance Liaison | BSA Compliance Officer |
| | | |
| | Steven D. Krichmar | Nancy E. Florek |
| | Vice President and | Vice President, Director of |
| | Principal Financial Officer | Proxy Voting and Corporate |
| | | Governance, Assistant Clerk, |
| | Robert T. Burns | and Associate Treasurer |
| | Vice President and | |
| | Chief Legal Officer | |
This report is for the information of shareholders of Putnam Ohio Tax Exempt Income Fund. It may also be used as sales literature when preceded or accompanied by the current prospectus, the most recent copy of Putnam’s Quarterly Performance Summary, and Putnam’s Quarterly Ranking Summary. For more recent performance, please visit putnam.com. Investors should carefully consider the investment objectives, risks, charges, and expenses of a fund, which are described in its prospectus. For this and other information or to request a prospectus or summary prospectus, call 1-800-225-1581 toll free. Please read the prospectus carefully before investing. The fund’s Statement of Additional Information contains additional information about the fund’s Trustees and is available without charge upon request by calling 1-800-225-1581.

| |
| Item 3. Audit Committee Financial Expert: |
| |
| Item 4. Principal Accountant Fees and Services: |
| |
| Item 5. Audit Committee of Listed Registrants |
| |
| Item 6. Schedule of Investments: |
| |
| The registrant’s schedule of investments in unaffiliated issuers is included in the report to shareholders in Item 1 above. |
| |
| Item 7. Disclosure of Proxy Voting Policies and Procedures For Closed-End Management Investment Companies: |
| |
| Item 8. Portfolio Managers of Closed-End Investment Companies |
| |
| Item 9. Purchases of Equity Securities by Closed-End Management Investment Companies and Affiliated Purchasers: |
| |
| Item 10. Submission of Matters to a Vote of Security Holders: |
| |
| Item 11. Controls and Procedures: |
| |
| (a) The registrant’s principal executive officer and principal financial officer have concluded, based on their evaluation of the effectiveness of the design and operation of the registrant’s disclosure controls and procedures as of a date within 90 days of the filing date of this report, that the design and operation of such procedures are generally effective to provide reasonable assurance that information required to be disclosed by the registrant in this report is recorded, processed, summarized and reported within the time periods specified in the Commission’s rules and forms. |
| |
| (b) Changes in internal control over financial reporting: Not applicable |
| |
| (a)(2) Separate certifications for the principal executive officer and principal financial officer of the registrant as required by Rule 30a-2(a) under the Investment Company Act of 1940, as amended, are filed herewith. |
| |
| (b) The certifications required by Rule 30a-2(b) under the Investment Company Act of 1940, as amended, are filed herewith. |
| |
| Putnam Ohio Tax Exempt Income Fund |
| |
| By (Signature and Title): |
| |
| /s/ Janet C. Smith
Janet C. Smith
Principal Accounting Officer
|
| |
| Pursuant to the requirements of the Securities Exchange Act of 1934 and the Investment Company Act of 1940, this report has been signed below by the following persons on behalf of the registrant and in the capacities and on the dates indicated. |
| |
| By (Signature and Title): |
| |
| /s/ Jonathan S. Horwitz
Jonathan S. Horwitz
Principal Executive Officer
|
| |
| By (Signature and Title): |
| |
| /s/ Steven D. Krichmar
Steven D. Krichmar
Principal Financial Officer
|