Exhibit 13
celebrating 25 years of building kitchens and baths of pride

American Woodmark Corporation celebrated its 25th Anniversary in 2005 and a quarter century of growth and achievement. The company is proud of its heritage and thanks its employees, retirees and partners for their dedication to making Kitchens and Baths of Pride for the American family.
Did You Know...
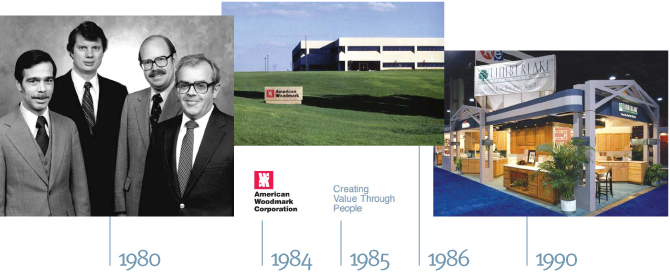
1980—Company co-founders,(from left to right)Don Mathias, Bill Brandt, Jeff Holcomb and Al Graber, initiated a leveraged buyout of the cabinet division of Boise Cascade Corporation to form American Woodmark Corporation.
The new company opened its first distribution center in Atlanta, Ga. to handle the growing business in the Southeast and with The Home Depot, a newly formed home center company with four stores located in the Atlanta area.
1984—The first regional manufacturing plant opened in Jackson, Ga.
1985—The company created a mission statement that became the cornerstone of the company’s culture and, to this day, is the fabric of American Woormark’s guiding principles.
1986—In March, American Woodmark moved into a new headquarters office in Winchester, Va., and in July, took the company “public.”
1990—The company introduced the Timberlake® brand of cabinets.
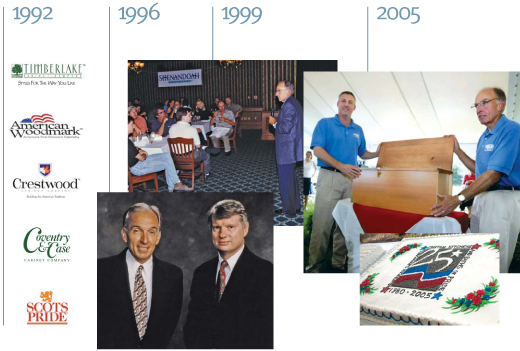
1992—The product line expanded to 100 door styles and five brands.
1996—Bill Brandt(right)turned over CEO responsibilities to Jake Gosa(left).
1999—The company introduced the Shenandoah Cabinetry® brand at Lowe’s.
2005—Employees across the country celebrated the company’s 25th Anniversary with a “time cabinet” ceremony. Shown here is the celebration at the head office in Winchester, VA. The time cabinet was closed by Kent Guichard, COO(left), and Jake Gosa, Chairman, President and CEO(right).
Most regional offices and manufacturing locations celebrated with community service activities, a commemorative cake and other festivities.

table of contents
| | |
| 2 | | Company Profile |
| |
| 3 | | Financial Highlights |
| |
| 3 | | Market Information |
| |
| 4 | | Letter from the President |
| |
| 11 | | Five-Year Selected Financial Information |
| |
| 12 | | Management’s Discussion and Analysis |
| |
| 20 | | Consolidated Financial Statements |
| |
| 24 | | Notes to Consolidated Financial Statements |
| |
| 37 | | Reports of Independent Registered Public Accounting Firms |
| |
| 39 | | Management’s Report on Internal Control over Financial Reporting |
| |
| 40 | | Report of Independent Registered Public Accounting Firm |
| |
| 41 | | Directors and Executive Officers |
| |
| 41 | | Corporate Information |
mission statement
creating value
through people
WHO WE ARE
American Woodmark is an organization of employees and shareholders who have combined their resources to pursue a common goal.
WHAT WE DO
Our common goal is to create value by providing kitchens and baths “of pride” for the American family.
WHY WE DO IT
We pursue this goal to earn a profit, which allows us to reward our shareholders and employees and to make a contribution to our society.
HOW WE DO IT
Four principles guide our actions:
CUSTOMER SATISFACTION Providing the best possible quality, service and value to the greatest number of people. Doing whatever is reasonable, and sometimes unreasonable, to make certain that each customer’s needs are met each and every day.
INTEGRITY Doing what is right. Caring about the dignity and rights of each individual. Acting fairly and responsibly with all parties. Being a good citizen in the communities in which we operate.
TEAMWORK Understanding that we must all work together if we are to be successful. Realizing that each individual must contribute to the team to remain a member of the team.
EXCELLENCE Striving to perform every job or action in a superior way. Being innovative, seeking new and better ways to get things done. Helping all individuals to become the best that they can be in their jobs and careers.
ONCE WE’VE DONE IT
When we achieve our goal good things happen: sales increase, profits are made, shareholders and employees are rewarded, jobs are created, our communities benefit, we have fun, and our customers are happy and proud—with a new kitchen or bath from American Woodmark.
AMERICAN WOODMARK CORPORATION® 2006 ANNUAL REPORT 1
company profile

American Woodmark Corporation manufactures and distributes kitchen cabinets and vanities for the remodeling and new home construction markets. The Company operates 15 manufacturing facilities located in Arizona, Georgia, Indiana, Kentucky, Maryland, Minnesota, Oklahoma, Tennessee, Virginia, and West Virginia and 9 service centers across the country.
American Woodmark Corporation was formed in 1980 and became a public company through a common stock offering in July, 1986.
The Company offers approximately 340 cabinet lines in a wide variety of designs, materials, and finishes. Products are sold across the United States through a network of independent distributors and directly to home centers and major builders. Approximately 62% of sales during fiscal year 2006 were to the remodeling market and 38% to the new home market.
The Company believes it is one of the three largest manufacturers of kitchen cabinets in the United States.
2 AMERICAN WOODMARK CORPORATION® 2006 ANNUAL REPORT

financial highlights
| | | | | | | | | | | | |
| | | FISCAL YEARS ENDED APRIL 30 | |
(in thousands, except per share data) | | 2006 | | | 2005 | | | 2004 | |
OPERATIONS | | | | | | | | | | | | |
Net sales | | $ | 837,671 | | | $ | 776,990 | | | $ | 667,547 | |
Operating income | | | 53,419 | | | | 58,367 | | | | 52,404 | |
Net income | | | 33,210 | | | | 35,591 | | | | 31,707 | |
Earnings per share | | | | | | | | | | | | |
Basic | | $ | 2.04 | | | $ | 2.16 | | | $ | 1.96 | |
Diluted | | | 2.00 | | | | 2.11 | | | | 1.90 | |
Average shares outstanding | | | | | | | | | | | | |
Basic | | | 16,280 | | | | 16,473 | | | | 16,188 | |
Diluted | | | 16,586 | | | | 16,880 | | | | 16,668 | |
FINANCIAL POSITION | | | | | | | | | | | | |
Working capital | | $ | 100,526 | | | $ | 74,112 | | | $ | 69,338 | |
Total assets | | | 377,543 | | | | 361,168 | | | | 307,051 | |
Long-term debt, net of current maturities | | | 27,761 | | | | 29,217 | | | | 18,028 | |
Shareholders’ equity | | | 241,661 | | | | 215,191 | | | | 193,145 | |
Long-term debt to capital ratio | | | 10.3 | % | | | 12.0 | % | | | 8.5 | % |

market information
American Woodmark Corporation common stock, no par value, is quoted on The NASDAQ National Market under the “AMWD” symbol. Common stock per share market prices and cash dividends declared during the last two fiscal years were as follows:
| | | | | | | | | |
| | | MARKET PRICE | | DIVIDENDS |
(in dollars) | | High | | Low | | DECLARED |
FISCAL 2006 | | | | | | | | | |
First quarter | | $ | 36.90 | | $ | 27.75 | | $ | 0.03 |
Second quarter | | | 38.95 | | | 27.77 | | | 0.03 |
Third quarter | | | 32.66 | | | 23.00 | | | 0.03 |
Fourth quarter | | | 41.00 | | | 28.26 | | | 0.03 |
| | | |
FISCAL 2005 | | | | | | | | | |
First quarter | | $ | 32.68 | | $ | 26.56 | | $ | 0.025 |
Second quarter | | | 40.00 | | | 27.36 | | | 0.03 |
Third quarter | | | 48.75 | | | 37.00 | | | 0.03 |
Fourth quarter | | | 43.55 | | | 31.13 | | | 0.03 |
As of June 7, 2006, there were approximately 10,000 shareholders of record of the Company’s common stock. Included are approximately 80% of the Company’s employees, who are shareholders through the American Woodmark Stock Ownership Plan.
AMERICAN WOODMARK CORPORATION® 2006 ANNUAL REPORT 3
to our shareholders

Fiscal year 2006 proved to be one of the most difficult, and one of the most rewarding years in my memory. We began the year beset with an operational crisis that began in the second half of our fiscal year 2005. Our problems started with a breakdown in our materials planning systems. Additionally, the bankruptcy of one of our major freight carriers coupled with the decision of another to exit the business required us to replace the majority of our carrier network at the same time. The combination of these internal and external events sent us into fiscal year 2006 facing a very difficult operating environment. To no one’s surprise, writing this letter is a much more pleasurable experience than last year’s.
4 AMERICAN WOODMARK CORPORATION® 2006 ANNUAL REPORT

As is the case in most high-growth organizations, our company has a strong need to constantly reevaluate systems and services to stay ahead of a rapidly changing environment. During the first half of fiscal year 2006, we undertook a number of key initiatives that had a major impact on the remainder of the year and, I believe, our future.
Last May, we launched a new quality organization with the challenge to reinvent our quality systems while also infusing a new level of human energy to yield the benefits of lower costs and industry leadership. At the same time, many of our internal planning systems and processes were overhauled to give managers significantly more visibility over materials movement and planning. Additionally, most of our carrier network was replaced, and we significantly expanded the size of our internal logistics support staff that selects, trains and oversees our carriers. Finally, we also began to exit certain low margin product categories.
AMERICAN WOODMARK CORPORATION® 2006 ANNUAL REPORT 5

In my letter last year, I told you that rebuilding our margin structure was one of my top priorities. Apart from the difficult operating events that I described above, three things have contributed to the erosion of our margins.
First, raw material costs have been increasing. During fiscal 2006 we took various pricing actions to remedy those cost pressures. To date, I can report that while future cost pressures continue to exist, the industry has begun to offset the impact of these cost increases and should continue to do so as conditions warrant.
Second, increases in diesel fuel and other systemic transportation issues have combined to drive higher freight costs. We have responded by passing along these increases where necessary.
Third, our sales mix devoted to low margin product categories, particularly the “in-stock” retail category, had evolved to a point where it occupied far too much of our production capacity and was diluting our margins. The impact of exiting this business will allow us to relieve our capacity pressures and backfill with more attractive core business that will significantly enhance both our profit margins and return on equity.
AMERICAN WOODMARK CORPORATION® 2006 ANNUAL REPORT 7
As we close out fiscal year 2006, I am delighted to report that the Company recovered with impressive speed. The first two quarters were well below expectations as we recovered from those operating events. Although third quarter earnings were also less than that of the prior year, our operations were solid and margins began to improve as we rebuilt our sales backlog. During the fourth quarter, the benefits of improved operations and sales order rates combined to restore profits to record levels. Most gratifying was the recovery of our gross margins to 21.1%, within the range of 21% to 23% that we believe the business should sustainably operate. For the year, sales were $837.7 million, 8% higher than $777.0 million in 2005, while net income was $33.2 million, 7% lower than the $35.6 million we earned in 2005.
Despite the problems we experienced in the first half of the year, our financial position grew even stronger. We generated over $40 million in free cash flow, repurchased over 3% of our outstanding stock and reduced debt to 10.3% of our total capitalization, while increasing our cash balance by over $20 million.
Before moving on to fiscal year 2007, I want to recognize the outstanding efforts of the entire organization. While the performance of the sales and marketing and manufacturing organizations speak for themselves, I particularly want to call out the outstanding efforts of our staff functions. Their superior contributions greatly
8 AMERICAN WOODMARK CORPORATION® 2006 ANNUAL REPORT

enabled our recovery. Our Management Information Systems, Human Resource and Finance groups all contributed to the Company-wide effort to meet the elevated standards that we established. My personal thanks go out to the more than 6,000 people that make up the American Woodmark team.
As we enter fiscal year 2007, we are in a very strong operating position. Our quality process is paying dividends, and I expect more good results throughout the year. The positive momentum realized in the third and fourth quarters of fiscal 2006 will carry us into the new year.
As we look forward to the period ahead, we face many uncertainties: high energy prices, rising interest rates, and a softening new construction market. On the positive side, the jobs outlook is good, consumer confidence has hovered near a four-year high for several months, and the underpinnings for housing and remodeling demand remain excellent. We believe the fundamentals for housing and remodeling demand will remain positive for years to come and that American Woodmark is well positioned to capitalize on this opportunity.

James J. Gosa
Chairman, President and CEO
10 AMERICAN WOODMARK CORPORATION® 2006 ANNUAL REPORT
FIVE-YEAR SELECTED FINANCIAL INFORMATION
| | | | | | | | | | | | | | | | | | | | |
| | | FISCAL YEARS ENDED APRIL 30 | |
(in millions, except per share data) | | 2006 | | | 2005 | | | 2004 | | | 2003 | | | 2002 | |
FINANCIAL STATEMENT DATA | | | | | | | | | | | | | | | | | | | | |
Net sales | | $ | 837.7 | | | $ | 777.0 | | | $ | 667.5 | | | $ | 563.5 | | | $ | 499.0 | |
Income before income taxes | | | 53.7 | | | | 58.3 | | | | 52.0 | | | | 53.9 | | | | 53.1 | |
Net income | | | 33.2 | | | | 35.6 | | | | 31.7 | | | | 32.7 | | | | 32.2 | |
Earnings per share:1 | | | | | | | | | | | | | | | | | | | | |
Basic | | | 2.04 | | | | 2.16 | | | | 1.96 | | | | 2.00 | | | | 1.97 | |
Diluted | | | 2.00 | | | | 2.11 | | | | 1.90 | | | | 1.95 | | | | 1.90 | |
Depreciation and amortization expense | | | 37.0 | | | | 33.4 | | | | 27.7 | | | | 27.7 | | | | 23.8 | |
Total assets | | | 377.5 | | | | 361.2 | | | | 307.1 | | | | 262.7 | | | | 234.2 | |
Long-term debt, net of current maturities | | | 27.8 | | | | 29.2 | | | | 18.0 | | | | 19.0 | | | | 14.4 | |
Shareholders’ equity | | | 241.7 | | | | 215.2 | | | | 193.1 | | | | 160.1 | | | | 145.2 | |
Cash dividends declared per share | | | .12 | | | | .115 | | | | .10 | | | | .10 | | | | .10 | |
Average shares outstanding1 | | | | | | | | | | | | | | | | | | | | |
Basic | | | 16.3 | | | | 16.5 | | | | 16.2 | | | | 16.3 | | | | 16.4 | |
Diluted | | | 16.6 | | | | 16.9 | | | | 16.7 | | | | 16.8 | | | | 16.8 | |
| | | | | |
PERCENT OF SALES | | | | | | | | | | | | | | | | | | | | |
Gross profit | | | 17.9 | % | | | 19.6 | % | | | 20.6 | % | | | 23.6 | % | | | 25.8 | % |
Selling, general and administrative expenses | | | 11.5 | | | | 12.1 | | | | 12.7 | | | | 13.9 | | | | 15.0 | |
Income before income taxes | | | 6.4 | | | | 7.5 | | | | 7.8 | | | | 9.6 | | | | 10.6 | |
Net income | | | 4.0 | | | | 4.6 | | | | 4.7 | | | | 5.8 | | | | 6.4 | |
| | | | | |
RATIO ANALYSIS | | | | | | | | | | | | | | | | | | | | |
Current ratio | | | 2.2 | | | | 1.9 | | | | 1.9 | | | | 1.8 | | | | 1.4 | |
Inventory turnover2 | | | 10.3 | | | | 10.4 | | | | 10.6 | | | | 10.8 | | | | 11.4 | |
Collection period – days3 | | | 35.5 | | | | 32.2 | | | | 32.6 | | | | 31.3 | | | | 31.8 | |
Percentage of capital (long-term debt plus equity): | | | | | | | | | | | | | | | | | | | | |
Long-term debt, net of current maturities | | | 10.3 | % | | | 12.0 | % | | | 8.5 | % | | | 10.6 | % | | | 9.0 | % |
Equity | | | 89.7 | | | | 88.0 | | | | 91.5 | | | | 89.4 | | | | 91.0 | |
Return on equity (average %) | | | 14.5 | | | | 17.4 | | | | 18.0 | | | | 21.4 | | | | 25.3 | |
| 1 | All share and per share information have been restated to reflect a two-for-one stock split, effective September 24, 2004. |
| 2 | Based on average of beginning and ending inventory. |
| 3 | Based on ratio of monthly average customer receivables to average sales per day. |
AMERICAN WOODMARK CORPORATION® 2006 ANNUAL REPORT 11
financial review
2006
management’s discussion and analysis
RESULTS OF OPERATIONS
The following table sets forth certain income and expense items as a percentage of net sales.
| | | | | | | | | |
| | | PERCENTAGE OF NET SALES | |
| | | Years Ended April 30 | |
| | | 2006 | | | 2005 | | | 2004 | |
Net sales | | 100.0 | % | | 100.0 | % | | 100.0 | % |
Cost of sales and distribution | | 82.1 | | | 80.4 | | | 79.4 | |
Gross profit | | 17.9 | | | 19.6 | | | 20.6 | |
Selling and marketing expenses | | 8.4 | | | 8.7 | | | 8.9 | |
General and administrative expenses | | 3.1 | | | 3.4 | | | 3.8 | |
Operating income | | 6.4 | | | 7.5 | | | 7.9 | |
Interest expense/other (income) expense | | 0.0 | | | 0.0 | | | 0.1 | |
Income before income taxes | | 6.4 | | | 7.5 | | | 7.8 | |
Income tax expense | | 2.4 | | | 2.9 | | | 3.0 | |
Net income | | 4.0 | | | 4.6 | | | 4.7 | |
The following discussion should be read in conjunction with the Selected Financial Data and the Consolidated Financial Statements and the related notes contained elsewhere herein.
12 AMERICAN WOODMARK CORPORATION® 2006 ANNUAL REPORT
FORWARD-LOOKING STATEMENTS
This report contains statements concerning the Company’s expectations, plans, objectives, future financial performance, and other statements that are not historical facts. These statements are “forward-looking statements” within the meaning of the Private Securities Litigation Reform Act of 1995. In most cases, the reader can identify these forward-looking statements by words such as “anticipate,” “estimate,” “forecast,” “expect,” “believe,” “should,” “could,” “plan,” “may” or other similar words. Forward-looking statements contained in this Management’s Discussion and Analysis are based on current expectations and our actual results may differ materially from those projected in any forward-looking statements. In addition, we participate in an industry that is subject to rapidly changing conditions and there are numerous factors that could cause the Company to experience a decline in sales and/or earnings. These include (1) overall industry demand at reduced levels, (2) economic weakness in a specific channel of distribution, (3) the loss of sales from specific customers due to their loss of market share, bankruptcy or switching to a competitor, (4) a sudden and significant rise in basic raw material costs, (5) a dramatic increase to the cost of diesel fuel and/or transportation related services, (6) the need to respond to price or product initiatives launched by a competitor, and (7) sales growth at a rate that outpaces the Company’s ability to install new capacity. While the Company believes that these risks are manageable and will not adversely impact the long-term performance of the Company, these risks could, under certain circumstances, have a materially adverse impact on operating results.
OVERVIEW
American Woodmark Corporation manufactures and distributes kitchen cabinets and vanities for the remodeling and new home construction markets. Its products are sold on a national basis directly to home centers, major builders and home manufacturers, and through a network of independent distributors. At April 30, 2006, the Company operated 15 manufacturing facilities and 9 service centers across the country.
The Company’s gross profit and net income declined for fiscal 2006 as compared with fiscal 2005. The Company was adversely impacted by two operational events that began in the latter part of fiscal 2005, namely 1) the impact upon the Company’s materials planning system from the start-up of two new manufacturing facilities, and 2) the transition of the majority of the Company’s transportation delivery network to new or other existing carriers. The adverse impact of these two events increased the Company’s production and transportation costs and resulted in a temporary loss of market share in geographical regions that were most impacted by these events. Both operational events were resolved during the third quarter of fiscal 2006, resulting in improved gross margin and net income in the Company’s fourth fiscal quarter.
During fiscal 2006, the Company experienced growth in net sales driven by expansion in both the new construction and remodeling markets. New construction markets serviced by the Company exhibited growth due to the continued favorable housing environment. Demand for the Company’s products in the remodeling market also exhibited growth as home improvement activity remained positive. Gross profit for 2006 was 17.9%, down from 19.6% in fiscal 2005. However, gross profit improved sequentially in fiscal 2006 from the second quarter performance of 15.7%, to 17.5% and 21.1% during the third and fourth fiscal quarters, respectively. The improvement was driven by several initiatives taken by the Company to improve performance, including focusing on operational efficiencies and disciplines, implementing selected pricing actions, and rationalizing spending and headcount levels. The Company commenced a transition out of certain low-margin products which improved the sales mix and margins in its fourth fiscal quarter. Finally, lower fuel costs also helped improve margins in the second half of fiscal 2006.
Net income for the fiscal year 2006 was $33.2 million compared to $35.6 million for fiscal year 2005.
FISCAL YEAR 2006
COMPARED TO FISCAL YEAR 2005
| | | | | | | | | |
| | | FISCAL YEARS ENDED APRIL 30 | |
(in thousands) | | 2006 | | 2005 | | PERCENT CHANGE | |
Net Sales | | $ | 837,671 | | $ | 776,990 | | 7.8 | % |
Gross Profit | | | 149,693 | | | 152,380 | | (1.8 | ) |
Selling & Marketing Expenses | | | 70,361 | | | 67,225 | | 4.7 | |
G&A Expenses | | | 25,913 | | | 26,788 | | (3.3 | ) |
Interest Expense | | | 1,018 | | | 515 | | 97.7 | |
NET SALES
Net sales for fiscal 2006 increased 7.8% to $837.7 million from $777.0 million in fiscal 2005. Higher sales were the result of shifts in product mix and improved pricing. Overall, unit volume increased 0.9% over the prior year as unit growth in core products was offset by unit volume declines as the Company began to execute its plans to exit certain high volume low margin business. In fiscal 2006, the average selling price per unit increased 6.8% due to shifts in product mix and improved pricing.
AMERICAN WOODMARK CORPORATION® 2006 ANNUAL REPORT 13
GROSS PROFIT
Gross profit as a percent of sales decreased in fiscal 2006 to 17.9% from 19.6% in fiscal 2005. The decrease in gross profit was the result of inflationary pressures in transportation and material costs, inefficiencies relating to the two operational events, and higher manufacturing overhead costs associated with two plants added during fiscal 2005.
Transportation costs increased by 0.8% of sales from the prior year due to higher fuel costs and general market inflation of rate structures.
Manufacturing overhead costs increased 1.1% of sales from the prior year due to higher depreciation, salary labor and other start-up costs associated with new capacity added in fiscal 2005.
Material costs decreased 0.4% of sales in fiscal 2006 from the prior fiscal year as inflationary pressures in raw materials were more than offset by improvements in product mix, improved pricing to offset inflationary pressures and improved hardwood lumber yields.
SELLING & MARKETING EXPENSES
Selling and marketing expenses were $70.4 million or 8.4% of sales in fiscal 2006 compared to $67.2 million or 8.7% in fiscal 2005. The decrease as a percent of sales was attributable to cost containment efforts and leverage gained on higher sales.
GENERAL & ADMINISTRATIVE EXPENSES
General and administrative expenses in fiscal year 2006 were $25.9 million or 3.1% of sales compared to $26.8 million or 3.4% in fiscal 2005. The decrease was primarily due to lower costs associated with the Company’s pay-for-performance employee incentive plan.
INTEREST AND OTHER EXPENSE
Net interest expense increased $503 thousand in fiscal 2006 compared to fiscal 2005. The increase was attributable to fewer long-term capital projects in fiscal 2006, resulting in less capitalized interest.
EFFECTIVE INCOME TAX RATES
The Company’s combined federal and state effective tax rate in fiscal 2006 was 38.2%, compared to 39.0% for fiscal 2005. The decrease in the effective tax rate was a result of the “American Jobs Creation Act of 2004” which allows a deduction based on qualified domestic production activities.
LIQUIDITY AND CAPITAL RESOURCES
On April 30, 2006, cash and cash equivalents totaled $48.0 million, up from $24.4 million at April 30, 2005. At fiscal year end April 30, 2006, total short-term and long-term debt was $29.2 million compared to $30.3 million at fiscal year end 2005. Long-term debt to capital was 10.3% and 12.0% at fiscal year end 2006 and 2005, respectively.
The Company’s operating activities generated $66.6 million in net cash during fiscal 2006 compared to $65.7 million in fiscal 2005. The increase in cash generated from operations was primarily due to increases in non-cash items such as increased depreciation and amortization expense, plus a lower level of incremental investment in inventories, customer receivables and prepaid expenses, offset by a reduction in accounts payable and lower net income.
The decrease in accounts payable was the result of reduced plant construction activity and timing. Depreciation and amortization increased as a result of increased investment in property, plant, and equipment during fiscal 2005. Inventories and customer receivables changes were due to sales activity and timing of cash receipts.
Net cash used in investing activities decreased to $26.6 million in fiscal 2006 compared to $73.8 million in fiscal 2005. Spending on property, plant, and equipment additions during fiscal 2006 decreased by $47.8 million from $61.1 million in fiscal 2005. During fiscal 2005, the Company completed capital expansion programs at several manufacturing facilities. These expenditures were primarily for construction of a new assembly facility in Allegany County, Maryland, and a new component facility in Hardy County, West Virginia. During fiscal 2006, capital expenditures were primarily for an expansion of an assembly facility, equipment additions to enhance capacity, and other equipment and tooling related to cost savings projects. The Company invested $13.4 million in promotional displays in fiscal 2006, nearly flat with its investment in fiscal 2005. The Company expects that continued sales growth will require additional investments in plant, property, equipment, and promotional displays. Capital expenditures in fiscal 2007 are expected to be between $15 and $20 million. Investment in promotional displays is expected to be between $17 and $19 million in fiscal 2007.
14 AMERICAN WOODMARK CORPORATION® 2006 ANNUAL REPORT
Net cash used by financing activities for fiscal 2006 was $16.5 million compared to cash provided of $3.1 million in fiscal 2005. The Company repurchased $15.3 million of stock during fiscal 2006 compared to $11.5 million in fiscal 2005. In fiscal 2005, proceeds from long-term borrowings of $15.7 million were directly related to local economic incentives to help fund the Company’s capital investments. Due to timing, the Company was required to make a one day borrowing of funds from its term credit facility of $2.3 million during fiscal 2006.
The due dates of the Company’s contractual obligations and other commercial commitments are summarized in the following table. For more information see Notes E, G, and I in the Notes to Consolidated Financial Statements.
| | | | | | | | | | | | |
| | | FISCAL YEARS ENDED APRIL 30 |
(in thousands) | | Total Amounts | | 2007 | | 2008–2011 | | 2012 and Thereafter |
Term credit facility | | $ | 10,000 | | $ | — | | $ | 10,000 | | $ | — |
Term loans | | | 6,232 | | | 357 | | | 1,518 | | | 4,357 |
Other term loans | | | 2,234 | | | — | | | — | | | 2,234 |
Interest on long-term debt(a) | | | 3,300 | | | 697 | | | 2,152 | | | 451 |
Interest rate swap | | | 9 | | | 9 | | | — | | | — |
Operating leases | | | 9,525 | | | 3,814 | | | 5,711 | | | — |
Capital lease obligations | | | 10,751 | | | 1,099 | | | 1,952 | | | 7,700 |
Pension contributions(b) | | | 26,507 | | | 10,887 | | | 15,620 | | | — |
| | | | | | | | | | | | |
Total | | $ | 68,558 | | $ | 16,863 | | $ | 36,953 | | $ | 14,742 |
| | | | | | | | | | | | |
| (a) | Interest commitments under interest bearing debt consists of interest under the Company��s primary loan agreement and other term loans and capitalized lease agreements. The Company’s term credit facility includes a $10 million term note that bears interest at the London Interbank Offered Rate (LIBOR) plus a spread of .050% and has been fixed at 6.0% through May 31, 2006, via an interest rate swap. Interest under other term loans and capitalized lease agreements is fixed at rates between 2% and 6%. Interest commitments under interest bearing debt assume the fixed rate on the Company’s primary loan agreement through May 31, 2006, and at LIBOR plus the spread as of April 30, 2006, throughout the remaining term of the agreement. |
| (b) | The estimated cost and benefits of the Company’s two defined benefit pension plans are determined annually by independent actuaries based upon the discount rate and other assumptions at fiscal year end. Future pension funding contributions have been projected through fiscal 2010. |
The Company received cash flow of $1.8 million from common stock issued from exercises of stock options in fiscal 2006.
The Company repurchased $15.3 million in common stock during fiscal 2006, compared to $11.5 million in fiscal 2005. All share repurchases were conducted in accordance with authorizations issued by its Board of Directors in August 2004, May 2005, and March 2006. Each authorization was for the repurchase of up to $10 million of company stock. At April 30, 2006, approximately $7.4 million remained authorized to repurchase shares of the Company’s common stock. The Company contributed $1.5 million in common stock to fund a portion of its employee benefit plan in fiscal 2006.
Cash dividends of $2.0 million and $1.9 million were paid on common stock during fiscal years 2006 and 2005, respectively.
Cash flow from operations combined with cash on hand and available borrowing capacity under the Company’s $35 million line of credit is expected to be sufficient to meet forecasted capital requirements, payments of accrued expenses, and service existing debt obligations for fiscal 2007.
FISCAL YEAR 2005
COMPARED TO FISCAL YEAR 2004
| | | | | | | | | |
| | | FISCAL YEARS ENDED APRIL 30 | |
(in thousands) | | 2005 | | 2004 | | PERCENT CHANGE | |
Net Sales | | $ | 776,990 | | $ | 667,547 | | 16.4 | % |
Gross Profit | | | 152,380 | | | 137,509 | | 10.8 | |
Selling & Marketing Expenses | | | 67,225 | | | 59,653 | | 12.7 | |
G&A Expenses | | | 26,788 | | | 25,452 | | 5.2 | |
Interest Expense | | | 515 | | | 869 | | (40.7 | ) |
NET SALES
Net sales for fiscal 2005 increased 16.4% to $777.0 million from $667.5 million in fiscal 2004. Higher sales were the result of the growth in shipments to both the remodeling and new home construction markets. Unit volume increased 9% over the prior year. Unit growth in the remodeling market was driven by strong home improvement spending and new products. New home construction unit growth was the result of high demand for housing and new products. In fiscal 2005, our average selling price per unit increased 6% due to shifts in product mix and improved pricing.
GROSS PROFIT
Gross profit as a percent of sales decreased in fiscal 2005 to 19.6% from 20.6% in fiscal 2004. The decrease in gross profit was the result of higher materials and freight costs.
Material costs increased by 0.3% of sales from fiscal 2004 to fiscal 2005 due to increases in hardwood lumber, particleboard, paint, and packaging materials. Cost increases were experienced as a result of higher commodity costs which were partially offset by materials substitutions.
AMERICAN WOODMARK CORPORATION® 2006 ANNUAL REPORT 15
Freight costs increased by 0.5% of sales from the prior year as the result of general industry conditions, which included higher fuel costs and increased operating expenses associated with new government requirements. To avoid significant proposed rate increases, the Company changed several of its carriers in fiscal 2005.
Labor costs decreased as a percentage of sales in fiscal 2005 from the prior fiscal year, as an increase in productivity and decreased costs associated with the Company’s pay-for-performance employee incentive plan were somewhat offset by increased premium hours worked and increased health care and pension costs. Offsetting this net reduction as a percentage of sales, other manufacturing costs increased slightly as a percentage of sales, as the Company commenced operations at two new manufacturing plants and added to its overhead cost.
SELLING & MARKETING EXPENSES
Selling and marketing expenses were $67.2 million or 8.7% of sales in fiscal 2005 compared to $59.7 million or 8.9% in fiscal 2004. The decrease as a percent of sales was due to the favorable impact of cost containment efforts and leverage gained on higher sales.
GENERAL & ADMINISTRATIVE EXPENSES
General and administrative expenses in fiscal year 2005 were $26.8 million or 3.4% of sales compared to $25.5 million or 3.8% in fiscal 2004. The decrease was primarily due to lower costs associated with the Company’s pay-for-performance employee incentive plan.
INTEREST AND OTHER EXPENSE
Net interest expense decreased $354 thousand in fiscal 2005 compared to fiscal 2004. The decrease was due to an increase in capitalized interest as the Company expended more resources for capital projects in fiscal 2005 compared to fiscal 2004.
EFFECTIVE INCOME TAX RATES
The Company’s combined federal and state effective tax rate in fiscal 2005 was 39.0%, consistent with fiscal 2004.
OUTLOOK FOR FISCAL 2007
The Company follows several indices, including housing starts, existing home sales, mortgage interest rates, new jobs growth and consumer confidence, that it believes are leading indicators of overall demand for kitchen and bath cabinetry. These indicators collectively suggest to the Company that the long-term economic outlook for housing is positive; however, the near term outlook is uncertain.
The Company expects to increase its total sales in fiscal 2007. The Company expects that its sales of core products, which include special order sales to Home Depot and Lowe’s, as well as sales to large builders, builder distributors and dealers, will increase at a higher rate than its total sales. The Company expects growth in core product sales to be somewhat offset by the impact of the Company’s continued transition out of certain high volume low margin products. Core product growth is expected to be driven by three factors. First, as one of the largest manufacturers in the industry with a broad distribution base, the Company expects to participate in the overall growth of the industry. Second, the Company expects to gain share in the general market due to strategic partnerships with home centers, builders and distributors that are gaining share versus other distribution outlets. Finally, the Company expects to gain share with customers due to the value of the products and services in the Company’s broad offering.
The Company expects to generate higher net income in fiscal 2007 versus fiscal 2006. The Company expects that its gross margin rate will increase in fiscal 2007 based on incremental sales, potential price increases to offset inflationary pressure in materials and freight costs, and improved operational efficiency and productivity.
The Company could be negatively impacted by reduced market demand as the result of lower overall remodeling or new construction activity. While the Company would expect to perform better than the industry on average during a downturn in demand, the combined effects of lower sales and underutilized capacity could result in decreased profitability in fiscal 2007 versus fiscal 2006.
The Company began to experience an inflationary environment with respect to certain commodity prices and petroleum based products during the past three fiscal years. While the Company believes that it is more efficient as compared to the industry in the use of materials, a continued rise in raw material costs could negatively impact profitability during fiscal 2007. The Company does not believe that additional increases in raw material costs would negatively impact performance over the long-term due to the availability of substitute materials and the historical ability for the industry to recover market-driven increases in raw materials through pricing.
Over the past six years, the Company has significantly expanded its overall manufacturing capacity through an aggressive capital spending program. In order to support the growth in demand for products and services, the Company has invested approximately
16 AMERICAN WOODMARK CORPORATION® 2006 ANNUAL REPORT
$183 million in property, plant, and equipment during this time. Long-term projected growth may continue to require the Company to invest in additional capacity. However, the Company does not anticipate constructing any new plants during fiscal 2007.
The aforementioned forward-looking statements should be read in combination with information presented in the Risk Factors section below.
RISK FACTORS
The Company’s business has historically been subjected to seasonal influences, with higher sales typically realized in the second and fourth fiscal quarters.
The costs of the Company’s products are subject to inflationary pressures and commodity price fluctuations. Inflationary pressures have been relatively mild over the past five years except in certain raw material markets. Commodity price pressures have been experienced in the raw material market during the recent period. The Company has generally been able, over time, to recover the effects of inflation and commodity price fluctuations through sales price increases.
On April 30, 2006, the Company had no material exposure to changes in interest rates for its debt agreements. All significant borrowings of the Company carry an effective interest rate between 2% and 6%.
CRITICAL ACCOUNTING POLICIES
Management has chosen accounting policies that are necessary to accurately and fairly report the Company’s operational and financial position. The significant accounting policies of the Company are disclosed in Note A to the Consolidated Financial Statements. The following discussion addresses the accounting policies that are the most important to the portrayal of the financial condition of the Company for the period being reported and that require judgment.
Management has reviewed these critical accounting policies and estimates with the Audit Committee of the Board of Directors.
REVENUE RECOGNITION.The Company utilizes signed sales agreements that provide for transfer of title to the customer upon delivery. The Company’s network of third-party carriers does not currently have the technology to provide detailed information regarding the delivery date for all orders. As a result, the Company must estimate the amount of sales that have been transferred to third-party carriers but not delivered to customers. The estimate is calculated using a lag factor determined by analyzing the actual difference between shipment date and delivery date of orders over the past 12 months. Revenue is only recognized on those shipments which we believe have been delivered to the customer. Due to the nature of the Company’s business, the impact from this estimate is limited to fiscal quarters as any shipments deemed to be in transit at the end of a reporting period are delivered to the customer within the first two weeks of the next period. Management believes that likely changes in the estimate are immaterial to the overall results of the fiscal year.
The Company recognizes revenue based on the invoice price less allowances for sales returns, cash discounts, and other deductions as required under current U.S. generally accepted accounting principles. Collection is reasonably assured as determined through an analysis of accounts receivable data, including historical product returns, and the evaluation of each customer’s ability to pay. Allowances for sales returns are based on the historical relationship between shipments and returns. The Company believes that historical experience is an accurate reflection of future returns.
SELF INSURANCE.The Company is self-insured for certain costs related to employee medical coverage and workers’ compensation liability. The Company maintains stop loss coverage with third-party insurers to limit total exposure. The Company establishes a liability at the balance sheet date based on estimates for a variety of factors that influence the Company’s ultimate cost. In the event that actual experience is substantially different from the estimates, the financial results for the period could be impacted. The Company believes that the methodologies used to estimate all factors related to employee medical coverage and workers’ compensation are an accurate reflection of the liability as of the date of the balance sheet.
PENSIONS.The Company has two non-contributory defined pension benefit plans covering substantially all of the Company’s employees. The Company accounts for its defined benefit plans in accordance with Statement of Financial Accounting Standards SFAS 87, “Employer’s Accounting for Pensions,” and Statement of Financial Accounting Standards SFAS 132 (revised), “Employers’ Disclosures about Pensions and Other Postretirement Benefits,” which requires amounts recognized in the consolidated financial statements to be determined on an actuarial basis. The estimated cost and benefits of the non-contributory defined benefit pension plans are determined by independent actuaries using various actuarial assumptions. The most significant assumptions are the long-term expected rate of return on plan assets, the discount rate used to determine the present value of the pension obligations, and the future rate of compensation level increases. The Company refers to high-quality, fixed-income investments in establishing the
AMERICAN WOODMARK CORPORATION® 2006 ANNUAL REPORT 17
discount rate. The long-term expected rate of return on plan assets reflects the current mix of the plan assets invested in equities and bonds. The future rate of compensation levels reflects expected salary trends.
The following is a summary of the potential impact of a hypothetical 1% change in actuarial assumptions for the discount rate, rate of compensation, expected return on plan assets, and consumer price index.
| | | | | | | |
(in millions) | | IMPACT OF 1%
INCREASE | | | IMPACT OF 1%
DECREASE |
(decrease) increase | | | | | | | |
Effect on annual pension expense | | $ | (1.8 | ) | | $ | 2.1 |
Effect on projected pension benefit obligation | | $ | (8.8 | ) | | $ | 10.9 |
Pension expense for fiscal year 2006 and the assumptions used in that calculation are presented in Note G of the Consolidated Financial Statements. At April 30, 2006, the discount rate was 6.1% compared to 5.46% at April 30, 2005. The expected return on plan assets is 8.0%, which is consistent with fiscal year 2005. The assumed rate of increase in compensation levels is 4.0% for the year ended April 30, 2006, unchanged from the prior fiscal year.
The Company’s pension plans are largely dependent on the assumptions used to measure the obligations of the plans and to estimate future performance of the plans’ invested assets. Over the past two measurement periods, the only material deviation between results based on assumptions and the actual plan performance has been as a result of the changes to the discount rate used to measure the plans’ benefit obligations. Under accounting guidelines, the discount rate is to be set to market at each annual measurement date. The discount rate decreased from 6.40% to 5.46% from the fiscal 2004 to fiscal 2005 measurement dates, resulting in an increase in plans’ benefit obligation of over 20%. From the fiscal 2005 to fiscal 2006 measurement dates, the discount rate increased from 5.46% to 6.10%, which resulted in a decrease in the plans’ benefit obligation of approximately 12%.
The Company strives to balance expected long-term returns and short-term volatility of pension plan assets. Favorable and unfavorable differences between the assumed and actual returns on plan assets are generally amortized over a period no longer than the average future working lifetime of the active participants. The actual rates of return on plan assets realized, net of investment manager fees, were 10%, 5%, and 14% for fiscal years 2006, 2005, and 2004, respectively.
The fair value of plan assets at April 30, 2006 was $54.5 million compared to $43.3 million at April 30, 2005. The Company’s projected benefit obligation exceeded plan assets by $17.3 million in fiscal 2006 and $31.0 million in fiscal 2005. The Company’s $13.7 million reduction in its net underfunded position in 2006 was driven primarily by the aforementioned increase in the discount rate. Due primarily to the increase in the discount rate, the Company expects pension expense for its defined benefit plans to decrease from $8.0 million in fiscal 2006 to $6.0 million in fiscal 2007. The Company made contributions of $7.7 million to its pension plans in fiscal 2006. The Company expects to contribute $10.9 million to its pension plans in fiscal 2007.
The Company’s estimate of its future pension contributions have been increased to reflect uncertainty surrounding the applicable federal funding regulations. The Federal Pension Funding Equity Act (the Act), which regulated the Company’s pension contributions, expired at the end of 2005. As Congress has not yet enacted new legislation, the Company has made its funding estimate assuming a return to the pension funding standards that were in place prior to the Act.
PROMOTIONAL DISPLAYS.The Company invests in promotional displays in retail stores to demonstrate product features, product specifications, quality specifications and serve as a training tool for designers. The investment is carried at cost less applicable amortization. Amortization is provided by the straight-line method on an individual display basis over the estimated period of economic benefit, approximately 30 months. The Company believes that the estimated period of economic benefit provides an accurate reflection of the value of displays as of the date of the balance sheet based on historical experience.
PRODUCT WARRANTY.The Company estimates outstanding warranty costs based on the historical relationship between warranty claims and revenues. The warranty accrual is reviewed monthly to verify that it properly reflects the Company’s remaining obligation based on anticipated expenditures over the balance of the obligation period. Adjustments are made when actual warranty claim experience differs from estimates. Warranty claims are generally made within three months of the original shipment date.
18 AMERICAN WOODMARK CORPORATION® 2006 ANNUAL REPORT
RECENT ACCOUNTING PRONOUNCEMENTS
In December 2004, the FASB issued Statement No. 123(Revised 2004), “Share-Based Payment,” which is a revision of FASB Statement No. 123, “Accounting for Stock-Based Compensation.” Statement 123(R) supersedes APB Opinion No. 25, “Accounting for Stock Issued to Employees.” Under FASB Statement No. 123(R), all share-based payments to employees, including grants of employee stock options, are to be recognized in the income statement based on their fair values as of the awards’ grant date and the estimated number of awards that are expected to vest. The Company will adopt this statement as of May 1, 2006, on a prospective basis. As permitted by SFAS 123, the Company currently accounts for share-based payments to employees using APB Opinion 25’s intrinsic value method and, as such, recognizes no compensation cost for employee stock options. Accordingly, the adoption of SFAS 123(R)’s fair value method will impact the Company’s results of operations. The impact of the adoption of SFAS 123(R) is expected to be similar to amounts shown in Note A to the Consolidated Financial Statements, subject to the levels of share-based payments granted in the future.
In December 2004, the FASB issued SFAS No. 151, “Inventory Costs—an amendment of ARB No. 43, Chapter 4” (“SFAS 151”), which clarifies the accounting for abnormal amounts of idle facility expenses, freight, handling costs, and wasted material (spoilage). Under this statement, such items are recognized as current-period charges. It also requires that allocation of fixed production overheads to the costs of conversion be based on the normal capacity of the production facilities. The Company adopted this statement as of May 1, 2005, and it did not have a material impact on the Company’s financial position or results of operations.
In March 2005, the FASB issued Interpretation No. 47 (“FIN 47”), “Accounting for Conditional Asset Retirement Obligations—an interpretation of FASB Statement No. 143.” FIN 47 requires that a Company recognize a liability for the fair value of a conditional asset retirement obligation if the fair value of the liability can be reasonably estimated. The Company adopted this statement as of May 1, 2005, and it did not have a material impact on the Company’s financial position or results of operations.
In May 2005, the FASB issued SFAS No. 154, “Accounting Changes and Error Corrections,” a replacement of APB Opinion No. 20, “Accounting Changes” and SFAS No. 3, “Reporting Accounting Changes in Interim Financial Statements” (“SFAS 154”). SFAS No. 154 changes the requirements for, the accounting for, and reporting of, a change in accounting principle. Previously, voluntary changes in accounting principles were generally required to be recognized by way of a cumulative effect adjustment within net income during the period of the change. SFAS No. 154 requires retrospective application to prior periods’ financial statements, unless it is impracticable to determine either the period-specific effects or the cumulative effect of the change. SFAS No. 154 is effective for accounting changes made in fiscal years beginning after December 15, 2005; however, the statement does not change the transition provisions of any existing accounting pronouncements. The adoption of this statement is not expected to have a material impact on the Company’s financial position or results of operations.
LEGAL MATTERS
The Company is involved in suits and claims in the normal course of business, including product liability and general liability claims, in addition to claims pending before the EEOC. On at least a quarterly basis, the Company consults with its legal counsel to ascertain the reasonable likelihood that such claims may result in a loss. As required by Statement of Financial Accounting Standards No. 5 (SFAS 5), the Company categorizes the various suits and claims into three categories according to their likelihood for resulting in potential loss: those that are probable (i.e., more likely than not), those that are reasonably possible, and those that are deemed to be remote. The Company accounts for these loss contingencies in accordance with SFAS 5. Where losses are deemed to be probable and estimable, accruals are made. Where losses are deemed to be reasonably possible, a range of loss estimates is determined. Where no loss estimate range can be made, the Company and its counsel perform a worst case estimate. In determining these loss range estimates, the Company considers known values of similar claims and consultation with its independent counsel.
The Company believes that the aggregate range of loss stemming from the various suits and asserted and unasserted claims which were deemed to be either probable or reasonably possible were not material.
DIVIDENDS DECLARED
On May 25, 2006, the Board of Directors approved a $.03 per share cash dividend on its common stock. The cash dividend was paid on June 23, 2006, to shareholders of record on June 15, 2006.
AMERICAN WOODMARK CORPORATION® 2006 ANNUAL REPORT 19
CONSOLIDATED BALANCE SHEETS
| | | | | | | | |
| | | APRIL 30 | |
(in thousands, except share and per share data) | | 2006 | | | 2005 | |
ASSETS | | | | | | | | |
Current Assets | | | | | | | | |
Cash and cash equivalents | | $ | 47,955 | | | $ | 24,406 | |
Customer receivables, net | | | 53,514 | | | | 52,877 | |
Inventories | | | 68,522 | | | | 65,213 | |
Prepaid expenses and other | | | 2,018 | | | | 3,268 | |
Deferred income taxes | | | 11,590 | | | | 10,890 | |
| | | | | | | | | |
Total Current Assets | | | 183,599 | | | | 156,654 | |
Property, plant and equipment, net | | | 175,384 | | | | 185,513 | |
Promotional displays, net | | | 16,698 | | | | 16,740 | |
Intangible pension asset | | | 1,056 | | | | 1,011 | |
Other assets | | | 806 | | | | 1,250 | |
| | | | | | | | | |
| | | $ | 377,543 | | | $ | 361,168 | |
| | | | | | | | | |
LIABILITIES AND SHAREHOLDERS’ EQUITY | | | | | | | | |
Current Liabilities | | | | | | | | |
Accounts payable | | $ | 34,329 | | | $ | 35,752 | |
Current maturities of long-term debt | | | 1,456 | | | | 1,046 | |
Accrued compensation and related expenses | | | 30,949 | | | | 30,564 | |
Accrued marketing expenses | | | 6,296 | | | | 6,787 | |
Other accrued expenses | | | 10,043 | | | | 8,393 | |
| | | | | | | | | |
Total Current Liabilities | | | 83,073 | | | | 82,542 | |
Long-term debt, less current maturities | | | 27,761 | | | | 29,217 | |
Deferred income taxes | | | 16,886 | | | | 13,339 | |
Long-term pension liabilities | | | 4,233 | | | | 16,149 | |
Other long-term liabilities | | | 3,929 | | | | 4,730 | |
Shareholders’ Equity | | | | | | | | |
Preferred stock, $1.00 par value; 2,000,000 shares authorized, none issued | | | — | | | | — | |
Common stock, no par value; 40,000,000 shares authorized; issued and outstanding shares: at April 30, 2006: 15,958,496; at April 30, 2005: 16,397,520 | | | 53,195 | | | | 51,189 | |
Retained earnings | | | 194,071 | | | | 176,303 | |
Accumulated Other Comprehensive Loss | | | | | | | | |
Minimum pension liability | | | (5,601 | ) | | | (12,178 | ) |
Unrealized loss on derivative contract | | | (4 | ) | | | (123 | ) |
| | | | | | | | | |
Total Accumulated Other Comprehensive Loss | | | (5,605 | ) | | | (12,301 | ) |
| | | | | | | | | |
Total Shareholders’ Equity | | | 241,661 | | | | 215,191 | |
| | | | | | | | | |
| | | $ | 377,543 | | | $ | 361,168 | |
| | | | | | | | | |
| | | | | | | | | |
See notes to consolidated financial statements.
20 AMERICAN WOODMARK CORPORATION® 2006 ANNUAL REPORT
CONSOLIDATED STATEMENTS OF INCOME
| | | | | | | | | | | | |
| | | YEARS ENDED APRIL 30 | |
(in thousands, except share and per share data) | | 2006 | | | 2005 | | | 2004 | |
Net sales | | $ | 837,671 | | | $ | 776,990 | | | $ | 667,547 | |
Cost of sales and distribution | | | 687,978 | | | | 624,610 | | | | 530,038 | |
| | | | | | | | | | | | | |
Gross Profit | | | 149,693 | | | | 152,380 | | | | 137,509 | |
Selling and marketing expenses | | | 70,361 | | | | 67,225 | | | | 59,653 | |
General and administrative expenses | | | 25,913 | | | | 26,788 | | | | 25,452 | |
| | | | | | | | | | | | | |
Operating Income | | | 53,419 | | | | 58,367 | | | | 52,404 | |
Interest expense | | | 1,018 | | | | 515 | | | | 869 | |
Other income | | | (1,300 | ) | | | (493 | ) | | | (461 | ) |
| | | | | | | | | | | | | |
Income Before Income Taxes | | | 53,701 | | | | 58,345 | | | | 51,996 | |
Income tax expense | | | 20,491 | | | | 22,754 | | | | 20,289 | |
| | | | | | | | | | | | | |
Net Income | | $ | 33,210 | | | $ | 35,591 | | | $ | 31,707 | |
| | | | | | | | | | | | | |
SHARE INFORMATION | | | | | | | | | | | | |
Earnings per share | | | | | | | | | | | | |
Basic | | $ | 2.04 | | | $ | 2.16 | | | $ | 1.96 | |
Diluted | | | 2.00 | | | | 2.11 | | | | 1.90 | |
Cash dividends per share | | | .12 | | | | .115 | | | | .10 | |
| | | | | | | | | | | | | |
| | | | | | | | | | | | | |
See notes to consolidated financial statements.
AMERICAN WOODMARK CORPORATION® 2006 ANNUAL REPORT 21
CONSOLIDATED STATEMENTS OF
SHAREHOLDERS’ EQUITY AND COMPREHENSIVE INCOME
| | | | | | | | | | | | | | | | | | | |
| | | COMMON STOCK | | | RETAINED | | | ACCUMULATED OTHER COMPREHENSIVE | | | TOTAL SHAREHOLDERS’ | |
(in thousands, except share and per share data) | | SHARES | | | AMOUNT | | | EARNINGS | | | INCOME (LOSS) | | | EQUITY | |
Balance, May 1, 2003 | | 16,160,196 | | | $ | 33,999 | | | $ | 134,406 | | | $ | (8,306 | ) | | $ | 160,099 | |
Comprehensive Income: | | | | | | | | | | | | | | | | | | | |
Net income | | | | | | | | | | 31,707 | | | | | | | | 31,707 | |
Other comprehensive income, net of tax: | | | | | | | | | | | | | | | | | | | |
Change in derivative financial instrument | | | | | | | | | | | | | | 240 | | | | 240 | |
Minimum pension liability | | | | | | | | | | | | | | 783 | | | | 783 | |
| | | | | | | | | | | | | | | | | | | |
Total Comprehensive Income | | | | | | | | | | | | | | | | | | 32,730 | |
| | | | | |
Cash dividends | | | | | | | | | | (1,619 | ) | | | | | | | (1,619 | ) |
Exercise of stock options | | 533,976 | | | | 8,474 | | | | | | | | | | | | 8,474 | |
Stock repurchases | | (281,500 | ) | | | (217 | ) | | | (7,501 | ) | | | | | | | (7,718 | ) |
Employee benefit plan contributions | | 47,214 | | | | 1,179 | | | | | | | | | | | | 1,179 | |
| | | | | | | | | | | | | | | | | | | |
Balance, April 30, 2004 | | 16,459,886 | | | $ | 43,435 | | | $ | 156,993 | | | $ | (7,283 | ) | | $ | 193,145 | |
Comprehensive Income: | | | | | | | | | | | | | | | | | | | |
Net income | | | | | | | | | | 35,591 | | | | | | | | 35,591 | |
Other comprehensive income, net of tax: | | | | | | | | | | | | | | | | | | | |
Change in derivative financial instrument | | | | | | | | | | | | | | 239 | | | | 239 | |
Minimum pension liability | | | | | | | | | | | | | | (5,257 | ) | | | (5,257 | ) |
| | | | | | | | | | | | | | | | | | | |
Total Comprehensive Income | | | | | | | | | | | | | | | | | | 30,573 | |
| | | | | |
Cash dividends | | | | | | | | | | (1,897 | ) | | | | | | | (1,897 | ) |
Exercise of stock options | | 335,823 | | | | 7,633 | | | | | | | | | | | | 7,633 | |
Stock repurchases | | (436,369 | ) | | | (1,191 | ) | | | (14,384 | ) | | | | | | | (15,575 | ) |
Employee benefit plan contributions | | 38,180 | | | | 1,312 | | | | | | | | | | | | 1,312 | |
| | | | | | | | | | | | | | | | | | | |
Balance, April 30, 2005 | | 16,397,520 | | | $ | 51,189 | | | $ | 176,303 | | | $ | (12,301 | ) | | $ | 215,191 | |
Comprehensive Income: | | | | | | | | | | | | | | | | | | | |
Net income | | | | | | | | | | 33,210 | | | | | | | | 33,210 | |
Other comprehensive income, net of tax: | | | | | | | | | | | | | | | | | | | |
Change in derivative financial instrument | | | | | | | | | | | | | | 119 | | | | 119 | |
Minimum pension liability | | | | | | | | | | | | | | 6,577 | | | | 6,577 | |
| | | | | | | | | | | | | | | | | | | |
Total Comprehensive Income | | | | | | | | | | | | | | | | | | 39,906 | |
| | | | | |
Cash dividends | | | | | | | | | | (1,959 | ) | | | | | | | (1,959 | ) |
Exercise of stock options | | 94,100 | | | | 2,430 | | | | | | | | | | | | 2,430 | |
Stock repurchases | | (581,400 | ) | | | (1,908 | ) | | | (13,483 | ) | | | | | | | (15,391 | ) |
Employee benefit plan contributions | | 48,276 | | | | 1,484 | | | | | | | | | | | | 1,484 | |
| | | | | | | | | | | | | | | | | | | |
Balance, April 30, 2006 | | 15,958,496 | | | $ | 53,195 | | | $ | 194,071 | | | $ | (5,605 | ) | | $ | 241,661 | |
| | | | | | | | | | | | | | | | | | | |
See notes to consolidated financial statements.
22 AMERICAN WOODMARK CORPORATION® 2006 ANNUAL REPORT
CONSOLIDATED STATEMENTS OF CASH FLOWS
| | | | | | | | | | | | |
| | | YEARS ENDED APRIL 30 | |
(in thousands) | | 2006 | | | 2005 | | | 2004 | |
OPERATING ACTIVITIES | | | | | | | | | | | | |
Net income | | $ | 33,210 | | | $ | 35,591 | | | $ | 31,707 | |
Adjustments to reconcile net income to net cash provided by operating activities: | | | | | | | | | | | | |
Depreciation and amortization | | | 37,012 | | | | 33,405 | | | | 27,696 | |
Net loss on disposal of property, plant and equipment | | | 66 | | | | 103 | | | | 73 | |
Deferred income taxes | | | (1,352 | ) | | | 1,787 | | | | 697 | |
Tax benefit from stock options exercised | | | 491 | | | | 2,426 | | | | 3,692 | |
Other non-cash items | | | 2,887 | | | | 1,424 | | | | 682 | |
Changes in operating assets and liabilities: | | | | | | | | | | | | |
Customer receivables | | | (1,992 | ) | | | (4,833 | ) | | | (8,062 | ) |
Inventories | | | (3,963 | ) | | | (11,349 | ) | | | (10,182 | ) |
Prepaid expenses and other assets | | | 1,410 | | | | (2,138 | ) | | | 3,113 | |
Accounts payable | | | (1,423 | ) | | | 6,607 | | | | 2,295 | |
Accrued compensation, marketing, and other accrued expenses | | | 1,543 | | | | 557 | | | | 9,171 | |
Other | | | (1,260 | ) | | | 2,094 | | | | (3,845 | ) |
| | | | | | | | | | | | | |
Net Cash Provided by Operating Activities | | | 66,629 | | | | 65,674 | | | | 57,037 | |
INVESTING ACTIVITIES | | | | | | | | | | | | |
Payments to acquire property, plant and equipment | | | (13,243 | ) | | | (61,054 | ) | | | (22,755 | ) |
Proceeds from sales of property, plant and equipment | | | 3 | | | | 401 | | | | 5 | |
Investment in promotional displays | | | (13,383 | ) | | | (13,106 | ) | | | (16,059 | ) |
| | | | | | | | | | | | | |
Net Cash Used in Investing Activities | | | (26,623 | ) | | | (73,759 | ) | | | (38,809 | ) |
FINANCING ACTIVITIES | | | | | | | | | | | | |
Payments of long-term debt | | | (3,296 | ) | | | (5,988 | ) | | | (932 | ) |
Proceeds from long-term debt | | | 2,250 | | | | 15,750 | | | | — | |
Proceeds from issuance of common stock | | | 1,815 | | | | 2,465 | | | | 471 | |
Repurchase of common stock | | | (15,267 | ) | | | (11,521 | ) | | | (2,228 | ) |
Payment of dividends | | | (1,959 | ) | | | (1,897 | ) | | | (1,619 | ) |
Grant proceeds relating to property, plant and equipment | | | — | | | | 4,250 | | | | — | |
| | | | | | | | | | | | | |
Net Cash (Used In) Provided By Financing Activities | | | (16,457 | ) | | | 3,059 | | | | (4,308 | ) |
| | | | | | | | | | | | | |
Net Increase/(Decrease) in Cash and Cash Equivalents | | | 23,549 | | | | (5,026 | ) | | | 13,920 | |
Cash and Cash Equivalents, Beginning of Year | | | 24,406 | | | | 29,432 | | | | 15,512 | |
| | | | | | | | | | | | | |
Cash and Cash Equivalents, End of Year | | $ | 47,955 | | | $ | 24,406 | | | $ | 29,432 | |
| | | | | | | | | | | | | |
| | | | | | | | | | | | | |
See notes to consolidated financial statements.
AMERICAN WOODMARK CORPORATION® 2006 ANNUAL REPORT 23
notes to consolidated financial statements
NOTE A — SUMMARY OF SIGNIFICANT ACCOUNTING POLICIES
The Company manufactures and distributes kitchen cabinets and vanities for the remodeling and new home construction markets. The Company’s products are sold across the United States through a network of independent distributors and directly to home centers and major builders.
The following is a description of the Company’s significant accounting policies:
PRINCIPLES OF CONSOLIDATION:The consolidated financial statements include the accounts of the Company and its wholly owned subsidiary. Significant inter-company accounts and transactions have been eliminated in consolidation.
STOCK SPLIT:On August 26, 2004, the Board of Directors declared a two-for-one stock split of the Company’s common stock that was distributed to shareholders in the form of a stock dividend on September 24, 2004, to shareholders of record on September 10, 2004. All share and per share information reflects the two-for-one stock split.
REVENUE RECOGNITION:The Company recognizes revenue when product is delivered to the customer and title has passed. Revenue is based on invoice price less allowances for sales returns, cash discounts, and other deductions.
COST OF SALES AND DISTRIBUTION:The cost of sales and distribution includes all costs associated with the manufacture and distribution of the Company’s products including the costs of shipping and handling.
ADVERTISING COSTS:Advertising costs are expensed as incurred. Advertising expenses for fiscal years 2006, 2005, and 2004 were $15.9 million, $15.5 million, and $12.5 million, respectively.
CASH AND CASH EQUIVALENTS:Cash in excess of operating requirements is invested in short-term instruments which are carried at fair value (approximate cost). The Company considers all highly liquid short-term investments with an original maturity of three months or less when purchased to be cash equivalents. Cash equivalents were $44.1 million and $19.5 million at April 30, 2006 and 2005, respectively.
INVENTORIES:Inventories are stated at lower of cost or market. Inventory costs are determined by the last-in, first-out (LIFO) method.
The LIFO cost reserve is determined in the aggregate for inventory and is applied as a reduction to inventories determined on the first-in, first-out method (FIFO). FIFO inventory cost approximates replacement cost.
24 AMERICAN WOODMARK CORPORATION® 2006 ANNUAL REPORT
PROPERTY, PLANT AND EQUIPMENT:Property, plant and equipment is stated on the basis of cost less accumulated depreciation. Depreciation is provided by the straight-line method over the estimated useful lives of the related assets, which range from 15 to 30 years for buildings and improvements and three to ten years for machinery and equipment. Assets under capital leases are amortized over the shorter of their estimated useful lives or the term of the related lease.
IMPAIRMENT OF LONG-LIVED ASSETS:The Company reviews its long-lived assets for impairment when events or changes in circumstances indicate that the carrying amount of an asset may not be recoverable.
PROMOTIONAL DISPLAYS:The Company invests in promotional displays in retail stores to demonstrate product features, product specifications, and quality specifications and serve as a training tool for retail kitchen designers. The Company invests in these long-lived productive assets to provide the aforementioned benefits. The Company’s investment in promotional displays is carried at cost less applicable amortization. Amortization is provided by the straight-line method on an individual display basis over 30 months (the estimated period of benefit). Promotional display amortization expense for fiscal years 2006, 2005, and 2004 was $13.4 million, $13.5 million, and $11.6 million, respectively.
FAIR VALUE OF FINANCIAL INSTRUMENTS:The carrying amounts of the Company’s cash and cash equivalents, customer receivables, accounts payable, and long-term debt approximate fair value.
DERIVATIVES:The Company records its derivatives at fair value and recognizes these assets or liabilities on the consolidated balance sheets. The Company’s primary objective for entering into derivative instruments is to manage its exposure to interest rates, as well as to maintain an appropriate mix of fixed and variable rate debt. At April 30, 2006, the Company had one outstanding interest rate swap with a notional amount of $10 million that exchanges variable rate interest at LIBOR plus 50 basis points on the Company’s term credit facility for fixed interest at 5.5% plus 50 basis points and expires on May 31, 2006.
INCOME TAXES:The Company accounts for deferred income taxes utilizing the asset and liability method, whereby deferred tax assets and liabilities are recognized based on the tax effects of temporary differences between the financial statement amounts and the tax basis of assets and liabilities, using enacted tax rates in effect for the year in which these items are expected to reverse. When appropriate, the Company evaluates the need for a valuation allowance to reduce deferred tax assets.
PENSIONS:The Company has two non-contributory defined pension benefit plans covering substantially all of the Company’s employees. The Company accounts for its defined benefit plans in accordance with Statement of Financial Accounting Standards SFAS No. 87, “Employer’s Accounting for Pensions,” which requires amounts recognized in the financial statements to be determined on an actuarial basis.
STOCK-BASED COMPENSATION:As permitted by Statement of Financial Accounting Standards SFAS No. 123, “Accounting for Stock-Based Compensation,” the Company has elected to continue using the intrinsic value method of accounting for stock options and has provided the additional required disclosures. SFAS No. 148, which amends SFAS No. 123, does not require companies to account for stock options using the fair value method; however, it does require all companies to adopt the disclosure provisions.
For the years ended April 30, 2006, 2005, and 2004, pro forma net income and earnings per share information required by SFAS No. 123 have been determined as if the Company had accounted for its stock options using the fair value method.
For purposes of pro forma disclosures, the estimated fair value of the options is amortized to expense over the options’ vesting periods. The Company’s pro forma information follows:
STOCK-BASED COMPENSATION
| | | | | | | | | | | | |
(in thousands, except per share amounts) | | 2006 | | | 2005 | | | 2004 | |
Net income | | $ | 33,210 | | | $ | 35,591 | | | $ | 31,707 | |
Stock-based employee compensation expense, net of income tax effects | | | (3,399 | ) | | | (3,185 | ) | | | (2,348 | ) |
| | | | | | | | | | | | | |
Pro forma net income | | $ | 29,811 | | | $ | 32,406 | | | $ | 29,359 | |
| | | | | | | | | | | | | |
Pro forma net income per common share: | | | | | | | | | | | | |
Basic | | | 1.83 | | | | 1.97 | | | | 1.81 | |
Diluted | | | 1.80 | | | | 1.92 | | | | 1.76 | |
AMERICAN WOODMARK CORPORATION® 2006 ANNUAL REPORT 25
To determine these amounts, the fair value of each stock option has been estimated on the date of the grant using a Black-Scholes option-pricing model. Significant assumptions used in this model include the following:
| | | | | | | | | | | | |
| | | 2006 | | | 2005 | | | 2004 | |
Expected volatility | | | 50.3 | % | | | 50.7 | % | | | 51.2 | % |
Expected dividend yield | | | 0.4 | % | | | 0.4 | % | | | 0.8 | % |
Risk-free interest rates | | | 3.89 | % | | | 3.96 | % | | | 2.55 | % |
Expected life in years | | | 6.0 | | | | 6.0 | | | | 6.0 | |
Weighted-average fair value per share | | $ | 14.62 | | | $ | 14.91 | | | $ | 12.03 | |
RECENT ACCOUNTING PRONOUNCEMENTS:In December 2004, the FASB issued Statement No. 123 (Revised 2004), “Share-Based Payment,” which is a revision of FASB Statement No. 123, “Accounting for Stock-Based Compensation.” Statement No. 123(R) supersedes APB Opinion No. 25, “Accounting for Stock Issued to Employees.” Under FASB Statement No. 123(R) and related accounting guidance, all share-based payments to employees, including grants of employee stock options, are to be recognized in the income statement based on their fair values as of the awards’ grant date and the estimated number of awards that are expected to vest. The Company will adopt this statement as of May 1, 2006, on a prospective basis. As permitted by SFAS 123, the Company currently accounts for share-based payments to employees using APB Opinion 25’s intrinsic value method and, as such, recognizes no compensation cost for employee stock options. Accordingly, the adoption of SFAS 123(R)’s fair value method will impact the Company’s results of operations. The impact of the adoption of SFAS 123(R) is expected to be similar to amounts shown in the table on page 25, subject to the levels of share-based payments granted in the future.
In December 2004, the FASB issued SFAS No. 151, “Inventory Costs — an amendment of ARB No. 43, Chapter 4” (“SFAS 151”), which clarifies the accounting for abnormal amounts of idle facility expenses, freight, handling costs, and wasted material (spoilage). Under this statement, such items are recognized as current-period charges. It also requires that allocation of fixed production overheads to the costs of conversion be based on the normal capacity of the production facilities. The Company adopted this statement as of May 1, 2005, and it did not have a material impact on the Company’s financial position or results of operations.
In March 2005, the FASB issued Interpretation No. 47 (“FIN 47”), “Accounting for Conditional Asset Retirement Obligations — an interpretation of FASB Statement No. 143.” FIN 47 requires that a Company recognize a liability for the fair value of a conditional asset retirement obligation if the fair value of the liability can be reasonably estimated. The Company adopted this statement as of May 1, 2005, and it did not have a material impact on the Company’s financial position or results of operations.
In May 2005, the FASB issued SFAS No. 154, “Accounting Changes and Error Corrections,” a replacement of APB Opinion No. 20, “Accounting Changes” and SFAS No. 3, “Reporting Accounting Changes in Interim Financial Statements” (“SFAS No. 154”). SFAS No. 154 changes the requirements for, the accounting for, and reporting of, a change in accounting principle. Previously, voluntary changes in accounting principles were generally required to be recognized by way of a cumulative effect adjustment within net income during the period of the change. SFAS No. 154 requires retrospective application to prior periods’ financial statements, unless it is impracticable to determine either the period-specific effects or the cumulative effect of the change. SFAS No. 154 is effective for accounting changes made in fiscal years beginning after December 15, 2005; however, the statement does not change the transition provisions of any existing accounting pronouncements. The adoption of this statement is not expected to have a material impact on the Company’s financial position or results of operations.
USE OF ESTIMATES:The preparation of consolidated financial statements in conformity with U.S. generally accepted accounting principles requires management to make estimates and assumptions that affect the reported amounts of assets and liabilities and disclosure of contingent assets and liabilities at the date of the consolidated financial statements and the reported amounts of revenues and expenses during the reporting period. Actual results could differ from those estimates.
26 AMERICAN WOODMARK CORPORATION® 2006 ANNUAL REPORT
NOTE B — CUSTOMER RECEIVABLES
The components of customer receivables were:
| | | | | | | | |
| | | APRIL 30 | |
(in thousands) | | 2006 | | | 2005 | |
Gross customer receivables | | $ | 60,769 | | | $ | 58,461 | |
Less: | | | | | | | | |
Allowance for doubtful accounts | | | (1,096 | ) | | | (698 | ) |
Allowance for returns and discounts | | | (6,159 | ) | | | (4,886 | ) |
| | | | | | | | | |
Net customer receivables | | $ | 53,514 | | | $ | 52,877 | |
| | | | | | | | | |
| | | | | | | | | |
| | |
NOTE C — INVENTORIES | | | | | | | | |
| | |
The components of inventories were: | | | | | | | | |
| |
| | | APRIL 30 | |
(in thousands) | | 2006 | | | 2005 | |
Raw materials | | $ | 20,081 | | | $ | 19,821 | |
Work-in-process | | | 42,762 | | | | 42,051 | |
Finished goods | | | 18,138 | | | | 16,378 | |
| | | | | | | | | |
Total FIFO inventories | | | 80,981 | | | | 78,250 | |
Reserve to adjust inventories to LIFO value | | | (12,459 | ) | | | (13,037 | ) |
| | | | | | | | | |
Total LIFO inventories | | $ | 68,522 | | | $ | 65,213 | |
| | | | | | | | | |
| | | | | | | | | |
| | |
NOTE D — PROPERTY, PLANT AND EQUIPMENT | | | | | | | | |
| | |
The components of property, plant and equipment were: | | | | | | | | |
| |
| | | APRIL 30 | |
(in thousands) | | 2006 | | | 2005 | |
Land | | $ | 3,440 | | | $ | 3,440 | |
Buildings and improvements | | | 81,754 | | | | 78,311 | |
Buildings and improvements-capital leases | | | 20,356 | | | | 20,142 | |
Machinery and equipment | | | 174,243 | | | | 168,592 | |
Machinery and equipment-capital leases | | | 29,787 | | | | 27,740 | |
Construction in progress | | | 4,195 | | | | 4,517 | |
| | | | | | | | | |
| | | | 313,775 | | | | 302,742 | |
Less accumulated amortization and depreciation | | | (138,391 | ) | | | (117,229 | ) |
| | | | | | | | | |
Total | | $ | 175,384 | | | $ | 185,513 | |
| | | | | | | | | |
| | | | | | | | | |
Depreciation expense amounted to $23.3 million, $19.6 million, and $16.1 million in fiscal 2006, 2005, and 2004, respectively.
AMERICAN WOODMARK CORPORATION® 2006 ANNUAL REPORT 27
NOTE E — LOANS PAYABLE AND LONG-TERM DEBT
Maturities of long-term debt are as follows:
| | | | | | | | | | | | | | | | | | | | | |
| | | FISCAL YEARS ENDING APRIL 30 |
(in thousands) | | 2007 | | 2008 | | 2009 | | 2010 | | 2011 | | 2012 AND
THEREAFTER | | TOTAL
OUTSTANDING |
Term credit facility | | $ | — | | $ | — | | $ | — | | $ | — | | $ | 10,000 | | $ | — | | $ | 10,000 |
Other term loans | | | — | | | — | | | — | | | — | | | — | | | 2,234 | | | 2,234 |
Term loans | | | 357 | | | 381 | | | 381 | | | 366 | | | 390 | | | 4,357 | | | 6,232 |
Capital lease obligations | | | 1,099 | | | 473 | | | 483 | | | 493 | | | 503 | | | 7,700 | | | 10,751 |
| | | | | | | | | | | | | | | | | | | | | |
Total | | $ | 1,456 | | $ | 854 | | $ | 864 | | $ | 859 | | $ | 10,893 | | $ | 14,291 | | $ | 29,217 |
| | | | | | | | | | | | | | | | | | | | | |
Less current maturities | | | | | | | | | | | | | | | | | | | | $ | 1,456 |
| | | | | | | | | | | | | | | | | | | | | |
Total long-term debt | | | | | | | | | | | | | | | | | | | | $ | 27,761 |
| | | | | | | | | | | | | | | | | | | | | |
The Company’s primary loan agreement is unsecured and provides for a five-year, $35 million revolving credit facility and a $10 million, five-year term credit facility which expires on May 31, 2010. Borrowings under the credit facilities bear interest at the London InterBank Offered Rate (LIBOR) (4.82% at April 30, 2006) plus a spread (0.50% at April 30, 2006) based on Total Funded Debt to earnings, before deduction of interest and taxes, plus depreciation and amortization (EBITDA). Funded debt is the total of senior debt, letter of credit obligations, stockholder debt, subordinated debt, and the value of all capitalized and synthetic leases. The Company has no synthetic leases. The Company incurs a fee for amounts not used under the revolving credit facility. The non-usage fee is included in interest expense and was $52,073, $57,090, and $66,819 for 2006, 2005, and 2004, respectively, or 0.2% of the amount not borrowed. There were no amounts outstanding under the revolving credit facility at April 30, 2006 and 2005. The interest rate on the five-year term loan has been fixed at 6.0% through May 31, 2006, via an interest rate swap. The notional amount of the swap agreement is $10 million. Under the terms of the interest rate swap, the Company receives variable interest rate payments based on LIBOR and makes fixed interest rate payments of 6.0% thereby creating the equivalent of fixed rate debt. Interest paid on the swap agreement was $415,631, $394,347, and $435,450 for the years ended April 30, 2006, 2005, and 2004, respectively. Net amounts to be received or paid under interest rate swap agreements are accrued as an adjustment to interest expense. Any unrealized gain or loss associated with the swap agreement is accounted for as other comprehensive income (loss). As of April 30, 2006 and 2005, the fair value of the swap was $6,000 and $201,000, respectively, and is classified as a liability. The Company does not invest, trade, or otherwise speculate in any derivatives or similar type financial instruments.
In 2005, the Company entered into separate loan agreements with the Maryland Economic Development Corporation and the County Commissioners of Allegany County as part of the Company’s capital investment and operations at the Allegany County, Maryland site. These loan agreements are for $1.5 million and $0.8 million, respectively, and expire at December 31, 2014, bearing interest at a fixed rate of 3%. These loan agreements are secured by mortgages on the manufacturing facility constructed in Allegany County, Maryland. These loan agreements defer principal and interest during the term of the obligation and forgive any outstanding balance at December 31, 2014, if the Company complies with certain employment levels at the facility.
In 2004, the Company entered into a lease agreement with the West Virginia Economic Development Authority as part of the Company’s capital investment and operations at the South Branch plant located in Hardy County, West Virginia. This capital lease agreement is a $10 million term obligation, which expires at July 1, 2024, bearing interest at a fixed rate of 2%. The lease obligation requires monthly payments consisting of interest only through July 1, 2006, and principal and interest thereafter.
In 2002, the Company entered into a loan agreement with the Perry, Harlan, Leslie, Breathitt Regional Industrial Authority (a.k.a. Coalfields Regional Industrial Authority, Inc.) as part of the Company’s capital investment and operations at the Hazard, Kentucky site. This debt facility is a $6 million term loan, which expires November 13, 2017, bearing interest at a fixed rate of 2%.
28 AMERICAN WOODMARK CORPORATION® 2006 ANNUAL REPORT
It is secured by a mortgage on the manufacturing facility constructed in Hazard, Kentucky. The loan requires annual debt service payments consisting of principal and interest with a fixed balloon payment of $1.6 million at loan expiration.
At April 30, 2006, total term loans of $6.2 million were outstanding. The interest-bearing term loans bore a weighted average interest rate of 2.5% on April 30, 2006.
The Company’s loan agreements limit the amount and type of indebtedness the Company can incur and require the Company to maintain specified financial ratios measured on a quarterly basis. In addition to the assets listed above, certain of the Company’s other fixed assets are pledged as collateral under term loan agreements and capital lease arrangements. The Company was in compliance with all covenants contained in its loan agreements at April 30, 2006.
Interest paid was $1,064,000, $1,082,000, and $982,000 during fiscal 2006, 2005, and 2004, respectively.
Interest capitalized was $149,000, $662,000, and $161,000 during fiscal 2006, 2005, and 2004, respectively.
NOTE F — SHAREHOLDERS’ EQUITY
EMPLOYEE STOCK OWNERSHIP PLAN
In fiscal 1990, the Company instituted the American Woodmark Stock Ownership Plan (AWSOP). Under this plan, all employees over the age of 18 who have been employed by the Company for a minimum of six months are eligible to receive company stock through a profit sharing contribution and a 401(k) matching contribution based upon the employee’s contribution to the plan.
Profit sharing contributions in the form of company stock are 3% of after tax earnings, calculated on a quarterly basis and distributed equally to all employees eligible to participate in the plan. The Company recognized expenses for profit sharing contributions of $996,000, $1,068,000, and $951,000 in fiscal 2006, 2005, and 2004, respectively.
The Company matches 401(k) contributions in the form of company stock at 50% of an employee’s contribution to the plan up to 4% of base salary for an effective maximum Company contribution of 2% of base salary. The expense for 401(k) matching contributions for this plan was $1,600,000, $1,409,000, and $1,307,000 in fiscal 2006, 2005, and 2004, respectively.
STOCK OPTIONS
In 1999, shareholders approved a stock option plan for key employees of the Company. Under the plan, up to 2,000,000 shares of common stock may be granted as options, with the term of options granted not exceeding ten years. Options granted are subject to vesting conditions and other requirements prescribed by a participant’s stock option agreement. Options vest over three years on a straight-line basis. No new options will be issued in the future under this plan.
In 2004, shareholders approved a stock incentive plan for key employees of the Company. Under the plan, up to 2,000,000 shares of common stock may be granted as incentive awards, with the term of the awards granted not exceeding ten years. Incentive awards granted are subject to vesting conditions and other requirements prescribed by a participant’s incentive award agreement. Incentive awards vest over three years on a straight-line basis.
In 2000 and 2005, shareholders approved stock option plans for non-employee directors. Under the 2000 plan, up to 60,000 shares of common stock may be granted as options, with each non-employee director receiving an option to purchase 2,000 shares on the anniversary date of the plan. No new options will be issued in the future under this plan. Under the 2005 plan, up to 72,000 shares of common stock may be granted as options, with each non-employee director receiving an option to purchase 2,000 shares on the anniversary date of the plan. Outstanding options under the plans are exercisable in annual cumulative increments of 33.33% of options granted beginning one year after the date of grant and must be exercised within 12 months after cumulative increments exercisable equal 100% of options granted, at which time options expire.
AMERICAN WOODMARK CORPORATION® 2006 ANNUAL REPORT 29
The following table summarizes stock option activity and related information under the stock option plans for the fiscal years ended April 30:
| | | | | | | | | | | | |
| | | 2006 | | | 2005 | | | 2004 | |
Outstanding at beginning of year | | | 1,796,171 | | | | 1,621,404 | | | | 1,738,594 | |
Granted | | | 370,740 | | | | 586,588 | | | | 433,952 | |
Exercised | | | (94,100 | ) | | | (335,823 | ) | | | (533,976 | ) |
Expired or cancelled | | | (38,600 | ) | | | (75,998 | ) | | | (17,166 | ) |
| | | | | | | | | | | | | |
Outstanding at April 30 | | | 2,034,211 | | | | 1,796,171 | | | | 1,621,404 | |
| | | | | | | | | | | | | |
Exercisable at April 30 | | | 1,178,305 | | | | 865,481 | | | | 864,052 | |
Available for future issuance at April 30 | | | 2,204,436 | | | | 2,482,776 | | | | 883,232 | |
| | | | | | | | | | | | | |
Weighted average prices (in dollars): | | | | | | | | | | | | |
Outstanding at beginning of year | | $ | 23.81 | | | $ | 20.39 | | | $ | 15.89 | |
Granted | | | 29.40 | | | | 29.19 | | | | 25.55 | |
Exercised | | | 20.60 | | | | 15.50 | | | | 9.76 | |
Expired or cancelled | | | 27.51 | | | | 29.00 | | | | 26.90 | |
Outstanding at April 30 | | | 24.96 | | | | 23.81 | | | | 20.39 | |
Exercisable at April 30 | | $ | 22.15 | | | $ | 18.82 | | | $ | 15.43 | |
The following table summarizes information about stock options outstanding at April 30, 2006 [remaining lives (in years) and exercise prices are weighted-averages]:
| | | | | | | | | | | | |
| | | OPTIONS OUTSTANDING | | OPTIONS EXERCISABLE |
OPTION PRICE PER SHARE | | OPTIONS | | REMAINING LIFE | | EXERCISE PRICE | | OPTIONS | | EXERCISE PRICE |
$4.63—$7.22 | | 1,500 | | 0.5 | | $ | 4.63 | | 1,500 | | $ | 4.63 |
$8.22—$9.28 | | 97,300 | | 4.0 | | | 9.26 | | 97,300 | | | 9.26 |
$10.86—$14.93 | | 322,500 | | 4.5 | | | 13.29 | | 322,500 | | | 13.29 |
$18.91—$24.21 | | 383,334 | | 5.9 | | | 22.65 | | 277,779 | | | 22.05 |
$25.49—$26.85 | | 374,476 | | 8.0 | | | 26.78 | | 129,783 | | | 26.70 |
$28.97—$34.87 | | 787,987 | | 7.7 | | | 30.58 | | 333,072 | | | 33.46 |
$36.87—$44.59 | | 67,114 | | 5.6 | | | 41.12 | | 16,371 | | | 42.68 |
| | | | | | | | | | | | |
| | 2,034,211 | | | | | | | 1,178,305 | | | |
EARNINGS PER SHARE
The following table summarizes the computations of basic and diluted earnings per share:
| | | | | | | | | |
| | | FISCAL YEARS ENDED APRIL 30 |
(in thousands, except per share amounts) | | 2006 | | 2005 | | 2004 |
Numerator used in basic and diluted earnings per common share: | | | | | | | | | |
Net income | | $ | 33,210 | | $ | 35,591 | | $ | 31,707 |
| | | | | | | | | | |
Denominator: | | | | | | | | | |
Denominator for basic earnings per common share—weighted average shares | | | 16,280 | | | 16,473 | | | 16,188 |
Effect of dilutive securities: | | | | | | | | | |
Stock options | | | 306 | | | 407 | | | 480 |
| | | | | | | | | | |
Denominator for diluted earnings per common share – weighted average shares and assumed conversions | | | 16,586 | | | 16,880 | | | 16,668 |
Net income per share | | | | | | | | | |
Basic | | $ | 2.04 | | $ | 2.16 | | $ | 1.96 |
Diluted | | $ | 2.00 | | $ | 2.11 | | $ | 1.90 |
30 AMERICAN WOODMARK CORPORATION® 2006 ANNUAL REPORT
NOTE G — PENSION BENEFITS
The Company has two defined benefit plans covering virtually all of the Company’s employees. These plans provide defined benefits based on years of service and final average salary. These benefit plans have an April 30 measurement date.
| | | | | | | | |
| | | PENSION BENEFITS | |
(in thousands) | | 2006 | | | 2005 | |
CHANGE IN BENEFIT OBLIGATION | | | | | | | | |
Benefit obligation at beginning of year | | $ | 74,311 | | | $ | 56,433 | |
Service cost | | | 5,359 | | | | 3,968 | |
Interest cost | | | 4,019 | | | | 3,575 | |
Amendments | | | 174 | | | | 163 | |
Actuarial (gains) and losses | | | (10,624 | ) | | | 11,413 | |
Benefits paid | | | (1,421 | ) | | | (1,241 | ) |
| | | | | | | | | |
Benefit obligation at end of year | | $ | 71,818 | | | $ | 74,311 | |
| | | | | | | | | |
CHANGE IN PLAN ASSETS | | | | | | | | |
Fair value of plan assets at beginning of year | | $ | 43,342 | | | $ | 34,184 | |
Actual return on plan assets | | | 4,854 | | | | 1,850 | |
Company contributions | | | 7,745 | | | | 8,549 | |
Benefits paid | | | (1,421 | ) | | | (1,241 | ) |
| | | | | | | | | |
Fair value of plan assets at end of year | | $ | 54,520 | | | $ | 43,342 | |
| | | | | | | | | |
Funded status of the plans | | $ | (17,298 | ) | | $ | (30,969 | ) |
Unamortized prior service cost | | | 1,056 | | | | 1,011 | |
Unrecognized net actuarial loss | | | 18,170 | | | | 32,189 | |
| | | | | | | | | |
Prepaid benefit cost | | $ | 1,928 | | | $ | 2,231 | |
| | | | | | | | | |
| | |
(in thousands) | | 2006 | | | 2005 | |
AMOUNTS RECOGNIZED IN THE CONSOLIDATED BALANCE SHEETS | | | | | | | | |
Accrued benefit liability | | $ | (8,247 | ) | | $ | (18,745 | ) |
Intangible asset | | | 1,056 | | | | 1,011 | |
Accumulated other comprehensive loss | | | 9,119 | | | | 19,965 | |
| | | | | | | | | |
Net amount recognized | | $ | 1,928 | | | $ | 2,231 | |
| | | | | | | | | |
| | |
(in millions) | | 2006 | | | 2005 | |
PENSION PLANS WITH AN ACCUMULATED BENEFIT OBLIGATION IN EXCESS OF PLAN ASSETS | | | | | | | | |
Projected benefit obligation | | $ | 71.8 | | | $ | 74.3 | |
Accumulated benefit obligation | | | 62.8 | | | | 62.1 | |
Fair value of plan assets | | | 54.5 | | | | 43.3 | |
| | | | | | | | | |
| | | | | | | | | |
AMERICAN WOODMARK CORPORATION® 2006 ANNUAL REPORT 31
| | | | | | | | | | | | |
| | | PENSION BENEFITS | |
(in thousands) | | 2006 | | | 2005 | | | 2004 | |
COMPONENTS OF NET PERIODIC BENEFIT COST | | | | | | | | | | | | |
Service cost | | $ | 5,359 | | | $ | 3,968 | | | $ | 3,227 | |
Interest cost | | | 4,019 | | | | 3,575 | | | | 2,937 | |
Expected return on plan assets | | | (3,411 | ) | | | (2,688 | ) | | | (2,189 | ) |
Amortization of prior service cost | | | 130 | | | | 116 | | | | 106 | |
Recognized net actuarial loss | | | 1,951 | | | | 1,224 | | | | 1,298 | |
| | | | | | | | | | | | | |
Benefit cost | | $ | 8,048 | | | $ | 6,195 | | | $ | 5,379 | |
| | | | | | | | | | | | | |
| | | | | | | | | | | | | |
| | | | | | | |
(in thousands) | | 2006 | | | 2004 |
(DECREASE)/INCREASE IN MINIMUM PENSION LIABILITY INCLUDED IN OTHER COMPREHENSIVE INCOME | | $ | (10,846 | ) | | $ | 8,619 |
| | | | | | | | |
| | | | | | | | |
ACTUARIAL ASSUMPTIONS: The discount rate at April 30 was used to measure the year-end benefit obligations and the earnings effects for the subsequent year. Actuarial assumptions used to determine benefit obligations and earnings effects for principal pension plans follow:
| | | | | | |
| | | FISCAL YEARS ENDED APRIL 30 | |
| | | 2006 | | | 2005 | |
WEIGHTED-AVERAGE ASSUMPTIONS TO DETERMINE BENEFIT OBLIGATIONS | | | | | | |
Discount rate | | 6.10 | % | | 5.46 | % |
Rate of compensation increase | | 4.0 | % | | 4.0 | % |
| | | | | | | |
| | | | | | | |
| | | | | | | | | |
| | | FISCAL YEARS ENDED APRIL 30 | |
| | | 2006 | | | 2005 | | | 2004 | |
WEIGHTED-AVERAGE ASSUMPTIONS TO DETERMINE NET PERIODIC BENEFIT COST | | | | | | | | | |
Discount rate | | 5.46 | % | | 6.40 | % | | 6.20 | % |
Expected return on plan assets | | 8.0 | % | | 8.0 | % | | 8.0 | % |
Rate of compensation increase | | 4.0 | % | | 4.0 | % | | 4.0 | % |
| | | | | | | | | | |
| | | | | | | | | | |
The discount rate was based on Moody’s Aa bond rate as of April 30 of each respective year indicated. The expected long-term rate of return on assets is based on asset allocation within the Plan’s investment portfolio. The assumptions and the basis for their selection are consistent for all periods presented.
The Company amortizes experience gains and losses, as well as the effects of changes in actuarial assumptions and plan provisions, over a period no longer than the average future working lifetime of the active participants.
The Company funds the pension plans in amounts sufficient to meet minimum funding requirements set forth in employee benefit and tax laws plus additional amounts that the Company deems appropriate.
32 AMERICAN WOODMARK CORPORATION® 2006 ANNUAL REPORT
The Company’s pension plans’ weighted-average asset allocations at April 30, 2006 and 2005, by asset category are as follows:
| | | | | | | | | |
| | | PLAN ASSET ALLOCATION | |
| | | 2006 | | | 2005 | |
APRIL 30 | | TARGET
ALLOCATION | | | ACTUAL
ALLOCATION | | | ACTUAL
ALLOCATION | |
Equity Funds | | 50 | % | | 50.4 | % | | 49.2 | % |
Fixed Income Funds | | 50 | % | | 49.6 | % | | 50.8 | % |
| | | | | | | | | | |
Total | | 100 | % | | 100 | % | | 100 | % |
| | | | | | | | | | |
| | | | | | | | | | |
Within the broad categories outlined above, the Company has indicated the following specific allocation: 30% Capital Preservation, 20% Bond, 20% Large Capital Growth, 20% Large Capital Value, 6% Small Capital, and 4% International.
CONTRIBUTIONS:The Company expects to contribute $10.9 million to its pension plans in fiscal 2007 which represents both required and discretionary funding.
ESTIMATED FUTURE BENEFIT PAYMENTS:The following benefit payments, which reflect expected future service, are expected to be paid:
| | | |
FISCAL YEAR (in thousands) | | BENEFIT
PAYMENTS |
2007 | | $ | 1,590 |
2008 | | | 1,714 |
2009 | | | 1,875 |
2010 | | | 1,986 |
2011 | | | 2,270 |
Years 2012–2016 | | $ | 15,936 |
NOTE H — INCOME TAXES
Income tax expense was comprised of the following:
| | | | | | | | | | | | |
| | | FISCAL YEARS ENDED APRIL 30 | |
(in thousands) | | 2006 | | | 2005 | | | 2004 | |
Current expense | | | | | | | | | | | | |
Federal | | $ | 18,239 | | | $ | 17,045 | | | $ | 15,886 | |
State | | | 3,604 | | | | 3,922 | | | | 3,706 | |
| | | | | | | | | | | | | |
Total current expense | | | 21,843 | | | | 20,967 | | | | 19,592 | |
| | | | | | | | | | | | | |
Deferred expense (benefit) | | | | | | | | | | | | |
Federal | | | (1,444 | ) | | | 1,532 | | | | 598 | |
State | | | 92 | | | | 255 | | | | 99 | |
| | | | | | | | | | | | | |
Total deferred expense (benefit) | | | (1,352 | ) | | | 1,787 | | | | 697 | |
| | | | | | | | | | | | | |
Total expense from continuing operations | | $ | 20,491 | | | $ | 22,754 | | | $ | 20,289 | |
Other comprehensive income (loss) | | | 4,345 | | | | (3,208 | ) | | | 654 | |
| | | | | | | | | | | | | |
Total comprehensive income tax expense | | $ | 24,836 | | | $ | 19,546 | | | $ | 20,943 | |
| | | | | | | | | | | | | |
| | | | | | | | | | | | | |
| | | |
The Company’s effective income tax rate varied from the federal statutory rate as follows: | | | | | | | | | | | | |
| | | FISCAL YEARS ENDED APRIL 30 | |
| | | 2006 | | | 2005 | | | 2004 | |
Federal statutory rate | | | 35.0 | % | | | 35.0 | % | | | 35.0 | % |
Permanent differences | | | (1.3 | ) | | | (.4 | ) | | | (.3 | ) |
State income taxes, net of federal tax effect | | | 4.5 | | | | 4.4 | | | | 4.3 | |
| | | | | | | | | | | | | |
Effective income tax rate | | | 38.2 | % | | | 39.0 | % | | | 39.0 | % |
| | | | | | | | | | | | | |
| | | | | | | | | | | | | |
Income taxes paid were $18,880,000, $16,185,000, and $15,681,000 for fiscal years 2006, 2005, and 2004, respectively.
AMERICAN WOODMARK CORPORATION® 2006 ANNUAL REPORT 33
The significant components of deferred tax assets and liabilities were as follows:
| | | | | | |
| | | APRIL 30 |
(in thousands) | | 2006 | | 2005 |
Deferred tax assets: | | | | | | |
Accounts receivable | | $ | 6,360 | | $ | 5,405 |
Employee benefits | | | — | | | 238 |
Product liability | | | 2,079 | | | 1,911 |
Pension liability | | | 3,518 | | | 7,787 |
Other | | | 1,818 | | | 1,884 |
| | | | | | | |
Total | | | 13,775 | | | 17,225 |
Deferred tax liabilities: | | | | | | |
Employee benefits | | | 1,208 | | | — |
Depreciation | | | 16,662 | | | 18,836 |
Inventory | | | 523 | | | 145 |
Other | | | 678 | | | 693 |
| | | | | | | |
Total | | | 19,071 | | | 19,674 |
Net deferred tax liability | | $ | 5,296 | | $ | 2,449 |
| | | | | | | |
| | | | | | | |
Management believes it is more likely than not that the Company will realize its gross deferred tax assets due to expected future income and reversal of taxable temporary differences.
NOTE I — COMMITMENTS AND CONTINGENCIES
LEGAL MATTERS
The Company is involved in suits and claims in the normal course of business, including product liability and general liability claims, in addition to claims pending before the EEOC. On at least a quarterly basis, the Company consults with its legal counsel to ascertain the reasonable likelihood that such claims may result in a loss. As required by Statement of Financial Accounting Standards No. 5 (SFAS 5), the Company categorizes the various suits and claims into three categories according to their likelihood for resulting in potential loss: those that are probable (i.e., more likely than not), those that are reasonably possible, and those that are deemed to be remote. The Company accounts for these loss contingencies in accordance with SFAS 5. Where losses are deemed to be probable and estimable, accruals are made. Where losses are deemed to be reasonably possible, a range of loss estimates is determined. Where no loss estimate range can be made, the Company and its counsel perform a worst case estimate. In determining these loss range estimates, the Company considers known values of similar claims and consultation with its independent counsel.
The Company believes that the aggregate range of loss stemming from the various suits and asserted and unasserted claims which were deemed to be either probable or reasonably possible are not material.
PRODUCT WARRANTY
The Company estimates outstanding warranty costs based on the historical relationship between warranty claims and revenues. The warranty accrual is reviewed monthly to verify that it properly reflects the remaining obligation based on the anticipated expenditures over the balance of the obligation period. Adjustments are made when actual warranty claim experience differs from estimates. Warranty claims are generally made within three months of the original shipment date.
The following is a reconciliation of the Company’s warranty liability:
| | | | | | | | |
(in thousands) | | 2006 | | | 2005 | |
PRODUCT WARRANTY | | | | | | | | |
RESERVE | | | | | | | | |
Beginning balance | | $ | 4,952 | | | $ | 3,322 | |
Accrual for warranties | | | 26,710 | | | | 24,775 | |
Settlements | | | (26,275 | ) | | | (23,145 | ) |
| | | | | | | | | |
Ending balance at fiscal year end | | $ | 5,387 | | | $ | 4,952 | |
| | | | | | | | | |
| | | | | | | | | |
LEASE AGREEMENTS
The Company leases certain office buildings, manufacturing buildings, service centers, and equipment. Total rental expenses under operating leases amounted to approximately $9,229,000, $7,860,000, and $6,969,000 in fiscal 2006, 2005, and 2004, respectively. Minimum rental commitments as of April 30, 2006, under noncancelable leases are as follows:
| | | | | | | |
FISCAL YEAR (in thousands) | | OPERATING | | CAPITAL | |
2007 | | $ | 3,814 | | $ | 1,327 | |
2008 | | | 2,499 | | | 662 | |
2009 | | | 1,726 | | | 662 | |
2010 | | | 1,014 | | | 662 | |
2011 | | | 472 | | | 662 | |
2012 (and thereafter) | | | | | | 8,774 | |
| | | | | | | |
| | $ | 9,525 | | $ | 12,749 | |
| | | | | | | |
Less amounts representing interest (2% to 6.2%) | | | | | | (1,998 | ) |
| | | | | | | |
Total obligations under capital lease | | | | | $ | 10,751 | |
| | | | | | | |
34 AMERICAN WOODMARK CORPORATION® 2006 ANNUAL REPORT
RELATED PARTIES
During fiscal 1985, prior to becoming a publicly held corporation, the Company entered into an agreement with a partnership formed by certain former executive officers of the Company to lease an office building constructed and owned by the partnership. The Company has subsequently renewed this lease in accordance with company policy and procedures which includes approval by the Board of Directors. As of April 30, 2006, the Company is in the first year of the last five year renewal period. Under this agreement, rental expense was $428,000, $420,000, and $416,000 in fiscal 2006, 2005, and 2004, respectively. Rent during the remaining term of approximately $436,000 annually (included in the above table) is subject to adjustment based upon changes in the Consumer Price Index.
NOTE J — OTHER INFORMATION
Credit is extended to customers based on an evaluation of the customer’s financial condition and generally collateral is not required. The Company’s customers operate in the new home construction and home remodeling markets. At April 30, 2006, the Company’s two largest customers, Customers A and B represented 32.1% and 29.8% of the Company’s gross customer receivables, respectively. At April 30, 2005, Customers A and B represented 21.4% and 34.3% of the Company’s gross customer receivables, respectively.
The following table summarizes the percentage of sales to the Company’s two largest customers for the last three fiscal years:
| | | | | | |
| | | PERCENT OF ANNUAL GROSS SALES |
| | | 2006 | | 2005 | | 2004 |
Customer A | | 31.1 | | 30.1 | | 30.6 |
Customer B | | 30.7 | | 32.4 | | 30.7 |
The Company maintains an allowance for bad debt based upon management’s evaluation and judgment of potential net loss. The allowance is estimated based upon historical experience, the effects of current developments and economic conditions, and of customers’ current and anticipated financial condition. Estimates and assumptions are periodically reviewed and updated. Any resulting adjustments to the allowance are reflected in current operating results.
AMERICAN WOODMARK CORPORATION® 2006 ANNUAL REPORT 35
NOTE K — QUARTERLY FINANCIAL DATA (UNAUDITED)
| | | | | | | | | | | | |
FY 2006 (in thousands, except share amounts) | | 07/31/05 | | 10/31/05 | | 01/31/06 | | 04/30/06 |
Net sales | | $ | 215,564 | | $ | 214,535 | | $ | 191,143 | | $ | 216,429 |
Gross profit | | | 36,890 | | | 33,727 | | | 33,355 | | | 45,721 |
Income before income taxes | | | 12,160 | | | 9,955 | | | 9,789 | | | 21,797 |
Net income | | | 7,455 | | | 6,172 | | | 6,069 | | | 13,514 |
Earnings per share | | | | | | | | | | | | |
Basic | | $ | 0.45 | | $ | 0.38 | | $ | 0.37 | | $ | 0.84 |
Diluted | | $ | 0.45 | | $ | 0.37 | | $ | 0.37 | | $ | 0.83 |
| | | | |
FY 2005 (in thousands, except share amounts) | | 07/31/04 | | 10/31/04 | | 01/31/05 | | 04/30/05 |
Net sales | | $ | 187,534 | | $ | 199,149 | | $ | 183,175 | | $ | 207,132 |
Gross profit | | | 38,870 | | | 42,670 | | | 34,381 | | | 36,459 |
Income before income taxes | | | 15,904 | | | 18,614 | | | 11,611 | | | 12,216 |
Net income | | | 9,701 | | | 11,355 | | | 7,083 | | | 7,452 |
Earnings per share | | | | | | | | | | | | |
Basic | | $ | 0.59 | | $ | 0.69 | | $ | 0.43 | | $ | 0.45 |
Diluted | | $ | 0.58 | | $ | 0.67 | | $ | 0.42 | | $ | 0.44 |
36 AMERICAN WOODMARK CORPORATION® 2006 ANNUAL REPORT
report of independent registered public accounting firm
THE BOARD OF DIRECTORS AND SHAREHOLDERS AMERICAN WOODMARK CORPORATION:
We have audited the accompanying consolidated balance sheets of American Woodmark Corporation (the Company), as of April 30, 2006 and 2005, and the related consolidated statements of income, shareholders’ equity and comprehensive income, and cash flows for each of the years then ended. These consolidated financial statements are the responsibility of the Company’s management. Our responsibility is to express an opinion on these consolidated financial statements based on our audits.
We conducted our audits in accordance with the standards of the Public Company Accounting Oversight Board (United States). Those standards require that we plan and perform the audit to obtain reasonable assurance about whether the financial statements are free of material misstatement. An audit includes examining, on a test basis, evidence supporting the amounts and disclosures in the financial statements. An audit also includes assessing the accounting principles used and significant estimates made by management, as well as evaluating the overall financial statement presentation. We believe that our audits provide a reasonable basis for our opinion.
In our opinion, the consolidated financial statements referred to above present fairly, in all material respects the financial position of American Woodmark Corporation as of April 30, 2006 and 2005, and the results of their operations and their cash flows for the years then ended, in conformity with U.S. generally accepted accounting principles.
We also have audited, in accordance with the standards of the Public Company Accounting Oversight Board (United States), the effectiveness of the Company’s internal control over financial reporting as of April 30, 2006, based on criteria established in Internal Control – Integrated Framework issued by the Committee of Sponsoring Organizations of the Treadway Commission (COSO), and our report dated June 12, 2006, expressed an unqualified opinion on management’s assessment of, and the effective operation of, internal control over financial reporting.
Roanoke, Virginia
June 12, 2006
AMERICAN WOODMARK CORPORATION® 2006 ANNUAL REPORT 37
report of independent registered public accounting firm
THE BOARD OF DIRECTORS AND SHAREHOLDERS AMERICAN WOODMARK CORPORATION:
We have audited the accompanying consolidated balance sheet of American Woodmark Corporation as of April 30, 2004, and the related consolidated statements of income, shareholders’ equity and comprehensive income, and cash flows for each of the two years in the period ended April 30, 2004. These financial statements are the responsibility of the Company’s management. Our responsibility is to express an opinion on these financial statements based on our audits.
We conducted our audits in accordance with the standards of the Public Company Accounting Oversight Board (United States). Those standards require that we plan and perform the audit to obtain reasonable assurance about whether the financial statements are free of material misstatement. We were not engaged to perform an audit of the Company’s internal control over financial reporting. Our audits included consideration of internal control over financial reporting as a basis for designing audit procedures that are appropriate in the circumstances, but not for the purpose of expressing an opinion on the effectiveness of the Company’s internal control over financial reporting. Accordingly, we express no such opinion. An audit also includes examining, on a test basis, evidence supporting the amounts and disclosures in the financial statements, assessing the accounting principles used and significant estimates made by management, and evaluating the overall financial statement presentation. We believe that our audits provide a reasonable basis for our opinion.
In our opinion, the financial statements referred to above present fairly, in all material respects, the consolidated financial position of American Woodmark Corporation at April 30, 2004, and the consolidated results of their operations and their cash flows for each of the two years in the period ended April 30, 2004, in conformity with U.S. generally accepted accounting principles.
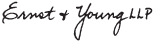
Richmond, Virginia
June 4, 2004,
except for the fourth paragraph
of Note A, as to which the date is
June 16, 2005
38 AMERICAN WOODMARK CORPORATION® 2006 ANNUAL REPORT
management’s report
MANAGEMENT’S REPORT ON INTERNAL CONTROL OVER FINANCIAL REPORTING
Management has responsibility for establishing and maintaining adequate internal control over financial reporting. Internal control over financial reporting is a process designed to provide reasonable assurance regarding the reliability of financial reporting and the preparation of financial statements for external reporting purposes in accordance with U.S. generally accepted accounting principles. Because of its inherent limitations, internal control over financial reporting may not prevent or detect misstatements. Management has assessed the effectiveness of the Company’s internal control over financial reporting as of April 30, 2006. In making its assessment, Management has utilized the criteria set forth by the Committee of Sponsoring Organizations (COSO) of the Treadway Commission in Internal Control–Integrated Framework. Management concluded that based on its assessment, American Woodmark Corporation’s internal control over financial reporting was effective as of April 30, 2006. Management’s assessment of the effectiveness of the Company’s internal control over financial reporting as of April 30, 2006, has been audited by KPMG LLP, an independent registered public accounting firm, as stated in their report, which appears in this Annual Report to Shareholders.
James J. Gosa
Chairman, President and CEO

Jonathan H. Wolk
Vice President and Chief Financial Officer
AMERICAN WOODMARK CORPORATION® 2006 ANNUAL REPORT 39
report of independent registered public accounting firm
THE BOARD OF DIRECTORS AND SHAREHOLDERS AMERICAN WOODMARK CORPORATION:
We have audited management’s assessment, included in the accompanying Management’s Report on Internal Control over Financial Reporting, that American Woodmark Corporation (the Company) maintained effective internal control over financial reporting as of April 30, 2006, based on criteria established in Internal Control—Integrated Framework issued by the Committee of Sponsoring Organizations of the Treadway Commission (COSO). The Company’s management is responsible for maintaining effective internal control over financial reporting and for its assessment of the effectiveness of internal control over financial reporting. Our responsibility is to express an opinion on management’s assessment and an opinion on the effectiveness of the Company’s internal control over financial reporting based on our audit.
We conducted our audit in accordance with the standards of the Public Company Accounting Oversight Board (United States). Those standards require that we plan and perform the audit to obtain reasonable assurance about whether effective internal control over financial reporting was maintained in all material respects. Our audit included obtaining an understanding of internal control over financial reporting, evaluating management’s assessment, testing and evaluating the design and operating effectiveness of internal control, and performing such other procedures as we considered necessary in the circumstances. We believe that our audit provides a reasonable basis for our opinion.
A company’s internal control over financial reporting is a process designed to provide reasonable assurance regarding the reliability of financial reporting and the preparation of financial statements for external purposes in accordance with generally accepted accounting principles. A company’s internal control over financial reporting includes those policies and procedures that (1) pertain to the maintenance of records that, in reasonable detail, accurately and fairly reflect the transactions and dispositions of the assets of the company; (2) provide reasonable assurance that transactions are recorded as necessary to permit preparation of financial statements in accordance with generally accepted accounting principles, and that receipts and expenditures of the company are being made only in accordance with authorizations of management and directors of the company; and (3) provide reasonable assurance regarding prevention or timely detection of unauthorized acquisition, use, or disposition of the company’s assets that could have a material effect on the financial statements.
Because of its inherent limitations, internal control over financial reporting may not prevent or detect misstatements. Also, projections of any evaluation of effectiveness to future periods are subject to the risk that controls may become inadequate because of changes in conditions, or that the degree of compliance with the policies or procedures may deteriorate.
In our opinion, management’s assessment that the Company maintained effective internal control over financial reporting as of April 30, 2006, is fairly stated, in all material respects, based on criteria established in Internal Control—Integrated Framework issued by the Committee of Sponsoring Organizations of the Treadway Commission (COSO). Also, in our opinion, the Company maintained, in all material respects, effective internal control over financial reporting as of April 30, 2006, based on criteria established in Internal Control—Integrated Framework issued by the Committee of Sponsoring Organizations of the Treadway Commission (COSO).
We also have audited, in accordance with the standards of the Public Company Accounting Oversight Board (United States), the consolidated balance sheet of American Woodmark Corporation as of April 30, 2006; and the related consolidated statements of income, shareholders’ equity and comprehensive income, and cash flows for the year then ended, and our report dated June 12, 2006, expressed an unqualified opinion on those consolidated financial statements.
Roanoke,
Virginia June 12, 2006
40 AMERICAN WOODMARK CORPORATION® 2006 ANNUAL REPORT
DIRECTORS AND EXECUTIVE OFFICERS
William F. Brandt, Jr.
Director
Daniel T. Carroll
Director;
Member of the Audit Committee,
and the Nominating and Governance Committee
Chairman — The Carroll Group
Martha M. Dally
Director;
Chair of the Nominating and Governance Committee,
and member of the Compensation Committee
Vice President Customer Development — Sara Lee Corporation
James G. Davis
Director;
Chairman of the Compensation Committee
President and CEO — James G. Davis Construction Corporation
Neil P. DeFeo
Director;
Member of the Compensation Committee,
and Nominating and Governance Committee
Chairman, President and CEO — Playtex Products, Inc.
James J. Gosa
Chairman, President and CEO
Kent B. Guichard
Director;
Executive Vice President and COO
Daniel T. Hendrix
Director;
Member of the Compensation Committee
President and CEO — Interface, Incorporated
Kent J. Hussey
Director;
Chairman of the Audit Committee
President and COO — Spectrum Brands, Inc.
(formerly Rayovac Corporation)
G. Thomas McKane
Director;
Member of the Audit Committee
Chairman — A.M. Castle & Co.
Carol B. Moerdyk
Director;
Member of the Audit Committee
Senior Vice President, International — OfficeMax Incorporated
Jonathan H. Wolk
Vice President and CFO; Corporate Secretary
CORPORATE INFORMATION
ANNUAL MEETING
The Annual Meeting of Shareholders of American Woodmark Corporation will be held on August 24, 2006, at 9:00 a.m. at the Museum of the Shenandoah Valley, 901 Amherst Street in Winchester, Virginia.
ANNUAL REPORT ON FORM 10-K
A copy of the Company’s Annual Report on Form 10-K for the fiscal year ended April 30, 2006, may be obtained free of charge by writing:
Glenn Eanes
Vice President & Treasurer
American Woodmark Corporation
PO Box 1980
Winchester, VA 22604-8090
CORPORATE HEADQUARTERS
American Woodmark Corporation
3102 Shawnee Drive
Winchester, VA 22601-4208
(540) 665-9100
MAILING ADDRESS
PO Box 1980
Winchester, VA 22604-8090
TRANSFER AGENT
American Stock Transfer & Trust Company
(800) 937-5449
SHAREHOLDER INQUIRIES
Investor Relations
American Woodmark Corporation
3102 Shawnee Drive
Winchester, VA 22601-4208
(540) 665-9100
www.americanwoodmark.com
American Woodmark™ is a trademark of American Woodmark Corporation.®
© 2006 American Woodmark Corporation®
Printed in U.S.A.
Design by Phoenix Creative Group, www.phoenixcreativegroup.com
