Exhibit 13
table of contents
| | |
| 2 | | Company Profile |
| |
| 3 | | Financial Highlights |
| |
| 3 | | Market Information |
| |
| 4 | | Letter from the Chief Executive Officer |
| |
| 11 | | Five-Year Selected Financial Information |
| |
| 12 | | Management’s Discussion and Analysis |
| |
| 21 | | Consolidated Financial Statements |
| |
| 25 | | Notes to Consolidated Financial Statements |
| |
| 40 | | Report of Independent Registered Public Accounting Firm |
| |
| 41 | | Management’s Report on Internal Control over Financial Reporting |
| |
| 42 | | Report of Independent Registered Public Accounting Firm |
| |
| 43 | | Stock Performance Graph |
| |
| 44 | | Directors and Executive Officers |
| |
| 45 | | Corporate Information |
mission statement
creating value
through people
WHO WE ARE
American Woodmark is an organization of employees and shareholders who have combined their resources to pursue a common goal.
WHAT WE DO
Our common goal is to create value by providing kitchens and baths “of pride” for the American family.
WHY WE DO IT
We pursue this goal to earn a profit, which allows us to reward our shareholders and employees and to make a contribution to our society.
HOW WE DO IT
Four principles guide our actions:
CUSTOMER SATISFACTION Providing the best possible quality, service and value to the greatest number of people. Doing whatever is reasonable, and sometimes unreasonable, to make certain that each customer’s needs are met each and every day.
INTEGRITY Doing what is right. Caring about the dignity and rights of each individual. Acting fairly and responsibly with all parties. Being a good citizen in the communities in which we operate.
TEAMWORK Understanding that we must all work together if we are to be successful. Realizing that each individual must contribute to the team to remain a member of the team.
EXCELLENCE Striving to perform every job or action in a superior way. Being innovative, seeking new and better ways to get things done. Helping all individuals to become the best that they can be in their jobs and careers.
ONCE WE’VE DONE IT
When we achieve our goal good things happen: sales increase, profits are made, shareholders and employees are rewarded, jobs are created, our communities benefit, we have fun, and our customers are happy and proud—with a new kitchen or bath from American Woodmark.
AMERICAN WOODMARK CORPORATION® 2007 ANNUAL REPORT 1
| | | | |
| | company |
| | | | profile |
| | |

| | | | American Woodmark Corporation manufactures and distributes kitchen cabinets and vanities for the remodeling and new home construction markets. The Company operates 15 manufacturing facilities located in Arizona, Georgia, Indiana, Kentucky, Maryland, Minnesota, Oklahoma, Tennessee, Virginia, and West Virginia and 9 service centers across the country. American Woodmark Corporation was formed in 1980 and became a public company through a common stock offering in July, 1986. The Company offers approximately 350 cabinet lines in a wide variety of designs, materials, and finishes. Products are sold across the United States through a network of independent distributors and directly to home centers and major builders. Approximately 66% of sales during fiscal year 2007 were to the remodeling market and 34% to the new home market. The Company believes it is one of the three largest manufacturers of kitchen cabinets in the United States. |
| | | |
| | | |
| | | |
2 AMERICAN WOODMARK CORPORATION® 2007 ANNUAL REPORT

financial highlights
| | | | | | | | | | | | |
| | | FISCAL YEARS ENDED APRIL 30 | |
(in thousands, except per share data) | | 2007 | | | 2006 | | | 2005 | |
OPERATIONS | | | | | | | | | | | | |
Net sales | | $ | 760,925 | | | $ | 837,671 | | | $ | 776,990 | |
Operating income | | | 49,408 | | | | 53,419 | | | | 58,367 | |
Net income | | | 32,561 | | | | 33,210 | | | | 35,591 | |
Earnings per share | | | | | | | | | | | | |
Basic | | $ | 2.08 | | | $ | 2.04 | | | $ | 2.16 | |
Diluted | | | 2.04 | | | | 2.00 | | | | 2.11 | |
Average shares outstanding | | | | | | | | | | | | |
Basic | | | 15,690 | | | | 16,280 | | | | 16,473 | |
Diluted | | | 15,976 | | | | 16,586 | | | | 16,880 | |
| | | |
FINANCIAL POSITION | | | | | | | | | | | | |
Working capital | | $ | 95,748 | | | $ | 100,526 | | | $ | 74,112 | |
Total assets | | | 348,695 | | | | 378,886 | | | | 361,168 | |
Long-term debt, net of current maturities | | | 26,908 | | | | 27,761 | | | | 29,217 | |
Shareholders’ equity | | | 226,097 | | | | 241,661 | | | | 215,191 | |
Long-term debt to capital ratio | | | 10.6 | % | | | 10.3 | % | | | 12.0 | % |
market information
American Woodmark Corporation common stock, no par value, is quoted on The NASDAQ Global Select Market under the “AMWD” symbol. Common stock per share market prices and cash dividends declared during the last two fiscal years were as follows:
| | | | | | | | | |
| | | MARKET PRICE | | DIVIDENDS DECLARED |
(in dollars) | | High | | Low | |
FISCAL 2007 | | | | | | | | | |
First quarter | | $ | 39.66 | | $ | 29.53 | | $ | 0.03 |
Second quarter | | | 39.18 | | | 29.59 | | | 0.06 |
Third quarter | | | 45.23 | | | 34.18 | | | 0.06 |
Fourth quarter | | | 46.10 | | | 34.47 | | | 0.06 |
| | | |
FISCAL 2006 | | | | | | | | | |
First quarter | | $ | 36.90 | | $ | 27.75 | | $ | 0.03 |
Second quarter | | | 38.95 | | | 27.77 | | | 0.03 |
Third quarter | | | 32.66 | | | 23.00 | | | 0.03 |
Fourth quarter | | | 41.00 | | | 28.26 | | | 0.03 |
As of June 5, 2007, there were approximately 9,000 shareholders of record of the Company’s common stock. Included are approximately 60% of the Company’s employees, who are shareholders through the American Woodmark Stock Ownership Plan. The Company pays dividends on its common stock each fiscal quarter. Although the Company presently intends to continue to declare cash dividends on a quarterly basis for the foreseeable future, the determination as to the payment and the amount of any future dividends will be made by the Board of Directors from time to time and will depend on the Company’s then-current financial condition, capital requirements, results of operations and any other factors then deemed relevant by the Board of Directors.
AMERICAN WOODMARK CORPORATION® 2007 ANNUAL REPORT 3

to our
shareholders
| | | | |
 | | We closed out our prior fiscal year on a very high note. As we entered fiscal year 2007, we were enjoying the benefits of improved management systems, a more favorable operating environment, and strong core product sales growth. At the same time, we were beginning to realize the benefits of our Company-wide quality program that we launched in fiscal 2006. Improved quality and service, coupled with the launching of new products, led to robust sales and increased market share. As a result, we achieved record levels of core product sales, net income, operating cash flow and free cash flow in the first half of fiscal 2007. By mid-year we had nearly completed our planned withdrawal from certain low-margin categories. This initiative enabled improved |
| |
KENT B. GUICHARD President and COO | | JAMES J. GOSA Chairman and CEO | |
| | | |
4 AMERICAN WOODMARK CORPORATION® 2007 ANNUAL REPORT
| | |
gross margins resulting from better product mix. In addition, withdrawing from these high-volume categories relieved production capacity which in turn contributed to a more favorable operating environment. However, in the fall of the year the decline that had been underway in new construction accelerated. Early consensus forecasts called for a five to eight percent pullback in housing starts in calendar 2006 followed by a similar impact in calendar 2007. As we now know, the actual decline has proven to be much more severe than anticipated. The impact of speculators in key housing markets such as California, Arizona, Florida and Greater Washington, DC has proved to be much greater than previously estimated. The pricing bubble created by over-speculation in these and other markets has led to what has become the biggest housing downturn since the recession of 1990–1991. In addition, around mid-year, the large home centers began to experience negative comparable store sales results. After several years of solid remodeling growth, the consumer has taken a pause in big ticket remodeling expenditures. It would appear that falling home prices have also impacted remodeling activity, albeit much less severely than new construction as the macro economic factors remain positive. Although we had been aggressively pursuing and gaining market share in both the remodeling and new construction channels, the depressed new housing market, combined with softening remodeling activity interrupted core product sales growth. Consequently, | | 
|
| |
| | |
| | |
AMERICAN WOODMARK CORPORATION® 2007 ANNUAL REPORT 5

the last two quarters of our fiscal year were punctuated by abnormally low levels of sales activity which negatively impacted margins and earnings.
Our operating strategy during this challenging period has been to eliminate non-strategic costs wherever possible, while at the same time continuing to staff critical jobs to maintain and in some cases improve our capability to service our customers. We have also maintained sufficient operational capacity which will allow us to take advantage of the market when it returns.
In response to the difficult market environment, we have reduced our labor costs by 25% and overhead spending by over 10%. We have continued to invest in our quality effort and are seeing both reduced costs and elevated customer satisfaction levels as a result. We have launched several new products which have become key contributors to market share gains. We will continue with these and other initiatives in pursuit of market share.
On the organizational front we have sustained our training and recruitment efforts to continue to staff the organization for the present environment without sacrificing the future.
We continue to focus on maintaining a strong balance sheet. Debt-to-equity remains below 11% of total capitalization. Our DSO has remained fairly constant at approximately 35 days and our inventory continues to turn at approximately 10 times per year. We generated over $90 million of operating cash flow and over $60 million of free cash flow in fiscal 2007, eclipsing our previous records by over $20 million. During fiscal year 2007, we bought back nearly 1.8 million shares, reduced our outstanding share base by 6% and completed nearly 60% of the $50 million stock repurchase authorization that our board approved in November 2006.
AMERICAN WOODMARK CORPORATION® 2007 ANNUAL REPORT 7
As we look ahead, we see a housing market that is depressed in the short term, but is part of an overall economy that remains relatively sound and continues to create jobs. Inflation is at acceptable levels and interest rates remain low by historical standards. While the near-term prospects for housing and remodeling are uncertain, the mid- and long-term outlook appears excellent. As the excess inventory of unsold homes is drawn down to more normal levels and home prices stabilize, we can begin to look for improved results. We are anticipating this to occur during our fiscal year 2008.
During the upcoming year, our management team will launch the 2013 Vision, the Company’s fourth six-year Vision in its history. The “Total Quality Experience” is the hallmark of the 2013 Vision. This is an ideal time to embark on this journey, and I am confident it will compound our successes in the market and prove rewarding to our shareholders.
Downturns are never fun, but they provide us with the opportunity to focus on improved operations and market share. We will continue those efforts as the housing and remodeling markets work through their remaining bumps and regain their health and vitality.
8 AMERICAN WOODMARK CORPORATION® 2007 ANNUAL REPORT


Finally, at our May board meeting, Kent Guichard, our President and Chief Operating Officer, was unanimously elected President and Chief Executive Officer, effective with our August board meeting. During his 14 years with the Company, Kent has gained experience in and had a positive impact on virtually every one of the Company’s functional areas. Since taking charge of day-to-day operations three years ago, his contributions have been outstanding.
I will look forward to working with Kent, staying on as non-executive Chairman of the Board. The past 11 years as your CEO have been a true labor of love. Earlier in my career I never dreamed that I would have the opportunity to lead such a unique and outstanding company like this one. It has been an honor for which I will be forever grateful.
Finally, I want to recognize every member of the American Woodmark team for their superior effort in navigating through this very difficult period. Many of our people have never experienced a housing downturn, so for them this is a first-time event. All Woodmark people have answered the call and, while I am no longer surprised by their tenacity and professionalism, I don’t take it for granted. My personal thanks goes out to each of them.
I look forward to a challenging but exciting period ahead. I remain very optimistic about the prospects for our industry, our Company and our long-term shareholders.
|
 |
|
| James J. Gosa |
| Chairman and CEO |
10 AMERICAN WOODMARK CORPORATION® 2007 ANNUAL REPORT
FIVE-YEAR SELECTED FINANCIAL INFORMATION
| | | | | | | | | | | | | | | | | | | | |
| | | FISCAL YEARS ENDED APRIL 30 | |
(in millions, except per share data) | | 20074 | | | 2006 | | | 2005 | | | 2004 | | | 2003 | |
FINANCIAL STATEMENT DATA | | | | | | | | | | | | | | | | | | | | |
Net sales | | $ | 760.9 | | | $ | 837.7 | | | $ | 777.0 | | | $ | 667.5 | | | $ | 563.5 | |
Income before income taxes | | | 51.2 | | | | 53.7 | | | | 58.3 | | | | 52.0 | | | | 53.9 | |
Net income | | | 32.6 | | | | 33.2 | | | | 35.6 | | | | 31.7 | | | | 32.7 | |
Earnings per share:1 | | | | | | | | | | | | | | | | | | | | |
Basic | | | 2.08 | | | | 2.04 | | | | 2.16 | | | | 1.96 | | | | 2.00 | |
Diluted | | | 2.04 | | | | 2.00 | | | | 2.11 | | | | 1.90 | | | | 1.95 | |
Depreciation and amortization expense | | | 35.9 | | | | 37.0 | | | | 33.4 | | | | 27.7 | | | | 27.7 | |
Total assets | | | 348.7 | | | | 378.9 | | | | 361.2 | | | | 307.1 | | | | 262.7 | |
Long-term debt, less current maturities | | | 26.9 | | | | 27.8 | | | | 29.2 | | | | 18.0 | | | | 19.0 | |
Total shareholders’ equity | | | 226.1 | | | | 241.7 | | | | 215.2 | | | | 193.1 | | | | 160.1 | |
Cash dividends declared per share | | | .21 | | | | .12 | | | | .115 | | | | .10 | | | | .10 | |
Average shares outstanding1 | | | | | | | | | | | | | | | | | | | | |
Basic | | | 15.7 | | | | 16.3 | | | | 16.5 | | | | 16.2 | | | | 16.3 | |
Diluted | | | 16.0 | | | | 16.6 | | | | 16.9 | | | | 16.7 | | | | 16.8 | |
| | | | | | | | | | | | | | | | | | | | |
PERCENT OF SALES | | | | | | | | | | | | | | | | | | | | |
Gross profit | | | 20.5 | % | | | 17.9 | % | | | 19.6 | % | | | 20.6 | % | | | 23.6 | % |
Selling, general and administrative expenses | | | 14.0 | | | | 11.5 | | | | 12.1 | | | | 12.7 | | | | 13.9 | |
Income before income taxes | | | 6.7 | | | | 6.4 | | | | 7.5 | | | | 7.8 | | | | 9.6 | |
Net income | | | 4.3 | | | | 4.0 | | | | 4.6 | | | | 4.7 | | | | 5.8 | |
| | | | | |
RATIO ANALYSIS | | | | | | | | | | | | | | | | | | | | |
Current ratio | | | 2.4 | | | | 2.2 | | | | 1.9 | | | | 1.9 | | | | 1.8 | |
Inventory turnover2 | | | 9.7 | | | | 10.3 | | | | 10.4 | | | | 10.6 | | | | 10.8 | |
Collection period–days3 | | | 34.9 | | | | 35.5 | | | | 32.2 | | | | 32.6 | | | | 31.3 | |
Percentage of capital (long-term debt plus equity): | | | | | | | | | | | | | | | | | | | | |
Long-term debt, net of current maturities | | | 10.6 | % | | | 10.3 | % | | | 12.0 | % | | | 8.5 | % | | | 10.6 | % |
Equity | | | 89.4 | | | | 89.7 | | | | 88.0 | | | | 91.5 | | | | 89.4 | |
Return on equity (average %) | | | 13.9 | | | | 14.5 | | | | 17.4 | | | | 18.0 | | | | 21.4 | |
1 | All share and per share information have been restated to reflect a two-for-one stock split, effective September 24, 2004. |
2 | Based on average of beginning and ending inventory. |
3 | Based on ratio of monthly average customer receivables to average sales per day. |
4 | The Company adopted the provisions of SFAS 123(R) and SFAS 158 during fiscal year 2007. |
AMERICAN WOODMARK CORPORATION® 2007 ANNUAL REPORT 11
financial review
2007
Management’s
discussion and analysis
RESULTS OF OPERATIONS
The following table sets forth certain income and expense items as a percentage of net sales.
| | | | | | | | | |
| | | PERCENTAGE OF NET SALES | |
| | | Years Ended April 30 | |
| | | 2007 | | | 2006 | | | 2005 | |
Net sales | | 100.0 | % | | 100.0 | % | | 100.0 | % |
Cost of sales and distribution | | 79.5 | | | 82.1 | | | 80.4 | |
Gross profit | | 20.5 | | | 17.9 | | | 19.6 | |
Selling and marketing expenses | | 9.3 | | | 8.4 | | | 8.7 | |
General and administrative expenses | | 4.7 | | | 3.1 | | | 3.4 | |
Operating income | | 6.5 | | | 6.4 | | | 7.5 | |
Interest expense/other (income) expense | | (0.2 | ) | | 0.0 | | | 0.0 | |
Income before income taxes | | 6.7 | | | 6.4 | | | 7.5 | |
Income tax expense | | 2.4 | | | 2.4 | | | 2.9 | |
Net income | | 4.3 | | | 4.0 | | | 4.6 | |
The following discussion should be read in conjunction with the Selected Financial Data and the Consolidated Financial Statements and the related notes contained elsewhere herein.
12 AMERICAN WOODMARK CORPORATION® 2007 ANNUAL REPORT
FORWARD-LOOKING STATEMENTS
This report contains statements concerning the Company’s expectations, plans, objectives, future financial performance, and other statements that are not historical facts. These statements are “forward-looking statements” within the meaning of the Private Securities Litigation Reform Act of 1995. In most cases, the reader can identify these forward-looking statements by words such as “anticipate,” “estimate,” “forecast,” “expect,” “believe,” “should,” “could,” “would,” “plan,” “may” or other similar words. Forward-looking statements contained in this report, including Management’s Discussion and Analysis are based on current expectations and our actual results may differ materially from those projected in any forward-looking statements. In addition, we participate in an industry that is subject to rapidly changing conditions and there are numerous factors that could cause the Company to experience a decline in sales and/or earnings. These include (1) overall industry demand at reduced levels, (2) economic weakness in a specific channel of distribution, (3) the loss of sales from specific customers due to their loss of market share, bankruptcy or switching to a competitor, (4) a sudden and significant rise in basic raw material costs, (5) a dramatic increase to the cost of diesel fuel and/or transportation related services, (6) the need to respond to price or product initiatives launched by a competitor, and (7) sales growth at a rate that outpaces the Company’s ability to install new capacity. While the Company believes that these risks are manageable and will not adversely impact the long-term performance of the Company, these risks could, under certain circumstances, have a materially adverse impact on the Company’s operating results or financial condition.
OVERVIEW
American Woodmark Corporation manufactures and distributes kitchen cabinets and vanities for the remodeling and new home construction markets. Its products are sold on a national basis directly to home centers, major builders and home manufacturers, and through a network of independent distributors.
At April 30, 2007, the Company operated 15 manufacturing facilities and 9 service centers across the country.
Despite the headwinds of a difficult market environment for housing, the Company achieved record levels of free cash flow (defined as the net of operating and investing cash flows) and net income exclusive of stock compensation expense in its fiscal year ended April 30, 2007 (fiscal 2007). The Company achieved record net income during the first half of fiscal 2007, driven by increased sales levels and benefits from the Company’s continued transition out of certain low-margin products, which was completed in February 2007. Sales and profits declined in the second half of the year, as sales order levels from new construction customers dropped significantly. The Company believes it grew market share during fiscal 2007, since its remodeling sales grew at a time when its remodeling customers experienced declining comparative sales results. Similarly, the rate of decline in the Company’s new construction sales was less than that experienced by many of its new construction customers.
Gross margin for fiscal year 2007 was 20.5%, up significantly from 17.9% in fiscal 2006. The improvement in gross margin was driven by the beneficial impact from the completion of the Company’s transition out of certain low-margin products, as well as the resolution of certain operational events that adversely impacted the Company’s margins in fiscal 2006.
As a result of adopting SFAS 123(R) on May 1, 2006, the Company’s income before income taxes and net income for fiscal 2007 was $6,287,000 and $3,912,000 lower, respectively, from what would have been presented had the Company continued to account for stock options under APB 25.
Net income was $32.6 million for fiscal 2007, compared with $33.2 million during fiscal 2006.
RESULTS OF OPERATIONS
| | | | | | | | | | | | | | | |
| | | FISCAL YEARS ENDED APRIL 30 | |
(in thousands) | | 2007 | | 2006 | | 2005 | | 2007 VS. 2006
PERCENT CHANGE | | | 2006 VS. 2005
PERCENT CHANGE | |
Net Sales | | $ | 760,925 | | $ | 837,671 | | $ | 776,990 | | (9.2 | )% | | 7.8 | % |
Gross Profit | | | 155,819 | | | 149,693 | | | 152,380 | | 4.1 | | | (1.8 | ) |
Selling & Marketing Expenses | | | 71,009 | | | 70,361 | | | 67,225 | | 0.9 | | | 4.7 | |
G&A Expenses | | | 35,402 | | | 25,913 | | | 26,788 | | 36.6 | | | (3.3 | ) |
Interest Expense | | | 910 | | | 1,018 | | | 515 | | (10.6 | ) | | 97.7 | |
AMERICAN WOODMARK CORPORATION® 2007 ANNUAL REPORT 13
NET SALES
Net sales were $760.9 million in fiscal 2007, a decrease of $76.7 million, or 9% as compared with fiscal 2006. The majority of the sales decline was driven by the Company’s planned transition out of certain low-margin products, which caused sales to decline by approximately $55 million. Sales of the Company’s core products declined by $21 million, or 3%, as a double-digit decline in new construction sales more than offset the Company’s 9% increase in remodeling sales. Overall unit volume for fiscal 2007 was 21.2% lower than in fiscal 2006, driven primarily by the Company’s transition out of certain low-margin products, as well as the weaker new construction sales volume. Average revenue per unit increased by 15.3% during fiscal 2007 compared with prior year, driven primarily by the aforementioned sales transition and the resulting improvements in the Company’s sales mix.
Net sales for fiscal 2006 increased 7.8% to $837.7 million from $777.0 million in fiscal 2005. Higher sales were the result of shifts in product mix and improved pricing. Overall, unit volume increased 0.9% over the prior year as unit growth in core products was offset by unit volume declines as the Company began to execute its plans to exit certain high volume low-margin business. In fiscal 2006, the average selling price per unit increased 6.8% due to shifts in product mix and improved pricing.
GROSS PROFIT
Gross profit as a percentage of sales increased to 20.5% in fiscal 2007 as compared with 17.9% in fiscal 2006. Materials and freight costs were lower as a percentage of net sales in fiscal 2007 due primarily to the aforementioned change in the Company’s sales mix. Manufacturing overhead costs were higher as a percentage of net sales in fiscal 2007, as this component of cost has a higher proportion of fixed cost and was compared with a reduced sales level. Labor costs comprised a slightly lower percentage of sales in fiscal 2007, as efficiencies from the product mix were somewhat offset by inefficiencies associated with lower volume. Specific changes and additional reasons for these changes were as follows:
| • | | Materials costs declined as a percentage of net sales by 1.9% during fiscal 2007 as compared with fiscal 2006. In addition to the favorable impact of the aforementioned changes in sales mix, sales price increases helped offset inflationary cost increases, and efficiencies in materials handling and lumber yields also helped reduce costs in relation to net sales. |
| • | | Freight costs declined as a percentage of net sales by 0.9% during fiscal 2007 as compared with fiscal 2006. In addition to the favorable impact of the aforementioned changes in sales mix, diesel fuel surcharge costs were in line with those of the prior year. |
| • | | Labor costs decreased 1.1% as a percentage of net sales as compared with those of the prior year. The favorable impact was driven by the aforementioned changes in sales mix which more than offset the impact of reduced productivity stemming from the decline in production volume. |
| • | | Overhead costs increased as a percentage of net sales by 1.3% as compared with fiscal 2006, as efficiencies from improved operations were more than offset by the impact of spreading a relatively fixed cost over a reduced sales base, as well as an increase of 0.2% of net sales for stock compensation expense. |
Gross profit as a percent of sales decreased in fiscal 2006 to 17.9% from 19.6% in fiscal 2005. The decrease in gross profit was the result of inflationary pressures in transportation and material costs, increased cost associated with the transition of the majority of the Company’s transportation network to new or other existing carriers, and inefficiencies in materials planning and overhead spending relating to the opening of two plants during fiscal 2005.
Transportation costs increased by 0.8% of net sales from fiscal 2005 due to higher fuel costs and general market inflation of rate structures.
Manufacturing overhead costs increased 1.1% of net sales from fiscal 2005 due to higher depreciation, salary labor and other start-up costs associated with new capacity added in fiscal 2005.
Material costs decreased 0.4% of net sales in fiscal 2006 from the prior fiscal year as inflationary pressures in raw materials were more than offset by improvements in product mix, improved pricing to offset inflationary pressures and improved hardwood lumber yields.
SELLING AND MARKETING EXPENSES
Selling and marketing expenses for fiscal 2007 were 9.3% of net sales, compared with 8.4% of net sales in fiscal 2006. The increased cost as a percent of sales in fiscal 2007 was due primarily to a relatively fixed sales overhead cost compared with a reduced sales level, as well as the inception of recording stock compensation costs of 0.2% of net sales.
14 AMERICAN WOODMARK CORPORATION® 2007 ANNUAL REPORT
Selling and marketing expenses were $70.4 million or 8.4% of net sales in fiscal 2006 compared to $67.2 million or 8.7% in fiscal 2005. The decrease as a percent of net sales was attributable to cost containment efforts and leverage gained on higher sales.
GENERAL & ADMINISTRATIVE EXPENSES
General and administrative expenses for fiscal 2007 increased by $9.5 million and represented 4.7% of net sales, as compared with 3.1% of net sales for fiscal 2006. The increase in fiscal 2007 was due primarily to higher costs associated with the Company’s pay-for-performance employee incentive plans, share-based compensation costs aggregating 0.6% of net sales, and 0.1% of net sales for a provision for potentially uncollectible receivables from new construction customers.
General and administrative expenses in fiscal year 2006 were $25.9 million or 3.1% of net sales compared to $26.8 million or 3.4% in fiscal 2005. The decrease was primarily due to lower costs associated with the Company’s pay-for-performance employee incentive plan.
INTEREST EXPENSE
Interest expense declined by $0.1 million in fiscal 2007, as the amount of outstanding indebtedness and effective interest rate incurred both declined.
Net interest expense increased $0.5 million in fiscal 2006 compared to fiscal 2005. The increase was attributable to fewer long-term capital projects in fiscal 2006, resulting in less capitalized interest.
EFFECTIVE INCOME TAX RATES
The Company’s combined federal and state effective income tax rate declined from 38.2% in fiscal 2006 to 36.4% in fiscal 2007, due primarily to the enhanced level of tax-exempt income earned by the Company.
The Company’s effective tax rate in fiscal 2006 was 38.2%, compared to 39.0% for fiscal 2005. The decrease in the effective tax rate was a result of the initial year of the impact from the American Jobs Creation Act of 2004.
OUTLOOK FOR FISCAL 2008
The Company follows several indices, including housing starts, existing home sales, mortgage interest rates, new jobs growth and consumer confidence, that it believes are leading indicators of overall demand for kitchen and bath cabinetry. These indicators collectively suggest to the Company that the long-term economic outlook for housing is positive; however, the near-term outlook is uncertain.
Looking ahead to fiscal year 2008, the Company expects the market for remodeling and new construction will modestly improve as the year progresses. The Company expects that new construction starts in the United States will approximate 1.5 million in calendar year 2007, down 15% to 20% below the levels attained in calendar year 2006, and increase to approximately 1.6 million in calendar year 2008. Each of the Company’s remodeling customers have likewise projected sluggish sales activity for calendar year 2007. The Company expects that its total sales will be down 7% to 11% as compared with fiscal year 2007 results, including the impact of $35 million of foregone sales of the transitioned low-margin products. The Company expects that core sales will decline by 3% to 7%, with remodeling sales roughly flat and new construction sales declining approximately 10%.
The Company expects its gross margin rate will approximate the 20.5% generated during fiscal 2007. The Company expects that the continued realization of operational improvements and the beneficial impact from the Company’s transition out of low-margin products will approximately offset the dilutive impact of reduced core sales volume, resulting in gross margin that approximates the fiscal 2007 gross margin rate. It is expected that material and fuel costs will be relatively stable in fiscal 2008; however, should these costs rise significantly, it would adversely affect the Company’s near-term operating performance. The Company has experienced an inflationary environment with respect to certain commodity prices and petroleum based products during the past three fiscal years. While the Company believes that it is more efficient as compared to the industry in the use of materials, a continued rise in raw material costs could negatively impact profitability during fiscal 2008. The Company does not believe that additional increases in raw material costs would negatively impact performance over the long term due to the availability of substitute materials and the historical ability for the industry to recover market-driven increases in raw materials through pricing.
The Company could be negatively impacted by reduced market demand as the result of lower overall remodeling or new construction activity. While the Company expects to perform better than the industry on average during a downturn in demand, the combined
AMERICAN WOODMARK CORPORATION® 2007 ANNUAL REPORT 15
effects of lower sales and increased costs due to underutilized capacity could result in decreased profitability in fiscal 2008 versus fiscal 2007.
Additional risks and uncertainties that could affect the Company’s results of operations and financial condition are discussed elsewhere in this report, including under “Forward-Looking Statements,” and in the Company’s annual report on Form 10-K filed with the SEC, under “Market Risks.”
LIQUIDITY AND CAPITAL RESOURCES
The statements of cash flows reflect the changes in cash and cash equivalents for the years ended April 30, 2007 and 2006, by classifying transactions into three major categories: operating, investing, and financing activities.
OPERATING ACTIVITIES
The Company’s main source of liquidity is cash generated from operating activities consisting of net earnings adjusted for non-cash operating items, primarily depreciation and amortization, and changes in operating assets and liabilities such as receivables, inventories, and payables.
Cash provided by operating activities in fiscal 2007 was $91.0 million, compared with $66.6 million in fiscal 2006. The improvement in cash provided from operations compared with last year was primarily attributable to the initial recording of $6.3 million of stock compensation expense, and reductions in the amount of receivables and inventory levels compared with prior year of $22.0 million and $15.5 million, respectively, that were driven by the Company’s exit from low-margin products and the resulting sales decline. Offsetting these improvements were reductions relating to reduced payables and accrual balances of $17.2 million and an increase in prepaid expenses of $2.5 million compared with the prior year. The reduction in the Company’s payables balances related to carrying lower levels of inventory, while the increase in prepaid expenses reflected prepaid taxes.
The Company’s operating cash flows in fiscal 2006 were higher than in prior year by $1.0 million, as a $2.4 million reduction in net income was more than offset by a $3.6 million increase in depreciation and amortization expense, while the movements in various components of the Company’s working capital balances offset each other.
INVESTING ACTIVITIES
The Company’s primary investing activities are capital expenditures and investments in promotional displays. Net cash used by investing activities in fiscal 2007 was $28.1 million compared with $26.6 million in fiscal 2006 and $73.8 million in fiscal 2005. Additions to property, plant, and equipment for fiscal 2007 were $14.7 million, compared with $13.2 million in fiscal 2006 and $61.0 million in fiscal 2005. Additions to property, plant, and equipment made in fiscal 2007 and fiscal 2006 were primarily for the re-layout and expansion of one of the Company’s manufacturing facilities in each year, while the much larger 2005 investment related primarily to the completion of two manufacturing plants. The Company’s investment in promotional displays in fiscal 2007 was $13.5 million, in line with the $13.4 million in fiscal 2006 and $13.1 million in fiscal 2005. The Company expects its investments in capital expenditures and promotional displays for fiscal 2008 will increase by $5 million to $10 million, driven primarily by additional store re-merchandising at one of the Company’s remodeling customers.
The Company completed a significant capital expansion during fiscal 2005. During fiscal 2005, the Company utilized funding from economic development agencies to increase its debt and supplement its operating cash flow by a net of $9.8 million, and received grant proceeds of $4.3 million to offset a portion of its capital investments made during that year.
The Company elected to transition out of certain low-margin products during fiscal 2006. This action, combined with lower production volumes due to the impact of difficult market conditions, has caused the Company to determine that its manufacturing capacity needs may be adequately served by its existing plants for several years. Accordingly, the Company’s investment in capital expenditures has been reduced significantly and is expected to remain at comparable levels until market conditions warrant a change. The Company has deployed the additional cash proceeds from increased levels of operating cash flow generated by the Company during fiscal 2006 and fiscal 2007 by returning this cash to its shareholders, in the form of increased stock repurchases and cash dividends. Accordingly, financing activities has become a significant use of cash in fiscal 2006 and 2007.
FINANCING ACTIVITIES
Net cash used by financing activities in fiscal 2007 was $52.7 million, up substantially as compared with the $16.5 million of cash used in fiscal 2006. The net use of cash in fiscal 2007 related to the Company’s repurchase of $62.9 million of its common stock, the payment of $3.3 million of dividends to shareholders, and the $1.5 million repayment of long-term debt, offset by proceeds and tax benefits received from the exercise of stock options in the amount of $15.0 million. During fiscal 2006 and fiscal 2005, the Company
16 AMERICAN WOODMARK CORPORATION® 2007 ANNUAL REPORT
repurchased $15.3 million and $11.5 million of stock, respectively, paid $2.0 million and $1.9 million of dividends, and made net repayments of debt of $1.0 million in 2006 offset by proceeds from exercises of stock options of $1.8 million and $2.5 million, respectively.
Under the Company’s stock repurchase plans approved by its Board of Directors in March 2006, July 2006, and November 2006, the Company repurchased $62.9 million of its common stock during fiscal 2007. The Company exhausted the March 2006 and July 2006 repurchase authorizations, which aggregated $10 million and $20 million, respectively. The November 2006 authorization allows the Company to repurchase its common stock from time to time, when management believes the market price presents an attractive return on investment for its shareholders. At April 30, 2007, approximately $20.3 million remained authorized by the Company’s Board of Directors to repurchase shares of the Company’s common stock under the November 2006 authorization. The Company has authorized a total of $120 million of stock repurchases since the inception of the program in 2001.
Cash flow from operations combined with accumulated cash on hand and available borrowing capacity on the Company’s $35 million line of credit is expected to be more than sufficient to meet forecasted working capital requirements, service existing debt obligations, and fund capital expenditures for fiscal 2008.
The Company’s interest rate swap agreement expired on May 31, 2006.
The timing of the Company’s contractual obligations as of April 30, 2007 is summarized in the table below.
| | | | | | | | | | | | | | | |
| | | FISCAL YEARS ENDED APRIL 30 |
(in thousands) | | TOTAL
AMOUNTS | | 2008 | | 2009–2010 | | 2011–2012 | | 2013 AND
THEREAFTER |
Term credit facility | | $ | 10,000 | | $ | — | | $ | — | | $ | 10,000 | | $ | — |
Economic development loans | | | 2,234 | | | — | | | — | | | — | | | 2,234 |
Term loans | | | 5,876 | | | 381 | | | 747 | | | 805 | | | 3,943 |
Capital lease obligations | | | 9,652 | | | 473 | | | 976 | | | 1,015 | | | 7,188 |
Interest on long-term debt(a) | | | 5,337 | | | 997 | | | 1,913 | | | 691 | | | 1,736 |
Operating lease obligations | | | 22,326 | | | 4,519 | | | 6,866 | | | 4,119 | | | 6,822 |
Pension contributions(b) | | | 30,618 | | | 7,590 | | | 11,598 | | | 11,430 | | | — |
| | | | | | | | | | | | | | | |
Total | | $ | 86,043 | | $ | 13,960 | | $ | 22,100 | | $ | 28,060 | | $ | 21,923 |
| | | | | | | | | | | | | | | |
(a) | Interest commitments under interest bearing debt consists of interest under the Company’s primary loan agreement and other term loans and capitalized lease agreements. The Company’s term credit facility includes a $10 million term note that bears a variable interest rate determined by the London Interbank Offered Rate (LIBOR) plus a spread of .50%. Interest under other term loans and capitalized lease agreements is fixed at rates between 2% and 6%. Interest commitments under interest bearing debt for the Company’s term credit facility is at LIBOR plus the spread as of April 30, 2007, throughout the remaining term of the agreement. |
(b) | The estimated cost and benefits of the Company’s two defined benefit pension plans are determined annually by independent actuaries based upon the discount rate and other assumptions at fiscal year end. Future pension funding contributions beyond 2012 have not been determined at this time. |
MARKET RISKS
The Company’s business has historically been subjected to seasonal influences, with higher sales typically realized in the second and fourth fiscal quarters.
The costs of the Company’s products are subject to inflationary pressures and commodity price fluctuations. Inflationary pressures have been relatively mild over the past five years except in certain raw material markets. Commodity price pressures have been experienced in the raw material market during the recent period. The Company has generally been able, over time, to recover the effects of inflation and commodity price fluctuations through sales price increases.
On April 30, 2007, the Company had no material exposure to changes in interest rates for its debt agreements. All significant borrowings of the Company carry an interest rate between 2% and 6%.
The Company does not currently use commodity or interest rate derivatives or similar financial instruments to manage its commodity price or interest rate risks.
CRITICAL ACCOUNTING POLICIES
Management has chosen accounting policies that are necessary to give reasonable assurance that the Company’s operational and financial position are accurately and fairly reported. The significant accounting policies of the Company are disclosed in Note A to
AMERICAN WOODMARK CORPORATION® 2007 ANNUAL REPORT 17
the Consolidated Financial Statements. The following discussion addresses the accounting policies that management believes have the greatest potential impact on the presentation of the financial condition of the Company for the periods being reported and that require the most judgment.
Management has reviewed these critical accounting policies and estimates with the Audit Committee of the Board of Directors.
REVENUE RECOGNITION.The Company utilizes signed sales agreements that provide for transfer of title to the customer upon delivery. The Company’s network of third-party carriers does not currently have the technology to provide detailed information regarding the delivery date for all orders. As a result, the Company must estimate the amount of sales that have been transferred to third-party carriers but not delivered to customers. The estimate is calculated using a lag factor determined by analyzing the actual difference between shipment date and delivery date of orders over the past 12 months. Revenue is only recognized on those shipments which we believe have been delivered to the customer. Due to the nature of the Company’s business, the impact from this estimate is limited to fiscal quarters as any shipments deemed to be in transit at the end of a reporting period are delivered to the customer within the first two weeks of the next period. Management believes that likely changes in the estimate are immaterial to the overall results of the fiscal year.
The Company recognizes revenue based on the invoice price less allowances for sales returns, cash discounts, and other deductions as required under current U.S. generally accepted accounting principles. Collection is reasonably assured as determined through an analysis of accounts receivable data, including historical product returns, and the evaluation of each customer’s ability to pay. Allowances for sales returns are based on the historical relationship between shipments and returns. The Company believes that historical experience is an accurate reflection of future returns.
SELF INSURANCE.The Company is self-insured for certain costs related to employee medical coverage and workers’ compensation liability. The Company maintains stop loss coverage with third-party insurers to limit total exposure. The Company establishes a liability at the balance sheet date based on estimates for a variety of factors that influence the Company’s ultimate cost. In the event that actual experience is substantially different from the estimates, the financial results for the period could be impacted. The Company believes that the methodologies used to estimate all factors related to employee medical coverage and workers’ compensation are an accurate reflection of the liability as of the date of the balance sheet.
PENSIONS.The Company has two non-contributory defined pension benefit plans covering substantially all of the Company’s employees.
The Company accounts for its defined benefit plans in accordance with the provisions of Statement of Financial Accounting Standards SFAS 87, “Employer’s Accounting for Pensions,” and Statement of Financial Accounting Standards SFAS 132 (revised), “Employers’ Disclosures about Pensions and Other Postretirement Benefits,” and SFAS 158, “Employers’ Accounting for Defined Benefit Pension and Other Postretirement Plans—an amendment of FASB Statements No. 87, 88, 106, and 132(R),” which requires amounts recognized in the consolidated financial statements to be determined on an actuarial basis. The estimated cost, benefits, and pension obligation of the non-contributory defined benefit pension plans are determined by independent actuaries using various actuarial assumptions. The most significant assumptions are the long-term expected rate of return on plan assets, the discount rate used to determine the present value of the pension obligations, and the future rate of compensation level increases. The Company refers to Moody’s Aa bond rate in establishing the discount rate. The long-term expected rate of return on plan assets reflects the current mix of the plan assets invested in equities and bonds. The future rate of compensation levels reflects expected salary trends.
The following is a summary of the potential impact of a hypothetical 1% change in actuarial assumptions for the discount rate, rate of compensation, expected return on plan assets, and consumer price index.
| | | | | | | |
(in millions) | | IMPACT OF 1%
INCREASE | | | IMPACT OF 1%
DECREASE |
| (decrease) increase | | | | | |
| | |
Effect on annual pension expense | | $ | (1.8 | ) | | $ | 2.0 |
Effect on projected pension benefit obligation | | $ | (10.6 | ) | | $ | 13.2 |
Pension expense for fiscal year 2007 and the assumptions used in that calculation are presented in Note H of the Consolidated Financial Statements. At April 30, 2007, the discount rate was 5.76% compared to 6.10% at April 30, 2006. The expected return on plan assets is 8.0%, which is consistent with fiscal year 2006. The assumed rate of increase in compensation levels is 4.0% for the year ended April 30, 2007, unchanged from the prior fiscal year.
The performance of the Company’s pension plans is largely dependent on the assumptions used to measure the obligations of the plans and to estimate future performance of the plans’ invested assets. Over the past two measurement periods, the only material
18 AMERICAN WOODMARK CORPORATION® 2007 ANNUAL REPORT
deviation between results based on assumptions and the actual plan performance has been as a result of the changes to the discount rate used to measure the plans’ benefit obligations. Under accounting guidelines, the discount rate is to be set to market at each annual measurement date. From the fiscal 2005 to fiscal 2006 measurement dates, the discount rate increased from 5.46% to 6.10%, which resulted in an actuarial gain of $10.6 million. From the fiscal 2006 to fiscal 2007 measurement dates, the discount rate decreased from 6.10% to 5.76%, which resulted in an actuarial loss of $5.4 million.
The Company strives to balance expected long-term returns and short-term volatility of pension plan assets. Favorable and unfavorable differences between the assumed and actual returns on plan assets are generally amortized over a period no longer than the average future working lifetime of the active participants. The actual rates of return on plan assets realized, net of investment manager fees, were 10%, 10%, and 5% for fiscal years 2007, 2006, and 2005, respectively.
The fair value of plan assets at April 30, 2007 was $70.9 million compared to $54.5 million at April 30, 2006. The Company’s projected benefit obligation exceeded plan assets by $14.0 million in fiscal 2007 and $17.3 million in fiscal 2006. The Company’s $3.3 million reduction in its net underfunded position during 2007 was driven primarily by the Company’s $4.5 million increase in contributions made, to a total of $12.3 million during the fiscal year. The Company expects its pension expense for fiscal year 2008 to be roughly flat with that of fiscal year 2007, as increased actuarial losses from the lower discount rate are offset by the impact of having fewer employees. The Company expects to contribute $7.6 million to its pension plans in fiscal 2008, a reduction of nearly $4.7 million from the fiscal 2007 contribution level.
PROMOTIONAL DISPLAYS.The Company invests in promotional displays in retail stores to demonstrate product features, product specifications, quality specifications and serve as a training tool for designers. The investment is carried at cost less applicable amortization. Amortization is provided by the straight-line method on an individual display basis over the estimated period of economic benefit, approximately 30 months. The Company believes that the estimated period of economic benefit provides an accurate reflection of the value of displays as of the date of the balance sheet based on historical experience.
PRODUCT WARRANTY.The Company estimates outstanding warranty costs based on the historical relationship between warranty claims and revenues. The warranty accrual is reviewed monthly to verify that it properly reflects the Company’s remaining obligation based on anticipated expenditures over the balance of the obligation period. Adjustments are made when actual warranty claim experience differs from estimates. Warranty claims are generally made within three months of the original shipment date.
STOCK-BASED COMPENSATION EXPENSE.Effective May 1, 2006, the Company adopted the provisions of SFAS 123(R) using the modified prospective transition method. Under this transition method, stock-based compensation expense recognized for share-based awards during fiscal 2007 included: (a) compensation expense for all stock-based compensation awards granted prior to, but not yet vested as of, May 1, 2006, based on the grant date fair value estimated in accordance with the original provisions of SFAS 123, and (b) compensation expense for all share-based compensation awards granted subsequent to May 1, 2006, based on the grant date fair value estimated in accordance with the provisions of SFAS 123(R). In accordance with the modified prospective transition method, results for prior periods were not restated. Prior to the adoption of SFAS 123(R), the Company recognized stock-based compensation expense in accordance with APB 25 and related Interpretations, as permitted by SFAS 123.
The calculation of share-based employee compensation expense involves estimates that require management’s judgments. These estimates include the fair value of each of the stock option awards granted, which is estimated on the date of grant using a Black-Scholes option pricing model. There are two significant inputs into the Black-Scholes option pricing model: expected volatility and expected term. The Company estimates expected volatility based on the historical volatility of the Company’s stock over a term equal to the expected term of the option granted. The expected term of stock option awards granted is derived from historical exercise experience under the Company’s stock option plans and represents the period of time that stock option awards granted are expected to be outstanding. The assumptions used in calculating the fair value of share-based payment awards represent management’s best estimates, but these estimates involve inherent uncertainties and the application of significant management judgment. As a result, if factors change and the Company uses different assumptions, stock-based compensation expense could be materially different in the future. In addition, the Company is required to estimate the expected forfeiture rate, and only recognize expense for those shares expected to vest. If the Company’s actual forfeiture rate is materially different from its estimate, the stock-based compensation expense could be significantly different from what the Company has recorded in the current period. See Note G to the Consolidated Financial Statements for further discussion on stock-based compensation.
AMERICAN WOODMARK CORPORATION® 2007 ANNUAL REPORT 19
RECENT ACCOUNTING PRONOUNCEMENTS
In July 2006, the Financial Accounting Standards Board (“FASB”) issued Interpretation No. 48, “Accounting for Uncertain Tax Positions” (“FIN 48”). FIN 48 clarifies how uncertainty in income taxes should be accounted for in a company’s financial statements in accordance with Statement of Financial Accounting Standards (SFAS) No. 109, “Accounting for Income Taxes.” It prescribes a recognition threshold and measurement attribute for the recognition and measurement of a tax position taken or expected to be taken in a tax return. FIN 48 also provides guidance on derecognition and classification of tax positions, accounting for interest and penalties, accounting for tax positions in interim periods, and disclosure and transition requirements. FIN 48 will be effective for fiscal years beginning after December 15, 2006, which the Company has adopted effective May 1, 2007. The Company does not believe the adoption of the new interpretation will have a material effect on its financial position or results of operations.
In September 2006, the FASB issued SFAS No. 157, “Fair Value Measurements” (“SFAS 157”). SFAS 157 establishes a common definition for fair value to be applied to GAAP guidance requiring use of fair value, establishes a framework for measuring fair value, and expands disclosure about such fair value measurements. SFAS 157 is effective for fiscal years beginning after November 15, 2007. The Company is currently evaluating the expected impact of the provisions of SFAS 157 on its results of operations and financial position.
In February 2007, the FASB issued SFAS No. 159, “The Fair Value Options for Financial Assets and Financial Liabilities” (“SFAS 159”). SFAS 159 permits entities to choose to measure many financial instruments and certain other items at fair value. The objective is to expand the use of fair value measurements in accounting for financial instruments. SFAS 159 is effective for fiscal years beginning after November 15, 2007. The Company is currently reviewing the provisions of SFAS 159 to determine the impact on the Company’s financial statements.
In September 2006, the SEC staff issued Staff Accounting Bulletin No.108, “Considering the Effects of Prior Year Misstatements when Quantifying Misstatements in Current Year Financial Statements” (“SAB 108”). SAB 108 establishes an approach that requires quantification of financial statement misstatements based on the effects of the misstatements on each of the Company’s financial statements and the related financial statement disclosures. SAB 108 was effective for the Company’s year ending April 30, 2007, and its adoption had no material effect on the Company’s consolidated financial statements.
LEGAL MATTERS
The Company is involved in suits and claims in the normal course of business, including product liability and general liability claims, in addition to claims pending before the EEOC. On at least a quarterly basis, the Company consults with its legal counsel to ascertain the reasonable likelihood that such claims may result in a loss. As required by Statement of Financial Accounting Standards No.5 (SFAS 5), the Company categorizes the various suits and claims into three categories according to their likelihood for resulting in potential loss: those that are probable (i.e., more likely than not), those that are reasonably possible, and those that are deemed to be remote. The Company accounts for these loss contingencies in accordance with SFAS 5. Where losses are deemed to be probable and estimable, accruals are made. Where losses are deemed to be reasonably possible, a range of loss estimates is determined. Where no loss estimate range can be made, the Company and its counsel perform a worst case estimate. In determining these loss range estimates, the Company considers known values of similar claims and consultation with its independent counsel.
The Company believes that the aggregate range of loss stemming from the various suits and asserted and unasserted claims which were deemed to be either probable or reasonably possible were not material.
DIVIDENDS DECLARED
On May 24, 2007, the Board of Directors approved a $.06 per share cash dividend on its common stock. The cash dividend was paid on June 18, 2007, to shareholders of record on June 5, 2007.
20 AMERICAN WOODMARK CORPORATION® 2007 ANNUAL REPORT
CONSOLIDATED BALANCE SHEETS
| | | | | | | | |
| | | APRIL 30 | |
(in thousands, except share and per share data) | | 2007 | | | 2006 | |
ASSETS | | | | | | | | |
Current Assets | | | | | | | | |
Cash and cash equivalents | | $ | 58,125 | | | $ | 47,955 | |
Customer receivables, net | | | 38,074 | | | | 54,857 | |
Inventories | | | 56,349 | | | | 68,522 | |
Prepaid expenses and other | | | 3,174 | | | | 2,018 | |
Deferred income taxes | | | 8,086 | | | | 11,590 | |
| | | | | | | | |
Total Current Assets | | | 163,808 | | | | 184,942 | |
| | |
Property, plant and equipment, net | | | 166,821 | | | | 175,384 | |
Promotional displays, net | | | 17,515 | | | | 16,698 | |
Intangible pension asset | | | — | | | | 1,056 | |
Other assets | | | 551 | | | | 806 | |
| | | | | | | | |
| | $ | 348,695 | | | $ | 378,886 | |
| | | | | | | | |
LIABILITIES AND SHAREHOLDERS’ EQUITY | | | | | | | | |
Current Liabilities | | | | | | | | |
Accounts payable | | $ | 25,604 | | | $ | 34,329 | |
Current maturities of long-term debt | | | 854 | | | | 1,456 | |
Accrued compensation and related expenses | | | 24,796 | | | | 30,949 | |
Accrued marketing expenses | | | 7,611 | | | | 7,639 | |
Other accrued expenses | | | 9,195 | | | | 10,043 | |
| | | | | | | | |
Total Current Liabilities | | | 68,060 | | | | 84,416 | |
| | |
Long-term debt, less current maturities | | | 26,908 | | | | 27,761 | |
Deferred income taxes | | | 9,487 | | | | 16,886 | |
Defined benefit pension and postretirement benefits liabilities | | | 14,826 | | | | 4,233 | |
Other long-term liabilities | | | 3,317 | | | | 3,929 | |
| | |
Shareholders’ Equity | | | | | | | | |
Preferred stock, $1.00 par value; 2,000,000 shares authorized, none issued | | | — | | | | — | |
Common stock, no par value; 40,000,000 shares authorized; issued and outstanding shares: at April 30, 2007: 14,919,939; at April 30, 2006: 15,958,496 | | | 72,350 | | | | 53,195 | |
Retained earnings | | | 167,506 | | | | 194,071 | |
Accumulated Other Comprehensive Loss | | | | | | | | |
Defined benefit pension and postretirement plans | | | (13,759 | ) | | | — | |
Minimum pension liability | | | — | | | | (5,601 | ) |
Unrealized loss on derivative contract | | | — | | | | (4 | ) |
| | | | | | | | |
Total Accumulated Other Comprehensive Loss | | | (13,759 | ) | | | (5,605 | ) |
| | | | | | | | |
Total Shareholders’ Equity | | | 226,097 | | | | 241,661 | |
| | | | | | | | |
| | $ | 348,695 | | | $ | 378,886 | |
| | | | | | | | |
See notes to consolidated financial statements.
AMERICAN WOODMARK CORPORATION® 2007 ANNUAL REPORT 21
CONSOLIDATED STATEMENTS OF INCOME
| | | | | | | | | | | | |
| | | YEARS ENDED APRIL 30 | |
(in thousands, except share and per share data) | | 2007 | | | 2006 | | | 2005 | |
Net sales | | $ | 760,925 | | | $ | 837,671 | | | $ | 776,990 | |
Cost of sales and distribution | | | 605,106 | | | | 687,978 | | | | 624,610 | |
| | | | | | | | | | | | |
Gross Profit | | | 155,819 | | | | 149,693 | | | | 152,380 | |
| | | |
Selling and marketing expenses | | | 71,009 | | | | 70,361 | | | | 67,225 | |
General and administrative expenses | | | 35,402 | | | | 25,913 | | | | 26,788 | |
| | | | | | | | | | | | |
Operating Income | | | 49,408 | | | | 53,419 | | | | 58,367 | |
| | | |
Interest expense | | | 910 | | | | 1,018 | | | | 515 | |
Other income | | | (2,680 | ) | | | (1,300 | ) | | | (493 | ) |
| | | | | | | | | | | | |
Income Before Income Taxes | | | 51,178 | | | | 53,701 | | | | 58,345 | |
| | | |
Income tax expense | | | 18,617 | | | | 20,491 | | | | 22,754 | |
| | | | | | | | | | | | |
Net Income | | $ | 32,561 | | | $ | 33,210 | | | $ | 35,591 | |
| | | | | | | | | | | | |
SHARE INFORMATION | | | | | | | | | | | | |
| | | |
Earnings per share | | | | | | | | | | | | |
Basic | | $ | 2.08 | | | $ | 2.04 | | | $ | 2.16 | |
Diluted | | | 2.04 | | | | 2.00 | | | | 2.11 | |
Cash dividends per share | | | .21 | | | | .12 | | | | .115 | |
| | | | | | | | | | | | |
See notes to consolidated financial statements.
22 AMERICAN WOODMARK CORPORATION® 2007 ANNUAL REPORT
CONSOLIDATED STATEMENTS OF
SHAREHOLDERS’ EQUITY AND COMPREHENSIVE INCOME
| | | | | | | | | | | | | | | | | | | |
| | | COMMON STOCK | | | RETAINED | | | ACCUMULATED OTHER COMPREHENSIVE | | | TOTAL SHAREHOLDERS’ | |
(in thousands, except share and per share data) | | SHARES | | | AMOUNT | | | EARNINGS | | | INCOME (LOSS) | | | EQUITY | |
Balance, May 1, 2004 | | 16,459,886 | | | $ | 43,435 | | | $ | 156,993 | | | $ | (7,283 | ) | | $ | 193,145 | |
| | | | | |
Comprehensive Income: | | | | | | | | | | | | | | | | | | | |
Net income | | | | | | | | | | 35,591 | | | | | | | | 35,591 | |
Other comprehensive income, net of tax: | | | | | | | | | | | | | | | | | | | |
Change in derivative financial instrument | | | | | | | | | | | | | | 239 | | | | 239 | |
Minimum pension liability | | | | | | | | | | | | | | (5,257 | ) | | | (5,257 | ) |
| | | | | | | | | | | | | | | | | | | |
Total Comprehensive Income | | | | | | | | | | | | | | | | | | 30,573 | |
| | | | | |
Cash dividends | | | | | | | | | | (1,897 | ) | | | | | | | (1,897 | ) |
Exercise of stock options | | 335,823 | | | | 7,633 | | | | | | | | | | | | 7,633 | |
Stock repurchases | | (436,369 | ) | | | (1,191 | ) | | | (14,384 | ) | | | | | | | (15,575 | ) |
Employee benefit plan contributions | | 38,180 | | | | 1,312 | | | | | | | | | | | | 1,312 | |
| | | | | | | | | | | | | | | | | | | |
Balance, April 30, 2005 | | 16,397,520 | | | $ | 51,189 | | | $ | 176,303 | | | $ | (12,301 | ) | | $ | 215,191 | |
| | | | | |
Comprehensive Income: | | | | | | | | | | | | | | | | | | | |
Net income | | | | | | | | | | 33,210 | | | | | | | | 33,210 | |
Other comprehensive income, net of tax: | | | | | | | | | | | | | | | | | | | |
Change in derivative financial instrument | | | | | | | | | | | | | | 119 | | | | 119 | |
Minimum pension liability | | | | | | | | | | | | | | 6,577 | | | | 6,577 | |
| | | | | | | | | | | | | | | | | | | |
Total Comprehensive Income | | | | | | | | | | | | | | | | | | 39,906 | |
| | | | | |
Cash dividends | | | | | | | | | | (1,959 | ) | | | | | | | (1,959 | ) |
Exercise of stock options | | 94,100 | | | | 2,430 | | | | | | | | | | | | 2,430 | |
Stock repurchases | | (581,400 | ) | | | (1,908 | ) | | | (13,483 | ) | | | | | | | (15,391 | ) |
Employee benefit plan contributions | | 48,276 | | | | 1,484 | | | | | | | | | | | | 1,484 | |
| | | | | | | | | | | | | | | | | | | |
Balance, April 30, 2006 | | 15,958,496 | | | $ | 53,195 | | | $ | 194,071 | | | $ | (5,605 | ) | | $ | 241,661 | |
| | | | | |
Comprehensive Income: | | | | | | | | | | | | | | | | | | | |
Net income | | | | | | | | | | 32,561 | | | | | | | | 32,561 | |
Other comprehensive income, net of tax: | | | | | | | | | | | | | | | | | | | |
Change in derivative financial instrument | | | | | | | | | | | | | | 4 | | | | 4 | |
Minimum pension liability | | | | | | | | | | | | | | (773 | ) | | | (773 | ) |
| | | | | | | | | | | | | | | | | | | |
Total Comprehensive Income | | | | | | | | | | | | | | | | | | 31, 792 | |
| | | | | |
Effect of SFAS 158 adoption | | | | | | | | | | | | | | (7,385 | ) | | | (7,385 | ) |
Stock-based compensation | | | | | | 6,287 | | | | | | | | | | | | 6,287 | |
Cash dividends | | | | | | | | | | (3,297 | ) | | | | | | | (3,297 | ) |
Exercise of stock options | | 682,538 | | | | 17,780 | | | | | | | | | | | | 17,780 | |
Stock repurchases | | (1,782,222 | ) | | | (7,077 | ) | | | (55,829 | ) | | | | | | | (62,906 | ) |
Employee benefit plan contributions | | 61,127 | | | | 2,165 | | | | | | | | | | | | 2,165 | |
| | | | | | | | | | | | | | | | | | | |
Balance, April 30, 2007 | | 14,919,939 | | | $ | 72,350 | | | $ | 167,506 | | | $ | (13,759 | ) | | $ | 226,097 | |
| | | | | | | | | | | | | | | | | | | |
See notes to consolidated financial statements.
AMERICAN WOODMARK CORPORATION® 2007 ANNUAL REPORT 23
CONSOLIDATED STATEMENTS OF CASH FLOWS
| | | | | | | | | | | | |
| | | YEARS ENDED APRIL 30 | |
(in thousands) | | 2007 | | | 2006 | | | 2005 | |
OPERATING ACTIVITIES | | | | | | | | | | | | |
| | | |
Net income | | $ | 32,561 | | | $ | 33,210 | | | $ | 35,591 | |
Adjustments to reconcile net income to net cash provided by operating activities: | | | | | | | | | | | | |
Depreciation and amortization | | | 35,909 | | | | 37,012 | | | | 33,405 | |
Net loss on disposal of property, plant and equipment | | | 178 | | | | 66 | | | | 103 | |
Stock-based compensation expense | | | 6,287 | | | | — | | | | — | |
Deferred income taxes | | | 1,225 | | | | (1,352 | ) | | | 1,787 | |
Excess tax benefits on stock option exercises | | | (1,718 | ) | | | — | | | | — | |
Tax benefit from stock options exercised | | | 4,527 | | | | 491 | | | | 2,426 | |
Other non-cash items | | | 309 | | | | 2,887 | | | | 1,424 | |
Changes in operating assets and liabilities: | | | | | | | | | | | | |
Customer receivables | | | 18,636 | | | | (3,335 | ) | | | (4,833 | ) |
Inventories | | | 11,572 | | | | (3,963 | ) | | | (11,349 | ) |
Prepaid expenses and other assets | | | (1,096 | ) | | | 1,410 | | | | (2,138 | ) |
Accounts payable | | | (8,725 | ) | | | (1,423 | ) | | | 6,607 | |
Accrued compensation, marketing, and other accrued expenses | | | (7,029 | ) | | | 2,886 | | | | 557 | |
Other | | | (1,630 | ) | | | (1,260 | ) | | | 2,094 | |
| | | | | | | | | | | | |
Net Cash Provided by Operating Activities | | | 91,006 | | | | 66,629 | | | | 65,674 | |
| | | |
INVESTING ACTIVITIES | | | | | | | | | | | | |
| | | |
Payments to acquire property, plant and equipment | | | (14,681 | ) | | | (13,243 | ) | | | (61,054 | ) |
Proceeds from sales of property, plant and equipment | | | 7 | | | | 3 | | | | 401 | |
Investment in promotional displays | | | (13,472 | ) | | | (13,383 | ) | | | (13,106 | ) |
| | | | | | | | | | | | |
Net Cash Used in Investing Activities | | | (28,146 | ) | | | (26,623 | ) | | | (73,759 | ) |
| | | |
FINANCING ACTIVITIES | | | | | | | | | | | | |
| | | |
Payments of long-term debt | | | (1,456 | ) | | | (3,296 | ) | | | (5,988 | ) |
Excess tax benefits on stock option exercises | | | 1,718 | | | | — | | | | — | |
Proceeds from long-term debt | | | — | | | | 2,250 | | | | 15,750 | |
Proceeds from issuance of common stock | | | 13,242 | | | | 1,815 | | | | 2,465 | |
Repurchase of common stock | | | (62,897 | ) | | | (15,267 | ) | | | (11,521 | ) |
Payment of dividends | | | (3,297 | ) | | | (1,959 | ) | | | (1,897 | ) |
Grant proceeds relating to property, plant and equipment | | | — | | | | — | | | | 4,250 | |
| | | | | | | | | | | | |
Net Cash (Used In) Provided By Financing Activities | | | (52,690 | ) | | | (16,457 | ) | | | 3,059 | |
| | | | | | | | | | | | |
Net Increase/(Decrease) in Cash and Cash Equivalents | | | 10,170 | | | | 23,549 | | | | (5,026 | ) |
| | | |
Cash and Cash Equivalents, Beginning of Year | | | 47,955 | | | | 24,406 | | | | 29,432 | |
| | | | | | | | | | | | |
Cash and Cash Equivalents, End of Year | | $ | 58,125 | | | $ | 47,955 | | | $ | 24,406 | |
| | | | | | | | | | | | |
See notes to consolidated financial statements.
24 AMERICAN WOODMARK CORPORATION® 2007 ANNUAL REPORT
notes
to consolidated financial statements
NOTE A—SUMMARY OF SIGNIFICANT ACCOUNTING POLICIES
The Company manufactures and distributes kitchen cabinets and vanities for the remodeling and new home construction markets. The Company’s products are sold across the United States through a network of independent distributors and directly to home centers and major builders.
The following is a description of the Company’s significant accounting policies:
PRINCIPLES OF CONSOLIDATION:The consolidated financial statements include the accounts of the Company and its wholly owned subsidiary. Significant inter-company accounts and transactions have been eliminated in consolidation.
STOCK SPLIT:On August 26, 2004, the Board of Directors declared a two-for-one stock split of the Company’s common stock that was distributed to shareholders in the form of a stock dividend on September 24, 2004, to shareholders of record on September 10, 2004. All share and per share information reflects the two-for-one stock split.
REVENUE RECOGNITION:The Company recognizes revenue when product is delivered to the customer and title has passed. Revenue is based on invoice price less allowances for sales returns, cash discounts, and other deductions.
COST OF SALES AND DISTRIBUTION:The cost of sales and distribution includes all costs associated with the manufacture and distribution of the Company’s products including the costs of shipping and handling.
ADVERTISING COSTS:Advertising costs are expensed as incurred. Advertising expenses for fiscal years 2007, 2006, and 2005 were $15.5 million, $15.9 million, and $15.5 million, respectively.
CASH AND CASH EQUIVALENTS:Cash in excess of operating requirements is invested in short-term instruments which are carried at fair value (approximate cost). The Company considers all highly liquid short-term investments with an original maturity of three months or less when purchased to be cash equivalents. Cash equivalents were $56.6 million and $44.1 million at April 30, 2007 and 2006, respectively.
INVENTORIES:Inventories are stated at lower of cost or market. Inventory costs are determined by the last-in, first-out (LIFO) method.
The LIFO cost reserve is determined in the aggregate for inventory and is applied as a reduction to inventories determined on the first-in, first-out method (FIFO). FIFO inventory cost approximates replacement cost.
PROPERTY, PLANT AND EQUIPMENT:Property, plant and equipment is stated on the basis of cost less accumulated depreciation. Depreciation is provided by the straight-line method over the estimated useful lives of the related assets, which range from 15 to 30 years for buildings and improvements and 3 to 10 years for machinery and equipment. Assets under capital leases are amortized over the shorter of their estimated useful lives or the term of the related lease.
IMPAIRMENT OF LONG-LIVED ASSETS:The Company reviews its long-lived assets for impairment when events or changes in circumstances indicate that the carrying amount of an asset may not be recoverable.
PROMOTIONAL DISPLAYS:The Company invests in promotional displays in retail stores to demonstrate product features, product specifications, and quality specifications and serve as a training tool for retail kitchen designers. The Company invests in these long-lived productive assets to provide the aforementioned benefits. The Company’s investment in promotional displays is carried at cost less applicable amortization. Amortization is provided by the straight-line method on an individual display basis over 30 months (the estimated period of benefit). Promotional display amortization expense for fiscal years 2007, 2006, and 2005 was $12.7 million, $13.4 million, and $13.5 million, respectively.
AMERICAN WOODMARK CORPORATION® 2007 ANNUAL REPORT 25
FAIR VALUE OF FINANCIAL INSTRUMENTS:The carrying amounts of the Company’s cash and cash equivalents, customer receivables, accounts payable, and long-term debt approximate fair value.
DERIVATIVES:The Company records its derivatives at fair value and recognizes these assets or liabilities on the consolidated balance sheets. The Company’s primary objective for entering into derivative instruments is to manage its exposure to interest rates, as well as to maintain an appropriate mix of fixed and variable rate debt. At April 30, 2006, the Company had one outstanding interest rate swap with a notional amount of $10 million that exchanged variable rate interest at LIBOR plus 50 basis points. This swap expired May 31, 2006.
INCOME TAXES:The Company accounts for deferred income taxes utilizing the asset and liability method, whereby deferred tax assets and liabilities are recognized based on the tax effects of temporary differences between the financial statement amounts and the tax basis of assets and liabilities, using enacted tax rates in effect for the year in which these items are expected to reverse. When appropriate, the Company evaluates the need for a valuation allowance to reduce deferred tax assets.
PENSIONS AND POSTRETIREMENT BENEFITS:The Company has two non-contributory defined pension benefit plans covering substantially all of the Company’s employees. The Company also has a postretirement benefit plan covering a small number of retirees who retired prior to May 1, 1991. Effective April 30, 2007, the Company adopted the recognition and disclosure provisions of Statement of Financial Accounting Standards No.158, “Employers’ Accounting for Defined Benefit Pension and Other Postretirement Plans—an amendment of FASB Statements No. 87, 88, 106, and 132(R)” (SFAS 158). SFAS 158 requires the Company to recognize in its consolidated balance sheet the under-funded status of its defined benefit pension plans and postretirement plan measured as the difference between the fair value of plan assets and the benefit obligation. The Company must also recognize as a component of other comprehensive income, net of tax, the actuarial gains and losses and the prior service costs, credits and transition costs that arise during the period. The adoption of SFAS 158 has no impact on years prior to fiscal 2007 and has no effect on the calculation of pension expense.
STOCK-BASED COMPENSATION:Effective May 1, 2006, the Company adopted the provisions of Statement of Financial Accounting Standard (“SFAS”) No.123(R), “Share-Based Payment” (“SFAS 123(R)”) using the modified prospective transition method. Under this transition method, stock-based compensation expense recognized for share-based awards for the fiscal year ended April 30, 2007 includes: (a) compensation expense for all stock-based compensation awards granted prior to, but not yet vested as of, May 1, 2006, based on the grant date fair value estimated in accordance with the original provisions of SFAS 123, and (b) compensation expense for all stock-based compensation awards granted subsequent to April 30, 2006, based on the grant date fair value estimated in accordance with the provisions of SFAS 123(R). In accordance with the modified prospective transition method, results for the prior period have not been restated. Prior to the adoption of SFAS 123(R), the Company recognized stock-based compensation expense in accordance with Accounting Principles Board (“APB”) Opinion No. 25, “Accounting for Stock Issued to Employees” (“APB 25”) and related Interpretations, as permitted by SFAS 123.
The pro forma table below illustrates the effect on net income and earnings per share as if the Company had applied the fair value recognition provisions of SFAS 123, as amended by SFAS 148, “Accounting for Stock-Based Compensation —Transition and Disclosure,” to all stock-based employee compensation for the fiscal years ended April 30, 2006 and April 30, 2005:
| | | | | | | | |
| | | APRIL 30 | |
| | | 2006 | | | 2005 | |
Net income, as reported | | $ | 33,210 | | | $ | 35,591 | |
Deduct: | | | | | | | | |
Total share-based employee compensation expense determined under the fair value method, net of taxes | | | (3,399 | ) | | | (3,185 | ) |
| | | | | | | | |
Net income, pro forma | | $ | 29,811 | | | $ | 32,406 | |
| | | | | | | | |
Net income per common share: | | | | | | | | |
Basic — as reported | | $ | 2.04 | | | $ | 2.16 | |
Basic — pro forma | | $ | 1.83 | | | $ | 1.97 | |
Diluted — as reported | | $ | 2.00 | | | $ | 2.11 | |
Diluted — pro forma | | $ | 1.80 | | | $ | 1.92 | |
RECENT ACCOUNTING PRONOUNCEMENTS:In July 2006, the Financial Accounting Standards Board (“FASB”) issued Interpretation No. 48, “Accounting for Uncertain Tax Positions” (“FIN 48”). FIN 48 clarifies how uncertainty in income taxes should be accounted for in a company’s financial statements in accordance with Statement of Financial Accounting Standards (SFAS) No.109, “Accounting for Income Taxes.” It prescribes a recognition threshold and measurement attribute for the recognition and measurement of a tax position taken or expected to be taken in a tax return. FIN 48 also provides guidance on derecognition and classification of tax positions, accounting for interest and penalties, accounting for tax positions in interim periods, and disclosure and
26 AMERICAN WOODMARK CORPORATION® 2007 ANNUAL REPORT
transition requirements. FIN 48 will be effective for fiscal years beginning after December 15, 2006, which the Company has adopted effective May 1, 2007. The Company does not believe the adoption of the new interpretation will have a material effect on its financial position or results of operations.
In September 2006, the FASB issued SFAS No.157, “Fair Value Measurements” (“SFAS 157”). SFAS 157 establishes a common definition for fair value to be applied to GAAP guidance requiring use of fair value, establishes a framework for measuring fair value, and expands disclosure about such fair value measurements. SFAS 157 is effective for fiscal years beginning after November 15, 2007. The Company is currently evaluating the expected impact of the provisions of SFAS 157 on its results of operations and financial position.
In February 2007, the FASB issued SFAS No.159, “The Fair Value Options for Financial Assets and Financial Liabilities” (“SFAS 159”). SFAS 159 permits entities to choose to measure many financial instruments and certain other items at fair value. The objective is to expand the use of fair value measurements in accounting for financial instruments. SFAS 159 is effective for fiscal years beginning after November 15, 2007. The Company is currently reviewing the provisions of SFAS 159 to determine the impact on the Company’s financial statements.
In September 2006, the SEC staff issued Staff Accounting Bulletin No.108, “Considering the Effects of Prior Year Misstatements when Quantifying Misstatements in Current Year Financial Statements” (“SAB 108”). SAB 108 establishes an approach that requires quantification of financial statement misstatements based on the effects of the misstatements on each of the Company’s financial statements and the related financial statement disclosures. SAB 108 was effective for the Company’s year ending April 30, 2007, and its adoption had no material effect on the Company’s consolidated financial statements.
USE OF ESTIMATES:The preparation of consolidated financial statements in conformity with U.S. generally accepted accounting principles requires management to make estimates and assumptions that affect the reported amounts of assets and liabilities and disclosure of contingent assets and liabilities at the date of the consolidated financial statements and the reported amounts of revenues and expenses during the reporting period. Actual results could differ from those estimates.
NOTE B—CUSTOMER RECEIVABLES
The components of customer receivables were:
| | | | | | | | |
| | | APRIL 30 | |
(in thousands) | | 2007 | | | 2006 | |
Gross customer receivables | | $ | 43,262 | | | $ | 62,112 | |
Less: | | | | | | | | |
Allowance for doubtful accounts | | | (1,511 | ) | | | (1,096 | ) |
Allowance for returns and discounts | | | (3,677 | ) | | | (6,159 | ) |
| | | | | | | | |
Net customer receivables | | $ | 38,074 | | | $ | 54,857 | |
| | | | | | | | |
NOTE C—INVENTORIES
The components of inventories were:
| | | | | | | | |
| | | APRIL 30 | |
(in thousands) | | 2007 | | | 2006 | |
Raw materials | | $ | 16,615 | | | $ | 20,081 | |
Work-in-process | | | 41,274 | | | | 42,762 | |
Finished goods | | | 12,020 | | | | 18,138 | |
| | | | | | | | |
Total FIFO inventories | | | 69,909 | | | | 80,981 | |
Reserve to adjust inventories to LIFO value | | | (13,560 | ) | | | (12,459 | ) |
| | | | | | | | |
Total LIFO inventories | | $ | 56,349 | | | $ | 68,522 | |
| | | | | | | | |
In fiscal year 2007, after tax earnings were impacted by $111 as a result of liquidation of LIFO based inventories.
NOTE D—PROPERTY, PLANT AND EQUIPMENT
The components of property, plant and equipment were:
| | | | | | | | |
| | | APRIL 30 | |
(in thousands) | | 2007 | | | 2006 | |
Land | | $ | 3,440 | | | $ | 3,440 | |
Buildings and improvements | | | 82,832 | | | | 81,754 | |
Buildings and improvements – capital leases | | | 20,356 | | | | 20,356 | |
Machinery and equipment | | | 179,646 | | | | 174,243 | |
Machinery and equipment – capital leases | | | 29,749 | | | | 29,787 | |
Construction in progress | | | 10,171 | | | | 4,195 | |
| | | | | | | | |
| | | 326,194 | | | | 313,775 | |
Less accumulated amortization and depreciation | | | (159,373 | ) | | | (138,391 | ) |
| | | | | | | | |
Total | | $ | 166,821 | | | $ | 175,384 | |
| | | | | | | | |
Depreciation expense amounted to $23.1 million, $23.3 million, and $19.6 million in fiscal 2007, 2006, and 2005, respectively.
AMERICAN WOODMARK CORPORATION® 2007 ANNUAL REPORT 27
NOTE E—LOANS PAYABLE AND LONG-TERM DEBT
Maturities of long-term debt are as follows:
| | | | | | | | | | | | | | | | | | | | | |
| | | FISCAL YEARS ENDING APRIL 30 |
(in thousands) | | 2008 | | 2009 | | 2010 | | 2011 | | 2012 | | 2013 AND
THEREAFTER | | TOTAL
OUTSTANDING |
Term credit facility | | $ | — | | $ | — | | $ | — | | $ | 10,000 | | $ | — | | $ | — | | $ | 10,000 |
Economic development loans | | | — | | | — | | | — | | | — | | | — | | | 2,234 | | | 2,234 |
Term loans | | | 381 | | | 381 | | | 366 | | | 390 | | | 415 | | | 3,943 | | | 5,876 |
Capital lease obligations | | | 473 | | | 483 | | | 493 | | | 503 | | | 512 | | | 7,188 | | | 9,652 |
| | | | | | | | | | | | | | | | | | | | | |
Total | | $ | 854 | | $ | 864 | | $ | 859 | | $ | 10,893 | | $ | 927 | | $ | 13,365 | | $ | 27,762 |
| | | | | | | | | | | | | | | | | | | | | |
Less current maturities | | | | | | | | | | | | | | | | | | | | $ | 854 |
| | | | | | | | | | | | | | | | | | | | | |
Total long-term debt | | | | | | | | | | | | | | | | | | | | $ | 26,908 |
| | | | | | | | | | | | | | | | | | | | | |
The Company’s primary loan agreement is unsecured and provides for a five-year, $35 million revolving credit facility which expires on February 5, 2009 and a $10 million, five-year term credit facility which expires on May 31, 2010. Borrowings under the credit facilities bear interest at the London InterBank Offered Rate (LIBOR) (5.36% at April 30, 2007) plus a spread (0.50% at April 30, 2007) based on Total Funded Debt to earnings, before deduction of interest and taxes, plus depreciation and amortization (EBITDA). Funded Debt is the total of senior debt, letter of credit obligations, stockholder debt, subordinated debt, and the value of all capitalized and synthetic leases. The Company has no synthetic leases. The Company incurs a fee for amounts not used under the revolving credit facility. The non-usage fee is included in interest expense and was $50,498, $52,073, and $57,090 for 2007, 2006, and 2005, respectively, or 0.2% of the amount not borrowed. There were no amounts outstanding under the revolving credit facility at April 30, 2007 and 2006.
The interest rate on the five-year term loan was fixed at 6.0% through May 31, 2006, via an interest rate swap. The notional amount of the swap agreement was $10 million. Under the terms of the interest rate swap, the Company received variable interest rate payments based on LIBOR and made fixed interest rate payments of 6.0% thereby creating the equivalent of fixed rate debt. Interest paid on the swap agreement was $155,719, $415,631, and $394,347 for the years ended April 30, 2007, 2006, and 2005, respectively. Net amounts received or paid under interest rate swap agreements were accrued as an adjustment to interest expense. Any unrealized gain or loss associated with the swap agreement was accounted for as other comprehensive income (loss). As of April 30, 2006, the fair value of the swap was $6,000, and was classified as a liability. The Company does not invest, trade, or otherwise speculate in any derivatives or similar type financial instruments.
In 2005, the Company entered into separate loan agreements with the Maryland Economic Development Corporation and the County Commissioners of Allegany County as part of the Company’s capital investment and operations at the Allegany County, Maryland site. These loan agreements and their balances at April 30, 2007, were $1,484,000 and $750,000, respectively, and expire at December 31, 2014, bearing interest at a fixed rate of 3%. These loan agreements are secured by mortgages on the manufacturing facility constructed in Allegany County, Maryland. These loan agreements defer principal and interest during the term of the obligation and forgive any outstanding balance at December 31, 2014, if the Company complies with certain employment levels at the facility.
In 2002, the Company entered into a loan agreement with the Perry, Harlan, Leslie, Breathitt Regional Industrial Authority (a.k.a. Coalfields Regional Industrial Authority, Inc.) as part of the Company’s capital investment and operations at the Hazard, Kentucky site. This debt facility is a $6 million term loan, which expires November 13, 2017, bearing interest at a fixed rate of 2%. It is secured by a mortgage on the manufacturing facility constructed in Hazard, Kentucky. The loan requires annual debt service payments consisting of principal and interest with a fixed balloon payment of $1.6 million at loan expiration. The outstanding amount as of April 30, 2007 was $5,211,000.
In 2001, the Company entered into a loan agreement with the West Virginia Economic Development Authority as part of the Company’s capital investment at the Moorefield, West Virginia site. This debt facility is a $1 million term loan which expires
28 AMERICAN WOODMARK CORPORATION® 2007 ANNUAL REPORT
January 12, 2013, bearing interest at a fixed rate of 5.9%. It is secured by Deed of Trust on the Moorefield, West Virginia site. The loan requires quarterly debt service of principal and interest. The balance outstanding at April 30, 2007 was $665,000.
In 2004, the Company entered into a lease agreement with the West Virginia Economic Development Authority as part of the Company’s capital investment and operations at the South Branch plant located in Hardy County, West Virginia. This capital lease agreement is a $10 million term obligation, which expires at July 1, 2024, bearing interest at a fixed rate of 2%. The lease obligation required monthly payments consisting of interest only through July 1, 2006, and principal and interest thereafter. The outstanding amount as of April 30, 2007 was $9,652,000.
Certain of the Company’s loan agreements limit the amount and type of indebtedness the Company can incur and require the Company to maintain specified financial ratios measured on a quarterly basis. In addition to the assets listed above, certain of the Company’s other fixed assets are pledged as collateral under term loan agreements and capital lease arrangements. The Company was in compliance with all covenants contained in its loan agreements at April 30, 2007.
Interest paid was $1,026,000, $1,064,000, and $1,082,000 during fiscal 2007, 2006, and 2005, respectively.
Interest capitalized was $178,000, $149,000, and $662,000 during fiscal 2007, 2006, and 2005, respectively.
NOTE F—EARNINGS PER SHARE
The following table summarizes the computations of basic and diluted earnings per share:
| | | | | | | | | |
| | | FISCAL YEARS ENDED APRIL 30 |
(in thousands, except per share amounts) | | 2007 | | 2006 | | 2005 |
Numerator used in basic and diluted earnings per common share: | | | | | | | | | |
Net income | | $ | 32,561 | | $ | 33,210 | | $ | 35,591 |
| | | | | | | | | |
Denominator: | | | | | | | | | |
Denominator for basic earnings per common share—weighted average shares | | | 15,690 | | | 16,280 | | | 16,473 |
Effect of dilutive securities: | | | | | | | | | |
Stock options | | | 286 | | | 306 | | | 407 |
| | | | | | | | | |
Denominator for diluted earnings per common share— weighted average shares and assumed conversions | | | 15,976 | | | 16,586 | | | 16,880 |
Net income per share | | | | | | | | | |
Basic | | $ | 2.08 | | $ | 2.04 | | $ | 2.16 |
Diluted | | $ | 2.04 | | $ | 2.00 | | $ | 2.11 |
NOTE G—STOCK-BASED COMPENSATION
At April 30, 2007, the Company had stock-based compensation plans as more particularly described below. The total compensation expense related to stock-based awards granted under these plans for the fiscal year ended April 30, 2007, reflecting the impact of the implementation of the modified prospective transition method in accordance with SFAS 123(R), was $6.3 million. Effective May 1, 2006 and subsequent thereto, the Company recognizes stock-based compensation costs net of a forfeiture rate for only those shares expected to vest on a straight-line basis over the requisite service period of the award. The Company estimated the forfeiture rate for options granted during fiscal 2007 based on its historical experience.
Prior to the adoption of SFAS 123(R), the Company presented all tax benefits related to deductions resulting from the exercise of stock options as operating activities in the consolidated statement of cash flows. SFAS 123(R) requires that cash flows resulting from tax benefits attributable to tax deductions in excess of the compensation expense recognized for those options (excess tax benefits) be classified as financing cash flows. As a result, the Company classified $1.7 million of excess tax benefits as financing cash flows for the fiscal year ended April 30, 2007. The total income tax benefit recognized in the consolidated statement of operations for
AMERICAN WOODMARK CORPORATION® 2007 ANNUAL REPORT 29
share-based awards for the fiscal year ended April 30, 2007 in accordance with the provisions of SFAS 123(R) was $2,375,000. During the fiscal years ended April 30, 2006 and April 30, 2005 in accordance with the provisions of APB 25 the total income tax benefit was $2,183,000 and $2,063,000, respectively.
STOCK OPTION PLANS
At April 30, 2007 the Company had stock option awards outstanding under five different plans: (1) 1999 stock option plan for employees, (2) 2004 stock incentive plan for employees, (3) 2000 stock option plan for non-employee directors, (4) 2005 stock option plan for non-employee directors, and (5) 2006 non-employee directors equity ownership plan. Stock options granted and outstanding under each of the plans vest evenly over a three-year period and have contractual terms ranging from four years to ten years. The exercise price of all stock options granted is equal to the fair market value of the Company’s common stock on the option grant date. No new grants will be made under the 2000 and 2005 plan for non-employee directors. As of April 30, 2007, there were 2,038,668 shares of future stock options that remained available for issuance under the 1999 stock option plan for employees, the 2004 stock incentive plan for employees, and 2006 non-employee directors equity ownership plan.
METHODOLOGY ASSUMPTIONS
As part of its SFAS 123(R) adoption, the Company examined its historical pattern of option exercises in an effort to determine if there were any discernable activity patterns based on certain employee and non-employee director groups. From this analysis, the Company identified two employee groups and one non-employee director group. The Company uses the Black-Scholes option-pricing model to value the Company’s stock options for each of the three groups. Using this option-pricing model, the fair value of each stock option award is estimated on the date of grant. The fair value of the Company’s stock option awards, which are subject to pro-rata vesting over three years, is expensed on a straight-line basis over the vesting period of the stock options. The expected volatility assumption is based on the historical volatility of the Company’s stock over a term at least equal to the expected term of the option granted. The expected term of stock option awards granted is derived from the Company’s historical exercise experience and represents the period of time that stock option awards granted are expected to be outstanding for each of the three identified groups. The expected term assumption incorporates the contractual term of an option grant, which is generally ten years for employees and from four years to ten years for non-employee directors, as well as the vesting period of an award. The risk-free interest rate is based on the implied yield on a U.S. Treasury constant maturity with a remaining term equal to the expected term of the option granted.
30 AMERICAN WOODMARK CORPORATION® 2007 ANNUAL REPORT
The weighted average assumptions and valuation of the Company’s stock options were as follows:
| | | | | | | | | | | | |
| | | 2007 | | | 2006 | | | 2005 | |
Weighted average fair value of grants | | $ | 14.48 | | | $ | 14.62 | | | $ | 14.91 | |
Expected volatility | | | 43.0 | % | | | 50.3 | % | | | 50.7 | % |
Expected term in years | | | 5.2 | | | | 6.0 | | | | 6.0 | |
Risk-free interest rate | | | 4.96 | % | | | 3.89 | % | | | 3.96 | % |
Expected dividend yield | | | 0.4 | % | | | 0.4 | % | | | 0.4 | % |
The following table summarizes stock option activity and related information under the stock option plans for the prior two fiscal years ended April 30:
| | | | | | | | |
| | | 2006 | | | 2005 | |
Outstanding at beginning of year | | | 1,796,171 | | | | 1,621,404 | |
Granted | | | 370,740 | | | | 586,588 | |
Exercised | | | (94,100 | ) | | | (335,823 | ) |
Expired or cancelled | | | (38,600 | ) | | | (75,998 | ) |
| | | | | | | | |
Outstanding at April 30 | | | 2,034,211 | | | | 1,796,171 | |
| | | | | | | | |
Exercisable at April 30 | | | 1,178,305 | | | | 865,481 | |
Available for future issuance at April 30 | | | 2,204,436 | | | | 2,482,776 | |
| | | | | | | | |
Weighted average prices (in dollars): | | | | | | | | |
Outstanding at beginning of year | | $ | 23.81 | | | $ | 20.39 | |
Granted | | | 29.40 | | | | 29.19 | |
Exercised | | | 20.60 | | | | 15.50 | |
Expired or cancelled | | | 27.51 | | | | 29.00 | |
Outstanding at April 30 | | | 24.96 | | | | 23.81 | |
Exercisable at April 30 | | $ | 22.15 | | | $ | 18.82 | |
STOCK-BASED COMPENSATION ACTIVITY
The following table presents a summary of the Company’s stock options activity for the fiscal year ended April 30, 2007 [remaining contractual term (in years) and exercise prices are weighted averages]:
| | | | | | | | | | | |
| | | NUMBER OF
OPTIONS | | | REMAINING
CONTRACTUAL TERM | | EXERCISE
PRICE | | AGGREGATE INTRINSIC VALUE (in thousands) |
Outstanding, beginning of period | | 2,034,211 | | | 6.7 | | $ | 24.96 | | $ | 18,859 |
Granted | | 521,888 | | | 8.1 | | | 33.07 | | | 764 |
Exercised | | (682,538 | ) | | — | | | 19.42 | | | 11,290 |
Cancelled or expired | | (87,529 | ) | | — | | | 30.52 | | | 370 |
| | | | | | | | | | | |
Outstanding at end of period | | 1,786,032 | | | 6.5 | | $ | 29.17 | | $ | 10,019 |
| | | | |
Vested and expected to vest in the future at April 30, 2007 | | 1,741,679 | | | 6.9 | | $ | 29.11 | | $ | 9,878 |
Exercisable at April 30, 2007 | | 905,785 | | | 5.5 | | $ | 26.93 | | $ | 7,150 |
Available for grant at April 30, 2007 | | 2,038,668 | | | | | | | | | |
AMERICAN WOODMARK CORPORATION® 2007 ANNUAL REPORT 31
The aggregate intrinsic value in the previous table represents the total pretax intrinsic value (the difference between the Company’s closing stock price on the last trading day of fiscal 2007 and the exercise price, multiplied by the number of in-the-money options) that would have been received by the option holders had all option holders exercised their options on April 30, 2007. This amount changes based on the fair market value of the Company’s common stock. Total intrinsic value of options exercised for the fiscal year ended April 30, 2007 (based on the difference between the Company’s stock price on the respective exercise dates and the respective exercise prices, multiplied by the number of respective options exercised) was $11.3 million. The total fair value of options vested for the fiscal year ended April 30, 2007 was $5.9 million.
As of April 30, 2007, there was $6.9 million of total unrecognized compensation expense related to unvested stock options granted under the Company’s share-based compensation plans. That expense is expected to be recognized over a weighted average period of 1.1 years.
Cash received from option exercises for the fiscal year ended April 30, 2007 was an aggregate of $13.2 million. The actual tax benefit realized for the tax deduction from option exercises of stock option awards totaled $4.5 million for the fiscal year ended April 30, 2007.
The following table summarizes information about stock options outstanding at April 30, 2007 [remaining lives (in years) and exercise prices are weighted-averages]:
| | | | | | | | | | | | |
OPTION PRICE PER SHARE | | OPTIONS OUTSTANDING | | OPTIONS EXERCISABLE |
| | OPTIONS | | REMAINING LIFE | | EXERCISE PRICE | | OPTIONS | | EXERCISE PRICE |
$9.28–$ 14.93 | | 94,249 | | 4.0 | | $ | 13.90 | | 94,249 | | $ | 13.90 |
$18.91–$ 24.21 | | 237,300 | | 5.0 | | | 22.68 | | 237,300 | | | 22.68 |
$25.49–$ 26.85 | | 266,969 | | 6.9 | | | 26.80 | | 152,858 | | | 26.76 |
$28.97–$ 34.87 | | 1,113,661 | | 7.1 | | | 31.63 | | 382,635 | | | 31.34 |
$36.87–$ 44.59 | | 73,853 | | 4.8 | | | 40.82 | | 38,743 | | | 41.78 |
| | | | | | | | | | | | |
| | 1,786,032 | | | | | | | 905,785 | | | |
For fiscal year ended April 30, 2007, stock-based compensation expense was allocated as follows (in thousands):
| | | |
| | | APRIL 30, 2007 |
Cost of sales and distribution | | $ | 1,256 |
Selling and marketing expenses | | | 1,238 |
General and administrative expenses | | | 3,793 |
| | | |
Stock-based compensation expense, before income taxes | | | 6,287 |
Less: | | | |
Income tax benefit | | | 2,375 |
| | | |
Total stock-based compensation expense, net of taxes | | $ | 3,912 |
| | | |
NOTE H—EMPLOYEE BENEFIT AND RETIREMENT PLANS
EMPLOYEE STOCK OWNERSHIP PLAN
In fiscal 1990, the Company instituted the American Woodmark Stock Ownership Plan (AWSOP). Under this plan, all employees who reach age 18 and who have been employed by the Company at the end of six consecutive months are eligible to receive company stock through a profit sharing contribution and a 401(k) matching contribution based upon the employee’s contribution to the plan.
Profit sharing contributions in the form of company stock are 3% of after tax earnings, calculated on a quarterly basis and distributed equally to all employees eligible to participate in the plan. The Company recognized expenses for profit sharing contributions of $977,000, $996,000, and $1,068,000 in fiscal 2007, 2006, and 2005, respectively.
32 AMERICAN WOODMARK CORPORATION® 2007 ANNUAL REPORT
The Company matches 401(k) contributions in the form of company stock at 50% of an employee’s contribution to the plan up to 4% of base salary for an effective maximum Company contribution of 2% of base salary. The expense for 401(k) matching contributions for this plan was $1,592,000, $1,600,000, and $1,409,000 in fiscal 2007, 2006, and 2005, respectively.
PENSION BENEFITS AND POSTRETIREMENT BENEFITS
The Company has two defined benefit plans covering virtually all of the Company’s employees. These plans provide defined benefits based on years of service and final average salary.
Effective April 30, 2007, the Company adopted the recognition and disclosure provisions of Statement of Financial Accounting Standards No.158, “Employers’ Accounting for Defined Benefit Pension and other Postretirement Plan—an amendment of FASB Statements No. 87, 88, 106, and 132(R)” (SFAS 158). SFAS 158 requires the Company to recognize in its consolidated balance sheet the underfunded status of its defined benefit pension plans and postretirement plan measured as the difference between the fair value of plan assets and the benefit obligation. The Company must also recognize as a component of other comprehensive income, net of tax, the actuarial gains and losses and the prior service costs, credits and transition costs that arise during the period. As a result of adopting this standard, the Company reduced its pension assets by $984,000 and increased its pension and postretirement benefits liabilities by $11.0 million in its consolidated balance sheet as of April 30, 2007, with a corresponding reduction to stockholders equity of $7.4 million (net of tax) reflected as an increase to accumulated other comprehensive loss. The adoption of SFAS 158 has no impact on years prior to fiscal 2007 and has no effect on the calculation of pension expense.
The effects of adoption of the provisions of SFAS158 on the Company’s consolidated balance sheet at April 30, 2007 are presented in the following table. Had the Company not been required to adopt SFAS158 at April 30, 2007, it would have recognized an additional minimum liability pursuant to the provisions of SFAS 87. The effect of recognizing the additional minimum liability is included in the following table in the column labeled “Prior to Adopting SFAS158.”
| | | | | | | | | | | | |
| | | APRIL 30, 2007 | |
| | | PRIOR TO ADOPTING
SFAS 158 | | | EFFECT OF ADOPTING
SFAS 158 | | | AS REPORTED
AT APRIL 30, 2007 | |
Intangible pension asset | | $ | 984 | | | $ | (984 | ) | | $ | — | |
Accrued compensation and related expenses | | | — | | | | (64 | ) | | | (64 | ) |
Defined benefit pension and postretirement benefit liabilities | | | (3,851 | ) | | | (10,975 | ) | | | (14,826 | ) |
Deferred income taxes | | | 4,003 | | | | 4,638 | | | | 8,641 | |
| | | |
Accumulated other comprehensive loss | | $ | 6,374 | | | $ | 7,385 | | | $ | 13,759 | |
Included in accumulated other comprehensive loss at April 30, 2007 is $22.4 million ($13.8 million net of tax) related to net unrecognized actuarial losses, unrecognized prior service costs, and transition obligation asset that have not yet been recognized in net periodic pension or benefit costs. The Company expects to recognize $1.2 million ($782 thousand net of tax) in net actuarial losses, prior service costs, and transition obligation asset in net periodic pension and benefit costs during fiscal year 2008.
AMERICAN WOODMARK CORPORATION® 2007 ANNUAL REPORT 33
The Company uses an April 30 measurement date for its benefit plans. The following provides a reconciliation of benefit obligations, plan assets and funded status of the Company’s noncontributory defined benefit pension plans as of April 30.
| | | | | | | | |
| | | PENSION BENEFITS | |
(in thousands) | | 2007 | | | 2006 | |
CHANGE IN BENEFIT OBLIGATION | | | | | | | | |
| | |
Benefit obligation at beginning of year | | $ | 71,818 | | | $ | 74,311 | |
Service cost | | | 4,942 | | | | 5,359 | |
Interest cost | | | 4,333 | | | | 4,019 | |
Amendments | | | 72 | | | | 174 | |
Actuarial (gains) and losses | | | 5,385 | | | | (10,624 | ) |
Benefits paid | | | (1,603 | ) | | | (1,421 | ) |
| | | | | | | | |
Benefit obligation at end of year | | $ | 84,947 | | | $ | 71,818 | |
| | | | | | | | |
| | |
CHANGE IN PLAN ASSETS | | | | | | | | |
| | |
Fair value of plan assets at beginning of year | | $ | 54,520 | | | $ | 43,342 | |
Actual return on plan assets | | | 5,761 | | | | 4,854 | |
Company contributions | | | 12,255 | | | | 7,745 | |
Benefits paid | | | (1,603 | ) | | | (1,421 | ) |
| | | | | | | | |
Fair value of plan assets at end of year | | $ | 70,933 | | | $ | 54,520 | |
| | | | | | | | |
Funded status of the plans | | $ | (14,014 | ) | | $ | (17,298 | ) |
Unamortized prior service cost | | | 983 | | | | 1,056 | |
Unrecognized net actuarial loss | | | 21,225 | | | | 18,170 | |
| | | | | | | | |
Prepaid benefit cost | | $ | 8,194 | | | $ | 1,928 | |
| | | | | | | | |
| |
| | | PENSION BENEFITS | |
(in thousands) | | 2007 | | | 2006 | |
AMOUNTS RECOGNIZED IN THE CONSOLIDATED BALANCE SHEETS | | | | | | | | |
| | |
Accrued benefit liability | | $ | (14,014 | ) | | $ | (8,247 | ) |
Intangible asset | | | — | | | | 1,056 | |
Accumulated other comprehensive loss | | | 22,208 | | | | 9,119 | |
| | | | | | | | |
Net amount recognized | | $ | 8,194 | | | $ | 1,928 | |
| | | | | | | | |
| | | | | | | | | | | | |
| | | PENSION BENEFITS | |
(in thousands) | | 2007 | | | 2006 | | | 2005 | |
COMPONENTS OF NET PERIODIC BENEFIT COST | | | | | | | | | | | | |
| | | |
Service cost | | $ | 4,942 | | | $ | 5,359 | | | $ | 3,968 | |
Interest cost | | | 4,333 | | | | 4,019 | | | | 3,575 | |
Expected return on plan assets | | | (4,298 | ) | | | (3,411 | ) | | | (2,688 | ) |
Amortization of prior service cost | | | 144 | | | | 130 | | | | 116 | |
Recognized net actuarial loss | | | 868 | | | | 1,951 | | | | 1,224 | |
| | | | | | | | | | | | |
Benefit cost | | $ | 5,989 | | | $ | 8,048 | | | $ | 6,195 | |
| | | | | | | | | | | | |
34 AMERICAN WOODMARK CORPORATION® 2007 ANNUAL REPORT
ACTUARIAL ASSUMPTIONS:The discount rate at April 30 was used to measure the year-end benefit obligations and the earnings effects for the subsequent year. Actuarial assumptions used to determine benefit obligations and earnings effects for principal pension plans follow:
| | | | | | |
| | | FISCAL YEARS ENDED APRIL 30 | |
| | | 2007 | | | 2006 | |
WEIGHTED-AVERAGE ASSUMPTIONS TO DETERMINE BENEFIT OBLIGATIONS | | | | | | |
| | |
Discount rate | | 5.76 | % | | 6.10 | % |
Rate of compensation increase | | 4.0 | % | | 4.0 | % |
| | | | | | |
| | | | | | | | | |
| | | FISCAL YEARS ENDED APRIL 30 | |
| | | 2007 | | | 2006 | | | 2005 | |
WEIGHTED-AVERAGE ASSUMPTIONS TO DETERMINE NET PERIODIC BENEFIT COST | | | | | | | | | |
| | | |
Discount rate | | 6.10 | % | | 5.46 | % | | 6.40 | % |
Expected return on plan assets | | 8.0 | % | | 8.0 | % | | 8.0 | % |
Rate of compensation increase | | 4.0 | % | | 4.0 | % | | 4.0 | % |
| | | | | | | | | |
The discount rate was based on Moody’s Aa bond rate as of April 30 of each respective year indicated. The expected long-term rate of return on assets is based on asset allocation within the Plan’s investment portfolio. The assumptions and the basis for their selection are consistent for all periods presented.
The Company amortizes experience gains and losses, as well as the effects of changes in actuarial assumptions and plan provisions, over a period no longer than the average future working lifetime of the active participants.
The Company funds the pension plans in amounts sufficient to meet minimum funding requirements set forth in employee benefit and tax laws plus additional amounts that the Company deems appropriate.
The Company’s pension plans’ weighted-average asset allocations at April 30, 2007 and 2006, by asset category are as follows:
| | | | | | | | | |
| | | PLAN ASSET ALLOCATION | |
APRIL 30 | | 2007
TARGET | | | 2007
ACTUAL | | | 2006
ACTUAL | |
Equity Funds | | 50.0 | % | | 50.7 | % | | 50.4 | % |
Fixed Income Funds | | 50.0 | % | | 49.3 | % | | 49.6 | % |
| | | | | | | | | |
Total | | 100.0 | % | | 100.0 | % | | 100.0 | % |
| | | | | | | | | |
Within the broad categories outlined in the preceding table, the Company has indicated the following specific allocation: 23% Capital Preservation, 27% Bond, 20% Large Capital Growth, 20% Large Capital Value, 6% Small Capital, and 4% International.
CONTRIBUTIONS:The Company expects to contribute $7.6 million to its pension plans in fiscal 2008 which represents both required and discretionary funding.
ESTIMATED FUTURE BENEFIT PAYMENTS:The following benefit payments, which reflect expected future service, are expected to be paid:
| | | |
| | | BENEFIT PAYMENTS |
FISCAL YEAR | | (in thousands) |
2008 | | $ | 1,764 |
2009 | | | 1,915 |
2010 | | | 2,030 |
2011 | | | 2,320 |
2012 | | | 2,508 |
Years 2013–2017 | | $ | 18,284 |
| | | |
AMERICAN WOODMARK CORPORATION® 2007 ANNUAL REPORT 35
The Company currently provides retiree health care insurance benefits for a small number of retirees who retired prior to May 1, 1991. Postretirement benefits are not offered to any employees who have retired or will retire subsequent to May 1, 1991. The following provides a reconciliation of benefit obligations and funded status of the Company’s postretirement benefit plan as of April 30, 2007 and 2006:
| | | | | | | | |
(in thousands) | | 2007 | | | 2006 | |
CHANGE IN BENEFIT OBLIGATIONS: | | | | | | | | |
Benefit obligation at beginning of year | | $ | 850 | | | $ | 901 | |
Interest cost | | | 50 | | | | 47 | |
Contributions by plan participants | | | 7 | | | | 7 | |
Actuarial loss (gain) | | | 30 | | | | (48 | ) |
Benefits paid | | | (61 | ) | | | (57 | ) |
| | | | | | | | |
Benefit obligation at end of year | | $ | 876 | | | $ | 850 | |
| | | | | | | | |
| | |
FUNDED STATUS: | | | | | | | | |
Funded status April 30, 2007 | | $ | (876 | ) | | $ | (850 | ) |
Unamortized actuarial loss | | | 78 | | | | 48 | |
Unrecognized net transition obligation | | | 113 | | | | 157 | |
| | | | | | | | |
Net benefit liability | | $ | (685 | ) | | $ | (645 | ) |
| | | | | | | | |
| | |
AMOUNT RECOGNIZED IN THE CONSOLIDATED BALANCE SHEETS: | | | | | | | | |
Accrued current benefit costs | | $ | (64 | ) | | $ | (645 | ) |
Accrued noncurrent benefit cost | | | (812 | ) | | | — | |
Accumulated other comprehensive loss | | | 191 | | | | — | |
| | | | | | | | |
Total | | $ | (685 | ) | | $ | (645 | ) |
| | | | | | | | |
There are no plan assets associated with the Company’s postretirement benefit plan.
The discount rate used to measure the year-end benefit obligations and the earnings effects for the subsequent year was based on Moody’s Aa bond rate as of April 30. The discount rate actuarial assumptions used to determine the benefit obligations and earnings effects for the postretirement benefit plan follows:
| | | | | | |
| | | 2007 | | | 2006 | |
Discount rate | | 5.76 | % | | 6.10 | % |
HEALTHCARE COST TREND ASSUMPTIONS
The weighted-average annual assumed rate of increase in the per capita cost of covered benefits is 10% for fiscal 2007 and 9.5% for fiscal 2008. It is assumed the rate will decrease gradually to a rate of 5% in 2017 and remain level thereafter.
A one percentage point change in the assumed health care cost trend rate would have the following effects:
| | | | | | | |
(in thousands) | | IMPACT OF 1%
INCREASE | | IMPACT OF 1%
DECREASE | |
| Increase (decrease) | | | | | |
| | |
Aggregate of 2006–2007 service and interest cost | | $ | 4.5 | | $ | (3.9 | ) |
Accumulated postretirement benefit obligation | | $ | 72.8 | | $ | (64.2 | ) |
36 AMERICAN WOODMARK CORPORATION® 2007 ANNUAL REPORT
NOTE I—INCOME TAXES
Income tax expense was comprised of the following:
| | | | | | | | | | | | |
| | | FISCAL YEARS ENDED APRIL 30 | |
(in thousands) | | 2007 | | | 2006 | | | 2005 | |
Current expense | | | | | | | | | | | | |
Federal | | $ | 14,646 | | | $ | 18,239 | | | $ | 17,045 | |
State | | | 2,746 | | | | 3,604 | | | | 3,922 | |
| | | | | | | | | | | | |
Total current expense | | | 17,392 | | | | 21,843 | | | | 20,967 | |
| | | | | | | | | | | | |
| | | |
Deferred expense (benefit) | | | | | | | | | | | | |
Federal | | | 803 | | | | (1,444 | ) | | | 1,532 | |
State | | | 422 | | | | 92 | | | | 255 | |
| | | | | | | | | | | | |
Total deferred expense (benefit) | | | 1,225 | | | | (1,352 | ) | | | 1,787 | |
| | | | | | | | | | | | |
Total expense from continuing operations | | $ | 18,617 | | | $ | 20,491 | | | $ | 22,754 | |
Other comprehensive income (loss) | | | (5,120 | ) | | | 4,345 | | | | (3,208 | ) |
| | | | | | | | | | | | |
Total comprehensive income tax expense | | $ | 13,497 | | | $ | 24,836 | | | $ | 19,546 | |
| | | | | | | | | | | | |
| | | |
The Company’s effective income tax rate varied from the federal statutory rate as follows: | | | | | | | | | | | | |
| | | FISCAL YEARS ENDED APRIL 30 | |
| | | 2007 | | | 2006 | | | 2005 | |
Federal statutory rate | | | 35.0 | % | | | 35.0 | % | | | 35.0 | % |
Effect of: | | | | | | | | | | | | |
Tax-free interest | | | -1.6 | % | | | -0.5 | % | | | -0.2 | % |
General business credits | | | -1.2 | | | | -1.0 | | | | -0.8 | |
Meals and entertainment | | | 0.9 | | | | 0.7 | | | | 0.5 | |
Domestic production deduction | | | -0.8 | | | | -1.0 | | | | 0.0 | |
Other | | | 0.1 | | | | 0.5 | | | | 0.1 | |
| | | | | | | | | | | | |
Total | | | -2.6 | % | | | -1.3 | % | | | -0.4 | % |
| | | |
Effective federal income tax rate | | | 32.4 | % | | | 33.7 | % | | | 34.6 | % |
State income taxes, net of federal tax effect | | | 4.0 | | | | 4.5 | | | | 4.4 | |
| | | | | | | | | | | | |
Effective income tax rate | | | 36.4 | % | | | 38.2 | % | | | 39.0 | % |
| | | | | | | | | | | | |
Income taxes paid were $15,560,000, $18,880,000, and $16,185,000 for fiscal years 2007, 2006, and 2005, respectively.
AMERICAN WOODMARK CORPORATION® 2007 ANNUAL REPORT 37
The significant components of deferred tax assets and liabilities were as follows:
| | | | | | |
| | | APRIL 30 |
(in thousands) | | 2007 | | 2006 |
Deferred tax assets: | | | | | | |
Accounts receivable | | $ | 3,932 | | $ | 6,360 |
Product liability | | | 1,198 | | | 2,079 |
Pension and postretirement benefit liabilities | | | 8,641 | | | 3,518 |
Other | | | 4,000 | | | 1,818 |
| | | | | | |
Total | | | 17,771 | | | 13,775 |
| | |
Deferred tax liabilities: | | | | | | |
Employee benefits | | | 2,779 | | | 1,208 |
Depreciation | | | 15,353 | | | 16,662 |
Inventory | | | 348 | | | 523 |
Other | | | 692 | | | 678 |
| | | | | | |
Total | | | 19,172 | | | 19,071 |
Net deferred tax liability | | $ | 1,401 | | $ | 5,296 |
| | | | | | |
Management believes it is more likely than not that the Company will realize its gross deferred tax assets due to expected future income and reversal of taxable temporary differences.
NOTE J—COMMITMENTS AND CONTINGENCIES
LEGAL MATTERS
The Company is involved in suits and claims in the normal course of business, including product liability and general liability claims, in addition to claims pending before the EEOC. On at least a quarterly basis, the Company consults with its legal counsel to ascertain the reasonable likelihood that such claims may result in a loss. As required by Statement of Financial Accounting Standards No.5 (SFAS 5), the Company categorizes the various suits and claims into three categories according to their likelihood for resulting in potential loss: those that are probable (i.e., more likely than not), those that are reasonably possible, and those that are deemed to be remote. The Company accounts for these loss contingencies in accordance with SFAS 5. Where losses are deemed to be probable and estimable, accruals are made. Where losses are deemed to be reasonably possible, a range of loss estimates is determined. Where no loss estimate range can be made, the Company and its counsel perform a worst case estimate. In determining these loss range estimates, the Company considers known values of similar claims and consultation with its independent counsel.
The Company believes that the aggregate range of loss stemming from the various suits and asserted and unasserted claims which were deemed to be either probable or reasonably possible are not material.
PRODUCT WARRANTY
The Company estimates outstanding warranty costs based on the historical relationship between warranty claims and revenues. The warranty accrual is reviewed monthly to verify that it properly reflects the remaining obligation based on the anticipated expenditures over the balance of the obligation period. Adjustments are made when actual warranty claim experience differs from estimates. Warranty claims are generally made within three months of the original shipment date.
The following is a reconciliation of the Company’s warranty liability:
| | | | | | | | |
(in thousands) | | 2007 | | | 2006 | |
PRODUCT WARRANTY RESERVE | | | | | | | | |
Beginning balance | | $ | 5,387 | | | $ | 4,952 | |
Accrual for warranties | | | 15,912 | | | | 26,710 | |
Settlements | | | (18,194 | ) | | | (26,275 | ) |
| | | | | | | | |
Ending balance at fiscal year end | | $ | 3,105 | | | $ | 5,387 | |
| | | | | | | | |
LEASE AGREEMENTS
The Company leases certain office buildings, manufacturing buildings, service centers, and equipment. Total rental expenses under operating leases amounted to approximately $9,484,000, $9,229,000, and $7,860,000 in fiscal 2007, 2006, and 2005, respectively. Minimum rental commitments as of April 30, 2007, under noncancelable leases are as follows:
| | | | | | | |
FISCAL YEAR | | OPERATING (in thousands) | | CAPITAL (in thousands) | |
2008 | | $ | 4,519 | | $ | 662 | |
2009 | | | 3,831 | | | 662 | |
2010 | | | 3,035 | | | 662 | |
2011 | | | 2,506 | | | 662 | |
2012 | | | 1,613 | | | 662 | |
2013 (and thereafter) | | | 6,822 | | | 8,112 | |
| | | | | | | |
| | $ | 22,326 | | $ | 11,422 | |
| | | | | | | |
Less amounts representing interest (2% to 6.2%) | | | | | | (1,770 | ) |
| | | | | | | |
Total obligations under capital lease | | | | | $ | 9,652 | |
| | | | | | | |
38 AMERICAN WOODMARK CORPORATION® 2007 ANNUAL REPORT
RELATED PARTIES
During fiscal 1985, prior to becoming a publicly held corporation, the Company entered into an agreement with a partnership formed by certain former executive officers, including one current member of the Board of Directors, of the Company to lease an office building constructed and owned by the partnership. The Company has subsequently renewed this lease in accordance with company policy and procedures which includes approval by the Board of Directors. As of April 30, 2007, the Company is in the second year of the latest five year renewal period. Under this agreement, rental expense was $437,000, $428,000, and $420,000 in fiscal 2007, 2006, and 2005, respectively. Rent during the remaining term of approximately $442,000 annually (included in the preceding table) is subject to adjustment based upon changes in the Consumer Price Index.
NOTE K—CREDIT CONCENTRATION
Credit is extended to customers based on an evaluation of the customer’s financial condition and generally collateral is not required. The Company’s customers operate in the new home construction and home remodeling markets.
The Company maintains an allowance for bad debt based upon management’s evaluation and judgment of potential net loss. The allowance is estimated based upon historical experience, the effects of current developments and economic conditions, and of customers’ current and anticipated financial condition. Estimates and assumptions are periodically reviewed and updated. Any resulting adjustments to the allowance are reflected in current operating results.
At April 30, 2007, the Company’s two largest customers, Customers A and B represented 25.1% and 31.9% of the Company’s gross customer receivables, respectively. At April 30, 2006, Customers A and B represented 32.1% and 29.8% of the Company’s gross customer receivables, respectively.
The following table summarizes the percentage of sales to the Company’s two largest customers for the last three fiscal years:
| | | | | | |
| | | PERCENT OF ANNUAL GROSS SALES |
| | | 2007 | | 2006 | | 2005 |
Customer A | | 35.5 | | 31.1 | | 30.1 |
Customer B | | 30.0 | | 30.7 | | 32.4 |
NOTE L—QUARTERLY FINANCIAL DATA (UNAUDITED)
| | | | | | | | | | | | |
FY 2007 | | 07/31/06 | | 10/31/06 | | 01/31/07 | | 04/30/07 |
| (in thousands, except share amounts) | | | | | | | | |
| | | | |
Net sales | | $ | 222,752 | | $ | 210,818 | | $ | 161,224 | | $ | 166,131 |
Gross profit | | | 49,111 | | | 42,863 | | | 29,068 | | | 34,777 |
Income before income taxes | | | 21,635 | | | 14,819 | | | 5,318 | | | 9,406 |
Net income | | | 13,414 | | | 9,188 | | | 3,779 | | | 6,180 |
Earnings per share | | | | | | | | | | | | |
Basic | | $ | 0.84 | | $ | 0.58 | | $ | 0.24 | | $ | 0.40 |
Diluted | | $ | 0.82 | | $ | 0.57 | | $ | 0.24 | | $ | 0.40 |
| | | | |
FY 2006 | | 07/31/05 | | 10/31/05 | | 01/31/06 | | 04/30/06 |
| (in thousands, except share amounts) | | | | | | | | |
| | | | |
Net sales | | $ | 215,564 | | $ | 214,535 | | $ | 191,143 | | $ | 216,429 |
Gross profit | | | 36,890 | | | 33,727 | | | 33,355 | | | 45,721 |
Income before income taxes | | | 12,160 | | | 9,955 | | | 9,789 | | | 21,797 |
Net income | | | 7,455 | | | 6,172 | | | 6,069 | | | 13,514 |
Earnings per share | | | | | | | | | | | | |
Basic | | $ | 0.45 | | $ | 0.38 | | $ | 0.37 | | $ | 0.84 |
Diluted | | $ | 0.45 | | $ | 0.37 | | $ | 0.37 | | $ | 0.83 |
AMERICAN WOODMARK CORPORATION® 2007 ANNUAL REPORT 39
report of independent registered public
accounting firm
THE BOARD OF DIRECTORS AND SHAREHOLDERS AMERICAN WOODMARK CORPORATION:
We have audited the accompanying consolidated balance sheets of American Woodmark Corporation (the Company), as of April 30, 2007 and 2006, and the related consolidated statements of income, shareholders’ equity and comprehensive income, and cash flows for each of the years in the three-year period ended April 30, 2007. These consolidated financial statements are the responsibility of the Company’s management. Our responsibility is to express an opinion on these consolidated financial statements based on our audits.
We conducted our audits in accordance with the standards of the Public Company Accounting Oversight Board (United States). Those standards require that we plan and perform the audit to obtain reasonable assurance about whether the financial statements are free of material misstatement. An audit includes examining, on a test basis, evidence supporting the amounts and disclosures in the financial statements. An audit also includes assessing the accounting principles used and significant estimates made by management, as well as evaluating the overall financial statement presentation. We believe that our audits provide a reasonable basis for our opinion.
In our opinion, the consolidated financial statements referred to above present fairly, in all material respects the financial position of American Woodmark Corporation as of April 30, 2007 and 2006, and the results of their operations and their cash flows for each of the years in the three-year period ended April 30, 2007, in conformity with U.S. generally accepted accounting principles.
As discussed in Note A to the consolidated financial statements, effective May 1, 2006, the Company adopted Statement of Financial Accounting Standards No.123(R), Share-Based Payment. Also, as discussed in Note A to the consolidated financial statements, the Company adopted Statement of Financial Accounting Standards No. 158, Employers’ Accounting for Defined Benefit Pension and Other Postretirement Plans, as of April 30, 2007.
We also have audited, in accordance with the standards of the Public Company Accounting Oversight Board (United States), the effectiveness of the Company’s internal control over financial reporting as of April 30, 2007, based on criteria established in Internal Control—Integrated Framework issued by the Committee of Sponsoring Organizations of the Treadway Commission (COSO), and our report dated July 11, 2007 expressed an unqualified opinion on management’s assessment of, and the effective operation of, internal control over financial reporting.
|

|
Roanoke, Virginia |
July 11, 2007 |
40 AMERICAN WOODMARK CORPORATION® 2007 ANNUAL REPORT
management’s
report
MANAGEMENT’S REPORT ON INTERNAL CONTROL OVER FINANCIAL REPORTING
Management has responsibility for establishing and maintaining adequate internal control over financial reporting. Internal control over financial reporting is a process designed to provide reasonable assurance regarding the reliability of financial reporting and the preparation of financial statements for external reporting purposes in accordance with U.S. generally accepted accounting principles. Because of its inherent limitations, internal control over financial reporting may not prevent or detect misstatements. Management has assessed the effectiveness of the Company’s internal control over financial reporting as of April 30, 2007. In making its assessment, Management has utilized the criteria set forth by the Committee of Sponsoring Organizations (COSO) of the Treadway Commission in Internal Control — Integrated Framework. Management concluded that based on its assessment, American Woodmark Corporation’s internal control over financial reporting was effective as of April 30, 2007. Management’s assessment of the effectiveness of the Company’s internal control over financial reporting as of April 30, 2007, has been audited by KPMG LLP, an independent registered public accounting firm, as stated in their report, which appears in this Annual Report to Shareholders.
| | | | |
| | 
| | James J. Gosa |
| | | | Chairman and CEO |
| | |
| |  | | Jonathan H. Wolk |
| | Vice President and Chief Financial Officer |
AMERICAN WOODMARK CORPORATION® 2007 ANNUAL REPORT 41
report of independent registered public
accounting firm
THE BOARD OF DIRECTORS AND SHAREHOLDERS AMERICAN WOODMARK CORPORATION:
We have audited management’s assessment, included in the accompanying Management’s Report on Internal Control over Financial Reporting, that American Woodmark Corporation (the Company) maintained effective internal control over financial reporting as of April 30, 2007, based on criteria established in Internal Control—Integrated Framework issued by the Committee of Sponsoring Organizations of the Treadway Commission (COSO). The Company’s management is responsible for maintaining effective internal control over financial reporting and for its assessment of the effectiveness of internal control over financial reporting. Our responsibility is to express an opinion on management’s assessment and an opinion on the effectiveness of the Company’s internal control over financial reporting based on our audit.
We conducted our audit in accordance with the standards of the Public Company Accounting Oversight Board (United States). Those standards require that we plan and perform the audit to obtain reasonable assurance about whether effective internal control over financial reporting was maintained in all material respects. Our audit included obtaining an understanding of internal control over financial reporting, evaluating management’s assessment, testing and evaluating the design and operating effectiveness of internal control, and performing such other procedures as we considered necessary in the circumstances. We believe that our audit provides a reasonable basis for our opinion.
A company’s internal control over financial reporting is a process designed to provide reasonable assurance regarding the reliability of financial reporting and the preparation of financial statements for external purposes in accordance with generally accepted accounting principles. A company’s internal control over financial reporting includes those policies and procedures that (1) pertain to the maintenance of records that, in reasonable detail, accurately and fairly reflect the transactions and dispositions of the assets of the company; (2) provide reasonable assurance that transactions are recorded as necessary to permit preparation of financial statements in accordance with generally accepted accounting principles, and that receipts and expenditures of the company are being made only in accordance with authorizations of management and directors of the company; and (3) provide reasonable assurance regarding prevention or timely detection of unauthorized acquisition, use, or disposition of the company’s assets that could have a material effect on the financial statements.
Because of its inherent limitations, internal control over financial reporting may not prevent or detect misstatements. Also, projections of any evaluation of effectiveness to future periods are subject to the risk that controls may become inadequate because of changes in conditions, or that the degree of compliance with the policies or procedures may deteriorate.
In our opinion, management’s assessment that the Company maintained effective internal control over financial reporting as of April 30, 2007, is fairly stated, in all material respects, based on criteria established in Internal Control—Integrated Framework issued by the Committee of Sponsoring Organizations of the Treadway Commission (COSO). Also, in our opinion, the Company maintained, in all material respects, effective internal control over financial reporting as of April 30, 2007, based on criteria established in Internal Control—Integrated Framework issued by the Committee of Sponsoring Organizations of the Treadway Commission (COSO).
We also have audited, in accordance with the standards of the Public Company Accounting Oversight Board (United States), the consolidated balance sheets of American Woodmark Corporation as of April 30, 2007 and 2006, and the related consolidated statements of income, shareholders’ equity and comprehensive income, and cash flows for each of the years in the three-year period ended April 30, 2007, and our report dated July 11, 2007, expressed an unqualified opinion on those consolidated financial statements.
|

|
| Roanoke, Virginia |
| July 11, 2007 |
42 AMERICAN WOODMARK CORPORATION® 2007 ANNUAL REPORT
stock
performance graph
Set forth below is a graph comparing the five-year cumulative total shareholder return, including reinvestment of dividends, from investing $100 on May 1, 2002 through April 30, 2007 in American Woodmark Corporation common stock, the Russell 2000 Index, and the S&P Household Durables Index:
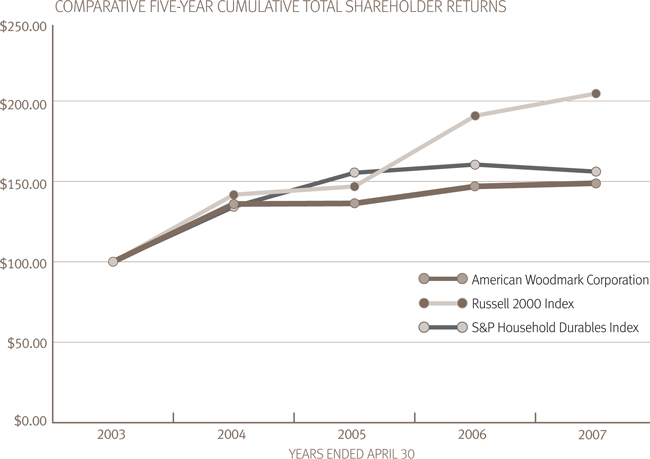
AMERICAN WOODMARK CORPORATION® 2007 ANNUAL REPORT 43
DIRECTORS AND EXECUTIVE OFFICERS
William F. Brandt, Jr.
Director;
Former Chairman and Chief Executive Officer
Daniel T. Carroll
Director;
Member of the Audit Committee, and the Nominating and Governance Committee
Chairman — The Carroll Group
Martha M. Dally
Director;
Chair of the Nominating and Governance Committee, and member of the Compensation Committee
Retired Vice President Customer Service —Sara Lee Corporation
James G. Davis, Jr.
Director;
Chairman of the Compensation Committee
President and Chief Executive Officer — James G. Davis Construction Corporation
Neil P. DeFeo
Director;
Member of the Compensation Committee, and the Nominating and Governance Committee
Chairman, President and Chief Executive Officer — Playtex Products, Inc.
S. Cary Dunston
Senior Vice President, Manufacturing
James J. Gosa
Director;
Chairman and Chief Executive Officer
Kent B. Guichard
Director;
President and Chief Operating Officer
Daniel T. Hendrix
Director;
Member of the Compensation Committee
President and Chief Executive Officer — Interface, Incorporated
Kent J. Hussey
Director;
Chairman of the Audit Committee
Chief Executive Officer — Spectrum Brands, Inc.
G. Thomas McKane
Director;
Member of the Audit Committee
Retired Chairman — A.M. Castle & Co.
Carol B. Moerdyk
Director;
Member of the Audit Committee
Senior Vice President, International — OfficeMax Incorporated
Jonathan H. Wolk
Vice President and Chief Financial Officer; Corporate Secretary
44 AMERICAN WOODMARK CORPORATION® 2007 ANNUAL REPORT
CORPORATE INFORMATION
ANNUAL MEETING
The Annual Meeting of Shareholders of American Woodmark Corporation will be held on August 23, 2007, at 9:00 a.m. at the Museum of the Shenandoah Valley, 901 Amherst Street in Winchester, Virginia.
ANNUAL REPORT ON FORM 10-K
A copy of the Company’s Annual Report on Form 10-K for the fiscal year ended April 30, 2007, may be obtained free of charge by writing:
Glenn Eanes
Vice President & Treasurer
American Woodmark Corporation
PO Box 1980
Winchester, VA 22604-8090
CORPORATE HEADQUARTERS
American Woodmark Corporation
3102 Shawnee Drive
Winchester, VA 22601-4208
(540) 665-9100
MAILING ADDRESS
PO Box 1980
Winchester, VA 22604-8090
TRANSFER AGENT
American Stock Transfer & Trust Company
(800) 937-5449
SHAREHOLDER INQUIRIES
Investor Relations
American Woodmark Corporation
3102 Shawnee Drive
Winchester, VA 22601-4208
(540) 665-9100
www.americanwoodmark.com
American Woodmark™is a trademark of American Woodmark Corporation.®
Printed in U.S.A. ©2007 American Woodmark Corporation®
