Exhibit 13


table of contents
| | |
| 1 | | Mission Statement |
| 2 | | Company Profile |
| 3 | | Financial Highlights |
| 3 | | Market Information |
| 4 | | Letter from the Chief Executive Officer |
| 11 | | Five-Year Selected Financial Information |
| 12 | | Management’s Discussion and Analysis |
| 23 | | Consolidated Financial Statements |
| 27 | | Notes to Consolidated Financial Statements |
| 43 | | Report of Independent Registered Public Accounting Firm |
| 44 | | Management’s Report on Internal Control over Financial Reporting |
| 45 | | Report of Independent Registered Public Accounting Firm |
| 46 | | Stock Performance Graph |
| 47 | | Directors and Executive Officers |
| 47 | | Corporate Information |
mission statement
creating value
through people
WHO WE ARE
American Woodmark is an organization of employees and shareholders who have combined their resources to pursue a common goal.
WHAT WE DO
Our common goal is to create value by providing kitchens and baths “of pride” for the American family.
WHY WE DO IT
We pursue this goal to earn a profit, which allows us to reward our shareholders and employees and to make a contribution to our society.
HOW WE DO IT
Four principles guide our actions:
CUSTOMER SATISFACTION Providing the best possible quality, service and value to the greatest number of people. Doing whatever is reasonable, and sometimes unreasonable, to make certain that each customer’s needs are met each and every day.
INTEGRITY Doing what is right. Caring about the dignity and rights of each individual. Acting fairly and responsibly with all parties. Being a good citizen in the communities in which we operate.
TEAMWORK Understanding that we must all work together if we are to be successful. Realizing that each individual must contribute to the team to remain a member of the team.
EXCELLENCE Striving to perform every job or action in a superior way. Being innovative, seeking new and better ways to get things done. Helping all individuals to become the best that they can be in their jobs and careers.
ONCE WE’VE DONE IT
When we achieve our goal good things happen: sales increase, profits are made, shareholders and employees are rewarded, jobs are created, our communities benefit, we have fun, and our customers are happy and proud–with a new kitchen or bath from American Woodmark.
| | |
| AMERICAN WOODMARK CORPORATION® 2009 ANNUAL REPORT 1 |
company profile
| | |
 | | |
| | American Woodmark Corporation manufactures and distributes kitchen cabinets and vanities for the remodeling and new home construction markets. The Company operates 11 manufacturing facilities located in Arizona, Georgia, Indiana, Kentucky, Maryland, Tennessee, Virginia, and West Virginia and 9 service centers across the country. American Woodmark Corporation was formed in 1980 and became a public company through a common stock offering in July, 1986. The Company offers approximately 400 cabinet lines in a wide variety of designs, materials, and finishes. Products are sold across the United States through a network of independent distributors and directly to home centers and major builders. Approximately 74% of sales during fiscal year 2009 were to the remodeling market and 26% to the new home market. The Company believes it is one of the three largest manufacturers of kitchen cabinets in the United States. |
| | |
| 2 AMERICAN WOODMARK CORPORATION® 2009 ANNUAL REPORT |

financial highlights
| | | | | | | | | | | | |
| | | FISCAL YEARS ENDED APRIL 30 | |
(in thousands, except per share data) | | 20091 | | | 2008 | | | 2007 | |
OPERATIONS | | | | | | | | | | | | |
Net sales | | $ | 545,934 | | | $ | 602,426 | | | $ | 760,925 | |
Operating income (loss) | | | (7,161 | ) | | | 4,382 | | | | 49,408 | |
Net income (loss) | | | (3,234 | ) | | | 4,271 | | | | 32,561 | |
Earnings (loss) per share | | | | | | | | | | | | |
Basic | | $ | (0.23 | ) | | $ | 0.30 | | | $ | 2.08 | |
Diluted | | | (0.23 | ) | | | 0.29 | | | | 2.04 | |
Average shares outstanding | | | | | | | | | | | | |
Basic | | | 14,055 | | | | 14,472 | | | | 15,690 | |
Diluted | | | 14,055 | | | | 14,540 | | | | 15,976 | |
| | | |
FINANCIAL POSITION | | | | | | | | | | | | |
Working capital | | $ | 95,371 | | | $ | 87,354 | | | $ | 95,748 | |
Total assets | | | 303,737 | | | | 314,799 | | | | 348,695 | |
Long-term debt, less current maturities | | | 26,475 | | | | 26,043 | | | | 26,908 | |
Shareholders’ equity | | | 203,682 | | | | 214,634 | | | | 226,097 | |
Long-term debt to capital ratio2 | | | 11.5 | % | | | 10.8 | % | | | 10.6 | % |
| 1 | The Company announced during fiscal year 2009 that it is realigning its manufacturing network. Operating income (loss), net income (loss), and earnings (loss) per share were reduced by restructuring costs relating to this initiative in the amounts of $9,743,000, $6,050,000, and $0.43, respectively. |
| 2 | Defined as long-term debt, less current maturities, divided by the sum of long-term debt and shareholder’s equity. |
market information
American Woodmark Corporation common stock is quoted on The NASDAQ Global Select Market under the “AMWD” symbol. Common stock per share market prices and cash dividends declared during the last two fiscal years were as follows:
| | | | | | | | | |
(in dollars) | | MARKET PRICE | | DIVIDENDS
DECLARED |
| | High | | Low | |
FISCAL 2009 | | | | | | | | | |
First quarter | | $ | 25.33 | | $ | 18.91 | | $ | 0.09 |
Second quarter | | | 32.42 | | | 14.25 | | | 0.09 |
Third quarter | | | 20.32 | | | 12.99 | | | 0.09 |
Fourth quarter | | | 21.97 | | | 13.27 | | | 0.09 |
| | | |
FISCAL 2008 | | | | | | | | | |
First quarter | | $ | 38.25 | | $ | 29.71 | | $ | 0.06 |
Second quarter | | | 30.88 | | | 23.53 | | | 0.09 |
Third quarter | | | 26.73 | | | 15.60 | | | 0.09 |
Fourth quarter | | | 22.99 | | | 17.37 | | | 0.09 |
As of May 15, 2009, there were approximately 6,700 shareholders of record of the Company’s common stock. Included are approximately 54% of the Company’s employees, who are shareholders through the American Woodmark Stock Ownership Plan. The Company pays dividends on its common stock each fiscal quarter. Although the Company presently intends to continue to declare cash dividends on a quarterly basis for the foreseeable future, the determination as to the payment and the amount of any future dividends will be made by the Board of Directors from time to time and will depend on the Company’s then-current financial condition, capital requirements, results of operations and any other factors then deemed relevant by the Board of Directors.
| | |
| AMERICAN WOODMARK CORPORATION® 2009 ANNUAL REPORT 3 |
to our shareholders
| | |

KENT B. GUICHARD President and CEO | | Preparing to put pen to paper, I began the process of collecting my thoughts for this space by rereading my comments to you in last year’s annual report. I was immediately struck by the challenge associated with drafting a letter that attempts to summarize recent events, articulates current reality, and provides insight into the coming period, all in less than two thousand words. Looking forward can be particularly troublesome as those that are too sure about the path ahead are generally humbled in short order. The economic environment over the last twelve months has certainly been worse than I anticipated at this time last year. Another reminder that while we can influence outcomes, we cannot predict or control events. We began fiscal 2009 in the midst of a significant housing slump brought on largely by cheap money and poor credit discipline by both lenders and borrowers that fueled a speculative bubble. Market activity, and our order rates, had dropped significantly from the peak in 2005. By the spring and early summer of 2008, we appeared to have reached a stable, although lower, level of new construction and remodeling investment in our category. Then in a matter of just days last fall, Lehman Brothers collapsed and pulled the financial markets into a series of cascading failures. |
| | |
| | |
| 4 AMERICAN WOODMARK CORPORATION® 2009 ANNUAL REPORT |
In hindsight, this event was clearly a tipping point after which all housing related activity took another step down. The rest of the economy, already suffering, was dealt a body blow. Most obvious was the impact on another core industry, automobiles. The situation at both Chrysler and General Motors declined rapidly, requiring a massive influx of government cash. Even the industry leader Toyota was impacted, reporting a multi-billion dollar quarterly loss. Industries that have not been negatively impacted are few and far between. Consumer confidence and spending has plunged. Unemployment has risen. The economy, as measured by gross domestic product, has shrunk.
At the beginning of fiscal 2009, we had taken the necessary steps to adjust expenses in light of lower market demand. Our goal was to operate near breakeven and generate cash during the height of the storm. With this approach, we felt we could continue to strengthen the financial condition of the Company, pursue our strategy, and be prepared to capitalize on the recovery. I am pleased to report that despite the continued deterioration in the economy, we successfully protected our core assets, gained market share, and ran the business effectively. We made progress throughout the year across a broad range of initiatives that both improved short term operational efficiencies and established a more competitive platform for the long term.
Revenue for the year dropped 9% to $546 million. Sales and production by quarter were remarkably consistent given the external environment. The additional market deterioration in the aftermath of Lehman did not impact our demand until late in the fiscal fourth quarter. About the time of the Lehman event, the big box retailers made a decision to concentrate their promotional efforts at the price points with the most activity. As the value player, we benefitted with increases in market share that sustained level production rates through March 2009.

Gross profit suffered throughout the year with lower volumes and the impact of unabsorbed overhead. Inflationary pressure in raw materials and other costs, most notably transportation costs driven by the extraordinary increases in diesel fuel, were offset by operational improvements. We reported near breakeven results for the first three fiscal quarters and a profit in the fourth quarter excluding restructuring charges. Most importantly, we continued to strengthen our financial position. For the full year, we generated $33.0 million in free cash flow. With $7.1 million applied to financing activities, predominantly stock repurchases and cash dividends, our cash and cash equivalents increased from $56.9 million at the end of fiscal 2008 to $82.8 million in 2009. On April 30th, our cash on hand was over 27% of total assets and $5.89 per outstanding common share. Debt to capital at the end of the year remained below 12%.
The Company has not only weathered the storm, but has performed extremely well within the context of the environment. Over the last two years, in the midst of the severe drop on the front of the housing cycle, we generated a net profit inclusive
| | |
| AMERICAN WOODMARK CORPORATION® 2009 ANNUAL REPORT 5 |

of restructuring charges despite a drop in revenue of $215 million or 28%. We generated almost $62 million in free cash flow, returning over $37 million to our shareholders through stock repurchases and dividends. We have enhanced our overall financial position, particularly as it relates to liquidity and our ability to continue to run the business and pursue our longer term strategy while facing a strong head wind.
We are not, however, immune from the events around us. While we have continued to gain share, these gains have been overwhelmed by the dramatic decline in the housing market. New construction activity in terms of starts, permits, and closings is running at a quarter of the level generally recognized as a normal market. The sale of existing homes, a broad predictor of kitchen remodeling, is also depressed. Gaining share simply cannot overcome these extreme market conditions.
Given all the data available, we consider it highly unlikely that there will be a significant housing recovery in calendar 2009. As a result, we made the decision during the fourth quarter to reduce the size of our organization. We announced several difficult decisions including a salary reduction-in-force, the closure of two manufacturing facilities, and the suspension of production operations at a third. In the process of making these choices, we balanced our on-going responsibility to maintain the financial health of the Company with the need to continue to support the customer, move the organization forward towards our long term goals, and remain ready to participate in the eventual and inevitable recovery. We have retained both the organizational and production capacity to service demand in a market with average to above average new construction and remodel activity.
I remain bullish on both housing as a sector and cabinets as a business. Demographic trends universally support a healthy industry over the long term. Birth rates, immigration, and the rate of new household formation are but a few of the metrics that we believe point to housing as a continuing driver of the economy. In the short term, we expect the economic reality to remain challenging. We are hoping for the bottom and a bounce during fiscal 2010, but believe the most prudent course is to prepare for much of the same.
In my experience, having weathered multiple business cycles, organizations face extreme difficulty on the downside in predictable ways. The time to prepare for an economic event
| | |
| AMERICAN WOODMARK CORPORATION® 2009 ANNUAL REPORT 7 |
is before it begins. Those that enter a recession with poor market position, high financial leverage, or a weak organization, are in trouble from the beginning. Their options are severely limited and they often end up in a situation dominated by accountants, bankers, and lawyers as they seek relief from creditors. Over the years, we prepared for the inevitable downturn in a cyclical industry and entered the current recession with our house in order.
Even companies that prepare, however, can still find themselves in dire straits during an economic cycle. Again, in my experience, this evolves from one of three sources. First, organizations lose sight of their Vision. In a challenging environment, they succumb to the temptation to forgo that “Vision thing” until after the crisis has passed. It can be deceptively easy to take that budget ax to programs with long term gains, but short term costs. Second, they cease to be fact based. The constant barrage of sound bites, mostly designed to play on emotions and fears, takes hold and they begin to react based on rumor, innuendo, and other distortions of reality. Third, organizations forget who they are. Based on the tension and pressure created by the environment, they suspend those guiding principles and core values in the name of expediency.
We are committed to avoiding all three of these pitfalls. We have a powerful Vision of the results we want to create. While we may not be able to move at the same pace during challenging times, we continue to hold our Vision like a lighthouse guiding home ships at sea. We have, and will continue, to demand fact based discussions. We will not be complacent or stuck in our historical view of the world, and when we do act it will be based on facts. We will undoubtedly make some mistakes, but we will act based on reason, judgment, and evaluation of reality as we can best determine. And finally, we will continue to act in a way consistent with our principles as articulated in our Mission Statement and supporting values of caring and candor, dignity and respect, accountability and responsibility.
By this time next year, I hope the housing recovery will be underway. Those that remain pessimistic certainly have many legitimate points. Credit availability remains restrictive. Home vacancies and unsold inventories remain high. Foreclosures continue. Sales contract cancellation rates reported by most major builders have not decreased. Consumer confidence and spending remain depressed.
| | |
| 8 AMERICAN WOODMARK CORPORATION® 2009 ANNUAL REPORT |

On the other hand, there are signs that the market may already have bottomed. The bubble prices are gone. Mortgage rates are at or near all time lows. The combination of reduced prices and lower interest rates has improved affordability. An increase in refinancing activity is helping homeowners both reduce and fix their carrying costs. Even though unemployment is still rising, albeit at a slower rate, from a macroeconomic viewpoint unemployment has consistently been a lagging indicator to overall economic activity. In each of the last four recessions, unemployment has continued to increase after the bottom, rising another 16% on average after the low point in the stock market.
What we need is simple. We need stable home prices to convince potential buyers that waiting will not be a benefit. We need affordable and available credit to support activity by qualified borrowers. We need unemployment to crest, reducing the insecurities of those with jobs and restarting consumer spending. Finally, we need some reason, any reason, to feel optimistic and break out of our collective funk.
What we are likely to get is uncertainty and more mixed signals. Much like the experience of teaching our teenager to drive a standard shift car, we are going to lurch forward only to buck back. In this environment, those that remain both financially and operationally flexible will have a distinct advantage. We are committed to maintaining the strength of our balance sheet and our cash liquidity. We are dedicated to managing our operations in a way that maximizes our options in dealing with an ever changing market. Our goal is not to predict future events, but to place the Company in a position to succeed in any set of circumstances.
Business cycles are a time for discipline and patience. I wish to express my sincere appreciation to our employees, our shareholders, our customers, our vendors, and our communities for your continued support. It is only through our combined efforts that we will achieve our collective goals and build long term value.

|
|
| Kent B. Guichard |
| President and Chief Executive Officer |
| | |
| 10 AMERICAN WOODMARK CORPORATION® 2009 ANNUAL REPORT |
FIVE-YEAR SELECTED FINANCIAL INFORMATION
| | | | | | | | | | | | | | | | | | | | |
| | | FISCAL YEARS ENDED APRIL 30 | |
(in millions, except per share data) | | 20091, 2 | | | 20082 | | | 20072 | | | 2006 | | | 2005 | |
FINANCIAL STATEMENT DATA | | | | | | | | | | | | | | | | | | | | |
| | | | | |
Net sales | | $ | 545.9 | | | $ | 602.4 | | | $ | 760.9 | | | $ | 837.7 | | | $ | 777.0 | |
Income (loss) before income taxes | | | (6.2 | ) | | | 5.7 | | | | 51.2 | | | | 53.7 | | | | 58.3 | |
Net income (loss) | | | (3.2 | ) | | | 4.3 | | | | 32.6 | | | | 33.2 | | | | 35.6 | |
Earnings (loss) per share: | | | | | | | | | | | | | | | | | | | | |
Basic | | | (0.23 | ) | | | 0.30 | | | | 2.08 | | | | 2.04 | | | | 2.16 | |
Diluted | | | (0.23 | ) | | | 0.29 | | | | 2.04 | | | | 2.00 | | | | 2.11 | |
Depreciation and amortization expense | | | 35.1 | | | | 35.2 | | | | 35.9 | | | | 37.0 | | | | 33.4 | |
Total assets | | | 303.7 | | | | 314.8 | | | | 348.7 | | | | 378.9 | | | | 361.2 | |
Long-term debt, less current maturities | | | 26.5 | | | | 26.0 | | | | 26.9 | | | | 27.8 | | | | 29.2 | |
Total shareholders’ equity | | | 203.7 | | | | 214.6 | | | | 226.1 | | | | 241.7 | | | | 215.2 | |
Cash dividends declared per share | | | 0.36 | | | | 0.33 | | | | 0.21 | | | | 0.12 | | | | 0.12 | |
Average shares outstanding | | | | | | | | | | | | | | | | | | | | |
Basic | | | 14.1 | | | | 14.5 | | | | 15.7 | | | | 16.3 | | | | 16.5 | |
Diluted | | | 14.1 | | | | 14.5 | | | | 16.0 | | | | 16.6 | | | | 16.9 | |
| | | | | |
PERCENT OF SALES | | | | | | | | | | | | | | | | | | | | |
| | | | | |
Gross profit | | | 16.4 | % | | | 17.1 | % | | | 20.5 | % | | | 17.9 | % | | | 19.6 | % |
Selling, general and administrative expenses | | | 15.9 | | | | 16.4 | | | | 14.0 | | | | 11.5 | | | | 12.1 | |
Income (loss) before income taxes | | | (1.1 | ) | | | 0.9 | | | | 6.7 | | | | 6.4 | | | | 7.5 | |
Net income (loss) | | | (0.6 | ) | | | 0.7 | | | | 4.3 | | | | 4.0 | | | | 4.6 | |
| | | | | |
RATIO ANALYSIS | | | | | | | | | | | | | | | | | | | | |
| | | | | |
Current ratio | | | 2.6 | | | | 2.6 | | | | 2.4 | | | | 2.2 | | | | 1.9 | |
Inventory turnover3 | | | 11.5 | | | | 9.7 | | | | 9.7 | | | | 10.3 | | | | 10.4 | |
Collection period – days4 | | | 33.5 | | | | 31.9 | | | | 34.9 | | | | 35.5 | | | | 32.2 | |
Percentage of capital (long-term debt plus equity): | | | | | | | | | | | | | | | | | | | | |
Long-term debt, less current maturities | | | 11.5 | % | | | 10.8 | % | | | 10.6 | % | | | 10.3 | % | | | 12.0 | % |
Equity | | | 88.5 | | | | 89.2 | | | | 89.4 | | | | 89.7 | | | | 88.0 | |
Return on equity (average %) | | | (1.5 | ) | | | 1.9 | | | | 13.9 | | | | 14.5 | | | | 17.4 | |
| 1 | The Company announced during fiscal year 2009 that it was realigning its manufacturing network. Operating income (loss), net income (loss), and earnings (loss) per share were reduced by restructuring costs relating to this initiative in the amounts of $9,743,000, $6,050,000, and $0.43, respectively. |
| 2 | The Company adopted the provisions of SFAS123R during fiscal year 2007, which resulted in stock-based compensation expense, net of income taxes of $3.0 million in fiscal 2009, $3.1 million in fiscal 2008, and $3.9 million in fiscal 2007. |
| 3 | Based on the average of beginning and ending inventory. |
| 4 | Based on the ratio of monthly average customer receivables to average sales per day. |
| | |
| AMERICAN WOODMARK CORPORATION® 2009 ANNUAL REPORT 11 |
financial review
2009
management’s discussion and analysis
RESULTS OF OPERATIONS
The following table sets forth certain income and expense items as a percentage of net sales.
| | | | | | | | | |
| | | PERCENTAGE OF NET SALES
Years Ended April 30 | |
| | | 2009 | | | 2008 | | | 2007 | |
Net sales | | 100.0 | % | | 100.0 | % | | 100.0 | % |
Cost of sales and distribution | | 83.6 | | | 82.9 | | | 79.5 | |
Gross profit | | 16.4 | | | 17.1 | | | 20.5 | |
Selling and marketing expenses | | 11.0 | | | 11.9 | | | 9.3 | |
General and administrative expenses | | 4.9 | | | 4.5 | | | 4.7 | |
Restructuring charges | | 1.8 | | | — | | | — | |
Operating income (loss) | | (1.3 | ) | | 0.7 | | | 6.5 | |
Interest expense/other (income) expense | | (0.2 | ) | | (0.2 | ) | | (0.2 | ) |
Income (loss) before income taxes | | (1.1 | ) | | 0.9 | | | 6.7 | |
Income tax expense (benefit) | | (0.5 | ) | | 0.2 | | | 2.4 | |
Net income (loss) | | (0.6 | ) | | 0.7 | | | 4.3 | |
The following discussion should be read in conjunction with the Selected Financial Data and the Consolidated Financial Statements and the related notes contained elsewhere herein.
| | |
| 12 AMERICAN WOODMARK CORPORATION® 2009 ANNUAL REPORT |
FORWARD-LOOKING STATEMENTS
This report contains statements concerning the Company’s expectations, plans, objectives, future financial performance, and other statements that are not historical facts. These statements are “forward-looking statements” within the meaning of the Private Securities Litigation Reform Act of 1995. In most cases, the reader can identify these forward-looking statements by words such as “anticipate,” “estimate,” “forecast,” “expect,” “believe,” “should,” “could,” “would,” “plan,” “may,” or other similar words. Forward-looking statements contained in this annual report, including Management’s Discussion and Analysis, are based on current expectations. Forward-looking statements are subject to risks and uncertainties that could cause actual results to differ materially from those in the forward-looking statements. Those risks and uncertainties include but are not limited to (1) overall industry demand at reduced levels, (2) economic weakness in a specific channel of distribution, (3) the loss of sales from specific customers due to their loss of market share, bankruptcy or switching to a competitor, (4) a sudden and significant rise in basic raw material costs, (5) a dramatic increase to the cost of diesel fuel and/or transportation related services, (6) the need to respond to price or product initiatives launched by a competitor, (7) the Company’s ability to successfully implement initiatives related to increasing market share, new products, maintaining and increasing its sales force and new product displays, and (8) sales growth at a rate that outpaces the Company’s ability to install new capacity. Additional risks that could affect the Company’s financial condition or results of operations are discussed in the Company’s most recent annual report on Form 10-K filed with the SEC, under the heading “Risk Factors,” While the Company believes that these risks are manageable and will not adversely impact the long-term performance of the Company these risks could, under certain circumstances, have a materially adverse impact on its operating results and financial condition.
OVERVIEW
American Woodmark Corporation manufactures and distributes kitchen cabinets and vanities for the remodeling and new home construction markets. Its products are sold on a national basis directly to home centers, major builders and home manufacturers, and through a network of independent distributors. At April 30, 2009, the Company operated 14 manufacturing facilities and 9 service centers across the country, but had announced that it was permanently closing two of these manufacturing plants and suspending operations at a third manufacturing plant.
Driven by market conditions that are generally regarded as the worst in 50 years, the Company’s net sales, gross profit, and net income all declined in its fiscal year that ended on April 30, 2009 (fiscal 2009) as compared with its fiscal year that ended on April 30, 2008 (fiscal 2008).
These declines were driven primarily by the impact of reduced sales volumes, as the Company’s market share gains in both the remodeling and new construction sectors were more than offset by the impact of the overall market’s decline. The Company’s remodeling sales declined by a mid-single digit percentage during fiscal 2009, as sales of existing homes, generally acknowledged to be a driver of remodeling activity, decreased 8% during the Company’s fiscal year according to data supplied by the U.S. Census Bureau. The Company believes that the magnitude of its remodeling sales decline was less than that of its remodeling customers. The Company’s sales to new construction customers declined approximately 25% in a market where construction of new single-family homes started during the Company’s fiscal year declined by 44%. The Company gained market share with many new construction customers during fiscal 2009, but these gains were tempered by declines that resulted from a handful of its new construction customers going out of business as a result of the difficult economic conditions.
Despite the present housing market downturn, the Company believes that the long-term fundamentals for the American housing industry continue to remain positive, based upon continued population growth, relatively low interest rates, and other favorable demographic trends. Based upon this belief, the Company has continued to invest in improving its operations and its capabilities to best service its customers. The Company remains focused on continuing to gain market share and has continued to invest in developing and launching new products while maintaining its product displays and related marketing collateral deployed with new customers in its new construction channel.
| | |
| AMERICAN WOODMARK CORPORATION® 2009 ANNUAL REPORT 13 |
During fiscal 2009, the Company announced that it is realigning its manufacturing network by closing two of its oldest manufacturing plants and suspending operations in a third. Restructuring charges related to these actions have been reflected in the Company’s results.
Gross margin for fiscal 2009 was 16.4%, down from 17.1% in fiscal 2008. The reduction in the Company’s gross margin rate was driven primarily by unabsorbed manufacturing overhead costs driven by lower sales volumes.
The Company regularly assesses its long-lived assets to determine if any impairment has occurred. Although the direction of the housing market and its resultant impact upon the Company’s performance is not presently positive, the Company continues to believe that the long-term fundamentals of population growth, job creation, employment, and long-term interest rates support a growing and vibrant housing economy in the future. The Company does not believe that its long-lived assets pertaining to its 14 manufacturing plants or any of its other long-lived assets were impaired as of April 30, 2009.
In connection with its aforementioned manufacturing realignment, the Company expects that certain of the three manufacturing plants that are closing may be accounted for as held for sale once manufacturing operations have ceased and the Company has met the required accounting criteria. At April 30, 2009, the aggregate net book value of the three plants which are scheduled to be permanently closed or suspended was $6.8 million. If these assets become held for sale, it is possible that an asset impairment charge could be recorded at that time if their estimated fair value is less than net book value.
The Company recorded restructuring charges during the fourth quarter of fiscal 2009 in connection with its plant closure activity. The net of tax impact of these charges aggregated $(6.0) million. Exclusive of these charges, the Company earned a net income of $2.8 million for fiscal 2009, compared with net income earned during the prior fiscal year of $4.3 million which included restructuring charges of $0.9 million related to the closure of one manufacturing plant during fiscal 2008.
RESULTS OF OPERATIONS
| | | | | | | | | | | | | | | |
| | | FISCAL YEARS ENDED APRIL 30 | |
(In thousands) | | 2009 | | 2008 | | 2007 | | 2009 VS. 2008
PERCENT CHANGE | | | 2008 VS. 2007
PERCENT CHANGE | |
Net sales | | $ | 545,934 | | $ | 602,426 | | $ | 760,925 | | (9.4 | )% | | (20.8 | )% |
Gross profit | | | 89,490 | | | 103,127 | | | 155,819 | | (13.2 | ) | | (33.8 | ) |
Selling and marketing expenses | | | 60,033 | | | 71,875 | | | 71,009 | | (16.5 | ) | | 1.2 | |
General and administrative expenses | | | 26,875 | | | 26,870 | | | 35,402 | | 0.0 | | | (24.1 | ) |
Interest expense | | | 716 | | | 805 | | | 910 | | (11.1 | ) | | (11.5 | ) |
NET SALES
Net sales were $545.9 million in fiscal 2009, a decrease of $56.5 million, or 9% compared with fiscal 2008. Overall unit volume for fiscal 2009 was 10% lower than in fiscal 2008, driven primarily by weaker new construction sales volume. Average revenue per unit increased 1% in fiscal 2009, driven primarily by the increased proportion of remodeling sales within the Company’s sales mix.
Net sales for fiscal 2008 decreased 21% to $602.4 million from $760.9 million in fiscal 2007 The completion of the Company’s transition out of selling certain low-margin products was responsible for about 20% of this decline, while reductions in sales of the Company’s core products resulted in the remainder of the sales decline. Overall unit volume for fiscal 2008 was 28% lower than in fiscal 2007 driven primarily by weaker new construction and remodeling sales volume, but also due to the elimination of the low-margin products sales. Average revenue per unit increased 10% during fiscal 2008 compared with prior year, driven primarily by the aforementioned low-margin products transition, and to a lesser extent from an increased proportion of remodeling sales within the Company’s sales mix.
| | |
| 14 AMERICAN WOODMARK CORPORATION® 2009 ANNUAL REPORT |
GROSS PROFIT
Gross profit as a percentage of sales decreased to 16.4% in fiscal 2009 as compared with 17.1% in fiscal 2008. The impact of reduced sales volume in fiscal 2009 created inefficiencies from unabsorbed manufacturing overhead, which more than offset the beneficial impact from improvements in labor productivity. Specific changes and additional information included:
| • | | Materials costs decreased as a percentage of net sales by 0.2% during fiscal 2009 as compared with fiscal 2008, driven by the inflationary impact of higher fuel and material costs that were more than offset by lower lumber prices. |
| • | | Freight costs increased as a percentage of net sales by 0.2% during fiscal 2009 as compared with fiscal 2008, as the impact from higher fuel costs were somewhat offset by reduced shipments relating to the Company’s focus on improved quality. |
| • | | Labor costs decreased 0.1% as a percentage of net sales compared with the prior year, driven by improved productivity that was somewhat offset by increased medical costs. |
| • | | Overhead costs increased as a percentage of net sales by 0.8% as compared with fiscal 2008, driven by under-absorbed fixed overhead costs as a result of the reduced sales volume. |
During fiscal 2008, the Company experienced a decrease in its gross profit as a percent of sales to 17.1% from 20.5% in fiscal 2002. The impact of reduced core product sales in fiscal 2008 drove labor productivity and fixed overhead cost absorption lower, more than offsetting the beneficial impact upon margins from the improvements in the Company’s sales mix that resulted from its completed transition out of selling low-margin products. In addition, the Company’s gross profit rate was reduced 0.8% by a change in the form of the Company’s sales promotional participation with one of its retail customers, and by 0.2% for severance and separation costs associated with headcount reductions and the closure of one of the Company’s manufacturing plants. Specific changes and additional information included:
| • | | Materials costs declined as a percentage of net sales by 1.6% during fiscal 2008 as compared with fiscal 2007. In addition to the favorable impact of the aforementioned changes in sales mix, declining lumber prices and improved lumber yields more than offset the inflationary impact of rising fuel costs. |
| • | | Freight costs were in line with costs incurred in the prior fiscal year as a percentage of net sales, as the beneficial impact of the Company’s improved sales mix was offset by inefficiencies that resulted from lower production volumes and the rise in fuel costs as the fiscal year progressed. |
| • | | Labor costs increased 1.4% as a percentage of net sales compared with the prior year, driven by reduced productivity associated with lower production volumes and increased medical costs. |
| • | | Overhead costs increased as a percentage of net sales by 3.5% as compared with fiscal 2007 as a 6% reduction in costs was less in magnitude than the Company’s sales decline. |
SELLING AND MARKETING EXPENSES
Selling and marketing expenses in fiscal 2009 were 11.0% of net sales, compared with 11.9% of net sales in fiscal 2008. The decreased cost as a percent of sales in fiscal 2009 was driven by reduced spending on advertising and promotions, product displays, and literature that more than outpaced the decline in sales.
Selling and marketing expenses were 11.9% of net sales in fiscal 2008 compared with 9.3% in fiscal 2007. The increased cost as a percent of sales in fiscal 2008 was driven by increased costs associated with launching new products and new displays deployed with new construction customers, coupled with the decline in net sales.
GENERAL & ADMINISTRATIVE EXPENSES
General and administrative expenses for fiscal 2009 were flat with fiscal 2008 costs, and represented 4.9% of net sales, compared with 4.5% of net sales for fiscal 2008. Increases associated with the Company’s pay-for-performance variable compensation program of $3.0 million were partially offset by cost reductions from headcount reductions of $1.0 million, a gain on the termination of the Company’s retiree health care plan of $0.6 million, and reduced bad debt expense of
| | |
| AMERICAN WOODMARK CORPORATION® 2009 ANNUAL REPORT 15 |
$0.7 million. As of April 30, 2009, the Company had receivables from customers with a higher perceived level of risk aggregating $1.3 million, of which $0.5 million had been reserved for potential uncollectibility.
General and administrative expenses in fiscal 2008 were reduced by $8.5 million from fiscal 2007 levels, and represented 4.5% of net sales, as compared with 4.7% of net sales for fiscal 2007. The decrease in fiscal 2008 was due primarily to lower costs associated with the Company’s pay-for-performance variable compensation program, offset somewhat by increased bad debt costs of $0.7 million. As of April 30, 2008, the Company had receivables from customers with a higher perceived level of risk aggregating $2.6 million, of which $1.3 million had been reserved for potential uncollectibility.
EFFECTIVE INCOME TAX RATES
The Company’s effective tax rate, reflecting the impact of permanent tax differences for general business credits and the domestic production deduction, as well as near break-even results, was 47.4% on the pre-tax loss of $6.1 million.
The Company’s combined federal and state effective income tax rate declined to 24.9% in fiscal 2008 from 36.4% in fiscal 2007, as the increased impact of permanent tax differences for tax-exempt interest, general business credits, and the domestic production deduction more than offset the increased impact of state income taxes and meals and entertainment in a year of reduced net income.
OUTLOOK FOR FISCAL 2010
The Company follows several indices, including but not limited to housing starts, existing home sales, mortgage interest rates, new jobs growth, GDP growth, and consumer confidence that it believes are near-term leading indicators of overall demand for kitchen and bath cabinetry. The Company believes that while these indicators collectively suggest the long-term economic outlook for housing is positive, the near-term outlook remains challenging.
At the commencement of fiscal 2010, two of the key remodeling and new construction market indicators started the new fiscal year at lower levels than they averaged during fiscal 2009:
| • | | Recent annualized sales of existing homes averaged 4.6 million homes, down 5% below their average for fiscal 2009, and |
| • | | Recent annualized construction starts of single-family homes averaged 370,000, down 25% below their average for fiscal 2009. |
The Company expects that the market will remain at similar levels of activity during its fiscal 2010. The Company expects that it will continue to benefit from the market share gains it has already achieved, and may continue to gain market share during fiscal 2010. The Company expects that material costs will be relatively stable in fiscal 2010. The Company has experienced an inflationary environment with respect to certain commodity prices and petroleum-based products during the past three fiscal years. While the Company believes that it is more efficient as compared to the industry in the use of materials, a rise in raw material costs could negatively impact profitability during fiscal 2010.
The Company could be negatively impacted by reduced market demand as the result of lower overall remodeling or new construction activity. While the Company expects to continue to perform better than the industry on average during a downturn in demand, the combined effects of lower sales and increased costs due to underutilized capacity could result in decreased profitability in fiscal 2010 versus fiscal 2009.
Additional risks and uncertainties that could affect the Company’s results of operations and financial condition are discussed elsewhere in this report, including under “Forward-Looking Statements,” and in the Company’s annual report on Form 10-K filed with the SEC, under “Risk Factors.”
LIQUIDITY AND CAPITAL RESOURCES
The statements of cash flows reflect the changes in cash and cash equivalents for the years ended April 30, 2009, 2008, and 2007, by classifying transactions into three major categories: operating, investing, and financing activities.
| | |
| 16 AMERICAN WOODMARK CORPORATION® 2009 ANNUAL REPORT |
OPERATING ACTIVITIES
The Company’s main source of liquidity is cash generated from operating activities consisting of net earnings adjusted for non-cash operating items, primarily depreciation, amortization and stock-based compensation, and changes in operating assets and liabilities such as receivables, inventories, and payables. Primarily because of the non-cash operating expenses that are included in net income, the Company’s cash provided by operating activities has historically been considerably more than the Company’s net income. During fiscal 2009, the Company’s net cash provided by operating activities was $46.8 million, as compared with the net loss of $3.2 million. Of the $50.0 million difference between these two amounts, $40.0 million related to non-cash depreciation and amortization and stock-based compensation expenses.
Cash provided by operating activities in fiscal 2009 was $46.8 million, down slightly from $47.6 million in fiscal 2008. The $0.8 million reduction in cash provided by operating activities was primarily attributable to the $7.5 million reduction of net income, which was in turn driven primarily by accrued restructuring charges and asset write-offs of nearly $10 million, most of which did not require a cash payout during fiscal 2009.
The Company’s working capital contribution from reduced levels of customer receivables was less favorable in fiscal 2009, as days sales outstanding increased by 1.6 days. This was partially offset by improved inventory turns related to the Company’s lean manufacturing initiative.
Cash provided by operating activities in fiscal 2008 was $47.6 million, compared with $86.5 million in fiscal 2007. The $38.9 million reduction in cash provided from operations compared with the prior year was primarily attributable to the $28.3 million reduction of net income. The remaining $10.6 million reduction in cash provided from operating activities was primarily driven by less favorable contributions from changes in receivables and inventory, offset somewhat by less unfavorable changes in accounts payable, accrued and prepaid expenses, and a decrease in deferred income taxes, as the Company’s working capital investment had been reduced significantly in fiscal 2007 due to the low-margin products transition.
INVESTING ACTIVITIES
The Company’s investing activities consist of capital expenditures and investments in promotional displays. Net cash used by investing activities in fiscal 2009 was $13.8 million, compared with $19.0 million in fiscal 2008 and $28.1 million in fiscal 2007. Additions to property, plant, and equipment for fiscal 2009 were $4.8 million, compared with $8.3 million in fiscal 2008 and $14.7 million in fiscal 2007
During fiscal 2009, the Company reduced its investments in capital expenditures and promotional displays by $3.4 million and $1.8 million, respectively. The Company made similar reductions of capital expenditures and promotional displays of $6.4 million and $2.7 million, respectively, during fiscal 2008 as compared with fiscal 2007. The reductions in capital expenditures were driven by declining sales that obviated the need for new manufacturing capacity, while the reductions in promotional displays were driven by reduced store re-merchandising activities and reduced growth in the number of new stores by the Company’s remodeling customers,
FINANCING ACTIVITIES
The Company generated $33.0 million of free cash flow in fiscal 2009 (defined as cash provided by operating activities net of cash used for investing activities) which represented an increase of $4.4 million, or 15%, above the free cash flow generated in fiscal 2008. The Company chose to build its cash balance to create enhanced liquidity during fiscal 2009, and used only $7.2 million for financing activities, which was considerably lower than the $29.8 million used for financing activities in fiscal 2008.
Cash was used for financing activities in fiscal 2009 primarily to pay $5.1 million of dividends and repurchase $2.5 million of stock. Cash was used for financing activities in fiscal 2008 primarily to repurchase $24.8 million of stock and pay $4.8 million of dividends.
The Company generated free cash flow of $58.3 million in fiscal 2007, and chose to use $48.2 million for financing activities, by repurchasing $62.9 million of stock and paying $3.3 million of dividends, offset by proceeds received from exercises of employee stock options and other, of $19.5 million.
| | |
| AMERICAN WOODMARK CORPORATION® 2009 ANNUAL REPORT 17 |
Under the Company’s stock repurchase authorization, approved by its Board of Directors in August 2007, the Company repurchased $2.5 million of its common stock during fiscal 2009. The August 2007 authorization allows the Company to repurchase its common stock from time to time, when management believes the market price presents an attractive return on investment for its shareholders. At April 30, 2009, approximately $93.2 million remained authorized by the Company’s Board of Directors to repurchase shares of the Company’s common stock under the August 2007 authorization. The Company has authorized a total of $220 million of stock repurchases since the inception of the program in 2001.
The Company chose to proactively amend its revolving credit agreement in June 2009, driven by the future impact upon the Company’s previous debt covenants of both restructuring charges associated with the Company’s previously announced operational initiatives, and the difficult economic environment. As a result of this amendment, the aggregate amount of the Company’s revolving credit line was reduced from $40 million to $25 million, the Company’s inventory and receivables now serve as collateral for the facility, the facility’s maturity date was reduced by one year to December 2011, and the Company is required to maintain a minimum of $35 million in cash on hand.
Cash flow from operations combined with accumulated cash on hand and available borrowing capacity on the Company’s $25 million line of credit, is expected to be more than sufficient to meet forecasted working capital requirements, service existing debt obligations, and fund capital expenditures for fiscal 2010.
The timing of the Company’s contractual obligations as of April 30, 2009 is summarized in the table below.
| | | | | | | | | | | | | | | |
| | | FISCAL YEARS ENDED APRIL 30 |
(in thousands) | | TOTAL
AMOUNTS | | 2010 | | 2011-2012 | | 2013-2014 | | 2015 AND
THEREAFTER |
Term credit facility | | $ | 10,000 | | $ | — | | $ | — | | $ | 10,000 | | $ | — |
Economic development loans | | | 3,524 | | | — | | | — | | | — | | | 3,524 |
Term loans | | | 5,114 | | | 366 | | | 805 | | | 761 | | | 3,182 |
Capital lease obligations | | | 8,696 | | | 493 | | | 1,015 | | | 1,057 | | | 6,131 |
Interest on long-term debt1 | | | 3,708 | | | 586 | | | 1,108 | | | 751 | | | 1,263 |
Operating lease obligations | | | 18,177 | | | 4,495 | | | 5,820 | | | 3,512 | | | 4,350 |
Pension contributions2 | | | 25,117 | | | — | | | 7,346 | | | 17,771 | | | — |
| | | | | | | | | | | | | | | |
Total | | $ | 74,336 | | $ | 5,940 | | $ | 16,094 | | $ | 33,852 | | $ | 18,450 |
| | | | | | | | | | | | | | | |
| 1 | Interest commitments under interest bearing debt consists of interest under the Company’s primary loan agreement and other term loans and capitalized lease agreements. The Company’s term credit facility includes a $10 million term note that bears a variable interest rate determined by the London Interbank Offered Rate (LIBOR) plus a spread between .50% and .675%. Interest under other term loans and capitalized lease agreements is fixed at rates between 2% and 6%. Interest commitments under interest bearing debt for the Company’s term credit facility is at LIBOR plus the spread as of April 30, 2009, throughout the remaining term of the agreement. |
| 2 | The estimated cost of the Company’s two defined benefit pension plans are determined annually based upon the discount rate and other assumptions at fiscal year end. Future pension funding contributions beyond 2014 have not been determined at this time. |
MARKET RISKS
The Company’s business has historically been subjected to seasonal influences, with higher sales typically realized in the second and fourth fiscal quarters.
The costs of the Company’s products are subject to inflationary pressures and commodity price fluctuations. The Company has generally been able, over time, to recover the effects of inflation and commodity price fluctuations through sales price increases.
As discussed in the Overview section, the present U.S. housing market conditions rank among the worst in 50 years. Consequently, unless the Company is able to gain sufficient market share to offset these difficult conditions, sales and net income could be reduced.
| | |
| 18 AMERICAN WOODMARK CORPORATION® 2009 ANNUAL REPORT |
On April 30, 2009, the Company had no material exposure to changes in interest rates for its debt agreements.
The Company does not currently use commodity or interest rate derivatives or similar financial instruments to manage its commodity price or interest rate risks.
For additional discussion of risks that could affect the Company and its business, see “Forward-Looking Statements” above and “Risk Factors” in the Company’s most recent annual report on Form 10-K filed with the SEC.
OFF-BALANCE SHEET ARRANGEMENTS
As of April 30, 2009 and 2008, the Company had no off-balance sheet arrangements other than operating leases.
CRITICAL ACCOUNTING POLICIES
Management has chosen accounting policies that are necessary to give reasonable assurance that the Company’s operational results and financial position are accurately and fairly reported. The significant accounting policies of the Company are disclosed in Note A to the Consolidated Financial Statements. The following discussion addresses the accounting policies that management believes have the greatest potential impact on the presentation of the financial condition and operating results of the Company for the periods being reported and that require the most judgment.
Management has reviewed these critical accounting policies and estimates with the Audit Committee of the Board of Directors.
LONG-LIVED ASSET IMPAIRMENT. The Company reviews its long-lived assets for impairment whenever events or changes in circumstances indicate that the related carrying amounts may not be recoverable. For purposes of assessing if impairment exists, assets are grouped at the lowest level for which there are identifiable cash flows that are largely independent of the cash flows of other groups of assets. To determine whether an impairment has occurred, the Company compares estimates of the future undiscounted net cash flows of groups of assets to their carrying values. The Company has not recognized impairments of long-lived assets in the last three years.
REVENUE RECOGNITION. The Company utilizes signed sales agreements that provide for transfer of title to the customer upon delivery. The Company’s network of third-party carriers does not currently have the technology to provide detailed information regarding the delivery date for all orders. As a result, the Company must estimate the amount of sales that have been transferred to third-party carriers but not delivered to customers. The estimate is calculated using a lag factor determined by analyzing the actual difference between shipment date and delivery date of orders over the past 12 months. Revenue is only recognized on those shipments which the Company believes have been delivered to the customer. Management believes that likely changes in the estimate are immaterial to the overall results of the fiscal year.
The Company recognizes revenue based on the invoice price less allowances for sales returns, cash discounts, and other deductions as required under current U.S. generally accepted accounting principles. Collection is reasonably assured as determined through an analysis of accounts receivable data, including historical product return, and the evaluation of each customer’s ability to pay. Allowances for sales returns are based on the historical relationship between shipments and returns. The Company believes that historical experience is an accurate reflection of future returns.
SELF INSURANCE. The Company is self-insured for certain costs related to employee medical coverage and workers’ compensation liability. The Company maintains stop-loss coverage with third-party insurers to limit total exposure. The Company establishes a liability at the balance sheet date based on estimates for a variety of factors that influence the Company’s ultimate cost. In the event that actual experience is substantially different from the estimates, the financial results for the period could be impacted. The Company believes that the methodologies used to estimate all factors related to employee medical coverage and workers’ compensation are an accurate reflection of the liability as of the date of the balance sheet.
PENSIONS. The Company has two non-contributory defined benefit pension plans covering substantially all of the Company’s employees.
| | |
| AMERICAN WOODMARK CORPORATION® 2009 ANNUAL REPORT 19 |
The estimated cost, benefits, and pension obligation of the non-contributory defined benefit pension plans are determined using various assumptions. The most significant assumptions are the long-term expected rate of return on plan assets, the discount rate used to determine the present value of the pension obligations, and the future rate of compensation level increases. The Company determines the discount rate by referencing the AON Yield Curve. The Company believes that using a yield curve approach more accurately reflects changes in the present value of liabilities over time since each cash flow is discounted at the rate at which it could effectively be settled. The long-term expected rate of return on plan assets reflects the current mix of the plan assets invested in equities and bonds. The future rate of compensation levels reflects expected salary trends.
The following is a summary of the potential impact of a hypothetical 1% change in actuarial assumptions for the discount rate, rate of compensation, expected return on plan assets, and consumer price index.
| | | | | | | |
(in millions) | | IMPACT OF 1%
INCREASE | | | IMPACT OF 1%
DECREASE |
| (decrease) increase | | | | | |
| | |
Effect on annual pension expense | | $ | (1.5 | ) | | $ | 2.1 |
| | |
Effect on projected pension benefit obligation | | $ | (8.8 | ) | | $ | 10.7 |
Pension expense for fiscal 2009 and the assumptions used in that calculation are presented in Note H of the Consolidated Financial Statements. At April 30, 2009, the discount rate was 7.16% compared to 6.68% at April 30, 2008. The expected return on plan assets is 8.0%, which is consistent with fiscal 2008. The assumed rate of increase in compensation levels is 4.0% for the year ended April 30, 2009, unchanged from the prior fiscal year.
The performance of the Company’s pension plans is largely dependent on the assumptions used to measure the obligations of the plans and to estimate future performance of the plans’ invested assets. Over the past two measurement periods, the material deviations between results based on assumptions and the actual plan performance has been as a result of the changes to the discount rate used to measure the plans’ benefit obligations and the actual return on plan assets. Under accounting guidelines, the discount rate is to be set to market at each annual measurement date. From the fiscal 2007 to fiscal 2008 measurement dates, the discount rate increased from 5.76% to 6.68%, which was the primary driver in an actuarial gain of $12.6 million. From the fiscal 2008 to fiscal 2009 measurement dates, the discount rate increased from 6.68% to 7.16%, which was the primary driver in the actuarial gain of $8.1 million.
The Company strives to balance expected long-term returns and short-term volatility of pension plan assets. Favorable and unfavorable differences between the assumed and actual returns on plan assets are generally amortized over a period no longer than the average future working lifetime of the active participants. The actual rates of return on plan assets realized, net of investment manager fees were (16.8)%, 1.5%, and 10.0% for fiscal years 2009, 2008, and 2007, respectively.
The fair value of plan assets at April 30, 2009 was $67.3 million compared to $77.6 million at April 30, 2008. The Company’s projected benefit obligation exceeded plan assets by $12.9 million in fiscal 2009 and $3.3 million in fiscal 2008. The Company’s $9.6 million increase in its net under-funded position during 2009 was driven primarily by the Company’s $13.6 million loss in value of plan assets. The Company expects its pension expense for fiscal 2009 to increase from $4.2 million in fiscal 2009 to $5.0 million in fiscal 2010, due primarily to amortization of unrecognized actuarial losses. The Company made contributions of $5.6 million to its pension plans in fiscal 2009. Under the requirements of the Pension Protection Act of 2006, the Company in fiscal 2010 is not required to make a mandatory contribution to the pension plans. During fiscal 2010, the Company plans to make a voluntary contribution in a similar amount to fiscal 2009.
PROMOTIONAL DISPLAYS. The Company invests in promotional displays in retail stores to demonstrate product features, product specifications, quality specifications, and serve as a training tool for designers. The investment is carried at cost less applicable amortization. Amortization is provided by
| | |
| 20 AMERICAN WOODMARK CORPORATION® 2009 ANNUAL REPORT |
the straight-line method on an individual display basis over the estimated period of economic benefit, approximately 30 months. The Company believes that the estimated period of economic benefit provides an accurate reflection of the value of displays as of the date of the balance sheet based on historical experience,
PRODUCT WARRANTY. The Company estimates outstanding warranty costs based on the historical relationship between warranty claims and revenues. The warranty accrual is reviewed monthly to verify that it properly reflects the Company’s remaining obligation based on anticipated expenditures over the balance of the obligation period. Adjustments are made when actual warranty claim experience differs from estimates. Warranty claims are generally made within three months of the original shipment date.
STOCK-BASED COMPENSATION EXPENSE. The calculation of stock-based compensation expense involves estimates that require management’s judgment. These estimates include the fair value of each of the stock option awards granted, which is estimated on the date of grant using a Black-Scholes option pricing model. There are two significant inputs into the Black-Scholes option pricing model: expected volatility and expected term. The Company estimates expected volatility based on the historical volatility of the Company’s stock over a term equal to the expected term of the option granted. The expected term of stock option awards granted is derived from historical exercise experience under the Company’s stock option plans and represents the period of time that stock option awards granted are expected to be outstanding. The assumptions used in calculating the fair value of share-based payment awards represent management’s best estimates, but these estimates involve inherent uncertainties and the application of significant management judgment. As a result, if factors change and the Company uses different assumptions, stock-based compensation expense could be materially different in the future. In addition, the Company is required to estimate the expected forfeiture rate, and only recognize expense for those shares expected to vest. If the Company’s actual forfeiture rate is materially different from its estimate, the stock-based compensation expense could be significantly different from what the Company has recorded in the current period. See Note G to the Consolidated Financial Statements for further discussion on stock-based compensation.
RECENT ACCOUNTING PRONOUNCEMENTS
In September 2006, the Financial Accounting Standards Board (FASB) issued Statement of Financial Accounting Standards (SFAS) No. 157, “Fair Value Measurements” (SFAS 157). SFAS 157 establishes a common definition for fair value to be applied to generally accepted accounting principles guidance requiring use of fair value, establishes a framework for measuring fair value, and expands disclosure about such fair value measurements. SFAS 157 is effective for fiscal years beginning after November 15, 2007. The FASB, on February 12, 2008, issued FASB Staff Position (FSP) SFAS 157-2, “Effective Date of FASB Statement No. 157.” This FSP permits a delay in the effective date of SFAS 157 to fiscal years beginning after November 15, 2008, for non-financial assets and non-financial liabilities, except for items that are recognized or disclosed at fair value on the financial statements on a recurring basis (at least annually). On February 14, 2008, the FASB issued FSP SFAS 157-1, “Application of FASB Statement No. 147 to FASB Statement No. 13 and Other Accounting Pronouncements that Address Fair Value Measurements for Purposes of Lease Classification or Measurement under Statement 13,” to exclude SFAS No. 13, “Accounting for Leases” and its related interpretive accounting pronouncements from the scope of SFAS 157. SFAS 157 was adopted by the Company on May 1, 2008, for financial assets and financial liabilities. The adoption of SFAS 157 as it relates to the Company’s financial assets and financial liabilities, did not have a material effect on the Company’s results of operations or financial position. The Company is currently evaluating the expected impact, if any, on its non-financial assets and non-financial liabilities.
In February 2007, the FASB issued SFAS No. 159, “The Fair Value Options for Financial Assets and Financial Liabilities—including an amendment of FASB Statement No. 115,” (SFAS 159). SFAS 159 permits entities to choose to measure many financial instruments and certain other items at fair
| | |
| AMERICAN WOODMARK CORPORATION® 2009 ANNUAL REPORT 21 |
value. The objective is to expand the use of fair value measurements in accounting for financial instruments. SFAS 159 was adopted by the Company on May 1, 2008. The Company did not elect the fair-value option for existing assets or liabilities upon adoption. Therefore, there was no impact of the provisions of SFAS 159 on the Company’s results of operations or its financial position.
In December 2007, the FASB issued SFAS No. 141 (revised 2007), “Business Combinations” (SFAS 141R) and SFAS No. 160, “Noncontrolling Interests in Consolidated Financial Statements—an amendment of ARB No. 51,” (SFAS 160). SFAS 141R requires the acquiring entity in a business combination to recognize the assets acquired and liabilities assumed. Further, SFAS 141R also changes the accounting for acquired in-process research and development assets, contingent consideration, partial acquisitions, and transaction costs. Under SFAS 160, all entities are required to report noncontrolling (minority) interests in subsidiaries as equity in the consolidated financial statements. In addition, transactions between an entity and noncontrolling interests will be treated as equity transactions. SFAS 141R and SFAS 160 are both effective for the Company beginning May 1, 2009. The adoption of these pronouncements is not expected to have a significant impact on the Company’s consolidated financial statements.
In March 2008, the FASB issued SFAS No. 161, “Disclosures about Derivative Instruments and Hedging Activities—an amendment of FASB Statement No. 133,” (SFAS 161). SFAS 161 is intended to improve financial reporting by requiring enhanced disclosures for derivative instruments and hedging activities to enable investors to better understand how derivative instruments are accounted for under SFAS No. 133, “Accounting for Derivative Instruments and Hedging Activities,” and their effects on an entity’s financial position, financial performance, and cash flows. SFAS 161 is effective for the Company beginning May 1, 2009. The adoption of SFAS 161 is not expected to have an impact on the Company’s consolidated financial statements.
In December 2008, the FASB issued FSP SFAS No. 132R-1, “Employers’ Disclosures about Postretirement Benefit Plan Assets,” (SFAS 132R-1). FSP SFAS 132R-1 requires companies to disclose how pension plan asset investment allocations are made, the major categories of plan assets, the inputs and valuation techniques used to measure the fair value of plan assets and significant concentrations of risk within plan assets. FSP SFAS 132R-1 is effective for financial statements issued for fiscal years ending after December 15, 2009. The adoption of FSP SFAS 132R-1 is not expected to have a significant impact on the Company’s results of operations or its financial position.
LEGAL MATTERS
The Company is involved in suits and claims in the normal course of business, including product liability and general liability claims, in addition to claims pending before the Equal Employment Opportunity Commission. On at least a quarterly basis, the Company consults with its legal counsel to ascertain the reasonable likelihood that such claims may result in a loss. As required by SFAS No. 5, “Accounting for Contingencies” (SFAS 5), the Company categorizes the various suits and claims into three categories according to their likelihood for resulting in potential loss; those that are probable (i.e., more likely than not), those that are reasonably possible, and those that are deemed to be remote. The Company accounts for these loss contingencies in accordance with SFAS 5. Where losses are deemed to be probable and estimable, accruals are made. Where losses are deemed to be reasonably possible or remote, a range of loss estimates is determined. Where no loss estimate range can be made, the Company and its counsel perform a worst case estimate. In determining these loss range estimates, the Company considers known values of similar claims and consultation with independent counsel.
The Company believes that the aggregate range of loss stemming from the various suits and asserted and unasserted claims which were deemed to be either probable or reasonably possible was not material as of April 30, 2009.
DIVIDENDS DECLARED
On May 28, 2009, the Board of Directors approved a $.09 per share cash dividend on its common stock. The cash dividend was paid on June 30, 2009, to shareholders of record on June 16, 2009.
| | |
22 AMERICAN WOODMARK CORPORATION® 2009 ANNUAL REPORT |
CONSOLIDATED BALANCE SHEETS
| | | | | | | | |
| | | APRIL 30 | |
(in thousands, except share and per share data) | | 2009 | | | 2008 | |
ASSETS | | | | | | | | |
Current Assets | | | | | | | | |
Cash and cash equivalents | | $ | 82,821 | | | $ | 56,932 | |
Customer receivables, net | | | 26,944 | | | | 27,744 | |
Inventories | | | 32,684 | | | | 46,981 | |
Prepaid expenses and other | | | 1,789 | | | | 3,006 | |
Deferred income taxes | | | 9,300 | | | | 8,725 | |
| | | | | | | | |
Total Current Assets | | | 153,538 | | | | 143,388 | |
| | |
Property, plant and equipment, net | | | 132,928 | | | | 150,840 | |
Promotional displays, net | | | 12,793 | | | | 15,506 | |
Prepaid pension asset | | | — | | | | 2,632 | |
Deferred income taxes | | | 1,393 | | | | — | |
Other assets | | | 3,085 | | | | 2,433 | |
| | | | | | | | |
TOTAL ASSETS | | $ | 303,737 | | | $ | 314,799 | |
| | | | | | | | |
| | |
LIABILITIES AND SHAREHOLDERS’ EQUITY | | | | | | | | |
Current Liabilities | | | | | | | | |
Accounts payable | | $ | 15,070 | | | $ | 19,708 | |
Current maturities of long-term debt | | | 859 | | | | 864 | |
Accrued compensation and related expenses | | | 24,909 | | | | 21,151 | |
Accrued marketing expenses | | | 7,080 | | | | 5,401 | |
Other accrued expenses | | | 10,249 | | | | 8,910 | |
| | | | | | | | |
Total Current Liabilities | | | 58,167 | | | | 56,034 | |
| | |
Long-term debt, less current maturities | | | 26,475 | | | | 26,043 | |
Deferred income taxes | | | — | | | | 8,071 | |
Defined benefit pension and postretirement benefits liabilities | | | 12,900 | | | | 6,617 | |
Other long-term liabilities | | | 2,513 | | | | 3,400 | |
| | |
Shareholders’ Equity | | | | | | | | |
Preferred stock, $1,00 par value; 2,000,000 shares authorized, none issued | | | — | | | | — | |
Common stock, no par value; 40,000,000 shares authorized; issued and outstanding shares: at April 30, 2009:14,094,449; at April 30,2008:14,150,290 | | | 82,293 | | | | 76,409 | |
Retained earnings | | | 136,074 | | | | 146,288 | |
Accumulated other comprehensive loss | | | | | | | | |
Defined benefit pension and postretirement plans | | | (14,685 | ) | | | (8,063 | ) |
| | | | | | | | |
Total Shareholders’ Equity | | | 203,682 | | | | 214,634 | |
| | | | | | | | |
TOTAL LIABILITIES AND SHAREHOLDERS’ EQUITY | | $ | 303,737 | | | $ | 314,799 | |
| | | | | | | | |
See notes to consolidated financial statements.
| | |
| AMERICAN WOODMARK CORPORATION® 2009 ANNUAL REPORT 23 |
CONSOLIDATED STATEMENTS OF OPERATIONS
| | | | | | | | | | | | |
| | | YEARS ENDED APRIL 30 | |
(in thousands, except share and per share data) | | 2009 | | | 2008 | | | 2007 | |
Net sales | | $ | 545,934 | | | $ | 602,426 | | | $ | 760,925 | |
Cost of sales and distribution | | | 456,444 | | | | 499,299 | | | | 605,106 | |
| | | | | | | | | | | | |
Gross Profit | | | 89,490 | | | | 103,127 | | | | 155,819 | |
| | | |
Selling and marketing expenses | | | 60,033 | | | | 71,875 | | | | 71,009 | |
General and administrative expenses | | | 26,875 | | | | 26,870 | | | | 35,402 | |
Restructuring charges | | | 9,743 | | | | — | | | | — | |
| | | | | | | | | | | | |
Operating Income (Loss) | | | (7,161 | ) | | | 4,382 | | | | 49,408 | |
| | | |
Interest expense | | | 716 | | | | 805 | | | | 910 | |
Other income | | | (1,726 | ) | | | (2,108 | ) | | | (2,680 | ) |
| | | | | | | | | | | | |
Income (Loss) Before Income Taxes | | | (6,151 | ) | | | 5,685 | | | | 51,178 | |
| | | |
Income tax expense (benefit) | | | (2,917 | ) | | | 1,414 | | | | 18,617 | |
| | | | | | | | | | | | |
Net Income (Loss) | | $ | (3,234 | ) | | $ | 4,271 | | | $ | 32,561 | |
| | | | | | | | | | | | |
| | | |
SHARE INFORMATION | | | | | | | | | | | | |
Earnings (loss) per share | | | | | | | | | | | | |
Basic | | $ | (0.23 | ) | | $ | 0.30 | | | $ | 2.08 | |
Diluted | | | (0.23 | ) | | | 0.29 | | | | 2.04 | |
Cash dividends per share | | | 0.36 | | | | 0.33 | | | | 0.21 | |
| | | | | | | | | | | | |
See notes to consolidated financial statements.
| | |
| 24 AMERICAN WOODMARK CORPORATION® 2009 ANNUAL REPORT |
CONSOLIDATED STATEMENTS OF
SHAREHOLDERS’ EQUITY AND COMPREHENSIVE INCOME (LOSS)
| | | | | | | | | | | | | | | | | | | |
| | | COMMON STOCK | | | | | | | | | | |
(in thousands, except share and per share data) | | SHARES | | | AMOUNT | | | RETAINED
EARNINGS | | | ACCUMULATED
OTHER
COMPREHENSIVE
INCOME (LOSS) | | | TOTAL
SHAREHOLDERS’
EQUITY | |
Balance, May 1, 2006 | | 15,958,496 | | | $ | 53,195 | | | $ | 194,071 | | | $ | (5,605 | ) | | $ | 241,661 | |
| | | | | |
Comprehensive Income: | | | | | | | | | | | | | | | | | | | |
Net income | | | | | | | | | | 32,561 | | | | | | | | 32,561 | |
Other comprehensive income, net of tax: | | | | | | | | | | | | | | | | | | | |
Change in derivative financial instrument | | | | | | | | | | | | | | 4 | | | | 4 | |
Change in minimum pension liability | | | | | | | | | | | | | | (773 | ) | | | (773 | ) |
| | | | | | | | | | | | | | | | | | | |
Total Comprehensive Income | | | | | | | | | | | | | | | | | | 31,792 | |
| | | | | |
Effect of SFAS 158 adoption | | | | | | | | | | | | | | (7,385 | ) | | | (7,385 | ) |
Stock-based compensation | | | | | | 6,287 | | | | | | | | | | | | 6,287 | |
Cash dividends | | | | | | | | | | (3,297 | ) | | | | | | | (3,297 | ) |
Exercise of stock options | | 682,538 | | | | 17,780 | | | | | | | | | | | | 17,780 | |
Stock repurchases | | (1,782,222 | ) | | | (7,077 | ) | | | (55,829 | ) | | | | | | | (62,906 | ) |
Employee benefit plan contributions | | 61,127 | | | | 2,165 | | | | | | | | | | | | 2,165 | |
| | | | | | | | | | | | | | | | | | | |
Balance, April 30, 2007 | | 14,919,939 | | | $ | 72,350 | | | $ | 167,506 | | | $ | (13,759 | ) | | $ | 226,097 | |
| | | | | |
Comprehensive Income: | | | | | | | | | | | | | | | | | | | |
Net income | | | | | | | | | | 4,271 | | | | | | | | 4,271 | |
Other comprehensive income, net of tax: | | | | | | | | | | | | | | | | | | | |
Change in pension and postretirement benefits | | | | | | | | | | | | | | 5,696 | | | | 5,696 | |
| | | | | | | | | | | | | | | | | | | |
Total Comprehensive Income | | | | | | | | | | | | | | | | | | 9,967 | |
| | | | | |
Stock-based compensation | | | | | | 5,277 | | | | | | | | | | | | 5,277 | |
Cash dividends | | | | | | | | | | (4,771 | ) | | | | | | | (4,771 | ) |
Exercise of stock options | | 44,716 | | | | 1,024 | | | | | | | | | | | | 1,024 | |
Stock repurchases | | (888,846 | ) | | | (3,990 | ) | | | (20,718 | ) | | | | | | | (24,708 | ) |
Employee benefit plan contributions | | 74,481 | | | | 1,748 | | | | | | | | | | | | 1,748 | |
| | | | | | | | | | | | | | | | | | | |
Balance, April 30, 2008 | | 14,150,290 | | | $ | 76,409 | | | $ | 146,288 | | | $ | (8,063 | ) | | $ | 214,634 | |
| | | | | |
Comprehensive Loss: | | | | | | | | | | | | | | | | | | | |
Net loss | | | | | | | | | | (3,234 | ) | | | | | | | (3,234 | ) |
Other comprehensive loss, net of tax: | | | | | | | | | | | | | | | | | | | |
Change in pension and postretirement benefits | | | | | | | | | | | | | | (6,622 | ) | | | (6,622 | ) |
| | | | | | | | | | | | | | | | | | | |
Total Comprehensive Loss | | | | | | | | | | | | | | | | | | (9,856 | ) |
| | | | | |
Stock-based compensation | | | | | | 4,877 | | | | | | | | | | | | 4,877 | |
Cash dividends | | | | | | | | | | (5,060 | ) | | | | | | | (5,060 | ) |
Exercise of stock options | | 8,400 | | | | 152 | | | | | | | | | | | | 152 | |
Stock repurchases | | (140,214 | ) | | | (549 | ) | | | (1,908 | ) | | | | | | | (2,457 | ) |
Employee benefit plan contributions | | 75,973 | | | | 1,404 | | | | (12 | ) | | | | | | | 1,392 | |
| | | | | | | | | | | | | | | | | | | |
Balance, April 30, 2009 | | 14,094,449 | | | $ | 82,293 | | | $ | 136,074 | | | $ | (14,685 | ) | | $ | 203,682 | |
| | | | | | | | | | | | | | | | | | | |
See notes to consolidated financial statements.
| | |
| AMERICAN WOODMARK CORPORATION® 2009 ANNUAL REPORT 25 |
CONSOLIDATED STATEMENTS OF CASH FLOWS
| | | | | | | | | | | | |
| | | YEARS ENDED APRIL 30 | |
(in thousands) | | 2009 | | | 2008 | | | 2007 | |
OPERATING ACTIVITIES | | | | | | | | | | | | |
Net income (loss) | | $ | (3,234 | ) | | $ | 4,271 | | | $ | 32,561 | |
Adjustments to reconcile net income (loss) to net cash provided by operating activities: | | | | | | | | | | | | |
Depreciation and amortization | | | 35,100 | | | | 35,204 | | | | 35,909 | |
Net loss on disposal of property, plant and equipment | | | 271 | | | | 517 | | | | 178 | |
Stock-based compensation expense | | | 4,877 | | | | 5,277 | | | | 6,287 | |
Deferred income taxes | | | (5,715 | ) | | | (5,631 | ) | | | 1,225 | |
Tax deficit/(benefit) from stock-based compensation | | | 219 | | | | 492 | | | | (1,718 | ) |
Other non-cash items | | | 2,310 | | | | 1,184 | | | | 309 | |
Changes in operating assets and liabilities: | | | | | | | | | | | | |
Customer receivables | | | 1,269 | | | | 9,449 | | | | 18,636 | |
Inventories | | | 9,976 | | | | 7,961 | | | | 11,572 | |
Prepaid expenses and other assets | | | (417 | ) | | | (414 | ) | | | (1,096 | ) |
Accounts payable | | | (4,638 | ) | | | (5,896 | ) | | | (8,725 | ) |
Accrued compensation, marketing, and other accrued expenses | | | 8,621 | | | | (3,894 | ) | | | (7,029 | ) |
Other | | | (1,827 | ) | | | (881 | ) | | | (1,630 | ) |
| | | | | | | | | | | | |
Net Cash Provided by Operating Activities | | | 46,812 | | | | 47,639 | | | | 86,479 | |
| | | |
INVESTING ACTIVITIES | | | | | | | | | | | | |
Payments to acquire property, plant and equipment | | | (4,824 | ) | | | (8,252 | ) | | | (14,681 | ) |
Proceeds from sales of property, plant and equipment | | | 64 | | | | 6 | | | | 7 | |
Investment in promotional displays | | | (9,005 | ) | | | (10,784 | ) | | | (13,472 | ) |
| | | | | | | | | | | | |
Net Cash Used in Investing Activities | | | (13,765 | ) | | | (19,030 | ) | | | (28,146 | ) |
| | | |
FINANCING ACTIVITIES | | | | | | | | | | | | |
Payments of long-term debt | | | (864 | ) | | | (855 | ) | | | (1,456 | ) |
Proceeds from long-term debt | | | 1,290 | | | | — | | | | — | |
Tax deficit/(benefit) from stock-based compensation | | | (219 | ) | | | (492 | ) | | | 1,718 | |
Proceeds from issuance of common stock and other | | | 152 | | | | 1,099 | | | | 17,769 | |
Repurchase of common stock | | | (2,457 | ) | | | (24,783 | ) | | | (62,897 | ) |
Payment of dividends | | | (5,060 | ) | | | (4,771 | ) | | | (3,297 | ) |
| | | | | | | | | | | | |
Net Cash Used In Financing Activities | | | (7,158 | ) | | | (29,802 | ) | | | (48,163 | ) |
| | | | | | | | | | | | |
| | | |
Net lncrease/(Decrease) in Cash and Cash Equivalents | | | 25,889 | | | | (1,193 | ) | | | 10,170 | |
Cash and Cash Equivalents, Beginning of Year | | | 56,932 | | | | 58,125 | | | | 47,955 | |
| | | | | | | | | | | | |
Cash and Cash Equivalents, End of Year | | $ | 82,821 | | | $ | 56,932 | | | $ | 58,125 | |
| | | | | | | | | | | | |
See notes to consolidated financial statements.
| | |
| 26 AMERICAN WOODMARK CORPORATION® 2009 ANNUAL REPORT |
notes to consolidated financial statements
NOTE A—SUMMARY OF SIGNIFICANT ACCOUNTING POLICIES
The Company manufactures and distributes kitchen cabinets and vanities for the remodeling and new home construction markets. The Company’s products are sold across the United States through a network of independent distributors and directly to home centers and major builders.
The following is a description of the Company’s significant accounting policies:
PRINCIPLES OF CONSOLIDATION AND BASIS OF PRESENTATION: The consolidated financial statements include the accounts of the Company and its wholly-owned subsidiary. Significant inter-company accounts and transactions have been eliminated in consolidation.
REVENUE RECOGNITION: The Company recognizes revenue when product is delivered to the customer and title has passed. Revenue is based on invoice price less allowances for sales returns, cash discounts, and other deductions.
COST OF SALES AND DISTRIBUTION: The cost of sales and distribution includes all costs associated with the manufacture and distribution of the Company’s products including the costs of shipping and handling.
ADVERTISING COSTS: Advertising costs are expensed as incurred. Advertising expenses for fiscal years 2009, 2008, and 2007 were $15.1 million, $17.5 million, and $15.5 million, respectively.
CASH AND CASH EQUIVALENTS: Cash in excess of operating requirements is invested in money market accounts which are carried at cost (which approximates fair value). The Company considers all highly liquid short-term investments with an original maturity of three months or less when purchased to be cash equivalents. Cash equivalents were $82.0 million and $55.8 million at April 30, 2009 and 2008, respectively.
INVENTORIES: Inventories are stated at lower of cost or market. Inventory costs are determined by the last-in, first-out (LIFO) method.
The LIFO cost reserve is determined in the aggregate for inventory and is applied as a reduction to inventories determined on the first-in, first-out method (FIFO). FIFO inventory cost approximates replacement cost.
PROPERTY, PLANT AND EQUIPMENT: Property, plant and equipment is stated on the basis of cost less accumulated depreciation. Depreciation is provided by the straight-line method over the estimated useful lives of the related assets, which range from 15 to 30 years for buildings and improvements and 3 to 10 years for machinery and equipment. Assets under capital leases are amortized over the shorter of their estimated useful lives or the term of the related lease.
IMPAIRMENT OF LONG-LIVED ASSETS: The Company reviews its long-lived assets for impairment when events or changes in circumstances indicate that the carrying amount of an asset may not be recoverable. During fiscal years 2009, 2008, and 2007 the Company concluded no impairment existed.
PROMOTIONAL DISPLAYS: The Company invests in promotional displays in retail stores to demonstrate product features, product specifications, and quality specifications and serve as a training tool for retail kitchen designers. The Company invests in these long-lived productive assets to provide the aforementioned benefits. The Company’s investment in promotional
| | |
| AMERICAN WOODMARK CORPORATION® 2009 ANNUAL REPORT 27 |
displays is carried at cost less applicable amortization. Amortization is provided by the straight-line method on an individual display basis over 30 months (the estimated period of benefit). Promotional display amortization expense for fiscal years 2009, 2008, and 2007 was $11.7 million, $12.8 million, and $12.7 million, respectively.
FAIR VALUE OF FINANCIAL INSTRUMENTS: The carrying amounts of the Company’s cash and cash equivalents, customer receivables, accounts payable, and long-term debt approximate fair value.
INCOME TAXES: The Company accounts for deferred income taxes utilizing the asset and liability method, whereby deferred tax assets and liabilities are recognized based on the tax effects of temporary differences between the financial statement amounts and the tax basis of assets and liabilities, using enacted tax rates in effect for the year in which these items are expected to reverse. At each reporting date, the Company evaluates the need for a valuation allowance to reduce deferred tax assets.
PENSIONS AND POSTRETIREMENT BENEFITS: The Company has two non-contributory defined benefit pension plans covering substantially all of the Company’s employees. Effective April 30, 2007 the Company adopted the recognition and disclosure provisions of Statement of Financial Accounting Standards (SFAS) No. 158, “Employers’ Accounting for Defined Benefit Pension and Other Postretirement Plans—an amendment of FASB Statements No. 87, 88,106, and 132R,” (SFAS 158). SFAS 158 requires the Company to recognize in its consolidated balance sheets the overfunded or underfunded status of its defined benefit pension plans and postretirement plan measured as the difference between the fair value of plan assets and the benefit obligation. The Company must also recognize as a component of other comprehensive income, net of tax, the actuarial gains and losses and the prior service costs, credits and transition costs that arise during the period. The adoption of SFAS 158 had no impact on years prior to fiscal 2007 and had no effect on the calculation of pension expense.
STOCK-BASED COMPENSATION:The Company recognizes stock-based compensation expense based on the provisions SFAS No. 123 R, “Share-Based Payment,” (SFAS 123R).
RECENT ACCOUNTING PRONOUNCEMENTS: In September 2006, the Financial Accounting Standards Board (FASB) issued SFAS No. 157, “Fair Value Measurements” (SFAS 157). SFAS 157 establishes a common definition for fair value to be applied to generally accepted accounting principles guidance requiring use of fair value, establishes a framework for measuring fair value, and expands disclosure about such fair value measurements. SFAS 157 is effective for fiscal years beginning after November 15, 2007. The FASB, on February 12, 2008, issued FASB Staff Position (FSP) SFAS 157-2, “Effective Date of FASB Statement No. 157” This FSP permits a delay in the effective date of SFAS 157 to fiscal years beginning after November 15, 2008, for non-financial assets and non-financial liabilities, except for items that are recognized or disclosed at fair value on the financial statements on a recurring basis (at least annually). On February 14, 2008, the FASB issued FSP SFAS 157-1, “Application of FASB Statement No. 147 to FASB Statement No. 13 and Other Accounting Pronouncements that Address Fair Value Measurements for Purposes of Lease Classification or Measurement under Statement 13,” to exclude SFAS No. 13, “Accounting for Leases” and its related interpretive accounting pronouncements from the scope of SFAS 157. SFAS 157 was adopted by the Company on May 1, 2008, for financial assets and financial liabilities. The adoption of SFAS 157 as it relates to the Company’s financial assets and financial liabilities, did not have a material effect on the Company’s results of operations or financial position. The Company is currently evaluating the expected impact, if any, on its non-financial assets and non-financial liabilities.
In February 2007, the FASB issued SFAS No. 159, “The Fair Value Options for Financial Assets and Financial Liabilities—including an amendment of FASB Statement No. 115,” (SFAS 159). SFAS 159 permits entities to choose to measure many financial instruments and certain other items at fair value. The objective is to expand the use of fair value measurements in accounting for financial Instruments. SFAS 159 was adopted by the Company on May 1, 2008. The Company did not elect the fair-value option for existing assets or liabilities upon adoption. Therefore, there was no impact of the provisions of SFAS 159 on the Company’s results of operations or its financial position.
| | |
| 28 AMERICAN WOODMARK CORPORATION® 2009 ANNUAL REPORT |
In December 2007, the FASB issued SFAS No. 141 (revised 2007), “Business Combinations” (SFAS 141R) and SFAS No. 160, “Noncontrolling Interests in Consolidated Financial Statements—an amendment of ARB No. 51,” (SFAS 160). SFAS 141R requires the acquiring entity in a business combination to recognize the assets acquired and liabilities assumed. Further, SFAS 141R also changes the accounting for acquired in-process research and development assets, contingent consideration, partial acquisitions, and transaction costs. Under SFAS 160, all entities are required to report non-controlling (minority) interests in subsidiaries as equity in the consolidated financial statements. In addition, transactions between an entity and noncontrolling interests will be treated as equity transactions. SFAS 141R and SFAS 160 are both effective for the Company beginning May 1, 2009. The adoption of these pronouncements is not expected to have a significant impact on the Company’s consolidated financial statements.
In March 2008, the FASB issued SFAS No. 161, “Disclosures about Derivative Instruments and Hedging Activities—an amendment of FASB Statement No. 133,” (SFAS 161). SFAS 161 is intended to improve financial reporting by requiring enhanced disclosures for derivative instruments and hedging activities to enable investors to better understand how derivative instruments are accounted for under SFAS No. 133, “Accounting for Derivative Instruments and Hedging Activities,” and their effects on an entity’s financial position, financial performance, and cash flows. SFAS 161 is effective for the Company beginning May 1, 2009. The adoption of SFAS 161 is not expected to have an impact on the Company’s consolidated financial statements.
In December 2008, the FASB issued FSP SFAS No. 132R-1, “Employers’ Disclosures about Postretirement Benefit Plan Assets,” (SFAS 132R-1). FSP SFAS 132R-1 requires companies to disclose how pension plan asset investment allocations are made, the major categories of plan assets, the inputs and valuation techniques used to measure the fair value of plan assets and significant concentrations of risk with in plan assets. FSP SFAS 132R-1 is effective for financial statements issued for fiscal years ending after December 15, 2009. The adoption of FSP SFAS 132R-1 is not expected to have a significant impact on the Company’s results of operations or its financial position.
USE OF ESTIMATES: The preparation of consolidated financial statements in conformity with U.S. generally accepted accounting principles requires management to make estimates and assumptions that affect the reported amounts of assets and liabilities and disclosure of contingent assets and liabilities at the date of the consolidated financial statements and the reported amounts of revenues and expenses during the reporting period. Actual results could differ from those estimates.
NOTE B—CUSTOMER RECEIVABLES
The components of customer receivables were:
| | | | | | | | |
| | | APRIL 30 | |
(in thousands) | | 2009 | | | 2008 | |
Gross customer receivables | | $ | 29,672 | | | $ | 32,336 | |
Less: | | | | | | | | |
Allowance for doubtful accounts | | | (536 | ) | | | (1,298 | ) |
Allowance for returns and discounts | | | (2,192 | ) | | | (3,294 | ) |
| | | | | | | | |
Net customer receivables | | $ | 26,944 | | | $ | 27,744 | |
| | | | | | | | |
NOTE C—INVENTORIES
The components of inventories were:
| | | | | | | | |
| | | APRIL 30 | |
(in thousands) | | 2009 | | | 2008 | |
Raw materials | | $ | 11,012 | | | $ | 13,062 | |
Work-in-process | | | 22,961 | | | | 35,185 | |
Finished goods | | | 8,853 | | | | 11,440 | |
| | | | | | | | |
Total FIFO inventories | | | 42,826 | | | | 59,687 | |
Reserve to adjust inventories to LIFO value | | | (10,142 | ) | | | (12,706 | ) |
| | | | | | | | |
Total LIFO inventories | | $ | 32,684 | | | $ | 46,981 | |
| | | | | | | | |
After tax earnings were impacted by $291,000, $136,000, and $71,000 in fiscal years 2009, 2008, and 2007 respectively, as a result of liquidation of LIFO based inventories.
| | |
| AMERICAN WOODMARK CORPORATION® 2009 ANNUAL REPORT 29 |
NOTE D—PROPERTY, PLANT AND EQUIPMENT
The components of property, plant and equipment were:
| | | | | | | | |
| | | APRIL 30 | |
(in thousands) | | 2009 | | | 2008 | |
Land | | $ | 6,654 | | | $ | 3,149 | |
Buildings and improvements | | | 88,990 | | | | 88,482 | |
Buildings and improvements—capital leases | | | 20,356 | | | | 20,356 | |
Machinery and equipment | | | 185,373 | | | | 183,524 | |
Machinery and equipment—capital leases | | | 29,342 | | | | 29,773 | |
Construction in progress | | | 568 | | | | 4,162 | |
| | | | | | | | |
| | | 331,283 | | | | 329,446 | |
Less accumulated amortization and depreciation | | | (198,355 | ) | | | (178,606 | ) |
| | | | | | | | |
Total | | $ | 132,928 | | | $ | 150,840 | |
| | | | | | | | |
Amortization and depreciation expense on property, plant and equipment amounted to $22.4 million, $22.3 million, and $23.1 million, in fiscal years 2009, 2008, and 2007, respectively.
NOTE E—LOANS PAYABLE AND LONG-TERM DEBT
Maturities of long-term debt are as follows:
| | | | | | | | | | | | | | | | | | | | | |
| | | FISCAL YEARS ENDING APRIL 30 |
(in thousands) | | 2010 | | 2011 | | 2012 | | 2013 | | 2014 | | 2015 AND
THEREAFTER | | TOTAL
OUTSTANDING |
Term credit facility | | $ | — | | $ | — | | $ | — | | $ | 10,000 | | $ | — | | $ | — | | $ | 10,000 |
Economic development loans | | | — | | | — | | | — | | | — | | | — | | | 3,524 | | | 3,524 |
Term loans | | | 366 | | | 390 | | | 415 | | | 413 | | | 348 | | | 3,182 | | | 5,114 |
Capital lease obligations | | | 493 | | | 503 | | | 512 | | | 523 | | | 534 | | | 6,131 | | | 8,696 |
| | | | | | | | | | | | | | | | | | | | | |
Total | | $ | 859 | | $ | 893 | | $ | 927 | | $ | 10,936 | | $ | 882 | | $ | 12,837 | | $ | 27,334 |
| | | | | | | | | | | | | | | | | | | | | |
Less current maturities | | | | | | | | | | | | | | | | | | | | $ | 859 |
| | | | | | | | | | | | | | | | | | | | | |
Total long-term debt | | | | | | | | | | | | | | | | | | | | $ | 26,475 |
| | | | | | | | | | | | | | | | | | | | | |
The Company amended its primary credit facility in June 2009. The amended facility provides a $10 million term loan that expires in December 2012, and a $25 million revolving line of credit that is secured by the Company’s inventories and receivables and expires in December 2011. The amended credit facility also requires the Company to maintain a minimum of $35 million in cash on hand and contains certain other limitations on the Company’s ability to increase its dividend and repurchase its stock. Prior to its amendment, the Company’s credit facility was unsecured, matured in December 2012, and was a $40 million revolving line of credit. Borrowings under the credit facility bear interest at the London InterBank Offered Rate (LIBOR) (1.25% at April 30, 2009) plus a spread ranging from 0.50% to 1.25% at April 30, 2009 (0.675% at April 30, 2009), based on the ratio of Total Funded Indebtedness to earnings, before deduction of interest and taxes, plus depreciation, amortization, and non-cash employee compensation (Consolidated EBITDA). Funded indebtedness is the total of senior debt, letter of credit obligations, stockholder debt, subordinated debt, the value of all capitalized and synthetic leases, and funded indebtedness of other persons secured or guaranteed by the Company. The
| | |
| 30 AMERICAN WOODMARK CORPORATION® 2009 ANNUAL REPORT |
Company incurs a fee for amounts not used under the revolving credit facility. The non-usage fee is included in interest expense and was $72,998, $56,235, and $50,498 for 2009, 2008, and 2007 respectively, or 0.2% of the amount not borrowed. There were no amounts outstanding under the revolving credit facility at April 30, 2009 and 2008.
In 2009, the Company entered into a loan agreement with the Board of County Commissioners of Garrett County as part of the Company’s capital investment in land located in Garrett County, Maryland. This loan agreement is secured by a Deed of Trust on the property and bears interest at a fixed rate of 3%. The agreement defers principal and interest during the term of the obligation and forgives any outstanding balance at December 31, 2019, if the Company complies with certain employment levels. The outstanding balance as of April 30, 2009 was $1,290,000.
In 2005, the Company entered into two separate loan agreements that were amended in 2008 with the Maryland Economic Development Corporation and the County Commissioners of Allegany County as part of the Company’s capital investment and operations at the Allegany County, Maryland site. The balances of these loan agreements were $1,484,000 and $750,000 for both years ended April 30, 2009 and 2008 and expire at December 31, 2016, bearing interest at a fixed rate of 3%. These loan agreements are secured by mortgages on the manufacturing facility constructed in Allegany County, Maryland. These loan agreements defer principal and interest during the term of the obligation and forgive any outstanding balance at December 31, 2016, if the Company complies with certain employment levels at the facility.
In 2002, the Company entered into a loan agreement with the Perry, Harlan, Leslie, Breathitt Regional Industrial Authority (a.k.a. Coalfields Regional Industrial Authority, Inc.) as part of the Company’s capital investment and operations at the Hazard, Kentucky site. This debt facility is a $6 million term loan, which expires November 13, 2017, bearing interest at a fixed rate of 2%. It is secured by a mortgage on the manufacturing facility constructed in Hazard, Kentucky. The loan requires annual debt service payments consisting of principal and interest with a fixed balloon payment of $1.6 million at loan expiration. The outstanding amounts owed as of April 30, 2009 and 2008 were $4,723,000 and $4,975,000, respectively.
In 2001, the Company entered into a loan agreement with the West Virginia Economic Development Authority as part of the Company’s capital investment at the Moorefield, West Virginia site. This debt facility is a $1 million term loan which expires January 12, 2013, bearing interest at a fixed rate of 5.9%. It is secured by a Deed of Trust on the Moorefield, West Virginia site. The loan requires quarterly debt service of principal and interest. The balances outstanding at April 30, 2009 and 2008 were $391,000 and $520,000, respectively.
In 2004, the Company entered into a lease agreement with the West Virginia Economic Development Authority as part of the Company’s capital investment and operations at the South Branch plant located in Hardy County, West Virginia. This capital lease agreement is a $10 million term obligation, which expires July 1, 2024, bearing interest at a fixed rate of 2%. The outstanding amounts owed as of April 30, 2009 and 2008 were $8,696,000 and $9,178,000, respectively.
Certain of the Company’s loan agreements limit the amount and type of indebtedness the Company can incur and require the Company to maintain specified financial ratios measured on a quarterly basis. In addition to the assets previously discussed, certain of the Company’s property, plant and equipment are pledged as collateral under term loan agreements and capital lease arrangements. The Company was in compliance with all covenants contained in its loan agreements at April 30, 2009.
Interest paid during fiscal years 2009, 2008, and 2007 was $721,000, $986,000, and $1,026,000, respectively.
Interest capitalized during fiscal years 2009, 2008, and 2007 was $49,000, $219,000, and $178,000, respectively.
| | |
| AMERICAN WOODMARK CORPORATION® 2009 ANNUAL REPORT 31 |
NOTE F—EARNINGS (LOSS) PER SHARE
The following table summarizes the computations of basic and diluted earnings per share:
| | | | | | | | | | |
| | | FISCAL YEARS ENDED APRIL 30 |
(in thousands, except per share amounts) | | 2009 | | | 2008 | | 2007 |
Numerator used in basic and diluted earnings per common share: | | | | | | | | | | |
Net income (loss) | | $ | (3,234 | ) | | $ | 4,271 | | $ | 32,561 |
| | | | | | | | | | |
Denominator: | | | | | | | | | | |
Denominator for basic earnings per common share—weighted-average shares | | | 14,055 | | | | 14,472 | | | 15,690 |
Effect of dilutive securities: | | | | | | | | | | |
Stock options | | | — | | | | 68 | | | 286 |
| | | | | | | | | | |
Denominator for diluted earnings per common share—weighted-average shares and assumed conversions | | | 14,055 | | | | 14,540 | | | 15,976 |
Net income (loss) per share | | | | | | | | | | |
Basic | | $ | (0.23 | ) | | $ | 0.30 | | $ | 2.08 |
Diluted | | $ | (0.23 | ) | | $ | 0.29 | | $ | 2.04 |
Dilutive securities have not been considered in the calculation of net loss per share for fiscal year ended April 30, 2009 as the effect would be anti-dilutive.
NOTE G—STOCK-BASED COMPENSATION
The Company has stock-based compensation plans as described below. Total compensation expense related to stock-based awards granted under these plans for the fiscal years ended April 30, 2009, 2008, and 2007 was $4.9 million, $5.3 million, and $6.3 million, respectively. The Company recognizes stock-based compensation costs net of an estimated forfeiture rate for those shares expected to vest on a straight-line basis over the requisite service period of the award. The Company estimated the forfeiture rate for options granted during fiscal years 2009, 2008, and 2007, based on its historical experience.
STOCK OPTION PLANS
At April 30, 2009, the Company had stock option awards outstanding under five different plans: (1) 1999 stock option plan for employees, (2) 2004 stock incentive plan for employees, (3) 2000 stock option plan for non-employee directors, (4) 2005 stock option plan for non-employee directors, and (5) 2006 non-employee directors equity ownership plan.
Stock options granted and outstanding under each of the plans vest evenly over a three-year period and have contractual terms ranging from four years to ten years. The exercise price of all stock options granted is equal to the fair market value of the Company’s common stock on the option grant date. No new option grants will be made under the 2000 and 2005 plans for non-employee directors. As of April 30,2009, there were 1,281,528 shares of common stock available for future stock options under the 1999 stock option plan for employees, the 2004 stock incentive plan for employees, and 2006 non-employee directors equity ownership plan.
METHODOLOGY ASSUMPTIONS
For purposes of valuing stock option grants, the Company has identified two employee groups and one non-employee director group, based upon observed option exercise patterns. The Company uses the Black-Scholes option-pricing model to value the Company’s stock options for each of the three groups. Using this option-pricing model, the fair value of each stock option award is estimated on the date of grant. The fair value of the Company’s stock option awards is expensed on a straight-line basis over the vesting period of the stock options.
| | |
| 32 AMERICAN WOODMARK CORPORATION® 2009 ANNUAL REPORT |
The expected volatility assumption is based on the historical volatility of the Company’s stock over a term equal to the expected term of the option granted. The expected term of stock option awards granted is derived from the Company’s historical exercise experience and represents the period of time that stock option awards granted are expected to be outstanding for each of the three identified groups. The expected term assumption incorporates the contractual term of an option grant, which is generally ten years for employees and from four years to ten years for non-employee directors, as well as the vesting period of an award. The risk-free interest rate is based on the implied yield on a U.S. Treasury constant maturity with a remaining term equal to the expected term of the option granted.
The weighted-average assumptions and valuation of the Company’s stock options were as follows:
| | | | | | | | | | | | |
| | | FISCAL YEARS ENDED APRIL 30 | |
| | | 2009 | | | 2008 | | | 2007 | |
Weighted-average fair value of grants | | $ | 12.07 | | | $ | 11.45 | | | $ | 14.48 | |
Expected volatility | | | 61.7 | % | | | 29.7 | % | | | 43.0 | % |
Expected term in years | | | 5.4 | | | | 5.3 | | | | 5.2 | |
Risk-free interest rate | | | 3.47 | % | | | 5.01 | % | | | 4.96 | % |
Expected dividend yield | | | 1.5 | % | | | 0.7 | % | | | 0.4 | % |
STOCK OPTION ACTIVITY
The following table presents a summary of the Company’s stock options activity for the fiscal years ended April 30, 2009, 2008, and 2007 (remaining contractual term [in years] and exercise prices are weighted-averages):
| | | | | | | | | | | |
| | | NUMBER
OF OPTIONS | | | REMAINING
CONTRACTUAL
TERM | | EXERCISE
PRICE | | AGGREGATE
INTRINSIC VALUE
(in thousands) |
Outstanding at April 30, 2006 | | 2,034,211 | | | 6.7 | | $ | 24.96 | | $ | 18,859 |
| | | | |
Granted | | 521,888 | | | 8.1 | | | 33.07 | | | 764 |
Exercised | | (682,538 | ) | | — | | | 19.42 | | | 11,290 |
Cancelled or expired | | (87,529 | ) | | — | | | 30.52 | | | 370 |
| | | | | | | | | | | |
Outstanding at April 30, 2007 | | 1,786,032 | | | 6.5 | | $ | 29.17 | | $ | 10,019 |
| | | | |
Granted | | 426,600 | | | 9.2 | | | 33.73 | | | — |
Exercised | | (44,716 | ) | | — | | | 22.89 | | | 307 |
Cancelled or expired | | (150,149 | ) | | — | | | 34.34 | | | 8 |
| | | | | | | | | | | |
Outstanding at April 30, 2008 | | 2,017,767 | | | 6.3 | | $ | 29.88 | | $ | 398 |
| | | | |
Granted | | 447,600 | | | 9.1 | | $ | 23.82 | | $ | — |
Exercised | | (8,400 | ) | | — | | | 16.62 | | | 31 |
Cancelled or expired | | (128,198 | ) | | — | | | 29.40 | | | 5 |
| | | | | | | | | | | |
Outstanding at April 30, 2009 | | 2,328,769 | | | 6.1 | | $ | 28.79 | | $ | 629 |
| | | | |
Vested and expected to vest in the future at April 30, 2009 | | 2,270,641 | | | 6.0 | | $ | 28.81 | | $ | 629 |
Exercisable at April 30, 2009 | | 1,542,329 | | | 5.0 | | $ | 28.95 | | $ | 625 |
Available for grant at April 30, 2009 | | 1,281,528 | | | | | | | | | |
| | |
| AMERICAN WOODMARK CORPORATION® 2009 ANNUAL REPORT 33 |
The aggregate intrinsic value in the previous table represents the total pre-tax intrinsic value (the difference between the Company’s closing stock price on the last trading day of fiscal 2009 and the exercise price, multiplied by the number of in-the-money options) that would have been received by the option holders had all option holders exercised their options on April 30, 2009. This amount changes based on the fair market value of the Company’s common stock. The total fair value of options vested for the fiscal years ended April 30, 2009, 2008, and 2007 was $4.9 million, $6.1 million, and $5.9 million, respectively.
As of April 30, 2009, there was $5.0 million of total unrecognized compensation expense related to unvested stock options granted under the Company’s stock-based compensation plans. This expense is expected to be recognized over a weighted-average period of 1.7 years.
Cash received from option exercises for the fiscal years ended April 30, 2009, 2008, and 2007, was an aggregate of $140,000, $1.0 million, and $13.2 million, respectively. The actual tax benefit realized for the tax deduction from option exercises of stock option awards totaled $12,000, $75,000 and $4.5 million for the fiscal years ended April 30, 2009, 2008, and 2007 respectively.
The following table summarizes information about stock options outstanding at April 30, 2009 (remaining lives [in years] and exercise prices are weighted-averages):
| | | | | | | | | | | | |
OPTION PRICE PER SHARE | | OPTIONS OUTSTANDING | | OPTIONS EXERCISABLE |
| | OPTIONS | | REMAINING LIFE | | EXERCISE PRICE | | OPTIONS | | EXERCISE PRICE |
$9.28-$14.93 | | 77,200 | | 1.9 | | $ | 13.96 | | 77,200 | | $ | 13.96 |
$18.91-$24.21 | | 630,900 | | 7.0 | | | 23.45 | | 220,500 | | | 22.79 |
$26.78-$ 28.97 | | 491,702 | | 5.6 | | | 27.94 | | 491,702 | | | 27.94 |
$30.06-$34.87 | | 1,088,378 | | 6.2 | | | 32.90 | | 713,209 | | | 32.56 |
$36.87-$44.59 | | 40,589 | | 3.3 | | | 39.89 | | 39,718 | | | 39.93 |
| | | | | | | | | | | | |
| | 2,328,769 | | | | | | | 1,542,329 | | | |
For the years ended April 30, 2009, 2008, and 2007 stock-based compensation expense was allocated as follows (in thousands):
| | | | | | | | | |
| | | 2009 | | 2008 | | 2007 |
Cost of sales and distribution | | $ | 1,102 | | $ | 1,211 | | $ | 1,256 |
Selling and marketing expenses | | | 1,195 | | | 1,256 | | | 1,238 |
General and administrative expenses | | | 2,580 | | | 2,810 | | | 3,793 |
| | | | | | | | | |
Stock-based compensation expense, before income taxes | | | 4,877 | | | 5,277 | | | 6,287 |
Less: | | | | | | | | | |
Income tax benefit | | | 1,902 | | | 2,144 | | | 2,375 |
| | | | | | | | | |
Total stock-based compensation expense, net of taxes | | $ | 2,975 | | $ | 3,133 | | $ | 3,912 |
| | | | | | | | | |
| | |
| 34 AMERICAN WOODMARK CORPORATION® 2009 ANNUAL REPORT |
NOTE H—EMPLOYEE BENEFIT AND RETIREMENT PLANS
EMPLOYEE STOCK OWNERSHIP PLAN
In fiscal 1990, the Company instituted the American Woodmark Investment Savings Stock Ownership Plan. Under this plan, all employees who are 18 years old and have been employed by the Company for six consecutive months are eligible to receive company stock through a profit-sharing contribution and a 401 (k) matching contribution based upon the employee’s contribution to the plan.
Profit-sharing contributions in the form of company stock are 3% of after-tax earnings, calculated on a quarterly basis and are distributed equally to all employees eligible to participate in the plan. The Company recognized expenses for profit-sharing contributions of $5,000, $196,000, and $977,000, in fiscal years 2009, 2008, and 2007 respectively.
The Company matches 401 (k) contributions in the form of company stock at 50% of an employee’s contribution to the plan up to 4% of base salary for an effective maximum Company contribution of 2% of base salary. The expense for 401 (k) matching contributions for this plan was $1,505,000, $1,613,000, and $1,592,000, in fiscal years 2009, 2008, and 2007 respectively.
PENSION BENEFITS AND POSTRETIREMENT BENEFITS
The Company has two defined benefit pension plans covering virtually all of the Company’s employees. These plans provide defined benefits based on years of service and final average salary.
Included in accumulated other comprehensive loss at April 30, 2009 is $24.1 million ($14.7 million net of tax) related to net unrecognized actuarial losses and unrecognized prior service costs that have not yet been recognized in net periodic pension or benefit costs. The Company expects to recognize $1.3 million ($0.8 million net of tax) in net actuarial losses and prior service costs in net periodic pension and benefit costs during fiscal 2010.
In fiscal 2009, the Company recognized curtailments in its pension plans due to employee terminations. In connection with these curtailments, the Company recorded a pre-tax curtailment loss of $122,000.
| | |
| AMERICAN WOODMARK CORPORATION® 2009 ANNUAL REPORT 35 |
The Company uses an April 30 measurement date for its benefit plans. The following provides a reconciliation of benefit obligations, plan assets, and funded status of the Company’s non-contributory defined benefit pension plans as of April 30.
| | | | | | | | |
| | | PENSION BENEFITS | |
(in thousands) | | 2009 | | | 2008 | |
CHANGE IN BENEFIT OBLIGATION | | | | | | | | |
Benefit obligation at beginning of year | | $ | 80,880 | | | $ | 84,947 | |
Service cost | | | 4,428 | | | | 5,568 | |
Interest cost | | | 5,330 | | | | 4,842 | |
Actuarial gains | | | (8,124 | ) | | | (12,624 | ) |
Benefits paid | | | (2,355 | ) | | | (1,853 | ) |
| | | | | | | | |
Benefit obligation at end of year | | $ | 80,159 | | | $ | 80,880 | |
| | | | | | | | |
| | |
CHANGE IN PLAN ASSETS | | | | | | | | |
Fair value of plan assets at beginning of year | | $ | 77,629 | | | $ | 70,933 | |
Actual return on plan assets | | | (13,586 | ) | | | 959 | |
Company contributions | | | 5,571 | | | | 7,590 | |
Benefits paid | | | (2,355 | ) | | | (1,853 | ) |
| | | | | | | | |
Fair value of plan assets at end of year | | $ | 67,259 | | | $ | 77,629 | |
| | | | | | | | |
Funded status of the plans | | $ | (12,900 | ) | | $ | (3,251 | ) |
Unamortized prior service cost | | | 585 | | | | 836 | |
Unrecognized net actuarial loss | | | 23,488 | | | | 12,216 | |
| | | | | | | | |
Prepaid benefit cost | | $ | 11,173 | | | $ | 9,801 | |
| | | | | | | | |
| |
| | | PENSION BENEFITS | |
(in thousands) | | 2009 | | | 2008 | |
AMOUNTS RECOGNIZED IN THE CONSOLIDATED BALANCE SHEETS | | | | | | | | |
Prepaid pension asset | | $ | — | | | $ | 2,632 | |
Accrued benefit liability | | | (12,900 | ) | | | (5,884 | ) |
Accumulated other comprehensive loss | | | 24,073 | | | | 13,053 | |
| | | | | | | | |
Net amount recognized | | $ | 11,173 | | | $ | 9,801 | |
| | | | | | | | |
| | | | | | | | | | | | |
| | | PENSION BENEFITS | |
(in thousands) | | 2009 | | | 2008 | | | 2007 | |
COMPONENTS OF NET PERIODIC BENEFIT COST | | | | | | | | | | | | |
Service cost | | $ | 4,428 | | | $ | 5,568 | | | $ | 4,942 | |
Interest cost | | | 5,330 | | | | 4,842 | | | | 4,333 | |
Expected return on plan assets | | | (6,124 | ) | | | (5,604 | ) | | | (4,298 | ) |
Amortization of prior service cost | | | 129 | | | | 147 | | | | 144 | |
Curtailment loss | | | 122 | | | | — | | | | — | |
Recognized net actuarial loss | | | 315 | | | | 1,030 | | | | 868 | |
| | | | | | | | | | | | |
Benefit cost | | $ | 4,200 | | | $ | 5,983 | | | $ | 5,989 | |
| | | | | | | | | | | | |
| | |
| 36 AMERICAN WOODMARK CORPORATION® 2009 ANNUAL REPORT |
ACTUARIAL ASSUMPTIONS: The discount rate at April 30 was used to measure the year-end benefit obligations and the earnings effects for the subsequent year. Actuarial assumptions used to determine benefit obligations and earnings effects for principal pension plans follow:
| | | | | | |
| | | FISCAL YEARS ENDED APRIL 30 | |
| | | 2009 | | | 2008 | |
WEIGHED-AVERAGE ASSUMPTIONS TO DETERMINE BENEFIT OBLIGATIONS | | | | | | |
Discount rate | | 7.16 | % | | 6.68 | % |
Rate of compensation increase | | 4.0 | % | | 4.0 | % |
| | | | | | | | | |
| | | FISCAL YEARS ENDED APRIL 30 | |
| | | 2009 | | | 2008 | | | 2007 | |
WEIGHTED-AVERAGE ASSUMPTIONS TO DETERMINE NET PERIODIC BENEFIT COST | | | | | | | | | |
Discount rate | | 6.68 | % | | 5.76 | % | | 6.10 | % |
Expected return on plan assets | | 8.0 | % | | 8.0 | % | | 8.0 | % |
Rate of compensation increase | | 4.0 | % | | 4.0 | % | | 4.0 | % |
In fiscal years 2009 and 2008, the Company determined the discount rate by referencing the AON Yield Curve. The Company believes that using a yield curve approach more accurately reflects changes in the present value of liabilities over time since each cash flow is discounted at the rate at which it could effectively be settled. Prior to fiscal 2008, the discount rate was based on Moody’s Aa corporate bond rate as of April 30.
The Company amortizes experience gains and losses, as well as the effects of changes in actuarial assumptions and plan provisions, over a period no longer than the average future working lifetime of the active participants.
The Company funds the pension plans in amounts sufficient to meet minimum funding requirements set forth in employee benefit and tax laws plus additional amounts the Company deems appropriate.
The Company’s pension plans’ weighted-average asset allocations at April 30, 2009 and 2008, by asset category are as follows:
| | | | | | | | | |
| | | PLAN ASSET ALLOCATION | |
APRIL 30 | | 2009
TARGET | | | 2009
ACTUAL | | | 2008
ACTUAL | |
Equity Funds | | 50.0 | % | | 41.9 | % | | 50.8 | % |
Fixed Income Funds | | 50.0 | % | | 58.1 | % | | 49.2 | % |
| | | | | | | | | |
Total | | 100.0 | % | | 100.0 | % | | 100.0 | % |
| | | | | | | | | |
During a period of uncertainty in the equity and fixed income markets, the Pension Committee may suspend the Target Asset Allocation and manage the investment mix as it sees reasonable, prudent, and in the best interest of the Plans to better protect the value of the Plan assets. With the stock market decreasing during fiscal 2009, the Company decided to not rebalance the funds to the target asset allocations.
| | |
| AMERICAN WOODMARK CORPORATION® 2009 ANNUAL REPORT 37 |
Within the broad categories outlined in the preceding table, the Company has targeted the following specific allocations: 26% Capital Preservation, 32% Bond, 18% Large Capital Growth, 16% Large Capital Value, 5% Small Capital, and 3% International.
CONTRIBUTIONS: Under the requirements of the Pension Protection Act of 2006, the Company is not required to make a mandatory contribution to the pension plans during fiscal 2010. The Company contributed $5.6 million to the pension plans in fiscal 2009 and plans to make a voluntary contribution in a similar amount during fiscal 2010.
ESTIMATED FUTURE BENEFIT PAYMENTS: The following benefit payments, which reflect expected future service, are expected to be paid:
| | | |
FISCAL YEAR | | BENEFIT PAYMENTS (in thousands) |
2010 | | $ | 2,466 |
2011 | | | 2,678 |
2012 | | | 2,850 |
2013 | | | 3,182 |
2014 | | | 3,564 |
Years 2015-2019 | | $ | 23,052 |
The Company previously provided retiree health care insurance benefits for a small number of retirees. During fiscal 2009, the Company settled its retiree medical benefits plan and recognized a $608,000 gain on settlement of the plan. The gain was recorded as a reduction of general and administrative expenses.
NOTE I—INCOME TAXES
Income tax expense was comprised of the following:
| | | | | | | | | | | | |
| | | FISCAL YEARS ENDED APRIL 30 | |
(in thousands) | | 2009 | | | 2008 | | | 2007 | |
CURRENT EXPENSE | | | | | | | | | | | | |
Federal | | $ | 2,250 | | | $ | 5,442 | | | $ | 14,646 | |
State | | | 548 | | | | 1,603 | | | | 2,746 | |
| | | | | | | | | | | | |
Total current expense | | | 2,798 | | | | 7,045 | | | | 17,392 | |
| | | | | | | | | | | | |
| | | |
DEFERRED EXPENSE (BENEFIT) | | | | | | | | | | | | |
Federal | | | (4,955 | ) | | | (4613 | ) | | | 803 | |
State | | | (760 | ) | | | (1,018 | ) | | | 422 | |
| | | | | | | | | | | | |
Total deferred expense (benefit) | | | (5,715 | ) | | | (5,631 | ) | | | 1,225 | |
| | | | | | | | | | | | |
Total expense from continuing operations | | $ | (2,917 | ) | | $ | 1,414 | | | $ | 18,617 | |
Other comprehensive income (loss) | | | (4,324 | ) | | | 3,576 | | | | (5,120 | ) |
| | | | | | | | | | | | |
Total comprehensive income tax expense (benefit) | | $ | 47,241 | ) | | $ | 4,990 | | | $ | 13,497 | |
| | | | | | | | | | | | |
| | |
| 38 AMERICAN WOODMARK CORPORATION® 2009 ANNUAL REPORT |
The Company’s effective income tax rate varied from the federal statutory rate as follows:
| | | | | | | | | |
| | | FISCAL YEARS ENDED APRIL 30 | |
| | | 2009 | | | 2008 | | | 2007 | |
Federal statutory rate | | 35.0 | % | | 35.0 | % | | 35.0 | % |
Effect of: | | | | | | | | | |
Tax-free interest | | 3.1 | % | | -9.7 | % | | -1.6 | % |
General business credits | | 5.1 | | | -7.0 | | | -1.2 | |
Meals and entertainment | | -5.2 | | | 6.8 | | | 0.9 | |
Domestic production deduction | | 2.7 | | | -5.8 | | | -0.8 | |
Other | | 3.2 | | | -1.2 | | | 0.1 | |
| | | | | | | | | |
Total | | 8.9 | % | | -16.9 | % | | -2.6 | % |
| | | |
Effective federal income tax rate | | 43.9 | % | | 18.1 | % | | 32.4 | % |
State income taxes, net of federal tax effect | | 3.5 | | | 6.8 | | | 4.0 | |
| | | | | | | | | |
Effective income tax rate | | 47.4 | % | | 24.9 | % | | 36.4 | % |
| | | | | | | | | |
Income taxes paid were $1,494,000, $6,458,000, and $15,560,000 for fiscal years 2009, 2008, and 2007 respectively.
The significant components of deferred tax assets and liabilities were as follows:
| | | | | | |
| | | APRIL 30 |
(in thousands) | | 2009 | | 2008 |
Deferred tax assets: | | | | | | |
Pension and postretirement benefits | | $ | 4,276 | | $ | 48 |
Accounts receivable | | | 4,089 | | | 4,918 |
Product liability | | | 799 | | | 937 |
Employee benefits | | | 10,683 | | | 7,342 |
Other | | | 590 | | | 589 |
| | | | | | |
Total | | | 20,437 | | | 13,834 |
| | |
Deferred tax liabilities: | | | | | | |
Depreciation | | | 8,929 | | | 12,374 |
Inventory | | | 815 | | | 806 |
| | | | | | |
Total | | | 9,744 | | | 13,180 |
| | |
Net deferred tax asset | | $ | 10,693 | | $ | 654 |
| | | | | | |
Management believes it is more likely than not that the Company will realize its gross deferred tax assets due to expected future income and reversal of taxable temporary differences.
NOTE J—ACCOUNTING FOR UNCERTAINTY IN INCOME TAXES
The Company adopted the provisions of FASB Interpretation No. 48, “Accounting for Uncertainty in Income Taxes—an interpretation of FASB Statement No. 109,” (FIN 48), effective May 1, 2007. On April 30, 2008, the Company had approximately $458,000 of unrecognized tax benefits accrued. Of this amount, approximately $298,000 would affect the effective tax rate if recognized. The liability for unrecognized tax benefits at April 30, 2009 was $298,000, including $193,000 which would affect the effective tax rate if recognized. It is reasonably possible that the amount of liability for unrecognized tax benefits
| | |
| AMERICAN WOODMARK CORPORATION® 2009 ANNUAL REPORT 39 |
will significantly change in the next twelve months; however, the Company is not able to reasonably estimate the amount of the change at this time, and does not expect the change to have a material impact on the Company’s financial statements.
A reconciliation of the beginning and ending amounts of gross unrecognized tax benefits is as follows:
| | | | |
(in thousands) | | GROSS UNRECOGNIZED
TAX BENEFITS | |
Balance at April 30, 2008 | | $ | 458 | |
| | | | |
Additions based on tax positions related to the current year | | | 15 | |
Additions for tax positions of prior years | | | 109 | |
Reductions for tax positions related to prior years | | | (274 | ) |
Expiration of the statute of limitations | | | (10 | ) |
| | | | |
Balance at April 30, 2009 | | $ | 298 | |
| | | | |
Consistent with prior policy, the Company classifies interest on underpayments of income tax as “Interest Expense” and classifies penalties in connection with underpayments of tax as “Other Expense.” As of April 30, 2008, the Company had liabilities of $64,000 and $167,000, for interest and penalties, respectively. As of April 30, 2009, the Company had liabilities of $55,000 and $56,000, for interest and penalties, respectively. During the year ended April 30, 2009, the Company recognized $111,000 as other income from reversal of penalties, and a reduction to interest expense of $9,000.
With minor exceptions, the Company is currently open to audit by the tax authorities for tax years ending April 30, 2006 through April 30, 2008. The Company is currently not under federal audit. The Company is under audit by the State of West Virginia for fiscal tax years 2006 and 2007.
NOTE K — COMMITMENTS AND CONTINGENCIES
LEGAL MATTERS
The Company is involved in suits and claims in the normal course of business, including product liability and general liability claims, in addition to claims pending before the Equal Employment Opportunity Commission. On at least a quarterly basis, the Company consults with its legal counsel to ascertain the reasonable likelihood that such claims may result in a loss. As required by SFAS No, 5, “Accounting for Contingencies,” (SFAS 5), the Company categorizes the various suits and claims into three categories according to their likelihood for resulting in potential loss: those that are probable (i.e., more likely than not), those that are reasonably possible, and those that are deemed to be remote. The Company accounts for these loss contingencies in accordance with SFAS 5. Where losses are deemed to be probable and estimable, accruals are made. Where losses are deemed to be reasonably possible or remote, a range of loss estimates is determined. Where no loss estimate range can be made, the Company and its counsel perform a worst-case estimate. In determining these loss range estimates, the Company considers known values of similar claims and consultation with independent counsel.
The Company believes that the aggregate range of loss stemming from the various suits and asserted and unasserted claims which were deemed to be either probable or reasonably possible were not material as of April 30, 2009.
PRODUCT WARRANTY
The Company estimates outstanding warranty costs based on the historical relationship between warranty claims and revenues. The warranty accrual is reviewed monthly to verify that it properly reflects the remaining obligation based on the anticipated expenditures over the balance of the obligation period. Adjustments are made when actual warranty claim experience differs from estimates. Warranty claims are generally made within three months of the original shipment date.
The following is a reconciliation of the Company’s warranty liability:
| | | | | | | | |
(in thousands) | | 2009 | | | 2008 | |
PRODUCT WARRANTY RESERVE | | | | | | | | |
Beginning balance | | $ | 2,428 | | | $ | 3,105 | |
Accrual for warranties | | | 8,487 | | | | 11,103 | |
Settlements | | | (8,867 | ) | | | (11,780 | ) |
| | | | | | | | |
Ending balance at fiscal year end | | $ | 2,048 | | | $ | 2,428 | |
| | | | | | | | |
| | |
| 40 AMERICAN WOODMARK CORPORATION® 2009 ANNUAL REPORT |
LEASE AGREEMENTS
The Company leases certain office buildings, manufacturing buildings, service centers, and equipment. Total rental expenses under operating leases amounted to approximately $8,207,000, $8,872,000, and $9,484,000, in fiscal years 2009, 2008, and 2007, respectively. Minimum rental commitments as of April 30, 2009, under noncancelable leases are as follows:
| | | | | | | |
FISCAL YEAR | | OPERATING
(in thousands) | | CAPITAL
(in thousands) | |
2010 | | $ | 4,495 | | $ | 662 | |
2011 | | | 3,596 | | | 662 | |
2012 | | | 2,224 | | | 662 | |
2013 | | | 1,799 | | | 662 | |
2014 | | | 1,713 | | | 662 | |
2015 (and thereafter) | | | 4,350 | | | 6,789 | |
| | | | | | | |
| | $ | 18,177 | | $ | 10,099 | |
| | | | | | | |
Less amounts representing interest (2%) | | | | | | (1,403 | ) |
| | | | | | | |
Total obligations under capital leases | | | | | $ | 8,696 | |
| | | | | | | |
RELATED PARTIES
During fiscal 1985, prior to becoming a publicly held corporation, the Company entered into an agreement with a partnership formed by certain former executive officers, including one current member of the Board of Directors, of the Company to lease an office building constructed and owned by the partnership. The Company has subsequently renewed this lease in accordance with company policy and procedures which includes approval by the Board of Directors. As of April 30, 2009, the Company is in the fourth year of the latest five-year renewal period. Under this agreement, rental expense was $454,000, $445,000, and $437,000, in fiscal years 2009, 2008, and 2007, respectively. Rent during the remaining term of approximately $454,000 annually (included in the preceding table) is subject to adjustment based upon changes in the Consumer Price Index.
NOTE L — CREDIT CONCENTRATION
Credit is extended to customers based on an evaluation of the customer’s financial condition and generally collateral is not required. The Company’s customers operate in the new home construction and home remodeling markets.
The Company maintains an allowance for bad debt based upon management’s evaluation and judgment of potential net loss. The allowance is estimated based upon historical experience, the effects of current developments and economic conditions, and of customers’ current and anticipated financial condition. Estimates and assumptions are periodically reviewed and updated. Any resulting adjustments to the allowance are reflected in current operating results.
At April 30, 2009, the Company’s two largest customers, Customers A and B represented 33.5% and 34.8% of the Company’s gross customer receivables, respectively. At April 30, 2008, Customers A and B represented 20.9% and 39.7% of the Company’s gross customer receivables, respectively.
The following table summarizes the percentage of sales to the Company’s two largest customers for the last three fiscal years:
| | | | | | |
| | | PERCENT OF ANNUAL GROSS SALES |
| | | 2009 | | 2008 | | 2007 |
Customer A | | 40.7 | | 36.6 | | 35.5 |
Customer B | | 33.7 | | 32.8 | | 30.0 |
NOTE M — RESTRUCTURING CHARGES
In the fourth quarter of fiscal 2009, the Company announced a restructuring plan that committed to the closing of two of the Company’s manufacturing plants, which are located in Berryville, Virginia, and Moorefield, West Virginia, and suspending operations in a third manufacturing plant located in Tahlequah, Oklahoma by August 2009. This initiative impacted approximately 600 employees. The continuing housing slump led to the decision to reduce production capacity. These initiatives are intended to increase the Company’s utilization rates and decrease overhead costs within the Company’s manufacturing operations. In addition to these initiatives, the Company made other staffing reductions during the fourth quarter of fiscal 2009. The Company expects to incur total pre-tax exit costs of $16.7 million related
| | |
| AMERICAN WOODMARK CORPORATION® 2009 ANNUAL REPORT 41 |
to this shut-down initiative and staffing reductions, including severance and separation costs of $8.4 million, pension curtailments of $0.1 million, and $8.2 million for equipment, inventory, and facilities-related expenses.
During fiscal 2009, the Company recognized $5.7 million of the severance and separation costs and $0.1 million of pension curtailments pertaining to the aforementioned plant closure initiative and staffing reductions. In addition, the Company also recognized a charge of $0.5 million relating to equipment, $0.1 million facilities-related expenses, and $3.3 million relating to inventory at the facilities that were closed. The total costs provided during fiscal 2009 aggregated $9.7 million and are recognized in restructuring charges. The Company expects to incur most of the remaining costs related to the closure of the plants during the first half of fiscal 2010.
A reserve for restructuring charges in the amount of $5.1 million is included in the Company’s consolidated balance sheet as of April 30, 2009 which relates to employee termination costs.
Below is the summary of the restructuring reserve balance as of April 30, 2009:
| | | | |
2009 RESTRUCTURING PLAN | | | |
Restructuring reserve balance as of April 30, 2008 | | $ | — | |
Additions | | | 5,689 | |
Payments | | | (549 | ) |
| | | | |
Reserve balance as of April 30, 2009 | | $ | 5,140 | |
| | | | |
In fiscal 2008, the Company closed its Ham Lake, Minnesota plant and made headcount reductions across its remaining manufacturing plants. During fiscal 2008, the Company recognized $1.5 million for severance and separation costs, equipment, inventory and facilities related expenses in cost of sales and distribution. During fiscal 2009, the Company recognized an additional $0.4 million of equipment and facilities-related expenses in cost of sales and distribution.
The Minnesota plant is being marketed for sale by the Company and the plant’s net book value of $1.4 million, which the Company believes is fully recoverable, is included in Other Assets at April 30, 2009 and 2008.
NOTE N—QUARTERLY FINANCIAL DATA (UNAUDITED)
| | | | | | | | | | | | | | | |
FISCAL 2009 | | 7/31/08 | | 10/31/08 | | | 1/31/09 | | | 4/30/09 | |
| (in thousands, except share amounts) | | | | | | | | | | | |
| | | | |
Net sales | | $ | 139,153 | | $ | 134,939 | | | $ | 131,153 | | | $ | 140,689 | |
Gross profit | | | 22,060 | | | 19,468 | | | | 20,385 | | | | 27,577 | |
Income (loss) before income taxes | | | 211 | | | (761 | ) | | | (336 | ) | | | (5,265 | ) |
Net income (loss) | | | 156 | | | (481 | ) | | | 23 | | | | (2,932 | ) |
Earnings (loss) per share | | | | | | | | | | | | | | | |
Basic | | $ | 0.01 | | $ | (0.03 | ) | | $ | — | | | $ | (0.21 | ) |
Diluted | | $ | 0.01 | | $ | (0.03 | ) | | $ | — | | | $ | (0.21 | ) |
| | | | |
FISCAL 2008 | | 7/31/07 | | 10/31/07 | | | 1/31/08 | | | 4/30/08 | |
| (in thousands, except share amounts) | | | | | | | | | | | |
| | | | |
Net sales | | $ | 166,056 | | $ | 160,231 | | | $ | 132,837 | | | $ | 143,302 | |
Gross profit | | | 34,309 | | | 27,709 | | | | 17,712 | | | | 23,397 | |
Income (loss) before income taxes | | | 7,935 | | | 1,674 | | | | (4,413 | ) | | | 489 | |
Net income | | | 5,104 | | | 1,152 | | | | (2,021 | ) | | | 36 | |
Earnings (loss) per share | | | | | | | | | | | | | | | |
Basic | | $ | 0.34 | | $ | 0.08 | | | $ | (0.14 | ) | | $ | — | |
Diluted | | $ | 0.34 | | $ | 0.08 | | | $ | (0.14 | ) | | $ | — | |
| | |
| 42 AMERICAN WOODMARK CORPORATION® 2009 ANNUAL REPORT |
report of independent registered public
accounting firm
THE BOARD OF DIRECTORS AND SHAREHOLDERS AMERICAN WOODMARK CORPORATION:
We have audited the accompanying consolidated balance sheets of American Woodmark Corporation (the Company), as of April 30, 2009 and 2008, and the related consolidated statements of operations, shareholders’ equity and comprehensive income (loss), and cash flows for each of the years in the three-year period ended April 30, 2009. These consolidated financial statements are the responsibility of the Company’s management. Our responsibility is to express an opinion on these consolidated financial statements based on our audits.
We conducted our audits in accordance with the standards of the Public Company Accounting Oversight Board (United States). Those standards require that we plan and perform the audit to obtain reasonable assurance about whether the financial statements are free of material misstatement. An audit includes examining, on a test basis, evidence supporting the amounts and disclosures in the financial statements. An audit also includes assessing the accounting principles used and significant estimates made by management, as well as evaluating the overall financial statement presentation. We believe that our audits provide a reasonable basis for our opinion.
In our opinion, the consolidated financial statements referred to above present fairly, in all material respects the financial position of American Woodmark Corporation as of April 30, 2009 and 2008, and the results of their operations and their cash flows for each of the years in the three-year period ended April 30, 2009, in conformity with U.S. generally accepted accounting principles.
As discussed in Note A to the consolidated financial statements, the Company adopted Statement of Financial Accounting Standards No. 158 “Employers’ Accounting for Defined Benefit Pension and Other Postretirement Plans,” as of April 30, 2007. Also, as discussed in Note J to the consolidated financial statements, effective May 1, 2007, the Company adopted Financial Accounting Standards Board (FASB) Interpretation No. 48, “Accounting for Uncertainty in Income Taxes—an interpretation of FASB Statement No. 109.”
We also have audited, in accordance with the standards of the Public Company Accounting Oversight Board (United States), the Company’s internal control over financial reporting as of April 30, 2009, based on criteria established in Internal Control—Integrated Framework issued by the Committee of Sponsoring Organizations of the Treadway Commission (COSO), and our report dated June 25, 2009 expressed an unqualified opinion on the effectiveness of the Company’s internal control over financial reporting.
|
|
| Roanoke, Virginia |
| June 25, 2009 |
| | |
| AMERICAN WOODMARK CORPORATION® 2009 ANNUAL REPORT 43 |
management’s report
MANAGEMENT’S REPORT ON INTERNAL CONTROL OVER FINANCIAL REPORTING
Management has responsibility for establishing and maintaining adequate internal control over financial reporting. Internal control over financial reporting is a process designed to provide reasonable assurance regarding the reliability of financial reporting and the preparation of financial statements for external reporting purposes in accordance with U.S. generally accepted accounting principles. Because of its inherent limitations, internal control over financial reporting may not prevent or detect misstatements. Management has assessed the effectiveness of the Company’s internal control over financial reporting as of April 30, 2009. In making its assessment, Management has utilized the criteria set forth by the Committee of Sponsoring Organizations of the Treadway Commission (COSO) in Internal Control–Integrated Framework. Management concluded that based on its assessment, American Woodmark Corporation’s internal control over financial reporting was effective as of April 30, 2009. The Company’s internal control over financial reporting as of April 30, 2009, has been audited by KPMG LLP, an independent registered public accounting firm, as stated in their report, which appears in this Annual Report to Shareholders.
|
 |
Kent B. Guichard |
| President and Chief Executive Officer |
|
 |
Jonathan H. Wolk |
| Vice President and Chief Financial Officer |
| | |
| 44 AMERICAN WOODMARK CORPORATION® 2009 ANNUAL REPORT |
report of independent registered public accounting firm
THE BOARD OF DIRECTORS AND SHAREHOLDERS AMERICAN WOODMARK CORPORATION:
We have audited American Woodmark Corporation’s (the Company’s) internal control over financial reporting as of April 30, 2009, based on criteria established in Internal Control–Integrated Framework, issued by the Committee of Sponsoring Organizations of the Treadway Commission (COSO). The Company’s management is responsible for maintaining effective internal control over financial reporting and for its assessment of the effectiveness of internal control over financial reporting, included in the accompanying Management’s Report on Internal Control over Financial Reporting. Our responsibility is to express an opinion on the Company’s internal control over financial reporting based on our audit.
We conducted our audit in accordance with the standards of the Public Company Accounting Oversight Board (United States). Those standards require that we plan and perform the audit to obtain reasonable assurance about whether effective internal control over financial reporting was maintained in all material respects. Our audit included obtaining an understanding of internal control over financial reporting, assessing the risk that a material weakness exists, and testing and evaluating the design and operating effectiveness of internal control based on the assessed risk. Our audit also included performing such other procedures as we considered necessary in the circumstances. We believe that our audit provides a reasonable basis for our opinion.
A company’s internal control over financial reporting is a process designed to provide reasonable assurance regarding the reliability of financial reporting and the preparation of financial statements for external purposes in accordance with generally accepted accounting principles. A company’s internal control over financial reporting includes those policies and procedures that (1) pertain to the maintenance of records that, in reasonable detail, accurately and fairly reflect the transactions and dispositions of the assets of the company; (2) provide reasonable assurance that transactions are recorded as necessary to permit preparation of financial statements in accordance with generally accepted accounting principles, and that receipts and expenditures of the company are being made only in accordance with authorizations of management and directors of the company; and (3) provide reasonable assurance regarding prevention or timely detection of unauthorized acquisition, use, or disposition of the company’s assets that could have a material effect on the financial statements.
Because of its inherent limitations, internal control over financial reporting may not prevent or detect misstatements. Also, projections of any evaluation of effectiveness to future periods are subject to the risk that controls may become inadequate because of changes in conditions, or that the degree of compliance with the policies or procedures may deteriorate.
In our opinion, the Company maintained, in all material respects, effective internal control over financial reporting as of April 30, 2009, based on criteria established in Internal Control–Integrated Framework issued by the Committee of Sponsoring Organizations of the Treadway Commission.
We also have audited, in accordance with the standards of the Public Company Accounting Oversight Board (United States), the consolidated balance sheets of the Company as of April 30, 2009 and 2008, and the related consolidated statements of operations, shareholders’ equity and comprehensive income (loss), and cash flows for each of the years in the three-year period ended April 30, 2009, and our report dated June 25, 2009 expressed an unqualified opinion on those consolidated financial statements.
|
 |
| Roanoke, Virginia |
| June 25, 2009 |
| | |
| AMERICAN WOODMARK CORPORATION® 2009 ANNUAL REPORT 45 |
stock performance graph
Set forth below is a graph comparing the five-year cumulative total shareholder return, including reinvestment of dividends, from investing $100 on May 1, 2004 through April 30, 2009 in American Woodmark Corporation common stock, the Russell 2000 Index, and the S&P Household Durables Index:
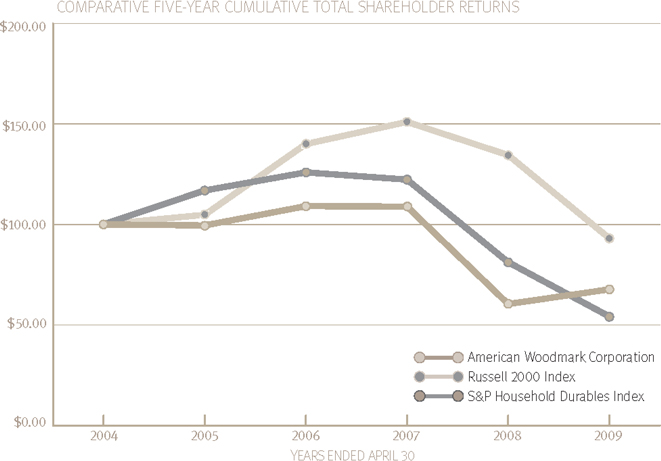
| | |
| 46 AMERICAN WOODMARK CORPORATION® 2009 ANNUAL REPORT |
| | | | |
 ] ] | | DIRECTORS AND EXECUTIVE OFFICERS William F. Brandt, Jr. Director; Former Chairman and Chief Executive Officer Andrew B. Cogan Director; Member of the Compensation Committee Chief Executive Officer of Knoll, Inc. Martha M. Dally Director; Chair of the Nominating and Governance Committee, and Member of the Compensation Committee Retired Vice President Customer Development of Sara Lee Corporation James G. Davis, Jr. Director; Member of the Audit Committee President and Chief Executive Officer of James G. Davis Construction Corporation S. Cary Dunston Senior Vice President, Manufacturing and Logistics James J. Gosa Director; Chairman and former Chief Executive Officer Kent B. Guichard Director; President and Chief Executive Officer Daniel T. Hendrix Director; Chairman of the Compensation Committee President and Chief Executive Officer of Interface, Inc. Kent J. Hussey Director; Member of the Audit Committee Chief Executive Officer of Spectrum Brands, Inc. G. Thomas McKane Director; Member of the Audit Committee and the Nominating and Governance Committee Retired Chairman of A.M. Castle & Co. Carol B. Moerdyk Director; Chairman of the Audit Committee, and Member of the Nominating and Governance Committee Retired Senior Vice President, International, OfficeMax Incorporated Jonathan H. Wolk Vice President and Chief Financial Officer; Corporate Secretary | | CORPORATE INFORMATION ANNUAL MEETING The Annual Meeting of Shareholders of American Woodmark Corporation will be held on August 27, 2009, at 9:00 a.m. at the Holiday Inn, 333 Front Royal Pike in Winchester, Virginia. ANNUAL REPORT ON FORM 10-K A copy of the Company’s Annual Report on Form 10-K for the fiscal year ended April 30, 2009, may be obtained free of charge on the Company’s Web site at www.americanwoodmark.com or by writing: Glenn Eanes Vice President & Treasurer American Woodmark Corporation PO Box 1980 Winchester, VA 22604-8090 CORPORATE HEADQUARTERS American Woodmark Corporation 3102 Shawnee Drive Winchester, VA 22601-4208 (540) 665-9100 MAILING ADDRESS PO Box 1980 Winchester, VA 22604-8090 TRANSFER AGENT Registrar and Transfer Company Investor Relations (800) 368-5948 SHAREHOLDER INQUIRES Investor Relations American Woodmark Corporation 3102 Shawnee Drive Winchester, VA 22601-4208 (540) 665-9100 www.americanwoodmark.com |
| | American Woodmark™ is a trademark of American Woodmark Corporation.® Printed in U.S.A. ©2009 American Woodmark Corporation®  Printed on recycled paper Printed on recycled paper
| | |
