UNITED STATES
SECURITIES AND EXCHANGE COMMISSION
Washington, D.C. 20549
FORM N-CSR
CERTIFIED SHAREHOLDER REPORT OF REGISTERED
MANAGEMENT INVESTMENT COMPANIES
Investment Company Act File Number 811-04704
Sims Total Return Fund, Inc.
225 East Mason Street, Suite 802
Milwaukee, WI 53202
(Address of principal executive offices)
David C. Sims, President
Sims Capital Management LLC
225 East Mason Street, Suite 802
Milwaukee, WI 53202
(Name and address of agent for service)
Registrant's telephone number, including area code: (414) 765-1107
Date of fiscal year end: June 30
Date of reporting period: December 31, 2017
Item 1. Reports to Stockholders
The following is a copy of the report transmitted to shareholders pursuant to Rule 30e-1 under the Investment Company Act of 1940 (17 CFR 270.30e-1)

SEMI-ANNUAL REPORT
Sims Total Return Fund
December 31, 2017
(Unaudited)
|
SIMS TOTAL RETURN FUND
|
Table of Contents | |
| |
Message to Shareholders | 2 |
Graphical Illustration | 3 |
Portfolio of Investments | 4 |
Statement of Assets and Liabilities | 5 |
Statement of Operations | 6 |
Statements of Changes in Net Assets | 7 |
Financial Highlights | 8 |
Notes to Financial Statements | 9 |
Expense Example | 12 |
Additional Information | 13 |
SIMS TOTAL RETURN FUND MESSAGE TO SHAREHOLDERS |
Fellow Shareholders,
The S&P 500 Index* (total return) rose 11.42% during the last six months of 2017, while our Fund appreciated 4.96%. During the second half of 2017, we remained cautious about the stock market valuations and held a sizeable position in cash. In a rising market, holding cash is detrimental to the Fund’s returns. However, so is overpaying for investments. We are trying to balance the benefit from the rising market against the risk that we are overpaying for investments.
The recent US Federal Tax change and the strengthening of the United States’ economy give us more confidence that the growth we’ve seen in recent years is sustainable. Even so, prices for stocks remain elevated when cast against a long-term backdrop.
We have been managing the Fund for about twenty months, slowly recasting the portfolio in our investment philosophy — investing in companies with high margins and returns on capital which operate in industries where most companies have high margins and returns on capital. Basically, we seek attractively-priced remarkable companies which face limited price competition for their products, which would erode the businesses long-term. Clearly, no business operates without competition, but we seek to avoid it whenever possible.
The Cabela’s, Inc shares we held mid-2017 were bought out in the acquisition that closed in September. We continued to hold a large position in Colgate-Palmolive Co, which is the number one seller of toothpaste worldwide. As a consumable product where the brand name carries value, Colgate-Palmolive is a great company in a nice industry. We sold the T. Rowe Price in the Fund since the mid-2017; while we continue to admire the company, we decided to sell the shares at fairly attractive prices rather than continue to hold and risk a share price decline.
As always, we love hearing from our shareholders. However, we cannot comment on an undisclosed purchase or sales that the Fund has made nor can we discuss contemplated transactions. With that caveat in mind, we enjoy discussing investing and hearing from fellow shareholders.
|
|
Luke E. Sims | David C. Sims |
Email: luke@simscapital.com | Email: dave@simscapital.com |
414/530-5680 | 414/765-1107 |


February 22, 2018
* | The S&P® Index is an unmanaged but commonly used measure of common stock total return performance. The Fund’s total returns include operating expenses such as transaction costs and advisory fees which reduce total returns while the total returns of the Index do not include such costs. One cannot invest in an index. |
Opinions expressed are subject to change at any time, are not guaranteed and should not be considered investment advice.
Mutual fund investing involves risk. Principal loss is possible. Investments in mid-cap companies involve additional risks such as limited liquidity and greater volatility.
Fund holding and allocation are subject to change at any time and should not be a recommendation to buy or sell any security. Please refer to the Portfolio of Investments for a complete list of Fund holdings.
Must be preceded or accompanied by a prospectus.
The Sims Total Return Fund is distributed by Quasar Distributors, LLC.
2
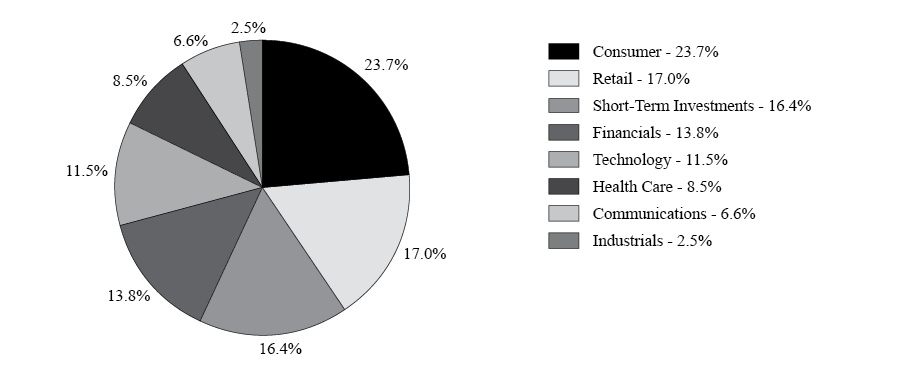
SIMS TOTAL RETURN FUND GRAPHICAL ILLUSTRATION |
The following chart provides a visual breakdown of the Fund by the industry sectors that the underlying securities represent as a percentage of the total investments.
Summary of Investments by Sector
Top Ten Equity Holdings
Security | Percent of |
Colgate-Palmolive Co. | 19.1% |
Automatic Data Processing, Inc. | 6.1% |
eBay, Inc. | 5.9% |
Diamond Hill Investment Group, Inc. | 5.4% |
Paychex, Inc. | 5.3% |
Abbott Laboratories | 5.2% |
White Mountains Insurance Group Ltd. | 4.9% |
Kraft Heinz Co. | 4.6% |
Starbucks Corp. | 4.5% |
Verizon Communications, Inc. | 4.1% |
Total | 65.1% |
3
SIMS TOTAL RETURN FUND PORTFOLIO OF INVESTMENTS |
| Shares | Fair Value | |||||||
| COMMON STOCKS (83.7%) | ||||||||
| COMMUNICATIONS (6.6%) | ||||||||
| Telecommunications (6.6%) | ||||||||
| 5,000 | Cisco Systems, Inc. | $ | 191,500 | |||||
| 6,000 | Verizon Communications, Inc. | 317,580 | ||||||
| Total Communications | 509,080 | |||||||
| CONSUMER (23.7%) | ||||||||
| Cosmetics/Personal Care (19.1%) | ||||||||
| 19,400 | Colgate-Palmolive Co. | 1,463,730 | ||||||
| Food (4.6%) | ||||||||
| 4,500 | Kraft Heinz Co. | 349,920 | ||||||
| Total Consumer | 1,813,650 | |||||||
| FINANCIALS (13.8%) | ||||||||
| Banks (3.5%) | ||||||||
| 5,000 | U.S. Bancorp | 267,900 | ||||||
| Diversified Financial Services (5.4%) | ||||||||
| 2,000 | Diamond Hill Investment Group, Inc. | 413,320 | ||||||
| Insurance (4.9%) | ||||||||
| 444 | White Mountains Insurance Group Ltd. | 377,968 | ||||||
| Total Financials | 1,059,188 | |||||||
| HEALTH CARE (8.5%) | ||||||||
| Healthcare-Products (5.2%) | ||||||||
| 7,000 | Abbott Laboratories | 399,490 | ||||||
| Pharmaceuticals (3.3%) | ||||||||
| 7,000 | Pfizer, Inc. | 253,540 | ||||||
| Total Health Care | 653,030 | |||||||
| INDUSTRIALS (2.5%) | ||||||||
| Miscellaneous Manufacturing (2.5%) | ||||||||
| 11,000 | General Electric Co. | 191,950 | ||||||
| RETAIL (17.1%) | ||||||||
| Auto Parts (6.7%) | ||||||||
| 375 | AutoZone, Inc.* | 266,764 | ||||||
| 1,000 | O’Reilly Automotive, Inc.* | 240,540 | ||||||
| 507,304 | ||||||||
| Internet (5.9%) | ||||||||
| 12,000 | eBay, Inc.* | 452,880 | ||||||
| Restaurant (4.5%) | ||||||||
| 6,000 | Starbucks Corp. | 344,580 | ||||||
| Total Retail | 1,304,764 | |||||||
| TECHNOLOGY (11.5%) | ||||||||
| Software (11.5%) | ||||||||
| 4,000 | Automatic Data Processing, Inc. | 468,760 | ||||||
| 6,000 | Paychex, Inc. | 408,480 | ||||||
| Total Technology | 877,240 | |||||||
| Total Common Stocks | ||||||||
| (Cost $5,329,593) | 6,408,902 | |||||||
| SHORT-TERM INVESTMENTS (16.4%) | ||||||||
| Money Market Funds (16.4%) | ||||||||
| 1,252,479 | First American Treasury Obligations Fund - Institutional Class, 1.170% | 1,252,479 | ||||||
| Total Short-Term Investments | ||||||||
| (Cost $1,252,479) | 1,252,479 | |||||||
| TOTAL INVESTMENTS (100.1%) | ||||||||
| (Cost $6,582,072) | 7,661,381 | |||||||
| Liabilities in excess of Other Assets (-0.1%) | (10,910 | ) | ||||||
| NET ASSETS (100.0%) | $ | 7,650,471 | ||||||
* | Non-income producing. |
See accompanying Notes to Financial Statements.
4
SIMS TOTAL RETURN FUND STATEMENT OF ASSETS AND LIABILITIES |
| Assets: | ||||
| Investments, at Fair Value (Note 2a): | ||||
| Common Stocks | $ | 6,408,902 | ||
| Short-Term Investments | 1,252,479 | |||
| Total Investments (Cost $6,582,072) | 7,661,381 | |||
| Dividends Receivable | 6,353 | |||
| Prepaid Expenses and Other Assets | 26,106 | |||
| Total Assets | 7,693,840 | |||
| Liabilities: | ||||
| Payable for Capital Stock Redeemed | 17,456 | |||
| Accrued Investment Advisory Fees (Note 3) | 4,835 | |||
| Professional Fees | 3,828 | |||
| Transfer Agent Fees | 6,783 | |||
| Administration and Accounting Fees | 6,180 | |||
| Other Fees | 4,287 | |||
| Total Liabilities | 43,369 | |||
| Net Assets | $ | 7,650,471 | ||
| Shares Outstanding | 701,195 | |||
| Net Asset Value, Offering and Redemption Price Per Share | $ | 10.91 | ||
| Net Assets Consist of: | ||||
| Capital Stock ($0.01 par value, 30,000,000 shares authorized) | $ | 6,578,565 | ||
| Distributions in Excess of Net Investment Income | (47,954 | ) | ||
| Accumulated Undistributed Net Realized Gain on Investments | 40,551 | |||
| Net Unrealized Appreciation on Investments | 1,079,309 | |||
| Net Assets | $ | 7,650,471 | ||
See accompanying Notes to Financial Statements.
5
SIMS TOTAL RETURN FUND STATEMENT OF OPERATIONS |
| Investment Income: | ||||
| Dividends | $ | 79,391 | ||
| Total Investment Income | 79,391 | |||
| Expenses: | ||||
| Administration and Accounting Fees | 36,680 | |||
| Investment Advisory Fees (Note 3) | 29,095 | |||
| Shareholder Servicing Costs | 20,417 | |||
| Professional Fees | 14,253 | |||
| Registration Fees | 8,992 | |||
| Directors | 6,050 | |||
| Insurance | 4,560 | |||
| Printing & Postage | 3,170 | |||
| Pricing | 2,659 | |||
| Custodial Fees | 1,107 | |||
| Other | 362 | |||
| Total Expenses | 127,345 | |||
| Net Investment Loss | (47,954 | ) | ||
| Net Realized Gain on Investments | 95,211 | |||
| Change in Net Unrealized Appreciation on Investments | 332,146 | |||
| Net Realized and Unrealized Gain on Investments | 427,357 | |||
| Net Increase in Net Assets From Operations | $ | 379,403 | ||
See accompanying Notes to Financial Statements.
6
SIMS TOTAL RETURN FUND STATEMENTS OF CHANGES IN NET ASSETS |
| Six Months Ended December 31, 2017 (Unaudited) | For Year Ended June 30, 2017 | |||||||
| Operations: | ||||||||
| Net Investment Loss | $ | (47,954 | ) | $ | (148,875 | ) | ||
| Net Realized Gain on Investments | 95,211 | 619,963 | ||||||
| Change in Net Unrealized Appreciation on Investments | 332,146 | (104,754 | ) | |||||
| Net Increase in Net Assets from Operations | 379,403 | 366,334 | ||||||
| Distributions to Shareholders: | ||||||||
| From Net Realized Gains | (212,327 | ) | (861,044 | ) | ||||
| Decrease in Net Assets from Distributions | (212,327 | ) | (861,044 | ) | ||||
| Fund Share Transactions: | ||||||||
| Proceeds from Shares Sold | 5,135 | 11,763 | ||||||
| Reinvested Distributions | 194,906 | 784,502 | ||||||
| Cost of Shares Redeemed | (869,925 | ) | (1,503,366 | ) | ||||
| Net Decrease in Net Assets from Fund Share Transactions | (669,884 | ) | (707,101 | ) | ||||
| Total Decrease in Net Assets | (502,808 | ) | (1,201,811 | ) | ||||
| Net Assets: | ||||||||
| Beginning of Period | 8,153,279 | 9,355,090 | ||||||
| End of Period | $ | 7,650,471 | $ | 8,153,279 | ||||
| Distributions in Excess of Net Investment Income at End of Period | $ | (47,954 | ) | $ | — | |||
| Transactions in Shares: | ||||||||
| Sales | 465 | 1,060 | ||||||
| Reinvested Distributions | 17,832 | 74,290 | ||||||
| Redemptions | (80,107 | ) | (135,476 | ) | ||||
| Net Decrease | (61,810 | ) | (60,126 | ) | ||||
See accompanying Notes to Financial Statements.
7
SIMS TOTAL RETURN FUND FINANCIAL HIGHLIGHTS |
The following table shows per share operation performance data, total investment return, ratios and supplemental data for each of the periods ended:
| Six Months Ended December 31, 2017 | Year Ended June 30, | |||||||||||||||||||||||
| (Unaudited) | 2017 | 2016 | 2015 | 2014 | 2013 | |||||||||||||||||||
| Sims Total Return Fund | ||||||||||||||||||||||||
| Per Share Operating Performance | ||||||||||||||||||||||||
| Net Asset Value, Beginning of Period | $ | 10.69 | $ | 11.37 | $ | 12.30 | $ | 14.32 | $ | 12.50 | $ | 11.23 | ||||||||||||
| Net Investment Income (Loss) | (0.07 | ) | (0.20 | ) | (0.02 | ) | 0.01 | 0.01 | 0.04 | |||||||||||||||
| Net Realized and Unrealized Gain (Loss) on Investments | 0.60 | 0.66 | (0.30 | ) | (0.99 | ) | 2.24 | 1.28 | ||||||||||||||||
| Total from Investment Operations | 0.53 | 0.46 | (0.32 | ) | (0.98 | ) | 2.25 | 1.32 | ||||||||||||||||
| Less Distributions: | ||||||||||||||||||||||||
| From Net Investment Income | — | — | (0.02 | ) | — | (0.06 | ) | (0.05 | ) | |||||||||||||||
| From Net Realized Gains | (0.31 | ) | (1.14 | ) | (0.59 | ) | (1.04 | ) | (0.37 | ) | — | |||||||||||||
| Total Distributions | (0.31 | ) | (1.14 | ) | (0.61 | ) | (1.04 | ) | (0.43 | ) | (0.05 | ) | ||||||||||||
| Net Increase (Decrease) | 0.22 | (0.68 | ) | (0.93 | ) | (2.02 | ) | 1.82 | 1.27 | |||||||||||||||
| Net Asset Value, End of Period | $ | 10.91 | $ | 10.69 | $ | 11.37 | $ | 12.30 | $ | 14.32 | $ | 12.50 | ||||||||||||
| Total Investment Return | 4.95 | %* | 4.13 | % | (2.36 | )% | (6.76 | )% | 18.36 | % | 11.80 | % | ||||||||||||
| Ratios and Supplemental Data | ||||||||||||||||||||||||
| Net Assets, End of Period (in thousands) | $ | 7,650 | $ | 8,153 | $ | 9,355 | $ | 11,182 | $ | 17,909 | $ | 15,955 | ||||||||||||
| Ratio of Expenses to Average Net Assets: | ||||||||||||||||||||||||
| Net of Waivers, Reimbursements and Recoupments*** | 3.24 | %** | 2.80 | % | 2.14 | % | 2.00 | % | 1.98 | % | 2.00 | % | ||||||||||||
| Before Waivers, Reimbursements and Recoupments | 3.24 | %** | 2.80 | % | 2.89 | % | 2.18 | % | 1.92 | % | 1.99 | % | ||||||||||||
| Ratio of Net Investment Income (Loss) to Average Net Assets: | ||||||||||||||||||||||||
| Net of Waivers, Reimbursements and Recoupments*** | (1.22 | )%** | (1.69 | )% | (0.15 | )% | 0.07 | % | 0.11 | % | 0.31 | % | ||||||||||||
| Before Waivers, Reimbursements and Recoupments | (1.22 | )%** | (1.69 | )% | (0.90 | )% | (0.11 | )% | 0.17 | % | 0.32 | % | ||||||||||||
| Portfolio Turnover | 29.5 | %* | 165.1 | % | 85.9 | % | 17.2 | % | 14.0 | % | 38.0 | % | ||||||||||||
| * | Not annualized |
| ** | Annualized |
| *** | Effective April 23, 2016, the expense cap of 2.00% was discontinued. |
See accompanying Notes to Financial Statements.
8
SIMS TOTAL RETURN FUND NOTES TO FINANCIAL STATEMENTS |
1. | Organization |
Sims Total Return Fund, Inc. (the “Company”) is an open-end, diversified management investment company registered under the Investment Company Act of 1940, as amended. The Company is a Wisconsin corporation. The Company began operations on September 15, 1986. Sims Total Return Fund, the only series of the Company, is hereinafter referred to as the “Fund”. The investment objective of the Fund is to seek total return.
2. | Significant Accounting Policies |
The Fund is an investment company and follows the accounting and reporting guidance under Financial Accounting Standards Board (“FASB”) Accounting Standards Codification (“ASC”) Topic 946, Financial Services – Investment Companies. The following is a summary of significant accounting policies followed by the Fund.
a. | Securities listed on a national securities exchange are valued at the last sale price. Securities that are traded on the NASDAQ National Market or the NASDAQ Small-Cap Market are valued at the NASDAQ Official Closing Price. If no sale is reported, the average of the last bid and asked prices is used. Other securities for which market quotations are readily available are valued at the average of the latest bid and asked prices. Debt securities (other than short-term instruments) are valued at prices furnished by a national pricing service, subject to review by the Adviser and determination of the appropriate price whenever a furnished price is significantly different from the previous day’s furnished price. Other assets and securities for which no quotations are readily available are valued at fair value as determined in good faith by the Board of Directors. Money market mutual funds are normally priced at net asset value based on the liquidity and transparency of the market. |
Accounting principles generally accepted in the United States of America (“GAAP”) defines fair value, establishes a framework for measuring fair value and expands disclosure about fair value measurements. It also provides guidance on determining when there has been a significant decrease in the volume and level of activity for an asset or liability, when a transaction is not orderly and how that information must be incorporated into a fair value measurement.
Under GAAP, various inputs are used in determining the value of the Fund’s investments. These inputs are summarized into three broad levels and described below:
Level 1 – | quoted prices for active markets for identical securities. An active market for the security is a market in which transactions occur with sufficient frequency and volume to provide pricing information on an ongoing basis. |
Level 2 – | other significant observable inputs (including quoted prices for similar securities, interest rates, prepayment speeds, credit risk, etc.). |
Level 3 – | significant unobservable inputs, including the Fund’s own assumptions in determining the fair value of investments. |
The inputs or methodology used for valuing securities are not necessarily an indication of the risk associated with investing in those securities. The following is a summary of the inputs used to value the Fund’s investments as of December 31, 2017:
| Level 1 | Level 2 | Level 3 | Total | |||||||||||||
| Common Stocks* | $ | 6,408,902 | $ | — | $ | — | $ | 6,408,902 | ||||||||
| Short-Term Investments | 1,252,479 | — | — | 1,252,479 | ||||||||||||
| Total | $ | 7,661,381 | $ | — | $ | — | $ | 7,661,381 | ||||||||
| * | All sub-categories within common stocks as detailed in the Portfolio of Investments represent Level 1 evaluation status. |
The Fund is required to disclose details of transfers in and out of Level 1 and Level 2 measurements and Level 2 and Level 3 measurements and the reasons for the transfers. For the six months ended December 31, 2017, there were no transfers in and out of Level 1, Level 2 and Level 3. The Fund did not hold any Level 3 securities during the six months ended December 31, 2017. It is the Fund’s policy to recognize transfers into and out of all Levels at the end of the reporting period.
9
SIMS TOTAL RETURN FUND NOTES TO FINANCIAL STATEMENTS (Continued) |
b. | Security transactions are recorded on the trade date. Dividend income is recorded on the ex-dividend date. Interest income is recorded as earned, and includes amortization of premiums and discounts. Securities gains and losses are determined on the basis of identified cost, which is the same basis used for federal income tax purposes. Withholding taxes on foreign dividends have been provided for in accordance with the Fund’s understanding of the country’s tax codes and regulations. |
c. | The Fund intends to comply with the requirements of Subchapter M of the Internal Revenue Code (the “Code”) applicable to regulated investment companies and to distribute substantially all of its net investment income and any net realized gains to its shareholders. Therefore, no provision is made for federal income or excise taxes. |
GAAP requires an evaluation of tax positions taken (or expected to be taken) in the course of preparing a Fund’s tax returns to determine whether these positions meet a “more-likely-than-not” standard that, based on the technical merits, have a more than fifty percent likelihood of being sustained by a taxing authority upon examination. A tax position that meets the “more likely-than-not” recognition threshold is measured to determine the amount of benefit to recognize in the financial statements. The Fund recognizes interest and penalties, if any, related to unrecognized tax benefits as income tax expense in the Statement of Operations.
GAAP requires management of the Fund to analyze all open tax years 2013-2016, as defined by IRS statute of limitations for all major jurisdictions, including federal tax authorities and certain state tax authorities. As of and during the six months ended December 31, 2017, the Fund does not have a liability for any unrecognized tax benefits. The Fund has no examination in progress and is not aware of any tax positions for which it is reasonably possible that the total amounts of unrecognized tax benefits will significantly change in the next twelve months.
d. | Distributions to shareholders, which are determined in accordance with income tax regulations, are recorded on the ex-dividend date. The character of distributions made during the year from net investment income or net realized gain may differ from the characterization for federal income tax purposes due to differences in the recognition of income, expense and gain/(loss) items for financial statement and tax purposes. Where appropriate, reclassifications between net asset accounts are made for such differences that are permanent in nature. |
The tax character of distributions paid during the fiscal years ended June 30, 2017 and 2016 were as follows:
| 2017 | 2016 | |||||||
| Distributions paid from: | ||||||||
| Ordinary income | $ | 300,505 | $ | 52,902 | ||||
| Net long term capital gains | 560,539 | 442,594 | ||||||
| Total distributions paid | $ | 861,044 | $ | 495,496 | ||||
e. | The preparation of financial statements in conformity with GAAP requires management to make estimates and assumptions that affect the reported amounts of assets and liabilities and disclosure of contingent assets and liabilities at the date of the financial statements and the reported amounts of increases and decreases in net assets from operations during the reporting period. Actual results could differ from those estimates. |
3. | Investment Advisory Fees and Management Agreements |
The Fund has an agreement with Sims Capital Management LLC (the “Adviser”) to serve as investment adviser. Under the terms of the agreement, the Fund pays the Adviser an investment advisory fee, payable monthly, based on the average net asset value of the Fund determined as of the close of each business day of the month at the annual rate of 0.74% of the average daily net asset value of the Fund. As noted in the Fund’s June 30, 2016, annual report, the Board of Directors, including all of the Independent Directors, reviewed the agreement and found it to be reasonable, fair and in the best interests of the Fund and the Fund’s shareholders. The agreement went into effect on April 23, 2016 and shall continue in effect for two years from that date. The agreement will then come up for renewal on an annual basis.
10
SIMS TOTAL RETURN FUND NOTES TO FINANCIAL STATEMENTS (Continued) |
4. | Purchases and Sales of Securities |
Total purchases and sales of securities, other than short-term investments, for the Fund for the six months ended December 31, 2017, were as follows:
Purchases | $ | 1,793,891 | |||
Sales | 1,892,487 |
5. | Tax Information |
At June 30, 2017, gross unrealized appreciation and depreciation of investments, based on cost for federal income tax purposes was as follows:
| Cost of investments | $ | 7,460,173 | ||
| Gross unrealized appreciation | 778,494 | |||
| Gross unrealized depreciation | (31,331 | ) | ||
| Net unrealized appreciation on investments | $ | 747,163 |
As of June 30, 2017, the components of accumulated earnings/(deficit) on a tax basis were as follows:
| Undistributed ordinary income | $ | 35,322 | ||
| Undistributed long-term capital gains | 122,345 | |||
| Accumulated earnings | 157,667 | |||
| Net unrealized appreciation | 747,163 | |||
| Total accumulated earnings | $ | 904,830 |
6. | Officers and Trustees |
Certain officers of the Fund are affiliated with the Adviser. The independent directors’ remuneration for the Fund totaled $11,000 for the fiscal year ended June 30, 2017. No Fund officer receives compensation in his capacity as an officer of the Fund.
11
SIMS TOTAL RETURN FUND EXPENSE EXAMPLE |
As a shareholder of the Sims Total Return Fund, you incur ongoing costs, including management fees and other Fund expenses. If you invest through a financial intermediary, you may also incur additional costs such as a transaction fee charged on the purchase or sale of the Fund or an asset-based management fee. This Example is intended to help you understand your ongoing costs (in dollars) of investing in the Fund and to compare these costs with the ongoing costs of investing in other mutual funds.
The Example is based on an investment of $1,000 invested at the beginning of the period and held for the entire period from July 1, 2017 to December 31, 2017.
Actual Expenses
The first line of the table below provides information about actual account values and actual expenses. You may use the information in this line, together with the amount you invested, to estimate the expenses you paid over the period. Simply divide your account value by $1,000 (for example, an $8,600 account value divided by $1,000 = 8.6), then multiply the result by the number in the first line under the heading entitled “Expenses Paid During Period” to estimate the expenses you paid on your account during the period.
Hypothetical Example for Comparison Purposes
The second line of the table below provides information about hypothetical account values and hypothetical expenses based on the Fund’s actual expense ratios and an assumed rate of return of 5% per year before expenses, which is not the Fund‘s actual return. The hypothetical account values and expenses may not be used to estimate the actual ending account balance or expenses you paid for the period. You may use this information to compare the ongoing costs of investing in the Fund and other funds. To do so, compare this 5% hypothetical example with the 5% hypothetical examples that appear in the shareholder reports of the other funds.
Please note that the expenses shown in the table are meant to highlight your ongoing costs only and do not reflect any costs that may be associated with investing in the Fund through a financial intermediary. Therefore, the second line of the table is useful in comparing the ongoing costs only, and will not help you determine the relative total costs of owning different funds. In addition, if any costs associated with investing through a financial intermediary were included, your costs would have been higher.
Beginning | Ending | Expenses | |
Actual | $1,000.00 | $1,049.50 | $16.74 |
Hypothetical (5% return before expenses) | 1,000.00 | 1,008.70 | 16.40 |
1 | Expenses are equal to the Fund’s annualized expense ratio of 3.24% for the period from July 1, 2017 through December 31, 2017, multiplied by the average account value over the period, multiplied by 184/365 (to reflect the one-half year period). |
12
SIMS TOTAL RETURN FUND ADDITIONAL INFORMATION |
Proxy Voting Policies and Procedures
For a description of the policies and procedures that the Fund uses to determine how to vote proxies relating to portfolio securities, please call 1-414-765-1107 and request a Statement of Additional Information. One will be mailed to you free of charge. The Statement of Additional Information is also available on the website of the Securities and Exchange Commission at http://www.sec.gov. Information on how the Fund voted proxies relating to portfolio securities during the twelve-month period ended June 30, 2017, will be available without charge, upon request, by calling 1-414-765-1107 or by accessing the website of the Securities and Exchange Commission.
Disclosure of Portfolio Holdings
The Fund will file its complete schedule of portfolio holdings with the Securities and Exchange Commission for the first and third quarters of each fiscal year on Form N-Q. The Form N-Q will be available on the website of the Securities and Exchange Commission at http://www.sec.gov.
13
SIMS TOTAL RETURN FUND |
INVESTMENT ADVISER
Sims Capital Management LLC
225 East Mason Street, Suite 802
Milwaukee, WI 53202-3657
1-414-765-1107
OFFICERS
Luke E. Sims, President and CEO
David C. Sims, Vice President, CFO, CCO, Treasurer and Secretary
DIRECTORS
Barry S. Arnold
Clark J. Hillery
William J. Rack
Richard L. Teigen
ADMINISTRATOR
UMB Fund Services, Inc.
235 West Galena Street
Milwaukee, Wisconsin 53212
CUSTODIAN
U.S. Bank, N.A.
1555 North RiverCenter Drive
Milwaukee, Wisconsin 53212
TRANSFER AGENT AND DIVIDEND DISBURSING AGENT
U.S. Bancorp Fund Services, LLC
615 East Michigan Street
Milwaukee, Wisconsin 53202
1-800-968-2122
INDEPENDENT REGISTERED PUBLIC ACCOUNTING FIRM
Cohen & Company, Ltd.
1350 Euclid Avenue, Suite 800
Cleveland, Ohio 44115
LEGAL COUNSEL
Foley & Lardner LLP
777 East Wisconsin Avenue
Milwaukee, Wisconsin 53202
Item 2. Code of Ethics
Not applicable to semi-annual reports.
Item 3. Audit Committee Financial Expert
Not applicable to semi-annual reports.
Item 4. Principal Accountant Fees and Services
Not applicable to semi-annual reports.
Item 5. Audit Committee of Listed Registrants
Not applicable.
Item 6. Schedule of Investments
Included as part of the report to shareholders filed under Item 1 of this Form N-CSR.
Item 7. Disclosure of Proxy Voting Policies and Procedures for Closed-End Management Investment Companies
Not applicable.
Item 8. Portfolio Managers of Closed-End Management Investment Companies
Not applicable.
Item 9. Purchase of Equity Securities of Closed-End Management Investment Company and Affiliated Purchasers
Not applicable.
Item 10. Submission of Matters to a Vote of Security Holders
Not applicable.
Item 11. Controls and Procedures
| (a) | The Principal Executive and Financial Officers concluded that the Registrant’s Disclosure Controls and Procedures are effective based on their evaluation of the Disclosure Controls and Procedures as of a date within 90 days of the filing date of this report. |
| (b) | There were no changes in Registrant’s internal control over financial reporting that occurred during the Registrant’s last fiscal half-year that have materially affected or are reasonably likely to materially affect Registrant’s internal control over financial reporting. |
Item 12. Disclosure of Securities Lending Activities for Closed-End Management Investment Companies
Not applicable to open-end management investment companies.
Item 13. Exhibits
| (a) | Code of Ethics. Not applicable for semi-annual reports. |
| (b) | Certifications required pursuant to Sections 302 and 906 of the Sarbanes-Oxley Act of 2002 are filed herewith. |
SIGNATURES
Pursuant to the requirements of the Securities Exchange Act of 1934 and the Investment Company Act of 1940, the registrant has duly caused this report to be signed on its behalf by the undersigned, thereunto duly authorized.
| Sims Total Return Fund, Inc. |
| /s/ Luke E. Sims |
Luke E. Sims
Principal Executive Officer
March 8, 2018
Pursuant to the requirements of the Securities Exchange Act of 1934 and the Investment Company Act of 1940, this report has been signed below by the following persons on behalf of the registrant and in the capacities and on the dates indicated.
| /s/ Luke E. Sims |
Luke E. Sims
Principal Executive Officer
March 8, 2018
| /s/ David C. Sims |
David C. Sims
Principal Financial Officer
March 7, 2018