NOTES TO FINANCIAL STATEMENTS
NOTE 1 - ORGANIZATION
Thompson Plumb Funds, Inc. (the “Company”) is a Wisconsin corporation registered under the Investment Company Act of 1940, as amended (the “1940 Act”), as an open-end, diversified management investment company.
The Company consists of separate mutual funds series (each, a “Fund,” and collectively, the “Funds”): Thompson Plumb Growth Fund (the “Growth Fund”) and Thompson Plumb Bond Fund (the “Bond Fund”). The assets and liabilities of each Fund are segregated and a shareholder’s interest is limited to the Fund in which the shareholder owns shares.
NOTE 2 - SIGNIFICANT ACCOUNTING POLICIES
The following is a summary of significant accounting policies followed by the Funds in the preparation of their financial statements.
SECURITY VALUATION - Each Fund’s investments are valued at their market prices (generally the last reported sales price on the exchange where the securities are primarily traded or, for Nasdaq listed securities, at their Nasdaq Official Closing Prices) or, where market quotations are not readily available or are unreliable, at fair value as determined in good faith pursuant to procedures established by the Funds’ Board of Directors (the “Funds’ Board”). Market quotations for the common stocks in which the Funds invest are nearly always readily available; however, market quotations for debt securities are often not readily available. Fair values of debt securities are typically based on valuations published by an independent pricing service, which uses various valuation methodologies such as matrix pricing and other analytical pricing models as well as market transactions and dealer quotations. Debt securities with remaining maturities of 60 days or less are valued at amortized cost basis.
When a security is “fair valued,” consideration is given to the facts and circumstances relevant to the particular situation, including a review of various factors set forth in the pricing procedures adopted by the Funds’ Board, which includes factors such as fundamental analytical data relating to the investment, nature and duration of any restrictions on disposition of the security and an evaluation of forces that influence the market in which the securities are purchased or sold. Fair value pricing is an inherently subjective process, and no single standard exists for determining fair value. Different funds could reasonably arrive at different values for the same security.
As of November 30, 2007, certain warrant securities held by the Growth Fund were fair valued and the value of these securities represented approximately 0.0014 % of the net assets of the Fund.
SECURITIES TRANSACTIONS AND INVESTMENT INCOME - Investment securities transactions are accounted for on the trade date. Gains or losses realized on sales of securities are determined by comparing the identified cost of the security lot sold with the net sales proceeds. Discounts/premiums on debt securities purchased are accreted/amortized over the life of the respective securities on the same basis for book and tax purposes. Dividend income is recorded on the ex-dividend date. Interest income is recorded as earned.
SECURITIES PURCHASED ON A WHEN-ISSUED OR DELAYED-DELIVERY BASIS - Each Fund may purchase securities on a when-issued or delayed-delivery basis. When-issued securities are securities purchased with delivery to occur at a later date at a stated price and/or yield, thereby involving the risk that the price and/or yield obtained may be more or less than those available in the market when delivery takes place. At the time a Fund makes a commitment to purchase a security on a when-issued basis, the Fund records the transaction and reflects the value of the security in determining net asset value. Each Fund designates and maintains cash and marketable securities at least equal in value to commitments for when-issued securities.
VARIABLE-RATE DEMAND NOTES - The Funds invest in short-term, variable-rate demand notes, which are unsecured instruments. The Funds may be susceptible to credit risk with respect to these instruments to the extent the issuer defaults on its payment obligation.
PERMANENT BOOK AND TAX DIFFERENCES - Generally accepted accounting principles require that permanent financial reporting and tax differences relating to shareholder distributions be reclassified in the capital accounts.
EXPENSES - Each Fund is charged for those expenses that are directly attributed to it. Expenses that are not readily identifiable to a specific Fund are generally allocated among the Funds in proportion to the relative sizes of the Funds.
USE OF ESTIMATES - The preparation of financial statements in conformity with generally accepted accounting principles requires management to make estimates and assumptions that affect the reported amounts of assets and liabilities and disclosure of contingent assets and liabilities at the date of the financial statements and the reported amounts of revenues and expenses during the reporting period. Actual results could differ from these estimates.
20
NOTES TO FINANCIAL STATEMENTS (Continued)
DISTRIBUTIONS TO SHAREHOLDERS - Distributions to shareholders from net investment income and realized gains on securities for the Growth Fund normally are declared at least annually. The Bond Fund distributions to shareholders from net investment income normally are declared on a quarterly basis, and distributions to shareholders from realized gains on securities normally are declared at least annually. Distributions are recorded on the ex-dividend date.
FEDERAL INCOME TAXES - No provision has been made for federal income taxes since the Funds have elected to be taxed as regulated investment companies and intend to distribute substantially all income to shareholders and otherwise comply with the provisions of the Internal Revenue Code applicable to regulated investment companies.
DIRECTED BROKERAGE ARRANGEMENTS - The Funds have directed brokerage arrangements with Fidelity Capital Markets, BNY Brokerage and Trade Manage Capital, Inc. Upon purchase and/or sale of the investment securities at best execution, the Funds pay brokerage commissions to Fidelity Capital Markets, BNY Brokerage and Trade Manage Capital, Inc. These commission payments generate non-refundable cumulative credits, which are available to pay certain expenses of the Funds. There were no directed brokerage credits during the fiscal year ended November 30, 2007.
LINE OF CREDIT - The Funds have established a line of credit (“LOC”) with U.S. Bank N.A. which expires November 15, 2008, used for temporary liquidity needs. The LOC is used primarily to finance redemption payments. Each of the individual Funds borrowing under the LOC are limited to either 5% of the market value of the Fund’s total assets or any explicit borrowing limits imposed by the Funds’ Board, whatever is less. As of November 30, 2007, the limits established by the Funds’ Board are: Growth Fund - $20,000,000 and Bond Fund - $1,000,000. The LOC was drawn upon during the year; however, as of November 30, 2007, there were no borrowings by the Funds outstanding under the LOC. The following table shows the average balance, average interest rate and interest expense incurred by the Funds on borrowings under the LOC for the fiscal year ended November 30, 2007.
| | | | Average | | Average | | Interest |
| Fund | | | Balance | | Interest Rate | | Expense |
| Growth Fund | | | $ | 512,142 | | | 8.150% | | | $ | 42,836 | |
| Bond Fund | | | $ | 13,885 | | | 8.250% | | | $ | 1,161 | |
GUARANTEES AND INDEMNIFICATIONS - In the normal course of business, the Funds enter into contracts with service providers that contain general indemnification clauses. The Funds’ maximum exposure under these arrangements is unknown as this would involve future claims against the Funds that have not yet occurred. Based on experience, the Funds expect the risk of loss to be remote.
FAIR VALUE MEASUREMENTS - In September 2006, the Financial Accounting Standards Board (“FASB”) issued Statement of Financial Accounting Standards (“SFAS”) No. 157, “Fair Value Measurements.” This standard establishes a single authoritative definition of fair value, sets out a framework for measuring fair value and requires additional disclosures about fair value measurements. SFAS No. 157 applies to fair value measurements already required or permitted by existing standards. SFAS No. 157 is effective for financial statements issued for fiscal years beginning after November 15, 2007 and interim periods within those fiscal years. The changes to current generally accepted accounting principles from the application of this standard relate to the definition of fair value, the methods used to measure fair value, and the expanded disclosures about fair value measurements. The Funds do not believe the adoption of SFAS No. 157 will impact the financial statement amounts; however, additional disclosures may be required about the inputs used to develop the measurements and the effect of certain of the measurements included within the Statements of Operations for the period.
ACCOUNTING FOR UNCERTAINTY IN INCOME TAXES - On July 13, 2006, the FASB released FASB Interpretation No. 48 “Accounting for Uncertainty in Income Taxes” (“FIN 48”). FIN 48 provides guidance for how uncertain tax positions should be recognized, measured, presented and disclosed in the financial statements. FIN 48 requires the evaluation of tax positions taken or expected to be taken in the course of preparing the Funds’ tax return to determine whether the tax positions are “more-likely-than-not” of being sustained by the applicable tax authority. Tax positions not deemed to meet the more-likely-than-not threshold would be recorded as a tax benefit or expense in the current year. Adoption of FIN 48 is required no later than the last business day of the first financial reporting date which occur during the fiscal year beginning after December 15, 2006 and is to be applied to all open tax years as of the effective date. As a result, the Funds must begin to incorporate FIN 48
21
NOTES TO FINANCIAL STATEMENTS (Continued)
into its NAV calculations by May 31, 2008. At this time, management is continuing to evaluate the implications of FIN 48 and does not expect the adoption of FIN 48 will have a significant impact on the net assets or results of operations of the Fund.
NOTE 3 - INVESTMENT ADVISORY AND ADMINISTRATIVE AND ACCOUNTING SERVICES AGREEMENTS AND OTHER TRANSACTIONS WITH AFFILIATES
The Investment Advisory Agreement pursuant to which Thompson Investment Management, Inc. (“TIM”) is retained by the Funds provides for compensation to TIM (computed daily and paid monthly) at the following annual rates: for the Growth Fund - 1.00% of the first $50 million of average daily net assets and 0.90% of average daily net assets in excess of $50 million; and for the Bond Fund - 0.65% of the first $50 million of average daily net assets and 0.60% of average daily net assets in excess of $50 million.
The Advisor is contractually bound to waive management fees and/or reimburse expenses incurred by the Bond Fund through March 31, 2008 so that the annual operating expenses of the Bond Fund do not exceed 0.59% of average daily net assets.
For the fiscal year ended November 30, 2007, the Advisor reimbursed expenses incurred by the Bond Fund in the amount of $241,302 so that that annual operating expenses did not exceed 0.59% of its average daily net assets.
Pursuant to an Administrative and Accounting Services Agreement, TIM maintains the Funds’ financial records in accordance with the 1940 Act, prepares all necessary financial statements of the Funds and calculates the net asset value per share of the Funds on a daily basis. As compensation for its services, each Fund pays TIM a fee computed daily and payable monthly at the annual rate of 0.15% of average daily net assets up to $30 million, 0.10% of the next $70 million of average daily net assets and 0.025% of average daily net assets in excess of $100 million, with an annual minimum fee of $30,000 per Fund. The calculations of daily net asset value are subcontracted to U.S. Bancorp Fund Services, resulting in fees paid by TIM in the amounts of $82,624 and $30,000 for the Growth Fund and Bond Fund, respectively, for the fiscal year ended November 30, 2007.
NOTE 4 - FUND SHARE TRANSACTIONS
Transactions in shares of the Funds were as follows:
| (In thousands) | | | | | | | | | | | | | | |
| | Year Ended | | Year Ended |
| | November 30, 2007 | | November 30, 2006 |
| | Shares | | Dollars | | Shares | | Dollars |
| Growth Fund | | | | | | | | | | | | | | |
| Shares sold | | 1,576 | | | $ | 77,304 | | | 2,417 | | | $ | 111,004 | |
| Shares issued in reinvestment of dividends | | 92 | | | | 4,548 | | | 121 | | | | 5,426 | |
| Shares issued in reinvestment of realized gains | | 483 | | | | 23,727 | | | 531 | | | | 23,769 | |
| Shares redeemed | | (5,705 | ) | | | (280,794 | ) | | (10,356 | ) | | | (471,540 | ) |
| Net decrease | | (3,554 | ) | | $ | (175,215 | ) | | (7,287 | ) | | $ | (331,341 | ) |
| |
| Bond Fund | | | | | | | | | | | | | | |
| Shares sold | | 2,036 | | | $ | 20,809 | | | 812 | | | $ | 8,193 | |
| Shares issued in reinvestment of dividends | | 148 | | | | 1,499 | | | 110 | | | | 1,103 | |
| Shares issued in reinvestment of realized gains | | – | | | | – | | | 26 | | | | 256 | |
| Shares redeemed | | (1,041 | ) | | | (10,639 | ) | | (779 | ) | | | (7,837 | ) |
| Net increase | | 1,143 | | | $ | 11,669 | | | 169 | | | $ | 1,715 | |
22
NOTES TO FINANCIAL STATEMENTS (Continued)
NOTE 5 - PURCHASE AND SALE OF SECURITIES
Investment transactions for the fiscal year ended November 30, 2007 were as follows:
| | Securities other than U. S. | | | | | | |
| | Government and Short-term | | | | | | |
| | Investments | | U. S. Government Securities |
| | Purchases | | Sales | | Purchases | | Sales |
| Growth Fund | | $ | 192,896,687 | | $ | 393,570,459 | | $ | – | | $ | – |
| Bond Fund | | $ | 6,012,981 | | $ | 9,647,494 | | $ | 46,784,369 | | $ | 21,652,594 |
NOTE 6 - INCOME TAX INFORMATION
At November 30, 2007, the investment cost and aggregate unrealized appreciation and depreciation on investments for federal income tax purposes were as follows:
| | | | | | | | | | | | | | | | | | Net unrealized | | Distributable | | Distributable |
| | | | | | | Unrealized | | Unrealized | | appreciation | | ordinary | | long-term |
| | Federal tax cost | | appreciation | | depreciation | | (depreciation) | | income | | capital gains |
| Growth Fund | | | $ | 520,667,504 | | | | $ | 65,543,606 | | | | $ | (50,897,398 | ) | | | | $ | 14,646,208 | | | | $ | 4,159,322 | | | | $ | 65,274,179 | |
| Bond Fund | | | $ | 61,518,166 | | | | $ | 426,016 | | | | $ | (271,727 | ) | | | | $ | 154,289 | | | | $ | 516,680 | | | | $ | – | |
The tax basis of investments for tax and financial reporting purposes differ principally due to wash sales.
The tax components of distributions paid during the fiscal year ended November 30, 2007, capital loss carryforward as of November 30, 2007 and tax basis post-October losses as of November 30, 2007, which are not recognized for tax purposes until the first day of the following fiscal year are:
| | | | | | | Long-term | | | | | | | | | | |
| | Ordinary income | | capital gains | | Net capital loss | | Post-October |
| | distributions | | distributions | | carryforward* | | losses |
| Growth Fund | | | $ | 11,295,040 | | | | $ | 18,429,147 | | | | $ | – | | | | $ | 1,096,652 | |
| Bond Fund | | | $ | 1,682,368 | | | | $ | – | | | | $ | 223,897 | | | | $ | 18,433 | |
* $90,180 expires November 30, 2014 and $133,717 expires November 30, 2015.
The tax components of distributions paid during the fiscal year ended November 30, 2006 are:
| | Ordinary | | Long-term |
| | income | | capital gains |
| | distributions | | distributions |
| Growth Fund | | | $ | 11,125,635 | | | | $ | 19,583,334 | |
| Bond Fund | | | $ | 1,226,849 | | | | $ | 281,964 | |
The following distributions were declared on December 13, 2007, payable to shareholders on December 14, 2007 (Unaudited):
| | Ordinary Income | | Long-term Capital Gains |
| | Distributions | | Distributions |
| | Amount | | Per Share | | Amount | | Per Share |
| Growth Fund | | | $ | 4,172,339 | | | | $ | 0.41 | | | | $ | 65,288,435 | | | | $ | 6.40 | |
| Bond Fund | | | $ | 728,481 | | | | $ | 0.15 | | | | $ | – | | | | $ | – | |
23
The following table presents information relating to a share of capital stock outstanding for the entire period.
| | Year Ended November 30, |
| | | 2007 | | | 2006 | | | 2005 | | | 2004 | | | 2003 |
| GROWTH FUND | | | | | | | | | | | | | | | | | | | | |
| |
| Net Asset Value, Beginning of Period | | | $49.95 | | | | $45.85 | | | | $46.03 | | | | $42.45 | | | | $37.85 | |
| Income from Investment Operations | | | | | | | | | | | | | | | | | | | | |
| Net investment income | | | 0.36 | | | | 0.35 | | | | 0.27 | | | | 0.46 | | | | 0.13 | |
| Net realized and unrealized gains (losses) | | | | | | | | | | | | | | | | | | | | |
| on investments | | | (2.49 | ) | | | 5.14 | | | | 0.54 | | | | 3.26 | | | | 4.83 | |
| Total from Investment Operations | | | (2.13 | ) | | | 5.49 | | | | 0.81 | | | | 3.72 | | | | 4.96 | |
| Less Distributions | | | | | | | | | | | | | | | | | | | | |
| Distributions from net investment income | | | (0.34 | ) | | | (0.27 | ) | | | (0.44 | ) | | | (0.14 | ) | | | (0.25 | ) |
| Distributions from net realized gains | | | (1.62 | ) | | | (1.12 | ) | | | (0.55 | ) | | | – | | | | (0.11 | ) |
| Total Distributions | | | (1.96 | ) | | | (1.39 | ) | | | (0.99 | ) | | | (0.14 | ) | | | (0.36 | ) |
| |
| Net Asset Value, End of Period | | | $45.86 | | | | $49.95 | | | | $45.85 | | | | $46.03 | | | | $42.45 | |
| |
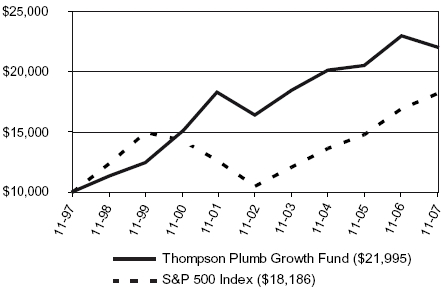
| Total Return | | | (4.52% | ) | | | 12.32% | | | | 1.76% | | | | 8.77% | | | | 13.28% | |
| |
| Ratios/Supplemental Data | | | | | | | | | | | | | | | | | | | | |
| Net assets, end of period (millions) | | $533.9 | | | $759.0 | | | $1,030.7 | | | $1,485.9 | | | $875.6 | |
| Ratios to average net assets: | | | | | | | | | | | | | | | | | | | | |
| Ratio of expenses | | | 1.13% | | | | 1.12% | | | | 1.08% | | | | 1.05% | | | | 1.07% | |
| Ratio of expenses without reimbursement† | | | 1.13% | | | | 1.12% | | | | 1.09% | | | | 1.06% | | | | 1.11% | |
| Ratio of net investment income | | | 0.62% | | | | 0.63% | | | | 0.50% | | | | 1.12% | | | | 0.47% | |
| Ratio of net investment income | | | | | | | | | | | | | | | | | | | | |
| without reimbursement† | | | 0.62% | | | | 0.63% | | | | 0.49% | | | | 1.11% | | | | 0.42% | |
| Portfolio turnover rate | | | 28.60% | | | | 17.44% | | | | 20.48% | | | | 28.54% | | | | 41.01% | |
| |
| † Before directed brokerage credits. |
See Notes to Financial Statements.
24
FINANCIAL HIGHLIGHTS (Continued) | |
| | |
The following table presents information relating to a share of capital stock outstanding for the entire period.
| | Year Ended November 30, |
| | | 2007 | | | 2006 | | | 2005 | | | 2004 | | | 2003 |
| BOND FUND | | | | | | | | | | | | | | | | | | | | |
| |
| Net Asset Value, Beginning of Period | | $10.26 | | | $10.21 | | | $10.68 | | | $10.86 | | | $10.09 | |
| Income from Investment Operations | | | | | | | | | | | | | | | | | | | | |
| Net investment income | | | 0.48 | | | | 0.44 | | | | 0.39 | | | | 0.57 | | | | 0.58 | |
| Net realized and unrealized gains (losses) | | | | | | | | | | | | | | | | | | | | |
| on investments | | | 0.08 | | | | 0.11 | | | | (0.36 | ) | | | (0.16 | ) | | | 0.77 | |
| Total from Investment Operations | | | 0.56 | | | | 0.55 | | | | 0.03 | | | | 0.41 | | | | 1.35 | |
| Less Distributions | | | | | | | | | | | | | | | | | | | | |
| Distributions from net investment income | | | (0.48 | ) | | | (0.41 | ) | | | (0.42 | ) | | | (0.59 | ) | | | (0.58 | ) |
| Distributions from net realized gains | | | – | | | | (0.09 | ) | | | (0.08 | ) | | | – | | | | – | |
| Total Distributions | | | (0.48 | ) | | | (0.50 | ) | | | (0.50 | ) | | | (0.59 | ) | | | (0.58 | ) |
| |
| Net Asset Value, End of Period | | $10.34 | | | $10.26 | | | $10.21 | | | $10.68 | | | $10.86 | |
| |
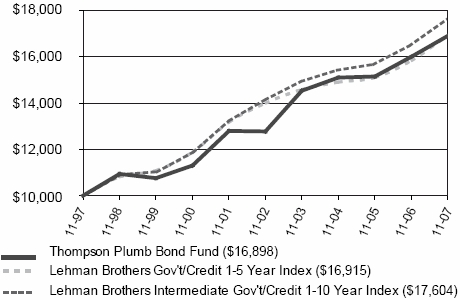
| Total Return | | | 5.64% | | | | 5.64% | | | | 0.29% | | | | 3.90% | | | | 13.75% | |
| |
| Ratios/Supplemental Data | | | | | | | | | | | | | | | | | | | | |
| Net assets, end of period (millions) | | | $44.5 | | | | $32.5 | | | | $30.6 | | | | $29.7 | | | | $41.9 | |
| Ratios to average net assets: | | | | | | | | | | | | | | | | | | | | |
| Ratio of expenses | | | 0.59% | | | | 0.72% | | | | 0.80% | | | | 0.80% | | | | 0.80% | |
| Ratio of expenses without reimbursement | | | 1.24% | | | | 1.30% | | | | 1.28% | | | | 1.20% | | | | 1.05% | |
| Ratio of net investment income | | | 4.92% | | | | 4.42% | | | | 3.80% | | | | 5.00% | | | | 5.49% | |
| Ratio of net investment income | | | | | | | | | | | | | | | | | | | | |
| without reimbursement | | | 4.26% | | | | 3.84% | | | | 3.31% | | | | 4.60% | | | | 5.24% | |
| Portfolio turnover rate | | | 85.58% | | | | 50.55% | | | | 25.93% | | | | 23.52% | | | | 29.89% | |
See Notes to Financial Statements.
25
 |
| | PricewaterhouseCoopers LLP
100 E. Wisconsin Ave.
Milwaukee WI 53202 |
REPORT OF INDEPENDENT REGISTERED PUBLIC ACCOUNTING FIRM
To the Board of Directors and Shareholders of Thompson Plumb Funds, Inc.:
In our opinion, the accompanying statements of assets and liabilities, including the schedules of investments, and the related statements of operations and of changes in net assets and the financial highlights present fairly, in all material respects, the financial position of Thompson Plumb Growth Fund and Thompson Plumb Bond Fund (constituting Thompson Plumb Funds, Inc., hereinafter collectively referred to as the “Funds”) at November 30, 2007, the results of each of their operations for the year then ended, the changes in each of their net assets for each of the two years in the period then ended and the financial highlights for each of the five years in the period then ended, in conformity with accounting principles generally accepted in the United States of America. These financial statements and financial highlights (hereafter referred to as “financial statements”) are the responsibility of the Funds’ management; our responsibility is to express an opinion on these financial statements based on our audits. We conducted our audits of these financial statements in accordance with the standards of the Public Company Accounting Oversight Board (United States). Those standards require that we plan and perform the audit to obtain reasonable assurance about whether the financial statements are free of material misstatement. An audit includes examining, on a test basis, evidence supporting the amounts and disclosures in the financial statements, assessing the accounting principles used and significant estimates made by management, and evaluating the overall financial statement presentation. We believe that our audits, which included confirmation of securities at November 30, 2007 by correspondence with the custodian and brokers, provide a reasonable basis for our opinion.
PricewaterhouseCoopers LLP
Milwaukee, WI
January 7, 200826
| DIRECTORS AND OFFICERS |
| (Information as of 12/31/07) |
| | | Position(s) | | | | Number of | | |
| | | Held with | | | | Thompson | | Other |
| | | Thompson Plumb | | | | Plumb Funds | | Directorships |
| Name, | | Funds, Inc. and | | Principal Occupation(s) | | Overseen | | Held by |
| Address & Age | | Length of Time Served(1) | | During Past Five Years | | by Director | | Director |
| Independent Directors: | | | | | | |
| |
Mary Ann Deibele
1200 John Q.
Hammons Drive
Madison, WI 53717
Birth Date: 3/5/36 | | | Director
since 1994 | | | Retired; Secretary of Elite Engineering Enterprises, Inc. (sheet metal fabrication) from 1997 to 2003; prior thereto, Director and member of the executive committee of Household Utilities, Inc. (a high tech sheet metal fabricating facility). | | 2 | | None |
| |
John W. Feldt
1200 John Q.
Hammons Drive
Madison, WI 53717
Birth Date: 5/2/42 | | | Director
since 1987 | | | Retired; Senior Vice President of Finance of the University of Wisconsin Foundation from 1984 to 2006; prior thereto, Vice President of Finance for the University of Wisconsin Foundation. | | 2 | | Baird
Funds, Inc.
(8 Funds)
Nakoma
Mutual Funds
(1 fund) |
| |
Patricia Lipton
1200 John Q.
Hammons Drive
Madison, WI 53717
Birth date: 12/9/42 | | | Director
since 2007 | | | Retired; Executive Director, State of Wisconsin Investment Board (“SWIB”) from 1989 to 2004; Assistant Executive Director, SWIB from 1982 to 1989; prior thereto, Director, State Tax Policy Bureau of the Wisconsin Department of Revenue. | | 2 | | None |
| |
Donald A. Nichols
1200 John Q.
Hammons Drive
Madison, WI 53717
Birth Date: 12/20/40 | | | Director
since 1987 | | | Retired; Director of the Robert M. La Follette School of Public Affairs at the University of Wisconsin from 2002 to 2006; prior thereto, Professor of Economics at the University of Wisconsin from 1966 to 2006; Chairman, Department of Economics from 1983 to 1986 and from 1988 to 1990; Economic Consultant. | | 2 | | None |
| |
| Interested Director & Officers: | | | | | | |
| |
John W. Thompson(2)(3)
1200 John Q.
Hammons Drive
Madison, WI 53717
Birth Date: 7/26/43 | | | Director and
Chairman
since 1987
and Chief
Executive
Officer
since 2005 | | | President of Thompson Investment Management, Inc. (“TIM”) since January 2004; President of Thompson, Plumb & Associates, Inc. (“TPA”) from June 1984 to December 2003; Treasurer of TPA from October 1993 to December 2003; Chief Executive Officer and Secretary of Thompson Plumb Trust Company from 2001 to December 2003; a Chartered Financial Analyst. | | 2 | | None |
| |
John C. Thompson(3)
1200 John Q.
Hammons Drive
Madison, WI 53717
Birth Date: 10/28/68 | | | President
and Chief
Operating
Officer
since 2005;
prior thereto,
Vice President
1996 to 2005 | | | Vice President of TIM since January 2004; Portfolio Manager of TIM since January 2004; Portfolio Manager of TPA from December 1996 to December 2003; Associate Portfolio Manager of TPA from January 1994 to December 1996; a Chartered Financial Analyst. | | N/A | | N/A |
27
| DIRECTORS AND OFFICERS (Continued) |
| (Information as of 12/31/07) |
| | | Position(s) | | | | Number of | | |
| | | Held with | | | | Thompson | | Other |
| | | Thompson Plumb | | | | Plumb Funds | | Directorships |
| Name, | | Funds, Inc. and | | Principal Occupation(s) | | Overseen | | Held by |
| Address & Age | | Length of Time Served(1) | | During Past Five Years | | by Director | | Director |
| Interested Director & Officers: | | | | | | |
| |
Penny M. Hubbard
1200 John Q.
Hammons Drive
Madison, WI 53717
Birth Date: 6/2/61 | | | Chief
Financial
Officer and
Treasurer
since 2005 | | | Vice President - Administrative Services of TIM since January 2004; prior thereto, Assistant Vice President - Client Services of TPA and various other capacities since 1984. | | N/A | | N/A |
| |
Nedra S. Pierce
1200 John Q.
Hammons Drive
Madison, WI 53717
Birth Date: 10/2/61 | | | Chief
Compliance
Officer
since 2006 | | | Chief Compliance Officer of TIM since May 2006; Director of Business Development of TIM from January 2004 to May 2006; Director of Business Development of TPA from January 1998 to December 2003; Administrative Assistant of TPA from May 1995 to December 1997. | | N/A | | N/A |
| |
Jason L. Stephens
1200 John Q.
Hammons Drive
Madison, WI 53717
Birth Date: 10/15/74 | | | Secretary
since 2005;
prior thereto,
Chief
Compliance
Officer from
2004 to 2006 | | | Corporate Secretary of TIM since January 2004; Portfolio Manager of TIM since July 2007; Research Analyst of TIM from January 2004 to June 2007; Chief Compliance Officer of TIM from January 2004 to May 2006; Research Analyst of TPA from June 2003 to December 2003; Investment Accountant of TPA from June 2002 to June 2003; a Chartered Financial Analyst. | | N/A | | N/A |
(1) Officers of Thompson Plumb Funds, Inc. serve one-year terms, subject to annual reappointment by the Board of Directors. Directors of Thompson Plumb Funds, Inc. serve a term of indefinite length until their resignation or removal, and stand for re-election by shareholders as and when required under the Investment Company Act of 1940, as amended.
(2) John W. Thompson is an “interested person” of Thompson Plumb Funds, Inc. by virtue of his position with Thompson Plumb Funds, Inc. and Thompson Investment Management, Inc.
(3) John C. Thompson, President and Chief Operating Officer of Thompson Plumb Funds, Inc., is the son of John W. Thompson, Chairman, Chief Executive Officer and Director of Thompson Plumb Funds, Inc.
28
| ADDITIONAL INFORMATION (Unaudited) |
| |
THOMPSON PLUMB FUNDS
INVESTMENT ADVISOR
Thompson Investment Management, Inc.
1200 John Q. Hammons Drive
Madison, Wisconsin 53717
DISTRIBUTOR
Quasar Distributors, LLC
615 East Michigan Street
Milwaukee, Wisconsin 53202
TRANSFER AGENT
U.S. Bancorp Fund Services, LLC
615 East Michigan Street
Milwaukee, Wisconsin 53202
INDEPENDENT REGISTERED
PUBLIC ACCOUNTING FIRM
PricewaterhouseCoopers LLP
100 East Wisconsin Avenue
Milwaukee, Wisconsin 53202
LEGAL COUNSEL
Quarles & Brady LLP
411 East Wisconsin Avenue
Milwaukee, Wisconsin 53202
The Statement of Additional Information contains additional information about the directors and officers of Thompson Plumb Funds, Inc. and is available without charge, upon request, by calling 1-800-999-0887.
Proxy Voting Policy
A description of the policies and procedures that the Funds use to determine how to vote proxies relating to portfolio securities and information regarding how the Funds actually voted proxies during the most recent 12-month period ended June 30 are available without charge, upon request, by calling 1-800-999-0887, through the Funds’ website at www.thompsonplumb.com and on the SEC’s website at www.sec.gov.
Information About Portfolio Securities
The Funds file complete schedules of the portfolio holdings with the Securities and Exchange Commission for the Funds’ first and third quarters of its fiscal year on Form N-Q. The Funds’ Forms N-Q are available on the Securities and Exchange Commission’s website at www.sec.gov. You may also review and copy those documents by visiting the Securities and Exchange Commission’s Public Reference Room in Washington, D.C. Information on the operation of the Public Reference Room may be obtained by calling the Securities and Exchange Commission at 1-800-SEC-0330. The Funds’ Forms N-Q are also available without charge, upon request, by calling 1-800-999-0887.
29
| ADDITIONAL INFORMATION (Unaudited) (Continued) |
| |
Board Approval of Investment Advisory Agreement
The Investment Company Act of 1940 (the “Act”) requires that the Investment Advisory Agreement (the “Agreement”) for Thompson Plumb Funds, Inc. (the “Funds”) be approved annually by a vote of a majority of the Board of Directors, including a majority of the Directors who are not parties to the Agreement or “interested persons” of the Funds as that term is defined in the Act (the “Independent Directors”). At its meeting on October 25, 2007, the Board of Directors of the Funds, including all of the Independent Directors, voted unanimously to renew the existing Agreement between the Funds and Thompson Investment Management, Inc. (the “Advisor”) for both series of the Funds (each series is sometimes referred to as a “Fund” in this section).
The Board’s approval was based on its consideration and evaluation of a variety of factors, including: (1) the nature, extent, and quality of the services provided by the Advisor; (2) the performance of each of the Funds in comparison to their benchmark index and a peer group of mutual funds; (3) the management fees and total operating expenses of each Fund, including comparative information with respect to a peer group of mutual funds; (4) the extent to which economies of scale may be realized as a Fund grows; and (5) whether fee levels reflect any potential economies of scale for the benefit of shareholders.
In connection with the renewal process, the Audit Committee of the Board, consisting of each of the Independent Directors, and the full Board met separately on October 25, 2007, to consider information relevant to the renewal process. The Audit Committee and the full Board are referred to as collectively as the “Board” in this section.
To facilitate evaluation of the Agreement, the Board received and reviewed information prepared or compiled by the Advisor as well as an independent analysis of the Funds’ performance and expenses prepared by Lipper Inc. (“Lipper”). Information reviewed included a memorandum from Fund counsel discussing the fiduciary duty of Directors under Section 15(c) of the Act; a memorandum from Fund management providing its recommendation for renewal of the Agreement; the Advisor’s analysis of profitability of the Agreement to the Advisor and the profitability of related service contracts with affiliates of the Advisor; a separate profitability comparison prepared by Lipper; a detailed statistical report from Lipper comparing the Funds’ performance and expenses with both a “performance group” and “performance universe” of other funds; the Advisor’s Form ADV; the Agreement and other service agreements with affiliates of the Advisor; and background information on the Funds’ portfolio managers and reports from the Funds’ Chief Compliance Officer. In addition, the Board had received and considered detailed information on the Funds’ investment performance and expenses at each of its quarterly meetings during the year as well as in-person reports from the Fund’s portfolio managers and reports from the Funds’ Chief Compliance Officer. Throughout the review and approval process, the Independent Directors were represented by independent legal counsel.
The Board considered the nature, extent, and quality of services provided by the Advisor, including services required to be provided under the Agreement, services required to be provided under other agreements with affiliates of the Advisor, and additional service provided by the Advisor although not required under any of those agreements. The Board considered the background and experience of the Funds’ portfolio managers, other advisory personnel, compliance personnel, and other support personnel. It noted that, in addition to investment management and broker selection services, the Advisor prepares compliance and other materials for each of the Board’s meetings; provides office space, equipment, and administrative services necessary for operation of the Funds; and performs regular compliance and risk analysis functions for the Funds. The Board believed that the nature, extent, and quality of services provided by the Advisor were comparable to those provided by advisers to comparable funds and that such services were adequate for the Funds’ needs.
In reviewing the Funds’ investment performance, the Board reviewed the one-, three-, five- and ten-year performance of each of the Funds. The Board noted that the long-term performance of both of the Funds was satisfactory. However, the investment performance of the Growth Fund during the last three to five years was below those of its peer groups. The Board discussed the Advisor’s commitment to modify the Growth Fund’s investment process so as to improve total return.
In reviewing the cost of services provided to the Funds and profits realized by the Advisor or its affiliates from these relationships, the Board noted that the Bond Fund’s management fee, after waiver of a portion thereof by the Advisor, was the second lowest in its Lipper comparison group, which included 16 funds, and was the fourth lowest in its Lipper comparison universe, which included 56 funds. The Board also noted that the Fund’s total expenses, after a waiver of certain fees by the Advisor, were reasonable, ranking in the first quintile of its Lipper comparison group and second quintile of its Lipper comparison universe. The advisory fees and total expenses of the Growth Fund were higher than the median of both of the Lipper comparison groups, although the total expenses of the Growth Fund were just above the median of its Lipper comparison universe, which included 99 funds. After reviewing the materials, the Board believed that the advisory fees and total expenses for the Growth Fund were within a reasonable range. With regard to profitability, the Board noted that the Advisor’s profitability ranked near the median for comparable firms and that the operating margins of the Advisor seemed to be reasonable. After reviewing information provided by Lipper and the Advisor’s own analysis, the Board believed that the cost of services provided by the Advisor and its affiliates to the Funds and the profits realized with respect thereto were reasonable.
30
| ADDITIONAL INFORMATION (Unaudited) (Continued) |
| |
The Board also considered whether economies of scale might be realized as the Fund’s assets increase. It noted that the Agreement provides for a fee breakpoint at $50 million of assets equal to ten basis points for the Growth Fund and five basis points for the Bond Fund. While the Board considered that an increase in assets could provide economies of scale in the Funds’ operations, it noted that the assets of the Growth Fund had decreased significantly in the past few years and, thus, presented no opportunity for such economies. Assets of the Bond Fund were considered to be quite small in comparison to other funds. The Board noted that economies of scale were unlikely to be realized unless its assets grew significantly.
31
01/08
|  |
Item 2. Code of Ethics.
As of the end of the period covered by this report on Form N-CSR, the Registrant has adopted a Code of Ethics (as defined in Item 2(b) of Form N-CSR) that applies to the Registrant’s principal executive officer, principal financial officer and principal accounting officer. The Registrant’s Code of Ethics (as defined in item 2(b) of Form N-CSR) and any amendments or waivers thereto are available on the Registrant’s website at www.thompsonplumb.com.
Item 3. Audit Committee Financial Expert.
The Registrant’s Board of Directors has determined that the Registrant has at least one audit committee financial expert serving on its audit committee. John Feldt, a director of the Registrant since 1987, has been determined to be an audit committee financial expert and is “independent” within the meaning of Item 3(a)(2) of Form N-CSR. Mr. Feldt, currently retired, was the Senior Vice President-Finance for the University of Wisconsin Foundation from 1984 through 2006. In such capacity, he oversaw the investment and accounting functions for the Foundation. These duties required Mr. Feldt to supervise the Foundation’s controller and approve the Foundation’s accounting and audit information.
Item 4. Principal Accountant Fees and Services.
The following table sets forth information as to the fees billed to the Registrant for each of the last two fiscal years for audit-related, tax and other services and products provided by PricewaterhouseCoopers, LLP, the Registrant’s principal accountant.
| | Fiscal Year Ended November 30, |
| | 2006 | | 2007 |
| Audit Fees(1) | | | $ | 31,868.00 | | | | $ | 37,624.00 | |
| Audit-Related Fees(2) | | | $ | 0 | | | | $ | 0 | |
| Tax Fees(3) | | | $ | 13,100.00 | | | | $ | 14,700.00 | |
| All Other Fees(4) | | | $ | 0 | | | | $ | 0 | |
| TOTAL | | | $ | 44,968.00 | | | | $ | 52,324.00 | |
____________________
| (1) | | This category relates to professional services rendered by the principal accountant for the audit of the Registrant's annual financial statements or services that are normally provided by the accountant in connection with statutory and regulatory filings or engagements for those fiscal years. |
| |
| (2) | | This category relates to assurance and related services by the principal accountant that are reasonably related to the performance of the audit of the Registrant's financial statements and are not reported under "Audit Fees" above. |
| |
| (3) | | This category relates to professional services rendered by the principal accountant for tax compliance, tax advice and tax planning. For 2006 and 2007, the tax services provided by the Registrant’s principal accountant specifically related to the preparation of the Registrant’s federal and state income and excise tax returns and a review of the Registrant’s distributions of capital gains and dividend and interest income. |
| |
| (4) | | This category relates to products and services provided by the principal accountant other than those reported under "Audit Fees," "Audit-Related Fees," and "Tax Fees" above. |
2
PricewaterhouseCoopers LLP did not bill any amounts over the last two fiscal years for services or products provided to Thompson Investment Management, Inc., the Registrant's investment advisor, or any entity controlling, controlled by or under common control with such advisor that provides ongoing services for the Registrant.
The audit committee of the Registrant’s Board of Directors has not adopted any pre-approval policies and procedures (as described in paragraph (c)(7) of Rule 2-01 of Regulation S-X) regarding the provision of audit or non-audit services to the Registrant.
Item 5. Audit Committee of Listed Registrants.
Not applicable to this Registrant because it is not a “listed issuer” within the meaning of Rule 10A-3 under the Securities Exchange Act of 1934.
Item 6. Schedule of Investments.
The required Schedules of Investments in securities of unaffiliated issuers is included as part of the Registrant’s Annual Report to shareholders dated as of November 30, 2007 provided under Item 1 of this Form N-CSR.
Item 7. Disclosure of Proxy Voting Policies and Procedures for Closed-End Management Investment Companies
Not applicable to this Registrant because it is not a closed-end management investment company.
Item 8. Portfolio Managers of Closed-End Management Investment Companies.
Not applicable to this Registrant because it is not a closed-end management investment company.
Item 9. Purchases of Equity Securities by Closed-End Management Investment Companies and Affiliated Purchasers.
Not applicable to this Registrant because it is not a closed-end management investment company.
Item 10. Submission of Matters to a Vote of Securities Holders.
The Registrant has not made any material changes to the procedures by which shareholders may recommend nominees to the Registrant's Board of Directors.
3
Item 11. Controls and Procedures.
| | (a) | | Disclosure Controls and Procedures. Based on an evaluation of the Registrant’s disclosure controls and procedures (as defined in Rule 30a-3(c) under the Investment Company Act of 1940) carried out under the supervision and with the participation of the Registrant’s management, including its principal executive and financial officers, within 90 days prior to the filing date of this report on Form N-CSR, the Registrant’s principal executive and financial officers have concluded that the design and operation of the Registrant’s disclosure controls and procedures are effective in providing reasonable assurance that the information required to be disclosed on Form N-CSR is recorded, processed, summarized and reported within the applicable time periods. |
| | | |
| (b) | | Change in Internal Controls Over Financial Reporting. There were no significant changes in the Registrant’s internal control over financial reporting (as defined in Rule 30a-3(d) under the Investment Company Act of 1940) that occurred during the Registrant’s second fiscal quarter of the period covered by this Form N-CSR that has materially affected, or is reasonably likely to materially affect, the Registrant’s internal control over financial reporting. |
Item 12. Exhibits
The following exhibits are attached to this Form N-CSR:
| | Exhibit No. | | Description of Exhibit | |
| 12(a)(1) | | The Code of Ethics for the Registrant’s Principal Executive Officer, Principal Financial Officer and Principal Accounting Officers referred to in Item 2 was filed as Exhibit 12(a)(1) to the Registrant’s Certified Shareholder Report on Form N-CSR filed on January 28, 2005, and is incorporated herein by reference |
| | | |
| 12(a)(2)-1 | | Certification of Principal Executive Officer Required by Section 302 of the Sarbanes-Oxley Act of 2002 |
| | | |
| 12(a)(2)-2 | | Certification of Principal Financial Officer Required by Section 302 of the Sarbanes-Oxley Act of 2002 |
| | | |
| 12(b) | | Certification of Chief Executive Officer and Chief Financial Officer Required by Section 906 of the Sarbanes-Oxley Act of 2002 |
4
SIGNATURES
Pursuant to the requirements of the Securities Exchange Act of 1934 and the Investment Company Act of 1940, the Registrant has duly caused this report to be signed on its behalf by the undersigned, thereunto duly authorized, on this 31st day of January, 2008.
| THOMPSON PLUMB FUNDS, INC. |
| |
| By: | /s/ John W. Thompson |
| | John W. Thompson, Chairman and Chief Executive Officer |
Pursuant to the requirements of the Securities Exchange Act of 1934 and the Investment Company Act of 1940, this report has been signed below by the following persons on behalf of the Registrant and in the capacities indicated on this 31st day of January, 2008.
| By: | /s/ John W. Thompson |
| | John W. Thompson, Chairman and Chief Executive Officer (Principal Executive Officer) |
| |
| By: | /s/ Penny Hubbard |
| | Penny Hubbard, Chief Financial Officer (Principal Financial Officer) |
5